UNITED STATES
SECURITIES AND EXCHANGE COMMISSION
Washington, D.C. 20549
FORM N-CSR
CERTIFIED SHAREHOLDER REPORT OF REGISTERED
MANAGEMENT INVESTMENT COMPANIES
Investment Company Act file number 811-3114
Fidelity Select Portfolios
(Exact name of registrant as specified in charter)
245 Summer St., Boston, Massachusetts 02210
(Address of principal executive offices) (Zip code)
Scott C. Goebel, Secretary
245 Summer St.
Boston, Massachusetts 02210
(Name and address of agent for service)
Registrant's telephone number, including area code: 617-563-7000
|
Date of fiscal year end: |
February 28 |
|
|
|
|
Date of reporting period: |
February 28, 2013 |
Item 1. Reports to Stockholders
Fidelity®
Select Portfolios®
Consumer Discretionary Sector
Automotive Portfolio
Construction and Housing Portfolio
Consumer Discretionary Portfolio
Leisure Portfolio
Multimedia Portfolio
Retailing Portfolio
Annual Report
February 28, 2013
(Fidelity Cover Art)
Contents
|
Shareholder Expense Example |
|
|
|
Automotive Portfolio |
Performance |
|
|
|
Management's Discussion |
|
|
|
Investment Changes |
|
|
|
Investments |
|
|
|
Financial Statements |
|
|
Construction and Housing Portfolio |
Performance |
|
|
|
Management's Discussion |
|
|
|
Investment Changes |
|
|
|
Investments |
|
|
|
Financial Statements |
|
|
Consumer Discretionary Portfolio |
Performance |
|
|
|
Management's Discussion |
|
|
|
Investment Changes |
|
|
|
Investments |
|
|
|
Financial Statements |
|
|
Leisure Portfolio |
Performance |
|
|
|
Management's Discussion |
|
|
|
Investment Changes |
|
|
|
Investments |
|
|
|
Financial Statements |
|
|
Multimedia Portfolio |
Performance |
|
|
|
Management's Discussion |
|
|
|
Investment Changes |
|
|
|
Investments |
|
|
|
Financial Statements |
|
|
Retailing Portfolio |
Performance |
|
|
|
Management's Discussion |
|
|
|
Investment Changes |
|
|
|
Investments |
|
|
|
Financial Statements |
|
|
Notes to Financial Statements |
|
|
|
Report of Independent Registered Public Accounting Firm |
|
|
|
Trustees and Officers |
|
|
|
Distributions |
|
|
|
Board Approval of Investment Advisory Contracts and Management Fees |
|
Annual Report
To view a fund's proxy voting guidelines and proxy voting record for the 12-month period ended June 30, visit http://www.fidelity.com/proxyvotingresults or visit the Securities and Exchange Commission's (SEC) web site at http://www.sec.gov. You may also call 1-800-544-8544 to request a free copy of the proxy voting guidelines.
Standard & Poor's, S&P and S&P 500 are registered service marks of The McGraw-Hill Companies, Inc. and have been licensed for use by Fidelity Distributors Corporation.
Other third-party marks appearing herein are the property of their respective owners.
All other marks appearing herein are registered or unregistered trademarks or service marks of FMR LLC or an affiliated company. © 2013 FMR LLC. All rights reserved.
This report and the financial statements contained herein are submitted for the general information of the shareholders of the funds. This report is not authorized for distribution to prospective investors in the funds unless preceded or accompanied by an effective prospectus.
A fund files its complete schedule of portfolio holdings with the SEC for the first and third quarters of each fiscal year on Form N-Q. Forms N-Q are available on the SEC's web site at http://www.sec.gov. A fund's Forms N-Q may be reviewed and copied at the SEC's Public Reference Room in Washington, DC. Information regarding the operation of the SEC's Public Reference Room may be obtained by calling 1-800-SEC-0330. For a complete list of a fund's portfolio holdings, view the most recent holdings listing, semiannual report, or annual report on Fidelity's web site at http://www.fidelity.com, http://www.advisor.fidelity.com, or http://www.401k.com, as applicable.
NOT FDIC INSURED • MAY LOSE VALUE • NO BANK GUARANTEE
Neither the funds nor Fidelity Distributors Corporation is a bank.
Annual Report
Shareholder Expense Example
As a shareholder of a Fund, you incur two types of costs: (1) transaction costs, including redemption fees and (2) ongoing costs, including management fees and other Fund expenses. This Example is intended to help you understand your ongoing costs (in dollars) of investing in the Funds and to compare these costs with the ongoing costs of investing in other mutual funds.
The Example is based on an investment of $1,000 invested at the beginning of the period and held for the entire period (September 1, 2012 to February 28, 2013).
Actual Expenses
The first line of the accompanying table for each fund provides information about actual account values and actual expenses. You may use the information in this line, together with the amount you invested, to estimate the expenses that you paid over the period. Simply divide your account value by $1,000.00 (for example, an $8,600 account value divided by $1,000.00 = 8.6), then multiply the result by the number in the first line for a fund under the heading entitled "Expenses Paid During Period" to estimate the expenses you paid on your account during this period. A small balance maintenance fee of $12.00 that is charged once a year may apply for certain accounts with a value of less than $2,000. This fee is not included in the table below. If it was, the estimate of expenses you paid during the period would be higher, and your ending account value lower, by this amount. In addition, each Fund, as a shareholder in the underlying Fidelity Central Funds, will indirectly bear its pro-rata share of the fees and expenses incurred by the underlying Fidelity Central Funds. These fees and expenses are not included in the Fund's annualized expense ratio used to calculate the expense estimate in the table below.
Hypothetical Example for Comparison Purposes
The second line of the accompanying table for each fund provides information about hypothetical account values and hypothetical expenses based on a fund's actual expense ratio and an assumed rate of return of 5% per year before expenses, which is not the Fund's actual return. The hypothetical account values and expenses may not be used to estimate the actual ending account balance or expenses you paid for the period. You may use this information to compare the ongoing costs of investing in the Fund and other funds. To do so, compare this 5% hypothetical example with the 5% hypothetical examples that appear in the shareholder reports of the other funds. A small balance maintenance fee of $12.00 that is charged once a year may apply for certain accounts with a value of less than $2,000. This fee is not included in the table below. If it was, the estimate of expenses you paid during the period would be higher, and your ending account value lower, by this amount. In addition, each Fund, as a shareholder in the underlying Fidelity Central Funds, will indirectly bear its pro-rata share of the fees and expenses incurred by the underlying Fidelity Central Funds. These fees and expenses are not included in the Fund's annualized expense ratio used to calculate the expense estimate in the table below.
Please note that the expenses shown in the table are meant to highlight your ongoing costs only and do not reflect any transaction costs. Therefore, the second line of the table is useful in comparing ongoing costs only, and will not help you determine the relative total costs of owning different funds. In addition, if these transactional costs were included, your costs would have been higher.
|
|
Annualized Expense Ratio |
Beginning |
Ending |
Expenses Paid |
|
Automotive Portfolio |
.89% |
|
|
|
|
Actual |
|
$ 1,000.00 |
$ 1,222.20 |
$ 4.90 |
|
HypotheticalA |
|
$ 1,000.00 |
$ 1,020.38 |
$ 4.46 |
|
Construction and Housing Portfolio |
.84% |
|
|
|
|
Actual |
|
$ 1,000.00 |
$ 1,199.80 |
$ 4.58 |
|
HypotheticalA |
|
$ 1,000.00 |
$ 1,020.63 |
$ 4.21 |
|
Consumer Discretionary Portfolio |
.85% |
|
|
|
|
Actual |
|
$ 1,000.00 |
$ 1,106.90 |
$ 4.44 |
|
HypotheticalA |
|
$ 1,000.00 |
$ 1,020.58 |
$ 4.26 |
|
Leisure Portfolio |
.84% |
|
|
|
|
Actual |
|
$ 1,000.00 |
$ 1,130.80 |
$ 4.44 |
|
HypotheticalA |
|
$ 1,000.00 |
$ 1,020.63 |
$ 4.21 |
|
Multimedia Portfolio |
.87% |
|
|
|
|
Actual |
|
$ 1,000.00 |
$ 1,156.50 |
$ 4.65 |
|
HypotheticalA |
|
$ 1,000.00 |
$ 1,020.48 |
$ 4.36 |
|
Retailing Portfolio |
.85% |
|
|
|
|
Actual |
|
$ 1,000.00 |
$ 1,092.90 |
$ 4.41 |
|
HypotheticalA |
|
$ 1,000.00 |
$ 1,020.58 |
$ 4.26 |
A 5% return per year before expenses
* Expenses are equal to each Fund's annualized expense ratio, multiplied by the average account value over the period, multiplied by 181/365 (to reflect the one-half year period).
Annual Report
Automotive Portfolio
Performance: The Bottom Line
Average annual total return reflects the change in the value of an investment, assuming reinvestment of the fund's distributions from dividend income and capital gains (the profits earned upon the sale of securities that have grown in value, if any) and assuming a constant rate of performance each year. The $10,000 table and the fund's returns do not reflect the deduction of taxes that a shareholder would pay on fund distributions or the redemption of fund shares. During periods of reimbursement by Fidelity, a fund's total return will be greater than it would be had the reimbursement not occurred. How a fund did yesterday is no guarantee of how it will do tomorrow.
Average Annual Total Returns
|
Periods ended February 28, 2013 |
Past 1 |
Past 5 |
Past 10 |
|
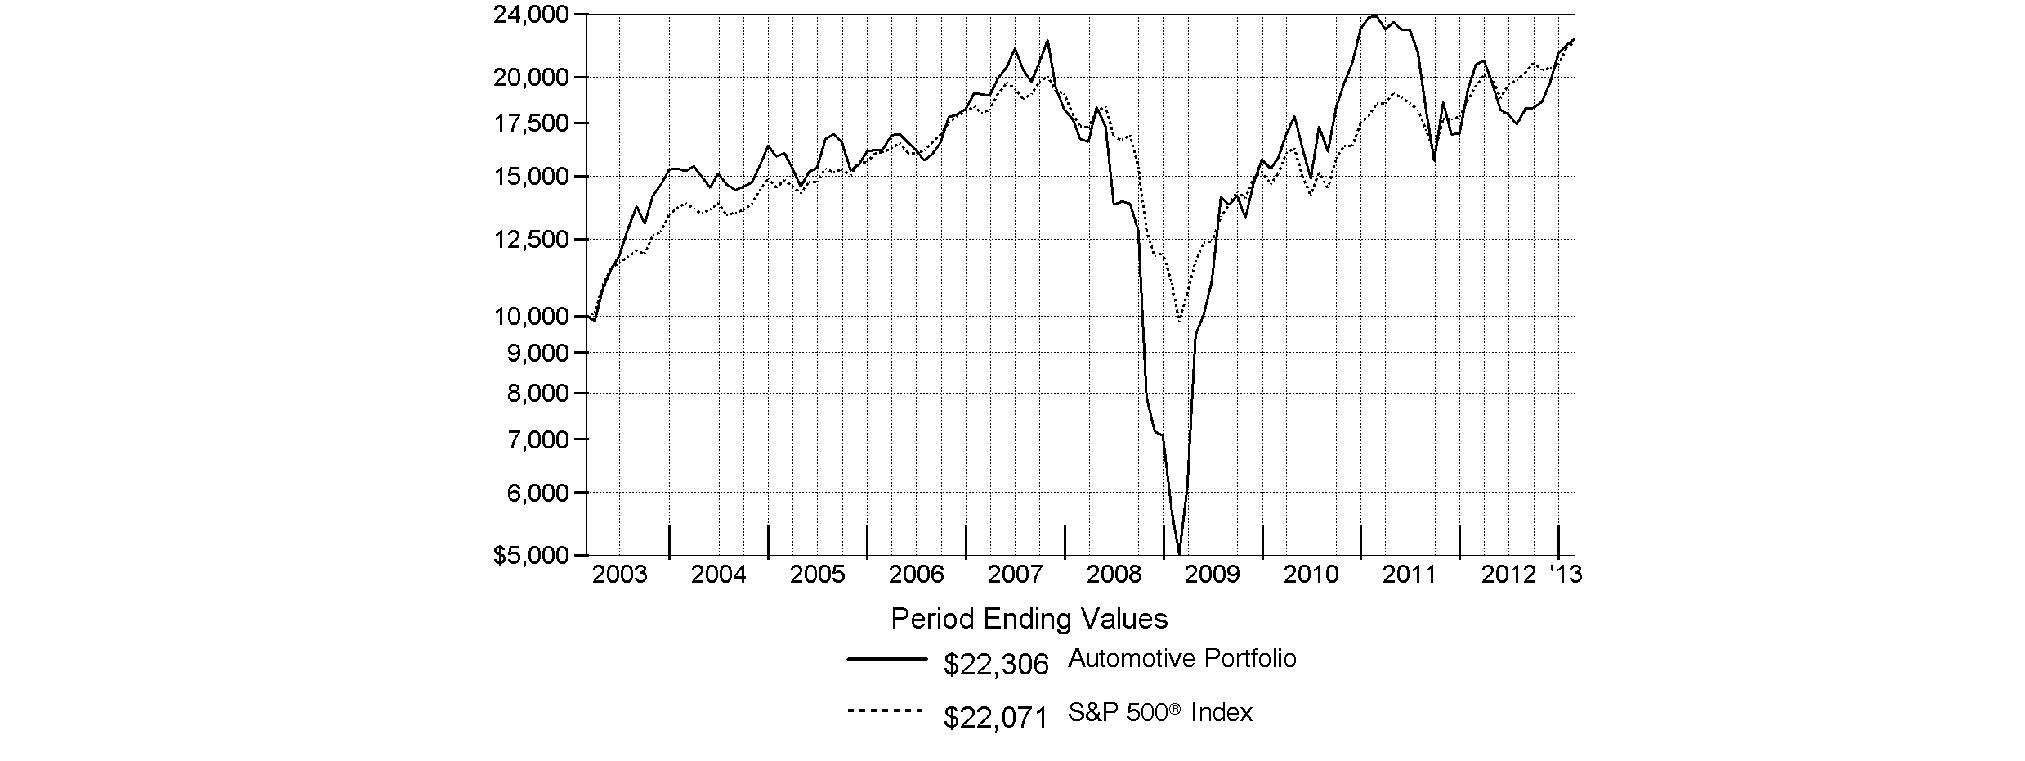
Automotive Portfolio |
7.64% |
5.97% |
8.35% |
$10,000 Over 10 Years
Let's say hypothetically that $10,000 was invested in Automotive Portfolio on February 28, 2003. The chart shows how the value of your investment would have changed, and also shows how the S&P 500® Index performed over the same period.
Annual Report
Automotive Portfolio
Management's Discussion of Fund Performance
Market Recap: U.S. stocks posted solid gains for the year ending February 28, 2013, sparked by a late-period rally that pushed major equity benchmarks to multiyear highs. Improvement in the global economy and more monetary stimulus from the U.S. Federal Reserve kept markets on the upswing for much of the year, shrugging off an early decline brought on by debt woes in Europe, and another dip later in the period amid Congressional gridlock on the federal budget. Renewed optimism over employment, the housing market, corporate earnings and record dividends made stocks a favorite with investors during the 12 months, which helped push the broad-based S&P 500® Index across the milestone 1,500 mark at the end of January. The S&P 500® finished the period up 13.46%. Seven of the 10 major market sectors tracked by MSCI U.S. IMI 25-50 classifications produced double-digit gains, led by health care and financials, while information technology, energy and materials trailed the broad equity market with only modest advances.
Comments from Michael Weaver, Portfolio Manager of Automotive Portfolio: For the year, the fund returned 7.64%, lagging the 8.04% result of the S&P® Custom Automobiles & Components Index and the S&P 500. The automotive industry rallied briskly during the second half of the period, climbing higher amid improvements in the global equity markets, as investors' became less pessimistic about some of the macroeconomic issues that previously challenged the markets. The fund's underperformance of the industry benchmark was due, in part, to its modest position in cash. Also of note, currency fluctuations hindered performance given the fund's investments in foreign stocks. Slightly underweighting the automakers, tire and rubber, and motorcycle manufacturers groups detracted as well. In particular, maintaining an underweighting, on average, in Japanese automaker Toyota Motor, one of the auto industry's best-performing stocks, was the biggest detractor. We also missed with Ford Motor and General Motors, the big U.S. automakers, because we held lighter-than-benchmark stakes during the fall months of 2012, when each stock made a sharp advance. An early-period overweighting in auto parts maker Tenneco hurt as well. On the upside, the fund's relative performance was bolstered by security selection in the auto parts and equipment industry, where the fund's emphasis on companies helping to limit emissions, increase fuel economy and enhance vehicle safety proved beneficial. Two of the fund's core holdings - Delphi Automotive and TRW Automotive Holdings - benefited from those themes and were top contributors. The fund also got an unexpected boost from a residual interest in a bond holding received during the restructuring of General Motors.
The views expressed above reflect those of the portfolio manager(s) only through the end of the period as stated on the cover of this report and do not necessarily represent the views of Fidelity or any other person in the Fidelity organization. Any such views are subject to change at any time based upon market or other conditions and Fidelity disclaims any responsibility to update such views. These views may not be relied on as investment advice and, because investment decisions for a Fidelity fund are based on numerous factors, may not be relied on as an indication of trading intent on behalf of any Fidelity fund.
Annual Report
Automotive Portfolio
Investment Changes (Unaudited)
|
Top Ten Stocks as of February 28, 2013 |
||
|
|
% of fund's |
% of fund's net assets |
|
Toyota Motor Corp. sponsored ADR |
17.2 |
15.8 |
|
Honda Motor Co. Ltd. sponsored ADR |
11.5 |
11.1 |
|
Ford Motor Co. |
9.7 |
8.3 |
|
Delphi Automotive PLC |
6.2 |
4.7 |
|
General Motors Co. |
5.3 |
4.7 |
|
Johnson Controls, Inc. |
4.4 |
5.5 |
|
Harley-Davidson, Inc. |
4.3 |
3.7 |
|
Magna International, Inc. Class A (sub. vtg.) |
4.2 |
3.1 |
|
TRW Automotive Holdings Corp. |
4.0 |
4.9 |
|
Tenneco, Inc. |
3.6 |
2.9 |
|
|
70.4 |
|
|
Top Industries (% of fund's net assets) |
|||
|
As of February 28, 2013 |
|||
 |
Automobiles |
49.5% |
|
 |
Auto Components |
47.8% |
|
 |
Machinery |
1.3% |
|
 |
All Others* |
1.4% |
|

|
As of August 31, 2012 |
|||
|
Auto Components |
47.8% |
|
 |
Automobiles |
45.2% |
|
|
Machinery |
1.9% |
|
|
All Others* |
5.1% |
|

|
* Includes short-term investments and net other assets. |
Annual Report
Automotive Portfolio
Investments February 28, 2013
Showing Percentage of Net Assets
|
Common Stocks - 98.6% |
|||
|
Shares |
Value |
||
|
AUTO COMPONENTS - 47.8% |
|||
|
Auto Parts & Equipment - 44.9% |
|||
|
American Axle & Manufacturing Holdings, Inc. (a) |
104,800 |
$ 1,325,720 |
|
|
Autoliv, Inc. (e) |
58,455 |
3,810,097 |
|
|
BorgWarner, Inc. (a) |
66,500 |
4,948,265 |
|
|
Dana Holding Corp. |
169,700 |
2,839,081 |
|
|
Delphi Automotive PLC |
211,678 |
8,858,724 |
|
|
Dorman Products, Inc. |
31,300 |
1,094,248 |
|
|
Drew Industries, Inc. |
37,900 |
1,378,802 |
|
|
Exide Technologies (a) |
166,200 |
445,416 |
|
|
Federal-Mogul Corp. Class A (a) |
56,924 |
459,946 |
|
|
Fuel Systems Solutions, Inc. (a) |
25,000 |
347,250 |
|
|
Gentex Corp. |
127,000 |
2,381,250 |
|
|
Gentherm, Inc. (a) |
30,600 |
471,240 |
|
|
Johnson Controls, Inc. |
201,970 |
6,355,996 |
|
|
Lear Corp. |
84,200 |
4,497,964 |
|
|
Linamar Corp. |
50,700 |
1,265,964 |
|
|
Magna International, Inc. Class A (sub. vtg.) |
113,184 |
6,020,017 |
|
|
Martinrea International, Inc. (a) |
99,300 |
856,989 |
|
|
Modine Manufacturing Co. (a) |
73,100 |
602,344 |
|
|
Motorcar Parts of America, Inc. (a) |
54,200 |
296,474 |
|
|
Spartan Motors, Inc. |
88,400 |
467,636 |
|
|
Standard Motor Products, Inc. |
28,000 |
692,440 |
|
|
Stoneridge, Inc. (a) |
58,289 |
375,964 |
|
|
Tenneco, Inc. (a) |
144,446 |
5,117,722 |
|
|
Tower International, Inc. (a) |
87,800 |
1,057,112 |
|
|
TRW Automotive Holdings Corp. (a) |
98,500 |
5,780,965 |
|
|
Visteon Corp. (a) |
41,900 |
2,441,932 |
|
|
|
64,189,558 |
||
|
Tires & Rubber - 2.9% |
|||
|
Cooper Tire & Rubber Co. |
65,200 |
1,648,256 |
|
|
The Goodyear Tire & Rubber Co. (a) |
190,426 |
2,471,729 |
|
|
|
4,119,985 |
||
|
TOTAL AUTO COMPONENTS |
68,309,543 |
||
|
AUTOMOBILES - 49.5% |
|||
|
Automobile Manufacturers - 45.2% |
|||
|
Ford Motor Co. |
1,098,861 |
13,856,637 |
|
|
General Motors Co. (a) |
279,544 |
7,589,620 |
|
|
Honda Motor Co. Ltd. sponsored ADR (e) |
440,900 |
16,507,296 |
|
|
Thor Industries, Inc. |
33,600 |
1,263,024 |
|
|
Toyota Motor Corp. sponsored ADR (e) |
239,300 |
24,552,180 |
|
|
Winnebago Industries, Inc. (a) |
45,700 |
885,666 |
|
|
|
64,654,423 |
||
|
|
|||
|
Shares |
Value |
||
|
Motorcycle Manufacturers - 4.3% |
|||
|
Harley-Davidson, Inc. |
115,600 |
$ 6,084,028 |
|
|
TOTAL AUTOMOBILES |
70,738,451 |
||
|
MACHINERY - 1.3% |
|||
|
Construction & Farm Machinery & Heavy Trucks - 1.3% |
|||
|
Meritor, Inc. (a) |
100,800 |
443,520 |
|
|
Westport Innovations, Inc. (a)(e) |
50,600 |
1,464,364 |
|
|
|
1,907,884 |
||
|
TOTAL COMMON STOCKS (Cost $107,448,098) |
|
||
|
Nonconvertible Bonds - 0.0% |
||||
|
|
Principal Amount |
|
||
|
AUTOMOBILES - 0.0% |
||||
|
Automobile Manufacturers - 0.0% |
||||
|
General Motors Corp. 6.75% 5/1/28 (d) |
|
$ 31,005,000 |
|
|
|
Money Market Funds - 18.3% |
|||
|
Shares |
|
||
|
Fidelity Cash Central Fund, 0.16% (b) |
2,900,231 |
2,900,231 |
|
|
Fidelity Securities Lending Cash Central Fund, 0.16% (b)(c) |
23,259,799 |
23,259,799 |
|
|
TOTAL MONEY MARKET FUNDS (Cost $26,160,030) |
|
||
|
TOTAL INVESTMENT PORTFOLIO - 116.9% (Cost $133,892,484) |
167,115,911 |
||
|
NET OTHER ASSETS (LIABILITIES) - (16.9)% |
(24,157,280) |
||
|
NET ASSETS - 100% |
$ 142,958,631 |
||
|
Legend |
|
(a) Non-income producing |
|
(b) Affiliated fund that is generally available only to investment companies and other accounts managed by Fidelity Investments. The rate quoted is the annualized seven-day yield of the fund at period end. A complete unaudited listing of the fund's holdings as of its most recent quarter end is available upon request. In addition, each Fidelity Central Fund's financial statements, which are not covered by the Fund's Report of Independent Registered Public Accounting Firm, are available on the SEC's website or upon request. |
|
(c) Investment made with cash collateral received from securities on loan. |
|
(d) Non-income producing - Security is in default. |
|
(e) Security or a portion of the security is on loan at period end. |
|
Affiliated Central Funds |
|
Information regarding fiscal year to date income earned by the Fund from investments in Fidelity Central Funds is as follows: |
|
Fund |
Income earned |
|
Fidelity Cash Central Fund |
$ 9,561 |
|
Fidelity Securities Lending Cash Central Fund |
207,741 |
|
Total |
$ 217,302 |
|
Other Information |
|
The following is a summary of the inputs used, as of February 28, 2013, involving the Fund's assets and liabilities carried at fair value. The inputs or methodology used for valuing securities may not be an indication of the risk associated with investing in those securities. For more information on valuation inputs, and their aggregation into the levels used in the table below, please refer to the Investment Valuation section in the accompanying Notes to Financial Statements. |
|
Valuation Inputs at Reporting Date: |
||||
|
Description |
Total |
Level 1 |
Level 2 |
Level 3 |
|
Investments in Securities: |
||||
|
Common Stocks |
$ 140,955,878 |
$ 140,955,878 |
$ - |
$ - |
|
Nonconvertible Bonds |
3 |
- |
- |
3 |
|
Money Market Funds |
26,160,030 |
26,160,030 |
- |
- |
|
Total Investments in Securities: |
$ 167,115,911 |
$ 167,115,908 |
$ - |
$ 3 |
|
Distribution of investments by country or territory of incorporation, as a percentage of total net assets, is as follows. (Unaudited) |
|
United States of America |
58.4% |
|
Japan |
28.7% |
|
Canada |
6.7% |
|
Bailiwick of Jersey |
6.2% |
|
|
100.0% |
See accompanying notes which are an integral part of the financial statements.
Annual Report
Automotive Portfolio
Financial Statements
Statement of Assets and Liabilities
|
|
February 28, 2013 |
|
|
|
|
|
|
Assets |
|
|
|
Investment in securities, at value (including securities loaned of $22,926,781) - See accompanying schedule: Unaffiliated issuers (cost $107,732,454) |
$ 140,955,881 |
|
|
Fidelity Central Funds (cost $26,160,030) |
26,160,030 |
|
|
Total Investments (cost $133,892,484) |
|
$ 167,115,911 |
|
Receivable for fund shares sold |
|
186,192 |
|
Dividends receivable |
|
247,709 |
|
Distributions receivable from Fidelity Central Funds |
|
32,684 |
|
Prepaid expenses |
|
113 |
|
Receivable from investment adviser for expense reductions |
|
64 |
|
Other receivables |
|
9,520 |
|
Total assets |
|
167,592,193 |
|
|
|
|
|
Liabilities |
|
|
|
Payable for fund shares redeemed |
$ 1,240,027 |
|
|
Accrued management fee |
70,738 |
|
|
Other affiliated payables |
31,875 |
|
|
Other payables and accrued expenses |
31,123 |
|
|
Collateral on securities loaned, at value |
23,259,799 |
|
|
Total liabilities |
|
24,633,562 |
|
|
|
|
|
Net Assets |
|
$ 142,958,631 |
|
Net Assets consist of: |
|
|
|
Paid in capital |
|
$ 114,592,016 |
|
Accumulated net investment loss |
|
(89) |
|
Accumulated undistributed net realized gain (loss) on investments and foreign currency transactions |
|
(4,855,875) |
|
Net unrealized appreciation (depreciation) on investments and assets and liabilities in foreign currencies |
|
33,222,579 |
|
Net Assets, for 3,516,444 shares outstanding |
|
$ 142,958,631 |
|
Net Asset Value, offering price and redemption price per share ($142,958,631 ÷ 3,516,444 shares) |
|
$ 40.65 |
Statement of Operations
|
|
Year ended February 28, 2013 |
|
|
|
|
|
|
Investment Income |
|
|
|
Dividends |
|
$ 1,660,529 |
|
Income from Fidelity Central Funds (including $207,741 from security lending) |
|
217,302 |
|
Total income |
|
1,877,831 |
|
|
|
|
|
Expenses |
|
|
|
Management fee |
$ 677,842 |
|
|
Transfer agent fees |
296,108 |
|
|
Accounting and security lending fees |
50,118 |
|
|
Custodian fees and expenses |
9,107 |
|
|
Independent trustees' compensation |
811 |
|
|
Registration fees |
30,233 |
|
|
Audit |
38,186 |
|
|
Legal |
475 |
|
|
Miscellaneous |
1,239 |
|
|
Total expenses before reductions |
1,104,119 |
|
|
Expense reductions |
(21,599) |
1,082,520 |
|
Net investment income (loss) |
|
795,311 |
|
Realized and Unrealized Gain (Loss) Net realized gain (loss) on: |
|
|
|
Investment securities: |
|
|
|
Unaffiliated issuers |
266,592 |
|
|
Foreign currency transactions |
(1,506) |
|
|
Total net realized gain (loss) |
|
265,086 |
|
Change in net unrealized appreciation (depreciation) on: Investment securities |
1,979,102 |
|
|
Assets and liabilities in foreign currencies |
(360) |
|
|
Total change in net unrealized appreciation (depreciation) |
|
1,978,742 |
|
Net gain (loss) |
|
2,243,828 |
|
Net increase (decrease) in net assets resulting from operations |
|
$ 3,039,139 |
See accompanying notes which are an integral part of the financial statements.
Annual Report
Automotive Portfolio
Financial Statements - continued
Statement of Changes in Net Assets
|
|
Year ended |
Year ended |
|
Increase (Decrease) in Net Assets |
|
|
|
Operations |
|
|
|
Net investment income (loss) |
$ 795,311 |
$ 119,923 |
|
Net realized gain (loss) |
265,086 |
4,447,404 |
|
Change in net unrealized appreciation (depreciation) |
1,978,742 |
(41,641,844) |
|
Net increase (decrease) in net assets resulting from operations |
3,039,139 |
(37,074,517) |
|
Distributions to shareholders from net investment income |
(740,892) |
(45,425) |
|
Distributions to shareholders from net realized gain |
(99,972) |
(9,238,375) |
|
Total distributions |
(840,864) |
(9,283,800) |
|
Share transactions |
113,289,906 |
130,281,367 |
|
Reinvestment of distributions |
802,629 |
8,936,839 |
|
Cost of shares redeemed |
(143,364,154) |
(296,538,707) |
|
Net increase (decrease) in net assets resulting from share transactions |
(29,271,619) |
(157,320,501) |
|
Redemption fees |
16,206 |
62,990 |
|
Total increase (decrease) in net assets |
(27,057,138) |
(203,615,828) |
|
|
|
|
|
Net Assets |
|
|
|
Beginning of period |
170,015,769 |
373,631,597 |
|
End of period (including accumulated net investment loss of $89 and distributions in excess of net investment income of $77, respectively) |
$ 142,958,631 |
$ 170,015,769 |
|
Other Information Shares |
|
|
|
Sold |
2,953,140 |
3,433,091 |
|
Issued in reinvestment of distributions |
21,299 |
246,291 |
|
Redeemed |
(3,926,750) |
(7,183,045) |
|
Net increase (decrease) |
(952,311) |
(3,503,663) |
Financial Highlights
|
Years ended February 28, |
2013 |
2012 F |
2011 |
2010 |
2009 |
|
Selected Per-Share Data |
|
|
|
|
|
|
Net asset value, beginning of period |
$ 38.05 |
$ 46.87 |
$ 31.63 |
$ 10.07 |
$ 34.23 |
|
Income from Investment Operations |
|
|
|
|
|
|
Net investment income (loss) B |
.24 |
.03 |
(.08) |
(.06) |
.42 |
|
Net realized and unrealized gain (loss) |
2.65 |
(6.45) |
15.94 |
21.67 |
(24.30) |
|
Total from investment operations |
2.89 |
(6.42) |
15.86 |
21.61 |
(23.88) |
|
Distributions from net investment income |
(.26) |
(.02) |
- |
(.07) |
(.28) |
|
Distributions from net realized gain |
(.02) |
(2.41) |
(.63) |
- |
(.01) |
|
Total distributions |
(.29) I |
(2.42) H |
(.63) |
(.07) |
(.29) |
|
Redemption fees added to paid in capital B |
- G |
.02 |
.01 |
.02 |
.01 |
|
Net asset value, end of period |
$ 40.65 |
$ 38.05 |
$ 46.87 |
$ 31.63 |
$ 10.07 |
|
Total Return A |
7.64% |
(13.06)% |
50.90% |
215.39% |
(69.99)% |
|
Ratios to Average Net Assets C, E |
|
|
|
|
|
|
Expenses before reductions |
.91% |
.90% |
.91% |
.99% |
1.47% |
|
Expenses net of fee waivers, if any |
.91% |
.90% |
.91% |
.99% |
1.15% |
|
Expenses net of all reductions |
.89% |
.90% |
.91% |
.97% |
1.15% |
|
Net investment income (loss) |
.66% |
.08% |
(.19)% |
(.23)% |
1.73% |
|
Supplemental Data |
|
|
|
|
|
|
Net assets, end of period (000 omitted) |
$ 142,959 |
$ 170,016 |
$ 373,632 |
$ 146,023 |
$ 7,581 |
|
Portfolio turnover rate D |
72% |
49% |
91% |
156% |
156% |
|
A Total returns would have been lower if certain expenses had not been reduced during the applicable periods shown. B Calculated based on average shares outstanding during the period. C Fees and expenses of any underlying Fidelity Central Funds are not included in the Fund's expense ratio. The Fund indirectly bears its proportionate share of the expenses of any underlying Fidelity Central Funds. D Amount does not include the portfolio activity of any underlying Fidelity Central Funds. E Expense ratios reflect operating expenses of the Fund. Expenses before reductions do not reflect amounts reimbursed by the investment adviser or reductions from brokerage service arrangements or reductions from other expense offset arrangements and do not represent the amount paid by the Fund during periods when reimbursements or reductions occur. Expenses net of fee waivers reflect expenses after reimbursement by the investment adviser but prior to reductions from brokerage service arrangements or other expense offset arrangements. Expenses net of all reductions represent the net expenses paid by the Fund. F For the year ended February 29. G Amount represents less than $.01 per share. H Total distributions of $2.42 per share is comprised of distributions from net investment income of $0.015 and distributions from net realized gain of $2.408 per share. I Total distributions of $.29 per share is comprised of distributions from net investment income of $0.261 and distributions from net realized gain of $0.024 per share. |
See accompanying notes which are an integral part of the financial statements.
Annual Report
Construction and Housing Portfolio
Performance: The Bottom Line
Average annual total return reflects the change in the value of an investment, assuming reinvestment of the fund's distributions from dividend income and capital gains (the profits earned upon the sale of securities that have grown in value, if any) and assuming a constant rate of performance each year. The $10,000 table and the fund's returns do not reflect the deduction of taxes that a shareholder would pay on fund distributions or the redemption of fund shares. During periods of reimbursement by Fidelity, a fund's total return will be greater than it would be had the reimbursement not occurred. How a fund did yesterday is no guarantee of how it will do tomorrow.
Average Annual Total Returns
|
Periods ended February 28, 2013 |
Past 1 |
Past 5 |
Past 10 |
|
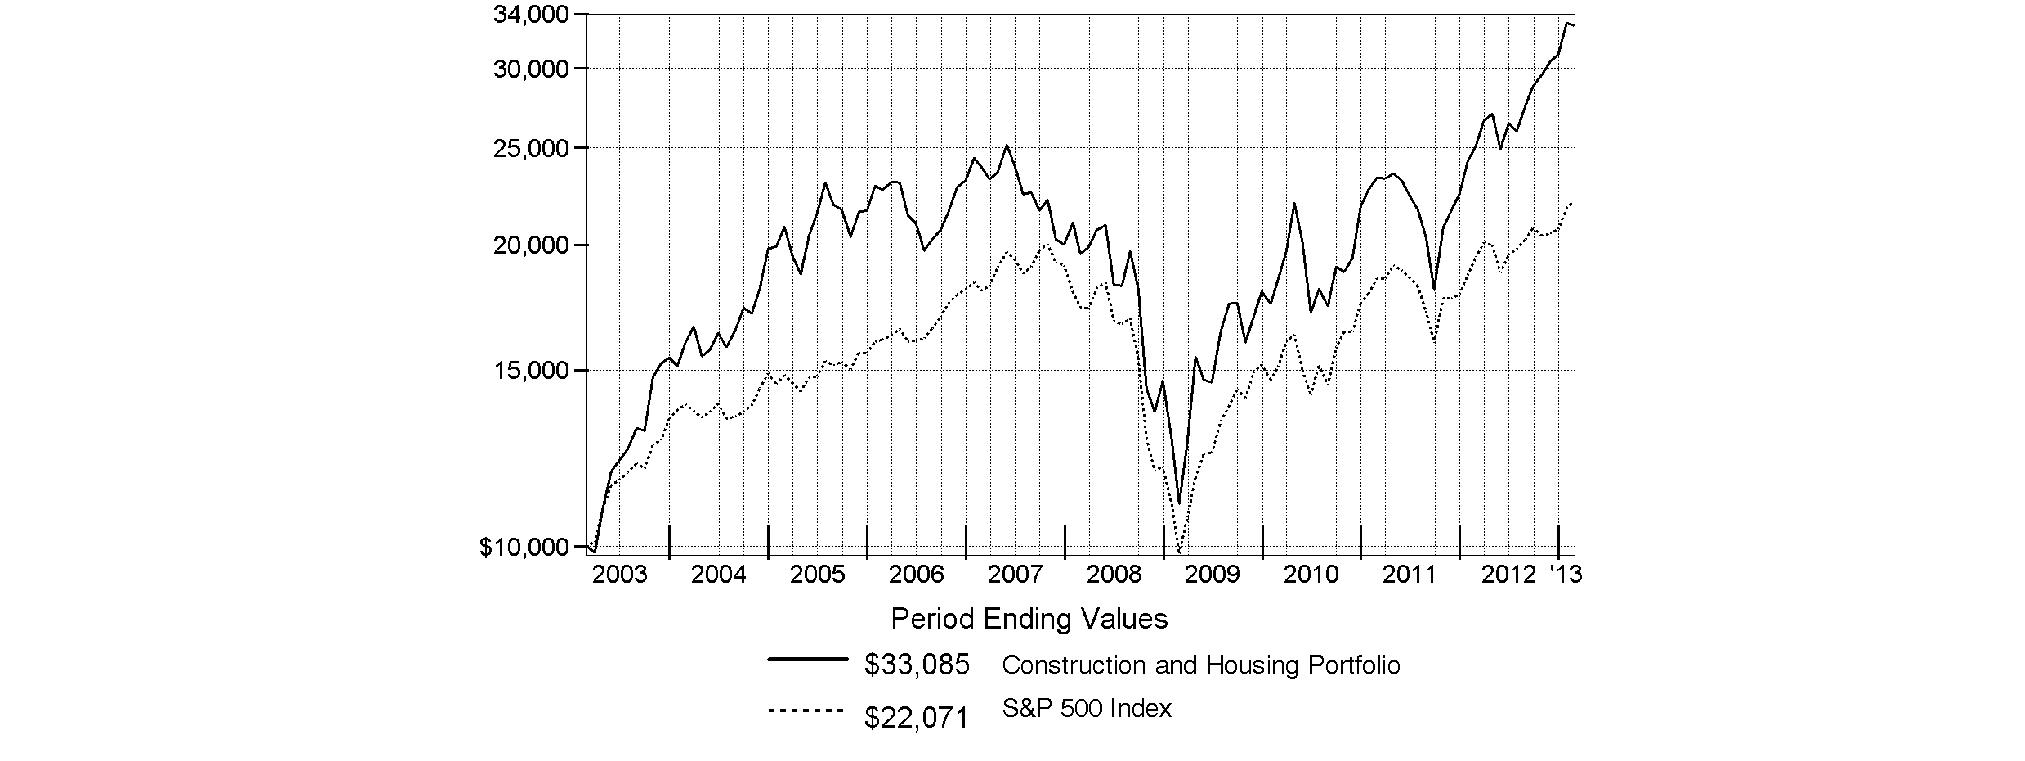
Construction and Housing Portfolio |
31.79% |
11.05% |
12.71% |
$10,000 Over 10 Years
Let's say hypothetically that $10,000 was invested in Construction and Housing Portfolio on February 28, 2003. The chart shows how the value of your investment would have changed, and also shows how the S&P 500 Index performed over the same period.
Annual Report
Construction and Housing Portfolio
Management's Discussion of Fund Performance
Market Recap: U.S. stocks posted solid gains for the year ending February 28, 2013, sparked by a late-period rally that pushed major equity benchmarks to multiyear highs. Improvement in the global economy and more monetary stimulus from the U.S. Federal Reserve kept markets on the upswing for much of the year, shrugging off an early decline brought on by debt woes in Europe, and another dip later in the period amid Congressional gridlock on the federal budget. Renewed optimism over employment, the housing market, corporate earnings and record dividends made stocks a favorite with investors during the 12 months, which helped push the broad-based S&P 500® Index across the milestone 1,500 mark at the end of January. The S&P 500® finished the period up 13.46%. Seven of the 10 major market sectors tracked by MSCI U.S. IMI 25-50 classifications produced double-digit gains, led by health care and financials, while information technology, energy and materials trailed the broad equity market with only modest advances.
Comments from Holger Boerner, who became sole Portfolio Manager of Construction and Housing Portfolio on October 1, 2012, after serving as Co-Manager: For the year, the fund returned 31.79%, beating the 30.25% gain of the MSCI® U.S. IMI Custom Construction & Housing 25-50 Index, and well ahead of the S&P 500®. Record-low interest rates, rising demand and constrained housing supply led to a pickup in new home construction and home values, benefiting the industry. Versus the index, an underweighting in lagging residential real estate investment trusts (REITs) and an overweighting in homebuilding helped the most, while stock picks in home improvement retail, an underweighting in the strong-performing building products group and a modest overweighting in construction/engineering detracted. Individual standouts included national homebuilders Ryland Group, D.R. Horton and Toll Brothers, whose sharp gains were driven by accelerated order growth, high profit margins and positive earnings surprises. In the residential REITs segment, sizable underweightings in UDR and AvalonBay Communities worked well, as decelerating revenue growth and rising costs pressured the group. On the downside, construction/engineering firm Fluor hurt due to an overweighting early on when slowing global economic growth hampered the business and the stock fell. Similarly, in home improvement retail, an early-period overweighting in Lowe's Companies and underweighting in Home Depot had a negative impact. Not owning home improvement retailer Lumber Liquidators Holdings and building products company Fortune Brands Home & Security for most of the period detracted, as the housing recovery fueled steep gains in the stocks of both index components. UDR, Lumber Liquidators and Fortune Brands were not in the fund at period end.
The views expressed above reflect those of the portfolio manager(s) only through the end of the period as stated on the cover of this report and do not necessarily represent the views of Fidelity or any other person in the Fidelity organization. Any such views are subject to change at any time based upon market or other conditions and Fidelity disclaims any responsibility to update such views. These views may not be relied on as investment advice and, because investment decisions for a Fidelity fund are based on numerous factors, may not be relied on as an indication of trading intent on behalf of any Fidelity fund.
Annual Report
Construction and Housing Portfolio
Investment Changes (Unaudited)
|
Top Ten Stocks as of February 28, 2013 |
||
|
|
% of fund's |
% of fund's net assets |
|
Home Depot, Inc. |
23.5 |
23.2 |
|
Lowe's Companies, Inc. |
12.2 |
10.7 |
|
Fluor Corp. |
3.4 |
4.5 |
|
Toll Brothers, Inc. |
2.7 |
4.2 |
|
Vulcan Materials Co. |
2.6 |
2.5 |
|
Jacobs Engineering Group, Inc. |
2.4 |
2.9 |
|
Quanta Services, Inc. |
2.4 |
3.2 |
|
Apartment Investment & Management Co. Class A |
2.4 |
2.2 |
|
Lennar Corp. Class A |
2.4 |
2.8 |
|
AvalonBay Communities, Inc. |
2.3 |
2.0 |
|
|
56.3 |
|
|
Top Industries (% of fund's net assets) |
|||
|
As of February 28, 2013 |
|||
|
Specialty Retail |
35.7% |
|
 |
Real Estate Investment Trusts |
15.9% |
|
 |
Household Durables |
14.3% |
|
 |
Construction & Engineering |
13.4% |
|
 |
Construction Materials |
8.4% |
|
|
All Others* |
12.3% |
|

|
As of August 31, 2012 |
|||
|
Specialty Retail |
33.9% |
|
|
Real Estate Investment Trusts |
21.7% |
|
|
Construction & Engineering |
15.8% |
|
 |
Household Durables |
13.6% |
|
|
Building Products |
5.4% |
|
|
All Others* |
9.6% |
|

|
* Includes short-term investments and net other assets. |
Annual Report
Construction and Housing Portfolio
Investments February 28, 2013
Showing Percentage of Net Assets
|
Common Stocks - 98.8% |
|||
|
Shares |
Value |
||
|
BUILDING PRODUCTS - 5.2% |
|||
|
Building Products - 5.2% |
|||
|
American Woodmark Corp. (a) |
239,068 |
$ 7,674,083 |
|
|
Armstrong World Industries, Inc. |
156,650 |
8,009,515 |
|
|
Gibraltar Industries, Inc. (a) |
87,400 |
1,498,910 |
|
|
Masco Corp. |
416,400 |
8,019,864 |
|
|
Owens Corning (a) |
101,669 |
3,945,774 |
|
|
USG Corp. (a)(d) |
410,000 |
11,570,200 |
|
|
|
40,718,346 |
||
|
COMMERCIAL SERVICES & SUPPLIES - 0.3% |
|||
|
Office Services & Supplies - 0.3% |
|||
|
Interface, Inc. |
152,480 |
2,791,909 |
|
|
CONSTRUCTION & ENGINEERING - 13.4% |
|||
|
Construction & Engineering - 13.4% |
|||
|
Dycom Industries, Inc. (a) |
476,000 |
9,972,200 |
|
|
Fluor Corp. |
422,300 |
26,140,370 |
|
|
Furmanite Corp. (a) |
882,689 |
5,269,653 |
|
|
Granite Construction, Inc. |
297,400 |
9,246,166 |
|
|
Jacobs Engineering Group, Inc. (a) |
390,250 |
19,059,810 |
|
|
MasTec, Inc. (a) |
321,000 |
9,658,890 |
|
|
Quanta Services, Inc. (a) |
670,800 |
19,050,720 |
|
|
Tutor Perini Corp. (a) |
366,890 |
6,240,799 |
|
|
|
104,638,608 |
||
|
CONSTRUCTION MATERIALS - 8.4% |
|||
|
Construction Materials - 8.4% |
|||
|
Eagle Materials, Inc. |
210,500 |
13,537,255 |
|
|
Headwaters, Inc. (a) |
1,095,354 |
10,307,281 |
|
|
James Hardie Industries PLC CDI |
272,998 |
2,732,767 |
|
|
Lafarge SA (Bearer) |
98,200 |
6,620,507 |
|
|
Martin Marietta Materials, Inc. (d) |
132,750 |
12,894,008 |
|
|
Vulcan Materials Co. |
391,460 |
19,937,058 |
|
|
|
66,028,876 |
||
|
CONTAINERS & PACKAGING - 1.2% |
|||
|
Paper Packaging - 1.2% |
|||
|
Rock-Tenn Co. Class A |
103,900 |
9,189,955 |
|
|
ELECTRICAL EQUIPMENT - 0.4% |
|||
|
Electrical Components & Equipment - 0.4% |
|||
|
Generac Holdings, Inc. |
94,400 |
3,252,080 |
|
|
ENERGY EQUIPMENT & SERVICES - 1.2% |
|||
|
Oil & Gas Equipment & Services - 1.2% |
|||
|
McDermott International, Inc. (a) |
720,500 |
9,164,760 |
|
|
HOUSEHOLD DURABLES - 14.1% |
|||
|
Homebuilding - 13.1% |
|||
|
D.R. Horton, Inc. |
805,137 |
17,954,555 |
|
|
KB Home (d) |
594,600 |
11,113,074 |
|
|
Lennar Corp. Class A (d) |
484,078 |
18,680,570 |
|
|
M.D.C. Holdings, Inc. |
170,292 |
6,544,322 |
|
|
|
|||
|
Shares |
Value |
||
|
M/I Homes, Inc. (a) |
478,350 |
$ 10,954,215 |
|
|
PulteGroup, Inc. (a) |
295,583 |
5,669,282 |
|
|
Ryland Group, Inc. |
294,070 |
10,504,180 |
|
|
Toll Brothers, Inc. (a) |
604,714 |
20,632,842 |
|
|
|
102,053,040 |
||
|
Household Appliances - 1.0% |
|||
|
Whirlpool Corp. |
70,000 |
7,906,500 |
|
|
TOTAL HOUSEHOLD DURABLES |
109,959,540 |
||
|
REAL ESTATE INVESTMENT TRUSTS - 15.9% |
|||
|
Residential REITs - 14.9% |
|||
|
Apartment Investment & Management Co. Class A |
642,271 |
19,024,067 |
|
|
AvalonBay Communities, Inc. |
145,759 |
18,195,096 |
|
|
BRE Properties, Inc. |
248,900 |
12,099,029 |
|
|
Camden Property Trust (SBI) |
212,600 |
14,699,164 |
|
|
Equity Residential (SBI) |
311,192 |
17,128,008 |
|
|
Essex Property Trust, Inc. |
116,300 |
17,327,537 |
|
|
Home Properties, Inc. |
225,600 |
14,081,952 |
|
|
Sun Communities, Inc. |
76,059 |
3,539,025 |
|
|
|
116,093,878 |
||
|
Retail REITs - 1.0% |
|||
|
CBL & Associates Properties, Inc. |
347,200 |
7,895,328 |
|
|
TOTAL REAL ESTATE INVESTMENT TRUSTS |
123,989,206 |
||
|
REAL ESTATE MANAGEMENT & DEVELOPMENT - 1.5% |
|||
|
Real Estate Operating Companies - 1.5% |
|||
|
Forest City Enterprises, Inc. Class A (a) |
599,600 |
9,617,584 |
|
|
LEG Immobilien AG |
37,775 |
2,168,475 |
|
|
|
11,786,059 |
||
|
SPECIALTY RETAIL - 35.7% |
|||
|
Home Improvement Retail - 35.7% |
|||
|
Home Depot, Inc. |
2,678,261 |
183,460,877 |
|
|
Lowe's Companies, Inc. |
2,498,734 |
95,326,702 |
|
|
|
278,787,579 |
||
|
THRIFTS & MORTGAGE FINANCE - 0.6% |
|||
|
Thrifts & Mortgage Finance - 0.6% |
|||
|
Radian Group, Inc. |
50,900 |
448,429 |
|
|
Walker & Dunlop, Inc. (a) |
194,161 |
4,116,213 |
|
|
|
4,564,642 |
||
|
TRADING COMPANIES & DISTRIBUTORS - 0.9% |
|||
|
Trading Companies & Distributors - 0.9% |
|||
|
Watsco, Inc. |
86,600 |
6,743,542 |
|
|
TOTAL COMMON STOCKS (Cost $679,090,305) |
|
||
|
Nonconvertible Preferred Stocks - 0.2% |
|||
|
Shares |
Value |
||
|
HOUSEHOLD DURABLES - 0.2% |
|||
|
Homebuilding - 0.2% |
|||
|
M/I Homes, Inc. Series A, 9.75% (a) |
69,778 |
$ 1,751,428 |
|
|
Money Market Funds - 4.9% |
|||
|
|
|
|
|
|
Fidelity Cash Central Fund, 0.16% (b) |
3,710,749 |
3,710,749 |
|
|
Fidelity Securities Lending Cash Central Fund, 0.16% (b)(c) |
34,324,380 |
34,324,380 |
|
|
TOTAL MONEY MARKET FUNDS (Cost $38,035,129) |
|
||
|
TOTAL INVESTMENT PORTFOLIO - 103.9% (Cost $718,575,839) |
811,401,659 |
||
|
NET OTHER ASSETS (LIABILITIES) - (3.9)% |
(30,394,632) |
||
|
NET ASSETS - 100% |
$ 781,007,027 |
||
|
Legend |
|
(a) Non-income producing |
|
(b) Affiliated fund that is generally available only to investment companies and other accounts managed by Fidelity Investments. The rate quoted is the annualized seven-day yield of the fund at period end. A complete unaudited listing of the fund's holdings as of its most recent quarter end is available upon request. In addition, each Fidelity Central Fund's financial statements, which are not covered by the Fund's Report of Independent Registered Public Accounting Firm, are available on the SEC's website or upon request. |
|
(c) Investment made with cash collateral received from securities on loan. |
|
(d) Security or a portion of the security is on loan at period end. |
|
Affiliated Central Funds |
|
Information regarding fiscal year to date income earned by the Fund from investments in Fidelity Central Funds is as follows: |
|
Fund |
Income earned |
|
Fidelity Cash Central Fund |
$ 14,783 |
|
Fidelity Securities Lending Cash Central Fund |
53,623 |
|
Total |
$ 68,406 |
|
Other Information |
|
All investments are categorized as Level 1 under the Fair Value Hierarchy. The inputs or methodology used for valuing securities may not be an indication of the risk associated with investing in those securities. For more information on valuation inputs, please refer to the Investment Valuation section in the accompanying Notes to Financial Statements. |
See accompanying notes which are an integral part of the financial statements.
Annual Report
Construction and Housing Portfolio
Financial Statements
Statement of Assets and Liabilities
|
|
February 28, 2013 |
|
|
|
|
|
|
Assets |
|
|
|
Investment in securities, at value (including securities loaned of $33,169,257) - See accompanying schedule: Unaffiliated issuers (cost $680,540,710) |
$ 773,366,530 |
|
|
Fidelity Central Funds (cost $38,035,129) |
38,035,129 |
|
|
Total Investments (cost $718,575,839) |
|
$ 811,401,659 |
|
Receivable for investments sold |
|
14,345,020 |
|
Receivable for fund shares sold |
|
3,389,300 |
|
Dividends receivable |
|
159,522 |
|
Distributions receivable from Fidelity Central Funds |
|
9,025 |
|
Prepaid expenses |
|
637 |
|
Receivable from investment adviser for expense reductions |
|
288 |
|
Other receivables |
|
18,052 |
|
Total assets |
|
829,323,503 |
|
|
|
|
|
Liabilities |
|
|
|
Payable for investments purchased |
$ 11,722,400 |
|
|
Payable for fund shares redeemed |
1,733,274 |
|
|
Accrued management fee |
354,473 |
|
|
Other affiliated payables |
126,718 |
|
|
Other payables and accrued expenses |
55,231 |
|
|
Collateral on securities loaned, at value |
34,324,380 |
|
|
Total liabilities |
|
48,316,476 |
|
|
|
|
|
Net Assets |
|
$ 781,007,027 |
|
Net Assets consist of: |
|
|
|
Paid in capital |
|
$ 688,369,076 |
|
Undistributed net investment income |
|
139,301 |
|
Accumulated undistributed net realized gain (loss) on investments and foreign currency transactions |
|
(328,354) |
|
Net unrealized appreciation (depreciation) on investments and assets and liabilities in foreign currencies |
|
92,827,004 |
|
Net Assets, for 15,017,726 shares outstanding |
|
$ 781,007,027 |
|
Net Asset Value, offering price and redemption price per share ($781,007,027 ÷ 15,017,726 shares) |
|
$ 52.01 |
Statement of Operations
|
|
Year ended February 28, 2013 |
|
|
|
|
|
|
Investment Income |
|
|
|
Dividends |
|
$ 4,232,133 |
|
Income from Fidelity Central Funds (including $53,623 from security lending) |
|
68,406 |
|
Total income |
|
4,300,539 |
|
|
|
|
|
Expenses |
|
|
|
Management fee |
$ 1,897,905 |
|
|
Transfer agent fees |
725,801 |
|
|
Accounting and security lending fees |
131,615 |
|
|
Custodian fees and expenses |
17,420 |
|
|
Independent trustees' compensation |
1,906 |
|
|
Registration fees |
94,114 |
|
|
Audit |
38,080 |
|
|
Legal |
928 |
|
|
Miscellaneous |
1,507 |
|
|
Total expenses before reductions |
2,909,276 |
|
|
Expense reductions |
(31,182) |
2,878,094 |
|
Net investment income (loss) |
|
1,422,445 |
|
Realized and Unrealized Gain (Loss) Net realized gain (loss) on: |
|
|
|
Investment securities: |
|
|
|
Unaffiliated issuers |
13,161,826 |
|
|
Foreign currency transactions |
6,772 |
|
|
Total net realized gain (loss) |
|
13,168,598 |
|
Change in net unrealized appreciation (depreciation) on: Investment securities |
77,121,102 |
|
|
Assets and liabilities in foreign currencies |
1,184 |
|
|
Total change in net unrealized appreciation (depreciation) |
|
77,122,286 |
|
Net gain (loss) |
|
90,290,884 |
|
Net increase (decrease) in net assets resulting from operations |
|
$ 91,713,329 |
See accompanying notes which are an integral part of the financial statements.
Annual Report
Construction and Housing Portfolio
Financial Statements - continued
Statement of Changes in Net Assets
|
|
Year ended |
Year ended |
|
Increase (Decrease) in Net Assets |
|
|
|
Operations |
|
|
|
Net investment income (loss) |
$ 1,422,445 |
$ 595,248 |
|
Net realized gain (loss) |
13,168,598 |
5,605,883 |
|
Change in net unrealized appreciation (depreciation) |
77,122,286 |
5,586,759 |
|
Net increase (decrease) in net assets resulting from operations |
91,713,329 |
11,787,890 |
|
Distributions to shareholders from net investment income |
(1,172,487) |
(636,876) |
|
Distributions to shareholders from net realized gain |
(4,637,838) |
- |
|
Total distributions |
(5,810,325) |
(636,876) |
|
Share transactions |
698,619,193 |
114,698,637 |
|
Reinvestment of distributions |
5,599,926 |
621,770 |
|
Cost of shares redeemed |
(180,705,745) |
(67,163,181) |
|
Net increase (decrease) in net assets resulting from share transactions |
523,513,374 |
48,157,226 |
|
Redemption fees |
76,720 |
5,297 |
|
Total increase (decrease) in net assets |
609,493,098 |
59,313,537 |
|
|
|
|
|
Net Assets |
|
|
|
Beginning of period |
171,513,929 |
112,200,392 |
|
End of period (including undistributed net investment income of $139,301 and distributions in excess of net investment income of $52,526, respectively) |
$ 781,007,027 |
$ 171,513,929 |
|
Other Information Shares |
|
|
|
Sold |
14,575,583 |
3,099,736 |
|
Issued in reinvestment of distributions |
115,773 |
17,775 |
|
Redeemed |
(3,960,211) |
(1,828,259) |
|
Net increase (decrease) |
10,731,145 |
1,289,252 |
Financial Highlights
|
Years ended February 28, |
2013 |
2012 F |
2011 |
2010 |
2009 |
|
Selected Per-Share Data |
|
|
|
|
|
|
Net asset value, beginning of period |
$ 40.01 |
$ 37.43 |
$ 29.89 |
$ 18.01 |
$ 33.19 |
|
Income from Investment Operations |
|
|
|
|
|
|
Net investment income (loss) B |
.19 |
.21 |
.18 |
.22 |
.31 |
|
Net realized and unrealized gain (loss) |
12.47 |
2.62 |
7.63 |
11.91 |
(14.35) |
|
Total from investment operations |
12.66 |
2.83 |
7.81 |
12.13 |
(14.04) |
|
Distributions from net investment income |
(.14) |
(.25) |
(.28) |
(.25) |
(.30) |
|
Distributions from net realized gain |
(.53) |
- |
- |
- |
(.85) |
|
Total distributions |
(.67) |
(.25) |
(.28) |
(.25) |
(1.15) |
|
Redemption fees added to paid in capital B |
.01 |
- G |
.01 |
- G |
.01 |
|
Net asset value, end of period |
$ 52.01 |
$ 40.01 |
$ 37.43 |
$ 29.89 |
$ 18.01 |
|
Total Return A |
31.79% |
7.65% |
26.24% |
67.46% |
(43.68)% |
|
Ratios to Average Net Assets C, E |
|
|
|
|
|
|
Expenses before reductions |
.86% |
.96% |
.98% |
1.01% |
1.03% |
|
Expenses net of fee waivers, if any |
.86% |
.96% |
.98% |
1.01% |
1.03% |
|
Expenses net of all reductions |
.86% |
.96% |
.98% |
1.01% |
1.02% |
|
Net investment income (loss) |
.42% |
.59% |
.55% |
.84% |
1.14% |
|
Supplemental Data |
|
|
|
|
|
|
Net assets, end of period (000 omitted) |
$ 781,007 |
$ 171,514 |
$ 112,200 |
$ 99,562 |
$ 82,219 |
|
Portfolio turnover rate D |
47% |
81% |
101% |
82% |
85% |
|
A Total returns would have been lower if certain expenses had not been reduced during the applicable periods shown. B Calculated based on average shares outstanding during the period. C Fees and expenses of any underlying Fidelity Central Funds are not included in the Fund's expense ratio. The Fund indirectly bears its proportionate share of the expenses of any underlying Fidelity Central Funds. D Amount does not include the portfolio activity of any underlying Fidelity Central Funds. E Expense ratios reflect operating expenses of the Fund. Expenses before reductions do not reflect amounts reimbursed by the investment adviser or reductions from brokerage service arrangements or reductions from other expense offset arrangements and do not represent the amount paid by the Fund during periods when reimbursements or reductions occur. Expenses net of fee waivers reflect expenses after reimbursement by the investment adviser but prior to reductions from brokerage service arrangements or other expense offset arrangements. Expenses net of all reductions represent the net expenses paid by the Fund. F For the year ended February 29. G Amount represents less than $.01 per share. |
See accompanying notes which are an integral part of the financial statements.
Annual Report
Consumer Discretionary Portfolio
Performance: The Bottom Line
Average annual total return reflects the change in the value of an investment, assuming reinvestment of the fund's distributions from dividend income and capital gains (the profits earned upon the sale of securities that have grown in value, if any) and assuming a constant rate of performance each year. The $10,000 table and the fund's returns do not reflect the deduction of taxes that a shareholder would pay on fund distributions or the redemption of fund shares. During periods of reimbursement by Fidelity, a fund's total return will be greater than it would be had the reimbursement not occurred. How a fund did yesterday is no guarantee of how it will do tomorrow.
Average Annual Total Returns
|
Periods ended February 28, 2013 |
Past 1 |
Past 5 |
Past 10 |
|
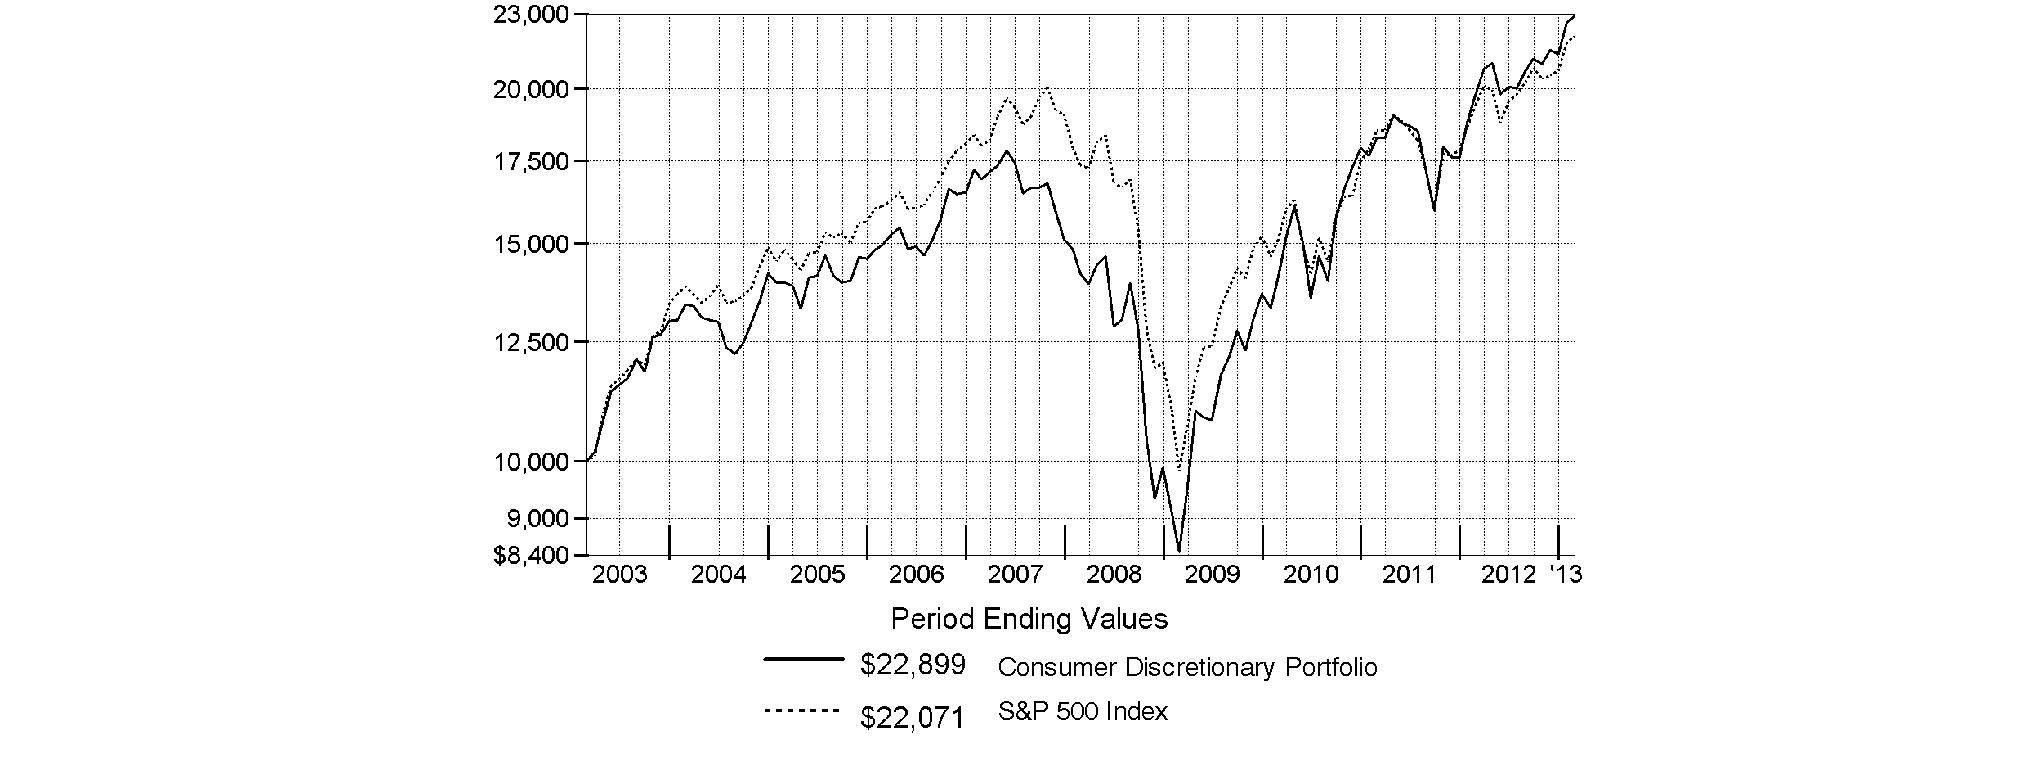
Consumer Discretionary Portfolio A |
15.38% |
10.07% |
8.64% |
A Prior to October 1, 2006, Consumer Discretionary Portfolio operated under certain different investment policies. The historical performance for the fund may not represent its current investment policies.
$10,000 Over 10 Years
Let's say hypothetically that $10,000 was invested in Consumer Discretionary Portfolio on February 28, 2003. The chart shows how the value of your investment would have changed, and also shows how the S&P 500 Index performed over the same period.
Annual Report
Consumer Discretionary Portfolio
Management's Discussion of Fund Performance
Market Recap: U.S. stocks posted solid gains for the year ending February 28, 2013, sparked by a late-period rally that pushed major equity benchmarks to multiyear highs. Improvement in the global economy and more monetary stimulus from the U.S. Federal Reserve kept markets on the upswing for much of the year, shrugging off an early decline brought on by debt woes in Europe, and another dip later in the period amid Congressional gridlock on the federal budget. Renewed optimism over employment, the housing market, corporate earnings and record dividends made stocks a favorite with investors during the 12 months, which helped push the broad-based S&P 500® Index across the milestone 1,500 mark at the end of January. The S&P 500® finished the period up 13.46%. Seven of the 10 major market sectors tracked by MSCI U.S. IMI 25-50 classifications produced double-digit gains, led by health care and financials, while information technology, energy and materials trailed the broad equity market with only modest advances.
Comments from Gordon Scott, who became Portfolio Manager of Consumer Discretionary Portfolio on May 1, 2012: The fund did well on an absolute basis, posting a 15.38% return for the year. Its relative performance versus the sector benchmark was disappointing, however, as the MSCI® U.S. IMI Consumer Discretionary 25-50 Index advanced 18.69%, but it outpaced the S&P 500®. The consumer discretionary sector was one of the market's stronger performers during the past year, buoyed by rising consumer confidence and a favorable shift in investor sentiment toward a more pro-cyclical, global-recovery market environment. From a broad perspective, the fund's overall bias toward domestic growth stocks was a bit of a headwind, as globally oriented value stocks tended to be more in favor, especially during the second half of the period. Within that context, the fund's relative underperformance was mostly due to inopportune industry positioning. In particular, the fund had significantly greater exposure than the index to general merchandise stores and specialty stores, industries that struggled later in the reporting period. An overweighting in restaurants, on average, also hurt, as did security selection in such areas as home furnishings and apparel retail. In terms of individual stocks, the fund's biggest detractor from relative performance was an overweighted position in Tempur-Pedic International, which makes premium mattresses and pillows. The stock performed poorly, in part due to competitive pressures on profit margins, and the fund's position was sold. An overweighting in fast-food chain operator Yum! Brands detracted, as investors were spooked by declining same-store sales in China, where the company derives a sizable portion of its revenues. The fund's positions in two off-price retailers, Dollar Tree and Ross Stores, also hurt. I added or added to these stocks in hopes of benefiting from potential growth in demand from value-conscious consumers, but, later in the reporting period, both traded down as the companies' earning growth slowed, partially due to greater competition in the off-price space. On the upside, relative performance was bolstered by opportune stock picking in the leisure products industry, as well as by underweighting certain stocks in the underperforming apparel, accessories and luxury goods category. The fund's strongest contributor was its significantly overweighted stake in cable giant Comcast, whose stock rose on solid increases in revenue and operating income. Brunswick, a leader in the marine, fitness, and bowling and billiards industries, and global consumer products conglomerate Jarden also buoyed the fund's relative results, as investors rewarded both companies for their strong earnings and free cash flow generation.
The views expressed above reflect those of the portfolio manager(s) only through the end of the period as stated on the cover of this report and do not necessarily represent the views of Fidelity or any other person in the Fidelity organization. Any such views are subject to change at any time based upon market or other conditions and Fidelity disclaims any responsibility to update such views. These views may not be relied on as investment advice and, because investment decisions for a Fidelity fund are based on numerous factors, may not be relied on as an indication of trading intent on behalf of any Fidelity fund.
Annual Report
Consumer Discretionary Portfolio
Investment Changes (Unaudited)
|
Top Ten Stocks as of February 28, 2013 |
||
|
|
% of fund's |
% of fund's net assets |
|
Comcast Corp. Class A |
8.0 |
7.5 |
|
The Walt Disney Co. |
5.5 |
6.0 |
|
News Corp. Class A |
4.5 |
4.4 |
|
Lowe's Companies, Inc. |
4.1 |
2.1 |
|
Time Warner, Inc. |
3.6 |
2.7 |
|
Home Depot, Inc. |
2.9 |
0.0 |
|
NIKE, Inc. Class B |
2.5 |
0.5 |
|
Yum! Brands, Inc. |
2.4 |
3.4 |
|
O'Reilly Automotive, Inc. |
2.3 |
1.4 |
|
Starbucks Corp. |
2.2 |
2.4 |
|
|
38.0 |
|
|
Top Industries (% of fund's net assets) |
|||
|
As of February 28, 2013 |
|||
|
Specialty Retail |
33.3% |
|
|
Media |
25.5% |
|
|
Hotels, Restaurants & Leisure |
10.2% |
|
|
Textiles, Apparel & Luxury Goods |
9.4% |
|
|
Internet & Catalog Retail |
5.1% |
|
|
All Others* |
16.5% |
|

|
As of August 31, 2012 |
|||
|
Media |
29.2% |
|
|
Specialty Retail |
26.8% |
|
|
Hotels, Restaurants & Leisure |
13.4% |
|
|
Multiline Retail |
7.9% |
|
|
Textiles, Apparel & Luxury Goods |
5.2% |
|
|
All Others* |
17.5% |
|

|
* Includes short-term investments and net other assets. |
Annual Report
Consumer Discretionary Portfolio
Investments February 28, 2013
Showing Percentage of Net Assets
|
Common Stocks - 98.4% |
|||
|
Shares |
Value |
||
|
AUTO COMPONENTS - 3.2% |
|||
|
Auto Parts & Equipment - 3.2% |
|||
|
BorgWarner, Inc. (a) |
51,542 |
$ 3,835,240 |
|
|
Delphi Automotive PLC |
119,631 |
5,006,557 |
|
|
Lear Corp. |
36,292 |
1,938,719 |
|
|
Tenneco, Inc. (a) |
53,700 |
1,902,591 |
|
|
|
12,683,107 |
||
|
COMMERCIAL SERVICES & SUPPLIES - 0.8% |
|||
|
Office Services & Supplies - 0.8% |
|||
|
Interface, Inc. |
184,900 |
3,385,519 |
|
|
DISTRIBUTORS - 1.6% |
|||
|
Distributors - 1.6% |
|||
|
LKQ Corp. (a) |
299,386 |
6,343,989 |
|
|
DIVERSIFIED CONSUMER SERVICES - 0.2% |
|||
|
Specialized Consumer Services - 0.2% |
|||
|
Ascent Capital Group, Inc. (a) |
13,072 |
896,608 |
|
|
HOTELS, RESTAURANTS & LEISURE - 10.2% |
|||
|
Casinos & Gaming - 1.4% |
|||
|
Las Vegas Sands Corp. |
103,809 |
5,345,125 |
|
|
Hotels, Resorts & Cruise Lines - 1.2% |
|||
|
Wyndham Worldwide Corp. |
81,640 |
4,917,994 |
|
|
Restaurants - 7.6% |
|||
|
Buffalo Wild Wings, Inc. (a) |
31,800 |
2,502,342 |
|
|
Chipotle Mexican Grill, Inc. (a) |
11,326 |
3,587,964 |
|
|
Domino's Pizza, Inc. |
124,100 |
5,909,642 |
|
|
Starbucks Corp. |
161,618 |
8,859,899 |
|
|
Yum! Brands, Inc. |
141,839 |
9,287,618 |
|
|
|
30,147,465 |
||
|
TOTAL HOTELS, RESTAURANTS & LEISURE |
40,410,584 |
||
|
HOUSEHOLD DURABLES - 3.0% |
|||
|
Homebuilding - 0.5% |
|||
|
Lennar Corp. Class A |
55,800 |
2,153,322 |
|
|
Housewares & Specialties - 2.5% |
|||
|
Jarden Corp. |
99,649 |
6,189,199 |
|
|
Tupperware Brands Corp. |
45,500 |
3,559,465 |
|
|
|
9,748,664 |
||
|
TOTAL HOUSEHOLD DURABLES |
11,901,986 |
||
|
INTERNET & CATALOG RETAIL - 5.1% |
|||
|
Catalog Retail - 2.0% |
|||
|
Liberty Media Corp. Interactive Series A (a) |
369,297 |
7,710,921 |
|
|
|
|||
|
Shares |
Value |
||
|
Internet Retail - 3.1% |
|||
|
Amazon.com, Inc. (a) |
17,868 |
$ 4,721,976 |
|
|
priceline.com, Inc. (a) |
11,273 |
7,751,089 |
|
|
|
12,473,065 |
||
|
TOTAL INTERNET & CATALOG RETAIL |
20,183,986 |
||
|
LEISURE EQUIPMENT & PRODUCTS - 1.8% |
|||
|
Leisure Products - 1.8% |
|||
|
Brunswick Corp. |
201,932 |
7,358,402 |
|
|
MACHINERY - 0.3% |
|||
|
Industrial Machinery - 0.3% |
|||
|
Stanley Black & Decker, Inc. |
14,400 |
1,133,280 |
|
|
MEDIA - 25.5% |
|||
|
Broadcasting - 1.5% |
|||
|
Discovery Communications, Inc. (a) |
84,400 |
6,189,052 |
|
|
Cable & Satellite - 10.4% |
|||
|
Comcast Corp. Class A |
802,360 |
31,925,905 |
|
|
DIRECTV (a) |
85,954 |
4,140,404 |
|
|
Sirius XM Radio, Inc. (d) |
1,666,577 |
5,166,389 |
|
|
|
41,232,698 |
||
|
Movies & Entertainment - 13.6% |
|||
|
News Corp. Class A |
618,969 |
17,826,307 |
|
|
The Walt Disney Co. |
398,858 |
21,773,658 |
|
|
Time Warner, Inc. |
272,027 |
14,463,676 |
|
|
|
54,063,641 |
||
|
TOTAL MEDIA |
101,485,391 |
||
|
MULTILINE RETAIL - 3.6% |
|||
|
General Merchandise Stores - 3.6% |
|||
|
Dollar General Corp. (a) |
160,038 |
7,416,161 |
|
|
Dollar Tree, Inc. (a) |
154,427 |
6,977,784 |
|
|
|
14,393,945 |
||
|
PROFESSIONAL SERVICES - 0.4% |
|||
|
Research & Consulting Services - 0.4% |
|||
|
Nielsen Holdings B.V. |
43,500 |
1,465,515 |
|
|
SPECIALTY RETAIL - 33.3% |
|||
|
Apparel Retail - 6.5% |
|||
|
Abercrombie & Fitch Co. Class A |
77,180 |
3,598,903 |
|
|
American Eagle Outfitters, Inc. |
173,860 |
3,595,425 |
|
|
Ascena Retail Group, Inc. (a) |
89,179 |
1,497,315 |
|
|
Limited Brands, Inc. |
86,898 |
3,955,597 |
|
|
Ross Stores, Inc. |
103,320 |
5,988,427 |
|
|
TJX Companies, Inc. |
160,261 |
7,206,937 |
|
|
|
25,842,604 |
||
|
Automotive Retail - 4.1% |
|||
|
CarMax, Inc. (a) |
184,563 |
7,089,065 |
|
|
O'Reilly Automotive, Inc. (a) |
91,070 |
9,265,462 |
|
|
|
16,354,527 |
||
|
Common Stocks - continued |
|||
|
Shares |
Value |
||
|
SPECIALTY RETAIL - CONTINUED |
|||
|
Home Improvement Retail - 7.0% |
|||
|
Home Depot, Inc. |
167,562 |
$ 11,477,997 |
|
|
Lowe's Companies, Inc. |
425,235 |
16,222,715 |
|
|
|
27,700,712 |
||
|
Homefurnishing Retail - 2.4% |
|||
|
Bed Bath & Beyond, Inc. (a) |
84,324 |
4,785,387 |
|
|
Williams-Sonoma, Inc. |
105,617 |
4,795,012 |
|
|
|
9,580,399 |
||
|
Specialty Stores - 13.3% |
|||
|
Cabela's, Inc. Class A (a) |
106,700 |
5,397,953 |
|
|
Dick's Sporting Goods, Inc. |
109,228 |
5,461,400 |
|
|
Hibbett Sports, Inc. (a) |
58,700 |
3,101,708 |
|
|
PetSmart, Inc. |
89,800 |
5,846,878 |
|
|
Sally Beauty Holdings, Inc. (a) |
177,090 |
4,912,477 |
|
|
Signet Jewelers Ltd. |
116,400 |
7,126,008 |
|
|
Staples, Inc. |
223,000 |
2,939,140 |
|
|
Tiffany & Co., Inc. (d) |
75,154 |
5,047,343 |
|
|
Tractor Supply Co. |
65,239 |
6,784,204 |
|
|
Ulta Salon, Cosmetics & Fragrance, Inc. |
44,385 |
3,930,736 |
|
|
Vitamin Shoppe, Inc. (a) |
48,200 |
2,532,910 |
|
|
|
53,080,757 |
||
|
TOTAL SPECIALTY RETAIL |
132,558,999 |
||
|
TEXTILES, APPAREL & LUXURY GOODS - 9.4% |
|||
|
Apparel, Accessories & Luxury Goods - 5.8% |
|||
|
Hanesbrands, Inc. (a) |
135,100 |
5,355,364 |
|
|
Michael Kors Holdings Ltd. (a) |
20,600 |
1,221,168 |
|
|
PVH Corp. |
66,485 |
8,101,197 |
|
|
Ralph Lauren Corp. |
15,955 |
2,767,714 |
|
|
VF Corp. |
35,985 |
5,802,941 |
|
|
|
23,248,384 |
||
|
Footwear - 3.6% |
|||
|
NIKE, Inc. Class B |
183,122 |
9,972,824 |
|
|
|
|||
|
Shares |
Value |
||
|
Steven Madden Ltd. (a) |
41,606 |
$ 1,834,409 |
|
|
Wolverine World Wide, Inc. |
55,900 |
2,358,980 |
|
|
|
14,166,213 |
||
|
TOTAL TEXTILES, APPAREL & LUXURY GOODS |
37,414,597 |
||
|
TOTAL COMMON STOCKS (Cost $325,345,658) |
|
||
|
Money Market Funds - 4.1% |
|||
|
|
|
|
|
|
Fidelity Cash Central Fund, 0.16% (b) |
6,055,808 |
6,055,808 |
|
|
Fidelity Securities Lending Cash Central Fund, 0.16% (b)(c) |
10,155,047 |
10,155,047 |
|
|
TOTAL MONEY MARKET FUNDS (Cost $16,210,855) |
|
||
|
TOTAL INVESTMENT PORTFOLIO - 102.5% (Cost $341,556,513) |
407,826,763 |
||
|
NET OTHER ASSETS (LIABILITIES) - (2.5)% |
(9,901,802) |
||
|
NET ASSETS - 100% |
$ 397,924,961 |
||
|
Legend |
|
(a) Non-income producing |
|
(b) Affiliated fund that is generally available only to investment companies and other accounts managed by Fidelity Investments. The rate quoted is the annualized seven-day yield of the fund at period end. A complete unaudited listing of the fund's holdings as of its most recent quarter end is available upon request. In addition, each Fidelity Central Fund's financial statements, which are not covered by the Fund's Report of Independent Registered Public Accounting Firm, are available on the SEC's website or upon request. |
|
(c) Investment made with cash collateral received from securities on loan. |
|
(d) Security or a portion of the security is on loan at period end. |
|
Affiliated Central Funds |
|
Information regarding fiscal year to date income earned by the Fund from investments in Fidelity Central Funds is as follows: |
|
Fund |
Income earned |
|
Fidelity Cash Central Fund |
$ 6,263 |
|
Fidelity Securities Lending Cash Central Fund |
62,598 |
|
Total |
$ 68,861 |
|
Other Information |
|
All investments are categorized as Level 1 under the Fair Value Hierarchy. The inputs or methodology used for valuing securities may not be an indication of the risk associated with investing in those securities. For more information on valuation inputs, please refer to the Investment Valuation section in the accompanying Notes to Financial Statements. |
See accompanying notes which are an integral part of the financial statements.
Annual Report
Consumer Discretionary Portfolio
Financial Statements
Statement of Assets and Liabilities
|
|
February 28, 2013 |
|
|
|
|
|
|
Assets |
|
|
|
Investment in securities, at value (including securities loaned of $9,847,613) - See accompanying schedule: Unaffiliated issuers (cost $325,345,658) |
$ 391,615,908 |
|
|
Fidelity Central Funds (cost $16,210,855) |
16,210,855 |
|
|
Total Investments (cost $341,556,513) |
|
$ 407,826,763 |
|
Receivable for fund shares sold |
|
536,218 |
|
Dividends receivable |
|
211,179 |
|
Distributions receivable from Fidelity Central Funds |
|
2,005 |
|
Prepaid expenses |
|
715 |
|
Receivable from investment adviser for expense reductions |
|
16 |
|
Other receivables |
|
14,733 |
|
Total assets |
|
408,591,629 |
|
|
|
|
|
Liabilities |
|
|
|
Payable for fund shares redeemed |
$ 211,171 |
|
|
Accrued management fee |
181,483 |
|
|
Other affiliated payables |
79,274 |
|
|
Other payables and accrued expenses |
39,693 |
|
|
Collateral on securities loaned, at value |
10,155,047 |
|
|
Total liabilities |
|
10,666,668 |
|
|
|
|
|
Net Assets |
|
$ 397,924,961 |
|
Net Assets consist of: |
|
|
|
Paid in capital |
|
$ 333,133,047 |
|
Undistributed net investment income |
|
71,669 |
|
Accumulated undistributed net realized gain (loss) on investments and foreign currency transactions |
|
(1,550,005) |
|
Net unrealized appreciation (depreciation) on investments |
|
66,270,250 |
|
Net Assets, for 14,523,342 shares outstanding |
|
$ 397,924,961 |
|
Net Asset Value, offering price and redemption price per share ($397,924,961 ÷ 14,523,342 shares) |
|
$ 27.40 |
Statement of Operations
|
|
Year ended February 28, 2013 |
|
|
|
|
|
|
Investment Income |
|
|
|
Dividends |
|
$ 4,076,157 |
|
Income from Fidelity Central Funds (including $62,598 from security lending) |
|
68,861 |
|
Total income |
|
4,145,018 |
|
|
|
|
|
Expenses |
|
|
|
Management fee |
$ 1,823,645 |
|
|
Transfer agent fees |
734,561 |
|
|
Accounting and security lending fees |
129,095 |
|
|
Custodian fees and expenses |
19,221 |
|
|
Independent trustees' compensation |
2,095 |
|
|
Registration fees |
42,080 |
|
|
Audit |
49,441 |
|
|
Legal |
1,126 |
|
|
Miscellaneous |
2,444 |
|
|
Total expenses before reductions |
2,803,708 |
|
|
Expense reductions |
(48,271) |
2,755,437 |
|
Net investment income (loss) |
|
1,389,581 |
|
Realized and Unrealized Gain (Loss) Net realized gain (loss) on: |
|
|
|
Investment securities: |
|
|
|
Unaffiliated issuers (net of foreign taxes of $10,018) |
32,711,295 |
|
|
Foreign currency transactions |
(13,116) |
|
|
Total net realized gain (loss) |
|
32,698,179 |
|
Change in net unrealized appreciation (depreciation) on investment securities |
|
14,080,239 |
|
Net gain (loss) |
|
46,778,418 |
|
Net increase (decrease) in net assets resulting from operations |
|
$ 48,167,999 |
See accompanying notes which are an integral part of the financial statements.
Annual Report
Financial Statements - continued
Statement of Changes in Net Assets
|
|
Year ended |
Year ended |
|
Increase (Decrease) in Net Assets |
|
|
|
Operations |
|
|
|
Net investment income (loss) |
$ 1,389,581 |
$ 1,570,752 |
|
Net realized gain (loss) |
32,698,179 |
(1,910,941) |
|
Change in net unrealized appreciation (depreciation) |
14,080,239 |
19,673,233 |
|
Net increase (decrease) in net assets resulting from operations |
48,167,999 |
19,333,044 |
|
Distributions to shareholders from net investment income |
(1,423,771) |
(1,192,808) |
|
Distributions to shareholders from net realized gain |
(28,825,549) |
(7,465,053) |
|
Total distributions |
(30,249,320) |
(8,657,861) |
|
Share transactions |
157,798,400 |
134,058,752 |
|
Reinvestment of distributions |
29,828,221 |
8,554,881 |
|
Cost of shares redeemed |
(86,154,173) |
(77,852,268) |
|
Net increase (decrease) in net assets resulting from share transactions |
101,472,448 |
64,761,365 |
|
Redemption fees |
9,795 |
4,336 |
|
Total increase (decrease) in net assets |
119,400,922 |
75,440,884 |
|
|
|
|
|
Net Assets |
|
|
|
Beginning of period |
278,524,039 |
203,083,155 |
|
End of period (including undistributed net investment income of $71,669 and undistributed net investment income of $208,928, respectively) |
$ 397,924,961 |
$ 278,524,039 |
|
Other Information Shares |
|
|
|
Sold |
5,875,814 |
5,545,938 |
|
Issued in reinvestment of distributions |
1,171,513 |
353,027 |
|
Redeemed |
(3,249,221) |
(3,302,815) |
|
Net increase (decrease) |
3,798,106 |
2,596,150 |
Financial Highlights
|
Years ended February 28, |
2013 |
2012 F |
2011 |
2010 |
2009 |
|
Selected Per-Share Data |
|
|
|
|
|
|
Net asset value, beginning of period |
$ 25.97 |
$ 24.98 |
$ 19.37 |
$ 11.67 |
$ 19.70 |
|
Income from Investment Operations |
|
|
|
|
|
|
Net investment income (loss) B |
.11 |
.17 |
.05 |
.06 |
.10 |
|
Net realized and unrealized gain (loss) |
3.70 |
1.91 |
5.71 |
7.70 |
(8.05) |
|
Total from investment operations |
3.81 |
2.08 |
5.76 |
7.76 |
(7.95) |
|
Distributions from net investment income |
(.11) |
(.12) |
(.05) |
(.06) |
(.08) |
|
Distributions from net realized gain |
(2.27) |
(.97) |
(.10) |
- |
(.01) |
|
Total distributions |
(2.38) |
(1.09) |
(.15) |
(.06) |
(.09) |
|
Redemption fees added to paid in capital B |
- G |
- G |
- G |
- G |
.01 |
|
Net asset value, end of period |
$ 27.40 |
$ 25.97 |
$ 24.98 |
$ 19.37 |
$ 11.67 |
|
Total Return A |
15.38% |
8.67% |
29.75% |
66.54% |
(40.37)% |
|
Ratios to Average Net Assets C, E |
|
|
|
|
|
|
Expenses before reductions |
.86% |
.89% |
.96% |
1.10% |
1.19% |
|
Expenses net of fee waivers, if any |
.86% |
.89% |
.96% |
1.10% |
1.15% |
|
Expenses net of all reductions |
.84% |
.88% |
.95% |
1.08% |
1.15% |
|
Net investment income (loss) |
.43% |
.72% |
.23% |
.37% |
.62% |
|
Supplemental Data |
|
|
|
|
|
|
Net assets, end of period (000 omitted) |
$ 397,925 |
$ 278,524 |
$ 203,083 |
$ 77,011 |
$ 21,325 |
|
Portfolio turnover rate D |
170% |
174% |
196% |
134% |
71% |
|
A Total returns would have been lower if certain expenses had not been reduced during the applicable periods shown. B Calculated based on average shares outstanding during the period. C Fees and expenses of any underlying Fidelity Central Funds are not included in the Fund's expense ratio. The Fund indirectly bears its proportionate share of the expenses of any underlying Fidelity Central Funds. D Amount does not include the portfolio activity of any underlying Fidelity Central Funds. E Expense ratios reflect operating expenses of the Fund. Expenses before reductions do not reflect amounts reimbursed by the investment adviser or reductions from brokerage service arrangements or reductions from other expense offset arrangements and do not represent the amount paid by the Fund during periods when reimbursements or reductions occur. Expenses net of fee waivers reflect expenses after reimbursement by the investment adviser but prior to reductions from brokerage service arrangements or other expense offset arrangements. Expenses net of all reductions represent the net expenses paid by the Fund. F For the year ended February 29. G Amount represents less than $.01 per share. |
See accompanying notes which are an integral part of the financial statements.
Annual Report
Leisure Portfolio
Performance: The Bottom Line
Average annual total return reflects the change in the value of an investment, assuming reinvestment of the fund's distributions from dividend income and capital gains (the profits earned upon the sale of securities that have grown in value, if any) and assuming a constant rate of performance each year. The $10,000 table and the fund's returns do not reflect the deduction of taxes that a shareholder would pay on fund distributions or the redemption of fund shares. During periods of reimbursement by Fidelity, a fund's total return will be greater than it would be had the reimbursement not occurred. How a fund did yesterday is no guarantee of how it will do tomorrow.
Average Annual Total Returns
|
Periods ended February 28, 2013 |
Past 1 |
Past 5 |
Past 10 |
|
Leisure Portfolio |
7.52% |
11.27% |
12.70% |
$10,000 Over 10 Years
Let's say hypothetically that $10,000 was invested in Leisure Portfolio on February 28, 2003. The chart shows how the value of your investment would have changed, and also shows how the S&P 500 Index performed over the same period.
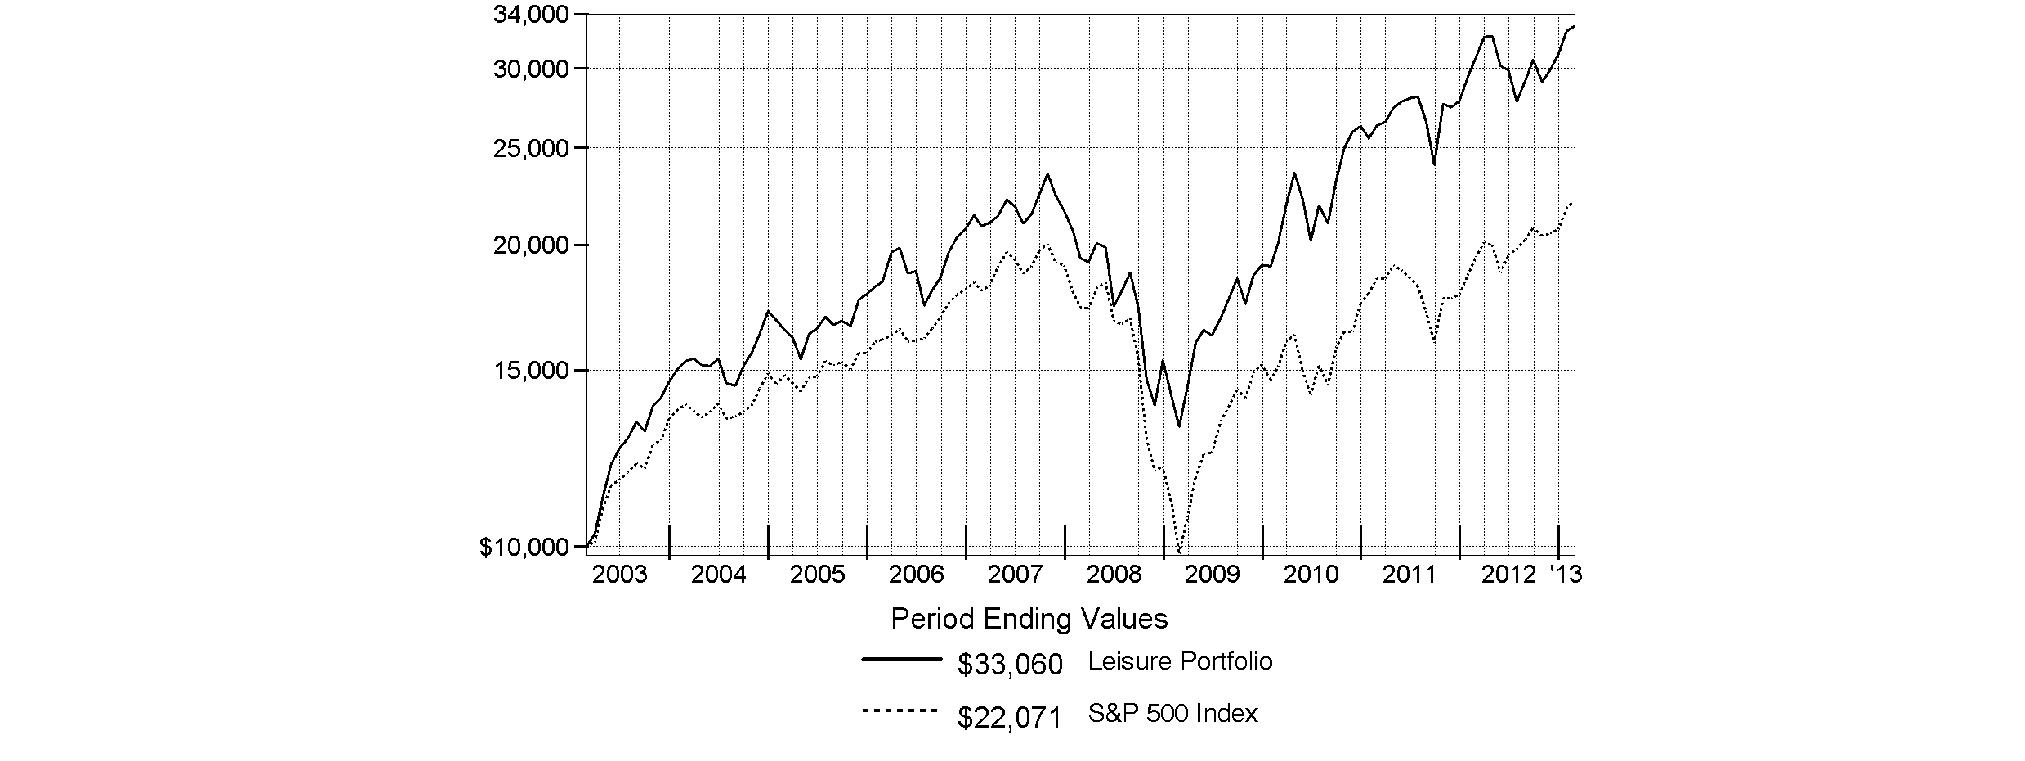
Annual Report
Leisure Portfolio
Management's Discussion of Fund Performance
Market Recap: U.S. stocks posted solid gains for the year ending February 28, 2013, sparked by a late-period rally that pushed major equity benchmarks to multiyear highs. Improvement in the global economy and more monetary stimulus from the U.S. Federal Reserve kept markets on the upswing for much of the year, shrugging off an early decline brought on by debt woes in Europe, and another dip later in the period amid Congressional gridlock on the federal budget. Renewed optimism over employment, the housing market, corporate earnings and record dividends made stocks a favorite with investors during the 12 months, which helped push the broad-based S&P 500® Index across the milestone 1,500 mark at the end of January. The S&P 500® finished the period up 13.46%. Seven of the 10 major market sectors tracked by MSCI U.S. IMI 25-50 classifications produced double-digit gains, led by health care and financials, while information technology, energy and materials trailed the broad equity market with only modest advances.
Comments from Jean Park, Portfolio Manager of Leisure Portfolio: For the year, the fund gained 7.52%, solidly outpacing the 6.27% return of its industry benchmark, the MSCI® U.S. IMI Consumer Services 25-50 Index, but underperforming the broad-based S&P 500®. Despite numerous macroeconomic challenges, leisure stocks rallied in the second half of the period, overcoming a negative showing in the first half, as investor sentiment improved and macroeconomic concerns somewhat abated. Turning to the fund's performance versus the MSCI index, underweighting the weak-performing education services group - along with good stock selection here - provided the biggest boost. These companies have been hindered by both waning demand and changes in government funding. In particular, not owning index component Apollo Group and largely avoiding ITT Educational Services were positives. Also contributing were out-of-index positions in G-III Apparel Group and PVH in the apparel accessories/luxury goods category, and Dollar General in general merchandise stores. I sold ITT, G-III and Dollar General by period end. Wyndham Worldwide was the fund's top individual contributor on a relative basis. This stock benefited in part from the hotel's improving returns in its time-share business. Among restaurants, our position in Starbucks was a winner, due in part to declining coffee prices. Another strong pick was Ruth's Hospitality Group, which operates the franchise Ruth's Chris Steak House, among others. On the downside, stock selection in specialized consumer services hampered the fund's result. Here, H&R Block and Weight Watchers were the primary detractors. Not owning a stake in brick and mortar tax preparer H&R Block - an index component - detracted, as the company held up better than I anticipated given the increasing demand for online tax services. In the case of Weight Watchers, the fund's overweighting was detrimental, since the weight-management services company suffered from several challenges, including the rollout of its new diet launches. Elsewhere, untimely ownership of cruise line Carnival was a miss. I sold the stock in the first half of the year thinking pressure from the weakened European consumer coupled with more stringent fuel standards and rising fuel costs would negatively impact the company, but it held up well. In casinos/gaming, Las Vegas Sands detracted, as the company grappled with a weak outlook in Asia and the stock lost ground.
The views expressed above reflect those of the portfolio manager(s) only through the end of the period as stated on the cover of this report and do not necessarily represent the views of Fidelity or any other person in the Fidelity organization. Any such views are subject to change at any time based upon market or other conditions and Fidelity disclaims any responsibility to update such views. These views may not be relied on as investment advice and, because investment decisions for a Fidelity fund are based on numerous factors, may not be relied on as an indication of trading intent on behalf of any Fidelity fund.
Annual Report
Leisure Portfolio
Investment Changes (Unaudited)
|
Top Ten Stocks as of February 28, 2013 |
||
|
|
% of fund's |
% of fund's net assets |
|
Starbucks Corp. |
14.9 |
16.7 |
|
McDonald's Corp. |
13.4 |
15.5 |
|
Wyndham Worldwide Corp. |
7.9 |
5.7 |
|
Las Vegas Sands Corp. |
7.6 |
11.6 |
|
Penn National Gaming, Inc. |
5.9 |
2.1 |
|
Hyatt Hotels Corp. Class A |
4.6 |
2.8 |
|
Yum! Brands, Inc. |
4.5 |
5.0 |
|
Brinker International, Inc. |
3.9 |
2.1 |
|
Starwood Hotels & Resorts Worldwide, Inc. |
3.6 |
1.5 |
|
Panera Bread Co. Class A |
3.6 |
4.4 |
|
|
69.9 |
|
|
Top Industries (% of fund's net assets) |
|||
|
As of February 28, 2013 |
|||
|
Hotels, Restaurants & Leisure |
86.0% |
|
|
Diversified Consumer Services |
4.7% |
|
|
Software |
2.8% |
|
|
Media |
1.3% |
|
|
Textiles, Apparel & Luxury Goods |
1.0% |
|
|
All Others* |
4.2% |
|

|
As of August 31, 2012 |
|||
|
Hotels, Restaurants & Leisure |
83.7% |
|
|
Diversified Consumer Services |
8.3% |
|
|
Food & Staples Retailing |
1.4% |
|
|
Textiles, Apparel & Luxury Goods |
1.4% |
|
|
Household Durables |
1.0% |
|
|
All Others* |
4.2% |
|

|
* Includes short-term investments and net other assets. |
Annual Report
Leisure Portfolio
Investments February 28, 2013
Showing Percentage of Net Assets
|
Common Stocks - 98.2% |
|||
|
Shares |
Value |
||
|
DIVERSIFIED CONSUMER SERVICES - 4.7% |
|||
|
Education Services - 0.2% |
|||
|
K12, Inc. (a)(d) |
30,312 |
$ 632,005 |
|
|
Specialized Consumer Services - 4.5% |
|||
|
Coinstar, Inc. (a)(d) |
48,700 |
2,492,953 |
|
|
Steiner Leisure Ltd. (a) |
243,193 |
11,466,550 |
|
|
Weight Watchers International, Inc. (d) |
40,000 |
1,713,600 |
|
|
|
15,673,103 |
||
|
TOTAL DIVERSIFIED CONSUMER SERVICES |
16,305,108 |
||
|
FOOD & STAPLES RETAILING - 0.2% |
|||
|
Hypermarkets & Super Centers - 0.2% |
|||
|
Wal-Mart Stores, Inc. |
9,500 |
672,410 |
|
|
HOTELS, RESTAURANTS & LEISURE - 85.9% |
|||
|
Casinos & Gaming - 16.7% |
|||
|
Las Vegas Sands Corp. |
513,276 |
26,428,581 |
|
|
Melco PBL Entertainment (Macau) Ltd. sponsored ADR (a)(d) |
40,870 |
785,113 |
|
|
MGM China Holdings Ltd. |
900,000 |
2,174,687 |
|
|
Penn National Gaming, Inc. (a) |
408,112 |
20,344,383 |
|
|
SHFL Entertainment, Inc. (a) |
356,261 |
5,650,299 |
|
|
Wynn Resorts Ltd. |
23,000 |
2,688,700 |
|
|
|
58,071,763 |
||
|
Hotels, Resorts & Cruise Lines - 16.1% |
|||
|
Hyatt Hotels Corp. Class A (a) |
387,907 |
15,939,099 |
|
|
Starwood Hotels & Resorts Worldwide, Inc. |
209,100 |
12,615,003 |
|
|
Wyndham Worldwide Corp. |
457,200 |
27,541,728 |
|
|
|
56,095,830 |
||
|
Leisure Facilities - 1.3% |
|||
|
Cedar Fair LP (depositary unit) |
114,290 |
4,324,734 |
|
|
Restaurants - 51.8% |
|||
|
BJ's Restaurants, Inc. (a) |
91,500 |
2,817,285 |
|
|
Bravo Brio Restaurant Group, Inc. (a) |
131,269 |
1,979,537 |
|
|
Brinker International, Inc. |
412,900 |
13,782,602 |
|
|
CEC Entertainment, Inc. |
52,815 |
1,597,654 |
|
|
Chipotle Mexican Grill, Inc. (a) |
37,229 |
11,793,775 |
|
|
Denny's Corp. (a) |
534,503 |
3,025,287 |
|
|
Jack in the Box, Inc. (a) |
83,900 |
2,656,274 |
|
|
McDonald's Corp. |
486,700 |
46,674,530 |
|
|
Panera Bread Co. Class A (a) |
77,000 |
12,393,150 |
|
|
Papa John's International, Inc. (a) |
108,600 |
5,648,286 |
|
|
Ruth's Hospitality Group, Inc. (a) |
486,729 |
4,409,765 |
|
|
Starbucks Corp. |
945,400 |
51,826,825 |
|
|
Texas Roadhouse, Inc. Class A |
300,308 |
5,807,957 |
|
|
Yum! Brands, Inc. |
240,700 |
15,761,036 |
|
|
|
180,173,963 |
||
|
TOTAL HOTELS, RESTAURANTS & LEISURE |
298,666,290 |
||
|
|
|||
|
Shares |
Value |
||
|
HOUSEHOLD DURABLES - 0.9% |
|||
|
Housewares & Specialties - 0.9% |
|||
|
Tupperware Brands Corp. |
39,900 |
$ 3,121,377 |
|
|
LEISURE EQUIPMENT & PRODUCTS - 0.5% |
|||
|
Leisure Products - 0.5% |
|||
|
Hasbro, Inc. (d) |
42,677 |
1,707,934 |
|
|
MEDIA - 1.3% |
|||
|
Movies & Entertainment - 1.3% |
|||
|
Viacom, Inc. Class B (non-vtg.) |
78,500 |
4,589,110 |
|
|
SOFTWARE - 2.8% |
|||
|
Application Software - 1.6% |
|||
|
Intuit, Inc. |
89,500 |
5,770,960 |
|
|
Home Entertainment Software - 1.2% |
|||
|
Playtech Ltd. |
480,000 |
4,161,572 |
|
|
TOTAL SOFTWARE |
9,932,532 |
||
|
SPECIALTY RETAIL - 0.9% |
|||
|
Apparel Retail - 0.9% |
|||
|
Express, Inc. (a) |
165,000 |
3,052,500 |
|
|
TEXTILES, APPAREL & LUXURY GOODS - 1.0% |
|||
|
Apparel, Accessories & Luxury Goods - 1.0% |
|||
|
PVH Corp. |
29,140 |
3,550,709 |
|
|
TOTAL COMMON STOCKS (Cost $208,138,905) |
|
||
|
Convertible Bonds - 0.1% |
||||
|
|
Principal |
|
||
|
HOTELS, RESTAURANTS & LEISURE - 0.1% |
||||
|
Casinos & Gaming - 0.1% |
||||
|
MGM Mirage, Inc. 4.25% 4/15/15 |
|
$ 300,000 |
|
|
|
Money Market Funds - 3.2% |
|||
|
Shares |
Value |
||
|
Fidelity Cash Central Fund, 0.16% (b) |
5,251,085 |
$ 5,251,085 |
|
|
Fidelity Securities Lending Cash Central Fund, 0.16% (b)(c) |
5,865,638 |
5,865,638 |
|
|
TOTAL MONEY MARKET FUNDS (Cost $11,116,723) |
|
||
|
TOTAL INVESTMENT PORTFOLIO - 101.5% (Cost $219,555,628) |
353,038,131 |
||
|
NET OTHER ASSETS (LIABILITIES) - (1.5)% |
(5,336,803) |
||
|
NET ASSETS - 100% |
$ 347,701,328 |
||
|
Legend |
|
(a) Non-income producing |
|
(b) Affiliated fund that is generally available only to investment companies and other accounts managed by Fidelity Investments. The rate quoted is the annualized seven-day yield of the fund at period end. A complete unaudited listing of the fund's holdings as of its most recent quarter end is available upon request. In addition, each Fidelity Central Fund's financial statements, which are not covered by the Fund's Report of Independent Registered Public Accounting Firm, are available on the SEC's website or upon request. |
|
(c) Investment made with cash collateral received from securities on loan. |
|
(d) Security or a portion of the security is on loan at period end. |
|
Affiliated Central Funds |
|
Information regarding fiscal year to date income earned by the Fund from investments in Fidelity Central Funds is as follows: |
|
Fund |
Income earned |
|
Fidelity Cash Central Fund |
$ 8,305 |
|
Fidelity Securities Lending Cash Central Fund |
319,439 |
|
Total |
$ 327,744 |
|
Other Information |
|
The following is a summary of the inputs used, as of February 28, 2013, involving the Fund's assets and liabilities carried at fair value. The inputs or methodology used for valuing securities may not be an indication of the risk associated with investing in those securities. For more information on valuation inputs, and their aggregation into the levels used in the table below, please refer to the Investment Valuation section in the accompanying Notes to Financial Statements. |
|
Valuation Inputs at Reporting Date: |
||||
|
Description |
Total |
Level 1 |
Level 2 |
Level 3 |
|
Investments in Securities: |
||||
|
Common Stocks |
$ 341,597,970 |
$ 341,597,970 |
$ - |
$ - |
|
Convertible Bonds |
323,438 |
- |
323,438 |
- |
|
Money Market Funds |
11,116,723 |
11,116,723 |
- |
- |
|
Total Investments in Securities: |
$ 353,038,131 |
$ 352,714,693 |
$ 323,438 |
$ - |
See accompanying notes which are an integral part of the financial statements.
Annual Report
Leisure Portfolio
Financial Statements
Statement of Assets and Liabilities
|
|
February 28, 2013 |
|
|
|
|
|
|
Assets |
|
|
|
Investment in securities, at value (including securities loaned of $5,662,152) - See accompanying schedule: Unaffiliated issuers (cost $208,438,905) |
$ 341,921,408 |
|
|
Fidelity Central Funds (cost $11,116,723) |
11,116,723 |
|
|
Total Investments (cost $219,555,628) |
|
$ 353,038,131 |
|
Receivable for investments sold |
|
1,450,153 |
|
Receivable for fund shares sold |
|
283,408 |
|
Dividends receivable |
|
374,759 |
|
Interest receivable |
|
4,817 |
|
Distributions receivable from Fidelity Central Funds |
|
26,683 |
|
Prepaid expenses |
|
742 |
|
Receivable from investment adviser for expense reductions |
|
977 |
|
Other receivables |
|
14,146 |
|
Total assets |
|
355,193,816 |
|
|
|
|
|
Liabilities |
|
|
|
Payable for investments purchased |
$ 1,008,793 |
|
|
Payable for fund shares redeemed |
352,549 |
|
|
Accrued management fee |
160,400 |
|
|
Other affiliated payables |
72,652 |
|
|
Other payables and accrued expenses |
32,456 |
|
|
Collateral on securities loaned, at value |
5,865,638 |
|
|
Total liabilities |
|
7,492,488 |
|
|
|
|
|
Net Assets |
|
$ 347,701,328 |
|
Net Assets consist of: |
|
|
|
Paid in capital |
|
$ 206,373,985 |
|
Undistributed net investment income |
|
1,020,608 |
|
Accumulated undistributed net realized gain (loss) on investments and foreign currency transactions |
|
6,824,232 |
|
Net unrealized appreciation (depreciation) on investments |
|
133,482,503 |
|
Net Assets, for 3,210,562 shares outstanding |
|
$ 347,701,328 |
|
Net Asset Value, offering price and redemption price per share ($347,701,328 ÷ 3,210,562 shares) |
|
$ 108.30 |
Statement of Operations
|
|
Year ended February 28, 2013 |
|
|
|
|
|
|
Investment Income |
|
|
|
Dividends |
|
$ 6,090,533 |
|
Special dividends |
|
1,975,259 |
|
Interest |
|
12,785 |
|
Income from Fidelity Central Funds (including $319,439 from security lending) |
|
327,744 |
|
Total income |
|
8,406,321 |
|
|
|
|
|
Expenses |
|
|
|
Management fee |
$ 2,160,756 |
|
|
Transfer agent fees |
863,140 |
|
|
Accounting and security lending fees |
154,109 |
|
|
Custodian fees and expenses |
22,247 |
|
|
Independent trustees' compensation |
2,653 |
|
|
Registration fees |
39,638 |
|
|
Audit |
39,890 |
|
|
Legal |
1,586 |
|
|
Interest |
648 |
|
|
Miscellaneous |
3,513 |
|
|
Total expenses before reductions |
3,288,180 |
|
|
Expense reductions |
(53,638) |
3,234,542 |
|
Net investment income (loss) |
|
5,171,779 |
|
Realized and Unrealized Gain (Loss) Net realized gain (loss) on: |
|
|
|
Investment securities: |
|
|
|
Unaffiliated issuers |
29,159,541 |
|
|
Foreign currency transactions |
(415) |
|
|
Total net realized gain (loss) |
|
29,159,126 |
|
Change in net unrealized appreciation (depreciation) on: Investment securities |
(18,514,264) |
|
|
Assets and liabilities in foreign currencies |
(88) |
|
|
Total change in net unrealized appreciation (depreciation) |
|
(18,514,352) |
|
Net gain (loss) |
|
10,644,774 |
|
Net increase (decrease) in net assets resulting from operations |
|
$ 15,816,553 |
See accompanying notes which are an integral part of the financial statements.
Annual Report
Statement of Changes in Net Assets
|
|
Year ended |
Year ended |
|
Increase (Decrease) in Net Assets |
|
|
|
Operations |
|
|
|
Net investment income (loss) |
$ 5,171,779 |
$ 2,610,015 |
|
Net realized gain (loss) |
29,159,126 |
3,812,173 |
|
Change in net unrealized appreciation (depreciation) |
(18,514,352) |
51,611,340 |
|
Net increase (decrease) in net assets resulting from operations |
15,816,553 |
58,033,528 |
|
Distributions to shareholders from net investment income |
(4,448,135) |
(358,648) |
|
Distributions to shareholders from net realized gain |
(14,222,894) |
(19,922) |
|
Total distributions |
(18,671,029) |
(378,570) |
|
Share transactions |
156,429,390 |
191,824,059 |
|
Reinvestment of distributions |
17,865,449 |
362,956 |
|
Cost of shares redeemed |
(264,267,746) |
(220,590,207) |
|
Net increase (decrease) in net assets resulting from share transactions |
(89,972,907) |
(28,403,192) |
|
Redemption fees |
21,280 |
17,007 |
|
Total increase (decrease) in net assets |
(92,806,103) |
29,268,773 |
|
|
|
|
|
Net Assets |
|
|
|
Beginning of period |
440,507,431 |
411,238,658 |
|
End of period (including undistributed net investment income of $1,020,608 and undistributed net investment income of $598,610, respectively) |
$ 347,701,328 |
$ 440,507,431 |
|
Other Information Shares |
|
|
|
Sold |
1,447,422 |
2,002,224 |
|
Issued in reinvestment of distributions |
175,454 |
3,903 |
|
Redeemed |
(2,547,299) |
(2,377,349) |
|
Net increase (decrease) |
(924,423) |
(371,222) |
Financial Highlights
|
Years ended February 28, |
2013 |
2012 G |
2011 |
2010 |
2009 |
|
Selected Per-Share Data |
|
|
|
|
|
|
Net asset value, beginning of period |
$ 106.53 |
$ 91.26 |
$ 69.99 |
$ 46.24 |
$ 69.03 |
|
Income from Investment Operations |
|
|
|
|
|
|
Net investment income (loss) B |
1.40 E |
.64 |
.55 |
.43 |
.60 |
|
Net realized and unrealized gain (loss) |
6.22 |
14.73 |
21.22 |
23.73 |
(22.57) |
|
Total from investment operations |
7.62 |
15.37 |
21.77 |
24.16 |
(21.97) |
|
Distributions from net investment income |
(1.36) |
(.09) |
(.52) |
(.41) |
(.54) |
|
Distributions from net realized gain |
(4.50) |
(.01) |
- |
- |
(.28) |
|
Total distributions |
(5.86) |
(.10) |
(.52) |
(.41) |
(.82) |
|
Redemption fees added to paid in capital B |
.01 |
- H |
.02 |
- H |
- H |
|
Net asset value, end of period |
$ 108.30 |
$ 106.53 |
$ 91.26 |
$ 69.99 |
$ 46.24 |
|
Total Return A |
7.52% |
16.85% |
31.16% |
52.35% |
(32.07)% |
|
Ratios to Average Net Assets C, F |
|
|
|
|
|
|
Expenses before reductions |
.85% |
.86% |
.90% |
.94% |
.93% |
|
Expenses net of fee waivers, if any |
.85% |
.86% |
.90% |
.94% |
.93% |
|
Expenses net of all reductions |
.83% |
.86% |
.89% |
.93% |
.93% |
|
Net investment income (loss) |
1.33% E |
.68% |
.66% |
.70% |
1.00% |
|
Supplemental Data |
|
|
|
|
|
|
Net assets, end of period (000 omitted) |
$ 347,701 |
$ 440,507 |
$ 411,239 |
$ 224,465 |
$ 159,115 |
|
Portfolio turnover rate D |
90% |
77% |
112% |
99% |
120% |
|
A Total returns would have been lower if certain expenses had not been reduced during the applicable periods shown. B Calculated based on average shares outstanding during the period. C Fees and expenses of any underlying Fidelity Central Funds are not included in the Fund's expense ratio. The Fund indirectly bears its proportionate share of the expenses of any underlying Fidelity Central Funds. D Amount does not include the portfolio activity of any underlying Fidelity Central Funds. E Investment income per share reflects a large, non-recurring dividend which amounted to $.53 per share. Excluding this non-recurring dividend, the ratio of net investment income (loss) to average net assets would have been .82%. F Expense ratios reflect operating expenses of the Fund. Expenses before reductions do not reflect amounts reimbursed by the investment adviser or reductions from brokerage service arrangements or reductions from other expense offset arrangements and do not represent the amount paid by the Fund during periods when reimbursements or reductions occur. Expenses net of fee waivers reflect expenses after reimbursement by the investment adviser but prior to reductions from brokerage service arrangements or other expense offset arrangements. Expenses net of all reductions represent the net expenses paid by the Fund. G For the year ended February 29. H Amount represents less than $.01 per share. |
See accompanying notes which are an integral part of the financial statements.
Annual Report
Multimedia Portfolio
Performance: The Bottom Line
Average annual total return reflects the change in the value of an investment, assuming reinvestment of the fund's distributions from dividend income and capital gains (the profits earned upon the sale of securities that have grown in value, if any) and assuming a constant rate of performance each year. The $10,000 table and the fund's returns do not reflect the deduction of taxes that a shareholder would pay on fund distributions or the redemption of fund shares. During periods of reimbursement by Fidelity, a fund's total return will be greater than it would be had the reimbursement not occurred. How a fund did yesterday is no guarantee of how it will do tomorrow.
Average Annual Total Returns
|
Periods ended February 28, 2013 |
Past 1 |
Past 5 |
Past 10 |
|
Multimedia Portfolio |
27.91% |
13.01% |
11.65% |
$10,000 Over 10 Years
Let's say hypothetically that $10,000 was invested in Multimedia Portfolio on February 28, 2003. The chart shows how the value of your investment would have changed, and also shows how the S&P 500 Index performed over the same period.

Annual Report
Multimedia Portfolio
Management's Discussion of Fund Performance
Market Recap: U.S. stocks posted solid gains for the year ending February 28, 2013, sparked by a late-period rally that pushed major equity benchmarks to multiyear highs. Improvement in the global economy and more monetary stimulus from the U.S. Federal Reserve kept markets on the upswing for much of the year, shrugging off an early decline brought on by debt woes in Europe, and another dip later in the period amid Congressional gridlock on the federal budget. Renewed optimism over employment, the housing market, corporate earnings and record dividends made stocks a favorite with investors during the 12 months, which helped push the broad-based S&P 500® Index across the milestone 1,500 mark at the end of January. The S&P 500® finished the period up 13.46%. Seven of the 10 major market sectors tracked by MSCI U.S. IMI 25-50 classifications produced double-digit gains, led by health care and financials, while information technology, energy and materials trailed the broad equity market with only modest advances.
Comments from Nidhi Gupta, who became Portfolio Manager of Multimedia Portfolio on January 19, 2013: For the year, the fund advanced 27.91%, trailing the 31.66% result of the MSCI® U.S. IMI Media 25-50 Index but easily topping the broad-based S&P 500®. It was a strong year for media stocks even amid decelerating growth in the U.S. advertising market, which resulted in lackluster company fundamentals. Against this backdrop, the best-performing areas within the industry were those with the highest and/or fastest-growing dividend yields, such as cable/satellite and movies/entertainment. Companies in these sub-industries tend to have the most dominant market share and predictable cash flow. With the ad cycle moving into the deceleration phase, the fund was hurt primarily by its positioning in newer forms of media with the fastest growth - namely companies with the greatest exposure to the secular transition toward digital advertising and entertainment - on the assumption that these firms could grow regardless of the cycle and, therefore, investors would still favor them. This led the previous manager to maintain modest out-of-benchmark exposure to Internet software/services, home entertainment software and Internet retail, which hampered results. Specifically, non-index positions in Bankrate, an Internet-based personal finance service, online social-game developer Zynga and Groupon, the operator of a local commerce marketplace that offers goods and services at discounted rates, were among the largest individual detractors from relative performance. Each of these new-media stocks underperformed the market this past year on disappointing financial results. Conversely, large underweightings in publishing and advertising boosted relative results the most. Within publishing, largely avoiding Washington Post and Scholastic, which specialize in newspapers and educational books, respectively, helped, as did not owning integrated media and merchandising company Martha Stewart Living Omnimedia, an index component. Each of these stocks struggled with declining print advertising. Additionally, revenue for the Washington Post's education business shrank amid renewed government scrutiny of this industry, while Martha Stewart Living's branding department was tied up in a legal battle over distribution rights with department store Macy's.
The views expressed above reflect those of the portfolio manager(s) only through the end of the period as stated on the cover of this report and do not necessarily represent the views of Fidelity or any other person in the Fidelity organization. Any such views are subject to change at any time based upon market or other conditions and Fidelity disclaims any responsibility to update such views. These views may not be relied on as investment advice and, because investment decisions for a Fidelity fund are based on numerous factors, may not be relied on as an indication of trading intent on behalf of any Fidelity fund.
Annual Report
Multimedia Portfolio
Investment Changes (Unaudited)
|
Top Ten Stocks as of February 28, 2013 |
||
|
|
% of fund's |
% of fund's net assets |
|
The Walt Disney Co. |
14.0 |
14.7 |
|
Comcast Corp. Class A |
12.7 |
11.0 |
|
Time Warner, Inc. |
7.2 |
7.1 |
|
News Corp. Class A |
6.2 |
6.3 |
|
CBS Corp. Class B |
4.5 |
4.8 |
|
Viacom, Inc. Class B (non-vtg.) |
4.2 |
4.8 |
|
DIRECTV |
3.8 |
4.9 |
|
Time Warner Cable, Inc. |
3.6 |
4.5 |
|
Omnicom Group, Inc. |
2.8 |
2.0 |
|
Comcast Corp. Class A (special) (non-vtg.) |
2.5 |
2.0 |
|
|
61.5 |
|
|
Top Industries (% of fund's net assets) |
|||
|
As of February 28, 2013 |
|||
|
Media |
93.0% |
|
 |
Diversified Financial Services |
2.1% |
|
|
All Others* |
4.9% |
|

|
As of August 31, 2012 |
|||
|
Media |
92.3% |
|
|
Internet Software & Services |
2.3% |
|
|
Software |
0.3% |
|
|
Internet & Catalog Retail |
0.2% |
|
|
All Others* |
4.9% |
|

|
* Includes short-term investments and net other assets. |
Annual Report
Multimedia Portfolio
Investments February 28, 2013
Showing Percentage of Net Assets
|
Common Stocks - 95.1% |
|||
|
Shares |
Value |
||
|
DIVERSIFIED FINANCIAL SERVICES - 2.1% |
|||
|
Specialized Finance - 2.1% |
|||
|
McGraw-Hill Companies, Inc. |
298,200 |
$ 13,881,210 |
|
|
MEDIA - 93.0% |
|||
|
Advertising - 6.1% |
|||
|
Arbitron, Inc. |
61,800 |
2,894,712 |
|
|
Digital Generation, Inc. (a)(d) |
153,600 |
1,190,400 |
|
|
Harte-Hanks, Inc. |
187,300 |
1,361,671 |
|
|
Interpublic Group of Companies, Inc. |
595,400 |
7,609,212 |
|
|
Lamar Advertising Co. Class A (a) |
107,300 |
4,961,552 |
|
|
National CineMedia, Inc. |
145,000 |
2,211,250 |
|
|
Omnicom Group, Inc. |
320,600 |
18,444,118 |
|
|
ReachLocal, Inc. (a) |
116,000 |
1,453,480 |
|
|
|
40,126,395 |
||
|
Broadcasting - 12.7% |
|||
|
Belo Corp. Series A |
274,200 |
2,369,088 |
|
|
CBS Corp. Class B |
684,700 |
29,709,133 |
|
|
Discovery Communications, Inc. (a) |
176,350 |
12,931,746 |
|
|
Discovery Communications, Inc. Class C (non-vtg.) (a) |
136,750 |
8,820,375 |
|
|
Fisher Communications, Inc. |
2,800 |
102,956 |
|
|
Liberty Media Corp. Class A (a) |
126,793 |
13,693,644 |
|
|
LIN TV Corp. Class A (a) |
350,600 |
3,986,322 |
|
|
Pandora Media, Inc. (a)(d) |
152,700 |
1,862,940 |
|
|
Scripps Networks Interactive, Inc. Class A |
118,300 |
7,458,815 |
|
|
Sinclair Broadcast Group, Inc. Class A |
164,300 |
2,313,344 |
|
|
|
83,248,363 |
||
|
Cable & Satellite - 34.5% |
|||
|
AMC Networks, Inc. Class A (a) |
90,000 |
5,166,000 |
|
|
Cablevision Systems Corp. - NY Group Class A |
302,400 |
4,230,576 |
|
|
Charter Communications, Inc. Class A (a) |
60,400 |
5,217,956 |
|
|
Comcast Corp.: |
|
|
|
|
Class A |
2,099,850 |
83,553,032 |
|
|
Class A (special) (non-vtg.) |
430,200 |
16,480,962 |
|
|
DIRECTV (a) |
524,813 |
25,280,242 |
|
|
DISH Network Corp. Class A |
271,900 |
9,462,120 |
|
|
Liberty Global, Inc.: |
|
|
|
|
Class A (a)(d) |
174,675 |
12,033,361 |
|
|
Class C (a)(d) |
150,200 |
9,591,772 |
|
|
Sirius XM Radio, Inc. (d) |
4,667,460 |
14,469,126 |
|
|
Starz - Liberty Capital Series A (a) |
125,093 |
2,321,726 |
|
|
Time Warner Cable, Inc. |
276,569 |
23,892,796 |
|
|
Virgin Media, Inc. |
332,700 |
15,437,280 |
|
|
|
227,136,949 |
||
|
Movies & Entertainment - 35.7% |
|||
|
Cinemark Holdings, Inc. |
167,700 |
4,662,060 |
|
|
DreamWorks Animation SKG, Inc. Class A (a)(d) |
134,800 |
2,237,680 |
|
|
Lions Gate Entertainment Corp. (a)(d) |
168,300 |
3,529,251 |
|
|
Live Nation Entertainment, Inc. (a) |
281,700 |
2,983,203 |
|
|
|
|||
|
Shares |
Value |
||
|
News Corp.: |
|
|
|
|
Class A |
1,413,982 |
$ 40,722,682 |
|
|
Class B |
188,300 |
5,509,658 |
|
|
Regal Entertainment Group Class A (d) |
185,200 |
2,902,084 |
|
|
The Madison Square Garden Co. Class A (a) |
94,800 |
5,301,216 |
|
|
The Walt Disney Co. |
1,690,504 |
92,284,612 |
|
|
Time Warner, Inc. |
884,366 |
47,021,740 |
|
|
Viacom, Inc. Class B (non-vtg.) |
474,000 |
27,710,040 |
|
|
|
234,864,226 |
||
|
Publishing - 4.0% |
|||
|
E.W. Scripps Co. Class A (a) |
159,900 |
1,728,519 |
|
|
Gannett Co., Inc. |
339,400 |
6,811,758 |
|
|
John Wiley & Sons, Inc. Class A |
76,700 |
2,805,686 |
|
|
Meredith Corp. (d) |
78,600 |
3,302,772 |
|
|
Morningstar, Inc. |
46,900 |
3,216,402 |
|
|
Scholastic Corp. |
70,800 |
2,131,080 |
|
|
The New York Times Co. Class A (a) |
286,300 |
2,768,521 |
|
|
Washington Post Co. Class B |
8,800 |
3,507,152 |
|
|
|
26,271,890 |
||
|
TOTAL MEDIA |
611,647,823 |
||
|
TOTAL COMMON STOCKS (Cost $491,226,734) |
|
||
|
Money Market Funds - 11.3% |
|||
|
|
|
|
|
|
Fidelity Cash Central Fund, 0.16% (b) |
31,684,270 |
31,684,270 |
|
|
Fidelity Securities Lending Cash Central Fund, 0.16% (b)(c) |
42,534,384 |
42,534,384 |
|
|
TOTAL MONEY MARKET FUNDS (Cost $74,218,654) |
|
||
|
TOTAL INVESTMENT PORTFOLIO - 106.4% (Cost $565,445,388) |
699,747,687 |
||
|
NET OTHER ASSETS (LIABILITIES) - (6.4)% |
(42,381,314) |
||
|
NET ASSETS - 100% |
$ 657,366,373 |
||
|
Legend |
|
(a) Non-income producing |
|
(b) Affiliated fund that is generally available only to investment companies and other accounts managed by Fidelity Investments. The rate quoted is the annualized seven-day yield of the fund at period end. A complete unaudited listing of the fund's holdings as of its most recent quarter end is available upon request. In addition, each Fidelity Central Fund's financial statements, which are not covered by the Fund's Report of Independent Registered Public Accounting Firm, are available on the SEC's website or upon request. |
|
(c) Investment made with cash collateral received from securities on loan. |
|
(d) Security or a portion of the security is on loan at period end. |
|
Affiliated Central Funds |
|
Information regarding fiscal year to date income earned by the Fund from investments in Fidelity Central Funds is as follows: |
|
Fund |
Income earned |
|
Fidelity Cash Central Fund |
$ 29,222 |
|
Fidelity Securities Lending Cash Central Fund |
145,513 |
|
Total |
$ 174,735 |
|
Other Information |
|
All investments are categorized as Level 1 under the Fair Value Hierarchy. The inputs or methodology used for valuing securities may not be an indication of the risk associated with investing in those securities. For more information on valuation inputs, please refer to the Investment Valuation section in the accompanying Notes to Financial Statements. |
See accompanying notes which are an integral part of the financial statements.
Annual Report
Multimedia Portfolio
Financial Statements
Statement of Assets and Liabilities
|
|
February 28, 2013 |
|
|
|
|
|
|
Assets |
|
|
|
Investment in securities, at value (including securities loaned of $41,712,156) - See accompanying schedule: Unaffiliated issuers (cost $491,226,734) |
$ 625,529,033 |
|
|
Fidelity Central Funds (cost $74,218,654) |
74,218,654 |
|
|
Total Investments (cost $565,445,388) |
|
$ 699,747,687 |
|
Receivable for fund shares sold |
|
1,412,038 |
|
Dividends receivable |
|
661,537 |
|
Distributions receivable from Fidelity Central Funds |
|
29,102 |
|
Prepaid expenses |
|
526 |
|
Receivable from investment adviser for expense reductions |
|
97 |
|
Other receivables |
|
12,854 |
|
Total assets |
|
701,863,841 |
|
|
|
|
|
Liabilities |
|
|
|
Payable for fund shares redeemed |
$ 1,493,778 |
|
|
Accrued management fee |
297,102 |
|
|
Other affiliated payables |
126,700 |
|
|
Other payables and accrued expenses |
45,504 |
|
|
Collateral on securities loaned, at value |
42,534,384 |
|
|
Total liabilities |
|
44,497,468 |
|
|
|
|
|
Net Assets |
|
$ 657,366,373 |
|
Net Assets consist of: |
|
|
|
Paid in capital |
|
$ 526,089,400 |
|
Distributions in excess of net investment income |
|
(139,171) |
|
Accumulated undistributed net realized gain (loss) on investments and foreign currency transactions |
|
(2,885,766) |
|
Net unrealized appreciation (depreciation) on investments and assets and liabilities in foreign currencies |
|
134,301,910 |
|
Net Assets, for 10,679,403 shares outstanding |
|
$ 657,366,373 |
|
Net Asset Value, offering price and redemption price per share ($657,366,373 ÷ 10,679,403 shares) |
|
$ 61.55 |
Statement of Operations
|
|
Year ended February 28, 2013 |
|
|
|
|
|
|
Investment Income |
|
|
|
Dividends |
|
$ 5,531,217 |
|
Special dividends |
|
734,250 |
|
Income from Fidelity Central Funds (including $145,513 from security lending) |
|
174,735 |
|
Total income |
|
6,440,202 |
|
|
|
|
|
Expenses |
|
|
|
Management fee |
$ 1,958,974 |
|
|
Transfer agent fees |
827,444 |
|
|
Accounting and security lending fees |
138,852 |
|
|
Custodian fees and expenses |
14,720 |
|
|
Independent trustees' compensation |
2,055 |
|
|
Registration fees |
95,415 |
|
|
Audit |
41,549 |
|
|
Legal |
1,011 |
|
|
Miscellaneous |
2,145 |
|
|
Total expenses before reductions |
3,082,165 |
|
|
Expense reductions |
(24,243) |
3,057,922 |
|
Net investment income (loss) |
|
3,382,280 |
|
Realized and Unrealized Gain (Loss) Net realized gain (loss) on: |
|
|
|
Investment securities: |
|
|
|
Unaffiliated issuers |
803,715 |
|
|
Foreign currency transactions |
7,950 |
|
|
Total net realized gain (loss) |
|
811,665 |
|
Change in net unrealized appreciation (depreciation) on: Investment securities |
86,560,234 |
|
|
Assets and liabilities in foreign currencies |
(401) |
|
|
Total change in net unrealized appreciation (depreciation) |
|
86,559,833 |
|
Net gain (loss) |
|
87,371,498 |
|
Net increase (decrease) in net assets resulting from operations |
|
$ 90,753,778 |
See accompanying notes which are an integral part of the financial statements.
Annual Report
Statement of Changes in Net Assets
|
|
Year ended |
Year ended |
|
Increase (Decrease) in Net Assets |
|
|
|
Operations |
|
|
|
Net investment income (loss) |
$ 3,382,280 |
$ 1,191,206 |
|
Net realized gain (loss) |
811,665 |
(3,300,816) |
|
Change in net unrealized appreciation (depreciation) |
86,559,833 |
(611,251) |
|
Net increase (decrease) in net assets resulting from operations |
90,753,778 |
(2,720,861) |
|
Distributions to shareholders from net investment income |
(3,485,896) |
(1,167,605) |
|
Distributions to shareholders from net realized gain |
- |
(1,177,808) |
|
Total distributions |
(3,485,896) |
(2,345,413) |
|
Share transactions |
539,936,328 |
125,782,043 |
|
Reinvestment of distributions |
3,390,166 |
2,273,089 |
|
Cost of shares redeemed |
(156,442,466) |
(145,769,203) |
|
Net increase (decrease) in net assets resulting from share transactions |
386,884,028 |
(17,714,071) |
|
Redemption fees |
57,823 |
16,532 |
|
Total increase (decrease) in net assets |
474,209,733 |
(22,763,813) |
|
|
|
|
|
Net Assets |
|
|
|
Beginning of period |
183,156,640 |
205,920,453 |
|
End of period (including distributions in excess of net investment income of $139,171 and distributions in excess of net investment income of $52,199, respectively) |
$ 657,366,373 |
$ 183,156,640 |
|
Other Information Shares |
|
|
|
Sold |
9,657,499 |
2,698,656 |
|
Issued in reinvestment of distributions |
59,456 |
50,831 |
|
Redeemed |
(2,815,324) |
(3,279,398) |
|
Net increase (decrease) |
6,901,631 |
(529,911) |
Financial Highlights
|
Years ended February 28, |
2013 |
2012 I |
2011 |
2010 |
2009 |
|
Selected Per-Share Data |
|
|
|
|
|
|
Net asset value, beginning of period |
$ 48.48 |
$ 47.80 |
$ 34.39 |
$ 18.27 |
$ 35.30 |
|
Income from Investment Operations |
|
|
|
|
|
|
Net investment income (loss) B |
.53 E |
.29 |
.14 |
.13 F |
.06 |
|
Net realized and unrealized gain (loss) |
12.96 |
.96 G |
13.39 |
16.12 |
(16.17) |
|
Total from investment operations |
13.49 |
1.25 |
13.53 |
16.25 |
(16.11) |
|
Distributions from net investment income |
(.43) |
(.32) |
(.12) |
(.13) |
(.06) |
|
Distributions from net realized gain |
- |
(.25) |
- |
- |
(.86) |
|
Total distributions |
(.43) |
(.57) |
(.12) |
(.13) |
(.92) |
|
Redemption fees added to paid in capital B |
.01 |
- J |
- J |
- J |
- J |
|
Net asset value, end of period |
$ 61.55 |
$ 48.48 |
$ 47.80 |
$ 34.39 |
$ 18.27 |
|
Total Return A |
27.91% |
2.73% |
39.37% |
88.96% |
(46.75)% |
|
Ratios to Average Net Assets C, H |
|
|
|
|
|
|
Expenses before reductions |
.88% |
.90% |
.94% |
1.08% |
1.07% |
|
Expenses net of fee waivers, if any |
.88% |
.90% |
.94% |
1.08% |
1.07% |
|
Expenses net of all reductions |
.88% |
.90% |
.94% |
1.07% |
1.07% |
|
Net investment income (loss) |
.97% E |
.64% |
.37% |
.44% F |
.22% |
|
Supplemental Data |
|
|
|
|
|
|
Net assets, end of period (000 omitted) |
$ 657,366 |
$ 183,157 |
$ 205,920 |
$ 76,309 |
$ 26,183 |
|
Portfolio turnover rate D |
30% |
85% |
76% |
40% |
39% |
|
A Total returns would have been lower if certain expenses had not been reduced during the applicable periods shown. B Calculated based on average shares outstanding during the period. C Fees and expenses of any underlying Fidelity Central Funds are not included in the Fund's expense ratio. The Fund indirectly bears its proportionate share of the expenses of any underlying Fidelity Central Funds. D Amount does not include the portfolio activity of any underlying Fidelity Central Funds. E Investment income per share reflects a large, non-recurring dividend which amounted to $.12 per share. Excluding this non-recurring dividend, the ratio of net investment income (loss) to average net assets would have been ..76%. F Investment income per share reflects a large, non-recurring dividend which amounted to $.10 per share. Excluding this non-recurring dividend, the ratio of net investment income (loss) to average net assets would have been .10%. G The amount shown for a share outstanding does not correspond with the aggregate net gain (loss) on investments for the period due to the timing of sales and repurchases of shares in relation to fluctuating market values of the investments of the Fund. H Expense ratios reflect operating expenses of the Fund. Expenses before reductions do not reflect amounts reimbursed by the investment adviser or reductions from brokerage service arrangements or reductions from other expense offset arrangements and do not represent the amount paid by the Fund during periods when reimbursements or reductions occur. Expenses net of fee waivers reflect expenses after reimbursement by the investment adviser but prior to reductions from brokerage service arrangements or other expense offset arrangements. Expenses net of all reductions represent the net expenses paid by the Fund. I For the year ended February 29. J Amount represents less than $.01 per share. |
See accompanying notes which are an integral part of the financial statements.
Annual Report
Retailing Portfolio
Performance: The Bottom Line
Average annual total return reflects the change in the value of an investment, assuming reinvestment of the fund's distributions from dividend income and capital gains (the profits earned upon the sale of securities that have grown in value, if any) and assuming a constant rate of performance each year. The $10,000 table and the fund's returns do not reflect the deduction of taxes that a shareholder would pay on fund distributions or the redemption of fund shares. During periods of reimbursement by Fidelity, a fund's total return will be greater than it would be had the reimbursement not occurred. How a fund did yesterday is no guarantee of how it will do tomorrow.
Average Annual Total Returns
|
Periods ended February 28, 2013 |
Past 1 |
Past 5 |
Past 10 |
|
Retailing Portfolio |
18.98% |
17.07% |
14.21% |
$10,000 Over 10 Years
Let's say hypothetically that $10,000 was invested in Retailing Portfolio on February 28, 2003. The chart shows how the value of your investment would have changed, and also shows how the S&P 500 Index performed over the same period.

Annual Report
Retailing Portfolio
Management's Discussion of Fund Performance
Market Recap: U.S. stocks posted solid gains for the year ending February 28, 2013, sparked by a late-period rally that pushed major equity benchmarks to multiyear highs. Improvement in the global economy and more monetary stimulus from the U.S. Federal Reserve kept markets on the upswing for much of the year, shrugging off an early decline brought on by debt woes in Europe, and another dip later in the period amid Congressional gridlock on the federal budget. Renewed optimism over employment, the housing market, corporate earnings and record dividends made stocks a favorite with investors during the 12 months, which helped push the broad-based S&P 500® Index across the milestone 1,500 mark at the end of January. The S&P 500® finished the period up 13.46%. Seven of the 10 major market sectors tracked by MSCI U.S. IMI 25-50 classifications produced double-digit gains, led by health care and financials, while information technology, energy and materials trailed the broad equity market with only modest advances.
Comments from Peter Dixon, Portfolio Manager of Retailing Portfolio: For the year, the fund gained 18.98%, trailing the 21.05% return of the MSCI® U.S. IMI Retailing 25-50 Index, but significantly outpacing the 13.46% advance of the broad-based S&P 500®. The period started with unusually warm weather, which drove strong customer traffic to stores and malls and benefited sales of spring goods, lifting many retailers, including home improvement and apparel. New apparel trends helped sustain strong momentum throughout spring and into summer, and also was a strong contributor to a better-than-expected back-to-school season. Despite some macroeconomic and political distractions, as well as warm weather continuing into the holiday season, the year finished strong, which helped retailing stocks sustain their upward momentum through period end. An early-period overweighting in apparel retailer Express was by far the biggest individual detractor. The company suffered from a series of temporary, fashion-driven missteps that resulted in lower-than-expected earnings growth, which hurt the stock during a time when other apparel retailers were performing well. Not owning apparel retailer and index component Gap also hampered the fund's performance, as I underestimated the amount to which the company would benefit from easy input-cost comparisons and on-trend fashion, which drove better-than-expected earnings and strong stock performance. Untimely positioning in home-improvement retailer Lowe's Companies hurt. I overweighted the stock in anticipation of the company benefiting from self-help initiatives and a lift from an improving U.S. housing market. However, self-help initiatives took longer-than-expected to aid the firm, driving poor earnings and stock performance in first half of the period. Conversely, I avoided JCPenney for essentially the entire period, and it was our biggest relative contributor. The department store chain has been undergoing a large transformation, and same-store sales plummeted during the year. Several other top contributors were non-index holdings in companies that have concepts and/or brands that are differentiated from the majority of retailers and have exposure to faster-growing categories. Names here that did well for the fund included France-based luxury-goods retailer PPR, which owns high-fashion brands such as Gucci, and G-III Apparel Group, which primarily produces outerwear and owns the license to manufacture Calvin Klein dresses, among other brands.
The views expressed above reflect those of the portfolio manager(s) only through the end of the period as stated on the cover of this report and do not necessarily represent the views of Fidelity or any other person in the Fidelity organization. Any such views are subject to change at any time based upon market or other conditions and Fidelity disclaims any responsibility to update such views. These views may not be relied on as investment advice and, because investment decisions for a Fidelity fund are based on numerous factors, may not be relied on as an indication of trading intent on behalf of any Fidelity fund.
Annual Report
Retailing Portfolio
Investment Changes (Unaudited)
|
Top Ten Stocks as of February 28, 2013 |
||
|
|
% of fund's |
% of fund's net assets |
|
Home Depot, Inc. |
16.2 |
14.6 |
|
Amazon.com, Inc. |
10.1 |
14.2 |
|
Lowe's Companies, Inc. |
7.7 |
3.2 |
|
priceline.com, Inc. |
6.7 |
5.2 |
|
TJX Companies, Inc. |
4.4 |
7.1 |
|
AutoZone, Inc. |
4.2 |
4.9 |
|
Limited Brands, Inc. |
4.0 |
4.4 |
|
LKQ Corp. |
3.2 |
1.8 |
|
O'Reilly Automotive, Inc. |
3.1 |
4.0 |
|
Urban Outfitters, Inc. |
3.1 |
0.0 |
|
|
62.7 |
|
|
Top Industries (% of fund's net assets) |
|||
|
As of February 28, 2013 |
|||
|
Specialty Retail |
63.0% |
|
|
Internet & Catalog Retail |
16.9% |
|
|
Textiles, Apparel & Luxury Goods |
9.9% |
|
|
Multiline Retail |
3.9% |
|
|
Distributors |
3.2% |
|
|
All Others* |
3.1% |
|

|
As of August 31, 2012 |
|||
|
Specialty Retail |
59.8% |
|
|
Internet & Catalog Retail |
19.4% |
|
 |
Food & Staples Retailing |
5.4% |
|
|
Textiles, Apparel & Luxury Goods |
4.3% |
|
|
Multiline Retail |
4.1% |
|
|
All Others* |
7.0% |
|

|
* Includes short-term investments and net other assets. |
Annual Report
Retailing Portfolio
Investments February 28, 2013
Showing Percentage of Net Assets
|
Common Stocks - 98.7% |
|||
|
Shares |
Value |
||
|
DISTRIBUTORS - 3.2% |
|||
|
Distributors - 3.2% |
|||
|
LKQ Corp. (a) |
965,200 |
$ 20,452,588 |
|
|
DIVERSIFIED CONSUMER SERVICES - 0.6% |
|||
|
Specialized Consumer Services - 0.6% |
|||
|
Steiner Leisure Ltd. (a) |
87,650 |
4,132,698 |
|
|
FOOD PRODUCTS - 0.0% |
|||
|
Packaged Foods & Meats - 0.0% |
|||
|
Annie's, Inc. |
4,237 |
177,785 |
|
|
INTERNET & CATALOG RETAIL - 16.9% |
|||
|
Internet Retail - 16.9% |
|||
|
Amazon.com, Inc. (a) |
244,920 |
64,725,008 |
|
|
ASOS PLC (a) |
14,400 |
598,349 |
|
|
priceline.com, Inc. (a) |
62,840 |
43,207,527 |
|
|
|
108,530,884 |
||
|
MULTILINE RETAIL - 3.9% |
|||
|
Department Stores - 2.1% |
|||
|
PPR SA |
61,000 |
13,673,939 |
|
|
General Merchandise Stores - 1.8% |
|||
|
Target Corp. |
185,621 |
11,686,698 |
|
|
TOTAL MULTILINE RETAIL |
25,360,637 |
||
|
SOFTWARE - 1.2% |
|||
|
Home Entertainment Software - 1.2% |
|||
|
Take-Two Interactive Software, Inc. (a) |
518,000 |
7,583,520 |
|
|
SPECIALTY RETAIL - 63.0% |
|||
|
Apparel Retail - 20.7% |
|||
|
DSW, Inc. Class A |
212,900 |
14,411,201 |
|
|
Express, Inc. (a) |
740,997 |
13,708,445 |
|
|
H&M Hennes & Mauritz AB (B Shares) |
396,000 |
14,211,522 |
|
|
Inditex SA |
77,529 |
10,390,026 |
|
|
Limited Brands, Inc. |
566,098 |
25,768,781 |
|
|
Ross Stores, Inc. |
112,800 |
6,537,888 |
|
|
TJX Companies, Inc. |
620,400 |
27,899,388 |
|
|
Urban Outfitters, Inc. (a) |
490,200 |
19,862,904 |
|
|
|
132,790,155 |
||
|
Automotive Retail - 8.5% |
|||
|
AutoZone, Inc. (a) |
70,443 |
26,778,906 |
|
|
Monro Muffler Brake, Inc. (d) |
218,144 |
8,082,235 |
|
|
O'Reilly Automotive, Inc. (a) |
197,365 |
20,079,915 |
|
|
|
54,941,056 |
||
|
Home Improvement Retail - 23.9% |
|||
|
Home Depot, Inc. |
1,520,700 |
104,167,950 |
|
|
Lowe's Companies, Inc. |
1,299,000 |
49,556,850 |
|
|
|
153,724,800 |
||
|
Homefurnishing Retail - 2.2% |
|||
|
Bed Bath & Beyond, Inc. (a) |
245,980 |
13,959,365 |
|
|
|
|||
|
Shares |
Value |
||
|
Specialty Stores - 7.7% |
|||
|
Dick's Sporting Goods, Inc. |
352,700 |
$ 17,635,000 |
|
|
GNC Holdings, Inc. |
386,000 |
15,826,000 |
|
|
Ulta Salon, Cosmetics & Fragrance, Inc. |
179,900 |
15,931,944 |
|
|
|
49,392,944 |
||
|
TOTAL SPECIALTY RETAIL |
404,808,320 |
||
|
TEXTILES, APPAREL & LUXURY GOODS - 9.9% |
|||
|
Apparel, Accessories & Luxury Goods - 7.9% |
|||
|
Compagnie Financiere Richemont SA Series A |
52,601 |
4,228,620 |
|
|
G-III Apparel Group Ltd. (a) |
350,096 |
12,778,504 |
|
|
lululemon athletica, Inc. (a)(d) |
206,600 |
13,852,530 |
|
|
Swatch Group AG (Bearer) (Reg.) |
34,564 |
3,512,452 |
|
|
VF Corp. |
101,300 |
16,335,638 |
|
|
|
50,707,744 |
||
|
Footwear - 2.0% |
|||
|
NIKE, Inc. Class B |
241,700 |
13,162,982 |
|
|
TOTAL TEXTILES, APPAREL & LUXURY GOODS |
63,870,726 |
||
|
TOTAL COMMON STOCKS (Cost $498,877,967) |
|
||
|
Convertible Bonds - 0.2% |
||||
|
|
Principal |
|
||
|
SOFTWARE - 0.2% |
||||
|
Home Entertainment Software - 0.2% |
||||
|
Take-Two Interactive Software, Inc. 1.75% 12/1/16 |
|
$ 1,000,000 |
|
|
|
Money Market Funds - 3.5% |
|||
|
Shares |
|
||
|
Fidelity Cash Central Fund, 0.16% (b) |
7,414,802 |
7,414,802 |
|
|
Fidelity Securities Lending Cash Central Fund, 0.16% (b)(c) |
15,126,375 |
15,126,375 |
|
|
TOTAL MONEY MARKET FUNDS (Cost $22,541,177) |
|
||
|
TOTAL INVESTMENT PORTFOLIO - 102.4% (Cost $522,419,144) |
658,543,960 |
||
|
NET OTHER ASSETS (LIABILITIES) - (2.4)% |
(15,461,554) |
||
|
NET ASSETS - 100% |
$ 643,082,406 |
||
|
Legend |
|
(a) Non-income producing |
|
(b) Affiliated fund that is generally available only to investment companies and other accounts managed by Fidelity Investments. The rate quoted is the annualized seven-day yield of the fund at period end. A complete unaudited listing of the fund's holdings as of its most recent quarter end is available upon request. In addition, each Fidelity Central Fund's financial statements, which are not covered by the Fund's Report of Independent Registered Public Accounting Firm, are available on the SEC's website or upon request. |
|
(c) Investment made with cash collateral received from securities on loan. |
|
(d) Security or a portion of the security is on loan at period end. |
|
Affiliated Central Funds |
|
Information regarding fiscal year to date income earned by the Fund from investments in Fidelity Central Funds is as follows: |
|
Fund |
Income earned |
|
Fidelity Cash Central Fund |
$ 19,959 |
|
Fidelity Securities Lending Cash Central Fund |
74,675 |
|
Total |
$ 94,634 |
|
Other Information |
|
The following is a summary of the inputs used, as of February 28, 2013, involving the Fund's assets and liabilities carried at fair value. The inputs or methodology used for valuing securities may not be an indication of the risk associated with investing in those securities. For more information on valuation inputs, and their aggregation into the levels used in the table below, please refer to the Investment Valuation section in the accompanying Notes to Financial Statements. |
|
Valuation Inputs at Reporting Date: |
||||
|
Description |
Total |
Level 1 |
Level 2 |
Level 3 |
|
Investments in Securities: |
||||
|
Common Stocks |
$ 634,917,158 |
$ 634,917,158 |
$ - |
$ - |
|
Convertible Bonds |
1,085,625 |
- |
1,085,625 |
- |
|
Money Market Funds |
22,541,177 |
22,541,177 |
- |
- |
|
Total Investments in Securities: |
$ 658,543,960 |
$ 657,458,335 |
$ 1,085,625 |
$ - |
See accompanying notes which are an integral part of the financial statements.
Annual Report
Retailing Portfolio
Financial Statements
Statement of Assets and Liabilities
|
|
February 28, 2013 |
|
|
|
|
|
|
Assets |
|
|
|
Investment in securities, at value (including securities loaned of $14,648,775) - See accompanying schedule: Unaffiliated issuers (cost $499,877,967) |
$ 636,002,783 |
|
|
Fidelity Central Funds (cost $22,541,177) |
22,541,177 |
|
|
Total Investments (cost $522,419,144) |
|
$ 658,543,960 |
|
Receivable for investments sold |
|
3,191,726 |
|
Receivable for fund shares sold |
|
1,481,776 |
|
Dividends receivable |
|
382,585 |
|
Interest receivable |
|
4,375 |
|
Distributions receivable from Fidelity Central Funds |
|
3,981 |
|
Prepaid expenses |
|
1,458 |
|
Receivable from investment adviser for expense reductions |
|
193 |
|
Other receivables |
|
24,640 |
|
Total assets |
|
663,634,694 |
|
|
|
|
|
Liabilities |
|
|
|
Payable for investments purchased |
$ 4,151,022 |
|
|
Payable for fund shares redeemed |
811,298 |
|
|
Accrued management fee |
292,106 |
|
|
Other affiliated payables |
131,090 |
|
|
Other payables and accrued expenses |
40,397 |
|
|
Collateral on securities loaned, at value |
15,126,375 |
|
|
Total liabilities |
|
20,552,288 |
|
|
|
|
|
Net Assets |
|
$ 643,082,406 |
|
Net Assets consist of: |
|
|
|
Paid in capital |
|
$ 513,244,831 |
|
Undistributed net investment income |
|
258,403 |
|
Accumulated undistributed net realized gain (loss) on investments and foreign currency transactions |
|
(6,545,715) |
|
Net unrealized appreciation (depreciation) on investments and assets and liabilities in foreign currencies |
|
136,124,887 |
|
Net Assets, for 9,656,844 shares outstanding |
|
$ 643,082,406 |
|
Net Asset Value, offering price and redemption price per share ($643,082,406 ÷ 9,656,844 shares) |
|
$ 66.59 |
Statement of Operations
|
|
Year ended February 28, 2013 |
|
|
|
|
|
|
Investment Income |
|
|
|
Dividends |
|
$ 7,296,120 |
|
Special dividends |
|
1,614,594 |
|
Interest |
|
17,580 |
|
Income from Fidelity Central Funds (including $74,675 from security lending) |
|
94,634 |
|
Total income |
|
9,022,928 |
|
|
|
|
|
Expenses |
|
|
|
Management fee |
$ 3,015,934 |
|
|
Transfer agent fees |
1,248,759 |
|
|
Accounting and security lending fees |
205,910 |
|
|
Custodian fees and expenses |
16,350 |
|
|
Independent trustees' compensation |
3,473 |
|
|
Registration fees |
84,423 |
|
|
Audit |
39,056 |
|
|
Legal |
1,843 |
|
|
Interest |
963 |
|
|
Miscellaneous |
3,342 |
|
|
Total expenses before reductions |
4,620,053 |
|
|
Expense reductions |
(93,516) |
4,526,537 |
|
Net investment income (loss) |
|
4,496,391 |
|
Realized and Unrealized Gain (Loss) Net realized gain (loss) on: |
|
|
|
Investment securities: |
|
|
|
Unaffiliated issuers |
10,511,308 |
|
|
Foreign currency transactions |
(43,341) |
|
|
Total net realized gain (loss) |
|
10,467,967 |
|
Change in net unrealized appreciation (depreciation) on: Investment securities |
68,227,734 |
|
|
Assets and liabilities in foreign currencies |
71 |
|
|
Total change in net unrealized appreciation (depreciation) |
|
68,227,805 |
|
Net gain (loss) |
|
78,695,772 |
|
Net increase (decrease) in net assets resulting from operations |
|
$ 83,192,163 |
See accompanying notes which are an integral part of the financial statements.
Annual Report
Statement of Changes in Net Assets
|
|
Year ended |
Year ended |
|
Increase (Decrease) in Net Assets |
|
|
|
Operations |
|
|
|
Net investment income (loss) |
$ 4,496,391 |
$ 2,294,727 |
|
Net realized gain (loss) |
10,467,967 |
4,508,981 |
|
Change in net unrealized appreciation (depreciation) |
68,227,805 |
31,163,378 |
|
Net increase (decrease) in net assets resulting from operations |
83,192,163 |
37,967,086 |
|
Distributions to shareholders from net investment income |
(3,444,682) |
(1,998,613) |
|
Distributions to shareholders from net realized gain |
(12,259,653) |
(14,569,913) |
|
Total distributions |
(15,704,335) |
(16,568,526) |
|
Share transactions |
545,350,604 |
358,193,782 |
|
Reinvestment of distributions |
15,326,898 |
16,017,682 |
|
Cost of shares redeemed |
(329,889,159) |
(218,000,118) |
|
Net increase (decrease) in net assets resulting from share transactions |
230,788,343 |
156,211,346 |
|
Redemption fees |
62,949 |
38,912 |
|
Total increase (decrease) in net assets |
298,339,120 |
177,648,818 |
|
|
|
|
|
Net Assets |
|
|
|
Beginning of period |
344,743,286 |
167,094,468 |
|
End of period (including undistributed net investment income of $258,403 and undistributed net investment income of $59,634, respectively) |
$ 643,082,406 |
$ 344,743,286 |
|
Other Information Shares |
|
|
|
Sold |
8,767,180 |
6,700,769 |
|
Issued in reinvestment of distributions |
246,579 |
307,489 |
|
Redeemed |
(5,348,769) |
(4,129,046) |
|
Net increase (decrease) |
3,664,990 |
2,879,212 |
Financial Highlights
|
Years ended February 28, |
2013 |
2012 H |
2011 |
2010 |
2009 |
|
Selected Per-Share Data |
|
|
|
|
|
|
Net asset value, beginning of period |
$ 57.54 |
$ 53.68 |
$ 45.11 |
$ 26.48 |
$ 36.57 |
|
Income from Investment Operations |
|
|
|
|
|
|
Net investment income (loss) B |
.52 E |
.49 F |
.09 |
.11 |
.21 |
|
Net realized and unrealized gain (loss) |
10.27 |
7.46 |
9.81 |
20.74 |
(10.11) |
|
Total from investment operations |
10.79 |
7.95 |
9.90 |
20.85 |
(9.90) |
|
Distributions from net investment income |
(.38) |
(.34) |
(.01) |
(.11) |
(.20) |
|
Distributions from net realized gain |
(1.36) |
(3.76) |
(1.33) |
(2.11) |
- |
|
Total distributions |
(1.75) J |
(4.10) |
(1.34) |
(2.22) |
(.20) |
|
Redemption fees added to paid in capital B |
.01 |
.01 |
.01 |
- I |
.01 |
|
Net asset value, end of period |
$ 66.59 |
$ 57.54 |
$ 53.68 |
$ 45.11 |
$ 26.48 |
|
Total Return A |
18.98% |
15.70% |
22.24% |
79.26% |
(27.09)% |
|
Ratios to Average Net Assets C, G |
|
|
|
|
|
|
Expenses before reductions |
.86% |
.90% |
.93% |
.96% |
1.07% |
|
Expenses net of fee waivers, if any |
.86% |
.90% |
.93% |
.96% |
1.07% |
|
Expenses net of all reductions |
.84% |
.88% |
.93% |
.94% |
1.06% |
|
Net investment income (loss) |
.83% E |
.93% F |
.18% |
.27% |
.63% |
|
Supplemental Data |
|
|
|
|
|
|
Net assets, end of period (000 omitted) |
$ 643,082 |
$ 344,743 |
$ 167,094 |
$ 137,409 |
$ 40,335 |
|
Portfolio turnover rate D |
119% |
217% |
191% |
281% |
504% |
|
A Total returns would have been lower if certain expenses had not been reduced during the applicable periods shown. B Calculated based on average shares outstanding during the period. C Fees and expenses of any underlying Fidelity Central Funds are not included in the Fund's expense ratio. The Fund indirectly bears its proportionate share of the expenses of any underlying Fidelity Central Funds. D Amount does not include the portfolio activity of any underlying Fidelity Central Funds. E Investment income per share reflects a large, non-recurring dividend which amounted to $.19 per share. Excluding this non-recurring dividend, the ratio of net investment income (loss) to average net assets would have been ..53%. F Investment income per share reflects a large, non-recurring dividend which amounted to $.28 per share. Excluding this non-recurring dividend, the ratio of net investment income (loss) to average net assets would have been .40%. G Expense ratios reflect operating expenses of the Fund. Expenses before reductions do not reflect amounts reimbursed by the investment adviser or reductions from brokerage service arrangements or reductions from other expense offset arrangements and do not represent the amount paid by the Fund during periods when reimbursements or reductions occur. Expenses net of fee waivers reflect expenses after reimbursement by the investment adviser but prior to reductions from brokerage service arrangements or other expense offset arrangements. Expenses net of all reductions represent the net expenses paid by the Fund. H For the year ended February 29. I Amount represents less than $.01 per share. J Total distributions of $1.75 per share is comprised of distributions from net investment income of $.383 and distributions from net realized gain of $1.364 per share. |
See accompanying notes which are an integral part of the financial statements.
Annual Report
Notes to Financial Statements
For the period ended February 28, 2013
1. Organization.
Automotive Portfolio, Construction and Housing Portfolio, Consumer Discretionary Portfolio, Leisure Portfolio, Multimedia Portfolio, and Retailing Portfolio (the Funds) are non-diversified funds of Fidelity Select Portfolios (the Trust). The Trust is registered under the Investment Company Act of 1940, as amended (the 1940 Act), as an open-end management investment company organized as a Massachusetts business trust. The Funds invest primarily in securities of companies whose principal business activities fall within specific industries. Each Fund is authorized to issue an unlimited number of shares.
2. Investments in Fidelity Central Funds.
The Funds invest in Fidelity Central Funds, which are open-end investment companies available only to other investment companies and accounts managed by Fidelity Management & Research Company (FMR) and its affiliates. The Funds' Schedules of Investments list each of the Fidelity Central Funds held as of period end, if any, as an investment of each Fund, but do not include the underlying holdings of each Fidelity Central Fund. As an Investing Fund, each Fund indirectly bears its proportionate share of the expenses of the underlying Fidelity Central Funds.
The Money Market Central Funds seek preservation of capital and current income and are managed by Fidelity Investments Money Management, Inc. (FIMM), an affiliate of FMR.
A complete unaudited list of holdings for each Fidelity Central Fund is available upon request or at the Securities and Exchange Commission (the SEC) website at www.sec.gov. In addition, the financial statements of the Fidelity Central Funds, which are not covered by the Funds' Report of Independent Registered Public Accounting Firm, are available on the SEC website or upon request.
3. Significant Accounting Policies.
The financial statements have been prepared in conformity with accounting principles generally accepted in the United States of America (GAAP), which require management to make certain estimates and assumptions at the date of the financial statements. Actual results could differ from those estimates. Subsequent events, if any, through the date that the financial statements were issued have been evaluated in the preparation of the financial statements. The following summarizes the significant accounting policies of the Funds:
Investment Valuation. Investments are valued as of 4:00 p.m. Eastern time on the last calendar day of the period. In accordance with valuation policies and procedures approved by the Board of Trustees (the Board), each Fund attempts to obtain prices from one or more third party pricing vendors or brokers to value its investments. When current market prices, quotations or currency exchange rates are not readily available or reliable, investments will be fair valued in good faith by the FMR Fair Value Committee (the Committee), in accordance with procedures adopted by each Fund's Board. Factors used in determining fair value vary by investment type and may include market or investment specific events, changes in interest rates and credit quality. The frequency with which these procedures are used cannot be predicted and they may be utilized to a significant extent. The Committee oversees each Fund's valuation policies and procedures and is responsible for approving and reporting to the Board all fair value determinations.
Each Fund categorizes the inputs to valuation techniques used to value their investments into a disclosure hierarchy consisting of three levels as shown below:
Level 1 - quoted prices in active markets for identical investments
Level 2 - other significant observable inputs (including quoted prices for similar investments, interest rates, prepayment speeds, etc.)
Level 3 - unobservable inputs (including the Fund's own assumptions based on the best information available)
Valuation techniques used to value each Fund's investments by major category are as follows:
Equity securities, including restricted securities, for which market quotations are readily available, are valued at the last reported sale price or official closing price as reported by a third party pricing vendor on the primary market or exchange on which they are traded and are categorized as Level 1 in the hierarchy. In the event there were no sales during the day or closing prices are not available, securities are valued at the last quoted bid price or may be valued using the last available price and are generally categorized as Level 2 in the hierarchy. For foreign equity securities, when significant market or security specific events arise, comparisons to the valuation of American Depositary Receipts (ADRs), futures contracts, Exchange-Traded Funds (ETFs) and certain indexes as well as quoted prices for similar securities are used and are categorized as Level 2 in the hierarchy. Utilizing these techniques may result in transfers between Level 1 and Level 2.
Debt securities, including restricted securities, are valued based on evaluated prices received from third party pricing vendors or from brokers who make markets in such securities. For corporate bonds, pricing vendors utilize matrix pricing which considers yield or price of bonds of comparable quality, coupon, maturity and type as well as broker-supplied prices. When independent prices are unavailable or unreliable, debt securities may be
Annual Report
3. Significant Accounting Policies - continued
Investment Valuation - continued
valued utilizing pricing methodologies which consider similar factors that would be used by third party pricing vendors. Debt securities are generally categorized as Level 2 in the hierarchy but may be Level 3 depending on the circumstances.
Investments in open-end mutual funds, including the Fidelity Central Funds, are valued at their closing net asset value (NAV) each business day and are categorized as Level 1 in the hierarchy.
Changes in valuation techniques may result in transfers in or out of an assigned level within the disclosure hierarchy. The aggregate value of investments by input level, as of February 28, 2013, is included at the end of each applicable Fund's Schedule of Investments.
Foreign Currency. The Funds may use foreign currency contracts to facilitate transactions in foreign-denominated securities. Gains and losses from these transactions may arise from changes in the value of the foreign currency or if the counterparties do not perform under the contracts' terms.
Foreign-denominated assets, including investment securities, and liabilities are translated into U.S. dollars at the exchange rates at period end. Purchases and sales of investment securities, income and dividends received and expenses denominated in foreign currencies are translated into U.S. dollars at the exchange rate in effect on the transaction date.
The effects of exchange rate fluctuations on investments are included with the net realized and unrealized gain (loss) on investment securities. Other foreign currency transactions resulting in realized and unrealized gain (loss) are disclosed separately.
Investment Transactions and Income. For financial reporting purposes, the Funds' investment holdings and NAV include trades executed through the end of the last business day of the period. The NAV per share for processing shareholder transactions is calculated as of the close of business of the New York Stock Exchange (NYSE), normally 4:00 p.m. Eastern time and includes trades executed through the end of the prior business day. Gains and losses on securities sold are determined on the basis of identified cost and may include proceeds received from litigation. Dividend income is recorded on the ex-dividend date, except for certain dividends from foreign securities where the ex-dividend date may have passed, which are recorded as soon as the Funds are informed of the ex-dividend date. Non-cash dividends included in dividend income, if any, are recorded at the fair market value of the securities received. Distributions received on securities that represent a return of capital or capital gain are recorded as a reduction of cost of investments and/or as a realized gain. The Funds estimate the components of distributions received that may be considered return of capital distributions or capital gain distributions. Large, non-recurring dividends recognized by the Funds are presented separately on the Statement of Operations as "Special Dividends" and the impact of these dividends is presented in the Financial Highlights. Interest income and distributions from the Fidelity Central Funds are accrued as earned. Interest income includes coupon interest and amortization of premium and accretion of discount on debt securities. Investment income is recorded net of foreign taxes withheld where recovery of such taxes is uncertain. Debt obligations may be placed on non-accrual status and related interest income may be reduced by ceasing current accruals and writing off interest receivables when the collection of all or a portion of interest has become doubtful based on consistently applied procedures. A debt obligation is removed from non-accrual status when the issuer resumes interest payments or when collectability of interest is reasonably assured.
Expenses. Expenses directly attributable to a fund are charged to that fund. Expenses attributable to more than one fund are allocated among the respective funds on the basis of relative net assets or other appropriate methods. Expense estimates are accrued in the period to which they relate and adjustments are made when actual amounts are known.
Income Tax Information and Distributions to Shareholders. Each year, each Fund intends to qualify as a regulated investment company under Subchapter M of the Internal Revenue Code, including distributing substantially all of its taxable income and realized gains. As a result, no provision for income taxes is required. As of February 28, 2013, each Fund did not have any unrecognized tax benefits in the financial statements; nor is each Fund aware of any tax positions for which it is reasonably possible that the total amounts of unrecognized tax benefits will significantly change in the next twelve months. Each Fund files a U.S. federal tax return, in addition to state and local tax returns as required. A fund's federal income tax returns are subject to examination by the Internal Revenue Service (IRS) for a period of three fiscal years after they are filed. State and local tax returns may be subject to examination for an additional fiscal year depending on the jurisdiction. Foreign taxes are provided for based on each Fund's understanding of the tax rules and rates that exist in the foreign markets in which it invests.
Distributions are declared and recorded on the ex-dividend date. Income and capital gain distributions are determined in accordance with income tax regulations, which may differ from GAAP. In addition, certain Funds claimed a portion of the payment made to redeeming shareholders as a distribution for income tax purposes.
Capital accounts within the financial statements are adjusted for permanent book-tax differences. These adjustments have no impact on net assets or the results of operations. Temporary book-tax differences will reverse in a subsequent period.
Book-tax differences are primarily due to foreign currency transactions, partnerships, certain foreign taxes, deferred trustees compensation, capital loss carryforwards and losses deferred due to wash sales and excise tax regulations.
Annual Report
Notes to Financial Statements - continued
3. Significant Accounting Policies - continued
Income Tax Information and Distributions to Shareholders - continued
The federal tax cost of investment securities and unrealized appreciation (depreciation) as of period end were as follows for each Fund:
|
|
Tax cost |
Gross unrealized |
Gross unrealized |
Net unrealized |
|
Automotive Portfolio |
$ 134,510,070 |
$ 36,193,079 |
$ (3,587,238) |
$ 32,605,841 |
|
Construction and Housing Portfolio |
723,265,185 |
98,137,586 |
(10,001,112) |
88,136,474 |
|
Consumer Discretionary Portfolio |
343,909,960 |
69,409,756 |
(5,492,953) |
63,916,803 |
|
Leisure Portfolio |
223,267,430 |
131,386,482 |
(1,615,781) |
129,770,701 |
|
Multimedia Portfolio |
566,111,238 |
139,045,722 |
(5,409,273) |
133,636,449 |
|
Retailing Portfolio |
524,732,583 |
138,049,659 |
(4,238,282) |
133,811,377 |
The tax-based components of distributable earnings as of period end were as follows for each Fund:
|
|
Undistributed |
Undistributed |
Capital loss |
Net unrealized |
|
Automotive Portfolio |
$ - |
$ - |
$ (4,238,289) |
$ 32,604,993 |
|
Construction and Housing Portfolio |
4,002,596 |
497,700 |
- |
88,137,658 |
|
Consumer Discretionary Portfolio |
71,671 |
2,331,440 |
- |
69,916,803 |
|
Leisure Portfolio |
1,020,811 |
11,170,913 |
- |
129,770,701 |
|
Multimedia Portfolio |
- |
- |
(2,219,916) |
133,636,060 |
|
Retailing Portfolio |
258,576 |
162,663 |
- |
133,811,448 |
Capital loss carryforwards are only available to offset future capital gains of the Funds to the extent provided by regulations and may be limited. Under the Regulated Investment Company Modernization Act of 2010 (the Act), the Funds are permitted to carry forward capital losses incurred in taxable years beginning after December 22, 2010 for an unlimited period and such capital losses are required to be used prior to any losses that expire. Capital loss carryforwards were as follows:
|
|
No expiration |
|
|
|
|
Short-term |
Long-term |
Total capital loss |
|
Automotive Portfolio |
$ (4,238,289) |
$ - |
$ (4,238,289) |
|
Multimedia Portfolio |
(1,873,910) |
(346,006) |
(2,219,916) |
Certain of the Funds intend to elect to defer to the fiscal year ending February 28, 2014 capital losses recognized during the period November 1, 2012 to February 28, 2013. Loss deferrals were as follows:
|
|
Capital losses |
|
Consumer Discretionary Portfolio |
$ (1,527,998) |
|
Leisure Portfolio |
381,510 |
|
Retailing Portfolio |
(4,394,939) |
The tax character of distributions paid was as follows:
|
February 28, 2013 |
Ordinary Income |
Long-term |
Total |
|
Automotive Portfolio |
$ 740,892 |
$ 99,972 |
$ 840,864 |
|
Construction and Housing Portfolio |
1,172,487 |
4,637,838 |
5,810,325 |
|
Consumer Discretionary Portfolio |
5,808,610 |
24,440,710 |
30,249,320 |
|
Leisure Portfolio |
4,448,135 |
14,222,894 |
18,671,029 |
|
Multimedia Portfolio |
3,485,896 |
- |
3,485,896 |
|
Retailing Portfolio |
3,444,682 |
12,259,653 |
15,704,335 |
Annual Report
3. Significant Accounting Policies - continued
Income Tax Information and Distributions to Shareholders - continued
|
February 29, 2012 |
Ordinary Income |
Long-term |
Total |
|
Automotive Portfolio |
$ 102,737 |
$ 9,181,063 |
$ 9,283,800 |
|
Construction and Housing Portfolio |
636,876 |
- |
636,876 |
|
Consumer Discretionary Portfolio |
5,656,448 |
3,001,413 |
8,657,861 |
|
Leisure Portfolio |
378,570 |
- |
378,570 |
|
Multimedia Portfolio |
1,167,605 |
1,177,808 |
2,345,413 |
|
Retailing Portfolio |
1,998,613 |
14,569,913 |
16,568,526 |
Trading (Redemption) Fees. Shares held by investors in the Funds less than 30 days are subject to a redemption fee equal to .75% of the net asset value of shares redeemed. All redemption fees, which reduce the proceeds of the shareholder redemption, are retained by the Funds and accounted for as an addition to paid in capital.
4. Purchases and Sales of Investments.
Purchases and sales of securities, other than short-term securities, are noted in the table below.
|
|
Purchases ($) |
Sales ($) |
|
Automotive Portfolio |
84,974,809 |
107,044,789 |
|
Construction and Housing Portfolio |
677,379,024 |
162,594,788 |
|
Consumer Discretionary Portfolio |
622,200,681 |
554,194,109 |
|
Leisure Portfolio |
346,942,435 |
450,346,664 |
|
Multimedia Portfolio |
463,910,955 |
102,139,587 |
|
Retailing Portfolio |
846,053,610 |
629,239,373 |
5. Fees and Other Transactions with Affiliates.
Management Fee. FMR and its affiliates provide the Funds with investment management related services for which the Funds pay a monthly management fee. The management fee is the sum of an individual fund fee rate and an annualized group fee rate. The individual fund fee rate is applied to each Fund's average net assets. The group fee rate is based upon the average net assets of all the mutual funds advised by FMR. The group fee rate decreases as assets under management increase and increases as assets under management decrease. For the period, each Fund's annual management fee rate expressed as a percentage of each Fund's average net assets was as follows:
|
|
Individual Rate |
Group Rate |
Total |
|
Automotive Portfolio |
.30% |
.26% |
.56% |
|
Construction and Housing Portfolio |
.30% |
.26% |
.56% |
|
Consumer Discretionary Portfolio |
.30% |
.26% |
.56% |
|
Leisure Portfolio |
.30% |
.26% |
.56% |
|
Multimedia Portfolio |
.30% |
.26% |
.56% |
|
Retailing Portfolio |
.30% |
.26% |
.56% |
Transfer Agent Fees. Fidelity Investments Institutional Operations Company, Inc. (FIIOC), an affiliate of FMR, is the Funds' transfer, dividend disbursing and shareholder servicing agent. FIIOC receives account fees and asset-based fees that vary according to account size and type of account. FIIOC pays for typesetting, printing and mailing of shareholder reports, except proxy statements. For the period, transfer agent fees were equivalent to the following annual rates expressed as a percentage of average net assets:
|
Automotive Portfolio |
.24% |
|
Construction and Housing Portfolio |
.22% |
|
Consumer Discretionary Portfolio |
.22% |
|
Leisure Portfolio |
.22% |
|
Multimedia Portfolio |
.24% |
|
Retailing Portfolio |
.23% |
Accounting and Security Lending Fees. Fidelity Service Company, Inc. (FSC), an affiliate of FMR, maintains each Fund's accounting records. The accounting fee is based on the level of average net assets for each month. Under a separate contract, FSC administers the security lending program. The security lending fee is based on the number and duration of lending transactions.
Annual Report
Notes to Financial Statements - continued
5. Fees and Other Transactions with Affiliates - continued
Brokerage Commissions. Certain Funds placed a portion of their portfolio transactions with brokerage firms which are affiliates of the investment adviser. The commissions paid to these affiliated firms were as follows:
|
|
Amount |
|
Automotive Portfolio |
$ 7,168 |
|
Construction and Housing Portfolio |
23,179 |
|
Consumer Discretionary Portfolio |
16,861 |
|
Leisure Portfolio |
16,951 |
|
Multimedia Portfolio |
16,317 |
|
Retailing Portfolio |
16,493 |
Interfund Lending Program. Pursuant to an Exemptive Order issued by the SEC, the Funds, along with other registered investment companies having management contracts with FMR, may participate in an interfund lending program. This program provides an alternative credit facility allowing the funds to borrow from, or lend money to, other participating affiliated funds. At period end, there were no interfund loans outstanding. Each applicable fund's activity in this program during the period for which loans were outstanding was as follows:
|
|
Borrower or |
Average |
Weighted |
Interest |
|
Leisure Portfolio |
Borrower |
$ 5,494,625 |
.41% |
$ 501 |
|
Retailing Portfolio |
Borrower |
8,173,000 |
.42% |
963 |
6. Committed Line of Credit.
Certain Funds participate with other funds managed by FMR or an affiliate in a $4.25 billion credit facility (the "line of credit") to be utilized for temporary or emergency purposes to fund shareholder redemptions or for other short-term liquidity purposes. The participating funds have agreed to pay commitment fees on their pro-rata portion of the line of credit, which are reflected in Miscellaneous expenses on the Statement of Operations, and are as follows:
|
Automotive Portfolio |
$ 316 |
|
Construction and Housing Portfolio |
645 |
|
Consumer Discretionary Portfolio |
799 |
|
Leisure Portfolio |
1,069 |
|
Multimedia Portfolio |
718 |
|
Retailing Portfolio |
1,286 |
During the period, there were no borrowings on this line of credit.
7. Security Lending.
Certain Funds lend portfolio securities through a lending agent from time to time in order to earn additional income. For equity securities, a lending agent is used and may loan securities to certain qualified borrowers, including Fidelity Capital Markets (FCM), a broker-dealer affiliated with the Funds. On the settlement date of the loan, each applicable Fund receives collateral (in the form of U.S. Treasury obligations, letters of credit and/or cash) against the loaned securities and maintains collateral in an amount not less than 100% of the market value of the loaned securities during the period of the loan. The market value of the loaned securities is determined at the close of business of the Funds and any additional required collateral is delivered to the Funds on the next business day. If the borrower defaults on its obligation to return the securities loaned because of insolvency or other reasons, a fund could experience delays and costs in recovering the securities loaned or in gaining access to the collateral. Any cash collateral received is invested in the Fidelity Securities Lending Cash Central Fund. The value of loaned securities and cash collateral at period end are disclosed on each applicable Fund's Statement of Assets and Liabilities. Security lending income represents the income earned on investing cash collateral, less rebates paid to borrowers and any lending agent fees associated with the loan, plus any premium payments received for lending certain types of securities. Security lending income is presented on each applicable Fund's Statement of Operations as a component of income from Fidelity Central Funds. FCM security lending activity as of and during the period was as follows:
|
|
Security Lending |
Value of Securities |
|
Automotive Portfolio |
$ - |
$ - |
|
Construction and Housing Portfolio |
203 |
- |
|
Consumer Discretionary Portfolio |
- |
- |
Annual Report
7. Security Lending - continued
|
|
Security Lending |
Value of Securities |
|
Leisure Portfolio |
$ 5,441 |
$ - |
|
Multimedia Portfolio |
25,264 |
1,632,980 |
|
Retailing Portfolio |
2,736 |
- |
8. Bank Borrowings.
Each Fund is permitted to have bank borrowings for temporary or emergency purposes to fund shareholder redemptions or for other short-term liquidity requirements. Each Fund has established borrowing arrangements with certain banks. The interest rate on the borrowings is the bank's base rate, as revised from time to time. At period end, there were no bank borrowings outstanding. Each applicable Fund's activity in this program during the period for which loans were outstanding was as follows:
|
|
Average Loan |
Weighted Average |
Interest |
|
Leisure Portfolio |
$ 2,001,750 |
.66% |
$ 147 |
9. Expense Reductions.
Many of the brokers with whom FMR places trades on behalf of certain Funds provided services to these Funds in addition to trade execution. These services included payments of expenses on behalf of each applicable Fund. In addition,through arrangements with each applicable Fund's custodian, credits realized as a result of uninvested cash balances were used to reduce each applicable Fund's expenses. All of the applicable expense reductions are noted in the table below.
|
|
Brokerage Service |
|
|
|
|
Automotive Portfolio |
$ 21,535 |
|
Construction and Housing Portfolio |
30,894 |
|
Consumer Discretionary Portfolio |
48,255 |
|
Leisure Portfolio |
52,661 |
|
Multimedia Portfolio |
24,146 |
|
Retailing Portfolio |
93,323 |
In addition, FMR reimbursed a portion of each Fund's operating expenses during the period as follows:
|
|
Reimbursement |
|
Automotive Portfolio |
$ 64 |
|
Construction and Housing Portfolio |
288 |
|
Consumer Discretionary Portfolio |
16 |
|
Leisure Portfolio |
977 |
|
Multimedia Portfolio |
97 |
|
Retailing Portfolio |
193 |
10. Other.
The Funds' organizational documents provide former and current trustees and officers with a limited indemnification against liabilities arising in connection with the performance of their duties to the Funds. In the normal course of business, the Funds may also enter into contracts that provide general indemnifications. The Funds' maximum exposure under these arrangements is unknown as this would be dependent on future claims that may be made against the Funds. The risk of material loss from such claims is considered remote.
At the end of the period, VIP FundsManager 60% Portfolio was the owner of record of approximately 33% of the total outstanding shares of Consumer Discretionary Portfolio. In addition, at the end of the period, Strategic Advisers U.S. Opportunity Fund was the owner of record of approximately 17% of the total outstanding shares of Consumer Discretionary Portfolio. Mutual funds managed by FMR or its affiliates, were the owners of record, in the aggregate, of approximately 71%, 21%, and 21% of the total outstanding shares of Consumer Discretionary Portfolio, Multimedia Portfolio, and Retailing Portfolio, respectively.
Annual Report
Report of Independent Registered Public Accounting Firm
To the Trustees of Fidelity Select Portfolios and the Shareholders of Automotive Portfolio, Construction and Housing Portfolio, Consumer Discretionary Portfolio, Leisure Portfolio, Multimedia Portfolio, and Retailing Portfolio:
In our opinion, the accompanying statements of assets and liabilities, including the schedules of investments, and the related statements of operations and of changes in net assets and the financial highlights present fairly, in all material respects, the financial positions of Automotive Portfolio, Construction and Housing Portfolio, Consumer Discretionary Portfolio, Leisure Portfolio, Multimedia Portfolio, and Retailing Portfolio (funds of Fidelity Select Portfolios) at February 28, 2013, the results of each of their operations for the year then ended, the changes in each of their net assets for each of the two years in the period then ended and the financial highlights for each of the five years in the period then ended, in conformity with accounting principles generally accepted in the United States of America. These financial statements and financial highlights (hereafter referred to as "financial statements") are the responsibility of the Fidelity Select Portfolios' management. Our responsibility is to express an opinion on these financial statements based on our audits. We conducted our audits of these financial statements in accordance with the standards of the Public Company Accounting Oversight Board (United States). Those standards require that we plan and perform the audit to obtain reasonable assurance about whether the financial statements are free of material misstatement. An audit includes examining, on a test basis, evidence supporting the amounts and disclosures in the financial statements, assessing the accounting principles used and significant estimates made by management, and evaluating the overall financial statement presentation. We believe that our audits, which included confirmation of securities at February 28, 2013 by correspondence with the custodian and brokers, provide a reasonable basis for our opinion.
PricewaterhouseCoopers LLP
Boston, Massachusetts
April 16, 2013
Annual Report
Trustees and Officers
The Trustees, Members of the Advisory Board, and executive officers of the trust and funds, as applicable, are listed below. The Board of Trustees governs each fund and is responsible for protecting the interests of shareholders. The Trustees are experienced executives who meet periodically throughout the year to oversee each fund's activities, review contractual arrangements with companies that provide services to each fund, oversee management of the risks associated with such activities and contractual arrangements, and review each fund's performance. Except for James C. Curvey, each of the Trustees oversees 234 Fidelity funds. Mr. Curvey oversees 453 Fidelity funds.
The Trustees hold office without limit in time except that (a) any Trustee may resign; (b) any Trustee may be removed by written instrument, signed by at least two-thirds of the number of Trustees prior to such removal; (c) any Trustee who requests to be retired or who has become incapacitated by illness or injury may be retired by written instrument signed by a majority of the other Trustees; and (d) any Trustee may be removed at any special meeting of shareholders by a two-thirds vote of the outstanding voting securities of the trust. Each Trustee who is not an interested person of the trust and the funds (as defined in the 1940 Act) (Independent Trustee), shall retire not later than the last day of the calendar year in which his or her 75th birthday occurs. The Independent Trustees may waive this mandatory retirement age policy with respect to individual Trustees. The executive officers and Advisory Board Members hold office without limit in time, except that any officer and Advisory Board Member may resign or may be removed by a vote of a majority of the Trustees at any regular meeting or any special meeting of the Trustees. Except as indicated, each individual has held the office shown or other offices in the same company for the past five years.
Experience, Skills, Attributes, and Qualifications of the Funds' Trustees. The Governance and Nominating Committee has adopted a statement of policy that describes the experience, qualifications, attributes, and skills that are necessary and desirable for potential Independent Trustee candidates (Statement of Policy). The Board believes that each Trustee satisfied at the time he or she was initially elected or appointed a Trustee, and continues to satisfy, the standards contemplated by the Statement of Policy. The Governance and Nominating Committee also engages professional search firms to help identify potential Independent Trustee candidates who have the experience, qualifications, attributes, and skills consistent with the Statement of Policy. From time to time, additional criteria based on the composition and skills of the current Independent Trustees, as well as experience or skills that may be appropriate in light of future changes to board composition, business conditions, and regulatory or other developments, have also been considered by the professional search firms and the Governance and Nominating Committee. In addition, the Board takes into account the Trustees' commitment and participation in Board and committee meetings, as well as their leadership of standing and ad hoc committees throughout their tenure.
In determining that a particular Trustee was and continues to be qualified to serve as a Trustee, the Board has considered a variety of criteria, none of which, in isolation, was controlling. The Board believes that, collectively, the Trustees have balanced and diverse experience, qualifications, attributes, and skills, which allow the Board to operate effectively in governing each fund and protecting the interests of shareholders. Information about the specific experience, skills, attributes, and qualifications of each Trustee, which in each case led to the Board's conclusion that the Trustee should serve (or continue to serve) as a trustee of the funds, is provided below.
Board Structure and Oversight Function. James C. Curvey is an interested person (as defined in the 1940 Act) and currently serves as Chairman. The Trustees have determined that an interested Chairman is appropriate and benefits shareholders because an interested Chairman has a personal and professional stake in the quality and continuity of services provided to the funds. Independent Trustees exercise their informed business judgment to appoint an individual of their choosing to serve as Chairman, regardless of whether the Trustee happens to be independent or a member of management. The Independent Trustees have determined that they can act independently and effectively without having an Independent Trustee serve as Chairman and that a key structural component for assuring that they are in a position to do so is for the Independent Trustees to constitute a substantial majority for the Board. The Independent Trustees also regularly meet in executive session. Ned C. Lautenbach serves as Chairman of the Independent Trustees and as such (i) acts as a liaison between the Independent Trustees and management with respect to matters important to the Independent Trustees and (ii) with management prepares agendas for Board meetings.
Fidelity funds are overseen by different Boards of Trustees. The funds' Board oversees Fidelity's equity and high income funds and another Board oversees Fidelity's investment-grade bond, money market, and asset allocation funds. The asset allocation funds may invest in Fidelity funds overseen by the funds' Board. The use of separate Boards, each with its own committee structure, allows the Trustees of each group of Fidelity funds to focus on the unique issues of the funds they oversee, including common research, investment, and operational issues. On occasion, the separate Boards establish joint committees to address issues of overlapping consequences for the Fidelity funds overseen by each Board.
The Trustees operate using a system of committees to facilitate the timely and efficient consideration of all matters of importance to the Trustees, each fund, and fund shareholders and to facilitate compliance with legal and regulatory requirements and oversight of the funds' activities and associated risks. The Board, acting through its committees, has charged FMR and its affiliates with (i) identifying events or circumstances the occurrence of which could have demonstrably adverse effects on the funds' business and/or reputation; (ii) implementing processes and controls to lessen the possibility that such events or circumstances occur or to mitigate the effects of such events or circumstances if they do occur; and (iii) creating and maintaining a system designed to evaluate continuously business and market conditions in order to facilitate the identification and implementation processes described in (i) and (ii) above. Because the day-to-day operations and activities of the funds are carried out by or through FMR, its affiliates and other service providers, the funds' exposure to risks is mitigated but not eliminated by the processes overseen by the Trustees. While each of the Board's committees has responsibility for overseeing different aspects of the funds' activities, oversight is exercised primarily through the Operations, Audit, and Compliance Committees. In addition, the Independent Trustees have worked with FMR to enhance the Board's oversight of investment and financial risks, legal and regulatory risks, technology risks, and operational risks, including the development of additional risk reporting to the Board. For example, a working group comprised of Independent Trustees and FMR has worked and continues to work to review the Fidelity funds' valuation-related activities, reporting and risk management. Appropriate personnel, including but not limited to the funds' Chief Compliance Officer (CCO), FMR's internal auditor, the independent accountants, the funds' Treasurer and portfolio management personnel, make periodic reports to the Board's committees, as appropriate, including an annual review of FMR's risk management program for the Fidelity funds. The responsibilities of each standing committee, including their oversight responsibilities, are described further under "Standing Committees of the Funds' Trustees."
Annual Report
Trustees and Officers - continued
The funds' Statement of Additional Information (SAI) includes more information about the Trustees. To request a free copy, call Fidelity at 1-800-544-8544.
Interested Trustees*:
Correspondence intended for each Trustee who is an interested person may be sent to Fidelity Investments, 245 Summer Street, Boston, Massachusetts 02210.
|
Name, Year of Birth; Principal Occupations and Other Relevant Experience+ |
|
|
James C. Curvey (1935) |
|
|
|
Year of Election or Appointment: 2007 Mr. Curvey is Trustee and Chairman of the Board of Trustees of certain Trusts. Mr. Curvey also serves as Trustee (2007-present) of other investment companies advised by FMR. Mr. Curvey is a Director of Fidelity Investments Money Management, Inc. (2009-present), Director of Fidelity Research & Analysis Co. (2009-present) and Director of FMR and FMR Co., Inc. (2007-present). Mr. Curvey is also Vice Chairman (2007-present) and Director of FMR LLC. In addition, Mr. Curvey serves as an Overseer for the Boston Symphony Orchestra and a member of the Trustees of Villanova University. Previously, Mr. Curvey was the Vice Chairman (2006-2007) and Director (2000-2007) of FMR Corp. |
|
Ronald P. O'Hanley (1957) |
|
|
|
Year of Election or Appointment: 2011 Mr. O'Hanley is Director of FMR Co., Inc. (2010-present), Director of Fidelity Investments Money Management, Inc. (2010-present), Director of Fidelity Research & Analysis Company (2010-present), President of Fidelity Asset Management and Corporate Services and a member of Fidelity's Executive Committee (2010-present). Previously, Mr. O'Hanley served as President and Chief Executive Officer of BNY Mellon Asset Management (2007-2010). Mr. O'Hanley also served as Vice Chairman of Bank New York Mellon Corp. and a member of that firm's Executive Committee. Prior to the 2007 merger of The Bank of New York and Mellon Financial Corporation, he was Vice Chairman of Mellon Financial Corporation and President and Chief Executive Officer of Mellon Asset Management. He joined Mellon in February 1997. Mr. O'Hanley currently serves as Chairman of the Boston Public Library Foundation Board of Directors and sits on the Board of Directors of Beth Israel Deaconess Medical Center, the Board of Trustees of the Marine Biological Laboratory and the Advisory Board of the Maxwell School of Citizenship and Public Administration at Syracuse University. Mr. O'Hanley also chairs the Council on Asset Management for the Financial Services Roundtable and is a member of the Board of Directors of Institutional Investor's U.S. Institute. |
* Trustees have been determined to be "Interested Trustees" by virtue of, among other things, their affiliation with the trust or various entities under common control with FMR.
+ The information above includes each Trustee's principal occupation during the last five years and other information relating to the experience, attributes, and skills relevant to each Trustee's qualifications to serve as a Trustee, which led to the conclusion that each Trustee should serve as a Trustee for each fund.
Independent Trustees:
Correspondence intended for each Independent Trustee (that is, the Trustees other than the Interested Trustees) may be sent to Fidelity Investments, P.O. Box 55235, Boston, Massachusetts 02205-5235.
|
Name, Year of Birth; Principal Occupations and Other Relevant Experience+ |
|
|
Dennis J. Dirks (1948) |
|
|
|
Year of Election or Appointment: 2005 Prior to his retirement in May 2003, Mr. Dirks was Chief Operating Officer and a member of the Board of The Depository Trust & Clearing Corporation (DTCC). He also served as President, Chief Operating Officer, and Board member of The Depository Trust Company (DTC) and President and Board member of the National Securities Clearing Corporation (NSCC). In addition, Mr. Dirks served as Chief Executive Officer and Board member of the Government Securities Clearing Corporation, Chief Executive Officer and Board member of the Mortgage-Backed Securities Clearing Corporation, as a Trustee and a member of the Finance Committee of Manhattan College (2005-2008), and as a Trustee and a member of the Finance Committee of AHRC of Nassau County (2006-2008). Mr. Dirks is a member of the Independent Directors Council (IDC) Governing Council (2010-present) and Board of Directors for The Brookville Center for Children's Services, Inc. (2009-present). |
|
Alan J. Lacy (1953) |
|
|
|
Year of Election or Appointment: 2008 Mr. Lacy serves as Senior Adviser (2007-present) of Oak Hill Capital Partners, L.P. (private equity). Mr. Lacy also served as Chief Executive Officer (2000-2005) and Vice Chairman (2005-2006) of Sears Holdings Corporation and Sears, Roebuck and Co. (retail). In addition, Mr. Lacy serves as a member of the Board of Directors of Dave & Buster's Entertainment, Inc. (restaurant and entertainment complexes, 2010-present), Earth Fare, Inc. (retail grocery, 2012-present), The Hillman Companies, Inc. (hardware wholesalers, 2010-present), and Bristol-Myers Squibb Company (global pharmaceuticals, 2008-present). Mr. Lacy is a member of the Board of Trustees of The National Parks Conservation Association (2006-present). Previously, Mr. Lacy served as Chairman of the Board of Trustees of the National Parks Conservation Association (2008-2011) and as a member of the Board of Directors for the Western Union Company (global money transfer, 2006-2011). |
|
Ned C. Lautenbach (1944) |
|
|
|
Year of Election or Appointment: 2000 Mr. Lautenbach is Chairman of the Independent Trustees of the Equity and High Income Funds (2006-present). Mr. Lautenbach currently serves as the Lead Director of the Eaton Corporation Board of Directors (diversified industrial, 1997-present). Mr. Lautenbach is Chairman of the Board of Directors of the Philharmonic Center for the Arts in Naples, Florida (2012-present) and a member of the Council on Foreign Relations (1994-present). Previously, Mr. Lautenbach was a Partner/Advisory Partner at Clayton, Dubilier & Rice, LLC (private equity investment, 1998-2010), as well as a Director of Sony Corporation (2006-2007). |
|
Joseph Mauriello (1944) |
|
|
|
Year of Election or Appointment: 2008 Prior to his retirement in January 2006, Mr. Mauriello served in numerous senior management positions including Deputy Chairman and Chief Operating Officer (2004-2005), and Vice Chairman of Financial Services (2002-2004) of KPMG LLP US (professional services, 1965-2005). Mr. Mauriello currently serves as a member of the Board of Directors of XL Group plc. (global insurance and re-insurance, 2006-present). Previously, Mr. Mauriello served as a Director of the Hamilton Funds of the Bank of New York (2006-2007) and of Arcadia Resources Inc. (health care services and products, 2007-2012). |
|
Robert W. Selander (1950) |
|
|
|
Year of Election or Appointment: 2011 Previously, Mr. Selander served as a Member of the Advisory Board of Fidelity's Equity and High Income Funds (2011), Executive Vice Chairman (2010), Chief Executive Officer (2009-2010), and President and Chief Executive Officer (1997-2009) of Mastercard, Inc. |
|
Cornelia M. Small (1944) |
|
|
|
Year of Election or Appointment: 2005 Ms. Small is a member of the Board of Directors (2009-present) and Chair of the Investment Committee (2010-present) of the Teagle Foundation. Ms. Small also serves on the Investment Committee of the Berkshire Taconic Community Foundation (2008-present). Previously, Ms. Small served as Chairperson (2002-2008) and a member of the Investment Committee and Chairperson (2008-2012) and a member of the Board of Trustees of Smith College. In addition, Ms. Small served as Chief Investment Officer, Director of Global Equity Investments, and a member of the Board of Directors of Scudder, Stevens & Clark and Scudder Kemper Investments. |
|
William S. Stavropoulos (1939) |
|
|
|
Year of Election or Appointment: 2001 Mr. Stavropoulos is Vice Chairman of the Independent Trustees of the Equity and High Income Funds (2006-present). Mr. Stavropoulos serves as President and Founder of the Michigan Baseball Foundation, the Great Lakes Loons (2007-present). Mr. Stavropoulos is Chairman Emeritus of the Board of Directors of The Dow Chemical Company, where he previously served in numerous senior management positions, including President, CEO (1995-2000; 2002-2004), Chairman of the Executive Committee (2000-2006), and as a member of the Board of Directors (1990-2006). Currently, Mr. Stavropoulos is a Director of Univar Inc. (global distributor of commodity and specialty chemicals, Chairman from 2010-May 2012 and Lead Director from May 2012-present), Teradata Corporation (data warehousing and technology solutions, 2008-present), Maersk Inc. (industrial conglomerate), and Tyco International, Ltd. (multinational manufacturing and services, 2007-present), and a member of the Advisory Board for Metalmark Capital LLC (private equity investment, 2005-present). Mr. Stavropoulos is an operating advisor to Clayton, Dubilier & Rice, LLC (private equity investment). In addition, Mr. Stavropoulos is a member of the University of Notre Dame Advisory Council for the College of Science, a Trustee of the Rollin L. Gerstacker Foundation, and a Director of the Naples Philharmonic Center for the Arts. Previously, Mr. Stavropoulos served as a Director of Chemical Financial Corporation (bank holding company, 1993-2012). |
|
David M. Thomas (1949) |
|
|
|
Year of Election or Appointment: 2008 |
|
Michael E. Wiley (1950) |
|
|
|
Year of Election or Appointment: 2008 Mr. Wiley also serves as a Director of Asia Pacific Exploration Consolidated (international oil and gas exploration and production, 2008-present). Mr. Wiley serves as a Director of Tesoro Corporation (independent oil refiner and marketer, 2005-present), and a Director of Bill Barrett Corporation (exploration and production, 2005-present). In addition, Mr. Wiley also serves as a Director of Post Oak Bank (privately-held bank, 2004-present). Previously, Mr. Wiley served as a member of the Board of Trustees of the University of Tulsa (2000-2006; 2007-2010), as a Senior Energy Advisor of Katzenbach Partners, LLC (consulting, 2006-2007), as an Advisory Director of Riverstone Holdings (private investment), Chairman, President, and CEO of Baker Hughes, Inc. (oilfield services, 2000-2004), and as Director of Spinnaker Exploration Company (exploration and production, 2001-2005). |
+ The information above includes each Trustee's principal occupation during the last five years and other information relating to the experience, attributes, and skills relevant to each Trustee's qualifications to serve as a Trustee, which led to the conclusion that each Trustee should serve as a Trustee for each fund.
Advisory Board Members and Executive Officers:
Correspondence intended for David A. Rosow and Garnett A. Smith may be sent to Fidelity Investments, P.O. Box 55235, Boston, Massachusetts 02205-5235. Correspondence intended for each executive officer and Peter S. Lynch may be sent to Fidelity Investments, 245 Summer Street, Boston, Massachusetts 02210.
|
Name, Year of Birth; Principal Occupation |
|
|
Peter S. Lynch (1944) |
|
|
|
Year of Election or Appointment: 2003 Member of the Advisory Board of Fidelity's Equity and High Income Funds. Mr. Lynch is Vice Chairman and a Director of FMR and FMR Co., Inc. In addition, Mr. Lynch serves as a Trustee of Boston College and as the Chairman of the Inner-City Scholarship Fund. Previously, Mr. Lynch served on the Special Olympics International Board of Directors (1997-2006). |
|
David A. Rosow (1942) |
|
|
|
Year of Election or Appointment: 2012 Member of the Advisory Board of Fidelity's Equity and High Income Funds. Chairman and Chief Executive Officer of International Golf Group, Inc. (golf course development, 1989-present). Previously, Mr. Rosow served as Chairman and Chief Executive Officer of Rosow & Company, Inc. (private investment company, 1989-2011), a Lead Director of Hudson United Bancorp (2001-2006) and as a Director of TD Banknorth (1996-2006). In addition, Mr. Rosow is a member (2008-present) and President (2009-present) of the Town Council of Palm Beach, Florida. |
|
Garnett A. Smith (1947) |
|
|
|
Year of Election or Appointment: 2012 Member of the Advisory Board of Fidelity's Equity and High Income Funds. Prior to Mr. Smith's retirement, he served as Chairman and Chief Executive Officer of Inbrand Corp. (manufacturer of personal absorbent products, 1990-1997). He also served as President (1986-1990) of Inbrand Corp. Prior to his employment with Inbrand Corp., he was employed by a retail fabric chain and North Carolina National Bank. In addition, Mr. Smith is a board member of the Jackson Hole Land Trust (2009-present). |
|
Kenneth B. Robins (1969) |
|
|
|
Year of Election or Appointment: 2008 President and Treasurer of Fidelity's Equity and High Income Funds. Mr. Robins also serves as President and Treasurer (2010-present) and Assistant Treasurer (2009-present) of other Fidelity funds and is an employee of Fidelity Investments (2004-present). Previously, Mr. Robins served as Deputy Treasurer of the Fidelity funds (2005-2008) and Treasurer and Chief Financial Officer of The North Carolina Capital Management Trust: Cash and Term Portfolios (2006-2008). |
|
Brian B. Hogan (1964) |
|
|
|
Year of Election or Appointment: 2009 Vice President of Equity and High Income Funds. Mr. Hogan also serves as President of FMR's Equity Division (2009-present). Previously, Mr. Hogan served as Senior Vice President, Equity Research of FMR (2006-2009) and as a portfolio manager. |
|
Christopher S. Bartel (1971) |
|
|
|
Year of Election or Appointment: 2009 Vice President of Fidelity's Sector and Real Estate Equity Funds. Mr. Bartel also serves as a Director, President, and Chief Executive Officer of Fidelity Management & Research (Japan) Inc. (2012-present), a Director of Fidelity Management & Research (Hong Kong) (2012-present), and Senior Vice President of Global Equity Research (2010-present). Previously, Mr. Bartel served as Senior Vice President of Equity Research (2009-2010), Managing Director of Research (2006-2009), and an analyst and portfolio manager (2000-2006). |
|
Scott C. Goebel (1968) |
|
|
|
Year of Election or Appointment: 2008 Secretary and Chief Legal Officer (CLO) of the Fidelity funds. Mr. Goebel also serves as Secretary of Fidelity Investments Money Management, Inc. (FIMM) (2010-present) and Fidelity Research and Analysis Company (FRAC) (2010-present); Secretary and CLO of The North Carolina Capital Management Trust: Cash and Term Portfolios (2008-present); General Counsel, Secretary, and Senior Vice President of FMR (2008-present) and FMR Co., Inc. (2008-present); employed by FMR LLC or an affiliate (2001-present); Chief Legal Officer of Fidelity Management & Research (Hong Kong) Limited (2008-present) and Assistant Secretary of Fidelity Management & Research (Japan) Inc. (2008-present), and Fidelity Management & Research (U.K.) Inc. (2008-present). Previously, Mr. Goebel served as Assistant Secretary of FIMM (2008-2010), FRAC (2008-2010), and the Funds (2007-2008) and as Vice President and Secretary of Fidelity Distributors Corporation (FDC) (2005-2007). |
|
William C. Coffey (1969) |
|
|
|
Year of Election or Appointment: 2009 Assistant Secretary of Fidelity's Equity and High Income Funds. Mr. Coffey also serves as Senior Vice President and Deputy General Counsel of FMR LLC (2010-present), and is an employee of Fidelity Investments. Previously, Mr. Coffey served as Vice President and Associate General Counsel of FMR LLC (2005-2009). |
|
Elizabeth Paige Baumann (1968) |
|
|
|
Year of Election or Appointment: 2012 Anti-Money Laundering (AML) Officer of the Fidelity funds. Ms. Baumann also serves as AML Officer of The North Carolina Capital Management Trust: Cash and Term Portfolios (2012-present), Chief AML Officer of FMR LLC (2012-present), and is an employee of Fidelity Investments. Previously, Ms. Baumann served as Vice President and Deputy Anti-Money Laundering Officer (2007-2012). |
|
Christine Reynolds (1958) |
|
|
|
Year of Election or Appointment: 2008 Chief Financial Officer of the Fidelity funds. Ms. Reynolds became President of Fidelity Pricing and Cash Management Services (FPCMS) in August 2008. Ms. Reynolds served as Chief Operating Officer of FPCMS (2007-2008). Previously, Ms. Reynolds served as President, Treasurer, and Anti-Money Laundering officer of the Fidelity funds (2004-2007). |
|
Joseph A. Hanlon (1968) |
|
|
|
Year of Election or Appointment: 2012 Chief Compliance Officer of Fidelity's Equity and High Income Funds. Mr. Hanlon serves as Compliance Officer of FMR, FMR Co., Inc., Fidelity Investments Money Management, Inc. (FIMM), Fidelity Research and Analysis Company (FRAC), Fidelity Management & Research (Japan) Inc., Fidelity Management & Research (U.K.) Inc., Fidelity Management & Research (Hong Kong), and Strategic Advisers, Inc. (2009-present), as Senior Vice President of the Fidelity Asset Management Division (2009-present), and is an employee of Fidelity Investments. |
|
Joseph F. Zambello (1957) |
|
|
|
Year of Election or Appointment: 2011 Deputy Treasurer of the Fidelity funds. Mr. Zambello is an employee of Fidelity Investments. Previously, Mr. Zambello served as Vice President of FMR's Program Management Group (2009-2011) and Vice President of the Transfer Agent Oversight Group (2005-2009). |
|
Adrien E. Deberghes (1967) |
|
|
|
Year of Election or Appointment: 2008 Deputy Treasurer of Fidelity's Equity and High Income Funds. Mr. Deberghes also serves as Vice President (2011-present) and Assistant Treasurer (2010-present) of other Fidelity funds, and is an employee of Fidelity Investments (2008-present). Previously, Mr. Deberghes served as Senior Vice President of Mutual Fund Administration at State Street Corporation (2007-2008), Senior Director of Mutual Fund Administration at Investors Bank & Trust (2005-2007), and Director of Finance for Dunkin' Brands (2000-2005). |
|
Stephen Sadoski (1971) |
|
|
|
Year of Election or Appointment: 2012 Deputy Treasurer of Fidelity's Equity and High Income Funds. Mr. Sadoski also serves as Deputy Treasurer of other Fidelity funds (2013-present) and is an employee of Fidelity Investments (2012-present). Previously, Mr. Sadoski served as Assistant Treasurer of Fidelity's Fixed Income and Asset Allocation Funds (2012-2013), an assistant chief accountant in the Division of Investment Management of the Securities and Exchange Commission (SEC) (2009-2012) and as a senior manager at Deloitte & Touche (1997-2009). |
|
Stacie Smith (1974) |
|
|
|
Year of Election or Appointment: 2013 Deputy Treasurer of Fidelity's Equity and High Income Funds. Ms. Smith is an employee of Fidelity Investments (2009-present). Previously, Ms. Smith served as Senior Audit Manager of Ernst & Young LLP (1996-2009). |
|
Stephanie J. Dorsey (1969) |
|
|
|
Year of Election or Appointment: 2010 Assistant Treasurer of Fidelity's Equity and High Income Funds. Ms. Dorsey also serves as President and Treasurer (2013-present) and Assistant Treasurer (2012-present) of other Fidelity funds and is an employee of Fidelity Investments (2008-present). Previously, Ms. Dorsey served as Deputy Treasurer of Fidelity's Fixed Income and Asset Allocation Funds (2008-2013), Treasurer (2004-2008) of the JPMorgan Mutual Funds and Vice President (2004-2008) of JPMorgan Chase Bank. |
|
John R. Hebble (1958) |
|
|
|
Year of Election or Appointment: 2009 Assistant Treasurer of Fidelity's Equity and High Income Funds. Mr. Hebble also serves as President (2011-present), Treasurer, and Chief Financial Officer of The North Carolina Capital Management Trust: Cash and Term Portfolios (2008-present) and is an employee of Fidelity Investments. Previously, Mr. Hebble served as President and Treasurer of Fidelity's Fixed Income and Asset Allocation Funds (2008-2013). |
|
Gary W. Ryan (1958) |
|
|
|
Year of Election or Appointment: 2005 Assistant Treasurer of the Fidelity funds. Mr. Ryan is an employee of Fidelity Investments. Previously, Mr. Ryan served as Vice President of Fund Reporting in Fidelity Pricing and Cash Management Services (FPCMS) (1999-2005). |
|
Jonathan Davis (1968) |
|
|
|
Year of Election or Appointment: 2010 Assistant Treasurer of the Fidelity funds. Mr. Davis is also Assistant Treasurer of Fidelity Rutland Square Trust II and Fidelity Commonwealth Trust II. Mr. Davis is an employee of Fidelity Investments. Previously, Mr. Davis served as Vice President and Associate General Counsel of FMR LLC (2003-2010). |
Annual Report
Distributions (Unaudited)
The Board of Trustees of each fund voted to pay to shareholders of record at the opening of business on record date, the following distributions per share derived from capital gains realized from sales of portfolio securities, and dividends derived from net investment income:
|
|
Pay Date |
Record Date |
Dividends |
Capital Gains |
|
Automotive Portfolio |
04/15/13 |
04/12/13 |
$0.000 |
$0.000 |
|
Construction and Housing Portfolio |
04/15/13 |
04/12/13 |
$0.009 |
$0.287 |
|
Consumer Discretionary Portfolio |
04/15/13 |
04/12/13 |
$0.005 |
$0.159 |
|
Leisure Portfolio |
04/15/13 |
04/12/13 |
$0.316 |
$3.451 |
|
Multimedia Portfolio |
04/15/13 |
04/12/13 |
$0.000 |
$0.000 |
|
Retailing Portfolio |
04/15/13 |
04/12/13 |
$0.027 |
$0.018 |
The funds hereby designate as capital gain dividend the amounts noted below for the taxable year ended February 28, 2013, or, if subsequently determined to be different, the net capital gain of such year.
|
Construction and Housing Portfolio |
$5,135,537 |
|
Consumer Discretionary Portfolio |
$27,106,786 |
|
Leisure Portfolio |
$30,265,890 |
|
Retailing Portfolio |
$12,649,289 |
A percentage of the dividends distributed during the fiscal year for the following funds qualifies for the dividends-received deduction for corporate shareholders:
|
|
April 2012 |
December 2012 |
|
Automotive Portfolio |
0% |
95% |
|
Construction and Housing Portfolio |
0% |
100% |
|
Consumer Discretionary Portfolio |
96% |
58% |
|
Leisure Portfolio |
100% |
100% |
|
Multimedia Portfolio |
0% |
100% |
|
Retailing Portfolio |
100% |
100% |
A percentage of the dividends distributed during the fiscal year for the following funds may be taken into account as a dividend for purposes of the maximum rate under section 1(h)(11) of the Internal Revenue Code.
|
|
April 2012 |
December 2012 |
|
Automotive Portfolio |
0% |
100% |
|
Construction and Housing Portfolio |
0% |
100% |
|
Consumer Discretionary Portfolio |
97% |
59% |
|
Leisure Portfolio |
100% |
100% |
|
Multimedia Portfolio |
0% |
100% |
|
Retailing Portfolio |
100% |
100% |
The funds will notify shareholders in January 2014 of amounts for use in preparing 2013 income tax returns.
Annual Report
Board Approval of Investment Advisory Contracts and Management Fees
Automotive Portfolio
Construction and Housing Portfolio
Consumer Discretionary Portfolio
Leisure Portfolio
Multimedia Portfolio
Retailing Portfolio
On November 14, 2012, the Board of Trustees, including the Independent Trustees (together, the Board), voted to approve a new management contract (the New Contracts) between each fund and Fidelity SelectCo, LLC (SelectCo) and to submit the New Contracts to shareholders for their approval. If the New Contracts are approved by shareholders, effective August 1, 2013, SelectCo will serve as investment adviser to each fund. The terms of the New Contracts are identical to those of the current management contracts with FMR (the Current Contracts), except with respect to the name of the investment adviser and the dates of execution and the initial two-year term of the contract. The Board, assisted by the advice of fund counsel and Independent Trustees' counsel, considered a broad range of information.
In determining whether to approve the New Contracts for the funds, the Board was aware that shareholders in the funds have a broad range of investment choices available to them, including a wide choice among mutual funds offered by competitors to Fidelity, and that each fund's shareholders, with the opportunity to review and weigh the disclosure provided by the fund in its prospectus and other public disclosures, have chosen to invest in the fund, managed by Fidelity.
Nature, Extent, and Quality of Services Provided. The Board considered the nature, quality, cost and extent of the services to be provided by SelectCo under the New Contracts as well as the nature, quality, cost and extent of the advisory, administrative, distribution and shareholder services performed by the FMR and the sub-advisers, and by affiliated companies. The Board considered that, upon shareholder approval, SelectCo will render the same services to the funds under the New Contracts that FMR currently renders to the funds under the Current Contracts. The Board also considered that the New Contracts would not result in any changes to (i) the investment process or strategies employed in the management of the funds' assets or (ii) the day-to-day management of the funds or the persons primarily responsible for such management.
Throughout the year, the Trustees had discussions with FMR about plans to establish SelectCo as a new investment adviser to manage sector-based funds and products. The Trustees considered Fidelity's rationale for creating a separate investment adviser and noted that a separate investment adviser may be better positioned to focus on opportunities for growth within the sector investing space and to focus on a distinct approach to sector investing and research.
Shareholder and Administrative Services. The Board noted that the growth of fund assets across the complex allows Fidelity to reinvest in the development of services designed to enhance the value or convenience of the Fidelity funds as investment vehicles. These services include 24-hour access to account information and market information through phone representatives and over the Internet, and investor education materials and asset allocation tools.
Investment in a Large Fund Family. The Board considered the benefits to shareholders of investing in a Fidelity fund, including the benefits of investing in a fund that is part of a large family of funds offering a variety of investment disciplines and providing for a large variety of mutual fund shareholder services.
Investment Performance. The Board did not consider performance to be a material factor in its decision to approve the New Contracts because the New Contracts would not result in any changes to the funds' investment processes or strategies or in the persons primarily responsible for the day-to-day management of the funds.
Based on its review, the Board concluded that the nature, extent, and quality of the services provided to each fund will benefit the fund's shareholders, particularly in light of the Board's view that the fund's shareholders benefit from investing in a fund that is part of a large family of funds offering a variety of investment disciplines and services.
Competitiveness of Management Fee and Total Fund Expenses. The Board considered that, if approved by shareholders, the New Contracts would not result in any changes to the amount of the management fees paid by the funds, except that such fees would be paid to SelectCo rather than FMR. The Board noted that at previous meetings during the year it received and considered materials relating to its review of the management fee of each fund. This information includes comparisons that focus on a fund's standing relative to the total universe of comparable funds available to investors in terms of gross management fees before expense reimbursements or caps, as well as a fund's standing relative to non-Fidelity funds similar in size to the fund within the comparison group.
Based on its review, the Board concluded that each fund's management fee was fair and reasonable in light of the services that the fund receives and the other factors considered.
Annual Report
Because there are no expected changes in the funds' management fees under the New Contracts, the Board will review each fund's total expenses compared to competitive fund median expenses in connection with its future consideration of the renewal of the funds' management contracts and sub-advisory agreements.
In its review of total expenses, the Board also noted that at previous meetings during the year it received and considered materials relating to its review of total expenses for each Fidelity fund. This information includes Fidelity fee structures and other information with respect to clients of FMR and its affiliates, such as other mutual funds advised or sub-advised by FMR or its affiliates, pension plan clients, and other institutional clients.
Costs of the Services and Profitability. Because there were no changes to the services to be provided or fees to be charged to the funds under the New Contracts, the Board did not consider data regarding the impact on Fidelity's costs of services, revenues, or profitability from the new arrangements to be a significant factor in its decision.
In connection with its future consideration of the renewal of each fund's management contract and sub-advisory agreements, the Board will consider the revenues earned and the expenses incurred by Fidelity in conducting the business of developing, marketing, distributing, managing, administering and servicing the funds and their shareholders.
Economies of Scale. The Board recognized that the New Contracts, like the Current Contracts, incorporate a "group fee" structure, which provides for lower fee rates as total fund assets under FMR's management increase, and for higher fee rates as total fund assets under FMR's management decrease. The Board considered that the group fee is designed to deliver the benefits of economies of scale to fund shareholders when total fund assets increase, even if assets of any particular fund are unchanged or have declined, because some portion of Fidelity's costs are attributable to services provided to all Fidelity funds, and all funds benefit if those costs can be allocated among more assets. The Board concluded that, given the group fee structure, fund shareholders will achieve a certain level of economies of scale as assets under FMR's management increase at the fund complex level, regardless of whether Fidelity achieves any such economies of scale.
In connection with its future consideration of the renewal of each fund's management contract and sub-advisory agreements, the Board will consider whether there have been economies of scale in respect of the management of the Fidelity funds, whether the Fidelity funds (including the funds) have appropriately benefited from any such economies of scale, and whether there is potential for realization of any further economies of scale.
Based on its evaluation of all of the conclusions noted above, and after considering all material factors, the Board ultimately concluded that each New Contract is fair and reasonable, and that the New Contracts should be approved and submitted to the applicable funds' shareholders for their approval.
Annual Report
Investment Adviser
Fidelity Management & Research Company
Boston, MA
Investment Sub-Advisers
FMR Co., Inc.
Fidelity Management & Research
(U.K.) Inc.
Fidelity Management & Research
(Hong Kong) Limited
Fidelity Management & Research
(Japan) Inc.
General Distributor
Fidelity Distributors Corporation
Smithfield, RI
Transfer and Service Agents
Fidelity Investments Institutional Operations Company, Inc.
Boston, MA
Fidelity Service Company, Inc.
Boston, MA
Custodian
Brown Brothers Harriman & Co.
Boston, MA
Corporate Headquarters
245 Summer Street
Boston, MA 02210
1-800-544-8888
The Fidelity Telephone Connection
Mutual Fund 24-Hour Service
Exchanges/Redemptions
and Account Assistance 1-800-544-6666
Product Information 1-800-544-8888
Retirement Accounts 1-800-544-4774
(8 a.m. - 9 p.m.)
TDD Service 1-800-544-0118
for the deaf and hearing impaired
(9 a.m. - 9 p.m. Eastern time)
Fidelity Automated Service
Telephone (FAST®) 
1-800-544-5555
Automated line for quickest service

SELCON-UANNPRO-0413
1.910417.103
Fidelity®
Select Portfolios®
Financials Sector
Banking Portfolio
Brokerage and Investment Management Portfolio
Consumer Finance Portfolio
Financial Services Portfolio
Insurance Portfolio
Annual Report
February 28, 2013
(Fidelity Cover Art)
Contents
|
Shareholder Expense Example |
|
|
|
Banking Portfolio |
Performance |
|
|
|
Management's Discussion |
|
|
|
Investment Changes |
|
|
|
Investments |
|
|
|
Financial Statements |
|
|
Brokerage and Investment |
Performance |
|
|
|
Management's Discussion |
|
|
|
Investment Changes |
|
|
|
Investments |
|
|
|
Financial Statements |
|
|
Consumer Finance Portfolio |
Performance |
|
|
|
Management's Discussion |
|
|
|
Investment Changes |
|
|
|
Investments |
|
|
|
Financial Statements |
|
|
Financial Services Portfolio |
Performance |
|
|
|
Management's Discussion |
|
|
|
Investment Changes |
|
|
|
Investments |
|
|
|
Financial Statements |
|
|
Insurance Portfolio |
Performance |
|
|
|
Management's Discussion |
|
|
|
Investment Changes |
|
|
|
Investments |
|
|
|
Financial Statements |
|
|
Notes to Financial Statements |
|
|
|
Report of Independent Registered Public Accounting Firm |
|
|
|
Trustees and Officers |
|
|
|
Distributions |
|
|
|
Board Approval of Investment Advisory Contracts and Management Fees |
|
To view a fund's proxy voting guidelines and proxy voting record for the 12-month period ended June 30, visit http://www.fidelity.com/proxyvotingresults or visit the Securities and Exchange Commission's (SEC) web site at http://www.sec.gov. You may also call 1-800-544-8544 to request a free copy of the proxy voting guidelines.
Standard & Poor's, S&P and S&P 500 are registered service marks of The McGraw-Hill Companies, Inc. and have been licensed for use by Fidelity Distributors Corporation.
Other third-party marks appearing herein are the property of their respective owners.
All other marks appearing herein are registered or unregistered trademarks or service marks of FMR LLC or an affiliated company. © 2013 FMR LLC. All rights reserved.
Annual Report
This report and the financial statements contained herein are submitted for the general information of the shareholders of the funds. This report is not authorized for distribution to prospective investors in the funds unless preceded or accompanied by an effective prospectus.
A fund files its complete schedule of portfolio holdings with the SEC for the first and third quarters of each fiscal year on Form N-Q. Forms N-Q are available on the SEC's web site at http://www.sec.gov. A fund's Forms N-Q may be reviewed and copied at the SEC's Public Reference Room in Washington, DC. Information regarding the operation of the SEC's Public Reference Room may be obtained by calling 1-800-SEC-0330. For a complete list of a fund's portfolio holdings, view the most recent holdings listing, semiannual report, or annual report on Fidelity's web site at http://www.fidelity.com, http://www.advisor.fidelity.com, or http://www.401k.com, as applicable.
NOT FDIC INSURED • MAY LOSE VALUE • NO BANK GUARANTEE
Neither the funds nor Fidelity Distributors Corporation is a bank.
Annual Report
Shareholder Expense Example
As a shareholder of a Fund, you incur two types of costs: (1) transaction costs, including redemption fees and (2) ongoing costs, including management fees and other Fund expenses. This Example is intended to help you understand your ongoing costs (in dollars) of investing in the Funds and to compare these costs with the ongoing costs of investing in other mutual funds.
The Example is based on an investment of $1,000 invested at the beginning of the period and held for the entire period (September 1, 2012 to February 28, 2013).
Actual Expenses
The first line of the accompanying table for each fund provides information about actual account values and actual expenses. You may use the information in this line, together with the amount you invested, to estimate the expenses that you paid over the period. Simply divide your account value by $1,000.00 (for example, an $8,600 account value divided by $1,000.00 = 8.6), then multiply the result by the number in the first line for a fund under the heading entitled "Expenses Paid During Period" to estimate the expenses you paid on your account during this period. A small balance maintenance fee of $12.00 that is charged once a year may apply for certain accounts with a value of less than $2,000. This fee is not included in the table below. If it was, the estimate of expenses you paid during the period would be higher, and your ending account value lower, by this amount. In addition, each Fund, as a shareholder in the underlying Fidelity Central Funds, will indirectly bear its pro-rata share of the fees and expenses incurred by the underlying Fidelity Central Funds. These fees and expenses are not included in the Fund's annualized expense ratio used to calculate the expense estimate in the table below.
Hypothetical Example for Comparison Purposes
The second line of the accompanying table for each fund provides information about hypothetical account values and hypothetical expenses based on a fund's actual expense ratio and an assumed rate of return of 5% per year before expenses, which is not the Fund's actual return. The hypothetical account values and expenses may not be used to estimate the actual ending account balance or expenses you paid for the period. You may use this information to compare the ongoing costs of investing in the Fund and other funds. To do so, compare this 5% hypothetical example with the 5% hypothetical examples that appear in the shareholder reports of the other funds. A small balance maintenance fee of $12.00 that is charged once a year may apply for certain accounts with a value of less than $2,000. This fee is not included in the table below. If it was, the estimate of expenses you paid during the period would be higher, and your ending account value lower, by this amount. In addition, each Fund, as a shareholder in the underlying Fidelity Central Funds, will indirectly bear its pro-rata share of the fees and expenses incurred by the underlying Fidelity Central Funds. These fees and expenses are not included in the Fund's annualized expense ratio used to calculate the expense estimate in the table below.
Please note that the expenses shown in the table are meant to highlight your ongoing costs only and do not reflect any transaction costs. Therefore, the second line of the table is useful in comparing ongoing costs only, and will not help you determine the relative total costs of owning different funds. In addition, if these transactional costs were included, your costs would have been higher.
|
|
Annualized |
Beginning |
Ending |
Expenses Paid |
|
Banking Portfolio |
.83% |
|
|
|
|
Actual |
|
$ 1,000.00 |
$ 1,080.90 |
$ 4.28 |
|
HypotheticalA |
|
$ 1,000.00 |
$ 1,020.68 |
$ 4.16 |
|
Brokerage and Investment Management Portfolio |
.84% |
|
|
|
|
Actual |
|
$ 1,000.00 |
$ 1,246.10 |
$ 4.68 |
|
HypotheticalA |
|
$ 1,000.00 |
$ 1,020.63 |
$ 4.21 |
|
Consumer Finance Portfolio |
.87% |
|
|
|
|
Actual |
|
$ 1,000.00 |
$ 1,128.90 |
$ 4.59 |
|
HypotheticalA |
|
$ 1,000.00 |
$ 1,020.48 |
$ 4.36 |
|
Financial Services Portfolio |
.85% |
|
|
|
|
Actual |
|
$ 1,000.00 |
$ 1,143.70 |
$ 4.52 |
|
HypotheticalA |
|
$ 1,000.00 |
$ 1,020.58 |
$ 4.26 |
|
Insurance Portfolio |
.86% |
|
|
|
|
Actual |
|
$ 1,000.00 |
$ 1,166.10 |
$ 4.62 |
|
HypotheticalA |
|
$ 1,000.00 |
$ 1,020.53 |
$ 4.31 |
A 5% return per year before expenses
* Expenses are equal to each Fund's annualized expense ratio, multiplied by the average account value over the period, multiplied by 181/365 (to reflect the one-half year period).
Annual Report
Banking Portfolio
Performance: The Bottom Line
Average annual total return reflects the change in the value of an investment, assuming reinvestment of the fund's distributions from dividend income and capital gains (the profits earned upon the sale of securities that have grown in value, if any) and assuming a constant rate of performance each year. The $10,000 table and the fund's returns do not reflect the deduction of taxes that a shareholder would pay on fund distributions or the redemption of fund shares. During periods of reimbursement by Fidelity, a fund's total return will be greater than it would be had the reimbursement not occurred. How a fund did yesterday is no guarantee of how it will do tomorrow.
Average Annual Total Returns
|
Periods ended February 28, 2013 |
Past 1 |
Past 5 |
Past 10 |
|
Banking Portfolio |
16.86% |
-0.14% |
1.88% |
$10,000 Over 10 Years
Let's say hypothetically that $10,000 was invested in Banking Portfolio on February 28, 2003. The chart shows how the value of your investment would have changed, and also shows how the S&P 500® Index performed over the same period.
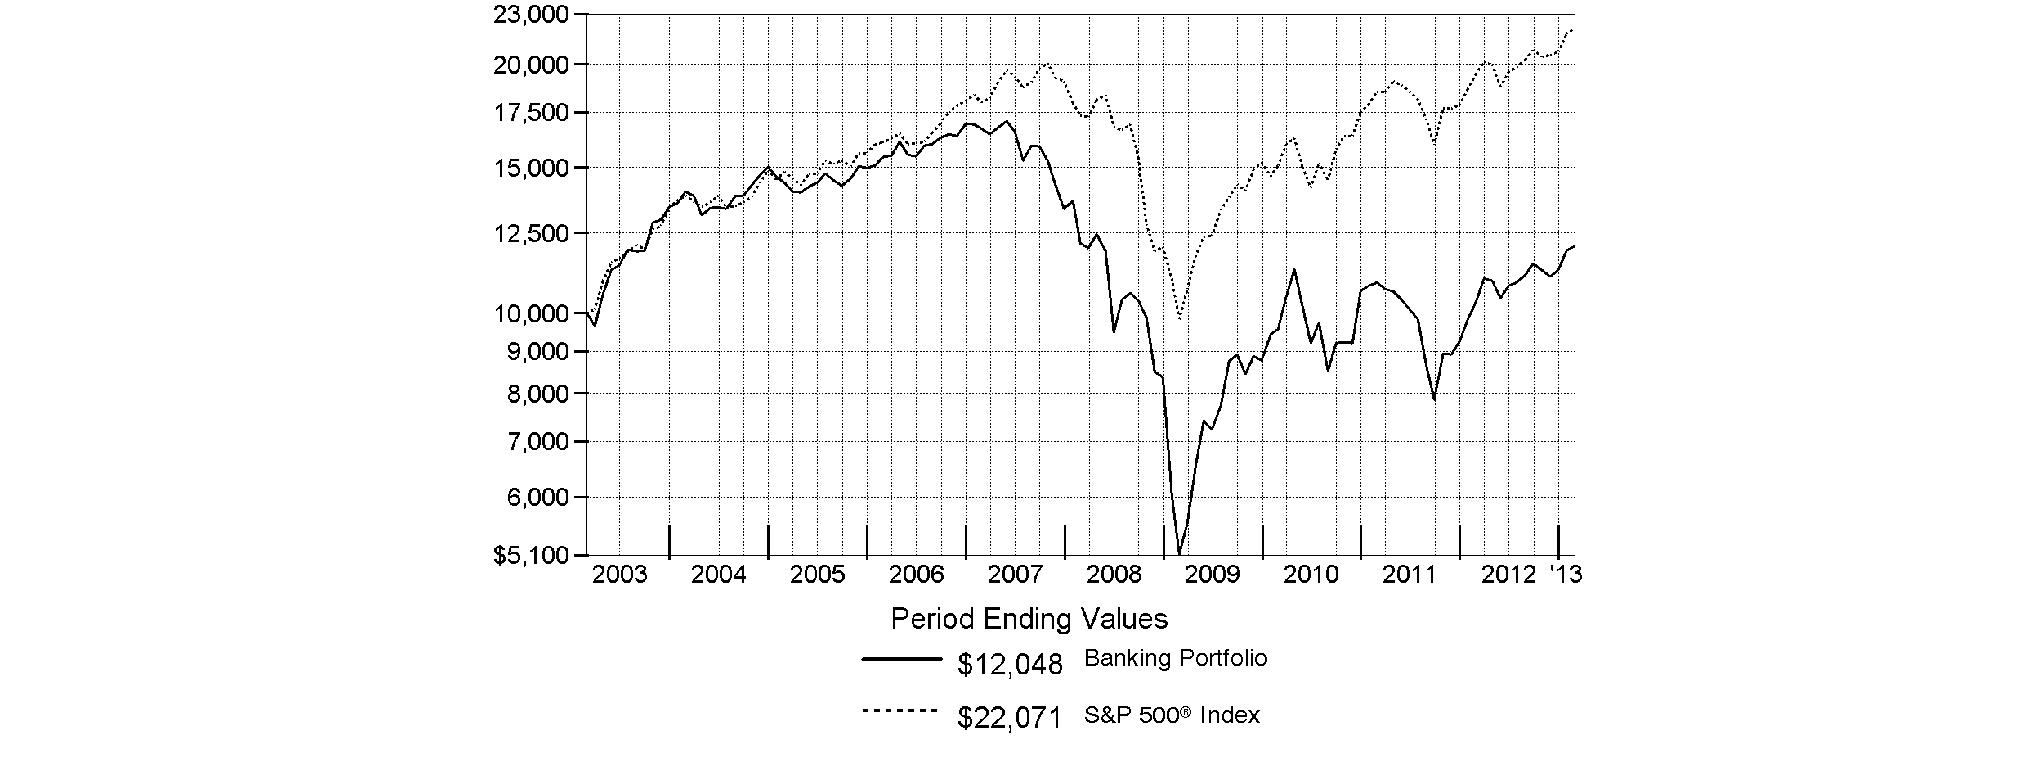
Annual Report
Banking Portfolio
Management's Discussion of Fund Performance
Market Recap: U.S. stocks posted solid gains for the year ending February 28, 2013, sparked by a late-period rally that pushed major equity benchmarks to multiyear highs. Improvement in the global economy and more monetary stimulus from the U.S. Federal Reserve kept markets on the upswing for much of the year, shrugging off an early decline brought on by debt woes in Europe, and another dip later in the period amid Congressional gridlock on the federal budget. Renewed optimism over employment, the housing market, corporate earnings and record dividends made stocks a favorite with investors during the 12 months, which helped push the broad-based S&P 500® Index across the milestone 1,500 mark at the end of January. The S&P 500® finished the period up 13.46%. Seven of the 10 major market sectors tracked by MSCI U.S. IMI 25-50 classifications produced double-digit gains, led by health care and financials, while information technology, energy and materials trailed the broad equity market with only modest advances.
Comments from John Sheehy, who became sole Portfolio Manager of Banking Portfolio on June 30, 2012, after serving as Co-Manager: For the year, the fund returned 16.86%, about in line with the 16.78% gain of the MSCI® U.S. IMI Banks 25-50 Index but well ahead of the S&P 500®. As a group, bank stocks were particularly aided by strong performance from the thrifts and mortgage finance group, as rock-bottom interest rates spurred robust home-mortgage refinancing activity. Versus the MSCI index, stock selection in regional banks - by far the largest industry group in both the index and the fund - added significantly to our relative performance. In fact, the six largest relative contributors were regional banks, starting with Bank of the Ozarks, a construction lender based in Arkansas. Despite the challenging economic environment of the past few years, this bank has aggressively grown its loan portfolio, and many of these loans began paying down during the period, adding to the company's net interest income. Also contributing was M&T Bank, a well-managed lender in upstate New York, and PacWest Bancorp, a Los Angeles-based holding company for Pacific Western Bank. I liquidated this latter position to nail down profits. Additionally, the fund was aided by a lighter-than-benchmark stake in the weak-performing shares of Hancock Holding, which operates Hancock Bank and Whitney Bank, both headquartered in the Southeast. Although the fund's position here fluctuated during the period, I ultimately sold this stock. Conversely, the biggest negative was a stake in cash and cash equivalents averaging 4%, which dampened the fund's return amid solid gains in bank stocks. A sizable underweighting in thrifts and mortgage finance, an overweighting in diversified banks, and out-of-benchmark exposure to consumer finance also detracted. At the stock level, avoiding mortgage insurance provider and benchmark component Radian Group hurt, as this stock more than doubled in value, bolstered by signs of recovery in the U.S. housing market. Also weighing on the portfolio was a non-index position in consumer finance firm Capital One Financial, which issued disappointing quarterly guidance early in the period amid efforts to integrate some recent acquisitions. Because I thought these problems were temporary, I roughly doubled the size of this position by period end. Overweighting CVB Financial, a conservatively managed regional bank in which I materially increased the fund's stake, also detracted, given this stock's underperformance. Avoiding Popular, a bank holding company in the index that operates Banco Popular de Puerto Rico, proved unrewarding as well. Improving economic conditions in Puerto Rico enabled this stock to post a gain of approximately 47%.
The views expressed above reflect those of the portfolio manager(s) only through the end of the period as stated on the cover of this report and do not necessarily represent the views of Fidelity or any other person in the Fidelity organization. Any such views are subject to change at any time based upon market or other conditions and Fidelity disclaims any responsibility to update such views. These views may not be relied on as investment advice and, because investment decisions for a Fidelity fund are based on numerous factors, may not be relied on as an indication of trading intent on behalf of any Fidelity fund.
Annual Report
Banking Portfolio
Investment Changes (Unaudited)
|
Top Ten Stocks as of February 28, 2013 |
||
|
|
% of fund's |
% of fund's net assets |
|
U.S. Bancorp |
12.9 |
12.7 |
|
Wells Fargo & Co. |
12.9 |
12.1 |
|
Huntington Bancshares, Inc. |
3.5 |
3.3 |
|
Comerica, Inc. |
3.5 |
3.5 |
|
M&T Bank Corp. |
3.2 |
3.9 |
|
PNC Financial Services Group, Inc. |
3.1 |
4.0 |
|
Commerce Bancshares, Inc. |
3.1 |
2.0 |
|
BB&T Corp. |
3.0 |
3.8 |
|
Ocwen Financial Corp. |
2.9 |
0.5 |
|
Texas Capital Bancshares, Inc. |
2.8 |
1.5 |
|
|
50.9 |
|
|
Top Industries (% of fund's net assets) |
|||
|
As of February 28, 2013 |
|||
 |
Commercial Banks |
83.6% |
|
 |
Thrifts & Mortgage Finance |
7.4% |
|
 |
Consumer Finance |
3.0% |
|
 |
IT Services |
1.6% |
|
 |
Diversified Financial Services |
0.8% |
|
 |
All Others* |
3.6% |
|

|
As of August 31, 2012 |
|||
|
Commercial Banks |
82.1% |
|
|
Thrifts & Mortgage Finance |
7.4% |
|
|
Consumer Finance |
2.2% |
|
|
Capital Markets |
1.0% |
|
|
Diversified Financial Services |
0.8% |
|
|
All Others* |
6.5% |
|

|
* Includes short-term investments and net other assets. |
Annual Report
Banking Portfolio
Investments February 28, 2013
Showing Percentage of Net Assets
|
Common Stocks - 96.3% |
|||
|
Shares |
Value |
||
|
CAPITAL MARKETS - 0.7% |
|||
|
Diversified Capital Markets - 0.7% |
|||
|
UBS AG (NY Shares) |
238,900 |
$ 3,777,009 |
|
|
COMMERCIAL BANKS - 82.8% |
|||
|
Diversified Banks - 32.1% |
|||
|
Aozora Bank Ltd. |
961,000 |
2,913,378 |
|
|
Axis Bank Ltd. |
78,795 |
1,947,992 |
|
|
Banco ABC Brasil SA (a) |
14,913 |
79,603 |
|
|
BanColombia SA sponsored ADR |
74,700 |
4,851,018 |
|
|
Comerica, Inc. |
541,400 |
18,613,332 |
|
|
Itau Unibanco Holding SA sponsored ADR |
320,600 |
5,661,796 |
|
|
U.S. Bancorp |
2,010,400 |
68,313,391 |
|
|
Wells Fargo & Co. |
1,946,192 |
68,272,415 |
|
|
|
170,652,925 |
||
|
Regional Banks - 50.7% |
|||
|
1st Source Corp. |
322,600 |
7,600,456 |
|
|
Bank of the Ozarks, Inc. |
370,400 |
14,219,656 |
|
|
BB&T Corp. |
518,900 |
15,753,804 |
|
|
BBCN Bancorp, Inc. |
764,212 |
9,460,945 |
|
|
BOK Financial Corp. |
14,200 |
843,906 |
|
|
CIT Group, Inc. (a) |
245,200 |
10,264,072 |
|
|
City National Corp. |
201,500 |
11,447,215 |
|
|
Commerce Bancshares, Inc. |
426,310 |
16,238,148 |
|
|
Cullen/Frost Bankers, Inc. (d) |
226,700 |
13,728,952 |
|
|
CVB Financial Corp. |
1,040,300 |
11,027,180 |
|
|
East West Bancorp, Inc. |
316,300 |
7,780,980 |
|
|
Fifth Third Bancorp |
169,600 |
2,686,464 |
|
|
First Horizon National Corp. (d) |
1,130,500 |
12,017,215 |
|
|
First Republic Bank |
265,000 |
9,659,250 |
|
|
Huntington Bancshares, Inc. |
2,653,751 |
18,655,870 |
|
|
International Bancshares Corp. |
289,100 |
5,854,275 |
|
|
KeyCorp |
415,600 |
3,902,484 |
|
|
M&T Bank Corp. |
168,700 |
17,222,583 |
|
|
Oriental Financial Group, Inc. |
213,180 |
3,263,786 |
|
|
PNC Financial Services Group, Inc. |
264,441 |
16,498,474 |
|
|
SunTrust Banks, Inc. |
326,600 |
9,010,894 |
|
|
Susquehanna Bancshares, Inc. |
691,400 |
8,040,982 |
|
|
SVB Financial Group (a) |
98,865 |
6,629,887 |
|
|
Texas Capital Bancshares, Inc. (a) |
357,400 |
15,103,724 |
|
|
UMB Financial Corp. |
274,275 |
12,504,197 |
|
|
Wilshire Bancorp, Inc. (a) |
265,800 |
1,560,246 |
|
|
Wintrust Financial Corp. |
218,200 |
7,964,300 |
|
|
|
268,939,945 |
||
|
TOTAL COMMERCIAL BANKS |
439,592,870 |
||
|
CONSUMER FINANCE - 3.0% |
|||
|
Consumer Finance - 3.0% |
|||
|
Capital One Financial Corp. |
266,200 |
13,584,186 |
|
|
SLM Corp. |
126,700 |
2,403,499 |
|
|
|
15,987,685 |
||
|
|
|||
|
Shares |
Value |
||
|
DIVERSIFIED FINANCIAL SERVICES - 0.8% |
|||
|
Other Diversified Financial Services - 0.8% |
|||
|
JPMorgan Chase & Co. |
82,700 |
$ 4,045,684 |
|
|
IT SERVICES - 1.6% |
|||
|
Data Processing & Outsourced Services - 1.6% |
|||
|
Global Payments, Inc. |
59,600 |
2,873,316 |
|
|
Total System Services, Inc. |
242,000 |
5,749,920 |
|
|
|
8,623,236 |
||
|
THRIFTS & MORTGAGE FINANCE - 7.4% |
|||
|
Thrifts & Mortgage Finance - 7.4% |
|||
|
Ocwen Financial Corp. (a) |
392,800 |
15,484,176 |
|
|
People's United Financial, Inc. (d) |
829,200 |
10,862,520 |
|
|
Trustco Bank Corp., New York |
1,374,900 |
7,163,229 |
|
|
Washington Federal, Inc. |
316,500 |
5,554,575 |
|
|
|
39,064,500 |
||
|
TOTAL COMMON STOCKS (Cost $484,604,171) |
|
||
|
Nonconvertible Preferred Stocks - 0.8% |
|||
|
|
|
|
|
|
COMMERCIAL BANKS - 0.8% |
|||
|
Diversified Banks - 0.8% |
|||
|
Banco ABC Brasil SA |
582,680 |
|
|
|
Money Market Funds - 6.7% |
|||
|
|
|
|
|
|
Fidelity Cash Central Fund, 0.16% (b) |
13,517,402 |
13,517,402 |
|
|
Fidelity Securities Lending Cash Central Fund, 0.16% (b)(c) |
22,068,150 |
22,068,150 |
|
|
TOTAL MONEY MARKET FUNDS (Cost $35,585,552) |
|
||
|
TOTAL INVESTMENT PORTFOLIO - 103.8% (Cost $523,125,237) |
550,944,930 |
||
|
NET OTHER ASSETS (LIABILITIES) - (3.8)% |
(20,382,966) |
||
|
NET ASSETS - 100% |
$ 530,561,964 |
||
|
Legend |
|
(a) Non-income producing |
|
(b) Affiliated fund that is generally available only to investment companies and other accounts managed by Fidelity Investments. The rate quoted is the annualized seven-day yield of the fund at period end. A complete unaudited listing of the fund's holdings as of its most recent quarter end is available upon request. In addition, each Fidelity Central Fund's financial statements, which are not covered by the Fund's Report of Independent Registered Public Accounting Firm, are available on the SEC's website or upon request. |
|
(c) Investment made with cash collateral received from securities on loan. |
|
(d) Security or a portion of the security is on loan at period end. |
|
Affiliated Central Funds |
|
Information regarding fiscal year to date income earned by the Fund from investments in Fidelity Central Funds is as follows: |
|
Fund |
Income earned |
|
Fidelity Cash Central Fund |
$ 32,856 |
|
Fidelity Securities Lending Cash Central Fund |
8,997 |
|
Total |
$ 41,853 |
|
Other Information |
|
The following is a summary of the inputs used, as of February 28, 2013, involving the Fund's assets and liabilities carried at fair value. The inputs or methodology used for valuing securities may not be an indication of the risk associated with investing in those securities. For more information on valuation inputs, and their aggregation into the levels used in the table below, please refer to the Investment Valuation section in the accompanying Notes to Financial Statements. |
|
Valuation Inputs at Reporting Date: |
||||
|
Description |
Total |
Level 1 |
Level 2 |
Level 3 |
|
Investments in Securities: |
||||
|
Common Stocks |
$ 511,090,984 |
$ 511,011,381 |
$ - |
$ 79,603 |
|
Nonconvertible Preferred Stocks |
4,268,394 |
4,268,394 |
- |
- |
|
Money Market Funds |
35,585,552 |
35,585,552 |
- |
- |
|
Total Investments in Securities: |
$ 550,944,930 |
$ 550,865,327 |
$ - |
$ 79,603 |
See accompanying notes which are an integral part of the financial statements.
Annual Report
Banking Portfolio
Financial Statements
Statement of Assets and Liabilities
|
|
February 28, 2013 |
|
|
|
|
|
|
Assets |
|
|
|
Investment in securities, at value (including securities loaned of $21,769,516) - See accompanying schedule: Unaffiliated issuers (cost $487,539,685) |
$ 515,359,378 |
|
|
Fidelity Central Funds (cost $35,585,552) |
35,585,552 |
|
|
Total Investments (cost $523,125,237) |
|
$ 550,944,930 |
|
Receivable for investments sold |
|
2,733,527 |
|
Receivable for fund shares sold |
|
385,317 |
|
Dividends receivable |
|
1,042,889 |
|
Distributions receivable from Fidelity Central Funds |
|
3,199 |
|
Prepaid expenses |
|
930 |
|
Receivable from investment adviser for expense reductions |
|
210 |
|
Other receivables |
|
28,164 |
|
Total assets |
|
555,139,166 |
|
|
|
|
|
Liabilities |
|
|
|
Payable for investments purchased |
$ 1,616,674 |
|
|
Payable for fund shares redeemed |
499,837 |
|
|
Accrued management fee |
248,628 |
|
|
Other affiliated payables |
111,360 |
|
|
Other payables and accrued expenses |
32,553 |
|
|
Collateral on securities loaned, at value |
22,068,150 |
|
|
Total liabilities |
|
24,577,202 |
|
|
|
|
|
Net Assets |
|
$ 530,561,964 |
|
Net Assets consist of: |
|
|
|
Paid in capital |
|
$ 558,810,460 |
|
Undistributed net investment income |
|
930,688 |
|
Accumulated undistributed net realized gain (loss) on investments and foreign currency transactions |
|
(56,998,877) |
|
Net unrealized appreciation (depreciation) on investments |
|
27,819,693 |
|
Net Assets, for 25,785,867 shares outstanding |
|
$ 530,561,964 |
|
Net Asset Value, offering price and redemption price per share ($530,561,964 ÷ 25,785,867 shares) |
|
$ 20.58 |
Statement of Operations
|
|
Year ended February 28, 2013 |
|
|
|
|
|
|
Investment Income |
|
|
|
Dividends |
|
$ 10,626,726 |
|
Income from Fidelity Central Funds |
|
41,853 |
|
Total income |
|
10,668,579 |
|
|
|
|
|
Expenses |
|
|
|
Management fee |
$ 2,708,978 |
|
|
Transfer agent fees |
1,111,500 |
|
|
Accounting and security lending fees |
189,721 |
|
|
Custodian fees and expenses |
13,057 |
|
|
Independent trustees' compensation |
3,211 |
|
|
Registration fees |
34,022 |
|
|
Audit |
41,241 |
|
|
Legal |
2,686 |
|
|
Miscellaneous |
3,815 |
|
|
Total expenses before reductions |
4,108,231 |
|
|
Expense reductions |
(83,814) |
4,024,417 |
|
Net investment income (loss) |
|
6,644,162 |
|
Realized and Unrealized Gain (Loss) Net realized gain (loss) on: |
|
|
|
Investment securities: |
|
|
|
Unaffiliated issuers |
28,772,131 |
|
|
Foreign currency transactions |
(9,349) |
|
|
Total net realized gain (loss) |
|
28,762,782 |
|
Change in net unrealized appreciation (depreciation) on investment securities |
|
35,942,241 |
|
Net gain (loss) |
|
64,705,023 |
|
Net increase (decrease) in net assets resulting from operations |
|
$ 71,349,185 |
See accompanying notes which are an integral part of the financial statements.
Annual Report
Banking Portfolio
Financial Statements - continued
Statement of Changes in Net Assets
|
|
Year ended |
Year ended |
|
Increase (Decrease) in Net Assets |
|
|
|
Operations |
|
|
|
Net investment income (loss) |
$ 6,644,162 |
$ 2,165,481 |
|
Net realized gain (loss) |
28,762,782 |
(8,189,625) |
|
Change in net unrealized appreciation (depreciation) |
35,942,241 |
(30,402,176) |
|
Net increase (decrease) in net assets resulting from operations |
71,349,185 |
(36,426,320) |
|
Distributions to shareholders from net investment income |
(6,092,882) |
(1,687,594) |
|
Share transactions |
205,300,987 |
263,836,043 |
|
Reinvestment of distributions |
5,934,143 |
1,634,419 |
|
Cost of shares redeemed |
(175,700,047) |
(315,949,436) |
|
Net increase (decrease) in net assets resulting from share transactions |
35,535,083 |
(50,478,974) |
|
Redemption fees |
23,579 |
22,957 |
|
Total increase (decrease) in net assets |
100,814,965 |
(88,569,931) |
|
|
|
|
|
Net Assets |
|
|
|
Beginning of period |
429,746,999 |
518,316,930 |
|
End of period (including undistributed net investment income of $930,688 and undistributed net investment income of $388,757, respectively) |
$ 530,561,964 |
$ 429,746,999 |
|
Other Information Shares |
|
|
|
Sold |
10,627,011 |
15,627,481 |
|
Issued in reinvestment of distributions |
307,206 |
104,569 |
|
Redeemed |
(9,249,788) |
(19,030,038) |
|
Net increase (decrease) |
1,684,429 |
(3,297,988) |
Financial Highlights
|
Years ended February 28, |
2013 |
2012 F |
2011 |
2010 |
2009 |
|
Selected Per-Share Data |
|
|
|
|
|
|
Net asset value, beginning of period |
$ 17.83 |
$ 18.92 |
$ 16.63 |
$ 9.04 |
$ 22.24 |
|
Income from Investment Operations |
|
|
|
|
|
|
Net investment income (loss) B |
.26 |
.09 |
(.01) |
.06 |
.67 |
|
Net realized and unrealized gain (loss) |
2.73 |
(1.11) |
2.31 |
7.74 |
(13.32) |
|
Total from investment operations |
2.99 |
(1.02) |
2.30 |
7.80 |
(12.65) |
|
Distributions from net investment income |
(.24) |
(.07) |
(.01) |
(.21) |
(.51) |
|
Distributions from net realized gain |
- |
- |
- |
- |
(.05) |
|
Total distributions |
(.24) |
(.07) |
(.01) |
(.21) |
(.56) |
|
Redemption fees added to paid in capital B |
- G |
- G |
- G |
- G |
.01 |
|
Net asset value, end of period |
$ 20.58 |
$ 17.83 |
$ 18.92 |
$ 16.63 |
$ 9.04 |
|
Total Return A |
16.86% |
(5.31)% |
13.83% |
87.04% |
(57.85)% |
|
Ratios to Average Net Assets C, E |
|
|
|
|
|
|
Expenses before reductions |
.85% |
.88% |
.89% |
.95% |
.93% |
|
Expenses net of fee waivers, if any |
.85% |
.88% |
.89% |
.95% |
.93% |
|
Expenses net of all reductions |
.83% |
.87% |
.88% |
.94% |
.93% |
|
Net investment income (loss) |
1.37% |
.55% |
(.04)% |
.46% |
3.86% |
|
Supplemental Data |
|
|
|
|
|
|
Net assets, end of period (000 omitted) |
$ 530,562 |
$ 429,747 |
$ 518,317 |
$ 359,438 |
$ 151,158 |
|
Portfolio turnover rate D |
69% |
91% |
73% |
105% |
199% |
A Total returns would have been lower if certain expenses had not been reduced during the applicable periods shown.
B Calculated based on average shares outstanding during the period.
C Fees and expenses of any underlying Fidelity Central Funds are not included in the Fund's expense ratio. The Fund indirectly bears its proportionate share of the expenses of any underlying Fidelity Central Funds.
D Amount does not include the portfolio activity of any underlying Fidelity Central Funds.
E Expense ratios reflect operating expenses of the Fund. Expenses before reductions do not reflect amounts reimbursed by the investment adviser or reductions from brokerage service arrangements or reductions from other expense offset arrangements and do not represent the amount paid by the Fund during periods when reimbursements or reductions occur. Expenses net of fee waivers reflect expenses after reimbursement by the investment adviser but prior to reductions from brokerage service arrangements or other expense offset arrangements. Expenses net of all reductions represent the net expenses paid by the Fund.
F For the year ended February 29.
G Amount represents less than $.01 per share.
See accompanying notes which are an integral part of the financial statements.
Annual Report
Brokerage and Investment Management Portfolio
Performance: The Bottom Line
Average annual total return reflects the change in the value of an investment, assuming reinvestment of the fund's distributions from dividend income and capital gains (the profits earned upon the sale of securities that have grown in value, if any) and assuming a constant rate of performance each year. The $10,000 table and the fund's returns do not reflect the deduction of taxes that a shareholder would pay on fund distributions or the redemption of fund shares. During periods of reimbursement by Fidelity, a fund's total return will be greater than it would be had the reimbursement not occurred. How a fund did yesterday is no guarantee of how it will do tomorrow.
Average Annual Total Returns
|
Periods ended February 28, 2013 |
Past 1 |
Past 5 |
Past 10 |
|
Brokerage and Investment Management Portfolio |
21.08% |
1.15% |
9.59% |
$10,000 Over 10 Years
Let's say hypothetically that $10,000 was invested in Brokerage and Investment Management Portfolio on February 28, 2003. The chart shows how the value of your investment would have changed, and also shows how the S&P 500 Index performed over the same period.
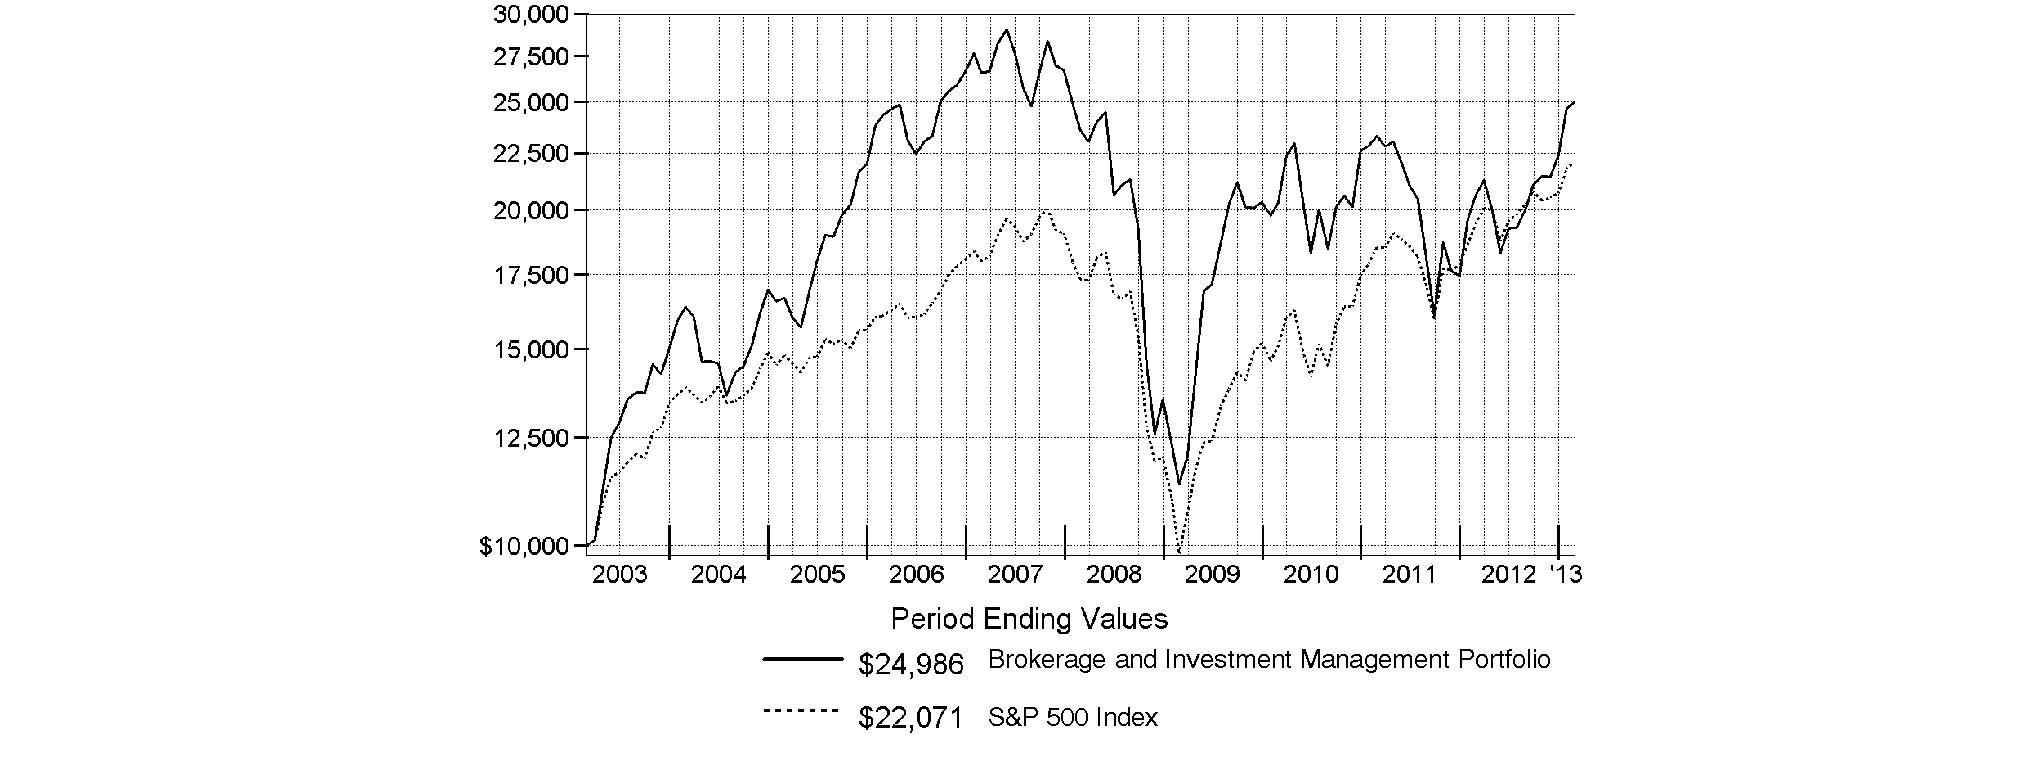
Annual Report
Brokerage and Investment Management Portfolio
Management's Discussion of Fund Performance
Market Recap: U.S. stocks posted solid gains for the year ending February 28, 2013, sparked by a late-period rally that pushed major equity benchmarks to multiyear highs. Improvement in the global economy and more monetary stimulus from the U.S. Federal Reserve kept markets on the upswing for much of the year, shrugging off an early decline brought on by debt woes in Europe, and another dip later in the period amid Congressional gridlock on the federal budget. Renewed optimism over employment, the housing market, corporate earnings and record dividends made stocks a favorite with investors during the 12 months, which helped push the broad-based S&P 500® Index across the milestone 1,500 mark at the end of January. The S&P 500® finished the period up 13.46%. Seven of the 10 major market sectors tracked by MSCI U.S. IMI 25-50 classifications produced double-digit gains, led by health care and financials, while information technology, energy and materials trailed the broad equity market with only modest advances.
Comments from Benjamin Hesse, Portfolio Manager of Brokerage and Investment Management Portfolio: For the year, the fund returned 21.08%, trailing the 22.67% advance of its industry benchmark, the MSCI® U.S. IMI Capital Markets 25-50 Index, but beating the broadly based S&P 500® Index. Stocks in the industry benefited from attractive valuations, central bank action during the third quarter and the postponement of federal spending cuts and tax increases. Weak stock picking hurt performance versus the industry benchmark, especially choices in asset management/custody banks, the out-of-index data processing/outsourced services segment and multi-line insurance. Also detracting was a high cash position, which was mostly a function of positioning changes. Individual disappointments included Brazilian stock exchange Cetip, whose decline was tied to economic weakness in Brazil, and U.K. emerging-markets fund manager Ashmore Group, whose stock was hampered by disappointing investment performance and declining fee income. Shares of multi-line insurer Genworth Financial were pressured by low interest rates and the delayed sale of its Australian business. Currency fluctuations hindered performance, given the fund's investment in foreign stocks. By contrast, positioning in investment banking/brokerage and stock picks in the out-of-index diversified financial services and specialized finance segments helped. Individual contributors included alternative asset manger Apollo Global Management, whose stock rallied as the company began harvesting gains from earlier investments, and global diversified financial leader Citigroup, which benefited from an improved capital outlook and cost cutting under new management. Many of the stocks mentioned were not in the industry index, and Cetip was not in the fund at period end.
The views expressed above reflect those of the portfolio manager(s) only through the end of the period as stated on the cover of this report and do not necessarily represent the views of Fidelity or any other person in the Fidelity organization. Any such views are subject to change at any time based upon market or other conditions and Fidelity disclaims any responsibility to update such views. These views may not be relied on as investment advice and, because investment decisions for a Fidelity fund are based on numerous factors, may not be relied on as an indication of trading intent on behalf of any Fidelity fund.
Annual Report
Brokerage and Investment Management Portfolio
Investment Changes (Unaudited)
|
Top Ten Stocks as of February 28, 2013 |
||
|
|
% of fund's |
% of fund's net assets |
|
Comerica, Inc. |
8.1 |
0.0 |
|
The Blackstone Group LP |
4.6 |
3.0 |
|
NYSE Euronext |
4.4 |
0.0 |
|
Ashmore Group PLC |
4.1 |
0.0 |
|
Ares Capital Corp. |
4.0 |
5.8 |
|
BlackRock, Inc. Class A |
4.0 |
2.0 |
|
A.F.P. Provida SA sponsored ADR |
3.9 |
3.7 |
|
Evercore Partners, Inc. Class A |
3.9 |
4.2 |
|
Franklin Resources, Inc. |
3.7 |
0.5 |
|
Ameriprise Financial, Inc. |
3.5 |
3.0 |
|
|
44.2 |
|
|
Top Industries (% of fund's net assets) |
|||
|
As of February 28, 2013 |
|||
|
Capital Markets |
63.5% |
|
|
Diversified Financial Services |
16.1% |
|
|
Commercial Banks |
10.8% |
|
|
Insurance |
2.8% |
|
|
Real Estate Investment Trusts |
0.9% |
|
|
All Others* |
5.9% |
|

|
As of August 31, 2012 |
|||
|
Capital Markets |
62.8% |
|
|
Diversified Financial Services |
16.4% |
|
|
Commercial Banks |
4.5% |
|
|
IT Services |
3.7% |
|
|
Real Estate Investment Trusts |
2.9% |
|
|
All Others* |
9.7% |
|

|
* Includes short-term investments and net other assets. |
Annual Report
Brokerage and Investment Management Portfolio
Investments February 28, 2013
Showing Percentage of Net Assets
|
Common Stocks - 95.0% |
|||
|
Shares |
Value |
||
|
AEROSPACE & DEFENSE - 0.0% |
|||
|
Aerospace & Defense - 0.0% |
|||
|
BAE Systems PLC |
100 |
$ 539 |
|
|
CAPITAL MARKETS - 63.5% |
|||
|
Asset Management & Custody Banks - 49.9% |
|||
|
A.F.P. Provida SA sponsored ADR |
229,830 |
23,810,388 |
|
|
Affiliated Managers Group, Inc. (a) |
23,615 |
3,453,221 |
|
|
AllianceBernstein Holding LP |
288,600 |
6,646,458 |
|
|
American Capital Ltd. (a) |
364,500 |
5,095,710 |
|
|
Ameriprise Financial, Inc. |
306,800 |
21,055,684 |
|
|
Apollo Global Management LLC Class A |
621,632 |
14,614,568 |
|
|
Apollo Investment Corp. |
739,443 |
6,425,760 |
|
|
Ares Capital Corp. |
1,306,705 |
24,193,643 |
|
|
Artio Global Investors, Inc. Class A |
239,385 |
651,127 |
|
|
Ashmore Group PLC |
4,513,700 |
24,534,623 |
|
|
Bank of New York Mellon Corp. |
17,462 |
473,919 |
|
|
Bank Sarasin & Cie AG Series B (Reg.) (a) |
1,380 |
38,943 |
|
|
BlackRock Kelso Capital Corp. |
566,620 |
5,915,513 |
|
|
BlackRock, Inc. Class A |
99,984 |
23,971,164 |
|
|
Calamos Asset Management, Inc. Class A |
30,000 |
335,400 |
|
|
Cohen & Steers, Inc. (d) |
481,748 |
15,883,232 |
|
|
Eaton Vance Corp. (non-vtg.) |
1,500 |
57,285 |
|
|
EFG International (d) |
235,793 |
2,993,638 |
|
|
Federated Investors, Inc. Class B (non-vtg.) (d) |
2,100 |
48,762 |
|
|
Fifth Street Finance Corp. |
170,245 |
1,821,622 |
|
|
Franklin Resources, Inc. |
159,668 |
22,553,105 |
|
|
Invesco Ltd. |
782,572 |
20,965,104 |
|
|
Janus Capital Group, Inc. (d) |
904,197 |
8,372,864 |
|
|
Julius Baer Group Ltd. |
980 |
37,138 |
|
|
KKR & Co. LP |
2,600 |
47,372 |
|
|
Legg Mason, Inc. |
196,861 |
5,610,539 |
|
|
Man Group PLC |
20,311 |
30,905 |
|
|
MCG Capital Corp. |
95,707 |
430,682 |
|
|
MVC Capital, Inc. |
17,300 |
220,575 |
|
|
Northern Trust Corp. |
900 |
47,853 |
|
|
Oaktree Capital Group LLC |
31,990 |
1,597,261 |
|
|
Och-Ziff Capital Management Group LLC Class A |
681,449 |
6,221,629 |
|
|
PennantPark Investment Corp. |
429,370 |
4,980,692 |
|
|
Pzena Investment Management, Inc. |
36,849 |
231,780 |
|
|
SEI Investments Co. |
60,090 |
1,698,744 |
|
|
Solar Capital Ltd. |
47,664 |
1,167,768 |
|
|
State Street Corp. |
210,300 |
11,900,877 |
|
|
T. Rowe Price Group, Inc. |
1,300 |
92,547 |
|
|
The Blackstone Group LP |
1,462,983 |
27,650,379 |
|
|
U.S. Global Investments, Inc. Class A |
516,479 |
1,962,620 |
|
|
Virtus Investment Partners, Inc. (a) |
4,800 |
806,448 |
|
|
Waddell & Reed Financial, Inc. Class A |
1,200 |
49,224 |
|
|
|
|||
|
Shares |
Value |
||
|
Walter Investment Management Corp. (a) |
60,000 |
$ 2,755,200 |
|
|
WisdomTree Investments, Inc. (a) |
59,000 |
536,900 |
|
|
|
301,988,866 |
||
|
Diversified Capital Markets - 3.3% |
|||
|
Credit Suisse Group sponsored ADR |
1,800 |
48,168 |
|
|
Deutsche Bank AG (NY Shares) |
900 |
41,157 |
|
|
UBS AG |
29,730 |
469,743 |
|
|
UBS AG (NY Shares) |
1,219,977 |
19,287,836 |
|
|
|
19,846,904 |
||
|
Investment Banking & Brokerage - 10.3% |
|||
|
BGC Partners, Inc. Class A |
500 |
2,135 |
|
|
Charles Schwab Corp. |
3,200 |
51,968 |
|
|
Cowen Group, Inc. Class A (a) |
14,900 |
38,889 |
|
|
Duff & Phelps Corp. Class A |
100 |
1,554 |
|
|
E*TRADE Financial Corp. (a) |
40,800 |
436,968 |
|
|
Evercore Partners, Inc. Class A |
572,815 |
23,313,571 |
|
|
GFI Group, Inc. |
3,400,207 |
11,934,727 |
|
|
Gleacher & Co., Inc. (a) |
50,081 |
29,398 |
|
|
Goldman Sachs Group, Inc. |
19,400 |
2,905,344 |
|
|
Greenhill & Co., Inc. |
820 |
49,840 |
|
|
ICAP PLC |
59,200 |
299,065 |
|
|
Investment Technology Group, Inc. (a) |
437,896 |
5,302,921 |
|
|
Jefferies Group, Inc. |
2,849 |
61,880 |
|
|
Lazard Ltd. Class A |
1,400 |
50,260 |
|
|
LPL Financial |
1,646 |
51,898 |
|
|
Morgan Stanley |
39,989 |
901,752 |
|
|
Nomura Holdings, Inc. sponsored ADR |
8,800 |
50,688 |
|
|
Oppenheimer Holdings, Inc. Class A (non-vtg.) |
1,600 |
30,240 |
|
|
Piper Jaffray Companies (a) |
43,943 |
1,694,882 |
|
|
Raymond James Financial, Inc. |
300,567 |
13,188,880 |
|
|
Stifel Financial Corp. (a) |
12,629 |
436,206 |
|
|
SWS Group, Inc. (a) |
205,719 |
1,318,659 |
|
|
TD Ameritrade Holding Corp. |
2,524 |
47,981 |
|
|
|
62,199,706 |
||
|
TOTAL CAPITAL MARKETS |
384,035,476 |
||
|
COMMERCIAL BANKS - 10.8% |
|||
|
Diversified Banks - 10.6% |
|||
|
Banco de Chile sponsored ADR |
407 |
40,525 |
|
|
Banco Santander SA (Spain) sponsored ADR |
3,900 |
29,562 |
|
|
Banco Santander SA (Brasil) ADR |
4,700 |
34,357 |
|
|
BanColombia SA sponsored ADR |
86,200 |
5,597,828 |
|
|
Barclays PLC sponsored ADR (d) |
139,662 |
2,590,730 |
|
|
BNP Paribas SA |
1,000 |
56,276 |
|
|
BPI-SGPS SA (a) |
302,300 |
491,756 |
|
|
Comerica, Inc. |
1,423,684 |
48,946,254 |
|
|
HSBC Holdings PLC sponsored ADR |
800 |
44,352 |
|
|
ICICI Bank Ltd. sponsored ADR |
1,207 |
50,597 |
|
|
Industrial & Commercial Bank of China Ltd. (H Shares) |
214,000 |
153,693 |
|
|
Common Stocks - continued |
|||
|
Shares |
Value |
||
|
COMMERCIAL BANKS - CONTINUED |
|||
|
Diversified Banks - continued |
|||
|
The Toronto-Dominion Bank |
77,300 |
$ 6,360,150 |
|
|
UniCredit SpA (a) |
630 |
3,201 |
|
|
United Overseas Bank Ltd. |
3,000 |
46,221 |
|
|
|
64,445,502 |
||
|
Regional Banks - 0.2% |
|||
|
CIT Group, Inc. (a) |
1,200 |
50,232 |
|
|
Fifth Third Bancorp |
2,800 |
44,352 |
|
|
First Interstate Bancsystem, Inc. |
12,725 |
232,486 |
|
|
PNC Financial Services Group, Inc. |
8,400 |
524,076 |
|
|
Regions Financial Corp. |
7,284 |
55,723 |
|
|
SunTrust Banks, Inc. |
2,000 |
55,180 |
|
|
|
962,049 |
||
|
TOTAL COMMERCIAL BANKS |
65,407,551 |
||
|
CONSUMER FINANCE - 0.0% |
|||
|
Consumer Finance - 0.0% |
|||
|
SLM Corp. |
2,600 |
49,322 |
|
|
DIVERSIFIED CONSUMER SERVICES - 0.0% |
|||
|
Specialized Consumer Services - 0.0% |
|||
|
Sotheby's Class A (Ltd. vtg.) |
1,100 |
42,053 |
|
|
DIVERSIFIED FINANCIAL SERVICES - 16.1% |
|||
|
Other Diversified Financial Services - 5.8% |
|||
|
Bank of America Corp. |
4,354 |
48,895 |
|
|
BTG Pactual Participations Ltd. unit |
770,850 |
14,171,583 |
|
|
Citigroup, Inc. |
500,210 |
20,993,814 |
|
|
JPMorgan Chase & Co. |
900 |
44,028 |
|
|
|
35,258,320 |
||
|
Specialized Finance - 10.3% |
|||
|
BM&F Bovespa SA |
6,400 |
43,359 |
|
|
Bursa Malaysia Bhd |
151,100 |
322,524 |
|
|
CBOE Holdings, Inc. |
469,200 |
16,853,664 |
|
|
CME Group, Inc. |
941 |
56,291 |
|
|
Deutsche Boerse AG |
6,500 |
402,961 |
|
|
Hellenic Exchanges Holding SA |
6,800 |
44,921 |
|
|
IntercontinentalExchange, Inc. (a) |
226 |
34,989 |
|
|
NYSE Euronext |
706,678 |
26,344,956 |
|
|
The NASDAQ Stock Market, Inc. |
571,900 |
18,106,354 |
|
|
|
62,210,019 |
||
|
TOTAL DIVERSIFIED FINANCIAL SERVICES |
97,468,339 |
||
|
HOTELS, RESTAURANTS & LEISURE - 0.0% |
|||
|
Casinos & Gaming - 0.0% |
|||
|
Boyd Gaming Corp. (a)(d) |
4,900 |
32,193 |
|
|
Las Vegas Sands Corp. |
700 |
36,043 |
|
|
|
68,236 |
||
|
|
|||
|
Shares |
Value |
||
|
Hotels, Resorts & Cruise Lines - 0.0% |
|||
|
Starwood Hotels & Resorts Worldwide, Inc. |
700 |
$ 42,231 |
|
|
TOTAL HOTELS, RESTAURANTS & LEISURE |
110,467 |
||
|
INSURANCE - 2.8% |
|||
|
Insurance Brokers - 2.2% |
|||
|
National Financial Partners Corp. (a) |
680,387 |
13,376,408 |
|
|
Life & Health Insurance - 0.0% |
|||
|
AFLAC, Inc. |
800 |
39,960 |
|
|
Multi-Line Insurance - 0.5% |
|||
|
American International Group, Inc. (a) |
77,700 |
2,953,377 |
|
|
Genworth Financial, Inc. Class A (a) |
6,300 |
53,802 |
|
|
|
3,007,179 |
||
|
Property & Casualty Insurance - 0.1% |
|||
|
ACE Ltd. |
500 |
42,695 |
|
|
Fidelity National Financial, Inc. Class A |
2,487 |
62,026 |
|
|
The Travelers Companies, Inc. |
600 |
48,252 |
|
|
|
152,973 |
||
|
TOTAL INSURANCE |
16,576,520 |
||
|
INTERNET SOFTWARE & SERVICES - 0.0% |
|||
|
Internet Software & Services - 0.0% |
|||
|
China Finance Online Co. Ltd. ADR (a) |
1,600 |
2,336 |
|
|
eBay, Inc. (a) |
1,100 |
60,148 |
|
|
|
62,484 |
||
|
IT SERVICES - 0.8% |
|||
|
Data Processing & Outsourced Services - 0.8% |
|||
|
Fidelity National Information Services, Inc. |
2,100 |
79,065 |
|
|
Fiserv, Inc. (a) |
400 |
32,844 |
|
|
MasterCard, Inc. Class A |
100 |
51,782 |
|
|
Total System Services, Inc. |
67,070 |
1,593,583 |
|
|
VeriFone Systems, Inc. (a) |
170,596 |
3,236,206 |
|
|
|
4,993,480 |
||
|
MEDIA - 0.0% |
|||
|
Publishing - 0.0% |
|||
|
Morningstar, Inc. |
700 |
48,006 |
|
|
PROFESSIONAL SERVICES - 0.0% |
|||
|
Research & Consulting Services - 0.0% |
|||
|
Equifax, Inc. |
900 |
49,608 |
|
|
IHS, Inc. Class A (a) |
500 |
53,125 |
|
|
|
102,733 |
||
|
REAL ESTATE INVESTMENT TRUSTS - 0.9% |
|||
|
Mortgage REITs - 0.7% |
|||
|
American Capital Agency Corp. |
129,300 |
4,101,396 |
|
|
Retail REITs - 0.1% |
|||
|
Federal Realty Investment Trust (SBI) |
6,500 |
690,365 |
|
|
Common Stocks - continued |
|||
|
Shares |
Value |
||
|
REAL ESTATE INVESTMENT TRUSTS - CONTINUED |
|||
|
Specialized REITs - 0.1% |
|||
|
Big Yellow Group PLC |
19,400 |
$ 109,894 |
|
|
Strategic Hotel & Resorts, Inc. (a) |
19,100 |
139,048 |
|
|
|
248,942 |
||
|
TOTAL REAL ESTATE INVESTMENT TRUSTS |
5,040,703 |
||
|
REAL ESTATE MANAGEMENT & DEVELOPMENT - 0.1% |
|||
|
Real Estate Services - 0.1% |
|||
|
CBRE Group, Inc. (a) |
22,437 |
542,302 |
|
|
Jones Lang LaSalle, Inc. |
500 |
48,320 |
|
|
|
590,622 |
||
|
ROAD & RAIL - 0.0% |
|||
|
Railroads - 0.0% |
|||
|
Canadian Pacific |
100 |
12,152 |
|
|
TRADING COMPANIES & DISTRIBUTORS - 0.0% |
|||
|
Trading Companies & Distributors - 0.0% |
|||
|
Noble Group Ltd. |
75,000 |
71,766 |
|
|
TOTAL COMMON STOCKS (Cost $552,963,110) |
|
||
|
Money Market Funds - 11.3% |
|||
|
Shares |
Value |
||
|
Fidelity Cash Central Fund, 0.16% (b) |
46,115,442 |
$ 46,115,442 |
|
|
Fidelity Securities Lending Cash Central Fund, 0.16% (b)(c) |
21,867,953 |
21,867,953 |
|
|
TOTAL MONEY MARKET FUNDS (Cost $67,983,395) |
|
||
|
TOTAL INVESTMENT PORTFOLIO - 106.3% (Cost $620,946,505) |
642,595,608 |
||
|
NET OTHER ASSETS (LIABILITIES) - (6.3)% |
(37,822,376) |
||
|
NET ASSETS - 100% |
$ 604,773,232 |
||
|
Legend |
|
(a) Non-income producing |
|
(b) Affiliated fund that is generally available only to investment companies and other accounts managed by Fidelity Investments. The rate quoted is the annualized seven-day yield of the fund at period end. A complete unaudited listing of the fund's holdings as of its most recent quarter end is available upon request. In addition, each Fidelity Central Fund's financial statements, which are not covered by the Fund's Report of Independent Registered Public Accounting Firm, are available on the SEC's website or upon request. |
|
(c) Investment made with cash collateral received from securities on loan. |
|
(d) Security or a portion of the security is on loan at period end. |
|
Affiliated Central Funds |
|
Information regarding fiscal year to date income earned by the Fund from investments in Fidelity Central Funds is as follows: |
|
Fund |
Income earned |
|
Fidelity Cash Central Fund |
$ 57,502 |
|
Fidelity Securities Lending Cash Central Fund |
88,675 |
|
Total |
$ 146,177 |
|
Other Information |
|
The following is a summary of the inputs used, as of February 28, 2013, involving the Fund's assets and liabilities carried at fair value. The inputs or methodology used for valuing securities may not be an indication of the risk associated with investing in those securities. For more information on valuation inputs, and their aggregation into the levels used in the table below, please refer to the Investment Valuation section in the accompanying Notes to Financial Statements. |
|
Valuation Inputs at Reporting Date: |
||||
|
Description |
Total |
Level 1 |
Level 2 |
Level 3 |
|
Investments in Securities: |
||||
|
Common Stocks |
$ 574,612,213 |
$ 574,142,470 |
$ 469,743 |
$ - |
|
Money Market Funds |
67,983,395 |
67,983,395 |
- |
- |
|
Total Investments in Securities: |
$ 642,595,608 |
$ 642,125,865 |
$ 469,743 |
$ - |
|
Distribution of investments by country or territory of incorporation, as a percentage of total net assets, is as follows. (Unaudited) |
|
United States of America |
79.8% |
|
United Kingdom |
4.5% |
|
Chile |
3.9% |
|
Switzerland |
3.8% |
|
Bermuda |
3.5% |
|
Brazil |
2.3% |
|
Canada |
1.1% |
|
Others (Individually Less Than 1%) |
1.1% |
|
|
100.0% |
See accompanying notes which are an integral part of the financial statements.
Annual Report
Brokerage and Investment Management Portfolio
Financial Statements
Statement of Assets and Liabilities
|
|
February 28, 2013 |
|
|
|
|
|
|
Assets |
|
|
|
Investment in securities, at value (including securities loaned of $21,217,070) - See accompanying schedule: Unaffiliated issuers (cost $552,963,110) |
$ 574,612,213 |
|
|
Fidelity Central Funds (cost $67,983,395) |
67,983,395 |
|
|
Total Investments (cost $620,946,505) |
|
$ 642,595,608 |
|
Receivable for investments sold |
|
9,767,868 |
|
Receivable for fund shares sold |
|
1,532,153 |
|
Dividends receivable |
|
649,992 |
|
Distributions receivable from Fidelity Central Funds |
|
15,036 |
|
Prepaid expenses |
|
601 |
|
Receivable from investment adviser for expense reductions |
|
357 |
|
Other receivables |
|
94,031 |
|
Total assets |
|
654,655,646 |
|
|
|
|
|
Liabilities |
|
|
|
Payable for investments purchased |
$ 27,015,076 |
|
|
Payable for fund shares redeemed |
588,866 |
|
|
Accrued management fee |
266,090 |
|
|
Other affiliated payables |
110,575 |
|
|
Other payables and accrued expenses |
33,854 |
|
|
Collateral on securities loaned, at value |
21,867,953 |
|
|
Total liabilities |
|
49,882,414 |
|
|
|
|
|
Net Assets |
|
$ 604,773,232 |
|
Net Assets consist of: |
|
|
|
Paid in capital |
|
$ 664,202,209 |
|
Distributions in excess of net investment income |
|
(1,676,111) |
|
Accumulated undistributed net realized gain (loss) on investments and foreign currency transactions |
|
(79,404,435) |
|
Net unrealized appreciation (depreciation) on investments and assets and liabilities in foreign currencies |
|
21,651,569 |
|
Net Assets, for 10,800,894 shares outstanding |
|
$ 604,773,232 |
|
Net Asset Value, offering price and redemption price per share ($604,773,232 ÷ 10,800,894 shares) |
|
$ 55.99 |
Statement of Operations
|
|
Year ended February 28, 2013 |
|
|
|
|
|
|
Investment Income |
|
|
|
Dividends |
|
$ 14,085,492 |
|
Interest |
|
445 |
|
Income from Fidelity Central Funds |
|
146,177 |
|
Total income |
|
14,232,114 |
|
|
|
|
|
Expenses |
|
|
|
Management fee |
$ 2,271,641 |
|
|
Transfer agent fees |
986,205 |
|
|
Accounting and security lending fees |
159,578 |
|
|
Custodian fees and expenses |
21,713 |
|
|
Independent trustees' compensation |
2,617 |
|
|
Registration fees |
31,103 |
|
|
Audit |
38,841 |
|
|
Legal |
1,835 |
|
|
Interest |
234 |
|
|
Miscellaneous |
3,164 |
|
|
Total expenses before reductions |
3,516,931 |
|
|
Expense reductions |
(359,688) |
3,157,243 |
|
Net investment income (loss) |
|
11,074,871 |
|
Realized and Unrealized Gain (Loss) Net realized gain (loss) on: |
|
|
|
Investment securities: |
|
|
|
Unaffiliated issuers |
23,310,414 |
|
|
Foreign currency transactions |
72,846 |
|
|
Total net realized gain (loss) |
|
23,383,260 |
|
Change in net unrealized appreciation (depreciation) on: Investment securities |
47,764,577 |
|
|
Assets and liabilities in foreign currencies |
1,980 |
|
|
Total change in net unrealized appreciation (depreciation) |
|
47,766,557 |
|
Net gain (loss) |
|
71,149,817 |
|
Net increase (decrease) in net assets resulting from operations |
|
$ 82,224,688 |
See accompanying notes which are an integral part of the financial statements.
Annual Report
Brokerage and Investment Management Portfolio
Financial Statements - continued
Statement of Changes in Net Assets
|
|
Year ended |
Year ended |
|
Increase (Decrease) in Net Assets |
|
|
|
Operations |
|
|
|
Net investment income (loss) |
$ 11,074,871 |
$ 2,322,577 |
|
Net realized gain (loss) |
23,383,260 |
6,425,048 |
|
Change in net unrealized appreciation (depreciation) |
47,766,557 |
(74,629,734) |
|
Net increase (decrease) in net assets resulting from operations |
82,224,688 |
(65,882,109) |
|
Distributions to shareholders from net investment income |
(9,530,873) |
(4,337,210) |
|
Share transactions |
260,177,013 |
128,724,945 |
|
Reinvestment of distributions |
9,158,425 |
4,112,513 |
|
Cost of shares redeemed |
(150,492,325) |
(201,372,099) |
|
Net increase (decrease) in net assets resulting from share transactions |
118,843,113 |
(68,534,641) |
|
Redemption fees |
7,873 |
6,744 |
|
Total increase (decrease) in net assets |
191,544,801 |
(138,747,216) |
|
|
|
|
|
Net Assets |
|
|
|
Beginning of period |
413,228,431 |
551,975,647 |
|
End of period (including distributions in excess of net investment income of $1,676,111 and distributions in excess of net investment income of $1,450,399, respectively) |
$ 604,773,232 |
$ 413,228,431 |
|
Other Information Shares |
|
|
|
Sold |
5,081,081 |
2,865,057 |
|
Issued in reinvestment of distributions |
183,536 |
99,867 |
|
Redeemed |
(3,204,634) |
(4,424,392) |
|
Net increase (decrease) |
2,059,983 |
(1,459,468) |
Financial Highlights
|
Years ended February 28, |
2013 |
2012 F |
2011 |
2010 |
2009 |
|
Selected Per-Share Data |
|
|
|
|
|
|
Net asset value, beginning of period |
$ 47.28 |
$ 54.11 |
$ 47.32 |
$ 26.68 |
$ 59.56 |
|
Income from Investment Operations |
|
|
|
|
|
|
Net investment income (loss) B |
1.31 |
.26 |
.39 |
.27 |
.78 |
|
Net realized and unrealized gain (loss) |
8.52 |
(6.56) |
6.71 |
20.62 |
(30.23) |
|
Total from investment operations |
9.83 |
(6.30) |
7.10 |
20.89 |
(29.45) |
|
Distributions from net investment income |
(1.12) |
(.53) |
(.31) |
(.25) |
(.93) |
|
Distributions from net realized gain |
- |
- |
- |
- |
(2.51) |
|
Total distributions |
(1.12) |
(.53) |
(.31) |
(.25) |
(3.44) |
|
Redemption fees added to paid in capital B |
- G |
- G |
- G |
- G |
.01 |
|
Net asset value, end of period |
$ 55.99 |
$ 47.28 |
$ 54.11 |
$ 47.32 |
$ 26.68 |
|
Total Return A |
21.08% |
(11.51)% |
15.03% |
78.44% |
(51.86)% |
|
Ratios to Average Net Assets C, E |
|
|
|
|
|
|
Expenses before reductions |
.87% |
.89% |
.88% |
.93% |
.90% |
|
Expenses net of fee waivers, if any |
.87% |
.89% |
.88% |
.93% |
.90% |
|
Expenses net of all reductions |
.78% |
.85% |
.86% |
.89% |
.89% |
|
Net investment income (loss) |
2.72% |
.57% |
.79% |
.64% |
1.74% |
|
Supplemental Data |
|
|
|
|
|
|
Net assets, end of period (000 omitted) |
$ 604,773 |
$ 413,228 |
$ 551,976 |
$ 555,473 |
$ 294,618 |
|
Portfolio turnover rate D |
308% |
294% |
153% |
264% |
351% |
A Total returns would have been lower if certain expenses had not been reduced during the applicable periods shown.
B Calculated based on average shares outstanding during the period.
C Fees and expenses of any underlying Fidelity Central Funds are not included in the Fund's expense ratio. The Fund indirectly bears its proportionate share of the expenses of any underlying Fidelity Central Funds.
D Amount does not include the portfolio activity of any underlying Fidelity Central Funds.
E Expense ratios reflect operating expenses of the Fund. Expenses before reductions do not reflect amounts reimbursed by the investment adviser or reductions from brokerage service arrangements or reductions from other expense offset arrangements and do not represent the amount paid by the Fund during periods when reimbursements or reductions occur. Expenses net of fee waivers reflect expenses after reimbursement by the investment adviser but prior to reductions from brokerage service arrangements or other expense offset arrangements. Expenses net of all reductions represent the net expenses paid by the Fund.
F For the year ended February 29.
G Amount represents less than $.01 per share.
See accompanying notes which are an integral part of the financial statements.
Annual Report
Consumer Finance Portfolio
Performance: The Bottom Line
Average annual total return reflects the change in the value of an investment, assuming reinvestment of the fund's distributions from dividend income and capital gains (the profits earned upon the sale of securities that have grown in value, if any) and assuming a constant rate of performance each year. The $10,000 table and the fund's returns do not reflect the deduction of taxes that a shareholder would pay on fund distributions or the redemption of fund shares. During periods of reimbursement by Fidelity, a fund's total return will be greater than it would be had the reimbursement not occurred. How a fund did yesterday is no guarantee of how it will do tomorrow.
Average Annual Total Returns
|
Periods ended February 28, 2013 |
Past 1 |
Past 5 |
Past 10 |
|
Consumer Finance PortfolioA |
23.92% |
-7.05% |
-4.32% |
A Prior to December 1, 2010, Consumer Finance Portfolio operated under certain different investment policies. The historical performance for the fund may not represent its current investment policies.
$10,000 Over 10 Years
Let's say hypothetically that $10,000 was invested in Consumer Finance Portfolio on February 28, 2003. The chart shows how the value of your investment would have changed, and also shows how the S&P 500 Index performed over the same period.
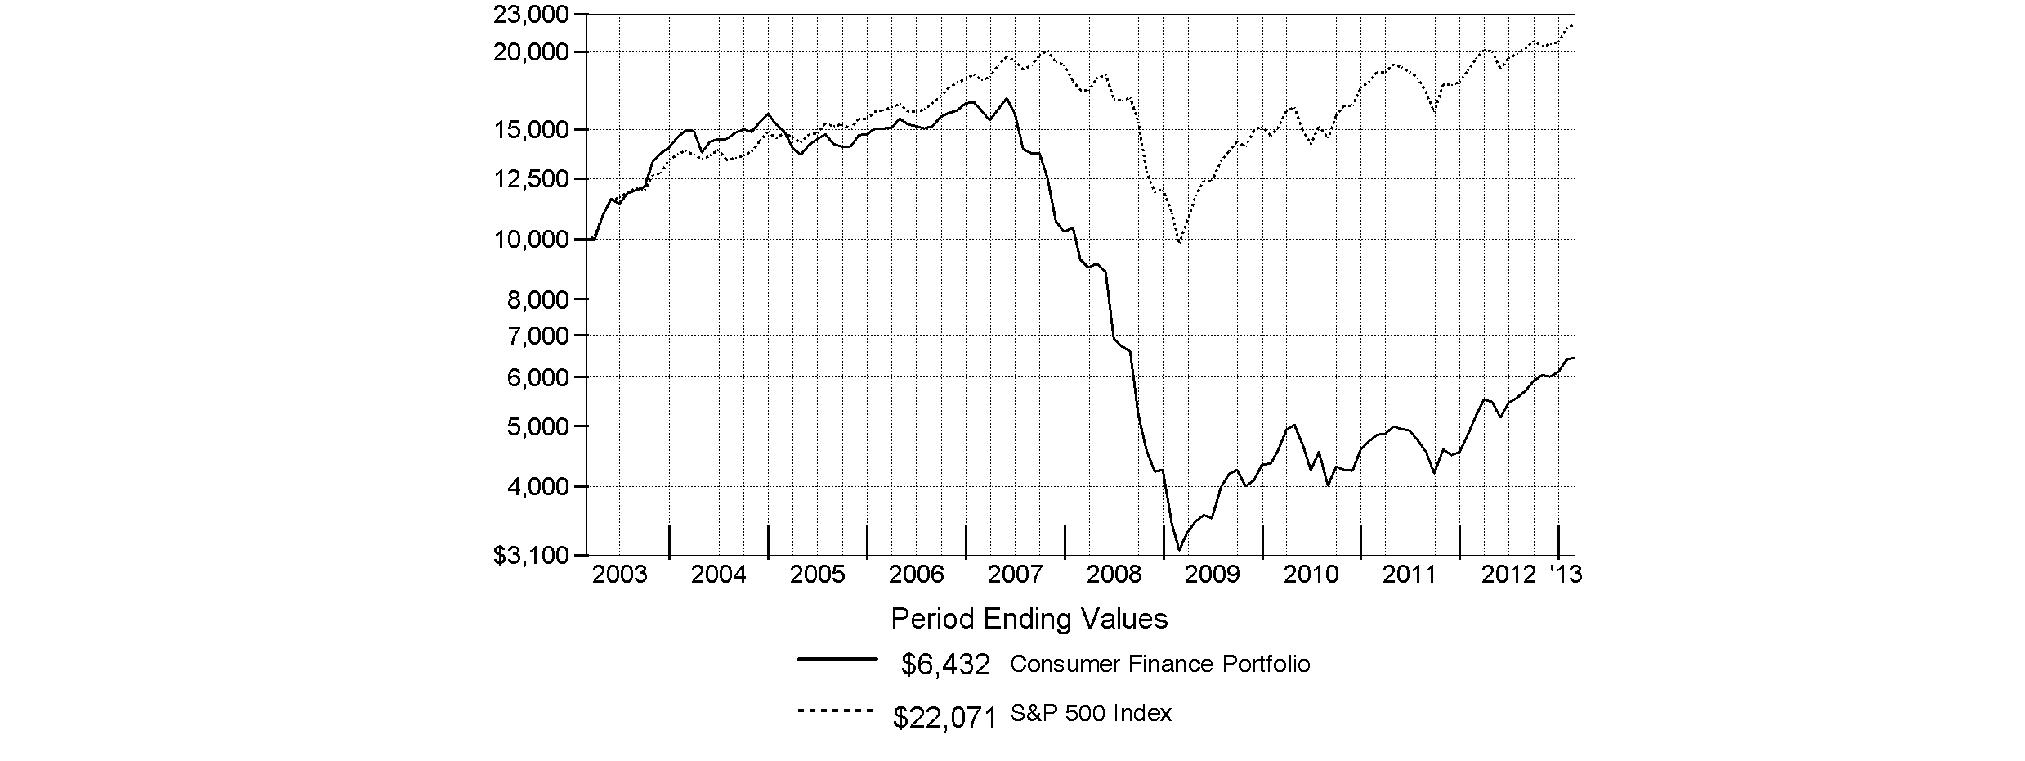
Annual Report
Consumer Finance Portfolio
Management's Discussion of Fund Performance
Market Recap: U.S. stocks posted solid gains for the year ending February 28, 2013, sparked by a late-period rally that pushed major equity benchmarks to multiyear highs. Improvement in the global economy and more monetary stimulus from the U.S. Federal Reserve kept markets on the upswing for much of the year, shrugging off an early decline brought on by debt woes in Europe, and another dip later in the period amid Congressional gridlock on the federal budget. Renewed optimism over employment, the housing market, corporate earnings and record dividends made stocks a favorite with investors during the 12 months, which helped push the broad-based S&P 500® Index across the milestone 1,500 mark at the end of January. The S&P 500® finished the period up 13.46%. Seven of the 10 major market sectors tracked by MSCI U.S. IMI 25-50 classifications produced double-digit gains, led by health care and financials, while information technology, energy and materials trailed the broad equity market with only modest advances.
Comments from Shilpa Mehra, who became sole Portfolio Manager of Consumer Finance Portfolio on November 1, 2012, after serving as Co-Manager: For the year, the fund returned 23.92%, outpacing the 20.47% gain of its industry benchmark, the S&P® Consumer Finance Index, and the broadly based S&P 500® Index. Consumer finance stocks benefited from improved U.S. economic and housing data, an increase in consumer confidence and lower-than-expected credit losses. Good security selection within mortgage real estate investment trusts (REITs) and thrifts/mortgage finance helped versus the industry benchmark. An overweighting in data processing/outsourced services contributed, but was partially offset by modestly disappointing stock picks here. Individual contributors included Ocwen Financial, a low-cost servicer of subprime mortgage loans, whose shares soared as more banks outsourced the servicing of these loans. Underweighting REITs such as Annaly Capital Management that focus on mortgage-backed securities issued by government agencies also worked, as their lack of credit exposure led to underperformance. Within consumer finance, not owning pawn and payday lender EZCORP until December was a plus because declining gold prices pressured the stock of this index component. By contrast, security selection within regional banks and Internet software/services detracted, along with a small cash position in a rising market. Among individual disappointments was a small out-of-index position in consumer finance website Bankrate, whose stock sank as declining credit card volumes led to a reduced earnings forecast. We sold Bankrate from the fund by period end. An overweighting in credit card company Capital One Financial also hurt after an acquisition, divestiture and increase in regulatory costs kept the stock from making headway.
The views expressed above reflect those of the portfolio manager(s) only through the end of the period as stated on the cover of this report and do not necessarily represent the views of Fidelity or any other person in the Fidelity organization. Any such views are subject to change at any time based upon market or other conditions and Fidelity disclaims any responsibility to update such views. These views may not be relied on as investment advice and, because investment decisions for a Fidelity fund are based on numerous factors, may not be relied on as an indication of trading intent on behalf of any Fidelity fund.
Annual Report
Consumer Finance Portfolio
Investment Changes (Unaudited)
|
Top Ten Stocks as of February 28, 2013 |
||
|
|
% of fund's |
% of fund's net assets |
|
Capital One Financial Corp. |
7.3 |
6.6 |
|
Visa, Inc. Class A |
6.7 |
7.3 |
|
MasterCard, Inc. Class A |
6.6 |
6.2 |
|
SLM Corp. |
5.5 |
5.6 |
|
American Express Co. |
5.2 |
3.2 |
|
American Capital Agency Corp. |
3.9 |
2.7 |
|
Total System Services, Inc. |
3.4 |
0.6 |
|
Citigroup, Inc. |
3.3 |
1.8 |
|
Hudson City Bancorp, Inc. |
3.3 |
0.8 |
|
Ocwen Financial Corp. |
3.3 |
2.8 |
|
|
48.5 |
|
|
Top Industries (% of fund's net assets) |
|||
|
As of February 28, 2013 |
|||
|
IT Services |
22.2% |
|
|
Consumer Finance |
22.0% |
|
|
Commercial Banks |
19.5% |
|
|
Thrifts & Mortgage Finance |
12.4% |
|
|
Real Estate Investment Trusts |
12.1% |
|
|
All Others* |
11.8% |
|

|
As of August 31, 2012 |
|||
|
Commercial Banks |
25.1% |
|
|
Consumer Finance |
21.0% |
|
|
IT Services |
17.4% |
|
|
Real Estate Investment Trusts |
14.5% |
|
|
Thrifts & Mortgage Finance |
7.5% |
|
|
All Others* |
14.5% |
|

|
* Includes short-term investments and net other assets. |
Annual Report
Consumer Finance Portfolio
Investments February 28, 2013
Showing Percentage of Net Assets
|
Common Stocks - 99.1% |
|||
|
Shares |
Value |
||
|
COMMERCIAL BANKS - 19.5% |
|||
|
Diversified Banks - 8.1% |
|||
|
Comerica, Inc. |
243,800 |
$ 8,381,844 |
|
|
U.S. Bancorp |
257,800 |
8,760,044 |
|
|
Wells Fargo & Co. |
213,000 |
7,472,040 |
|
|
|
24,613,928 |
||
|
Regional Banks - 11.4% |
|||
|
BB&T Corp. |
83,500 |
2,535,060 |
|
|
Fifth Third Bancorp |
236,900 |
3,752,496 |
|
|
First Republic Bank |
38,700 |
1,410,615 |
|
|
KeyCorp |
155,200 |
1,457,328 |
|
|
M&T Bank Corp. |
16,400 |
1,674,276 |
|
|
PNC Financial Services Group, Inc. |
85,900 |
5,359,301 |
|
|
Regions Financial Corp. |
920,000 |
7,038,000 |
|
|
SunTrust Banks, Inc. |
161,700 |
4,461,303 |
|
|
TCF Financial Corp. |
512,600 |
7,043,124 |
|
|
|
34,731,503 |
||
|
TOTAL COMMERCIAL BANKS |
59,345,431 |
||
|
COMMERCIAL SERVICES & SUPPLIES - 1.0% |
|||
|
Diversified Support Services - 1.0% |
|||
|
Edenred SA |
51,200 |
1,771,370 |
|
|
Intrum Justitia AB |
63,400 |
1,137,149 |
|
|
|
2,908,519 |
||
|
CONSUMER FINANCE - 22.0% |
|||
|
Consumer Finance - 22.0% |
|||
|
American Express Co. |
254,100 |
15,792,315 |
|
|
Capital One Financial Corp. |
435,200 |
22,208,257 |
|
|
Cash America International, Inc. |
27,150 |
1,374,876 |
|
|
DFC Global Corp. (a) |
86,600 |
1,617,688 |
|
|
Discover Financial Services |
185,800 |
7,158,874 |
|
|
EZCORP, Inc. (non-vtg.) Class A (a) |
46,200 |
955,416 |
|
|
International Personal Finance PLC |
130,900 |
793,334 |
|
|
SLM Corp. |
883,800 |
16,765,686 |
|
|
|
66,666,446 |
||
|
DIVERSIFIED FINANCIAL SERVICES - 9.1% |
|||
|
Other Diversified Financial Services - 8.2% |
|||
|
Bank of America Corp. |
800,300 |
8,987,369 |
|
|
Citigroup, Inc. |
242,800 |
10,190,316 |
|
|
JPMorgan Chase & Co. |
118,400 |
5,792,128 |
|
|
|
24,969,813 |
||
|
Specialized Finance - 0.9% |
|||
|
PHH Corp. (a)(d) |
127,400 |
2,676,674 |
|
|
TOTAL DIVERSIFIED FINANCIAL SERVICES |
27,646,487 |
||
|
IT SERVICES - 22.2% |
|||
|
Data Processing & Outsourced Services - 22.2% |
|||
|
Alliance Data Systems Corp. (a)(d) |
26,900 |
4,268,761 |
|
|
|
|||
|
Shares |
Value |
||
|
Euronet Worldwide, Inc. (a) |
116,400 |
$ 2,809,896 |
|
|
Fidelity National Information Services, Inc. |
105,300 |
3,964,545 |
|
|
Global Payments, Inc. |
119,900 |
5,780,379 |
|
|
MasterCard, Inc. Class A |
38,900 |
20,143,198 |
|
|
Total System Services, Inc. |
431,200 |
10,245,312 |
|
|
Visa, Inc. Class A |
127,584 |
20,239,926 |
|
|
|
67,452,017 |
||
|
REAL ESTATE INVESTMENT TRUSTS - 12.1% |
|||
|
Mortgage REITs - 12.1% |
|||
|
American Capital Agency Corp. |
377,200 |
11,964,784 |
|
|
Annaly Capital Management, Inc. |
136,300 |
2,111,287 |
|
|
Capstead Mortgage Corp. |
88,600 |
1,111,044 |
|
|
Chimera Investment Corp. |
1,235,800 |
3,682,684 |
|
|
Hatteras Financial Corp. |
83,000 |
2,215,270 |
|
|
Invesco Mortgage Capital, Inc. |
223,857 |
4,705,474 |
|
|
MFA Financial, Inc. |
708,100 |
6,287,928 |
|
|
Redwood Trust, Inc. |
168,300 |
3,409,758 |
|
|
Two Harbors Investment Corp. |
94,200 |
1,211,412 |
|
|
|
36,699,641 |
||
|
REAL ESTATE MANAGEMENT & DEVELOPMENT - 0.8% |
|||
|
Real Estate Services - 0.8% |
|||
|
Altisource Portfolio Solutions SA |
29,100 |
2,372,814 |
|
|
THRIFTS & MORTGAGE FINANCE - 12.4% |
|||
|
Thrifts & Mortgage Finance - 12.4% |
|||
|
Flushing Financial Corp. |
141,700 |
2,238,860 |
|
|
Hudson City Bancorp, Inc. |
1,190,485 |
10,142,932 |
|
|
Nationstar Mortgage Holdings, Inc. (d) |
120,700 |
4,650,571 |
|
|
New York Community Bancorp, Inc. |
216,900 |
2,928,150 |
|
|
Ocwen Financial Corp. (a) |
252,300 |
9,945,666 |
|
|
People's United Financial, Inc. |
206,500 |
2,705,150 |
|
|
ViewPoint Financial Group |
67,000 |
1,396,950 |
|
|
Washington Federal, Inc. |
92,900 |
1,630,395 |
|
|
WSFS Financial Corp. |
44,400 |
2,109,000 |
|
|
|
37,747,674 |
||
|
TOTAL COMMON STOCKS (Cost $269,119,571) |
|
||
|
Money Market Funds - 5.5% |
|||
|
Shares |
Value |
||
|
Fidelity Cash Central Fund, 0.16% (b) |
5,982,738 |
$ 5,982,738 |
|
|
Fidelity Securities Lending Cash Central Fund, 0.16% (b)(c) |
10,733,843 |
10,733,843 |
|
|
TOTAL MONEY MARKET FUNDS (Cost $16,716,581) |
|
||
|
TOTAL INVESTMENT PORTFOLIO - 104.6% (Cost $285,836,152) |
317,555,610 |
||
|
NET OTHER ASSETS (LIABILITIES) - (4.6)% |
(13,999,368) |
||
|
NET ASSETS - 100% |
$ 303,556,242 |
||
|
Legend |
|
(a) Non-income producing |
|
(b) Affiliated fund that is generally available only to investment companies and other accounts managed by Fidelity Investments. The rate quoted is the annualized seven-day yield of the fund at period end. A complete unaudited listing of the fund's holdings as of its most recent quarter end is available upon request. In addition, each Fidelity Central Fund's financial statements, which are not covered by the Fund's Report of Independent Registered Public Accounting Firm, are available on the SEC's website or upon request. |
|
(c) Investment made with cash collateral received from securities on loan. |
|
(d) Security or a portion of the security is on loan at period end. |
|
Affiliated Central Funds |
|
Information regarding fiscal year to date income earned by the Fund from investments in Fidelity Central Funds is as follows: |
|
Fund |
Income earned |
|
Fidelity Cash Central Fund |
$ 17,229 |
|
Fidelity Securities Lending Cash Central Fund |
17,849 |
|
Total |
$ 35,078 |
|
Other Information |
|
All investments are categorized as Level 1 under the Fair Value Hierarchy. The inputs or methodology used for valuing securities may not be an indication of the risk associated with investing in those securities. For more information on valuation inputs, please refer to the Investment Valuation section in the accompanying Notes to Financial Statements. |
See accompanying notes which are an integral part of the financial statements.
Annual Report
Consumer Finance Portfolio
Financial Statements
Statement of Assets and Liabilities
|
|
February 28, 2013 |
|
|
|
|
|
|
Assets |
|
|
|
Investment in securities, at value (including securities loaned of $10,492,842) - See accompanying schedule: Unaffiliated issuers (cost $269,119,571) |
$ 300,839,029 |
|
|
Fidelity Central Funds (cost $16,716,581) |
16,716,581 |
|
|
Total Investments (cost $285,836,152) |
|
$ 317,555,610 |
|
Receivable for investments sold |
|
4,290,070 |
|
Receivable for fund shares sold |
|
125,377 |
|
Dividends receivable |
|
288,258 |
|
Distributions receivable from Fidelity Central Funds |
|
3,891 |
|
Prepaid expenses |
|
666 |
|
Receivable from investment adviser for expense reductions |
|
70 |
|
Other receivables |
|
28,237 |
|
Total assets |
|
322,292,179 |
|
|
|
|
|
Liabilities |
|
|
|
Payable for investments purchased |
$ 5,917,248 |
|
|
Payable for fund shares redeemed |
1,830,351 |
|
|
Accrued management fee |
147,589 |
|
|
Other affiliated payables |
75,252 |
|
|
Other payables and accrued expenses |
31,654 |
|
|
Collateral on securities loaned, at value |
10,733,843 |
|
|
Total liabilities |
|
18,735,937 |
|
|
|
|
|
Net Assets |
|
$ 303,556,242 |
|
Net Assets consist of: |
|
|
|
Paid in capital |
|
$ 280,433,957 |
|
Undistributed net investment income |
|
153,363 |
|
Accumulated undistributed net realized gain (loss) on investments and foreign currency transactions |
|
(8,750,536) |
|
Net unrealized appreciation (depreciation) on investments |
|
31,719,458 |
|
Net Assets, for 19,749,458 shares outstanding |
|
$ 303,556,242 |
|
Net Asset Value, offering price and redemption price per share ($303,556,242 ÷ 19,749,458 shares) |
|
$ 15.37 |
Statement of Operations
|
|
Year ended February 28, 2013 |
|
|
|
|
|
|
Investment Income |
|
|
|
Dividends |
|
$ 7,706,268 |
|
Income from Fidelity Central Funds |
|
35,078 |
|
Total income |
|
7,741,346 |
|
|
|
|
|
Expenses |
|
|
|
Management fee |
$ 1,518,866 |
|
|
Transfer agent fees |
698,186 |
|
|
Accounting and security lending fees |
107,196 |
|
|
Custodian fees and expenses |
9,615 |
|
|
Independent trustees' compensation |
1,773 |
|
|
Registration fees |
38,584 |
|
|
Audit |
41,667 |
|
|
Legal |
1,150 |
|
|
Interest |
124 |
|
|
Miscellaneous |
1,688 |
|
|
Total expenses before reductions |
2,418,849 |
|
|
Expense reductions |
(68,526) |
2,350,323 |
|
Net investment income (loss) |
|
5,391,023 |
|
Realized and Unrealized Gain (Loss) Net realized gain (loss) on: |
|
|
|
Investment securities: |
|
|
|
Unaffiliated issuers |
28,623,271 |
|
|
Foreign currency transactions |
(1,202) |
|
|
Total net realized gain (loss) |
|
28,622,069 |
|
Change in net unrealized appreciation (depreciation) on investment securities |
|
22,333,097 |
|
Net gain (loss) |
|
50,955,166 |
|
Net increase (decrease) in net assets resulting from operations |
|
$ 56,346,189 |
See accompanying notes which are an integral part of the financial statements.
Annual Report
Statement of Changes in Net Assets
|
|
Year ended |
Year ended |
|
Increase (Decrease) in Net Assets |
|
|
|
Operations |
|
|
|
Net investment income (loss) |
$ 5,391,023 |
$ 2,508,536 |
|
Net realized gain (loss) |
28,622,069 |
4,579,990 |
|
Change in net unrealized appreciation (depreciation) |
22,333,097 |
6,126,184 |
|
Net increase (decrease) in net assets resulting from operations |
56,346,189 |
13,214,710 |
|
Distributions to shareholders from net investment income |
(5,254,457) |
(2,460,438) |
|
Distributions to shareholders from net realized gain |
(261,707) |
(165,262) |
|
Total distributions |
(5,516,164) |
(2,625,700) |
|
Share transactions |
282,686,434 |
92,296,814 |
|
Reinvestment of distributions |
5,347,969 |
2,566,050 |
|
Cost of shares redeemed |
(201,716,370) |
(41,147,880) |
|
Net increase (decrease) in net assets resulting from share transactions |
86,318,033 |
53,714,984 |
|
Redemption fees |
17,217 |
5,807 |
|
Total increase (decrease) in net assets |
137,165,275 |
64,309,801 |
|
|
|
|
|
Net Assets |
|
|
|
Beginning of period |
166,390,967 |
102,081,166 |
|
End of period (including undistributed net investment income of $153,363 and undistributed net investment income of $20,275, respectively) |
$ 303,556,242 |
$ 166,390,967 |
|
Other Information Shares |
|
|
|
Sold |
20,232,913 |
7,998,753 |
|
Issued in reinvestment of distributions |
367,092 |
231,417 |
|
Redeemed |
(14,034,397) |
(3,576,270) |
|
Net increase (decrease) |
6,565,608 |
4,653,900 |
Financial Highlights
|
Years ended February 28, |
2013 |
2012 G |
2011 |
2010 |
2009 |
|
Selected Per-Share Data |
|
|
|
|
|
|
Net asset value, beginning of period |
$ 12.62 |
$ 11.97 |
$ 11.58 |
$ 8.38 |
$ 25.83 |
|
Income from Investment Operations |
|
|
|
|
|
|
Net investment income (loss) B |
.28 |
.22 |
.19 |
.22 |
.75 |
|
Net realized and unrealized gain (loss) |
2.72 |
.64 |
.48 E |
3.44 |
(17.60) |
|
Total from investment operations |
3.00 |
.86 |
.67 |
3.66 |
(16.85) |
|
Distributions from net investment income |
(.24) |
(.20) |
(.28) |
(.46) |
(.56) |
|
Distributions from net realized gain |
(.01) |
(.01) |
- |
- |
(.05) |
|
Total distributions |
(.25) |
(.21) |
(.28) |
(.46) |
(.61) |
|
Redemption fees added to paid in capital B |
- H |
- H |
- H |
- H |
.01 |
|
Net asset value, end of period |
$ 15.37 |
$ 12.62 |
$ 11.97 |
$ 11.58 |
$ 8.38 |
|
Total Return A |
23.92% |
7.41% |
5.83% |
44.74% |
(65.96)% |
|
Ratios to Average Net Assets C, F |
|
|
|
|
|
|
Expenses before reductions |
.89% |
.95% |
1.01% |
1.05% |
.99% |
|
Expenses net of fee waivers, if any |
.89% |
.95% |
1.01% |
1.05% |
.99% |
|
Expenses net of all reductions |
.86% |
.94% |
.98% |
1.02% |
.99% |
|
Net investment income (loss) |
1.98% |
1.96% |
1.63% |
2.18% |
4.48% |
|
Supplemental Data |
|
|
|
|
|
|
Net assets, end of period (000 omitted) |
$ 303,556 |
$ 166,391 |
$ 102,081 |
$ 85,409 |
$ 51,440 |
|
Portfolio turnover rate D |
79% |
113% |
161% |
153% |
79% |
A Total returns would have been lower if certain expenses had not been reduced during the applicable periods shown.
B Calculated based on average shares outstanding during the period.
C Fees and expenses of any underlying Fidelity Central Funds are not included in the Fund's expense ratio. The Fund indirectly bears its proportionate share of the expenses of any underlying Fidelity Central Funds.
D Amount does not include the portfolio activity of any underlying Fidelity Central Funds.
E The amount shown for a share outstanding does not correspond with the aggregate net gain (loss) on investments for the period due to the timing of sales and repurchases of shares in relation to fluctuating market values of the investments of the Fund.
F Expense ratios reflect operating expenses of the Fund. Expenses before reductions do not reflect amounts reimbursed by the investment adviser or reductions from brokerage service arrangements or reductions from other expense offset arrangements and do not represent the amount paid by the Fund during periods when reimbursements or reductions occur. Expenses net of fee waivers reflect expenses after reimbursement by the investment adviser but prior to reductions from brokerage service arrangements or other expense offset arrangements. Expenses net of all reductions represent the net expenses paid by the Fund.
G For the year ended February 29.
H Amount represents less than $.01 per share.
See accompanying notes which are an integral part of the financial statements.
Annual Report
Financial Services Portfolio
Performance: The Bottom Line
Average annual total return reflects the change in the value of an investment, assuming reinvestment of the fund's distributions from dividend income and capital gains (the profits earned upon the sale of securities that have grown in value, if any) and assuming a constant rate of performance each year. The $10,000 table and the fund's returns do not reflect the deduction of taxes that a shareholder would pay on fund distributions or the redemption of fund shares. During periods of reimbursement by Fidelity, a fund's total return will be greater than it would be had the reimbursement not occurred. How a fund did yesterday is no guarantee of how it will do tomorrow.
Average Annual Total Returns
|
Periods ended February 28, 2013 |
Past 1 |
Past 5 |
Past 10 |
|
Financial Services Portfolio |
15.26% |
-3.80% |
1.83% |
$10,000 Over 10 Years
Let's say hypothetically that $10,000 was invested in Financial Services Portfolio on February 28, 2003. The chart shows how the value of your investment would have changed, and also shows how the S&P 500 Index performed over the same period.
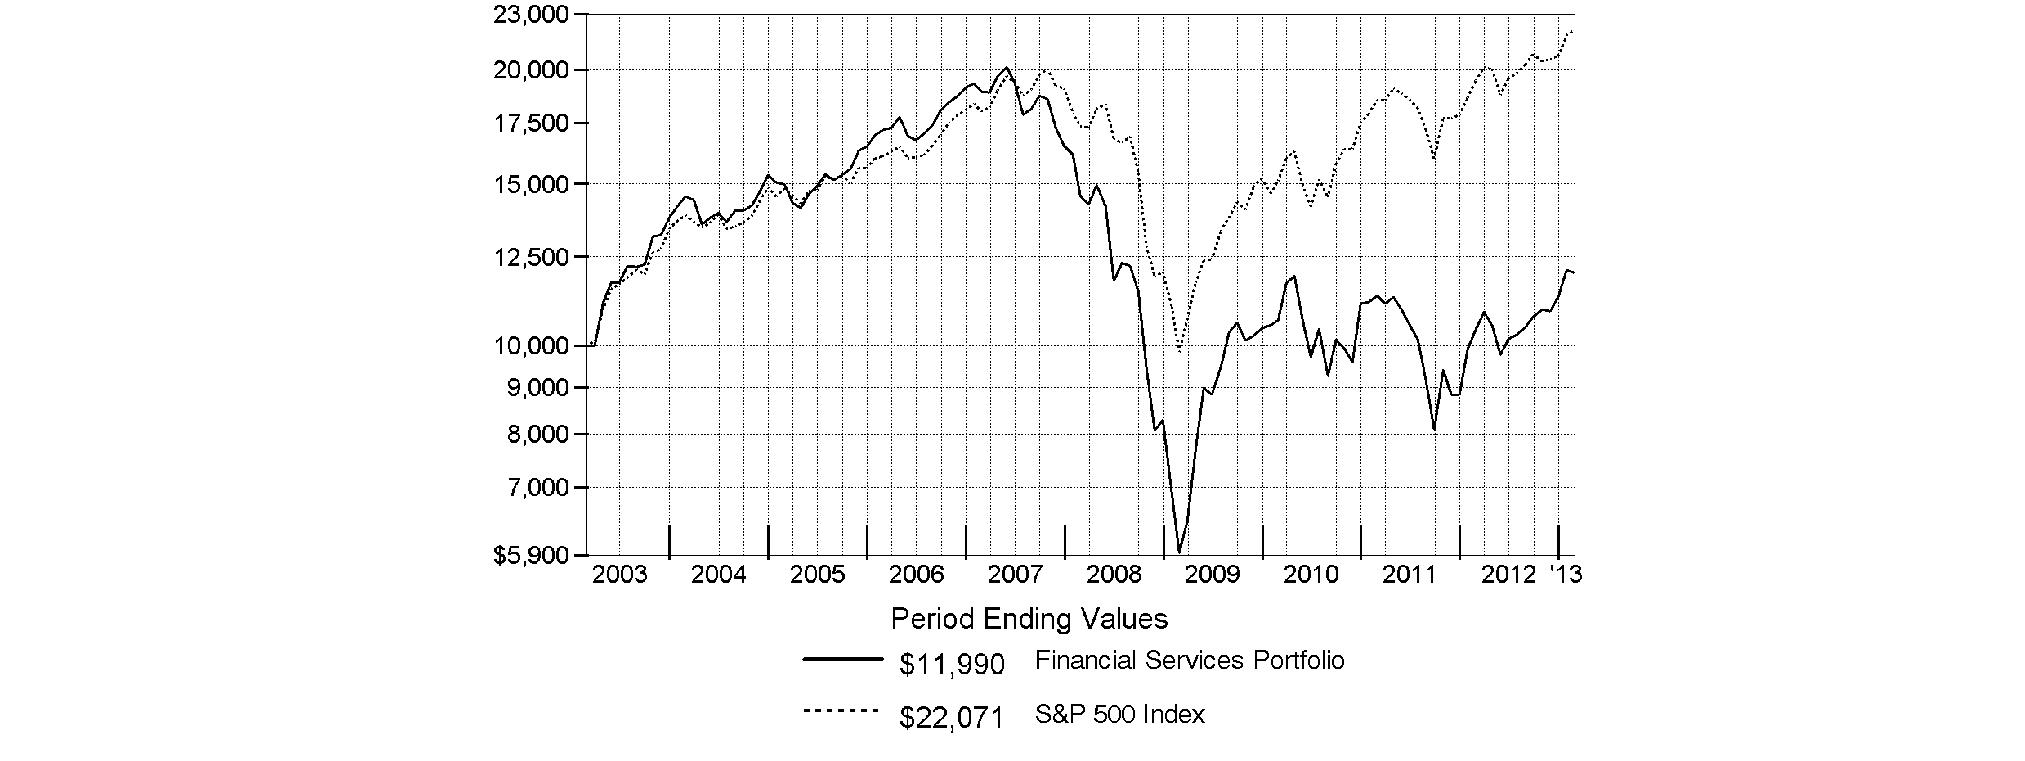
Annual Report
Financial Services Portfolio
Management's Discussion of Fund Performance
Market Recap: U.S. stocks posted solid gains for the year ending February 28, 2013, sparked by a late-period rally that pushed major equity benchmarks to multiyear highs. Improvement in the global economy and more monetary stimulus from the U.S. Federal Reserve kept markets on the upswing for much of the year, shrugging off an early decline brought on by debt woes in Europe, and another dip later in the period amid Congressional gridlock on the federal budget. Renewed optimism over employment, the housing market, corporate earnings and record dividends made stocks a favorite with investors during the 12 months, which helped push the broad-based S&P 500® Index across the milestone 1,500 mark at the end of January. The S&P 500® finished the period up 13.46%. Seven of the 10 major market sectors tracked by MSCI U.S. IMI 25-50 classifications produced double-digit gains, led by health care and financials, while information technology, energy and materials trailed the broad equity market with only modest advances.
Comments from Benjamin Hesse, Portfolio Manager of Financial Services Portfolio: For the year, the fund returned 15.26%, outpacing the S&P 500® Index, but trailing the 21.23% return of the MSCI® U.S. IMI Financials 25-50 Index. Central bank action in the U.S. and Europe, along with improving U.S. housing and economic data, helped fuel the sector's rally after a rough start to the period. However, security selection in the out-of-index data processing/outsourced services segment and multi-line insurance, along with an overweighting in residential real estate investment trusts (REITs), caused the fund to lag the MSCI index. Individual detractors included VeriFone Systems, which makes electronic payment equipment. A fire last July at a servicing facility in Brazil and increased competition in Europe hurt the stock. An overweighting early on in multi-line insurer Genworth Financial proved costly, as low interest rates and a delayed initial public offering for its Australian business pressured the stock. Elsewhere, a sizable underweighting in diversified financial services company Bank of America detracted when easing capital adequacy concerns drove the share price higher. Additionally, currency fluctuations hindered performance, given the fund's investments in foreign stocks. By contrast, stock picks within specialized finance and regional banks and an underweighting in life/health insurance aided performance. Top individual contributors included alternative asset manager Apollo Global Management, whose stock soared as the company began harvesting sizable gains, and diversified financial firm Citigroup, whose share price benefited from a stronger capital outlook and cost cutting. Apollo and VeriFone were not in the sector benchmark.
The views expressed above reflect those of the portfolio manager(s) only through the end of the period as stated on the cover of this report and do not necessarily represent the views of Fidelity or any other person in the Fidelity organization. Any such views are subject to change at any time based upon market or other conditions and Fidelity disclaims any responsibility to update such views. These views may not be relied on as investment advice and, because investment decisions for a Fidelity fund are based on numerous factors, may not be relied on as an indication of trading intent on behalf of any Fidelity fund.
Annual Report
Financial Services Portfolio
Investment Changes (Unaudited)
|
Top Ten Stocks as of February 28, 2013 |
||
|
|
% of fund's |
% of fund's net assets |
|
Comerica, Inc. |
6.7 |
0.3 |
|
Citigroup, Inc. |
4.9 |
5.0 |
|
American International Group, Inc. |
4.7 |
0.2 |
|
HCP, Inc. |
3.8 |
2.8 |
|
Big Yellow Group PLC |
3.4 |
3.6 |
|
The Blackstone Group LP |
2.9 |
2.0 |
|
A.F.P. Provida SA sponsored ADR |
2.0 |
0.5 |
|
Health Care REIT, Inc. |
2.0 |
2.7 |
|
VeriFone Systems, Inc. |
1.9 |
1.0 |
|
BanColombia SA sponsored ADR |
1.9 |
1.6 |
|
|
34.2 |
|
|
Top Industries (% of fund's net assets) |
|||
|
As of February 28, 2013 |
|||
|
Real Estate Investment Trusts |
26.4% |
|
|
Commercial Banks |
25.0% |
|
|
Insurance |
13.7% |
|
|
Capital Markets |
12.5% |
|
|
Diversified Financial Services |
8.8% |
|
|
All Others* |
13.6% |
|

|
As of August 31, 2012 |
|||
|
Real Estate Investment Trusts |
32.1% |
|
|
Diversified Financial Services |
14.6% |
|
|
Commercial Banks |
14.4% |
|
|
Insurance |
12.8% |
|
|
Capital Markets |
12.2% |
|
|
All Others* |
13.9% |
|

|
* Includes short-term investments and net other assets. |
Annual Report
Financial Services Portfolio
Investments February 28, 2013
Showing Percentage of Net Assets
|
Common Stocks - 93.8% |
|||
|
Shares |
Value |
||
|
CAPITAL MARKETS - 12.5% |
|||
|
Asset Management & Custody Banks - 9.2% |
|||
|
A.F.P. Provida SA sponsored ADR |
120,500 |
$ 12,483,800 |
|
|
Affiliated Managers Group, Inc. (a) |
298 |
43,577 |
|
|
AllianceBernstein Holding LP |
29,500 |
679,385 |
|
|
Ameriprise Financial, Inc. |
800 |
54,904 |
|
|
Apollo Global Management LLC Class A |
407,099 |
9,570,897 |
|
|
Ares Capital Corp. |
359,927 |
6,664,048 |
|
|
Ashmore Group PLC |
438,900 |
2,385,681 |
|
|
Bank of New York Mellon Corp. |
1,879 |
50,996 |
|
|
BlackRock, Inc. Class A |
193 |
46,272 |
|
|
Cohen & Steers, Inc. |
11,000 |
362,670 |
|
|
Franklin Resources, Inc. |
327 |
46,189 |
|
|
Invesco Ltd. |
28,186 |
755,103 |
|
|
Janus Capital Group, Inc. (d) |
463,604 |
4,292,973 |
|
|
Legg Mason, Inc. |
2,318 |
66,063 |
|
|
Northern Trust Corp. |
893 |
47,481 |
|
|
Och-Ziff Capital Management Group LLC Class A |
101,100 |
923,043 |
|
|
State Street Corp. |
973 |
55,062 |
|
|
The Blackstone Group LP |
949,847 |
17,952,108 |
|
|
|
56,480,252 |
||
|
Diversified Capital Markets - 0.8% |
|||
|
HFF, Inc. |
41,200 |
756,432 |
|
|
UBS AG (NY Shares) |
271,981 |
4,300,020 |
|
|
|
5,056,452 |
||
|
Investment Banking & Brokerage - 2.5% |
|||
|
Charles Schwab Corp. |
2,400 |
38,976 |
|
|
Evercore Partners, Inc. Class A |
237,913 |
9,683,059 |
|
|
GFI Group, Inc. |
1,115,636 |
3,915,882 |
|
|
Goldman Sachs Group, Inc. |
386 |
57,807 |
|
|
Investment Technology Group, Inc. (a) |
4,400 |
53,284 |
|
|
Macquarie Group Ltd. |
1,078 |
41,534 |
|
|
Monex Group, Inc. |
116 |
38,421 |
|
|
Morgan Stanley |
66,877 |
1,508,076 |
|
|
|
15,337,039 |
||
|
TOTAL CAPITAL MARKETS |
76,873,743 |
||
|
COMMERCIAL BANKS - 24.7% |
|||
|
Diversified Banks - 16.9% |
|||
|
Banco ABC Brasil SA (a) |
857 |
4,575 |
|
|
Banco Bilbao Vizcaya Argentaria SA |
114,100 |
1,105,324 |
|
|
Banco Bradesco SA (PN) sponsored ADR |
432,470 |
7,771,486 |
|
|
Banco de Chile sponsored ADR |
425 |
42,317 |
|
|
Banco Macro SA sponsored ADR (a) |
3,700 |
53,761 |
|
|
Banco Pine SA rights 3/6/13 (a) |
4,530 |
160 |
|
|
Banco Santander Chile sponsored ADR |
1,039 |
30,193 |
|
|
Banco Santander SA (Spain) sponsored ADR (d) |
6,400 |
48,512 |
|
|
Banco Santander SA (Brasil) ADR |
399,210 |
2,918,225 |
|
|
BanColombia SA sponsored ADR |
182,500 |
11,851,550 |
|
|
Bangkok Bank Public Co. Ltd. (For. Reg.) |
74,200 |
578,538 |
|
|
|
|||
|
Shares |
Value |
||
|
Bank of Baroda |
23,878 |
$ 305,513 |
|
|
Bank of the Philippine Islands (BPI) |
53,430 |
139,325 |
|
|
Barclays PLC sponsored ADR |
3,338 |
61,920 |
|
|
BBVA Banco Frances SA sponsored ADR (a) |
6,900 |
27,876 |
|
|
BNP Paribas SA |
948 |
53,349 |
|
|
China CITIC Bank Corp. Ltd. (H Shares) |
88,000 |
56,506 |
|
|
Comerica, Inc. |
1,200,291 |
41,266,005 |
|
|
CorpBanca SA sponsored ADR |
1,600 |
35,232 |
|
|
Credicorp Ltd. (NY Shares) |
300 |
44,994 |
|
|
Credit Agricole SA (a) |
600 |
5,640 |
|
|
Criteria CaixaCorp SA (d) |
138,400 |
567,722 |
|
|
Development Credit Bank Ltd. (a) |
95,718 |
70,420 |
|
|
Grupo Financiero Banorte S.A.B. de CV Series O |
286,400 |
2,127,938 |
|
|
Grupo Financiero Galicia SA sponsored ADR (a)(d) |
5,400 |
28,296 |
|
|
Guaranty Trust Bank PLC GDR (Reg. S) |
14,800 |
113,220 |
|
|
Hana Financial Group, Inc. |
11,260 |
419,517 |
|
|
HDFC Bank Ltd. sponsored ADR |
31,200 |
1,187,160 |
|
|
Hong Leong Bank Bhd |
12,100 |
57,055 |
|
|
HSBC Holdings PLC sponsored ADR |
28,200 |
1,563,408 |
|
|
ICICI Bank Ltd. sponsored ADR |
220,025 |
9,223,448 |
|
|
Industrial & Commercial Bank of China Ltd. (H Shares) |
17,000 |
12,209 |
|
|
Intesa Sanpaolo SpA |
30,559 |
49,591 |
|
|
Itau Unibanco Holding SA sponsored ADR |
1,875 |
33,113 |
|
|
KB Financial Group, Inc. |
10,300 |
372,407 |
|
|
Malayan Banking Bhd |
114,087 |
337,606 |
|
|
Nordea Bank AB |
3,400 |
39,350 |
|
|
PT Bank Bukopin Tbk |
16,869,000 |
1,361,598 |
|
|
PT Bank Central Asia Tbk |
37,000 |
42,117 |
|
|
Raiffeisen International Bank-Holding AG |
3,700 |
139,916 |
|
|
Sberbank (Savings Bank of the Russian Federation) sponsored ADR |
3,100 |
42,749 |
|
|
Standard Chartered PLC (United Kingdom) |
1,911 |
52,068 |
|
|
Swedbank AB (A Shares) |
2,600 |
62,514 |
|
|
The Jammu & Kashmir Bank Ltd. |
20,167 |
468,214 |
|
|
The Toronto-Dominion Bank |
71,700 |
5,899,389 |
|
|
U.S. Bancorp |
221,699 |
7,533,332 |
|
|
United Overseas Bank Ltd. |
3,000 |
46,221 |
|
|
Wells Fargo & Co. |
172,718 |
6,058,947 |
|
|
Yes Bank Ltd. |
6,614 |
57,418 |
|
|
|
104,367,944 |
||
|
Regional Banks - 7.8% |
|||
|
Alerus Financial Corp. |
1,500 |
51,375 |
|
|
Bancorp New Jersey, Inc. |
300 |
3,942 |
|
|
BancorpSouth, Inc. |
22,700 |
347,310 |
|
|
Bank of the Ozarks, Inc. |
26,248 |
1,007,661 |
|
|
BankUnited, Inc. |
1,500 |
42,540 |
|
|
BB&T Corp. |
98,600 |
2,993,496 |
|
|
Boston Private Financial Holdings, Inc. |
6,000 |
54,780 |
|
|
Common Stocks - continued |
|||
|
Shares |
Value |
||
|
COMMERCIAL BANKS - CONTINUED |
|||
|
Regional Banks - continued |
|||
|
Bridge Capital Holdings (a) |
132,440 |
$ 2,015,737 |
|
|
BS Financial Group, Inc. |
171,890 |
2,480,820 |
|
|
Canadian Western Bank, Edmonton (d) |
23,700 |
703,244 |
|
|
Cascade Bancorp (a) |
2,530 |
15,256 |
|
|
Citizens & Northern Corp. |
1,500 |
29,250 |
|
|
City Holding Co. |
1,200 |
45,504 |
|
|
City National Corp. |
872 |
49,538 |
|
|
CNB Financial Corp., Pennsylvania |
2,300 |
38,755 |
|
|
CoBiz, Inc. |
661,293 |
5,482,119 |
|
|
Commerce Bancshares, Inc. |
26,500 |
1,009,385 |
|
|
Fifth Third Bancorp |
86,199 |
1,365,392 |
|
|
First Business Finance Services, Inc. |
2,000 |
49,540 |
|
|
First Commonwealth Financial Corp. |
71,700 |
521,259 |
|
|
First Interstate Bancsystem, Inc. |
325,786 |
5,952,110 |
|
|
First Midwest Bancorp, Inc., Delaware |
3,900 |
48,750 |
|
|
First Republic Bank |
12,426 |
452,928 |
|
|
FirstMerit Corp. |
2,700 |
40,824 |
|
|
FNB Corp., Pennsylvania |
4,000 |
45,440 |
|
|
Glacier Bancorp, Inc. |
3,186 |
55,564 |
|
|
Huntington Bancshares, Inc. |
782,579 |
5,501,530 |
|
|
NBT Bancorp, Inc. |
400 |
8,184 |
|
|
Northrim Bancorp, Inc. |
6,100 |
132,614 |
|
|
Pacific Continental Corp. |
97,952 |
1,041,230 |
|
|
PNC Financial Services Group, Inc. |
97,689 |
6,094,817 |
|
|
PrivateBancorp, Inc. |
3,000 |
53,730 |
|
|
PT Bank Tabungan Negara Tbk |
4,918,000 |
829,547 |
|
|
Regions Financial Corp. |
416,312 |
3,184,787 |
|
|
Sandy Spring Bancorp, Inc. |
400 |
7,744 |
|
|
SCBT Financial Corp. |
2,500 |
119,050 |
|
|
Susquehanna Bancshares, Inc. |
178,375 |
2,074,501 |
|
|
SVB Financial Group (a) |
698 |
46,808 |
|
|
Texas Capital Bancshares, Inc. (a) |
1,100 |
46,486 |
|
|
Trustmark Corp. |
10,418 |
238,572 |
|
|
UMB Financial Corp. |
4,700 |
214,273 |
|
|
Valley National Bancorp (d) |
4,290 |
43,029 |
|
|
Virginia Commerce Bancorp, Inc. (a) |
9,600 |
130,176 |
|
|
Washington Trust Bancorp, Inc. |
25,900 |
684,796 |
|
|
Webster Financial Corp. |
20,700 |
455,814 |
|
|
Westamerica Bancorp. |
100 |
4,425 |
|
|
Western Alliance Bancorp. (a) |
171,661 |
2,283,091 |
|
|
|
48,097,723 |
||
|
TOTAL COMMERCIAL BANKS |
152,465,667 |
||
|
COMMERCIAL SERVICES & SUPPLIES - 0.0% |
|||
|
Diversified Support Services - 0.0% |
|||
|
Intrum Justitia AB |
2,600 |
46,634 |
|
|
CONSTRUCTION MATERIALS - 0.0% |
|||
|
Construction Materials - 0.0% |
|||
|
Headwaters, Inc. (a) |
18,400 |
173,144 |
|
|
|
|||
|
Shares |
Value |
||
|
CONSUMER FINANCE - 1.0% |
|||
|
Consumer Finance - 1.0% |
|||
|
American Express Co. |
975 |
$ 60,596 |
|
|
Capital One Financial Corp. |
23,615 |
1,205,073 |
|
|
DFC Global Corp. (a) |
9,748 |
182,093 |
|
|
EZCORP, Inc. (non-vtg.) Class A (a) |
68,804 |
1,422,867 |
|
|
First Cash Financial Services, Inc. (a) |
16,028 |
848,041 |
|
|
Green Dot Corp. Class A (a) |
9,800 |
137,396 |
|
|
International Personal Finance PLC |
662 |
4,012 |
|
|
Nelnet, Inc. Class A |
1,800 |
59,724 |
|
|
Netspend Holdings, Inc. (a) |
3,724 |
59,025 |
|
|
PT Clipan Finance Indonesia Tbk |
928,000 |
42,734 |
|
|
Regional Management Corp. |
44,400 |
797,424 |
|
|
SLM Corp. |
63,059 |
1,196,229 |
|
|
|
6,015,214 |
||
|
DIVERSIFIED CONSUMER SERVICES - 0.0% |
|||
|
Specialized Consumer Services - 0.0% |
|||
|
Sotheby's Class A (Ltd. vtg.) |
1,530 |
58,492 |
|
|
DIVERSIFIED FINANCIAL SERVICES - 8.8% |
|||
|
Other Diversified Financial Services - 5.5% |
|||
|
Bank of America Corp. |
108,158 |
1,214,614 |
|
|
BTG Pactual Participations Ltd. unit |
70,859 |
1,302,697 |
|
|
Challenger Ltd. |
355,424 |
1,310,603 |
|
|
Citigroup, Inc. |
723,780 |
30,377,047 |
|
|
JPMorgan Chase & Co. |
1,279 |
62,569 |
|
|
|
34,267,530 |
||
|
Specialized Finance - 3.3% |
|||
|
BM&F Bovespa SA |
6,400 |
43,359 |
|
|
CBOE Holdings, Inc. |
263,989 |
9,482,485 |
|
|
CME Group, Inc. |
1,022 |
61,136 |
|
|
IntercontinentalExchange, Inc. (a) |
247 |
38,241 |
|
|
MarketAxess Holdings, Inc. |
3,800 |
148,428 |
|
|
Moody's Corp. |
927 |
44,552 |
|
|
NYSE Euronext |
84,700 |
3,157,616 |
|
|
PHH Corp. (a) |
2,887 |
60,656 |
|
|
The NASDAQ Stock Market, Inc. |
224,517 |
7,108,208 |
|
|
|
20,144,681 |
||
|
TOTAL DIVERSIFIED FINANCIAL SERVICES |
54,412,211 |
||
|
ENERGY EQUIPMENT & SERVICES - 0.0% |
|||
|
Oil & Gas Equipment & Services - 0.0% |
|||
|
SBM Offshore NV (a) |
3,500 |
49,076 |
|
|
HOTELS, RESTAURANTS & LEISURE - 0.0% |
|||
|
Casinos & Gaming - 0.0% |
|||
|
Las Vegas Sands Corp. |
1,029 |
52,983 |
|
|
MGM Mirage, Inc. (a) |
3,000 |
37,470 |
|
|
Wynn Resorts Ltd. |
397 |
46,409 |
|
|
|
136,862 |
||
|
Common Stocks - continued |
|||
|
Shares |
Value |
||
|
HOTELS, RESTAURANTS & LEISURE - CONTINUED |
|||
|
Hotels, Resorts & Cruise Lines - 0.0% |
|||
|
Starwood Hotels & Resorts Worldwide, Inc. |
849 |
$ 51,220 |
|
|
TOTAL HOTELS, RESTAURANTS & LEISURE |
188,082 |
||
|
HOUSEHOLD DURABLES - 0.0% |
|||
|
Homebuilding - 0.0% |
|||
|
M.D.C. Holdings, Inc. |
1,500 |
57,645 |
|
|
PulteGroup, Inc. (a) |
5,200 |
99,736 |
|
|
|
157,381 |
||
|
INDUSTRIAL CONGLOMERATES - 0.0% |
|||
|
Industrial Conglomerates - 0.0% |
|||
|
General Electric Co. |
100 |
2,322 |
|
|
Keppel Corp. Ltd. |
4,000 |
37,597 |
|
|
|
39,919 |
||
|
INSURANCE - 13.7% |
|||
|
Insurance Brokers - 0.5% |
|||
|
Aon PLC |
900 |
54,981 |
|
|
Brasil Insurance Participacoes e Administracao SA |
112,000 |
1,185,410 |
|
|
Marsh & McLennan Companies, Inc. |
32,400 |
1,203,336 |
|
|
National Financial Partners Corp. (a) |
26,900 |
528,854 |
|
|
|
2,972,581 |
||
|
Life & Health Insurance - 1.1% |
|||
|
AFLAC, Inc. |
1,023 |
51,099 |
|
|
AIA Group Ltd. |
233,200 |
1,010,305 |
|
|
Citizens, Inc. Class A (a) |
5,800 |
53,302 |
|
|
Delta Lloyd NV |
2,909 |
51,499 |
|
|
FBL Financial Group, Inc. Class A |
800 |
29,072 |
|
|
Lincoln National Corp. |
1,700 |
50,218 |
|
|
MetLife, Inc. |
24,118 |
854,742 |
|
|
Phoenix Companies, Inc. (a) |
785 |
19,704 |
|
|
Ping An Insurance Group Co. China Ltd. (H Shares) |
10,500 |
87,866 |
|
|
Prudential Financial, Inc. |
74,491 |
4,139,465 |
|
|
Resolution Ltd. |
8,700 |
34,474 |
|
|
StanCorp Financial Group, Inc. |
11,900 |
473,739 |
|
|
Symetra Financial Corp. |
3,000 |
39,510 |
|
|
Torchmark Corp. |
900 |
50,571 |
|
|
Unum Group |
1,900 |
46,493 |
|
|
|
6,992,059 |
||
|
Multi-Line Insurance - 5.3% |
|||
|
American International Group, Inc. (a) |
769,533 |
29,249,949 |
|
|
Assurant, Inc. |
43,200 |
1,813,968 |
|
|
Fairfax Financial Holdings Ltd. (sub. vtg.) |
579 |
220,000 |
|
|
Genworth Financial, Inc. Class A (a) |
7,354 |
62,803 |
|
|
Hartford Financial Services Group, Inc. |
16,800 |
396,648 |
|
|
|
|||
|
Shares |
Value |
||
|
Loews Corp. |
9,000 |
$ 387,990 |
|
|
Porto Seguro SA |
38,100 |
505,267 |
|
|
|
32,636,625 |
||
|
Property & Casualty Insurance - 5.1% |
|||
|
ACE Ltd. |
132,759 |
11,336,291 |
|
|
Allied World Assurance Co. Holdings Ltd. |
9,500 |
834,195 |
|
|
Allstate Corp. |
1,075 |
49,472 |
|
|
Arch Capital Group Ltd. (a) |
44,700 |
2,195,664 |
|
|
Assured Guaranty Ltd. |
2,600 |
48,542 |
|
|
Axis Capital Holdings Ltd. |
25,200 |
1,026,396 |
|
|
Berkshire Hathaway, Inc. Class B (a) |
490 |
50,058 |
|
|
CNA Financial Corp. |
14,700 |
463,638 |
|
|
Erie Indemnity Co. Class A |
1,437 |
105,188 |
|
|
Fidelity National Financial, Inc. Class A |
2,000 |
49,880 |
|
|
First American Financial Corp. |
21,400 |
519,806 |
|
|
Hanover Insurance Group, Inc. |
8,175 |
348,909 |
|
|
RLI Corp. |
100 |
6,894 |
|
|
The Travelers Companies, Inc. |
131,930 |
10,609,811 |
|
|
W.R. Berkley Corp. |
11,800 |
489,700 |
|
|
XL Group PLC Class A |
107,712 |
3,084,872 |
|
|
|
31,219,316 |
||
|
Reinsurance - 1.7% |
|||
|
Everest Re Group Ltd. |
23,500 |
2,928,335 |
|
|
Montpelier Re Holdings Ltd. |
18,600 |
459,792 |
|
|
Platinum Underwriters Holdings Ltd. |
25,904 |
1,369,804 |
|
|
RenaissanceRe Holdings Ltd. |
36,900 |
3,226,536 |
|
|
Swiss Re Ltd. |
648 |
51,816 |
|
|
Validus Holdings Ltd. |
68,007 |
2,423,089 |
|
|
|
10,459,372 |
||
|
TOTAL INSURANCE |
84,279,953 |
||
|
INTERNET SOFTWARE & SERVICES - 0.0% |
|||
|
Internet Software & Services - 0.0% |
|||
|
eBay, Inc. (a) |
1,300 |
71,084 |
|
|
IT SERVICES - 5.8% |
|||
|
Data Processing & Outsourced Services - 5.8% |
|||
|
Alliance Data Systems Corp. (a) |
400 |
63,476 |
|
|
Cielo SA |
2,150 |
64,552 |
|
|
Fidelity National Information Services, Inc. |
1,800 |
67,770 |
|
|
Fiserv, Inc. (a) |
938 |
77,019 |
|
|
Global Cash Access Holdings, Inc. (a) |
43,300 |
307,430 |
|
|
Jack Henry & Associates, Inc. |
102,037 |
4,461,058 |
|
|
Lender Processing Services, Inc. |
200 |
4,912 |
|
|
The Western Union Co. |
247,611 |
3,473,982 |
|
|
Total System Services, Inc. |
355,971 |
8,457,871 |
|
|
Vantiv, Inc. |
302,907 |
6,591,256 |
|
|
VeriFone Systems, Inc. (a) |
628,608 |
11,924,694 |
|
|
Visa, Inc. Class A |
360 |
57,110 |
|
|
|
35,551,130 |
||
|
Common Stocks - continued |
|||
|
Shares |
Value |
||
|
IT SERVICES - CONTINUED |
|||
|
IT Consulting & Other Services - 0.0% |
|||
|
Accenture PLC Class A |
600 |
$ 44,616 |
|
|
Cognizant Technology Solutions Corp. Class A (a) |
578 |
44,373 |
|
|
|
88,989 |
||
|
TOTAL IT SERVICES |
35,640,119 |
||
|
MACHINERY - 0.1% |
|||
|
Industrial Machinery - 0.1% |
|||
|
Middleby Corp. (a) |
2,211 |
330,124 |
|
|
PROFESSIONAL SERVICES - 0.0% |
|||
|
Research & Consulting Services - 0.0% |
|||
|
Equifax, Inc. |
1,015 |
55,947 |
|
|
IHS, Inc. Class A (a) |
410 |
43,563 |
|
|
|
99,510 |
||
|
REAL ESTATE INVESTMENT TRUSTS - 26.4% |
|||
|
Diversified REITs - 1.5% |
|||
|
American Assets Trust, Inc. |
19,200 |
580,416 |
|
|
Duke Realty LP |
78,500 |
1,268,560 |
|
|
First Potomac Realty Trust |
2,900 |
40,977 |
|
|
Lexington Corporate Properties Trust |
669,847 |
7,676,447 |
|
|
Vornado Realty Trust |
400 |
32,084 |
|
|
|
9,598,484 |
||
|
Industrial REITs - 0.8% |
|||
|
DCT Industrial Trust, Inc. |
140,500 |
1,020,030 |
|
|
Prologis, Inc. |
97,300 |
3,788,862 |
|
|
Stag Industrial, Inc. |
3,000 |
63,630 |
|
|
|
4,872,522 |
||
|
Mortgage REITs - 1.4% |
|||
|
American Capital Agency Corp. |
118,114 |
3,746,576 |
|
|
American Capital Mortgage Investment Corp. |
4,800 |
123,360 |
|
|
Invesco Mortgage Capital, Inc. |
143,300 |
3,012,166 |
|
|
PennyMac Mortgage Investment Trust |
2,100 |
53,382 |
|
|
Two Harbors Investment Corp. |
125,200 |
1,610,072 |
|
|
|
8,545,556 |
||
|
Office REITs - 3.2% |
|||
|
BioMed Realty Trust, Inc. |
29,600 |
625,152 |
|
|
Boston Properties, Inc. |
63,300 |
6,575,604 |
|
|
Corporate Office Properties Trust (SBI) |
18,400 |
476,008 |
|
|
CyrusOne, Inc. |
52,300 |
1,114,513 |
|
|
Douglas Emmett, Inc. |
307,383 |
7,533,957 |
|
|
Highwoods Properties, Inc. (SBI) |
53,692 |
1,959,758 |
|
|
Kilroy Realty Corp. |
13,100 |
691,156 |
|
|
MPG Office Trust, Inc. (a) |
14,400 |
37,296 |
|
|
SL Green Realty Corp. |
7,012 |
572,319 |
|
|
|
19,585,763 |
||
|
|
|||
|
Shares |
Value |
||
|
Residential REITs - 5.5% |
|||
|
American Campus Communities, Inc. |
32,300 |
$ 1,459,960 |
|
|
Apartment Investment & Management Co. Class A |
163,456 |
4,841,567 |
|
|
AvalonBay Communities, Inc. |
10,892 |
1,359,648 |
|
|
BRE Properties, Inc. |
1,400 |
68,054 |
|
|
Camden Property Trust (SBI) |
60,700 |
4,196,798 |
|
|
Campus Crest Communities, Inc. |
3,100 |
38,874 |
|
|
Colonial Properties Trust (SBI) |
159,600 |
3,440,976 |
|
|
Equity Lifestyle Properties, Inc. |
59,400 |
4,377,186 |
|
|
Equity Residential (SBI) |
99,238 |
5,462,060 |
|
|
Essex Property Trust, Inc. |
16,100 |
2,398,739 |
|
|
Home Properties, Inc. |
31,235 |
1,949,689 |
|
|
Post Properties, Inc. |
62,346 |
2,976,398 |
|
|
UDR, Inc. |
51,579 |
1,230,675 |
|
|
|
33,800,624 |
||
|
Retail REITs - 0.7% |
|||
|
Federal Realty Investment Trust (SBI) |
21,000 |
2,230,410 |
|
|
Glimcher Realty Trust |
1,278 |
14,390 |
|
|
Kimco Realty Corp. |
1,800 |
39,186 |
|
|
Realty Income Corp. (d) |
43,100 |
1,967,515 |
|
|
Simon Property Group, Inc. |
268 |
42,574 |
|
|
Urstadt Biddle Properties, Inc. Class A |
3,900 |
82,407 |
|
|
|
4,376,482 |
||
|
Specialized REITs - 13.3% |
|||
|
American Tower Corp. |
700 |
54,320 |
|
|
Big Yellow Group PLC |
3,697,063 |
20,942,622 |
|
|
CubeSmart |
3,100 |
45,694 |
|
|
DiamondRock Hospitality Co. |
43,805 |
391,617 |
|
|
HCP, Inc. |
482,441 |
23,581,716 |
|
|
Health Care REIT, Inc. |
191,617 |
12,290,314 |
|
|
Host Hotels & Resorts, Inc. |
6,300 |
105,021 |
|
|
National Health Investors, Inc. |
26,900 |
1,743,120 |
|
|
Plum Creek Timber Co., Inc. |
2,300 |
111,550 |
|
|
Potlatch Corp. |
6,000 |
264,060 |
|
|
Public Storage |
17,723 |
2,679,895 |
|
|
Rayonier, Inc. |
33,700 |
1,882,819 |
|
|
Sovran Self Storage, Inc. |
1,500 |
91,260 |
|
|
Strategic Hotel & Resorts, Inc. (a) |
716,867 |
5,218,792 |
|
|
Sunstone Hotel Investors, Inc. (a) |
63,700 |
721,721 |
|
|
Ventas, Inc. |
158,497 |
11,218,418 |
|
|
Weyerhaeuser Co. |
16,259 |
478,177 |
|
|
|
81,821,116 |
||
|
TOTAL REAL ESTATE INVESTMENT TRUSTS |
162,600,547 |
||
|
REAL ESTATE MANAGEMENT & DEVELOPMENT - 0.7% |
|||
|
Diversified Real Estate Activities - 0.6% |
|||
|
Tejon Ranch Co. (a) |
23,367 |
684,653 |
|
|
The St. Joe Co. (a)(d) |
118,692 |
2,646,832 |
|
|
|
3,331,485 |
||
|
Real Estate Development - 0.0% |
|||
|
Bukit Sembawang Estates Ltd. |
23,000 |
128,706 |
|
|
Common Stocks - continued |
|||
|
Shares |
Value |
||
|
REAL ESTATE MANAGEMENT & DEVELOPMENT - CONTINUED |
|||
|
Real Estate Operating Companies - 0.1% |
|||
|
BR Malls Participacoes SA |
1,900 |
$ 24,573 |
|
|
Castellum AB |
2,857 |
42,938 |
|
|
Forest City Enterprises, Inc. Class A (a) |
29,296 |
469,908 |
|
|
Thomas Properties Group, Inc. |
6,200 |
32,302 |
|
|
|
569,721 |
||
|
Real Estate Services - 0.0% |
|||
|
CBRE Group, Inc. (a) |
2,088 |
50,467 |
|
|
Jones Lang LaSalle, Inc. |
495 |
47,837 |
|
|
Kennedy-Wilson Holdings, Inc. |
6,100 |
98,027 |
|
|
|
196,331 |
||
|
TOTAL REAL ESTATE MANAGEMENT & DEVELOPMENT |
4,226,243 |
||
|
SOFTWARE - 0.0% |
|||
|
Application Software - 0.0% |
|||
|
EPIQ Systems, Inc. |
1,600 |
19,904 |
|
|
Fair Isaac Corp. |
200 |
8,868 |
|
|
|
28,772 |
||
|
THRIFTS & MORTGAGE FINANCE - 0.1% |
|||
|
Thrifts & Mortgage Finance - 0.1% |
|||
|
Brookline Bancorp, Inc., Delaware |
2,200 |
20,020 |
|
|
Cape Bancorp, Inc. |
3,700 |
33,633 |
|
|
Cheviot Financial Corp. |
22,986 |
250,088 |
|
|
Eagle Bancorp Montana, Inc. |
1,300 |
13,468 |
|
|
Hudson City Bancorp, Inc. |
2,300 |
19,596 |
|
|
People's United Financial, Inc. |
3,000 |
39,300 |
|
|
|
376,105 |
||
|
TOTAL COMMON STOCKS (Cost $533,092,623) |
|
||
|
Nonconvertible Preferred Stocks - 0.3% |
|||
|
|
|
|
|
|
COMMERCIAL BANKS - 0.3% |
|||
|
Diversified Banks - 0.2% |
|||
|
Banco ABC Brasil SA |
34,600 |
253,461 |
|
|
Banco Pine SA |
80,870 |
586,281 |
|
|
Texas Capital Bancshares, Inc. 6.50% |
25,600 |
646,656 |
|
|
|
1,486,398 |
||
|
|
|||
|
Shares |
Value |
||
|
Regional Banks - 0.1% |
|||
|
Banco Daycoval SA (PN) 0.00% |
55,000 |
$ 305,648 |
|
|
TOTAL NONCONVERTIBLE PREFERRED STOCKS (Cost $1,703,400) |
1,792,046 |
||
|
Money Market Funds - 6.1% |
|||
|
|
|
|
|
|
Fidelity Cash Central Fund, 0.16% (b) |
32,354,733 |
32,354,733 |
|
|
Fidelity Securities Lending Cash Central Fund, 0.16% (b)(c) |
5,029,346 |
5,029,346 |
|
|
TOTAL MONEY MARKET FUNDS (Cost $37,384,079) |
|
||
|
TOTAL INVESTMENT PORTFOLIO - 100.2% (Cost $572,180,102) |
617,308,145 |
||
|
NET OTHER ASSETS (LIABILITIES) - (0.2)% |
(1,248,907) |
||
|
NET ASSETS - 100% |
$ 616,059,238 |
||
|
Legend |
|
(a) Non-income producing |
|
(b) Affiliated fund that is generally available only to investment companies and other accounts managed by Fidelity Investments. The rate quoted is the annualized seven-day yield of the fund at period end. A complete unaudited listing of the fund's holdings as of its most recent quarter end is available upon request. In addition, each Fidelity Central Fund's financial statements, which are not covered by the Fund's Report of Independent Registered Public Accounting Firm, are available on the SEC's website or upon request. |
|
(c) Investment made with cash collateral received from securities on loan. |
|
(d) Security or a portion of the security is on loan at period end. |
|
Affiliated Central Funds |
|
Information regarding fiscal year to date income earned by the Fund from investments in Fidelity Central Funds is as follows: |
|
Fund |
Income earned |
|
Fidelity Cash Central Fund |
$ 38,666 |
|
Fidelity Securities Lending Cash Central Fund |
62,977 |
|
Total |
$ 101,643 |
|
Other Information |
|
The following is a summary of the inputs used, as of February 28, 2013, involving the Fund's assets and liabilities carried at fair value. The inputs or methodology used for valuing securities may not be an indication of the risk associated with investing in those securities. For more information on valuation inputs, and their aggregation into the levels used in the table below, please refer to the Investment Valuation section in the accompanying Notes to Financial Statements. |
|
Valuation Inputs at Reporting Date: |
||||
|
Description |
Total |
Level 1 |
Level 2 |
Level 3 |
|
Investments in Securities: |
||||
|
Common Stocks |
$ 578,132,020 |
$ 576,649,554 |
$ 1,477,891 |
$ 4,575 |
|
Nonconvertible Preferred Stocks |
1,792,046 |
1,792,046 |
- |
- |
|
Money Market Funds |
37,384,079 |
37,384,079 |
- |
- |
|
Total Investments in Securities: |
$ 617,308,145 |
$ 615,825,679 |
$ 1,477,891 |
$ 4,575 |
|
Distribution of investments by country or territory of incorporation, as a percentage of total net assets, is as follows. (Unaudited) |
|
United States of America |
79.0% |
|
United Kingdom |
4.1% |
|
Switzerland |
2.6% |
|
Brazil |
2.5% |
|
Bermuda |
2.4% |
|
Chile |
2.0% |
|
Colombia |
1.9% |
|
India |
1.8% |
|
Canada |
1.1% |
|
Others (Individually Less Than 1%) |
2.6% |
|
|
100.0% |
See accompanying notes which are an integral part of the financial statements.
Annual Report
Financial Services Portfolio
Financial Statements
Statement of Assets and Liabilities
|
|
February 28, 2013 |
|
|
|
|
|
|
Assets |
|
|
|
Investment in securities, at value (including securities loaned of $4,882,604) - See accompanying schedule: Unaffiliated issuers (cost $534,796,023) |
$ 579,924,066 |
|
|
Fidelity Central Funds (cost $37,384,079) |
37,384,079 |
|
|
Total Investments (cost $572,180,102) |
|
$ 617,308,145 |
|
Cash |
|
1,771,476 |
|
Receivable for investments sold |
|
6,879,918 |
|
Receivable for fund shares sold |
|
473,724 |
|
Dividends receivable |
|
484,334 |
|
Distributions receivable from Fidelity Central Funds |
|
5,207 |
|
Prepaid expenses |
|
847 |
|
Receivable from investment adviser for expense reductions |
|
785 |
|
Other receivables |
|
78,112 |
|
Total assets |
|
627,002,548 |
|
|
|
|
|
Liabilities |
|
|
|
Payable for investments purchased |
$ 4,300,995 |
|
|
Payable for fund shares redeemed |
1,160,349 |
|
|
Accrued management fee |
285,407 |
|
|
Other affiliated payables |
124,599 |
|
|
Other payables and accrued expenses |
42,614 |
|
|
Collateral on securities loaned, at value |
5,029,346 |
|
|
Total liabilities |
|
10,943,310 |
|
|
|
|
|
Net Assets |
|
$ 616,059,238 |
|
Net Assets consist of: |
|
|
|
Paid in capital |
|
$ 667,463,027 |
|
Undistributed net investment income |
|
609,096 |
|
Accumulated undistributed net realized gain (loss) on investments and foreign currency transactions |
|
(97,140,168) |
|
Net unrealized appreciation (depreciation) on investments and assets and liabilities in foreign currencies |
|
45,127,283 |
|
Net Assets, for 9,397,213 shares outstanding |
|
$ 616,059,238 |
|
Net Asset Value, offering price and redemption price per share ($616,059,238 ÷ 9,397,213 shares) |
|
$ 65.56 |
Statement of Operations
|
|
Year ended February 28, 2013 |
|
|
|
|
|
|
Investment Income |
|
|
|
Dividends |
|
$ 11,172,850 |
|
Interest |
|
123 |
|
Income from Fidelity Central Funds |
|
101,643 |
|
Total income |
|
11,274,616 |
|
|
|
|
|
Expenses |
|
|
|
Management fee |
$ 2,580,182 |
|
|
Transfer agent fees |
1,115,692 |
|
|
Accounting and security lending fees |
181,062 |
|
|
Custodian fees and expenses |
47,185 |
|
|
Independent trustees' compensation |
3,013 |
|
|
Registration fees |
39,277 |
|
|
Audit |
50,020 |
|
|
Legal |
2,201 |
|
|
Miscellaneous |
3,300 |
|
|
Total expenses before reductions |
4,021,932 |
|
|
Expense reductions |
(422,606) |
3,599,326 |
|
Net investment income (loss) |
|
7,675,290 |
|
Realized and Unrealized Gain (Loss) Net realized gain (loss) on: |
|
|
|
Investment securities: |
|
|
|
Unaffiliated issuers |
15,089,041 |
|
|
Foreign currency transactions |
(45,284) |
|
|
Total net realized gain (loss) |
|
15,043,757 |
|
Change in net unrealized appreciation (depreciation) on: Investment securities |
42,945,418 |
|
|
Assets and liabilities in foreign currencies |
2,355 |
|
|
Total change in net unrealized appreciation (depreciation) |
|
42,947,773 |
|
Net gain (loss) |
|
57,991,530 |
|
Net increase (decrease) in net assets resulting from operations |
|
$ 65,666,820 |
See accompanying notes which are an integral part of the financial statements.
Annual Report
Statement of Changes in Net Assets
|
|
Year ended |
Year ended |
|
Increase (Decrease) in Net Assets |
|
|
|
Operations |
|
|
|
Net investment income (loss) |
$ 7,675,290 |
$ 1,467,379 |
|
Net realized gain (loss) |
15,043,757 |
(20,645,188) |
|
Change in net unrealized appreciation (depreciation) |
42,947,773 |
(12,817,989) |
|
Net increase (decrease) in net assets resulting from operations |
65,666,820 |
(31,995,798) |
|
Distributions to shareholders from net investment income |
(6,085,400) |
(961,766) |
|
Share transactions |
292,034,591 |
182,517,774 |
|
Reinvestment of distributions |
5,948,865 |
932,153 |
|
Cost of shares redeemed |
(180,543,241) |
(223,738,234) |
|
Net increase (decrease) in net assets resulting from share transactions |
117,440,215 |
(40,288,307) |
|
Redemption fees |
25,104 |
31,454 |
|
Total increase (decrease) in net assets |
177,046,739 |
(73,214,417) |
|
|
|
|
|
Net Assets |
|
|
|
Beginning of period |
439,012,499 |
512,226,916 |
|
End of period (including undistributed net investment income of $609,096 and distributions in excess of net investment income of $210,476, respectively) |
$ 616,059,238 |
$ 439,012,499 |
|
Other Information Shares |
|
|
|
Sold |
4,757,449 |
3,429,796 |
|
Issued in reinvestment of distributions |
96,934 |
19,762 |
|
Redeemed |
(3,083,350) |
(3,978,638) |
|
Net increase (decrease) |
1,771,033 |
(529,080) |
Financial Highlights
|
Years ended February 28, |
2013 |
2012 F |
2011 |
2010 |
2009 |
|
Selected Per-Share Data |
|
|
|
|
|
|
Net asset value, beginning of period |
$ 57.57 |
$ 62.81 |
$ 59.32 |
$ 33.45 |
$ 84.31 |
|
Income from Investment Operations |
|
|
|
|
|
|
Net investment income (loss) B |
.99 |
.21 |
.17 |
.37 |
1.58 |
|
Net realized and unrealized gain (loss) |
7.75 |
(5.31) |
3.49 |
26.14 |
(51.12) |
|
Total from investment operations |
8.74 |
(5.10) |
3.66 |
26.51 |
(49.54) |
|
Distributions from net investment income |
(.75) |
(.14) |
(.18) |
(.62) |
(1.22) |
|
Distributions from net realized gain |
- |
- |
- |
(.03) |
(.13) |
|
Total distributions |
(.75) |
(.14) |
(.18) |
(.65) |
(1.35) |
|
Redemption fees added to paid in capital B |
- G |
- G |
.01 |
.01 |
.03 |
|
Net asset value, end of period |
$ 65.56 |
$ 57.57 |
$ 62.81 |
$ 59.32 |
$ 33.45 |
|
Total Return A |
15.26% |
(8.07)% |
6.21% |
79.56% |
(59.22)% |
|
Ratios to Average Net Assets C, E |
|
|
|
|
|
|
Expenses before reductions |
.87% |
.90% |
.92% |
.96% |
.94% |
|
Expenses net of fee waivers, if any |
.87% |
.90% |
.92% |
.96% |
.94% |
|
Expenses net of all reductions |
.78% |
.84% |
.88% |
.92% |
.93% |
|
Net investment income (loss) |
1.66% |
.39% |
.28% |
.70% |
2.57% |
|
Supplemental Data |
|
|
|
|
|
|
Net assets, end of period (000 omitted) |
$ 616,059 |
$ 439,012 |
$ 512,227 |
$ 482,520 |
$ 227,344 |
|
Portfolio turnover rate D |
271% |
384% |
242% |
301% |
129% |
A Total returns would have been lower if certain expenses had not been reduced during the applicable periods shown.
B Calculated based on average shares outstanding during the period.
C Fees and expenses of any underlying Fidelity Central Funds are not included in the Fund's expense ratio. The Fund indirectly bears its proportionate share of the expenses of any underlying Fidelity Central Funds.
D Amount does not include the portfolio activity of any underlying Fidelity Central Funds.
E Expense ratios reflect operating expenses of the Fund. Expenses before reductions do not reflect amounts reimbursed by the investment adviser or reductions from brokerage service arrangements or reductions from other expense offset arrangements and do not represent the amount paid by the Fund during periods when reimbursements or reductions occur. Expenses net of fee waivers reflect expenses after reimbursement by the investment adviser but prior to reductions from brokerage service arrangements or other expense offset arrangements. Expenses net of all reductions represent the net expenses paid by the Fund.
F For the year ended February 29.
G Amount represents less than $.01 per share.
See accompanying notes which are an integral part of the financial statements.
Annual Report
Insurance Portfolio
Performance: The Bottom Line
Average annual total return reflects the change in the value of an investment, assuming reinvestment of the fund's distributions from dividend income and capital gains (the profits earned upon the sale of securities that have grown in value, if any) and assuming a constant rate of performance each year. The $10,000 table and the fund's returns do not reflect the deduction of taxes that a shareholder would pay on fund distributions or the redemption of fund shares. During periods of reimbursement by Fidelity, a fund's total return will be greater than it would be had the reimbursement not occurred. How a fund did yesterday is no guarantee of how it will do tomorrow.
Average Annual Total Returns
|
Periods ended February 28, 2013 |
Past 1 |
Past 5 |
Past 10 |
|
Insurance Portfolio |
22.91% |
2.47% |
6.25% |
$10,000 Over 10 Years
Let's say hypothetically that $10,000 was invested in Insurance Portfolio on February 28, 2003. The chart shows how the value of your investment would have changed, and also shows how the S&P 500 Index performed over the same period.

Annual Report
Insurance Portfolio
Management's Discussion of Fund Performance
Market Recap: U.S. stocks posted solid gains for the year ending February 28, 2013, sparked by a late-period rally that pushed major equity benchmarks to multiyear highs. Improvement in the global economy and more monetary stimulus from the U.S. Federal Reserve kept markets on the upswing for much of the year, shrugging off an early decline brought on by debt woes in Europe, and another dip later in the period amid Congressional gridlock on the federal budget. Renewed optimism over employment, the housing market, corporate earnings and record dividends made stocks a favorite with investors during the 12 months, which helped push the broad-based S&P 500® Index across the milestone 1,500 mark at the end of January. The S&P 500® finished the period up 13.46%. Seven of the 10 major market sectors tracked by MSCI U.S. IMI 25-50 classifications produced double-digit gains, led by health care and financials, while information technology, energy and materials trailed the broad equity market with only modest advances.
Comments from Court Dignan, Portfolio Manager of Insurance Portfolio: For the 12 months ending February 28, 2013, the fund returned 22.91%, beating the 20.84% gain of the MSCI® U.S. IMI Insurance 25-50 Index and also the broadly-based S&P 500®. Within the MSCI index, property/casualty (P&C) insurance, reinsurance and insurance brokers posted strong gains, driven by improved pricing within P&C. Life/health insurance stocks, however, were up only modestly, and multi-line insurance lagged. Security selection in the P&C and multi-line insurance segments gave the biggest boost versus the MSCI index. Top individual contributors included London-based P&C insurer Beazley, whose strong earnings, improved growth prospects and declaration of a large special dividend drove the stock higher. Shares of Bermuda-based P&C Axis Capital rallied, buoyed in part by underappreciated pricing power in certain specialty lines. An investment in small-cap multi-line company FBD Holdings - the largest farm insurer in Ireland - benefited from excellent earnings, a large dividend and a normalization of catastrophe costs. Stock picks within insurance brokers, along with an overweighting last summer in reinsurance when it underperformed, detracted from relative performance. Individual disappointments included Brazil-based insurance broker Brasil Insurance, whose share price declined following an earnings shortfall, and an underweighting in P&C insurer Allstate, as its stock rallied. Additionally, currency fluctuations hindered performance, given the fund's investments in foreign stocks. Beazley, FBD and Brasil Insurance were not in the index, and Brasil Insurance was not in the portfolio at period end.
The views expressed above reflect those of the portfolio manager(s) only through the end of the period as stated on the cover of this report and do not necessarily represent the views of Fidelity or any other person in the Fidelity organization. Any such views are subject to change at any time based upon market or other conditions and Fidelity disclaims any responsibility to update such views. These views may not be relied on as investment advice and, because investment decisions for a Fidelity fund are based on numerous factors, may not be relied on as an indication of trading intent on behalf of any Fidelity fund.
Annual Report
Insurance Portfolio
Investment Changes (Unaudited)
|
Top Ten Stocks as of February 28, 2013 |
||
|
|
% of fund's |
% of fund's net assets |
|
Berkshire Hathaway, Inc. Class B |
16.5 |
18.2 |
|
The Travelers Companies, Inc. |
7.8 |
8.9 |
|
American International Group, Inc. |
7.7 |
3.4 |
|
ACE Ltd. |
6.2 |
4.0 |
|
Marsh & McLennan Companies, Inc. |
6.1 |
2.2 |
|
MetLife, Inc. |
5.0 |
5.1 |
|
Everest Re Group Ltd. |
4.9 |
0.0 |
|
Axis Capital Holdings Ltd. |
4.3 |
4.7 |
|
Allied World Assurance Co. Holdings Ltd. |
4.0 |
3.0 |
|
Validus Holdings Ltd. |
3.2 |
5.4 |
|
|
65.7 |
|
|
Top Industries (% of fund's net assets) |
|||
|
As of February 28, 2013 |
|||
|
Insurance |
96.5% |
|
|
All Others* |
3.5% |
|

|
As of August 31, 2012 |
|||
|
Insurance |
95.6% |
|
 |
Professional Services |
1.1% |
|
 |
Capital Markets |
0.1% |
|
|
All Others* |
3.2% |
|

|
* Includes short-term investments and net other assets. |
Annual Report
Insurance Portfolio
Investments February 28, 2013
Showing Percentage of Net Assets
|
Common Stocks - 96.5% |
|||
|
Shares |
Value |
||
|
INSURANCE - 96.5% |
|||
|
Insurance Brokers - 8.0% |
|||
|
Arthur J. Gallagher & Co. |
91,100 |
$ 3,505,528 |
|
|
Brown & Brown, Inc. |
86,900 |
2,607,000 |
|
|
Marsh & McLennan Companies, Inc. |
500,500 |
18,588,570 |
|
|
|
24,701,098 |
||
|
Life & Health Insurance - 14.0% |
|||
|
AFLAC, Inc. |
116,900 |
5,839,155 |
|
|
AIA Group Ltd. |
7,600 |
32,926 |
|
|
CNO Financial Group, Inc. |
217,900 |
2,383,826 |
|
|
Lincoln National Corp. |
91,700 |
2,708,818 |
|
|
MetLife, Inc. |
436,175 |
15,458,042 |
|
|
Protective Life Corp. |
92,800 |
2,962,176 |
|
|
Prudential Financial, Inc. |
127,289 |
7,073,450 |
|
|
Prudential PLC |
2,060 |
30,576 |
|
|
StanCorp Financial Group, Inc. |
33,600 |
1,337,616 |
|
|
Torchmark Corp. |
90,200 |
5,068,338 |
|
|
|
42,894,923 |
||
|
Multi-Line Insurance - 11.7% |
|||
|
American Financial Group, Inc. |
36,600 |
1,608,936 |
|
|
American International Group, Inc. (a) |
617,600 |
23,474,976 |
|
|
American International Group, Inc. warrants 1/19/21 (a) |
96,169 |
1,330,979 |
|
|
FBD Holdings PLC |
347,500 |
5,557,563 |
|
|
Hartford Financial Services Group, Inc. |
159,700 |
3,770,517 |
|
|
Zurich Insurance Group AG |
1,118 |
305,950 |
|
|
|
36,048,921 |
||
|
Property & Casualty Insurance - 52.1% |
|||
|
ACE Ltd. |
223,549 |
19,088,849 |
|
|
Allied World Assurance Co. Holdings Ltd. |
139,200 |
12,223,152 |
|
|
Allstate Corp. |
181,000 |
8,329,620 |
|
|
Amerisafe, Inc. |
3,325 |
108,462 |
|
|
Arch Capital Group Ltd. (a) |
52,900 |
2,598,448 |
|
|
Aspen Insurance Holdings Ltd. |
69,700 |
2,499,442 |
|
|
Assured Guaranty Ltd. |
28,700 |
535,829 |
|
|
Axis Capital Holdings Ltd. |
325,000 |
13,237,250 |
|
|
|
|||
|
Shares |
Value |
||
|
Beazley PLC |
397,296 |
$ 1,222,312 |
|
|
Berkshire Hathaway, Inc. Class B (a) |
495,969 |
50,668,192 |
|
|
Hiscox Ltd. |
615,743 |
4,876,069 |
|
|
ProAssurance Corp. |
143,100 |
6,709,959 |
|
|
The Chubb Corp. |
62,558 |
5,256,749 |
|
|
The Travelers Companies, Inc. |
296,900 |
23,876,698 |
|
|
W.R. Berkley Corp. |
211,800 |
8,789,700 |
|
|
|
160,020,731 |
||
|
Reinsurance - 10.7% |
|||
|
Everest Re Group Ltd. |
120,600 |
15,027,966 |
|
|
Greenlight Capital Re, Ltd. (a) |
64,167 |
1,538,725 |
|
|
PartnerRe Ltd. |
7,000 |
624,680 |
|
|
Reinsurance Group of America, Inc. |
102,900 |
5,916,750 |
|
|
Validus Holdings Ltd. |
269,600 |
9,605,848 |
|
|
|
32,713,969 |
||
|
TOTAL INSURANCE (Cost $252,269,276) |
296,379,642 |
||
|
Money Market Funds - 2.7% |
|||
|
|
|
|
|
|
Fidelity Cash Central Fund, 0.16% (b) |
8,207,304 |
|
|
|
TOTAL INVESTMENT PORTFOLIO - 99.2% (Cost $260,476,580) |
304,586,946 |
||
|
NET OTHER ASSETS (LIABILITIES) - 0.8% |
2,483,958 |
||
|
NET ASSETS - 100% |
$ 307,070,904 |
||
|
Legend |
|
(a) Non-income producing |
|
(b) Affiliated fund that is generally available only to investment companies and other accounts managed by Fidelity Investments. The rate quoted is the annualized seven-day yield of the fund at period end. A complete unaudited listing of the fund's holdings as of its most recent quarter end is available upon request. In addition, each Fidelity Central Fund's financial statements, which are not covered by the Fund's Report of Independent Registered Public Accounting Firm, are available on the SEC's website or upon request. |
|
Affiliated Central Funds |
|
Information regarding fiscal year to date income earned by the Fund from investments in Fidelity Central Funds is as follows: |
|
Fund |
Income earned |
|
Fidelity Cash Central Fund |
$ 10,591 |
|
Fidelity Securities Lending Cash Central Fund |
76 |
|
Total |
$ 10,667 |
|
Other Information |
|
The following is a summary of the inputs used, as of February 28, 2013, involving the Fund's assets and liabilities carried at fair value. The inputs or methodology used for valuing securities may not be an indication of the risk associated with investing in those securities. For more information on valuation inputs, and their aggregation into the levels used in the table below, please refer to the Investment Valuation section in the accompanying Notes to Financial Statements. |
|
Valuation Inputs at Reporting Date: |
||||
|
Description |
Total |
Level 1 |
Level 2 |
Level 3 |
|
Investments in Securities: |
||||
|
Common Stocks |
$ 296,379,642 |
$ 296,349,066 |
$ 30,576 |
$ - |
|
Money Market Funds |
8,207,304 |
8,207,304 |
- |
- |
|
Total Investments in Securities: |
$ 304,586,946 |
$ 304,556,370 |
$ 30,576 |
$ - |
|
Distribution of investments by country or territory of incorporation, as a percentage of total net assets, is as follows. (Unaudited) |
|
United States of America |
71.0% |
|
Bermuda |
16.0% |
|
Switzerland |
10.3% |
|
Ireland |
1.8% |
|
Others (Individually Less Than 1%) |
0.9% |
|
|
100.0% |
See accompanying notes which are an integral part of the financial statements.
Annual Report
Insurance Portfolio
Financial Statements
Statement of Assets and Liabilities
|
|
February 28, 2013 |
|
|
|
|
|
|
Assets |
|
|
|
Investment in securities, at value - See accompanying schedule: Unaffiliated issuers (cost $252,269,276) |
$ 296,379,642 |
|
|
Fidelity Central Funds (cost $8,207,304) |
8,207,304 |
|
|
Total Investments (cost $260,476,580) |
|
$ 304,586,946 |
|
Receivable for investments sold |
|
3,734,506 |
|
Receivable for fund shares sold |
|
2,500,925 |
|
Dividends receivable |
|
393,309 |
|
Distributions receivable from Fidelity Central Funds |
|
913 |
|
Prepaid expenses |
|
490 |
|
Receivable from investment adviser for expense reductions |
|
3 |
|
Other receivables |
|
14,345 |
|
Total assets |
|
311,231,437 |
|
|
|
|
|
Liabilities |
|
|
|
Payable for investments purchased |
$ 3,864,578 |
|
|
Payable for fund shares redeemed |
54,334 |
|
|
Accrued management fee |
138,500 |
|
|
Other affiliated payables |
61,924 |
|
|
Other payables and accrued expenses |
41,197 |
|
|
Total liabilities |
|
4,160,533 |
|
|
|
|
|
Net Assets |
|
$ 307,070,904 |
|
Net Assets consist of: |
|
|
|
Paid in capital |
|
$ 256,507,579 |
|
Undistributed net investment income |
|
955,417 |
|
Accumulated undistributed net realized gain (loss) on investments and foreign currency transactions |
|
5,496,909 |
|
Net unrealized appreciation (depreciation) on investments and assets and liabilities in foreign currencies |
|
44,110,999 |
|
Net Assets, for 5,405,418 shares outstanding |
|
$ 307,070,904 |
|
Net Asset Value, offering price and redemption price per share ($307,070,904 ÷ 5,405,418 shares) |
|
$ 56.81 |
Statement of Operations
|
|
Year ended February 28, 2013 |
|
|
|
|
|
|
Investment Income |
|
|
|
Dividends |
|
$ 5,911,991 |
|
Income from Fidelity Central Funds |
|
10,667 |
|
Total income |
|
5,922,658 |
|
|
|
|
|
Expenses |
|
|
|
Management fee |
$ 1,498,706 |
|
|
Transfer agent fees |
626,133 |
|
|
Accounting and security lending fees |
104,742 |
|
|
Custodian fees and expenses |
36,416 |
|
|
Independent trustees' compensation |
1,768 |
|
|
Registration fees |
24,283 |
|
|
Audit |
41,670 |
|
|
Legal |
1,069 |
|
|
Interest |
508 |
|
|
Miscellaneous |
2,137 |
|
|
Total expenses before reductions |
2,337,432 |
|
|
Expense reductions |
(48,495) |
2,288,937 |
|
Net investment income (loss) |
|
3,633,721 |
|
Realized and Unrealized Gain (Loss) Net realized gain (loss) on: |
|
|
|
Investment securities: |
|
|
|
Unaffiliated issuers |
28,763,504 |
|
|
Foreign currency transactions |
(10,754) |
|
|
Total net realized gain (loss) |
|
28,752,750 |
|
Change in net unrealized appreciation (depreciation) on: Investment securities |
22,070,270 |
|
|
Assets and liabilities in foreign currencies |
1,162 |
|
|
Total change in net unrealized appreciation (depreciation) |
|
22,071,432 |
|
Net gain (loss) |
|
50,824,182 |
|
Net increase (decrease) in net assets resulting from operations |
|
$ 54,457,903 |
See accompanying notes which are an integral part of the financial statements.
Annual Report
Statement of Changes in Net Assets
|
|
Year ended |
Year ended |
|
Increase (Decrease) in Net Assets |
|
|
|
Operations |
|
|
|
Net investment income (loss) |
$ 3,633,721 |
$ 2,287,483 |
|
Net realized gain (loss) |
28,752,750 |
5,305,470 |
|
Change in net unrealized appreciation (depreciation) |
22,071,432 |
(15,220,844) |
|
Net increase (decrease) in net assets resulting from operations |
54,457,903 |
(7,627,891) |
|
Distributions to shareholders from net investment income |
(2,671,620) |
(2,221,509) |
|
Distributions to shareholders from net realized gain |
(4,976,342) |
- |
|
Total distributions |
(7,647,962) |
(2,221,509) |
|
Share transactions |
51,037,876 |
97,056,869 |
|
Reinvestment of distributions |
7,552,084 |
2,151,605 |
|
Cost of shares redeemed |
(69,107,383) |
(66,644,402) |
|
Net increase (decrease) in net assets resulting from share transactions |
(10,517,423) |
32,564,072 |
|
Redemption fees |
2,211 |
6,573 |
|
Total increase (decrease) in net assets |
36,294,729 |
22,721,245 |
|
|
|
|
|
Net Assets |
|
|
|
Beginning of period |
270,776,175 |
248,054,930 |
|
End of period (including undistributed net investment income of $955,417 and undistributed net investment income of $203,364, respectively) |
$ 307,070,904 |
$ 270,776,175 |
|
Other Information Shares |
|
|
|
Sold |
980,985 |
2,136,907 |
|
Issued in reinvestment of distributions |
146,776 |
48,397 |
|
Redeemed |
(1,415,569) |
(1,449,326) |
|
Net increase (decrease) |
(287,808) |
735,978 |
Financial Highlights
|
Years ended February 28, |
2013 |
2012 F |
2011 |
2010 |
2009 |
|
Selected Per-Share Data |
|
|
|
|
|
|
Net asset value, beginning of period |
$ 47.56 |
$ 50.04 |
$ 41.55 |
$ 23.95 |
$ 54.02 |
|
Income from Investment Operations |
|
|
|
|
|
|
Net investment income (loss) B |
.68 |
.43 |
.47 |
.34 |
.51 |
|
Net realized and unrealized gain (loss) |
10.06 |
(2.52) |
8.36 |
17.60 |
(30.02) |
|
Total from investment operations |
10.74 |
(2.09) |
8.83 |
17.94 |
(29.51) |
|
Distributions from net investment income |
(.52) |
(.39) |
(.34) |
(.34) |
(.54) |
|
Distributions from net realized gain |
(.97) |
- |
- |
- |
(.02) |
|
Total distributions |
(1.49) |
(.39) |
(.34) |
(.34) |
(.56) |
|
Redemption fees added to paid in capital B, G |
- |
- |
- |
- |
- |
|
Net asset value, end of period |
$ 56.81 |
$ 47.56 |
$ 50.04 |
$ 41.55 |
$ 23.95 |
|
Total Return A |
22.91% |
(4.13)% |
21.31% |
74.97% |
(54.83)% |
|
Ratios to Average Net Assets C, E |
|
|
|
|
|
|
Expenses before reductions |
.87% |
.89% |
.93% |
.99% |
.97% |
|
Expenses net of fee waivers, if any |
.87% |
.89% |
.93% |
.99% |
.97% |
|
Expenses net of all reductions |
.85% |
.88% |
.91% |
.97% |
.97% |
|
Net investment income (loss) |
1.35% |
.94% |
1.05% |
.96% |
1.27% |
|
Supplemental Data |
|
|
|
|
|
|
Net assets, end of period (000 omitted) |
$ 307,071 |
$ 270,776 |
$ 248,055 |
$ 150,176 |
$ 76,580 |
|
Portfolio turnover rate D |
157% |
153% |
193% |
215% |
426% |
A Total returns would have been lower if certain expenses had not been reduced during the applicable periods shown.
B Calculated based on average shares outstanding during the period.
C Fees and expenses of any underlying Fidelity Central Funds are not included in the Fund's expense ratio. The Fund indirectly bears its proportionate share of the expenses of any underlying Fidelity Central Funds.
D Amount does not include the portfolio activity of any underlying Fidelity Central Funds.
E Expense ratios reflect operating expenses of the Fund. Expenses before reductions do not reflect amounts reimbursed by the investment adviser or reductions from brokerage service arrangements or reductions from other expense offset arrangements and do not represent the amount paid by the Fund during periods when reimbursements or reductions occur. Expenses net of fee waivers reflect expenses after reimbursement by the investment adviser but prior to reductions from brokerage service arrangements or other expense offset arrangements. Expenses net of all reductions represent the net expenses paid by the Fund.
F For the year ended February 29.
G Amount represents less than $.01 per share.
See accompanying notes which are an integral part of the financial statements.
Annual Report
Notes to Financial Statements
For the period ended February 28, 2013
1. Organization.
Banking Portfolio, Brokerage and Investment Management Portfolio, Consumer Finance Portfolio, Financial Services Portfolio and Insurance Portfolio (the Funds) are funds of Fidelity Select Portfolios (the Trust). The Trust is registered under the Investment Company Act of 1940, as amended (the 1940 Act), as an open-end management investment company organized as a Massachusetts business trust. The Funds are non-diversified with the exception of Banking Portfolio and Financial Services Portfolio. The Funds invest primarily in securities of companies whose principal business activities fall within specific industries. Each Fund is authorized to issue an unlimited number of shares. Brokerage and Investment Management Portfolio's, Financial Services Portfolio's and Insurance Portfolio's investments in emerging markets can be subject to social, economic, regulatory and political uncertainties and can be extremely volatile.
2. Investments in Fidelity Central Funds.
The Funds invest in Fidelity Central Funds, which are open-end investment companies available only to other investment companies and accounts managed by Fidelity Management & Research Company (FMR) and its affiliates. The Funds' Schedules of Investments list each of the Fidelity Central Funds held as of period end, if any, as an investment of each Fund, but does not include the underlying holdings of each Fidelity Central Fund. As an Investing Fund, each Fund indirectly bears its proportionate share of the expenses of the underlying Fidelity Central Funds.
The Money Market Central Funds seek preservation of capital and current income and are managed by Fidelity Investments Money Management, Inc. (FIMM), an affiliate of FMR.
A complete unaudited list of holdings for each Fidelity Central Fund is available upon request or at the Securities and Exchange Commission (the SEC) website at www.sec.gov. In addition, the financial statements of the Fidelity Central Funds, which are not covered by the Funds' Report of Independent Registered Public Accounting Firm, are available on the SEC website or upon request.
3. Significant Accounting Policies.
The financial statements have been prepared in conformity with accounting principles generally accepted in the United States of America (GAAP), which require management to make certain estimates and assumptions at the date of the financial statements. Actual results could differ from those estimates. Subsequent events, if any, through the date that the financial statements were issued have been evaluated in the preparation of the financial statements. The following summarizes the significant accounting policies of the Funds:
Investment Valuation. Investments are valued as of 4:00 p.m. Eastern time on the last calendar day of the period. In accordance with valuation policies and procedures approved by the Board of Trustees (the Board), each Fund attempts to obtain prices from one or more third party pricing vendors or brokers to value its investments. When current market prices, quotations or currency exchange rates are not readily available or reliable, investments will be fair valued in good faith by the FMR Fair Value Committee (the Committee), in accordance with procedures adopted by each Fund's Board. Factors used in determining fair value vary by investment type and may include market or investment specific events. The frequency with which these procedures are used cannot be predicted and they may be utilized to a significant extent. The Committee oversees each Fund's valuation policies and procedures and is responsible for approving and reporting to the Board all fair value determinations.
Each Fund categorizes the inputs to valuation techniques used to value their investments into a disclosure hierarchy consisting of three levels as shown below:
Level 1 - quoted prices in active markets for identical investments
Level 2 - other significant observable inputs (including quoted prices for similar investments, interest rates, prepayment speeds, etc.)
Level 3 - unobservable inputs (including the Fund's own assumptions based on the best information available)
Valuation techniques used to value each Fund's investments by major category are as follows:
Equity securities, including restricted securities, for which market quotations are readily available, are valued at the last reported sale price or official closing price as reported by a third party pricing vendor on the primary market or exchange on which they are traded and are categorized as Level 1 in the hierarchy. In the event there were no sales during the day or closing prices are not available, securities are valued at the last quoted bid price or may be valued using the last available price and are generally categorized as Level 2 in the hierarchy. For foreign equity securities, when significant market or security specific events arise, comparisons to the valuation of American Depositary Receipts (ADRs), futures contracts, Exchange-Traded Funds (ETFs) and certain indexes as well as quoted prices for similar securities are used and are categorized as Level 2 in the hierarchy. Utilizing these techniques may result in transfers between Level 1 and Level 2.
Investments in open-end mutual funds, including the Fidelity Central Funds, are valued at their closing net asset value (NAV) each business day and are categorized as Level 1 in the hierarchy.
Annual Report
3. Significant Accounting Policies - continued
Investment Valuation - continued
Changes in valuation techniques may result in transfers in or out of an assigned level within the disclosure hierarchy. The aggregate value of investments by input level, as of February 28, 2013 is included at the end of each applicable Fund's Schedule of Investments.
Foreign Currency. The Funds may use foreign currency contracts to facilitate transactions in foreign-denominated securities. Gains and losses from these transactions may arise from changes in the value of the foreign currency or if the counterparties do not perform under the contracts' terms.
Foreign-denominated assets, including investment securities, and liabilities are translated into U.S. dollars at the exchange rates at period end. Purchases and sales of investment securities, income and dividends received and expenses denominated in foreign currencies are translated into U.S. dollars at the exchange rate in effect on the transaction date.
The effects of exchange rate fluctuations on investments are included with the net realized and unrealized gain (loss) on investment securities. Other foreign currency transactions resulting in realized and unrealized gain (loss) are disclosed separately.
Investment Transactions and Income. For financial reporting purposes, the Funds' investment holdings and NAV include trades executed through the end of the last business day of the period. The NAV per share for processing shareholder transactions is calculated as of the close of business of the New York Stock Exchange (NYSE), normally 4:00 p.m. Eastern time and includes trades executed through the end of the prior business day. Gains and losses on securities sold are determined on the basis of identified cost and may include proceeds received from litigation. Dividend income is recorded on the ex-dividend date, except for certain dividends from foreign securities where the ex-dividend date may have passed, which are recorded as soon as the Funds are informed of the ex-dividend date. Non-cash dividends included in dividend income, if any, are recorded at the fair market value of the securities received. Distributions received on securities that represent a return of capital or capital gain are recorded as a reduction of cost of investments and/or as a realized gain. The Funds estimate the components of distributions received that may be considered return of capital distributions or capital gain distributions. Interest income and distributions from the Fidelity Central Funds are accrued as earned. Interest income includes coupon interest and amortization of premium and accretion of discount on debt securities. Investment income is recorded net of foreign taxes withheld where recovery of such taxes is uncertain.
Expenses. Expenses directly attributable to a fund are charged to that fund. Expenses attributable to more than one fund are allocated among the respective funds on the basis of relative net assets or other appropriate methods. Expense estimates are accrued in the period to which they relate and adjustments are made when actual amounts are known.
Income Tax Information and Distributions to Shareholders. Each year, each Fund intends to qualify as a regulated investment company under Subchapter M of the Internal Revenue Code, including distributing substantially all of its taxable income and realized gains. As a result, no provision for income taxes is required. As of February 28, 2013, each Fund did not have any unrecognized tax benefits in the financial statements; nor is each Fund aware of any tax positions for which it is reasonably possible that the total amounts of unrecognized tax benefits will significantly change in the next twelve months. Each Fund files a U.S. federal tax return, in addition to state and local tax returns as required. A fund's federal income tax returns are subject to examination by the Internal Revenue Service (IRS) for a period of three fiscal years after they are filed. State and local tax returns may be subject to examination for an additional fiscal year depending on the jurisdiction. Foreign taxes are provided for based on each Fund's understanding of the tax rules and rates that exist in the foreign markets in which it invests.
Distributions are declared and recorded on the ex-dividend date. Income and capital gain distributions are determined in accordance with income tax regulations, which may differ from GAAP. In addition, certain funds claimed a portion of the payment made to redeeming shareholders as a distribution for income tax purposes.
Capital accounts within the financial statements are adjusted for permanent book-tax differences. These adjustments have no impact on net assets or the results of operations. Temporary book-tax differences will reverse in a subsequent period.
Book-tax differences are primarily due to foreign currency transactions, passive foreign investment companies (PFIC), equity-to-debt classification, partnerships, deferred trustees compensation, capital loss carryforwards, losses deferred due to wash sales and excise tax regulations.
The federal tax cost of investment securities and unrealized appreciation (depreciation) as of period end were as follows for each Fund:
|
|
Tax cost |
Gross unrealized |
Gross unrealized |
Net unrealized |
|
Banking Portfolio |
$ 562,315,890 |
$ 40,551,712 |
$ (51,922,672) |
$ (11,370,960) |
|
Brokerage and Investment Management Portfolio |
623,411,494 |
54,734,750 |
(35,550,636) |
19,184,114 |
|
Consumer Finance Portfolio |
286,578,998 |
34,774,191 |
(3,797,579) |
30,976,612 |
|
Financial Services Portfolio |
579,032,944 |
55,560,183 |
(17,284,982) |
38,275,201 |
|
Insurance Portfolio |
262,332,205 |
44,113,042 |
(1,858,301) |
42,254,741 |
Annual Report
Notes to Financial Statements - continued
3. Significant Accounting Policies - continued
Income Tax Information and Distributions to Shareholders - continued
The tax-based components of distributable earnings as of period end were as follows for each Fund:
|
|
Undistributed |
Undistributed |
Capital loss |
Net unrealized |
|
Banking Portfolio |
$ 930,839 |
$ - |
$ (17,808,226) |
$ (11,370,960) |
|
Brokerage and Investment Management Portfolio |
- |
- |
(76,939,447) |
19,186,580 |
|
Consumer Finance Portfolio |
7,727,275 |
12,523,283 |
(28,104,789) |
30,976,612 |
|
Financial Services Portfolio |
619,028 |
- |
(90,287,326) |
38,274,441 |
|
Insurance Portfolio |
2,479,453 |
5,828,500 |
- |
42,255,374 |
Capital loss carryforwards are only available to offset future capital gains of the Funds to the extent provided by regulations and may be limited. Under the Regulated Investment Company Modernization Act of 2010 (the Act), the Funds are permitted to carry forward capital losses incurred in taxable years beginning after December 22, 2010 for an unlimited period and such capital losses are required to be used prior to any losses that expire. Capital loss carryforwards were as follows:
|
|
Fiscal year of expiration |
|
||
|
|
2017 |
2018 |
2019 |
Total with expiration |
|
Banking Portfolio |
$ (7,872,687) |
$ (9,935,539) |
- |
$ (17,808,226) |
|
Brokerage and Investment Management Portfolio |
(37,046,558) |
(39,892,889) |
- |
(76,939,447) |
|
Consumer Finance Portfolio |
- |
(27,093,125) |
(1,011,664) |
(28,104,789) |
|
Financial Services Portfolio |
(72,220,809) |
(672,925) |
- |
(72,893,734) |
|
|
Total no expiration |
Total capital loss |
|
Banking Portfolio |
$ - |
$ (17,808,226) |
|
Brokerage and Investment Management Portfolio |
- |
(76,939,447) |
|
Consumer Finance Portfolio |
- |
(28,104,789) |
|
Financial Services Portfolio |
(17,393,592) |
(90,287,326) |
Due to large subscriptions in a prior period, $28,104,789 of capital losses that will be available to offset future capital gains of the Consumer Finance Portfolio will be limited to approximately $5,418,625 per year.
The tax character of distributions paid was as follows:
|
February 28, 2013 |
|
|
|
|
|
Ordinary Income |
Long-Term |
Total |
|
Banking Portfolio |
$ 6,092,882 |
- |
$ 6,092,882 |
|
Brokerage and Investment Management Portfolio |
9,530,873 |
- |
9,530,873 |
|
Consumer Finance Portfolio |
5,516,164 |
- |
5,516,164 |
|
Financial Services Portfolio |
6,085,400 |
- |
6,085,400 |
|
Insurance Portfolio |
2,671,620 |
4,976,342 |
7,647,962 |
|
February 29, 2012 |
|
|
|
Ordinary Income |
|
Banking Portfolio |
$ 1,687,594 |
|
Brokerage and Investment Management Portfolio |
4,337,210 |
|
Consumer Finance Portfolio |
2,625,700 |
|
Financial Services Portfolio |
961,766 |
|
Insurance Portfolio |
2,221,509 |
Trading (Redemption) Fees. Shares held by investors in the Funds less than 30 days are subject to a redemption fee equal to .75% of the net asset value of shares redeemed. All redemption fees, which reduce the proceeds of the shareholder redemption, are retained by the Funds and accounted for as an addition to paid in capital.
Annual Report
4. Purchases and Sales of Investments.
Purchases and sales of securities, other than short-term securities, are noted in the table below.
|
|
Purchases ($) |
Sales ($) |
|
Banking Portfolio |
356,424,994 |
322,946,218 |
|
Brokerage and Investment Management Portfolio |
1,282,639,130 |
1,178,162,716 |
|
Consumer Finance Portfolio |
293,914,900 |
204,080,839 |
|
Financial Services Portfolio |
1,301,963,687 |
1,213,577,374 |
|
Insurance Portfolio |
413,939,749 |
434,511,009 |
5. Fees and Other Transactions with Affiliates.
Management Fee. FMR and its affiliates provide the Funds with investment management related services for which the Funds pay a monthly management fee. The management fee is the sum of an individual fund fee rate and an annualized group fee rate. The individual fund fee rate is applied to each Fund's average net assets. The group fee rate is based upon the average net assets of all the mutual funds advised by FMR. The group fee rate decreases as assets under management increase and increases as assets under management decrease. For the period, each Fund's annual management fee rate expressed as a percentage of each Fund's average net assets was as follows:
|
|
Individual Rate |
Group Rate |
Total |
|
Banking Portfolio |
.30% |
.26% |
.56% |
|
Brokerage and Investment Management Portfolio |
.30% |
.26% |
.56% |
|
Consumer Finance Portfolio |
.30% |
.26% |
.56% |
|
Financial Services Portfolio |
.30% |
.26% |
.56% |
|
Insurance Portfolio |
.30% |
.26% |
.56% |
Transfer Agent Fees. Fidelity Investments Institutional Operations Company, Inc. (FIIOC), an affiliate of FMR, is the Funds' transfer, dividend disbursing and shareholder servicing agent. FIIOC receives account fees and asset-based fees that vary according to account size and type of account. FIIOC pays for typesetting, printing and mailing of shareholder reports, except proxy statements. For the period, transfer agent fees were equivalent to the following annual rates expressed as a percentage of average net assets:
|
Banking Portfolio |
.23% |
|
Brokerage and Investment Management Portfolio |
.24% |
|
Consumer Finance Portfolio |
.26% |
|
Financial Services Portfolio |
.24% |
|
Insurance Portfolio |
.23% |
Accounting and Security Lending Fees. Fidelity Service Company, Inc. (FSC), an affiliate of FMR, maintains each Fund's accounting records. The accounting fee is based on the level of average net assets for each month. Under a separate contract, FSC administers the security lending program. The security lending fee is based on the number and duration of lending transactions.
Brokerage Commissions. Certain Funds placed a portion of their portfolio transactions with brokerage firms which are affiliates of the investment adviser. The commissions paid to these affiliated firms were as follows:
|
|
Amount |
|
Banking Portfolio |
$ 20,330 |
|
Brokerage and Investment Management Portfolio |
62,673 |
|
Consumer Finance Portfolio |
19,946 |
|
Financial Services Portfolio |
69,288 |
|
Insurance Portfolio |
12,847 |
Interfund Lending Program. Pursuant to an Exemptive Order issued by the SEC, the Funds, along with other registered investment companies having management contracts with FMR, may participate in an interfund lending program. This program provides an alternative credit facility allowing
Annual Report
Notes to Financial Statements - continued
5. Fees and Other Transactions with Affiliates - continued
Interfund Lending Program - continued
the funds to borrow from, or lend money to, other participating affiliated funds. At period end, there were no interfund loans outstanding. Each applicable fund's activity in this program during the period for which loans were outstanding was as follows:
|
|
Borrower or |
Average Loan |
Weighted |
Interest Expense |
|
Brokerage and Investment Management Portfolio |
Borrower |
$ 7,032,667 |
.40% |
$ 234 |
|
Consumer Finance Portfolio |
Borrower |
$ 6,020,000 |
.37% |
$ 124 |
|
Insurance Portfolio |
Borrower |
$ 10,366,500 |
.44% |
$ 508 |
6. Committed Line of Credit.
Certain Funds participate with other funds managed by FMR or an affiliate in a $4.25 billion credit facility (the "line of credit") to be utilized for temporary or emergency purposes to fund shareholder redemptions or for other short-term liquidity purposes. The participating funds have agreed to pay commitment fees on their pro-rata portion of the line of credit, which are reflected in Miscellaneous expenses on the Statement of Operations, and are as follows:
|
Banking Portfolio |
$ 1,227 |
|
Brokerage and Investment Management Portfolio |
1,013 |
|
Consumer Finance Portfolio |
634 |
|
Financial Services Portfolio |
1,137 |
|
Insurance Portfolio |
702 |
During the period, there were no borrowings on this line of credit.
7. Security Lending.
Certain Funds lend portfolio securities through a lending agent from time to time in order to earn additional income. For equity securities, a lending agent is used and may loan securities to certain qualified borrowers, including Fidelity Capital Markets (FCM), a broker-dealer affiliated with the Funds. On the settlement date of the loan, each applicable Fund receives collateral (in the form of U.S. Treasury obligations, letters of credit and/or cash) against the loaned securities and maintains collateral in an amount not less than 100% of the market value of the loaned securities during the period of the loan. The market value of the loaned securities is determined at the close of business of the Funds and any additional required collateral is delivered to the Funds on the next business day. If the borrower defaults on its obligation to return the securities loaned because of insolvency or other reasons, a fund could experience delays and costs in recovering the securities loaned or in gaining access to the collateral. Any cash collateral received is invested in the Fidelity Securities Lending Cash Central Fund. The value of loaned securities and cash collateral at period end are disclosed on each applicable Fund's Statement of Assets and Liabilities. At period end, there were no security loans outstanding with FCM. Security lending income represents the income earned on investing cash collateral, less rebates paid to borrowers and any lending agent fees associated with the loan, plus any premium payments received for lending certain types of securities. Security lending income is presented on each applicable Fund's Statement of Operations as a component of income from Fidelity Central Funds. Security lending activity as of and during the period was as follows:
|
|
Total Security |
Security Lending |
|
Banking Portfolio |
$ 8,997 |
$ - |
|
Brokerage and Investment Management Portfolio |
88,675 |
1,784 |
|
Consumer Finance Portfolio |
17,849 |
1,445 |
|
Financial Services Portfolio |
62,977 |
73 |
|
Insurance Portfolio |
76 |
- |
8. Expense Reductions.
Many of the brokers with whom FMR places trades on behalf of certain Funds provided services to these Funds in addition to trade execution. These services included payments of expenses on behalf of each applicable Fund. In addition, through arrangements with each applicable Fund's custodian,
Annual Report
8. Expense Reductions - continued
credits realized as a result of uninvested cash balances were used to reduce each applicable Fund's expenses. All of the applicable expense reductions are noted in the table below.
|
|
Brokerage |
Custody |
|
|
|
|
|
Banking Portfolio |
$ 83,588 |
$ 16 |
|
Brokerage and Investment Management Portfolio |
359,291 |
40 |
|
Consumer Finance Portfolio |
68,451 |
5 |
|
Financial Services Portfolio |
421,811 |
10 |
|
Insurance Portfolio |
48,490 |
2 |
In addition, FMR reimbursed a portion of each Fund's operating expenses during the period as follows:
|
|
Reimbursement |
|
Banking Portfolio |
$ 210 |
|
Brokerage and Investment Management Portfolio |
357 |
|
Consumer Finance Portfolio |
70 |
|
Financial Services Portfolio |
785 |
|
Insurance Portfolio |
3 |
9. Other.
The Funds' organizational documents provide former and current trustees and officers with a limited indemnification against liabilities arising in connection with the performance of their duties to the Funds. In the normal course of business, the Funds may also enter into contracts that provide general indemnifications. The Funds' maximum exposure under these arrangements is unknown as this would be dependent on future claims that may be made against the Funds. The risk of material loss from such claims is considered remote.
At the end of the period, Strategic Advisors U.S. Opportunity Fund was the owner of record of approximately 11%, 16%, 12% and 21% of the total outstanding shares of Banking Portfolio, Consumer Finance Portfolio, Financial Services Portfolio and Insurance Portfolio, respectively. VIP FundsManager 60% Portfolio was the owner of record of approximately 21%, 15%, 21% and 31% of the total shares of Banking Portfolio, Consumer Finance Portfolio, Financial Services Portfolio and Insurance Portfolio, respectively. Mutual funds managed by FMR or its affiliates were the owners of record, in the aggregate, of approximately 43%, 25%, 36%, 46% and 70% of the total outstanding shares of Banking Portfolio, Brokerage and Investment Management Portfolio, Consumer Finance Portfolio, Financial Services Portfolio and Insurance Portfolio, respectively.
Annual Report
Report of Independent Registered Public Accounting Firm
To the Trustees of Fidelity Select Portfolios and the Shareholders of Banking Portfolio, Brokerage and Investment Management Portfolio, Consumer Finance Portfolio, Financial Services Portfolio, and Insurance Portfolio:
In our opinion, the accompanying statements of assets and liabilities, including the schedules of investments, and the related statements of operations and of changes in net assets and the financial highlights present fairly, in all material respects, the financial position of Banking Portfolio, Brokerage and Investment Management Portfolio, Consumer Finance Portfolio, Financial Services Portfolio, and Insurance Portfolio (funds of Fidelity Select Portfolios) at February 28, 2013, the results of each of their operations for the year then ended, the changes in each of their net assets for the two years in the period then ended and each of their financial highlights for the five years in the period then ended, in conformity with accounting principles generally accepted in the United States of America. These financial statements and financial highlights (hereafter referred to as "financial statements") are the responsibility of the Fidelity Select Portfolios' management. Our responsibility is to express an opinion on these financial statements based on our audits. We conducted our audits of these financial statements in accordance with the standards of the Public Company Accounting Oversight Board (United States). Those standards require that we plan and perform the audit to obtain reasonable assurance about whether the financial statements are free of material misstatement. An audit includes examining, on a test basis, evidence supporting the amounts and disclosures in the financial statements, assessing the accounting principles used and significant estimates made by management, and evaluating the overall financial statement presentation. We believe that our audits, which included confirmation of securities at February 28, 2013 by correspondence with the custodian and brokers, provide a reasonable basis for our opinion.
PricewaterhouseCoopers LLP
Boston, Massachusetts
April 16, 2013
Annual Report
Trustees and Officers
The Trustees, Members of the Advisory Board, and executive officers of the trust and funds, as applicable, are listed below. The Board of Trustees governs each fund and is responsible for protecting the interests of shareholders. The Trustees are experienced executives who meet periodically throughout the year to oversee each fund's activities, review contractual arrangements with companies that provide services to each fund, oversee management of the risks associated with such activities and contractual arrangements, and review each fund's performance. Except for James C. Curvey, each of the Trustees oversees 234 Fidelity funds. Mr. Curvey oversees 453 Fidelity funds.
The Trustees hold office without limit in time except that (a) any Trustee may resign; (b) any Trustee may be removed by written instrument, signed by at least two-thirds of the number of Trustees prior to such removal; (c) any Trustee who requests to be retired or who has become incapacitated by illness or injury may be retired by written instrument signed by a majority of the other Trustees; and (d) any Trustee may be removed at any special meeting of shareholders by a two-thirds vote of the outstanding voting securities of the trust. Each Trustee who is not an interested person of the trust and the funds (as defined in the 1940 Act) (Independent Trustee), shall retire not later than the last day of the calendar year in which his or her 75th birthday occurs. The Independent Trustees may waive this mandatory retirement age policy with respect to individual Trustees. The executive officers and Advisory Board Members hold office without limit in time, except that any officer and Advisory Board Member may resign or may be removed by a vote of a majority of the Trustees at any regular meeting or any special meeting of the Trustees. Except as indicated, each individual has held the office shown or other offices in the same company for the past five years.
Experience, Skills, Attributes, and Qualifications of the Funds' Trustees. The Governance and Nominating Committee has adopted a statement of policy that describes the experience, qualifications, attributes, and skills that are necessary and desirable for potential Independent Trustee candidates (Statement of Policy). The Board believes that each Trustee satisfied at the time he or she was initially elected or appointed a Trustee, and continues to satisfy, the standards contemplated by the Statement of Policy. The Governance and Nominating Committee also engages professional search firms to help identify potential Independent Trustee candidates who have the experience, qualifications, attributes, and skills consistent with the Statement of Policy. From time to time, additional criteria based on the composition and skills of the current Independent Trustees, as well as experience or skills that may be appropriate in light of future changes to board composition, business conditions, and regulatory or other developments, have also been considered by the professional search firms and the Governance and Nominating Committee. In addition, the Board takes into account the Trustees' commitment and participation in Board and committee meetings, as well as their leadership of standing and ad hoc committees throughout their tenure.
In determining that a particular Trustee was and continues to be qualified to serve as a Trustee, the Board has considered a variety of criteria, none of which, in isolation, was controlling. The Board believes that, collectively, the Trustees have balanced and diverse experience, qualifications, attributes, and skills, which allow the Board to operate effectively in governing each fund and protecting the interests of shareholders. Information about the specific experience, skills, attributes, and qualifications of each Trustee, which in each case led to the Board's conclusion that the Trustee should serve (or continue to serve) as a trustee of the funds, is provided below.
Board Structure and Oversight Function. James C. Curvey is an interested person (as defined in the 1940 Act) and currently serves as Chairman. The Trustees have determined that an interested Chairman is appropriate and benefits shareholders because an interested Chairman has a personal and professional stake in the quality and continuity of services provided to the funds. Independent Trustees exercise their informed business judgment to appoint an individual of their choosing to serve as Chairman, regardless of whether the Trustee happens to be independent or a member of management. The Independent Trustees have determined that they can act independently and effectively without having an Independent Trustee serve as Chairman and that a key structural component for assuring that they are in a position to do so is for the Independent Trustees to constitute a substantial majority for the Board. The Independent Trustees also regularly meet in executive session. Ned C. Lautenbach serves as Chairman of the Independent Trustees and as such (i) acts as a liaison between the Independent Trustees and management with respect to matters important to the Independent Trustees and (ii) with management prepares agendas for Board meetings.
Fidelity funds are overseen by different Boards of Trustees. The funds' Board oversees Fidelity's equity and high income funds and another Board oversees Fidelity's investment-grade bond, money market, and asset allocation funds. The asset allocation funds may invest in Fidelity funds overseen by the funds' Board. The use of separate Boards, each with its own committee structure, allows the Trustees of each group of Fidelity funds to focus on the unique issues of the funds they oversee, including common research, investment, and operational issues. On occasion, the separate Boards establish joint committees to address issues of overlapping consequences for the Fidelity funds overseen by each Board.
The Trustees operate using a system of committees to facilitate the timely and efficient consideration of all matters of importance to the Trustees, each fund, and fund shareholders and to facilitate compliance with legal and regulatory requirements and oversight of the funds' activities and associated risks. The Board, acting through its committees, has charged FMR and its affiliates with (i) identifying events or circumstances the occurrence of which could have demonstrably adverse effects on the funds' business and/or reputation; (ii) implementing processes and controls to lessen the possibility that such events or circumstances occur or to mitigate the effects of such events or circumstances if they do occur; and (iii) creating and maintaining a system designed to evaluate continuously business and market conditions in order to facilitate the identification and implementation processes described in (i) and (ii) above. Because the day-to-day operations and activities of the funds are carried out by or through FMR, its affiliates and other service providers, the funds' exposure to risks is mitigated but not eliminated by the processes overseen by the Trustees. While each of the Board's committees has responsibility for overseeing different aspects of the funds' activities, oversight is exercised primarily through the Operations, Audit, and Compliance Committees. In addition, the Independent Trustees have worked with FMR to enhance the Board's oversight of investment and financial risks, legal and regulatory risks, technology risks, and operational risks, including the development of additional risk reporting to the Board. For example, a working group comprised of Independent Trustees and FMR has worked and continues to work to review the Fidelity funds' valuation-related activities, reporting and risk management. Appropriate personnel, including but not limited to the funds' Chief Compliance Officer (CCO), FMR's internal auditor, the independent accountants, the funds' Treasurer and portfolio management personnel, make periodic reports to the Board's committees, as appropriate, including an annual review of FMR's risk management program for the Fidelity funds. The responsibilities of each standing committee, including their oversight responsibilities, are described further under "Standing Committees of the Funds' Trustees."
Annual Report
Trustees and Officers - continued
The funds' Statement of Additional Information (SAI) includes more information about the Trustees. To request a free copy, call Fidelity at 1-800-544-8544.
Interested Trustees*:
Correspondence intended for each Trustee who is an interested person may be sent to Fidelity Investments, 245 Summer Street, Boston, Massachusetts 02210.
|
Name, Year of Birth; Principal Occupations and Other Relevant Experience+ |
|
|
James C. Curvey (1935) |
|
|
|
Year of Election or Appointment: 2007 Mr. Curvey is Trustee and Chairman of the Board of Trustees of certain Trusts. Mr. Curvey also serves as Trustee (2007-present) of other investment companies advised by FMR. Mr. Curvey is a Director of Fidelity Investments Money Management, Inc. (2009-present), Director of Fidelity Research & Analysis Co. (2009-present) and Director of FMR and FMR Co., Inc. (2007-present). Mr. Curvey is also Vice Chairman (2007-present) and Director of FMR LLC. In addition, Mr. Curvey serves as an Overseer for the Boston Symphony Orchestra and a member of the Trustees of Villanova University. Previously, Mr. Curvey was the Vice Chairman (2006-2007) and Director (2000-2007) of FMR Corp. |
|
Ronald P. O'Hanley (1957) |
|
|
|
Year of Election or Appointment: 2011 Mr. O'Hanley is Director of FMR Co., Inc. (2010-present), Director of Fidelity Investments Money Management, Inc. (2010-present), Director of Fidelity Research & Analysis Company (2010-present), President of Fidelity Asset Management and Corporate Services and a member of Fidelity's Executive Committee (2010-present). Previously, Mr. O'Hanley served as President and Chief Executive Officer of BNY Mellon Asset Management (2007-2010). Mr. O'Hanley also served as Vice Chairman of Bank New York Mellon Corp. and a member of that firm's Executive Committee. Prior to the 2007 merger of The Bank of New York and Mellon Financial Corporation, he was Vice Chairman of Mellon Financial Corporation and President and Chief Executive Officer of Mellon Asset Management. He joined Mellon in February 1997. Mr. O'Hanley currently serves as Chairman of the Boston Public Library Foundation Board of Directors and sits on the Board of Directors of Beth Israel Deaconess Medical Center, the Board of Trustees of the Marine Biological Laboratory and the Advisory Board of the Maxwell School of Citizenship and Public Administration at Syracuse University. Mr. O'Hanley also chairs the Council on Asset Management for the Financial Services Roundtable and is a member of the Board of Directors of Institutional Investor's U.S. Institute. |
* Trustees have been determined to be "Interested Trustees" by virtue of, among other things, their affiliation with the trust or various entities under common control with FMR.
+ The information above includes each Trustee's principal occupation during the last five years and other information relating to the experience, attributes, and skills relevant to each Trustee's qualifications to serve as a Trustee, which led to the conclusion that each Trustee should serve as a Trustee for each fund.
Independent Trustees:
Correspondence intended for each Independent Trustee (that is, the Trustees other than the Interested Trustees) may be sent to Fidelity Investments, P.O. Box 55235, Boston, Massachusetts 02205-5235.
|
Name, Year of Birth; Principal Occupations and Other Relevant Experience+ |
|
|
Dennis J. Dirks (1948) |
|
|
|
Year of Election or Appointment: 2005 Prior to his retirement in May 2003, Mr. Dirks was Chief Operating Officer and a member of the Board of The Depository Trust & Clearing Corporation (DTCC). He also served as President, Chief Operating Officer, and Board member of The Depository Trust Company (DTC) and President and Board member of the National Securities Clearing Corporation (NSCC). In addition, Mr. Dirks served as Chief Executive Officer and Board member of the Government Securities Clearing Corporation, Chief Executive Officer and Board member of the Mortgage-Backed Securities Clearing Corporation, as a Trustee and a member of the Finance Committee of Manhattan College (2005-2008), and as a Trustee and a member of the Finance Committee of AHRC of Nassau County (2006-2008). Mr. Dirks is a member of the Independent Directors Council (IDC) Governing Council (2010-present) and Board of Directors for The Brookville Center for Children's Services, Inc. (2009-present). |
|
Alan J. Lacy (1953) |
|
|
|
Year of Election or Appointment: 2008 Mr. Lacy serves as Senior Adviser (2007-present) of Oak Hill Capital Partners, L.P. (private equity). Mr. Lacy also served as Chief Executive Officer (2000-2005) and Vice Chairman (2005-2006) of Sears Holdings Corporation and Sears, Roebuck and Co. (retail). In addition, Mr. Lacy serves as a member of the Board of Directors of Dave & Buster's Entertainment, Inc. (restaurant and entertainment complexes, 2010-present), Earth Fare, Inc. (retail grocery, 2012-present), The Hillman Companies, Inc. (hardware wholesalers, 2010-present), and Bristol-Myers Squibb Company (global pharmaceuticals, 2008-present). Mr. Lacy is a member of the Board of Trustees of The National Parks Conservation Association (2006-present). Previously, Mr. Lacy served as Chairman of the Board of Trustees of the National Parks Conservation Association (2008-2011) and as a member of the Board of Directors for the Western Union Company (global money transfer, 2006-2011). |
|
Ned C. Lautenbach (1944) |
|
|
|
Year of Election or Appointment: 2000 Mr. Lautenbach is Chairman of the Independent Trustees of the Equity and High Income Funds (2006-present). Mr. Lautenbach currently serves as the Lead Director of the Eaton Corporation Board of Directors (diversified industrial, 1997-present). Mr. Lautenbach is Chairman of the Board of Directors of the Philharmonic Center for the Arts in Naples, Florida (2012-present) and a member of the Council on Foreign Relations (1994-present). Previously, Mr. Lautenbach was a Partner/Advisory Partner at Clayton, Dubilier & Rice, LLC (private equity investment, 1998-2010), as well as a Director of Sony Corporation (2006-2007). |
|
Joseph Mauriello (1944) |
|
|
|
Year of Election or Appointment: 2008 Prior to his retirement in January 2006, Mr. Mauriello served in numerous senior management positions including Deputy Chairman and Chief Operating Officer (2004-2005), and Vice Chairman of Financial Services (2002-2004) of KPMG LLP US (professional services, 1965-2005). Mr. Mauriello currently serves as a member of the Board of Directors of XL Group plc. (global insurance and re-insurance, 2006-present). Previously, Mr. Mauriello served as a Director of the Hamilton Funds of the Bank of New York (2006-2007) and of Arcadia Resources Inc. (health care services and products, 2007-2012). |
|
Robert W. Selander (1950) |
|
|
|
Year of Election or Appointment: 2011 Previously, Mr. Selander served as a Member of the Advisory Board of Fidelity's Equity and High Income Funds (2011), Executive Vice Chairman (2010), Chief Executive Officer (2009-2010), and President and Chief Executive Officer (1997-2009) of Mastercard, Inc. |
|
Cornelia M. Small (1944) |
|
|
|
Year of Election or Appointment: 2005 Ms. Small is a member of the Board of Directors (2009-present) and Chair of the Investment Committee (2010-present) of the Teagle Foundation. Ms. Small also serves on the Investment Committee of the Berkshire Taconic Community Foundation (2008-present). Previously, Ms. Small served as Chairperson (2002-2008) and a member of the Investment Committee and Chairperson (2008-2012) and a member of the Board of Trustees of Smith College. In addition, Ms. Small served as Chief Investment Officer, Director of Global Equity Investments, and a member of the Board of Directors of Scudder, Stevens & Clark and Scudder Kemper Investments. |
|
William S. Stavropoulos (1939) |
|
|
|
Year of Election or Appointment: 2001 Mr. Stavropoulos is Vice Chairman of the Independent Trustees of the Equity and High Income Funds (2006-present). Mr. Stavropoulos serves as President and Founder of the Michigan Baseball Foundation, the Great Lakes Loons (2007-present). Mr. Stavropoulos is Chairman Emeritus of the Board of Directors of The Dow Chemical Company, where he previously served in numerous senior management positions, including President, CEO (1995-2000; 2002-2004), Chairman of the Executive Committee (2000-2006), and as a member of the Board of Directors (1990-2006). Currently, Mr. Stavropoulos is a Director of Univar Inc. (global distributor of commodity and specialty chemicals, Chairman from 2010-May 2012 and Lead Director from May 2012-present), Teradata Corporation (data warehousing and technology solutions, 2008-present), Maersk Inc. (industrial conglomerate), and Tyco International, Ltd. (multinational manufacturing and services, 2007-present), and a member of the Advisory Board for Metalmark Capital LLC (private equity investment, 2005-present). Mr. Stavropoulos is an operating advisor to Clayton, Dubilier & Rice, LLC (private equity investment). In addition, Mr. Stavropoulos is a member of the University of Notre Dame Advisory Council for the College of Science, a Trustee of the Rollin L. Gerstacker Foundation, and a Director of the Naples Philharmonic Center for the Arts. Previously, Mr. Stavropoulos served as a Director of Chemical Financial Corporation (bank holding company, 1993-2012). |
|
David M. Thomas (1949) |
|
|
|
Year of Election or Appointment: 2008 |
|
Michael E. Wiley (1950) |
|
|
|
Year of Election or Appointment: 2008 Mr. Wiley also serves as a Director of Asia Pacific Exploration Consolidated (international oil and gas exploration and production, 2008-present). Mr. Wiley serves as a Director of Tesoro Corporation (independent oil refiner and marketer, 2005-present), and a Director of Bill Barrett Corporation (exploration and production, 2005-present). In addition, Mr. Wiley also serves as a Director of Post Oak Bank (privately-held bank, 2004-present). Previously, Mr. Wiley served as a member of the Board of Trustees of the University of Tulsa (2000-2006; 2007-2010), as a Senior Energy Advisor of Katzenbach Partners, LLC (consulting, 2006-2007), as an Advisory Director of Riverstone Holdings (private investment), Chairman, President, and CEO of Baker Hughes, Inc. (oilfield services, 2000-2004), and as Director of Spinnaker Exploration Company (exploration and production, 2001-2005). |
+ The information above includes each Trustee's principal occupation during the last five years and other information relating to the experience, attributes, and skills relevant to each Trustee's qualifications to serve as a Trustee, which led to the conclusion that each Trustee should serve as a Trustee for each fund.
Advisory Board Members and Executive Officers:
Correspondence intended for David A. Rosow and Garnett A. Smith may be sent to Fidelity Investments, P.O. Box 55235, Boston, Massachusetts 02205-5235. Correspondence intended for each executive officer and Peter S. Lynch may be sent to Fidelity Investments, 245 Summer Street, Boston, Massachusetts 02210.
|
Name, Year of Birth; Principal Occupation |
|
|
Peter S. Lynch (1944) |
|
|
|
Year of Election or Appointment: 2003 Member of the Advisory Board of Fidelity's Equity and High Income Funds. Mr. Lynch is Vice Chairman and a Director of FMR and FMR Co., Inc. In addition, Mr. Lynch serves as a Trustee of Boston College and as the Chairman of the Inner-City Scholarship Fund. Previously, Mr. Lynch served on the Special Olympics International Board of Directors (1997-2006). |
|
David A. Rosow (1942) |
|
|
|
Year of Election or Appointment: 2012 Member of the Advisory Board of Fidelity's Equity and High Income Funds. Chairman and Chief Executive Officer of International Golf Group, Inc. (golf course development, 1989-present). Previously, Mr. Rosow served as Chairman and Chief Executive Officer of Rosow & Company, Inc. (private investment company, 1989-2011), a Lead Director of Hudson United Bancorp (2001-2006) and as a Director of TD Banknorth (1996-2006). In addition, Mr. Rosow is a member (2008-present) and President (2009-present) of the Town Council of Palm Beach, Florida. |
|
Garnett A. Smith (1947) |
|
|
|
Year of Election or Appointment: 2012 Member of the Advisory Board of Fidelity's Equity and High Income Funds. Prior to Mr. Smith's retirement, he served as Chairman and Chief Executive Officer of Inbrand Corp. (manufacturer of personal absorbent products, 1990-1997). He also served as President (1986-1990) of Inbrand Corp. Prior to his employment with Inbrand Corp., he was employed by a retail fabric chain and North Carolina National Bank. In addition, Mr. Smith is a board member of the Jackson Hole Land Trust (2009-present). |
|
Kenneth B. Robins (1969) |
|
|
|
Year of Election or Appointment: 2008 President and Treasurer of Fidelity's Equity and High Income Funds. Mr. Robins also serves as President and Treasurer (2010-present) and Assistant Treasurer (2009-present) of other Fidelity funds and is an employee of Fidelity Investments (2004-present). Previously, Mr. Robins served as Deputy Treasurer of the Fidelity funds (2005-2008) and Treasurer and Chief Financial Officer of The North Carolina Capital Management Trust: Cash and Term Portfolios (2006-2008). |
|
Brian B. Hogan (1964) |
|
|
|
Year of Election or Appointment: 2009 Vice President of Equity and High Income Funds. Mr. Hogan also serves as President of FMR's Equity Division (2009-present). Previously, Mr. Hogan served as Senior Vice President, Equity Research of FMR (2006-2009) and as a portfolio manager. |
|
Christopher S. Bartel (1971) |
|
|
|
Year of Election or Appointment: 2009 Vice President of Fidelity's Sector and Real Estate Equity Funds. Mr. Bartel also serves as a Director, President, and Chief Executive Officer of Fidelity Management & Research (Japan) Inc. (2012-present), a Director of Fidelity Management & Research (Hong Kong) (2012-present), and Senior Vice President of Global Equity Research (2010-present). Previously, Mr. Bartel served as Senior Vice President of Equity Research (2009-2010), Managing Director of Research (2006-2009), and an analyst and portfolio manager (2000-2006). |
|
Scott C. Goebel (1968) |
|
|
|
Year of Election or Appointment: 2008 Secretary and Chief Legal Officer (CLO) of the Fidelity funds. Mr. Goebel also serves as Secretary of Fidelity Investments Money Management, Inc. (FIMM) (2010-present) and Fidelity Research and Analysis Company (FRAC) (2010-present); Secretary and CLO of The North Carolina Capital Management Trust: Cash and Term Portfolios (2008-present); General Counsel, Secretary, and Senior Vice President of FMR (2008-present) and FMR Co., Inc. (2008-present); employed by FMR LLC or an affiliate (2001-present); Chief Legal Officer of Fidelity Management & Research (Hong Kong) Limited (2008-present) and Assistant Secretary of Fidelity Management & Research (Japan) Inc. (2008-present), and Fidelity Management & Research (U.K.) Inc. (2008-present). Previously, Mr. Goebel served as Assistant Secretary of FIMM (2008-2010), FRAC (2008-2010), and the Funds (2007-2008) and as Vice President and Secretary of Fidelity Distributors Corporation (FDC) (2005-2007). |
|
William C. Coffey (1969) |
|
|
|
Year of Election or Appointment: 2009 Assistant Secretary of Fidelity's Equity and High Income Funds. Mr. Coffey also serves as Senior Vice President and Deputy General Counsel of FMR LLC (2010-present), and is an employee of Fidelity Investments. Previously, Mr. Coffey served as Vice President and Associate General Counsel of FMR LLC (2005-2009). |
|
Elizabeth Paige Baumann (1968) |
|
|
|
Year of Election or Appointment: 2012 Anti-Money Laundering (AML) Officer of the Fidelity funds. Ms. Baumann also serves as AML Officer of The North Carolina Capital Management Trust: Cash and Term Portfolios (2012-present), Chief AML Officer of FMR LLC (2012-present), and is an employee of Fidelity Investments. Previously, Ms. Baumann served as Vice President and Deputy Anti-Money Laundering Officer (2007-2012). |
|
Christine Reynolds (1958) |
|
|
|
Year of Election or Appointment: 2008 Chief Financial Officer of the Fidelity funds. Ms. Reynolds became President of Fidelity Pricing and Cash Management Services (FPCMS) in August 2008. Ms. Reynolds served as Chief Operating Officer of FPCMS (2007-2008). Previously, Ms. Reynolds served as President, Treasurer, and Anti-Money Laundering officer of the Fidelity funds (2004-2007). |
|
Joseph A. Hanlon (1968) |
|
|
|
Year of Election or Appointment: 2012 Chief Compliance Officer of Fidelity's Equity and High Income Funds. Mr. Hanlon serves as Compliance Officer of FMR, FMR Co., Inc., Fidelity Investments Money Management, Inc. (FIMM), Fidelity Research and Analysis Company (FRAC), Fidelity Management & Research (Japan) Inc., Fidelity Management & Research (U.K.) Inc., Fidelity Management & Research (Hong Kong), and Strategic Advisers, Inc. (2009-present), as Senior Vice President of the Fidelity Asset Management Division (2009-present), and is an employee of Fidelity Investments. |
|
Joseph F. Zambello (1957) |
|
|
|
Year of Election or Appointment: 2011 Deputy Treasurer of the Fidelity funds. Mr. Zambello is an employee of Fidelity Investments. Previously, Mr. Zambello served as Vice President of FMR's Program Management Group (2009-2011) and Vice President of the Transfer Agent Oversight Group (2005-2009). |
|
Adrien E. Deberghes (1967) |
|
|
|
Year of Election or Appointment: 2008 Deputy Treasurer of Fidelity's Equity and High Income Funds. Mr. Deberghes also serves as Vice President (2011-present) and Assistant Treasurer (2010-present) of other Fidelity funds, and is an employee of Fidelity Investments (2008-present). Previously, Mr. Deberghes served as Senior Vice President of Mutual Fund Administration at State Street Corporation (2007-2008), Senior Director of Mutual Fund Administration at Investors Bank & Trust (2005-2007), and Director of Finance for Dunkin' Brands (2000-2005). |
|
Stephen Sadoski (1971) |
|
|
|
Year of Election or Appointment: 2012 Deputy Treasurer of Fidelity's Equity and High Income Funds. Mr. Sadoski also serves as Deputy Treasurer of other Fidelity funds (2013-present) and is an employee of Fidelity Investments (2012-present). Previously, Mr. Sadoski served as Assistant Treasurer of Fidelity's Fixed Income and Asset Allocation Funds (2012-2013), an assistant chief accountant in the Division of Investment Management of the Securities and Exchange Commission (SEC) (2009-2012) and as a senior manager at Deloitte & Touche (1997-2009). |
|
Stacie Smith (1974) |
|
|
|
Year of Election or Appointment: 2013 Deputy Treasurer of Fidelity's Equity and High Income Funds. Ms. Smith is an employee of Fidelity Investments (2009-present). Previously, Ms. Smith served as Senior Audit Manager of Ernst & Young LLP (1996-2009). |
|
Stephanie J. Dorsey (1969) |
|
|
|
Year of Election or Appointment: 2010 Assistant Treasurer of Fidelity's Equity and High Income Funds. Ms. Dorsey also serves as President and Treasurer (2013-present) and Assistant Treasurer (2012-present) of other Fidelity funds and is an employee of Fidelity Investments (2008-present). Previously, Ms. Dorsey served as Deputy Treasurer of Fidelity's Fixed Income and Asset Allocation Funds (2008-2013), Treasurer (2004-2008) of the JPMorgan Mutual Funds and Vice President (2004-2008) of JPMorgan Chase Bank. |
|
John R. Hebble (1958) |
|
|
|
Year of Election or Appointment: 2009 Assistant Treasurer of Fidelity's Equity and High Income Funds. Mr. Hebble also serves as President (2011-present), Treasurer, and Chief Financial Officer of The North Carolina Capital Management Trust: Cash and Term Portfolios (2008-present) and is an employee of Fidelity Investments. Previously, Mr. Hebble served as President and Treasurer of Fidelity's Fixed Income and Asset Allocation Funds (2008-2013). |
|
Gary W. Ryan (1958) |
|
|
|
Year of Election or Appointment: 2005 Assistant Treasurer of the Fidelity funds. Mr. Ryan is an employee of Fidelity Investments. Previously, Mr. Ryan served as Vice President of Fund Reporting in Fidelity Pricing and Cash Management Services (FPCMS) (1999-2005). |
|
Jonathan Davis (1968) |
|
|
|
Year of Election or Appointment: 2010 Assistant Treasurer of the Fidelity funds. Mr. Davis is also Assistant Treasurer of Fidelity Rutland Square Trust II and Fidelity Commonwealth Trust II. Mr. Davis is an employee of Fidelity Investments. Previously, Mr. Davis served as Vice President and Associate General Counsel of FMR LLC (2003-2010). |
Annual Report
Distributions (Unaudited)
The Board of Trustees of each fund voted to pay to shareholders of record at the opening of business on record date the following distributions per share derived from capital gains realized from sales of portfolio securities and dividends derived from net investment income:
|
|
Pay Date |
Record Date |
Dividends |
Capital Gains |
|
Banking Portfolio |
04/15/13 |
04/12/13 |
$0.038 |
$0.000 |
|
Brokerage and Investment Management Portfolio |
04/15/13 |
04/12/13 |
$0.000 |
$0.000 |
|
Consumer Finance Portfolio |
04/15/13 |
04/12/13 |
$0.009 |
$1.067 |
|
Financial Services Portfolio |
04/15/13 |
04/12/13 |
$0.070 |
$0.000 |
|
Insurance Portfolio |
04/15/13 |
04/12/13 |
$0.157 |
$1.207 |
The funds hereby designate as capital gain dividend the amounts noted below for the taxable year ended February 28, 2013, or, if subsequently determined to be different, the net capital gain of such year:
|
Consumer Finance Portfolio |
$12,523,283 |
|
Insurance Portfolio |
$10,804,841 |
A percentage of the dividends distributed during the fiscal year for the following funds qualify for the dividends-received deduction for corporate shareholders:
|
|
April 2012 |
December 2012 |
|
Banking Portfolio |
100% |
100% |
|
Brokerage and Investment Management Portfolio |
- |
82% |
|
Consumer Finance Portfolio |
71% |
48% |
|
Financial Services Portfolio |
- |
54% |
|
Insurance Portfolio |
100% |
100% |
A percentage of the dividends distributed during the fiscal year for the following funds may be taken into account as a dividend for purposes of the maximum rate under section 1(h) (11) of the Internal Revenue Code:
|
|
April 2012 |
December 2012 |
|
Banking Portfolio |
100% |
100% |
|
Brokerage and Investment Management Portfolio |
- |
100% |
|
Consumer Finance Portfolio |
75% |
54% |
|
Financial Services Portfolio |
- |
84% |
|
Insurance Portfolio |
100% |
100% |
The funds will notify shareholders in January 2014 of amounts for use in preparing 2013 income tax returns.
Annual Report
Board Approval of Investment Advisory Contracts and Management Fees
Banking Portfolio
Brokerage and Investment Management Portfolio
Consumer Finance Portfolio
Financial Services Portfolio
Insurance Portfolio
On November 14, 2012, the Board of Trustees, including the Independent Trustees (together, the Board), voted to approve a new management contract (the New Contracts) between each fund and Fidelity SelectCo, LLC (SelectCo) and to submit the New Contracts to shareholders for their approval. If the New Contracts are approved by shareholders, effective August 1, 2013, SelectCo will serve as investment adviser to each fund. The terms of the New Contracts are identical to those of the current management contracts with FMR (the Current Contracts), except with respect to the name of the investment adviser and the dates of execution and the initial two-year term of the contract. The Board, assisted by the advice of fund counsel and Independent Trustees' counsel, considered a broad range of information.
In determining whether to approve the New Contracts for the funds, the Board was aware that shareholders in the funds have a broad range of investment choices available to them, including a wide choice among mutual funds offered by competitors to Fidelity, and that each fund's shareholders, with the opportunity to review and weigh the disclosure provided by the fund in its prospectus and other public disclosures, have chosen to invest in the fund, managed by Fidelity.
Nature, Extent, and Quality of Services Provided. The Board considered the nature, quality, cost and extent of the services to be provided by SelectCo under the New Contracts as well as the nature, quality, cost and extent of the advisory, administrative, distribution and shareholder services performed by the FMR and the sub-advisers, and by affiliated companies. The Board considered that, upon shareholder approval, SelectCo will render the same services to the funds under the New Contracts that FMR currently renders to the funds under the Current Contracts. The Board also considered that the New Contracts would not result in any changes to (i) the investment process or strategies employed in the management of the funds' assets or (ii) the day-to-day management of the funds or the persons primarily responsible for such management.
Throughout the year, the Trustees had discussions with FMR about plans to establish SelectCo as a new investment adviser to manage sector-based funds and products. The Trustees considered Fidelity's rationale for creating a separate investment adviser and noted that a separate investment adviser may be better positioned to focus on opportunities for growth within the sector investing space and to focus on a distinct approach to sector investing and research.
Shareholder and Administrative Services. The Board noted that the growth of fund assets across the complex allows Fidelity to reinvest in the development of services designed to enhance the value or convenience of the Fidelity funds as investment vehicles. These services include 24-hour access to account information and market information through phone representatives and over the Internet, and investor education materials and asset allocation tools.
Investment in a Large Fund Family. The Board considered the benefits to shareholders of investing in a Fidelity fund, including the benefits of investing in a fund that is part of a large family of funds offering a variety of investment disciplines and providing for a large variety of mutual fund shareholder services.
Investment Performance. The Board did not consider performance to be a material factor in its decision to approve the New Contracts because the New Contracts would not result in any changes to the funds' investment processes or strategies or in the persons primarily responsible for the day-to-day management of the funds.
Based on its review, the Board concluded that the nature, extent, and quality of the services provided to each fund will benefit the fund's shareholders, particularly in light of the Board's view that the fund's shareholders benefit from investing in a fund that is part of a large family of funds offering a variety of investment disciplines and services.
Competitiveness of Management Fee and Total Fund Expenses. The Board considered that, if approved by shareholders, the New Contracts would not result in any changes to the amount of the management fees paid by the funds, except that such fees would be paid to SelectCo rather than FMR. The Board noted that at previous meetings during the year it received and considered materials relating to its review of the management fee of each fund. This information includes comparisons that focus on a fund's standing relative to the total universe of comparable funds available to investors in terms of gross management fees before expense reimbursements or caps, as well as a fund's standing relative to non-Fidelity funds similar in size to the fund within the comparison group.
Based on its review, the Board concluded that each fund's management fee was fair and reasonable in light of the services that the fund receives and the other factors considered.
Annual Report
Because there are no expected changes in the funds' management fees under the New Contracts, the Board will review each fund's total expenses compared to competitive fund median expenses in connection with its future consideration of the renewal of the funds' management contracts and sub-advisory agreements.
In its review of total expenses, the Board also noted that at previous meetings during the year it received and considered materials relating to its review of total expenses for each Fidelity fund. This information includes Fidelity fee structures and other information with respect to clients of FMR and its affiliates, such as other mutual funds advised or sub-advised by FMR or its affiliates, pension plan clients, and other institutional clients.
Costs of the Services and Profitability. Because there were no changes to the services to be provided or fees to be charged to the funds under the New Contracts, the Board did not consider data regarding the impact on Fidelity's costs of services, revenues, or profitability from the new arrangements to be a significant factor in its decision.
In connection with its future consideration of the renewal of each fund's management contract and sub-advisory agreements, the Board will consider the revenues earned and the expenses incurred by Fidelity in conducting the business of developing, marketing, distributing, managing, administering and servicing the funds and their shareholders.
Economies of Scale. The Board recognized that the New Contracts, like the Current Contracts, incorporate a "group fee" structure, which provides for lower fee rates as total fund assets under FMR's management increase, and for higher fee rates as total fund assets under FMR's management decrease. The Board considered that the group fee is designed to deliver the benefits of economies of scale to fund shareholders when total fund assets increase, even if assets of any particular fund are unchanged or have declined, because some portion of Fidelity's costs are attributable to services provided to all Fidelity funds, and all funds benefit if those costs can be allocated among more assets. The Board concluded that, given the group fee structure, fund shareholders will achieve a certain level of economies of scale as assets under FMR's management increase at the fund complex level, regardless of whether Fidelity achieves any such economies of scale.
In connection with its future consideration of the renewal of each fund's management contract and sub-advisory agreements, the Board will consider whether there have been economies of scale in respect of the management of the Fidelity funds, whether the Fidelity funds (including the funds) have appropriately benefited from any such economies of scale, and whether there is potential for realization of any further economies of scale.
Based on its evaluation of all of the conclusions noted above, and after considering all material factors, the Board ultimately concluded that each New Contract is fair and reasonable, and that the New Contracts should be approved and submitted to the applicable funds' shareholders for their approval.
Annual Report
Investment Adviser
Fidelity Management & Research Company
Boston, MA
Investment Sub-Advisers
FMR Co., Inc.
Fidelity Management & Research (U.K.) Inc.
Fidelity Management & Research (Hong Kong) Limited
Fidelity Management & Research (Japan) Inc.
General Distributor
Fidelity Distributors Corporation
Smithfield, RI
Transfer and Service Agents
Fidelity Investments Institutional Operations Company, Inc.
Boston, MA
Fidelity Service Company, Inc.
Boston, MA
Custodian
Brown Brothers Harriman & Co.
Boston, MA
Corporate Headquarters
245 Summer Street
Boston, MA 02210
1-800-544-8888
The Fidelity Telephone Connection
Mutual Fund 24-Hour Service
Exchanges/Redemptions
and Account Assistance 1-800-544-6666
Product Information 1-800-544-8888
Retirement Accounts 1-800-544-4774
(8 a.m. - 9 p.m.)
TDD Service 1-800-544-0118
for the deaf and hearing impaired
(9 a.m. - 9 p.m. Eastern time)
Fidelity Automated Service
Telephone (FAST®) 
1-800-544-5555
Automated line for quickest service

SELFIN-UANNPRO-0413
1.910420.103
Fidelity®
Select Portfolios®
Health Care Sector
Biotechnology Portfolio
Health Care Portfolio
Medical Delivery Portfolio
Medical Equipment and Systems Portfolio
Pharmaceuticals Portfolio
Annual Report
February 28, 2013
(Fidelity Cover Art)
Contents
|
Shareholder Expense Example |
|
|
|
Biotechnology Portfolio |
Performance |
|
|
|
Management's Discussion |
|
|
|
Investment Changes |
|
|
|
Investments |
|
|
|
Financial Statements |
|
|
Health Care Portfolio |
Performance |
|
|
|
Management's Discussion |
|
|
|
Investment Changes |
|
|
|
Investments |
|
|
|
Financial Statements |
|
|
Medical Delivery Portfolio |
Performance |
|
|
|
Management's Discussion |
|
|
|
Investment Changes |
|
|
|
Investments |
|
|
|
Financial Statements |
|
|
Medical Equipment and Systems Portfolio |
Performance |
|
|
|
Management's Discussion |
|
|
|
Investment Changes |
|
|
|
Investments |
|
|
|
Financial Statements |
|
|
Pharmaceuticals Portfolio |
Performance |
|
|
|
Management's Discussion |
|
|
|
Investment Changes |
|
|
|
Investments |
|
|
|
Financial Statements |
|
|
Notes to Financial Statements |
|
|
|
Report of Independent Registered Public Accounting Firm |
|
|
|
Trustees and Officers |
|
|
|
Distributions |
|
|
|
Board Approval of Investment Advisory Contracts and Management Fees |
|
|
|
|
|
|
To view a fund's proxy voting guidelines and proxy voting record for the 12-month period ended June 30, visit http://www.fidelity.com/proxyvotingresults or visit the Securities and Exchange Commission's (SEC) web site at http://www.sec.gov. You may also call 1-800-544-8544 to request a free copy of the proxy voting guidelines.
Standard & Poor's, S&P and S&P 500 are registered service marks of The McGraw-Hill Companies, Inc. and have been licensed for use by Fidelity Distributors Corporation.
Other third-party marks appearing herein are the property of their respective owners.
All other marks appearing herein are registered or unregistered trademarks or service marks of FMR LLC or an affiliated company. © 2013 FMR LLC. All rights reserved.
Annual Report
This report and the financial statements contained herein are submitted for the general information of the shareholders of the funds. This report is not authorized for distribution to prospective investors in the funds unless preceded or accompanied by an effective prospectus.
A fund files its complete schedule of portfolio holdings with the SEC for the first and third quarters of each fiscal year on Form N-Q. Forms N-Q are available on the SEC's web site at http://www.sec.gov. A fund's Forms N-Q may be reviewed and copied at the SEC's Public Reference Room in Washington, DC. Information regarding the operation of the SEC's Public Reference Room may be obtained by calling 1-800-SEC-0330. For a complete list of a fund's portfolio holdings, view the most recent holdings listing, semiannual report, or annual report on Fidelity's web site at http://www.fidelity.com, http://www.advisor.fidelity.com, or http://www.401k.com, as applicable.
NOT FDIC INSURED • MAY LOSE VALUE • NO BANK GUARANTEE
Neither the funds nor Fidelity Distributors Corporation is a bank.
Annual Report
Shareholder Expense Example
As a shareholder of a Fund, you incur two types of costs: (1) transaction costs, including redemption fees and (2) ongoing costs, including management fees and other Fund expenses. This Example is intended to help you understand your ongoing costs (in dollars) of investing in the Funds and to compare these costs with the ongoing costs of investing in other mutual funds.
The Example is based on an investment of $1,000 invested at the beginning of the period and held for the entire period (September 1, 2012 to February 28, 2013).
Actual Expenses
The first line of the accompanying table for each fund provides information about actual account values and actual expenses. You may use the information in this line, together with the amount you invested, to estimate the expenses that you paid over the period. Simply divide your account value by $1,000.00 (for example, an $8,600 account value divided by $1,000.00 = 8.6), then multiply the result by the number in the first line for a fund under the heading entitled "Expenses Paid During Period" to estimate the expenses you paid on your account during this period. A small balance maintenance fee of $12.00 that is charged once a year may apply for certain accounts with a value of less than $2,000. This fee is not included in the table below. If it was, the estimate of expenses you paid during the period would be higher, and your ending account value lower, by this amount. In addition, each Fund, as a shareholder in the underlying Fidelity Central Funds, will indirectly bear its pro-rata share of the fees and expenses incurred by the underlying Fidelity Central Funds. These fees and expenses are not included in the Fund's annualized expense ratio used to calculate the expense estimate in the table below.
Hypothetical Example for Comparison Purposes
The second line of the accompanying table for each fund provides information about hypothetical account values and hypothetical expenses based on a fund's actual expense ratio and an assumed rate of return of 5% per year before expenses, which is not the Fund's actual return. The hypothetical account values and expenses may not be used to estimate the actual ending account balance or expenses you paid for the period. You may use this information to compare the ongoing costs of investing in the Fund and other funds. To do so, compare this 5% hypothetical example with the 5% hypothetical examples that appear in the shareholder reports of the other funds. A small balance maintenance fee of $12.00 that is charged once a year may apply for certain accounts with a value of less than $2,000. This fee is not included in the table below. If it was, the estimate of expenses you paid during the period would be higher, and your ending account value lower, by this amount. In addition, each Fund, as a shareholder in the underlying Fidelity Central Funds, will indirectly bear its pro-rata share of the fees and expenses incurred by the underlying Fidelity Central Funds. These fees and expenses are not included in the Fund's annualized expense ratio used to calculate the expense estimate in the table below.
Please note that the expenses shown in the table are meant to highlight your ongoing costs only and do not reflect any transaction costs. Therefore, the second line of the table is useful in comparing ongoing costs only, and will not help you determine the relative total costs of owning different funds. In addition, if these transactional costs were included, your costs would have been higher.
|
|
Annualized |
Beginning |
Ending |
Expenses Paid |
|
Biotechnology Portfolio |
.80% |
|
|
|
|
Actual |
|
$ 1,000.00 |
$ 1,124.60 |
$ 4.21 |
|
HypotheticalA |
|
$ 1,000.00 |
$ 1,020.83 |
$ 4.01 |
|
Health Care Portfolio |
.78% |
|
|
|
|
Actual |
|
$ 1,000.00 |
$ 1,119.50 |
$ 4.10 |
|
HypotheticalA |
|
$ 1,000.00 |
$ 1,020.93 |
$ 3.91 |
|
Medical Delivery Portfolio |
.83% |
|
|
|
|
Actual |
|
$ 1,000.00 |
$ 1,051.80 |
$ 4.22 |
|
HypotheticalA |
|
$ 1,000.00 |
$ 1,020.68 |
$ 4.16 |
|
Medical Equipment and Systems Portfolio |
.82% |
|
|
|
|
Actual |
|
$ 1,000.00 |
$ 1,134.40 |
$ 4.34 |
|
HypotheticalA |
|
$ 1,000.00 |
$ 1,020.73 |
$ 4.11 |
|
Pharmaceuticals Portfolio |
.84% |
|
|
|
|
Actual |
|
$ 1,000.00 |
$ 1,100.80 |
$ 4.38 |
|
HypotheticalA |
|
$ 1,000.00 |
$ 1,020.63 |
$ 4.21 |
A 5% return per year before expenses
* Expenses are equal to each Fund's annualized expense ratio, multiplied by the average account value over the period, multiplied by 181/365 (to reflect the one-half year period).
Annual Report
Biotechnology Portfolio
Performance: The Bottom Line
Average annual total return reflects the change in the value of an investment, assuming reinvestment of the fund's distributions from dividend income and capital gains (the profits earned upon the sale of securities that have grown in value, if any) and assuming a constant rate of performance each year. The $10,000 table and the fund's returns do not reflect the deduction of taxes that a shareholder would pay on fund distributions or the redemption of fund shares. During periods of reimbursement by Fidelity a fund's total return will be greater than it would be had the reimbursement not occurred. How a fund did yesterday is no guarantee of how it will do tomorrow.
Average Annual Total Returns
|
Periods ended February 28, 2013 |
Past 1 |
Past 5 |
Past 10 |
|
Biotechnology Portfolio |
31.78% |
15.57% |
12.88% |
$10,000 Over 10 Years
Let's say hypothetically that $10,000 was invested in Biotechnology Portfolio on February 28, 2003. The chart shows how the value of your investment would have changed, and also shows how the S&P 500® Index performed over the same period.
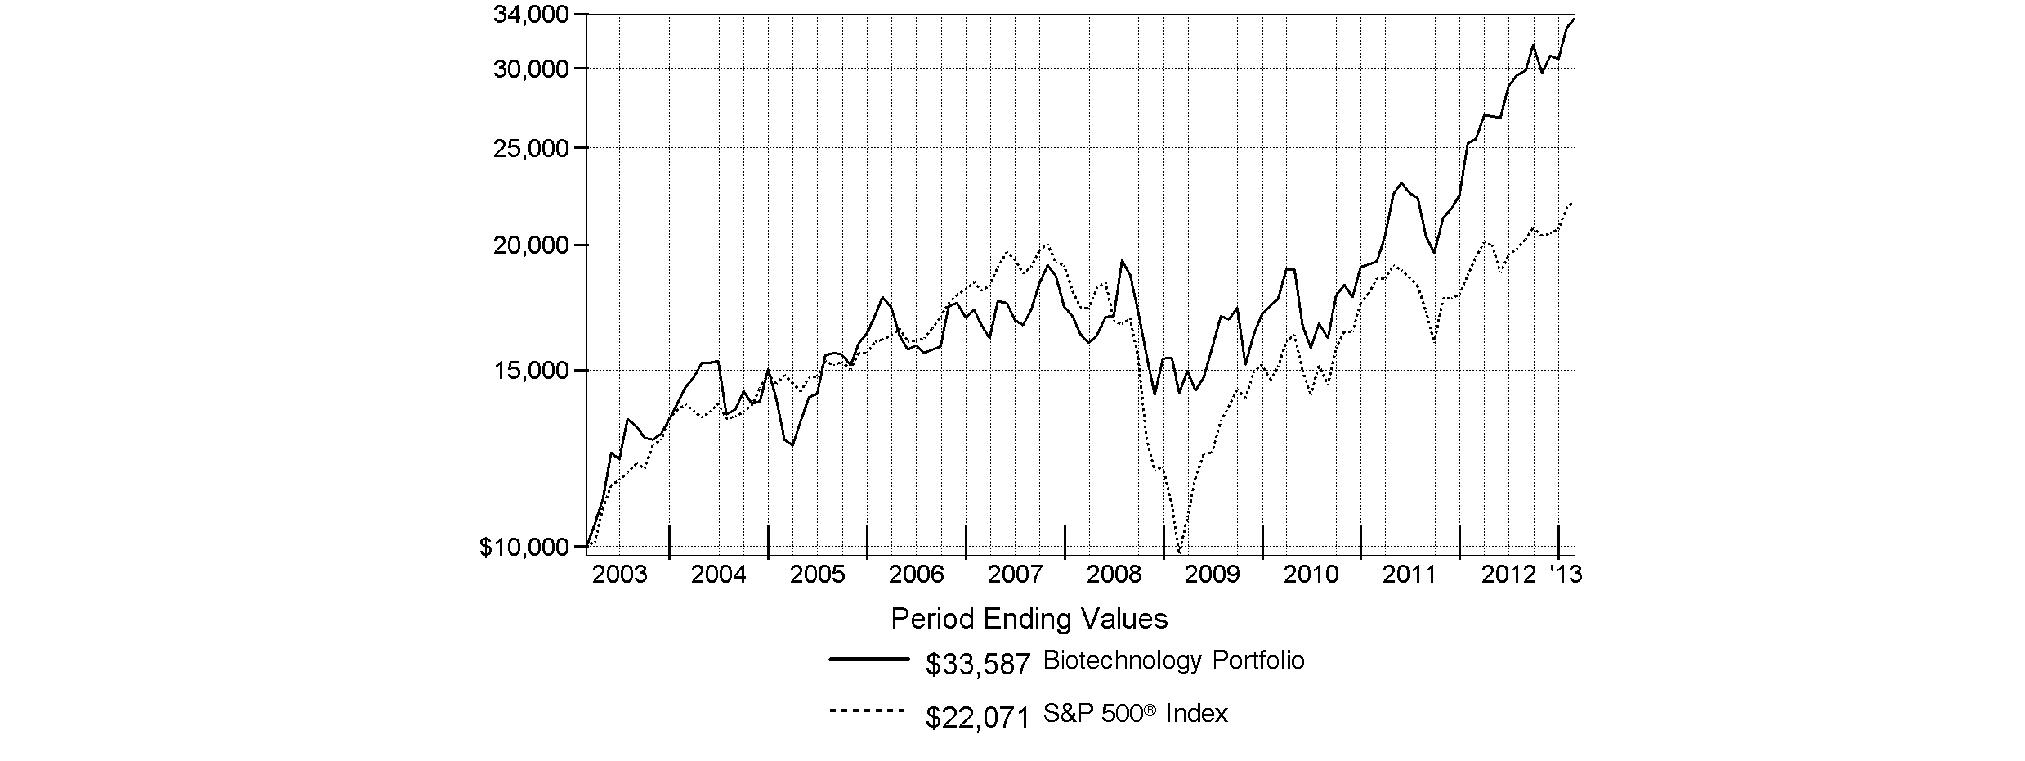
Annual Report
Biotechnology Portfolio
Management's Discussion of Fund Performance
Market Recap: U.S. stocks posted solid gains for the year ending February 28, 2013, sparked by a late-period rally that pushed major equity benchmarks to multiyear highs. Improvement in the global economy and more monetary stimulus from the U.S. Federal Reserve kept markets on the upswing for much of the year, shrugging off an early decline brought on by debt woes in Europe, and another dip later in the period amid Congressional gridlock on the federal budget. Renewed optimism over employment, the housing market, corporate earnings and record dividends made stocks a favorite with investors during the 12 months, which helped push the broad-based S&P 500® Index across the milestone 1,500 mark at the end of January. The S&P 500® finished the period up 13.46%. Seven of the 10 major market sectors tracked by MSCI U.S. IMI 25-50 classifications produced double-digit gains, led by health care and financials, while information technology, energy and materials trailed the broad equity market with only modest advances.
Comments from Rajiv Kaul, Portfolio Manager of Biotechnology Portfolio: For the year, the fund returned 31.78%, trailing the robust 36.13% gain of its industry benchmark, the MSCI® U.S. IMI Biotechnology 25-50 Index, but more than doubling the return of the S&P 500®. Versus the broader market, biotechnology shares benefited from a steady flow of important new drug approvals, positive test results and a favorable regulatory environment. Compared with its industry index, the fund's emphasis on small-cap stocks in the biotech universe and its underweighted exposure to the largest-cap benchmark components hurt, especially during the first half of the reporting period. Stock selection the micro-cap area fared poorly as well. An overweighting in Progenics Pharmaceuticals was the fund's largest relative detractor. The firm's share price took a spill at the end of July, after the U.S. Food and Drug Administration (FDA) failed to approve a broadened application of Relistor®, its drug for relieving constipation in cancer patients taking opioid painkillers. A small out-of-index stake in PolyMedix further hampered the fund's result. In January, the company replaced its CEO while mulling strategic alternatives that included selling the firm. I'll also mention an underweighted stake in Human Genome Sciences, whose stock soared in April, after British drug firm GlaxoSmithKline made a bid for the company that roughly doubled its share price overnight. I liquidated this position soon after to nail down profits. Additionally, underweighted exposure to two strong-performing large-caps, Gilead Sciences and Amgen, detracted, but I increased both of these positions, making Gilead the fund's largest position by period end. Conversely, the fund's top relative contributor was Aegerion Pharmaceuticals, whose stock got a lift in October from positive FDA comments on lomitapide, a cholesterol treatment intended for use in place of statin drugs. Another positive for the fund was its out-of-index position in Puma Biotechnology, a development-stage company focused on acquiring and developing treatments for various forms of cancer. I began investing in the company's private shares prior to its April initial public offering, and it showed a solid gain during the period, as the company reached an agreement with the FDA on the terms of a late-stage trial of neratinib, its medication for breast cancer and the firm's most advanced experimental drug. Also lifting our result was a sizable overweighting in Medivation, the fund's tenth-largest position at period end. Among other positives, the FDA approved XTANDI®, the company's drug for a form of prostate cancer.
The views expressed above reflect those of the portfolio manager(s) only through the end of the period as stated on the cover of this report and do not necessarily represent the views of Fidelity or any other person in the Fidelity organization. Any such views are subject to change at any time based upon market or other conditions and Fidelity disclaims any responsibility to update such views. These views may not be relied on as investment advice and, because investment decisions for a Fidelity fund are based on numerous factors, may not be relied on as an indication of trading intent on behalf of any Fidelity fund.
Annual Report
Biotechnology Portfolio
Investment Changes (Unaudited)
|
Top Ten Stocks as of February 28, 2013 |
||
|
|
% of fund's |
% of fund's net assets |
|
Gilead Sciences, Inc. |
14.2 |
11.6 |
|
Amgen, Inc. |
13.4 |
10.6 |
|
Celgene Corp. |
7.4 |
3.6 |
|
Biogen Idec, Inc. |
6.0 |
7.8 |
|
Regeneron Pharmaceuticals, Inc. |
4.3 |
4.7 |
|
Alexion Pharmaceuticals, Inc. |
3.6 |
2.9 |
|
BioMarin Pharmaceutical, Inc. |
3.5 |
1.7 |
|
Vertex Pharmaceuticals, Inc. |
3.2 |
3.7 |
|
Onyx Pharmaceuticals, Inc. |
2.8 |
4.1 |
|
Medivation, Inc. |
2.6 |
2.9 |
|
|
61.0 |
|
|
Top Industries (% of fund's net assets) |
|||
|
As of February 28, 2013 |
|||
 |
Biotechnology |
98.2% |
|
 |
Pharmaceuticals |
1.3% |
|
 |
Life Sciences |
0.2% |
|
 |
Health Care |
0.1% |
|
 |
Personal Products |
0.0% |
|
 |
All Others* |
0.2% |
|

|
As of August 31, 2012 |
|||
|
Biotechnology |
94.4% |
|
|
Pharmaceuticals |
4.3% |
|
|
Life Sciences |
0.4% |
|
|
Health Care |
0.2% |
|
|
Health Care |
0.0% |
|
|
All Others* |
0.7% |
|

|
* Includes short-term investments and net other assets. |
Annual Report
Biotechnology Portfolio
Investments February 28, 2013
Showing Percentage of Net Assets
|
Common Stocks - 99.6% |
|||
|
Shares |
Value |
||
|
BIOTECHNOLOGY - 98.0% |
|||
|
Biotechnology - 98.0% |
|||
|
A.P. Pharma, Inc. (f) |
13,895,725 |
$ 9,727,008 |
|
|
ACADIA Pharmaceuticals, Inc. (a)(d) |
3,072,059 |
18,647,398 |
|
|
Achillion Pharmaceuticals, Inc. (a) |
1,383,942 |
11,209,930 |
|
|
Acorda Therapeutics, Inc. (a) |
1,428,302 |
42,491,985 |
|
|
Aegerion Pharmaceuticals, Inc. (a)(e) |
1,968,168 |
59,281,220 |
|
|
Affymax, Inc. (a)(d) |
1,164,556 |
3,097,719 |
|
|
Agenus, Inc. (a)(e) |
150,089 |
642,381 |
|
|
Agenus, Inc. warrants 6/9/18 (a)(e)(f) |
1,548,000 |
78,596 |
|
|
Alexion Pharmaceuticals, Inc. (a) |
1,439,849 |
124,892,502 |
|
|
Alkermes PLC (a) |
1,304,995 |
28,331,441 |
|
|
Alnylam Pharmaceuticals, Inc. (a) |
1,583,803 |
37,520,293 |
|
|
AMAG Pharmaceuticals, Inc. (a) |
638,851 |
10,572,984 |
|
|
Amarin Corp. PLC ADR (a)(d) |
849,324 |
6,871,031 |
|
|
Amgen, Inc. |
5,059,219 |
462,463,209 |
|
|
Arena Pharmaceuticals, Inc. (a)(d) |
3,753,744 |
31,493,912 |
|
|
ARIAD Pharmaceuticals, Inc. (a) |
2,009,505 |
42,259,890 |
|
|
ArQule, Inc. (a) |
2,649,542 |
6,517,873 |
|
|
AVEO Pharmaceuticals, Inc. (a) |
382,187 |
2,549,187 |
|
|
Biogen Idec, Inc. (a) |
1,252,166 |
208,285,292 |
|
|
BioMarin Pharmaceutical, Inc. (a) |
2,079,144 |
120,527,978 |
|
|
Bionovo, Inc. warrants 2/2/16 (a) |
1,043,150 |
2,524 |
|
|
BioTime, Inc. (a)(d) |
1,447,595 |
6,094,375 |
|
|
Catalyst Pharmaceutical Partners, Inc.: |
|
|
|
|
warrants 5/2/17 (a) |
141,443 |
1 |
|
|
warrants 5/30/17 (a) |
282,100 |
3 |
|
|
Celgene Corp. (a) |
2,477,923 |
255,672,095 |
|
|
Cell Therapeutics, Inc. (a)(d)(e) |
6,675,910 |
8,945,719 |
|
|
Cell Therapeutics, Inc. warrants 7/6/16 (a)(e) |
835,596 |
20,931 |
|
|
Celldex Therapeutics, Inc. (a) |
2,393,805 |
22,789,024 |
|
|
Cepheid, Inc. (a) |
491,400 |
17,901,702 |
|
|
Clovis Oncology, Inc. (a)(d) |
602,782 |
11,368,469 |
|
|
Codexis, Inc. (a) |
130,248 |
269,613 |
|
|
Cubist Pharmaceuticals, Inc. (a) |
558,508 |
23,697,494 |
|
|
Cytokinetics, Inc. (e) |
6,380,800 |
6,368,038 |
|
|
Cytokinetics, Inc. warrants 6/25/17 (a)(e) |
3,828,480 |
393,737 |
|
|
Dendreon Corp. (a)(d) |
2,487,677 |
14,403,650 |
|
|
Durata Therapeutics, Inc. (d) |
190,730 |
1,630,742 |
|
|
Dyax Corp. (a) |
3,775,905 |
12,120,655 |
|
|
Dynavax Technologies Corp. (a) |
2,015,143 |
4,110,892 |
|
|
Elan Corp. PLC sponsored ADR (a) |
919,698 |
10,429,375 |
|
|
Emergent BioSolutions, Inc. (a) |
252,200 |
3,906,578 |
|
|
Enzon Pharmaceuticals, Inc. |
439,366 |
1,858,518 |
|
|
Exact Sciences Corp. (a) |
701,061 |
7,487,331 |
|
|
Exelixis, Inc. (a)(d) |
1,292,468 |
5,893,654 |
|
|
Fibrocell Science, Inc. (f) |
60,806,000 |
9,272,915 |
|
|
Genomic Health, Inc. (a) |
257,685 |
7,382,675 |
|
|
Geron Corp. (a) |
5,667,235 |
8,274,163 |
|
|
Gilead Sciences, Inc. (a) |
11,430,751 |
488,207,371 |
|
|
Halozyme Therapeutics, Inc. (a) |
2,111,308 |
11,527,742 |
|
|
|
|||
|
Shares |
Value |
||
|
Idenix Pharmaceuticals, Inc. (a)(d) |
1,065,749 |
$ 4,486,803 |
|
|
ImmunoGen, Inc. (a)(d) |
984,415 |
14,933,576 |
|
|
Immunomedics, Inc. (a)(d) |
1,186,585 |
2,729,146 |
|
|
Incyte Corp. (a)(d) |
1,423,736 |
31,606,939 |
|
|
Infinity Pharmaceuticals, Inc. (a)(d) |
690,234 |
28,499,762 |
|
|
Intercept Pharmaceuticals, Inc. (d) |
117,834 |
4,597,883 |
|
|
InterMune, Inc. (a)(d) |
3,172,913 |
28,143,738 |
|
|
Ironwood Pharmaceuticals, Inc. Class A (a) |
4,651,810 |
69,451,523 |
|
|
Isis Pharmaceuticals, Inc. (a)(d) |
1,146,191 |
16,849,008 |
|
|
KaloBios Pharmaceuticals, Inc. |
224,464 |
1,333,316 |
|
|
KaloBios Pharmaceuticals, Inc. |
232,300 |
1,533,180 |
|
|
Lexicon Pharmaceuticals, Inc. (a) |
7,487,723 |
14,750,814 |
|
|
Ligand Pharmaceuticals, Inc. Class B (a) |
439,128 |
9,019,689 |
|
|
MannKind Corp. (a)(d) |
4,561,500 |
11,677,440 |
|
|
Medivation, Inc. (a) |
1,793,896 |
88,152,049 |
|
|
Merrimack Pharmaceuticals, Inc. |
44,600 |
285,440 |
|
|
Momenta Pharmaceuticals, Inc. (a)(d) |
491,448 |
6,261,048 |
|
|
Myriad Genetics, Inc. (a) |
853,918 |
21,706,596 |
|
|
Neurocrine Biosciences, Inc. (a) |
905,291 |
9,577,979 |
|
|
NeurogesX, Inc. (a) |
3,131,785 |
845,582 |
|
|
NewLink Genetics Corp. (a)(d) |
706,455 |
8,314,975 |
|
|
Novavax, Inc. (a)(d) |
7,352,004 |
13,380,647 |
|
|
Novelos Therapeutics, Inc. (a)(e) |
2,334,890 |
1,144,096 |
|
|
Novelos Therapeutics, Inc. warrants 12/6/16 (a)(e) |
2,362,400 |
23,713 |
|
|
NPS Pharmaceuticals, Inc. (a) |
1,640,126 |
13,088,205 |
|
|
OncoGenex Pharmaceuticals, Inc. (a) |
217,303 |
2,583,733 |
|
|
Onyx Pharmaceuticals, Inc. (a) |
1,281,245 |
96,490,561 |
|
|
Opko Health, Inc. (a)(d) |
1,994,800 |
13,843,912 |
|
|
Oragenics, Inc. (f) |
1,558,058 |
5,390,881 |
|
|
Orexigen Therapeutics, Inc. (a)(d) |
2,579,263 |
15,372,407 |
|
|
Osiris Therapeutics, Inc. (a)(d) |
433,418 |
2,851,890 |
|
|
OvaScience, Inc. (a) |
212,300 |
2,282,225 |
|
|
PDL BioPharma, Inc. (d) |
1,251,833 |
8,938,088 |
|
|
Pharmacyclics, Inc. (a) |
913,244 |
80,164,558 |
|
|
PolyMedix, Inc. (a)(e) |
5,775,434 |
698,828 |
|
|
PolyMedix, Inc. warrants 4/10/16 (a)(e) |
2,961,167 |
4,541 |
|
|
Progenics Pharmaceuticals, Inc. (a)(e) |
4,487,695 |
11,847,515 |
|
|
PROLOR Biotech, Inc. (a)(d) |
1,150,384 |
5,809,439 |
|
|
Protalix BioTherapeutics, Inc. (a)(d) |
1,140,342 |
6,522,756 |
|
|
Puma Biotechnology, Inc. |
854,701 |
21,974,363 |
|
|
Raptor Pharmaceutical Corp. (a)(d) |
1,472,579 |
7,318,718 |
|
|
Regeneron Pharmaceuticals, Inc. (a) |
879,087 |
146,807,529 |
|
|
Rigel Pharmaceuticals, Inc. (a) |
1,147,051 |
7,708,183 |
|
|
Sangamo Biosciences, Inc. (a)(d) |
1,902,030 |
19,381,686 |
|
|
Savient Pharmaceuticals, Inc. (a)(d) |
2,589,401 |
2,434,037 |
|
|
Seattle Genetics, Inc. (a)(d) |
860,619 |
24,217,819 |
|
|
SIGA Technologies, Inc. (a)(d) |
1,611,814 |
6,898,564 |
|
|
Sophiris Bio, Inc. |
2,502,000 |
558,022 |
|
|
Sorrento Therapeutics, Inc. (f) |
11,780,000 |
2,591,600 |
|
|
Spectrum Pharmaceuticals, Inc. (d)(e) |
3,489,000 |
39,774,600 |
|
|
Stemline Therapeutics, Inc. (e) |
486,300 |
5,884,230 |
|
|
Common Stocks - continued |
|||
|
Shares |
Value |
||
|
BIOTECHNOLOGY - CONTINUED |
|||
|
Biotechnology - continued |
|||
|
Sunesis Pharmaceuticals, Inc. (a)(d) |
2,100,978 |
$ 10,967,105 |
|
|
Synageva BioPharma Corp. (a) |
254,200 |
12,702,374 |
|
|
Synergy Pharmaceuticals, Inc. (a) |
1,481,266 |
8,102,525 |
|
|
Synergy Pharmaceuticals, Inc. warrants 11/14/16 (a) |
354,400 |
832,840 |
|
|
Synta Pharmaceuticals Corp. (a)(d) |
2,406,427 |
20,671,208 |
|
|
Synthetic Biologics, Inc. (a) |
900 |
1,548 |
|
|
Targacept, Inc. (a) |
1,272,417 |
5,509,566 |
|
|
TESARO, Inc. |
463,200 |
9,199,152 |
|
|
Theravance, Inc. (a)(d) |
1,100,589 |
22,330,951 |
|
|
Threshold Pharmaceuticals, Inc. (a) |
1,262,685 |
5,846,232 |
|
|
Threshold Pharmaceuticals, Inc. warrants 3/16/16 (a) |
631,520 |
1,815,496 |
|
|
Tranzyme, Inc. (a) |
1,194,686 |
632,228 |
|
|
Trius Therapeutics, Inc. (a) |
919,606 |
4,827,932 |
|
|
United Therapeutics Corp. (a) |
590,351 |
35,308,893 |
|
|
Vanda Pharmaceuticals, Inc. (a) |
793,907 |
2,985,090 |
|
|
Verastem, Inc. (a) |
95,367 |
898,357 |
|
|
Vertex Pharmaceuticals, Inc. (a) |
2,350,363 |
110,043,996 |
|
|
Vical, Inc. (a) |
4,038,130 |
12,922,016 |
|
|
ZIOPHARM Oncology, Inc. (a)(d) |
2,097,692 |
9,292,776 |
|
|
|
3,383,125,932 |
||
|
HEALTH CARE EQUIPMENT & SUPPLIES - 0.1% |
|||
|
Health Care Equipment - 0.1% |
|||
|
Alsius Corp. (a) |
314,300 |
3 |
|
|
Aradigm Corp. (a) |
6,398,160 |
710,196 |
|
|
InVivo Therapeutics Holdings Corp. (a)(d) |
1,520,200 |
3,146,814 |
|
|
|
3,857,013 |
||
|
LIFE SCIENCES TOOLS & SERVICES - 0.2% |
|||
|
Life Sciences Tools & Services - 0.2% |
|||
|
BG Medicine, Inc. (a)(d) |
1,177,641 |
2,025,543 |
|
|
ChromaDex, Inc. (a)(d) |
2,283,700 |
1,667,101 |
|
|
Transgenomic, Inc. (a) |
3,392,882 |
1,526,797 |
|
|
Transgenomic, Inc. warrants 2/3/17 (a)(f) |
1,419,000 |
14 |
|
|
|
5,219,455 |
||
|
PERSONAL PRODUCTS - 0.0% |
|||
|
Personal Products - 0.0% |
|||
|
MYOS Corp. (f) |
1,666,700 |
341,674 |
|
|
PHARMACEUTICALS - 1.3% |
|||
|
Pharmaceuticals - 1.3% |
|||
|
AcelRx Pharmaceuticals, Inc. (a)(d) |
743,754 |
3,718,770 |
|
|
Auxilium Pharmaceuticals, Inc. (a) |
628,851 |
10,721,910 |
|
|
AVANIR Pharmaceuticals Class A (a)(d) |
4,969,885 |
13,567,786 |
|
|
Horizon Pharma, Inc. (d) |
1,607,800 |
3,392,458 |
|
|
|
|||
|
Shares |
Value |
||
|
Horizon Pharma, Inc.: |
|
|
|
|
warrants 2/28/17 (a)(f) |
319,539 |
$ 15 |
|
|
warrants 9/25/17 (a) |
759,050 |
36 |
|
|
Jazz Pharmaceuticals PLC (a) |
106,217 |
6,179,705 |
|
|
Pacira Pharmaceuticals, Inc. (a) |
17,500 |
382,550 |
|
|
TherapeuticsMD, Inc. (a) |
1,304,007 |
4,433,624 |
|
|
ViroPharma, Inc. (a) |
1,799 |
44,867 |
|
|
XenoPort, Inc. (a) |
106,798 |
815,937 |
|
|
Zogenix, Inc. (a) |
1,444,658 |
2,701,510 |
|
|
Zogenix, Inc. warrants 7/27/17 (a) |
498,465 |
5,428 |
|
|
|
45,964,596 |
||
|
TOTAL COMMON STOCKS (Cost $2,603,861,381) |
|
||
|
Convertible Preferred Stocks - 0.2% |
|||
|
|
|
|
|
|
BIOTECHNOLOGY - 0.2% |
|||
|
Biotechnology - 0.2% |
|||
|
bluebird bio (f) |
535,716 |
266,947 |
|
|
Xenon Pharmaceuticals, Inc. Series E (a)(f) |
981,626 |
4,476,215 |
|
|
|
4,743,162 |
||
|
PHARMACEUTICALS - 0.0% |
|||
|
Pharmaceuticals - 0.0% |
|||
|
Agios Pharmaceuticals, Inc. Series C (a)(f) |
229,509 |
1,127,142 |
|
|
TOTAL CONVERTIBLE PREFERRED STOCKS (Cost $8,118,227) |
|
||
|
Money Market Funds - 7.9% |
|||
|
|
|
|
|
|
Fidelity Cash Central Fund, 0.16% (b) |
4,079,402 |
4,079,402 |
|
|
Fidelity Securities Lending Cash Central Fund, 0.16% (b)(c) |
269,288,218 |
269,288,218 |
|
|
TOTAL MONEY MARKET FUNDS (Cost $273,367,620) |
|
||
|
TOTAL INVESTMENT PORTFOLIO - 107.7% (Cost $2,885,347,228) |
3,717,746,594 |
|
NET OTHER ASSETS (LIABILITIES) - (7.7)% |
(267,021,153) |
||
|
NET ASSETS - 100% |
$ 3,450,725,441 |
||
|
Legend |
|
(a) Non-income producing |
|
(b) Affiliated fund that is generally available only to investment companies and other accounts managed by Fidelity Investments. The rate quoted is the annualized seven-day yield of the fund at period end. A complete unaudited listing of the fund's holdings as of its most recent quarter end is available upon request. In addition, each Fidelity Central Fund's financial statements, which are not covered by the Fund's Report of Independent Registered Public Accounting Firm, are available on the SEC's website or upon request. |
|
(c) Investment made with cash collateral received from securities on loan. |
|
(d) Security or a portion of the security is on loan at period end. |
|
(e) Affiliated company |
|
(f) Restricted securities - Investment in securities not registered under the Securities Act of 1933 (excluding 144A issues). At the end of the period, the value of restricted securities (excluding 144A issues) amounted to $33,273,004 or 1.0% of net assets. |
|
Additional information on each restricted holding is as follows: |
|
Security |
Acquisition Date |
Acquisition Cost |
|
A.P. Pharma, Inc. |
7/25/12 |
$ 7,295,256 |
|
Agenus, Inc. warrants 6/9/18 |
1/9/08 |
$ 1,930,622 |
|
Agios Pharmaceuticals, Inc. Series C |
11/16/11 |
$ 1,127,142 |
|
bluebird bio |
7/23/12 |
$ 266,947 |
|
Fibrocell Science, Inc. |
10/8/12 |
$ 6,080,600 |
|
Horizon Pharma, Inc. warrants 2/28/17 |
2/29/12 |
$ 39,942 |
|
MYOS Corp. |
7/2/12 |
$ 416,675 |
|
Oragenics, Inc. |
7/31/12 |
$ 2,337,087 |
|
Sorrento Therapeutics, Inc. |
5/15/12 |
$ 1,884,800 |
|
Transgenomic, Inc. warrants 2/3/17 |
2/3/12 |
$ 9,800 |
|
Xenon Pharmaceuticals, Inc. Series E |
3/23/01 |
$ 6,724,138 |
|
Affiliated Central Funds |
|
Information regarding fiscal year to date income earned by the Fund from investments in Fidelity Central Funds is as follows: |
|
Fund |
Income earned |
|
Fidelity Cash Central Fund |
$ 31,134 |
|
Fidelity Securities Lending Cash Central Fund |
8,964,611 |
|
Total |
$ 8,995,745 |
|
Other Affiliated Issuers |
|
An affiliated company is a company in which the Fund has ownership of at least 5% of the voting securities. Fiscal year to date transactions with companies which are or were affiliates are as follows: |
|
Affiliate |
Value, |
Purchases |
Sales |
Dividend |
Value, |
|
ACADIA Pharmaceuticals, Inc. |
$ 5,217,290 |
$ 5,939,953 |
$ 3,169,265 |
$ - |
$ - |
|
AcelRx Pharmaceuticals, Inc. |
2,938,158 |
- |
1,433,922 |
- |
- |
|
Aegerion Pharmaceuticals, Inc. |
12,553,506 |
23,183,874 |
6,611,061 |
- |
59,281,220 |
|
Agenus, Inc. |
1,182,412 |
- |
1,326,203 |
- |
642,381 |
|
Agenus, Inc. warrants 6/9/18 |
210,780 |
- |
- |
- |
78,596 |
|
ArQule, Inc. |
6,759,157 |
14,501,481 |
2,825,193 |
- |
- |
|
BG Medicine, Inc. |
5,510,191 |
2,915,171 |
7,359 |
- |
- |
|
Catalyst Pharmaceutical Partners, Inc. |
1,960,391 |
225,677 |
1,130,731 |
- |
- |
|
Catalyst Pharmaceutical Partners, Inc. warrants 5/2/17 |
72,699 |
- |
- |
- |
- |
|
Catalyst Pharmaceutical Partners, Inc. warrants 5/30/17 |
- |
3 |
- |
- |
- |
|
Cell Therapeutics, Inc. |
13,577,687 |
6,500,000 |
514,929 |
- |
8,945,719 |
|
Cell Therapeutics, Inc. warrants 7/6/16 |
620,755 |
- |
- |
- |
20,931 |
|
Cytokinetics, Inc. |
- |
4,849,408 |
- |
- |
6,368,038 |
|
Cytokinetics, Inc. warrants 6/25/17 |
- |
- |
- |
- |
393,737 |
|
Novavax, Inc. |
3,095,123 |
7,859,673 |
445,152 |
- |
- |
|
Novelos Therapeutics, Inc. |
1,181,200 |
- |
54,744 |
- |
1,144,096 |
|
Novelos Therapeutics, Inc. warrants 12/6/16 |
46,546 |
- |
- |
- |
23,713 |
|
Orexigen Therapeutics, Inc. |
12,734,873 |
7,632,061 |
7,728,844 |
- |
- |
|
PolyMedix, Inc. |
7,699,034 |
- |
151,839 |
- |
698,828 |
|
PolyMedix, Inc. warrants 4/10/16 |
2,392,472 |
- |
- |
- |
4,541 |
|
Progenics Pharmaceuticals, Inc. |
21,224,629 |
11,011,507 |
698,061 |
- |
11,847,515 |
|
Affiliate |
Value, |
Purchases |
Sales |
Dividend |
Value, |
|
Spectrum Pharmaceuticals, Inc. |
$ 20,755,301 |
$ 26,633,684 |
$ 2,994,820 |
$ 322,029 |
$ 39,774,600 |
|
Stemline Therapeutics, Inc. |
- |
4,881,000 |
22,817 |
- |
5,884,230 |
|
Vanda Pharmaceuticals, Inc. |
- |
8,137,480 |
3,572,709 |
- |
- |
|
Ventrus Biosciences, Inc. |
7,280,513 |
- |
3,915,058 |
- |
- |
|
Total |
$ 127,012,717 |
$ 124,270,972 |
$ 36,602,707 |
$ 322,029 |
$ 135,108,145 |
|
Other Information |
|
The following is a summary of the inputs used, as of February 28, 2013, involving the Fund's assets and liabilities carried at fair value. The inputs or methodology used for valuing securities may not be an indication of the risk associated with investing in those securities. For more information on valuation inputs, and their aggregation into the levels used in the table below, please refer to the Investment Valuation section in the accompanying Notes to Financial Statements. |
|
Valuation Inputs at Reporting Date: |
||||
|
Description |
Total |
Level 1 |
Level 2 |
Level 3 |
|
Investments in Securities: |
||||
|
Common Stocks |
$ 3,438,508,670 |
$ 3,434,830,316 |
$ 3,678,351 |
$ 3 |
|
Convertible Preferred Stocks |
5,870,304 |
- |
- |
5,870,304 |
|
Money Market Funds |
273,367,620 |
273,367,620 |
- |
- |
|
Total Investments in Securities: |
$ 3,717,746,594 |
$ 3,708,197,936 |
$ 3,678,351 |
$ 5,870,307 |
See accompanying notes which are an integral part of the financial statements.
Annual Report
Biotechnology Portfolio
Financial Statements
Statement of Assets and Liabilities
|
|
February 28, 2013 |
|
|
|
|
|
|
Assets |
|
|
|
Investment in securities, at value (including securities loaned of $261,641,788) - See accompanying schedule: Unaffiliated issuers (cost $2,479,870,368) |
$ 3,309,270,829 |
|
|
Fidelity Central Funds (cost $273,367,620) |
273,367,620 |
|
|
Other affiliated issuers (cost $132,109,240) |
135,108,145 |
|
|
Total Investments (cost $2,885,347,228) |
|
$ 3,717,746,594 |
|
Receivable for investments sold |
|
3,943,604 |
|
Receivable for fund shares sold |
|
11,388,284 |
|
Dividends receivable |
|
2,617,427 |
|
Distributions receivable from Fidelity Central Funds |
|
1,048,786 |
|
Prepaid expenses |
|
5,622 |
|
Receivable from investment adviser for expense reductions |
|
2,707 |
|
Other receivables |
|
79,124 |
|
Total assets |
|
3,736,832,148 |
|
|
|
|
|
Liabilities |
|
|
|
Payable for investments purchased |
$ 8,575,202 |
|
|
Payable for fund shares redeemed |
6,054,680 |
|
|
Accrued management fee |
1,556,792 |
|
|
Other affiliated payables |
586,085 |
|
|
Other payables and accrued expenses |
45,730 |
|
|
Collateral on securities loaned, at value |
269,288,218 |
|
|
Total liabilities |
|
286,106,707 |
|
|
|
|
|
Net Assets |
|
$ 3,450,725,441 |
|
Net Assets consist of: |
|
|
|
Paid in capital |
|
$ 2,645,237,645 |
|
Accumulated net investment loss |
|
(1,465) |
|
Accumulated undistributed net realized gain (loss) on investments and foreign currency transactions |
|
(26,910,105) |
|
Net unrealized appreciation (depreciation) on investments |
|
832,399,366 |
|
Net Assets, for 28,635,187 shares outstanding |
|
$ 3,450,725,441 |
|
Net Asset Value, offering price and redemption price per share ($3,450,725,441 ÷ 28,635,187 shares) |
|
$ 120.51 |
Statement of Operations
|
|
Year ended February 28, 2013 |
|
|
|
|
|
|
Investment Income |
|
|
|
Dividends (including $322,029 earned from other affiliated issuers) |
|
$ 6,414,071 |
|
Interest |
|
467 |
|
Income from Fidelity Central Funds (including $8,964,611 from security lending) |
|
8,995,745 |
|
Total income |
|
15,410,283 |
|
|
|
|
|
Expenses |
|
|
|
Management fee |
$ 13,380,293 |
|
|
Transfer agent fees |
4,751,801 |
|
|
Accounting and security lending fees |
771,480 |
|
|
Custodian fees and expenses |
42,379 |
|
|
Independent trustees' compensation |
15,342 |
|
|
Registration fees |
229,018 |
|
|
Audit |
47,258 |
|
|
Legal |
8,453 |
|
|
Interest |
3,614 |
|
|
Miscellaneous |
17,177 |
|
|
Total expenses before reductions |
19,266,815 |
|
|
Expense reductions |
(290,903) |
18,975,912 |
|
Net investment income (loss) |
|
(3,565,629) |
|
Realized and Unrealized Gain (Loss) Net realized gain (loss) on: |
|
|
|
Investment securities: |
|
|
|
Unaffiliated issuers |
38,094,305 |
|
|
Other affiliated issuers |
(9,215,293) |
|
|
Foreign currency transactions |
1,052 |
|
|
Total net realized gain (loss) |
|
28,880,064 |
|
Change in net unrealized appreciation (depreciation) on investment securities |
|
605,920,510 |
|
Net gain (loss) |
|
634,800,574 |
|
Net increase (decrease) in net assets resulting from operations |
|
$ 631,234,945 |
See accompanying notes which are an integral part of the financial statements.
Annual Report
Statement of Changes in Net Assets
|
|
Year ended |
Year ended |
|
Increase (Decrease) in Net Assets |
|
|
|
Operations |
|
|
|
Net investment income (loss) |
$ (3,565,629) |
$ (3,384,036) |
|
Net realized gain (loss) |
28,880,064 |
152,368,279 |
|
Change in net unrealized appreciation (depreciation) |
605,920,510 |
201,752,872 |
|
Net increase (decrease) in net assets resulting from operations |
631,234,945 |
350,737,115 |
|
Distributions to shareholders from net realized gain |
(122,210,105) |
(1,786,490) |
|
Share transactions |
2,048,861,225 |
771,494,800 |
|
Reinvestment of distributions |
115,347,882 |
1,665,527 |
|
Cost of shares redeemed |
(964,521,211) |
(393,289,579) |
|
Net increase (decrease) in net assets resulting from share transactions |
1,199,687,896 |
379,870,748 |
|
Redemption fees |
182,621 |
102,179 |
|
Total increase (decrease) in net assets |
1,708,895,357 |
728,923,552 |
|
|
|
|
|
Net Assets |
|
|
|
Beginning of period |
1,741,830,084 |
1,012,906,532 |
|
End of period (including accumulated net investment loss of $1,465 and accumulated net investment loss of $777,802, respectively) |
$ 3,450,725,441 |
$ 1,741,830,084 |
|
Other Information Shares |
|
|
|
Sold |
18,573,347 |
8,809,741 |
|
Issued in reinvestment of distributions |
1,211,311 |
19,987 |
|
Redeemed |
(8,962,811) |
(4,701,921) |
|
Net increase (decrease) |
10,821,847 |
4,127,807 |
Financial Highlights
|
Years ended February 28, |
2013 |
2012 J |
2011 |
2010 |
2009 |
|
Selected Per-Share Data |
|
|
|
|
|
|
Net asset value, beginning of period |
$ 97.78 |
$ 74.01 |
$ 67.83 |
$ 54.62 |
$ 62.59 |
|
Income from Investment Operations |
|
|
|
|
|
|
Net investment income (loss) B |
(.16) |
(.23) |
(.41) F |
(.39) G |
(.38) H |
|
Net realized and unrealized gain (loss) |
29.36 |
24.11 |
6.59 |
13.60 |
(7.60) |
|
Total from investment operations |
29.20 |
23.88 |
6.18 |
13.21 |
(7.98) |
|
Distributions from net realized gain |
(6.48) |
(.12) |
- |
- |
- |
|
Redemption fees added to paid in capital B |
.01 |
.01 |
- E |
- E |
.01 |
|
Net asset value, end of period |
$ 120.51 |
$ 97.78 |
$ 74.01 |
$ 67.83 |
$ 54.62 |
|
Total Return A |
31.78% |
32.31% |
9.11% |
24.19% |
(12.73)% |
|
Ratios to Average Net Assets C, I |
|
|
|
|
|
|
Expenses before reductions |
.81% |
.83% |
.87% |
.91% |
.89% |
|
Expenses net of fee waivers, if any |
.80% |
.83% |
.87% |
.91% |
.89% |
|
Expenses net of all reductions |
.79% |
.83% |
.86% |
.91% |
.89% |
|
Net investment income (loss) |
(.15)% |
(.27)% |
(.59)% F |
(.64)% G |
(.61)% H |
|
Supplemental Data |
|
|
|
|
|
|
Net assets, end of period (000 omitted) |
$ 3,450,725 |
$ 1,741,830 |
$ 1,012,907 |
$ 1,068,656 |
$ 1,152,137 |
|
Portfolio turnover rate D |
42% |
106% |
119% |
109% |
55% |
A Total returns would have been lower if certain expenses had not been reduced during the applicable periods shown.
B Calculated based on average shares outstanding during the period.
C Fees and expenses of any underlying Fidelity Central Funds are not included in the Fund's expense ratio. The Fund indirectly bears its proportionate share of the expenses of any underlying Fidelity Central Funds.
D Amount does not include the portfolio activity of any underlying Fidelity Central Funds.
E Amount represents less than $.01 per share.
F Investment income per share reflects a large, non-recurring dividend which amounted to $.11 per share. Excluding this non-recurring dividend, the ratio of net investment income (loss) to average net assets would have been (.75)%.
G Investment income per share reflects a large, non-recurring dividend which amounted to $.09 per share. Excluding this non-recurring dividend, the ratio of net investment income (loss) to average net assets would have been (.78)%.
H Investment income per share reflects a large, non-recurring dividend which amounted to $.05 per share. Excluding this non-recurring dividend, the ratio of net investment income (loss) to average net assets would have been (.69)%.
I Expense ratios reflect operating expenses of the Fund. Expenses before reductions do not reflect amounts reimbursed by the investment adviser or reductions from brokerage service arrangements or reductions from other expense offset arrangements and do not represent the amount paid by the Fund during periods when reimbursements or reductions occur. Expenses net of fee waivers reflect expenses after reimbursement by the investment adviser but prior to reductions from brokerage service arrangements or other expense offset arrangements. Expenses net of all reductions represent the net expenses paid by the Fund.
J For the year ended February 29.
See accompanying notes which are an integral part of the financial statements.
Annual Report
Health Care Portfolio
Performance: The Bottom Line
Average annual total return reflects the change in the value of an investment, assuming reinvestment of the fund's distributions from dividend income and capital gains (the profits earned upon the sale of securities that have grown in value, if any) and assuming a constant rate of performance each year. The $10,000 table and the fund's returns do not reflect the deduction of taxes that a shareholder would pay on fund distributions or the redemption of fund shares. During periods of reimbursement by Fidelity a fund's total return will be greater than it would be had the reimbursement not occurred. How a fund did yesterday is no guarantee of how it will do tomorrow.
Average Annual Total Returns
|
Periods ended February 28, 2013 |
Past 1 |
Past 5 |
Past 10 |
|
Health Care Portfolio |
20.07% |
10.11% |
10.10% |
$10,000 Over 10 Years
Let's say hypothetically that $10,000 was invested in Health Care Portfolio on February 28, 2003. The chart shows how the value of your investment would have changed, and also shows how the S&P 500 Index performed over the same period.

Annual Report
Health Care Portfolio
Management's Discussion of Fund Performance
Market Recap: U.S. stocks posted solid gains for the year ending February 28, 2013, sparked by a late-period rally that pushed major equity benchmarks to multiyear highs. Improvement in the global economy and more monetary stimulus from the U.S. Federal Reserve kept markets on the upswing for much of the year, shrugging off an early decline brought on by debt woes in Europe, and another dip later in the period amid Congressional gridlock on the federal budget. Renewed optimism over employment, the housing market, corporate earnings and record dividends made stocks a favorite with investors during the 12 months, which helped push the broad-based S&P 500® Index across the milestone 1,500 mark at the end of January. The S&P 500® finished the period up 13.46%. Seven of the 10 major market sectors tracked by MSCI U.S. IMI 25-50 classifications produced double-digit gains, led by health care and financials, while information technology, energy and materials trailed the broad equity market with only modest advances.
Comments from Edward Yoon, Portfolio Manager of Health Care Portfolio: For the year, the fund advanced 20.07%, trailing the 22.46% gain of its sector benchmark, the MSCI® U.S. IMI Health Care 25-50 Index, but easily outpacing the S&P 500®. It was a strong year in the health care sector overall, but crosscurrents such as policy and macroeconomic forces drove short-term volatility. Relative to the MSCI sector benchmark, I could've done a better job in managed health care, an area that struggled amid lack of clarity regarding policy reform out of Washington. Here, Health Net and Humana were among our biggest individual relative detractors, and after some reevaluation, I more than halved our exposure to the group and sold Health Net by period end. The fund was hampered by stock choices and an underweighting in pharmaceuticals, which outperformed. I maintained my underweighting here, but I gradually added to companies I felt could aggressively return capital to shareholders and those with solid long-term growth drivers. Pfizer, Merck and Endo Health Solutions were some of our largest individual detractors this period, but I ramped up exposure to all three since they possess these key attributes. Shares of hospital revenue-cycle manager Accretive Health lagged, and I sold the stock. Currency fluctuations also hurt, given our investments in foreign stocks. On the brighter side, my decision to significantly overweight the strong-performing biotechnology category helped the most, although weak picks here tempered the benefit. Our top contributor by far was an overweighting in biotech company Gilead Sciences. Strong data on its hepatitis C therapies lifted the stock. Infinity Pharmaceuticals struggled early this period after its leading cancer drug failed in clinical trials. While I reduced my stake here during the period, I maintained an overweighting, which helped as shares soared through period end on more-promising clinical results. Choices in health care facilities helped, namely Sunrise Senior Living, whose share price rose in August on a lucrative takeout bid, and I sold the stock shortly after.
The views expressed above reflect those of the portfolio manager(s) only through the end of the period as stated on the cover of this report and do not necessarily represent the views of Fidelity or any other person in the Fidelity organization. Any such views are subject to change at any time based upon market or other conditions and Fidelity disclaims any responsibility to update such views. These views may not be relied on as investment advice and, because investment decisions for a Fidelity fund are based on numerous factors, may not be relied on as an indication of trading intent on behalf of any Fidelity fund.
Annual Report
Health Care Portfolio
Investment Changes (Unaudited)
|
Top Ten Stocks as of February 28, 2013 |
||
|
|
% of fund's |
% of fund's net assets |
|
Amgen, Inc. |
8.5 |
7.7 |
|
Merck & Co., Inc. |
7.5 |
6.1 |
|
Gilead Sciences, Inc. |
7.1 |
4.9 |
|
Pfizer, Inc. |
3.8 |
7.1 |
|
McKesson Corp. |
3.6 |
0.5 |
|
Cerner Corp. |
2.6 |
1.7 |
|
Actavis, Inc. |
2.5 |
2.9 |
|
Valeant Pharmaceuticals International, Inc. (Canada) |
2.5 |
1.6 |
|
Quest Diagnostics, Inc. |
2.1 |
1.3 |
|
Boston Scientific Corp. |
2.0 |
2.0 |
|
|
42.2 |
|
|
Top Industries (% of fund's net assets) |
|||
|
As of February 28, 2013 |
|||
|
Biotechnology |
32.6% |
|
|
Pharmaceuticals |
28.5% |
|
|
Health Care |
16.4% |
|
|
Health Care |
8.4% |
|
|
Health Care Technology |
4.4% |
|
|
All Others* |
9.7% |
|

|
As of August 31, 2012 |
|||
|
Pharmaceuticals |
31.6% |
|
|
Biotechnology |
28.1% |
|
|
Health Care |
21.8% |
|
|
Health Care |
8.8% |
|
|
Health Care Technology |
3.2% |
|
|
All Others* |
6.5% |
|

|
* Includes short-term investments and net other assets. |
Annual Report
Health Care Portfolio
Investments February 28, 2013
Showing Percentage of Net Assets
|
Common Stocks - 97.0% |
|||
|
Shares |
Value |
||
|
BIOTECHNOLOGY - 32.5% |
|||
|
Biotechnology - 32.5% |
|||
|
Achillion Pharmaceuticals, Inc. (a) |
1,280,000 |
$ 10,368,000 |
|
|
Acorda Therapeutics, Inc. (a) |
200,000 |
5,950,000 |
|
|
Alexion Pharmaceuticals, Inc. (a) |
540,000 |
46,839,600 |
|
|
Amgen, Inc. |
2,550,000 |
233,095,501 |
|
|
AVEO Pharmaceuticals, Inc. (a)(d) |
400,000 |
2,668,000 |
|
|
Biogen Idec, Inc. (a) |
60,000 |
9,980,400 |
|
|
BioMarin Pharmaceutical, Inc. (a) |
800,000 |
46,376,000 |
|
|
Biovitrum AB (a) |
2,145,200 |
13,035,588 |
|
|
Discovery Laboratories, Inc. (a)(d) |
1,961,800 |
4,826,028 |
|
|
Dynavax Technologies Corp. (a) |
2,500,000 |
5,100,000 |
|
|
Elan Corp. PLC sponsored ADR (a) |
1,500,000 |
17,010,000 |
|
|
Genomic Health, Inc. (a) |
350,000 |
10,027,500 |
|
|
Gilead Sciences, Inc. (a) |
4,550,000 |
194,330,500 |
|
|
Grifols SA ADR |
1,344,000 |
38,545,920 |
|
|
Infinity Pharmaceuticals, Inc. (a) |
280,000 |
11,561,200 |
|
|
Insmed, Inc. (a) |
264,994 |
1,632,363 |
|
|
Intercept Pharmaceuticals, Inc. |
83,260 |
3,248,805 |
|
|
Lexicon Pharmaceuticals, Inc. (a) |
2,612,400 |
5,146,428 |
|
|
Medivation, Inc. (a) |
600,000 |
29,484,000 |
|
|
Merrimack Pharmaceuticals, Inc. |
500,000 |
3,200,000 |
|
|
Momenta Pharmaceuticals, Inc. (a) |
600,000 |
7,644,000 |
|
|
Neurocrine Biosciences, Inc. (a) |
1,005,500 |
10,638,190 |
|
|
NPS Pharmaceuticals, Inc. (a) |
800,000 |
6,384,000 |
|
|
Onyx Pharmaceuticals, Inc. (a) |
570,000 |
42,926,700 |
|
|
Puma Biotechnology, Inc. |
400,000 |
10,284,000 |
|
|
Regeneron Pharmaceuticals, Inc. (a) |
320,000 |
53,440,000 |
|
|
Seattle Genetics, Inc. (a) |
450,000 |
12,663,000 |
|
|
Spectrum Pharmaceuticals, Inc. |
600,000 |
6,840,000 |
|
|
Synageva BioPharma Corp. (a) |
156,000 |
7,795,320 |
|
|
Synta Pharmaceuticals Corp. (a) |
400,000 |
3,436,000 |
|
|
Targacept, Inc. (a) |
1,000,000 |
4,330,000 |
|
|
Theravance, Inc. (a)(d) |
700,000 |
14,203,000 |
|
|
United Therapeutics Corp. (a) |
140,000 |
8,373,400 |
|
|
ZIOPHARM Oncology, Inc. (a)(d) |
1,100,000 |
4,873,000 |
|
|
|
886,256,443 |
||
|
DIVERSIFIED CONSUMER SERVICES - 0.7% |
|||
|
Specialized Consumer Services - 0.7% |
|||
|
Carriage Services, Inc. (e) |
996,904 |
18,143,653 |
|
|
FOOD & STAPLES RETAILING - 1.8% |
|||
|
Drug Retail - 1.8% |
|||
|
CVS Caremark Corp. |
500,000 |
25,560,000 |
|
|
Walgreen Co. |
550,000 |
22,517,000 |
|
|
|
48,077,000 |
||
|
HEALTH CARE EQUIPMENT & SUPPLIES - 8.4% |
|||
|
Health Care Equipment - 6.5% |
|||
|
Boston Scientific Corp. (a) |
7,300,000 |
53,947,000 |
|
|
CONMED Corp. |
265,000 |
8,244,150 |
|
|
Covidien PLC |
700,000 |
44,499,000 |
|
|
Genmark Diagnostics, Inc. (a) |
1,342,600 |
14,003,318 |
|
|
|
|||
|
Shares |
Value |
||
|
HeartWare International, Inc. (a)(d) |
120,000 |
$ 10,250,400 |
|
|
Insulet Corp. (a) |
712,300 |
16,076,611 |
|
|
Volcano Corp. (a) |
850,000 |
18,394,000 |
|
|
Wright Medical Group, Inc. (a) |
400,000 |
9,300,000 |
|
|
Zeltiq Aesthetics, Inc. (a) |
1,050,000 |
4,231,500 |
|
|
|
178,945,979 |
||
|
Health Care Supplies - 1.9% |
|||
|
Derma Sciences, Inc. (a)(e) |
900,000 |
11,097,000 |
|
|
The Cooper Companies, Inc. |
380,000 |
40,302,800 |
|
|
|
51,399,800 |
||
|
TOTAL HEALTH CARE EQUIPMENT & SUPPLIES |
230,345,779 |
||
|
HEALTH CARE PROVIDERS & SERVICES - 16.4% |
|||
|
Health Care Distributors & Services - 3.8% |
|||
|
Amplifon SpA |
1,200,000 |
6,454,639 |
|
|
McKesson Corp. |
920,000 |
97,639,600 |
|
|
|
104,094,239 |
||
|
Health Care Facilities - 1.7% |
|||
|
Brookdale Senior Living, Inc. (a) |
450,000 |
12,456,000 |
|
|
Emeritus Corp. (a) |
434,000 |
12,364,660 |
|
|
Hanger, Inc. (a) |
300,000 |
8,898,000 |
|
|
NMC Health PLC |
1,054,000 |
4,525,087 |
|
|
Raffles Medical Group Ltd. |
2,789,000 |
7,296,802 |
|
|
|
45,540,549 |
||
|
Health Care Services - 6.6% |
|||
|
BioScrip, Inc. (a) |
1,290,000 |
14,125,500 |
|
|
Catamaran Corp. (a) |
800,000 |
42,968,002 |
|
|
HMS Holdings Corp. (a) |
500,000 |
14,495,000 |
|
|
MEDNAX, Inc. (a) |
620,000 |
53,084,400 |
|
|
Quest Diagnostics, Inc. |
1,000,000 |
56,170,000 |
|
|
|
180,842,902 |
||
|
Managed Health Care - 4.3% |
|||
|
Aetna, Inc. |
150,000 |
7,078,500 |
|
|
CIGNA Corp. |
750,000 |
43,845,000 |
|
|
Humana, Inc. |
500,000 |
34,130,000 |
|
|
Qualicorp SA (a) |
600,000 |
6,708,093 |
|
|
UnitedHealth Group, Inc. |
450,000 |
24,052,500 |
|
|
|
115,814,093 |
||
|
TOTAL HEALTH CARE PROVIDERS & SERVICES |
446,291,783 |
||
|
HEALTH CARE TECHNOLOGY - 3.9% |
|||
|
Health Care Technology - 3.9% |
|||
|
athenahealth, Inc. (a)(d) |
300,000 |
28,137,000 |
|
|
Cerner Corp. (a) |
820,000 |
71,717,200 |
|
|
HealthStream, Inc. (a) |
325,000 |
6,951,750 |
|
|
|
106,805,950 |
||
|
IT SERVICES - 1.1% |
|||
|
IT Consulting & Other Services - 1.1% |
|||
|
Maximus, Inc. |
400,000 |
29,112,000 |
|
|
Common Stocks - continued |
|||
|
Shares |
Value |
||
|
LIFE SCIENCES TOOLS & SERVICES - 2.9% |
|||
|
Life Sciences Tools & Services - 2.9% |
|||
|
Agilent Technologies, Inc. |
1,280,000 |
$ 53,094,400 |
|
|
Bruker BioSciences Corp. (a) |
500,000 |
8,770,000 |
|
|
Fluidigm Corp. (a) |
2,063 |
35,607 |
|
|
Illumina, Inc. (a) |
162,400 |
8,141,112 |
|
|
Waters Corp. (a) |
100,000 |
9,272,000 |
|
|
|
79,313,119 |
||
|
PERSONAL PRODUCTS - 0.7% |
|||
|
Personal Products - 0.7% |
|||
|
Prestige Brands Holdings, Inc. (a) |
770,000 |
18,318,300 |
|
|
PHARMACEUTICALS - 28.5% |
|||
|
Pharmaceuticals - 28.5% |
|||
|
Actavis, Inc. (a) |
810,000 |
68,979,600 |
|
|
Cadence Pharmaceuticals, Inc. (a) |
900,000 |
4,410,000 |
|
|
Eli Lilly & Co. |
600,000 |
32,796,000 |
|
|
Endo Health Solutions, Inc. (a) |
1,100,000 |
34,100,000 |
|
|
Hi-Tech Pharmacal Co., Inc. |
250,000 |
9,252,500 |
|
|
Ipca Laboratories Ltd. |
300,000 |
2,737,079 |
|
|
Johnson & Johnson |
150,000 |
11,416,500 |
|
|
Lee's Pharmaceutical Holdings Ltd. |
725,000 |
574,907 |
|
|
Meda AB (A Shares) |
1,000,000 |
11,287,380 |
|
|
Merck & Co., Inc. |
4,800,000 |
205,104,000 |
|
|
Mylan, Inc. (a) |
800,000 |
23,688,000 |
|
|
Optimer Pharmaceuticals, Inc. (a)(d) |
1,000,000 |
12,120,000 |
|
|
Pacira Pharmaceuticals, Inc. (a)(d) |
250,000 |
5,465,000 |
|
|
Pfizer, Inc. |
3,800,000 |
104,006,000 |
|
|
Salix Pharmaceuticals Ltd. (a) |
197,812 |
9,663,116 |
|
|
Sanofi SA |
450,000 |
42,497,036 |
|
|
Shire PLC sponsored ADR |
400,000 |
37,464,000 |
|
|
The Medicines Company (a) |
400,000 |
12,724,000 |
|
|
UCB SA |
300,000 |
17,331,176 |
|
|
Valeant Pharmaceuticals International, Inc. (Canada) (a) |
1,000,000 |
67,442,424 |
|
|
ViroPharma, Inc. (a) |
1,415,482 |
35,302,121 |
|
|
Warner Chilcott PLC |
2,000,000 |
27,020,000 |
|
|
XenoPort, Inc. (a) |
106,000 |
809,840 |
|
|
|
776,190,679 |
||
|
REAL ESTATE MANAGEMENT & DEVELOPMENT - 0.1% |
|||
|
Real Estate Development - 0.1% |
|||
|
PT Lippo Karawaci Tbk |
26,534,500 |
3,102,803 |
|
|
TOTAL COMMON STOCKS (Cost $2,099,206,796) |
|
||
|
Convertible Preferred Stocks - 0.6% |
|||
|
|
|
|
|
|
BIOTECHNOLOGY - 0.1% |
|||
|
Biotechnology - 0.1% |
|||
|
Ariosa Diagnostics (a)(f) |
496,689 |
3,000,002 |
|
|
|
|||
|
Shares |
Value |
||
|
HEALTH CARE TECHNOLOGY - 0.5% |
|||
|
Health Care Technology - 0.5% |
|||
|
Castlight Health, Inc.: |
|
|
|
|
Series C (a)(f) |
90,850 |
$ 635,950 |
|
|
Series D (a)(f) |
1,784,800 |
12,493,600 |
|
|
|
13,129,550 |
||
|
TOTAL CONVERTIBLE PREFERRED STOCKS (Cost $14,322,475) |
|
||
|
Money Market Funds - 4.6% |
|||
|
|
|
|
|
|
Fidelity Cash Central Fund, 0.16% (b) |
85,067,314 |
85,067,314 |
|
|
Fidelity Securities Lending Cash Central Fund, 0.16% (b)(c) |
41,558,804 |
41,558,804 |
|
|
TOTAL MONEY MARKET FUNDS (Cost $126,626,118) |
|
||
|
TOTAL INVESTMENT PORTFOLIO - 102.2% (Cost $2,240,155,389) |
2,784,713,179 |
|
NET OTHER ASSETS (LIABILITIES) - (2.2)% |
(60,372,080) |
||
|
NET ASSETS - 100% |
$ 2,724,341,099 |
||
|
Legend |
|
(a) Non-income producing |
|
(b) Affiliated fund that is generally available only to investment companies and other accounts managed by Fidelity Investments. The rate quoted is the annualized seven-day yield of the fund at period end. A complete unaudited listing of the fund's holdings as of its most recent quarter end is available upon request. In addition, each Fidelity Central Fund's financial statements, which are not covered by the Fund's Report of Independent Registered Public Accounting Firm, are available on the SEC's website or upon request. |
|
(c) Investment made with cash collateral received from securities on loan. |
|
(d) Security or a portion of the security is on loan at period end. |
|
(e) Affiliated company |
|
(f) Restricted securities - Investment in securities not registered under the Securities Act of 1933 (excluding 144A issues). At the end of the period, the value of restricted securities (excluding 144A issues) amounted to $16,129,552 or 0.6% of net assets. |
|
Additional information on each restricted holding is as follows: |
|
Security |
Acquisition Date |
Acquisition Cost |
|
Ariosa Diagnostics |
11/30/11 |
$ 3,000,002 |
|
Castlight Health, Inc. Series C |
12/6/12 |
$ 548,421 |
|
Castlight Health, Inc. Series D |
4/25/12 |
$ 10,774,052 |
|
Affiliated Central Funds |
|
Information regarding fiscal year to date income earned by the Fund from investments in Fidelity Central Funds is as follows: |
|
Fund |
Income earned |
|
Fidelity Cash Central Fund |
$ 86,988 |
|
Fidelity Securities Lending Cash Central Fund |
449,841 |
|
Total |
$ 536,829 |
|
Other Affiliated Issuers |
|
An affiliated company is a company in which the Fund has ownership of at least 5% of the voting securities. Fiscal year to date transactions with companies which are or were affiliates are as follows: |
|
Affiliate |
Value, |
Purchases |
Sales |
Dividend |
Value, |
|
Carriage Services, Inc. |
$ 5,971,455 |
$ - |
$ - |
$ 99,690 |
$ 18,143,653 |
|
Derma Sciences, Inc. |
- |
9,574,295 |
- |
- |
11,097,000 |
|
Genmark Diagnostics, Inc. |
3,923,962 |
1,671,998 |
- |
- |
- |
|
Total |
$ 9,895,417 |
$ 11,246,293 |
$ - |
$ 99,690 |
$ 29,240,653 |
|
Other Information |
|
The following is a summary of the inputs used, as of February 28, 2013, involving the Fund's assets and liabilities carried at fair value. The inputs or methodology used for valuing securities may not be an indication of the risk associated with investing in those securities. For more information on valuation inputs, and their aggregation into the levels used in the table below, please refer to the Investment Valuation section in the accompanying Notes to Financial Statements. |
|
Valuation Inputs at Reporting Date: |
||||
|
Description |
Total |
Level 1 |
Level 2 |
Level 3 |
|
Investments in Securities: |
||||
|
Common Stocks |
$ 2,641,957,509 |
$ 2,599,460,473 |
$ 42,497,036 |
$ - |
|
Convertible Preferred Stocks |
16,129,552 |
- |
- |
16,129,552 |
|
Money Market Funds |
126,626,118 |
126,626,118 |
- |
- |
|
Total Investments in Securities: |
$ 2,784,713,179 |
$ 2,726,086,591 |
$ 42,497,036 |
$ 16,129,552 |
|
Distribution of investments by country or territory of incorporation, as a percentage of total net assets, is as follows. (Unaudited) |
|
United States of America |
85.7% |
|
Canada |
4.1% |
|
Ireland |
3.2% |
|
France |
1.6% |
|
Spain |
1.4% |
|
Bailiwick of Jersey |
1.4% |
|
Others (Individually Less Than 1%) |
2.6% |
|
|
100.0% |
See accompanying notes which are an integral part of the financial statements.
Annual Report
Health Care Portfolio
Financial Statements
Statement of Assets and Liabilities
|
|
February 28, 2013 |
|
|
|
|
|
|
Assets |
|
|
|
Investment in securities, at value (including securities loaned of $40,408,274) - See accompanying schedule: Unaffiliated issuers (cost $2,098,254,711) |
$ 2,628,846,408 |
|
|
Fidelity Central Funds (cost $126,626,118) |
126,626,118 |
|
|
Other affiliated issuers (cost $15,274,560) |
29,240,653 |
|
|
Total Investments (cost $2,240,155,389) |
|
$ 2,784,713,179 |
|
Cash |
|
1,803,616 |
|
Receivable for investments sold |
|
29,747,367 |
|
Receivable for fund shares sold |
|
1,824,404 |
|
Dividends receivable |
|
2,905,125 |
|
Distributions receivable from Fidelity Central Funds |
|
73,845 |
|
Prepaid expenses |
|
4,453 |
|
Receivable from investment adviser for expense reductions |
|
1,487 |
|
Other receivables |
|
112,792 |
|
Total assets |
|
2,821,186,268 |
|
|
|
|
|
Liabilities |
|
|
|
Payable for investments purchased |
$ 51,112,820 |
|
|
Payable for fund shares redeemed |
2,370,406 |
|
|
Accrued management fee |
1,253,877 |
|
|
Other affiliated payables |
467,299 |
|
|
Other payables and accrued expenses |
81,963 |
|
|
Collateral on securities loaned, at value |
41,558,804 |
|
|
Total liabilities |
|
96,845,169 |
|
|
|
|
|
Net Assets |
|
$ 2,724,341,099 |
|
Net Assets consist of: |
|
|
|
Paid in capital |
|
$ 2,111,635,431 |
|
Undistributed net investment income |
|
639,646 |
|
Accumulated undistributed net realized gain (loss) on investments and foreign currency transactions |
|
67,511,457 |
|
Net unrealized appreciation (depreciation) on investments and assets and liabilities in foreign currencies |
|
544,554,565 |
|
Net Assets, for 18,892,288 shares outstanding |
|
$ 2,724,341,099 |
|
Net Asset Value, offering price and redemption price per share ($2,724,341,099 ÷ 18,892,288 shares) |
|
$ 144.20 |
Statement of Operations
|
|
Year ended February 28, 2013 |
|
|
|
|
|
|
Investment Income |
|
|
|
Dividends (including $99,690 earned from other affiliated issuers) |
|
$ 26,583,041 |
|
Interest |
|
2,892 |
|
Income from Fidelity Central Funds (including $449,841 from security lending) |
|
536,829 |
|
Total income |
|
27,122,762 |
|
|
|
|
|
Expenses |
|
|
|
Management fee |
$ 13,306,167 |
|
|
Transfer agent fees |
4,512,167 |
|
|
Accounting and security lending fees |
724,579 |
|
|
Custodian fees and expenses |
101,982 |
|
|
Independent trustees' compensation |
15,627 |
|
|
Appreciation in deferred trustee compensation account |
269 |
|
|
Registration fees |
78,311 |
|
|
Audit |
50,624 |
|
|
Legal |
9,096 |
|
|
Miscellaneous |
22,208 |
|
|
Total expenses before reductions |
18,821,030 |
|
|
Expense reductions |
(317,267) |
18,503,763 |
|
Net investment income (loss) |
|
8,618,999 |
|
Realized and Unrealized Gain (Loss) Net realized gain (loss) on: |
|
|
|
Investment securities: |
|
|
|
Unaffiliated issuers |
270,833,135 |
|
|
Foreign currency transactions |
(121,990) |
|
|
Total net realized gain (loss) |
|
270,711,145 |
|
Change in net unrealized appreciation (depreciation) on: Investment securities |
161,747,205 |
|
|
Assets and liabilities in foreign currencies |
(1,092) |
|
|
Total change in net unrealized appreciation (depreciation) |
|
161,746,113 |
|
Net gain (loss) |
|
432,457,258 |
|
Net increase (decrease) in net assets resulting from operations |
|
$ 441,076,257 |
See accompanying notes which are an integral part of the financial statements.
Annual Report
Statement of Changes in Net Assets
|
|
Year ended |
Year ended |
|
Increase (Decrease) in Net Assets |
|
|
|
Operations |
|
|
|
Net investment income (loss) |
$ 8,618,999 |
$ 1,031 |
|
Net realized gain (loss) |
270,711,145 |
269,212,000 |
|
Change in net unrealized appreciation (depreciation) |
161,746,113 |
(93,355,802) |
|
Net increase (decrease) in net assets resulting from operations |
441,076,257 |
175,857,229 |
|
Distributions to shareholders from net investment income |
(7,644,611) |
- |
|
Distributions to shareholders from net realized gain |
(233,576,413) |
(176,290,692) |
|
Total distributions |
(241,221,024) |
(176,290,692) |
|
Share transactions |
587,069,831 |
643,651,462 |
|
Reinvestment of distributions |
229,888,847 |
167,043,397 |
|
Cost of shares redeemed |
(468,724,036) |
(625,716,838) |
|
Net increase (decrease) in net assets resulting from share transactions |
348,234,642 |
184,978,021 |
|
Redemption fees |
27,171 |
75,308 |
|
Total increase (decrease) in net assets |
548,117,046 |
184,619,866 |
|
|
|
|
|
Net Assets |
|
|
|
Beginning of period |
2,176,224,053 |
1,991,604,187 |
|
End of period (including undistributed net investment income of $639,646 and distributions in excess of net investment income of $37,650, respectively) |
$ 2,724,341,099 |
$ 2,176,224,053 |
|
Other Information Shares |
|
|
|
Sold |
4,198,660 |
4,810,845 |
|
Issued in reinvestment of distributions |
1,723,942 |
1,397,502 |
|
Redeemed |
(3,383,695) |
(4,725,720) |
|
Net increase (decrease) |
2,538,907 |
1,482,627 |
Financial Highlights
|
Years ended February 28, |
2013 |
2012 G |
2011 |
2010 |
2009 |
|
Selected Per-Share Data |
|
|
|
|
|
|
Net asset value, beginning of period |
$ 133.07 |
$ 133.93 |
$ 109.17 |
$ 73.65 |
$ 114.24 |
|
Income from Investment Operations |
|
|
|
|
|
|
Net investment income (loss) B |
.50 |
- H |
.04 |
.06 |
.42 |
|
Net realized and unrealized gain (loss) |
24.74 |
10.86 |
24.90 |
35.71 |
(35.98) |
|
Total from investment operations |
25.24 |
10.86 |
24.94 |
35.77 |
(35.56) |
|
Distributions from net investment income |
(.44) |
- |
(.17) |
(.25) |
(.37) |
|
Distributions from net realized gain |
(13.67) |
(11.72) |
(.01) |
(.01) |
(4.66) |
|
Total distributions |
(14.11) |
(11.72) |
(.18) |
(.25) I |
(5.03) |
|
Redemption fees added to paid in capital B, H |
- |
- |
- |
- |
- |
|
Net asset value, end of period |
$ 144.20 |
$ 133.07 |
$ 133.93 |
$ 109.17 |
$ 73.65 |
|
Total Return A |
20.07% |
9.10% |
22.86% |
48.65% |
(32.34)% |
|
Ratios to Average Net Assets C, F |
|
|
|
|
|
|
Expenses before reductions |
.79% |
.80% |
.82% |
.88% |
.86% |
|
Expenses net of fee waivers, if any |
.79% |
.80% |
.82% |
.88% |
.86% |
|
Expenses net of all reductions |
.78% |
.80% |
.82% |
.87% |
.86% |
|
Net investment income (loss) |
.36% |
.00% E |
.03% |
.07% |
.44% |
|
Supplemental Data |
|
|
|
|
|
|
Net assets, end of period (000 omitted) |
$ 2,724,341 |
$ 2,176,224 |
$ 1,991,604 |
$ 1,727,742 |
$ 1,191,143 |
|
Portfolio turnover rate D |
95% |
130% |
99% |
116% |
173% |
A Total returns would have been lower if certain expenses had not been reduced during the applicable periods shown.
B Calculated based on average shares outstanding during the period.
C Fees and expenses of any underlying Fidelity Central Funds are not included in the Fund's expense ratio. The Fund indirectly bears its proportionate share of the expenses of any underlying Fidelity Central Funds.
D Amount does not include the portfolio activity of any underlying Fidelity Central Funds.
E Amount represents less than .01%.
F Expense ratios reflect operating expenses of the Fund. Expenses before reductions do not reflect amounts reimbursed by the investment adviser or reductions from brokerage service arrangements or reductions from other expense offset arrangements and do not represent the amount paid by the Fund during periods when reimbursements or reductions occur. Expenses net of fee waivers reflect expenses after reimbursement by the investment adviser but prior to reductions from brokerage service arrangements or other expense offset arrangements. Expenses net of all reductions represent the net expenses paid by the Fund.
G For the year ended February 29.
H Amount represents less than $.01 per share.
I Total distributions of $.25 per share is comprised of distributions from net investment income of $.245 and distributions from net realized gain of $.005 per share.
See accompanying notes which are an integral part of the financial statements.
Annual Report
Medical Delivery Portfolio
Performance: The Bottom Line
Average annual total return reflects the change in the value of an investment, assuming reinvestment of the fund's distributions from dividend income and capital gains (the profits earned upon the sale of securities that have grown in value, if any) and assuming a constant rate of performance each year. The $10,000 table and the fund's returns do not reflect the deduction of taxes that a shareholder would pay on fund distributions or the redemption of fund shares. During periods of reimbursement by Fidelity a fund's total return will be greater than it would be had the reimbursement not occurred. How a fund did yesterday is no guarantee of how it will do tomorrow.
Average Annual Total Returns
|
Periods ended February 28, 2013 |
Past 1 |
Past 5 |
Past 10 |
|
Medical Delivery Portfolio |
3.17% |
7.11% |
13.45% |
$10,000 Over 10 Years
Let's say hypothetically that $10,000 was invested in Medical Delivery Portfolio on February 28, 2003. The chart shows how the value of your investment would have changed, and also shows how the S&P 500 Index performed over the same period.
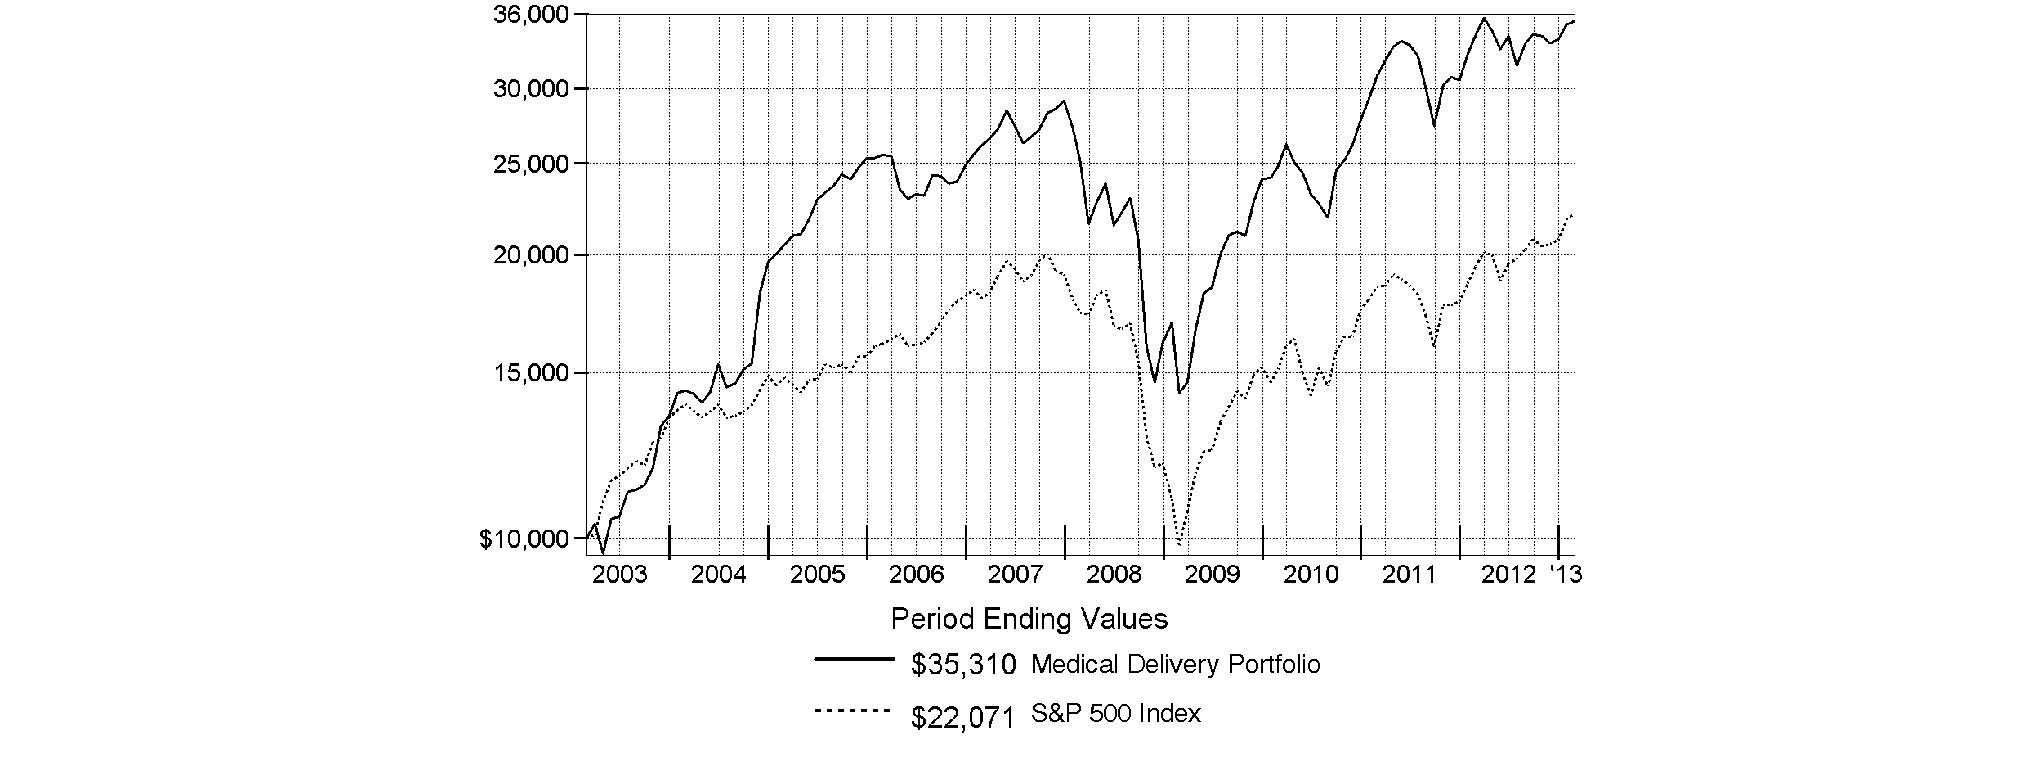
Annual Report
Medical Delivery Portfolio
Management's Discussion of Fund Performance
Market Recap: U.S. stocks posted solid gains for the year ending February 28, 2013, sparked by a late-period rally that pushed major equity benchmarks to multiyear highs. Improvement in the global economy and more monetary stimulus from the U.S. Federal Reserve kept markets on the upswing for much of the year, shrugging off an early decline brought on by debt woes in Europe, and another dip later in the period amid Congressional gridlock on the federal budget. Renewed optimism over employment, the housing market, corporate earnings and record dividends made stocks a favorite with investors during the 12 months, which helped push the broad-based S&P 500® Index across the milestone 1,500 mark at the end of January. The S&P 500® finished the period up 13.46%. Seven of the 10 major market sectors tracked by MSCI U.S. IMI 25-50 classifications produced double-digit gains, led by health care and financials, while information technology, energy and materials trailed the broad equity market with only modest advances.
Comments from Steven Bullock, who became Portfolio Manager of Medical Delivery Portfolio on July 23, 2012: For the year, the fund returned 3.17%, trailing its industry benchmark, the MSCI® U.S. IMI Health Care Providers & Services 25-50 Index, which gained 12.48%, and the broadly based S&P 500®. Medical delivery companies faced a challenging environment, as the industry lagged the broader market in part due to declining stock prices among managed health care companies and macroeconomic weakness that pushed investors to favor less-risky assets for the majority of the period. But a primary source of uncertainty in the industry subsided when the U.S. Supreme Court upheld most major provisions of the Patient Protection and Affordable Care Act (ACA) at the end of June. Relative to the MSCI index, the fund's positioning in health care services hurt the most, mainly due to an overweighting in hospital billing company Accretive Health. Shares of Accretive plummeted in April amid allegations the firm engaged in aggressive and unlawful collections tactics. I sold Accretive shortly after I took over the fund, since I deemed the stock expensive and was wary of its legal struggles. Positioning in managed health care also hurt, as many firms here, including Health Net, underestimated rising medical costs during the period and downwardly revised their earnings guidance. I halved our exposure to the group and sold Health Net. A non-index stake in Weight Watchers really hurt performance when the company's early-2013 selling season proved disappointing. I exited the position by period end since I lost conviction in the stock's long-term value. Conversely, an out-of-benchmark position in pharmacy benefits manager (PBM) SXC Health Solutions was our biggest relative contributor, as investors reacted positively after its announcement in April 2012 of plans to buy rival Catalyst Health Solutions, which also was a beneficial fund holding. Timely ownership of HMS Holdings helped, as execution issues throughout the year and a slower ramp in its Medicaid business weighed on investor sentiment. Lastly, MEDNAX, which provides physician services to newborns and anesthesia care, continued to exceed expectations and benefited from the government's decision to increase Medicaid physician rates to Medicare levels.
The views expressed above reflect those of the portfolio manager(s) only through the end of the period as stated on the cover of this report and do not necessarily represent the views of Fidelity or any other person in the Fidelity organization. Any such views are subject to change at any time based upon market or other conditions and Fidelity disclaims any responsibility to update such views. These views may not be relied on as investment advice and, because investment decisions for a Fidelity fund are based on numerous factors, may not be relied on as an indication of trading intent on behalf of any Fidelity fund.
Annual Report
Medical Delivery Portfolio
Investment Changes (Unaudited)
|
Top Ten Stocks as of February 28, 2013 |
||
|
|
% of fund's |
% of fund's net assets |
|
Express Scripts Holding Co. |
17.6 |
17.0 |
|
UnitedHealth Group, Inc. |
15.7 |
19.4 |
|
McKesson Corp. |
9.3 |
6.9 |
|
CIGNA Corp. |
5.4 |
5.0 |
|
AmerisourceBergen Corp. |
5.0 |
3.7 |
|
Cardinal Health, Inc. |
5.0 |
0.0 |
|
Quest Diagnostics, Inc. |
4.2 |
4.6 |
|
Henry Schein, Inc. |
4.1 |
3.1 |
|
Laboratory Corp. of America Holdings |
3.8 |
4.2 |
|
MEDNAX, Inc. |
3.3 |
2.6 |
|
|
73.4 |
|
|
Top Industries (% of fund's net assets) |
|||
|
As of February 28, 2013 |
|||
|
Health Care |
90.1% |
|
|
Food & Staples Retailing |
1.0% |
|
|
Health Care |
1.0% |
|
|
Chemicals |
0.6% |
|
|
Industrial Conglomerates |
0.6% |
|
|
All Others* |
6.7% |
|

|
As of August 31, 2012 |
|||
|
Health Care |
95.8% |
|
 |
Diversified Consumer Services |
0.5% |
|
 |
Health Care |
0.5% |
|
|
Life Sciences |
0.3% |
|
|
All Others* |
2.9% |
|

|
* Includes short-term investments and net other assets. |
Annual Report
Medical Delivery Portfolio
Investments February 28, 2013
Showing Percentage of Net Assets
|
Common Stocks - 96.1% |
|||
|
Shares |
Value |
||
|
CHEMICALS - 0.6% |
|||
|
Specialty Chemicals - 0.6% |
|||
|
Sigma Aldrich Corp. |
41,200 |
$ 3,174,872 |
|
|
COMMERCIAL SERVICES & SUPPLIES - 0.5% |
|||
|
Environmental & Facility Services - 0.5% |
|||
|
Stericycle, Inc. (a) |
32,700 |
3,136,584 |
|
|
FOOD & STAPLES RETAILING - 1.0% |
|||
|
Drug Retail - 1.0% |
|||
|
CVS Caremark Corp. |
110,200 |
5,633,424 |
|
|
HEALTH CARE EQUIPMENT & SUPPLIES - 1.0% |
|||
|
Health Care Equipment - 0.5% |
|||
|
Covidien PLC |
48,200 |
3,064,074 |
|
|
Health Care Supplies - 0.5% |
|||
|
Align Technology, Inc. (a) |
89,700 |
2,820,168 |
|
|
TOTAL HEALTH CARE EQUIPMENT & SUPPLIES |
5,884,242 |
||
|
HEALTH CARE PROVIDERS & SERVICES - 90.1% |
|||
|
Health Care Distributors & Services - 30.2% |
|||
|
AmerisourceBergen Corp. |
593,000 |
27,989,600 |
|
|
Cardinal Health, Inc. |
604,400 |
27,929,324 |
|
|
Henry Schein, Inc. (a) |
261,300 |
23,313,186 |
|
|
McKesson Corp. |
492,500 |
52,269,025 |
|
|
MWI Veterinary Supply, Inc. (a) |
88,100 |
11,123,506 |
|
|
Owens & Minor, Inc. (d) |
379,400 |
11,552,730 |
|
|
Patterson Companies, Inc. |
436,100 |
15,847,874 |
|
|
|
170,025,245 |
||
|
Health Care Facilities - 0.9% |
|||
|
The Ensign Group, Inc. |
83,500 |
2,615,220 |
|
|
U.S. Physical Therapy, Inc. |
89,300 |
2,198,566 |
|
|
|
4,813,786 |
||
|
Health Care Services - 35.2% |
|||
|
Air Methods Corp. |
128,400 |
5,751,036 |
|
|
BioScrip, Inc. (a) |
127,200 |
1,392,840 |
|
|
Catamaran Corp. (a) |
40,512 |
2,175,900 |
|
|
Chemed Corp. |
55,900 |
4,314,921 |
|
|
Corvel Corp. (a) |
108,200 |
5,197,928 |
|
|
DaVita, Inc. (a) |
44,500 |
5,323,090 |
|
|
Express Scripts Holding Co. (a) |
1,742,450 |
99,162,828 |
|
|
HMS Holdings Corp. (a) |
199,800 |
5,792,202 |
|
|
Laboratory Corp. of America Holdings (a) |
240,200 |
21,281,720 |
|
|
Landauer, Inc. |
96,500 |
5,665,515 |
|
|
MEDNAX, Inc. (a) |
213,600 |
18,288,432 |
|
|
Quest Diagnostics, Inc. |
420,200 |
23,602,634 |
|
|
|
197,949,046 |
||
|
Managed Health Care - 23.8% |
|||
|
Centene Corp. (a) |
121,200 |
5,456,424 |
|
|
CIGNA Corp. |
519,000 |
30,340,740 |
|
|
Magellan Health Services, Inc. (a) |
78,000 |
4,021,680 |
|
|
|
|||
|
Shares |
Value |
||
|
Molina Healthcare, Inc. (a) |
137,900 |
$ 4,400,389 |
|
|
Qualicorp SA (a) |
131,900 |
1,474,663 |
|
|
UnitedHealth Group, Inc. |
1,656,297 |
88,529,075 |
|
|
|
134,222,971 |
||
|
TOTAL HEALTH CARE PROVIDERS & SERVICES |
507,011,048 |
||
|
INDUSTRIAL CONGLOMERATES - 0.6% |
|||
|
Industrial Conglomerates - 0.6% |
|||
|
Danaher Corp. |
51,500 |
3,172,400 |
|
|
IT SERVICES - 0.1% |
|||
|
IT Consulting & Other Services - 0.1% |
|||
|
Maximus, Inc. |
11,700 |
851,526 |
|
|
LIFE SCIENCES TOOLS & SERVICES - 0.5% |
|||
|
Life Sciences Tools & Services - 0.5% |
|||
|
Agilent Technologies, Inc. |
68,100 |
2,824,788 |
|
|
MACHINERY - 0.6% |
|||
|
Industrial Machinery - 0.6% |
|||
|
Pall Corp. |
46,400 |
3,163,552 |
|
|
PROFESSIONAL SERVICES - 0.6% |
|||
|
Research & Consulting Services - 0.6% |
|||
|
Verisk Analytics, Inc. (a) |
62,100 |
3,634,092 |
|
|
SPECIALTY RETAIL - 0.5% |
|||
|
Specialty Stores - 0.5% |
|||
|
PetSmart, Inc. |
42,100 |
2,741,131 |
|
|
TOTAL COMMON STOCKS (Cost $419,189,804) |
|
||
|
Money Market Funds - 4.0% |
|||
|
|
|
|
|
|
Fidelity Cash Central Fund, 0.16% (b) |
19,045,873 |
19,045,873 |
|
|
Fidelity Securities Lending Cash Central Fund, 0.16% (b)(c) |
3,300,000 |
3,300,000 |
|
|
TOTAL MONEY MARKET FUNDS (Cost $22,345,873) |
|
||
|
TOTAL INVESTMENT PORTFOLIO - 100.1% (Cost $441,535,677) |
563,573,532 |
|
NET OTHER ASSETS (LIABILITIES) - (0.1)% |
(624,665) |
||
|
NET ASSETS - 100% |
$ 562,948,867 |
||
|
Legend |
|
(a) Non-income producing |
|
(b) Affiliated fund that is generally available only to investment companies and other accounts managed by Fidelity Investments. The rate quoted is the annualized seven-day yield of the fund at period end. A complete unaudited listing of the fund's holdings as of its most recent quarter end is available upon request. In addition, each Fidelity Central Fund's financial statements, which are not covered by the Fund's Report of Independent Registered Public Accounting Firm, are available on the SEC's website or upon request. |
|
(c) Investment made with cash collateral received from securities on loan. |
|
(d) Security or a portion of the security is on loan at period end. |
|
Affiliated Central Funds |
|
Information regarding fiscal year to date income earned by the Fund from investments in Fidelity Central Funds is as follows: |
|
Fund |
Income earned |
|
Fidelity Cash Central Fund |
$ 23,787 |
|
Fidelity Securities Lending Cash Central Fund |
340,199 |
|
Total |
$ 363,986 |
|
Other Information |
|
All investments are categorized as Level 1 under the Fair Value Hierarchy. The inputs or methodology used for valuing securities may not be an indication of the risk associated with investing in those securities. For more information on valuation inputs, please refer to the Investment Valuation section in the accompanying Notes to Financial Statements. |
See accompanying notes which are an integral part of the financial statements.
Annual Report
Medical Delivery Portfolio
Financial Statements
Statement of Assets and Liabilities
|
|
February 28, 2013 |
|
|
|
|
|
|
Assets |
|
|
|
Investment in securities, at value (including securities loaned of $3,215,520) - See accompanying schedule: Unaffiliated issuers (cost $419,189,804) |
$ 541,227,659 |
|
|
Fidelity Central Funds (cost $22,345,873) |
22,345,873 |
|
|
Total Investments (cost $441,535,677) |
|
$ 563,573,532 |
|
Foreign currency held at value (cost $5) |
|
5 |
|
Receivable for investments sold |
|
5,539,060 |
|
Receivable for fund shares sold |
|
423,308 |
|
Dividends receivable |
|
247,792 |
|
Distributions receivable from Fidelity Central Funds |
|
85,638 |
|
Prepaid expenses |
|
1,609 |
|
Receivable from investment adviser for expense reductions |
|
545 |
|
Other receivables |
|
31,995 |
|
Total assets |
|
569,903,484 |
|
|
|
|
|
Liabilities |
|
|
|
Payable for investments purchased |
$ 1,943,364 |
|
|
Payable for fund shares redeemed |
1,280,208 |
|
|
Accrued management fee |
266,337 |
|
|
Other affiliated payables |
129,697 |
|
|
Other payables and accrued expenses |
35,011 |
|
|
Collateral on securities loaned, at value |
3,300,000 |
|
|
Total liabilities |
|
6,954,617 |
|
|
|
|
|
Net Assets |
|
$ 562,948,867 |
|
Net Assets consist of: |
|
|
|
Paid in capital |
|
$ 433,393,973 |
|
Accumulated net investment loss |
|
(75,161) |
|
Accumulated undistributed net realized gain (loss) on investments and foreign currency transactions |
|
7,592,897 |
|
Net unrealized appreciation (depreciation) on investments and assets and liabilities in foreign currencies |
|
122,037,158 |
|
Net Assets, for 9,398,788 shares outstanding |
|
$ 562,948,867 |
|
Net Asset Value, offering price and redemption price per share ($562,948,867 ÷ 9,398,788 shares) |
|
$ 59.90 |
Statement of Operations
|
|
Year ended February 28, 2013 |
|
|
|
|
|
|
Investment Income |
|
|
|
Dividends |
|
$ 6,664,619 |
|
Interest |
|
177 |
|
Income from Fidelity Central Funds (including $340,199 from security lending) |
|
363,986 |
|
Total income |
|
7,028,782 |
|
|
|
|
|
Expenses |
|
|
|
Management fee |
$ 4,239,363 |
|
|
Transfer agent fees |
1,781,152 |
|
|
Accounting and security lending fees |
270,452 |
|
|
Custodian fees and expenses |
29,530 |
|
|
Independent trustees' compensation |
5,241 |
|
|
Registration fees |
59,854 |
|
|
Audit |
40,607 |
|
|
Legal |
3,585 |
|
|
Interest |
1,077 |
|
|
Miscellaneous |
8,321 |
|
|
Total expenses before reductions |
6,439,182 |
|
|
Expense reductions |
(139,619) |
6,299,563 |
|
Net investment income (loss) |
|
729,219 |
|
Realized and Unrealized Gain (Loss) Net realized gain (loss) on: |
|
|
|
Investment securities: |
|
|
|
Unaffiliated issuers |
78,613,341 |
|
|
Foreign currency transactions |
(32,579) |
|
|
Total net realized gain (loss) |
|
78,580,762 |
|
Change in net unrealized appreciation (depreciation) on: Investment securities |
(75,359,977) |
|
|
Assets and liabilities in foreign currencies |
(3,936) |
|
|
Total change in net unrealized appreciation (depreciation) |
|
(75,363,913) |
|
Net gain (loss) |
|
3,216,849 |
|
Net increase (decrease) in net assets resulting from operations |
|
$ 3,946,068 |
See accompanying notes which are an integral part of the financial statements.
Annual Report
Statement of Changes in Net Assets
|
|
Year ended |
Year ended |
|
Increase (Decrease) in Net Assets |
|
|
|
Operations |
|
|
|
Net investment income (loss) |
$ 729,219 |
$ (358,264) |
|
Net realized gain (loss) |
78,580,762 |
20,993,184 |
|
Change in net unrealized appreciation (depreciation) |
(75,363,913) |
35,164,416 |
|
Net increase (decrease) in net assets resulting from operations |
3,946,068 |
55,799,336 |
|
Distributions to shareholders from net investment income |
(299,615) |
- |
|
Distributions to shareholders from net realized gain |
(31,559,328) |
- |
|
Total distributions |
(31,858,943) |
- |
|
Share transactions |
239,485,576 |
856,410,093 |
|
Reinvestment of distributions |
30,763,816 |
- |
|
Cost of shares redeemed |
(549,770,786) |
(608,437,132) |
|
Net increase (decrease) in net assets resulting from share transactions |
(279,521,394) |
247,972,961 |
|
Redemption fees |
25,054 |
185,986 |
|
Total increase (decrease) in net assets |
(307,409,215) |
303,958,283 |
|
|
|
|
|
Net Assets |
|
|
|
Beginning of period |
870,358,082 |
566,399,799 |
|
End of period (including accumulated net investment loss of $75,161 and accumulated net investment loss of $472,186, respectively) |
$ 562,948,867 |
$ 870,358,082 |
|
Other Information Shares |
|
|
|
Sold |
3,859,479 |
14,989,950 |
|
Issued in reinvestment of distributions |
531,970 |
- |
|
Redeemed |
(9,199,114) |
(11,022,680) |
|
Net increase (decrease) |
(4,807,665) |
3,967,270 |
Financial Highlights
|
Years ended February 28, |
2013 |
2012 F |
2011 |
2010 |
2009 |
|
Selected Per-Share Data |
|
|
|
|
|
|
Net asset value, beginning of period |
$ 61.26 |
$ 55.32 |
$ 44.38 |
$ 25.53 |
$ 45.27 |
|
Income from Investment Operations |
|
|
|
|
|
|
Net investment income (loss) B |
.06 |
(.03) |
(.25) |
(.24) |
(.18) |
|
Net realized and unrealized gain (loss) |
1.77 |
5.96 |
11.19 |
19.09 |
(19.18) |
|
Total from investment operations |
1.83 |
5.93 |
10.94 |
18.85 |
(19.36) |
|
Distributions from net investment income |
(.03) |
- |
- |
- |
(.03) |
|
Distributions from net realized gain |
(3.16) |
- |
- |
- |
(.35) |
|
Total distributions |
(3.19) |
- |
- |
- |
(.38) |
|
Redemption fees added to paid in capital B |
- G |
.01 |
- G |
- G |
- G |
|
Net asset value, end of period |
$ 59.90 |
$ 61.26 |
$ 55.32 |
$ 44.38 |
$ 25.53 |
|
Total Return A |
3.17% |
10.74% |
24.65% |
73.83% |
(43.05)% |
|
Ratios to Average Net Assets C, E |
|
|
|
|
|
|
Expenses before reductions |
.84% |
.86% |
.89% |
.96% |
.94% |
|
Expenses net of fee waivers, if any |
.84% |
.86% |
.89% |
.96% |
.94% |
|
Expenses net of all reductions |
.83% |
.84% |
.88% |
.96% |
.94% |
|
Net investment income (loss) |
.10% |
(.05)% |
(.54)% |
(.67)% |
(.50)% |
|
Supplemental Data |
|
|
|
|
|
|
Net assets, end of period (000 omitted) |
$ 562,949 |
$ 870,358 |
$ 566,400 |
$ 466,110 |
$ 263,503 |
|
Portfolio turnover rate D |
96% |
86% |
55% |
50% |
122% |
A Total returns would have been lower if certain expenses had not been reduced during the applicable periods shown.
B Calculated based on average shares outstanding during the period.
C Fees and expenses of any underlying Fidelity Central Funds are not included in the Fund's expense ratio. The Fund indirectly bears its proportionate share of the expenses of any underlying Fidelity Central Funds.
D Amount does not include the portfolio activity of any underlying Fidelity Central Funds.
E Expense ratios reflect operating expenses of the Fund. Expenses before reductions do not reflect amounts reimbursed by the investment adviser or reductions from brokerage service arrangements or reductions from other expense offset arrangements and do not represent the amount paid by the Fund during periods when reimbursements or reductions occur. Expenses net of fee waivers reflect expenses after reimbursement by the investment adviser but prior to reductions from brokerage service arrangements or other expense offset arrangements. Expenses net of all reductions represent the net expenses paid by the Fund.
F For the year ended February 29.
G Amount represents less than $.01 per share.
See accompanying notes which are an integral part of the financial statements.
Annual Report
Medical Equipment and Systems Portfolio
Performance: The Bottom Line
Average annual total return reflects the change in the value of an investment, assuming reinvestment of the fund's distributions from dividend income and capital gains (the profits earned upon the sale of securities that have grown in value, if any) and assuming a constant rate of performance each year. The $10,000 table and the fund's returns do not reflect the deduction of taxes that a shareholder would pay on fund distributions or the redemption of fund shares. During periods of reimbursement by Fidelity a fund's total return will be greater than it would be had the reimbursement not occurred. How a fund did yesterday is no guarantee of how it will do tomorrow.
Average Annual Total Returns
|
Periods ended February 28, 2013 |
Past 1 |
Past 5 |
Past 10 |
|
Medical Equipment and Systems Portfolio |
14.09% |
7.41% |
11.07% |
$10,000 Over 10 Years
Let's say hypothetically that $10,000 was invested in Medical Equipment and Systems Portfolio on February 28, 2003. The chart shows how the value of your investment would have changed, and also shows how the S&P 500 Index performed over the same period.
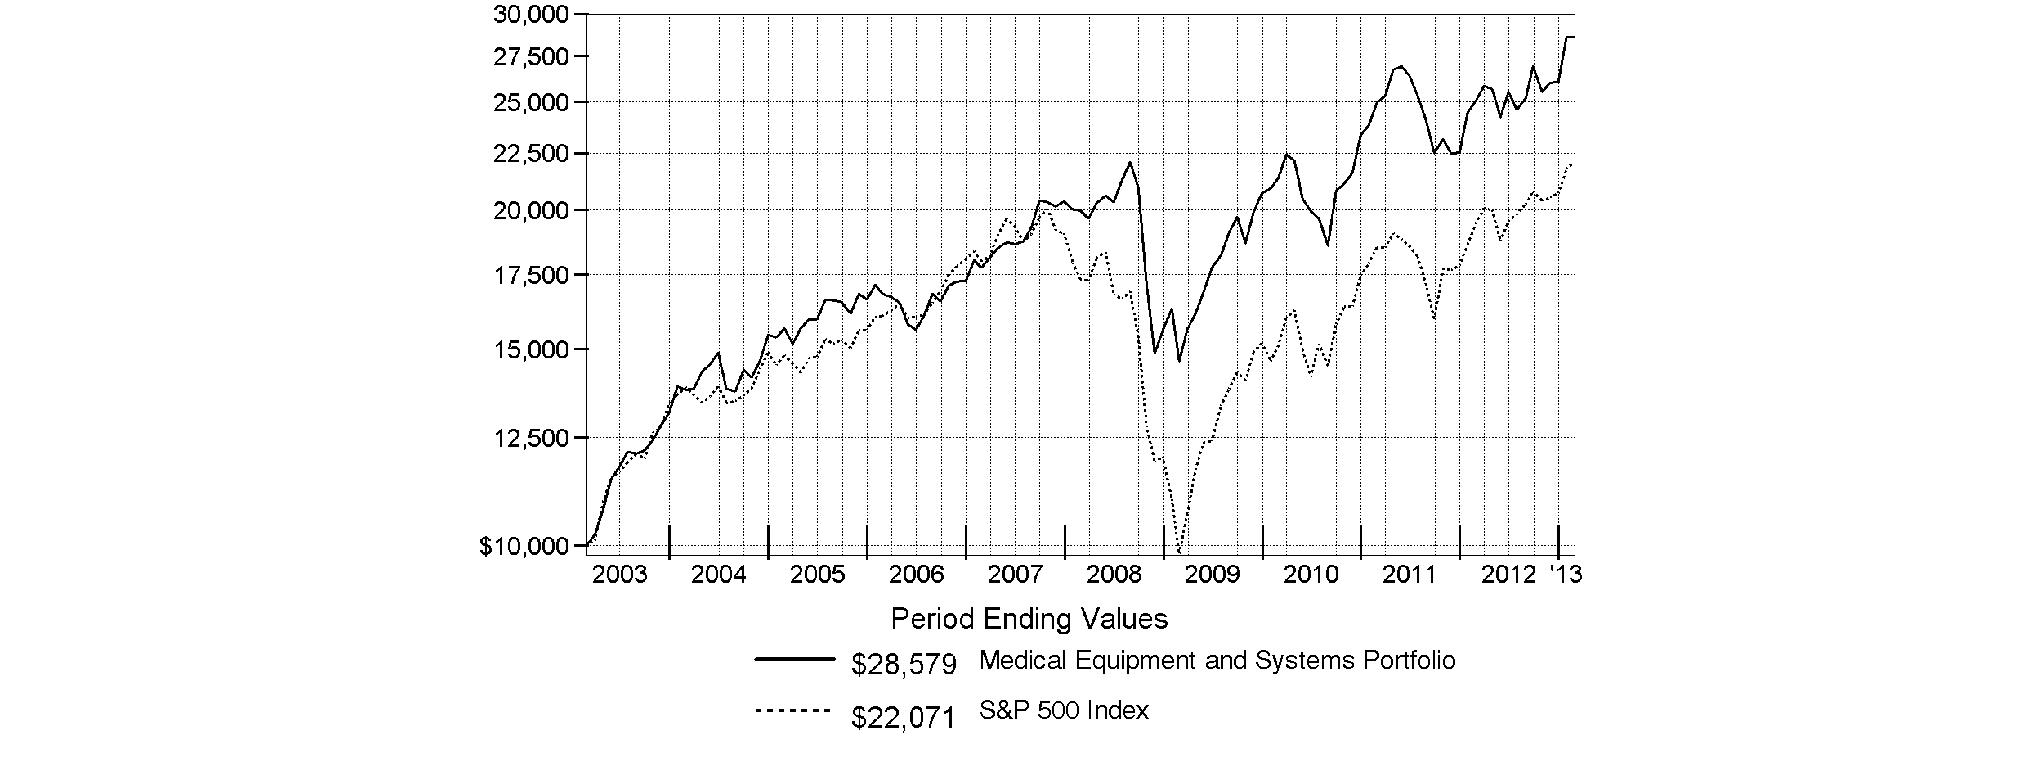
Annual Report
Medical Equipment and Systems Portfolio
Management's Discussion of Fund Performance
Market Recap: U.S. stocks posted solid gains for the year ending February 28, 2013, sparked by a late-period rally that pushed major equity benchmarks to multiyear highs. Improvement in the global economy and more monetary stimulus from the U.S. Federal Reserve kept markets on the upswing for much of the year, shrugging off an early decline brought on by debt woes in Europe, and another dip later in the period amid Congressional gridlock on the federal budget. Renewed optimism over employment, the housing market, corporate earnings and record dividends made stocks a favorite with investors during the 12 months, which helped push the broad-based S&P 500® Index across the milestone 1,500 mark at the end of January. The S&P 500® finished the period up 13.46%. Seven of the 10 major market sectors tracked by MSCI U.S. IMI 25-50 classifications produced double-digit gains, led by health care and financials, while information technology, energy and materials trailed the broad equity market with only modest advances.
Comments from Edward Yoon, Portfolio Manager of Medical Equipment and Systems Portfolio: For the year, the fund gained 14.09%, trailing the 16.79% advance of its industry benchmark, the MSCI® U.S. IMI Health Care Equipment & Supplies 25-50 Index, but outpacing the S&P 500®. Industry fundamentals in developed markets finally began to stabilize in 2012. This, coupled with relatively inexpensive valuations, attracted investors to health care equipment companies, given their stable business models and great free cash generation. Unfortunately, some less-than-stellar picks in this outperforming group - the dominant component of the MSCI index - was the primary driver of the fund's underperformance of its industry benchmark during the period. At the issuer level, it hurt the most to have a non-index stake in Health Net, a managed health care firm that missed consecutive earnings targets due to pricing issues in its commercial business. As the stock struggled, I lost conviction about Health Net's fit within my investment criteria and sold it by period end. As I mentioned, choices in health care equipment were weak, including an overweighting in MAKO Surgical, which makes robotic surgical devices for orthopedic procedures. A new product launch disappointed investors, which prompted me to exit the position since my investment thesis here had changed. An unexpected convertible offering and a weaker yen weighed on shares of Volcano, a maker of precision guided therapy tools, while it also hurt to not own strong-performing sleep-disorder device maker and index name ResMed. On the positive side, a non-index position in Spain-based biotechnology firm Grifols added the most value. Momentum in its pipeline of blood plasma products ramped up sales for the firm, while it also continued to benefit from its 2011 acquisition of industry peer Talecris Biotherapeutics Holdings. Security selection in health care supplies provided a boost, including our out-of-benchmark stake in Spectranetics. The maker of lasers to treat heart disease saw record revenues and profits during the past year, due to strong momentum in its peripheral artery disease products. It also was a good call to have an overweighting in Cooper Companies, which benefited from strength in the global contact lens market.
The views expressed above reflect those of the portfolio manager(s) only through the end of the period as stated on the cover of this report and do not necessarily represent the views of Fidelity or any other person in the Fidelity organization. Any such views are subject to change at any time based upon market or other conditions and Fidelity disclaims any responsibility to update such views. These views may not be relied on as investment advice and, because investment decisions for a Fidelity fund are based on numerous factors, may not be relied on as an indication of trading intent on behalf of any Fidelity fund.
Annual Report
Medical Equipment and Systems Portfolio
Investment Changes (Unaudited)
|
Top Ten Stocks as of February 28, 2013 |
||
|
|
% of fund's |
% of fund's net assets |
|
Covidien PLC |
11.3 |
11.2 |
|
Medtronic, Inc. |
8.2 |
5.0 |
|
Stryker Corp. |
6.8 |
5.9 |
|
Boston Scientific Corp. |
6.8 |
6.7 |
|
Zimmer Holdings, Inc. |
5.6 |
6.3 |
|
Abbott Laboratories |
5.5 |
0.0 |
|
The Cooper Companies, Inc. |
4.8 |
3.8 |
|
Baxter International, Inc. |
4.0 |
5.8 |
|
DENTSPLY International, Inc. |
3.4 |
3.5 |
|
Intuitive Surgical, Inc. |
2.8 |
2.4 |
|
|
59.2 |
|
|
Top Industries (% of fund's net assets) |
|||
|
As of February 28, 2013 |
|||
|
Health Care |
86.3% |
|
|
Biotechnology |
3.0% |
|
|
Life Sciences |
2.9% |
|
|
Health Care |
2.6% |
|
|
Health Care Technology |
2.6% |
|
|
All Others* |
2.6% |
|

|
As of August 31, 2012 |
|||
|
Health Care |
88.7% |
|
|
Health Care |
7.8% |
|
|
Biotechnology |
1.7% |
|
|
Health Care Technology |
0.9% |
|
|
All Others* |
0.9% |
|

|
* Includes short-term investments and net other assets. |
Annual Report
Medical Equipment and Systems Portfolio
Investments February 28, 2013
Showing Percentage of Net Assets
|
Common Stocks - 97.6% |
|||
|
Shares |
Value |
||
|
BIOTECHNOLOGY - 2.9% |
|||
|
Biotechnology - 2.9% |
|||
|
Genomic Health, Inc. (a) |
260,000 |
$ 7,449,000 |
|
|
Grifols SA ADR (d) |
1,155,000 |
33,125,400 |
|
|
|
40,574,400 |
||
|
HEALTH CARE EQUIPMENT & SUPPLIES - 85.6% |
|||
|
Health Care Equipment - 73.5% |
|||
|
Abbott Laboratories |
2,300,000 |
77,717,000 |
|
|
ArthroCare Corp. (a) |
370,000 |
12,920,400 |
|
|
Baxter International, Inc. |
825,000 |
55,770,000 |
|
|
Boston Scientific Corp. (a) |
12,900,000 |
95,331,000 |
|
|
C.R. Bard, Inc. |
45,000 |
4,448,250 |
|
|
Cardiovascular Systems, Inc. (a) |
350,000 |
5,533,500 |
|
|
CareFusion Corp. (a) |
130,000 |
4,256,200 |
|
|
Conceptus, Inc. (a) |
300,000 |
6,699,000 |
|
|
CONMED Corp. |
300,000 |
9,333,000 |
|
|
Covidien PLC |
2,500,000 |
158,924,999 |
|
|
Cyberonics, Inc. (a)(d) |
230,000 |
10,522,500 |
|
|
Edwards Lifesciences Corp. (a) |
280,000 |
24,060,400 |
|
|
Exactech, Inc. (a)(e) |
900,000 |
16,569,000 |
|
|
Fisher & Paykel Healthcare Corp. |
2,800,000 |
5,948,933 |
|
|
Genmark Diagnostics, Inc. (a) |
1,130,306 |
11,789,092 |
|
|
HeartWare International, Inc. CDI (a) |
5,500,000 |
13,595,500 |
|
|
Insulet Corp. (a) |
1,200,000 |
27,084,000 |
|
|
Integra LifeSciences Holdings Corp. (a) |
385,700 |
15,713,418 |
|
|
Intuitive Surgical, Inc. (a) |
77,000 |
39,261,530 |
|
|
Medtronic, Inc. |
2,550,000 |
114,648,000 |
|
|
Natus Medical, Inc. (a) |
600,000 |
7,620,000 |
|
|
NxStage Medical, Inc. (a) |
650,000 |
7,293,000 |
|
|
Sirona Dental Systems, Inc. (a) |
175,000 |
12,428,500 |
|
|
St. Jude Medical, Inc. |
900,000 |
36,900,000 |
|
|
Stryker Corp. |
1,500,000 |
95,820,000 |
|
|
Teleflex, Inc. |
250,000 |
19,990,000 |
|
|
Tornier BV (a) |
800,000 |
13,904,000 |
|
|
Trauson Holdings Co. Ltd. |
1,443,000 |
1,384,280 |
|
|
Varian Medical Systems, Inc. (a) |
100,000 |
7,063,000 |
|
|
Volcano Corp. (a) |
1,150,000 |
24,886,000 |
|
|
Wright Medical Group, Inc. (a)(d) |
550,000 |
12,787,500 |
|
|
Zeltiq Aesthetics, Inc. (a) |
900,000 |
3,627,000 |
|
|
Zimmer Holdings, Inc. |
1,050,000 |
78,708,000 |
|
|
|
1,032,537,002 |
||
|
Health Care Supplies - 12.1% |
|||
|
Align Technology, Inc. (a) |
700,000 |
22,008,000 |
|
|
DENTSPLY International, Inc. |
1,150,000 |
47,633,000 |
|
|
Derma Sciences, Inc. (a) |
500,000 |
6,165,000 |
|
|
The Cooper Companies, Inc. |
630,000 |
66,817,800 |
|
|
The Spectranetics Corp. (a) |
850,000 |
15,427,500 |
|
|
|
|||
|
Shares |
Value |
||
|
Unilife Corp. (a)(d) |
2,000,000 |
$ 5,020,000 |
|
|
Vascular Solutions, Inc. (a) |
400,000 |
6,072,000 |
|
|
|
169,143,300 |
||
|
TOTAL HEALTH CARE EQUIPMENT & SUPPLIES |
1,201,680,302 |
||
|
HEALTH CARE PROVIDERS & SERVICES - 2.6% |
|||
|
Health Care Distributors & Services - 0.4% |
|||
|
Amplifon SpA |
1,000,000 |
5,378,866 |
|
|
Health Care Facilities - 0.6% |
|||
|
Hanger, Inc. (a) |
300,000 |
8,898,000 |
|
|
Health Care Services - 1.6% |
|||
|
Quest Diagnostics, Inc. |
410,000 |
23,029,700 |
|
|
TOTAL HEALTH CARE PROVIDERS & SERVICES |
37,306,566 |
||
|
HEALTH CARE TECHNOLOGY - 2.1% |
|||
|
Health Care Technology - 2.1% |
|||
|
athenahealth, Inc. (a)(d) |
130,000 |
12,192,700 |
|
|
Cerner Corp. (a) |
200,000 |
17,492,000 |
|
|
|
29,684,700 |
||
|
LIFE SCIENCES TOOLS & SERVICES - 2.9% |
|||
|
Life Sciences Tools & Services - 2.9% |
|||
|
Agilent Technologies, Inc. |
470,000 |
19,495,600 |
|
|
Bruker BioSciences Corp. (a) |
280,000 |
4,911,200 |
|
|
Eurofins Scientific SA |
40,000 |
7,932,522 |
|
|
Fluidigm Corp. (a) |
250,000 |
4,315,000 |
|
|
Illumina, Inc. (a) |
84,500 |
4,235,985 |
|
|
|
40,890,307 |
||
|
PHARMACEUTICALS - 1.5% |
|||
|
Pharmaceuticals - 1.5% |
|||
|
Endo Health Solutions, Inc. (a) |
450,000 |
13,950,000 |
|
|
Warner Chilcott PLC |
500,000 |
6,755,000 |
|
|
|
20,705,000 |
||
|
TOTAL COMMON STOCKS (Cost $1,096,256,521) |
|
||
|
Preferred Stocks - 1.3% |
|||
|
|
|
|
|
|
Convertible Preferred Stocks - 0.6% |
|||
|
BIOTECHNOLOGY - 0.1% |
|||
|
Biotechnology - 0.1% |
|||
|
Ariosa Diagnostics (a)(f) |
331,126 |
2,000,001 |
|
|
HEALTH CARE TECHNOLOGY - 0.5% |
|||
|
Health Care Technology - 0.5% |
|||
|
Castlight Health, Inc. Series D (a)(f) |
999,300 |
6,995,100 |
|
|
TOTAL CONVERTIBLE PREFERRED STOCKS |
8,995,101 |
||
|
Preferred Stocks - continued |
|||
|
Shares |
Value |
||
|
Nonconvertible Preferred Stocks - 0.7% |
|||
|
HEALTH CARE EQUIPMENT & SUPPLIES - 0.7% |
|||
|
Health Care Equipment - 0.7% |
|||
|
Sartorius AG (non-vtg.) |
80,000 |
$ 9,215,094 |
|
|
TOTAL PREFERRED STOCKS (Cost $14,916,313) |
|
||
|
Money Market Funds - 3.4% |
|||
|
|
|
|
|
|
Fidelity Cash Central Fund, 0.16% (b) |
21,158,234 |
21,158,234 |
|
|
Fidelity Securities Lending Cash Central Fund, 0.16% (b)(c) |
26,016,371 |
26,016,371 |
|
|
TOTAL MONEY MARKET FUNDS (Cost $47,174,605) |
|
||
|
TOTAL INVESTMENT PORTFOLIO - 102.3% (Cost $1,158,347,439) |
1,436,226,075 |
|
NET OTHER ASSETS (LIABILITIES) - (2.3)% |
(31,789,033) |
||
|
NET ASSETS - 100% |
$ 1,404,437,042 |
||
|
Legend |
|
(a) Non-income producing |
|
(b) Affiliated fund that is generally available only to investment companies and other accounts managed by Fidelity Investments. The rate quoted is the annualized seven-day yield of the fund at period end. A complete unaudited listing of the fund's holdings as of its most recent quarter end is available upon request. In addition, each Fidelity Central Fund's financial statements, which are not covered by the Fund's Report of Independent Registered Public Accounting Firm, are available on the SEC's website or upon request. |
|
(c) Investment made with cash collateral received from securities on loan. |
|
(d) Security or a portion of the security is on loan at period end. |
|
(e) Affiliated company |
|
(f) Restricted securities - Investment in securities not registered under the Securities Act of 1933 (excluding 144A issues). At the end of the period, the value of restricted securities (excluding 144A issues) amounted to $8,995,101 or 0.6% of net assets. |
|
Additional information on each restricted holding is as follows: |
|
Security |
Acquisition Date |
Acquisition Cost |
|
Ariosa Diagnostics |
11/30/11 |
$ 2,000,001 |
|
Castlight Health, Inc. Series D |
4/25/12 |
$ 6,032,334 |
|
Affiliated Central Funds |
|
Information regarding fiscal year to date income earned by the Fund from investments in Fidelity Central Funds is as follows: |
|
Fund |
Income earned |
|
Fidelity Cash Central Fund |
$ 42,777 |
|
Fidelity Securities Lending Cash Central Fund |
537,591 |
|
Total |
$ 580,368 |
|
Other Affiliated Issuers |
|
An affiliated company is a company in which the Fund has ownership of at least 5% of the voting securities. Fiscal year to date transactions with companies which are or were affiliates are as follows: |
|
Affiliate |
Value, |
Purchases |
Sales |
Dividend |
Value, |
|
Exactech, Inc. |
$ 5,637,391 |
$ 9,126,595 |
$ - |
$ - |
$ 16,569,000 |
|
Genmark Diagnostics, Inc. |
4,160,254 |
555,059 |
- |
- |
- |
|
Total |
$ 9,797,645 |
$ 9,681,654 |
$ - |
$ - |
$ 16,569,000 |
|
Other Information |
|
The following is a summary of the inputs used, as of February 28, 2013, involving the Fund's assets and liabilities carried at fair value. The inputs or methodology used for valuing securities may not be an indication of the risk associated with investing in those securities. For more information on valuation inputs, and their aggregation into the levels used in the table below, please refer to the Investment Valuation section in the accompanying Notes to Financial Statements. |
|
Valuation Inputs at Reporting Date: |
||||
|
Description |
Total |
Level 1 |
Level 2 |
Level 3 |
|
Investments in Securities: |
||||
|
Common Stocks |
$ 1,370,841,275 |
$ 1,370,841,275 |
$ - |
$ - |
|
Preferred Stocks |
18,210,195 |
9,215,094 |
- |
8,995,101 |
|
Money Market Funds |
47,174,605 |
47,174,605 |
- |
- |
|
Total Investments in Securities: |
$ 1,436,226,075 |
$ 1,427,230,974 |
$ - |
$ 8,995,101 |
|
Distribution of investments by country or territory of incorporation, as a percentage of total net assets, is as follows. (Unaudited) |
|
United States of America |
82.6% |
|
Ireland |
11.8% |
|
Spain |
2.4% |
|
Netherlands |
1.0% |
|
Others (Individually Less Than 1%) |
2.2% |
|
|
100.0% |
See accompanying notes which are an integral part of the financial statements.
Annual Report
Medical Equipment and Systems Portfolio
Financial Statements
Statement of Assets and Liabilities
|
|
February 28, 2013 |
|
|
|
|
|
|
Assets |
|
|
|
Investment in securities, at value (including securities loaned of $25,113,231) - See accompanying schedule: Unaffiliated issuers (cost $1,096,187,468) |
$ 1,372,482,470 |
|
|
Fidelity Central Funds (cost $47,174,605) |
47,174,605 |
|
|
Other affiliated issuers (cost $14,985,366) |
16,569,000 |
|
|
Total Investments (cost $1,158,347,439) |
|
$ 1,436,226,075 |
|
Cash |
|
421,791 |
|
Foreign currency held at value (cost $429,252) |
|
429,252 |
|
Receivable for investments sold |
|
9,883,520 |
|
Receivable for fund shares sold |
|
771,797 |
|
Distributions receivable from Fidelity Central Funds |
|
15,261 |
|
Prepaid expenses |
|
2,061 |
|
Receivable from investment adviser for expense reductions |
|
986 |
|
Other receivables |
|
76,586 |
|
Total assets |
|
1,447,827,329 |
|
|
|
|
|
Liabilities |
|
|
|
Payable for investments purchased |
$ 14,509,130 |
|
|
Payable for fund shares redeemed |
1,879,492 |
|
|
Accrued management fee |
651,734 |
|
|
Other affiliated payables |
280,354 |
|
|
Other payables and accrued expenses |
53,206 |
|
|
Collateral on securities loaned, at value |
26,016,371 |
|
|
Total liabilities |
|
43,390,287 |
|
|
|
|
|
Net Assets |
|
$ 1,404,437,042 |
|
Net Assets consist of: |
|
|
|
Paid in capital |
|
$ 1,112,479,690 |
|
Distributions in excess of net investment income |
|
(943,858) |
|
Accumulated undistributed net realized gain (loss) on investments and foreign currency transactions |
|
15,037,720 |
|
Net unrealized appreciation (depreciation) on investments and assets and liabilities in foreign currencies |
|
277,863,490 |
|
Net Assets, for 45,896,641 shares outstanding |
|
$ 1,404,437,042 |
|
Net Asset Value, offering price and redemption price per share ($1,404,437,042 ÷ 45,896,641 shares) |
|
$ 30.60 |
Statement of Operations
|
|
Year ended February 28, 2013 |
|
|
|
|
|
|
Investment Income |
|
|
|
Dividends |
|
$ 11,822,661 |
|
Interest |
|
1,299 |
|
Income from Fidelity Central Funds (including $537,591 from security lending) |
|
580,368 |
|
Total income |
|
12,404,328 |
|
|
|
|
|
Expenses |
|
|
|
Management fee |
$ 7,320,613 |
|
|
Transfer agent fees |
2,992,010 |
|
|
Accounting and security lending fees |
424,415 |
|
|
Custodian fees and expenses |
57,832 |
|
|
Independent trustees' compensation |
8,642 |
|
|
Registration fees |
46,621 |
|
|
Audit |
44,855 |
|
|
Legal |
4,969 |
|
|
Interest |
546 |
|
|
Miscellaneous |
14,167 |
|
|
Total expenses before reductions |
10,914,670 |
|
|
Expense reductions |
(186,589) |
10,728,081 |
|
Net investment income (loss) |
|
1,676,247 |
|
Realized and Unrealized Gain (Loss) Net realized gain (loss) on: |
|
|
|
Investment securities: |
|
|
|
Unaffiliated issuers |
55,650,467 |
|
|
Foreign currency transactions |
43,334 |
|
|
Total net realized gain (loss) |
|
55,693,801 |
|
Change in net unrealized appreciation (depreciation) on: Investment securities (net of decrease in deferred foreign taxes of $110,782) |
112,565,199 |
|
|
Assets and liabilities in foreign currencies |
(14,246) |
|
|
Total change in net unrealized appreciation (depreciation) |
|
112,550,953 |
|
Net gain (loss) |
|
168,244,754 |
|
Net increase (decrease) in net assets resulting from operations |
|
$ 169,921,001 |
See accompanying notes which are an integral part of the financial statements.
Annual Report
Statement of Changes in Net Assets
|
|
Year ended |
Year ended |
|
Increase (Decrease) in Net Assets |
|
|
|
Operations |
|
|
|
Net investment income (loss) |
$ 1,676,247 |
$ 275,186 |
|
Net realized gain (loss) |
55,693,801 |
99,115,448 |
|
Change in net unrealized appreciation (depreciation) |
112,550,953 |
(120,778,603) |
|
Net increase (decrease) in net assets resulting from operations |
169,921,001 |
(21,387,969) |
|
Distributions to shareholders from net investment income |
(2,142,447) |
(720,894) |
|
Distributions to shareholders from net realized gain |
(54,255,083) |
(68,879,454) |
|
Total distributions |
(56,397,530) |
(69,600,348) |
|
Share transactions |
216,598,206 |
442,706,650 |
|
Reinvestment of distributions |
54,158,373 |
66,786,926 |
|
Cost of shares redeemed |
(340,863,585) |
(465,899,006) |
|
Net increase (decrease) in net assets resulting from share transactions |
(70,107,006) |
43,594,570 |
|
Redemption fees |
8,764 |
63,013 |
|
Total increase (decrease) in net assets |
43,425,229 |
(47,330,734) |
|
|
|
|
|
Net Assets |
|
|
|
Beginning of period |
1,361,011,813 |
1,408,342,547 |
|
End of period (including distributions in excess of net investment income of $943,858 and distributions in excess of net investment income of $477,658, respectively) |
$ 1,404,437,042 |
$ 1,361,011,813 |
|
Other Information Shares |
|
|
|
Sold |
7,408,450 |
15,011,136 |
|
Issued in reinvestment of distributions |
1,952,608 |
2,628,709 |
|
Redeemed |
(12,033,703) |
(16,731,272) |
|
Net increase (decrease) |
(2,672,645) |
908,573 |
Financial Highlights
|
Years ended February 28, |
2013 |
2012 G |
2011 |
2010 |
2009 |
|
Selected Per-Share Data |
|
|
|
|
|
|
Net asset value, beginning of period |
$ 28.02 |
$ 29.55 |
$ 25.23 |
$ 17.30 |
$ 24.41 |
|
Income from Investment Operations |
|
|
|
|
|
|
Net investment income (loss) B |
.04 |
.01 |
(.01) E |
(.03) |
.01 |
|
Net realized and unrealized gain (loss) |
3.77 |
(.10) |
4.33 |
7.96 |
(6.35) |
|
Total from investment operations |
3.81 |
(.09) |
4.32 |
7.93 |
(6.34) |
|
Distributions from net investment income |
(.05) |
(.02) |
- |
- |
(.01) |
|
Distributions from net realized gain |
(1.18) |
(1.43) |
- |
- |
(.77) |
|
Total distributions |
(1.23) |
(1.44) I |
- |
- |
(.78) |
|
Redemption fees added to paid in capital B |
- H |
- H |
- H |
- H |
.01 |
|
Net asset value, end of period |
$ 30.60 |
$ 28.02 |
$ 29.55 |
$ 25.23 |
$ 17.30 |
|
Total Return A |
14.09% |
.23% |
17.12% |
45.84% |
(26.81)% |
|
Ratios to Average Net Assets C, F |
|
|
|
|
|
|
Expenses before reductions |
.83% |
.84% |
.86% |
.91% |
.87% |
|
Expenses net of fee waivers, if any |
.83% |
.84% |
.86% |
.91% |
.87% |
|
Expenses net of all reductions |
.82% |
.84% |
.86% |
.90% |
.87% |
|
Net investment income (loss) |
.13% |
.02% |
(.04)% E |
(.13)% |
.06% |
|
Supplemental Data |
|
|
|
|
|
|
Net assets, end of period (000 omitted) |
$ 1,404,437 |
$ 1,361,012 |
$ 1,408,343 |
$ 1,377,991 |
$ 1,012,464 |
|
Portfolio turnover rate D |
69% |
120% |
92% |
83% |
116% |
A Total returns would have been lower if certain expenses had not been reduced during the applicable periods shown.
B Calculated based on average shares outstanding during the period.
C Fees and expenses of any underlying Fidelity Central Funds are not included in the Fund's expense ratio. The Fund indirectly bears its proportionate share of the expenses of any underlying Fidelity Central Funds.
D Amount does not include the portfolio activity of any underlying Fidelity Central Funds.
E Investment income per share reflects a large, non-recurring dividend which amounted to $.04 per share. Excluding this non-recurring dividend, the ratio of net investment income (loss) to average net assets would have been (.18)%.
F Expense ratios reflect operating expenses of the Fund. Expenses before reductions do not reflect amounts reimbursed by the investment adviser or reductions from brokerage service arrangements or reductions from other expense offset arrangements and do not represent the amount paid by the Fund during periods when reimbursements or reductions occur. Expenses net of fee waivers reflect expenses after reimbursement by the investment adviser but prior to reductions from brokerage service arrangements or other expense offset arrangements. Expenses net of all reductions represent the net expenses paid by the Fund.
G For the year ended February 29.
H Amount represents less than $.01 per share.
I Total distributions of $1.44 per share is comprised of distributions from net investment income of $.015 and distributions from net realized gain of $1.426 per share.
See accompanying notes which are an integral part of the financial statements.
Annual Report
Pharmaceuticals Portfolio
Performance: The Bottom Line
Average annual total return reflects the change in the value of an investment, assuming reinvestment of the fund's distributions from dividend income and capital gains (the profits earned upon the sale of securities that have grown in value, if any) and assuming a constant rate of performance each year. The $10,000 table and the fund's returns do not reflect the deduction of taxes that a shareholder would pay on fund distributions or the redemption of fund shares. During periods of reimbursement by Fidelity a fund's total return will be greater than it would be had the reimbursement not occurred. How a fund did yesterday is no guarantee of how it will do tomorrow.
Average Annual Total Returns
|
Periods ended February 28, 2013 |
Past 1 |
Past 5 |
Past 10 |
|
Pharmaceuticals Portfolio |
17.93% |
11.70% |
11.02% |
$10,000 Over 10 Years
Let's say hypothetically that $10,000 was invested in Pharmaceuticals Portfolio on February 28, 2003. The chart shows how the value of your investment would have changed, and also shows how the S&P 500 Index performed over the same period.
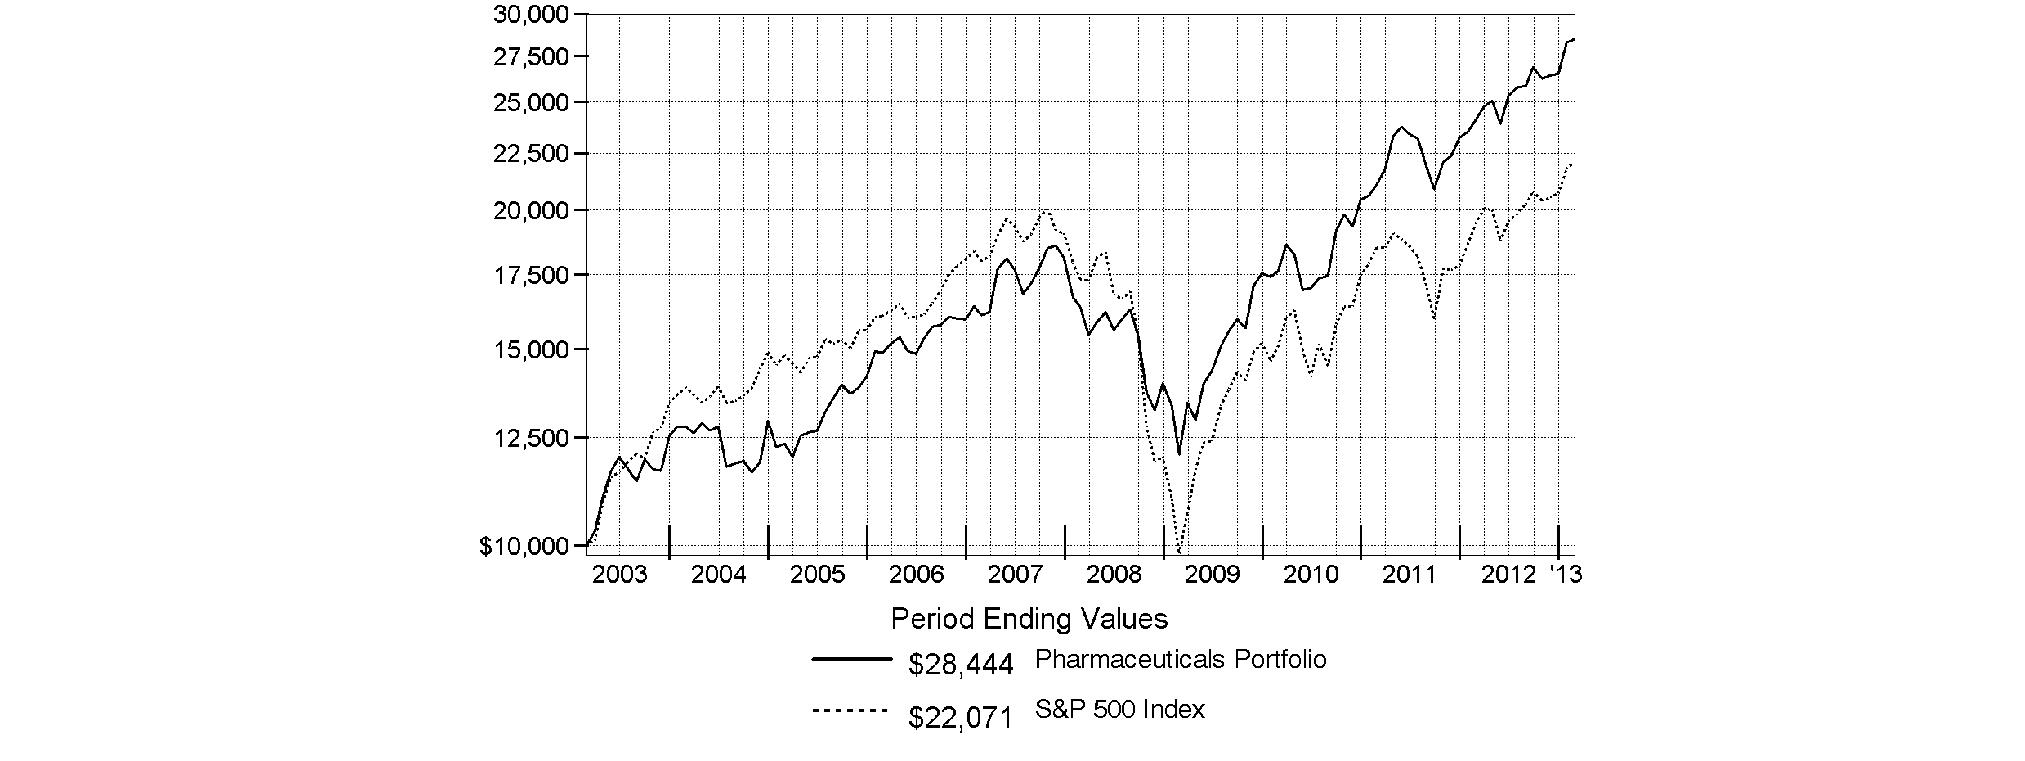
Annual Report
Pharmaceuticals Portfolio
Management's Discussion of Fund Performance
Market Recap: U.S. stocks posted solid gains for the year ending February 28, 2013, sparked by a late-period rally that pushed major equity benchmarks to multiyear highs. Improvement in the global economy and more monetary stimulus from the U.S. Federal Reserve kept markets on the upswing for much of the year, shrugging off an early decline brought on by debt woes in Europe, and another dip later in the period amid Congressional gridlock on the federal budget. Renewed optimism over employment, the housing market, corporate earnings and record dividends made stocks a favorite with investors during the 12 months, which helped push the broad-based S&P 500® Index across the milestone 1,500 mark at the end of January. The S&P 500® finished the period up 13.46%. Seven of the 10 major market sectors tracked by MSCI U.S. IMI 25-50 classifications produced double-digit gains, led by health care and financials, while information technology, energy and materials trailed the broad equity market with only modest advances.
Comments from Asher Anolic, who became Portfolio Manager of Pharmaceuticals Portfolio on April 1, 2013: For the year ending February 28, 2013, the fund returned 17.93%, modestly underperforming the 18.45% gain of the S&P® Custom Pharmaceuticals Index, and solidly outperforming the broadly based S&P 500®. Large-cap pharmaceutical stocks - the fund's primary industry group - outperformed the broad market, as concerns surrounding global growth prospects and political issues in the U.S., European Union and China drove investors to seek cover in larger-cap, more-defensive slices of the market that offered greater stability and attractive dividend yields. As far as the fund's performance relative to the S&P industry benchmark, favorable positioning in biotechnology was notably positive, with other groups making only modest contributions. Four of the fund's top-seven individual contributors were non-index stocks from the biotech industry, including Puma Biotechnology, Onyx Pharmaceuticals, BioMarin Pharmaceutical and Amylin Pharmaceuticals. Puma, a development stage biopharmaceutical firm, executed a reverse merger and became publicly traded at a higher valuation than expected. Onyx got a lift from the U.S. Food and Drug Administration's (FDA) accelerated approval for a drug to treat multiple myeloma. BioMarin was buoyed by positive phase three clinical data for its GALNS enzyme replacement therapy to treat a rare lysosomal storage disorder. Lastly, Amylin contributed when Bristol-Myers Squibb announced it would acquire the company, a deal that closed in August. Underweighting several underperforming pharmaceutical companies completed the group of top contributors, including VIVUS, Hospira and AstraZeneca. VIVUS was not held at period end. On the other hand, there were some disappointing investments, led by a number of choices in the pharmaceuticals industry. Significant underweightings in pharma giants Novartis, Pfizer and Bristol-Myers Squibb hurt, as they all outperformed in the face of a weak macroeconomic outlook that favored larger, more-defensive higher-yielding stocks. An overweighting in ViroPharma detracted due to an earlier-than-expected FDA approval of generic alternatives to a major product, while Jazz Pharmaceutical underperformed in response to fears early in the period that a patent issue could harm a major drug that accounts for the bulk of the firm's revenues. Within health care services, a non-index stake in hospital billing and collections firm Accretive Health hurt when the stock plunged in late April in response to an investigative report alleging violations of federally mandated access to emergency care, regardless of the ability to pay. Although a lawsuit was later resolved, the damage was done and we sold the stock before period end. An underweighting in Abbott Laboratories hurt. The stock performed well because investors rewarded the company's move to split its pharmaceuticals and other health care operations into two separate entities. Lastly, the fund's modest cash position in a strong market proved to be the biggest drag on relative performance for the year, and currency fluctuations hindered performance given the fund's investments in foreign stocks.
The views expressed above reflect those of the portfolio manager(s) only through the end of the period as stated on the cover of this report and do not necessarily represent the views of Fidelity or any other person in the Fidelity organization. Any such views are subject to change at any time based upon market or other conditions and Fidelity disclaims any responsibility to update such views. These views may not be relied on as investment advice and, because investment decisions for a Fidelity fund are based on numerous factors, may not be relied on as an indication of trading intent on behalf of any Fidelity fund.
Annual Report
Pharmaceuticals Portfolio
Investment Changes (Unaudited)
|
Top Ten Stocks as of February 28, 2013 |
||
|
|
% of fund's |
% of fund's net assets |
|
Pfizer, Inc. |
7.9 |
6.5 |
|
Merck & Co., Inc. |
7.3 |
8.2 |
|
Johnson & Johnson |
6.5 |
5.4 |
|
Sanofi SA sponsored ADR |
6.1 |
7.4 |
|
GlaxoSmithKline PLC sponsored ADR |
5.7 |
5.8 |
|
Allergan, Inc. |
5.0 |
2.1 |
|
Eli Lilly & Co. |
4.3 |
3.7 |
|
Valeant Pharmaceuticals International, Inc. (Canada) |
4.3 |
3.6 |
|
Novartis AG sponsored ADR |
4.2 |
3.2 |
|
Novo Nordisk A/S Series B sponsored ADR |
3.6 |
4.4 |
|
|
54.9 |
|
|
Top Industries (% of fund's net assets) |
|||
|
As of February 28, 2013 |
|||
|
Pharmaceuticals |
86.0% |
|
|
Biotechnology |
9.7% |
|
|
Health Care |
1.2% |
|
|
Personal Products |
0.4% |
|
|
Health Care |
0.1% |
|
|
All Others* |
2.6% |
|

|
As of August 31, 2012 |
|||
|
Pharmaceuticals |
87.7% |
|
|
Biotechnology |
6.9% |
|
|
Health Care |
1.6% |
|
|
Health Care |
0.3% |
|
|
Personal Products |
0.3% |
|
|
All Others* |
3.2% |
|

|
* Includes short-term investments and net other assets. |
Annual Report
Pharmaceuticals Portfolio
Investments February 28, 2013
Showing Percentage of Net Assets
|
Common Stocks - 97.4% |
|||
|
Shares |
Value |
||
|
BIOTECHNOLOGY - 9.7% |
|||
|
Biotechnology - 9.7% |
|||
|
Acorda Therapeutics, Inc. (a) |
104,000 |
$ 3,094,000 |
|
|
AMAG Pharmaceuticals, Inc. (a) |
318,000 |
5,262,900 |
|
|
ARIAD Pharmaceuticals, Inc. (a) |
172,500 |
3,627,675 |
|
|
BioMarin Pharmaceutical, Inc. (a) |
136,500 |
7,912,905 |
|
|
Biovitrum AB (a) |
325,000 |
1,974,905 |
|
|
Celldex Therapeutics, Inc. (a) |
235,000 |
2,237,200 |
|
|
Cubist Pharmaceuticals, Inc. (a) |
125,000 |
5,303,750 |
|
|
Discovery Laboratories, Inc. (a) |
128,200 |
315,372 |
|
|
Elan Corp. PLC sponsored ADR (a) |
1,604,400 |
18,193,896 |
|
|
Grifols SA (d) |
110,000 |
3,918,412 |
|
|
Grifols SA Class B (a) |
5,500 |
156,894 |
|
|
ImmunoGen, Inc. (a) |
49,100 |
744,847 |
|
|
Insmed, Inc. (a) |
68,700 |
423,192 |
|
|
Intercept Pharmaceuticals, Inc. |
23,098 |
901,284 |
|
|
KYTHERA Biopharmaceuticals, Inc. |
115,000 |
2,996,900 |
|
|
Medivation, Inc. (a) |
146,000 |
7,174,440 |
|
|
Merrimack Pharmaceuticals, Inc. |
13,500 |
86,400 |
|
|
Neurocrine Biosciences, Inc. (a) |
224,794 |
2,378,321 |
|
|
NPS Pharmaceuticals, Inc. (a) |
130,600 |
1,042,188 |
|
|
Onyx Pharmaceuticals, Inc. (a) |
81,800 |
6,160,358 |
|
|
Puma Biotechnology, Inc. |
140,233 |
3,605,390 |
|
|
Regeneron Pharmaceuticals, Inc. (a) |
20,000 |
3,340,000 |
|
|
Sarepta Therapeutics, Inc. (a)(d) |
45,000 |
1,317,150 |
|
|
Synageva BioPharma Corp. (a) |
79,600 |
3,977,612 |
|
|
Theravance, Inc. (a) |
119,900 |
2,432,771 |
|
|
|
88,578,762 |
||
|
HEALTH CARE EQUIPMENT & SUPPLIES - 1.2% |
|||
|
Health Care Equipment - 0.8% |
|||
|
Abbott Laboratories |
215,690 |
7,288,165 |
|
|
Genmark Diagnostics, Inc. (a) |
45,500 |
474,565 |
|
|
|
7,762,730 |
||
|
Health Care Supplies - 0.4% |
|||
|
Align Technology, Inc. (a) |
79,000 |
2,483,760 |
|
|
Antares Pharma, Inc. (a)(d) |
315,000 |
1,083,600 |
|
|
|
3,567,360 |
||
|
TOTAL HEALTH CARE EQUIPMENT & SUPPLIES |
11,330,090 |
||
|
HEALTH CARE PROVIDERS & SERVICES - 0.1% |
|||
|
Health Care Facilities - 0.0% |
|||
|
Apollo Hospitals Enterprise Ltd. |
26,018 |
395,701 |
|
|
Managed Health Care - 0.1% |
|||
|
Qualicorp SA (a) |
50,000 |
559,008 |
|
|
TOTAL HEALTH CARE PROVIDERS & SERVICES |
954,709 |
||
|
|
|||
|
Shares |
Value |
||
|
PERSONAL PRODUCTS - 0.4% |
|||
|
Personal Products - 0.4% |
|||
|
MYOS Corp. (e) |
2,000,000 |
$ 410,000 |
|
|
Prestige Brands Holdings, Inc. (a) |
121,892 |
2,899,811 |
|
|
|
3,309,811 |
||
|
PHARMACEUTICALS - 86.0% |
|||
|
Pharmaceuticals - 86.0% |
|||
|
AbbVie, Inc. |
275,490 |
10,171,091 |
|
|
Actavis, Inc. (a) |
157,800 |
13,438,248 |
|
|
Akorn, Inc. (a) |
289,100 |
3,989,580 |
|
|
Allergan, Inc. |
419,300 |
45,460,506 |
|
|
AstraZeneca PLC sponsored ADR |
350,000 |
15,904,000 |
|
|
Auxilium Pharmaceuticals, Inc. (a) |
100,200 |
1,708,410 |
|
|
Bristol-Myers Squibb Co. |
121,110 |
4,477,437 |
|
|
Cadence Pharmaceuticals, Inc. (a) |
41,300 |
202,370 |
|
|
Columbia Laboratories, Inc. (a) |
303,100 |
187,073 |
|
|
Daiichi Sankyo Kabushiki Kaisha |
270,000 |
4,832,560 |
|
|
Dechra Pharmaceuticals PLC |
196,760 |
2,090,956 |
|
|
DepoMed, Inc. (a) |
176,000 |
1,138,720 |
|
|
Dr. Reddy's Laboratories Ltd. sponsored ADR (d) |
84,400 |
2,751,440 |
|
|
Durect Corp. (a) |
744,500 |
833,840 |
|
|
Eli Lilly & Co. |
718,200 |
39,256,812 |
|
|
Endo Health Solutions, Inc. (a) |
454,400 |
14,086,400 |
|
|
Endo Health Solutions, Inc. rights (a) |
9,000 |
0 |
|
|
Forest Laboratories, Inc. (a) |
546,520 |
20,111,936 |
|
|
GlaxoSmithKline PLC sponsored ADR |
1,188,400 |
52,325,252 |
|
|
Hi-Tech Pharmacal Co., Inc. |
64,000 |
2,368,640 |
|
|
Hospira, Inc. (a) |
320,000 |
9,417,600 |
|
|
Impax Laboratories, Inc. (a) |
227,500 |
4,511,325 |
|
|
Ipca Laboratories Ltd. |
40,000 |
364,944 |
|
|
Jazz Pharmaceuticals PLC (a) |
336,000 |
19,548,480 |
|
|
Johnson & Johnson |
776,100 |
59,068,971 |
|
|
Merck & Co., Inc. |
1,546,536 |
66,083,483 |
|
|
Mylan, Inc. (a) |
795,200 |
23,545,872 |
|
|
Nektar Therapeutics (a)(d) |
445,500 |
4,129,785 |
|
|
Novartis AG sponsored ADR (d) |
561,198 |
38,049,224 |
|
|
Novo Nordisk A/S Series B sponsored ADR |
186,500 |
32,637,500 |
|
|
Obagi Medical Products, Inc. (a) |
143,000 |
1,927,640 |
|
|
Ono Pharmaceutical Co. Ltd. |
28,000 |
1,486,244 |
|
|
Optimer Pharmaceuticals, Inc. (a) |
293,000 |
3,551,160 |
|
|
Pain Therapeutics, Inc. |
171,721 |
503,143 |
|
|
Paladin Labs, Inc. (a) |
136,600 |
6,490,570 |
|
|
Perrigo Co. |
102,400 |
11,588,608 |
|
|
Pfizer, Inc. |
2,620,388 |
71,720,019 |
|
|
Questcor Pharmaceuticals, Inc. (d) |
134,200 |
4,374,920 |
|
|
Salix Pharmaceuticals Ltd. (a) |
224,900 |
10,986,365 |
|
|
Sanofi SA sponsored ADR |
1,179,022 |
55,661,629 |
|
|
Santarus, Inc. (a) |
566,500 |
7,517,455 |
|
|
Shire PLC sponsored ADR |
210,000 |
19,668,600 |
|
|
Stada Arzneimittel AG |
50,000 |
1,953,756 |
|
|
Common Stocks - continued |
|||
|
Shares |
Value |
||
|
PHARMACEUTICALS - CONTINUED |
|||
|
Pharmaceuticals - continued |
|||
|
Teva Pharmaceutical Industries Ltd. sponsored ADR |
691,289 |
$ 25,854,209 |
|
|
The Medicines Company (a) |
220,500 |
7,014,105 |
|
|
UCB SA |
72,000 |
4,159,482 |
|
|
Valeant Pharmaceuticals International, Inc. (Canada) (a)(d) |
574,927 |
38,774,471 |
|
|
Virbac SA |
11,467 |
2,468,675 |
|
|
ViroPharma, Inc. (a) |
223,100 |
5,564,114 |
|
|
Warner Chilcott PLC |
510,000 |
6,890,100 |
|
|
XenoPort, Inc. (a) |
285,000 |
2,177,400 |
|
|
Zoetis, Inc. Class A |
7,500 |
250,875 |
|
|
|
783,275,995 |
||
|
TOTAL COMMON STOCKS (Cost $674,966,948) |
|
||
|
Convertible Preferred Stocks - 0.0% |
|||
|
|
|
|
|
|
LIFE SCIENCES TOOLS & SERVICES - 0.0% |
|||
|
Life Sciences Tools & Services - 0.0% |
|||
|
Living Proof, Inc. 8.00% (e) |
112,714 |
200,000 |
|
|
PHARMACEUTICALS - 0.0% |
|||
|
Pharmaceuticals - 0.0% |
|||
|
Agios Pharmaceuticals, Inc. Series C (a)(e) |
50,916 |
250,054 |
|
|
TOTAL CONVERTIBLE PREFERRED STOCKS (Cost $450,054) |
|
||
|
Money Market Funds - 6.4% |
|||
|
Shares |
Value |
||
|
Fidelity Cash Central Fund, 0.16% (b) |
18,597,794 |
$ 18,597,794 |
|
|
Fidelity Securities Lending Cash Central Fund, 0.16% (b)(c) |
39,631,494 |
39,631,494 |
|
|
TOTAL MONEY MARKET FUNDS (Cost $58,229,288) |
|
||
|
TOTAL INVESTMENT PORTFOLIO - 103.8% (Cost $733,646,290) |
946,128,709 |
|
NET OTHER ASSETS (LIABILITIES) - (3.8)% |
(35,064,498) |
||
|
NET ASSETS - 100% |
$ 911,064,211 |
||
|
Legend |
|
(a) Non-income producing |
|
(b) Affiliated fund that is generally available only to investment companies and other accounts managed by Fidelity Investments. The rate quoted is the annualized seven-day yield of the fund at period end. A complete unaudited listing of the fund's holdings as of its most recent quarter end is available upon request. In addition, each Fidelity Central Fund's financial statements, which are not covered by the Fund's Report of Independent Registered Public Accounting Firm, are available on the SEC's website or upon request. |
|
(c) Investment made with cash collateral received from securities on loan. |
|
(d) Security or a portion of the security is on loan at period end. |
|
(e) Restricted securities - Investment in securities not registered under the Securities Act of 1933 (excluding 144A issues). At the end of the period, the value of restricted securities (excluding 144A issues) amounted to $860,054 or 0.1% of net assets. |
|
Additional information on each restricted holding is as follows: |
|
Security |
Acquisition Date |
Acquisition Cost |
|
Agios Pharmaceuticals, Inc. Series C |
11/16/11 |
$ 250,054 |
|
Living Proof, Inc. 8.00% |
2/13/13 |
$ 200,000 |
|
MYOS Corp. |
7/2/12 |
$ 500,000 |
|
Affiliated Central Funds |
|
Information regarding fiscal year to date income earned by the Fund from investments in Fidelity Central Funds is as follows: |
|
Fund |
Income earned |
|
Fidelity Cash Central Fund |
$ 37,268 |
|
Fidelity Securities Lending Cash Central Fund |
335,763 |
|
Total |
$ 373,031 |
|
Other Information |
|
The following is a summary of the inputs used, as of February 28, 2013, involving the Fund's assets and liabilities carried at fair value. The inputs or methodology used for valuing securities may not be an indication of the risk associated with investing in those securities. For more information on valuation inputs, and their aggregation into the levels used in the table below, please refer to the Investment Valuation section in the accompanying Notes to Financial Statements. |
|
Valuation Inputs at Reporting Date: |
||||
|
Description |
Total |
Level 1 |
Level 2 |
Level 3 |
|
Investments in Securities: |
||||
|
Common Stocks |
$ 887,449,367 |
$ 887,449,367 |
$ - |
$ - |
|
Convertible Preferred Stocks |
450,054 |
- |
- |
450,054 |
|
Money Market Funds |
58,229,288 |
58,229,288 |
- |
- |
|
Total Investments in Securities: |
$ 946,128,709 |
$ 945,678,655 |
$ - |
$ 450,054 |
|
Distribution of investments by country or territory of incorporation, as a percentage of total net assets, is as follows. (Unaudited) |
|
United States of America |
60.9% |
|
United Kingdom |
7.6% |
|
France |
6.4% |
|
Canada |
5.0% |
|
Ireland |
4.9% |
|
Switzerland |
4.2% |
|
Denmark |
3.6% |
|
Israel |
2.8% |
|
Bailiwick of Jersey |
2.2% |
|
Others (Individually Less Than 1%) |
2.4% |
|
|
100.0% |
See accompanying notes which are an integral part of the financial statements.
Annual Report
Pharmaceuticals Portfolio
Financial Statements
Statement of Assets and Liabilities
|
|
February 28, 2013 |
|
|
|
|
|
|
Assets |
|
|
|
Investment in securities, at value (including securities loaned of $38,496,198) - See accompanying schedule: Unaffiliated issuers (cost $675,417,002) |
$ 887,899,421 |
|
|
Fidelity Central Funds (cost $58,229,288) |
58,229,288 |
|
|
Total Investments (cost $733,646,290) |
|
$ 946,128,709 |
|
Receivable for investments sold |
|
1,676,364 |
|
Receivable for fund shares sold |
|
1,661,408 |
|
Dividends receivable |
|
4,411,811 |
|
Distributions receivable from Fidelity Central Funds |
|
28,704 |
|
Prepaid expenses |
|
1,717 |
|
Receivable from investment adviser for expense reductions |
|
753 |
|
Other receivables |
|
14,783 |
|
Total assets |
|
953,924,249 |
|
|
|
|
|
Liabilities |
|
|
|
Payable for investments purchased |
$ 1,837,416 |
|
|
Payable for fund shares redeemed |
736,544 |
|
|
Accrued management fee |
414,282 |
|
|
Other affiliated payables |
187,703 |
|
|
Other payables and accrued expenses |
52,599 |
|
|
Collateral on securities loaned, at value |
39,631,494 |
|
|
Total liabilities |
|
42,860,038 |
|
|
|
|
|
Net Assets |
|
$ 911,064,211 |
|
Net Assets consist of: |
|
|
|
Paid in capital |
|
$ 686,720,408 |
|
Undistributed net investment income |
|
3,565,748 |
|
Accumulated undistributed net realized gain (loss) on investments and foreign currency transactions |
|
8,296,699 |
|
Net unrealized appreciation (depreciation) on investments and assets and liabilities in foreign currencies |
|
212,481,356 |
|
Net Assets, for 56,494,277 shares outstanding |
|
$ 911,064,211 |
|
Net Asset Value, offering price and redemption price per share ($911,064,211 ÷ 56,494,277 shares) |
|
$ 16.13 |
Statement of Operations
|
|
Year ended February 28, 2013 |
|
|
|
|
|
|
Investment Income |
|
|
|
Dividends |
|
$ 18,667,527 |
|
Interest |
|
154 |
|
Income from Fidelity Central Funds (including $335,763 from security lending) |
|
373,031 |
|
Total income |
|
19,040,712 |
|
|
|
|
|
Expenses |
|
|
|
Management fee |
$ 4,451,081 |
|
|
Transfer agent fees |
1,893,741 |
|
|
Accounting and security lending fees |
283,878 |
|
|
Custodian fees and expenses |
28,965 |
|
|
Independent trustees' compensation |
5,168 |
|
|
Registration fees |
77,981 |
|
|
Audit |
43,229 |
|
|
Legal |
2,867 |
|
|
Interest |
207 |
|
|
Miscellaneous |
6,950 |
|
|
Total expenses before reductions |
6,794,067 |
|
|
Expense reductions |
(58,842) |
6,735,225 |
|
Net investment income (loss) |
|
12,305,487 |
|
Realized and Unrealized Gain (Loss) Net realized gain (loss) on: |
|
|
|
Investment securities: |
|
|
|
Unaffiliated issuers |
28,243,939 |
|
|
Foreign currency transactions |
(39,205) |
|
|
Total net realized gain (loss) |
|
28,204,734 |
|
Change in net unrealized appreciation (depreciation) on: Investment securities |
90,405,236 |
|
|
Assets and liabilities in foreign currencies |
1,984 |
|
|
Total change in net unrealized appreciation (depreciation) |
|
90,407,220 |
|
Net gain (loss) |
|
118,611,954 |
|
Net increase (decrease) in net assets resulting from operations |
|
$ 130,917,441 |
See accompanying notes which are an integral part of the financial statements.
Annual Report
Statement of Changes in Net Assets
|
|
Year ended |
Year ended |
|
Increase (Decrease) in Net Assets |
|
|
|
Operations |
|
|
|
Net investment income (loss) |
$ 12,305,487 |
$ 6,424,503 |
|
Net realized gain (loss) |
28,204,734 |
4,591,223 |
|
Change in net unrealized appreciation (depreciation) |
90,407,220 |
55,847,467 |
|
Net increase (decrease) in net assets resulting from operations |
130,917,441 |
66,863,193 |
|
Distributions to shareholders from net investment income |
(10,455,612) |
(4,623,019) |
|
Distributions to shareholders from net realized gain |
(14,704,906) |
(11,091,469) |
|
Total distributions |
(25,160,518) |
(15,714,488) |
|
Share transactions |
336,546,113 |
525,622,548 |
|
Reinvestment of distributions |
24,435,405 |
15,307,379 |
|
Cost of shares redeemed |
(271,573,650) |
(267,283,200) |
|
Net increase (decrease) in net assets resulting from share transactions |
89,407,868 |
273,646,727 |
|
Redemption fees |
17,062 |
66,684 |
|
Total increase (decrease) in net assets |
195,181,853 |
324,862,116 |
|
|
|
|
|
Net Assets |
|
|
|
Beginning of period |
715,882,358 |
391,020,242 |
|
End of period (including undistributed net investment income of $3,565,748 and undistributed net investment income of $2,289,300, respectively) |
$ 911,064,211 |
$ 715,882,358 |
|
Other Information Shares |
|
|
|
Sold |
22,249,886 |
39,011,957 |
|
Issued in reinvestment of distributions |
1,635,914 |
1,159,149 |
|
Redeemed |
(18,109,515) |
(20,142,513) |
|
Net increase (decrease) |
5,776,285 |
20,028,593 |
Financial Highlights
|
Years ended February 28, |
2013 |
2012 F |
2011 |
2010 |
2009 |
|
Selected Per-Share Data |
|
|
|
|
|
|
Net asset value, beginning of period |
$ 14.11 |
$ 12.74 |
$ 10.93 |
$ 7.60 |
$ 10.52 |
|
Income from Investment Operations |
|
|
|
|
|
|
Net investment income (loss) B |
.23 |
.15 |
.17 |
.14 |
.18 |
|
Net realized and unrealized gain (loss) |
2.26 |
1.64 |
1.96 |
3.35 |
(2.91) |
|
Total from investment operations |
2.49 |
1.79 |
2.13 |
3.49 |
(2.73) |
|
Distributions from net investment income |
(.20) |
(.11) |
(.13) |
(.16) |
(.13) |
|
Distributions from net realized gain |
(.27) |
(.31) |
(.19) |
- |
(.06) |
|
Total distributions |
(.47) |
(.42) |
(.32) |
(.16) |
(.19) |
|
Redemption fees added to paid in capital B, G |
- |
- |
- |
- |
- |
|
Net asset value, end of period |
$ 16.13 |
$ 14.11 |
$ 12.74 |
$ 10.93 |
$ 7.60 |
|
Total Return A |
17.93% |
14.34% |
19.68% |
46.05% |
(26.23)% |
|
Ratios to Average Net Assets C, E |
|
|
|
|
|
|
Expenses before reductions |
.85% |
.89% |
.94% |
1.01% |
1.00% |
|
Expenses net of fee waivers, if any |
.85% |
.89% |
.94% |
1.01% |
1.00% |
|
Expenses net of all reductions |
.84% |
.88% |
.94% |
1.00% |
.99% |
|
Net investment income (loss) |
1.54% |
1.12% |
1.42% |
1.49% |
1.89% |
|
Supplemental Data |
|
|
|
|
|
|
Net assets, end of period (000 omitted) |
$ 911,064 |
$ 715,882 |
$ 391,020 |
$ 235,535 |
$ 142,011 |
|
Portfolio turnover rate D |
54% |
73% |
102% |
221% |
240% |
A Total returns would have been lower if certain expenses had not been reduced during the applicable periods shown.
B Calculated based on average shares outstanding during the period.
C Fees and expenses of any underlying Fidelity Central Funds are not included in the Fund's expense ratio. The Fund indirectly bears its proportionate share of the expenses of any underlying Fidelity Central Funds.
D Amount does not include the portfolio activity of any underlying Fidelity Central Funds.
E Expense ratios reflect operating expenses of the Fund. Expenses before reductions do not reflect amounts reimbursed by the investment adviser or reductions from brokerage service arrangements or reductions from other expense offset arrangements and do not represent the amount paid by the Fund during periods when reimbursements or reductions occur. Expenses net of fee waivers reflect expenses after reimbursement by the investment adviser but prior to reductions from brokerage service arrangements or other expense offset arrangements. Expenses net of all reductions represent the net expenses paid by the Fund.
F For the year ended February 29.
G Amount represents less than $.01 per share.
See accompanying notes which are an integral part of the financial statements.
Annual Report
Notes to Financial Statements
For the period ended February 28, 2013
1. Organization.
Biotechnology Portfolio, Health Care Portfolio, Medical Delivery Portfolio, Medical Equipment and Systems Portfolio, and Pharmaceuticals Portfolio (the Funds) are non-diversified funds of Fidelity Select Portfolios (the Trust). The Trust is registered under the Investment Company Act of 1940, as amended (the 1940 Act), as an open-end management investment company organized as a Massachusetts business trust. The Funds invest primarily in securities of companies whose principal business activities fall within specific industries. Each Fund is authorized to issue an unlimited number of shares.
2. Investments in Fidelity Central Funds.
The Funds invest in Fidelity Central Funds, which are open-end investment companies available only to other investment companies and accounts managed by Fidelity Management & Research Company (FMR) and its affiliates. The Funds' Schedules of Investments list each of the Fidelity Central Funds held as of period end, if any, as an investment of each Fund, but do not include the underlying holdings of each Fidelity Central Fund. As an Investing Fund, each Fund indirectly bears its proportionate share of the expenses of the underlying Fidelity Central Funds.
The Money Market Central Funds seek preservation of capital and current income and are managed by Fidelity Investments Money Management, Inc. (FIMM), an affiliate of FMR.
A complete unaudited list of holdings for each Fidelity Central Fund is available upon request or at the Securities and Exchange Commission (the SEC) website at www.sec.gov. In addition, the financial statements of the Fidelity Central Funds, which are not covered by the Funds' Report of Independent Registered Public Accounting Firm, are available on the SEC website or upon request.
3. Significant Accounting Policies.
The financial statements have been prepared in conformity with accounting principles generally accepted in the United States of America (GAAP), which require management to make certain estimates and assumptions at the date of the financial statements. Actual results could differ from those estimates. Subsequent events, if any, through the date that the financial statements were issued have been evaluated in the preparation of the financial statements. The following summarizes the significant accounting policies of the Funds:
Investment Valuation. Investments are valued as of 4:00 p.m. Eastern time on the last calendar day of the period. In accordance with valuation policies and procedures approved by the Board of Trustees (the Board), each Fund attempts to obtain prices from one or more third party pricing vendors or brokers to value its investments. When current market prices, quotations or currency exchange rates are not readily available or reliable, investments will be fair valued in good faith by the FMR Fair Value Committee (the Committee), in accordance with procedures adopted by each Fund's Board. Factors used in determining fair value vary by investment type and may include market or investment specific events. The frequency with which these procedures are used cannot be predicted and they may be utilized to a significant extent. The Committee oversees each Fund's valuation policies and procedures and is responsible for approving and reporting to the Board all fair value determinations.
Each Fund categorizes the inputs to valuation techniques used to value their investments into a disclosure hierarchy consisting of three levels as shown below:
Level 1 - quoted prices in active markets for identical investments
Level 2 - other significant observable inputs (including quoted prices for similar investments, interest rates, prepayment speeds, etc.)
Level 3 - unobservable inputs (including the Fund's own assumptions based on the best information available)
Valuation techniques used to value each Fund's investments by major category are as follows:
Equity securities, including restricted securities, for which market quotations are readily available, are valued at the last reported sale price or official closing price as reported by a third party pricing vendor on the primary market or exchange on which they are traded and are categorized as Level 1 in the hierarchy. In the event there were no sales during the day or closing prices are not available, securities are valued at the last quoted bid price or may be valued using the last available price and are generally categorized as Level 2 in the hierarchy. For foreign equity securities, when significant market or security specific events arise, comparisons to the valuation of American Depositary Receipts (ADRs), futures contracts, Exchange-Traded Funds (ETFs) and certain indexes as well as quoted prices for similar securities are used and are categorized as Level 2 in the hierarchy. Utilizing these techniques may result in transfers between Level 1 and Level 2. For restricted equity securities and private placements where observable inputs are limited, assumptions about market activity and risk are used and these securities are generally categorized as Level 3 in the hierarchy.
Investments in open-end mutual funds, including the Fidelity Central Funds, are valued at their closing net asset value (NAV) each business day and are categorized as Level 1 in the hierarchy.
Changes in valuation techniques may result in transfers in or out of an assigned level within the disclosure hierarchy. The aggregate value of investments by input level, as of February 28, 2013, is included at the end of each applicable Fund's Schedule of Investments.
Annual Report
3. Significant Accounting Policies - continued
Foreign Currency. The Funds may use foreign currency contracts to facilitate transactions in foreign-denominated securities. Gains and losses from these transactions may arise from changes in the value of the foreign currency or if the counterparties do not perform under the contracts' terms.
Foreign-denominated assets, including investment securities, and liabilities are translated into U.S. dollars at the exchange rates at period end. Purchases and sales of investment securities, income and dividends received and expenses denominated in foreign currencies are translated into U.S. dollars at the exchange rate in effect on the transaction date.
The effects of exchange rate fluctuations on investments are included with the net realized and unrealized gain (loss) on investment securities. Other foreign currency transactions resulting in realized and unrealized gain (loss) are disclosed separately.
Investment Transactions and Income. For financial reporting purposes, the Funds' investment holdings and NAV include trades executed through the end of the last business day of the period. The NAV per share for processing shareholder transactions is calculated as of the close of business of the New York Stock Exchange (NYSE), normally 4:00 p.m. Eastern time and includes trades executed through the end of the prior business day. Gains and losses on securities sold are determined on the basis of identified cost and may include proceeds received from litigation. Dividend income is recorded on the ex-dividend date, except for certain dividends from foreign securities where the ex-dividend date may have passed, which are recorded as soon as the Funds are informed of the ex-dividend date. Non-cash dividends included in dividend income, if any, are recorded at the fair market value of the securities received. Distributions received on securities that represent a return of capital or capital gain are recorded as a reduction of cost of investments and/or as a realized gain. The Funds estimate the components of distributions received that may be considered return of capital distributions or capital gain distributions. Interest income and distributions from the Fidelity Central Funds are accrued as earned. Interest income includes coupon interest and amortization of premium and accretion of discount on debt securities. Investment income is recorded net of foreign taxes withheld where recovery of such taxes is uncertain.
Expenses. Expenses directly attributable to a fund are charged to that fund. Expenses attributable to more than one fund are allocated among the respective funds on the basis of relative net assets or other appropriate methods. Expense estimates are accrued in the period to which they relate and adjustments are made when actual amounts are known.
Deferred Trustee Compensation. Under a Deferred Compensation Plan (the Plan) for Health Care Portfolio, independent Trustees may elect to defer receipt of a portion of their annual compensation. Deferred amounts are invested in a cross-section of Fidelity funds, are marked-to-market and remain in the Fund until distributed in accordance with the Plan. The investment of deferred amounts and the offsetting payable to the Trustees are included in the accompanying Statement of Assets and Liabilities.
Income Tax Information and Distributions to Shareholders. Each year, each Fund intends to qualify as a regulated investment company under Subchapter M of the Internal Revenue Code, including distributing substantially all of its taxable income and realized gains. As a result, no provision for income taxes is required. As of February 28, 2013, each Fund did not have any unrecognized tax benefits in the financial statements; nor is each Fund aware of any tax positions for which it is reasonably possible that the total amounts of unrecognized tax benefits will significantly change in the next twelve months. Each Fund files a U.S. federal tax return, in addition to state and local tax returns as required. A fund's federal income tax returns are subject to examination by the Internal Revenue Service (IRS) for a period of three fiscal years after they are filed. State and local tax returns may be subject to examination for an additional fiscal year depending on the jurisdiction. Foreign taxes are provided for based on each Fund's understanding of the tax rules and rates that exist in the foreign markets in which it invests.
Distributions are declared and recorded on the ex-dividend date. Income and capital gain distributions are determined in accordance with income tax regulations, which may differ from GAAP. In addition, certain Funds claimed a portion of the payment made to redeeming shareholders as a distribution for income tax purposes.
Capital accounts within the financial statements are adjusted for permanent book-tax differences. These adjustments have no impact on net assets or the results of operations. Temporary book-tax differences will reverse in a subsequent period.
Book-tax differences are primarily due to foreign currency transactions, deferred trustees compensation, capital loss carryforwards, net operating losses, and loss deferred due to wash sales and excise tax regulations.
Annual Report
Notes to Financial Statements - continued
3. Significant Accounting Policies - continued
Income Tax Information and Distributions to Shareholders - continued
The federal tax cost of investment securities and unrealized appreciation (depreciation) as of period end were as follows for each Fund:
|
|
Tax cost |
Gross unrealized |
Gross unrealized |
Net unrealized |
|
Biotechnology Portfolio |
$ 2,905,068,849 |
$ 1,010,460,709 |
$ (197,782,964) |
$ 812,677,745 |
|
Health Care Portfolio |
2,242,613,398 |
591,949,750 |
(49,849,969) |
542,099,781 |
|
Medical Delivery Portfolio |
444,382,811 |
120,561,406 |
(1,370,685) |
119,190,721 |
|
Medical Equipment and Systems Portfolio |
1,161,807,923 |
301,235,973 |
(26,817,821) |
274,418,152 |
|
Pharmaceuticals Portfolio |
738,756,261 |
221,243,945 |
(13,871,497) |
207,372,448 |
The tax-based components of distributable earnings as of period end were as follows for each Fund:
|
|
Undistributed |
Undistributed |
Net unrealized |
|
Biotechnology Portfolio |
$ 1,778,885 |
$ - |
$ 812,677,745 |
|
Health Care Portfolio |
10,361,369 |
60,286,678 |
542,096,556 |
|
Medical Delivery Portfolio |
- |
10,440,031 |
119,190,024 |
|
Medical Equipment and Systems Portfolio |
3,360,858 |
15,137,346 |
274,403,006 |
|
Pharmaceuticals Portfolio |
5,666,405 |
11,306,013 |
207,371,385 |
The tax character of distributions paid was as follows:
|
February 28, 2013 |
|
|
|
|
|
Ordinary Income |
Long-term |
Total |
|
Biotechnology Portfolio |
$ 18,771,575 |
$ 103,438,530 |
$ 122,210,105 |
|
Health Care Portfolio |
26,738,737 |
214,482,287 |
241,221,024 |
|
Medical Delivery Portfolio |
299,615 |
31,559,328 |
31,858,943 |
|
Medical Equipment and Systems Portfolio |
2,142,447 |
54,255,083 |
56,397,530 |
|
Pharmaceuticals Portfolio |
11,753,342 |
13,407,176 |
25,160,518 |
|
February 29, 2012 |
|
|
|
|
|
Ordinary Income |
Long-term |
Total |
|
Biotechnology Portfolio |
$ - |
$ 1,786,490 |
$ 1,786,490 |
|
Health Care Portfolio |
- |
176,290,692 |
176,290,692 |
|
Medical Equipment and Systems Portfolio |
720,894 |
68,879,454 |
69,600,348 |
|
Pharmaceuticals Portfolio |
8,103,586 |
7,610,902 |
15,714,488 |
Trading (Redemption) Fees. Shares held by investors in the Funds less than 30 days are subject to a redemption fee equal to .75% of the net asset value of shares redeemed. All redemption fees, which reduce the proceeds of the shareholder redemption, are retained by the Funds and accounted for as an addition to paid in capital.
Restricted Securities. The Funds may invest in securities that are subject to legal or contractual restrictions on resale. These securities generally may be resold in transactions exempt from registration or to the public if the securities are registered. Disposal of these securities may involve time-consuming negotiations and expense, and prompt sale at an acceptable price may be difficult. Information regarding restricted securities is included at the end of each applicable Fund's Schedule of Investments.
Annual Report
4. Purchases and Sales of Investments.
Purchases and sales of securities, other than short-term securities, are noted in the table below.
|
|
Purchases ($) |
Sales ($) |
|
Biotechnology Portfolio |
2,076,805,185 |
1,005,523,044 |
|
Health Care Portfolio |
2,307,448,357 |
2,237,511,722 |
|
Medical Delivery Portfolio |
711,218,067 |
1,024,887,136 |
|
Medical Equipment and Systems Portfolio |
896,681,462 |
1,003,883,052 |
|
Pharmaceuticals Portfolio |
495,907,313 |
418,449,059 |
5. Fees and Other Transactions with Affiliates.
Management Fee. FMR and its affiliates provide the Funds with investment management related services for which the Funds pay a monthly management fee. The management fee is the sum of an individual fund fee rate and an annualized group fee rate. The individual fund fee rate is applied to each Fund's average net assets. The group fee rate is based upon the average net assets of all the mutual funds advised by FMR. The group fee rate decreases as assets under management increase and increases as assets under management decrease. For the period, each Fund's annual management fee rate expressed as a percentage of each Fund's average net assets was as follows:
|
|
Individual Rate |
Group Rate |
Total |
|
Biotechnology Portfolio |
.30% |
.26% |
.56% |
|
Health Care Portfolio |
.30% |
.26% |
.56% |
|
Medical Delivery Portfolio |
.30% |
.26% |
.56% |
|
Medical Equipment and Systems Portfolio |
.30% |
.26% |
.56% |
|
Pharmaceuticals Portfolio |
.30% |
.26% |
.56% |
Transfer Agent Fees. Fidelity Investments Institutional Operations Company, Inc. (FIIOC), an affiliate of FMR, is the Funds' transfer, dividend disbursing and shareholder servicing agent. FIIOC receives account fees and asset-based fees that vary according to account size and type of account. FIIOC pays for typesetting, printing and mailing of shareholder reports, except proxy statements. For the period, transfer agent fees were equivalent to the following annual rates expressed as a percentage of average net assets:
|
Biotechnology Portfolio |
.20% |
|
Health Care Portfolio |
.19% |
|
Medical Delivery Portfolio |
.23% |
|
Medical Equipment and Systems Portfolio |
.23% |
|
Pharmaceuticals Portfolio |
.24% |
Accounting and Security Lending Fees. Fidelity Service Company, Inc. (FSC), an affiliate of FMR, maintains each Fund's accounting records. The accounting fee is based on the level of average net assets for each month. Under a separate contract, FSC administers the security lending program. The security lending fee is based on the number and duration of lending transactions.
Brokerage Commissions. Certain Funds placed a portion of their portfolio transactions with brokerage firms which are affiliates of the investment adviser. The commissions paid to these affiliated firms were as follows:
|
|
Amount |
|
Biotechnology Portfolio |
$ 36,712 |
|
Health Care Portfolio |
26,343 |
|
Medical Delivery Portfolio |
23,849 |
|
Medical Equipment and Systems Portfolio |
13,879 |
|
Pharmaceuticals Portfolio |
8,945 |
Annual Report
Notes to Financial Statements - continued
5. Fees and Other Transactions with Affiliates - continued
Interfund Lending Program. Pursuant to an Exemptive Order issued by the SEC, the Funds, along with other registered investment companies having management contracts with FMR, may participate in an interfund lending program. This program provides an alternative credit facility allowing the funds to borrow from, or lend money to, other participating affiliated funds. At period end, there were no interfund loans outstanding. Each applicable fund's activity in this program during the period for which loans were outstanding was as follows:
|
|
Borrower or |
Average Loan |
Weighted Average |
Interest |
|
Biotechnology Portfolio |
Borrower |
$ 9,707,485 |
.41% |
$ 3,614 |
|
Medical Delivery Portfolio |
Borrower |
10,745,222 |
.40% |
1,077 |
|
Medical Equipment and Systems Portfolio |
Borrower |
12,820,750 |
.38% |
546 |
|
Pharmaceuticals Portfolio |
Borrower |
5,181,000 |
.36% |
207 |
6. Committed Line of Credit.
Certain Funds participate with other funds managed by FMR or an affiliate in a $4.25 billion credit facility (the "line of credit") to be utilized for temporary or emergency purposes to fund shareholder redemptions or for other short-term liquidity purposes. The participating funds have agreed to pay commitment fees on their pro-rata portion of the line of credit, which are reflected in Miscellaneous expenses on the Statement of Operations, and are as follows:
|
Biotechnology Portfolio |
$ 5,559 |
|
Health Care Portfolio |
6,070 |
|
Medical Delivery Portfolio |
2,142 |
|
Medical Equipment and Systems Portfolio |
3,477 |
|
Pharmaceuticals Portfolio |
2,030 |
During the period, there were no borrowings on this line of credit.
7. Security Lending.
Certain Funds lend portfolio securities through a lending agent from time to time in order to earn additional income. For equity securities, a lending agent is used and may loan securities to certain qualified borrowers, including Fidelity Capital Markets (FCM), a broker-dealer affiliated with the Funds. On the settlement date of the loan, each applicable Fund receives collateral (in the form of U.S. Treasury obligations, letters of credit and/or cash) against the loaned securities and maintains collateral in an amount not less than 100% of the market value of the loaned securities during the period of the loan. The market value of the loaned securities is determined at the close of business of the Funds and any additional required collateral is delivered to the Funds on the next business day. If the borrower defaults on its obligation to return the securities loaned because of insolvency or other reasons, a fund could experience delays and costs in recovering the securities loaned or in gaining access to the collateral. Any cash collateral received is invested in the Fidelity Securities Lending Cash Central Fund. The value of loaned securities and cash collateral at period end are disclosed on each applicable Fund's Statement of Assets and Liabilities. Security lending income represents the income earned on investing cash collateral, less rebates paid to borrowers and any lending agent fees associated with the loan, plus any premium payments received for lending certain types of securities. Security lending income is presented on each applicable Fund's Statement of Operations as a component of income from Fidelity Central Funds. FCM security lending activity as of and during the period was as follows:
|
|
Security Lending |
Value of Securities |
|
Biotechnology Portfolio |
$ 836,104 |
$ 10,956,313 |
|
Health Care Portfolio |
11,063 |
606,000 |
|
Medical Delivery Portfolio |
23,100 |
- |
|
Medical Equipment and Systems Portfolio |
74,233 |
946,270 |
|
Pharmaceuticals Portfolio |
50,864 |
1,793,000 |
Annual Report
8. Expense Reductions.
Many of the brokers with whom FMR places trades on behalf of certain Funds provided services to these Funds in addition to trade execution. These services included payments of expenses on behalf of each applicable Fund. In addition, through arrangements with each applicable Fund's custodian, credits realized as a result of uninvested cash balances were used to reduce each applicable Fund's expenses. All of the applicable expense reductions are noted in the table below.
|
|
Brokerage |
Custody |
|
Biotechnology Portfolio |
$ 288,075 |
$ 121 |
|
Health Care Portfolio |
315,680 |
100 |
|
Medical Delivery Portfolio |
139,074 |
- |
|
Medical Equipment and Systems Portfolio |
185,522 |
81 |
|
Pharmaceuticals Portfolio |
58,063 |
26 |
In addition, FMR reimbursed a portion of each Fund's operating expenses during the period as follows:
|
|
Reimbursement |
|
Biotechnology Portfolio |
$ 2,707 |
|
Health Care Portfolio |
1,487 |
|
Medical Delivery Portfolio |
545 |
|
Medical Equipment and Systems Portfolio |
986 |
|
Pharmaceuticals Portfolio |
753 |
9. Other.
The Funds' organizational documents provide former and current trustees and officers with a limited indemnification against liabilities arising in connection with the performance of their duties to the Funds. In the normal course of business, the Funds may also enter into contracts that provide general indemnifications. The Funds' maximum exposure under these arrangements is unknown as this would be dependent on future claims that may be made against the Funds. The risk of material loss from such claims is considered remote.
At the end of the period, the Strategic Advisers U.S. Opportunity Fund was the owner of record of approximately 11% of the total outstanding shares of Pharmaceuticals Portfolio. Mutual funds managed by FMR or its affiliates were the owners of record, in the aggregate, of approximately 24% of the total outstanding shares of Pharmaceuticals Portfolio.
Annual Report
Report of Independent Registered Public Accounting Firm
To the Trustees of Fidelity Select Portfolios and the Shareholders of Biotechnology Portfolio, Health Care Portfolio, Medical Delivery Portfolio, Medical Equipment and Systems Portfolio, and Pharmaceuticals Portfolio:
In our opinion, the accompanying statements of assets and liabilities, including the schedules of investments, and the related statements of operations and of changes in net assets and the financial highlights present fairly, in all material respects, the financial position of Biotechnology Portfolio, Health Care Portfolio, Medical Delivery Portfolio, Medical Equipment and Systems Portfolio, and Pharmaceuticals Portfolio (funds of Fidelity Select Portfolios) at February 28, 2013, the results of each of their operations for the year then ended, the changes in each of their net assets for each of the two years in the period then ended and the financial highlights for each of the five years in the period then ended, in conformity with accounting principles generally accepted in the United States of America. These financial statements and financial highlights (hereafter referred to as "financial statements") are the responsibility of the Fidelity Select Portfolios' management. Our responsibility is to express an opinion on these financial statements based on our audits. We conducted our audits of these financial statements in accordance with the standards of the Public Company Accounting Oversight Board (United States). Those standards require that we plan and perform the audit to obtain reasonable assurance about whether the financial statements are free of material misstatement. An audit includes examining, on a test basis, evidence supporting the amounts and disclosures in the financial statements, assessing the accounting principles used and significant estimates made by management, and evaluating the overall financial statement presentation. We believe that our audits, which included confirmation of securities at February 28, 2013 by correspondence with the custodian and brokers, provide a reasonable basis for our opinion.
PricewaterhouseCoopers LLP
Boston, Massachusetts
April 15, 2013
Annual Report
Trustees and Officers
The Trustees, Members of the Advisory Board, and executive officers of the trust and funds, as applicable, are listed below. The Board of Trustees governs each fund and is responsible for protecting the interests of shareholders. The Trustees are experienced executives who meet periodically throughout the year to oversee each fund's activities, review contractual arrangements with companies that provide services to each fund, oversee management of the risks associated with such activities and contractual arrangements, and review each fund's performance. Except for James C. Curvey, each of the Trustees oversees 234 Fidelity funds. Mr. Curvey oversees 453 Fidelity funds.
The Trustees hold office without limit in time except that (a) any Trustee may resign; (b) any Trustee may be removed by written instrument, signed by at least two-thirds of the number of Trustees prior to such removal; (c) any Trustee who requests to be retired or who has become incapacitated by illness or injury may be retired by written instrument signed by a majority of the other Trustees; and (d) any Trustee may be removed at any special meeting of shareholders by a two-thirds vote of the outstanding voting securities of the trust. Each Trustee who is not an interested person of the trust and the funds (as defined in the 1940 Act) (Independent Trustee), shall retire not later than the last day of the calendar year in which his or her 75th birthday occurs. The Independent Trustees may waive this mandatory retirement age policy with respect to individual Trustees. The executive officers and Advisory Board Members hold office without limit in time, except that any officer and Advisory Board Member may resign or may be removed by a vote of a majority of the Trustees at any regular meeting or any special meeting of the Trustees. Except as indicated, each individual has held the office shown or other offices in the same company for the past five years.
Experience, Skills, Attributes, and Qualifications of the Funds' Trustees. The Governance and Nominating Committee has adopted a statement of policy that describes the experience, qualifications, attributes, and skills that are necessary and desirable for potential Independent Trustee candidates (Statement of Policy). The Board believes that each Trustee satisfied at the time he or she was initially elected or appointed a Trustee, and continues to satisfy, the standards contemplated by the Statement of Policy. The Governance and Nominating Committee also engages professional search firms to help identify potential Independent Trustee candidates who have the experience, qualifications, attributes, and skills consistent with the Statement of Policy. From time to time, additional criteria based on the composition and skills of the current Independent Trustees, as well as experience or skills that may be appropriate in light of future changes to board composition, business conditions, and regulatory or other developments, have also been considered by the professional search firms and the Governance and Nominating Committee. In addition, the Board takes into account the Trustees' commitment and participation in Board and committee meetings, as well as their leadership of standing and ad hoc committees throughout their tenure.
In determining that a particular Trustee was and continues to be qualified to serve as a Trustee, the Board has considered a variety of criteria, none of which, in isolation, was controlling. The Board believes that, collectively, the Trustees have balanced and diverse experience, qualifications, attributes, and skills, which allow the Board to operate effectively in governing each fund and protecting the interests of shareholders. Information about the specific experience, skills, attributes, and qualifications of each Trustee, which in each case led to the Board's conclusion that the Trustee should serve (or continue to serve) as a trustee of the funds, is provided below.
Board Structure and Oversight Function. James C. Curvey is an interested person (as defined in the 1940 Act) and currently serves as Chairman. The Trustees have determined that an interested Chairman is appropriate and benefits shareholders because an interested Chairman has a personal and professional stake in the quality and continuity of services provided to the funds. Independent Trustees exercise their informed business judgment to appoint an individual of their choosing to serve as Chairman, regardless of whether the Trustee happens to be independent or a member of management. The Independent Trustees have determined that they can act independently and effectively without having an Independent Trustee serve as Chairman and that a key structural component for assuring that they are in a position to do so is for the Independent Trustees to constitute a substantial majority for the Board. The Independent Trustees also regularly meet in executive session. Ned C. Lautenbach serves as Chairman of the Independent Trustees and as such (i) acts as a liaison between the Independent Trustees and management with respect to matters important to the Independent Trustees and (ii) with management prepares agendas for Board meetings.
Fidelity funds are overseen by different Boards of Trustees. The funds' Board oversees Fidelity's equity and high income funds and another Board oversees Fidelity's investment-grade bond, money market, and asset allocation funds. The asset allocation funds may invest in Fidelity funds overseen by the funds' Board. The use of separate Boards, each with its own committee structure, allows the Trustees of each group of Fidelity funds to focus on the unique issues of the funds they oversee, including common research, investment, and operational issues. On occasion, the separate Boards establish joint committees to address issues of overlapping consequences for the Fidelity funds overseen by each Board.
The Trustees operate using a system of committees to facilitate the timely and efficient consideration of all matters of importance to the Trustees, each fund, and fund shareholders and to facilitate compliance with legal and regulatory requirements and oversight of the funds' activities and associated risks. The Board, acting through its committees, has charged FMR and its affiliates with (i) identifying events or circumstances the occurrence of which could have demonstrably adverse effects on the funds' business and/or reputation; (ii) implementing processes and controls to lessen the possibility that such events or circumstances occur or to mitigate the effects of such events or circumstances if they do occur; and (iii) creating and maintaining a system designed to evaluate continuously business and market conditions in order to facilitate the identification and implementation processes described in (i) and (ii) above. Because the day-to-day operations and activities of the funds are carried out by or through FMR, its affiliates and other service providers, the funds' exposure to risks is mitigated but not eliminated by the processes overseen by the Trustees. While each of the Board's committees has responsibility for overseeing different aspects of the funds' activities, oversight is exercised primarily through the Operations, Audit, and Compliance Committees. In addition, the Independent Trustees have worked with FMR to enhance the Board's oversight of investment and financial risks, legal and regulatory risks, technology risks, and operational risks, including the development of additional risk reporting to the Board. For example, a working group comprised of Independent Trustees and FMR has worked and continues to work to review the Fidelity funds' valuation-related activities, reporting and risk management. Appropriate personnel, including but not limited to the funds' Chief Compliance Officer (CCO), FMR's internal auditor, the independent accountants, the funds' Treasurer and portfolio management personnel, make periodic reports to the Board's committees, as appropriate, including an annual review of FMR's risk management program for the Fidelity funds. The responsibilities of each standing committee, including their oversight responsibilities, are described further under "Standing Committees of the Funds' Trustees."
Annual Report
The funds' Statement of Additional Information (SAI) includes more information about the Trustees. To request a free copy, call Fidelity at 1-800-544-8544.
Interested Trustees*:
Correspondence intended for each Trustee who is an interested person may be sent to Fidelity Investments, 245 Summer Street, Boston, Massachusetts 02210.
|
Name, Year of Birth; Principal Occupations and Other Relevant Experience+ |
|
|
James C. Curvey (1935) |
|
|
|
Year of Election or Appointment: 2007 Mr. Curvey is Trustee and Chairman of the Board of Trustees of certain Trusts. Mr. Curvey also serves as Trustee (2007-present) of other investment companies advised by FMR. Mr. Curvey is a Director of Fidelity Investments Money Management, Inc. (2009-present), Director of Fidelity Research & Analysis Co. (2009-present) and Director of FMR and FMR Co., Inc. (2007-present). Mr. Curvey is also Vice Chairman (2007-present) and Director of FMR LLC. In addition, Mr. Curvey serves as an Overseer for the Boston Symphony Orchestra and a member of the Trustees of Villanova University. Previously, Mr. Curvey was the Vice Chairman (2006-2007) and Director (2000-2007) of FMR Corp. |
|
Ronald P. O'Hanley (1957) |
|
|
|
Year of Election or Appointment: 2011 Mr. O'Hanley is Director of FMR Co., Inc. (2010-present), Director of Fidelity Investments Money Management, Inc. (2010-present), Director of Fidelity Research & Analysis Company (2010-present), President of Fidelity Asset Management and Corporate Services and a member of Fidelity's Executive Committee (2010-present). Previously, Mr. O'Hanley served as President and Chief Executive Officer of BNY Mellon Asset Management (2007-2010). Mr. O'Hanley also served as Vice Chairman of Bank New York Mellon Corp. and a member of that firm's Executive Committee. Prior to the 2007 merger of The Bank of New York and Mellon Financial Corporation, he was Vice Chairman of Mellon Financial Corporation and President and Chief Executive Officer of Mellon Asset Management. He joined Mellon in February 1997. Mr. O'Hanley currently serves as Chairman of the Boston Public Library Foundation Board of Directors and sits on the Board of Directors of Beth Israel Deaconess Medical Center, the Board of Trustees of the Marine Biological Laboratory and the Advisory Board of the Maxwell School of Citizenship and Public Administration at Syracuse University. Mr. O'Hanley also chairs the Council on Asset Management for the Financial Services Roundtable and is a member of the Board of Directors of Institutional Investor's U.S. Institute. |
* Trustees have been determined to be "Interested Trustees" by virtue of, among other things, their affiliation with the trust or various entities under common control with FMR.
+ The information above includes each Trustee's principal occupation during the last five years and other information relating to the experience, attributes, and skills relevant to each Trustee's qualifications to serve as a Trustee, which led to the conclusion that each Trustee should serve as a Trustee for each fund.
Independent Trustees:
Correspondence intended for each Independent Trustee (that is, the Trustees other than the Interested Trustees) may be sent to Fidelity Investments, P.O. Box 55235, Boston, Massachusetts 02205-5235.
|
Name, Year of Birth; Principal Occupations and Other Relevant Experience+ |
|
|
Dennis J. Dirks (1948) |
|
|
|
Year of Election or Appointment: 2005 Prior to his retirement in May 2003, Mr. Dirks was Chief Operating Officer and a member of the Board of The Depository Trust & Clearing Corporation (DTCC). He also served as President, Chief Operating Officer, and Board member of The Depository Trust Company (DTC) and President and Board member of the National Securities Clearing Corporation (NSCC). In addition, Mr. Dirks served as Chief Executive Officer and Board member of the Government Securities Clearing Corporation, Chief Executive Officer and Board member of the Mortgage-Backed Securities Clearing Corporation, as a Trustee and a member of the Finance Committee of Manhattan College (2005-2008), and as a Trustee and a member of the Finance Committee of AHRC of Nassau County (2006-2008). Mr. Dirks is a member of the Independent Directors Council (IDC) Governing Council (2010-present) and Board of Directors for The Brookville Center for Children's Services, Inc. (2009-present). |
|
Alan J. Lacy (1953) |
|
|
|
Year of Election or Appointment: 2008 Mr. Lacy serves as Senior Adviser (2007-present) of Oak Hill Capital Partners, L.P. (private equity). Mr. Lacy also served as Chief Executive Officer (2000-2005) and Vice Chairman (2005-2006) of Sears Holdings Corporation and Sears, Roebuck and Co. (retail). In addition, Mr. Lacy serves as a member of the Board of Directors of Dave & Buster's Entertainment, Inc. (restaurant and entertainment complexes, 2010-present), Earth Fare, Inc. (retail grocery, 2012-present), The Hillman Companies, Inc. (hardware wholesalers, 2010-present), and Bristol-Myers Squibb Company (global pharmaceuticals, 2008-present). Mr. Lacy is a member of the Board of Trustees of The National Parks Conservation Association (2006-present). Previously, Mr. Lacy served as Chairman of the Board of Trustees of the National Parks Conservation Association (2008-2011) and as a member of the Board of Directors for the Western Union Company (global money transfer, 2006-2011). |
|
Ned C. Lautenbach (1944) |
|
|
|
Year of Election or Appointment: 2000 Mr. Lautenbach is Chairman of the Independent Trustees of the Equity and High Income Funds (2006-present). Mr. Lautenbach currently serves as the Lead Director of the Eaton Corporation Board of Directors (diversified industrial, 1997-present). Mr. Lautenbach is Chairman of the Board of Directors of the Philharmonic Center for the Arts in Naples, Florida (2012-present) and a member of the Council on Foreign Relations (1994-present). Previously, Mr. Lautenbach was a Partner/Advisory Partner at Clayton, Dubilier & Rice, LLC (private equity investment, 1998-2010), as well as a Director of Sony Corporation (2006-2007). |
|
Joseph Mauriello (1944) |
|
|
|
Year of Election or Appointment: 2008 Prior to his retirement in January 2006, Mr. Mauriello served in numerous senior management positions including Deputy Chairman and Chief Operating Officer (2004-2005), and Vice Chairman of Financial Services (2002-2004) of KPMG LLP US (professional services, 1965-2005). Mr. Mauriello currently serves as a member of the Board of Directors of XL Group plc. (global insurance and re-insurance, 2006-present). Previously, Mr. Mauriello served as a Director of the Hamilton Funds of the Bank of New York (2006-2007) and of Arcadia Resources Inc. (health care services and products, 2007-2012). |
|
Robert W. Selander (1950) |
|
|
|
Year of Election or Appointment: 2011 Previously, Mr. Selander served as a Member of the Advisory Board of Fidelity's Equity and High Income Funds (2011), Executive Vice Chairman (2010), Chief Executive Officer (2009-2010), and President and Chief Executive Officer (1997-2009) of Mastercard, Inc. |
|
Cornelia M. Small (1944) |
|
|
|
Year of Election or Appointment: 2005 Ms. Small is a member of the Board of Directors (2009-present) and Chair of the Investment Committee (2010-present) of the Teagle Foundation. Ms. Small also serves on the Investment Committee of the Berkshire Taconic Community Foundation (2008-present). Previously, Ms. Small served as Chairperson (2002-2008) and a member of the Investment Committee and Chairperson (2008-2012) and a member of the Board of Trustees of Smith College. In addition, Ms. Small served as Chief Investment Officer, Director of Global Equity Investments, and a member of the Board of Directors of Scudder, Stevens & Clark and Scudder Kemper Investments. |
|
William S. Stavropoulos (1939) |
|
|
|
Year of Election or Appointment: 2001 Mr. Stavropoulos is Vice Chairman of the Independent Trustees of the Equity and High Income Funds (2006-present). Mr. Stavropoulos serves as President and Founder of the Michigan Baseball Foundation, the Great Lakes Loons (2007-present). Mr. Stavropoulos is Chairman Emeritus of the Board of Directors of The Dow Chemical Company, where he previously served in numerous senior management positions, including President, CEO (1995-2000; 2002-2004), Chairman of the Executive Committee (2000-2006), and as a member of the Board of Directors (1990-2006). Currently, Mr. Stavropoulos is a Director of Univar Inc. (global distributor of commodity and specialty chemicals, Chairman from 2010-May 2012 and Lead Director from May 2012-present), Teradata Corporation (data warehousing and technology solutions, 2008-present), Maersk Inc. (industrial conglomerate), and Tyco International, Ltd. (multinational manufacturing and services, 2007-present), and a member of the Advisory Board for Metalmark Capital LLC (private equity investment, 2005-present). Mr. Stavropoulos is an operating advisor to Clayton, Dubilier & Rice, LLC (private equity investment). In addition, Mr. Stavropoulos is a member of the University of Notre Dame Advisory Council for the College of Science, a Trustee of the Rollin L. Gerstacker Foundation, and a Director of the Naples Philharmonic Center for the Arts. Previously, Mr. Stavropoulos served as a Director of Chemical Financial Corporation (bank holding company, 1993-2012). |
|
David M. Thomas (1949) |
|
|
|
Year of Election or Appointment: 2008 |
|
Michael E. Wiley (1950) |
|
|
|
Year of Election or Appointment: 2008 Mr. Wiley also serves as a Director of Asia Pacific Exploration Consolidated (international oil and gas exploration and production, 2008-present). Mr. Wiley serves as a Director of Tesoro Corporation (independent oil refiner and marketer, 2005-present), and a Director of Bill Barrett Corporation (exploration and production, 2005-present). In addition, Mr. Wiley also serves as a Director of Post Oak Bank (privately-held bank, 2004-present). Previously, Mr. Wiley served as a member of the Board of Trustees of the University of Tulsa (2000-2006; 2007-2010), as a Senior Energy Advisor of Katzenbach Partners, LLC (consulting, 2006-2007), as an Advisory Director of Riverstone Holdings (private investment), Chairman, President, and CEO of Baker Hughes, Inc. (oilfield services, 2000-2004), and as Director of Spinnaker Exploration Company (exploration and production, 2001-2005). |
+ The information above includes each Trustee's principal occupation during the last five years and other information relating to the experience, attributes, and skills relevant to each Trustee's qualifications to serve as a Trustee, which led to the conclusion that each Trustee should serve as a Trustee for each fund.
Advisory Board Members and Executive Officers:
Correspondence intended for David A. Rosow and Garnett A. Smith may be sent to Fidelity Investments, P.O. Box 55235, Boston, Massachusetts 02205-5235. Correspondence intended for each executive officer and Peter S. Lynch may be sent to Fidelity Investments, 245 Summer Street, Boston, Massachusetts 02210.
|
Name, Year of Birth; Principal Occupation |
|
|
Peter S. Lynch (1944) |
|
|
|
Year of Election or Appointment: 2003 Member of the Advisory Board of Fidelity's Equity and High Income Funds. Mr. Lynch is Vice Chairman and a Director of FMR and FMR Co., Inc. In addition, Mr. Lynch serves as a Trustee of Boston College and as the Chairman of the Inner-City Scholarship Fund. Previously, Mr. Lynch served on the Special Olympics International Board of Directors (1997-2006). |
|
David A. Rosow (1942) |
|
|
|
Year of Election or Appointment: 2012 Member of the Advisory Board of Fidelity's Equity and High Income Funds. Chairman and Chief Executive Officer of International Golf Group, Inc. (golf course development, 1989-present). Previously, Mr. Rosow served as Chairman and Chief Executive Officer of Rosow & Company, Inc. (private investment company, 1989-2011), a Lead Director of Hudson United Bancorp (2001-2006) and as a Director of TD Banknorth (1996-2006). In addition, Mr. Rosow is a member (2008-present) and President (2009-present) of the Town Council of Palm Beach, Florida. |
|
Garnett A. Smith (1947) |
|
|
|
Year of Election or Appointment: 2012 Member of the Advisory Board of Fidelity's Equity and High Income Funds. Prior to Mr. Smith's retirement, he served as Chairman and Chief Executive Officer of Inbrand Corp. (manufacturer of personal absorbent products, 1990-1997). He also served as President (1986-1990) of Inbrand Corp. Prior to his employment with Inbrand Corp., he was employed by a retail fabric chain and North Carolina National Bank. In addition, Mr. Smith is a board member of the Jackson Hole Land Trust (2009-present). |
|
Kenneth B. Robins (1969) |
|
|
|
Year of Election or Appointment: 2008 President and Treasurer of Fidelity's Equity and High Income Funds. Mr. Robins also serves as President and Treasurer (2010-present) and Assistant Treasurer (2009-present) of other Fidelity funds and is an employee of Fidelity Investments (2004-present). Previously, Mr. Robins served as Deputy Treasurer of the Fidelity funds (2005-2008) and Treasurer and Chief Financial Officer of The North Carolina Capital Management Trust: Cash and Term Portfolios (2006-2008). |
|
Brian B. Hogan (1964) |
|
|
|
Year of Election or Appointment: 2009 Vice President of Equity and High Income Funds. Mr. Hogan also serves as President of FMR's Equity Division (2009-present). Previously, Mr. Hogan served as Senior Vice President, Equity Research of FMR (2006-2009) and as a portfolio manager. |
|
Christopher S. Bartel (1971) |
|
|
|
Year of Election or Appointment: 2009 Vice President of Fidelity's Sector and Real Estate Equity Funds. Mr. Bartel also serves as a Director, President, and Chief Executive Officer of Fidelity Management & Research (Japan) Inc. (2012-present), a Director of Fidelity Management & Research (Hong Kong) (2012-present), and Senior Vice President of Global Equity Research (2010-present). Previously, Mr. Bartel served as Senior Vice President of Equity Research (2009-2010), Managing Director of Research (2006-2009), and an analyst and portfolio manager (2000-2006). |
|
Scott C. Goebel (1968) |
|
|
|
Year of Election or Appointment: 2008 Secretary and Chief Legal Officer (CLO) of the Fidelity funds. Mr. Goebel also serves as Secretary of Fidelity Investments Money Management, Inc. (FIMM) (2010-present) and Fidelity Research and Analysis Company (FRAC) (2010-present); Secretary and CLO of The North Carolina Capital Management Trust: Cash and Term Portfolios (2008-present); General Counsel, Secretary, and Senior Vice President of FMR (2008-present) and FMR Co., Inc. (2008-present); employed by FMR LLC or an affiliate (2001-present); Chief Legal Officer of Fidelity Management & Research (Hong Kong) Limited (2008-present) and Assistant Secretary of Fidelity Management & Research (Japan) Inc. (2008-present), and Fidelity Management & Research (U.K.) Inc. (2008-present). Previously, Mr. Goebel served as Assistant Secretary of FIMM (2008-2010), FRAC (2008-2010), and the Funds (2007-2008) and as Vice President and Secretary of Fidelity Distributors Corporation (FDC) (2005-2007). |
|
William C. Coffey (1969) |
|
|
|
Year of Election or Appointment: 2009 Assistant Secretary of Fidelity's Equity and High Income Funds. Mr. Coffey also serves as Senior Vice President and Deputy General Counsel of FMR LLC (2010-present), and is an employee of Fidelity Investments. Previously, Mr. Coffey served as Vice President and Associate General Counsel of FMR LLC (2005-2009). |
|
Elizabeth Paige Baumann (1968) |
|
|
|
Year of Election or Appointment: 2012 Anti-Money Laundering (AML) Officer of the Fidelity funds. Ms. Baumann also serves as AML Officer of The North Carolina Capital Management Trust: Cash and Term Portfolios (2012-present), Chief AML Officer of FMR LLC (2012-present), and is an employee of Fidelity Investments. Previously, Ms. Baumann served as Vice President and Deputy Anti-Money Laundering Officer (2007-2012). |
|
Christine Reynolds (1958) |
|
|
|
Year of Election or Appointment: 2008 Chief Financial Officer of the Fidelity funds. Ms. Reynolds became President of Fidelity Pricing and Cash Management Services (FPCMS) in August 2008. Ms. Reynolds served as Chief Operating Officer of FPCMS (2007-2008). Previously, Ms. Reynolds served as President, Treasurer, and Anti-Money Laundering officer of the Fidelity funds (2004-2007). |
|
Joseph A. Hanlon (1968) |
|
|
|
Year of Election or Appointment: 2012 Chief Compliance Officer of Fidelity's Equity and High Income Funds. Mr. Hanlon serves as Compliance Officer of FMR, FMR Co., Inc., Fidelity Investments Money Management, Inc. (FIMM), Fidelity Research and Analysis Company (FRAC), Fidelity Management & Research (Japan) Inc., Fidelity Management & Research (U.K.) Inc., Fidelity Management & Research (Hong Kong), and Strategic Advisers, Inc. (2009-present), as Senior Vice President of the Fidelity Asset Management Division (2009-present), and is an employee of Fidelity Investments. |
|
Joseph F. Zambello (1957) |
|
|
|
Year of Election or Appointment: 2011 Deputy Treasurer of the Fidelity funds. Mr. Zambello is an employee of Fidelity Investments. Previously, Mr. Zambello served as Vice President of FMR's Program Management Group (2009-2011) and Vice President of the Transfer Agent Oversight Group (2005-2009). |
|
Adrien E. Deberghes (1967) |
|
|
|
Year of Election or Appointment: 2008 Deputy Treasurer of Fidelity's Equity and High Income Funds. Mr. Deberghes also serves as Vice President (2011-present) and Assistant Treasurer (2010-present) of other Fidelity funds, and is an employee of Fidelity Investments (2008-present). Previously, Mr. Deberghes served as Senior Vice President of Mutual Fund Administration at State Street Corporation (2007-2008), Senior Director of Mutual Fund Administration at Investors Bank & Trust (2005-2007), and Director of Finance for Dunkin' Brands (2000-2005). |
|
Stephen Sadoski (1971) |
|
|
|
Year of Election or Appointment: 2012 Deputy Treasurer of Fidelity's Equity and High Income Funds. Mr. Sadoski also serves as Deputy Treasurer of other Fidelity funds (2013-present) and is an employee of Fidelity Investments (2012-present). Previously, Mr. Sadoski served as Assistant Treasurer of Fidelity's Fixed Income and Asset Allocation Funds (2012-2013), an assistant chief accountant in the Division of Investment Management of the Securities and Exchange Commission (SEC) (2009-2012) and as a senior manager at Deloitte & Touche (1997-2009). |
|
Stacie Smith (1974) |
|
|
|
Year of Election or Appointment: 2013 Deputy Treasurer of Fidelity's Equity and High Income Funds. Ms. Smith is an employee of Fidelity Investments (2009-present). Previously, Ms. Smith served as Senior Audit Manager of Ernst & Young LLP (1996-2009). |
|
Stephanie J. Dorsey (1969) |
|
|
|
Year of Election or Appointment: 2010 Assistant Treasurer of Fidelity's Equity and High Income Funds. Ms. Dorsey also serves as President and Treasurer (2013-present) and Assistant Treasurer (2012-present) of other Fidelity funds and is an employee of Fidelity Investments (2008-present). Previously, Ms. Dorsey served as Deputy Treasurer of Fidelity's Fixed Income and Asset Allocation Funds (2008-2013), Treasurer (2004-2008) of the JPMorgan Mutual Funds and Vice President (2004-2008) of JPMorgan Chase Bank. |
|
John R. Hebble (1958) |
|
|
|
Year of Election or Appointment: 2009 Assistant Treasurer of Fidelity's Equity and High Income Funds. Mr. Hebble also serves as President (2011-present), Treasurer, and Chief Financial Officer of The North Carolina Capital Management Trust: Cash and Term Portfolios (2008-present) and is an employee of Fidelity Investments. Previously, Mr. Hebble served as President and Treasurer of Fidelity's Fixed Income and Asset Allocation Funds (2008-2013). |
|
Gary W. Ryan (1958) |
|
|
|
Year of Election or Appointment: 2005 Assistant Treasurer of the Fidelity funds. Mr. Ryan is an employee of Fidelity Investments. Previously, Mr. Ryan served as Vice President of Fund Reporting in Fidelity Pricing and Cash Management Services (FPCMS) (1999-2005). |
|
Jonathan Davis (1968) |
|
|
|
Year of Election or Appointment: 2010 Assistant Treasurer of the Fidelity funds. Mr. Davis is also Assistant Treasurer of Fidelity Rutland Square Trust II and Fidelity Commonwealth Trust II. Mr. Davis is an employee of Fidelity Investments. Previously, Mr. Davis served as Vice President and Associate General Counsel of FMR LLC (2003-2010). |
Annual Report
Distributions (Unaudited)
The Board of Trustees of each fund voted to pay to shareholders of record at the opening of business on record date the following distributions per share derived from capital gains realized from sales of portfolio securities and dividends derived from net investment income:
|
|
Pay Date |
Record Date |
Dividends |
Capital Gains |
|
Health Care Portfolio |
04/15/13 |
04/12/13 |
$0.034 |
$3.532 |
|
Biotechnology Portfolio |
04/15/13 |
04/12/13 |
$0.000 |
$0.055 |
|
Pharmaceuticals Portfolio |
04/15/13 |
04/12/13 |
$0.060 |
$0.226 |
|
Medical Equipment and Systems Portfolio |
04/15/13 |
04/12/13 |
$0.000 |
$0.418 |
|
Medical Delivery Portfolio |
04/15/13 |
04/12/13 |
$0.000 |
$1.162 |
The funds hereby designate as capital gain dividend the amounts noted below for the taxable year ended February 28, 2013, or, if subsequently determined to be different, the net capital gain of such year.
|
Health Care Portfolio |
$217,173,772 |
|
Biotechnology Portfolio |
$8,424,495 |
|
Pharmaceuticals Portfolio |
$22,986,761 |
|
Medical Equipment and Systems Portfolio |
$43,483,931 |
|
Medical Delivery Portfolio |
$52,637,683 |
A percentage of the dividends distributed during the fiscal year for the following funds qualify for the dividends-received deduction for corporate shareholders:
|
|
April 2012 |
December 2012 |
|
Health Care Portfolio |
0% |
72% |
|
Biotechnology Portfolio |
0% |
15% |
|
Pharmaceuticals Portfolio |
90% |
79% |
|
Medical Equipment and Systems Portfolio |
0% |
100% |
|
Medical Delivery Portfolio |
0% |
100% |
A percentage of the dividends distributed during the fiscal year for the following funds may be taken into account as a dividend for purposes of the maximum rate under section 1(h) (11) of the Internal Revenue Code:
|
|
April 2012 |
December 2012 |
|
Health Care Portfolio |
0% |
79% |
|
Biotechnology Portfolio |
0% |
21% |
|
Pharmaceuticals Portfolio |
100% |
100% |
|
Medical Equipment and Systems Portfolio |
0% |
100% |
|
Medical Delivery Portfolio |
0% |
100% |
The funds will notify shareholders in January 2014 of amounts for use in preparing 2013 income tax returns.
Annual Report
Board Approval of Investment Advisory Contracts and Management Fees
Biotechnology Portfolio
Health Care Portfolio
Medical Delivery Portfolio
Medical Equipment and Systems Portfolio
Pharmaceuticals Portfolio
On November 14, 2012, the Board of Trustees, including the Independent Trustees (together, the Board), voted to approve a new management contract (the New Contracts) between each fund and Fidelity SelectCo, LLC (SelectCo) and to submit the New Contracts to shareholders for their approval. If the New Contracts are approved by shareholders, effective August 1, 2013, SelectCo will serve as investment adviser to each fund. The terms of the New Contracts are identical to those of the current management contracts with FMR (the Current Contracts), except with respect to the name of the investment adviser and the dates of execution and the initial two-year term of the contract. The Board, assisted by the advice of fund counsel and Independent Trustees' counsel, considered a broad range of information.
In determining whether to approve the New Contracts for the funds, the Board was aware that shareholders in the funds have a broad range of investment choices available to them, including a wide choice among mutual funds offered by competitors to Fidelity, and that each fund's shareholders, with the opportunity to review and weigh the disclosure provided by the fund in its prospectus and other public disclosures, have chosen to invest in the fund, managed by Fidelity.
Nature, Extent, and Quality of Services Provided. The Board considered the nature, quality, cost and extent of the services to be provided by SelectCo under the New Contracts as well as the nature, quality, cost and extent of the advisory, administrative, distribution and shareholder services performed by the FMR and the sub-advisers, and by affiliated companies. The Board considered that, upon shareholder approval, SelectCo will render the same services to the funds under the New Contracts that FMR currently renders to the funds under the Current Contracts. The Board also considered that the New Contracts would not result in any changes to (i) the investment process or strategies employed in the management of the funds' assets or (ii) the day-to-day management of the funds or the persons primarily responsible for such management.
Throughout the year, the Trustees had discussions with FMR about plans to establish SelectCo as a new investment adviser to manage sector-based funds and products. The Trustees considered Fidelity's rationale for creating a separate investment adviser and noted that a separate investment adviser may be better positioned to focus on opportunities for growth within the sector investing space and to focus on a distinct approach to sector investing and research.
Shareholder and Administrative Services. The Board noted that the growth of fund assets across the complex allows Fidelity to reinvest in the development of services designed to enhance the value or convenience of the Fidelity funds as investment vehicles. These services include 24-hour access to account information and market information through phone representatives and over the Internet, and investor education materials and asset allocation tools.
Investment in a Large Fund Family. The Board considered the benefits to shareholders of investing in a Fidelity fund, including the benefits of investing in a fund that is part of a large family of funds offering a variety of investment disciplines and providing for a large variety of mutual fund shareholder services.
Investment Performance. The Board did not consider performance to be a material factor in its decision to approve the New Contracts because the New Contracts would not result in any changes to the funds' investment processes or strategies or in the persons primarily responsible for the day-to-day management of the funds.
Based on its review, the Board concluded that the nature, extent, and quality of the services provided to each fund will benefit the fund's shareholders, particularly in light of the Board's view that the fund's shareholders benefit from investing in a fund that is part of a large family of funds offering a variety of investment disciplines and services.
Competitiveness of Management Fee and Total Fund Expenses. The Board considered that, if approved by shareholders, the New Contracts would not result in any changes to the amount of the management fees paid by the funds, except that such fees would be paid to SelectCo rather than FMR. The Board noted that at previous meetings during the year it received and considered materials relating to its review of the management fee of each fund. This information includes comparisons that focus on a fund's standing relative to the total universe of comparable funds available to investors in terms of gross management fees before expense reimbursements or caps, as well as a fund's standing relative to non-Fidelity funds similar in size to the fund within the comparison group.
Based on its review, the Board concluded that each fund's management fee was fair and reasonable in light of the services that the fund receives and the other factors considered.
Annual Report
Board Approval of Investment Advisory Contracts and Management Fees - continued
Because there are no expected changes in the funds' management fees under the New Contracts, the Board will review each fund's total expenses compared to competitive fund median expenses in connection with its future consideration of the renewal of the funds' management contracts and sub-advisory agreements.
In its review of total expenses, the Board also noted that at previous meetings during the year it received and considered materials relating to its review of total expenses for each Fidelity fund. This information includes Fidelity fee structures and other information with respect to clients of FMR and its affiliates, such as other mutual funds advised or sub-advised by FMR or its affiliates, pension plan clients, and other institutional clients.
Costs of the Services and Profitability. Because there were no changes to the services to be provided or fees to be charged to the funds under the New Contracts, the Board did not consider data regarding the impact on Fidelity's costs of services, revenues, or profitability from the new arrangements to be a significant factor in its decision.
In connection with its future consideration of the renewal of each fund's management contract and sub-advisory agreements, the Board will consider the revenues earned and the expenses incurred by Fidelity in conducting the business of developing, marketing, distributing, managing, administering and servicing the funds and their shareholders.
Economies of Scale. The Board recognized that the New Contracts, like the Current Contracts, incorporate a "group fee" structure, which provides for lower fee rates as total fund assets under FMR's management increase, and for higher fee rates as total fund assets under FMR's management decrease. The Board considered that the group fee is designed to deliver the benefits of economies of scale to fund shareholders when total fund assets increase, even if assets of any particular fund are unchanged or have declined, because some portion of Fidelity's costs are attributable to services provided to all Fidelity funds, and all funds benefit if those costs can be allocated among more assets. The Board concluded that, given the group fee structure, fund shareholders will achieve a certain level of economies of scale as assets under FMR's management increase at the fund complex level, regardless of whether Fidelity achieves any such economies of scale.
In connection with its future consideration of the renewal of each fund's management contract and sub-advisory agreements, the Board will consider whether there have been economies of scale in respect of the management of the Fidelity funds, whether the Fidelity funds (including the funds) have appropriately benefited from any such economies of scale, and whether there is potential for realization of any further economies of scale.
Based on its evaluation of all of the conclusions noted above, and after considering all material factors, the Board ultimately concluded that each New Contract is fair and reasonable, and that the New Contracts should be approved and submitted to the applicable funds' shareholders for their approval.
Annual Report
Investment Adviser
Fidelity Management & Research Company
Boston, MA
Investment Sub-Advisers
FMR Co., Inc.
Fidelity Management & Research
(U.K.) Inc.
Fidelity Management & Research
(Hong Kong) Limited
Fidelity Management & Research
(Japan) Inc.
General Distributor
Fidelity Distributors Corporation
Smithfield, RI
Transfer and Service Agents
Fidelity Investments Institutional Operations Company, Inc.
Boston, MA
Fidelity Service Company, Inc.
Boston, MA
Custodian
Brown Brothers Harriman & Co.
Boston, MA
Corporate Headquarters
245 Summer Street
Boston, MA 02210
1-800-544-8888
The Fidelity Telephone Connection
Mutual Fund 24-Hour Service
Exchanges/Redemptions
and Account Assistance 1-800-544-6666
Product Information 1-800-544-8888
Retirement Accounts 1-800-544-4774
(8 a.m. - 9 p.m.)
TDD Service 1-800-544-0118
for the deaf and hearing impaired
(9 a.m. - 9 p.m. Eastern time)
Fidelity Automated Service
Telephone (FAST®) 
1-800-544-5555
Automated line for quickest service

SELHC-UANNPRO-0413
1.910421.103
Fidelity®
Select Portfolios®
Energy Sector
Energy Portfolio
Energy Service Portfolio
Natural Gas Portfolio
Natural Resources Portfolio
Annual Report
February 28, 2013
(Fidelity Cover Art)
Contents
|
Shareholder Expense Example |
|
|
|
Energy Portfolio |
Performance |
|
|
|
Management's Discussion |
|
|
|
Investment Changes |
|
|
|
Investments |
|
|
|
Financial Statements |
|
|
Energy Service Portfolio |
Performance |
|
|
|
Management's Discussion |
|
|
|
Investment Changes |
|
|
|
Investments |
|
|
|
Financial Statements |
|
|
Natural Gas Portfolio |
Performance |
|
|
|
Management's Discussion |
|
|
|
Investment Changes |
|
|
|
Investments |
|
|
|
Financial Statements |
|
|
Natural Resources Portfolio |
Performance |
|
|
|
Management's Discussion |
|
|
|
Investment Changes |
|
|
|
Investments |
|
|
|
Financial Statements |
|
|
Notes to Financial Statements |
|
|
|
Report of Independent Registered Public Accounting Firm |
|
|
|
Trustees and Officers |
|
|
|
Distributions |
|
|
|
Board Approval of Investment Advisory Contracts and Management Fees |
|
To view a fund's proxy voting guidelines and proxy voting record for the 12-month period ended June 30, visit http://www.fidelity.com/proxyvotingresults or visit the Securities and Exchange Commission's (SEC) web site at http://www.sec.gov. You may also call 1-800-544-8544 to request a free copy of the proxy voting guidelines.
Standard & Poor's, S&P and S&P 500 are registered service marks of The McGraw-Hill Companies, Inc. and have been licensed for use by Fidelity Distributors Corporation.
Other third-party marks appearing herein are the property of their respective owners.
All other marks appearing herein are registered or unregistered trademarks or service marks of FMR LLC or an affiliated company. © 2013 FMR LLC. All rights reserved.
This report and the financial statements contained herein are submitted for the general information of the shareholders of the funds. This report is not authorized for distribution to prospective investors in the funds unless preceded or accompanied by an effective prospectus.
A fund files its complete schedule of portfolio holdings with the SEC for the first and third quarters of each fiscal year on Form N-Q. Forms N-Q are available on the SEC's web site at http://www.sec.gov. A fund's Forms N-Q may be reviewed and copied at the SEC's Public Reference Room in Washington, DC. Information regarding the operation of the SEC's Public Reference Room may be obtained by calling 1-800-SEC-0330. For a complete list of a fund's portfolio holdings, view the most recent holdings listing, semiannual report, or annual report on Fidelity's web site at http://www.fidelity.com, http://www.advisor.fidelity.com, or http://www.401k.com, as applicable.
NOT FDIC INSURED • MAY LOSE VALUE • NO BANK GUARANTEE
Neither the funds nor Fidelity Distributors Corporation is a bank.
Annual Report
Shareholder Expense Example
As a shareholder of a Fund, you incur two types of costs: (1) transaction costs, including redemption fees and (2) ongoing costs, including management fees and other Fund expenses. This Example is intended to help you understand your ongoing costs (in dollars) of investing in the Funds and to compare these costs with the ongoing costs of investing in other mutual funds.
The Example is based on an investment of $1,000 invested at the beginning of the period and held for the entire period (September 1, 2012 to February 28, 2013).
Actual Expenses
The first line of the accompanying table for each fund provides information about actual account values and actual expenses. You may use the information in this line, together with the amount you invested, to estimate the expenses that you paid over the period. Simply divide your account value by $1,000.00 (for example, an $8,600 account value divided by $1,000.00 = 8.6), then multiply the result by the number in the first line for a fund under the heading entitled "Expenses Paid During Period" to estimate the expenses you paid on your account during this period. A small balance maintenance fee of $12.00 that is charged once a year may apply for certain accounts with a value of less than $2,000. This fee is not included in the table below. If it was, the estimate of expenses you paid during the period would be higher, and your ending account value lower, by this amount. In addition, each Fund, as a shareholder in the underlying Fidelity Central Funds, will indirectly bear its pro-rata share of the fees and expenses incurred by the underlying Fidelity Central Funds. These fees and expenses are not included in the Fund's annualized expense ratio used to calculate the expense estimate in the table below.
Hypothetical Example for Comparison Purposes
The second line of the accompanying table for each fund provides information about hypothetical account values and hypothetical expenses based on a fund's actual expense ratio and an assumed rate of return of 5% per year before expenses, which is not the Fund's actual return. The hypothetical account values and expenses may not be used to estimate the actual ending account balance or expenses you paid for the period. You may use this information to compare the ongoing costs of investing in the Fund and other funds. To do so, compare this 5% hypothetical example with the 5% hypothetical examples that appear in the shareholder reports of the other funds. A small balance maintenance fee of $12.00 that is charged once a year may apply for certain accounts with a value of less than $2,000. This fee is not included in the table below. If it was, the estimate of expenses you paid during the period would be higher, and your ending account value lower, by this amount. In addition, each Fund, as a shareholder in the underlying Fidelity Central Funds, will indirectly bear its pro-rata share of the fees and expenses incurred by the underlying Fidelity Central Funds. These fees and expenses are not included in the Fund's annualized expense ratio used to calculate the expense estimate in the table below.
Please note that the expenses shown in the table are meant to highlight your ongoing costs only and do not reflect any transaction costs. Therefore, the second line of the table is useful in comparing ongoing costs only, and will not help you determine the relative total costs of owning different funds. In addition, if these transactional costs were included, your costs would have been higher.
|
|
Annualized |
Beginning |
Ending |
Expenses Paid |
|
Energy Portfolio |
.82% |
|
|
|
|
Actual |
|
$ 1,000.00 |
$ 1,093.80 |
$ 4.26 |
|
HypotheticalA |
|
$ 1,000.00 |
$ 1,020.73 |
$ 4.11 |
|
Energy Service Portfolio |
.82% |
|
|
|
|
Actual |
|
$ 1,000.00 |
$ 1,095.10 |
$ 4.26 |
|
HypotheticalA |
|
$ 1,000.00 |
$ 1,020.73 |
$ 4.11 |
|
Natural Gas Portfolio |
.87% |
|
|
|
|
Actual |
|
$ 1,000.00 |
$ 1,064.10 |
$ 4.45 |
|
HypotheticalA |
|
$ 1,000.00 |
$ 1,020.48 |
$ 4.36 |
|
Natural Resources Portfolio |
.85% |
|
|
|
|
Actual |
|
$ 1,000.00 |
$ 1,077.00 |
$ 4.38 |
|
HypotheticalA |
|
$ 1,000.00 |
$ 1,020.58 |
$ 4.26 |
A 5% return per year before expenses
* Expenses are equal to each Fund's annualized expense ratio, multiplied by the average account value over the period, multiplied by 181/365 (to reflect the one-half year period).
Annual Report
Energy Portfolio
Performance: The Bottom Line
Average annual total return reflects the change in the value of an investment, assuming reinvestment of the fund's distributions from dividend income and capital gains (the profits earned upon the sale of securities that have grown in value, if any) and assuming a constant rate of performance each year. The $10,000 table and the fund's returns do not reflect the deduction of taxes that a shareholder would pay on fund distributions or the redemption of fund shares. During periods of reimbursement by Fidelity, a fund's total return will be greater than it would be had the reimbursement not occurred. How a fund did yesterday is no guarantee of how it will do tomorrow.
Average Annual Total Returns
|
Periods ended February 28, 2013 |
Past 1 |
Past 5 |
Past 10 |
|
Energy Portfolio |
1.00% |
-2.21% |
13.40% |
$10,000 Over 10 Years
Let's say hypothetically that $10,000 was invested in Energy Portfolio on February 28, 2003. The chart shows how the value of your investment would have changed, and also shows how the S&P 500® Index performed over the same period.
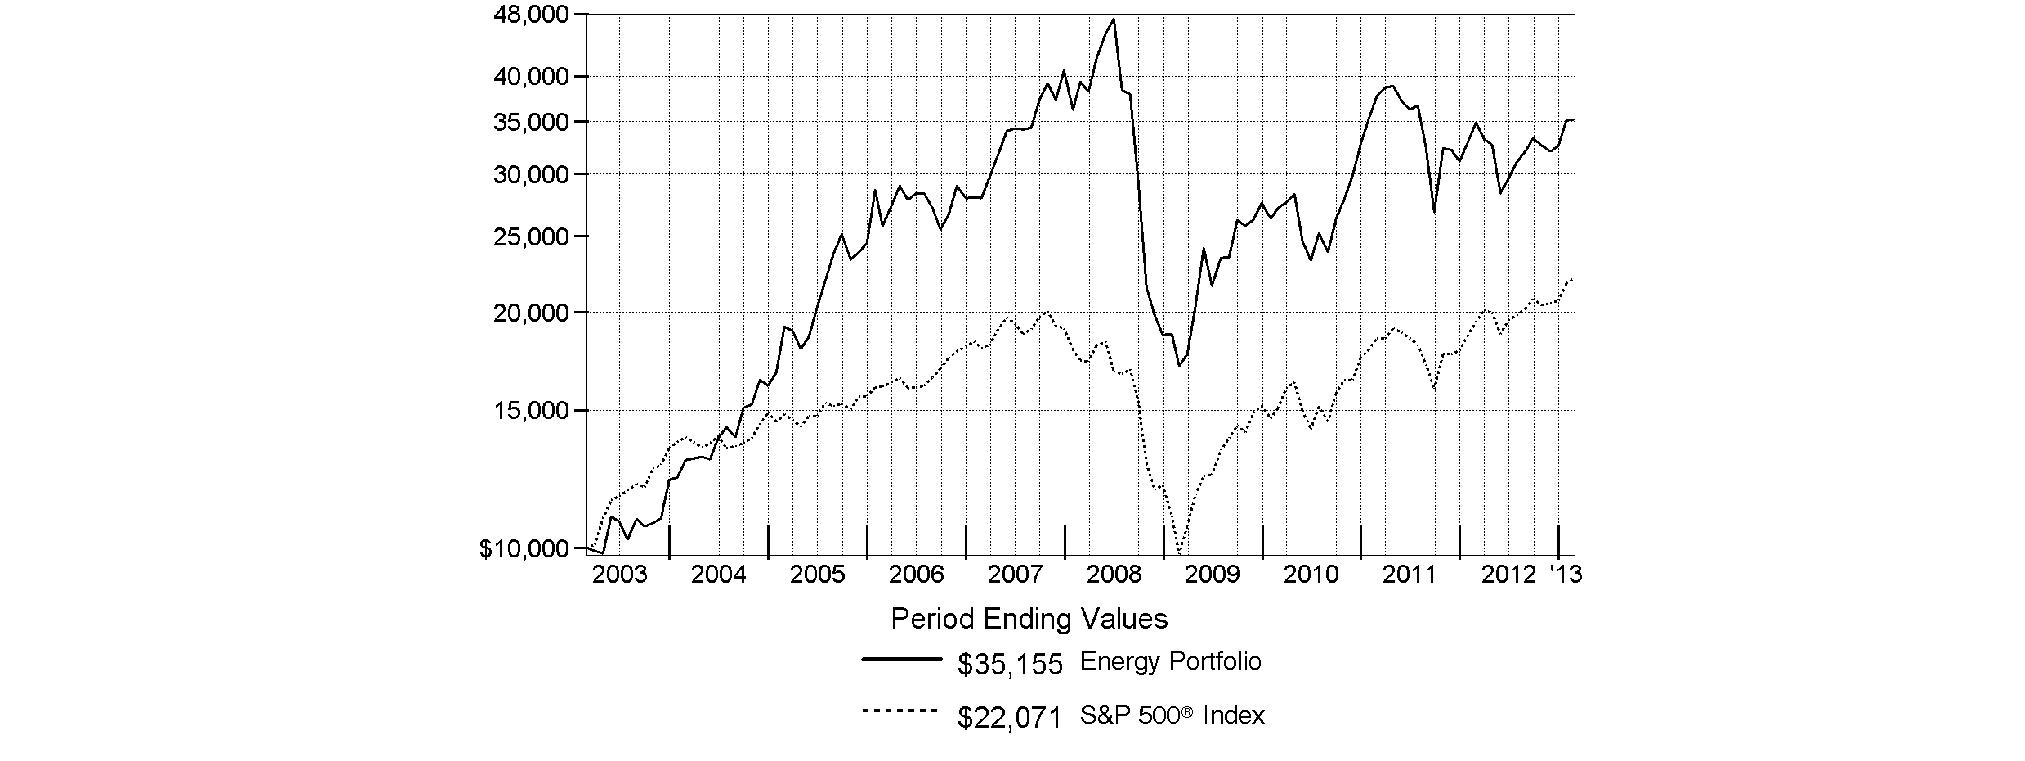
Annual Report
Energy Portfolio
Management's Discussion of Fund Performance
Market Recap: U.S. stocks posted solid gains for the year ending February 28, 2013, sparked by a late-period rally that pushed major equity benchmarks to multiyear highs. Improvement in the global economy and more monetary stimulus from the U.S. Federal Reserve kept markets on the upswing for much of the year, shrugging off an early decline brought on by debt woes in Europe, and another dip later in the period amid Congressional gridlock on the federal budget. Renewed optimism over employment, the housing market, corporate earnings and record dividends made stocks a favorite with investors during the 12 months, which helped push the broad-based S&P 500® Index across the milestone 1,500 mark at the end of January. The S&P 500® finished the period up 13.46%. Seven of the 10 major market sectors tracked by MSCI U.S. IMI 25-50 classifications produced double-digit gains, led by health care and financials, while information technology, energy and materials trailed the broad equity market with only modest advances.
Comments from John Dowd, Portfolio Manager of Energy Portfolio: For the year, the fund returned 1.00%, underperforming the S&P 500® and the 3.63% return of the MSCI® U.S. IMI Energy 25-50 Index. Concern about global economic growth turned investors away from cyclically oriented energy stocks in the period. However, supply and demand fundamentals drove performance within the sector's industries. Relative to the MSCI sector benchmark, the fund was hurt by poor stock picking in the integrated oil/gas and equipment/services industries. In the former category, underweighting Exxon Mobil detracted, as its stock rose on the strength of its refining business. A stake in integrated oil/gas firm Occidental Petroleum also was detrimental because its stock fell amid expensive new projects. Oil/gas producer SM Energy hurt, as the lingering glut of natural gas put pressure on margins, hurting earnings. I sold the stock from the fund by period end. Conversely, positioning in the strong-performing oil/gas refining and marketing segment helped, including an overweighting in refiner Tesoro, the fund's top relative contributor for the period. Tesoro's stock price more than doubled during the period, boosted by strong margins from the oversupply of U.S. crude oil, and good overall execution. I also owned some of the best stocks in the underperforming oil/gas exploration and production group, including Cabot Oil & Gas, where I correctly believed that its well-established position in shale drilling was starting to pay off. At the same time, I stayed away from benchmark component Devon Energy, which was hit by quarterly earnings misses.
The views expressed above reflect those of the portfolio manager(s) only through the end of the period as stated on the cover of this report and do not necessarily represent the views of Fidelity or any other person in the Fidelity organization. Any such views are subject to change at any time based upon market or other conditions and Fidelity disclaims any responsibility to update such views. These views may not be relied on as investment advice and, because investment decisions for a Fidelity fund are based on numerous factors, may not be relied on as an indication of trading intent on behalf of any Fidelity fund.
Annual Report
Energy Portfolio
Investment Changes (Unaudited)
|
Top Ten Stocks as of February 28, 2013 |
||
|
|
% of fund's |
% of fund's net assets |
|
Exxon Mobil Corp. |
9.8 |
10.1 |
|
Chevron Corp. |
9.0 |
11.8 |
|
Occidental Petroleum Corp. |
5.8 |
7.0 |
|
Hess Corp. |
4.3 |
3.3 |
|
National Oilwell Varco, Inc. |
4.2 |
5.1 |
|
Anadarko Petroleum Corp. |
3.6 |
1.6 |
|
Halliburton Co. |
3.6 |
1.3 |
|
Concho Resources, Inc. |
3.3 |
1.0 |
|
Murphy Oil Corp. |
3.3 |
0.9 |
|
Pioneer Natural Resources Co. |
3.2 |
2.1 |
|
|
50.1 |
|
|
Top Industries (% of fund's net assets) |
|||
|
As of February 28, 2013 |
|||
 |
Oil, Gas & Consumable Fuels |
74.5% |
|
 |
Energy Equipment & Services |
22.9% |
|
 |
Chemicals |
1.4% |
|
 |
Metals & Mining |
0.3% |
|
 |
Hotels, Restaurants & Leisure ** |
0.0% |
|
 |
All Others* |
0.9% |
|

|
As of August 31, 2012 |
|||
|
Oil, Gas & Consumable Fuels |
73.7% |
|
|
Energy Equipment & Services |
23.2% |
|
|
Chemicals |
0.6% |
|
|
Construction & Engineering |
0.5% |
|
|
Hotels, Restaurants & Leisure ** |
0.0% |
|
|
All Others* |
2.0% |
|

|
* Includes short-term investments and net other assets. |
|
** Amount represents less than 0.1% |
Annual Report
Energy Portfolio
Investments February 28, 2013
Showing Percentage of Net Assets
|
Common Stocks - 99.1% |
|||
|
Shares |
Value |
||
|
CHEMICALS - 1.4% |
|||
|
Commodity Chemicals - 1.4% |
|||
|
LyondellBasell Industries NV Class A (d) |
437,741 |
$ 25,660,377 |
|
|
Westlake Chemical Corp. |
61,600 |
5,311,152 |
|
|
|
30,971,529 |
||
|
ENERGY EQUIPMENT & SERVICES - 22.9% |
|||
|
Oil & Gas Drilling - 6.9% |
|||
|
Discovery Offshore S.A. (a)(e) |
2,188,208 |
4,936,209 |
|
|
Ensco PLC Class A |
1,056,773 |
63,554,328 |
|
|
Helmerich & Payne, Inc. |
320,205 |
21,216,783 |
|
|
Noble Corp. |
1,281,896 |
45,917,515 |
|
|
Northern Offshore Ltd. |
1,076,682 |
1,969,300 |
|
|
Tuscany International Drilling, Inc. (a) |
3,442,200 |
667,578 |
|
|
Unit Corp. (a) |
141,017 |
6,413,453 |
|
|
Vantage Drilling Co. (a) |
1,507,600 |
2,457,388 |
|
|
|
147,132,554 |
||
|
Oil & Gas Equipment & Services - 16.0% |
|||
|
Anton Oilfield Services Group |
1,334,000 |
758,541 |
|
|
C&J Energy Services, Inc. (a) |
48,100 |
1,164,020 |
|
|
Cameron International Corp. (a) |
502,215 |
32,001,140 |
|
|
Core Laboratories NV |
113,230 |
15,529,495 |
|
|
FMC Technologies, Inc. (a) |
186,700 |
9,691,597 |
|
|
Forum Energy Technologies, Inc. |
289,121 |
7,713,748 |
|
|
Geospace Technologies Corp. (a) |
25,800 |
2,510,856 |
|
|
Halliburton Co. |
1,823,355 |
75,687,466 |
|
|
McDermott International, Inc. (a) |
505,700 |
6,432,504 |
|
|
National Oilwell Varco, Inc. |
1,300,684 |
88,615,601 |
|
|
Oceaneering International, Inc. |
38,000 |
2,416,420 |
|
|
Oil States International, Inc. (a) |
250,121 |
19,046,714 |
|
|
Schlumberger Ltd. |
811,694 |
63,190,378 |
|
|
Superior Energy Services, Inc. (a) |
273,876 |
7,244,020 |
|
|
Total Energy Services, Inc. |
173,000 |
2,382,158 |
|
|
Weatherford International Ltd. (a) |
416,573 |
4,948,887 |
|
|
|
339,333,545 |
||
|
TOTAL ENERGY EQUIPMENT & SERVICES |
486,466,099 |
||
|
HOTELS, RESTAURANTS & LEISURE - 0.0% |
|||
|
Casinos & Gaming - 0.0% |
|||
|
Icahn Enterprises LP rights |
215,902 |
2 |
|
|
METALS & MINING - 0.3% |
|||
|
Diversified Metals & Mining - 0.3% |
|||
|
SunCoke Energy, Inc. (a) |
340,346 |
5,612,306 |
|
|
OIL, GAS & CONSUMABLE FUELS - 74.5% |
|||
|
Coal & Consumable Fuels - 1.0% |
|||
|
Alpha Natural Resources, Inc. (a) |
312,500 |
2,493,750 |
|
|
Peabody Energy Corp. |
847,439 |
18,270,785 |
|
|
|
20,764,535 |
||
|
Integrated Oil & Gas - 35.2% |
|||
|
Chevron Corp. |
1,637,376 |
191,818,598 |
|
|
|
|||
|
Shares |
Value |
||
|
Exxon Mobil Corp. |
2,319,502 |
$ 207,711,403 |
|
|
Hess Corp. |
1,362,855 |
90,629,858 |
|
|
InterOil Corp. (a)(d) |
182,600 |
12,740,002 |
|
|
Murphy Oil Corp. |
1,145,168 |
69,717,828 |
|
|
Occidental Petroleum Corp. |
1,506,606 |
124,038,872 |
|
|
Suncor Energy, Inc. |
1,701,900 |
51,572,727 |
|
|
|
748,229,288 |
||
|
Oil & Gas Exploration & Production - 27.0% |
|||
|
Anadarko Petroleum Corp. |
968,248 |
77,053,176 |
|
|
Apache Corp. |
41,959 |
3,116,295 |
|
|
Bankers Petroleum Ltd. (a) |
1,813,700 |
5,399,330 |
|
|
BPZ Energy, Inc. (a) |
807,923 |
1,987,491 |
|
|
Cabot Oil & Gas Corp. |
669,502 |
41,489,039 |
|
|
Cobalt International Energy, Inc. (a) |
848,343 |
20,928,622 |
|
|
Concho Resources, Inc. (a) |
785,675 |
70,679,323 |
|
|
Continental Resources, Inc. (a) |
161,200 |
14,185,600 |
|
|
Energy XXI (Bermuda) Ltd. |
63,200 |
1,878,936 |
|
|
EOG Resources, Inc. |
527,629 |
66,328,242 |
|
|
EQT Corp. |
847,633 |
53,477,166 |
|
|
EV Energy Partners LP |
185,535 |
10,391,815 |
|
|
Gulfport Energy Corp. (a) |
159,854 |
6,546,021 |
|
|
Halcon Resources Corp. (f) |
1,010,000 |
7,171,000 |
|
|
Kodiak Oil & Gas Corp. (a) |
480,700 |
4,278,230 |
|
|
Marathon Oil Corp. |
928,497 |
31,104,650 |
|
|
Noble Energy, Inc. |
456,044 |
50,543,357 |
|
|
Northern Oil & Gas, Inc. (a) |
679,101 |
9,310,475 |
|
|
Oasis Petroleum, Inc. (a) |
589,552 |
21,636,558 |
|
|
Painted Pony Petroleum Ltd. Class A (a) |
469,400 |
4,483,481 |
|
|
Pioneer Natural Resources Co. |
542,502 |
68,252,177 |
|
|
Rosetta Resources, Inc. (a) |
56,405 |
2,745,795 |
|
|
TAG Oil Ltd. (a) |
251,575 |
870,907 |
|
|
|
573,857,686 |
||
|
Oil & Gas Refining & Marketing - 7.3% |
|||
|
Calumet Specialty Products Partners LP |
335,299 |
12,862,070 |
|
|
Marathon Petroleum Corp. |
618,806 |
51,286,641 |
|
|
Northern Tier Energy LP Class A |
284,305 |
8,230,630 |
|
|
PBF Energy, Inc. Class A (d) |
138,500 |
5,782,375 |
|
|
Phillips 66 |
726,900 |
45,765,624 |
|
|
Tesoro Corp. |
197,193 |
11,090,134 |
|
|
Valero Energy Corp. |
439,721 |
20,046,880 |
|
|
|
155,064,354 |
||
|
Oil & Gas Storage & Transport - 4.0% |
|||
|
Atlas Energy LP |
98,278 |
4,101,141 |
|
|
Atlas Pipeline Partners LP |
335,458 |
11,083,532 |
|
|
Magellan Midstream Partners LP |
222,640 |
11,167,622 |
|
|
Markwest Energy Partners LP |
110,300 |
6,305,851 |
|
|
Common Stocks - continued |
|||
|
Shares |
Value |
||
|
OIL, GAS & CONSUMABLE FUELS - CONTINUED |
|||
|
Oil & Gas Storage & Transport - continued |
|||
|
Tesoro Logistics LP |
326,322 |
$ 16,283,468 |
|
|
The Williams Companies, Inc. |
1,068,959 |
37,103,567 |
|
|
|
86,045,181 |
||
|
TOTAL OIL, GAS & CONSUMABLE FUELS |
1,583,961,044 |
||
|
TOTAL COMMON STOCKS (Cost $1,626,812,741) |
|
||
|
Money Market Funds - 2.4% |
|||
|
|
|
|
|
|
Fidelity Cash Central Fund, 0.16% (b) |
16,086,340 |
16,086,340 |
|
|
Fidelity Securities Lending Cash Central Fund, 0.16% (b)(c) |
34,738,500 |
34,738,500 |
|
|
TOTAL MONEY MARKET FUNDS (Cost $50,824,840) |
|
||
|
TOTAL INVESTMENT PORTFOLIO - 101.5% (Cost $1,677,637,581) |
2,157,835,820 |
|
NET OTHER ASSETS (LIABILITIES) - (1.5)% |
(30,844,177) |
||
|
NET ASSETS - 100% |
$ 2,126,991,643 |
||
|
Legend |
|
(a) Non-income producing |
|
(b) Affiliated fund that is generally available only to investment companies and other accounts managed by Fidelity Investments. The rate quoted is the annualized seven-day yield of the fund at period end. A complete unaudited listing of the fund's holdings as of its most recent quarter end is available upon request. In addition, each Fidelity Central Fund's financial statements, which are not covered by the Fund's Report of Independent Registered Public Accounting Firm, are available on the SEC's website or upon request. |
|
(c) Investment made with cash collateral received from securities on loan. |
|
(d) Security or a portion of the security is on loan at period end. |
|
(e) Security exempt from registration under Rule 144A of the Securities Act of 1933. These securities may be resold in transactions exempt from registration, normally to qualified institutional buyers. At the end of the period, the value of these securities amounted to $4,936,209 or 0.2% of net assets. |
|
(f) Restricted securities - Investment in securities not registered under the Securities Act of 1933 (excluding 144A issues). At the end of the period, the value of restricted securities (excluding 144A issues) amounted to $7,171,000 or 0.3% of net assets. |
|
Additional information on each restricted holding is as follows: |
|
Security |
Acquisition Date |
Acquisition Cost |
|
Halcon Resources Corp. |
3/1/12 |
$ 9,090,000 |
|
Affiliated Central Funds |
|
Information regarding fiscal year to date income earned by the Fund from investments in Fidelity Central Funds is as follows: |
|
Fund |
Income earned |
|
Fidelity Cash Central Fund |
$ 37,743 |
|
Fidelity Securities Lending Cash Central Fund |
458,077 |
|
Total |
$ 495,820 |
|
Other Information |
|
The following is a summary of the inputs used, as of February 28, 2013, involving the Fund's assets and liabilities carried at fair value. The inputs or methodology used for valuing securities may not be an indication of the risk associated with investing in those securities. For more information on valuation inputs, and their aggregation into the levels used in the table below, please refer to the Investment Valuation section in the accompanying Notes to Financial Statements. |
|
Valuation Inputs at Reporting Date: |
||||
|
Description |
Total |
Level 1 |
Level 2 |
Level 3 |
|
Investments in Securities: |
||||
|
Common Stocks |
$ 2,107,010,980 |
$ 2,107,010,978 |
$ - |
$ 2 |
|
Money Market Funds |
50,824,840 |
50,824,840 |
- |
- |
|
Total Investments in Securities: |
$ 2,157,835,820 |
$ 2,157,835,818 |
$ - |
$ 2 |
|
Distribution of investments by country or territory of incorporation, as a percentage of total net assets, is as follows. (Unaudited) |
|
United States of America |
85.1% |
|
Canada |
3.8% |
|
United Kingdom |
3.0% |
|
Curacao |
3.0% |
|
Switzerland |
2.4% |
|
Netherlands |
1.9% |
|
Others (Individually Less Than 1%) |
0.8% |
|
|
100.0% |
See accompanying notes which are an integral part of the financial statements.
Annual Report
Energy Portfolio
Financial Statements
Statement of Assets and Liabilities
|
|
February 28, 2013 |
|
|
|
|
|
|
Assets |
|
|
|
Investment in securities, at value (including securities loaned of $33,481,772) - See accompanying schedule: Unaffiliated issuers (cost $1,626,812,741) |
$ 2,107,010,980 |
|
|
Fidelity Central Funds (cost $50,824,840) |
50,824,840 |
|
|
Total Investments (cost $1,677,637,581) |
|
$ 2,157,835,820 |
|
Receivable for investments sold |
|
1,550,503 |
|
Receivable for fund shares sold |
|
1,515,821 |
|
Dividends receivable |
|
4,731,344 |
|
Distributions receivable from Fidelity Central Funds |
|
40,748 |
|
Prepaid expenses |
|
2,782 |
|
Receivable from investment adviser for expense reductions |
|
2,333 |
|
Other receivables |
|
71,929 |
|
Total assets |
|
2,165,751,280 |
|
|
|
|
|
Liabilities |
|
|
|
Payable for investments purchased |
$ 426,693 |
|
|
Payable for fund shares redeemed |
2,111,215 |
|
|
Accrued management fee |
996,944 |
|
|
Other affiliated payables |
436,188 |
|
|
Other payables and accrued expenses |
50,097 |
|
|
Collateral on securities loaned, at value |
34,738,500 |
|
|
Total liabilities |
|
38,759,637 |
|
|
|
|
|
Net Assets |
|
$ 2,126,991,643 |
|
Net Assets consist of: |
|
|
|
Paid in capital |
|
$ 1,648,145,534 |
|
Distributions in excess of net investment income |
|
(1,146,415) |
|
Accumulated undistributed net realized gain (loss) on investments and foreign currency transactions |
|
(204,412) |
|
Net unrealized appreciation (depreciation) on investments and assets and liabilities in foreign currencies |
|
480,196,936 |
|
Net Assets, for 38,807,744 shares outstanding |
|
$ 2,126,991,643 |
|
Net Asset Value, offering price and redemption price per share ($2,126,991,643 ÷ 38,807,744 shares) |
|
$ 54.81 |
Statement of Operations
|
|
Year ended February 28, 2013 |
|
|
|
|
|
|
Investment Income |
|
|
|
Dividends |
|
$ 38,243,130 |
|
Interest |
|
172 |
|
Income from Fidelity Central Funds |
|
495,820 |
|
Total income |
|
38,739,122 |
|
|
|
|
|
Expenses |
|
|
|
Management fee |
$ 11,654,820 |
|
|
Transfer agent fees |
4,751,016 |
|
|
Accounting and security lending fees |
636,378 |
|
|
Custodian fees and expenses |
46,264 |
|
|
Independent trustees' compensation |
13,942 |
|
|
Registration fees |
63,750 |
|
|
Audit |
42,418 |
|
|
Legal |
8,054 |
|
|
Interest |
1,533 |
|
|
Miscellaneous |
23,699 |
|
|
Total expenses before reductions |
17,241,874 |
|
|
Expense reductions |
(263,981) |
16,977,893 |
|
Net investment income (loss) |
|
21,761,229 |
|
Realized and Unrealized Gain (Loss) Net realized gain (loss) on: |
|
|
|
Investment securities: |
|
|
|
Unaffiliated issuers |
13,655,110 |
|
|
Foreign currency transactions |
(21,715) |
|
|
Total net realized gain (loss) |
|
13,633,395 |
|
Change in net unrealized appreciation (depreciation) on: Investment securities |
(47,364,523) |
|
|
Assets and liabilities in foreign currencies |
(7,985) |
|
|
Total change in net unrealized appreciation (depreciation) |
|
(47,372,508) |
|
Net gain (loss) |
|
(33,739,113) |
|
Net increase (decrease) in net assets resulting from operations |
|
$ (11,977,884) |
See accompanying notes which are an integral part of the financial statements.
Annual Report
Statement of Changes in Net Assets
|
|
Year ended |
Year ended |
|
Increase (Decrease) in Net Assets |
|
|
|
Operations |
|
|
|
Net investment income (loss) |
$ 21,761,229 |
$ 19,550,432 |
|
Net realized gain (loss) |
13,633,395 |
168,510,187 |
|
Change in net unrealized appreciation (depreciation) |
(47,372,508) |
(444,437,546) |
|
Net increase (decrease) in net assets resulting from operations |
(11,977,884) |
(256,376,927) |
|
Distributions to shareholders from net investment income |
(18,731,365) |
(18,440,144) |
|
Distributions to shareholders from net realized gain |
(14,385,264) |
(1,534,468) |
|
Total distributions |
(33,116,629) |
(19,974,612) |
|
Share transactions |
409,900,203 |
831,405,883 |
|
Reinvestment of distributions |
31,802,132 |
19,134,753 |
|
Cost of shares redeemed |
(774,101,022) |
(1,102,939,381) |
|
Net increase (decrease) in net assets resulting from share transactions |
(332,398,687) |
(252,398,745) |
|
Redemption fees |
36,846 |
175,722 |
|
Total increase (decrease) in net assets |
(377,456,354) |
(528,574,562) |
|
|
|
|
|
Net Assets |
|
|
|
Beginning of period |
2,504,447,997 |
3,033,022,559 |
|
End of period (including distributions in excess of net investment income of $1,146,415 and distributions in excess of net investment income of $284, respectively) |
$ 2,126,991,643 |
$ 2,504,447,997 |
|
Other Information Shares |
|
|
|
Sold |
8,050,534 |
15,055,782 |
|
Issued in reinvestment of distributions |
620,890 |
366,408 |
|
Redeemed |
(15,279,430) |
(20,368,627) |
|
Net increase (decrease) |
(6,608,006) |
(4,946,437) |
Financial Highlights
|
Years ended February 28, |
2013 |
2012 G |
2011 |
2010 |
2009 |
|
Selected Per-Share Data |
|
|
|
|
|
|
Net asset value, beginning of period |
$ 55.14 |
$ 60.22 |
$ 43.55 |
$ 27.43 |
$ 64.48 |
|
Income from Investment Operations |
|
|
|
|
|
|
Net investment income (loss) C |
.53 |
.41 |
.29 |
.07 |
.02 |
|
Net realized and unrealized gain (loss) |
(.04) |
(5.06) |
16.63 |
16.14 |
(35.81) |
|
Total from investment operations |
.49 |
(4.65) |
16.92 |
16.21 |
(35.79) |
|
Distributions from net investment income |
(.47) |
(.40) |
(.25) |
(.09) |
(.01) |
|
Distributions from net realized gain |
(.35) |
(.03) |
- |
- |
(1.26) |
|
Total distributions |
(.82) |
(.43) |
(.25) |
(.09) |
(1.27) |
|
Redemption fees added to paid in capital C |
- B |
- B |
- B |
- B |
.01 |
|
Net asset value, end of period |
$ 54.81 |
$ 55.14 |
$ 60.22 |
$ 43.55 |
$ 27.43 |
|
Total Return A |
1.00% |
(7.68)% |
38.95% |
59.11% |
(56.63)% |
|
Ratios to Average Net Assets D, F |
|
|
|
|
|
|
Expenses before reductions |
.82% |
.83% |
.85% |
.90% |
.83% |
|
Expenses net of fee waivers, if any |
.82% |
.83% |
.85% |
.90% |
.83% |
|
Expenses net of all reductions |
.81% |
.82% |
.85% |
.90% |
.83% |
|
Net investment income (loss) |
1.04% |
.77% |
.64% |
.18% |
.03% |
|
Supplemental Data |
|
|
|
|
|
|
Net assets, end of period (000 omitted) |
$ 2,126,992 |
$ 2,504,448 |
$ 3,033,023 |
$ 2,134,018 |
$ 1,337,382 |
|
Portfolio turnover rate E |
80% |
90% |
107% |
97% |
148% |
A Total returns would have been lower if certain expenses had not been reduced during the applicable periods shown.
B Amount represents less than $.01 per share.
C Calculated based on average shares outstanding during the period.
D Fees and expenses of any underlying Fidelity Central Funds are not included in the Fund's expense ratio. The Fund indirectly bears its proportionate share of the expenses of any underlying Fidelity Central Funds.
E Amount does not include the portfolio activity of any underlying Fidelity Central Funds.
F Expense ratios reflect operating expenses of the Fund. Expenses before reductions do not reflect amounts reimbursed by the investment adviser or reductions from brokerage service arrangements or reductions from other expense offset arrangements and do not represent the amount paid by the Fund during periods when reimbursements or reductions occur. Expenses net of fee waivers reflect expenses after reimbursement by the investment adviser but prior to reductions from brokerage service arrangements or other expense offset arrangements. Expenses net of all reductions represent the net expenses paid by the Fund.
G For the year ended February 29.
See accompanying notes which are an integral part of the financial statements.
Annual Report
Energy Service Portfolio
Performance: The Bottom Line
Average annual total return reflects the change in the value of an investment, assuming reinvestment of the fund's distributions from dividend income and capital gains (the profits earned upon the sale of securities that have grown in value, if any) and assuming a constant rate of performance each year. The $10,000 table and the fund's returns do not reflect the deduction of taxes that a shareholder would pay on fund distributions or the redemption of fund shares. During periods of reimbursement by Fidelity, a fund's total return will be greater than it would be had the reimbursement not occurred. How a fund did yesterday is no guarantee of how it will do tomorrow.
Average Annual Total Returns
|
Periods ended February 28, 2013 |
Past 1 |
Past 5 |
Past 10 |
|
Energy Service Portfolio |
1.37% |
-3.58% |
10.97% |
$10,000 Over 10 Years
Let's say hypothetically that $10,000 was invested in Energy Service Portfolio on February 28, 2003. The chart shows how the value of your investment would have changed, and also shows how the S&P 500 Index performed over the same period.

Annual Report
Energy Service Portfolio
Management's Discussion of Fund Performance
Market Recap: U.S. stocks posted solid gains for the year ending February 28, 2013, sparked by a late-period rally that pushed major equity benchmarks to multiyear highs. Improvement in the global economy and more monetary stimulus from the U.S. Federal Reserve kept markets on the upswing for much of the year, shrugging off an early decline brought on by debt woes in Europe, and another dip later in the period amid Congressional gridlock on the federal budget. Renewed optimism over employment, the housing market, corporate earnings and record dividends made stocks a favorite with investors during the 12 months, which helped push the broad-based S&P 500® Index across the milestone 1,500 mark at the end of January. The S&P 500® finished the period up 13.46%. Seven of the 10 major market sectors tracked by MSCI U.S. IMI 25-50 classifications produced double-digit gains, led by health care and financials, while information technology, energy and materials trailed the broad equity market with only modest advances.
Comments from Jonathan Kasen, Portfolio Manager of Energy Service Portfolio: For the year, the fund gained 1.37%, underperforming the S&P 500® but outpacing the -0.04% return of the MSCI® U.S. IMI Energy Equipment & Services 25-50 Index. Volatile energy prices hurt energy service stocks during the period. Given the price swings, stock selection and good investment timing were key. The fund was helped by an overweighting in Cameron International, which makes oil and gas pressure-control equipment for the offshore drilling market. Cameron's stock price popped in July on news of record revenues. I bought more of the stock in late summer and the fund benefited from its further gains. I also had good timing with Key Energy Services, initiating a position near its November bottom and riding it up through period end. A sizable stake in large-cap service name Halliburton contributed, as did an average cash stake of about 3% during the down market early in the year. Conversely, an underweighting in oil/gas driller Helmerich & Payne hurt, as it bucked the trend of weakness among North American land drillers. I believed H&P's profit margins would decline in the second half of the year, so I sold the stock in January. Instead, the firm cut costs and expanded margins, and the fund missed out. Investments in a collection of Canadian drilling companies detracted, including Tuscany International Drilling, which was hurt by weak oil prices. I halved my stake in the firm by period end. In the offshore space, subsea equipment provider National Oilwell Varco proved detrimental, as the market became pessimistic about the sustainability of high order levels on deepwater drillship equipment.
The views expressed above reflect those of the portfolio manager(s) only through the end of the period as stated on the cover of this report and do not necessarily represent the views of Fidelity or any other person in the Fidelity organization. Any such views are subject to change at any time based upon market or other conditions and Fidelity disclaims any responsibility to update such views. These views may not be relied on as investment advice and, because investment decisions for a Fidelity fund are based on numerous factors, may not be relied on as an indication of trading intent on behalf of any Fidelity fund.
Annual Report
Energy Service Portfolio
Investment Changes (Unaudited)
|
Top Ten Stocks as of February 28, 2013 |
||
|
|
% of fund's |
% of fund's net assets |
|
Halliburton Co. |
16.2 |
10.0 |
|
Schlumberger Ltd. |
14.6 |
17.7 |
|
National Oilwell Varco, Inc. |
9.8 |
12.2 |
|
Cameron International Corp. |
8.1 |
9.5 |
|
Noble Corp. |
4.7 |
4.7 |
|
Ensco PLC Class A |
4.6 |
3.1 |
|
Core Laboratories NV |
3.3 |
2.4 |
|
FMC Technologies, Inc. |
3.1 |
4.8 |
|
Oceaneering International, Inc. |
2.9 |
3.5 |
|
Weatherford International Ltd. |
2.7 |
2.4 |
|
|
70.0 |
|
|
Top Industries (% of fund's net assets) |
|||
|
As of February 28, 2013 |
|||
|
Energy Equipment & Services |
95.5% |
|
 |
Machinery |
0.6% |
|
|
All Others* |
3.9% |
|

|
As of August 31, 2012 |
|||
|
Energy Equipment & Services |
92.4% |
|
 |
Machinery |
1.1% |
|
 |
Construction & Engineering |
0.5% |
|
|
All Others* |
6.0% |
|

|
* Includes short-term investments and net other assets. |
Annual Report
Energy Service Portfolio
Investments February 28, 2013
Showing Percentage of Net Assets
|
Common Stocks - 96.1% |
|||
|
Shares |
Value |
||
|
ENERGY EQUIPMENT & SERVICES - 95.5% |
|||
|
Oil & Gas Drilling - 15.7% |
|||
|
Discovery Offshore S.A. (a)(e) |
578,100 |
$ 1,304,091 |
|
|
Ensco PLC Class A |
954,000 |
57,373,560 |
|
|
Hercules Offshore, Inc. (a) |
669,600 |
4,539,888 |
|
|
Nabors Industries Ltd. |
443,300 |
7,429,708 |
|
|
Noble Corp. |
1,633,435 |
58,509,642 |
|
|
Ocean Rig UDW, Inc. (United States) (a) |
1,039,613 |
15,147,161 |
|
|
Pacific Drilling SA (a) |
377,200 |
3,526,820 |
|
|
Parker Drilling Co. (a) |
200,600 |
954,856 |
|
|
Patterson-UTI Energy, Inc. |
125,900 |
2,938,506 |
|
|
Pioneer Energy Services Corp. (a) |
122,500 |
1,069,425 |
|
|
Rowan Companies PLC (a) |
750,300 |
25,952,877 |
|
|
Sevan Drilling ASA (a) |
734,300 |
507,808 |
|
|
Tuscany International Drilling, Inc. (a) |
4,164,700 |
807,699 |
|
|
Unit Corp. (a) |
177,600 |
8,077,248 |
|
|
Vantage Drilling Co. (a) |
3,853,200 |
6,280,716 |
|
|
|
194,420,005 |
||
|
Oil & Gas Equipment & Services - 79.8% |
|||
|
Anton Oilfield Services Group |
2,026,000 |
1,152,027 |
|
|
Baker Hughes, Inc. |
507,322 |
22,738,172 |
|
|
C&J Energy Services, Inc. (a)(d) |
191,100 |
4,624,620 |
|
|
Cameron International Corp. (a) |
1,563,188 |
99,606,339 |
|
|
Core Laboratories NV |
295,300 |
40,500,395 |
|
|
Dresser-Rand Group, Inc. (a) |
499,400 |
30,793,004 |
|
|
Dril-Quip, Inc. (a) |
370,100 |
30,433,323 |
|
|
Exterran Holdings, Inc. (a) |
205,300 |
5,179,719 |
|
|
FMC Technologies, Inc. (a) |
731,562 |
37,975,383 |
|
|
Forum Energy Technologies, Inc. |
400,500 |
10,685,340 |
|
|
Geospace Technologies Corp. (a) |
56,800 |
5,527,776 |
|
|
Global Geophysical Services, Inc. (a) |
692,713 |
1,620,948 |
|
|
Gulf Island Fabrication, Inc. |
60,600 |
1,442,886 |
|
|
Halliburton Co. |
4,818,599 |
200,020,047 |
|
|
Helix Energy Solutions Group, Inc. (a) |
385,100 |
9,015,191 |
|
|
Hornbeck Offshore Services, Inc. (a) |
137,900 |
5,860,750 |
|
|
ION Geophysical Corp. (a) |
451,955 |
3,000,981 |
|
|
Key Energy Services, Inc. (a) |
478,600 |
4,106,388 |
|
|
Lufkin Industries, Inc. |
203,200 |
13,163,296 |
|
|
McDermott International, Inc. (a) |
2,196,100 |
27,934,392 |
|
|
National Oilwell Varco, Inc. |
1,771,762 |
120,710,145 |
|
|
Oceaneering International, Inc. |
558,000 |
35,483,220 |
|
|
Oil States International, Inc. (a) |
414,300 |
31,548,945 |
|
|
Petrofac Ltd. |
282,000 |
6,220,330 |
|
|
Schlumberger Ltd. |
2,322,011 |
180,768,556 |
|
|
Superior Energy Services, Inc. (a) |
472,800 |
12,505,560 |
|
|
|
|||
|
Shares |
Value |
||
|
Tesco Corp. (a) |
748,785 |
$ 9,517,057 |
|
|
Weatherford International Ltd. (a) |
2,861,371 |
33,993,087 |
|
|
|
986,127,877 |
||
|
TOTAL ENERGY EQUIPMENT & SERVICES |
1,180,547,882 |
||
|
MACHINERY - 0.6% |
|||
|
Industrial Machinery - 0.6% |
|||
|
Rotork PLC |
163,600 |
7,078,361 |
|
|
TOTAL COMMON STOCKS (Cost $909,198,521) |
|
||
|
Money Market Funds - 9.2% |
|||
|
|
|
|
|
|
Fidelity Cash Central Fund, 0.16% (b) |
111,833,186 |
111,833,186 |
|
|
Fidelity Securities Lending Cash Central Fund, 0.16% (b)(c) |
2,320,725 |
2,320,725 |
|
|
TOTAL MONEY MARKET FUNDS (Cost $114,153,911) |
|
||
|
TOTAL INVESTMENT PORTFOLIO - 105.3% (Cost $1,023,352,432) |
1,301,780,154 |
|
NET OTHER ASSETS (LIABILITIES) - (5.3)% |
(65,377,584) |
||
|
NET ASSETS - 100% |
$ 1,236,402,570 |
||
|
Legend |
|
(a) Non-income producing |
|
(b) Affiliated fund that is generally available only to investment companies and other accounts managed by Fidelity Investments. The rate quoted is the annualized seven-day yield of the fund at period end. A complete unaudited listing of the fund's holdings as of its most recent quarter end is available upon request. In addition, each Fidelity Central Fund's financial statements, which are not covered by the Fund's Report of Independent Registered Public Accounting Firm, are available on the SEC's website or upon request. |
|
(c) Investment made with cash collateral received from securities on loan. |
|
(d) Security or a portion of the security is on loan at period end. |
|
(e) Security exempt from registration under Rule 144A of the Securities Act of 1933. These securities may be resold in transactions exempt from registration, normally to qualified institutional buyers. At the end of the period, the value of these securities amounted to $1,304,091 or 0.1% of net assets. |
|
Affiliated Central Funds |
|
Information regarding fiscal year to date income earned by the Fund from investments in Fidelity Central Funds is as follows: |
|
Fund |
Income earned |
|
Fidelity Cash Central Fund |
$ 60,889 |
|
Fidelity Securities Lending Cash Central Fund |
31,600 |
|
Total |
$ 92,489 |
|
Other Information |
|
All investments are categorized as Level 1 under the Fair Value Hierarchy. The inputs or methodology used for valuing securities may not be an indication of the risk associated with investing in those securities. For more information on valuation inputs, please refer to the Investment Valuation section in the accompanying Notes to Financial Statements. |
|
Distribution of investments by country or territory of incorporation, as a percentage of total net assets, is as follows. (Unaudited) |
|
United States of America |
60.9% |
|
Curacao |
14.6% |
|
Switzerland |
7.4% |
|
United Kingdom |
7.3% |
|
Netherlands |
3.3% |
|
Panama |
2.3% |
|
Marshall Islands |
1.2% |
|
Others (Individually Less Than 1%) |
3.0% |
|
|
100.0% |
See accompanying notes which are an integral part of the financial statements.
Annual Report
Energy Service Portfolio
Financial Statements
Statement of Assets and Liabilities
|
|
February 28, 2013 |
|
|
|
|
|
|
Assets |
|
|
|
Investment in securities, at value (including securities loaned of $2,315,940) - See accompanying schedule: Unaffiliated issuers (cost $909,198,521) |
$ 1,187,626,243 |
|
|
Fidelity Central Funds (cost $114,153,911) |
114,153,911 |
|
|
Total Investments (cost $1,023,352,432) |
|
$ 1,301,780,154 |
|
Receivable for investments sold |
|
10,198,548 |
|
Receivable for fund shares sold |
|
2,170,022 |
|
Dividends receivable |
|
828,108 |
|
Distributions receivable from Fidelity Central Funds |
|
10,828 |
|
Prepaid expenses |
|
979 |
|
Receivable from investment adviser for expense reductions |
|
1,053 |
|
Other receivables |
|
50,065 |
|
Total assets |
|
1,315,039,757 |
|
|
|
|
|
Liabilities |
|
|
|
Payable for investments purchased |
$ 73,569,387 |
|
|
Payable for fund shares redeemed |
1,922,569 |
|
|
Accrued management fee |
561,025 |
|
|
Other affiliated payables |
227,935 |
|
|
Other payables and accrued expenses |
35,546 |
|
|
Collateral on securities loaned, at value |
2,320,725 |
|
|
Total liabilities |
|
78,637,187 |
|
|
|
|
|
Net Assets |
|
$ 1,236,402,570 |
|
Net Assets consist of: |
|
|
|
Paid in capital |
|
$ 1,013,688,451 |
|
Accumulated net investment loss |
|
(409,089) |
|
Accumulated undistributed net realized gain (loss) on investments and foreign currency transactions |
|
(55,303,939) |
|
Net unrealized appreciation (depreciation) on investments and assets and liabilities in foreign currencies |
|
278,427,147 |
|
Net Assets, for 16,705,981 shares outstanding |
|
$ 1,236,402,570 |
|
Net Asset Value, offering price and redemption price per share ($1,236,402,570 ÷ 16,705,981 shares) |
|
$ 74.01 |
Statement of Operations
|
|
Year ended February 28, 2013 |
|
|
|
|
|
|
Investment Income |
|
|
|
Dividends |
|
$ 9,032,076 |
|
Interest |
|
45 |
|
Income from Fidelity Central Funds |
|
92,489 |
|
Total income |
|
9,124,610 |
|
|
|
|
|
Expenses |
|
|
|
Management fee |
$ 6,245,160 |
|
|
Transfer agent fees |
2,484,597 |
|
|
Accounting and security lending fees |
367,424 |
|
|
Custodian fees and expenses |
22,718 |
|
|
Independent trustees' compensation |
7,490 |
|
|
Registration fees |
48,441 |
|
|
Audit |
40,577 |
|
|
Legal |
4,313 |
|
|
Interest |
239 |
|
|
Miscellaneous |
14,408 |
|
|
Total expenses before reductions |
9,235,367 |
|
|
Expense reductions |
(167,642) |
9,067,725 |
|
Net investment income (loss) |
|
56,885 |
|
Realized and Unrealized Gain (Loss) Net realized gain (loss) on: |
|
|
|
Investment securities: |
|
|
|
Unaffiliated issuers |
(10,185,066) |
|
|
Foreign currency transactions |
(12,191) |
|
|
Total net realized gain (loss) |
|
(10,197,257) |
|
Change in net unrealized appreciation (depreciation) on: Investment securities |
(8,430,069) |
|
|
Assets and liabilities in foreign currencies |
(575) |
|
|
Total change in net unrealized appreciation (depreciation) |
|
(8,430,644) |
|
Net gain (loss) |
|
(18,627,901) |
|
Net increase (decrease) in net assets resulting from operations |
|
$ (18,571,016) |
See accompanying notes which are an integral part of the financial statements.
Annual Report
Statement of Changes in Net Assets
|
|
Year ended |
Year ended |
|
Increase (Decrease) in Net Assets |
|
|
|
Operations |
|
|
|
Net investment income (loss) |
$ 56,885 |
$ (1,903,878) |
|
Net realized gain (loss) |
(10,197,257) |
154,277,931 |
|
Change in net unrealized appreciation (depreciation) |
(8,430,644) |
(472,064,401) |
|
Net increase (decrease) in net assets resulting from operations |
(18,571,016) |
(319,690,348) |
|
Share transactions |
458,926,393 |
683,109,205 |
|
Cost of shares redeemed |
(586,274,324) |
(1,022,036,053) |
|
Net increase (decrease) in net assets resulting from share transactions |
(127,347,931) |
(338,926,848) |
|
Redemption fees |
33,045 |
214,497 |
|
Total increase (decrease) in net assets |
(145,885,902) |
(658,402,699) |
|
|
|
|
|
Net Assets |
|
|
|
Beginning of period |
1,382,288,472 |
2,040,691,171 |
|
End of period (including accumulated net investment loss of $409,089 and accumulated net investment loss of $453,783, respectively) |
$ 1,236,402,570 |
$ 1,382,288,472 |
|
Other Information Shares |
|
|
|
Sold |
6,636,814 |
8,913,160 |
|
Redeemed |
(8,864,023) |
(13,741,994) |
|
Net increase (decrease) |
(2,227,209) |
(4,828,834) |
Financial Highlights
|
Years ended February 28, |
2013 |
2012 I |
2011 |
2010 |
2009 |
|
Selected Per-Share Data |
|
|
|
|
|
|
Net asset value, beginning of period |
$ 73.01 |
$ 85.88 |
$ 58.27 |
$ 33.87 |
$ 92.62 |
|
Income from Investment Operations |
|
|
|
|
|
|
Net investment income (loss) B |
- |
(.09) |
(.04) |
.02 E |
(.02) F |
|
Net realized and unrealized gain (loss) |
1.00 G |
(12.79) |
27.65 |
24.41 |
(54.75) |
|
Total from investment operations |
1.00 |
(12.88) |
27.61 |
24.43 |
(54.77) |
|
Distributions from net investment income |
- |
- |
- |
(.04) |
- |
|
Distributions from net realized gain |
- |
- |
- |
- |
(4.00) |
|
Total distributions |
- |
- |
- |
(.04) |
(4.00) |
|
Redemption fees added to paid in capital B |
- J |
.01 |
- J |
.01 |
.02 |
|
Net asset value, end of period |
$ 74.01 |
$ 73.01 |
$ 85.88 |
$ 58.27 |
$ 33.87 |
|
Total Return A |
1.37% |
(14.99)% |
47.38% |
72.15% |
(61.89)% |
|
Ratios to Average Net Assets C, H |
|
|
|
|
|
|
Expenses before reductions |
.82% |
.82% |
.85% |
.91% |
.82% |
|
Expenses net of fee waivers, if any |
.82% |
.82% |
.85% |
.91% |
.82% |
|
Expenses net of all reductions |
.81% |
.81% |
.85% |
.91% |
.82% |
|
Net investment income (loss) |
.01% |
(.12)% |
(.06)% |
.04% E |
(.03)% F |
|
Supplemental Data |
|
|
|
|
|
|
Net assets, end of period (000 omitted) |
$ 1,236,403 |
$ 1,382,288 |
$ 2,040,691 |
$ 1,282,428 |
$ 740,946 |
|
Portfolio turnover rate D |
49% |
74% |
85% |
84% |
82% |
A Total returns would have been lower if certain expenses had not been reduced during the applicable periods shown.
B Calculated based on average shares outstanding during the period.
C Fees and expenses of any underlying Fidelity Central Funds are not included in the Fund's expense ratio. The Fund indirectly bears its proportionate share of the expenses of any underlying Fidelity Central Funds.
D Amount does not include the portfolio activity of any underlying Fidelity Central Funds.
E Investment income per share reflects a large, non-recurring dividend which amounted to $.10 per share. Excluding this non-recurring dividend, the ratio of net investment income (loss) to average net assets would have been (.15)%.
F Investment income per share reflects a large, non-recurring dividend which amounted to $.07 per share. Excluding this non-recurring dividend, the ratio of net investment income (loss) to average net assets would have been (.11)%.
G The amount shown for a share outstanding does not correspond with the aggregate net gain (loss) on investments for the period due to the timing of sales and repurchases of shares in relation to fluctuating market values of the investments of the Fund.
H Expense ratios reflect operating expenses of the Fund. Expenses before reductions do not reflect amounts reimbursed by the investment adviser or reductions from brokerage service arrangements or reductions from other expense offset arrangements and do not represent the amount paid by the Fund during periods when reimbursements or reductions occur. Expenses net of fee waivers reflect expenses after reimbursement by the investment adviser but prior to reductions from brokerage service arrangements or other expense offset arrangements. Expenses net of all reductions represent the net expenses paid by the Fund.
I For the year ended February 29.
J Amount represents less than $.01 per share.
See accompanying notes which are an integral part of the financial statements.
Annual Report
Natural Gas Portfolio
Performance: The Bottom Line
Average annual total return reflects the change in the value of an investment, assuming reinvestment of the fund's distributions from dividend income and capital gains (the profits earned upon the sale of securities that have grown in value, if any) and assuming a constant rate of performance each year. The $10,000 table and the fund's returns do not reflect the deduction of taxes that a shareholder would pay on fund distributions or the redemption of fund shares. During periods of reimbursement by Fidelity, a fund's total return will be greater than it would be had the reimbursement not occurred. How a fund did yesterday is no guarantee of how it will do tomorrow.
Average Annual Total Returns
|
Periods ended February 28, 2013 |
Past 1 |
Past 5 |
Past 10 |
|
Natural Gas Portfolio |
0.86% |
-6.73% |
10.56% |
$10,000 Over 10 Years
Let's say hypothetically that $10,000 was invested in Natural Gas Portfolio on February 28, 2003. The chart shows how the value of your investment would have changed, and also shows how the S&P 500 Index performed over the same period.
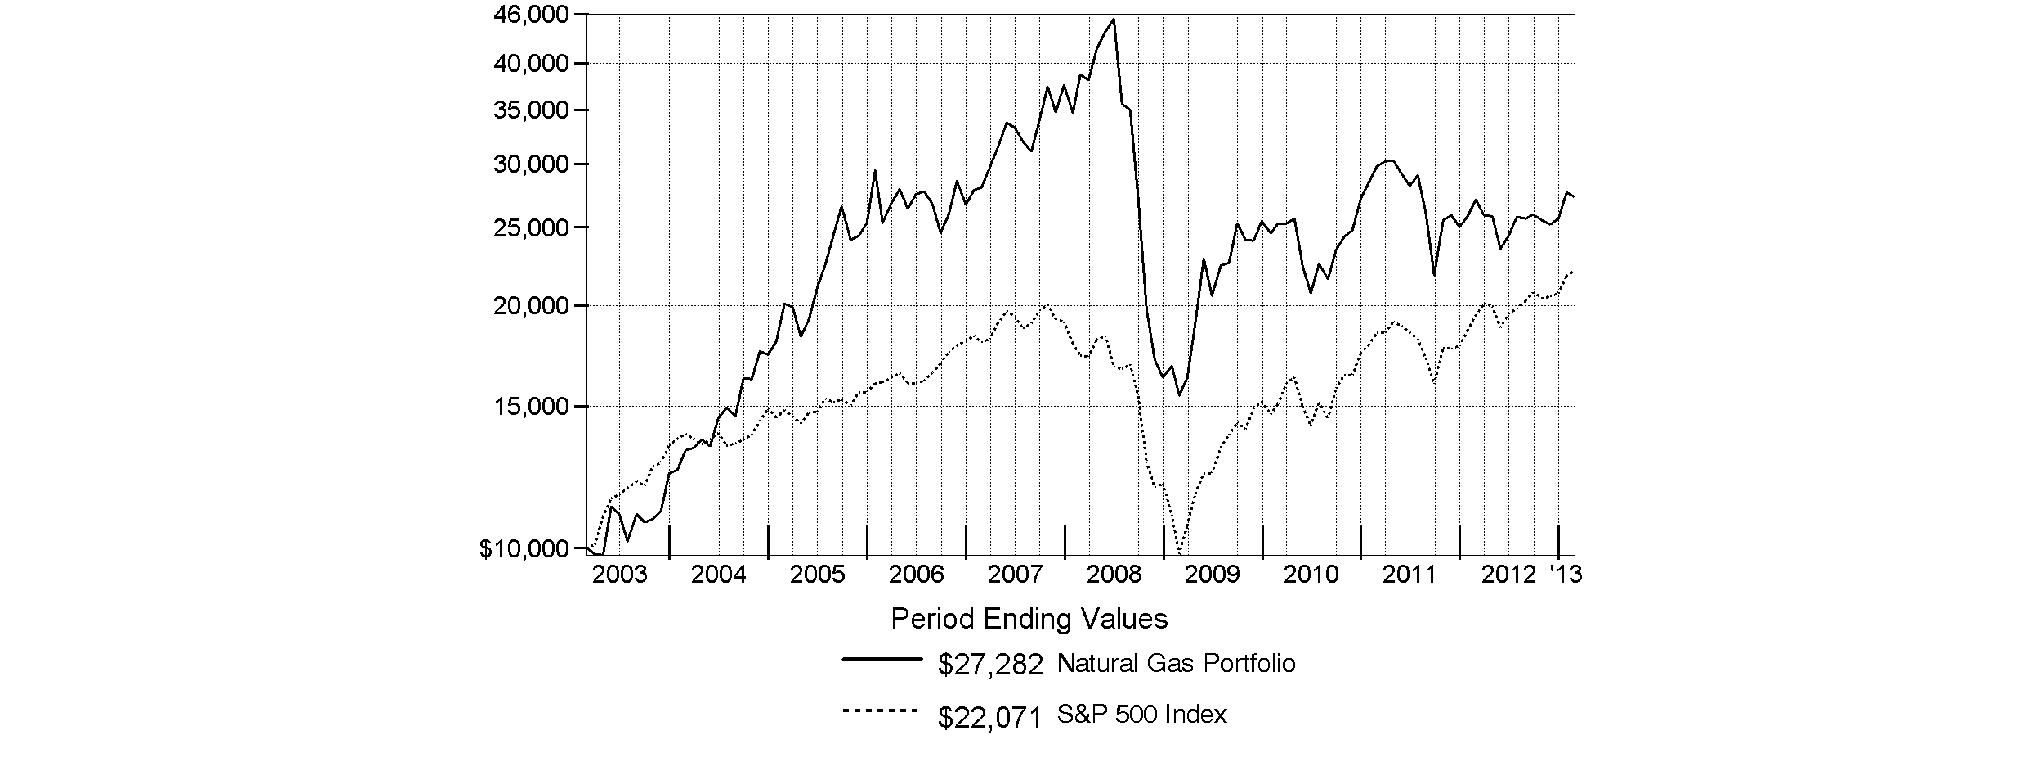
Annual Report
Natural Gas Portfolio
Management's Discussion of Fund Performance
Market Recap: U.S. stocks posted solid gains for the year ending February 28, 2013, sparked by a late-period rally that pushed major equity benchmarks to multiyear highs. Improvement in the global economy and more monetary stimulus from the U.S. Federal Reserve kept markets on the upswing for much of the year, shrugging off an early decline brought on by debt woes in Europe, and another dip later in the period amid Congressional gridlock on the federal budget. Renewed optimism over employment, the housing market, corporate earnings and record dividends made stocks a favorite with investors during the 12 months, which helped push the broad-based S&P 500® Index across the milestone 1,500 mark at the end of January. The S&P 500® finished the period up 13.46%. Seven of the 10 major market sectors tracked by MSCI U.S. IMI 25-50 classifications produced double-digit gains, led by health care and financials, while information technology, energy and materials trailed the broad equity market with only modest advances.
Comments from Ryan Oldham and Ted Davis, Co-Portfolio Managers of Natural Gas Portfolio. Ted Davis became co-manager on September 17, 2012, and sole manager on April 1, 2013: For the year, the fund gained 0.86%, beating the -0.15% result of the S&P® Custom Natural Gas Index, but lagging the S&P 500®. Despite tailwinds for the broader domestic economy, the energy sector struggled to keep pace, as volatile oil and natural gas prices helped drive the sector down an uncertain path. Relative to the industry benchmark, stock selection in oil/gas exploration and production (E&P) accounted for most of the outperformance. In September, changes were made to more broadly diversify the index; Canadian-domiciled companies were added and stocks with a stronger correlation to the price of natural gas were given a heavier weighting. Since E&P firms comprise more than 50% of the index, we were pleased the fund did so well in its core area of focus. Choices among integrated oil and gas companies also helped, as we recently added global firms well-positioned in the growing market for liquefied natural gas (LNG), a form of the commodity easier to store and transport. From this segment, Australia-based and non-index name InterOil was among the fund's top relative contributors. It was a good call to overweight some North American E&P companies that announced plans to be acquired at premiums during the period. Canada-based Nexen's stock vaulted higher in July after China's CNOOC announced plans to acquire the firm in a push to enter the attractive North American oil and gas market. Similarly, Progress Energy Resources benefited, as a Malaysian company put in a bid in June to buy the Canadian firm. We sold both stocks to lock in profits. Elsewhere, pipeline company Williams Companies added value. As the secular-growth prospects for pipelines in North America improved during the period, investors sought the stock's high dividend in a yield-starved market, and its share price took off. On the negative side, utilities, in general, hurt the most, but as a result of the index restructuring, our exposure here decreased by period end and increased among energy services firms, an area - along with E&Ps - within the fund's intended area of focus. Elsewhere, picks in oil and gas equipment/services detracted, most notably our overweighting in National Oilwell Varco. Although E&P picks helped this period, our large stake in Apache didn't, as its operations in Egypt were constrained amid political instability there, sending the stock downward. The fund was stung by not owning gas pipeline company and index constituent El Paso, whose shares gained on shareholder approval of a takeover bid by Kinder Morgan. Currency fluctuations hurt, given our investments in foreign stocks.
The views expressed above reflect those of the portfolio manager(s) only through the end of the period as stated on the cover of this report and do not necessarily represent the views of Fidelity or any other person in the Fidelity organization. Any such views are subject to change at any time based upon market or other conditions and Fidelity disclaims any responsibility to update such views. These views may not be relied on as investment advice and, because investment decisions for a Fidelity fund are based on numerous factors, may not be relied on as an indication of trading intent on behalf of any Fidelity fund.
Annual Report
Natural Gas Portfolio
Investment Changes (Unaudited)
|
Top Ten Stocks as of February 28, 2013 |
||
|
|
% of fund's |
% of fund's net assets |
|
Halliburton Co. |
6.9 |
1.2 |
|
Anadarko Petroleum Corp. |
6.7 |
10.9 |
|
Apache Corp. |
5.6 |
9.8 |
|
National Oilwell Varco, Inc. |
5.5 |
1.3 |
|
Canadian Natural Resources Ltd. |
4.5 |
0.0 |
|
TransCanada Corp. |
4.4 |
0.0 |
|
ONEOK, Inc. |
4.0 |
0.0 |
|
Schlumberger Ltd. |
3.6 |
0.0 |
|
Noble Energy, Inc. |
3.3 |
5.5 |
|
Marathon Oil Corp. |
3.2 |
0.0 |
|
|
47.7 |
|
|
Top Industries (% of fund's net assets) |
|||
|
As of February 28, 2013 |
|||
|
Oil, Gas & Consumable Fuels |
61.9% |
|
|
Energy Equipment & Services |
25.5% |
|
|
Gas Utilities |
9.8% |
|
|
Multi-Utilities |
0.5% |
|
|
All Others* |
2.3% |
|

|
As of August 31, 2012 |
|||
|
Oil, Gas & Consumable Fuels |
55.6% |
|
|
Energy Equipment & Services |
12.2% |
|
|
Electric Utilities |
12.0% |
|
|
Multi-Utilities |
11.6% |
|
|
Gas Utilities |
3.6% |
|
|
All Others* |
5.0% |
|

|
* Includes short-term investments and net other assets. |
Annual Report
Natural Gas Portfolio
Investments February 28, 2013
Showing Percentage of Net Assets
|
Common Stocks - 97.6% |
|||
|
Shares |
Value |
||
|
ENERGY EQUIPMENT & SERVICES - 25.5% |
|||
|
Oil & Gas Drilling - 4.4% |
|||
|
Ensco PLC Class A |
319,300 |
$ 19,202,702 |
|
|
Nabors Industries Ltd. |
200,000 |
3,352,000 |
|
|
Transocean Ltd. (United States) |
120,900 |
6,323,070 |
|
|
|
28,877,772 |
||
|
Oil & Gas Equipment & Services - 21.1% |
|||
|
C&J Energy Services, Inc. (a)(d) |
138,100 |
3,342,020 |
|
|
Cameron International Corp. (a) |
150,650 |
9,599,418 |
|
|
Canadian Energy Services & Tech Credit (d) |
227,900 |
2,428,723 |
|
|
Dril-Quip, Inc. (a) |
43,500 |
3,577,005 |
|
|
Halliburton Co. |
1,081,800 |
44,905,517 |
|
|
National Oilwell Varco, Inc. |
524,000 |
35,700,120 |
|
|
Oil States International, Inc. (a) |
49,000 |
3,731,350 |
|
|
Pason Systems, Inc. |
167,900 |
2,642,441 |
|
|
Schlumberger Ltd. |
304,300 |
23,689,755 |
|
|
Trican Well Service Ltd. |
128,000 |
1,649,571 |
|
|
Weatherford International Ltd. (a) |
485,900 |
5,772,492 |
|
|
|
137,038,412 |
||
|
TOTAL ENERGY EQUIPMENT & SERVICES |
165,916,184 |
||
|
GAS UTILITIES - 9.8% |
|||
|
Gas Utilities - 9.8% |
|||
|
Atmos Energy Corp. |
374,128 |
14,280,466 |
|
|
National Fuel Gas Co. |
204,150 |
11,879,489 |
|
|
ONEOK, Inc. |
568,000 |
25,554,320 |
|
|
Questar Corp. |
134,000 |
3,150,340 |
|
|
UGI Corp. |
240,700 |
8,621,874 |
|
|
|
63,486,489 |
||
|
MULTI-UTILITIES - 0.5% |
|||
|
Multi-Utilities - 0.5% |
|||
|
Sempra Energy |
44,439 |
3,455,577 |
|
|
OIL, GAS & CONSUMABLE FUELS - 61.8% |
|||
|
Coal & Consumable Fuels - 0.3% |
|||
|
CONSOL Energy, Inc. |
48,800 |
1,568,920 |
|
|
Integrated Oil & Gas - 5.5% |
|||
|
Hess Corp. |
70,800 |
4,708,200 |
|
|
Husky Energy, Inc. |
186,600 |
5,737,780 |
|
|
InterOil Corp. (a)(d) |
84,250 |
5,878,123 |
|
|
Murphy Oil Corp. |
56,100 |
3,415,368 |
|
|
Suncor Energy, Inc. |
525,300 |
15,918,182 |
|
|
|
35,657,653 |
||
|
Oil & Gas Exploration & Production - 45.3% |
|||
|
Americas Petrogas, Inc. (a) |
437,600 |
1,043,875 |
|
|
Americas Petrogas, Inc. (a)(e) |
116,000 |
276,713 |
|
|
Anadarko Petroleum Corp. |
545,400 |
43,402,932 |
|
|
Apache Corp. |
486,233 |
36,112,525 |
|
|
Bonanza Creek Energy, Inc. (a) |
49,400 |
1,671,202 |
|
|
|
|||
|
Shares |
Value |
||
|
Cabot Oil & Gas Corp. |
128,300 |
$ 7,950,751 |
|
|
Canadian Natural Resources Ltd. |
948,600 |
28,993,815 |
|
|
Chesapeake Energy Corp. (d) |
492,900 |
9,936,864 |
|
|
Cimarex Energy Co. |
197,000 |
13,260,070 |
|
|
Cobalt International Energy, Inc. (a) |
193,850 |
4,782,280 |
|
|
Concho Resources, Inc. (a) |
52,700 |
4,740,892 |
|
|
Crew Energy, Inc. (a) |
249,750 |
1,562,073 |
|
|
Crown Point Energy, Inc. (e) |
670,016 |
181,920 |
|
|
Denbury Resources, Inc. (a) |
419,875 |
7,608,135 |
|
|
Devon Energy Corp. |
128,746 |
6,985,758 |
|
|
Diamondback Energy, Inc. |
45,100 |
1,024,221 |
|
|
Emerald Oil, Inc. warrants 2/4/16 (a) |
15,002 |
0 |
|
|
Encana Corp. |
117,800 |
2,118,972 |
|
|
Energen Corp. |
95,000 |
4,392,800 |
|
|
Energy XXI (Bermuda) Ltd. |
50,300 |
1,495,419 |
|
|
EOG Resources, Inc. |
116,185 |
14,605,616 |
|
|
EQT Corp. |
124,500 |
7,854,705 |
|
|
Halcon Resources Corp. (f) |
80,000 |
568,000 |
|
|
Kodiak Oil & Gas Corp. (a) |
156,100 |
1,389,290 |
|
|
Kosmos Energy Ltd. (a) |
82,150 |
897,900 |
|
|
Marathon Oil Corp. |
630,000 |
21,105,000 |
|
|
Newfield Exploration Co. (a) |
106,700 |
2,466,904 |
|
|
Noble Energy, Inc. |
191,507 |
21,224,721 |
|
|
Painted Pony Petroleum Ltd. (e) |
12,700 |
121,304 |
|
|
Painted Pony Petroleum Ltd. Class A (a) |
579,700 |
5,537,013 |
|
|
PDC Energy, Inc. (a) |
52,700 |
2,457,928 |
|
|
Pengrowth Energy Corp. (d) |
382,800 |
1,629,568 |
|
|
Penn West Petroleum Ltd. |
531,700 |
5,166,191 |
|
|
PetroBakken Energy Ltd. (d) |
297,293 |
2,456,181 |
|
|
Petrominerales Ltd. (d) |
146,300 |
1,220,053 |
|
|
QEP Resources, Inc. |
141,300 |
4,303,998 |
|
|
Talisman Energy, Inc. |
1,105,800 |
13,886,167 |
|
|
Whiting Petroleum Corp. (a) |
83,900 |
4,085,930 |
|
|
WPX Energy, Inc. (a) |
438,233 |
6,218,526 |
|
|
|
294,736,212 |
||
|
Oil & Gas Refining & Marketing - 1.4% |
|||
|
Marathon Petroleum Corp. |
30,200 |
2,502,976 |
|
|
Phillips 66 |
104,100 |
6,554,136 |
|
|
|
9,057,112 |
||
|
Oil & Gas Storage & Transport - 9.3% |
|||
|
Enbridge, Inc. |
251,900 |
11,231,381 |
|
|
Spectra Energy Corp. |
34,400 |
998,976 |
|
|
The Williams Companies, Inc. |
557,099 |
19,336,906 |
|
|
TransCanada Corp. |
619,000 |
28,835,646 |
|
|
|
60,402,909 |
||
|
TOTAL OIL, GAS & CONSUMABLE FUELS |
401,422,806 |
||
|
TOTAL COMMON STOCKS (Cost $641,117,418) |
|
||
|
Convertible Bonds - 0.1% |
||||
|
|
Principal Amount |
Value |
||
|
OIL, GAS & CONSUMABLE FUELS - 0.1% |
||||
|
Oil & Gas Exploration & Production - 0.1% |
||||
|
Cobalt International Energy, Inc. 2.625% 12/1/19 |
|
$ 600,000 |
$ 619,500 |
|
|
Money Market Funds - 5.1% |
|||
|
Shares |
|
||
|
Fidelity Cash Central Fund, 0.16% (b) |
11,431,499 |
11,431,499 |
|
|
Fidelity Securities Lending Cash Central Fund, 0.16% (b)(c) |
22,134,533 |
22,134,533 |
|
|
TOTAL MONEY MARKET FUNDS (Cost $33,566,032) |
|
||
|
TOTAL INVESTMENT PORTFOLIO - 102.8% (Cost $675,278,950) |
668,466,588 |
|
NET OTHER ASSETS (LIABILITIES) - (2.8)% |
(18,394,027) |
||
|
NET ASSETS - 100% |
$ 650,072,561 |
||
|
Legend |
|
(a) Non-income producing |
|
(b) Affiliated fund that is generally available only to investment companies and other accounts managed by Fidelity Investments. The rate quoted is the annualized seven-day yield of the fund at period end. A complete unaudited listing of the fund's holdings as of its most recent quarter end is available upon request. In addition, each Fidelity Central Fund's financial statements, which are not covered by the Fund's Report of Independent Registered Public Accounting Firm, are available on the SEC's website or upon request. |
|
(c) Investment made with cash collateral received from securities on loan. |
|
(d) Security or a portion of the security is on loan at period end. |
|
(e) Security exempt from registration under Rule 144A of the Securities Act of 1933. These securities may be resold in transactions exempt from registration, normally to qualified institutional buyers. At the end of the period, the value of these securities amounted to $579,937 or 0.1% of net assets. |
|
(f) Restricted securities - Investment in securities not registered under the Securities Act of 1933 (excluding 144A issues). At the end of the period, the value of restricted securities (excluding 144A issues) amounted to $568,000 or 0.1% of net assets. |
|
Additional information on each restricted holding is as follows: |
|
Security |
Acquisition Date |
Acquisition Cost |
|
Halcon Resources Corp. |
3/1/12 |
$ 720,000 |
|
Affiliated Central Funds |
|
Information regarding fiscal year to date income earned by the Fund from investments in Fidelity Central Funds is as follows: |
|
Fund |
Income earned |
|
Fidelity Cash Central Fund |
$ 35,755 |
|
Fidelity Securities Lending Cash Central Fund |
535,824 |
|
Total |
$ 571,579 |
|
Other Information |
|
The following is a summary of the inputs used, as of February 28, 2013, involving the Fund's assets and liabilities carried at fair value. The inputs or methodology used for valuing securities may not be an indication of the risk associated with investing in those securities. For more information on valuation inputs, and their aggregation into the levels used in the table below, please refer to the Investment Valuation section in the accompanying Notes to Financial Statements. |
|
Valuation Inputs at Reporting Date: |
||||
|
Description |
Total |
Level 1 |
Level 2 |
Level 3 |
|
Investments in Securities: |
||||
|
Common Stocks |
$ 634,281,056 |
$ 634,281,056 |
$ - |
$ - |
|
Convertible Bonds |
619,500 |
- |
619,500 |
- |
|
Money Market Funds |
33,566,032 |
33,566,032 |
- |
- |
|
Total Investments in Securities: |
$ 668,466,588 |
$ 667,847,088 |
$ 619,500 |
$ - |
|
Distribution of investments by country or territory of incorporation, as a percentage of total net assets, is as follows. (Unaudited) |
|
United States of America |
69.3% |
|
Canada |
21.5% |
|
Curacao |
3.6% |
|
United Kingdom |
2.9% |
|
Switzerland |
1.9% |
|
Others (Individually Less Than 1%) |
0.8% |
|
|
100.0% |
See accompanying notes which are an integral part of the financial statements.
Annual Report
Natural Gas Portfolio
Financial Statements
Statement of Assets and Liabilities
|
|
February 28, 2013 |
|
|
|
|
|
|
Assets |
|
|
|
Investment in securities, at value (including securities loaned of $21,188,492) - See accompanying schedule: Unaffiliated issuers (cost $641,712,918) |
$ 634,900,556 |
|
|
Fidelity Central Funds (cost $33,566,032) |
33,566,032 |
|
|
Total Investments (cost $675,278,950) |
|
$ 668,466,588 |
|
Receivable for investments sold |
|
7,735,690 |
|
Delayed delivery |
|
19,999 |
|
Receivable for fund shares sold |
|
461,740 |
|
Dividends receivable |
|
658,989 |
|
Interest receivable |
|
3,238 |
|
Distributions receivable from Fidelity Central Funds |
|
32,974 |
|
Prepaid expenses |
|
937 |
|
Receivable from investment adviser for expense reductions |
|
1,059 |
|
Other receivables |
|
29,795 |
|
Total assets |
|
677,411,009 |
|
|
|
|
|
Liabilities |
|
|
|
Payable to custodian bank |
$ 2,132,826 |
|
|
Payable for investments purchased |
1,582,493 |
|
|
Payable for fund shares redeemed |
982,108 |
|
|
Accrued management fee |
308,560 |
|
|
Other affiliated payables |
154,604 |
|
|
Other payables and accrued expenses |
43,324 |
|
|
Collateral on securities loaned, at value |
22,134,533 |
|
|
Total liabilities |
|
27,338,448 |
|
|
|
|
|
Net Assets |
|
$ 650,072,561 |
|
Net Assets consist of: |
|
|
|
Paid in capital |
|
$ 1,062,997,477 |
|
Undistributed net investment income |
|
303,922 |
|
Accumulated undistributed net realized gain (loss) on investments and foreign currency transactions |
|
(406,390,549) |
|
Net unrealized appreciation (depreciation) on investments and assets and liabilities in foreign currencies |
|
(6,838,289) |
|
Net Assets, for 19,783,908 shares outstanding |
|
$ 650,072,561 |
|
Net Asset Value, offering price and redemption price per share ($650,072,561 ÷ 19,783,908 shares) |
|
$ 32.86 |
Statement of Operations
|
|
Year ended February 28, 2013 |
|
|
|
|
|
|
Investment Income |
|
|
|
Dividends |
|
$ 11,571,975 |
|
Interest |
|
3,203 |
|
Income from Fidelity Central Funds |
|
571,579 |
|
Total income |
|
12,146,757 |
|
|
|
|
|
Expenses |
|
|
|
Management fee |
$ 3,710,993 |
|
|
Transfer agent fees |
1,737,782 |
|
|
Accounting and security lending fees |
246,053 |
|
|
Custodian fees and expenses |
25,410 |
|
|
Independent trustees' compensation |
4,438 |
|
|
Registration fees |
50,634 |
|
|
Audit |
39,021 |
|
|
Legal |
2,579 |
|
|
Miscellaneous |
7,924 |
|
|
Total expenses before reductions |
5,824,834 |
|
|
Expense reductions |
(105,949) |
5,718,885 |
|
Net investment income (loss) |
|
6,427,872 |
|
Realized and Unrealized Gain (Loss) Net realized gain (loss) on: |
|
|
|
Investment securities: |
|
|
|
Unaffiliated issuers |
50,895,434 |
|
|
Foreign currency transactions |
51,318 |
|
|
Total net realized gain (loss) |
|
50,946,752 |
|
Change in net unrealized appreciation (depreciation) on: Investment securities |
(53,778,192) |
|
|
Assets and liabilities in foreign currencies |
4,947 |
|
|
Total change in net unrealized appreciation (depreciation) |
|
(53,773,245) |
|
Net gain (loss) |
|
(2,826,493) |
|
Net increase (decrease) in net assets resulting from operations |
|
$ 3,601,379 |
See accompanying notes which are an integral part of the financial statements.
Annual Report
Statement of Changes in Net Assets
|
|
Year ended |
Year ended |
|
Increase (Decrease) in Net Assets |
|
|
|
Operations |
|
|
|
Net investment income (loss) |
$ 6,427,872 |
$ 7,111,150 |
|
Net realized gain (loss) |
50,946,752 |
5,423,932 |
|
Change in net unrealized appreciation (depreciation) |
(53,773,245) |
(127,183,989) |
|
Net increase (decrease) in net assets resulting from operations |
3,601,379 |
(114,648,907) |
|
Distributions to shareholders from net investment income |
(5,539,434) |
(7,350,892) |
|
Distributions to shareholders from net realized gain |
(1,080,476) |
- |
|
Total distributions |
(6,619,910) |
(7,350,892) |
|
Share transactions |
191,939,367 |
317,625,822 |
|
Reinvestment of distributions |
6,127,922 |
6,793,558 |
|
Cost of shares redeemed |
(288,673,684) |
(448,864,133) |
|
Net increase (decrease) in net assets resulting from share transactions |
(90,606,395) |
(124,444,753) |
|
Redemption fees |
17,095 |
42,090 |
|
Total increase (decrease) in net assets |
(93,607,831) |
(246,402,462) |
|
|
|
|
|
Net Assets |
|
|
|
Beginning of period |
743,680,392 |
990,082,854 |
|
End of period (including undistributed net investment income of $303,922 and undistributed net investment income of $1,198,017, respectively) |
$ 650,072,561 |
$ 743,680,392 |
|
Other Information Shares |
|
|
|
Sold |
6,269,617 |
9,161,528 |
|
Issued in reinvestment of distributions |
196,748 |
211,560 |
|
Redeemed |
(9,280,431) |
(13,898,138) |
|
Net increase (decrease) |
(2,814,066) |
(4,525,050) |
Financial Highlights
|
Years ended February 28, |
2013 |
2012 G |
2011 |
2010 |
2009 |
|
Selected Per-Share Data |
|
|
|
|
|
|
Net asset value, beginning of period |
$ 32.91 |
$ 36.50 |
$ 31.34 |
$ 19.16 |
$ 49.91 |
|
Income from Investment Operations |
|
|
|
|
|
|
Net investment income (loss) B |
.30 |
.26 |
.29 E |
(.04) |
(.05) |
|
Net realized and unrealized gain (loss) |
(.03) I |
(3.56) |
5.19 |
12.22 |
(28.62) |
|
Total from investment operations |
.27 |
(3.30) |
5.48 |
12.18 |
(28.67) |
|
Distributions from net investment income |
(.27) |
(.29) |
(.26) |
- |
- |
|
Distributions from net realized gain |
(.05) |
- |
(.06) |
- |
(2.09) |
|
Total distributions |
(.32) |
(.29) |
(.32) |
- |
(2.09) |
|
Redemption fees added to paid in capital B |
- H |
- H |
- H |
- H |
.01 |
|
Net asset value, end of period |
$ 32.86 |
$ 32.91 |
$ 36.50 |
$ 31.34 |
$ 19.16 |
|
Total Return A |
.86% I |
(9.03)% |
17.58% |
63.57% |
(59.99)% |
|
Ratios to Average Net Assets C, F |
|
|
|
|
|
|
Expenses before reductions |
.87% |
.86% |
.89% |
.93% |
.85% |
|
Expenses net of fee waivers, if any |
.87% |
.86% |
.89% |
.93% |
.85% |
|
Expenses net of all reductions |
.86% |
.86% |
.88% |
.93% |
.85% |
|
Net investment income (loss) |
.96% |
.81% |
.95% E |
(.13)% |
(.13)% |
|
Supplemental Data |
|
|
|
|
|
|
Net assets, end of period (000 omitted) |
$ 650,073 |
$ 743,680 |
$ 990,083 |
$ 1,141,747 |
$ 705,002 |
|
Portfolio turnover rate D |
107% |
63% |
167% |
110% |
81% |
A Total returns would have been lower if certain expenses had not been reduced during the applicable periods shown.
B Calculated based on average shares outstanding during the period.
C Fees and expenses of any underlying Fidelity Central Funds are not included in the Fund's expense ratio. The Fund indirectly bears its proportionate share of the expenses of any underlying Fidelity Central Funds.
D Amount does not include the portfolio activity of any underlying Fidelity Central Funds.
E Investment income per share reflects a large, non-recurring dividend which amounted to $.15 per share. Excluding this non-recurring dividend, the ratio of net investment income (loss) to average net assets would have been .47%.
F Expense ratios reflect operating expenses of the Fund. Expenses before reductions do not reflect amounts reimbursed by the investment adviser or reductions from brokerage service arrangements or reductions from other expense offset arrangements and do not represent the amount paid by the Fund during periods when reimbursements or reductions occur. Expenses net of fee waivers reflect expenses after reimbursement by the investment adviser but prior to reductions from brokerage service arrangements or other expense offset arrangements. Expenses net of all reductions represent the net expenses paid by the Fund.
G For the year ended February 29.
H Amount represents less than $.01 per share.
I Net realized and unrealized gain (loss) per share reflects proceeds received from litigation which amounted to $.03 per share. Excluding these litigation proceeds, the total return would have been 0.75%.
See accompanying notes which are an integral part of the financial statements.
Annual Report
Natural Resources Portfolio
Performance: The Bottom Line
Average annual total return reflects the change in the value of an investment, assuming reinvestment of the fund's distributions from dividend income and capital gains (the profits earned upon the sale of securities that have grown in value, if any) and assuming a constant rate of performance each year. The $10,000 table and the fund's returns do not reflect the deduction of taxes that a shareholder would pay on fund distributions or the redemption of fund shares. During periods of reimbursement by Fidelity, a fund's total return will be greater than it would be had the reimbursement not occurred. How a fund did yesterday is no guarantee of how it will do tomorrow.
Average Annual Total Returns
|
Periods ended February 28, 2013 |
Past 1 |
Past 5 |
Past 10 |
|
Natural Resources Portfolio |
-3.30% |
-1.97% |
13.94% |
$10,000 Over 10 Years
Let's say hypothetically that $10,000 was invested in Natural Resources Portfolio on February 28, 2003. The chart shows how the value of your investment would have changed, and also shows how the S&P 500 Index performed over the same period.
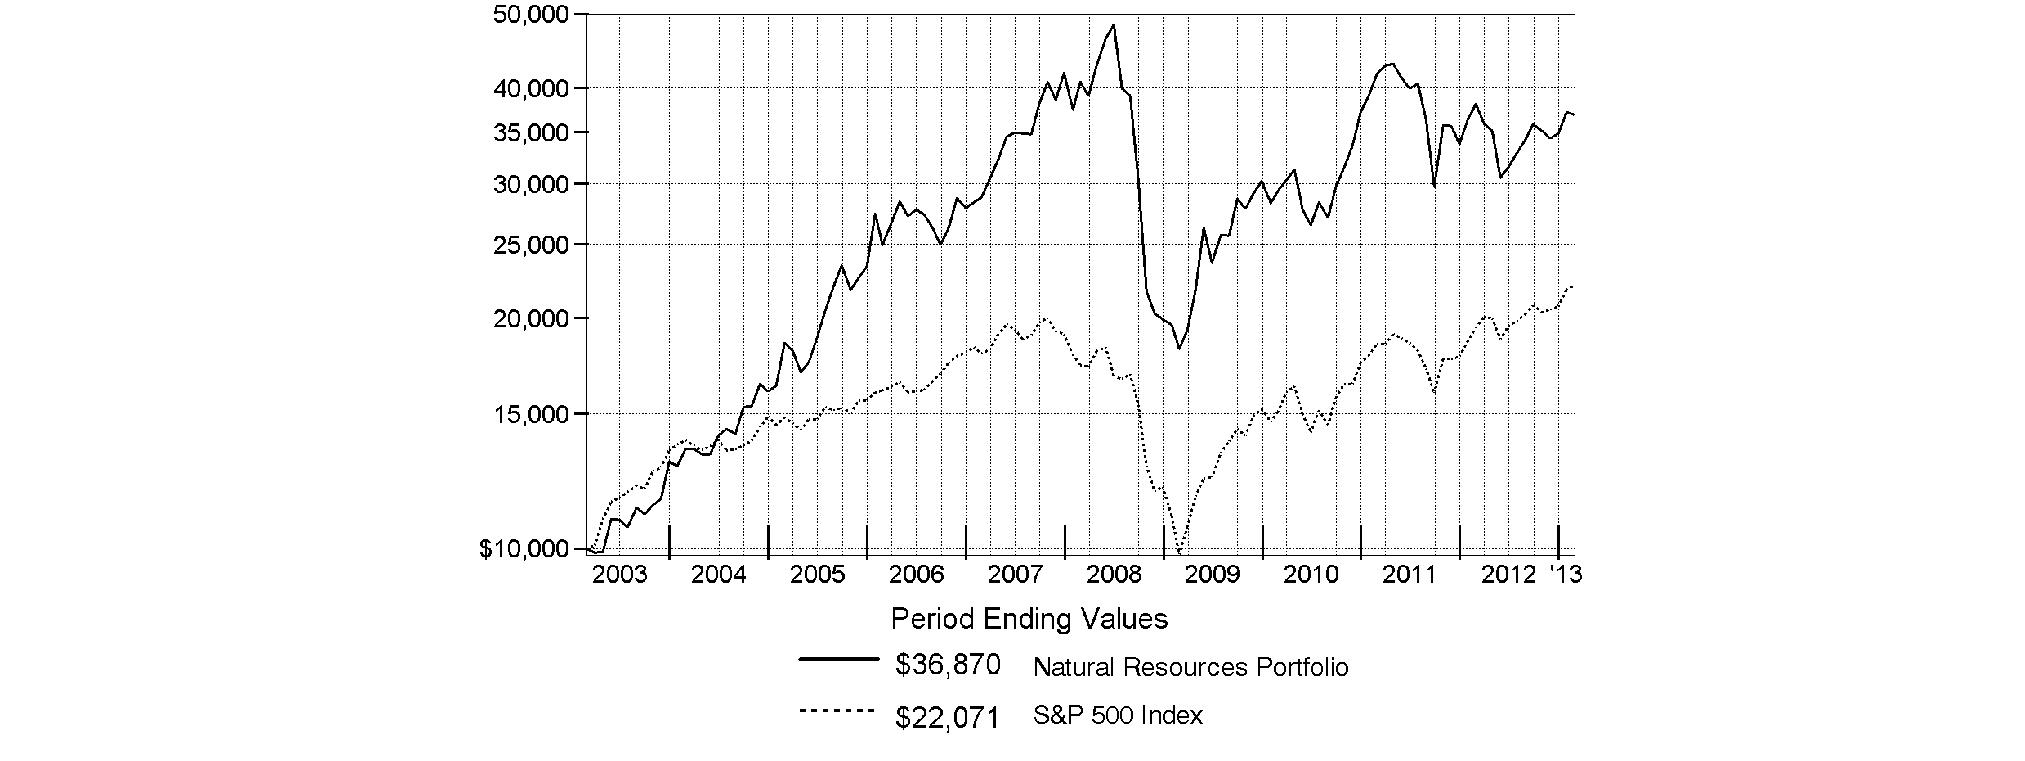
Annual Report
Natural Resources Portfolio
Management's Discussion of Fund Performance
Market Recap: U.S. stocks posted solid gains for the year ending February 28, 2013, sparked by a late-period rally that pushed major equity benchmarks to multiyear highs. Improvement in the global economy and more monetary stimulus from the U.S. Federal Reserve kept markets on the upswing for much of the year, shrugging off an early decline brought on by debt woes in Europe, and another dip later in the period amid Congressional gridlock on the federal budget. Renewed optimism over employment, the housing market, corporate earnings and record dividends made stocks a favorite with investors during the 12 months, which helped push the broad-based S&P 500® Index across the milestone 1,500 mark at the end of January. The S&P 500® finished the period up 13.46%. Seven of the 10 major market sectors tracked by MSCI U.S. IMI 25-50 classifications produced double-digit gains, led by health care and financials, while information technology, energy and materials trailed the broad equity market with only modest advances.
Comments from John Dowd, Portfolio Manager of Natural Resources Portfolio: For the year, the fund returned -3.30%, underperforming the S&P 500® and the -2.88% return of the S&P® North American Natural Resources Sector Index. Concerns about global economic growth turned investors away from cyclically oriented natural resources stocks during the period. Relative to the sector benchmark, the fund was hurt by stock picking in the integrated oil/gas and equipment/services industries. In the former category, an underweighting in Exxon Mobil detracted, as its stock rose on the strength of its refining business. A sizable stake in integrated oil/gas firm Occidental Petroleum also hurt, as its stock fell amid expensive new projects. Oil/gas producer SM Energy was detrimental, as low natural gas prices put pressure on margins, hurting earnings. I sold the stock from the fund by period end. An underweighting in the oil/gas storage and transport group also curbed results. Lastly, currency fluctuations hindered performance given the fund's investments in foreign stocks. Conversely, positioning in oil/gas refining and marketing helped, including an overweighting in refiner Tesoro, the fund's top relative contributor. Tesoro's stock price more than doubled during the period, boosted by strong margins from the oversupply of U.S. crude oil and good overall execution. I also owned some of the best stocks in the underperforming oil/gas exploration and production group, including Cabot Oil & Gas, where I correctly believed that its well-established position in shale drilling was starting to pay off. Commodity chemicals firm LyondellBasell Industries was additive, as it profited from the low price of crude oil used in its products.
The views expressed above reflect those of the portfolio manager(s) only through the end of the period as stated on the cover of this report and do not necessarily represent the views of Fidelity or any other person in the Fidelity organization. Any such views are subject to change at any time based upon market or other conditions and Fidelity disclaims any responsibility to update such views. These views may not be relied on as investment advice and, because investment decisions for a Fidelity fund are based on numerous factors, may not be relied on as an indication of trading intent on behalf of any Fidelity fund.
Annual Report
Natural Resources Portfolio
Investment Changes (Unaudited)
|
Top Ten Stocks as of February 28, 2013 |
||
|
|
% of fund's |
% of fund's net assets |
|
Occidental Petroleum Corp. |
6.4 |
7.3 |
|
Hess Corp. |
4.5 |
3.5 |
|
Halliburton Co. |
4.2 |
1.5 |
|
Suncor Energy, Inc. |
3.6 |
2.5 |
|
National Oilwell Varco, Inc. |
3.6 |
4.3 |
|
Anadarko Petroleum Corp. |
3.6 |
0.9 |
|
Pioneer Natural Resources Co. |
3.4 |
2.1 |
|
Murphy Oil Corp. |
3.4 |
0.9 |
|
EOG Resources, Inc. |
3.2 |
2.0 |
|
Concho Resources, Inc. |
3.0 |
1.0 |
|
|
38.9 |
|
|
Top Industries (% of fund's net assets) |
|||
|
As of February 28, 2013 |
|||
|
Oil, Gas & Consumable Fuels |
64.9% |
|
|
Energy Equipment & Services |
20.8% |
|
|
Metals & Mining |
7.9% |
|
|
Containers & Packaging |
2.8% |
|
|
Chemicals |
2.0% |
|
|
All Others* |
1.6% |
|

|
As of August 31, 2012 |
|||
|
Oil, Gas & Consumable Fuels |
60.9% |
|
|
Energy Equipment & Services |
21.7% |
|
|
Metals & Mining |
11.8% |
|
|
Containers & Packaging |
1.8% |
|
|
Chemicals |
1.3% |
|
|
All Others* |
2.5% |
|

|
* Includes short-term investments and net other assets. |
Annual Report
Natural Resources Portfolio
Investments February 28, 2013
Showing Percentage of Net Assets
|
Common Stocks - 99.3% |
|||
|
Shares |
Value |
||
|
CHEMICALS - 2.0% |
|||
|
Commodity Chemicals - 2.0% |
|||
|
LyondellBasell Industries NV Class A (d) |
318,300 |
$ 18,658,746 |
|
|
Westlake Chemical Corp. |
30,700 |
2,646,954 |
|
|
|
21,305,700 |
||
|
CONTAINERS & PACKAGING - 2.8% |
|||
|
Metal & Glass Containers - 1.2% |
|||
|
Ball Corp. |
296,100 |
13,149,801 |
|
|
Paper Packaging - 1.6% |
|||
|
Rock-Tenn Co. Class A |
186,000 |
16,451,700 |
|
|
TOTAL CONTAINERS & PACKAGING |
29,601,501 |
||
|
ENERGY EQUIPMENT & SERVICES - 20.8% |
|||
|
Oil & Gas Drilling - 5.5% |
|||
|
Discovery Offshore S.A. (a)(e) |
1,522,800 |
3,435,166 |
|
|
Ensco PLC Class A |
398,400 |
23,959,776 |
|
|
Helmerich & Payne, Inc. |
151,100 |
10,011,886 |
|
|
Noble Corp. |
408,600 |
14,636,052 |
|
|
Northern Offshore Ltd. |
941,800 |
1,722,595 |
|
|
Tuscany International Drilling, Inc. (a) |
863,300 |
167,428 |
|
|
Unit Corp. (a) |
56,600 |
2,574,168 |
|
|
Vantage Drilling Co. (a) |
925,800 |
1,509,054 |
|
|
|
58,016,125 |
||
|
Oil & Gas Equipment & Services - 15.3% |
|||
|
Cameron International Corp. (a) |
260,600 |
16,605,432 |
|
|
Core Laboratories NV |
54,500 |
7,474,675 |
|
|
FMC Technologies, Inc. (a) |
86,200 |
4,474,642 |
|
|
Forum Energy Technologies, Inc. |
150,500 |
4,015,340 |
|
|
Geospace Technologies Corp. (a) |
11,800 |
1,148,376 |
|
|
Halliburton Co. |
1,059,400 |
43,975,694 |
|
|
McDermott International, Inc. (a) |
332,000 |
4,223,040 |
|
|
National Oilwell Varco, Inc. |
561,258 |
38,238,508 |
|
|
Oceaneering International, Inc. |
21,100 |
1,341,749 |
|
|
Oil States International, Inc. (a) |
113,300 |
8,627,795 |
|
|
Schlumberger Ltd. |
349,292 |
27,192,382 |
|
|
Superior Energy Services, Inc. (a) |
56,900 |
1,505,005 |
|
|
Total Energy Services, Inc. |
100,000 |
1,376,970 |
|
|
Weatherford International Ltd. (a) |
127,900 |
1,519,452 |
|
|
|
161,719,060 |
||
|
TOTAL ENERGY EQUIPMENT & SERVICES |
219,735,185 |
||
|
HOTELS, RESTAURANTS & LEISURE - 0.0% |
|||
|
Casinos & Gaming - 0.0% |
|||
|
Icahn Enterprises LP rights |
282,600 |
3 |
|
|
METALS & MINING - 7.9% |
|||
|
Diversified Metals & Mining - 1.7% |
|||
|
Anglo American PLC (United Kingdom) |
143,262 |
4,177,191 |
|
|
Kenmare Resources PLC (a) |
4,978,800 |
2,643,581 |
|
|
SunCoke Energy, Inc. (a) |
180,100 |
2,969,849 |
|
|
|
|||
|
Shares |
Value |
||
|
Teck Resources Ltd. Class B (sub. vtg.) |
220,100 |
$ 6,814,830 |
|
|
Turquoise Hill Resources Ltd. (a) |
218,025 |
1,393,246 |
|
|
|
17,998,697 |
||
|
Gold - 5.3% |
|||
|
AngloGold Ashanti Ltd. sponsored ADR |
196,700 |
4,768,008 |
|
|
Barrick Gold Corp. |
283,000 |
8,581,246 |
|
|
Gold Fields Ltd. sponsored ADR |
568,500 |
4,712,865 |
|
|
Goldcorp, Inc. |
241,600 |
7,885,824 |
|
|
Harmony Gold Mining Co. Ltd. sponsored ADR |
530,400 |
3,277,872 |
|
|
IAMGOLD Corp. |
508,200 |
3,424,960 |
|
|
Kinross Gold Corp. |
295,867 |
2,252,175 |
|
|
Newmont Mining Corp. |
243,800 |
9,822,702 |
|
|
Randgold Resources Ltd. sponsored ADR |
49,800 |
4,126,926 |
|
|
Sibanye Gold Ltd. ADR (a) |
142,125 |
804,428 |
|
|
Yamana Gold, Inc. |
425,900 |
6,269,248 |
|
|
|
55,926,254 |
||
|
Precious Metals & Minerals - 0.9% |
|||
|
Pan American Silver Corp. |
128,600 |
2,120,614 |
|
|
Silver Wheaton Corp. |
217,400 |
6,893,556 |
|
|
|
9,014,170 |
||
|
TOTAL METALS & MINING |
82,939,121 |
||
|
OIL, GAS & CONSUMABLE FUELS - 64.9% |
|||
|
Coal & Consumable Fuels - 0.9% |
|||
|
Alpha Natural Resources, Inc. (a) |
138,900 |
1,108,422 |
|
|
Peabody Energy Corp. |
371,100 |
8,000,916 |
|
|
|
9,109,338 |
||
|
Integrated Oil & Gas - 23.9% |
|||
|
Chevron Corp. |
250,200 |
29,310,930 |
|
|
Exxon Mobil Corp. |
306,000 |
27,402,300 |
|
|
Hess Corp. |
715,700 |
47,594,050 |
|
|
InterOil Corp. (a)(d) |
96,900 |
6,760,713 |
|
|
Murphy Oil Corp. |
583,800 |
35,541,744 |
|
|
Occidental Petroleum Corp. |
818,500 |
67,387,104 |
|
|
Suncor Energy, Inc. |
1,268,700 |
38,445,455 |
|
|
|
252,442,296 |
||
|
Oil & Gas Exploration & Production - 29.0% |
|||
|
Anadarko Petroleum Corp. |
477,600 |
38,007,408 |
|
|
Bankers Petroleum Ltd. (a) |
1,073,500 |
3,195,777 |
|
|
BPZ Energy, Inc. (a) |
500,300 |
1,230,738 |
|
|
Cabot Oil & Gas Corp. |
322,700 |
19,997,719 |
|
|
Canadian Natural Resources Ltd. |
230,300 |
7,039,085 |
|
|
Cobalt International Energy, Inc. (a) |
402,000 |
9,917,340 |
|
|
Concho Resources, Inc. (a) |
356,700 |
32,088,732 |
|
|
Continental Resources, Inc. (a) |
132,200 |
11,633,600 |
|
|
EOG Resources, Inc. |
267,700 |
33,652,567 |
|
|
EQT Corp. |
487,200 |
30,737,448 |
|
|
EV Energy Partners LP |
115,700 |
6,480,357 |
|
|
Gulfport Energy Corp. (a) |
71,000 |
2,907,450 |
|
|
Halcon Resources Corp. (f) |
570,000 |
4,047,000 |
|
|
Common Stocks - continued |
|||
|
Shares |
Value |
||
|
OIL, GAS & CONSUMABLE FUELS - CONTINUED |
|||
|
Oil & Gas Exploration & Production - continued |
|||
|
Kodiak Oil & Gas Corp. (a) |
294,900 |
$ 2,624,610 |
|
|
Marathon Oil Corp. |
540,400 |
18,103,400 |
|
|
Noble Energy, Inc. |
261,500 |
28,982,045 |
|
|
Northern Oil & Gas, Inc. (a)(d) |
371,595 |
5,094,567 |
|
|
Oasis Petroleum, Inc. (a) |
328,500 |
12,055,950 |
|
|
Pioneer Natural Resources Co. |
288,600 |
36,308,766 |
|
|
Rosetta Resources, Inc. (a) |
16,800 |
817,824 |
|
|
TAG Oil Ltd. (a) |
126,100 |
436,535 |
|
|
|
305,358,918 |
||
|
Oil & Gas Refining & Marketing - 6.9% |
|||
|
Calumet Specialty Products Partners LP |
171,700 |
6,586,412 |
|
|
Marathon Petroleum Corp. |
322,900 |
26,761,952 |
|
|
Northern Tier Energy LP Class A |
153,700 |
4,449,615 |
|
|
PBF Energy, Inc. Class A (d) |
69,000 |
2,880,750 |
|
|
Phillips 66 |
372,400 |
23,446,304 |
|
|
Tesoro Corp. |
72,100 |
4,054,904 |
|
|
Valero Energy Corp. |
102,600 |
4,677,534 |
|
|
|
72,857,471 |
||
|
Oil & Gas Storage & Transport - 4.2% |
|||
|
Atlas Energy LP |
73,000 |
3,046,290 |
|
|
Atlas Pipeline Partners LP |
206,800 |
6,832,672 |
|
|
Magellan Midstream Partners LP |
114,800 |
5,758,368 |
|
|
Markwest Energy Partners LP |
60,900 |
3,481,653 |
|
|
Tesoro Logistics LP |
174,700 |
8,717,530 |
|
|
The Williams Companies, Inc. |
466,600 |
16,195,686 |
|
|
|
44,032,199 |
||
|
TOTAL OIL, GAS & CONSUMABLE FUELS |
683,800,222 |
||
|
PAPER & FOREST PRODUCTS - 0.9% |
|||
|
Paper Products - 0.9% |
|||
|
International Paper Co. |
226,100 |
9,950,661 |
|
|
TOTAL COMMON STOCKS (Cost $947,374,120) |
|
||
|
Money Market Funds - 3.6% |
|||
|
Shares |
Value |
||
|
Fidelity Cash Central Fund, 0.16% (b) |
7,149,627 |
$ 7,149,627 |
|
|
Fidelity Securities Lending Cash Central Fund, 0.16% (b)(c) |
30,414,300 |
30,414,300 |
|
|
TOTAL MONEY MARKET FUNDS (Cost $37,563,927) |
|
||
|
TOTAL INVESTMENT PORTFOLIO - 102.9% (Cost $984,938,047) |
1,084,896,320 |
|
NET OTHER ASSETS (LIABILITIES) - (2.9)% |
(30,368,575) |
||
|
NET ASSETS - 100% |
$ 1,054,527,745 |
||
|
Legend |
|
(a) Non-income producing |
|
(b) Affiliated fund that is generally available only to investment companies and other accounts managed by Fidelity Investments. The rate quoted is the annualized seven-day yield of the fund at period end. A complete unaudited listing of the fund's holdings as of its most recent quarter end is available upon request. In addition, each Fidelity Central Fund's financial statements, which are not covered by the Fund's Report of Independent Registered Public Accounting Firm, are available on the SEC's website or upon request. |
|
(c) Investment made with cash collateral received from securities on loan. |
|
(d) Security or a portion of the security is on loan at period end. |
|
(e) Security exempt from registration under Rule 144A of the Securities Act of 1933. These securities may be resold in transactions exempt from registration, normally to qualified institutional buyers. At the end of the period, the value of these securities amounted to $3,435,166 or 0.3% of net assets. |
|
(f) Restricted securities - Investment in securities not registered under the Securities Act of 1933 (excluding 144A issues). At the end of the period, the value of restricted securities (excluding 144A issues) amounted to $4,047,000 or 0.4% of net assets. |
|
Additional information on each restricted holding is as follows: |
|
Security |
Acquisition Date |
Acquisition Cost |
|
Halcon Resources Corp. |
3/1/12 |
$ 5,130,000 |
|
Affiliated Central Funds |
|
Information regarding fiscal year to date income earned by the Fund from investments in Fidelity Central Funds is as follows: |
|
Fund |
Income earned |
|
Fidelity Cash Central Fund |
$ 19,695 |
|
Fidelity Securities Lending Cash Central Fund |
347,603 |
|
Total |
$ 367,298 |
|
Other Information |
|
The following is a summary of the inputs used, as of February 28, 2013, involving the Fund's assets and liabilities carried at fair value. The inputs or methodology used for valuing securities may not be an indication of the risk associated with investing in those securities. For more information on valuation inputs, and their aggregation into the levels used in the table below, please refer to the Investment Valuation section in the accompanying Notes to Financial Statements. |
|
Valuation Inputs at Reporting Date: |
||||
|
Description |
Total |
Level 1 |
Level 2 |
Level 3 |
|
Investments in Securities: |
||||
|
Common Stocks |
$ 1,047,332,393 |
$ 1,047,332,390 |
$ - |
$ 3 |
|
Money Market Funds |
37,563,927 |
37,563,927 |
- |
- |
|
Total Investments in Securities: |
$ 1,084,896,320 |
$ 1,084,896,317 |
$ - |
$ 3 |
|
Distribution of investments by country or territory of incorporation, as a percentage of total net assets, is as follows. (Unaudited) |
|
United States of America |
77.7% |
|
Canada |
9.9% |
|
United Kingdom |
2.7% |
|
Curacao |
2.6% |
|
Netherlands |
2.5% |
|
Switzerland |
1.6% |
|
South Africa |
1.3% |
|
Others (Individually Less Than 1%) |
1.7% |
|
|
100.0% |
See accompanying notes which are an integral part of the financial statements.
Annual Report
Natural Resources Portfolio
Financial Statements
Statement of Assets and Liabilities
|
|
February 28, 2013 |
|
|
|
|
|
|
Assets |
|
|
|
Investment in securities, at value (including securities loaned of $29,567,301) - See accompanying schedule: Unaffiliated issuers (cost $947,374,120) |
$ 1,047,332,393 |
|
|
Fidelity Central Funds (cost $37,563,927) |
37,563,927 |
|
|
Total Investments (cost $984,938,047) |
|
$ 1,084,896,320 |
|
Receivable for investments sold |
|
74 |
|
Receivable for fund shares sold |
|
733,311 |
|
Dividends receivable |
|
1,632,955 |
|
Distributions receivable from Fidelity Central Funds |
|
21,353 |
|
Prepaid expenses |
|
1,212 |
|
Receivable from investment adviser for expense reductions |
|
2,944 |
|
Other receivables |
|
47,339 |
|
Total assets |
|
1,087,335,508 |
|
|
|
|
|
Liabilities |
|
|
|
Payable for investments purchased |
$ 213,343 |
|
|
Payable for fund shares redeemed |
1,389,121 |
|
|
Accrued management fee |
499,849 |
|
|
Other affiliated payables |
245,081 |
|
|
Other payables and accrued expenses |
46,069 |
|
|
Collateral on securities loaned, at value |
30,414,300 |
|
|
Total liabilities |
|
32,807,763 |
|
|
|
|
|
Net Assets |
|
$ 1,054,527,745 |
|
Net Assets consist of: |
|
|
|
Paid in capital |
|
$ 1,036,713,921 |
|
Distributions in excess of net investment income |
|
(5,579,312) |
|
Accumulated undistributed net realized gain (loss) on investments and foreign currency transactions |
|
(76,563,757) |
|
Net unrealized appreciation (depreciation) on investments and assets and liabilities in foreign currencies |
|
99,956,893 |
|
Net Assets, for 30,928,606 shares outstanding |
|
$ 1,054,527,745 |
|
Net Asset Value, offering price and redemption price per share ($1,054,527,745 ÷ 30,928,606 shares) |
|
$ 34.10 |
Statement of Operations
|
|
Year ended February 28, 2013 |
|
|
|
|
|
|
Investment Income |
|
|
|
Dividends |
|
$ 19,529,606 |
|
Interest |
|
89 |
|
Income from Fidelity Central Funds |
|
367,298 |
|
Total income |
|
19,896,993 |
|
|
|
|
|
Expenses |
|
|
|
Management fee |
$ 6,397,198 |
|
|
Transfer agent fees |
2,900,344 |
|
|
Accounting and security lending fees |
376,037 |
|
|
Custodian fees and expenses |
45,538 |
|
|
Independent trustees' compensation |
7,739 |
|
|
Registration fees |
45,433 |
|
|
Audit |
39,436 |
|
|
Legal |
4,537 |
|
|
Interest |
3,030 |
|
|
Miscellaneous |
14,584 |
|
|
Total expenses before reductions |
9,833,876 |
|
|
Expense reductions |
(166,614) |
9,667,262 |
|
Net investment income (loss) |
|
10,229,731 |
|
Realized and Unrealized Gain (Loss) Net realized gain (loss) on: |
|
|
|
Investment securities: |
|
|
|
Unaffiliated issuers |
7,095,426 |
|
|
Foreign currency transactions |
(15,004) |
|
|
Total net realized gain (loss) |
|
7,080,422 |
|
Change in net unrealized appreciation (depreciation) on: Investment securities |
(85,363,809) |
|
|
Assets and liabilities in foreign currencies |
(6,161) |
|
|
Total change in net unrealized appreciation (depreciation) |
|
(85,369,970) |
|
Net gain (loss) |
|
(78,289,548) |
|
Net increase (decrease) in net assets resulting from operations |
|
$ (68,059,817) |
See accompanying notes which are an integral part of the financial statements.
Annual Report
Natural Resources Portfolio
Financial Statements - continued
Statement of Changes in Net Assets
|
|
Year ended |
Year ended |
|
Increase (Decrease) in Net Assets |
|
|
|
Operations |
|
|
|
Net investment income (loss) |
$ 10,229,731 |
$ 9,525,458 |
|
Net realized gain (loss) |
7,080,422 |
95,126,213 |
|
Change in net unrealized appreciation (depreciation) |
(85,369,970) |
(309,447,822) |
|
Net increase (decrease) in net assets resulting from operations |
(68,059,817) |
(204,796,151) |
|
Distributions to shareholders from net investment income |
(2,965,193) |
(11,394,017) |
|
Distributions to shareholders from net realized gain |
- |
(3,192,087) |
|
Total distributions |
(2,965,193) |
(14,586,104) |
|
Share transactions |
206,073,881 |
534,526,277 |
|
Reinvestment of distributions |
2,845,421 |
13,954,763 |
|
Cost of shares redeemed |
(513,976,231) |
(870,401,869) |
|
Net increase (decrease) in net assets resulting from share transactions |
(305,056,929) |
(321,920,829) |
|
Redemption fees |
29,174 |
119,543 |
|
Total increase (decrease) in net assets |
(376,052,765) |
(541,183,541) |
|
|
|
|
|
Net Assets |
|
|
|
Beginning of period |
1,430,580,510 |
1,971,764,051 |
|
End of period (including distributions in excess of net investment income of $5,579,312 and distributions in excess of net investment income of $7,311,274, respectively) |
$ 1,054,527,745 |
$ 1,430,580,510 |
|
Other Information Shares |
|
|
|
Sold |
6,393,747 |
14,620,404 |
|
Issued in reinvestment of distributions |
88,101 |
409,738 |
|
Redeemed |
(16,015,960) |
(25,039,254) |
|
Net increase (decrease) |
(9,534,112) |
(10,009,112) |
Financial Highlights
|
Years ended February 28, |
2013 |
2012 G |
2011 |
2010 |
2009 |
|
Selected Per-Share Data |
|
|
|
|
|
|
Net asset value, beginning of period |
$ 35.36 |
$ 39.07 |
$ 27.66 |
$ 17.24 |
$ 39.00 |
|
Income from Investment Operations |
|
|
|
|
|
|
Net investment income (loss) C |
.28 |
.20 |
.12 |
- B |
.01 |
|
Net realized and unrealized gain (loss) |
(1.45) |
(3.59) |
11.49 |
10.54 |
(21.29) |
|
Total from investment operations |
(1.17) |
(3.39) |
11.61 |
10.54 |
(21.28) |
|
Distributions from net investment income |
(.09) |
(.26) |
(.11) |
(.02) |
(.01) |
|
Distributions from net realized gain |
- |
(.06) |
(.09) |
(.10) |
(.48) |
|
Total distributions |
(.09) |
(.32) |
(.20) |
(.12) |
(.49) |
|
Redemption fees added to paid in capital C |
- B |
- B |
- B |
- B |
.01 |
|
Net asset value, end of period |
$ 34.10 |
$ 35.36 |
$ 39.07 |
$ 27.66 |
$ 17.24 |
|
Total Return A |
(3.30)% |
(8.63)% |
42.09% |
61.13% |
(55.24)% |
|
Ratios to Average Net Assets D, F |
|
|
|
|
|
|
Expenses before reductions |
.86% |
.84% |
.88% |
.93% |
.85% |
|
Expenses net of fee waivers, if any |
.85% |
.84% |
.88% |
.93% |
.85% |
|
Expenses net of all reductions |
.84% |
.84% |
.87% |
.92% |
.84% |
|
Net investment income (loss) |
.89% |
.58% |
.39% |
(.01)% |
.03% |
|
Supplemental Data |
|
|
|
|
|
|
Net assets, end of period (000 omitted) |
$ 1,054,528 |
$ 1,430,581 |
$ 1,971,764 |
$ 1,484,857 |
$ 923,110 |
|
Portfolio turnover rate E |
76% |
88% |
113% |
85% |
136% |
A Total returns would have been lower if certain expenses had not been reduced during the applicable periods shown.
B Amount represents less than $.01 per share.
C Calculated based on average shares outstanding during the period.
D Fees and expenses of any underlying Fidelity Central Funds are not included in the Fund's expense ratio. The Fund indirectly bears its proportionate share of the expenses of any underlying Fidelity Central Funds.
E Amount does not include the portfolio activity of any underlying Fidelity Central Funds.
F Expense ratios reflect operating expenses of the Fund. Expenses before reductions do not reflect amounts reimbursed by the investment adviser or reductions from brokerage service arrangements or reductions from other expense offset arrangements and do not represent the amount paid by the Fund during periods when reimbursements or reductions occur. Expenses net of fee waivers reflect expenses after reimbursement by the investment adviser but prior to reductions from brokerage service arrangements or other expense offset arrangements. Expenses net of all reductions represent the net expenses paid by the Fund.
G For the year ended February 29.
See accompanying notes which are an integral part of the financial statements.
Annual Report
Notes to Financial Statements
For the period ended February 28, 2013
1. Organization.
Energy Portfolio, Energy Service Portfolio, Natural Gas Portfolio, and Natural Resources Portfolio (the Funds) are funds of Fidelity Select Portfolios (the Trust). Energy Portfolio, Energy Service Portfolio and Natural Gas Portfolio are non-diversified funds. The Trust is registered under the Investment Company Act of 1940, as amended (the 1940 Act), as an open-end management investment company organized as a Massachusetts business trust. The Funds invest primarily in securities of companies whose principal business activities fall within specific industries. Each Fund is authorized to issue an unlimited number of shares. The Natural Resources Portfolio may also invest in certain precious metals. Certain Funds' investments in emerging markets can be subject to social, economic, regulatory, and political uncertainties and can be extremely volatile.
2. Investments in Fidelity Central Funds.
The Funds invest in Fidelity Central Funds, which are open-end investment companies available only to other investment companies and accounts managed by Fidelity Management & Research Company (FMR) and its affiliates. The Funds' Schedules of Investments list each of the Fidelity Central Funds held as of period end, if any, as an investment of each Fund, but do not include the underlying holdings of each Fidelity Central Fund. As an Investing Fund, each Fund indirectly bears its proportionate share of the expenses of the underlying Fidelity Central Funds.
The Money Market Central Funds seek preservation of capital and current income and are managed by Fidelity Investments Money Management, Inc. (FIMM), an affiliate of FMR.
A complete unaudited list of holdings for each Fidelity Central Fund is available upon request or at the Securities and Exchange Commission (the SEC) website at www.sec.gov. In addition, the financial statements of the Fidelity Central Funds, which are not covered by the Funds' Report of Independent Registered Public Accounting Firm, are available on the SEC website or upon request.
3. Significant Accounting Policies.
The financial statements have been prepared in conformity with accounting principles generally accepted in the United States of America (GAAP), which require management to make certain estimates and assumptions at the date of the financial statements. Actual results could differ from those estimates. Subsequent events, if any, through the date that the financial statements were issued have been evaluated in the preparation of the financial statements. The following summarizes the significant accounting policies of the Funds:
Investment Valuation. Investments are valued as of 4:00 p.m. Eastern time on the last calendar day of the period. In accordance with valuation policies and procedures approved by the Board of Trustees (the Board), each Fund attempts to obtain prices from one or more third party pricing vendors or brokers to value its investments. When current market prices, quotations or currency exchange rates are not readily available or reliable, investments will be fair valued in good faith by the FMR Fair Value Committee (the Committee), in accordance with procedures adopted by each Fund's Board. Factors used in determining fair value vary by investment type and may include market or investment specific events, changes in interest rates and quality. The frequency with which these procedures are used cannot be predicted and they may be utilized to a significant extent. The Committee oversees each Fund's valuation policies and procedures and is responsible for approving and reporting to the Board all fair value determinations.
Each Fund categorizes the inputs to valuation techniques used to value their investments into a disclosure hierarchy consisting of three levels as shown below:
Level 1 - quoted prices in active markets for identical investments
Level 2 - other significant observable inputs (including quoted prices for similar investments, interest rates, prepayment speeds, etc.)
Level 3 - unobservable inputs (including the Fund's own assumptions based on the best information available)
Valuation techniques used to value each Fund's investments by major category are as follows:
Equity securities, including restricted securities, for which market quotations are readily available, are valued at the last reported sale price or official closing price as reported by a third party pricing vendor on the primary market or exchange on which they are traded and are categorized as Level 1 in the hierarchy. In the event there were no sales during the day or closing prices are not available, securities are valued at the last quoted bid price or may be valued using the last available price and are generally categorized as Level 2 in the hierarchy. For foreign equity securities, when significant market or security specific events arise, comparisons to the valuation of American Depositary Receipts (ADRs), futures contracts, Exchange-Traded Funds (ETFs) and certain indexes as well as quoted prices for similar securities are used and are categorized as Level 2 in the hierarchy. Utilizing these techniques may result in transfers between Level 1 and Level 2. For restricted equity securities and private placements where observable inputs are limited, assumptions about market activity and risk are used and these securities are generally categorized as Level 3 in the hierarchy.
Debt securities, including restricted securities, are valued based on evaluated prices received from third party pricing vendors or from brokers who make markets in such securities. For corporate bonds, pricing vendors utilize matrix pricing which considers yield or price of bonds of comparable quality, coupon, maturity and type as well as broker-supplied prices. When independent prices are unavailable or unreliable, debt securities may be valued utilizing pricing methodologies which consider similar factors that would be used by third party pricing vendors. Debt securities are generally categorized as Level 2 in the hierarchy but may be Level 3 depending on the circumstances.
Investments in open-end mutual funds, including the Fidelity Central Funds, are valued at their closing net asset value (NAV) each business day and are categorized as Level 1 in the hierarchy.
Annual Report
Notes to Financial Statements - continued
3. Significant Accounting Policies - continued
Investment Valuation - continued
Changes in valuation techniques may result in transfers in or out of an assigned level within the disclosure hierarchy. The aggregate value of investments by input level, as of February 28, 2013, is included at the end of each applicable Fund's Schedule of Investments.
Foreign Currency. The Funds may use foreign currency contracts to facilitate transactions in foreign-denominated securities. Gains and losses from these transactions may arise from changes in the value of the foreign currency or if the counterparties do not perform under the contracts' terms.
Foreign-denominated assets, including investment securities, and liabilities are translated into U.S. dollars at the exchange rates at period end. Purchases and sales of investment securities, income and dividends received and expenses denominated in foreign currencies are translated into U.S. dollars at the exchange rate in effect on the transaction date.
The effects of exchange rate fluctuations on investments are included with the net realized and unrealized gain (loss) on investment securities. Other foreign currency transactions resulting in realized and unrealized gain (loss) are disclosed separately.
Investment Transactions and Income. For financial reporting purposes, the Funds' investment holdings and NAV include trades executed through the end of the last business day of the period. The NAV per share for processing shareholder transactions is calculated as of the close of business of the New York Stock Exchange (NYSE), normally 4:00 p.m. Eastern time and includes trades executed through the end of the prior business day. Gains and losses on securities sold are determined on the basis of identified cost and may include proceeds received from litigation. Dividend income is recorded on the ex-dividend date, except for certain dividends from foreign securities where the ex-dividend date may have passed, which are recorded as soon as the Funds are informed of the ex-dividend date. Non-cash dividends included in dividend income, if any, are recorded at the fair market value of the securities received. Distributions received on securities that represent a return of capital or capital gain are recorded as a reduction of cost of investments and/or as a realized gain. The Funds estimate the components of distributions received that may be considered return of capital distributions or capital gain distributions. Interest income and distributions from the Fidelity Central Funds are accrued as earned. Interest income includes coupon interest and amortization of premium and accretion of discount on debt securities. Investment income is recorded net of foreign taxes withheld where recovery of such taxes is uncertain.
Expenses. Expenses directly attributable to a fund are charged to that fund. Expenses attributable to more than one fund are allocated among the respective funds on the basis of relative net assets or other appropriate methods. Expense estimates are accrued in the period to which they relate and adjustments are made when actual amounts are known.
Income Tax Information and Distributions to Shareholders. Each year, each Fund intends to qualify as a regulated investment company under Subchapter M of the Internal Revenue Code, including distributing substantially all of its taxable income and realized gains. As a result, no provision for income taxes is required. As of February 28, 2013, each Fund did not have any unrecognized tax benefits in the financial statements; nor is each Fund aware of any tax positions for which it is reasonably possible that the total amounts of unrecognized tax benefits will significantly change in the next twelve months. Each Fund files a U.S. federal tax return, in addition to state and local tax returns as required. A fund's federal income tax returns are subject to examination by the Internal Revenue Service (IRS) for a period of three fiscal years after they are filed. State and local tax returns may be subject to examination for an additional fiscal year depending on the jurisdiction. Foreign taxes are provided for based on each Fund's understanding of the tax rules and rates that exist in the foreign markets in which it invests.
Distributions are declared and recorded on the ex-dividend date. Income and capital gain distributions are determined in accordance with income tax regulations, which may differ from GAAP. In addition, Energy Portfolio claimed a portion of the payment made to redeeming shareholders as a distribution for income tax purposes.
Capital accounts within the financial statements are adjusted for permanent book-tax differences. These adjustments have no impact on net assets or the results of operations. Temporary book-tax differences will reverse in a subsequent period.
Book-tax differences are primarily due to foreign currency transactions, passive foreign investment companies (PFIC), partnerships, deferred trustees compensation, net operating losses, capital loss carryforwards and losses deferred due to wash sales and excise tax regulations.
The federal tax cost of investment securities and unrealized appreciation (depreciation) as of period end were as follows for each Fund:
|
|
Tax cost |
Gross unrealized |
Gross unrealized |
Net unrealized |
|
Energy Portfolio |
$ 1,679,040,468 |
$ 520,463,069 |
$ (41,667,717) |
$ 478,795,352 |
|
Energy Service Portfolio |
1,026,105,489 |
301,869,190 |
(26,194,525) |
275,674,665 |
|
Natural Gas Portfolio |
678,873,337 |
43,273,406 |
(53,680,155) |
(10,406,749) |
|
Natural Resources Portfolio |
986,096,972 |
150,329,789 |
(51,530,441) |
98,799,348 |
Annual Report
3. Significant Accounting Policies - continued
Income Tax Information and Distributions to Shareholders - continued
The tax-based components of distributable earnings as of period end were as follows for each Fund:
|
|
Undistributed |
Undistributed |
Capital loss |
Net unrealized |
|
Energy Portfolio |
$ 4,043,370 |
$ - |
$ - |
$ 478,794,049 |
|
Energy Service Portfolio |
- |
- |
(52,550,882) |
275,674,090 |
|
Natural Gas Portfolio |
303,926 |
- |
(397,977,007) |
(10,432,676) |
|
Natural Resources Portfolio |
- |
- |
(75,404,833) |
98,797,968 |
Capital loss carryforwards are only available to offset future capital gains of the Funds to the extent provided by regulations and may be limited. Under the Regulated Investment Company Modernization Act of 2010 (the Act), the Funds are permitted to carry forward capital losses incurred in taxable years beginning after December 22, 2010 for an unlimited period and such capital losses are required to be used prior to any losses that expire. Capital loss carryforwards were as follows:
|
|
Fiscal year of expiration |
||
|
|
2018 |
2019 |
Total with expiration |
|
Natural Gas Portfolio |
$ (189,200,700) |
$ (208,776,307) |
$ (397,977,007) |
|
Natural Resources Portfolio |
(47,558,563) |
- |
(47,558,563) |
|
|
No expiration |
|
|
|
Short-term |
Total capital loss |
|
Energy Service Portfolio |
$ (52,550,882) |
$ (52,550,882) |
|
Natural Gas Portfolio |
- |
(397,977,007) |
|
Natural Resources Portfolio |
(27,846,270) |
(75,404,833) |
In addition, certain of the Funds intend to elect to defer to the fiscal year ending February 28, 2014, capital losses recognized during the period November 1, 2012 to February 28, 2013. Loss deferrals were as follows:
|
|
Capital losses |
|
Natural Gas Portfolio |
$ (4,819,155) |
The tax character of distributions paid was as follows:
|
February 28, 2013 |
|
|
|
|
|
Ordinary Income |
Long-term |
Total |
|
Energy Portfolio |
$ 18,731,365 |
$ 14,385,264 |
$ 33,116,629 |
|
Natural Gas Portfolio |
6,619,910 |
- |
6,619,910 |
|
Natural Resources Portfolio |
2,965,193 |
- |
2,965,193 |
|
February 29, 2012 |
|
|
|
Ordinary Income |
|
Energy Portfolio |
$ 19,974,612 |
|
Natural Gas Portfolio |
7,350,892 |
|
Natural Resources Portfolio |
14,586,104 |
Trading (Redemption) Fees. Shares held by investors in the Funds less than 30 days are subject to a redemption fee equal to .75% of the net asset value of shares redeemed. All redemption fees, which reduce the proceeds of the shareholder redemption, are retained by the Funds and accounted for as an addition to paid in capital.
Annual Report
Notes to Financial Statements - continued
3. Significant Accounting Policies - continued
Delayed Delivery Transactions and When-Issued Securities. During the period, the Funds transacted in securities on a delayed delivery or when-issued basis. Payment and delivery may take place after the customary settlement period for that security. The price of the underlying securities and the date when the securities will be delivered and paid for are fixed at the time the transaction is negotiated. The Funds may receive compensation for interest forgone in the purchase of a delayed delivery or when-issued security. With respect to purchase commitments, each applicable Fund identifies securities as segregated in its records with a value at least equal to the amount of the commitment. Losses may arise due to changes in the value of the underlying securities or if the counterparty does not perform under the contract's terms, or if the issuer does not issue the securities due to political, economic, or other factors.
Restricted Securities. The Funds may invest in securities that are subject to legal or contractual restrictions on resale. These securities generally may be resold in transactions exempt from registration or to the public if the securities are registered. Disposal of these securities may involve time-consuming negotiations and expense, and prompt sale at an acceptable price may be difficult. Information regarding restricted securities is included at the end of each applicable Fund's Schedule of Investments.
4. Purchases and Sales of Investments.
Purchases and sales of securities, other than short-term securities, are noted in the table below.
|
|
Purchases ($) |
Sales ($) |
|
Energy Portfolio |
1,662,015,513 |
1,994,236,374 |
|
Energy Service Portfolio |
538,443,854 |
637,472,601 |
|
Natural Gas Portfolio |
690,044,914 |
767,111,740 |
|
Natural Resources Portfolio |
866,865,233 |
1,161,813,638 |
5. Fees and Other Transactions with Affiliates.
Management Fee. FMR and its affiliates provide the Funds with investment management related services for which the Funds pay a monthly management fee. The management fee is the sum of an individual fund fee rate and an annualized group fee rate. The individual fund fee rate is applied to each Fund's average net assets. The group fee rate is based upon the average net assets of all the mutual funds advised by FMR. The group fee rate decreases as assets under management increase and increases as assets under management decrease. For the period, each Fund's annual management fee rate expressed as a percentage of each Fund's average net assets was as follows:
|
|
Individual Rate |
Group Rate |
Total |
|
Energy Portfolio |
.30% |
.26% |
.56% |
|
Energy Service Portfolio |
.30% |
.26% |
.56% |
|
Natural Gas Portfolio |
.30% |
.26% |
.56% |
|
Natural Resources Portfolio |
.30% |
.26% |
.56% |
Transfer Agent Fees. Fidelity Investments Institutional Operations Company, Inc. (FIIOC), an affiliate of FMR, is the Funds' transfer, dividend disbursing and shareholder servicing agent. FIIOC receives account fees and asset-based fees that vary according to account size and type of account. FIIOC pays for typesetting, printing and mailing of shareholder reports, except proxy statements. For the period, transfer agent fees were equivalent to the following annual rates expressed as a percentage of average net assets:
|
Energy Portfolio |
.23% |
|
Energy Service Portfolio |
.22% |
|
Natural Gas Portfolio |
.26% |
|
Natural Resources Portfolio |
.25% |
Accounting and Security Lending Fees. Fidelity Service Company, Inc. (FSC), an affiliate of FMR, maintains each Fund's accounting records. The accounting fee is based on the level of average net assets for each month. Under a separate contract, FSC administers the security lending program. The security lending fee is based on the number and duration of lending transactions.
Annual Report
5. Fees and Other Transactions with Affiliates - continued
Brokerage Commissions. Certain Funds placed a portion of their portfolio transactions with brokerage firms which are affiliates of the investment adviser. The commissions paid to these affiliated firms were as follows:
|
|
Amount |
|
Energy Portfolio |
$ 27,384 |
|
Energy Service Portfolio |
13,415 |
|
Natural Gas Portfolio |
7,751 |
|
Natural Resources Portfolio |
15,699 |
Interfund Lending Program. Pursuant to an Exemptive Order issued by the SEC, the Funds, along with other registered investment companies having management contracts with FMR, may participate in an interfund lending program. This program provides an alternative credit facility allowing the funds to borrow from, or lend money to, other participating affiliated funds. At period end, there were no interfund loans outstanding. Each applicable fund's activity in this program during the period for which loans were outstanding was as follows:
|
|
Borrower or |
Average Loan |
Weighted Average |
Interest Expense |
|
Energy Portfolio |
Borrower |
$ 7,434,222 |
.41% |
$ 1,533 |
|
Energy Service Portfolio |
Borrower |
2,516,875 |
.43% |
239 |
|
Natural Resources Portfolio |
Borrower |
7,492,486 |
.42% |
3,030 |
6. Committed Line of Credit.
Certain Funds participate with other funds managed by FMR or an affiliate in a $4.25 billion credit facility (the "line of credit") to be utilized for temporary or emergency purposes to fund shareholder redemptions or for other short-term liquidity purposes. The participating funds have agreed to pay commitment fees on their pro-rata portion of the line of credit, which are reflected in Miscellaneous expenses on the Statement of Operations, and are as follows:
|
Energy Portfolio |
$ 5,725 |
|
Energy Service Portfolio |
3,092 |
|
Natural Gas Portfolio |
1,824 |
|
Natural Resources Portfolio |
3,232 |
During the period, there were no borrowings on this line of credit.
7. Security Lending.
Certain Funds lend portfolio securities through a lending agent from time to time in order to earn additional income. For equity securities, a lending agent is used and may loan securities to certain qualified borrowers, including Fidelity Capital Markets (FCM), a broker-dealer affiliated with the Funds. On the settlement date of the loan, each applicable Fund receives collateral (in the form of U.S. Treasury obligations, letters of credit and/or cash) against the loaned securities and maintains collateral in an amount not less than 100% of the market value of the loaned securities during the period of the loan. The market value of the loaned securities is determined at the close of business of the Funds and any additional required collateral is delivered to the Funds on the next business day. If the borrower defaults on its obligation to return the securities loaned because of insolvency or other reasons, a fund could experience delays and costs in recovering the securities loaned or in gaining access to the collateral. Any cash collateral received is invested in the Fidelity Securities Lending Cash Central Fund. The value of loaned securities and cash collateral at period end are disclosed on each applicable Fund's Statement of Assets and Liabilities. Security lending income represents the income earned on investing cash collateral, less rebates paid to borrowers and any lending agent fees associated with the loan, plus any premium payments received for lending certain types of securities. Security lending income is presented on each applicable Fund's Statement of Operations as a component of income from Fidelity Central Funds. Security lending activity as of and during the period was as follows:
|
|
Total Security |
Security Lending |
Value of Securities |
|
Energy Portfolio |
$ 458,077 |
$ 8,448 |
$ - |
|
Energy Service Portfolio |
31,600 |
993 |
- |
|
Natural Gas Portfolio |
535,824 |
7,954 |
265 |
|
Natural Resources Portfolio |
347,603 |
10,644 |
- |
Annual Report
Notes to Financial Statements - continued
8. Expense Reductions.
Many of the brokers with whom FMR places trades on behalf of certain Funds provided services to these Funds in addition to trade execution. These services included payments of expenses on behalf of each applicable Fund. In addition, through arrangements with each applicable Fund's custodian, credits realized as a result of uninvested cash balances were used to reduce each applicable Fund's expenses. All of the applicable expense reductions are noted in the table below.
|
|
Brokerage Service |
Custody |
|
Energy Portfolio |
$ 261,648 |
$ - |
|
Energy Service Portfolio |
166,565 |
24 |
|
Natural Gas Portfolio |
104,830 |
60 |
|
Natural Resources Portfolio |
163,670 |
- |
In addition, FMR reimbursed a portion of each Fund's operating expenses during the period as follows:
|
|
Reimbursement |
|
Energy Portfolio |
$ 2,333 |
|
Energy Service Portfolio |
1,053 |
|
Natural Gas Portfolio |
1,059 |
|
Natural Resources Portfolio |
2,944 |
9. Other.
The Funds' organizational documents provide former and current trustees and officers with a limited indemnification against liabilities arising in connection with the performance of their duties to the Funds. In the normal course of business, the Funds may also enter into contracts that provide general indemnifications. The Funds' maximum exposure under these arrangements is unknown as this would be dependent on future claims that may be made against the Funds. The risk of material loss from such claims is considered remote.
At the end of the period, mutual funds managed by FMR or its affiliates were the owners of record, in the aggregate, of approximately 21% of the total outstanding shares of Energy Service Portfolio.
Annual Report
Report of Independent Registered Public Accounting Firm
To the Trustees of Fidelity Select Portfolios and the Shareholders of Energy Portfolio, Energy Service Portfolio, Natural Gas Portfolio and Natural Resources Portfolio:
In our opinion, the accompanying statements of assets and liabilities, including the schedules of investments, and the related statements of operations and of changes in net assets and the financial highlights present fairly, in all material respects, the financial position of Energy Portfolio, Energy Service Portfolio, Natural Gas Portfolio and Natural Resources Portfolio (funds of Fidelity Select Portfolios) at February 28, 2013, the results of each of their operations for the year then ended, the changes in each of their net assets for each of the two years in the period then ended and the financial highlights for each of the five years in the period then ended, in conformity with accounting principles generally accepted in the United States of America. These financial statements and financial highlights (hereafter referred to as "financial statements") are the responsibility of the Fidelity Select Portfolios' management. Our responsibility is to express an opinion on these financial statements based on our audits. We conducted our audits of these financial statements in accordance with the standards of the Public Company Accounting Oversight Board (United States). Those standards require that we plan and perform the audit to obtain reasonable assurance about whether the financial statements are free of material misstatement. An audit includes examining, on a test basis, evidence supporting the amounts and disclosures in the financial statements, assessing the accounting principles used and significant estimates made by management, and evaluating the overall financial statement presentation. We believe that our audits, which included confirmation of securities at February 28, 2013 by correspondence with the custodian and brokers, provide a reasonable basis for our opinion.
PricewaterhouseCoopers LLP
Boston, Massachusetts
April 15, 2013
Annual Report
Trustees and Officers
The Trustees, Members of the Advisory Board, and executive officers of the trust and funds, as applicable, are listed below. The Board of Trustees governs each fund and is responsible for protecting the interests of shareholders. The Trustees are experienced executives who meet periodically throughout the year to oversee each fund's activities, review contractual arrangements with companies that provide services to each fund, oversee management of the risks associated with such activities and contractual arrangements, and review each fund's performance. Except for James C. Curvey, each of the Trustees oversees 234 Fidelity funds. Mr. Curvey oversees 453 Fidelity funds.
The Trustees hold office without limit in time except that (a) any Trustee may resign; (b) any Trustee may be removed by written instrument, signed by at least two-thirds of the number of Trustees prior to such removal; (c) any Trustee who requests to be retired or who has become incapacitated by illness or injury may be retired by written instrument signed by a majority of the other Trustees; and (d) any Trustee may be removed at any special meeting of shareholders by a two-thirds vote of the outstanding voting securities of the trust. Each Trustee who is not an interested person of the trust and the funds (as defined in the 1940 Act) (Independent Trustee), shall retire not later than the last day of the calendar year in which his or her 75th birthday occurs. The Independent Trustees may waive this mandatory retirement age policy with respect to individual Trustees. The executive officers and Advisory Board Members hold office without limit in time, except that any officer and Advisory Board Member may resign or may be removed by a vote of a majority of the Trustees at any regular meeting or any special meeting of the Trustees. Except as indicated, each individual has held the office shown or other offices in the same company for the past five years.
Experience, Skills, Attributes, and Qualifications of the Funds' Trustees. The Governance and Nominating Committee has adopted a statement of policy that describes the experience, qualifications, attributes, and skills that are necessary and desirable for potential Independent Trustee candidates (Statement of Policy). The Board believes that each Trustee satisfied at the time he or she was initially elected or appointed a Trustee, and continues to satisfy, the standards contemplated by the Statement of Policy. The Governance and Nominating Committee also engages professional search firms to help identify potential Independent Trustee candidates who have the experience, qualifications, attributes, and skills consistent with the Statement of Policy. From time to time, additional criteria based on the composition and skills of the current Independent Trustees, as well as experience or skills that may be appropriate in light of future changes to board composition, business conditions, and regulatory or other developments, have also been considered by the professional search firms and the Governance and Nominating Committee. In addition, the Board takes into account the Trustees' commitment and participation in Board and committee meetings, as well as their leadership of standing and ad hoc committees throughout their tenure.
In determining that a particular Trustee was and continues to be qualified to serve as a Trustee, the Board has considered a variety of criteria, none of which, in isolation, was controlling. The Board believes that, collectively, the Trustees have balanced and diverse experience, qualifications, attributes, and skills, which allow the Board to operate effectively in governing each fund and protecting the interests of shareholders. Information about the specific experience, skills, attributes, and qualifications of each Trustee, which in each case led to the Board's conclusion that the Trustee should serve (or continue to serve) as a trustee of the funds, is provided below.
Board Structure and Oversight Function. James C. Curvey is an interested person (as defined in the 1940 Act) and currently serves as Chairman. The Trustees have determined that an interested Chairman is appropriate and benefits shareholders because an interested Chairman has a personal and professional stake in the quality and continuity of services provided to the funds. Independent Trustees exercise their informed business judgment to appoint an individual of their choosing to serve as Chairman, regardless of whether the Trustee happens to be independent or a member of management. The Independent Trustees have determined that they can act independently and effectively without having an Independent Trustee serve as Chairman and that a key structural component for assuring that they are in a position to do so is for the Independent Trustees to constitute a substantial majority for the Board. The Independent Trustees also regularly meet in executive session. Ned C. Lautenbach serves as Chairman of the Independent Trustees and as such (i) acts as a liaison between the Independent Trustees and management with respect to matters important to the Independent Trustees and (ii) with management prepares agendas for Board meetings.
Fidelity funds are overseen by different Boards of Trustees. The funds' Board oversees Fidelity's equity and high income funds and another Board oversees Fidelity's investment-grade bond, money market, and asset allocation funds. The asset allocation funds may invest in Fidelity funds overseen by the funds' Board. The use of separate Boards, each with its own committee structure, allows the Trustees of each group of Fidelity funds to focus on the unique issues of the funds they oversee, including common research, investment, and operational issues. On occasion, the separate Boards establish joint committees to address issues of overlapping consequences for the Fidelity funds overseen by each Board.
The Trustees operate using a system of committees to facilitate the timely and efficient consideration of all matters of importance to the Trustees, each fund, and fund shareholders and to facilitate compliance with legal and regulatory requirements and oversight of the funds' activities and associated risks. The Board, acting through its committees, has charged FMR and its affiliates with (i) identifying events or circumstances the occurrence of which could have demonstrably adverse effects on the funds' business and/or reputation; (ii) implementing processes and controls to lessen the possibility that such events or circumstances occur or to mitigate the effects of such events or circumstances if they do occur; and (iii) creating and maintaining a system designed to evaluate continuously business and market conditions in order to facilitate the identification and implementation processes described in (i) and (ii) above. Because the day-to-day operations and activities of the funds are carried out by or through FMR, its affiliates and other service providers, the funds' exposure to risks is mitigated but not eliminated by the processes overseen by the Trustees. While each of the Board's committees has responsibility for overseeing different aspects of the funds' activities, oversight is exercised primarily through the Operations, Audit, and Compliance Committees. In addition, the Independent Trustees have worked with FMR to enhance the Board's oversight of investment and financial risks, legal and regulatory risks, technology risks, and operational risks, including the development of additional risk reporting to the Board. For example, a working group comprised of Independent Trustees and FMR has worked and continues to work to review the Fidelity funds' valuation-related activities, reporting and risk management. Appropriate personnel, including but not limited to the funds' Chief Compliance Officer (CCO), FMR's internal auditor, the independent accountants, the funds' Treasurer and portfolio management personnel, make periodic reports to the Board's committees, as appropriate, including an annual review of FMR's risk management program for the Fidelity funds. The responsibilities of each standing committee, including their oversight responsibilities, are described further under "Standing Committees of the Funds' Trustees."
Annual Report
The funds' Statement of Additional Information (SAI) includes more information about the Trustees. To request a free copy, call Fidelity at 1-800-544-8544.
Interested Trustees*:
Correspondence intended for each Trustee who is an interested person may be sent to Fidelity Investments, 245 Summer Street, Boston, Massachusetts 02210.
|
Name, Year of Birth; Principal Occupations and Other Relevant Experience+ |
|
|
James C. Curvey (1935) |
|
|
|
Year of Election or Appointment: 2007 Mr. Curvey is Trustee and Chairman of the Board of Trustees of certain Trusts. Mr. Curvey also serves as Trustee (2007-present) of other investment companies advised by FMR. Mr. Curvey is a Director of Fidelity Investments Money Management, Inc. (2009-present), Director of Fidelity Research & Analysis Co. (2009-present) and Director of FMR and FMR Co., Inc. (2007-present). Mr. Curvey is also Vice Chairman (2007-present) and Director of FMR LLC. In addition, Mr. Curvey serves as an Overseer for the Boston Symphony Orchestra and a member of the Trustees of Villanova University. Previously, Mr. Curvey was the Vice Chairman (2006-2007) and Director (2000-2007) of FMR Corp. |
|
Ronald P. O'Hanley (1957) |
|
|
|
Year of Election or Appointment: 2011 Mr. O'Hanley is Director of FMR Co., Inc. (2010-present), Director of Fidelity Investments Money Management, Inc. (2010-present), Director of Fidelity Research & Analysis Company (2010-present), President of Fidelity Asset Management and Corporate Services and a member of Fidelity's Executive Committee (2010-present). Previously, Mr. O'Hanley served as President and Chief Executive Officer of BNY Mellon Asset Management (2007-2010). Mr. O'Hanley also served as Vice Chairman of Bank New York Mellon Corp. and a member of that firm's Executive Committee. Prior to the 2007 merger of The Bank of New York and Mellon Financial Corporation, he was Vice Chairman of Mellon Financial Corporation and President and Chief Executive Officer of Mellon Asset Management. He joined Mellon in February 1997. Mr. O'Hanley currently serves as Chairman of the Boston Public Library Foundation Board of Directors and sits on the Board of Directors of Beth Israel Deaconess Medical Center, the Board of Trustees of the Marine Biological Laboratory and the Advisory Board of the Maxwell School of Citizenship and Public Administration at Syracuse University. Mr. O'Hanley also chairs the Council on Asset Management for the Financial Services Roundtable and is a member of the Board of Directors of Institutional Investor's U.S. Institute. |
* Trustees have been determined to be "Interested Trustees" by virtue of, among other things, their affiliation with the trust or various entities under common control with FMR.
+ The information above includes each Trustee's principal occupation during the last five years and other information relating to the experience, attributes, and skills relevant to each Trustee's qualifications to serve as a Trustee, which led to the conclusion that each Trustee should serve as a Trustee for each fund.
Independent Trustees:
Correspondence intended for each Independent Trustee (that is, the Trustees other than the Interested Trustees) may be sent to Fidelity Investments, P.O. Box 55235, Boston, Massachusetts 02205-5235.
|
Name, Year of Birth; Principal Occupations and Other Relevant Experience+ |
|
|
Dennis J. Dirks (1948) |
|
|
|
Year of Election or Appointment: 2005 Prior to his retirement in May 2003, Mr. Dirks was Chief Operating Officer and a member of the Board of The Depository Trust & Clearing Corporation (DTCC). He also served as President, Chief Operating Officer, and Board member of The Depository Trust Company (DTC) and President and Board member of the National Securities Clearing Corporation (NSCC). In addition, Mr. Dirks served as Chief Executive Officer and Board member of the Government Securities Clearing Corporation, Chief Executive Officer and Board member of the Mortgage-Backed Securities Clearing Corporation, as a Trustee and a member of the Finance Committee of Manhattan College (2005-2008), and as a Trustee and a member of the Finance Committee of AHRC of Nassau County (2006-2008). Mr. Dirks is a member of the Independent Directors Council (IDC) Governing Council (2010-present) and Board of Directors for The Brookville Center for Children's Services, Inc. (2009-present). |
|
Alan J. Lacy (1953) |
|
|
|
Year of Election or Appointment: 2008 Mr. Lacy serves as Senior Adviser (2007-present) of Oak Hill Capital Partners, L.P. (private equity). Mr. Lacy also served as Chief Executive Officer (2000-2005) and Vice Chairman (2005-2006) of Sears Holdings Corporation and Sears, Roebuck and Co. (retail). In addition, Mr. Lacy serves as a member of the Board of Directors of Dave & Buster's Entertainment, Inc. (restaurant and entertainment complexes, 2010-present), Earth Fare, Inc. (retail grocery, 2012-present), The Hillman Companies, Inc. (hardware wholesalers, 2010-present), and Bristol-Myers Squibb Company (global pharmaceuticals, 2008-present). Mr. Lacy is a member of the Board of Trustees of The National Parks Conservation Association (2006-present). Previously, Mr. Lacy served as Chairman of the Board of Trustees of the National Parks Conservation Association (2008-2011) and as a member of the Board of Directors for the Western Union Company (global money transfer, 2006-2011). |
|
Ned C. Lautenbach (1944) |
|
|
|
Year of Election or Appointment: 2000 Mr. Lautenbach is Chairman of the Independent Trustees of the Equity and High Income Funds (2006-present). Mr. Lautenbach currently serves as the Lead Director of the Eaton Corporation Board of Directors (diversified industrial, 1997-present). Mr. Lautenbach is Chairman of the Board of Directors of the Philharmonic Center for the Arts in Naples, Florida (2012-present) and a member of the Council on Foreign Relations (1994-present). Previously, Mr. Lautenbach was a Partner/Advisory Partner at Clayton, Dubilier & Rice, LLC (private equity investment, 1998-2010), as well as a Director of Sony Corporation (2006-2007). |
|
Joseph Mauriello (1944) |
|
|
|
Year of Election or Appointment: 2008 Prior to his retirement in January 2006, Mr. Mauriello served in numerous senior management positions including Deputy Chairman and Chief Operating Officer (2004-2005), and Vice Chairman of Financial Services (2002-2004) of KPMG LLP US (professional services, 1965-2005). Mr. Mauriello currently serves as a member of the Board of Directors of XL Group plc. (global insurance and re-insurance, 2006-present). Previously, Mr. Mauriello served as a Director of the Hamilton Funds of the Bank of New York (2006-2007) and of Arcadia Resources Inc. (health care services and products, 2007-2012). |
|
Robert W. Selander (1950) |
|
|
|
Year of Election or Appointment: 2011 Previously, Mr. Selander served as a Member of the Advisory Board of Fidelity's Equity and High Income Funds (2011), Executive Vice Chairman (2010), Chief Executive Officer (2009-2010), and President and Chief Executive Officer (1997-2009) of Mastercard, Inc. |
|
Cornelia M. Small (1944) |
|
|
|
Year of Election or Appointment: 2005 Ms. Small is a member of the Board of Directors (2009-present) and Chair of the Investment Committee (2010-present) of the Teagle Foundation. Ms. Small also serves on the Investment Committee of the Berkshire Taconic Community Foundation (2008-present). Previously, Ms. Small served as Chairperson (2002-2008) and a member of the Investment Committee and Chairperson (2008-2012) and a member of the Board of Trustees of Smith College. In addition, Ms. Small served as Chief Investment Officer, Director of Global Equity Investments, and a member of the Board of Directors of Scudder, Stevens & Clark and Scudder Kemper Investments. |
|
William S. Stavropoulos (1939) |
|
|
|
Year of Election or Appointment: 2001 Mr. Stavropoulos is Vice Chairman of the Independent Trustees of the Equity and High Income Funds (2006-present). Mr. Stavropoulos serves as President and Founder of the Michigan Baseball Foundation, the Great Lakes Loons (2007-present). Mr. Stavropoulos is Chairman Emeritus of the Board of Directors of The Dow Chemical Company, where he previously served in numerous senior management positions, including President, CEO (1995-2000; 2002-2004), Chairman of the Executive Committee (2000-2006), and as a member of the Board of Directors (1990-2006). Currently, Mr. Stavropoulos is a Director of Univar Inc. (global distributor of commodity and specialty chemicals, Chairman from 2010-May 2012 and Lead Director from May 2012-present), Teradata Corporation (data warehousing and technology solutions, 2008-present), Maersk Inc. (industrial conglomerate), and Tyco International, Ltd. (multinational manufacturing and services, 2007-present), and a member of the Advisory Board for Metalmark Capital LLC (private equity investment, 2005-present). Mr. Stavropoulos is an operating advisor to Clayton, Dubilier & Rice, LLC (private equity investment). In addition, Mr. Stavropoulos is a member of the University of Notre Dame Advisory Council for the College of Science, a Trustee of the Rollin L. Gerstacker Foundation, and a Director of the Naples Philharmonic Center for the Arts. Previously, Mr. Stavropoulos served as a Director of Chemical Financial Corporation (bank holding company, 1993-2012). |
|
David M. Thomas (1949) |
|
|
|
Year of Election or Appointment: 2008 |
|
Michael E. Wiley (1950) |
|
|
|
Year of Election or Appointment: 2008 Mr. Wiley also serves as a Director of Asia Pacific Exploration Consolidated (international oil and gas exploration and production, 2008-present). Mr. Wiley serves as a Director of Tesoro Corporation (independent oil refiner and marketer, 2005-present), and a Director of Bill Barrett Corporation (exploration and production, 2005-present). In addition, Mr. Wiley also serves as a Director of Post Oak Bank (privately-held bank, 2004-present). Previously, Mr. Wiley served as a member of the Board of Trustees of the University of Tulsa (2000-2006; 2007-2010), as a Senior Energy Advisor of Katzenbach Partners, LLC (consulting, 2006-2007), as an Advisory Director of Riverstone Holdings (private investment), Chairman, President, and CEO of Baker Hughes, Inc. (oilfield services, 2000-2004), and as Director of Spinnaker Exploration Company (exploration and production, 2001-2005). |
+ The information above includes each Trustee's principal occupation during the last five years and other information relating to the experience, attributes, and skills relevant to each Trustee's qualifications to serve as a Trustee, which led to the conclusion that each Trustee should serve as a Trustee for each fund.
Advisory Board Members and Executive Officers:
Correspondence intended for David A. Rosow and Garnett A. Smith may be sent to Fidelity Investments, P.O. Box 55235, Boston, Massachusetts 02205-5235. Correspondence intended for each executive officer and Peter S. Lynch may be sent to Fidelity Investments, 245 Summer Street, Boston, Massachusetts 02210.
|
Name, Year of Birth; Principal Occupation |
|
|
Peter S. Lynch (1944) |
|
|
|
Year of Election or Appointment: 2003 Member of the Advisory Board of Fidelity's Equity and High Income Funds. Mr. Lynch is Vice Chairman and a Director of FMR and FMR Co., Inc. In addition, Mr. Lynch serves as a Trustee of Boston College and as the Chairman of the Inner-City Scholarship Fund. Previously, Mr. Lynch served on the Special Olympics International Board of Directors (1997-2006). |
|
David A. Rosow (1942) |
|
|
|
Year of Election or Appointment: 2012 Member of the Advisory Board of Fidelity's Equity and High Income Funds. Chairman and Chief Executive Officer of International Golf Group, Inc. (golf course development, 1989-present). Previously, Mr. Rosow served as Chairman and Chief Executive Officer of Rosow & Company, Inc. (private investment company, 1989-2011), a Lead Director of Hudson United Bancorp (2001-2006) and as a Director of TD Banknorth (1996-2006). In addition, Mr. Rosow is a member (2008-present) and President (2009-present) of the Town Council of Palm Beach, Florida. |
|
Garnett A. Smith (1947) |
|
|
|
Year of Election or Appointment: 2012 Member of the Advisory Board of Fidelity's Equity and High Income Funds. Prior to Mr. Smith's retirement, he served as Chairman and Chief Executive Officer of Inbrand Corp. (manufacturer of personal absorbent products, 1990-1997). He also served as President (1986-1990) of Inbrand Corp. Prior to his employment with Inbrand Corp., he was employed by a retail fabric chain and North Carolina National Bank. In addition, Mr. Smith is a board member of the Jackson Hole Land Trust (2009-present). |
|
Kenneth B. Robins (1969) |
|
|
|
Year of Election or Appointment: 2008 President and Treasurer of Fidelity's Equity and High Income Funds. Mr. Robins also serves as President and Treasurer (2010-present) and Assistant Treasurer (2009-present) of other Fidelity funds and is an employee of Fidelity Investments (2004-present). Previously, Mr. Robins served as Deputy Treasurer of the Fidelity funds (2005-2008) and Treasurer and Chief Financial Officer of The North Carolina Capital Management Trust: Cash and Term Portfolios (2006-2008). |
|
Brian B. Hogan (1964) |
|
|
|
Year of Election or Appointment: 2009 Vice President of Equity and High Income Funds. Mr. Hogan also serves as President of FMR's Equity Division (2009-present). Previously, Mr. Hogan served as Senior Vice President, Equity Research of FMR (2006-2009) and as a portfolio manager. |
|
Christopher S. Bartel (1971) |
|
|
|
Year of Election or Appointment: 2009 Vice President of Fidelity's Sector and Real Estate Equity Funds. Mr. Bartel also serves as a Director, President, and Chief Executive Officer of Fidelity Management & Research (Japan) Inc. (2012-present), a Director of Fidelity Management & Research (Hong Kong) (2012-present), and Senior Vice President of Global Equity Research (2010-present). Previously, Mr. Bartel served as Senior Vice President of Equity Research (2009-2010), Managing Director of Research (2006-2009), and an analyst and portfolio manager (2000-2006). |
|
Scott C. Goebel (1968) |
|
|
|
Year of Election or Appointment: 2008 Secretary and Chief Legal Officer (CLO) of the Fidelity funds. Mr. Goebel also serves as Secretary of Fidelity Investments Money Management, Inc. (FIMM) (2010-present) and Fidelity Research and Analysis Company (FRAC) (2010-present); Secretary and CLO of The North Carolina Capital Management Trust: Cash and Term Portfolios (2008-present); General Counsel, Secretary, and Senior Vice President of FMR (2008-present) and FMR Co., Inc. (2008-present); employed by FMR LLC or an affiliate (2001-present); Chief Legal Officer of Fidelity Management & Research (Hong Kong) Limited (2008-present) and Assistant Secretary of Fidelity Management & Research (Japan) Inc. (2008-present), and Fidelity Management & Research (U.K.) Inc. (2008-present). Previously, Mr. Goebel served as Assistant Secretary of FIMM (2008-2010), FRAC (2008-2010), and the Funds (2007-2008) and as Vice President and Secretary of Fidelity Distributors Corporation (FDC) (2005-2007). |
|
William C. Coffey (1969) |
|
|
|
Year of Election or Appointment: 2009 Assistant Secretary of Fidelity's Equity and High Income Funds. Mr. Coffey also serves as Senior Vice President and Deputy General Counsel of FMR LLC (2010-present), and is an employee of Fidelity Investments. Previously, Mr. Coffey served as Vice President and Associate General Counsel of FMR LLC (2005-2009). |
|
Elizabeth Paige Baumann (1968) |
|
|
|
Year of Election or Appointment: 2012 Anti-Money Laundering (AML) Officer of the Fidelity funds. Ms. Baumann also serves as AML Officer of The North Carolina Capital Management Trust: Cash and Term Portfolios (2012-present), Chief AML Officer of FMR LLC (2012-present), and is an employee of Fidelity Investments. Previously, Ms. Baumann served as Vice President and Deputy Anti-Money Laundering Officer (2007-2012). |
|
Christine Reynolds (1958) |
|
|
|
Year of Election or Appointment: 2008 Chief Financial Officer of the Fidelity funds. Ms. Reynolds became President of Fidelity Pricing and Cash Management Services (FPCMS) in August 2008. Ms. Reynolds served as Chief Operating Officer of FPCMS (2007-2008). Previously, Ms. Reynolds served as President, Treasurer, and Anti-Money Laundering officer of the Fidelity funds (2004-2007). |
|
Joseph A. Hanlon (1968) |
|
|
|
Year of Election or Appointment: 2012 Chief Compliance Officer of Fidelity's Equity and High Income Funds. Mr. Hanlon serves as Compliance Officer of FMR, FMR Co., Inc., Fidelity Investments Money Management, Inc. (FIMM), Fidelity Research and Analysis Company (FRAC), Fidelity Management & Research (Japan) Inc., Fidelity Management & Research (U.K.) Inc., Fidelity Management & Research (Hong Kong), and Strategic Advisers, Inc. (2009-present), as Senior Vice President of the Fidelity Asset Management Division (2009-present), and is an employee of Fidelity Investments. |
|
Joseph F. Zambello (1957) |
|
|
|
Year of Election or Appointment: 2011 Deputy Treasurer of the Fidelity funds. Mr. Zambello is an employee of Fidelity Investments. Previously, Mr. Zambello served as Vice President of FMR's Program Management Group (2009-2011) and Vice President of the Transfer Agent Oversight Group (2005-2009). |
|
Adrien E. Deberghes (1967) |
|
|
|
Year of Election or Appointment: 2008 Deputy Treasurer of Fidelity's Equity and High Income Funds. Mr. Deberghes also serves as Vice President (2011-present) and Assistant Treasurer (2010-present) of other Fidelity funds, and is an employee of Fidelity Investments (2008-present). Previously, Mr. Deberghes served as Senior Vice President of Mutual Fund Administration at State Street Corporation (2007-2008), Senior Director of Mutual Fund Administration at Investors Bank & Trust (2005-2007), and Director of Finance for Dunkin' Brands (2000-2005). |
|
Stephen Sadoski (1971) |
|
|
|
Year of Election or Appointment: 2012 Deputy Treasurer of Fidelity's Equity and High Income Funds. Mr. Sadoski also serves as Deputy Treasurer of other Fidelity funds (2013-present) and is an employee of Fidelity Investments (2012-present). Previously, Mr. Sadoski served as Assistant Treasurer of Fidelity's Fixed Income and Asset Allocation Funds (2012-2013), an assistant chief accountant in the Division of Investment Management of the Securities and Exchange Commission (SEC) (2009-2012) and as a senior manager at Deloitte & Touche (1997-2009). |
|
Stacie Smith (1974) |
|
|
|
Year of Election or Appointment: 2013 Deputy Treasurer of Fidelity's Equity and High Income Funds. Ms. Smith is an employee of Fidelity Investments (2009-present). Previously, Ms. Smith served as Senior Audit Manager of Ernst & Young LLP (1996-2009). |
|
Stephanie J. Dorsey (1969) |
|
|
|
Year of Election or Appointment: 2010 Assistant Treasurer of Fidelity's Equity and High Income Funds. Ms. Dorsey also serves as President and Treasurer (2013-present) and Assistant Treasurer (2012-present) of other Fidelity funds and is an employee of Fidelity Investments (2008-present). Previously, Ms. Dorsey served as Deputy Treasurer of Fidelity's Fixed Income and Asset Allocation Funds (2008-2013), Treasurer (2004-2008) of the JPMorgan Mutual Funds and Vice President (2004-2008) of JPMorgan Chase Bank. |
|
John R. Hebble (1958) |
|
|
|
Year of Election or Appointment: 2009 Assistant Treasurer of Fidelity's Equity and High Income Funds. Mr. Hebble also serves as President (2011-present), Treasurer, and Chief Financial Officer of The North Carolina Capital Management Trust: Cash and Term Portfolios (2008-present) and is an employee of Fidelity Investments. Previously, Mr. Hebble served as President and Treasurer of Fidelity's Fixed Income and Asset Allocation Funds (2008-2013). |
|
Gary W. Ryan (1958) |
|
|
|
Year of Election or Appointment: 2005 Assistant Treasurer of the Fidelity funds. Mr. Ryan is an employee of Fidelity Investments. Previously, Mr. Ryan served as Vice President of Fund Reporting in Fidelity Pricing and Cash Management Services (FPCMS) (1999-2005). |
|
Jonathan Davis (1968) |
|
|
|
Year of Election or Appointment: 2010 Assistant Treasurer of the Fidelity funds. Mr. Davis is also Assistant Treasurer of Fidelity Rutland Square Trust II and Fidelity Commonwealth Trust II. Mr. Davis is an employee of Fidelity Investments. Previously, Mr. Davis served as Vice President and Associate General Counsel of FMR LLC (2003-2010). |
Annual Report
Distributions (Unaudited)
The Board of Trustees of each fund voted to pay to shareholders of record at the opening of business on record date the following distributions per share derived from capital gains realized from sales of portfolio securities and dividends derived from net investment income:
|
|
Pay Date |
Record Date |
Dividends |
Capital Gains |
|
Energy Portfolio |
04/08/13 |
04/05/13 |
$0.077 |
$0.034 |
|
Energy Service Portfolio |
04/08/13 |
04/05/13 |
$0.000 |
$0.000 |
|
Natural Gas Portfolio |
04/08/13 |
04/05/13 |
$0.017 |
$0.000 |
|
Natural Resources Portfolio |
04/08/13 |
04/05/13 |
$0.000 |
$0.000 |
The funds hereby designate as capital gain dividend the amounts noted below for the taxable year ended February 28, 2013, or, if subsequently determined to be different, the net capital gain of such year.
|
Energy Portfolio |
$10,903,316 |
A percentage of the dividends distributed during the fiscal year for the following funds qualify for the dividends-received deduction for corporate shareholders:
|
|
April 2012 |
December 21, 2012 |
December 27, 2012 |
|
Energy Portfolio |
0% |
100% |
0% |
|
Natural Gas Portfolio |
100% |
100% |
0% |
|
Natural Resources Portfolio |
0% |
100% |
100% |
A percentage of the dividends distributed during the fiscal year for the following funds may be taken into account as a dividend for purposes of the maximum rate under section 1(h) (11) of the Internal Revenue Code:
|
|
April 2012 |
December 21, 2012 |
December 27, 2012 |
|
Energy Portfolio |
0% |
100% |
0% |
|
Natural Gas Portfolio |
100% |
100% |
0% |
|
Natural Resources Portfolio |
0% |
100% |
100% |
The funds will notify shareholders in January 2014 of amounts for use in preparing 2013 income tax returns.
Annual Report
Board Approval of Investment Advisory Contracts and Management Fees
Energy Portfolio
Energy Service Portfolio
Natural Gas Portfolio
Natural Resources Portfolio
On November 14, 2012, the Board of Trustees, including the Independent Trustees (together, the Board), voted to approve a new management contract (the New Contracts) between each fund and Fidelity SelectCo, LLC (SelectCo) and to submit the New Contracts to shareholders for their approval. If the New Contracts are approved by shareholders, effective August 1, 2013, SelectCo will serve as investment adviser to each fund. The terms of the New Contracts are identical to those of the current management contracts with FMR (the Current Contracts), except with respect to the name of the investment adviser and the dates of execution and the initial two-year term of the contract. The Board, assisted by the advice of fund counsel and Independent Trustees' counsel, considered a broad range of information.
In determining whether to approve the New Contracts for the funds, the Board was aware that shareholders in the funds have a broad range of investment choices available to them, including a wide choice among mutual funds offered by competitors to Fidelity, and that each fund's shareholders, with the opportunity to review and weigh the disclosure provided by the fund in its prospectus and other public disclosures, have chosen to invest in the fund, managed by Fidelity.
Nature, Extent, and Quality of Services Provided. The Board considered the nature, quality, cost and extent of the services to be provided by SelectCo under the New Contracts as well as the nature, quality, cost and extent of the advisory, administrative, distribution and shareholder services performed by the FMR and the sub-advisers, and by affiliated companies. The Board considered that, upon shareholder approval, SelectCo will render the same services to the funds under the New Contracts that FMR currently renders to the funds under the Current Contracts. The Board also considered that the New Contracts would not result in any changes to (i) the investment process or strategies employed in the management of the funds' assets or (ii) the day-to-day management of the funds or the persons primarily responsible for such management.
Throughout the year, the Trustees had discussions with FMR about plans to establish SelectCo as a new investment adviser to manage sector-based funds and products. The Trustees considered Fidelity's rationale for creating a separate investment adviser and noted that a separate investment adviser may be better positioned to focus on opportunities for growth within the sector investing space and to focus on a distinct approach to sector investing and research.
Shareholder and Administrative Services. The Board noted that the growth of fund assets across the complex allows Fidelity to reinvest in the development of services designed to enhance the value or convenience of the Fidelity funds as investment vehicles. These services include 24-hour access to account information and market information through phone representatives and over the Internet, and investor education materials and asset allocation tools.
Investment in a Large Fund Family. The Board considered the benefits to shareholders of investing in a Fidelity fund, including the benefits of investing in a fund that is part of a large family of funds offering a variety of investment disciplines and providing for a large variety of mutual fund shareholder services.
Investment Performance. The Board did not consider performance to be a material factor in its decision to approve the New Contracts because the New Contracts would not result in any changes to the funds' investment processes or strategies or in the persons primarily responsible for the day-to-day management of the funds.
Based on its review, the Board concluded that the nature, extent, and quality of the services provided to each fund will benefit the fund's shareholders, particularly in light of the Board's view that the fund's shareholders benefit from investing in a fund that is part of a large family of funds offering a variety of investment disciplines and services.
Competitiveness of Management Fee and Total Fund Expenses. The Board considered that, if approved by shareholders, the New Contracts would not result in any changes to the amount of the management fees paid by the funds, except that such fees would be paid to SelectCo rather than FMR. The Board noted that at previous meetings during the year it received and considered materials relating to its review of the management fee of each fund. This information includes comparisons that focus on a fund's standing relative to the total universe of comparable funds available to investors in terms of gross management fees before expense reimbursements or caps, as well as a fund's standing relative to non-Fidelity funds similar in size to the fund within the comparison group.
Based on its review, the Board concluded that each fund's management fee was fair and reasonable in light of the services that the fund receives and the other factors considered.
Annual Report
Board Approval of Investment Advisory Contracts and Management Fees - continued
Because there are no expected changes in the funds' management fees under the New Contracts, the Board will review each fund's total expenses compared to competitive fund median expenses in connection with its future consideration of the renewal of the funds' management contracts and sub-advisory agreements.
In its review of total expenses, the Board also noted that at previous meetings during the year it received and considered materials relating to its review of total expenses for each Fidelity fund. This information includes Fidelity fee structures and other information with respect to clients of FMR and its affiliates, such as other mutual funds advised or sub-advised by FMR or its affiliates, pension plan clients, and other institutional clients.
Costs of the Services and Profitability. Because there were no changes to the services to be provided or fees to be charged to the funds under the New Contracts, the Board did not consider data regarding the impact on Fidelity's costs of services, revenues, or profitability from the new arrangements to be a significant factor in its decision.
In connection with its future consideration of the renewal of each fund's management contract and sub-advisory agreements, the Board will consider the revenues earned and the expenses incurred by Fidelity in conducting the business of developing, marketing, distributing, managing, administering and servicing the funds and their shareholders.
Economies of Scale. The Board recognized that the New Contracts, like the Current Contracts, incorporate a "group fee" structure, which provides for lower fee rates as total fund assets under FMR's management increase, and for higher fee rates as total fund assets under FMR's management decrease. The Board considered that the group fee is designed to deliver the benefits of economies of scale to fund shareholders when total fund assets increase, even if assets of any particular fund are unchanged or have declined, because some portion of Fidelity's costs are attributable to services provided to all Fidelity funds, and all funds benefit if those costs can be allocated among more assets. The Board concluded that, given the group fee structure, fund shareholders will achieve a certain level of economies of scale as assets under FMR's management increase at the fund complex level, regardless of whether Fidelity achieves any such economies of scale.
In connection with its future consideration of the renewal of each fund's management contract and sub-advisory agreements, the Board will consider whether there have been economies of scale in respect of the management of the Fidelity funds, whether the Fidelity funds (including the funds) have appropriately benefited from any such economies of scale, and whether there is potential for realization of any further economies of scale.
Based on its evaluation of all of the conclusions noted above, and after considering all material factors, the Board ultimately concluded that each New Contract is fair and reasonable, and that the New Contracts should be approved and submitted to the applicable funds' shareholders for their approval.
Annual Report
Investment Adviser
Fidelity Management & Research Company
Boston, MA
Investment Sub-Advisers
FMR Co., Inc.
Fidelity Management & Research
(U.K.) Inc.
Fidelity Management & Research
(Hong Kong) Limited
Fidelity Management & Research
(Japan) Inc.
General Distributor
Fidelity Distributors Corporation
Smithfield, RI
Transfer and Service Agents
Fidelity Investments Institutional Operations Company, Inc.
Boston, MA
Fidelity Service Company, Inc.
Boston, MA
Custodian
Brown Brothers Harriman & Co.
Boston, MA
Corporate Headquarters
245 Summer Street
Boston, MA 02210
1-800-544-8888
The Fidelity Telephone Connection
Mutual Fund 24-Hour Service
Exchanges/Redemptions
and Account Assistance 1-800-544-6666
Product Information 1-800-544-8888
Retirement Accounts 1-800-544-4774
(8 a.m. - 9 p.m.)
TDD Service 1-800-544-0118
for the deaf and hearing impaired
(9 a.m. - 9 p.m. Eastern time)
Fidelity Automated Service
Telephone (FAST®) 
1-800-544-5555
Automated line for quickest service

SELNR-UANNPRO-0413
1.910419.103
Fidelity®
Select Portfolios®
Utilities Sector
Utilities Portfolio
Annual Report
February 28, 2013
(Fidelity Cover Art)
Contents
|
Performance |
How the fund has done over time. |
|
|
Management's Discussion of Fund Performance |
The Portfolio Manager's review of fund performance and strategy. |
|
|
Shareholder Expense Example |
|
|
|
Investment Changes |
|
|
|
Investments |
|
|
|
Financial Statements |
|
|
|
Notes to Financial Statements |
|
|
|
Report of Independent Registered Public Accounting Firm |
|
|
|
Trustees and Officers |
|
|
|
Distributions |
|
|
|
Board Approval of Investment Advisory Contracts and Management Fees |
|
To view a fund's proxy voting guidelines and proxy voting record for the 12-month period ended June 30, visit http://www.fidelity.com/proxyvotingresults or visit the Securities and Exchange Commission's (SEC) web site at http://www.sec.gov. You may also call 1-800-544-8544 to request a free copy of the proxy voting guidelines.
Standard & Poor's, S&P and S&P 500 are registered service marks of The McGraw-Hill Companies, Inc. and have been licensed for use by Fidelity Distributors Corporation.
Other third-party marks appearing herein are the property of their respective owners.
All other marks appearing herein are registered or unregistered trademarks or service marks of FMR LLC or an affiliated company. © 2013 FMR LLC. All rights reserved.
This report and the financial statements contained herein are submitted for the general information of the shareholders of the fund. This report is not authorized for distribution to prospective investors in the fund unless preceded or accompanied by an effective prospectus.
A fund files its complete schedule of portfolio holdings with the SEC for the first and third quarters of each fiscal year on Form N-Q. Forms N-Q are available on the SEC's web site at http://www.sec.gov. A fund's Forms N-Q may be reviewed and copied at the SEC's Public Reference Room in Washington, DC. Information regarding the operation of the SEC's Public Reference Room may be obtained by calling 1-800-SEC-0330. For a complete list of a fund's portfolio holdings, view the most recent holdings listing, semiannual report, or annual report on Fidelity's web site at http://www.fidelity.com, http://www.advisor.fidelity.com, or http://www.401k.com, as applicable.
NOT FDIC INSURED • MAY LOSE VALUE • NO BANK GUARANTEE
Neither the fund nor Fidelity Distributors Corporation is a bank.
Annual Report
Utilities Portfolio
Performance: The Bottom Line
Average annual total return reflects the change in the value of an investment, assuming reinvestment of the fund's distributions from dividend income and capital gains (the profits earned upon the sale of securities that have grown in value, if any) and assuming a constant rate of performance each year. The $10,000 table and the fund's returns do not reflect the deduction of taxes that a shareholder would pay on fund distributions or the redemption of fund shares. During periods of reimbursement by Fidelity, a fund's total return will be greater than it would be had the reimbursement not occurred. How a fund did yesterday is no guarantee of how it will do tomorrow.
Average Annual Total Returns
|
Periods ended February 28, 2013 |
Past 1 |
Past 5 |
Past 10 |
|
Utilities Portfolio A |
17.46% |
3.59% |
11.69% |
A Prior to October 1, 2006, Utilities Portfolio operated under certain different investment policies. The historical performance for the fund may not represent its current investment policies.
$10,000 Over 10 Years
Let's say hypothetically that $10,000 was invested in Utilities Portfolio on February 28, 2003. The chart shows how the value of your investment would have changed, and also shows how the S&P 500® Index performed over the same period.
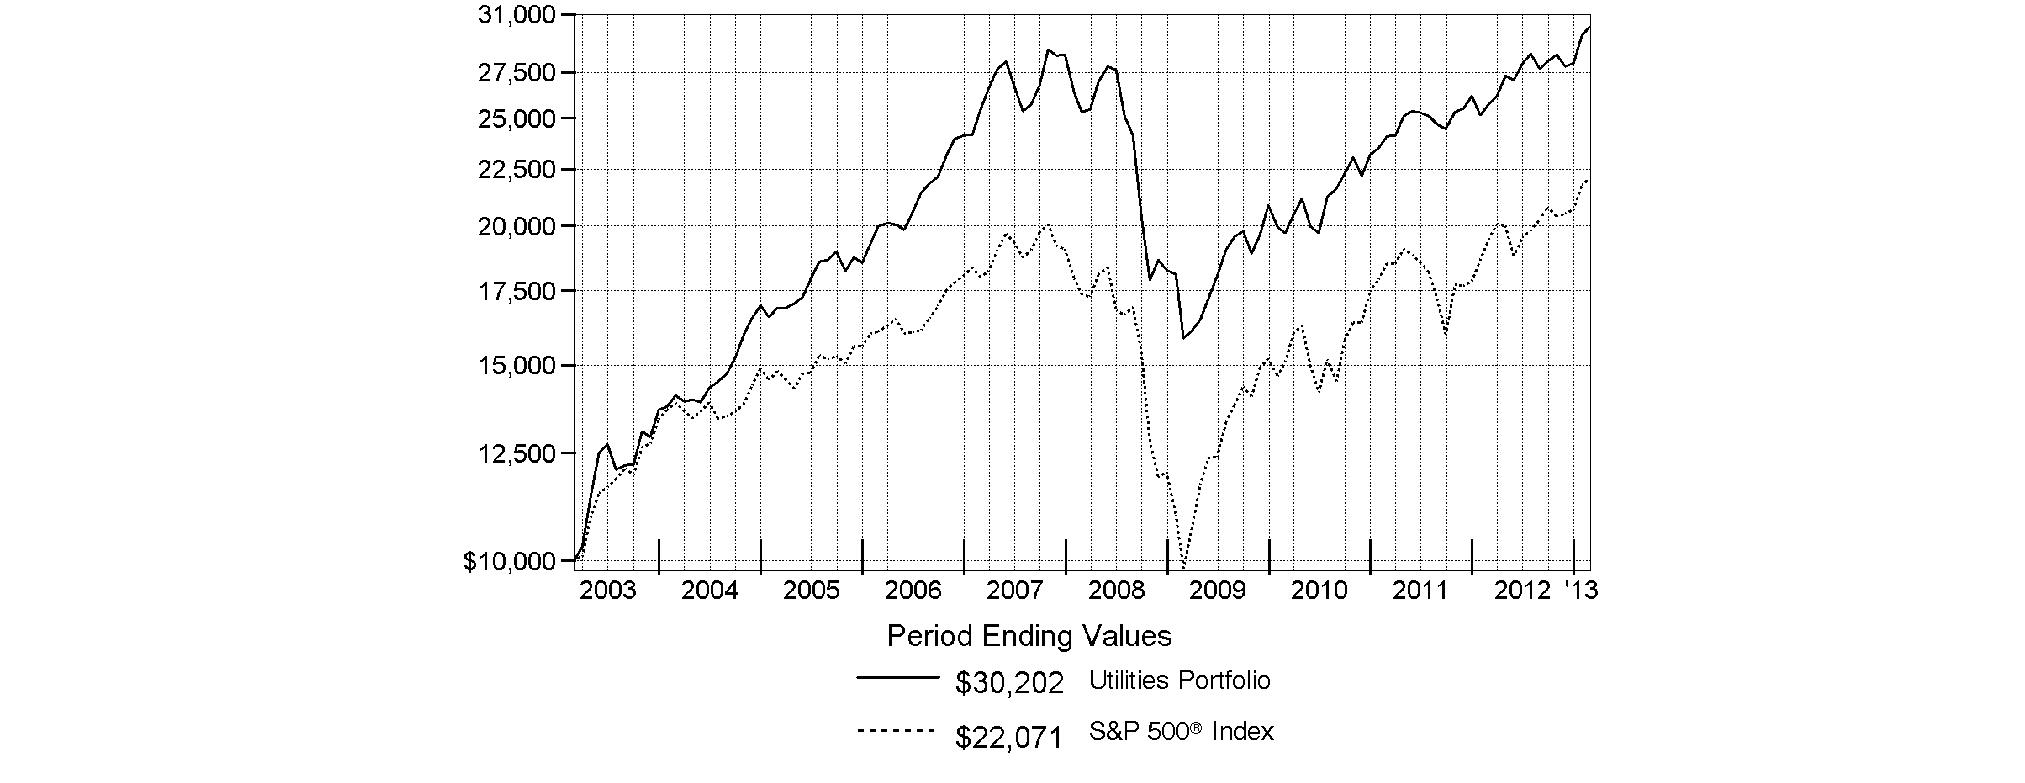
Annual Report
Utilities Portfolio
Management's Discussion of Fund Performance
Market Recap: U.S. stocks posted solid gains for the year ending February 28, 2013, sparked by a late-period rally that pushed major equity benchmarks to multiyear highs. Improvement in the global economy and more monetary stimulus from the U.S. Federal Reserve kept markets on the upswing for much of the year, shrugging off an early decline brought on by debt woes in Europe, and another dip later in the period amid Congressional gridlock on the federal budget. Renewed optimism over employment, the housing market, corporate earnings and record dividends made stocks a favorite with investors during the 12 months, which helped push the broad-based S&P 500® Index across the milestone 1,500 mark at the end of January. The S&P 500® finished the period up 13.46%. Seven of the 10 major market sectors tracked by MSCI U.S. IMI 25-50 classifications produced double-digit gains, led by health care and financials, while information technology, energy and materials trailed the broad equity market with only modest advances.
Comments from Douglas Simmons, Portfolio Manager of Utilities Portfolio: For the year, the fund advanced 17.46%, solidly outperforming the 13.06% rise of the MSCI® U.S. IMI Utilities 25-50 Index as well as the broadly based S&P 500®. Strong stock selection was the key to the fund's outperformance versus the MSCI index, with many of its holdings benefiting during a period when utilities stocks offered market-matching returns due to their attractive yields within a very low interest rate environment. We were particularly successful with our picks in electric utilities and multi-utilities, most notably our significant underweighting in Chicago-based electric utility Exelon. Weak power prices put Exelon's dividend program in jeopardy, which led me to underweight and eventually sell the stock. It also helped to have a position in out-of-benchmark oil/gas refining and marketing stock Sunoco, which was sold from the fund early in the period after news of its acquisition. Other top contributors included an overweighting in San Diego-based multi-utility Sempra Energy and investments in independent power producers NRG Energy and Calpine. On the down side, the fund's very modest cash position was a drag on performance in an up market. Our positioning in gas utilities and an underweighting in multi-utilities also were slight negatives. Among individual detractors were international power company AES, with headquarters in Virginia, not owning Detroit multi-utility and outperforming index component DTE Energy, and an overweighting in Oklahoma gas utility ONEOK, which offered a solid return but underperformed the index.
The views expressed above reflect those of the portfolio manager(s) only through the end of the period as stated on the cover of this report and do not necessarily represent the views of Fidelity or any other person in the Fidelity organization. Any such views are subject to change at any time based upon market or other conditions and Fidelity disclaims any responsibility to update such views. These views may not be relied on as investment advice and, because investment decisions for a Fidelity fund are based on numerous factors, may not be relied on as an indication of trading intent on behalf of any Fidelity fund.
Annual Report
Utilities Portfolio
Shareholder Expense Example
As a shareholder of the Fund, you incur two types of costs: (1) transaction costs, including redemption fees and (2) ongoing costs, including management fees and other Fund expenses. This Example is intended to help you understand your ongoing costs (in dollars) of investing in the Fund and to compare these costs with the ongoing costs of investing in other mutual funds.
The Example is based on an investment of $1,000 invested at the beginning of the period and held for the entire period (September 1, 2012 to February 28, 2013).
Actual Expenses
The first line of the accompanying table provides information about actual account values and actual expenses. You may use the information in this line, together with the amount you invested, to estimate the expenses that you paid over the period. Simply divide your account value by $1,000.00 (for example, an $8,600 account value divided by $1,000.00 = 8.6), then multiply the result by the number in the first line under the heading entitled "Expenses Paid During Period" to estimate the expenses you paid on your account during this period. A small balance maintenance fee of $12.00 that is charged once a year may apply for certain accounts with a value of less than $2,000. This fee is not included in the table below. If it was, the estimate of expenses you paid during the period would be higher, and your ending account value lower, by this amount. In addition, the Fund, as a shareholder in the underlying Fidelity Central Funds, will indirectly bear its pro-rata share of the fees and expenses incurred by the underlying Fidelity Central Funds. These fees and expenses are not included in the Fund's annualized expense ratio used to calculate the expense estimate in the table below.
Hypothetical Example for Comparison Purposes
The second line of the accompanying table provides information about hypothetical account values and hypothetical expenses based on the Fund's actual expense ratio and an assumed rate of return of 5% per year before expenses, which is not the Fund's actual return. The hypothetical account values and expenses may not be used to estimate the actual ending account balance or expenses you paid for the period. You may use this information to compare the ongoing costs of investing in the Fund and other funds. To do so, compare this 5% hypothetical example with the 5% hypothetical examples that appear in the shareholder reports of the other funds. A small balance maintenance fee of $12.00 that is charged once a year may apply for certain accounts with a value of less than $2,000. This fee is not included in the table below. If it was, the estimate of expenses you paid during the period would be higher, and your ending account value lower, by this amount. In addition, the Fund, as a shareholder in the underlying Fidelity Central Funds, will indirectly bear its pro-rata share of the fees and expenses incurred by the underlying Fidelity Central Funds. These fees and expenses are not included in the Fund's annualized expense ratio used to calculate the expense estimate in the table below.
Please note that the expenses shown in the table are meant to highlight your ongoing costs only and do not reflect any transaction costs. Therefore, the second line of the table is useful in comparing ongoing costs only, and will not help you determine the relative total costs of owning different funds. In addition, if these transactional costs were included, your costs would have been higher.
|
|
Annualized |
Beginning |
Ending |
Expenses Paid |
|
Actual |
.83% |
$ 1,000.00 |
$ 1,092.40 |
$ 4.31 |
|
Hypothetical (5% return per year before expenses) |
|
$ 1,000.00 |
$ 1,020.68 |
$ 4.16 |
* Expenses are equal to the Fund's annualized expense ratio, multiplied by the average account value over the period, multiplied by 181/365 (to reflect the one-half year period).
Annual Report
Utilities Portfolio
Investment Changes (Unaudited)
|
Top Ten Stocks as of February 28, 2013 |
||
|
|
% of fund's |
% of fund's net assets |
|
Duke Energy Corp. |
13.7 |
14.7 |
|
American Electric Power Co., Inc. |
8.3 |
7.9 |
|
Sempra Energy |
8.2 |
4.8 |
|
Edison International |
6.4 |
7.5 |
|
The AES Corp. |
5.5 |
4.4 |
|
CenterPoint Energy, Inc. |
4.6 |
4.9 |
|
NiSource, Inc. |
4.6 |
4.6 |
|
NRG Energy, Inc. |
4.3 |
4.1 |
|
PPL Corp. |
4.2 |
0.0 |
|
Enbridge, Inc. |
4.0 |
0.0 |
|
|
63.8 |
|
|
Top Industries (% of fund's net assets) |
|||
|
As of February 28, 2013 |
|||
 |
Electric Utilities |
45.5% |
|
 |
Multi-Utilities |
22.5% |
|
 |
Independent Power Producers & Energy Traders |
12.8% |
|
 |
Oil, Gas & Consumable Fuels |
9.0% |
|
 |
Water Utilities |
4.5% |
|
 |
All Others* |
5.7% |
|

|
As of August 31, 2012 |
|||
|
Electric Utilities |
52.9% |
|
|
Multi-Utilities |
22.6% |
|
|
Independent Power Producers & Energy Traders |
13.3% |
|
|
Gas Utilities |
5.7% |
|
|
Water Utilities |
3.2% |
|
|
All Others* |
2.3% |
|

|
* Includes short-term investments and net other assets. |
Annual Report
Utilities Portfolio
Investments February 28, 2013
Showing Percentage of Net Assets
|
Common Stocks - 98.6% |
|||
|
Shares |
Value |
||
|
ELECTRIC UTILITIES - 45.5% |
|||
|
Electric Utilities - 45.5% |
|||
|
American Electric Power Co., Inc. |
942,639 |
$ 44,106,079 |
|
|
Duke Energy Corp. |
1,054,653 |
73,034,721 |
|
|
Edison International |
708,712 |
34,039,437 |
|
|
FirstEnergy Corp. |
519,654 |
20,515,940 |
|
|
ITC Holdings Corp. |
93,805 |
7,928,399 |
|
|
NextEra Energy, Inc. |
269,286 |
19,353,585 |
|
|
Northeast Utilities |
393,777 |
16,345,683 |
|
|
OGE Energy Corp. |
85,663 |
4,960,744 |
|
|
PPL Corp. |
718,710 |
22,150,642 |
|
|
|
242,435,230 |
||
|
GAS UTILITIES - 4.3% |
|||
|
Gas Utilities - 4.3% |
|||
|
National Fuel Gas Co. |
104,676 |
6,091,096 |
|
|
ONEOK, Inc. |
286,371 |
12,883,831 |
|
|
Questar Corp. |
164,100 |
3,857,991 |
|
|
|
22,832,918 |
||
|
INDEPENDENT POWER PRODUCERS & ENERGY TRADERS - 12.8% |
|||
|
Independent Power Producers & Energy Traders - 12.8% |
|||
|
Calpine Corp. (a) |
861,726 |
15,855,758 |
|
|
NRG Energy, Inc. |
955,890 |
22,941,360 |
|
|
The AES Corp. |
2,521,802 |
29,303,339 |
|
|
|
68,100,457 |
||
|
MULTI-UTILITIES - 22.5% |
|||
|
Multi-Utilities - 22.5% |
|||
|
Ameren Corp. |
228,663 |
7,726,523 |
|
|
CenterPoint Energy, Inc. |
1,143,164 |
24,498,005 |
|
|
NiSource, Inc. |
879,923 |
24,373,867 |
|
|
PG&E Corp. |
450,597 |
19,213,456 |
|
|
Sempra Energy |
562,885 |
43,769,938 |
|
|
|
119,581,789 |
||
|
OIL, GAS & CONSUMABLE FUELS - 9.0% |
|||
|
Oil & Gas Storage & Transport - 9.0% |
|||
|
Cheniere Energy, Inc. (a) |
269,492 |
5,740,180 |
|
|
|
|||
|
Shares |
Value |
||
|
Enbridge, Inc. |
478,500 |
$ 21,334,720 |
|
|
Spectra Energy Corp. |
714,024 |
20,735,257 |
|
|
|
47,810,157 |
||
|
WATER UTILITIES - 4.5% |
|||
|
Water Utilities - 4.5% |
|||
|
American Water Works Co., Inc. |
443,560 |
17,498,442 |
|
|
Companhia de Saneamento Basico do Estado de Sao Paulo (SABESP) sponsored ADR |
136,776 |
6,614,487 |
|
|
|
24,112,929 |
||
|
TOTAL COMMON STOCKS (Cost $489,757,873) |
|
||
|
Money Market Funds - 1.5% |
|||
|
|
|
|
|
|
Fidelity Cash Central Fund, 0.16% (b) |
7,992,688 |
|
|
|
TOTAL INVESTMENT PORTFOLIO - 100.1% (Cost $497,750,561) |
532,866,168 |
|
|
NET OTHER ASSETS (LIABILITIES) - (0.1)% |
(483,951) |
|
|
NET ASSETS - 100% |
$ 532,382,217 |
|
|
Legend |
|
(a) Non-income producing |
|
(b) Affiliated fund that is generally available only to investment companies and other accounts managed by Fidelity Investments. The rate quoted is the annualized seven-day yield of the fund at period end. A complete unaudited listing of the fund's holdings as of its most recent quarter end is available upon request. In addition, each Fidelity Central Fund's financial statements, which are not covered by the Fund's Report of Independent Registered Public Accounting Firm, are available on the SEC's website or upon request. |
|
Affiliated Central Funds |
|
Information regarding fiscal year to date income earned by the Fund from investments in Fidelity Central Funds is as follows: |
|
Fund |
Income earned |
|
Fidelity Cash Central Fund |
$ 16,268 |
|
Fidelity Securities Lending Cash Central Fund |
36,716 |
|
Total |
$ 52,984 |
|
Other Information |
|
All investments are categorized as Level 1 under the Fair Value Hierarchy. The inputs or methodology used for valuing securities may not be an indication of the risk associated with investing in those securities. For more information on valuation inputs, please refer to the Investment Valuation section in the accompanying Notes to Financial Statements. |
See accompanying notes which are an integral part of the financial statements.
Annual Report
Utilities Portfolio
Financial Statements
Statement of Assets and Liabilities
|
|
February 28, 2013 |
|
|
|
|
|
|
Assets |
|
|
|
Investment in securities, at value - See accompanying schedule: Unaffiliated issuers (cost $489,757,873) |
$ 524,873,480 |
|
|
Fidelity Central Funds (cost $7,992,688) |
7,992,688 |
|
|
Total Investments (cost $497,750,561) |
|
$ 532,866,168 |
|
Receivable for investments sold |
|
5,851,907 |
|
Receivable for fund shares sold |
|
857,100 |
|
Dividends receivable |
|
2,032,935 |
|
Distributions receivable from Fidelity Central Funds |
|
6,649 |
|
Prepaid expenses |
|
1,370 |
|
Reimbursement from investment adviser for expense reductions |
|
3,285 |
|
Other receivables |
|
55,931 |
|
Total assets |
|
541,675,345 |
|
|
|
|
|
Liabilities |
|
|
|
Payable for investments purchased |
$ 8,144,350 |
|
|
Payable for fund shares redeemed |
760,862 |
|
|
Accrued management fee |
245,151 |
|
|
Other affiliated payables |
110,952 |
|
|
Other payables and accrued expenses |
31,813 |
|
|
Total liabilities |
|
9,293,128 |
|
|
|
|
|
Net Assets |
|
$ 532,382,217 |
|
Net Assets consist of: |
|
|
|
Paid in capital |
|
$ 497,641,390 |
|
Distributions in excess of net investment income |
|
(481) |
|
Accumulated undistributed net realized gain (loss) on investments and foreign currency transactions |
|
(372,878) |
|
Net unrealized appreciation (depreciation) on investments and assets and liabilities in foreign currencies |
|
35,114,186 |
|
Net Assets, for 8,721,247 shares outstanding |
|
$ 532,382,217 |
|
Net Asset Value, offering price and redemption price per share ($532,382,217 ÷ 8,721,247 shares) |
|
$ 61.04 |
Statement of Operations
|
|
Year ended February 28, 2013 |
|
|
|
|
|
|
Investment Income |
|
|
|
Dividends |
|
$ 18,065,166 |
|
Interest |
|
95 |
|
Income from Fidelity Central Funds |
|
52,984 |
|
Total income |
|
18,118,245 |
|
|
|
|
|
Expenses |
|
|
|
Management fee |
$ 3,067,076 |
|
|
Transfer agent fees |
1,202,802 |
|
|
Accounting and security lending fees |
209,105 |
|
|
Custodian fees and expenses |
11,437 |
|
|
Independent trustees' compensation |
3,740 |
|
|
Registration fees |
47,098 |
|
|
Audit |
39,126 |
|
|
Legal |
2,584 |
|
|
Interest |
477 |
|
|
Miscellaneous |
4,524 |
|
|
Total expenses before reductions |
4,587,969 |
|
|
Expense reductions |
(220,190) |
4,367,779 |
|
Net investment income (loss) |
|
13,750,466 |
|
Realized and Unrealized Gain (Loss) Net realized gain (loss) on: |
|
|
|
Investment securities: |
|
|
|
Unaffiliated issuers |
53,488,083 |
|
|
Foreign currency transactions |
5,549 |
|
|
Total net realized gain (loss) |
|
53,493,632 |
|
Change in net unrealized appreciation (depreciation) on: Investment securities |
18,563,116 |
|
|
Assets and liabilities in foreign currencies |
(1,421) |
|
|
Total change in net unrealized appreciation (depreciation) |
|
18,561,695 |
|
Net gain (loss) |
|
72,055,327 |
|
Net increase (decrease) in net assets resulting from operations |
|
$ 85,805,793 |
See accompanying notes which are an integral part of the financial statements.
Annual Report
Statement of Changes in Net Assets
|
|
Year ended |
Year ended |
|
Increase (Decrease) in Net Assets |
|
|
|
Operations |
|
|
|
Net investment income (loss) |
$ 13,750,466 |
$ 13,914,571 |
|
Net realized gain (loss) |
53,493,632 |
37,618,924 |
|
Change in net unrealized appreciation (depreciation) |
18,561,695 |
(16,724,019) |
|
Net increase (decrease) in net assets resulting from operations |
85,805,793 |
34,809,476 |
|
Distributions to shareholders from net investment income |
(5,973,646) |
(12,398,149) |
|
Share transactions |
222,822,612 |
378,621,055 |
|
Reinvestment of distributions |
5,732,879 |
11,907,757 |
|
Cost of shares redeemed |
(294,987,858) |
(348,108,330) |
|
Net increase (decrease) in net assets resulting from share transactions |
(66,432,367) |
42,420,482 |
|
Redemption fees |
13,113 |
40,172 |
|
Total increase (decrease) in net assets |
13,412,893 |
64,871,981 |
|
|
|
|
|
Net Assets |
|
|
|
Beginning of period |
518,969,324 |
454,097,343 |
|
End of period (including distributions in excess of net investment income of $481 and undistributed net investment income of $2,477,032, respectively) |
$ 532,382,217 |
$ 518,969,324 |
|
Other Information Shares |
|
|
|
Sold |
3,964,937 |
7,340,663 |
|
Issued in reinvestment of distributions |
103,651 |
231,406 |
|
Redeemed |
(5,221,879) |
(6,728,327) |
|
Net increase (decrease) |
(1,153,291) |
843,742 |
Financial Highlights
|
Years ended February 28, |
2013 |
2012 F |
2011 |
2010 |
2009 |
|
Selected Per-Share Data |
|
|
|
|
|
|
Net asset value, beginning of period |
$ 52.56 |
$ 50.28 |
$ 42.24 |
$ 34.94 |
$ 57.09 |
|
Income from Investment Operations |
|
|
|
|
|
|
Net investment income (loss) B |
1.41 |
1.43 |
1.14 |
1.21 |
.99 |
|
Net realized and unrealized gain (loss) |
7.70 |
1.99 |
8.09 |
7.34 |
(22.29) |
|
Total from investment operations |
9.11 |
3.42 |
9.23 |
8.55 |
(21.30) |
|
Distributions from net investment income |
(.63) |
(1.14) |
(1.19) |
(1.25) |
(.85) |
|
Redemption fees added to paid in capital B,G |
- |
- |
- |
- |
- |
|
Net asset value, end of period |
$ 61.04 |
$ 52.56 |
$ 50.28 |
$ 42.24 |
$ 34.94 |
|
Total Return A |
17.46% |
6.85% |
22.07% |
24.50% |
(37.47)% |
|
Ratios to Average Net Assets C,E |
|
|
|
|
|
|
Expenses before reductions |
.83% |
.86% |
.90% |
.95% |
.89% |
|
Expenses net of fee waivers, if any |
.83% |
.86% |
.90% |
.95% |
.89% |
|
Expenses net of all reductions |
.79% |
.84% |
.87% |
.93% |
.89% |
|
Net investment income (loss) |
2.49% |
2.78% |
2.46% |
2.98% |
1.95% |
|
Supplemental Data |
|
|
|
|
|
|
Net assets, end of period (000 omitted) |
$ 532,382 |
$ 518,969 |
$ 454,097 |
$ 335,992 |
$ 301,529 |
|
Portfolio turnover rate D |
158% |
202% |
238% |
226% |
167% |
A Total returns would have been lower if certain expenses had not been reduced during the applicable periods shown.
B Calculated based on average shares outstanding during the period.
C Fees and expenses of any underlying Fidelity Central Funds are not included in the Fund's expense ratio. The Fund indirectly bears its proportionate share of the expenses of any underlying Fidelity Central Funds.
D Amount does not include the portfolio activity of any underlying Fidelity Central Funds.
E Expense ratios reflect operating expenses of the Fund. Expenses before reductions do not reflect amounts reimbursed by the investment adviser or reductions from brokerage service arrangements or reductions from other expense offset arrangements and do not represent the amount paid by the Fund during periods when reimbursements or reductions occur. Expenses net of fee waivers reflect expenses after reimbursement by the investment adviser but prior to reductions from brokerage service arrangements or other expense offset arrangements. Expenses net of all reductions represent the net expenses paid by the Fund.
F For the year ended February 29.
G Amount represents less than $.01 per share.
See accompanying notes which are an integral part of the financial statements.
Annual Report
Notes to Financial Statements
For the period ended February 28, 2013
1. Organization.
Utilities Portfolio (the Fund) is a non-diversified fund of Fidelity Select Portfolios (the Trust) and is authorized to issue an unlimited number of shares. The Trust is registered under the Investment Company Act of 1940, as amended (the 1940 Act), as an open-end management investment company organized as a Massachusetts business trust. The Fund invests primarily in securities of companies whose principal business activities fall within specific industries.
2. Investments in Fidelity Central Funds.
The Fund invest in Fidelity Central Funds, which are open-end investment companies available only to other investment companies and accounts managed by Fidelity Management & Research Company (FMR) and its affiliates. The Fund's Schedule of Investments lists each of the Fidelity Central Funds held as of period end, if any, as an investment of the Fund, but does not include the underlying holdings of each Fidelity Central Fund. As an Investing Fund, the Fund indirectly bears its proportionate share of the expenses of the underlying Fidelity Central Funds.
The Money Market Central Funds seek preservation of capital and current income and are managed by Fidelity Investments Money Management, Inc. (FIMM), an affiliate of FMR.
A complete unaudited list of holdings for each Fidelity Central Fund is available upon request or at the Securities and Exchange Commission (the SEC) website at www.sec.gov. In addition, the financial statements of the Fidelity Central Funds, which are not covered by the Fund's Report of Independent Registered Public Accounting Firm, are available on the SEC website or upon request.
3. Significant Accounting Policies.
The financial statements have been prepared in conformity with accounting principles generally accepted in the United States of America (GAAP), which require management to make certain estimates and assumptions at the date of the financial statements. Actual results could differ from those estimates. Subsequent events, if any, through the date that the financial statements were issued have been evaluated in the preparation of the financial statements. The following summarizes the significant accounting policies of the Fund:
Investment Valuation. Investments are valued as of 4:00 p.m. Eastern time on the last calendar day of the period. In accordance with valuation policies and procedures approved by the Board of Trustees (the Board), the Fund attempts to obtain prices from one or more third party pricing vendors or brokers to value its investments. When current market prices, quotations or currency exchange rates are not readily available or reliable, investments will be fair valued in good faith by the FMR Fair Value Committee (the Committee), in accordance with procedures adopted by the Fund's Board. Factors used in determining fair value vary by investment type and may include market or investment specific events. The frequency with which these procedures are used cannot be predicted and they may be utilized to a significant extent. The Committee oversees the Fund's valuation policies and procedures and is responsible for approving and reporting to the Board all fair value determinations.
The Fund categorizes the inputs to valuation techniques used to value its investments into a disclosure hierarchy consisting of three levels as shown below:
Level 1 - quoted prices in active markets for identical investments
Level 2 - other significant observable inputs (including quoted prices for similar investments, interest rates, prepayment speeds, etc.)
Level 3 - unobservable inputs (including the Fund's own assumptions based on the best information available)
Valuation techniques used to value the Fund's investments by major category are as follows:
Equity securities, including restricted securities, for which market quotations are readily available, are valued at the last reported sale price or official closing price as reported by a third party pricing vendor on the primary market or exchange on which they are traded and are categorized as Level 1 in the hierarchy. In the event there were no sales during the day or closing prices are not available, securities are valued at the last quoted bid price or may be valued using the last available price and are generally categorized as Level 2 in the hierarchy. For foreign equity securities, when significant market or security specific events arise, comparisons to the valuation of American Depositary Receipts (ADRs), futures contracts, Exchange-Traded Funds (ETFs) and certain indexes as well as quoted prices for similar securities are used and are categorized as Level 2 in the hierarchy. Utilizing these techniques may result in transfers between Level 1 and Level 2.
Investments in open-end mutual funds, including the Fidelity Central Funds, are valued at their closing net asset value (NAV) each business day and are categorized as Level 1 in the hierarchy.
Changes in valuation techniques may result in transfers in or out of an assigned level within the disclosure hierarchy.
Annual Report
Notes to Financial Statements - continued
3. Significant Accounting Policies - continued
Foreign Currency. The Fund may use foreign currency contracts to facilitate transactions in foreign-denominated securities. Gains and losses from these transactions may arise from changes in the value of the foreign currency or if the counterparties do not perform under the contracts' terms.
Foreign-denominated assets, including investment securities, and liabilities are translated into U.S. dollars at the exchange rates at period end. Purchases and sales of investment securities, income and dividends received and expenses denominated in foreign currencies are translated into U.S. dollars at the exchange rate in effect on the transaction date.
The effects of exchange rate fluctuations on investments are included with the net realized and unrealized gain (loss) on investment securities. Other foreign currency transactions resulting in realized and unrealized gain (loss) are disclosed separately.
Investment Transactions and Income. For financial reporting purposes, the Fund's investment holdings and NAV include trades executed through the end of the last business day of the period. The NAV per share for processing shareholder transactions is calculated as of the close of business of the New York Stock Exchange (NYSE), normally 4:00 p.m. Eastern time and includes trades executed through the end of the prior business day. Gains and losses on securities sold are determined on the basis of identified cost and may include proceeds received from litigation. Dividend income is recorded on the ex-dividend date, except for certain dividends from foreign securities where the ex-dividend date may have passed, which are recorded as soon as the Fund is informed of the ex-dividend date. Non-cash dividends included in dividend income, if any, are recorded at the fair market value of the securities received. Interest income and distributions from the Fidelity Central Funds are accrued as earned. Interest income includes coupon interest and amortization of premium and accretion of discount on debt securities. Investment income is recorded net of foreign taxes withheld where recovery of such taxes is uncertain.
Expenses. Expenses directly attributable to a fund are charged to that fund. Expenses attributable to more than one fund are allocated among the respective funds on the basis of relative net assets or other appropriate methods. Expense estimates are accrued in the period to which they relate and adjustments are made when actual amounts are known.
Income Tax Information and Distributions to Shareholders. Each year, the Fund intends to qualify as a regulated investment company under Subchapter M of the Internal Revenue Code, including distributing substantially all of its taxable income and realized gains. As a result, no provision for income taxes is required. As of February 28, 2013, the Fund did not have any unrecognized tax benefits in the financial statements; nor is the Fund aware of any tax positions for which it is reasonably possible that the total amounts of unrecognized tax benefits will significantly change in the next twelve months. The Fund files a U.S. federal tax return, in addition to state and local tax returns as required. A fund's federal income tax returns are subject to examination by the Internal Revenue Service (IRS) for a period of three fiscal years after they are filed. State and local tax returns may be subject to examination for an additional fiscal year depending on the jurisdiction. Foreign taxes are provided for based on the Fund's understanding of the tax rules and rates that exist in the foreign markets in which it invests.
Distributions are declared and recorded on the ex-dividend date. Income and capital gain distributions are determined in accordance with income tax regulations, which may differ from GAAP. In addition, the Fund claimed a portion of the payment made to redeeming shareholders as a distribution for income tax purposes.
Capital accounts within the financial statements are adjusted for permanent book-tax differences. These adjustments have no impact on net assets or the results of operations. Temporary book-tax differences will reverse in a subsequent period.
Book-tax differences are primarily due to foreign currency transactions, partnerships, equity-debt classifications, deferred trustees compensation, capital loss carryforwards, and losses deferred due to wash sales.
The federal tax cost of investment securities and unrealized appreciation (depreciation) as of period end were as follows:
|
Gross unrealized appreciation |
$ 40,666,503 |
|
Gross unrealized depreciation |
(5,923,775) |
|
Net unrealized appreciation (depreciation) on securities and other investments |
$ 34,742,728 |
|
|
|
|
Tax Cost |
$ 498,123,440 |
The tax-based components of distributable earnings as of period end were as follows:
|
Net unrealized appreciation (depreciation) |
$ 34,741,307 |
Annual Report
3. Significant Accounting Policies - continued
Income Tax Information and Distributions to Shareholders - continued
The tax character of distributions paid was as follows:
|
|
February 28, 2013 |
February 29, 2012 |
|
Ordinary Income |
$ 5,973,646 |
$ 12,398,149 |
Trading (Redemption) Fees. Shares held by investors in the Fund less than 30 days are subject to a redemption fee equal to .75% of the net asset value of shares redeemed. All redemption fees, which reduce the proceeds of the shareholder redemption, are retained by the Fund and accounted for as an addition to paid in capital.
4. Purchases and Sales of Investments.
Purchases and sales of securities, other than short-term securities, aggregated $853,390,877 and $892,555,035, respectively.
5. Fees and Other Transactions with Affiliates.
Management Fee. FMR and its affiliates provide the Fund with investment management related services for which the Fund pays a monthly management fee. The management fee is the sum of an individual fund fee rate that is based on an annual rate of .30% of the Fund's average net assets and an annualized group fee rate that averaged .26% during the period. The group fee rate is based upon the average net assets of all the mutual funds advised by FMR. The group fee rate decreases as assets under management increase and increases as assets under management decrease. For the period, the total annual management fee rate was .56% of the Fund's average net assets.
Transfer Agent Fees. Fidelity Investments Institutional Operations Company, Inc. (FIIOC), an affiliate of FMR, is the Fund's transfer, dividend disbursing and shareholder servicing agent. FIIOC receives account fees and asset-based fees that vary according to account size and type of account. FIIOC pays for typesetting, printing and mailing of shareholder reports, except proxy statements. For the period, the transfer agent fees were equivalent to an annual rate of .22% of average net assets.
Accounting and Security Lending Fees. Fidelity Service Company, Inc. (FSC), an affiliate of FMR, maintains the Fund's accounting records. The accounting fee is based on the level of average net assets for each month. Under a separate contract, FSC administers the security lending program. The security lending fee is based on the number and duration of lending transactions.
Brokerage Commissions. The Fund placed a portion of its portfolio transactions with brokerage firms which are affiliates of the investment adviser. The commissions paid to these affiliated firms were $13,250 for the period.
Interfund Lending Program. Pursuant to an Exemptive Order issued by the SEC, the Fund, along with other registered investment companies having management contracts with FMR, may participate in an interfund lending program. This program provides an alternative credit facility allowing the funds to borrow from, or lend money to, other participating affiliated funds. At period end, there were no interfund loans outstanding. The Fund's activity in this program during the period for which loans were outstanding was as follows:
|
Borrower or Lender |
Average Loan |
Weighted Average Interest Rate |
Interest Expense |
|
Borrower |
$ 6,560,167 |
.44% |
$ 477 |
6. Committed Line of Credit.
The Fund participates with other funds managed by FMR or an affiliate in a $4.25 billion credit facility (the "line of credit") to be utilized for temporary or emergency purposes to fund shareholder redemptions or for other short-term liquidity purposes. The Fund has agreed to pay commitment fees on its pro-rata portion of the line of credit, which amounted to $1,481 and is reflected in Miscellaneous expenses on the Statement of Operations. During the period, there were no borrowings on this line of credit.
Annual Report
Notes to Financial Statements - continued
7. Security Lending.
The Fund lends portfolio securities through a lending agent from time to time in order to earn additional income. For equity securities, a lending agent is used and may loan securities to certain qualified borrowers, including Fidelity Capital Markets (FCM), a broker-dealer affiliated with the Fund. On the settlement date of the loan, the Fund receives collateral (in the form of U.S. Treasury obligations, letters of credit and/or cash) against the loaned securities and maintains collateral in an amount not less than 100% of the market value of the loaned securities during the period of the loan. The market value of the loaned securities is determined at the close of business of the Fund and any additional required collateral is delivered to the Fund on the next business day. If the borrower defaults on its obligation to return the securities loaned because of insolvency or other reasons, a fund could experience delays and costs in recovering the securities loaned or in gaining access to the collateral. Any cash collateral received is invested in the Fidelity Securities Lending Cash Central Fund. At period end, there were no security loans outstanding. Security lending income represents the income earned on investing cash collateral, less rebates paid to borrowers and any lending agent fees associated with the loan, plus any premium payments received for lending certain types of securities. Security lending income is presented in the Statement of Operations as a component of income from Fidelity Central Funds. Total security lending income during the period amounted to $36,716. During the period, there were no securities loaned to FCM.
8. Expense Reductions.
Many of the brokers with whom FMR places trades on behalf of the Fund provided services to the Fund in addition to trade execution. These services included payments of certain expenses on behalf of the Fund totaling $216,905 for the period.
In addition, FMR reimbursed a portion of the Fund's operating expenses during the period in the amount of $3,285.
9. Other.
The Fund's organizational documents provide former and current trustees and officers with a limited indemnification against liabilities arising in connection with the performance of their duties to the Fund. In the normal course of business, the Fund may also enter into contracts that provide general indemnifications. The Fund's maximum exposure under these arrangements is unknown as this would be dependent on future claims that may be made against the Fund. The risk of material loss from such claims is considered remote.
At the end of the period, Fidelity VIP FundsManager 60% Portfolio was the owner of record of approximately 12% of the total outstanding shares of Utilities Portfolio.
Annual Report
Report of Independent Registered Public Accounting Firm
To the Trustees of Fidelity Select Portfolios and the Shareholders of Utilities Portfolio:
In our opinion, the accompanying statement of assets and liabilities, including the schedule of investments, and the related statements of operations and of changes in net assets and the financial highlights present fairly, in all material respects, the financial position of Utilities Portfolio (a fund of Fidelity Select Portfolios) at February 28, 2013, the results of its operations for the year then ended, the changes in its net assets for each of the two years in the period then ended and the financial highlights for each of the five years in the period then ended, in conformity with accounting principles generally accepted in the United States of America. These financial statements and financial highlights (hereafter referred to as "financial statements") are the responsibility of the Utilities Portfolio's management. Our responsibility is to express an opinion on these financial statements based on our audits. We conducted our audits of these financial statements in accordance with the standards of the Public Company Accounting Oversight Board (United States). Those standards require that we plan and perform the audit to obtain reasonable assurance about whether the financial statements are free of material misstatement. An audit includes examining, on a test basis, evidence supporting the amounts and disclosures in the financial statements, assessing the accounting principles used and significant estimates made by management, and evaluating the overall financial statement presentation. We believe that our audits, which included confirmation of securities at February 28, 2013 by correspondence with the custodian and brokers, provide a reasonable basis for our opinion.
PricewaterhouseCoopers LLP
Boston, Massachusetts
April 12, 2013
Annual Report
Trustees and Officers
The Trustees, Members of the Advisory Board, and executive officers of the trust and fund, as applicable, are listed below. The Board of Trustees governs the fund and is responsible for protecting the interests of shareholders. The Trustees are experienced executives who meet periodically throughout the year to oversee the fund's activities, review contractual arrangements with companies that provide services to the fund, oversee management of the risks associated with such activities and contractual arrangements, and review the fund's performance. Except for James C. Curvey, each of the Trustees oversees 234 Fidelity funds. Mr. Curvey oversees 453 Fidelity funds.
The Trustees hold office without limit in time except that (a) any Trustee may resign; (b) any Trustee may be removed by written instrument, signed by at least two-thirds of the number of Trustees prior to such removal; (c) any Trustee who requests to be retired or who has become incapacitated by illness or injury may be retired by written instrument signed by a majority of the other Trustees; and (d) any Trustee may be removed at any special meeting of shareholders by a two-thirds vote of the outstanding voting securities of the trust. Each Trustee who is not an interested person of the trust and the fund (as defined in the 1940 Act) (Independent Trustee), shall retire not later than the last day of the calendar year in which his or her 75th birthday occurs. The Independent Trustees may waive this mandatory retirement age policy with respect to individual Trustees. The executive officers and Advisory Board Members hold office without limit in time, except that any officer and Advisory Board Member may resign or may be removed by a vote of a majority of the Trustees at any regular meeting or any special meeting of the Trustees. Except as indicated, each individual has held the office shown or other offices in the same company for the past five years.
Experience, Skills, Attributes, and Qualifications of the Fund's Trustees. The Governance and Nominating Committee has adopted a statement of policy that describes the experience, qualifications, attributes, and skills that are necessary and desirable for potential Independent Trustee candidates (Statement of Policy). The Board believes that each Trustee satisfied at the time he or she was initially elected or appointed a Trustee, and continues to satisfy, the standards contemplated by the Statement of Policy. The Governance and Nominating Committee also engages professional search firms to help identify potential Independent Trustee candidates who have the experience, qualifications, attributes, and skills consistent with the Statement of Policy. From time to time, additional criteria based on the composition and skills of the current Independent Trustees, as well as experience or skills that may be appropriate in light of future changes to board composition, business conditions, and regulatory or other developments, have also been considered by the professional search firms and the Governance and Nominating Committee. In addition, the Board takes into account the Trustees' commitment and participation in Board and committee meetings, as well as their leadership of standing and ad hoc committees throughout their tenure.
In determining that a particular Trustee was and continues to be qualified to serve as a Trustee, the Board has considered a variety of criteria, none of which, in isolation, was controlling. The Board believes that, collectively, the Trustees have balanced and diverse experience, qualifications, attributes, and skills, which allow the Board to operate effectively in governing the fund and protecting the interests of shareholders. Information about the specific experience, skills, attributes, and qualifications of each Trustee, which in each case led to the Board's conclusion that the Trustee should serve (or continue to serve) as a trustee of the fund, is provided below.
Board Structure and Oversight Function. James C. Curvey is an interested person (as defined in the 1940 Act) and currently serves as Chairman. The Trustees have determined that an interested Chairman is appropriate and benefits shareholders because an interested Chairman has a personal and professional stake in the quality and continuity of services provided to the fund. Independent Trustees exercise their informed business judgment to appoint an individual of their choosing to serve as Chairman, regardless of whether the Trustee happens to be independent or a member of management. The Independent Trustees have determined that they can act independently and effectively without having an Independent Trustee serve as Chairman and that a key structural component for assuring that they are in a position to do so is for the Independent Trustees to constitute a substantial majority for the Board. The Independent Trustees also regularly meet in executive session. Ned C. Lautenbach serves as Chairman of the Independent Trustees and as such (i) acts as a liaison between the Independent Trustees and management with respect to matters important to the Independent Trustees and (ii) with management prepares agendas for Board meetings.
Fidelity funds are overseen by different Boards of Trustees. The fund's Board oversees Fidelity's equity and high income funds and another Board oversees Fidelity's investment-grade bond, money market, and asset allocation funds. The asset allocation funds may invest in Fidelity funds overseen by the fund's Board. The use of separate Boards, each with its own committee structure, allows the Trustees of each group of Fidelity funds to focus on the unique issues of the funds they oversee, including common research, investment, and operational issues. On occasion, the separate Boards establish joint committees to address issues of overlapping consequences for the Fidelity funds overseen by each Board.
The Trustees operate using a system of committees to facilitate the timely and efficient consideration of all matters of importance to the Trustees, the fund, and fund shareholders and to facilitate compliance with legal and regulatory requirements and oversight of the fund's activities and associated risks. The Board, acting through its committees, has charged FMR and its affiliates with (i) identifying events or circumstances the occurrence of which could have demonstrably adverse effects on the fund's business and/or reputation; (ii) implementing processes and controls to lessen the possibility that such events or circumstances occur or to mitigate the effects of such events or circumstances if they do occur; and (iii) creating and maintaining a system designed to evaluate continuously business and market conditions in order to facilitate the identification and implementation processes described in (i) and (ii) above. Because the day-to-day operations and activities of the fund are carried out by or through FMR, its affiliates and other service providers, the fund's exposure to risks is mitigated but not eliminated by the processes overseen by the Trustees. While each of the Board's committees has responsibility for overseeing different aspects of the fund's activities, oversight is exercised primarily through the Operations, Audit, and Compliance Committees. In addition, the Independent Trustees have worked with FMR to enhance the Board's oversight of investment and financial risks, legal and regulatory risks, technology risks, and operational risks, including the development of additional risk reporting to the Board. For example, a working group comprised of Independent Trustees and FMR has worked and continues to work to review the Fidelity funds' valuation-related activities, reporting and risk management. Appropriate personnel, including but not limited to the fund's Chief Compliance Officer (CCO), FMR's internal auditor, the independent accountants, the fund's Treasurer and portfolio management personnel, make periodic reports to the Board's committees, as appropriate, including an annual review of FMR's risk management program for the Fidelity funds. The responsibilities of each standing committee, including their oversight responsibilities, are described further under "Standing Committees of the Fund's Trustees."
Annual Report
Trustees and Officers - continued
The fund's Statement of Additional Information (SAI) includes more information about the Trustees. To request a free copy, call Fidelity at 1-800-544-8544.
Interested Trustees*:
Correspondence intended for each Trustee who is an interested person may be sent to Fidelity Investments, 245 Summer Street, Boston, Massachusetts 02210.
|
Name, Year of Birth; Principal Occupations and Other Relevant Experience+ |
|
|
James C. Curvey (1935) |
|
|
|
Year of Election or Appointment: 2007 Mr. Curvey is Trustee and Chairman of the Board of Trustees of certain Trusts. Mr. Curvey also serves as Trustee (2007-present) of other investment companies advised by FMR. Mr. Curvey is a Director of Fidelity Investments Money Management, Inc. (2009-present), Director of Fidelity Research & Analysis Co. (2009-present) and Director of FMR and FMR Co., Inc. (2007-present). Mr. Curvey is also Vice Chairman (2007-present) and Director of FMR LLC. In addition, Mr. Curvey serves as an Overseer for the Boston Symphony Orchestra and a member of the Trustees of Villanova University. Previously, Mr. Curvey was the Vice Chairman (2006-2007) and Director (2000-2007) of FMR Corp. |
|
Ronald P. O'Hanley (1957) |
|
|
|
Year of Election or Appointment: 2011 Mr. O'Hanley is Director of FMR Co., Inc. (2010-present), Director of Fidelity Investments Money Management, Inc. (2010-present), Director of Fidelity Research & Analysis Company (2010-present), President of Fidelity Asset Management and Corporate Services and a member of Fidelity's Executive Committee (2010-present). Previously, Mr. O'Hanley served as President and Chief Executive Officer of BNY Mellon Asset Management (2007-2010). Mr. O'Hanley also served as Vice Chairman of Bank New York Mellon Corp. and a member of that firm's Executive Committee. Prior to the 2007 merger of The Bank of New York and Mellon Financial Corporation, he was Vice Chairman of Mellon Financial Corporation and President and Chief Executive Officer of Mellon Asset Management. He joined Mellon in February 1997. Mr. O'Hanley currently serves as Chairman of the Boston Public Library Foundation Board of Directors and sits on the Board of Directors of Beth Israel Deaconess Medical Center, the Board of Trustees of the Marine Biological Laboratory and the Advisory Board of the Maxwell School of Citizenship and Public Administration at Syracuse University. Mr. O'Hanley also chairs the Council on Asset Management for the Financial Services Roundtable and is a member of the Board of Directors of Institutional Investor's U.S. Institute. |
* Trustees have been determined to be "Interested Trustees" by virtue of, among other things, their affiliation with the trust or various entities under common control with FMR.
+ The information above includes each Trustee's principal occupation during the last five years and other information relating to the experience, attributes, and skills relevant to each Trustee's qualifications to serve as a Trustee, which led to the conclusion that each Trustee should serve as a Trustee for the fund.
Independent Trustees:
Correspondence intended for each Independent Trustee (that is, the Trustees other than the Interested Trustees) may be sent to Fidelity Investments, P.O. Box 55235, Boston, Massachusetts 02205-5235.
|
Name, Year of Birth; Principal Occupations and Other Relevant Experience+ |
|
|
Dennis J. Dirks (1948) |
|
|
|
Year of Election or Appointment: 2005 Prior to his retirement in May 2003, Mr. Dirks was Chief Operating Officer and a member of the Board of The Depository Trust & Clearing Corporation (DTCC). He also served as President, Chief Operating Officer, and Board member of The Depository Trust Company (DTC) and President and Board member of the National Securities Clearing Corporation (NSCC). In addition, Mr. Dirks served as Chief Executive Officer and Board member of the Government Securities Clearing Corporation, Chief Executive Officer and Board member of the Mortgage-Backed Securities Clearing Corporation, as a Trustee and a member of the Finance Committee of Manhattan College (2005-2008), and as a Trustee and a member of the Finance Committee of AHRC of Nassau County (2006-2008). Mr. Dirks is a member of the Independent Directors Council (IDC) Governing Council (2010-present) and Board of Directors for The Brookville Center for Children's Services, Inc. (2009-present). |
|
Alan J. Lacy (1953) |
|
|
|
Year of Election or Appointment: 2008 Mr. Lacy serves as Senior Adviser (2007-present) of Oak Hill Capital Partners, L.P. (private equity). Mr. Lacy also served as Chief Executive Officer (2000-2005) and Vice Chairman (2005-2006) of Sears Holdings Corporation and Sears, Roebuck and Co. (retail). In addition, Mr. Lacy serves as a member of the Board of Directors of Dave & Buster's Entertainment, Inc. (restaurant and entertainment complexes, 2010-present), Earth Fare, Inc. (retail grocery, 2012-present), The Hillman Companies, Inc. (hardware wholesalers, 2010-present), and Bristol-Myers Squibb Company (global pharmaceuticals, 2008-present). Mr. Lacy is a member of the Board of Trustees of The National Parks Conservation Association (2006-present). Previously, Mr. Lacy served as Chairman of the Board of Trustees of the National Parks Conservation Association (2008-2011) and as a member of the Board of Directors for the Western Union Company (global money transfer, 2006-2011). |
|
Ned C. Lautenbach (1944) |
|
|
|
Year of Election or Appointment: 2000 Mr. Lautenbach is Chairman of the Independent Trustees of the Equity and High Income Funds (2006-present). Mr. Lautenbach currently serves as the Lead Director of the Eaton Corporation Board of Directors (diversified industrial, 1997-present). Mr. Lautenbach is Chairman of the Board of Directors of the Philharmonic Center for the Arts in Naples, Florida (2012-present) and a member of the Council on Foreign Relations (1994-present). Previously, Mr. Lautenbach was a Partner/Advisory Partner at Clayton, Dubilier & Rice, LLC (private equity investment, 1998-2010), as well as a Director of Sony Corporation (2006-2007). |
|
Joseph Mauriello (1944) |
|
|
|
Year of Election or Appointment: 2008 Prior to his retirement in January 2006, Mr. Mauriello served in numerous senior management positions including Deputy Chairman and Chief Operating Officer (2004-2005), and Vice Chairman of Financial Services (2002-2004) of KPMG LLP US (professional services, 1965-2005). Mr. Mauriello currently serves as a member of the Board of Directors of XL Group plc. (global insurance and re-insurance, 2006-present). Previously, Mr. Mauriello served as a Director of the Hamilton Funds of the Bank of New York (2006-2007) and of Arcadia Resources Inc. (health care services and products, 2007-2012). |
|
Robert W. Selander (1950) |
|
|
|
Year of Election or Appointment: 2011 Previously, Mr. Selander served as a Member of the Advisory Board of Fidelity's Equity and High Income Funds (2011), Executive Vice Chairman (2010), Chief Executive Officer (2009-2010), and President and Chief Executive Officer (1997-2009) of Mastercard, Inc. |
|
Cornelia M. Small (1944) |
|
|
|
Year of Election or Appointment: 2005 Ms. Small is a member of the Board of Directors (2009-present) and Chair of the Investment Committee (2010-present) of the Teagle Foundation. Ms. Small also serves on the Investment Committee of the Berkshire Taconic Community Foundation (2008-present). Previously, Ms. Small served as Chairperson (2002-2008) and a member of the Investment Committee and Chairperson (2008-2012) and a member of the Board of Trustees of Smith College. In addition, Ms. Small served as Chief Investment Officer, Director of Global Equity Investments, and a member of the Board of Directors of Scudder, Stevens & Clark and Scudder Kemper Investments. |
|
William S. Stavropoulos (1939) |
|
|
|
Year of Election or Appointment: 2001 Mr. Stavropoulos is Vice Chairman of the Independent Trustees of the Equity and High Income Funds (2006-present). Mr. Stavropoulos serves as President and Founder of the Michigan Baseball Foundation, the Great Lakes Loons (2007-present). Mr. Stavropoulos is Chairman Emeritus of the Board of Directors of The Dow Chemical Company, where he previously served in numerous senior management positions, including President, CEO (1995-2000; 2002-2004), Chairman of the Executive Committee (2000-2006), and as a member of the Board of Directors (1990-2006). Currently, Mr. Stavropoulos is a Director of Univar Inc. (global distributor of commodity and specialty chemicals, Chairman from 2010-May 2012 and Lead Director from May 2012-present), Teradata Corporation (data warehousing and technology solutions, 2008-present), Maersk Inc. (industrial conglomerate), and Tyco International, Ltd. (multinational manufacturing and services, 2007-present), and a member of the Advisory Board for Metalmark Capital LLC (private equity investment, 2005-present). Mr. Stavropoulos is an operating advisor to Clayton, Dubilier & Rice, LLC (private equity investment). In addition, Mr. Stavropoulos is a member of the University of Notre Dame Advisory Council for the College of Science, a Trustee of the Rollin L. Gerstacker Foundation, and a Director of the Naples Philharmonic Center for the Arts. Previously, Mr. Stavropoulos served as a Director of Chemical Financial Corporation (bank holding company, 1993-2012). |
|
David M. Thomas (1949) |
|
|
|
Year of Election or Appointment: 2008 Previously, Mr. Thomas served as Executive Chairman (2005-2006) and Chairman and Chief Executive Officer (2000-2005) of IMS Health, Inc. (pharmaceutical and healthcare information solutions), and a Director of Fortune Brands, Inc. (consumer products, 2000-2011). In addition, Mr. Thomas serves as Non-Executive Chairman of the Board of Directors of Fortune Brands Home and Security (home and security products, 2011-present), and as a member of the Board of Directors of Interpublic Group of Companies, Inc. (marketing communication, 2004-present). |
|
Michael E. Wiley (1950) |
|
|
|
Year of Election or Appointment: 2008 Mr. Wiley also serves as a Director of Asia Pacific Exploration Consolidated (international oil and gas exploration and production, 2008-present). Mr. Wiley serves as a Director of Tesoro Corporation (independent oil refiner and marketer, 2005-present), and a Director of Bill Barrett Corporation (exploration and production, 2005-present). In addition, Mr. Wiley also serves as a Director of Post Oak Bank (privately-held bank, 2004-present). Previously, Mr. Wiley served as a member of the Board of Trustees of the University of Tulsa (2000-2006; 2007-2010), as a Senior Energy Advisor of Katzenbach Partners, LLC (consulting, 2006-2007), as an Advisory Director of Riverstone Holdings (private investment), Chairman, President, and CEO of Baker Hughes, Inc. (oilfield services, 2000-2004), and as Director of Spinnaker Exploration Company (exploration and production, 2001-2005). |
+ The information above includes each Trustee's principal occupation during the last five years and other information relating to the experience, attributes, and skills relevant to each Trustee's qualifications to serve as a Trustee, which led to the conclusion that each Trustee should serve as a Trustee for the fund.
Advisory Board Members and Executive Officers:
Correspondence intended for David A. Rosow and Garnett A. Smith may be sent to Fidelity Investments, P.O. Box 55235, Boston, Massachusetts 02205-5235. Correspondence intended for each executive officer and Peter S. Lynch may be sent to Fidelity Investments, 245 Summer Street, Boston, Massachusetts 02210.
|
Name, Year of Birth; Principal Occupation |
|
|
Peter S. Lynch (1944) |
|
|
|
Year of Election or Appointment: 2003 Member of the Advisory Board of Fidelity's Equity and High Income Funds. Mr. Lynch is Vice Chairman and a Director of FMR and FMR Co., Inc. In addition, Mr. Lynch serves as a Trustee of Boston College and as the Chairman of the Inner-City Scholarship Fund. Previously, Mr. Lynch served on the Special Olympics International Board of Directors (1997-2006). |
|
David A. Rosow (1942) |
|
|
|
Year of Election or Appointment: 2012 Member of the Advisory Board of Fidelity's Equity and High Income Funds. Chairman and Chief Executive Officer of International Golf Group, Inc. (golf course development, 1989-present). Previously, Mr. Rosow served as Chairman and Chief Executive Officer of Rosow & Company, Inc. (private investment company, 1989-2011), a Lead Director of Hudson United Bancorp (2001-2006) and as a Director of TD Banknorth (1996-2006). In addition, Mr. Rosow is a member (2008-present) and President (2009-present) of the Town Council of Palm Beach, Florida. |
|
Garnett A. Smith (1947) |
|
|
|
Year of Election or Appointment: 2012 Member of the Advisory Board of Fidelity's Equity and High Income Funds. Prior to Mr. Smith's retirement, he served as Chairman and Chief Executive Officer of Inbrand Corp. (manufacturer of personal absorbent products, 1990-1997). He also served as President (1986-1990) of Inbrand Corp. Prior to his employment with Inbrand Corp., he was employed by a retail fabric chain and North Carolina National Bank. In addition, Mr. Smith is a board member of the Jackson Hole Land Trust (2009-present). |
|
Kenneth B. Robins (1969) |
|
|
|
Year of Election or Appointment: 2008 President and Treasurer of Fidelity's Equity and High Income Funds. Mr. Robins also serves as President and Treasurer (2010-present) and Assistant Treasurer (2009-present) of other Fidelity funds and is an employee of Fidelity Investments (2004-present). Previously, Mr. Robins served as Deputy Treasurer of the Fidelity funds (2005-2008) and Treasurer and Chief Financial Officer of The North Carolina Capital Management Trust: Cash and Term Portfolios (2006-2008). |
|
Brian B. Hogan (1964) |
|
|
|
Year of Election or Appointment: 2009 Vice President of Equity and High Income Funds. Mr. Hogan also serves as President of FMR's Equity Division (2009-present). Previously, Mr. Hogan served as Senior Vice President, Equity Research of FMR (2006-2009) and as a portfolio manager. |
|
Christopher S. Bartel (1971) |
|
|
|
Year of Election or Appointment: 2009 Vice President of Fidelity's Sector and Real Estate Equity Funds. Mr. Bartel also serves as a Director, President, and Chief Executive Officer of Fidelity Management & Research (Japan) Inc. (2012-present), a Director of Fidelity Management & Research (Hong Kong) (2012-present), and Senior Vice President of Global Equity Research (2010-present). Previously, Mr. Bartel served as Senior Vice President of Equity Research (2009-2010), Managing Director of Research (2006-2009), and an analyst and portfolio manager (2000-2006). |
|
Scott C. Goebel (1968) |
|
|
|
Year of Election or Appointment: 2008 Secretary and Chief Legal Officer (CLO) of the Fidelity funds. Mr. Goebel also serves as Secretary of Fidelity Investments Money Management, Inc. (FIMM) (2010-present) and Fidelity Research and Analysis Company (FRAC) (2010-present); Secretary and CLO of The North Carolina Capital Management Trust: Cash and Term Portfolios (2008-present); General Counsel, Secretary, and Senior Vice President of FMR (2008-present) and FMR Co., Inc. (2008-present); employed by FMR LLC or an affiliate (2001-present); Chief Legal Officer of Fidelity Management & Research (Hong Kong) Limited (2008-present) and Assistant Secretary of Fidelity Management & Research (Japan) Inc. (2008-present), and Fidelity Management & Research (U.K.) Inc. (2008-present). Previously, Mr. Goebel served as Assistant Secretary of FIMM (2008-2010), FRAC (2008-2010), and the Funds (2007-2008) and as Vice President and Secretary of Fidelity Distributors Corporation (FDC) (2005-2007). |
|
William C. Coffey (1969) |
|
|
|
Year of Election or Appointment: 2009 Assistant Secretary of Fidelity's Equity and High Income Funds. Mr. Coffey also serves as Senior Vice President and Deputy General Counsel of FMR LLC (2010-present), and is an employee of Fidelity Investments. Previously, Mr. Coffey served as Vice President and Associate General Counsel of FMR LLC (2005-2009). |
|
Elizabeth Paige Baumann (1968) |
|
|
|
Year of Election or Appointment: 2012 Anti-Money Laundering (AML) Officer of the Fidelity funds. Ms. Baumann also serves as AML Officer of The North Carolina Capital Management Trust: Cash and Term Portfolios (2012-present), Chief AML Officer of FMR LLC (2012-present), and is an employee of Fidelity Investments. Previously, Ms. Baumann served as Vice President and Deputy Anti-Money Laundering Officer (2007-2012). |
|
Christine Reynolds (1958) |
|
|
|
Year of Election or Appointment: 2008 Chief Financial Officer of the Fidelity funds. Ms. Reynolds became President of Fidelity Pricing and Cash Management Services (FPCMS) in August 2008. Ms. Reynolds served as Chief Operating Officer of FPCMS (2007-2008). Previously, Ms. Reynolds served as President, Treasurer, and Anti-Money Laundering officer of the Fidelity funds (2004-2007). |
|
Joseph A. Hanlon (1968) |
|
|
|
Year of Election or Appointment: 2012 Chief Compliance Officer of Fidelity's Equity and High Income Funds. Mr. Hanlon serves as Compliance Officer of FMR, FMR Co., Inc., Fidelity Investments Money Management, Inc. (FIMM), Fidelity Research and Analysis Company (FRAC), Fidelity Management & Research (Japan) Inc., Fidelity Management & Research (U.K.) Inc., Fidelity Management & Research (Hong Kong), and Strategic Advisers, Inc. (2009-present), as Senior Vice President of the Fidelity Asset Management Division (2009-present), and is an employee of Fidelity Investments. |
|
Joseph F. Zambello (1957) |
|
|
|
Year of Election or Appointment: 2011 Deputy Treasurer of the Fidelity funds. Mr. Zambello is an employee of Fidelity Investments. Previously, Mr. Zambello served as Vice President of FMR's Program Management Group (2009-2011) and Vice President of the Transfer Agent Oversight Group (2005-2009). |
|
Adrien E. Deberghes (1967) |
|
|
|
Year of Election or Appointment: 2008 Deputy Treasurer of Fidelity's Equity and High Income Funds. Mr. Deberghes also serves as Vice President (2011-present) and Assistant Treasurer (2010-present) of other Fidelity funds, and is an employee of Fidelity Investments (2008-present). Previously, Mr. Deberghes served as Senior Vice President of Mutual Fund Administration at State Street Corporation (2007-2008), Senior Director of Mutual Fund Administration at Investors Bank & Trust (2005-2007), and Director of Finance for Dunkin' Brands (2000-2005). |
|
Stephen Sadoski (1971) |
|
|
|
Year of Election or Appointment: 2012 Deputy Treasurer of Fidelity's Equity and High Income Funds. Mr. Sadoski also serves as Deputy Treasurer of other Fidelity funds (2013-present) and is an employee of Fidelity Investments (2012-present). Previously, Mr. Sadoski served as Assistant Treasurer of Fidelity's Fixed Income and Asset Allocation Funds (2012-2013), an assistant chief accountant in the Division of Investment Management of the Securities and Exchange Commission (SEC) (2009-2012) and as a senior manager at Deloitte & Touche (1997-2009). |
|
Stacie Smith (1974) |
|
|
|
Year of Election or Appointment: 2013 Deputy Treasurer of Fidelity's Equity and High Income Funds. Ms. Smith is an employee of Fidelity Investments (2009-present). Previously, Ms. Smith served as Senior Audit Manager of Ernst & Young LLP (1996-2009). |
|
Stephanie J. Dorsey (1969) |
|
|
|
Year of Election or Appointment: 2010 Assistant Treasurer of Fidelity's Equity and High Income Funds. Ms. Dorsey also serves as President and Treasurer (2013-present) and Assistant Treasurer (2012-present) of other Fidelity funds and is an employee of Fidelity Investments (2008-present). Previously, Ms. Dorsey served as Deputy Treasurer of Fidelity's Fixed Income and Asset Allocation Funds (2008-2013), Treasurer (2004-2008) of the JPMorgan Mutual Funds and Vice President (2004-2008) of JPMorgan Chase Bank. |
|
John R. Hebble (1958) |
|
|
|
Year of Election or Appointment: 2009 Assistant Treasurer of Fidelity's Equity and High Income Funds. Mr. Hebble also serves as President (2011-present), Treasurer, and Chief Financial Officer of The North Carolina Capital Management Trust: Cash and Term Portfolios (2008-present) and is an employee of Fidelity Investments. Previously, Mr. Hebble served as President and Treasurer of Fidelity's Fixed Income and Asset Allocation Funds (2008-2013). |
|
Gary W. Ryan (1958) |
|
|
|
Year of Election or Appointment: 2005 Assistant Treasurer of the Fidelity funds. Mr. Ryan is an employee of Fidelity Investments. Previously, Mr. Ryan served as Vice President of Fund Reporting in Fidelity Pricing and Cash Management Services (FPCMS) (1999-2005). |
|
Jonathan Davis (1968) |
|
|
|
Year of Election or Appointment: 2010 Assistant Treasurer of the Fidelity funds. Mr. Davis is also Assistant Treasurer of Fidelity Rutland Square Trust II and Fidelity Commonwealth Trust II. Mr. Davis is an employee of Fidelity Investments. Previously, Mr. Davis served as Vice President and Associate General Counsel of FMR LLC (2003-2010). |
Annual Report
Distributions (Unaudited)
The fund hereby designates as a capital gain dividend with respect to the taxable year ended February, 2013, $1,562,958, or, if subsequently determined to be different, the net capital gain of such year.
The fund designates 100% and 100% of the dividends distributed in April and December, respectively, during the fiscal year as qualifying for the dividends-received deduction for corporate shareholders.
The fund designates 100% of the dividends distributed during the fiscal year as amounts which may be taken into account as a dividends distributed in April and December, respectively, during the fiscal year as amounts which may be taken into account as a dividend for the purposes of the maximum rate under section 1(h)(11) of the Internal Revenue Code.
The fund will notify shareholders in January 2014 of amounts for use in preparing 2013 income tax returns.
Annual Report
Board Approval of Investment Advisory Contracts and Management Fees
Utilities Portfolio
On November 14, 2012, the Board of Trustees, including the Independent Trustees (together, the Board), voted to approve a new management contract (the New Contract) between the fund and Fidelity SelectCo, LLC (SelectCo) and to submit the New Contract to shareholders for their approval. If the New Contract is approved by shareholders, effective August 1, 2013, SelectCo will serve as investment adviser to the fund. The terms of the New Contract are identical to those of the current management contract with FMR (the Current Contract), except with respect to the name of the investment adviser and the dates of execution and the initial two-year term of the contract. The Board, assisted by the advice of fund counsel and Independent Trustees' counsel, considered a broad range of information.
In determining whether to approve the New Contract for the fund, the Board was aware that shareholders in the fund have a broad range of investment choices available to them, including a wide choice among mutual funds offered by competitors to Fidelity, and that the fund's shareholders, with the opportunity to review and weigh the disclosure provided by the fund in its prospectus and other public disclosures, have chosen to invest in the fund, managed by Fidelity.
Nature, Extent, and Quality of Services Provided. The Board considered the nature, quality, cost and extent of the services to be provided by SelectCo under the New Contract as well as the nature, quality, cost and extent of the advisory, administrative, distribution and shareholder services performed by the FMR and the sub-advisers, and by affiliated companies. The Board considered that, upon shareholder approval, SelectCo will render the same services to the fund under the New Contract that FMR currently renders to the fund under the Current Contract. The Board also considered that the New Contract would not result in any changes to (i) the investment process or strategies employed in the management of the fund's assets or (ii) the day-to-day management of the fund or the persons primarily responsible for such management.
Throughout the year, the Trustees had discussions with FMR about plans to establish SelectCo as a new investment adviser to manage sector-based funds and products. The Trustees considered Fidelity's rationale for creating a separate investment adviser and noted that a separate investment adviser may be better positioned to focus on opportunities for growth within the sector investing space and to focus on a distinct approach to sector investing and research.
Shareholder and Administrative Services. The Board noted that the growth of fund assets across the complex allows Fidelity to reinvest in the development of services designed to enhance the value or convenience of the Fidelity funds as investment vehicles. These services include 24-hour access to account information and market information through phone representatives and over the Internet, and investor education materials and asset allocation tools.
Investment in a Large Fund Family. The Board considered the benefits to shareholders of investing in a Fidelity fund, including the benefits of investing in a fund that is part of a large family of funds offering a variety of investment disciplines and providing for a large variety of mutual fund shareholder services.
Investment Performance. The Board did not consider performance to be a material factor in its decision to approve the New Contract because the New Contract would not result in any changes to the fund's investment processes or strategies or in the persons primarily responsible for the day-to-day management of the fund.
Based on its review, the Board concluded that the nature, extent, and quality of the services provided to the fund will benefit the fund's shareholders, particularly in light of the Board's view that the fund's shareholders benefit from investing in a fund that is part of a large family of funds offering a variety of investment disciplines and services.
Competitiveness of Management Fee and Total Fund Expenses. The Board considered that, if approved by shareholders, the New Contract would not result in any changes to the amount of the management fee paid by the fund, except that such fee would be paid to SelectCo rather than FMR. The Board noted that at previous meetings during the year it received and considered materials relating to its review of the management fee of the fund. This information includes comparisons that focus on the fund's standing relative to the total universe of comparable funds available to investors in terms of gross management fees before expense reimbursements or caps, as well as the fund's standing relative to non-Fidelity funds similar in size to the fund within the comparison group.
Based on its review, the Board concluded that the fund's management fee was fair and reasonable in light of the services that the fund receives and the other factors considered.
Because there are no expected changes in the fund's management fee under the New Contract, the Board will review the fund's total expenses compared to competitive fund median expenses in connection with its future consideration of the renewal of the fund's management contract and sub-advisory agreements.
In its review of total expenses, the Board also noted that at previous meetings during the year it received and considered materials relating to its review of total expenses for each Fidelity fund. This information includes Fidelity fee structures and other information with respect to clients of FMR and its affiliates, such as other mutual funds advised or sub-advised by FMR or its affiliates, pension plan clients, and other institutional clients.
Annual Report
Costs of the Services and Profitability. Because there were no changes to the services to be provided or fees to be charged to the fund under the New Contract, the Board did not consider data regarding the impact on Fidelity's costs of services, revenues, or profitability from the new arrangement to be a significant factor in its decision.
In connection with its future consideration of the renewal of the fund's management contract and sub-advisory agreements, the Board will consider the revenues earned and the expenses incurred by Fidelity in conducting the business of developing, marketing, distributing, managing, administering and servicing the fund and its shareholders.
Economies of Scale. The Board recognized that the New Contract, like the Current Contract, incorporates a "group fee" structure, which provides for lower fee rates as total fund assets under FMR's management increase, and for higher fee rates as total fund assets under FMR's management decrease. The Board considered that the group fee is designed to deliver the benefits of economies of scale to fund shareholders when total fund assets increase, even if assets of any particular fund are unchanged or have declined, because some portion of Fidelity's costs are attributable to services provided to all Fidelity funds, and all funds benefit if those costs can be allocated among more assets. The Board concluded that, given the group fee structure, fund shareholders will achieve a certain level of economies of scale as assets under FMR's management increase at the fund complex level, regardless of whether Fidelity achieves any such economies of scale.
In connection with its future consideration of the renewal of the fund's management contract and sub-advisory agreements, the Board will consider whether there have been economies of scale in respect of the management of the Fidelity funds, whether the Fidelity funds (including the fund) have appropriately benefited from any such economies of scale, and whether there is potential for realization of any further economies of scale.
Based on its evaluation of all of the conclusions noted above, and after considering all material factors, the Board ultimately concluded that the New Contract is fair and reasonable, and that the New Contract should be approved and submitted to the fund's shareholders for their approval.
Annual Report
Investment Adviser
Fidelity Management & Research Company
Boston, MA
Investment Sub-Advisers
FMR Co., Inc.
Fidelity Management & Research
(U.K.) Inc.
Fidelity Management & Research
(Hong Kong) Limited
Fidelity Management & Research
(Japan) Inc.
General Distributor
Fidelity Distributors Corporation
Smithfield, RI
Transfer and Service Agents
Fidelity Investments Institutional
Operations Company, Inc.
Boston, MA
Fidelity Service Company, Inc.
Boston, MA
Custodian
Brown Brothers Harriman & Co.
Boston, MA
Corporate Headquarters
245 Summer Street
Boston, MA 02210
1-800-544-8888
The Fidelity Telephone Connection
Mutual Fund 24-Hour Service
Exchanges/Redemptions
and Account Assistance 1-800-544-6666
Product Information 1-800-544-8888
Retirement Accounts 1-800-544-4774
(8 a.m. - 9 p.m.)
TDD Service 1-800-544-0118
for the deaf and hearing impaired
(9 a.m. - 9 p.m. Eastern time)
Fidelity Automated Service
Telephone (FAST®) 
1-800-544-5555
Automated line for quickest service

SELUTL-UANNPRO-0413
1.910427.103

Fidelity Advisor
Focus Funds®
Class A, Class T, Class B and Class C
Fidelity Advisor® Consumer Staples Fund
Fidelity Advisor Gold Fund
Fidelity Advisor Materials Fund
Fidelity Advisor Telecommunications Fund
Each Advisor fund listed above is a class
of the Fidelity® Select Portfolios®.
Annual Report
February 28, 2013
(Fidelity Cover Art)
Contents
|
Fidelity Advisor® Consumer Staples Fund |
Performance |
|
|
|
Management's Discussion |
|
|
|
Shareholder Expense Example |
|
|
|
Investment Changes |
|
|
|
Investments |
|
|
|
Financial Statements |
|
|
|
Notes to the Financial Statements |
|
|
Fidelity Advisor Gold Fund |
Performance |
|
|
|
Management's Discussion |
|
|
|
Shareholder Expense Example |
|
|
|
Consolidated Investment Changes |
|
|
|
Consolidated Investments |
|
|
|
Consolidated Financial Statements |
|
|
|
Notes to the Consolidated Financial Statements |
|
|
Fidelity Advisor Materials Fund |
Performance |
|
|
|
Management's Discussion |
|
|
|
Shareholder Expense Example |
|
|
|
Investment Changes |
|
|
|
Investments |
|
|
|
Financial Statements |
|
|
|
Notes to the Financial Statements |
|
|
Fidelity Advisor Telecommunications Fund |
Performance |
|
|
|
Management's Discussion |
|
|
|
Shareholder Expense Example |
|
|
|
Investment Changes |
|
|
|
Investments |
|
|
|
Financial Statements |
|
|
|
Notes to the Financial Statements |
|
|
Report of Independent Registered Public Accounting Firm |
|
|
|
Trustees and Officers |
|
|
|
Distributions |
|
|
|
Board Approval of Investment Advisory Contracts and Management Fees |
|
To view a fund's proxy voting guidelines and proxy voting record for the 12-month period ended June 30, visit http://www.fidelity.com/proxyvotingresults or visit the Securities and Exchange Commission's (SEC) web site at http://www.sec.gov. You may also call 1-877-208-0098 to request a free copy of the proxy voting guidelines.
Standard & Poor's, S&P and S&P 500 are registered service marks of The McGraw-Hill Companies, Inc. and have been licensed for use by Fidelity Distributors Corporation.
Other third-party marks appearing herein are the property of their respective owners.
All other marks appearing herein are registered or unregistered trademarks or service marks of FMR LLC or an affiliated company. © 2013 FMR LLC. All rights reserved.
This report and the financial statements contained herein are submitted for the general information of the shareholders of the funds. This report is not authorized for distribution to prospective investors in the funds unless preceded or accompanied by an effective prospectus.
A fund files its complete schedule of portfolio holdings with the SEC for the first and third quarters of each fiscal year on Form N-Q. Forms N-Q are available on the SEC's web site at http://www.sec.gov. A fund's Forms N-Q may be reviewed and copied at the SEC's Public Reference Room in Washington, DC. Information regarding the operation of the SEC's Public Reference Room may be obtained by calling 1-800-SEC-0330. For a complete list of a fund's portfolio holdings, view the most recent holdings listing, semiannual report, or annual report on Fidelity's web site at http://www.fidelity.com, http://www.advisor.fidelity.com, or http://www.401k.com, as applicable.
NOT FDIC INSURED • MAY LOSE VALUE • NO BANK GUARANTEE
Neither the funds nor Fidelity Distributors Corporation is a bank.
Annual Report
Fidelity Advisor® Consumer Staples Fund - Class A, T, B and C
Performance: The Bottom Line
Average annual total return reflects the change in the value of an investment, assuming reinvestment of the class' distributions from dividend income and capital gains (the profits earned upon the sale of securities that have grown in value, if any) and assuming a constant rate of performance each year. The $10,000 table and the fund's returns do not reflect the deduction of taxes that a shareholder would pay on fund distributions or the redemption of fund shares. During periods of reimbursement by Fidelity, a fund's total return will be greater than it would be had the reimbursement not occurred. How a fund did yesterday is no guarantee of how it will do tomorrow.
Average Annual Total Returns
|
Periods ended February 28, 2013 |
Past 1 |
Past 5 |
Past 10 |
|
Class A (incl. 5.75% sales charge) A |
10.84% |
7.47% |
11.67% |
|
Class T (incl. 3.50% sales charge) B |
13.18% |
7.67% |
11.73% |
|
Class B (incl. contingent deferred |
11.68% |
7.58% |
11.77% |
|
Class C (incl. contingent deferred sales charge) D |
15.73% |
7.94% |
11.80% |
A Class A shares bear a 0.25% 12b-1 fee. The initial offering of Class A shares took place on December 12, 2006. Returns prior to December 12, 2006, are those of Consumer Staples Portfolio, the original class of the fund, which has no 12b-1 fee. Had Class A shares' 12b-1 fee been reflected, returns prior to December 12, 2006, would have been lower.
B Class T shares bear a 0.50% 12b-1 fee. The initial offering of Class T shares took place on December 12, 2006. Returns prior to December 12, 2006, are those of Consumer Staples Portfolio, the original class of the fund, which has no 12b-1 fee. Had Class T shares' 12b-1 fee been reflected, returns prior to December 12, 2006, would have been lower.
C Class B shares bear a 1.00% 12b-1 fee. The initial offering of Class B shares took place on December 12, 2006. Returns prior to December 12, 2006, are those of Consumer Staples Portfolio, the original class of the fund, which has no 12b-1 fee. Had Class B shares' 12b-1 fee been reflected, returns prior to December 12, 2006, would have been lower. Class B shares' contingent deferred sales charges included in the past one year, past five years, and past ten years total return figures are 5%, 2%, and 0%, respectively.
D Class C shares bear a 1.00% 12b-1 fee. The initial offering of Class C shares took place on December 12, 2006. Returns prior to December 12, 2006, are those of Consumer Staples Portfolio, the original class of the fund, which has no 12b-1 fee. Had Class C shares' 12b-1 fee been reflected, returns prior to December 12, 2006, would have been lower. Class C shares' contingent deferred sales charges included in the past one year, past five years, and past ten years total return figures are 1%, 0%, and 0%, respectively.
Prior to October 1, 2006, the fund operated under certain different investment policies. The historical performance of the fund may not represent its current investment policies.
$10,000 Over 10 Years
Let's say hypothetically that $10,000 was invested in Fidelity Advisor Consumer Staples Fund - Class A on February 28, 2003, and the current 5.75% sales charge was paid. The chart shows how the value of your investment would have changed, and also shows how the S&P 500® Index performed over the same period. The initial offering of Class A took place on December 12, 2006. See the Average Annual Total Returns table for additional information regarding the performance of Class A.
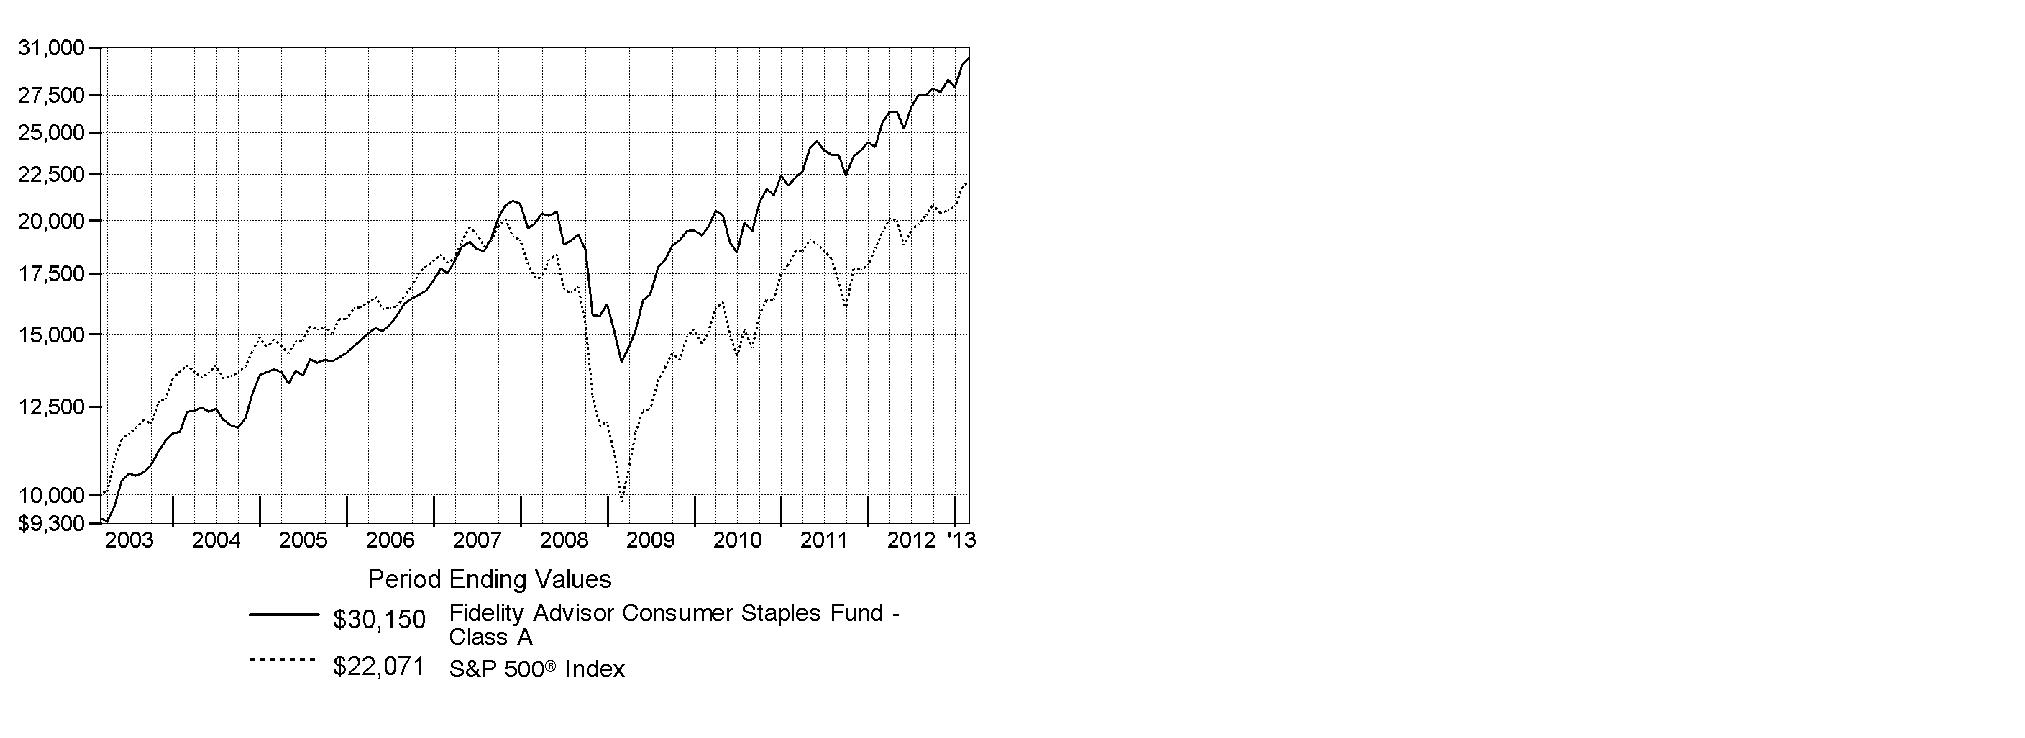
Annual Report
Fidelity Advisor Consumer Staples Fund
Management's Discussion of Fund Performance
Market Recap: U.S. stocks posted solid gains for the year ending February 28, 2013, sparked by a late-period rally that pushed major equity benchmarks to multiyear highs. Improvement in the global economy and more monetary stimulus from the U.S. Federal Reserve kept markets on the upswing for much of the year, shrugging off an early decline brought on by debt woes in Europe, and another dip later in the period amid Congressional gridlock on the federal budget. Renewed optimism over employment, the housing market, corporate earnings and record dividends made stocks a favorite with investors during the 12 months, which helped push the broad-based S&P 500® Index across the milestone 1,500 mark at the end of January. The S&P 500® finished the period up 13.46%. Seven of the 10 major market sectors tracked by MSCI U.S. IMI 25-50 classifications produced double-digit gains, led by health care and financials, while information technology, energy and materials trailed the broad equity market with only modest advances.
Comments from Robert Lee, Portfolio Manager of Fidelity Advisor® Consumer Staples Fund: For the 12 months ending February 28, 2013, the fund's Class A, Class T, Class B and Class C shares returned 17.60%, 17.29%, 16.68% and 16.73%, respectively (excluding sales charges), modestly underperforming the 18.07% advance of the MSCI® U.S. IMI Consumer Staples 25-50 Index, but solidly outpacing the S&P 500®. The consumer staples sector outperformed during the period, driven by household products and packaged foods/meats - both groups where the fund had unfavorable positioning. However, the biggest headwind hindering performance was the portfolio's positioning in tobacco, including a very large out-of-index stake in British American Tobacco, which was the fund's biggest individual detractor. Investors became concerned with new efforts by some countries to discourage smoking, and the stock price fell. An underweighting and weak stock picking in packaged foods/meats also hurt, especially not owning H.J. Heinz, a strong-performing index component. Heinz stock got a boost in February when Warren Buffet's Berkshire Hathaway, along with Brazilian private equity group 3G Capital, announced they would acquire the ketchup maker at a premium price. Household products was another group that detracted, including not owning personal paper products manufacturer and index stock Kimberly-Clark, which outperformed the benchmark, and overweighting Procter & Gamble, the fund's single largest position, on average. In other areas, underweighting the hypermarkets/super centers area hurt, as did a position in Nu Skin Enterprises, a direct-seller of anti-aging skin care products. Elsewhere, the fund's cash position detracted, as did currency fluctuations. Since consumer staples companies tend to conduct business in many countries, exchange rate movements during the period impacted most stocks in the sector, including many held by the fund. On the positive side, positioning in distillers/vintners and stock picking in brewers buoyed the fund's relative return. In the first category, global wine and spirits distributor Constellation Brands - which was sold prior to period end - was the fund's top individual contributor. Global brewer Anheuser-Busch InBev - a non-index name also among the fund's top contributors - announced in June it would acquire the 50% of Mexican brewer Grupo Modelo that it didn't already own. As part of the deal, Anheuser-Busch allowed Constellation to take full control of the joint venture it had with the Mexican brewer for the U.S. distribution rights to Corona, Modelo's premium beer brand, which lifted Constellation's stock. A non-index position in British global spirits producer Diageo also helped here. Elsewhere, an underweighting in nutritional and weight management direct-seller Herbalife helped, as the stock took a big hit late in 2012 when a prominent investor suggested the company was a pyramid scheme, rather then a sustainable business enterprise. In the tobacco group, there were a few offsets to British American Tobacco, including an underweighting in Philip Morris International.
The views expressed above reflect those of the portfolio manager(s) only through the end of the period as stated on the cover of this report and do not necessarily represent the views of Fidelity or any other person in the Fidelity organization. Any such views are subject to change at any time based upon market or other conditions and Fidelity disclaims any responsibility to update such views. These views may not be relied on as investment advice and, because investment decisions for a Fidelity fund are based on numerous factors, may not be relied on as an indication of trading intent on behalf of any Fidelity fund.
Annual Report
Consumer Staples Portfolio
Shareholder Expense Example
As a shareholder of the Fund, you incur two types of costs: (1) transaction costs, including sales charges (loads) on purchase payments or redemption proceeds, redemption fees and (2) ongoing costs, including management fees, distribution and/or service (12b-1) fees and other Fund expenses. This Example is intended to help you understand your ongoing costs (in dollars) of investing in the Fund and to compare these costs with the ongoing costs of investing in other mutual funds.
The Example is based on an investment of $1,000 invested at the beginning of the period and held for the entire period (September 1, 2012 to February 28, 2013).
Actual Expenses
The first line of the accompanying table for each class of the Fund provides information about actual account values and actual expenses. You may use the information in this line, together with the amount you invested, to estimate the expenses that you paid over the period. Simply divide your account value by $1,000.00 (for example, an $8,600 account value divided by $1,000.00 = 8.6), then multiply the result by the number in the first line for a class of the Fund under the heading entitled "Expenses Paid During Period" to estimate the expenses you paid on your account during this period. A small balance maintenance fee of $12.00 that is charged once a year may apply for certain accounts with a value of less than $2,000. This fee is not included in the table below. If it was, the estimate of expenses you paid during the period would be higher, and your ending account value lower, by this amount. In addition, the Fund, as a shareholder in the underlying Fidelity Central Funds, will indirectly bear its pro-rata share of the fees and expenses incurred by the underlying Fidelity Central Funds. These fees and expenses are not included in the Fund's annualized expense ratio used to calculate the expense estimate in the table below.
Hypothetical Example for Comparison Purposes
The second line of the accompanying table for each class of the Fund provides information about hypothetical account values and hypothetical expenses based on a Class' actual expense ratio and an assumed rate of return of 5% per year before expenses, which is not the Class' actual return. The hypothetical account values and expenses may not be used to estimate the actual ending account balance or expenses you paid for the period. You may use this information to compare the ongoing costs of investing in the Fund and other funds. To do so, compare this 5% hypothetical example with the 5% hypothetical examples that appear in the shareholder reports of the other funds. A small balance maintenance fee of $12.00 that is charged once a year may apply for certain accounts with a value of less than $2,000. This fee is not included in the table below. If it was, the estimate of expenses you paid during the period would be higher, and your ending account value lower, by this amount. In addition, the Fund, as a shareholder in the underlying Fidelity Central Funds, will indirectly bear its pro-rata share of the fees and expenses incurred by the underlying Fidelity Central Funds. These fees and expenses are not included in the Fund's annualized expense ratio used to calculate the expense estimate in the table below.
Please note that the expenses shown in the table are meant to highlight your ongoing costs only and do not reflect any transaction costs. Therefore, the second line of the table is useful in comparing ongoing costs only, and will not help you determine the relative total costs of owning different funds. In addition, if these transactional costs were included, your costs would have been higher.
|
|
Annualized |
Beginning |
Ending |
Expenses Paid |
|
Class A |
1.08% |
|
|
|
|
Actual |
|
$ 1,000.00 |
$ 1,096.50 |
$ 5.61 |
|
HypotheticalA |
|
$ 1,000.00 |
$ 1,019.44 |
$ 5.41 |
|
Class T |
1.35% |
|
|
|
|
Actual |
|
$ 1,000.00 |
$ 1,095.00 |
$ 7.01 |
|
HypotheticalA |
|
$ 1,000.00 |
$ 1,018.10 |
$ 6.76 |
|
Class B |
1.88% |
|
|
|
|
Actual |
|
$ 1,000.00 |
$ 1,092.30 |
$ 9.75 |
|
HypotheticalA |
|
$ 1,000.00 |
$ 1,015.47 |
$ 9.39 |
|
Class C |
1.82% |
|
|
|
|
Actual |
|
$ 1,000.00 |
$ 1,092.40 |
$ 9.44 |
|
HypotheticalA |
|
$ 1,000.00 |
$ 1,015.77 |
$ 9.10 |
|
Consumer Staples |
.81% |
|
|
|
|
Actual |
|
$ 1,000.00 |
$ 1,098.10 |
$ 4.21 |
|
HypotheticalA |
|
$ 1,000.00 |
$ 1,020.78 |
$ 4.06 |
|
Institutional Class |
.85% |
|
|
|
|
Actual |
|
$ 1,000.00 |
$ 1,097.80 |
$ 4.42 |
|
HypotheticalA |
|
$ 1,000.00 |
$ 1,020.58 |
$ 4.26 |
A 5% return per year before expenses
* Expenses are equal to each Class' annualized expense ratio, multiplied by the average account value over the period, multiplied by 181/365 (to reflect the one-half year period).
Annual Report
Consumer Staples Portfolio
Investment Changes (Unaudited)
|
Top Ten Stocks as of February 28, 2013 |
||
|
|
% of fund's |
% of fund's net assets |
|
British American Tobacco PLC sponsored ADR |
13.9 |
13.8 |
|
Procter & Gamble Co. |
13.1 |
14.9 |
|
The Coca-Cola Co. |
11.7 |
10.8 |
|
CVS Caremark Corp. |
7.3 |
7.1 |
|
Altria Group, Inc. |
4.8 |
4.5 |
|
Colgate-Palmolive Co. |
3.0 |
2.9 |
|
Wal-Mart Stores, Inc. |
2.9 |
2.0 |
|
Philip Morris International, Inc. |
2.5 |
2.4 |
|
Diageo PLC sponsored ADR |
2.5 |
3.1 |
|
Bunge Ltd. |
2.2 |
2.1 |
|
|
63.9 |
|
|
Top Industries (% of fund's net assets) |
|||
|
As of February 28, 2013 |
|||
 |
Beverages |
25.4% |
|
 |
Tobacco |
22.7% |
|
 |
Household Products |
16.1% |
|
 |
Food & Staples Retailing |
15.1% |
|
 |
Food Products |
10.7% |
|
 |
All Others* |
10.0% |
|

|
As of August 31, 2012 |
|||
|
Beverages |
28.9% |
|
|
Tobacco |
21.6% |
|
|
Household Products |
18.4% |
|
|
Food & Staples Retailing |
12.4% |
|
|
Food Products |
9.4% |
|
|
All Others* |
9.3% |
|

|
* Includes short-term investments and net other assets. |
Annual Report
Consumer Staples Portfolio
Investments February 28, 2013
Showing Percentage of Net Assets
|
Common Stocks - 94.4% |
|||
|
Shares |
Value |
||
|
BEVERAGES - 25.4% |
|||
|
Brewers - 4.3% |
|||
|
Anheuser-Busch InBev SA NV |
518,028 |
$ 48,546,936 |
|
|
Companhia de Bebidas das Americas (AmBev) (PN) sponsored ADR |
246,385 |
10,934,566 |
|
|
Compania Cervecerias Unidas SA sponsored ADR |
174,000 |
5,688,060 |
|
|
SABMiller PLC |
651,700 |
32,398,437 |
|
|
|
97,567,999 |
||
|
Distillers & Vintners - 5.9% |
|||
|
Diageo PLC sponsored ADR |
472,177 |
56,524,309 |
|
|
Pernod Ricard SA |
351,601 |
45,623,258 |
|
|
Remy Cointreau SA |
260,060 |
32,865,665 |
|
|
|
135,013,232 |
||
|
Soft Drinks - 15.2% |
|||
|
Coca-Cola Bottling Co. CONSOLIDATED |
92,245 |
6,035,590 |
|
|
Coca-Cola FEMSA SAB de CV sponsored ADR (d) |
34,829 |
5,873,563 |
|
|
Coca-Cola Hellenic Bottling Co. SA sponsored ADR |
78,006 |
2,105,382 |
|
|
Coca-Cola Icecek A/S |
363,162 |
8,580,140 |
|
|
Embotelladora Andina SA: |
|
|
|
|
ADR |
43,689 |
1,438,242 |
|
|
sponsored ADR (d) |
241,600 |
10,110,960 |
|
|
Fomento Economico Mexicano S.A.B. de CV sponsored ADR |
51,187 |
5,719,635 |
|
|
PepsiCo, Inc. |
528,471 |
40,042,248 |
|
|
The Coca-Cola Co. |
6,925,452 |
268,153,501 |
|
|
|
348,059,261 |
||
|
TOTAL BEVERAGES |
580,640,492 |
||
|
FOOD & STAPLES RETAILING - 15.1% |
|||
|
Drug Retail - 9.1% |
|||
|
CVS Caremark Corp. |
3,263,883 |
166,849,699 |
|
|
Drogasil SA |
516,400 |
5,953,444 |
|
|
Walgreen Co. |
856,660 |
35,071,660 |
|
|
|
207,874,803 |
||
|
Food Distributors - 0.2% |
|||
|
Chefs' Warehouse Holdings (a) |
230,800 |
4,154,400 |
|
|
Food Retail - 2.9% |
|||
|
Fresh Market, Inc. (a) |
120,828 |
5,633,001 |
|
|
Kroger Co. |
1,746,368 |
51,011,409 |
|
|
Susser Holdings Corp. (a) |
67,400 |
2,984,472 |
|
|
The Pantry, Inc. (a) |
473,635 |
5,892,019 |
|
|
|
65,520,901 |
||
|
Hypermarkets & Super Centers - 2.9% |
|||
|
Wal-Mart Stores, Inc. |
946,186 |
66,971,045 |
|
|
TOTAL FOOD & STAPLES RETAILING |
344,521,149 |
||
|
|
|||
|
Shares |
Value |
||
|
FOOD PRODUCTS - 10.7% |
|||
|
Agricultural Products - 3.3% |
|||
|
Archer Daniels Midland Co. |
618,163 |
$ 19,694,673 |
|
|
Bunge Ltd. |
690,273 |
51,156,132 |
|
|
First Resources Ltd. |
1,413,000 |
2,219,222 |
|
|
SLC Agricola SA |
253,600 |
2,482,958 |
|
|
|
75,552,985 |
||
|
Packaged Foods & Meats - 7.4% |
|||
|
Annie's, Inc. |
133,141 |
5,586,596 |
|
|
Green Mountain Coffee Roasters, Inc. (a) |
290,737 |
13,885,599 |
|
|
Hain Celestial Group, Inc. (a)(d) |
144,901 |
7,933,330 |
|
|
Lindt & Spruengli AG |
141 |
6,016,532 |
|
|
Mead Johnson Nutrition Co. Class A |
582,216 |
43,613,801 |
|
|
Nestle SA |
490,726 |
34,257,861 |
|
|
Orion Corp. |
2,360 |
2,328,767 |
|
|
TreeHouse Foods, Inc. (a) |
116,200 |
6,784,918 |
|
|
Ulker Biskuvi Sanayi A/S |
647,525 |
4,085,615 |
|
|
Unilever NV (NY Reg.) |
1,106,950 |
43,082,494 |
|
|
Want Want China Holdings Ltd. |
1,408,000 |
1,975,223 |
|
|
|
169,550,736 |
||
|
TOTAL FOOD PRODUCTS |
245,103,721 |
||
|
HOUSEHOLD PRODUCTS - 16.1% |
|||
|
Household Products - 16.1% |
|||
|
Colgate-Palmolive Co. |
587,471 |
67,224,307 |
|
|
Procter & Gamble Co. |
3,940,134 |
300,159,408 |
|
|
|
367,383,715 |
||
|
PERSONAL PRODUCTS - 2.4% |
|||
|
Personal Products - 2.4% |
|||
|
Hengan International Group Co. Ltd. |
556,500 |
5,647,087 |
|
|
Herbalife Ltd. |
128,590 |
5,180,891 |
|
|
L'Oreal SA |
197,600 |
29,551,229 |
|
|
Natura Cosmeticos SA |
38,700 |
999,075 |
|
|
Nu Skin Enterprises, Inc. Class A (d) |
311,404 |
12,829,845 |
|
|
|
54,208,127 |
||
|
PHARMACEUTICALS - 2.0% |
|||
|
Pharmaceuticals - 2.0% |
|||
|
Johnson & Johnson |
604,160 |
45,982,618 |
|
|
TOBACCO - 22.7% |
|||
|
Tobacco - 22.7% |
|||
|
Altria Group, Inc. |
3,272,917 |
109,806,365 |
|
|
British American Tobacco PLC sponsored ADR |
3,040,566 |
317,070,226 |
|
|
Imperial Tobacco Group PLC |
90,889 |
3,295,407 |
|
|
ITC Ltd. |
865,740 |
4,694,136 |
|
|
Japan Tobacco, Inc. |
176,200 |
5,560,308 |
|
|
Lorillard, Inc. |
357,233 |
13,767,760 |
|
|
Philip Morris International, Inc. |
618,358 |
56,734,347 |
|
|
Common Stocks - continued |
|||
|
Shares |
Value |
||
|
TOBACCO - CONTINUED |
|||
|
Tobacco - continued |
|||
|
Souza Cruz SA |
548,600 |
$ 8,755,317 |
|
|
Swedish Match Co. AB |
23,600 |
772,873 |
|
|
|
520,456,739 |
||
|
TOTAL COMMON STOCKS (Cost $1,604,527,630) |
|
||
|
Money Market Funds - 6.8% |
|||
|
|
|
|
|
|
Fidelity Cash Central Fund, 0.16% (b) |
135,004,801 |
135,004,801 |
|
|
Fidelity Securities Lending Cash Central Fund, 0.16% (b)(c) |
19,694,623 |
19,694,623 |
|
|
TOTAL MONEY MARKET FUNDS (Cost $154,699,424) |
|
||
|
TOTAL INVESTMENT PORTFOLIO - 101.2% (Cost $1,759,227,054) |
2,312,995,985 |
|
|
NET OTHER ASSETS (LIABILITIES) - (1.2)% |
(26,342,857) |
|
|
NET ASSETS - 100% |
$ 2,286,653,128 |
|
|
Legend |
|
(a) Non-income producing |
|
(b) Affiliated fund that is generally available only to investment companies and other accounts managed by Fidelity Investments. The rate quoted is the annualized seven-day yield of the fund at period end. A complete unaudited listing of the fund's holdings as of its most recent quarter end is available upon request. In addition, each Fidelity Central Fund's financial statements, which are not covered by the Fund's Report of Independent Registered Public Accounting Firm, are available on the SEC's websiteor upon request. |
|
(c) Investment made with cash collateral received from securities on loan. |
|
(d) Security or a portion of the security is on loan at period end. |
|
Affiliated Central Funds |
|
Information regarding fiscal year to date income earned by the Fund from investments in Fidelity Central Funds is as follows: |
|
Fund |
Income earned |
|
Fidelity Cash Central Fund |
$ 120,502 |
|
Fidelity Securities Lending Cash Central Fund |
405,984 |
|
Total |
$ 526,486 |
|
Other Information |
|
The following is a summary of the inputs used, as of February 28, 2013, involving the Fund's assets and liabilities carried at fair value. The inputs or methodology used for valuing securities may not be an indication of the risk associated with investing in those securities. For more information on valuation inputs, and their aggregation into the levels used in the tables below, please refer to the Investment Valuation section in the accompanying Notes to Financial Statements. |
|
Valuation Inputs at Reporting Date: |
||||
|
Description |
Total |
Level 1 |
Level 2 |
Level 3 |
|
Investments in Securities: |
||||
|
Common Stocks |
$ 2,158,296,561 |
$ 2,075,491,764 |
$ 82,804,797 |
$ - |
|
Money Market Funds |
154,699,424 |
154,699,424 |
- |
- |
|
Total Investments in Securities: |
$ 2,312,995,985 |
$ 2,230,191,188 |
$ 82,804,797 |
$ - |
|
The following is a summary of transfers between Level 1 and Level 2 for the period ended February 28, 2013. Transfers are assumed to have occurred at the beginning of the period, and are primarily attributable to the valuation techniques used for foreign equity securities, as discussed in the accompanying Notes to Financial Statements: |
|
Transfers |
Total |
|
Level 1 to Level 2 |
$ 23,412,228 |
|
Level 2 to Level 1 |
$ 0 |
|
Distribution of investments by country or territory of incorporation, as a percentage of total net assets, is as follows. (Unaudited) |
|
United States of America |
64.9% |
|
United Kingdom |
17.9% |
|
France |
4.7% |
|
Bermuda |
2.2% |
|
Belgium |
2.1% |
|
Netherlands |
1.9% |
|
Switzerland |
1.8% |
|
Brazil |
1.3% |
|
Others (Individually Less Than 1%) |
3.2% |
|
|
100.0% |
See accompanying notes which are an integral part of the financial statements.
Annual Report
Consumer Staples Portfolio
Financial Statements
Statement of Assets and Liabilities
|
|
February 28, 2013 |
|
|
|
|
|
|
Assets |
|
|
|
Investment in securities, at value (including securities loaned of $19,706,774) - See accompanying schedule: Unaffiliated issuers (cost $1,604,527,630) |
$ 2,158,296,561 |
|
|
Fidelity Central Funds (cost $154,699,424) |
154,699,424 |
|
|
Total Investments (cost $1,759,227,054) |
|
$ 2,312,995,985 |
|
Receivable for investments sold |
|
1,783,758 |
|
Receivable for fund shares sold |
|
5,431,937 |
|
Dividends receivable |
|
2,627,051 |
|
Distributions receivable from Fidelity Central Funds |
|
24,231 |
|
Prepaid expenses |
|
4,222 |
|
Receivable from investment advisor for expense reductions |
|
5,568 |
|
Other receivables |
|
36,756 |
|
Total assets |
|
2,322,909,508 |
|
|
|
|
|
Liabilities |
|
|
|
Payable for investments purchased |
$ 12,421,277 |
|
|
Payable for fund shares redeemed |
2,355,633 |
|
|
Accrued management fee |
1,047,248 |
|
|
Distribution and service plan fees payable |
204,748 |
|
|
Other affiliated payables |
440,332 |
|
|
Other payables and accrued expenses |
92,519 |
|
|
Collateral on securities loaned, at value |
19,694,623 |
|
|
Total liabilities |
|
36,256,380 |
|
|
|
|
|
Net Assets |
|
$ 2,286,653,128 |
|
Net Assets consist of: |
|
|
|
Paid in capital |
|
$ 1,671,219,940 |
|
Undistributed net investment income |
|
5,461,626 |
|
Accumulated undistributed net realized gain (loss) on investments and foreign currency transactions |
|
56,208,926 |
|
Net unrealized appreciation (depreciation) on investments and assets and liabilities in foreign currencies |
|
553,762,636 |
|
Net Assets |
|
$ 2,286,653,128 |
Statement of Assets and Liabilities - continued
|
|
February 28, 2013 |
|
|
|
|
|
|
Calculation of Maximum Offering Price Class A: |
|
$ 85.67 |
|
|
|
|
|
Maximum offering price per share (100/94.25 of $85.67) |
|
$ 90.90 |
|
Class T: |
|
$ 85.18 |
|
|
|
|
|
Maximum offering price per share (100/96.50 of $85.18) |
|
$ 88.27 |
|
Class B: |
|
$ 84.72 |
|
|
|
|
|
Class C: |
|
$ 84.28 |
|
|
|
|
|
Consumer Staples: |
|
$ 86.17 |
|
|
|
|
|
Institutional Class: |
|
$ 85.92 |
A Redemption price per share is equal to net asset value less any applicable contingent deferred sales charge.
See accompanying notes which are an integral part of the financial statements.
Annual Report
Statement of Operations
|
|
Year ended February 28, 2013 |
|
|
|
|
|
|
Investment Income |
|
|
|
Dividends |
|
$ 52,098,555 |
|
Interest |
|
18 |
|
Income from Fidelity Central Funds |
|
526,486 |
|
Total income |
|
52,625,059 |
|
|
|
|
|
Expenses |
|
|
|
Management fee |
$ 11,043,981 |
|
|
Transfer agent fees |
4,239,572 |
|
|
Distribution and service plan fees |
2,164,521 |
|
|
Accounting and security lending fees |
606,347 |
|
|
Custodian fees and expenses |
83,430 |
|
|
Independent trustees' compensation |
12,804 |
|
|
Registration fees |
202,756 |
|
|
Audit |
46,276 |
|
|
Legal |
7,103 |
|
|
Interest |
887 |
|
|
Miscellaneous |
16,586 |
|
|
Total expenses before reductions |
18,424,263 |
|
|
Expense reductions |
(125,364) |
18,298,899 |
|
Net investment income (loss) |
|
34,326,160 |
|
Realized and Unrealized Gain (Loss) Net realized gain (loss) on: |
|
|
|
Investment securities: |
|
|
|
Unaffiliated issuers |
94,857,369 |
|
|
Foreign currency transactions |
(47,642) |
|
|
Total net realized gain (loss) |
|
94,809,727 |
|
Change in net unrealized appreciation (depreciation) on: Investment securities (net of increase in deferred foreign taxes of $5,845) |
198,080,167 |
|
|
Assets and liabilities in foreign currencies |
(8,773) |
|
|
Total change in net unrealized appreciation (depreciation) |
|
198,071,394 |
|
Net gain (loss) |
|
292,881,121 |
|
Net increase (decrease) in net assets resulting from operations |
|
$ 327,207,281 |
Statement of Changes in Net Assets
|
|
Year ended |
Year ended |
|
Increase (Decrease) in Net Assets |
|
|
|
Operations |
|
|
|
Net investment income (loss) |
$ 34,326,160 |
$ 29,195,620 |
|
Net realized gain (loss) |
94,809,727 |
36,347,219 |
|
Change in net unrealized appreciation (depreciation) |
198,071,394 |
157,954,804 |
|
Net increase (decrease) in net assets resulting from operations |
327,207,281 |
223,497,643 |
|
Distributions to shareholders from net investment income |
(31,344,671) |
(25,900,882) |
|
Distributions to shareholders from net realized gain |
(29,546,659) |
(36,216,657) |
|
Total distributions |
(60,891,330) |
(62,117,539) |
|
Share transactions - net increase (decrease) |
287,768,850 |
162,381,495 |
|
Redemption fees |
35,035 |
45,851 |
|
Total increase (decrease) in net assets |
554,119,836 |
323,807,450 |
|
|
|
|
|
Net Assets |
|
|
|
Beginning of period |
1,732,533,292 |
1,408,725,842 |
|
End of period (including undistributed net investment income of $5,461,626 and undistributed net investment income of $3,220,648, respectively) |
$ 2,286,653,128 |
$ 1,732,533,292 |
See accompanying notes which are an integral part of the financial statements.
Annual Report
Financial Highlights - Class A
|
Years ended February 28, |
2013 |
2012 G |
2011 |
2010 |
2009 |
|
Selected Per-Share Data |
|
|
|
|
|
|
Net asset value, beginning of period |
$ 74.90 |
$ 67.65 |
$ 61.06 |
$ 43.94 |
$ 63.13 |
|
Income from Investment Operations |
|
|
|
|
|
|
Net investment income (loss) C |
1.26 |
1.22 |
.98 |
.84 |
.67 |
|
Net realized and unrealized gain (loss) |
11.73 |
8.73 |
7.10 |
17.02 |
(19.19) |
|
Total from investment operations |
12.99 |
9.95 |
8.08 |
17.86 |
(18.52) |
|
Distributions from net investment income |
(1.08) |
(1.06) |
(.83) |
(.74) |
(.66) |
|
Distributions from net realized gain |
(1.14) |
(1.64) |
(.66) |
- |
(.02) |
|
Total distributions |
(2.22) |
(2.70) |
(1.49) |
(.74) |
(.68) I |
|
Redemption fees added to paid in capital C |
- H |
- H |
- H |
- H |
.01 |
|
Net asset value, end of period |
$ 85.67 |
$ 74.90 |
$ 67.65 |
$ 61.06 |
$ 43.94 |
|
Total Return A,B |
17.60% |
15.00% |
13.27% |
40.66% |
(29.43)% |
|
Ratios to Average Net Assets D,F |
|
|
|
|
|
|
Expenses before reductions |
1.08% |
1.10% |
1.11% |
1.13% |
1.19% |
|
Expenses net of fee waivers, if any |
1.08% |
1.10% |
1.11% |
1.13% |
1.19% |
|
Expenses net of all reductions |
1.08% |
1.09% |
1.11% |
1.13% |
1.18% |
|
Net investment income (loss) |
1.58% |
1.74% |
1.53% |
1.51% |
1.27% |
|
Supplemental Data |
|
|
|
|
|
|
Net assets, end of period (000 omitted) |
$ 277,329 |
$ 205,851 |
$ 160,526 |
$ 162,370 |
$ 121,193 |
|
Portfolio turnover rate E |
28% |
35% |
57% |
69% |
70% |
A Total returns would have been lower if certain expenses had not been reduced during the applicable periods shown.
B Total returns do not include the effect of the sales charges.
C Calculated based on average shares outstanding during the period.
D Fees and expenses of any underlying Fidelity Central Funds are not included in the Fund's expense ratio. The Fund indirectly bears its proportionate share of the expenses of any underlying Fidelity Central Funds.
E Amount does not include the portfolio activity of any underlying Fidelity Central Funds.
F Expense ratios reflect operating expenses of the class. Expenses before reductions do not reflect amounts reimbursed by the investment adviser or reductions from brokerage service arrangements or reductions from other expense offset arrangements and do not represent the amount paid by the class during periods when reimbursements or reductions occur. Expenses net of fee waivers reflect expenses after reimbursement by the investment adviser but prior to reductions from brokerage service arrangements or other expense offset arrangements. Expenses net of all reductions represent the net expenses paid by the class.
G For the year ended February 29.
H Amount represents less than $.01 per share.
I Total distributions of $.68 per share is comprised of distributions from net investment income of $.655 and distributions from net realized gain of $.024 per share.
Financial Highlights - Class T
|
Years ended February 28, |
2013 |
2012 G |
2011 |
2010 |
2009 |
|
Selected Per-Share Data |
|
|
|
|
|
|
Net asset value, beginning of period |
$ 74.49 |
$ 67.30 |
$ 60.77 |
$ 43.75 |
$ 62.93 |
|
Income from Investment Operations |
|
|
|
|
|
|
Net investment income (loss) C |
1.03 |
1.01 |
.79 |
.66 |
.53 |
|
Net realized and unrealized gain (loss) |
11.68 |
8.68 |
7.05 |
16.95 |
(19.12) |
|
Total from investment operations |
12.71 |
9.69 |
7.84 |
17.61 |
(18.59) |
|
Distributions from net investment income |
(.88) |
(.86) |
(.65) |
(.59) |
(.60) |
|
Distributions from net realized gain |
(1.14) |
(1.64) |
(.66) |
- |
- |
|
Total distributions |
(2.02) |
(2.50) |
(1.31) |
(.59) |
(.60) I |
|
Redemption fees added to paid in capital C |
- H |
- H |
- H |
- H |
.01 |
|
Net asset value, end of period |
$ 85.18 |
$ 74.49 |
$ 67.30 |
$ 60.77 |
$ 43.75 |
|
Total Return A,B |
17.29% |
14.67% |
12.93% |
40.24% |
(29.61)% |
|
Ratios to Average Net Assets D,F |
|
|
|
|
|
|
Expenses before reductions |
1.36% |
1.38% |
1.40% |
1.44% |
1.46% |
|
Expenses net of fee waivers, if any |
1.36% |
1.38% |
1.40% |
1.44% |
1.46% |
|
Expenses net of all reductions |
1.35% |
1.38% |
1.40% |
1.44% |
1.46% |
|
Net investment income (loss) |
1.30% |
1.45% |
1.24% |
1.21% |
.99% |
|
Supplemental Data |
|
|
|
|
|
|
Net assets, end of period (000 omitted) |
$ 52,024 |
$ 39,047 |
$ 31,496 |
$ 29,662 |
$ 22,624 |
|
Portfolio turnover rate E |
28% |
35% |
57% |
69% |
70% |
A Total returns would have been lower if certain expenses had not been reduced during the applicable periods shown.
B Total returns do not include the effect of the sales charges.
C Calculated based on average shares outstanding during the period.
D Fees and expenses of any underlying Fidelity Central Funds are not included in the Fund's expense ratio. The Fund indirectly bears its proportionate share of the expenses of any underlying Fidelity Central Funds.
E Amount does not include the portfolio activity of any underlying Fidelity Central Funds.
F Expense ratios reflect operating expenses of the class. Expenses before reductions do not reflect amounts reimbursed by the investment adviser or reductions from brokerage service arrangements or reductions from other expense offset arrangements and do not represent the amount paid by the class during periods when reimbursements or reductions occur. Expenses net of fee waivers reflect expenses after reimbursement by the investment adviser but prior to reductions from brokerage service arrangements or other expense offset arrangements. Expenses net of all reductions represent the net expenses paid by the class.
G For the year ended February 29.
H Amount represents less than $.01 per share.
I Total distributions of $.60 per share is comprised of distributions from net investment income of $.599 and distributions from net realized gain of $.000 per share.
See accompanying notes which are an integral part of the financial statements.
Annual Report
Financial Highlights - Class B
|
Years ended February 28, |
2013 |
2012 G |
2011 |
2010 |
2009 |
|
Selected Per-Share Data |
|
|
|
|
|
|
Net asset value, beginning of period |
$ 74.01 |
$ 66.83 |
$ 60.37 |
$ 43.53 |
$ 62.69 |
|
Income from Investment Operations |
|
|
|
|
|
|
Net investment income (loss) C |
.61 |
.64 |
.46 |
.37 |
.26 |
|
Net realized and unrealized gain (loss) |
11.61 |
8.61 |
6.98 |
16.82 |
(19.01) |
|
Total from investment operations |
12.22 |
9.25 |
7.44 |
17.19 |
(18.75) |
|
Distributions from net investment income |
(.37) |
(.43) |
(.32) |
(.35) |
(.42) |
|
Distributions from net realized gain |
(1.14) |
(1.64) |
(.66) |
- |
- |
|
Total distributions |
(1.51) |
(2.07) |
(.98) |
(.35) |
(.42) I |
|
Redemption fees added to paid in capital C |
- H |
- H |
- H |
- H |
.01 |
|
Net asset value, end of period |
$ 84.72 |
$ 74.01 |
$ 66.83 |
$ 60.37 |
$ 43.53 |
|
Total Return A,B |
16.68% |
14.06% |
12.35% |
39.48% |
(29.96)% |
|
Ratios to Average Net Assets D,F |
|
|
|
|
|
|
Expenses before reductions |
1.89% |
1.91% |
1.91% |
1.97% |
1.96% |
|
Expenses net of fee waivers, if any |
1.89% |
1.91% |
1.91% |
1.97% |
1.96% |
|
Expenses net of all reductions |
1.88% |
1.90% |
1.91% |
1.97% |
1.96% |
|
Net investment income (loss) |
.78% |
.93% |
.73% |
.68% |
.50% |
|
Supplemental Data |
|
|
|
|
|
|
Net assets, end of period (000 omitted) |
$ 18,548 |
$ 19,330 |
$ 20,033 |
$ 21,099 |
$ 14,929 |
|
Portfolio turnover rate E |
28% |
35% |
57% |
69% |
70% |
A Total returns would have been lower if certain expenses had not been reduced during the applicable periods shown.
B Total returns do not include the effect of the contingent deferred sales charge.
C Calculated based on average shares outstanding during the period.
D Fees and expenses of any underlying Fidelity Central Funds are not included in the Fund's expense ratio. The Fund indirectly bears its proportionate share of the expenses of any underlying Fidelity Central Funds.
E Amount does not include the portfolio activity of any underlying Fidelity Central Funds.
F Expense ratios reflect operating expenses of the class. Expenses before reductions do not reflect amounts reimbursed by the investment adviser or reductions from brokerage service arrangements or reductions from other expense offset arrangements and do not represent the amount paid by the class during periods when reimbursements or reductions occur. Expenses net of fee waivers reflect expenses after reimbursement by the investment adviser but prior to reductions from brokerage service arrangements or other expense offset arrangements. Expenses net of all reductions represent the net expenses paid by the class.
G For the year ended February 29.
H Amount represents less than $.01 per share.
I Total distributions of $.42 per share is comprised of distributions from net investment income of $.418 and distributions from net realized gain of $.000 per share.
Financial Highlights - Class C
|
Years ended February 28, |
2013 |
2012 G |
2011 |
2010 |
2009 |
|
Selected Per-Share Data |
|
|
|
|
|
|
Net asset value, beginning of period |
$ 73.75 |
$ 66.71 |
$ 60.29 |
$ 43.46 |
$ 62.61 |
|
Income from Investment Operations |
|
|
|
|
|
|
Net investment income (loss) C |
.65 |
.68 |
.49 |
.41 |
.28 |
|
Net realized and unrealized gain (loss) |
11.55 |
8.59 |
7.00 |
16.80 |
(19.00) |
|
Total from investment operations |
12.20 |
9.27 |
7.49 |
17.21 |
(18.72) |
|
Distributions from net investment income |
(.53) |
(.59) |
(.41) |
(.38) |
(.44) |
|
Distributions from net realized gain |
(1.14) |
(1.64) |
(.66) |
- |
- |
|
Total distributions |
(1.67) |
(2.23) |
(1.07) |
(.38) |
(.44) I |
|
Redemption fees added to paid in capital C |
- H |
- H |
- H |
- H |
.01 |
|
Net asset value, end of period |
$ 84.28 |
$ 73.75 |
$ 66.71 |
$ 60.29 |
$ 43.46 |
|
Total Return A,B |
16.73% |
14.14% |
12.44% |
39.59% |
(29.94)% |
|
Ratios to Average Net Assets D,F |
|
|
|
|
|
|
Expenses before reductions |
1.83% |
1.85% |
1.86% |
1.90% |
1.93% |
|
Expenses net of fee waivers, if any |
1.83% |
1.85% |
1.86% |
1.90% |
1.93% |
|
Expenses net of all reductions |
1.82% |
1.84% |
1.85% |
1.89% |
1.93% |
|
Net investment income (loss) |
.83% |
.99% |
.79% |
.75% |
.52% |
|
Supplemental Data |
|
|
|
|
|
|
Net assets, end of period (000 omitted) |
$ 134,966 |
$ 102,321 |
$ 81,239 |
$ 73,829 |
$ 54,902 |
|
Portfolio turnover rate E |
28% |
35% |
57% |
69% |
70% |
A Total returns would have been lower if certain expenses had not been reduced during the applicable periods shown.
B Total returns do not include the effect of the contingent deferred sales charge.
C Calculated based on average shares outstanding during the period.
D Fees and expenses of any underlying Fidelity Central Funds are not included in the Fund's expense ratio. The Fund indirectly bears its proportionate share of the expenses of any underlying Fidelity Central Funds.
E Amount does not include the portfolio activity of any underlying Fidelity Central Funds.
F Expense ratios reflect operating expenses of the class. Expenses before reductions do not reflect amounts reimbursed by the investment adviser or reductions from brokerage service arrangements or reductions from other expense offset arrangements and do not represent the amount paid by the class during periods when reimbursements or reductions occur. Expenses net of fee waivers reflect expenses after reimbursement by the investment adviser but prior to reductions from brokerage service arrangements or other expense offset arrangements. Expenses net of all reductions represent the net expenses paid by the class.
G For the year ended February 29.
H Amount represents less than $.01 per share.
I Total distributions of $.44 per share is comprised of distributions from net investment income of $.443 and distributions from net realized gain of $.000 per share.
See accompanying notes which are an integral part of the financial statements.
Annual Report
Financial Highlights - Consumer Staples
|
Years ended February 28, |
2013 |
2012 G |
2011 |
2010 |
2009 |
|
Selected Per-Share Data |
|
|
|
|
|
|
Net asset value, beginning of period |
$ 75.29 |
$ 67.98 |
$ 61.34 |
$ 44.14 |
$ 63.25 |
|
Income from Investment Operations |
|
|
|
|
|
|
Net investment income (loss) C |
1.48 |
1.42 |
1.14 |
.96 |
.88 |
|
Net realized and unrealized gain (loss) |
11.82 |
8.76 |
7.14 |
17.11 |
(19.31) |
|
Total from investment operations |
13.30 |
10.18 |
8.28 |
18.07 |
(18.43) |
|
Distributions from net investment income |
(1.28) |
(1.24) |
(.98) |
(.87) |
(.67) |
|
Distributions from net realized gain |
(1.14) |
(1.64) |
(.66) |
- |
(.03) |
|
Total distributions |
(2.42) |
(2.87) J |
(1.64) |
(.87) |
(.69) I |
|
Redemption fees added to paid in capital C |
- H |
- H |
- H |
- H |
.01 |
|
Net asset value, end of period |
$ 86.17 |
$ 75.29 |
$ 67.98 |
$ 61.34 |
$ 44.14 |
|
Total Return A,B |
17.94% |
15.30% |
13.55% |
40.96% |
(29.23)% |
|
Ratios to Average Net Assets D,F |
|
|
|
|
|
|
Expenses before reductions |
.81% |
.83% |
.86% |
.92% |
.91% |
|
Expenses net of fee waivers, if any |
.81% |
.83% |
.86% |
.92% |
.91% |
|
Expenses net of all reductions |
.80% |
.82% |
.86% |
.91% |
.90% |
|
Net investment income (loss) |
1.85% |
2.01% |
1.78% |
1.73% |
1.55% |
|
Supplemental Data |
|
|
|
|
|
|
Net assets, end of period (000 omitted) |
$ 1,425,055 |
$ 1,202,440 |
$ 877,548 |
$ 946,455 |
$ 657,263 |
|
Portfolio turnover rate E |
28% |
35% |
57% |
69% |
70% |
A Total returns would have been lower if certain expenses had not been reduced during the applicable periods shown.
B Total returns do not include the effect of the former sales charges.
C Calculated based on average shares outstanding during the period.
D Fees and expenses of any underlying Fidelity Central Funds are not included in the Fund's expense ratio. The Fund indirectly bears its proportionate share of the expenses of any underlying Fidelity Central Funds.
E Amount does not include the portfolio activity of any underlying Fidelity Central Funds.
F Expense ratios reflect operating expenses of the class. Expenses before reductions do not reflect amounts reimbursed by the investment adviser or reductions from brokerage service arrangements or reductions from other expense offset arrangements and do not represent the amount paid by the class during periods when reimbursements or reductions occur. Expenses net of fee waivers reflect expenses after reimbursement by the investment adviser but prior to reductions from brokerage service arrangements or other expense offset arrangements. Expenses net of all reductions represent the net expenses paid by the class.
G For the year ended February 29.
H Amount represents less than $.01 per share.
I Total distributions of $.69 per share is comprised of distributions from net investment income of $.668 and distributions from net realized gain of $.025 per share.
J Total distributions of $2.87 per share is comprised of distributions from net investment income of $1.236 and distributions from net realized gain of $1.637 per share.
Financial Highlights - Institutional Class
|
Years ended February 28, |
2013 |
2012 F |
2011 |
2010 |
2009 |
|
Selected Per-Share Data |
|
|
|
|
|
|
Net asset value, beginning of period |
$ 75.14 |
$ 67.84 |
$ 61.26 |
$ 44.07 |
$ 63.22 |
|
Income from Investment Operations |
|
|
|
|
|
|
Net investment income (loss) B |
1.45 |
1.39 |
1.15 |
.98 |
.82 |
|
Net realized and unrealized gain (loss) |
11.79 |
8.73 |
7.13 |
17.09 |
(19.23) |
|
Total from investment operations |
13.24 |
10.12 |
8.28 |
18.07 |
(18.41) |
|
Distributions from net investment income |
(1.32) |
(1.19) |
(1.04) |
(.88) |
(.73) |
|
Distributions from net realized gain |
(1.14) |
(1.64) |
(.66) |
- |
(.03) |
|
Total distributions |
(2.46) |
(2.82) I |
(1.70) |
(.88) |
(.75) H |
|
Redemption fees added to paid in capital B |
- G |
- G |
- G |
- G |
.01 |
|
Net asset value, end of period |
$ 85.92 |
$ 75.14 |
$ 67.84 |
$ 61.26 |
$ 44.07 |
|
Total Return A |
17.90% |
15.24% |
13.57% |
41.03% |
(29.22)% |
|
Ratios to Average Net Assets C,E |
|
|
|
|
|
|
Expenses before reductions |
.85% |
.87% |
.87% |
.86% |
.91% |
|
Expenses net of fee waivers, if any |
.85% |
.87% |
.87% |
.86% |
.91% |
|
Expenses net of all reductions |
.84% |
.87% |
.87% |
.86% |
.91% |
|
Net investment income (loss) |
1.81% |
1.96% |
1.77% |
1.78% |
1.54% |
|
Supplemental Data |
|
|
|
|
|
|
Net assets, end of period (000 omitted) |
$ 378,731 |
$ 163,544 |
$ 237,883 |
$ 36,152 |
$ 30,922 |
|
Portfolio turnover rate D |
28% |
35% |
57% |
69% |
70% |
A Total returns would have been lower if certain expenses had not been reduced during the applicable periods shown.
B Calculated based on average shares outstanding during the period.
C Fees and expenses of any underlying Fidelity Central Funds are not included in the Fund's expense ratio. The Fund indirectly bears its proportionate share of the expenses of any underlying Fidelity Central Funds.
D Amount does not include the portfolio activity of any underlying Fidelity Central Funds.
E Expense ratios reflect operating expenses of the class. Expenses before reductions do not reflect amounts reimbursed by the investment adviser or reductions from brokerage service arrangements or reductions from other expense offset arrangements and do not represent the amount paid by the class during periods when reimbursements or reductions occur. Expenses net of fee waivers reflect expenses after reimbursement by the investment adviser but prior to reductions from brokerage service arrangements or other expense offset arrangements. Expenses net of all reductions represent the net expenses paid by the class.
F For the year ended February 29.
G Amount represents less than $.01 per share.
H Total distributions of $.75 per share is comprised of distributions from net investment income of $.726 and distributions from net realized gain of $.025 per share.
I Total distributions of $2.82 per share is comprised of distributions from net investment income of $1.186 and distributions from net realized gain of $1.637 per share.
See accompanying notes which are an integral part of the financial statements.
Annual Report
Notes to Financial Statements
For the period ended February 28, 2013
1. Organization.
Consumer Staples Portfolio (the Fund) is a non-diversified fund of Fidelity Select Portfolios (the Trust) and is authorized to issue an unlimited number of shares. The Trust is registered under the Investment Company Act of 1940, as amended (the 1940 Act), as an open-end management investment company organized as a Massachusetts business trust. The Fund invests primarily in securities of companies whose principal business activities fall within specific industries. The Fund offers Class A, Class T, Class C, Consumer Staples, and Institutional Class shares, each of which, along with Class B shares, has equal rights as to assets and voting privileges. Class B shares are closed to new accounts and additional purchases, except for exchanges and reinvestments. Each class has exclusive voting rights with respect to matters that affect that class. Class B shares will automatically convert to Class A shares after a holding period of seven years from the initial date of purchase. Investment income, realized and unrealized capital gains and losses, the common expenses of the Fund, and certain fund-level expense reductions, if any, are allocated on a pro-rata basis to each class based on the relative net assets of each class to the total net assets of the Fund. Each class differs with respect to transfer agent and distribution and service plan fees incurred. Certain expense reductions may also differ by class.
2. Investments in Fidelity Central Funds.
The Fund invests in Fidelity Central Funds, which are open-end investment companies available only to other investment companies and accounts managed by Fidelity Management & Research Company (FMR) and its affiliates. The Fund's Schedule of Investments lists each of the Fidelity Central Funds held as of period end, if any, as an investment of the Fund, but does not include the underlying holdings of each Fidelity Central Fund. As an Investing Fund, the Fund indirectly bears its proportionate share of the expenses of the underlying Fidelity Central Funds.
The Money Market Central Funds seek preservation of capital and current income and are managed by Fidelity Investments Money Management, Inc. (FIMM), an affiliate of FMR.
A complete unaudited list of holdings for each Fidelity Central Fund is available upon request or at the Securities and Exchange Commission (the SEC) website at www.sec.gov. In addition, the financial statements of the Fidelity Central Funds, which are not covered by the Fund's Report of Independent Registered Public Accounting Firm, are available on the SEC website or upon request.
3. Significant Accounting Policies.
The financial statements have been prepared in conformity with accounting principles generally accepted in the United States of America (GAAP), which require management to make certain estimates and assumptions at the date of the financial statements. Actual results could differ from those estimates. Subsequent events, if any, through the date that the financial statements were issued have been evaluated in the preparation of the financial statements. The following summarizes the significant accounting policies of the Fund:
Investment Valuation. Investments are valued as of 4:00 p.m. Eastern time on the last calendar day of the period. In accordance with valuation policies and procedures approved by the Board of Trustees (the Board), the Fund attempts to obtain prices from one or more third party pricing vendors or brokers to value its investments. When current market prices, quotations or currency exchange rates are not readily available or reliable, investments will be fair valued in good faith by the FMR Fair Value Committee (the Committee), in accordance with procedures adopted by the Fund's Board. Factors used in determining fair value vary by investment type and may include market or investment specific events. The frequency with which these procedures are used cannot be predicted and they may be utilized to a significant extent. The Committee oversees the Fund's valuation policies and procedures and is responsible for approving and reporting to the Board all fair value determinations.
The Fund categorizes the inputs to valuation techniques used to value its investments into a disclosure hierarchy consisting of three levels as shown below:
Level 1 - quoted prices in active markets for identical investments
Level 2 - other significant observable inputs (including quoted prices for similar investments, interest rates, prepayment speeds, etc.)
Level 3 - unobservable inputs (including the Fund's own assumptions based on the best information available)
Valuation techniques used to value the Fund's investments by major category are as follows:
Equity securities, including restricted securities, for which market quotations are readily available, are valued at the last reported sale price or official closing price as reported by a third party pricing vendor on the primary market or exchange on which they are traded and are categorized as Level 1 in the hierarchy. In the event there were no sales during the day or closing prices are not available, securities are valued at the last quoted bid price or may be valued using the last available price and are generally categorized as Level 2 in the hierarchy. For foreign equity securities, when significant market or security specific events arise, comparisons to the valuation of American Depositary Receipts (ADRs), futures contracts, Exchange-Traded Funds (ETFs) and certain indexes as well as quoted prices for similar securities are used and are categorized as Level 2 in the hierarchy. Utilizing these techniques may result in transfers between Level 1 and Level 2.
Annual Report
3. Significant Accounting Policies - continued
Investment Valuation - continued
Investments in open-end mutual funds ,including the Fidelity Central Funds, are valued at their closing net asset value (NAV) each business day and are categorized as Level 1 in the hierarchy.
Changes in valuation techniques may result in transfers in or out of an assigned level within the disclosure hierarchy. The aggregate value of investments by input level, as of February 28, 2013, including information on transfers between Levels 1 and 2, is included at the end of the Fund's Schedule of Investments.
Foreign Currency. The Fund may use foreign currency contracts to facilitate transactions in foreign-denominated securities. Gains and losses from these transactions may arise from changes in the value of the foreign currency or if the counterparties do not perform under the contracts' terms.
Foreign-denominated assets, including investment securities, and liabilities are translated into U.S. dollars at the exchange rates at period end. Purchases and sales of investment securities, income and dividends received and expenses denominated in foreign currencies are translated into U.S. dollars at the exchange rate in effect on the transaction date.
The effects of exchange rate fluctuations on investments are included with the net realized and unrealized gain (loss) on investment securities. Other foreign currency transactions resulting in realized and unrealized gain (loss) are disclosed separately.
Investment Transactions and Income. For financial reporting purposes, the Fund's investment holdings and NAV include trades executed through the end of the last business day of the period. The NAV per share for processing shareholder transactions is calculated as of the close of business of the New York Stock Exchange (NYSE), normally 4:00 p.m. Eastern time and includes trades executed through the end of the prior business day. Gains and losses on securities sold are determined on the basis of identified cost and may include proceeds received from litigation. Dividend income is recorded on the ex-dividend date, except for certain dividends from foreign securities where the ex-dividend date may have passed, which are recorded as soon as the Fund is informed of the ex-dividend date. Non-cash dividends included in dividend income, if any, are recorded at the fair market value of the securities received. Interest income and distributions from the Fidelity Central Funds are accrued as earned. Interest income includes coupon interest and amortization of premium and accretion of discount on debt securities. Investment income is recorded net of foreign taxes withheld where recovery of such taxes is uncertain.
Expenses. Expenses directly attributable to a fund are charged to that fund. Expenses attributable to more than one fund are allocated among the respective funds on the basis of relative net assets or other appropriate methods. Expense estimates are accrued in the period to which they relate and adjustments are made when actual amounts are known.
Income Tax Information and Distributions to Shareholders. Each year, the Fund intends to qualify as a regulated investment company under Subchapter M of the Internal Revenue Code, including distributing substantially all of its taxable income and realized gains. As a result, no provision for income taxes is required. As of February 28, 2013, the Fund did not have any unrecognized tax benefits in the financial statements; nor is the Fund aware of any tax positions for which it is reasonably possible that the total amounts of unrecognized tax benefits will significantly change in the next twelve months. The Fund files a U.S. federal tax return, in addition to state and local tax returns as required. A fund's federal income tax returns are subject to examination by the Internal Revenue Service (IRS) for a period of three fiscal years after they are filed. State and local tax returns may be subject to examination for an additional fiscal year depending on the jurisdiction. Foreign taxes are provided for based on the Fund's understanding of the tax rules and rates that exist in the foreign markets in which it invests.
Distributions are declared and recorded on the ex-dividend date. Income dividends and capital gain distributions are declared separately for each class. Income and capital gain distributions are determined in accordance with income tax regulations, which may differ from GAAP. In addition, the Fund claimed a portion of the payment made to redeeming shareholders as a distribution for income tax purposes.
Capital accounts within the financial statements are adjusted for permanent book-tax differences. These adjustments have no impact on net assets or the results of operations. Temporary book-tax differences will reverse in a subsequent period.
Book-tax differences are primarily due to foreign currency transactions, deferred trustees compensation and losses deferred due to wash sales and excise tax regulations.
The federal tax cost of investment securities and unrealized appreciation (depreciation) as of period end were as follows:
|
Gross unrealized appreciation |
$ 553,242,221 |
|
Gross unrealized depreciation |
(2,258,134) |
|
Net unrealized appreciation (depreciation) on securities and other investments |
$ 550,984,087 |
|
Tax Cost |
$ 1,762,011,898 |
Annual Report
Notes to Financial Statements - continued
3. Significant Accounting Policies - continued
Income Tax Information and Distributions to Shareholders - continued
The tax-based components of distributable earnings as of period end were as follows:
|
Undistributed ordinary income |
$ 6,885,738 |
|
Undistributed long-term capital gain |
$ 57,569,918 |
|
Net unrealized appreciation (depreciation) |
$ 550,983,637 |
The tax character of distributions paid was as follows:
|
|
February 28, 2013 |
February 29, 2012 |
|
Ordinary Income |
$ 31,344,671 |
$ 31,774,273 |
|
Long-term Capital Gains |
29,546,659 |
30,343,266 |
|
Total |
$ 60,891,330 |
$ 62,117,539 |
Trading (Redemption) Fees. Shares held by investors in the Fund less than 30 days are subject to a redemption fee equal to .75% of the net asset value of shares redeemed. All redemption fees, which reduce the proceeds of the shareholder redemption, are retained by the Fund and accounted for as an addition to paid in capital.
4. Purchases and Sales of Investments.
Purchases and sales of securities other than short-term securities, aggregated $716,429,728 and $535,013,896, respectively.
5. Fees and Other Transactions with Affiliates.
Management Fee. FMR and its affiliates provide the Fund with investment management related services for which the Fund pays a monthly management fee. The management fee is the sum of an individual fund fee rate that is based on an annual rate of .30% of the Fund's average net assets and an annualized group fee rate that averaged .26% during the period. The group fee rate is based upon the average net assets of all the mutual funds advised by FMR. The group fee rate decreases as assets under management increase and increases as assets under management decrease. For the period, the total annual management fee rate was .56% of the Fund's average net assets.
Distribution and Service Plan Fees. In accordance with Rule 12b-1 of the 1940 Act, the Fund has adopted separate Distribution and Service Plans for each class of shares. Certain classes pay Fidelity Distributors Corporation (FDC), an affiliate of FMR, separate Distribution and Service Fees, each of which is based on an annual percentage of each class' average net assets. In addition, FDC may pay financial intermediaries for selling shares of the Fund and providing shareholder support services. For the period, the Distribution and Service Fee rates, total fees and amounts retained by FDC were as follows:
|
|
Distribution |
Service |
Total Fees |
Retained |
|
Class A |
-% |
.25% |
$ 586,812 |
$ 10,136 |
|
Class T |
.25% |
.25% |
220,654 |
1,120 |
|
Class B |
.75% |
.25% |
186,750 |
140,226 |
|
Class C |
.75% |
.25% |
1,170,305 |
250,108 |
|
|
|
|
$ 2,164,521 |
$ 401,590 |
Sales Load. FDC may receive a front-end sales charge of up to 5.75% for selling Class A shares and 3.50% for selling Class T shares, some of which is paid to financial intermediaries for selling shares of the Fund. Depending on the holding period, FDC may receive contingent deferred sales charges levied on Class A, Class T, Class B, and Class C redemptions. The deferred sales charges range from 5.00% to 1.00% for Class B shares, 1.00% for Class C shares, 1.00% for certain purchases of Class A shares and .25% for certain purchases of Class T shares.
Annual Report
5. Fees and Other Transactions with Affiliates - continued
Sales Load - continued
For the period, sales charge amounts retained by FDC were as follows:
|
|
Retained |
|
Class A |
$ 190,041 |
|
Class T |
24,402 |
|
Class B* |
35,420 |
|
Class C* |
15,416 |
|
|
$ 265,279 |
* When Class B and Class C shares are initially sold, FDC pays commissions from its own resources to financial intermediaries through which the sales are made.
Transfer Agent Fees. Fidelity Investments Institutional Operations Company, Inc., (FIIOC), an affiliate of FMR, is the transfer, dividend disbursing and shareholder servicing agent for each class of the Fund. FIIOC receives account fees and asset-based fees that vary according to the account size and type of account of the shareholders of the respective classes of the Fund. FIIOC receives no fees for providing transfer agency services to Class F. FIIOC pays for typesetting, printing and mailing of shareholder reports, except proxy statements. For the period, transfer agent fees for each class were as follows:
|
|
Amount |
% of |
|
Class A |
$ 526,828 |
.22 |
|
Class T |
110,772 |
.25 |
|
Class B |
52,559 |
.28 |
|
Class C |
257,870 |
.22 |
|
Consumer Staples |
2,660,688 |
.20 |
|
Institutional Class |
630,855 |
.24 |
|
|
$ 4,239,572 |
|
Accounting and Security Lending Fees. Fidelity Service Company, Inc. (FSC), an affiliate of FMR, maintains the Fund's accounting records. The accounting fee is based on the level of average net assets for each month. Under a separate contract, FSC administers the security lending program. The security lending fee is based on the number and duration of lending transactions.
Brokerage Commissions. The Fund placed a portion of its portfolio transactions with brokerage firms which are affiliates of the investment adviser. The commissions paid to these affiliated firms were $11,055 for the period.
Interfund Lending Program. Pursuant to an Exemptive Order issued by the SEC, the Fund, along with other registered investment companies having management contracts with FMR, may participate in an interfund lending program. This program provides an alternative credit facility allowing the funds to borrow from, or lend money to, other participating affiliated funds. At period end, there were no interfund loans outstanding. The Fund's activity in this program during the period for which loans were outstanding was as follows:
|
Borrower or Lender |
Average Loan |
Weighted Average Interest Rate |
Interest Expense |
|
Borrower |
$ 12,984,167 |
.41% |
$ 887 |
6. Committed Line of Credit.
The Fund participates with other funds managed by FMR or an affiliate in a $4.25 billion credit facility (the "line of credit") to be utilized for temporary or emergency purposes to fund shareholder redemptions or for other short-term liquidity purposes. The Fund has agreed to pay commitment fees on its pro-rata portion of the line of credit, which amounted to $4,976 and is reflected in Miscellaneous expenses on the Statement of Operations. During the period, there were no borrowings on this line of credit.
Annual Report
Notes to Financial Statements - continued
7. Security Lending.
The Fund lends portfolio securities through a lending agent from time to time in order to earn additional income. On the settlement date of the loan, the Fund receives collateral (in the form of U.S. Treasury obligations, letters of credit and/or cash) against the loaned securities and maintains collateral in an amount not less than 100% of the market value of the loaned securities during the period of the loan. The market value of the loaned securities is determined at the close of business of the Fund and any additional required collateral is delivered to the Fund on the next business day. If the borrower defaults on its obligation to return the securities loaned because of insolvency or other reasons, a fund could experience delays and costs in recovering the securities loaned or in gaining access to the collateral. Any cash collateral received is invested in the Fidelity Securities Lending Cash Central Fund. The value of loaned securities and cash collateral at period end are disclosed on the Fund's Statement of Assets and Liabilities. At period end, there were no security loans outstanding with FCM. Security lending income represents the income earned on investing cash collateral, less rebates paid to borrowers and any lending agent fees associated with the loan, plus any premium payments received for lending certain types of securities. Security lending income is presented in the Statement of Operations as a component of income from Fidelity Central Funds. Total security lending income during the period amounted to $405,984, including $260 from securities loaned to FCM.
8. Expense Reductions.
Many of the brokers with whom FMR places trades on behalf of the Fund provided services to the Fund in addition to trade execution. These services included payments of certain expenses on behalf of the Fund totaling $119,711 for the period. In addition, through arrangements with the Fund's custodian, credits realized as a result of uninvested cash balances were used to reduce the Fund's expenses. During the period, these credits reduced the Fund's custody expenses by $85.
In addition, FMR reimbursed a portion of the Fund's operating expenses during the period in the amount of $5,568.
9. Distributions to Shareholders.
Distributions to shareholders of each class were as follows:
|
|
Year ended |
Year ended |
|
From net investment income |
|
|
|
Class A |
$ 3,290,973 |
$ 2,690,167 |
|
Class T |
500,306 |
422,197 |
|
Class B |
82,480 |
114,208 |
|
Class C |
820,066 |
829,469 |
|
Consumer Staples |
20,759,081 |
18,061,907 |
|
Institutional Class |
5,891,765 |
3,782,934 |
|
Total |
$ 31,344,671 |
$ 25,900,882 |
|
From net realized gain |
|
|
|
Class A |
$ 3,434,776 |
$ 4,102,363 |
|
Class T |
646,006 |
795,051 |
|
Class B |
260,273 |
441,952 |
|
Class C |
1,739,884 |
2,213,680 |
|
Consumer Staples |
18,561,423 |
23,446,773 |
|
Institutional Class |
4,904,297 |
5,216,838 |
|
Total |
$ 29,546,659 |
$ 36,216,657 |
Annual Report
10. Share Transactions.
Transactions for each class of shares were as follows:
|
|
Shares |
Dollars |
||
|
|
Year ended |
Year ended |
Year ended |
Year ended |
|
Class A |
|
|
|
|
|
Shares sold |
1,172,691 |
1,107,874 |
$ 93,404,427 |
$ 77,974,428 |
|
Reinvestment of distributions |
72,806 |
84,526 |
5,768,631 |
5,924,948 |
|
Shares redeemed |
(756,998) |
(816,686) |
(59,959,929) |
(57,527,748) |
|
Net increase (decrease) |
488,499 |
375,714 |
$ 39,213,129 |
$ 26,371,628 |
|
Class T |
|
|
|
|
|
Shares sold |
146,374 |
130,126 |
$ 11,640,258 |
$ 9,133,799 |
|
Reinvestment of distributions |
13,628 |
16,351 |
1,073,877 |
1,140,509 |
|
Shares redeemed |
(73,443) |
(90,239) |
(5,785,079) |
(6,276,410) |
|
Net increase (decrease) |
86,559 |
56,238 |
$ 6,929,056 |
$ 3,997,898 |
|
Class B |
|
|
|
|
|
Shares sold |
11,096 |
22,727 |
$ 868,729 |
$ 1,569,035 |
|
Reinvestment of distributions |
3,553 |
6,332 |
278,056 |
439,355 |
|
Shares redeemed |
(56,866) |
(67,638) |
(4,452,338) |
(4,695,265) |
|
Net increase (decrease) |
(42,217) |
(38,579) |
$ (3,305,553) |
$ (2,686,875) |
|
Class C |
|
|
|
|
|
Shares sold |
479,940 |
536,557 |
$ 37,531,069 |
$ 37,168,209 |
|
Reinvestment of distributions |
25,332 |
33,216 |
1,978,186 |
2,295,907 |
|
Shares redeemed |
(291,408) |
(400,115) |
(22,752,561) |
(28,068,157) |
|
Net increase (decrease) |
213,864 |
169,658 |
$ 16,756,694 |
$ 11,395,959 |
|
Consumer Staples |
|
|
|
|
|
Shares sold |
5,353,585 |
7,156,716 |
$ 425,841,967 |
$ 509,488,908 |
|
Reinvestment of distributions |
474,945 |
566,253 |
37,790,378 |
39,874,596 |
|
Shares redeemed |
(5,260,820) |
(4,661,196) |
(416,646,931) |
(330,401,040) |
|
Net increase (decrease) |
567,710 |
3,061,773 |
$ 46,985,414 |
$ 218,962,464 |
|
Institutional Class |
|
|
|
|
|
Shares sold |
3,475,040 |
2,454,993 |
$ 279,763,267 |
$ 173,115,499 |
|
Reinvestment of distributions |
125,836 |
115,398 |
10,030,919 |
8,111,953 |
|
Shares redeemed |
(1,369,230) |
(3,900,689) |
(108,604,076) |
(276,887,031) |
|
Net increase (decrease) |
2,231,646 |
(1,330,298) |
$ 181,190,110 |
$ (95,659,579) |
11. Other.
The Fund's organizational documents provide former and current trustees and officers with a limited indemnification against liabilities arising in connection with the performance of their duties to the Fund. In the normal course of business, the Fund may also enter into contracts that provide general indemnifications. The Fund's maximum exposure under these arrangements is unknown as this would be dependent on future claims that may be made against the Fund. The risk of material loss from such claims is considered remote.
At the end of the period, Strategic Advisers U. S. Opportunity Fund was the owner of record of approximately 11% of the total outstanding shares of the Fund. Mutual funds managed by FMR or its affiliates were the owners of record, in the aggregate, of approximately 26% of the total outstanding shares of the Fund.
Annual Report
Fidelity Advisor Gold Fund - Class A, T, B and C
Performance: The Bottom Line
Average annual total return reflects the change in the value of an investment, assuming reinvestment of the class' distributions from dividend income and capital gains (the profits earned upon the sale of securities that have grown in value, if any) and assuming a constant rate of performance each year. The $10,000 table and the fund's returns do not reflect the deduction of taxes that a shareholder would pay on fund distributions or the redemption of fund shares. During periods of reimbursement by Fidelity, a fund's total return will be greater than it would be had the reimbursement not occurred. How a fund did yesterday is no guarantee of how it will do tomorrow.
Average Annual Total Returns
|
Periods ended February 28, 2013 |
Past 1 |
Past 5 |
Past 10 |
|
Class A (incl. 5.75% sales charge) A |
-37.16% |
-6.30% |
8.73% |
|
Class T (incl. 3.50% sales charge) B |
-35.83% |
-6.11% |
8.82% |
|
Class B (incl. contingent deferred sales charge) C |
-37.15% |
-6.23% |
8.86% |
|
Class C (incl. contingent deferred sales charge) D |
-34.49% |
-5.89% |
8.86% |
A Class A shares bear a 0.25% 12b-1 fee. The initial offering of Class A shares took place on December 12, 2006. Returns prior to December 12, 2006, are those of Gold Portfolio, the original class of the fund, which has no 12b-1 fee. Had Class A shares' 12b-1 fee been reflected, returns prior to December 12, 2006, would have been lower.
B Class T shares bear a 0.50% 12b-1 fee. The initial offering of Class T shares took place on December 12, 2006. Returns prior to December 12, 2006, are those of Gold Portfolio, the original class of the fund, which has no 12b-1 fee. Had Class T shares' 12b-1 fee been reflected, returns prior to December 12, 2006, would have been lower.
C Class B shares bear a 1.00% 12b-1 fee. The initial offering of Class B shares took place on December 12, 2006. Returns prior to December 12, 2006, are those of Gold Portfolio, the original class of the fund, which has no 12b-1 fee. Had Class B shares' 12b-1 fee been reflected, returns prior to December 12, 2006, would have been lower. Class B shares' contingent deferred sales charges included in the past one year, past five years, and past ten years total return figures are 5%, 2%, and 0%, respectively.
D Class C shares bear a 1.00% 12b-1 fee. The initial offering of Class C shares took place on December 12, 2006. Returns prior to December 12, 2006, are those of Gold Portfolio, the original class of the fund, which has no 12b-1 fee. Had Class C shares' 12b-1 fee been reflected, returns prior to December 12, 2006, would have been lower. Class C shares' contingent deferred sales charges included in the past one year, past five years, and past ten years total return figures are 1%, 0%, and 0%, respectively.
$10,000 Over 10 Years
Let's say hypothetically that $10,000 was invested in Fidelity Advisor Gold Fund - Class A on February 28, 2003, and the current 5.75% sales charge was paid. The chart shows how the value of your investment would have changed, and also shows how the S&P 500 Index performed over the same period. The initial offering of Class A took place on December 12, 2006. See the Average Annual Total Returns table for additional information regarding the performance of Class A.
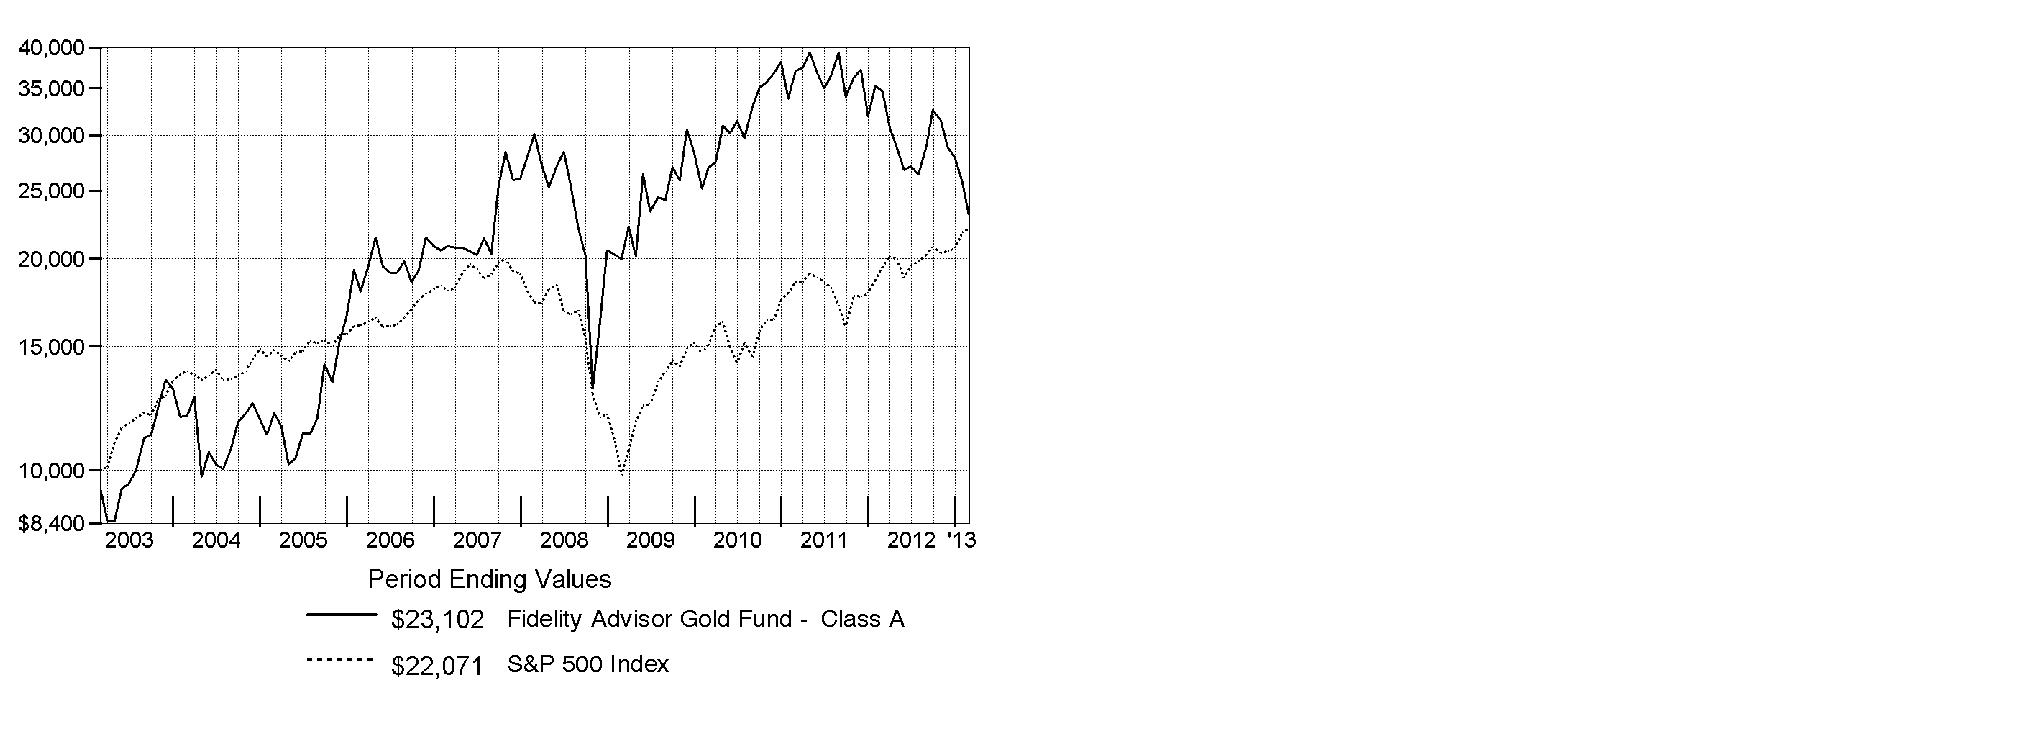
Annual Report
Fidelity Advisor Gold Fund
Management's Discussion of Fund Performance
Market Recap: U.S. stocks posted solid gains for the year ending February 28, 2013, sparked by a late-period rally that pushed major equity benchmarks to multiyear highs. Improvement in the global economy and more monetary stimulus from the U.S. Federal Reserve kept markets on the upswing for much of the year, shrugging off an early decline brought on by debt woes in Europe, and another dip later in the period amid Congressional gridlock on the federal budget. Renewed optimism over employment, the housing market, corporate earnings and record dividends made stocks a favorite with investors during the 12 months, which helped push the broad-based S&P 500® Index across the milestone 1,500 mark at the end of January. The S&P 500® finished the period up 13.46%. Seven of the 10 major market sectors tracked by MSCI U.S. IMI 25-50 classifications produced double-digit gains, led by health care and financials, while information technology, energy and materials trailed the broad equity market with only modest advances.
Comments from S. Joseph Wickwire, II, Portfolio Manager of Fidelity Advisor® Gold Fund: For the year, the fund's Class A, Class T, Class B and Class C shares returned -33.33%, -33.50%, -33.84% and -33.83%, respectively (excluding sales charges), lagging its industry benchmark, the S&P® Global BMI Gold Capped Index, which returned -32.73%, and the S&P 500®. Gold and gold stocks were hard hit during the period, due in part to fluctuating concern about the robustness of the U.S. economy and the U.S. dollar in a world where Europe and China were struggling economically. The fund was hurt by our overweighting, on average, in Premier Gold Mines, Avion Gold and Rainy River Resources, as these companies struggled in a difficult environment. Little-to-no ownership of China's Zijin Mining Group, Turkey's Koza Altin Isletmeleri and Canada's Nevsun Resources hurt, as these benchmark components outperformed. All three were not held at period end. Currency fluctuations also hindered performance, given the fund's investments in foreign stocks. A good balance between stock picking in gold stocks, an out-of-benchmark stake in gold bullion and a small allocation to silver bullion - no longer held - aided relative performance. Underweighting some poor-performing stocks helped, including Compania de Minas Buenaventura and Gabriel Resources, as did not owning index component Jaguar Mining. Stakes in Agnico-Eagle Mines and Randgold Resources proved beneficial.
The views expressed above reflect those of the portfolio manager(s) only through the end of the period as stated on the cover of this report and do not necessarily represent the views of Fidelity or any other person in the Fidelity organization. Any such views are subject to change at any time based upon market or other conditions and Fidelity disclaims any responsibility to update such views. These views may not be relied on as investment advice and, because investment decisions for a Fidelity fund are based on numerous factors, may not be relied on as an indication of trading intent on behalf of any Fidelity fund.
Annual Report
Gold Portfolio
Shareholder Expense Example
As a shareholder of the Fund, you incur two types of costs: (1) transaction costs, including sales charges (loads) on purchase payments or redemption proceeds, redemption fees and (2) ongoing costs, including management fees, distribution and/or service (12b-1) fees and other Fund expenses. This Example is intended to help you understand your ongoing costs (in dollars) of investing in the Fund and to compare these costs with the ongoing costs of investing in other mutual funds.
The Example is based on an investment of $1,000 invested at the beginning of the period and held for the entire period (September 1, 2012 to February 28, 2013).
Actual Expenses
The first line of the accompanying table for each class of the Fund provides information about actual account values and actual expenses. You may use the information in this line, together with the amount you invested, to estimate the expenses that you paid over the period. Simply divide your account value by $1,000.00 (for example, an $8,600 account value divided by $1,000.00 = 8.6), then multiply the result by the number in the first line for a class of the Fund under the heading entitled "Expenses Paid During Period" to estimate the expenses you paid on your account during this period. A small balance maintenance fee of $12.00 that is charged once a year may apply for certain accounts with a value of less than $2,000. This fee is not included in the table below. If it was, the estimate of expenses you paid during the period would be higher, and your ending account value lower, by this amount. In addition, the Fund, as a shareholder in the underlying Fidelity Central Funds, will indirectly bear its pro-rata share of the fees and expenses incurred by the underlying Fidelity Central Funds. These fees and expenses are not included in the Fund's annualized expense ratio used to calculate the expense estimate in the table below.
Hypothetical Example for Comparison Purposes
The second line of the accompanying table for each class of the Fund provides information about hypothetical account values and hypothetical expenses based on a Class' actual expense ratio and an assumed rate of return of 5% per year before expenses, which is not the Class' actual return. The hypothetical account values and expenses may not be used to estimate the actual ending account balance or expenses you paid for the period. You may use this information to compare the ongoing costs of investing in the Fund and other funds. To do so, compare this 5% hypothetical example with the 5% hypothetical examples that appear in the shareholder reports of the other funds. A small balance maintenance fee of $12.00 that is charged once a year may apply for certain accounts with a value of less than $2,000. This fee is not included in the table below. If it was, the estimate of expenses you paid during the period would be higher, and your ending account value lower, by this amount. In addition, the Fund, as a shareholder in the underlying Fidelity Central Funds, will indirectly bear its pro-rata share of the fees and expenses incurred by the underlying Fidelity Central Funds. These fees and expenses are not included in the Fund's annualized expense ratio used to calculate the expense estimate in the table below.
Please note that the expenses shown in the table are meant to highlight your ongoing costs only and do not reflect any transaction costs. Therefore, the second line of the table is useful in comparing ongoing costs only, and will not help you determine the relative total costs of owning different funds. In addition, if these transactional costs were included, your costs would have been higher.
|
|
Annualized |
Beginning |
Ending |
Expenses Paid |
|
Class A |
1.17% |
|
|
|
|
Actual |
|
$ 1,000.00 |
$ 799.60 |
$ 5.22 |
|
HypotheticalA |
|
$ 1,000.00 |
$ 1,018.99 |
$ 5.86 |
|
Class T |
1.44% |
|
|
|
|
Actual |
|
$ 1,000.00 |
$ 798.70 |
$ 6.42 |
|
HypotheticalA |
|
$ 1,000.00 |
$ 1,017.65 |
$ 7.20 |
|
Class B |
1.92% |
|
|
|
|
Actual |
|
$ 1,000.00 |
$ 796.50 |
$ 8.55 |
|
HypotheticalA |
|
$ 1,000.00 |
$ 1,015.27 |
$ 9.59 |
|
Class C |
1.91% |
|
|
|
|
Actual |
|
$ 1,000.00 |
$ 796.70 |
$ 8.51 |
|
HypotheticalA |
|
$ 1,000.00 |
$ 1,015.32 |
$ 9.54 |
|
Gold |
.92% |
|
|
|
|
Actual |
|
$ 1,000.00 |
$ 800.60 |
$ 4.11 |
|
HypotheticalA |
|
$ 1,000.00 |
$ 1,020.23 |
$ 4.61 |
|
Institutional Class |
.82% |
|
|
|
|
Actual |
|
$ 1,000.00 |
$ 801.10 |
$ 3.66 |
|
HypotheticalA |
|
$ 1,000.00 |
$ 1,020.73 |
$ 4.11 |
A 5% return per year before expenses
* Expenses are equal to each Class' annualized expense ratio, multiplied by the average account value over the period, multiplied by 181/365 (to reflect the one-half year period).
Annual Report
Gold Portfolio
Consolidated Investment Changes (Unaudited)
|
Top Ten Holdings as of February 28, 2013 |
||
|
|
% of fund's |
% of fund's net assets |
|
Barrick Gold Corp. |
12.6 |
11.1 |
|
Goldcorp, Inc. |
12.1 |
13.0 |
|
Newcrest Mining Ltd. |
7.7 |
6.9 |
|
Yamana Gold, Inc. |
5.3 |
4.5 |
|
Randgold Resources Ltd. sponsored ADR |
4.5 |
4.0 |
|
Gold Bullion |
4.4 |
3.7 |
|
Kinross Gold Corp. |
4.3 |
3.6 |
|
AngloGold Ashanti Ltd. sponsored ADR |
4.2 |
4.3 |
|
Newmont Mining Corp. |
4.0 |
8.1 |
|
Eldorado Gold Corp. |
3.6 |
3.6 |
|
|
62.7 |
|
|
Top Industries (% of fund's net assets) |
|||
|
As of February 28, 2013 |
|||
|
Gold |
94.3% |
|
 |
Commodities & Related Investments** |
4.4% |
|
|
Precious Metals & Minerals |
0.7% |
|
|
Diversified Metals & Mining |
0.2% |
|
|
Coal & Consumable Fuels |
0.2% |
|
|
Steel |
0.1% |
|
|
All Others* |
0.1% |
|

|
As of August 31, 2012 |
|||
|
Gold |
94.7% |
|
 |
Commodities & Related Investments** |
3.8% |
|
 |
Precious Metals & Minerals |
0.7% |
|
 |
Diversified Metals & Mining |
0.3% |
|
|
Coal & Consumable Fuels |
0.2% |
|
|
All Others* |
0.3% |
|

|
* Includes short-term investments and net other assets. |
|
** Includes gold bullion and/or silver bullion. |
|
Geographic Diversification (% of fund's net assets) |
|||
|
As of February 28, 2013 |
|||
|
Canada |
62.2% |
|
|
Australia |
11.4% |
|
|
United States of America |
11.1% |
|
|
South Africa |
8.5% |
|
|
Bailiwick of Jersey |
5.7% |
|
|
Bermuda |
0.5% |
|
|
Cayman Islands |
0.3% |
|
 |
United Kingdom |
0.3% |
|
|
Peru |
0.0% |
|
|
Other |
0.0% |
|

|
Percentages are based on country or territory of incorporation and are adjusted for the effect of futures contracts, if applicable. |
|
As of August 31, 2012 |
|||
|
Canada |
58.4% |
|
|
United States of America |
15.6% |
|
|
Australia |
9.9% |
|
|
South Africa |
8.8% |
|
|
Bailiwick of Jersey |
4.9% |
|
|
Peru |
1.2% |
|
|
United Kingdom |
0.6% |
|
|
China |
0.5% |
|
|
Bermuda |
0.1% |
|
|
Other |
0.0% |
|

|
Percentages are based on country or territory of incorporation and are adjusted for the effect of futures contracts, if applicable. |
Annual Report
Gold Portfolio
Consolidated Investments February 28, 2013
Showing Percentage of Net Assets
|
Common Stocks - 95.5% |
|||
|
Shares |
Value |
||
|
Australia - 11.4% |
|||
|
METALS & MINING - 11.4% |
|||
|
Gold - 11.4% |
|||
|
ABM Resources NL (a) |
2,300,000 |
$ 91,624 |
|
|
Alkane Resources Ltd. |
195,000 |
122,497 |
|
|
Ampella Mining Ltd. (a)(d) |
2,785,000 |
853,421 |
|
|
Beadell Resources Ltd. (a) |
9,968,618 |
8,247,780 |
|
|
Evolution Mining Ltd. (a) |
2,566,395 |
3,565,164 |
|
|
Gold One International Ltd. (a) |
90,277 |
25,820 |
|
|
Gryphon Minerals Ltd. (a) |
5,590,010 |
1,969,921 |
|
|
Intrepid Mines Ltd.: |
|
|
|
|
(Australia) (a) |
9,209,798 |
2,022,580 |
|
|
(Canada) (a) |
320,000 |
68,267 |
|
|
Kingsgate Consolidated NL (d) |
1,843,274 |
6,740,468 |
|
|
Medusa Mining Ltd. |
2,576,085 |
11,262,144 |
|
|
Newcrest Mining Ltd. |
8,706,620 |
201,523,923 |
|
|
Papillon Resources Ltd. (a)(d) |
1,964,068 |
2,567,932 |
|
|
Perseus Mining Ltd.: |
|
|
|
|
(Australia) (a) |
6,340,134 |
10,426,569 |
|
|
(Canada) (a) |
1,300,000 |
2,029,576 |
|
|
Ramelius Resources Ltd. (a)(d) |
980,000 |
320,327 |
|
|
Red 5 Ltd. (a) |
1,326,000 |
1,232,543 |
|
|
Regis Resources Ltd. (a) |
3,944,294 |
17,928,601 |
|
|
Resolute Mining Ltd. |
2,988,261 |
4,151,209 |
|
|
Saracen Mineral Holdings Ltd. (a) |
2,992,488 |
1,085,120 |
|
|
Silver Lake Resources Ltd. (a) |
4,547,781 |
10,173,275 |
|
|
St Barbara Ltd. (a) |
6,018,377 |
8,114,662 |
|
|
Tanami Gold NL (a)(d) |
130,000 |
29,877 |
|
|
Tanami Gold NL rights 3/12/13 (a)(d) |
162,500 |
2,324 |
|
|
Troy Resources NL |
195,000 |
587,589 |
|
|
Troy Resources NL (f) |
734,826 |
2,258,811 |
|
|
|
297,402,024 |
||
|
Bailiwick of Jersey - 5.7% |
|||
|
METALS & MINING - 5.7% |
|||
|
Gold - 5.7% |
|||
|
Centamin PLC (a) |
9,471,900 |
7,716,339 |
|
|
Lydian International Ltd. (a) |
1,525,300 |
2,336,944 |
|
|
Polyus Gold International Ltd. |
422,400 |
1,406,560 |
|
|
Polyus Gold International Ltd. sponsored GDR |
5,884,931 |
19,067,176 |
|
|
Randgold Resources Ltd. sponsored ADR |
1,424,595 |
118,056,188 |
|
|
|
148,583,207 |
||
|
Precious Metals & Minerals - 0.0% |
|||
|
Polymetal International PLC |
20,000 |
303,107 |
|
|
TOTAL METALS & MINING |
148,886,314 |
||
|
Bermuda - 0.5% |
|||
|
METALS & MINING - 0.5% |
|||
|
Gold - 0.4% |
|||
|
Continental Gold Ltd. (a) |
1,505,100 |
9,194,793 |
|
|
|
|||
|
Shares |
Value |
||
|
Steel - 0.1% |
|||
|
African Minerals Ltd. (a)(d) |
585,800 |
$ 2,521,652 |
|
|
TOTAL METALS & MINING |
11,716,445 |
||
|
Canada - 62.2% |
|||
|
METALS & MINING - 62.2% |
|||
|
Diversified Metals & Mining - 0.2% |
|||
|
East Asia Minerals Corp. (a) |
5,000 |
1,285 |
|
|
Eastmain Resources, Inc. (a) |
10,000 |
6,885 |
|
|
Kimber Resources, Inc. (a)(e) |
16,100 |
3,981 |
|
|
Kimber Resources, Inc. (a)(e)(f) |
5,577,500 |
1,379,164 |
|
|
NovaCopper, Inc. (a)(d) |
488,333 |
928,129 |
|
|
Sabina Gold & Silver Corp. (a) |
600,000 |
1,058,909 |
|
|
Turquoise Hill Resources Ltd. (a) |
285,000 |
1,821,236 |
|
|
|
5,199,589 |
||
|
Gold - 61.4% |
|||
|
Agnico-Eagle Mines Ltd. (Canada) (d) |
1,940,600 |
77,830,997 |
|
|
Alacer Gold Corp. (a) |
3,409,063 |
11,702,384 |
|
|
Alamos Gold, Inc. |
1,829,700 |
25,637,978 |
|
|
Americas Bullion Royalty Corp. (a) |
5,000 |
1,479 |
|
|
Argonaut Gold, Inc. (a) |
2,110,962 |
16,580,647 |
|
|
ATAC Resources Ltd. (a) |
67,200 |
71,680 |
|
|
AuRico Gold, Inc. (a) |
20,000 |
125,091 |
|
|
B2Gold Corp. (a) |
11,848,648 |
35,847,546 |
|
|
Banro Corp. (a) |
3,836,482 |
8,519,315 |
|
|
Barrick Gold Corp. (d) |
10,840,619 |
328,713,845 |
|
|
Belo Sun Mining Corp. (a)(d) |
5,680,400 |
5,838,763 |
|
|
Canaco Resources, Inc. (a)(f) |
121,100 |
55,779 |
|
|
Centerra Gold, Inc. |
2,047,200 |
13,300,596 |
|
|
Claude Resources, Inc. (a) |
320,000 |
127,224 |
|
|
Colossus Minerals, Inc. (a) |
3,087,200 |
8,621,708 |
|
|
Detour Gold Corp. (a) |
1,476,000 |
28,825,833 |
|
|
Detour Gold Corp. (a)(f) |
785,900 |
15,348,389 |
|
|
Eldorado Gold Corp. |
9,545,208 |
94,225,666 |
|
|
Exeter Resource Corp. (a) |
272,300 |
319,499 |
|
|
Franco-Nevada Corp. (d) |
1,612,500 |
77,994,182 |
|
|
Gabriel Resources Ltd. (a) |
950,600 |
2,276,831 |
|
|
Gold Canyon Resources, Inc. (a) |
800,000 |
360,727 |
|
|
Goldcorp, Inc. |
9,664,100 |
315,436,224 |
|
|
Golden Queen Mining Co. Ltd. (a) |
15,000 |
25,309 |
|
|
GoldQuest Mining Corp. (a) |
2,318,500 |
966,744 |
|
|
Gran Colombia Gold Corp. (a)(d) |
1,765,000 |
385,091 |
|
|
Guyana Goldfields, Inc. (a)(d) |
2,243,700 |
6,984,026 |
|
|
Guyana Goldfields, Inc. (a)(f) |
155,000 |
482,473 |
|
|
IAMGOLD Corp. |
4,024,500 |
27,122,691 |
|
|
International Minerals Corp. (Switzerland) |
15,000 |
61,133 |
|
|
International Tower Hill Mines Ltd. (a) |
546,700 |
906,528 |
|
|
Kinross Gold Corp. |
14,516,091 |
110,498,244 |
|
|
Kinross Gold Corp. warrants 9/17/14 (a) |
1,192,793 |
231,330 |
|
|
Kirkland Lake Gold, Inc. (a) |
791,000 |
4,694,225 |
|
|
Lake Shore Gold Corp. (a)(d) |
4,056,600 |
2,281,530 |
|
|
Common Stocks - continued |
|||
|
Shares |
Value |
||
|
Canada - continued |
|||
|
METALS & MINING - CONTINUED |
|||
|
Gold - continued |
|||
|
Marengo Mining Canada Ltd. (a) |
560,000 |
$ 77,222 |
|
|
Midas Gold Corp. (a) |
80,000 |
107,830 |
|
|
New Gold, Inc. (a) |
7,686,355 |
68,571,603 |
|
|
NGEx Resources, Inc. (a) |
50,000 |
145,455 |
|
|
Novagold Resources, Inc. (a)(d) |
2,930,000 |
11,620,558 |
|
|
OceanaGold Corp. (a) |
3,262,300 |
7,655,531 |
|
|
Orezone Gold Corp. (a) |
372,100 |
440,206 |
|
|
Orvana Minerals Corp. (a) |
10,000 |
9,988 |
|
|
Osisko Mining Corp. (a) |
3,972,631 |
22,997,922 |
|
|
Osisko Mining Corp. (a)(f) |
3,000,000 |
17,367,273 |
|
|
Pilot Gold, Inc. (a)(d) |
668,150 |
1,192,142 |
|
|
Premier Gold Mines Ltd. (a) |
4,996,322 |
13,711,119 |
|
|
Pretium Resources, Inc. (a) |
430,938 |
3,322,140 |
|
|
Pretium Resources, Inc. (a)(f) |
225,000 |
1,734,545 |
|
|
Pretium Resources, Inc. (a)(g) |
225,000 |
1,734,545 |
|
|
Primero Mining Corp. (a) |
911,200 |
5,009,943 |
|
|
Probe Mines Ltd. (a) |
85,000 |
140,121 |
|
|
Rainy River Resources Ltd. (a) |
3,056,400 |
8,328,227 |
|
|
Richmont Mines, Inc. (a) |
220,300 |
578,922 |
|
|
Romarco Minerals, Inc. (a) |
12,632,600 |
10,044,831 |
|
|
Romarco Minerals, Inc. (a)(f) |
5,900,000 |
4,691,394 |
|
|
Rubicon Minerals Corp. (a) |
4,568,502 |
9,967,641 |
|
|
San Gold Corp. (a) |
2,006,900 |
554,634 |
|
|
Sandstorm Gold Ltd. (a) |
30,000 |
280,727 |
|
|
Seabridge Gold, Inc. (a)(d) |
601,905 |
7,493,716 |
|
|
SEMAFO, Inc. (d) |
4,406,900 |
12,136,336 |
|
|
St. Andrew Goldfields Ltd. (a) |
440,000 |
192,000 |
|
|
Sulliden Gold Corp. Ltd. (a)(d) |
3,070,400 |
2,560,527 |
|
|
Teranga Gold Corp. (a) |
35,000 |
47,515 |
|
|
Teranga Gold Corp. CDI unit (a) |
3,430,974 |
4,906,396 |
|
|
Torex Gold Resources, Inc. (a) |
11,936,400 |
21,065,937 |
|
|
Volta Resources, Inc. (a) |
55,000 |
16,000 |
|
|
Yamana Gold, Inc. |
9,275,100 |
136,529,472 |
|
|
|
1,597,634,125 |
||
|
Precious Metals & Minerals - 0.6% |
|||
|
Chesapeake Gold Corp. (a) |
6,000 |
45,207 |
|
|
Dalradian Resources, Inc. (a) |
51,000 |
48,960 |
|
|
Gold Standard Ventures Corp. (a) |
415,400 |
410,868 |
|
|
Kaminak Gold Corp. Class A (a) |
20,000 |
21,333 |
|
|
MAG Silver Corp. (a) |
35,400 |
336,751 |
|
|
Pan American Silver Corp. |
88,387 |
1,457,501 |
|
|
Pan American Silver Corp. warrants 12/7/14 (a) |
232,460 |
65,048 |
|
|
Silver Wheaton Corp. |
39,000 |
1,236,655 |
|
|
|
|||
|
Shares |
Value |
||
|
Tahoe Resources, Inc. (a) |
736,300 |
$ 11,131,071 |
|
|
Wildcat Silver Corp. (a) |
75,200 |
50,316 |
|
|
|
14,803,710 |
||
|
TOTAL METALS & MINING |
1,617,637,424 |
||
|
Cayman Islands - 0.3% |
|||
|
METALS & MINING - 0.3% |
|||
|
Gold - 0.3% |
|||
|
Endeavour Mining Corp. (a) |
5,288,400 |
8,410,159 |
|
|
Netherlands - 0.0% |
|||
|
METALS & MINING - 0.0% |
|||
|
Gold - 0.0% |
|||
|
Nord Gold NV GDR (Reg. S) (a) |
15,000 |
63,000 |
|
|
Peru - 0.0% |
|||
|
METALS & MINING - 0.0% |
|||
|
Gold - 0.0% |
|||
|
Compania de Minas Buenaventura SA sponsored ADR |
5,000 |
128,100 |
|
|
South Africa - 8.5% |
|||
|
METALS & MINING - 8.5% |
|||
|
Gold - 8.5% |
|||
|
AngloGold Ashanti Ltd. sponsored ADR |
4,487,152 |
108,768,564 |
|
|
Gold Fields Ltd. |
55,000 |
450,798 |
|
|
Gold Fields Ltd. sponsored ADR |
8,462,226 |
70,151,854 |
|
|
Harmony Gold Mining Co. Ltd. |
1,484,000 |
9,301,172 |
|
|
Harmony Gold Mining Co. Ltd. sponsored ADR (d) |
3,347,300 |
20,686,314 |
|
|
Sibanye Gold Ltd. ADR (a) |
2,141,806 |
12,122,622 |
|
|
|
221,481,324 |
||
|
United Kingdom - 0.3% |
|||
|
METALS & MINING - 0.3% |
|||
|
Gold - 0.3% |
|||
|
Patagonia Gold PLC (a) |
260,000 |
57,193 |
|
|
Petropavlovsk PLC |
1,649,228 |
7,550,919 |
|
|
|
7,608,112 |
||
|
United States of America - 6.6% |
|||
|
METALS & MINING - 6.4% |
|||
|
Gold - 6.3% |
|||
|
Allied Nevada Gold Corp. (a) |
1,326,900 |
24,282,270 |
|
|
Allied Nevada Gold Corp. (Canada) (a) |
45,000 |
819,055 |
|
|
Gold Resource Corp. (d) |
40,000 |
524,000 |
|
|
Newmont Mining Corp. |
2,576,450 |
103,805,171 |
|
|
Royal Gold, Inc. |
526,113 |
34,481,446 |
|
|
|
163,911,942 |
||
|
Common Stocks - continued |
|||
|
Shares |
Value |
||
|
United States of America - continued |
|||
|
METALS & MINING - CONTINUED |
|||
|
Precious Metals & Minerals - 0.1% |
|||
|
McEwen Mining, Inc. (a) |
943,810 |
$ 2,293,458 |
|
|
TOTAL METALS & MINING |
166,205,400 |
||
|
OIL, GAS & CONSUMABLE FUELS - 0.2% |
|||
|
Coal & Consumable Fuels - 0.2% |
|||
|
Alpha Natural Resources, Inc. (a) |
320,000 |
2,553,600 |
|
|
Peabody Energy Corp. |
122,700 |
2,645,412 |
|
|
|
5,199,012 |
||
|
TOTAL UNITED STATES OF AMERICA |
171,404,412 |
||
|
TOTAL COMMON STOCKS (Cost $2,751,166,563) |
|
||
|
Commodities - 4.4% |
|||
|
Troy Ounces |
|
||
|
Gold Bullion (a) |
73,500 |
|
|
|
Money Market Funds - 16.4% |
|||
|
Shares |
|
||
|
Fidelity Cash Central Fund, 0.16% (b) |
8,528,230 |
8,528,230 |
|
|
Fidelity Securities Lending Cash Central Fund, 0.16% (b)(c) |
417,856,605 |
417,856,605 |
|
|
TOTAL MONEY MARKET FUNDS (Cost $426,384,835) |
|
||
|
TOTAL INVESTMENT PORTFOLIO - 116.3% (Cost $3,280,595,648) |
3,027,280,079 |
||
|
NET OTHER ASSETS (LIABILITIES) - (16.3)% |
(424,674,380) |
||
|
NET ASSETS - 100% |
$ 2,602,605,699 |
||
|
Legend |
|
(a) Non-income producing |
|
(b) Affiliated fund that is generally available only to investment companies and other accounts managed by Fidelity Investments. The rate quoted is the annualized seven-day yield of the fund at period end. A complete unaudited listing of the fund's holdings as of its most recent quarter end is available upon request. In addition, each Fidelity Central Fund's financial statements, which are not covered by the Fund's Report of Independent Registered Public Accounting Firm, are available on the SEC's website or upon request. |
|
(c) Investment made with cash collateral received from securities on loan. |
|
(d) Security or a portion of the security is on loan at period end. |
|
(e) Affiliated company |
|
(f) Security exempt from registration under Rule 144A of the Securities Act of 1933. These securities may be resold in transactions exempt from registration, normally to qualified institutional buyers. At the end of the period, the value of these securities amounted to $43,317,828 or 1.7% of net assets. |
|
(g) Restricted securities - Investment in securities not registered under the Securities Act of 1933 (excluding 144A issues). At the end of the period, the value of restricted securities (excluding 144A issues) amounted to $1,734,545 or 0.1% of net assets. |
|
Additional information on each restricted holding is as follows: |
|
Security |
Acquisition Date |
Acquisition Cost |
|
Pretium Resources, Inc. |
3/31/11 |
$ 2,172,293 |
|
Affiliated Central Funds |
|
Information regarding fiscal year to date income earned by the Fund from investments in Fidelity Central Funds is as follows: |
|
Fund |
Income earned |
|
Fidelity Cash Central Fund |
$ 13,702 |
|
Fidelity Securities Lending Cash Central Fund |
777,921 |
|
Total |
$ 791,623 |
|
Consolidated Subsidiary |
|
|
Value, |
Purchases |
Sales |
Dividend |
Value, |
|
Fidelity Select Gold Cayman Ltd. |
$ 43,125,922 |
$ 121,246,969 |
$ 43,684,769 |
$ - |
$ 116,121,090 |
|
Other Affiliated Issuers |
|
An affiliated company is a company in which the Fund has ownership of at least 5% of the voting securities. Fiscal year to date transactions with companies which are or were affiliates are as follows: |
|
Affiliate |
Value, |
Purchases |
Sales |
Dividend |
Value, |
|
Kimber Resources, Inc. |
$ 16,919 |
$ - |
$ - |
$ - |
$ 3,981 |
|
Kimber Resources, Inc. (144A) |
6,128,712 |
- |
140,075 |
- |
1,379,164 |
|
Total |
$ 6,145,631 |
$ - |
$ 140,075 |
$ - |
$ 1,383,145 |
|
Other Information |
|
The following is a summary of the inputs used, as of February 28, 2013, involving the Fund's assets and liabilities carried at fair value. The inputs or methodology used for valuing securities may not be an indication of the risk associated with investing in those securities. For more information on valuation inputs, and their aggregation into the levels used in the table below, please refer to the Investment Valuation section in the accompanying Notes to Consolidated Financial Statements. |
|
Valuation Inputs at Reporting Date: |
||||
|
Description |
Total |
Level 1 |
Level 2 |
Level 3 |
|
Investments in Securities: |
||||
|
Common Stocks |
$ 2,484,737,314 |
$ 2,474,920,296 |
$ 9,817,018 |
$ - |
|
Commodities |
116,157,930 |
116,157,930 |
- |
- |
|
Money Market Funds |
426,384,835 |
426,384,835 |
- |
- |
|
Total Investments in Securities: |
$ 3,027,280,079 |
$ 3,017,463,061 |
$ 9,817,018 |
$ - |
See accompanying notes which are an integral part of the consolidated financial statements.
Annual Report
Gold Portfolio
Consolidated Financial Statements
Consolidated Statement of Assets and Liabilities
|
|
February 28, 2013 |
|
|
|
|
|
|
Assets |
|
|
|
Investment in securities, at value (including securities loaned of $392,112,195) - See accompanying schedule: Unaffiliated issuers (cost $2,746,227,320) |
$ 2,483,354,169 |
|
|
Fidelity Central Funds (cost $426,384,835) |
426,384,835 |
|
|
Commodities (cost $103,044,250) |
116,157,930 |
|
|
Other affiliated issuers (cost $4,939,243) |
1,383,145 |
|
|
Total Investments (cost $3,280,595,648) |
|
$ 3,027,280,079 |
|
Cash |
|
715 |
|
Foreign currency held at value (cost $82,684) |
|
82,684 |
|
Receivable for investments sold |
|
5,257,999 |
|
Delayed delivery |
|
192,461 |
|
Receivable for fund shares sold |
|
3,459,026 |
|
Dividends receivable |
|
2,194,055 |
|
Distributions receivable from Fidelity Central Funds |
|
70,162 |
|
Prepaid expenses |
|
4,607 |
|
Receivable from investment adviser for expense reductions |
|
11,638 |
|
Other receivables |
|
88,669 |
|
Total assets |
|
3,038,642,095 |
|
|
|
|
|
Liabilities |
|
|
|
Payable for investments purchased |
$ 11,615,091 |
|
|
Payable for fund shares redeemed |
4,157,824 |
|
|
Accrued management fee |
1,301,169 |
|
|
Distribution and service plan fees payable |
76,605 |
|
|
Other affiliated payables |
880,568 |
|
|
Other payables and accrued expenses |
148,534 |
|
|
Collateral on securities loaned, at value |
417,856,605 |
|
|
Total liabilities |
|
436,036,396 |
|
|
|
|
|
Net Assets |
|
$ 2,602,605,699 |
|
Net Assets consist of: |
|
|
|
Paid in capital |
|
$ 3,303,577,289 |
|
Accumulated net investment loss |
|
(129,693,237) |
|
Accumulated undistributed net realized gain (loss) on investments and foreign currency transactions |
|
(317,951,928) |
|
Net unrealized appreciation (depreciation) on investments and assets and liabilities in foreign currencies |
|
(253,326,425) |
|
Net Assets |
|
$ 2,602,605,699 |
Consolidated Statement of Assets and Liabilities -
continued
|
|
February 28, 2013 |
|
|
Calculation of Maximum Offering Price Class A: |
|
$ 30.25 |
|
|
|
|
|
Maximum offering price per share (100/94.25 of $30.25) |
|
$ 32.10 |
|
Class T: |
|
$ 29.95 |
|
|
|
|
|
Maximum offering price per share (100/96.50 of $29.95) |
|
$ 31.04 |
|
Class B: |
|
$ 29.27 |
|
|
|
|
|
Class C: |
|
$ 29.15 |
|
|
|
|
|
|
|
|
|
Gold: |
|
$ 30.72 |
|
|
|
|
|
Institutional Class: |
|
$ 30.69 |
A Redemption price per share is equal to net asset value less any applicable contingent deferred sales charge.
See accompanying notes which are an integral part of the consolidated financial statements.
Annual Report
Consolidated Statement of Operations
|
|
Year ended February 28, 2013 |
|
|
|
|
|
|
Investment Income |
|
|
|
Dividends |
|
$ 45,886,618 |
|
Interest |
|
111 |
|
Income from Fidelity Central Funds |
|
791,623 |
|
Total income |
|
46,678,352 |
|
|
|
|
|
Expenses |
|
|
|
Management fee |
$ 19,638,737 |
|
|
Transfer agent fees |
10,364,827 |
|
|
Distribution and service plan fees |
1,124,567 |
|
|
Accounting and security lending fees |
1,461,846 |
|
|
Custodian fees and expenses |
395,094 |
|
|
Independent trustees' compensation |
23,350 |
|
|
Registration fees |
243,295 |
|
|
Audit |
48,549 |
|
|
Legal |
13,865 |
|
|
Interest |
6,213 |
|
|
Miscellaneous |
39,252 |
|
|
Total expenses before reductions |
33,359,595 |
|
|
Expense reductions |
(515,705) |
32,843,890 |
|
Net investment income (loss) |
|
13,834,462 |
|
Realized and Unrealized Gain (Loss) Net realized gain (loss) on: |
|
|
|
Investments: |
|
|
|
Unaffiliated issuers |
(148,732,522) |
|
|
Other affiliated issuers |
(218,170) |
|
|
Commodities |
(522,357) |
|
|
Foreign currency transactions |
56,194 |
|
|
Total net realized gain (loss) |
|
(149,416,855) |
|
Change in net unrealized appreciation (depreciation) on: Investments |
(1,259,403,752) |
|
|
Assets and liabilities in foreign currencies |
(20,196) |
|
|
Commodities |
(3,691,935) |
|
|
Total change in net unrealized appreciation (depreciation) |
|
(1,263,115,883) |
|
Net gain (loss) |
|
(1,412,532,738) |
|
Net increase (decrease) in net assets resulting from operations |
|
$ (1,398,698,276) |
Consolidated Statement of Changes in Net Assets
|
|
Year ended |
Year ended |
|
Increase (Decrease) in Net Assets |
|
|
|
Operations |
|
|
|
Net investment income (loss) |
$ 13,834,462 |
$ (2,911,115) |
|
Net realized gain (loss) |
(149,416,855) |
69,474,908 |
|
Change in net unrealized appreciation (depreciation) |
(1,263,115,883) |
(363,910,363) |
|
Net increase (decrease) in net assets resulting from operations |
(1,398,698,276) |
(297,346,570) |
|
Distributions to shareholders from net realized gain |
- |
(238,750,097) |
|
Share transactions - net increase (decrease) |
(374,414,799) |
229,358,064 |
|
Redemption fees |
209,222 |
461,104 |
|
Total increase (decrease) in net assets |
(1,772,903,853) |
(306,277,499) |
|
|
|
|
|
Net Assets |
|
|
|
Beginning of period |
4,375,509,552 |
4,681,787,051 |
|
End of period (including accumulated net investment loss of $129,693,237 and accumulated net investment loss of $30,304,890, respectively) |
$ 2,602,605,699 |
$ 4,375,509,552 |
See accompanying notes which are an integral part of the consolidated financial statements.
Annual Report
Consolidated Financial Highlights - Class A
|
Years ended February 28, |
2013 |
2012 G |
2011 |
2010 |
2009 |
|
Selected Per-Share Data |
|
|
|
|
|
|
Net asset value, beginning of period |
$ 45.37 |
$ 50.92 |
$ 40.50 |
$ 30.45 |
$ 46.19 |
|
Income from Investment Operations |
|
|
|
|
|
|
Net investment income (loss) C |
.07 |
(.13) |
(.30) |
(.25) |
(.15) |
|
Net realized and unrealized gain (loss) |
(15.19) |
(2.83) |
15.28 |
11.00 |
(15.44) |
|
Total from investment operations |
(15.12) |
(2.96) |
14.98 |
10.75 |
(15.59) |
|
Distributions from net realized gain |
- |
(2.59) |
(4.57) |
(.71) |
(.17) |
|
Redemption fees added to paid in capital C |
- H |
- H |
.01 |
.01 |
.02 |
|
Net asset value, end of period |
$ 30.25 |
$ 45.37 |
$ 50.92 |
$ 40.50 |
$ 30.45 |
|
Total Return A, B |
(33.33)% |
(6.24)% |
36.99% |
35.19% |
(33.81)% |
|
Ratios to Average Net Assets D, F |
|
|
|
|
|
|
Expenses before reductions |
1.18% |
1.14% |
1.16% |
1.21% |
1.21% |
|
Expenses net of fee waivers, if any |
1.17% |
1.14% |
1.15% |
1.19% |
1.19% |
|
Expenses net of all reductions |
1.17% |
1.14% |
1.14% |
1.17% |
1.15% |
|
Net investment income (loss) |
.18% |
(.28)% |
(.63)% |
(.63)% |
(.45)% |
|
Supplemental Data |
|
|
|
|
|
|
Net assets, end of period (000 omitted) |
$ 101,202 |
$ 152,969 |
$ 149,178 |
$ 82,413 |
$ 39,144 |
|
Portfolio turnover rate E |
18% |
22% |
35% |
46% |
42% |
|
A Total returns would have been lower if certain expenses had not been reduced during the applicable periods shown. B Total returns do not include the effect of the sales charges. C Calculated based on average shares outstanding during the period. D Fees and expenses of any underlying Fidelity Central Funds are not included in the Fund's expense ratio. The Fund indirectly bears its proportionate share of the expenses of any underlying Fidelity Central Funds. E Amount does not include the portfolio activity of any underlying Fidelity Central Funds. F Expense ratios reflect operating expenses of the class. Expenses before reductions do not reflect amounts reimbursed by the investment adviser or reductions from brokerage service arrangements or reductions from other expense offset arrangements and do not represent the amount paid by the class during periods when reimbursements or reductions occur. Expenses net of fee waivers reflect expenses after reimbursement by the investment adviser but prior to reductions from brokerage service arrangements or other expense offset arrangements. Expenses net of all reductions represent the net expenses paid by the class. G For the year ended February 29. H Amount represents less than $.01 per share. |
Consolidated Financial Highlights - Class T
|
Years ended February 28, |
2013 |
2012 G |
2011 |
2010 |
2009 |
|
Selected Per-Share Data |
|
|
|
|
|
|
Net asset value, beginning of period |
$ 45.04 |
$ 50.68 |
$ 40.34 |
$ 30.36 |
$ 46.17 |
|
Income from Investment Operations |
|
|
|
|
|
|
Net investment income (loss) C |
(.03) |
(.27) |
(.43) |
(.36) |
(.24) |
|
Net realized and unrealized gain (loss) |
(15.06) |
(2.80) |
15.21 |
10.96 |
(15.42) |
|
Total from investment operations |
(15.09) |
(3.07) |
14.78 |
10.60 |
(15.66) |
|
Distributions from net realized gain |
- |
(2.57) |
(4.45) |
(.63) |
(.17) |
|
Redemption fees added to paid in capital C |
- H |
- H |
.01 |
.01 |
.02 |
|
Net asset value, end of period |
$ 29.95 |
$ 45.04 |
$ 50.68 |
$ 40.34 |
$ 30.36 |
|
Total Return A, B |
(33.50)% |
(6.49)% |
36.62% |
34.79% |
(33.98)% |
|
Ratios to Average Net Assets D, F |
|
|
|
|
|
|
Expenses before reductions |
1.45% |
1.43% |
1.44% |
1.51% |
1.47% |
|
Expenses net of fee waivers, if any |
1.44% |
1.42% |
1.42% |
1.49% |
1.45% |
|
Expenses net of all reductions |
1.44% |
1.42% |
1.42% |
1.47% |
1.41% |
|
Net investment income (loss) |
(.09)% |
(.57)% |
(.90)% |
(.93)% |
(.71)% |
|
Supplemental Data |
|
|
|
|
|
|
Net assets, end of period (000 omitted) |
$ 24,913 |
$ 40,664 |
$ 45,846 |
$ 26,256 |
$ 15,284 |
|
Portfolio turnover rate E |
18% |
22% |
35% |
46% |
42% |
|
A Total returns would have been lower if certain expenses had not been reduced during the applicable periods shown. B Total returns do not include the effect of the sales charges. C Calculated based on average shares outstanding during the period. D Fees and expenses of any underlying Fidelity Central Funds are not included in the Fund's expense ratio. The Fund indirectly bears its proportionate share of the expenses of any underlying Fidelity Central Funds. E Amount does not include the portfolio activity of any underlying Fidelity Central Funds. F Expense ratios reflect operating expenses of the class. Expenses before reductions do not reflect amounts reimbursed by the investment adviser or reductions from brokerage service arrangements or reductions from other expense offset arrangements and do not represent the amount paid by the class during periods when reimbursements or reductions occur. Expenses net of fee waivers reflect expenses after reimbursement by the investment adviser but prior to reductions from brokerage service arrangements or other expense offset arrangements. Expenses net of all reductions represent the net expenses paid by the class. G For the year ended February 29. H Amount represents less than $.01 per share. |
See accompanying notes which are an integral part of the consolidated financial statements.
Annual Report
Consolidated Financial Highlights - Class B
|
Years ended February 28, |
2013 |
2012 G |
2011 |
2010 |
2009 |
|
Selected Per-Share Data |
|
|
|
|
|
|
Net asset value, beginning of period |
$ 44.24 |
$ 50.02 |
$ 39.87 |
$ 30.08 |
$ 45.97 |
|
Income from Investment Operations |
|
|
|
|
|
|
Net investment income (loss) C |
(.21) |
(.49) |
(.66) |
(.55) |
(.40) |
|
Net realized and unrealized gain (loss) |
(14.76) |
(2.76) |
15.02 |
10.84 |
(15.34) |
|
Total from investment operations |
(14.97) |
(3.25) |
14.36 |
10.29 |
(15.74) |
|
Distributions from net realized gain |
- |
(2.53) |
(4.21) |
(.51) |
(.17) |
|
Redemption fees added to paid in capital C |
- H |
- H |
- H |
.01 |
.02 |
|
Net asset value, end of period |
$ 29.27 |
$ 44.24 |
$ 50.02 |
$ 39.87 |
$ 30.08 |
|
Total Return A, B |
(33.84)% |
(6.95)% |
35.97% |
34.12% |
(34.30)% |
|
Ratios to Average Net Assets D, F |
|
|
|
|
|
|
Expenses before reductions |
1.93% |
1.90% |
1.93% |
2.00% |
1.97% |
|
Expenses net of fee waivers, if any |
1.92% |
1.90% |
1.92% |
1.98% |
1.95% |
|
Expenses net of all reductions |
1.91% |
1.90% |
1.91% |
1.96% |
1.89% |
|
Net investment income (loss) |
(.57)% |
(1.04)% |
(1.39)% |
(1.42)% |
(1.20)% |
|
Supplemental Data |
|
|
|
|
|
|
Net assets, end of period (000 omitted) |
$ 9,423 |
$ 20,894 |
$ 26,837 |
$ 18,340 |
$ 8,421 |
|
Portfolio turnover rate E |
18% |
22% |
35% |
46% |
42% |
|
A Total returns would have been lower if certain expenses had not been reduced during the applicable periods shown. B Total returns do not include the effect of the contingent deferred sales charge. C Calculated based on average shares outstanding during the period. D Fees and expenses of any underlying Fidelity Central Funds are not included in the Fund's expense ratio. The Fund indirectly bears its proportionate share of the expenses of any underlying Fidelity Central Funds. E Amount does not include the portfolio activity of any underlying Fidelity Central Funds. F Expense ratios reflect operating expenses of the class. Expenses before reductions do not reflect amounts reimbursed by the investment adviser or reductions from brokerage service arrangements or reductions from other expense offset arrangements and do not represent the amount paid by the class during periods when reimbursements or reductions occur. Expenses net of fee waivers reflect expenses after reimbursement by the investment adviser but prior to reductions from brokerage service arrangements or other expense offset arrangements. Expenses net of all reductions represent the net expenses paid by the class. G For the year ended February 29. H Amount represents less than $.01 per share. |
Consolidated Financial Highlights - Class C
|
Years ended February 28, |
2013 |
2012 G |
2011 |
2010 |
2009 |
|
Selected Per-Share Data |
|
|
|
|
|
|
Net asset value, beginning of period |
$ 44.05 |
$ 49.81 |
$ 39.75 |
$ 30.00 |
$ 45.85 |
|
Income from Investment Operations |
|
|
|
|
|
|
Net investment income (loss) C |
(.20) |
(.47) |
(.64) |
(.53) |
(.39) |
|
Net realized and unrealized gain (loss) |
(14.70) |
(2.76) |
14.98 |
10.80 |
(15.30) |
|
Total from investment operations |
(14.90) |
(3.23) |
14.34 |
10.27 |
(15.69) |
|
Distributions from net realized gain |
- |
(2.53) |
(4.28) |
(.53) |
(.17) |
|
Redemption fees added to paid in capital C |
- H |
- H |
- H |
.01 |
.01 |
|
Net asset value, end of period |
$ 29.15 |
$ 44.05 |
$ 49.81 |
$ 39.75 |
$ 30.00 |
|
Total Return A, B |
(33.83)% |
(6.93)% |
36.01% |
34.15% |
(34.30)% |
|
Ratios to Average Net Assets D, F |
|
|
|
|
|
|
Expenses before reductions |
1.93% |
1.87% |
1.89% |
1.97% |
1.97% |
|
Expenses net of fee waivers, if any |
1.92% |
1.87% |
1.88% |
1.95% |
1.95% |
|
Expenses net of all reductions |
1.91% |
1.87% |
1.87% |
1.93% |
1.89% |
|
Net investment income (loss) |
(.57)% |
(1.01)% |
(1.35)% |
(1.39)% |
(1.20)% |
|
Supplemental Data |
|
|
|
|
|
|
Net assets, end of period (000 omitted) |
$ 37,787 |
$ 67,996 |
$ 72,431 |
$ 38,624 |
$ 17,544 |
|
Portfolio turnover rate E |
18% |
22% |
35% |
46% |
42% |
|
A Total returns would have been lower if certain expenses had not been reduced during the applicable periods shown. B Total returns do not include the effect of the contingent deferred sales charge. C Calculated based on average shares outstanding during the period. D Fees and expenses of any underlying Fidelity Central Funds are not included in the Fund's expense ratio. The Fund indirectly bears its proportionate share of the expenses of any underlying Fidelity Central Funds. E Amount does not include the portfolio activity of any underlying Fidelity Central Funds. F Expense ratios reflect operating expenses of the class. Expenses before reductions do not reflect amounts reimbursed by the investment adviser or reductions from brokerage service arrangements or reductions from other expense offset arrangements and do not represent the amount paid by the class during periods when reimbursements or reductions occur. Expenses net of fee waivers reflect expenses after reimbursement by the investment adviser but prior to reductions from brokerage service arrangements or other expense offset arrangements. Expenses net of all reductions represent the net expenses paid by the class. G For the year ended February 29. H Amount represents less than $.01 per share. |
See accompanying notes which are an integral part of the consolidated financial statements.
Annual Report
Consolidated Financial Highlights - Gold
|
Years ended February 28, |
2013 |
2012 F |
2011 |
2010 |
2009 |
|
Selected Per-Share Data |
|
|
|
|
|
|
Net asset value, beginning of period |
$ 45.96 |
$ 51.44 |
$ 40.85 |
$ 30.67 |
$ 46.37 |
|
Income from Investment Operations |
|
|
|
|
|
|
Net investment income (loss) B |
.16 |
(.02) |
(.18) |
(.16) |
(.04) |
|
Net realized and unrealized gain (loss) |
(15.40) |
(2.85) |
15.43 |
11.10 |
(15.51) |
|
Total from investment operations |
(15.24) |
(2.87) |
15.25 |
10.94 |
(15.55) |
|
Distributions from net realized gain |
- |
(2.61) |
(4.67) |
(.77) |
(.17) |
|
Redemption fees added to paid in capital B |
- G |
- G |
.01 |
.01 |
.02 |
|
Net asset value, end of period |
$ 30.72 |
$ 45.96 |
$ 51.44 |
$ 40.85 |
$ 30.67 |
|
Total Return A |
(33.16)% |
(6.00)% |
37.35% |
35.52% |
(33.59)% |
|
Ratios to Average Net Assets C, E |
|
|
|
|
|
|
Expenses before reductions |
.93% |
.89% |
.91% |
.98% |
.89% |
|
Expenses net of fee waivers, if any |
.92% |
.89% |
.90% |
.96% |
.87% |
|
Expenses net of all reductions |
.92% |
.89% |
.89% |
.94% |
.86% |
|
Net investment income (loss) |
.43% |
(.03)% |
(.37)% |
(.40)% |
(.13)% |
|
Supplemental Data |
|
|
|
|
|
|
Net assets, end of period (000 omitted) |
$ 2,301,019 |
$ 3,924,439 |
$ 4,250,249 |
$ 2,839,664 |
$ 1,881,600 |
|
Portfolio turnover rate D |
18% |
22% |
35% |
46% |
42% |
|
A Total returns would have been lower if certain expenses had not been reduced during the applicable periods shown. B Calculated based on average shares outstanding during the period. C Fees and expenses of any underlying Fidelity Central Funds are not included in the Fund's expense ratio. The Fund indirectly bears its proportionate share of the expenses of any underlying Fidelity Central Funds. D Amount does not include the portfolio activity of any underlying Fidelity Central Funds. E Expense ratios reflect operating expenses of the class. Expenses before reductions do not reflect amounts reimbursed by the investment adviser or reductions from brokerage service arrangements or reductions from other expense offset arrangements and do not represent the amount paid by the class during periods when reimbursements or reductions occur. Expenses net of fee waivers reflect expenses after reimbursement by the investment adviser but prior to reductions from brokerage service arrangements or other expense offset arrangements. Expenses net of all reductions represent the net expenses paid by the class. F For the year ended February 29. G Amount represents less than $.01 per share. |
Consolidated Financial Highlights - Institutional Class
|
Years ended February 28, |
2013 |
2012 F |
2011 |
2010 |
2009 |
|
Selected Per-Share Data |
|
|
|
|
|
|
Net asset value, beginning of period |
$ 45.87 |
$ 51.32 |
$ 40.77 |
$ 30.65 |
$ 46.34 |
|
Income from Investment Operations |
|
|
|
|
|
|
Net investment income (loss) B |
.20 |
.02 |
(.15) |
(.15) |
(.05) |
|
Net realized and unrealized gain (loss) |
(15.38) |
(2.85) |
15.41 |
11.08 |
(15.49) |
|
Total from investment operations |
(15.18) |
(2.83) |
15.26 |
10.93 |
(15.54) |
|
Distributions from net realized gain |
- |
(2.62) |
(4.72) |
(.82) |
(.17) |
|
Redemption fees added to paid in capital B |
- G |
- G |
.01 |
.01 |
.02 |
|
Net asset value, end of period |
$ 30.69 |
$ 45.87 |
$ 51.32 |
$ 40.77 |
$ 30.65 |
|
Total Return A |
(33.09)% |
(5.94)% |
37.45% |
35.50% |
(33.59)% |
|
Ratios to Average Net Assets C, E |
|
|
|
|
|
|
Expenses before reductions |
.84% |
.82% |
.85% |
.95% |
.91% |
|
Expenses net of fee waivers, if any |
.83% |
.81% |
.84% |
.93% |
.89% |
|
Expenses net of all reductions |
.82% |
.81% |
.83% |
.91% |
.86% |
|
Net investment income (loss) |
.52% |
.04% |
(.31)% |
(.37)% |
(.14)% |
|
Supplemental Data |
|
|
|
|
|
|
Net assets, end of period (000 omitted) |
$ 128,262 |
$ 168,548 |
$ 137,246 |
$ 38,037 |
$ 6,070 |
|
Portfolio turnover rate D |
18% |
22% |
35% |
46% |
42% |
|
A Total returns would have been lower if certain expenses had not been reduced during the applicable periods shown. B Calculated based on average shares outstanding during the period. C Fees and expenses of any underlying Fidelity Central Funds are not included in the Fund's expense ratio. The Fund indirectly bears its proportionate share of the expenses of any underlying Fidelity Central Funds. D Amount does not include the portfolio activity of any underlying Fidelity Central Funds. E Expense ratios reflect operating expenses of the class. Expenses before reductions do not reflect amounts reimbursed by the investment adviser or reductions from brokerage service arrangements or reductions from other expense offset arrangements and do not represent the amount paid by the class during periods when reimbursements or reductions occur. Expenses net of fee waivers reflect expenses after reimbursement by the investment adviser but prior to reductions from brokerage service arrangements or other expense offset arrangements. Expenses net of all reductions represent the net expenses paid by the class. F For the year ended February 29. G Amount represents less than $.01 per share. |
See accompanying notes which are an integral part of the consolidated financial statements.
Annual Report
Notes to Consolidated Financial Statements
For the period ended February 28, 2013
1. Organization.
Gold Portfolio (the Fund) is a non-diversified fund of Fidelity Select Portfolios (the Trust) and is authorized to issue an unlimited number of shares. The Trust is registered under the Investment Company Act of 1940, as amended (the 1940 Act), as an open-end management investment company organized as a Massachusetts business trust. The Fund invests primarily in securities of companies whose principal business activities fall within specific industries. The Fund offers Class A, Class T, Class C, Gold, and Institutional Class shares, each of which, along with Class B shares, has equal rights as to assets and voting privileges. Class B shares are closed to new accounts and additional purchases, except for exchanges and reinvestments. Each class has exclusive voting rights with respect to matters that affect that class. Class B shares will automatically convert to Class A shares after a holding period of seven years from the initial date of purchase. Investment income, realized and unrealized capital gains and losses, the common expenses of the Fund, and certain fund-level expense reductions, if any, are allocated on a pro-rata basis to each class based on the relative net assets of each class to the total net assets of the Fund. Each class differs with respect to transfer agent and distribution and service plan fees incurred. Certain expense reductions may also differ by class.
2. Consolidated Subsidiary
The Fund invests in certain commodity-related investments through Fidelity Select Gold Cayman Ltd., a wholly owned subsidiary (the "Subsidiary"). As of February 28, 2013, the Fund held $116,121,090 in the Subsidiary, representing 4.5% of the Fund's net assets.
The financial statements have been consolidated and include accounts of the Fund and the Subsidiary. Accordingly, all inter-company transactions and balances have been eliminated.
3. Investments in Fidelity Central Funds.
The Fund invests in Fidelity Central Funds, which are open-end investment companies available only to other investment companies and accounts managed by Fidelity Management & Research Company (FMR) and its affiliates. The Fund's Consolidated Schedule of Investments lists each of the Fidelity Central Funds held as of period end, if any, as an investment of the Fund, but does not include the underlying holdings of each Fidelity Central Fund. As an Investing Fund, the Fund indirectly bears its proportionate share of the expenses of the underlying Fidelity Central Funds.
The Money Market Central Funds seek preservation of capital and current income and are managed by Fidelity Investments Money Management, Inc. (FIMM), an affiliate of FMR.
A complete unaudited list of holdings for each Fidelity Central Fund is available upon request or at the Securities and Exchange Commission (the SEC) website at www.sec.gov. In addition, the financial statements of the Fidelity Central Funds, which are not covered by the Fund's Report of Independent Registered Public Accounting Firm, are available on the SEC website or upon request.
4. Significant Accounting Policies.
The consolidated financial statements have been prepared in conformity with accounting principles generally accepted in the United States of America (GAAP), which require management to make certain estimates and assumptions at the date of the consolidated financial statements. Actual results could differ from those estimates. Subsequent events, if any, through the date that the consolidated financial statements were issued have been evaluated in the preparation of the consolidated financial statements. The following summarizes the significant accounting policies of the Fund:
Investment Valuation. Investments are valued as of 4:00 p.m. Eastern time on the last calendar day of the period. In accordance with valuation policies and procedures approved by the Board of Trustees (the Board), the Fund attempts to obtain prices from one or more third party pricing vendors or brokers to value its investments. When current market prices, quotations or currency exchange rates are not readily available or reliable, investments will be fair valued in good faith by FMR Fair Value Committee (the Committee), in accordance with procedures adopted by the Fund's Board. Factors used in determining fair value vary by investment type and may include market or investment specific events. The frequency with which these procedures are used cannot be predicted and they may be utilized to a significant extent. The Committee oversees the Fund's valuation policies and procedures and is responsible for approving and reporting to the Board all fair value determinations.
The Fund categorizes the inputs to valuation techniques used to value its investments into a disclosure hierarchy consisting of three levels as shown below:
Level 1 - quoted prices in active markets for identical investments
Level 2 - other significant observable inputs (including quoted prices for similar investments, interest rates, prepayment speeds, etc.)
Level 3 - unobservable inputs (including the Fund's own assumptions based on the best information available)
Valuation techniques used to value the Fund's investments by major category are as follows:
Annual Report
4. Significant Accounting Policies - continued
Investment Valuation - continued
Equity securities, including restricted securities, for which market quotations are readily available, are valued at the last reported sale price or official closing price as reported by a third party pricing vendor on the primary market or exchange on which they are traded and are categorized as Level 1 in the hierarchy. In the event there were no sales during the day or closing prices are not available, securities are valued at the last quoted bid price or may be valued using the last available price and are generally categorized as Level 2 in the hierarchy. For foreign equity securities, when significant market or security specific events arise, comparisons to the valuation of American Depositary Receipts (ADRs), futures contracts, Exchange-Traded Funds (ETFs) and certain indexes as well as quoted prices for similar securities are used and are categorized as Level 2 in the hierarchy. Utilizing these techniques may result in transfers between Level 1 and Level 2. For restricted equity securities and private placements where observable inputs are limited, assumptions about market activity and risk are used and these securities are generally categorized as Level 3 in the hierarchy.
Investments in commodities are valued at their last traded price at 4:00 p.m. Eastern time each business day and are categorized as Level 1 in the hierarchy. Investments in open-end mutual funds, including the Fidelity Central Funds, are valued at their closing net asset value (NAV) each business day and are categorized as Level 1 in the hierarchy.
Changes in valuation techniques may result in transfers in or out of an assigned level within the disclosure hierarchy. The aggregate value of investments by input level, as of February 28, 2013, is included at the end of the Fund's Consolidated Schedule of Investments.
Foreign Currency. The Fund may use foreign currency contracts to facilitate transactions in foreign-denominated securities. Gains and losses from these transactions may arise from changes in the value of the foreign currency or if the counterparties do not perform under the contracts' terms.
Foreign-denominated assets, including investment securities, and liabilities are translated into U.S. dollars at the exchange rates at period end. Purchases and sales of investment securities, income and dividends received and expenses denominated in foreign currencies are translated into U.S. dollars at the exchange rate in effect on the transaction date.
The effects of exchange rate fluctuations on investments are included with the net realized and unrealized gain (loss) on investment securities. Other foreign currency transactions resulting in realized and unrealized gain (loss) are disclosed separately.
Investment Transactions and Income. For financial reporting purposes, the Fund's investment holdings and NAV include trades executed through the end of the last business day of the period. The NAV per share for processing shareholder transactions is calculated as of the close of business of the New York Stock Exchange (NYSE), normally 4:00 p.m. Eastern time and includes trades executed through the end of the prior business day. Gains and losses on securities sold are determined on the basis of identified cost. Dividend income is recorded on the ex-dividend date, except for certain dividends from foreign securities where the ex-dividend date may have passed, which are recorded as soon as the Fund is informed of the ex-dividend date. Non-cash dividends included in dividend income, if any, are recorded at the fair market value of the securities received. Distributions received on securities that represent a return of capital or capital gain are recorded as a reduction of cost of investments and/or as a realized gain. The Fund estimates the components of distributions received that may be considered return of capital distributions or capital gain distributions. Interest income and distributions from the Fidelity Central Funds are accrued as earned. Interest income includes coupon interest and amortization of premium and accretion of discount on debt securities. Investment income is recorded net of foreign taxes withheld where recovery of such taxes is uncertain.
Expenses. Expenses directly attributable to a fund are charged to that fund. Expenses attributable to more than one fund are allocated among the respective funds on the basis of relative net assets or other appropriate methods. Expense estimates are accrued in the period to which they relate and adjustments are made when actual amounts are known.
Income Tax Information and Distributions to Shareholders. Each year, the Fund intends to qualify as a regulated investment company under Subchapter M of the Internal Revenue Code, including distributing substantially all of its taxable income and realized gains. As a result, no provision for income taxes is required. As of February 28, 2013, the Fund did not have any unrecognized tax benefits in the consolidated financial statements; nor is the Fund aware of any tax positions for which it is reasonably possible that the total amounts of unrecognized tax benefits will significantly change in the next twelve months. The Fund files a U.S. federal tax return, in addition to state and local tax returns as required. A fund's federal income tax returns are subject to examination by the Internal Revenue Service (IRS) for a period of three fiscal years after they are filed. State and local tax returns may be subject to examination for an additional fiscal year depending on the jurisdiction. Foreign taxes are provided for based on the Fund's understanding of the tax rules and rates that exist in the foreign markets in which it invests.
The Subsidiary is classified as a controlled foreign corporation under Subchapter N of the Internal Revenue Code. Therefore, the Fund is required to increase its taxable income by its share of the Subsidiary's income. Net investment losses of the Subsidiary cannot be deducted by the Fund in the current period nor carried forward to offset taxable income in future periods.
Annual Report
Notes to Consolidated Financial Statements - continued
4. Significant Accounting Policies - continued
Income Tax Information and Distributions to Shareholders - continued
Distributions are declared and recorded on the ex-dividend date. Income dividends and capital gain distributions are declared separately for each class. Income and capital gain distributions are determined in accordance with income tax regulations, which may differ from GAAP. In addition, the Fund claimed a portion of the payment made to redeeming shareholders as a distribution for income tax purposes.
Capital accounts within the consolidated financial statements are adjusted for permanent book-tax differences. These adjustments have no impact on net assets or the results of operations. Temporary book-tax differences will reverse in a subsequent period.
Book-tax differences are primarily due to foreign currency transactions, passive foreign investment companies (PFIC), controlled foreign corporation, deferred trustees compensation, net operating losses and losses deferred due to wash sales and excise tax regulations.
The federal tax cost of investment securities and unrealized appreciation (depreciation) as of period end on an unconsolidated basis were as follows:
|
Gross unrealized appreciation |
$ 353,036,986 |
|
Gross unrealized depreciation |
(764,931,082) |
|
Net unrealized appreciation (depreciation) on securities and other investments |
$ (411,894,096) |
|
|
|
|
Tax Cost |
$ 3,439,137,336 |
The tax-based components of distributable earnings as of period end were as follows:
|
Capital loss carryforward |
$ (170,232,605) |
|
Net unrealized appreciation (depreciation) |
$ (411,904,952) |
Capital loss carryforwards are only available to offset future capital gains of the Fund to the extent provided by regulations and may be limited. Under the Regulated Investment Company Modernization Act of 2010 (the Act), the Fund is permitted to carry forward capital losses incurred in taxable years beginning after December 22, 2010 for an unlimited period and such capital losses are required to be used prior to any losses that expire. Capital loss carryforwards were as follows:
|
Short-term |
$ (67,261,086) |
|
Long-term |
(102,971,519) |
|
Total capital loss carryforward |
$ (170,232,605) |
The Fund intends to elect to defer to its fiscal year ending February 28, 2014 approximately $129,692,316 of ordinary losses recognized during the period November 1, 2012 to February 28, 2013.
The tax character of distributions paid was as follows:
|
|
February 28, 2013 |
February 29, 2012 |
|
Ordinary Income |
$ - |
$ 158,364,329 |
|
Long-term Capital Gains |
- |
80,385,768 |
|
Total |
$ - |
$ 238,750,097 |
Trading (Redemption) Fees. Shares held by investors in the Fund less than 30 days are subject to a redemption fee equal to .75% of the net asset value of shares redeemed. All redemption fees, which reduce the proceeds of the shareholder redemption, are retained by the Fund and accounted for as an addition to paid in capital.
Delayed Delivery Transactions and When-Issued Securities. During the period, the Fund transacted in securities on a delayed delivery or when-issued basis. Payment and delivery may take place after the customary settlement period for that security. The price of the underlying securities and the date when the securities will be delivered and paid for are fixed at the time the transaction is negotiated. The Fund may receive compensation for interest forgone in the purchase of a delayed delivery or when-issued security. With respect to purchase commitments, the Fund identifies securities as segregated in its records with a value at least equal to the amount of the commitment. Losses may arise due to changes in the value of the underlying securities or if the counterparty does not perform under the contract's terms, or if the issuer does not issue the securities due to political, economic, or other factors.
Restricted Securities. The Fund may invest in securities that are subject to legal or contractual restrictions on resale. These securities generally may be resold in transactions exempt from registration or to the public if the securities are registered. Disposal of these securities may involve time-consuming negotiations and expense, and prompt sale at an acceptable price may be difficult. Information regarding restricted securities is included at the end of the Fund's Consolidated Schedule of Investments.
Annual Report
5. Purchases and Sales of Investments.
Purchases and sales of securities, other than short-term securities, aggregated $625,093,559 and $972,324,125, respectively.
6. Fees and Other Transactions with Affiliates.
Management Fee. FMR and its affiliates provide the Fund with investment management related services for which the Fund pays a monthly management fee. The management fee is the sum of an individual fund fee rate that is based on an annual rate of .30% of the Fund's average net assets and an annualized group fee rate that averaged .26% during the period. The group fee rate is based upon the average net assets of all the mutual funds advised by FMR. The group fee rate decreases as assets under management increase and increases as assets under management decrease. For the period, the total annual management fee rate was .56% of the Fund's average net assets.
FMR and its affiliates also provide investment management related services to the Subsidiary. The Subsidiary pays FMR a monthly management fee at the annual rate of .30% of its net assets. Under the management contract, FMR pays all other expenses of the Subsidiary, except custodian fees.
During the period, FMR waived a portion of its management fee as described in the Expense Reductions note.
Distribution and Service Plan Fees. In accordance with Rule 12b-1 of the 1940 Act, the Fund has adopted separate Distribution and Service Plans for each class of shares. Certain classes pay Fidelity Distributors Corporation (FDC), an affiliate of FMR, separate Distribution and Service Fees, each of which is based on an annual percentage of each class' average net assets. In addition, FDC may pay financial intermediaries for selling shares of the Fund and providing shareholder support services. For the period, the Distribution and Service Fee rates, total fees and amounts retained by FDC were as follows:
|
|
Distribution |
Service |
Total Fees |
Retained |
|
Class A |
-% |
.25% |
$ 315,882 |
$ 5,739 |
|
Class T |
.25% |
.25% |
157,988 |
814 |
|
Class B |
.75% |
.25% |
141,475 |
106,141 |
|
Class C |
.75% |
.25% |
509,222 |
77,647 |
|
|
|
|
$ 1,124,567 |
$ 190,341 |
Sales Load. FDC may receive a front-end sales charge of up to 5.75% for selling Class A shares and 3.50% for selling Class T shares, some of which is paid to financial intermediaries for selling shares of the Fund. Depending on the holding period, FDC may receive contingent deferred sales charges levied on Class A, Class T, Class B, and Class C redemptions. The deferred sales charges range from 5.00% to 1.00% for Class B shares, 1.00% for Class C shares, 1.00% for certain purchases of Class A shares and .25% for certain purchases of Class T shares.
For the period, sales charge amounts retained by FDC were as follows:
|
|
Retained |
|
Class A |
$ 54,740 |
|
Class T |
12,343 |
|
Class B* |
43,859 |
|
Class C* |
7,084 |
|
|
$ 118,026 |
* When Class B and Class C shares are initially sold, FDC pays commissions from its own resources to financial intermediaries through which the sales are made.
Transfer Agent Fees. Fidelity Investments Institutional Operations Company, Inc., (FIIOC), an affiliate of FMR, is the transfer, dividend disbursing and shareholder servicing agent for each class of the Fund. FIIOC receives account fees and asset-based fees that vary according to the account size and type of account of the shareholders of the respective classes of the Fund. FIIOC pays for typesetting, printing and mailing of shareholder reports, except proxy statements. For the period, transfer agent fees for each class were as follows:
|
|
Amount |
% of |
|
Class A |
$ 380,022 |
.30 |
|
Class T |
101,679 |
.32 |
|
Class B |
42,879 |
.30 |
|
Class C |
151,514 |
.30 |
|
Gold |
9,385,666 |
.30 |
|
Institutional Class |
303,067 |
.21 |
|
|
$ 10,364,827 |
|
Annual Report
Notes to Consolidated Financial Statements - continued
6. Fees and Other Transactions with Affiliates - continued
Accounting and Security Lending Fees. Fidelity Service Company, Inc. (FSC), an affiliate of FMR, maintains the Fund's accounting records. The accounting fee is based on the level of average net assets for each month. Under a separate contract, FSC administers the security lending program. The security lending fee is based on the number and duration of lending transactions.
Brokerage Commissions. The Fund placed a portion of its portfolio transactions with brokerage firms which are affiliates of the investment adviser. The commissions paid to these affiliated firms were $4,289 for the period.
Interfund Lending Program. Pursuant to an Exemptive Order issued by the SEC, the Fund, along with other registered investment companies having management contracts with FMR, may participate in an interfund lending program. This program provides an alternative credit facility allowing the funds to borrow from, or lend money to, other participating affiliated funds. At period end, there were no interfund loans outstanding. The Fund's activity in this program during the period for which loans were outstanding was as follows:
|
Borrower or Lender |
Average Loan |
Weighted Average |
Interest |
|
Borrower |
$ 7,919,951 |
.41% |
$ 5,520 |
7. Committed Line of Credit.
The Fund participates with other funds managed by FMR or an affiliate in a $4.25 billion credit facility (the "line of credit") to be utilized for temporary or emergency purposes to fund shareholder redemptions or for other short-term liquidity purposes. The Fund has agreed to pay commitment fees on its pro-rata portion of the line of credit, which amounted to $9,688 and is reflected in Miscellaneous expenses on the Consolidated Statement of Operations. During the period, there were no borrowings on this line of credit.
8. Security Lending.
The Fund lends portfolio securities through a lending agent from time to time in order to earn additional income. For equity securities, a lending agent is used and may loan securities to certain qualified borrowers, including Fidelity Capital Markets (FCM), a broker-dealer affiliated with the Fund. On the settlement date of the loan, the Fund receives collateral (in the form of U.S. Treasury obligations, letters of credit and/or cash) against the loaned securities and maintains collateral in an amount not less than 100% of the market value of the loaned securities during the period of the loan. The market value of the loaned securities is determined at the close of business of the Fund and any additional required collateral is delivered to the Fund on the next business day. If the borrower defaults on its obligation to return the securities loaned because of insolvency or other reasons, a fund could experience delays and costs in recovering the securities loaned or in gaining access to the collateral. Any cash collateral received is invested in the Fidelity Securities Lending Cash Central Fund. The value of loaned securities and cash collateral at period end are disclosed on the Fund's Consolidated Statement of Assets and Liabilities. At period end, there were no security loans outstanding with FCM. Security lending income represents the income earned on investing cash collateral, less rebates paid to borrowers and any lending agent fees associated with the loan, plus any premium payments received for lending certain types of securities. Security lending income is presented in the Consolidated Statement of Operations as a component of income from Fidelity Central Funds. Total security lending income during the period amounted to $777,921, including $19,129 from securities loaned to FCM.
9. Bank Borrowings.
The Fund is permitted to have bank borrowings for temporary or emergency purposes to fund shareholder redemptions or for other short-term liquidity requirements. The Fund has established borrowing arrangements with certain banks. The interest rate on the borrowings is the bank's base rate, as revised from time to time. The average loan balance during the period for which loans were outstanding amounted to $6,452,333. The weighted average interest rate was .64%. The interest expense amounted to $693 under the bank borrowing program. At period end, there were no bank borrowings outstanding.
10. Expense Reductions.
FMR has contractually agreed to waive the Fund's management fee in an amount equal to the management fee of the Subsidiary. During the period, this waiver reduced the Fund's management fee by $330,253. Many of the brokers with whom FMR places trades on behalf of the Fund provided services to the Fund in addition to trade execution. These services included payments of certain expenses on behalf of the Fund totaling $173,463 for the period. In addition, through arrangements with the Fund's custodian, credits realized as a result of uninvested cash balances were used to reduce the Fund's expenses. During the period, these credits reduced the Fund's expenses by $351.
In addition, FMR reimbursed a portion of the Fund's operating expenses during the period in the amount of $11,638.
Annual Report
11. Distributions to Shareholders.
Distributions to shareholders of each class were as follows:
|
|
Year ended |
Year ended |
|
From net realized gain |
|
|
|
Class A |
$ - |
$ 7,834,928 |
|
Class T |
- |
2,382,367 |
|
Class B |
- |
1,303,107 |
|
Class C |
- |
3,798,844 |
|
Gold |
- |
215,607,839 |
|
Institutional Class |
- |
7,823,012 |
|
Total |
$ - |
$ 238,750,097 |
12. Share Transactions.
Transactions for each class of shares were as follows:
|
|
Shares |
Dollars |
||
|
|
Year ended |
Year ended |
Year ended |
Year ended |
|
Class A |
|
|
|
|
|
Shares sold |
1,412,697 |
1,589,102 |
$ 53,420,103 |
$ 76,690,664 |
|
Reinvestment of distributions |
- |
145,713 |
- |
7,265,756 |
|
Shares redeemed |
(1,438,620) |
(1,293,053) |
(53,775,838) |
(61,867,749) |
|
Net increase (decrease) |
(25,923) |
441,762 |
$ (355,735) |
$ 22,088,671 |
|
Class T |
|
|
|
|
|
Shares sold |
284,748 |
326,122 |
$ 10,411,769 |
$ 15,663,258 |
|
Reinvestment of distributions |
- |
46,446 |
- |
2,308,310 |
|
Shares redeemed |
(355,685) |
(374,234) |
(13,010,570) |
(17,626,829) |
|
Net increase (decrease) |
(70,937) |
(1,666) |
$ (2,598,801) |
$ 344,739 |
|
Class B |
|
|
|
|
|
Shares sold |
16,804 |
55,740 |
$ 624,661 |
$ 2,638,278 |
|
Reinvestment of distributions |
- |
22,881 |
- |
1,122,370 |
|
Shares redeemed |
(167,215) |
(142,844) |
(6,101,257) |
(6,672,300) |
|
Net increase (decrease) |
(150,411) |
(64,223) |
$ (5,476,596) |
$ (2,911,652) |
|
Class C |
|
|
|
|
|
Shares sold |
311,882 |
510,073 |
$ 11,372,831 |
$ 24,191,165 |
|
Reinvestment of distributions |
- |
63,636 |
- |
3,100,723 |
|
Shares redeemed |
(559,180) |
(484,293) |
(20,004,404) |
(22,585,009) |
|
Net increase (decrease) |
(247,298) |
89,416 |
$ (8,631,573) |
$ 4,706,879 |
|
Gold |
|
|
|
|
|
Shares sold |
22,313,552 |
30,555,727 |
$ 848,495,476 |
$ 1,483,101,053 |
|
Reinvestment of distributions |
- |
4,125,294 |
- |
208,463,091 |
|
Shares redeemed |
(32,795,078) |
(31,912,749) |
(1,225,752,483) |
(1,536,990,789) |
|
Net increase (decrease) |
(10,481,526) |
2,768,272 |
$ (377,257,007) |
$ 154,573,355 |
|
Institutional Class |
|
|
|
|
|
Shares sold |
1,354,134 |
1,664,357 |
$ 51,488,741 |
$ 81,430,250 |
|
Reinvestment of distributions |
- |
146,226 |
- |
7,344,695 |
|
Shares redeemed |
(849,045) |
(810,698) |
(31,583,828) |
(38,218,873) |
|
Net increase (decrease) |
505,089 |
999,885 |
$ 19,904,913 |
$ 50,556,072 |
13. Other.
The Fund's organizational documents provide former and current trustees and officers with a limited indemnification against liabilities arising in connection with the performance of their duties to the Fund. In the normal course of business, the Fund may also enter into contracts that provide general indemnifications. The Fund's maximum exposure under these arrangements is unknown as this would be dependent on future claims that may be made against the Fund. The risk of material loss from such claims is considered remote.
Annual Report
Fidelity Advisor Materials Fund - Class A, T, B and C
Performance: The Bottom Line
Average annual total return reflects the change in the value of an investment, assuming reinvestment of the class' distributions from dividend income and capital gains (the profits earned upon the sale of securities that have grown in value, if any) and assuming a constant rate of performance each year. The $10,000 table and the fund's returns do not reflect the deduction of taxes that a shareholder would pay on fund distributions or the redemption of fund shares. During periods of reimbursement by Fidelity, a fund's total return will be greater than it would be had the reimbursement not occurred. How a fund did yesterday is no guarantee of how it will do tomorrow.
Average Annual Total Returns
|
Periods ended February 28, 2013 |
Past 1 |
Past 5 |
Past 10 |
|
Class A (incl. 5.75% sales charge) A |
3.11% |
5.43% |
14.40% |
|
Class T (incl. 3.50% sales charge) B |
5.28% |
5.63% |
14.45% |
|
Class B (incl. contingent deferred sales charge) C |
3.55% |
5.54% |
14.50% |
|
Class C (incl. contingent deferred sales charge) D |
7.58% |
5.88% |
14.51% |
A Class A shares bear a 0.25% 12b-1 fee. The initial offering of Class A shares took place on December 12, 2006. Returns prior to December 12, 2006, are those of Materials Portfolio, the original class of the fund, which has no 12b-1 fee. Had Class A shares' 12b-1 fee been reflected, returns prior to December 12, 2006, would have been lower.
B Class T shares bear a 0.50% 12b-1 fee. The initial offering of Class T shares took place on December 12, 2006. Returns prior to December 12, 2006, are those of Materials Portfolio, the original class of the fund, which has no 12b-1 fee. Had Class T shares' 12b-1 fee been reflected, returns prior to December 12, 2006, would have been lower.
C Class B shares bear a 1.00% 12b-1 fee. The initial offering of Class B shares took place on December 12, 2006. Returns prior to December 12, 2006, are those of Materials Portfolio, the original class of the fund, which has no 12b-1 fee. Had Class B shares' 12b-1 fee been reflected, returns prior to December 12, 2006, would have been lower. Class B shares' contingent deferred sales charges included in the past one year, past five years, and past ten years total return figures are 5%, 2%, and 0%, respectively.
D Class C shares bear a 1.00% 12b-1 fee. The initial offering of Class C shares took place on December 12, 2006. Returns prior to December 12, 2006, are those of Materials Portfolio, the original class of the fund, which has no 12b-1 fee. Had Class C shares' 12b-1 fee been reflected, returns prior to December 12, 2006, would have been lower. Class C shares' contingent deferred sales charges included in the past one year, past five years, and past ten years total return figures are 1%, 0%, and 0%, respectively.
Prior to October 1, 2006, the fund operated under certain different investment policies. The historical performance for the fund may not represent its current investment policies.
$10,000 Over 10 Years
Let's say hypothetically that $10,000 was invested in Fidelity Advisor Materials Fund - Class A on February 28, 2003, and the current 5.75% sales charge was paid. The chart shows how the value of your investment would have changed, and also shows how the S&P 500 Index performed over the same period. The initial offering of Class A took place on December 12, 2006. See the Average Annual Total Returns table for additional information regarding the performance of Class A.

Annual Report
Fidelity Advisor Materials Fund
Management's Discussion of Fund Performance
Market Recap: U.S. stocks posted solid gains for the year ending February 28, 2013, sparked by a late-period rally that pushed major equity benchmarks to multiyear highs. Improvement in the global economy and more monetary stimulus from the U.S. Federal Reserve kept markets on the upswing for much of the year, shrugging off an early decline brought on by debt woes in Europe, and another dip later in the period amid Congressional gridlock on the federal budget. Renewed optimism over employment, the housing market, corporate earnings and record dividends made stocks a favorite with investors during the 12 months, which helped push the broad-based S&P 500® Index across the milestone 1,500 mark at the end of January. The S&P 500® finished the period up 13.46%. Seven of the 10 major market sectors tracked by MSCI U.S. IMI 25-50 classifications produced double-digit gains, led by health care and financials, while information technology, energy and materials trailed the broad equity market with only modest advances.
Comments from Tobias Welo, Portfolio Manager of Fidelity Advisor Materials Fund: For the year, the fund's Class A, Class T, Class B and Class C shares returned 9.40%, 9.10%, 8.55% and 8.58%, respectively (excluding sales charges), outpacing the 7.68% advance of the MSCI® U.S. IMI Materials 25-50 Index but trailing the S&P 500®. Compared with the broader market, the materials sector was held back in part by weakness in various metals-related groups during the first several months of the period. Versus the MSCI index, the portfolio benefited from both industry weightings and stock selection, especially in commodity chemicals, where I increased the fund's exposure to companies with ties to the construction industry. Stock picking in fertilizers/agricultural chemicals and steel also benefited the fund's results. Not owning iron-ore producer and index component Cliffs Natural Resources had a positive impact, given this stock's decline of roughly 58% against the backdrop of increasingly unfavorable supply/demand conditions for the commodity. The fund also was helped by its underweightings in metals producer Freeport-McMoRan Copper & Gold and gold miner Newmont Mining - both weak-performing constituents of the MSCI index. I sold the former and significantly reduced the latter during the period. Among overweighted positions, one key contributor was an out-of-benchmark stake in Rentech Nitrogen Partners, which I sold to lock in profits. In absolute terms, agricultural chemicals producer Monsanto was the fund's top contributor and also its largest holding, although this stock had only a small positive impact on performance relative to the index. Conversely, performance was dampened by weak picks in diversified metals/mining, a group whose allocation in the fund I significantly reduced during the period, as slowing demand from China and ample supply weighed on the share prices of these stocks. The fund's holdings in cash and cash equivalents, averaging around 3.6% of net assets during the period, also muted the fund's gain in a rising market. At the stock level, out-of-benchmark positions in two Canada-based copper mines hampered the fund's results. One of these - and the fund's biggest relative detractor - was Ivanhoe Mines, which was renamed Turquoise Hill Resources in August. This stock sold off in part on concerns about the attempt of mining giant Rio Tinto, a minority owner in Ivanhoe, to gain control of the company. Subsequently, pressure from the Mongolian government for more control and a larger share of the profits from the company's Oyu Tolgoi mine - slated to begin production in June 2013 - further depressed the stock. The shares of Copper Mountain Mining also posted a sizable loss during the period amid disappointing production numbers, which I used as an opportunity to roughly double the fund's exposure by period end. Canadian gold producer Goldcorp, another non-index position, was hampered by softness in that metal's price.
The views expressed above reflect those of the portfolio manager(s) only through the end of the period as stated on the cover of this report and do not necessarily represent the views of Fidelity or any other person in the Fidelity organization. Any such views are subject to change at any time based upon market or other conditions and Fidelity disclaims any responsibility to update such views. These views may not be relied on as investment advice and, because investment decisions for a Fidelity fund are based on numerous factors, may not be relied on as an indication of trading intent on behalf of any Fidelity fund.
Annual Report
Materials Portfolio
Shareholder Expense Example
As a shareholder of the Fund, you incur two types of costs: (1) transaction costs, including sales charges (loads) on purchase payments or redemption proceeds, redemption fees and (2) ongoing costs, including management fees, distribution and/or service (12b-1) fees and other Fund expenses. This Example is intended to help you understand your ongoing costs (in dollars) of investing in the Fund and to compare these costs with the ongoing costs of investing in other mutual funds.
The Example is based on an investment of $1,000 invested at the beginning of the period and held for the entire period (September 1, 2012 to February 28, 2013).
Actual Expenses
The first line of the accompanying table for each class of the Fund provides information about actual account values and actual expenses. You may use the information in this line, together with the amount you invested, to estimate the expenses that you paid over the period. Simply divide your account value by $1,000.00 (for example, an $8,600 account value divided by $1,000.00 = 8.6), then multiply the result by the number in the first line for a class of the Fund under the heading entitled "Expenses Paid During Period" to estimate the expenses you paid on your account during this period. A small balance maintenance fee of $12.00 that is charged once a year may apply for certain accounts with a value of less than $2,000. This fee is not included in the table below. If it was, the estimate of expenses you paid during the period would be higher, and your ending account value lower, by this amount. In addition, the Fund, as a shareholder in the underlying Fidelity Central Funds, will indirectly bear its pro-rata share of the fees and expenses incurred by the underlying Fidelity Central Funds. These fees and expenses are not included in the Fund's annualized expense ratio used to calculate the expense estimate in the table below.
Hypothetical Example for Comparison Purposes
The second line of the accompanying table for each class of the Fund provides information about hypothetical account values and hypothetical expenses based on a Class' actual expense ratio and an assumed rate of return of 5% per year before expenses, which is not the Class' actual return. The hypothetical account values and expenses may not be used to estimate the actual ending account balance or expenses you paid for the period. You may use this information to compare the ongoing costs of investing in the Fund and other funds. To do so, compare this 5% hypothetical example with the 5% hypothetical examples that appear in the shareholder reports of the other funds. A small balance maintenance fee of $12.00 that is charged once a year may apply for certain accounts with a value of less than $2,000. This fee is not included in the table below. If it was, the estimate of expenses you paid during the period would be higher, and your ending account value lower, by this amount. In addition, the Fund, as a shareholder in the underlying Fidelity Central Funds, will indirectly bear its pro-rata share of the fees and expenses incurred by the underlying Fidelity Central Funds. These fees and expenses are not included in the Fund's annualized expense ratio used to calculate the expense estimate in the table below.
Please note that the expenses shown in the table are meant to highlight your ongoing costs only and do not reflect any transaction costs. Therefore, the second line of the table is useful in comparing ongoing costs only, and will not help you determine the relative total costs of owning different funds. In addition, if these transactional costs were included, your costs would have been higher.
|
|
Annualized |
Beginning |
Ending |
Expenses Paid |
|
Class A |
1.13% |
|
|
|
|
Actual |
|
$ 1,000.00 |
$ 1,105.40 |
$ 5.90 |
|
HypotheticalA |
|
$ 1,000.00 |
$ 1,019.19 |
$ 5.66 |
|
Class T |
1.42% |
|
|
|
|
Actual |
|
$ 1,000.00 |
$ 1,103.80 |
$ 7.41 |
|
HypotheticalA |
|
$ 1,000.00 |
$ 1,017.75 |
$ 7.10 |
|
Class B |
1.92% |
|
|
|
|
Actual |
|
$ 1,000.00 |
$ 1,101.10 |
$ 10.00 |
|
HypotheticalA |
|
$ 1,000.00 |
$ 1,015.27 |
$ 9.59 |
|
Class C |
1.88% |
|
|
|
|
Actual |
|
$ 1,000.00 |
$ 1,101.40 |
$ 9.80 |
|
HypotheticalA |
|
$ 1,000.00 |
$ 1,015.47 |
$ 9.39 |
|
Materials |
.84% |
|
|
|
|
Actual |
|
$ 1,000.00 |
$ 1,107.10 |
$ 4.39 |
|
HypotheticalA |
|
$ 1,000.00 |
$ 1,020.63 |
$ 4.21 |
|
Institutional Class |
.84% |
|
|
|
|
Actual |
|
$ 1,000.00 |
$ 1,107.00 |
$ 4.39 |
|
HypotheticalA |
|
$ 1,000.00 |
$ 1,020.63 |
$ 4.21 |
A 5% return per year before expenses
* Expenses are equal to each Class' annualized expense ratio, multiplied by the average account value over the period, multiplied by 181/365 (to reflect the one-half year period).
Annual Report
Materials Portfolio
Investment Changes (Unaudited)
|
Top Ten Stocks as of February 28, 2013 |
||
|
|
% of fund's |
% of fund's net assets |
|
Monsanto Co. |
9.6 |
8.1 |
|
LyondellBasell Industries NV Class A |
4.9 |
4.2 |
|
Air Products & Chemicals, Inc. |
4.7 |
5.7 |
|
E.I. du Pont de Nemours & Co. |
4.3 |
8.3 |
|
Ecolab, Inc. |
4.1 |
3.5 |
|
PPG Industries, Inc. |
4.0 |
3.6 |
|
International Paper Co. |
3.8 |
1.2 |
|
Eastman Chemical Co. |
3.6 |
3.8 |
|
The Dow Chemical Co. |
3.3 |
0.7 |
|
Rock-Tenn Co. Class A |
3.1 |
3.2 |
|
|
45.4 |
|
|
Top Industries (% of fund's net assets) |
|||
|
As of February 28, 2013 |
|||
|
Chemicals |
65.9% |
|
|
Metals & Mining |
12.3% |
|
|
Containers & Packaging |
8.6% |
|
|
Paper & Forest Products |
6.0% |
|
|
Construction Materials |
3.7% |
|
|
All Others* |
3.5% |
|

|
As of August 31, 2012 |
|||
|
Chemicals |
62.5% |
|
|
Metals & Mining |
19.5% |
|
|
Containers & Packaging |
8.6% |
|
|
Construction Materials |
1.5% |
|
|
Paper & Forest Products |
1.2% |
|
|
All Others* |
6.7% |
|

|
* Includes short-term investments and net other assets. |
Annual Report
Materials Portfolio
Investments February 28, 2013
Showing Percentage of Net Assets
|
Common Stocks - 97.2% |
|||
|
Shares |
Value |
||
|
CHEMICALS - 65.9% |
|||
|
Commodity Chemicals - 10.1% |
|||
|
Arkema SA |
115,041 |
$ 11,687,924 |
|
|
Axiall Corp. |
632,739 |
35,800,373 |
|
|
Cabot Corp. |
513,283 |
18,878,549 |
|
|
LyondellBasell Industries NV Class A (d) |
1,463,462 |
85,788,142 |
|
|
Westlake Chemical Corp. |
273,610 |
23,590,654 |
|
|
|
175,745,642 |
||
|
Diversified Chemicals - 18.5% |
|||
|
E.I. du Pont de Nemours & Co. |
1,551,829 |
74,332,609 |
|
|
Eastman Chemical Co. |
894,076 |
62,343,919 |
|
|
FMC Corp. |
881,753 |
53,134,436 |
|
|
Lanxess AG |
49,593 |
4,203,319 |
|
|
PPG Industries, Inc. |
514,803 |
69,323,372 |
|
|
The Dow Chemical Co. |
1,793,202 |
56,880,367 |
|
|
|
320,218,022 |
||
|
Fertilizers & Agricultural Chemicals - 9.6% |
|||
|
Monsanto Co. |
1,643,348 |
166,027,448 |
|
|
Industrial Gases - 6.5% |
|||
|
Air Products & Chemicals, Inc. |
947,891 |
81,840,909 |
|
|
Airgas, Inc. |
308,866 |
30,973,082 |
|
|
|
112,813,991 |
||
|
Specialty Chemicals - 21.2% |
|||
|
Albemarle Corp. |
671,011 |
43,669,396 |
|
|
Ashland, Inc. |
626,486 |
48,847,113 |
|
|
Balchem Corp. |
32,824 |
1,323,792 |
|
|
Cytec Industries, Inc. |
352,330 |
25,505,169 |
|
|
Ecolab, Inc. |
933,679 |
71,473,127 |
|
|
NewMarket Corp. |
4,004 |
1,007,687 |
|
|
PolyOne Corp. |
333,286 |
7,595,588 |
|
|
Rockwood Holdings, Inc. |
592,132 |
37,067,463 |
|
|
Sherwin-Williams Co. |
302,027 |
48,804,543 |
|
|
Sigma Aldrich Corp. |
511,144 |
39,388,757 |
|
|
W.R. Grace & Co. (a) |
612,196 |
43,820,990 |
|
|
|
368,503,625 |
||
|
TOTAL CHEMICALS |
1,143,308,728 |
||
|
COMMERCIAL SERVICES & SUPPLIES - 0.0% |
|||
|
Environmental & Facility Services - 0.0% |
|||
|
Swisher Hygiene, Inc. (a) |
262,171 |
369,661 |
|
|
CONSTRUCTION MATERIALS - 3.7% |
|||
|
Construction Materials - 3.7% |
|||
|
Lafarge SA (Bearer) |
139,600 |
9,411,637 |
|
|
|
|||
|
Shares |
Value |
||
|
Martin Marietta Materials, Inc. (d) |
206,511 |
$ 20,058,413 |
|
|
Vulcan Materials Co. |
670,556 |
34,151,417 |
|
|
|
63,621,467 |
||
|
CONTAINERS & PACKAGING - 8.6% |
|||
|
Metal & Glass Containers - 5.2% |
|||
|
Aptargroup, Inc. |
668,539 |
36,060,994 |
|
|
Ball Corp. |
937,435 |
41,631,488 |
|
|
Silgan Holdings, Inc. |
316,978 |
13,607,866 |
|
|
|
91,300,348 |
||
|
Paper Packaging - 3.4% |
|||
|
Graphic Packaging Holding Co. (a) |
602,665 |
4,471,774 |
|
|
Rock-Tenn Co. Class A |
611,384 |
54,076,915 |
|
|
|
58,548,689 |
||
|
TOTAL CONTAINERS & PACKAGING |
149,849,037 |
||
|
METALS & MINING - 12.3% |
|||
|
Diversified Metals & Mining - 2.8% |
|||
|
Copper Mountain Mining Corp. (a) |
3,528,527 |
11,017,558 |
|
|
First Quantum Minerals Ltd. (d) |
825,600 |
15,379,177 |
|
|
SunCoke Energy, Inc. (a) |
237,112 |
3,909,977 |
|
|
Turquoise Hill Resources Ltd. (a) |
1,499,940 |
9,585,071 |
|
|
Walter Energy, Inc. (d) |
273,776 |
8,703,339 |
|
|
|
48,595,122 |
||
|
Gold - 4.5% |
|||
|
Allied Nevada Gold Corp. (a) |
630,372 |
11,535,808 |
|
|
Franco-Nevada Corp. |
191,900 |
9,281,912 |
|
|
Goldcorp, Inc. |
786,200 |
25,661,568 |
|
|
Newmont Mining Corp. |
295,221 |
11,894,454 |
|
|
Royal Gold, Inc. |
298,383 |
19,556,022 |
|
|
|
77,929,764 |
||
|
Steel - 5.0% |
|||
|
Carpenter Technology Corp. |
527,172 |
24,898,334 |
|
|
Commercial Metals Co. |
1,157,189 |
18,873,753 |
|
|
Haynes International, Inc. |
275,652 |
14,196,078 |
|
|
Reliance Steel & Aluminum Co. |
445,602 |
29,672,637 |
|
|
|
87,640,802 |
||
|
TOTAL METALS & MINING |
214,165,688 |
||
|
OIL, GAS & CONSUMABLE FUELS - 0.7% |
|||
|
Coal & Consumable Fuels - 0.7% |
|||
|
Peabody Energy Corp. |
554,871 |
11,963,019 |
|
|
PAPER & FOREST PRODUCTS - 6.0% |
|||
|
Forest Products - 0.6% |
|||
|
Canfor Corp. (a) |
499,100 |
9,403,649 |
|
|
Common Stocks - continued |
|||
|
Shares |
Value |
||
|
PAPER & FOREST PRODUCTS - CONTINUED |
|||
|
Paper Products - 5.4% |
|||
|
International Paper Co. |
1,520,766 |
$ 66,928,912 |
|
|
MeadWestvaco Corp. |
762,580 |
27,231,732 |
|
|
|
94,160,644 |
||
|
TOTAL PAPER & FOREST PRODUCTS |
103,564,293 |
||
|
TOTAL COMMON STOCKS (Cost $1,361,969,249) |
|
||
|
Convertible Bonds - 0.4% |
||||
|
|
Principal Amount |
|
||
|
BUILDING PRODUCTS - 0.4% |
||||
|
Building Products - 0.4% |
||||
|
Aspen Aerogels, Inc. 8% 6/1/14 (f) |
|
$ 7,861,200 |
|
|
|
U.S. Treasury Obligations - 0.0% |
||||
|
|
||||
|
U.S. Treasury Bills, yield at date of purchase 0.1% 4/18/13 (e) |
|
290,000 |
|
|
|
Money Market Funds - 8.5% |
|||
|
Shares |
|
||
|
Fidelity Cash Central Fund, 0.16% (b) |
40,086,153 |
40,086,153 |
|
|
Fidelity Securities Lending Cash Central Fund, 0.16% (b)(c) |
107,374,488 |
107,374,488 |
|
|
TOTAL MONEY MARKET FUNDS (Cost $147,460,641) |
|
||
|
TOTAL INVESTMENT PORTFOLIO - 106.1% (Cost $1,517,581,053) |
1,842,453,701 |
||
|
NET OTHER ASSETS (LIABILITIES) - (6.1)% |
(106,263,651) |
||
|
NET ASSETS - 100% |
$ 1,736,190,050 |
||
|
Futures Contracts |
|||||
|
|
Expiration |
Underlying |
Unrealized |
||
|
Purchased |
|||||
|
Equity Index Contracts |
|||||
|
191 CME E-mini S&P Select Sector Materials Index Contracts |
March 2013 |
$ 7,737,410 |
$ 417,650 |
||
|
|
|
The face value of futures purchased as a percentage of net assets is 0.4% |
|
Legend |
|
(a) Non-income producing |
|
(b) Affiliated fund that is generally available only to investment companies and other accounts managed by Fidelity Investments. The rate quoted is the annualized seven-day yield of the fund at period end. A complete unaudited listing of the fund's holdings as of its most recent quarter end is available upon request. In addition, each Fidelity Central Fund's financial statements, which are not covered by the Fund's Report of Independent Registered Public Accounting Firm, are available on the SEC's website or upon request. |
|
(c) Investment made with cash collateral received from securities on loan. |
|
(d) Security or a portion of the security is on loan at period end. |
|
(e) Security or a portion of the security was pledged to cover margin requirements for futures contracts. At the period end, the value of securities pledged amounted to $289,967. |
|
(f) Restricted securities - Investment in securities not registered under the Securities Act of 1933 (excluding 144A issues). At the end of the period, the value of restricted securities (excluding 144A issues) amounted to $7,861,200 or 0.4% of net assets. |
|
Additional information on each restricted holding is as follows: |
|
Security |
Acquisition Date |
Acquisition Cost |
|
Aspen Aerogels, Inc. 8% 6/1/14 |
6/1/11 |
$ 7,861,200 |
|
Affiliated Central Funds |
|
Information regarding fiscal year to date income earned by the Fund from investments in Fidelity Central Funds is as follows: |
|
Fund |
Income earned |
|
Fidelity Cash Central Fund |
$ 104,759 |
|
Fidelity Securities Lending Cash Central Fund |
520,779 |
|
Total |
$ 625,538 |
|
Other Information |
|
The following is a summary of the inputs used, as of February 28, 2013, involving the Fund's assets and liabilities carried at fair value. The inputs or methodology used for valuing securities may not be an indication of the risk associated with investing in those securities. For more information on valuation inputs, and their aggregation into the levels used in the table below, please refer to the Investment Valuation section in the accompanying Notes to Financial Statements. |
|
Valuation Inputs at Reporting Date: |
||||
|
Description |
Total |
Level 1 |
Level 2 |
Level 3 |
|
Investments in Securities: |
||||
|
Common Stocks |
$ 1,686,841,893 |
$ 1,686,841,893 |
$ - |
$ - |
|
Convertible Bonds |
7,861,200 |
- |
- |
7,861,200 |
|
U.S. Treasury Obligations |
289,967 |
- |
289,967 |
- |
|
Money Market Funds |
147,460,641 |
147,460,641 |
- |
- |
|
Total Investments in Securities: |
$ 1,842,453,701 |
$ 1,834,302,534 |
$ 289,967 |
$ 7,861,200 |
|
Derivative Instruments: |
||||
|
Assets |
||||
|
Futures Contracts |
$ 417,650 |
$ 417,650 |
$ - |
$ - |
|
Value of Derivative Instruments |
|
The following table is a summary of the Fund's value of derivative instruments by primary risk exposure as of February 28, 2013. For additional information on derivative instruments, please refer to the Derivative Instruments section in the accompanying Notes to Financial Statements. |
|
Primary Risk Exposure / |
Value |
|
|
|
Asset |
Liability |
|
Equity Risk |
||
|
Futures Contracts (a) |
$ 417,650 |
$ - |
|
Total Value of Derivatives |
$ 417,650 |
$ - |
|
(a) Reflects cumulative appreciation/(depreciation) on futures contracts as disclosed on the Schedule of Investments. Only the period end variation margin is separately disclosed on the Statement of Assets and Liabilities. |
|
Distribution of investments by country or territory of incorporation, as a percentage of total net assets, is as follows. (Unaudited) |
|
United States of America |
89.0% |
|
Netherlands |
4.9% |
|
Canada |
4.7% |
|
France |
1.2% |
|
Others (Individually Less Than 1%) |
0.2% |
|
|
100.0% |
See accompanying notes which are an integral part of the financial statements.
Annual Report
Materials Portfolio
Financial Statements
Statement of Assets and Liabilities
|
|
February 28, 2013 |
|
|
|
|
|
|
Assets |
|
|
|
Investment in securities, at value (including securities loaned of $105,779,869) - See accompanying schedule: Unaffiliated issuers (cost $1,370,120,412) |
$ 1,694,993,060 |
|
|
Fidelity Central Funds (cost $147,460,641) |
147,460,641 |
|
|
Total Investments (cost $1,517,581,053) |
|
$ 1,842,453,701 |
|
Receivable for investments sold |
|
2,511,165 |
|
Receivable for fund shares sold |
|
3,698,364 |
|
Dividends receivable |
|
3,018,349 |
|
Interest receivable |
|
1,100,568 |
|
Distributions receivable from Fidelity Central Funds |
|
45,381 |
|
Receivable for daily variation margin on futures contracts |
|
3,820 |
|
Prepaid expenses |
|
2,248 |
|
Receivable from investment adviser for expense reductions |
|
2,610 |
|
Other receivables |
|
50,560 |
|
Total assets |
|
1,852,886,766 |
|
|
|
|
|
Liabilities |
|
|
|
Payable for investments purchased |
$ 1,546,840 |
|
|
Payable for fund shares redeemed |
6,400,199 |
|
|
Accrued management fee |
805,701 |
|
|
Distribution and service plan fees payable |
131,095 |
|
|
Other affiliated payables |
367,142 |
|
|
Other payables and accrued expenses |
71,251 |
|
|
Collateral on securities loaned, at value |
107,374,488 |
|
|
Total liabilities |
|
116,696,716 |
|
|
|
|
|
Net Assets |
|
$ 1,736,190,050 |
|
Net Assets consist of: |
|
|
|
Paid in capital |
|
$ 1,426,561,342 |
|
Undistributed net investment income |
|
1,139,006 |
|
Accumulated undistributed net realized gain (loss) on investments and foreign currency transactions |
|
(16,797,613) |
|
Net unrealized appreciation (depreciation) on investments and assets and liabilities in foreign currencies |
|
325,287,315 |
|
Net Assets |
|
$ 1,736,190,050 |
Statement of Assets and Liabilities - continued
|
|
February 28, 2013 |
|
|
|
|
|
|
Calculation of Maximum Offering Price Class A: |
|
$ 73.44 |
|
|
|
|
|
Maximum offering price per share (100/94.25 of $73.44) |
|
$ 77.92 |
|
Class T: |
|
$ 73.05 |
|
|
|
|
|
Maximum offering price per share (100/96.50 of $73.05) |
|
$ 75.70 |
|
Class B: |
|
$ 72.21 |
|
|
|
|
|
Class C: |
|
$ 71.96 |
|
|
|
|
|
Materials: |
|
$ 73.68 |
|
|
|
|
|
Institutional Class: |
|
$ 73.57 |
A Redemption price per share is equal to net asset value less any applicable contingent deferred sales charge.
See accompanying notes which are an integral part of the financial statements.
Annual Report
Statement of Operations
|
|
Year ended February 28, 2013 |
|
|
|
|
|
|
Investment Income |
|
|
|
Dividends |
|
$ 29,263,795 |
|
Interest |
|
631,374 |
|
Income from Fidelity Central Funds |
|
625,538 |
|
Total income |
|
30,520,707 |
|
|
|
|
|
Expenses |
|
|
|
Management fee |
$ 7,954,444 |
|
|
Transfer agent fees |
3,476,538 |
|
|
Distribution and service plan fees |
1,291,538 |
|
|
Accounting and security lending fees |
454,958 |
|
|
Custodian fees and expenses |
35,218 |
|
|
Independent trustees' compensation |
9,216 |
|
|
Registration fees |
204,637 |
|
|
Audit |
49,183 |
|
|
Legal |
5,043 |
|
|
Miscellaneous |
14,328 |
|
|
Total expenses before reductions |
13,495,103 |
|
|
Expense reductions |
(137,302) |
13,357,801 |
|
Net investment income (loss) |
|
17,162,906 |
|
Realized and Unrealized Gain (Loss) Net realized gain (loss) on: |
|
|
|
Investment securities: |
|
|
|
Unaffiliated issuers |
18,685,188 |
|
|
Foreign currency transactions |
(38,891) |
|
|
Futures contracts |
1,204,377 |
|
|
Total net realized gain (loss) |
|
19,850,674 |
|
Change in net unrealized appreciation (depreciation) on: Investment securities |
92,958,506 |
|
|
Assets and liabilities in foreign currencies |
(2,983) |
|
|
Futures contracts |
(743,685) |
|
|
Total change in net unrealized appreciation (depreciation) |
|
92,211,838 |
|
Net gain (loss) |
|
112,062,512 |
|
Net increase (decrease) in net assets resulting from operations |
|
$ 129,225,418 |
Statement of Changes in Net Assets
|
|
Year ended |
Year ended |
|
Increase (Decrease) in Net Assets |
|
|
|
Operations |
|
|
|
Net investment income (loss) |
$ 17,162,906 |
$ 11,168,253 |
|
Net realized gain (loss) |
19,850,674 |
34,880,798 |
|
Change in net unrealized appreciation (depreciation) |
92,211,838 |
(65,841,883) |
|
Net increase (decrease) in net assets resulting from operations |
129,225,418 |
(19,792,832) |
|
Distributions to shareholders from net investment income |
(15,064,080) |
(9,840,737) |
|
Distributions to shareholders from net realized gain |
(31,892,999) |
(7,461,289) |
|
Total distributions |
(46,957,079) |
(17,302,026) |
|
Share transactions - net increase (decrease) |
219,532,050 |
(18,941,790) |
|
Redemption fees |
63,898 |
99,276 |
|
Total increase (decrease) in net assets |
301,864,287 |
(55,937,372) |
|
|
|
|
|
Net Assets |
|
|
|
Beginning of period |
1,434,325,763 |
1,490,263,135 |
|
End of period (including undistributed net investment income of $1,139,006 and undistributed net investment income of $797,816, respectively) |
$ 1,736,190,050 |
$ 1,434,325,763 |
See accompanying notes which are an integral part of the financial statements.
Annual Report
Financial Highlights - Class A
|
Years ended February 28, |
2013 |
2012 J |
2011 |
2010 |
2009 |
|
Selected Per-Share Data |
|
|
|
|
|
|
Net asset value, beginning of period |
$ 69.23 |
$ 69.96 |
$ 52.54 |
$ 27.65 |
$ 57.00 |
|
Income from Investment Operations |
|
|
|
|
|
|
Net investment income (loss) C |
.70 |
.40 |
1.08 F |
.30 G |
.22 |
|
Net realized and unrealized gain (loss) |
5.69 |
(.35) |
17.40 |
24.90 |
(29.46) |
|
Total from investment operations |
6.39 |
.05 |
18.48 |
25.20 |
(29.24) |
|
Distributions from net investment income |
(.63) |
(.40) |
(1.06) |
(.32) |
(.12) |
|
Distributions from net realized gain |
(1.55) |
(.38) |
(.01) |
- |
- |
|
Total distributions |
(2.18) |
(.78) |
(1.07) |
(.32) |
(.12) |
|
Redemption fees added to paid in capital C |
- K |
- K |
.01 |
.01 |
.01 |
|
Net asset value, end of period |
$ 73.44 |
$ 69.23 |
$ 69.96 |
$ 52.54 |
$ 27.65 |
|
Total Return A, B |
9.40% |
.21% |
35.33% |
91.25% |
(51.30)% |
|
Ratios to Average Net Assets D, H |
|
|
|
|
|
|
Expenses before reductions |
1.13% |
1.13% |
1.16% |
1.23% |
1.21% |
|
Expenses net of fee waivers, if any |
1.13% |
1.13% |
1.16% |
1.23% |
1.21% |
|
Expenses net of all reductions |
1.12% |
1.13% |
1.15% |
1.22% |
1.20% |
|
Net investment income (loss) |
1.02% |
.61% |
1.81% F |
.65% G |
.47% |
|
Supplemental Data |
|
|
|
|
|
|
Net assets, end of period (000 omitted) |
$ 219,627 |
$ 157,781 |
$ 124,160 |
$ 52,352 |
$ 10,796 |
|
Portfolio turnover rate E |
61% |
94% |
87% |
104% I |
117% |
|
A Total returns would have been lower if certain expenses had not been reduced during the applicable periods shown. B Total returns do not include the effect of the sales charges. C Calculated based on average shares outstanding during the period. D Fees and expenses of any underlying Fidelity Central Funds are not included in the Fund's expense ratio. The Fund indirectly bears its proportionate share of the expenses of any underlying Fidelity Central Funds. E Amount does not include the portfolio activity of any underlying Fidelity Central Funds. F Investment income per share reflects a large, non-recurring dividend which amounted to $.83 per share. Excluding this non-recurring dividend, the ratio of net investment income (loss) to average net assets would have been .41%. G Investment income per share reflects a large, non-recurring dividend which amounted to $.10 per share. Excluding this non-recurring dividend, the ratio of net investment income (loss) to average net assets would have been .43%. H Expense ratios reflect operating expenses of the class. Expenses before reductions do not reflect amounts reimbursed by the investment adviser or reductions from brokerage service arrangements or reductions from other expense offset arrangements and do not represent the amount paid by the class during periods when reimbursements or reductions occur. Expenses net of fee waivers reflect expenses after reimbursement by the investment adviser but prior to reductions from brokerage service arrangements or other expense offset arrangements. Expenses net of all reductions represent the net expenses paid by the class. I The portfolio turnover rate does not include the assets acquired in the merger. J For the year ended February 29. K Amount represents less than $.01 per share. |
Financial Highlights - Class T
|
Years ended February 28, |
2013 |
2012 J |
2011 |
2010 |
2009 |
|
Selected Per-Share Data |
|
|
|
|
|
|
Net asset value, beginning of period |
$ 68.91 |
$ 69.68 |
$ 52.35 |
$ 27.56 |
$ 56.80 |
|
Income from Investment Operations |
|
|
|
|
|
|
Net investment income (loss) C |
.50 |
.21 |
.90 F |
.16 G |
.10 |
|
Net realized and unrealized gain (loss) |
5.66 |
(.35) |
17.34 |
24.81 |
(29.32) |
|
Total from investment operations |
6.16 |
(.14) |
18.24 |
24.97 |
(29.22) |
|
Distributions from net investment income |
(.46) |
(.25) |
(.92) |
(.19) |
(.03) |
|
Distributions from net realized gain |
(1.55) |
(.38) |
- |
- |
- |
|
Total distributions |
(2.02) L |
(.63) |
(.92) |
(.19) |
(.03) |
|
Redemption fees added to paid in capital C |
- K |
- K |
.01 |
.01 |
.01 |
|
Net asset value, end of period |
$ 73.05 |
$ 68.91 |
$ 69.68 |
$ 52.35 |
$ 27.56 |
|
Total Return A, B |
9.10% |
(.09)% |
34.98% |
90.70% |
(51.43)% |
|
Ratios to Average Net Assets D, H |
|
|
|
|
|
|
Expenses before reductions |
1.42% |
1.42% |
1.44% |
1.52% |
1.46% |
|
Expenses net of fee waivers, if any |
1.42% |
1.42% |
1.44% |
1.52% |
1.46% |
|
Expenses net of all reductions |
1.41% |
1.41% |
1.43% |
1.51% |
1.46% |
|
Net investment income (loss) |
.73% |
.33% |
1.54% F |
.35% G |
.22% |
|
Supplemental Data |
|
|
|
|
|
|
Net assets, end of period (000 omitted) |
$ 37,860 |
$ 28,290 |
$ 25,570 |
$ 14,712 |
$ 4,944 |
|
Portfolio turnover rate E |
61% |
94% |
87% |
104% I |
117% |
|
A Total returns would have been lower if certain expenses had not been reduced during the applicable periods shown. B Total returns do not include the effect of the sales charges. C Calculated based on average shares outstanding during the period. D Fees and expenses of any underlying Fidelity Central Funds are not included in the Fund's expense ratio. The Fund indirectly bears its proportionate share of the expenses of any underlying Fidelity Central Funds. E Amount does not include the portfolio activity of any underlying Fidelity Central Funds. F Investment income per share reflects a large, non-recurring dividend which amounted to $.83 per share. Excluding this non-recurring dividend, the ratio of net investment income (loss) to average net assets would have been .14%. G Investment income per share reflects a large, non-recurring dividend which amounted to $.10 per share. Excluding this non-recurring dividend, the ratio of net investment income (loss) to average net assets would have been .14%. H Expense ratios reflect operating expenses of the class. Expenses before reductions do not reflect amounts reimbursed by the investment adviser or reductions from brokerage service arrangements or reductions from other expense offset arrangements and do not represent the amount paid by the class during periods when reimbursements or reductions occur. Expenses net of fee waivers reflect expenses after reimbursement by the investment adviser but prior to reductions from brokerage service arrangements or other expense offset arrangements. Expenses net of all reductions represent the net expenses paid by the class. I The portfolio turnover rate does not include the assets acquired in the merger. J For the year ended February 29. K Amount represents less than $.01 per share. L Total distributions of $2.02 per share is comprised of distributions from net investment income of $.463 and distributions from net realized gain of $1.552 per share. |
See accompanying notes which are an integral part of the financial statements.
Annual Report
Financial Highlights - Class B
|
Years ended February 28, |
2013 |
2012 J |
2011 |
2010 |
2009 |
|
Selected Per-Share Data |
|
|
|
|
|
|
Net asset value, beginning of period |
$ 68.13 |
$ 68.95 |
$ 51.86 |
$ 27.35 |
$ 56.59 |
|
Income from Investment Operations |
|
|
|
|
|
|
Net investment income (loss) C |
.16 |
(.11) |
.60 F |
(.07) G |
(.12) |
|
Net realized and unrealized gain (loss) |
5.57 |
(.33) |
17.13 |
24.61 |
(29.13) |
|
Total from investment operations |
5.73 |
(.44) |
17.73 |
24.54 |
(29.25) |
|
Distributions from net investment income |
(.10) |
- |
(.65) |
(.04) |
- |
|
Distributions from net realized gain |
(1.55) |
(.38) |
- |
- |
- |
|
Total distributions |
(1.65) |
(.38) |
(.65) |
(.04) |
- |
|
Redemption fees added to paid in capital C |
- K |
- K |
.01 |
.01 |
.01 |
|
Net asset value, end of period |
$ 72.21 |
$ 68.13 |
$ 68.95 |
$ 51.86 |
$ 27.35 |
|
Total Return A, B |
8.55% |
(.57)% |
34.29% |
89.79% |
(51.67)% |
|
Ratios to Average Net Assets D, H |
|
|
|
|
|
|
Expenses before reductions |
1.92% |
1.91% |
1.93% |
2.02% |
1.95% |
|
Expenses net of fee waivers, if any |
1.92% |
1.91% |
1.93% |
2.02% |
1.95% |
|
Expenses net of all reductions |
1.91% |
1.91% |
1.92% |
2.01% |
1.95% |
|
Net investment income (loss) |
.24% |
(.17)% |
1.04% F |
(.15)% G |
(.27)% |
|
Supplemental Data |
|
|
|
|
|
|
Net assets, end of period (000 omitted) |
$ 10,218 |
$ 11,040 |
$ 13,507 |
$ 9,538 |
$ 2,601 |
|
Portfolio turnover rate E |
61% |
94% |
87% |
104% I |
117% |
|
A Total returns would have been lower if certain expenses had not been reduced during the applicable periods shown. B Total returns do not include the effect of the contingent deferred sales charge. C Calculated based on average shares outstanding during the period. D Fees and expenses of any underlying Fidelity Central Funds are not included in the Fund's expense ratio. The Fund indirectly bears its proportionate share of the expenses of any underlying Fidelity Central Funds. E Amount does not include the portfolio activity of any underlying Fidelity Central Funds. F Investment income per share reflects a large, non-recurring dividend which amounted to $.83 per share. Excluding this non-recurring dividend, the ratio of net investment income (loss) to average net assets would have been (.35)%. G Investment income per share reflects a large, non-recurring dividend which amounted to $.10 per share. Excluding this non-recurring dividend, the ratio of net investment income (loss) to average net assets would have been (.36)%. H Expense ratios reflect operating expenses of the class. Expenses before reductions do not reflect amounts reimbursed by the investment adviser or reductions from brokerage service arrangements or reductions from other expense offset arrangements and do not represent the amount paid by the class during periods when reimbursements or reductions occur. Expenses net of fee waivers reflect expenses after reimbursement by the investment adviser but prior to reductions from brokerage service arrangements or other expense offset arrangements. Expenses net of all reductions represent the net expenses paid by the class. I The portfolio turnover rate does not include the assets acquired in the merger. J For the year ended February 29. K Amount represents less than $.01 per share. |
Financial Highlights - Class C
|
Years ended February 28, |
2013 |
2012 J |
2011 |
2010 |
2009 |
|
Selected Per-Share Data |
|
|
|
|
|
|
Net asset value, beginning of period |
$ 67.98 |
$ 68.78 |
$ 51.79 |
$ 27.31 |
$ 56.50 |
|
Income from Investment Operations |
|
|
|
|
|
|
Net investment income (loss) C |
.18 |
(.10) |
.61 F |
(.06) G |
(.13) |
|
Net realized and unrealized gain (loss) |
5.55 |
(.32) |
17.09 |
24.57 |
(29.07) |
|
Total from investment operations |
5.73 |
(.42) |
17.70 |
24.51 |
(29.20) |
|
Distributions from net investment income |
(.20) |
- |
(.72) |
(.04) |
- |
|
Distributions from net realized gain |
(1.55) |
(.38) |
- |
- |
- |
|
Total distributions |
(1.75) |
(.38) |
(.72) |
(.04) |
- |
|
Redemption fees added to paid in capital C |
- K |
- K |
.01 |
.01 |
.01 |
|
Net asset value, end of period |
$ 71.96 |
$ 67.98 |
$ 68.78 |
$ 51.79 |
$ 27.31 |
|
Total Return A, B |
8.58% |
(.55)% |
34.29% |
89.82% |
(51.66)% |
|
Ratios to Average Net Assets D, H |
|
|
|
|
|
|
Expenses before reductions |
1.89% |
1.89% |
1.93% |
2.01% |
1.95% |
|
Expenses net of fee waivers, if any |
1.89% |
1.89% |
1.93% |
2.01% |
1.95% |
|
Expenses net of all reductions |
1.88% |
1.89% |
1.92% |
2.00% |
1.95% |
|
Net investment income (loss) |
.26% |
(.15)% |
1.04% F |
(.13)% G |
(.27)% |
|
Supplemental Data |
|
|
|
|
|
|
Net assets, end of period (000 omitted) |
$ 75,007 |
$ 58,296 |
$ 46,525 |
$ 20,469 |
$ 5,509 |
|
Portfolio turnover rate E |
61% |
94% |
87% |
104% I |
117% |
|
A Total returns would have been lower if certain expenses had not been reduced during the applicable periods shown. B Total returns do not include the effect of the contingent deferred sales charge. C Calculated based on average shares outstanding during the period. D Fees and expenses of any underlying Fidelity Central Funds are not included in the Fund's expense ratio. The Fund indirectly bears its proportionate share of the expenses of any underlying Fidelity Central Funds. E Amount does not include the portfolio activity of any underlying Fidelity Central Funds. F Investment income per share reflects a large, non-recurring dividend which amounted to $.83 per share. Excluding this non-recurring dividend, the ratio of net investment income (loss) to average net assets would have been (.35)%. G Investment income per share reflects a large, non-recurring dividend which amounted to $.10 per share. Excluding this non-recurring dividend, the ratio of net investment income (loss) to average net assets would have been (.35)%. H Expense ratios reflect operating expenses of the class. Expenses before reductions do not reflect amounts reimbursed by the investment adviser or reductions from brokerage service arrangements or reductions from other expense offset arrangements and do not represent the amount paid by the class during periods when reimbursements or reductions occur. Expenses net of fee waivers reflect expenses after reimbursement by the investment adviser but prior to reductions from brokerage service arrangements or other expense offset arrangements. Expenses net of all reductions represent the net expenses paid by the class. I The portfolio turnover rate does not include the assets acquired in the merger. J For the year ended February 29. K Amount represents less than $.01 per share. |
See accompanying notes which are an integral part of the financial statements.
Annual Report
Financial Highlights - Materials
|
Years ended February 28, |
2013 |
2012 I |
2011 |
2010 |
2009 |
|
Selected Per-Share Data |
|
|
|
|
|
|
Net asset value, beginning of period |
$ 69.41 |
$ 70.11 |
$ 52.61 |
$ 27.66 |
$ 57.01 |
|
Income from Investment Operations |
|
|
|
|
|
|
Net investment income (loss) B |
.90 |
.60 |
1.25 E |
.43 F |
.38 |
|
Net realized and unrealized gain (loss) |
5.71 |
(.37) |
17.43 |
24.91 |
(29.54) |
|
Total from investment operations |
6.61 |
.23 |
18.68 |
25.34 |
(29.16) |
|
Distributions from net investment income |
(.79) |
(.55) |
(1.16) |
(.40) |
(.20) |
|
Distributions from net realized gain |
(1.55) |
(.38) |
(.03) |
- |
- |
|
Total distributions |
(2.34) |
(.93) |
(1.19) |
(.40) |
(.20) |
|
Redemption fees added to paid in capital B |
- J |
- J |
.01 |
.01 |
.01 |
|
Net asset value, end of period |
$ 73.68 |
$ 69.41 |
$ 70.11 |
$ 52.61 |
$ 27.66 |
|
Total Return A |
9.71% |
.49% |
35.70% |
91.77% |
(51.15)% |
|
Ratios to Average Net Assets C, G |
|
|
|
|
|
|
Expenses before reductions |
.85% |
.85% |
.88% |
.96% |
.90% |
|
Expenses net of fee waivers, if any |
.85% |
.85% |
.88% |
.96% |
.90% |
|
Expenses net of all reductions |
.84% |
.84% |
.87% |
.94% |
.90% |
|
Net investment income (loss) |
1.30% |
.90% |
2.10% E |
.92% F |
.78% |
|
Supplemental Data |
|
|
|
|
|
|
Net assets, end of period (000 omitted) |
$ 1,146,782 |
$ 1,089,619 |
$ 1,195,371 |
$ 604,475 |
$ 127,551 |
|
Portfolio turnover rate D |
61% |
94% |
87% |
104% H |
117% |
|
A Total returns would have been lower if certain expenses had not been reduced during the applicable periods shown. B Calculated based on average shares outstanding during the period. C Fees and expenses of any underlying Fidelity Central Funds are not included in the Fund's expense ratio. The Fund indirectly bears its proportionate share of the expenses of any underlying Fidelity Central Funds. D Amount does not include the portfolio activity of any underlying Fidelity Central Funds. E Investment income per share reflects a large, non-recurring dividend which amounted to $.83 per share. Excluding this non-recurring dividend, the ratio of net investment income (loss) to average net assets would have been ..70%. F Investment income per share reflects a large, non-recurring dividend which amounted to $.10 per share. Excluding this non-recurring dividend, the ratio of net investment income (loss) to average net assets would have been .70%. G Expense ratios reflect operating expenses of the class. Expenses before reductions do not reflect amounts reimbursed by the investment adviser or reductions from brokerage service arrangements or reductions from other expense offset arrangements and do not represent the amount paid by the class during periods when reimbursements or reductions occur. Expenses net of fee waivers reflect expenses after reimbursement by the investment adviser but prior to reductions from brokerage service arrangements or other expense offset arrangements. Expenses net of all reductions represent the net expenses paid by the class. H The portfolio turnover rate does not include the assets acquired in the merger. I For the year ended February 29. J Amount represents less than $.01 per share. |
Financial Highlights - Institutional Class
|
Years ended February 28, |
2013 |
2012 I |
2011 |
2010 |
2009 |
|
Selected Per-Share Data |
|
|
|
|
|
|
Net asset value, beginning of period |
$ 69.35 |
$ 70.05 |
$ 52.58 |
$ 27.66 |
$ 57.00 |
|
Income from Investment Operations |
|
|
|
|
|
|
Net investment income (loss) B |
.90 |
.60 |
1.28 E |
.46 F |
.38 |
|
Net realized and unrealized gain (loss) |
5.70 |
(.36) |
17.40 |
24.89 |
(29.53) |
|
Total from investment operations |
6.60 |
.24 |
18.68 |
25.35 |
(29.15) |
|
Distributions from net investment income |
(.83) |
(.56) |
(1.19) |
(.44) |
(.20) |
|
Distributions from net realized gain |
(1.55) |
(.38) |
(.03) |
- |
- |
|
Total distributions |
(2.38) |
(.94) |
(1.22) |
(.44) |
(.20) |
|
Redemption fees added to paid in capital B |
- J |
- J |
.01 |
.01 |
.01 |
|
Net asset value, end of period |
$ 73.57 |
$ 69.35 |
$ 70.05 |
$ 52.58 |
$ 27.66 |
|
Total Return A |
9.71% |
.50% |
35.73% |
91.79% |
(51.15)% |
|
Ratios to Average Net Assets C, G |
|
|
|
|
|
|
Expenses before reductions |
.85% |
.84% |
.86% |
.94% |
.90% |
|
Expenses net of fee waivers, if any |
.85% |
.84% |
.86% |
.94% |
.90% |
|
Expenses net of all reductions |
.84% |
.83% |
.85% |
.93% |
.90% |
|
Net investment income (loss) |
1.30% |
.91% |
2.11% E |
.94% F |
.78% |
|
Supplemental Data |
|
|
|
|
|
|
Net assets, end of period (000 omitted) |
$ 246,696 |
$ 89,299 |
$ 85,130 |
$ 13,670 |
$ 719 |
|
Portfolio turnover rate D |
61% |
94% |
87% |
104% H |
117% |
|
A Total returns would have been lower if certain expenses had not been reduced during the applicable periods shown. B Calculated based on average shares outstanding during the period. C Fees and expenses of any underlying Fidelity Central Funds are not included in the Fund's expense ratio. The Fund indirectly bears its proportionate share of the expenses of any underlying Fidelity Central Funds. D Amount does not include the portfolio activity of any underlying Fidelity Central Funds. E Investment income per share reflects a large, non-recurring dividend which amounted to $.83 per share. Excluding this non-recurring dividend, the ratio of net investment income (loss) to average net assets would have been ..72%. F Investment income per share reflects a large, non-recurring dividend which amounted to $.10 per share. Excluding this non-recurring dividend, the ratio of net investment income (loss) to average net assets would have been .72%. G Expense ratios reflect operating expenses of the class. Expenses before reductions do not reflect amounts reimbursed by the investment adviser or reductions from brokerage service arrangements or reductions from other expense offset arrangements and do not represent the amount paid by the class during periods when reimbursements or reductions occur. Expenses net of fee waivers reflect expenses after reimbursement by the investment adviser but prior to reductions from brokerage service arrangements or other expense offset arrangements. Expenses net of all reductions represent the net expenses paid by the class. H The portfolio turnover rate does not include the assets acquired in the merger. I For the year ended February 29. J Amount represents less than $.01 per share. |
See accompanying notes which are an integral part of the financial statements.
Annual Report
Notes to Financial Statements
For the period ended February 28, 2013
1. Organization.
Materials Portfolio (the Fund) is a non-diversified fund of Fidelity Select Portfolios (the Trust) and is authorized to issue an unlimited number of shares. The Trust is registered under the Investment Company Act of 1940, as amended (the 1940 Act), as an open-end management investment company organized as a Massachusetts business trust. The Fund invests primarily in securities of companies whose principal business activities fall within specific industries. The Fund offers Class A, Class T, Class C, Materials, and Institutional Class shares, each of which, along with Class B shares, has equal rights as to assets and voting privileges. Class B shares are closed to new accounts and additional purchases, except for exchanges and reinvestments. Each class has exclusive voting rights with respect to matters that affect that class. Class B shares will automatically convert to Class A shares after a holding period of seven years from the initial date of purchase. Investment income, realized and unrealized capital gains and losses, the common expenses of the Fund, and certain fund-level expense reductions, if any, are allocated on a pro-rata basis to each class based on the relative net assets of each class to the total net assets of the Fund. Each class differs with respect to transfer agent and distribution and service plan fees incurred. Certain expense reductions may also differ by class.
2. Investments in Fidelity Central Funds.
The Fund invests in Fidelity Central Funds, which are open-end investment companies available only to other investment companies and accounts managed by Fidelity Management & Research Company (FMR) and its affiliates. The Fund's Schedule of Investments lists each of the Fidelity Central Funds held as of period end, if any, as an investment of the Fund, but does not include the underlying holdings of each Fidelity Central Fund. As an Investing Fund, the Fund indirectly bears its proportionate share of the expenses of the underlying Fidelity Central Funds.
The Money Market Central Funds seek preservation of capital and current income and are managed by Fidelity Investments Money Management, Inc. (FIMM), an affiliate of FMR.
A complete unaudited list of holdings for each Fidelity Central Fund is available upon request or at the Securities and Exchange Commission (the SEC) website at www.sec.gov. In addition, the financial statements of the Fidelity Central Funds, which are not covered by the Fund's Report of Independent Registered Public Accounting Firm, are available on the SEC website or upon request.
3. Significant Accounting Policies.
The financial statements have been prepared in conformity with accounting principles generally accepted in the United States of America (GAAP), which require management to make certain estimates and assumptions at the date of the financial statements. Actual results could differ from those estimates. Subsequent events, if any, through the date that the financial statements were issued have been evaluated in the preparation of the financial statements. The following summarizes the significant accounting policies of the Fund:
Investment Valuation. Investments are valued as of 4:00 p.m. Eastern time on the last calendar day of the period. In accordance with valuation policies and procedures approved by the Board of Trustees (the Board), the Fund attempts to obtain prices from one or more third party pricing vendors or brokers to value its investments. When current market prices, quotations or currency exchange rates are not readily available or reliable, investments will be fair valued in good faith by the FMR Fair Value Committee (the Committee), in accordance with procedures adopted by the Fund's Board. Factors used in determining fair value vary by investment type and may include market or investment specific events, changes in interest rates and credit quality. The frequency with which these procedures are used cannot be predicted and they may be utilized to a significant extent. The Committee oversees the Fund's valuation policies and procedures and is responsible for approving and reporting to the Board all fair value determinations.
The Fund categorizes the inputs to valuation techniques used to value its investments into a disclosure hierarchy consisting of three levels as shown below:
Level 1 - quoted prices in active markets for identical investments
Level 2 - other significant observable inputs (including quoted prices for similar investments, interest rates, prepayment speeds, etc.)
Level 3 - unobservable inputs (including the Fund's own assumptions based on the best information available)
Valuation techniques used to value the Fund's investments by major category are as follows:
Equity securities, including restricted securities, for which market quotations are readily available, are valued at the last reported sale price or official closing price as reported by a third party pricing vendor on the primary market or exchange on which they are traded and are categorized as Level 1 in the hierarchy. In the event there were no sales during the day or closing prices are not available, securities are valued at the last quoted bid price or may be valued using the last available price and are generally categorized as Level 2 in the hierarchy. For foreign equity securities, when significant market or security specific events arise, comparisons to the valuation of American Depositary Receipts (ADRs), futures contracts, Exchange-Traded
Annual Report
3. Significant Accounting Policies - continued
Investment Valuation - continued
Funds (ETFs) and certain indexes as well as quoted prices for similar securities are used and are categorized as Level 2 in the hierarchy. Utilizing these techniques may result in transfers between Level 1 and Level 2.
Debt securities, including restricted securities, are valued based on evaluated prices received from third party pricing vendors or from brokers who make markets in such securities. For corporate bonds and U.S. government and government agency obligations, pricing vendors utilize matrix pricing which considers yield or price of bonds of comparable quality, coupon, maturity and type as well as broker-supplied prices. When independent prices are unavailable or unreliable, debt securities may be valued utilizing pricing methodologies which consider similar factors that would be used by third party pricing vendors. Debt securities are generally categorized as Level 2 in the hierarchy but may be Level 3 depending on the circumstances.
Futures contracts are valued at the settlement price established each day by the board of trade or exchange on which they are traded and are categorized as Level 1 in the hierarchy. Investments in open-end mutual funds, including the Fidelity Central Funds, are valued at their closing net asset value (NAV) each business day and are categorized as Level 1 in the hierarchy.
Changes in valuation techniques may result in transfers in or out of an assigned level within the disclosure hierarchy. The aggregate value of investments by input level, as of February 28, 2013, is included at the end of the Fund's Schedule of Investments.
Foreign Currency. The Fund may use foreign currency contracts to facilitate transactions in foreign-denominated securities. Gains and losses from these transactions may arise from changes in the value of the foreign currency or if the counterparties do not perform under the contracts' terms.
Foreign-denominated assets, including investment securities, and liabilities are translated into U.S. dollars at the exchange rates at period end. Purchases and sales of investment securities, income and dividends received and expenses denominated in foreign currencies are translated into U.S. dollars at the exchange rate in effect on the transaction date.
The effects of exchange rate fluctuations on investments are included with the net realized and unrealized gain (loss) on investment securities. Other foreign currency transactions resulting in realized and unrealized gain (loss) are disclosed separately.
Investment Transactions and Income. For financial reporting purposes, the Fund's investment holdings and NAV include trades executed through the end of the last business day of the period. The NAV per share for processing shareholder transactions is calculated as of the close of business of the New York Stock Exchange (NYSE), normally 4:00 p.m. Eastern time and includes trades executed through the end of the prior business day. Gains and losses on securities sold are determined on the basis of identified cost and may include proceeds received from litigation. Dividend income is recorded on the ex-dividend date, except for certain dividends from foreign securities where the ex-dividend date may have passed, which are recorded as soon as the Fund is informed of the ex-dividend date. Non-cash dividends included in dividend income, if any, are recorded at the fair market value of the securities received. Distributions received on securities that represent a return of capital or capital gain are recorded as a reduction of cost of investments and/or as a realized gain. The Fund estimates the components of distributions received that may be considered return of capital distributions or capital gain distributions. Interest income and distributions from the Fidelity Central Funds are accrued as earned. Interest income includes coupon interest and amortization of premium and accretion of discount on debt securities. Investment income is recorded net of foreign taxes withheld where recovery of such taxes is uncertain.
Expenses. Expenses directly attributable to a fund are charged to that fund. Expenses attributable to more than one fund are allocated among the respective funds on the basis of relative net assets or other appropriate methods. Expense estimates are accrued in the period to which they relate and adjustments are made when actual amounts are known.
Income Tax Information and Distributions to Shareholders. Each year, the Fund intends to qualify as a regulated investment company under Subchapter M of the Internal Revenue Code, including distributing substantially all of its taxable income and realized gains. As a result, no provision for income taxes is required. As of February 28, 2013, the Fund did not have any unrecognized tax benefits in the financial statements; nor is the Fund aware of any tax positions for which it is reasonably possible that the total amounts of unrecognized tax benefits will significantly change in the next twelve months. The Fund files a U.S. federal tax return, in addition to state and local tax returns as required. A fund's federal income tax returns are subject to examination by the Internal Revenue Service (IRS) for a period of three fiscal years after they are filed. State and local tax returns may be subject to examination for an additional fiscal year depending on the jurisdiction. Foreign taxes are provided for based on the Fund's understanding of the tax rules and rates that exist in the foreign markets in which it invests.
Distributions are declared and recorded on the ex-dividend date. Income dividends and capital gain distributions are declared separately for each class. Income and capital gain distributions are determined in accordance with income tax regulations, which may differ from GAAP. In addition, the Fund claimed a portion of the payment made to redeeming shareholders as a distribution for income tax purposes.
Capital accounts within the financial statements are adjusted for permanent book-tax differences. These adjustments have no impact on net assets or the results of operations. Temporary book-tax differences will reverse in a subsequent period.
Annual Report
Notes to Financial Statements - continued
3. Significant Accounting Policies - continued
Income Tax Information and Distributions to Shareholders - continued
Book-tax differences are primarily due to futures contracts, foreign currency transactions, partnerships, passive foreign investment companies (PFIC), deferred trustees compensation, capital loss carryforwards, and losses deferred due to wash sales and excise tax regulations.
The federal tax cost of investment securities and unrealized appreciation (depreciation) as of period end were as follows:
|
Gross unrealized appreciation |
$ 369,676,346 |
|
Gross unrealized depreciation |
(47,344,015) |
|
Net unrealized appreciation (depreciation) on securities and other investments |
$ 322,332,331 |
|
|
|
|
Tax Cost |
$ 1,520,121,370 |
The tax-based components of distributable earnings as of period end were as follows:
|
Undistributed ordinary income |
$ 1,139,008 |
|
Undistributed long-term capital gain |
$ 374,657 |
|
Net unrealized appreciation (depreciation) |
$ 322,329,348 |
The tax character of distributions paid was as follows:
|
|
February 28, 2013 |
February 29, 2012 |
|
Ordinary Income |
$ 15,064,080 |
$ 9,840,737 |
|
Long-term Capital Gains |
31,892,999 |
7,461,289 |
|
Total |
$ 46,957,079 |
$ 17,302,026 |
Capital loss carryforwards are only available to offset future capital gains of the Fund to the extent provided by regulations and may be limited. Under the Regulated Investment Company Modernization Act of 2010 (the Act), the Fund is permitted to carry forward capital losses incurred in taxable years beginning after December 22, 2010 for an unlimited period and such capital losses are required to be used prior to any losses that expire. At February 28, 2013 capital loss carryforwards were as follows:
|
Fiscal year of expiration: |
|
|
2017 |
$ (2,033,557) |
|
2018 |
(1,022,988) |
|
2019 |
(80,787) |
|
Total with expiration |
$ (3,137,332) |
The Fund acquired $3,137,332 of its capital loss carryforward as part of a merger in a prior period. The losses acquired that will be available to offset future capital gains of the Fund will be limited to approximately $611,309 per year.
Trading (Redemption) Fees. Shares held by investors in the Fund less than 30 days are subject to a redemption fee equal to .75% of the net asset value of shares redeemed. All redemption fees, which reduce the proceeds of the shareholder redemption, are retained by the Fund and accounted for as an addition to paid in capital.
Restricted Securities. The Fund may invest in securities that are subject to legal or contractual restrictions on resale. These securities generally may be resold in transactions exempt from registration or to the public if the securities are registered. Disposal of these securities may involve time-consuming negotiations and expense, and prompt sale at an acceptable price may be difficult. Information regarding restricted securities is included at the end of the Fund's Schedule of Investments.
New Accounting Pronouncement. The Financial Accounting Standards Board issued in December 2011, Accounting Standard Update No. 2011-11, Disclosures about Offsetting Assets and Liabilities, and in January 2013, Accounting Standards Update No. 2013-1 Clarifying the Scope of Disclosures about Offsetting Assets and Liabilities. These updates create new disclosure requirements requiring entities to disclose both gross and net information for derivatives and other financial instruments that are either offset in the Statement of Assets and Liabilities or subject to an enforceable master netting arrangement or similar agreement. The disclosure requirements are effective for annual reporting periods beginning on or after January 1, 2013, and interim periods within those annual periods. Management is currently evaluating the impact of the update's adoption on the Fund's financial statement disclosures.
Annual Report
4. Derivative Instruments.
Risk Exposures and the Use of Derivative Instruments. The Fund's investment objective allows the Fund to enter into various types of derivative contracts, including futures contracts. Derivatives are investments whose value is primarily derived from underlying assets, indices or reference rates and may be transacted on an exchange or over-the-counter (OTC). Derivatives may involve a future commitment to buy or sell a specified asset based on specified terms, to exchange future cash flows at periodic intervals based on a notional principal amount, or for one party to make one or more payments upon the occurrence of specified events in exchange for periodic payments from the other party.
The Fund used derivatives to increase returns and to manage exposure to certain risks as defined below. The success of any strategy involving derivatives depends on analysis of numerous economic factors, and if the strategies for investment do not work as intended, the Fund may not achieve its objectives.
The Fund's use of derivatives increased or decreased its exposure to the following risk:
|
Equity Risk |
Equity risk relates to the fluctuations in the value of financial instruments as a result of changes in market prices (other than those arising from interest rate risk or foreign exchange risk), whether caused by factors specific to an individual investment, its issuer, or all factors affecting all instruments traded in a market or market segment. |
The Fund is also exposed to additional risks from investing in derivatives, such as liquidity risk and counterparty credit risk. Liquidity risk is the risk that the Fund will be unable to close out the derivative in the open market in a timely manner. Counterparty credit risk is the risk that the counterparty will not be able to fulfill its obligation to the Fund. Counterparty credit risk related to exchange-traded futures contracts is mitigated by the protection provided by the exchange on which they trade.
Investing in derivatives may involve greater risks than investing in the underlying assets directly and, to varying degrees, may involve risk of loss in excess of any initial investment and collateral received and amounts recognized in the Statement of Assets and Liabilities. In addition, there may be the risk that the change in value of the derivative contract does not correspond to the change in value of the underlying instrument.
Futures Contracts. A futures contract is an agreement between two parties to buy or sell a specified underlying instrument for a fixed price at a specified future date. The Fund used futures contracts to manage its exposure to the stock market.
Upon entering into a futures contract, a fund is required to deposit either cash or securities (initial margin) with a clearing broker in an amount equal to a certain percentage of the face value of the contract. Futures contracts are marked-to-market daily and subsequent payments (variation margin) are made or received by a fund depending on the daily fluctuations in the value of the futures contracts and are recorded as unrealized appreciation or (depreciation). This receivable and/or payable, if any, is included in daily variation margin on futures contracts in the Statement of Assets and Liabilities. Realized gain or (loss) is recorded upon the expiration or closing of a futures contract.
Any open futures contracts at period end are presented in the Schedule of Investments under the caption "Futures Contracts." The underlying face amount at value reflects each contract's exposure to the underlying instrument or index at period end and is representative of activity for the period. Securities deposited to meet initial margin requirements are identified in the Schedule of Investments.
During the period the Fund recognized net realized gain (loss) of $1,204,377 and a change in net unrealized appreciation (depreciation) of $(743,685) related to its investment in futures contracts. These amounts are included in the Statement of Operations.
5. Purchases and Sales of Investments.
Purchases and sales of securities, other than short-term securities, aggregated $1,052,076,740 and $837,936,289, respectively.
6. Fees and Other Transactions with Affiliates.
Management Fee. FMR and its affiliates provide the Fund with investment management related services for which the Fund pays a monthly management fee. The management fee is the sum of an individual fund fee rate that is based on an annual rate of .30% of the Fund's average net assets and an annualized group fee rate that averaged .26% during the period. The group fee rate is based upon the average net assets of all the mutual funds advised by FMR. The group fee rate decreases as assets under management increase and increases as assets under management decrease. For the period, the total annual management fee rate was .56% of the Fund's average net assets.
Annual Report
Notes to Financial Statements - continued
6. Fees and Other Transactions with Affiliates - continued
Distribution and Service Plan Fees. In accordance with Rule 12b-1 of the 1940 Act, the Fund has adopted separate Distribution and Service Plans for each class of shares. Certain classes pay Fidelity Distributors Corporation (FDC), an affiliate of FMR, separate Distribution and Service Fees, each of which is based on an annual percentage of each class' average net assets. In addition, FDC may pay financial intermediaries for selling shares of the Fund and providing shareholder support services. For the period, the Distribution and Service Fee rates, total fees and amounts retained by FDC were as follows:
|
|
Distribution |
Service |
Total Fees |
Retained |
|
Class A |
-% |
.25% |
$ 427,638 |
$ 10,034 |
|
Class T |
.25% |
.25% |
153,568 |
902 |
|
Class B |
.75% |
.25% |
102,442 |
76,934 |
|
Class C |
.75% |
.25% |
607,890 |
167,651 |
|
|
|
|
$ 1,291,538 |
$ 255,521 |
Sales Load. FDC may receive a front-end sales charge of up to 5.75% for selling Class A shares and 3.50% for selling Class T shares, some of which is paid to financial intermediaries for selling shares of the Fund. Depending on the holding period, FDC may receive contingent deferred sales charges levied on Class A, Class T, Class B and Class C redemptions. The deferred sales charges range from 5.00% to 1.00% for Class B shares, 1.00% for Class C shares, 1.00% for certain purchases of Class A shares and .25% for certain purchases of Class T shares.
For the period, sales charge amounts retained by FDC were as follows:
|
|
Retained |
|
Class A |
$ 151,786 |
|
Class T |
13,666 |
|
Class B* |
18,449 |
|
Class C* |
13,222 |
|
|
$ 197,123 |
* When Class B and Class C shares are initially sold, FDC pays commissions from its own resources to financial intermediaries through which the sales are made.
Transfer Agent Fees. Fidelity Investments Institutional Operations Company, Inc., (FIIOC), an affiliate of FMR, is the transfer, dividend disbursing and shareholder servicing agent for each class of the Fund. FIIOC receives account fees and asset-based fees that vary according to the account size and type of account of the shareholders of the respective classes of the Fund. FIIOC pays for typesetting, printing and mailing of shareholder reports, except proxy statements. For the period, transfer agent fees for each class were as follows:
|
|
Amount |
% of |
|
Class A |
$ 461,680 |
.27 |
|
Class T |
94,591 |
.31 |
|
Class B |
30,998 |
.30 |
|
Class C |
165,490 |
.27 |
|
Materials |
2,436,019 |
.24 |
|
Institutional Class |
287,760 |
.24 |
|
|
$ 3,476,538 |
|
Accounting and Security Lending Fees. Fidelity Service Company, Inc. (FSC), an affiliate of FMR, maintains the Fund's accounting records. The accounting fee is based on the level of average net assets for each month. Under a separate contract, FSC administers the security lending program. The security lending fee is based on the number and duration of lending transactions.
Brokerage Commissions. The Fund placed a portion of its portfolio transactions with brokerage firms which are affiliates of the investment adviser. The commissions paid to these affiliated firms were $14,947 for the period.
7. Committed Line of Credit.
The Fund participates with other funds managed by FMR or an affiliate in a $4.25 billion credit facility (the "line of credit") to be utilized for temporary or emergency purposes to fund shareholder redemptions or for other short-term liquidity purposes. The Fund has agreed to pay commitment fees on its pro-rata portion of the line of credit, which amounted to $3,636 and is reflected in Miscellaneous expenses on the Statement of Operations. During the period, there were no borrowings on this line of credit.
Annual Report
8. Security Lending.
The Fund lends portfolio securities through a lending agent from time to time in order to earn additional income. For equity securities, a lending agent is used and may loan securities to certain qualified borrowers, including Fidelity Capital Markets (FCM), a broker-dealer affiliated with the Fund. On the settlement date of the loan, the Fund receives collateral (in the form of U.S. Treasury obligations, letters of credit and/or cash) against the loaned securities and maintains collateral in an amount not less than 100% of the market value of the loaned securities during the period of the loan. The market value of the loaned securities is determined at the close of business of the Fund and any additional required collateral is delivered to the Fund on the next business day. If the borrower defaults on its obligation to return the securities loaned because of insolvency or other reasons, a fund could experience delays and costs in recovering the securities loaned or in gaining access to the collateral. Any cash collateral received is invested in the Fidelity Securities Lending Cash Central Fund. The value of loaned securities and cash collateral at period end are disclosed on the Fund's Statement of Assets and Liabilities. Security lending income represents the income earned on investing cash collateral, less rebates paid to borrowers and any lending agent fees associated with the loan, plus any premium payments received for lending certain types of securities. Security lending income is presented in the Statement of Operations as a component of income from Fidelity Central Funds. Total security lending income during the period amounted to $520,779. During the period, there were no securities loaned to FCM.
9. Expense Reductions.
Many of the brokers with whom FMR places trades on behalf of the Fund provided services to the Fund in addition to trade execution. These services included payments of certain expenses on behalf of the Fund totaling $134,582 for the period. In addition, through arrangements with the Fund's custodian, credits realized as a result of uninvested cash balances were used to reduce the Fund's expenses. During the period, these credits reduced the Fund's custody expenses by $110.
In addition, FMR reimbursed a portion of the Fund's operating expenses during the period in the amount of $2,610.
10. Distributions to Shareholders.
Distributions to shareholders of each class were as follows:
|
|
Year Ended |
Year Ended |
|
From net investment income |
|
|
|
Class A |
$ 1,631,593 |
$ 868,107 |
|
Class T |
221,281 |
100,314 |
|
Class B |
14,451 |
- |
|
Class C |
183,511 |
- |
|
Materials |
11,420,509 |
8,266,851 |
|
Institutional Class |
1,592,735 |
605,465 |
|
Total |
$ 15,064,080 |
$ 9,840,737 |
|
From net realized gain |
|
|
|
Class A |
$ 3,967,803 |
$ 816,536 |
|
Class T |
717,303 |
151,869 |
|
Class B |
228,009 |
66,321 |
|
Class C |
1,411,838 |
312,224 |
|
Materials |
22,783,457 |
5,701,275 |
|
Institutional Class |
2,784,589 |
413,064 |
|
Total |
$ 31,892,999 |
$ 7,461,289 |
11. Share Transactions.
Transactions for each class of shares were as follows:
|
|
Shares |
Dollars |
||
|
|
Year Ended |
Year Ended |
Year Ended |
Year Ended |
|
Class A |
|
|
|
|
|
Shares sold |
1,611,922 |
1,406,389 |
$ 112,576,195 |
$ 95,285,956 |
|
Reinvestment of distributions |
68,775 |
23,605 |
4,804,595 |
1,462,799 |
|
Shares redeemed |
(969,159) |
(925,476) |
(66,285,158) |
(60,145,567) |
|
Net increase (decrease) |
711,538 |
504,518 |
$ 51,095,632 |
$ 36,603,188 |
Annual Report
Notes to Financial Statements - continued
11. Share Transactions - continued
|
|
Shares |
Dollars |
||
|
|
Year Ended |
Year Ended |
Year Ended |
Year Ended |
|
Class T |
|
|
|
|
|
Shares sold |
205,283 |
150,265 |
$ 14,234,477 |
$ 10,197,019 |
|
Reinvestment of distributions |
12,892 |
3,964 |
896,667 |
244,682 |
|
Shares redeemed |
(110,407) |
(110,682) |
(7,498,384) |
(7,174,563) |
|
Net increase (decrease) |
107,768 |
43,547 |
$ 7,632,760 |
$ 3,267,138 |
|
Class B |
|
|
|
|
|
Shares sold |
21,997 |
35,651 |
$ 1,493,049 |
$ 2,318,398 |
|
Reinvestment of distributions |
3,022 |
909 |
207,121 |
55,554 |
|
Shares redeemed |
(45,545) |
(70,403) |
(3,081,508) |
(4,524,937) |
|
Net increase (decrease) |
(20,526) |
(33,843) |
$ (1,381,338) |
$ (2,150,985) |
|
Class C |
|
|
|
|
|
Shares sold |
423,105 |
456,374 |
$ 29,248,360 |
$ 30,369,453 |
|
Reinvestment of distributions |
19,249 |
4,184 |
1,317,196 |
254,995 |
|
Shares redeemed |
(257,585) |
(279,339) |
(17,263,032) |
(17,740,501) |
|
Net increase (decrease) |
184,769 |
181,219 |
$ 13,302,524 |
$ 12,883,947 |
|
Materials |
|
|
|
|
|
Shares sold |
5,306,846 |
6,950,456 |
$ 372,534,797 |
$ 471,314,225 |
|
Reinvestment of distributions |
464,930 |
214,200 |
32,543,457 |
13,299,700 |
|
Shares redeemed |
(5,905,812) |
(8,516,169) |
(406,043,890) |
(562,008,908) |
|
Net increase (decrease) |
(134,036) |
(1,351,513) |
$ (965,636) |
$ (77,394,983) |
|
Institutional Class |
|
|
|
|
|
Shares sold |
2,986,457 |
1,444,894 |
$ 212,651,449 |
$ 97,144,756 |
|
Reinvestment of distributions |
54,139 |
13,291 |
3,797,777 |
824,595 |
|
Shares redeemed |
(975,090) |
(1,385,770) |
(66,601,118) |
(90,119,446) |
|
Net increase (decrease) |
2,065,506 |
72,415 |
$ 149,848,108 |
$ 7,849,905 |
12. Other.
The Fund's organizational documents provide former and current trustees and officers with a limited indemnification against liabilities arising in connection with the performance of their duties to the Fund. In the normal course of business, the Fund may also enter into contracts that provide general indemnifications. The Fund's maximum exposure under these arrangements is unknown as this would be dependent on future claims that may be made against the Fund. The risk of material loss from such claims is considered remote.
Annual Report
Fidelity Advisor Telecommunications Fund - Class A, T, B and C
Performance: The Bottom Line
Average annual total return reflects the change in the value of an investment, assuming reinvestment of the class' distributions from dividend income and capital gains (the profits earned upon the sale of securities that have grown in value, if any) and assuming a constant rate of performance each year. The $10,000 table and the fund's returns do not reflect the deduction of taxes that a shareholder would pay on fund distributions or the redemption of fund shares. During periods of reimbursement by Fidelity, a fund's total return will be greater than it would be had the reimbursement not occurred. How a fund did yesterday is no guarantee of how it will do tomorrow.
Average Annual Total Returns
|
Periods ended February 28, 2013 |
Past 1 |
Past 5 |
Past 10 |
|
Class A (incl. 5.75% sales charge) A |
7.41% |
4.22% |
8.76% |
|
Class T (incl. 3.50% sales charge) B |
9.64% |
4.41% |
8.83% |
|
Class B (incl. contingent deferred sales charge) C |
8.11% |
4.33% |
8.89% |
|
Class C (incl. contingent deferred sales charge) D |
12.14% |
4.68% |
8.91% |
A Class A shares bear a 0.25% 12b-1 fee. The initial offering of Class A shares took place on December 12, 2006. Returns prior to December 12, 2006, are those of Telecommunications Portfolio, the original class of the fund, which has no 12b-1 fee. Had Class A shares' 12b-1 fee been reflected, returns prior to December 12, 2006, would have been lower.
B Class T shares bear a 0.50% 12b-1 fee. The initial offering of Class T shares took place on December 12, 2006. Returns prior to December 12, 2006, are those of Telecommunications Portfolio, the original class of the fund, which has no 12b-1 fee. Had Class T shares' 12b-1 fee been reflected, returns prior to December 12, 2006, would have been lower.
C Class B shares bear a 1.00% 12b-1 fee. The initial offering of Class B shares took place on December 12, 2006. Returns prior to December 12, 2006, are those of Telecommunications Portfolio, the original class of the fund, which has no 12b-1 fee. Had Class B shares' 12b-1 fee been reflected, returns prior to December 12, 2006, would have been lower. Class B shares' contingent deferred sales charges included in the past one year, past five years, and past ten years total return figures are 5%, 2%, and 0%, respectively.
D Class C shares bear a 1.00% 12b-1 fee. The initial offering of Class C shares took place on December 12, 2006. Returns prior to December 12, 2006, are those of Telecommunications Portfolio, the original class of the fund, which has no 12b-1 fee. Had Class C shares' 12b-1 fee been reflected, returns prior to December 12, 2006, would have been lower. Class C shares' contingent deferred sales charges included in the past one year, past five years, and past ten years total return figures are 1%, 0%, and 0%, respectively.
$10,000 Over 10 Years
Let's say hypothetically that $10,000 was invested in Fidelity Advisor Telecommunications Fund - Class A on February 28, 2003, and the current 5.75% sales charge was paid. The chart shows how the value of your investment would have changed, and also shows how the S&P 500 Index performed over the same period. The initial offering of Class A took place on December 12, 2006. See the Average Annual Total Returns table for additional information regarding the performance of Class A.
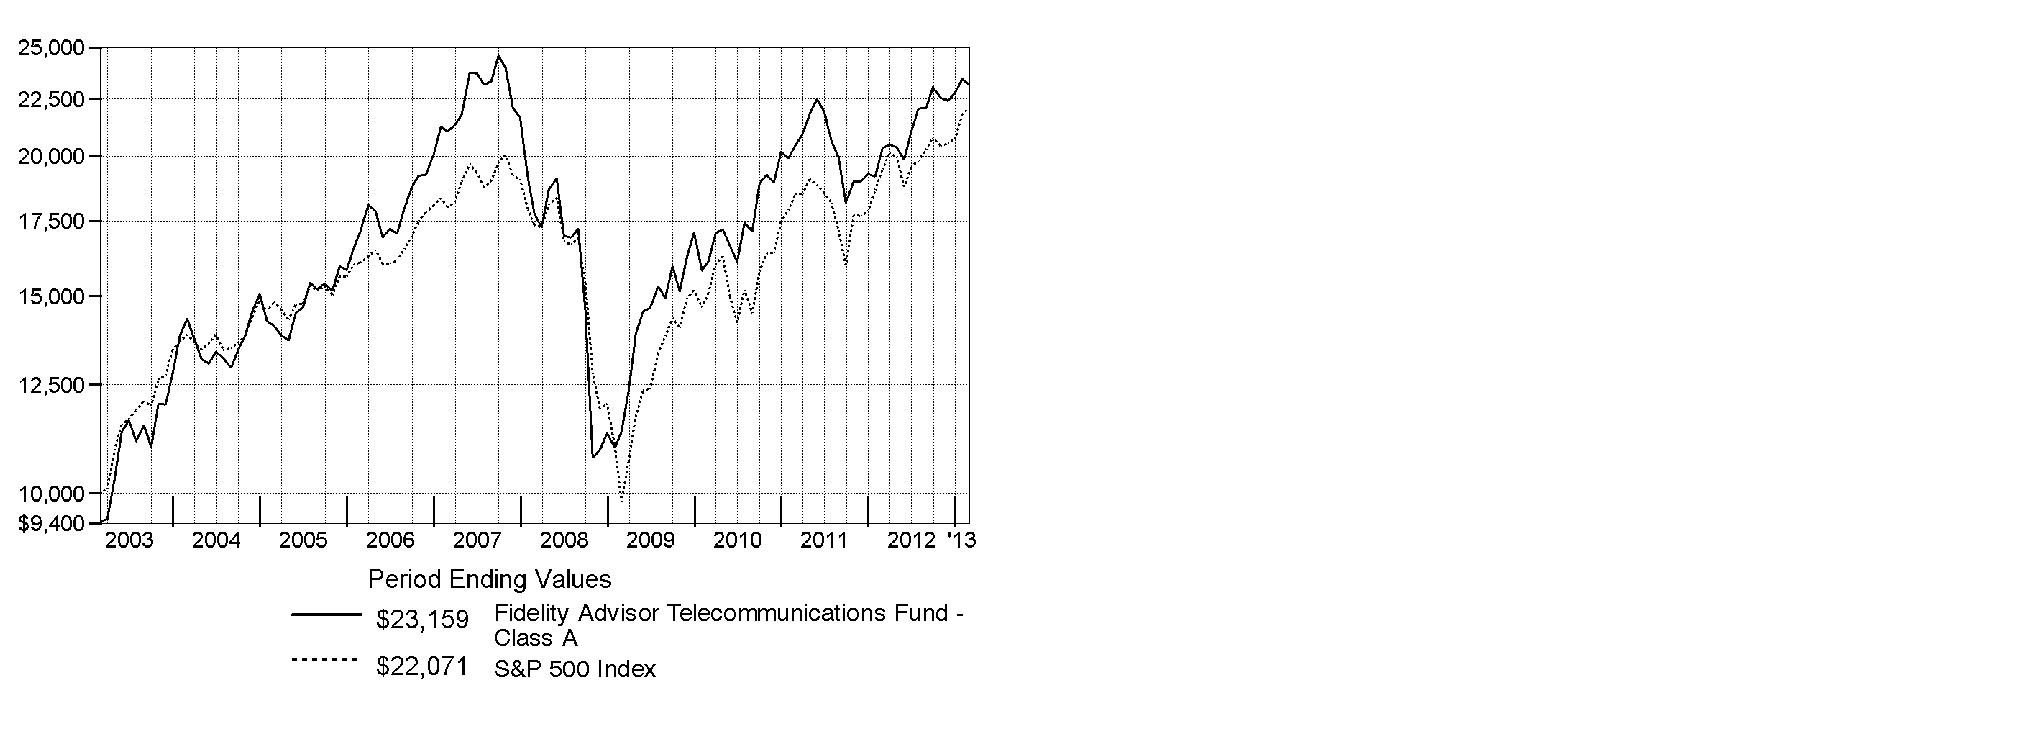
Annual Report
Fidelity Advisor Telecommunications Fund
Management's Discussion of Fund Performance
Market Recap: U.S. stocks posted solid gains for the year ending February 28, 2013, sparked by a late-period rally that pushed major equity benchmarks to multiyear highs. Improvement in the global economy and more monetary stimulus from the U.S. Federal Reserve kept markets on the upswing for much of the year, shrugging off an early decline brought on by debt woes in Europe, and another dip later in the period amid Congressional gridlock on the federal budget. Renewed optimism over employment, the housing market, corporate earnings and record dividends made stocks a favorite with investors during the 12 months, which helped push the broad-based S&P 500® Index across the milestone 1,500 mark at the end of January. The S&P 500® finished the period up 13.46%. Seven of the 10 major market sectors tracked by MSCI U.S. IMI 25-50 classifications produced double-digit gains, led by health care and financials, while information technology, energy and materials trailed the broad equity market with only modest advances.
Comments from Matthew Drukker, who became Portfolio Manager of Fidelity Advisor® Telecommunications Fund on January 22, 2013: For the year, the fund's Class A, Class T, Class B and Class C shares advanced 13.97%, 13.61%, 13.11% and 13.14%, respectively (excluding sales charges), trailing the 15.35% result of the MSCI® U.S. IMI Telecommunications Services 25-50 Index, but straddling the S&P 500®. The market experienced some turbulent swings this period, and investors generally favored large integrated telecom stocks because of their high dividend yields and more-defensive characteristics. Not surprisingly, a significant driver of the fund's and index's solid absolute returns was their heavy exposure - 55% and 63% average weightings, respectively - to the group. That said, the fund did give up some ground to the MSCI index during the period due to forced underweightings - stemming from diversification rules imposed under the Internal Revenue Code - in telecom giants Verizon Communications and AT&T, which together comprised about 45% of the sector benchmark. Verizon, the fund's biggest relative detractor, and AT&T performed quite well over the one-year stretch, each boasting a double-digit return. Alaskan telecom provider General Communications was another miss. The fund owned a larger-than-benchmark stake in the stock, as the prior manager believed this company would grow faster than many of its U.S. integrated telecom counterparts. Unfortunately, stocks of companies with exposure to Alaska were often influenced by temperamental oil prices. Overweighting integrated telecom CenturyLink weighed on performance, particularly when the stock plunged late in the period after the company reported weak fourth-quarter results, cut its quarterly dividend and issued mixed guidance. Elsewhere, wireless broadband mobile services provider MetroPCS Communications lagged the sector benchmark early on and the fund's slightly overweighted position at that time hurt performance. Conversely, the fund tended to steer clear of small-cap integrated telecom companies with subscale operations and declining revenues, which was the right call during the year, as largely avoiding benchmark components that fit these criteria - such as Elephant Talk Communications, Lumos Networks and Alaska Communications Systems Group, and underweighting Windstream - were among the fund's biggest contributors. Elephant Talk provides software and services to telecom companies across the globe. Its exposure to the hard-hit eurozone, along with disappointing financial results, caused shares to plummet. Avoiding Lumos Networks, a fiber-based network services provider operating in the Mid-Atlantic region, and underweighting integrated telecom firm Windstream was beneficial, as shares of both index components tumbled on poor financial results. Lastly, Alaska Communications was hurt by its exposure to this state, as the price of oil - the state's primary source of revenue - was volatile during the period.
The views expressed above reflect those of the portfolio manager(s) only through the end of the period as stated on the cover of this report and do not necessarily represent the views of Fidelity or any other person in the Fidelity organization. Any such views are subject to change at any time based upon market or other conditions and Fidelity disclaims any responsibility to update such views. These views may not be relied on as investment advice and, because investment decisions for a Fidelity fund are based on numerous factors, may not be relied on as an indication of trading intent on behalf of any Fidelity fund.
Annual Report
Telecommunications Portfolio
Shareholder Expense Example
As a shareholder of the Fund, you incur two types of costs: (1) transaction costs, including sales charges (loads) on purchase payments or redemption proceeds, redemption fees and (2) ongoing costs, including management fees, distribution and/or service (12b-1) fees and other Fund expenses. This Example is intended to help you understand your ongoing costs (in dollars) of investing in the Fund and to compare these costs with the ongoing costs of investing in other mutual funds.
The Example is based on an investment of $1,000 invested at the beginning of the period and held for the entire period (September 1, 2012 to February 28, 2013).
Actual Expenses
The first line of the accompanying table for each class of the Fund provides information about actual account values and actual expenses. You may use the information in this line, together with the amount you invested, to estimate the expenses that you paid over the period. Simply divide your account value by $1,000.00 (for example, an $8,600 account value divided by $1,000.00 = 8.6), then multiply the result by the number in the first line for a class of the Fund under the heading entitled "Expenses Paid During Period" to estimate the expenses you paid on your account during this period. A small balance maintenance fee of $12.00 that is charged once a year may apply for certain accounts with a value of less than $2,000. This fee is not included in the table below. If it was, the estimate of expenses you paid during the period would be higher, and your ending account value lower, by this amount. In addition, the Fund, as a shareholder in the underlying Fidelity Central Funds, will indirectly bear its pro-rata share of the fees and expenses incurred by the underlying Fidelity Central Funds. These fees and expenses are not included in the Fund's annualized expense ratio used to calculate the expense estimate in the table below.
Hypothetical Example for Comparison Purposes
The second line of the accompanying table for each class of the Fund provides information about hypothetical account values and hypothetical expenses based on a Class' actual expense ratio and an assumed rate of return of 5% per year before expenses, which is not the Class' actual return. The hypothetical account values and expenses may not be used to estimate the actual ending account balance or expenses you paid for the period. You may use this information to compare the ongoing costs of investing in the Fund and other funds. To do so, compare this 5% hypothetical example with the 5% hypothetical examples that appear in the shareholder reports of the other funds. A small balance maintenance fee of $12.00 that is charged once a year may apply for certain accounts with a value of less than $2,000. This fee is not included in the table below. If it was, the estimate of expenses you paid during the period would be higher, and your ending account value lower, by this amount. In addition, the Fund, as a shareholder in the underlying Fidelity Central Funds, will indirectly bear its pro-rata share of the fees and expenses incurred by the underlying Fidelity Central Funds. These fees and expenses are not included in the Fund's annualized expense ratio used to calculate the expense estimate in the table below.
Please note that the expenses shown in the table are meant to highlight your ongoing costs only and do not reflect any transaction costs. Therefore, the second line of the table is useful in comparing ongoing costs only, and will not help you determine the relative total costs of owning different funds. In addition, if these transactional costs were included, your costs would have been higher.
|
|
Annualized |
Beginning |
Ending |
Expenses Paid |
|
Class A |
1.18% |
|
|
|
|
Actual |
|
$ 1,000.00 |
$ 1,049.00 |
$ 5.99 |
|
HypotheticalA |
|
$ 1,000.00 |
$ 1,018.94 |
$ 5.91 |
|
Class T |
1.47% |
|
|
|
|
Actual |
|
$ 1,000.00 |
$ 1,047.60 |
$ 7.46 |
|
HypotheticalA |
|
$ 1,000.00 |
$ 1,017.50 |
$ 7.35 |
|
Class B |
1.93% |
|
|
|
|
Actual |
|
$ 1,000.00 |
$ 1,045.20 |
$ 9.79 |
|
HypotheticalA |
|
$ 1,000.00 |
$ 1,015.22 |
$ 9.64 |
|
Class C |
1.90% |
|
|
|
|
Actual |
|
$ 1,000.00 |
$ 1,045.20 |
$ 9.63 |
|
HypotheticalA |
|
$ 1,000.00 |
$ 1,015.37 |
$ 9.49 |
|
Telecommunications |
.86% |
|
|
|
|
Actual |
|
$ 1,000.00 |
$ 1,050.80 |
$ 4.37 |
|
HypotheticalA |
|
$ 1,000.00 |
$ 1,020.53 |
$ 4.31 |
|
Institutional Class |
.82% |
|
|
|
|
Actual |
|
$ 1,000.00 |
$ 1,051.00 |
$ 4.17 |
|
HypotheticalA |
|
$ 1,000.00 |
$ 1,020.73 |
$ 4.11 |
A 5% return per year before expenses
* Expenses are equal to each Class' annualized expense ratio, multiplied by the average account value over the period, multiplied by 181/365 (to reflect the one-half year period).
Annual Report
Telecommunications Portfolio
Investment Changes (Unaudited)
|
Top Ten Stocks as of February 28, 2013 |
||
|
|
% of fund's |
% of fund's net assets |
|
Verizon Communications, Inc. |
25.3 |
18.1 |
|
American Tower Corp. |
7.1 |
0.0 |
|
AT&T, Inc. |
6.6 |
21.5 |
|
SBA Communications Corp. Class A |
5.6 |
5.0 |
|
CenturyLink, Inc. |
5.6 |
9.6 |
|
Vodafone Group PLC sponsored ADR |
4.4 |
3.3 |
|
Sprint Nextel Corp. |
3.9 |
5.1 |
|
Telephone & Data Systems, Inc. |
2.9 |
2.9 |
|
Clearwire Corp. Class A |
2.6 |
1.7 |
|
General Communications, Inc. Class A |
2.5 |
2.6 |
|
|
66.5 |
|
|
Top Industries (% of fund's net assets) |
|||
|
As of February 28, 2013 |
|||
|
Diversified Telecommunication Services |
56.9% |
|
|
Wireless Telecommunication Services |
28.0% |
|
|
Real Estate Investment Trusts |
7.1% |
|
|
Media |
2.1% |
|
|
Electronic Equipment & Components |
1.5% |
|
|
All Others* |
4.4% |
|

|
As of August 31, 2012 |
|||
|
Diversified Telecommunication Services |
67.3% |
|
|
Wireless Telecommunication Services |
27.5% |
|
|
Media |
1.7% |
|
|
Software |
0.2% |
|
 |
Communications Equipment |
0.0% |
|
|
All Others* |
3.3% |
|

|
* Includes short-term investments and net other assets. |
Annual Report
Telecommunications Portfolio
Investments February 28, 2013
Showing Percentage of Net Assets
|
Common Stocks - 97.6% |
|||
|
Shares |
Value |
||
|
COMMUNICATIONS EQUIPMENT - 0.4% |
|||
|
Communications Equipment - 0.4% |
|||
|
Symmetricom, Inc. (a) |
338,300 |
$ 1,671,202 |
|
|
COMPUTERS & PERIPHERALS - 0.3% |
|||
|
Computer Hardware - 0.3% |
|||
|
Apple, Inc. |
2,241 |
989,177 |
|
|
DIVERSIFIED TELECOMMUNICATION SERVICES - 56.9% |
|||
|
Alternative Carriers - 9.8% |
|||
|
Cogent Communications Group, Inc. |
378,402 |
9,516,810 |
|
|
inContact, Inc. (a) |
262,200 |
1,780,338 |
|
|
Iridium Communications, Inc. (a) |
16,600 |
101,426 |
|
|
Level 3 Communications, Inc. (a) |
479,895 |
9,588,302 |
|
|
Lumos Networks Corp. |
301,762 |
3,446,122 |
|
|
tw telecom, inc. (a) |
343,657 |
8,701,395 |
|
|
Vonage Holdings Corp. (a) |
2,186,000 |
5,771,040 |
|
|
|
38,905,433 |
||
|
Integrated Telecommunication Services - 47.1% |
|||
|
AT&T, Inc. |
721,319 |
25,902,565 |
|
|
Atlantic Tele-Network, Inc. |
137,400 |
6,457,800 |
|
|
CenturyLink, Inc. |
642,484 |
22,274,920 |
|
|
Cincinnati Bell, Inc. (a) |
808,400 |
2,627,300 |
|
|
Consolidated Communications Holdings, Inc. |
53,298 |
895,406 |
|
|
Elephant Talk Communication, Inc. (a)(d) |
326,540 |
391,848 |
|
|
Frontier Communications Corp. (d) |
2,098,500 |
8,687,790 |
|
|
General Communications, Inc. Class A (a) |
1,160,061 |
9,802,515 |
|
|
IDT Corp. Class B |
51,100 |
516,621 |
|
|
Koninklijke KPN NV (d) |
461,212 |
1,573,982 |
|
|
Telecom Italia SpA |
1,147,800 |
844,086 |
|
|
Telefonica Brasil SA sponsored ADR |
236,963 |
6,246,345 |
|
|
Verizon Communications, Inc. |
2,155,147 |
100,278,991 |
|
|
Windstream Corp. |
182 |
1,563 |
|
|
|
186,501,732 |
||
|
TOTAL DIVERSIFIED TELECOMMUNICATION SERVICES |
225,407,165 |
||
|
ELECTRONIC EQUIPMENT & COMPONENTS - 1.5% |
|||
|
Electronic Manufacturing Services - 1.5% |
|||
|
Flextronics International Ltd. (a) |
899,300 |
5,980,345 |
|
|
INTERNET SOFTWARE & SERVICES - 0.1% |
|||
|
Internet Software & Services - 0.1% |
|||
|
Velti PLC (a) |
145,900 |
536,912 |
|
|
MEDIA - 2.1% |
|||
|
Cable & Satellite - 2.1% |
|||
|
Cablevision Systems Corp. - NY Group Class A |
54,425 |
761,406 |
|
|
Comcast Corp. Class A |
65,700 |
2,614,203 |
|
|
|
|||
|
Shares |
Value |
||
|
Liberty Global, Inc. Class A (a) |
42,318 |
$ 2,915,287 |
|
|
Time Warner Cable, Inc. |
22,881 |
1,976,690 |
|
|
|
8,267,586 |
||
|
REAL ESTATE INVESTMENT TRUSTS - 7.1% |
|||
|
Specialized REITs - 7.1% |
|||
|
American Tower Corp. |
362,800 |
28,153,280 |
|
|
SEMICONDUCTORS & SEMICONDUCTOR EQUIPMENT - 0.8% |
|||
|
Semiconductors - 0.8% |
|||
|
Broadcom Corp. Class A |
94,031 |
3,207,397 |
|
|
SOFTWARE - 0.4% |
|||
|
Application Software - 0.4% |
|||
|
Synchronoss Technologies, Inc. (a) |
45,603 |
1,375,843 |
|
|
WIRELESS TELECOMMUNICATION SERVICES - 28.0% |
|||
|
Wireless Telecommunication Services - 28.0% |
|||
|
America Movil S.A.B. de CV Series L sponsored ADR |
197,000 |
4,115,330 |
|
|
Boingo Wireless, Inc. (a) |
262,815 |
1,597,915 |
|
|
Clearwire Corp. Class A (a) |
3,309,836 |
10,326,688 |
|
|
Crown Castle International Corp. (a) |
102,183 |
7,132,373 |
|
|
Leap Wireless International, Inc. (a)(d) |
89,900 |
480,965 |
|
|
MetroPCS Communications, Inc. (a) |
877,806 |
8,602,499 |
|
|
Millicom International Cellular SA (depository receipt) |
11,000 |
863,175 |
|
|
Mobile TeleSystems OJSC sponsored ADR |
114,694 |
2,373,019 |
|
|
NII Holdings, Inc. (a) |
492,400 |
2,373,368 |
|
|
NTELOS Holdings Corp. |
15,706 |
196,011 |
|
|
NTT DoCoMo, Inc. |
1,327 |
2,051,525 |
|
|
SBA Communications Corp. Class A (a) |
313,556 |
22,300,103 |
|
|
Sprint Nextel Corp. (a) |
2,668,950 |
15,479,910 |
|
|
Telephone & Data Systems, Inc. |
506,600 |
11,596,074 |
|
|
TIM Participacoes SA |
229,200 |
1,001,607 |
|
|
U.S. Cellular Corp. (a) |
79,700 |
2,932,163 |
|
|
Vodafone Group PLC sponsored ADR |
696,300 |
17,504,982 |
|
|
|
110,927,707 |
||
|
TOTAL COMMON STOCKS (Cost $399,839,378) |
|
||
|
Money Market Funds - 5.2% |
|||
|
Shares |
Value |
||
|
Fidelity Cash Central Fund, 0.16% (b) |
12,575,761 |
$ 12,575,761 |
|
|
Fidelity Securities Lending Cash Central Fund, 0.16% (b)(c) |
8,239,903 |
8,239,903 |
|
|
TOTAL MONEY MARKET FUNDS (Cost $20,815,664) |
|
||
|
TOTAL INVESTMENT PORTFOLIO - 102.8% (Cost $420,655,042) |
407,332,278 |
||
|
NET OTHER ASSETS (LIABILITIES) - (2.8)% |
(11,234,417) |
||
|
NET ASSETS - 100% |
$ 396,097,861 |
||
|
Legend |
|
(a) Non-income producing |
|
(b) Affiliated fund that is generally available only to investment companies and other accounts managed by Fidelity Investments. The rate quoted is the annualized seven-day yield of the fund at period end. A complete unaudited listing of the fund's holdings as of its most recent quarter end is available upon request. In addition, each Fidelity Central Fund's financial statements, which are not covered by the Fund's Report of Independent Registered Public Accounting Firm, are available on the SEC's website or upon request. |
|
(c) Investment made with cash collateral received from securities on loan. |
|
(d) Security or a portion of the security is on loan at period end. |
|
Affiliated Central Funds |
|
Information regarding fiscal year to date income earned by the Fund from investments in Fidelity Central Funds is as follows: |
|
Fund |
Income earned |
|
Fidelity Cash Central Fund |
$ 29,115 |
|
Fidelity Securities Lending Cash Central Fund |
316,632 |
|
Total |
$ 345,747 |
|
Other Information |
|
The following is a summary of the inputs used, as of February 28, 2013, involving the Fund's assets and liabilities carried at fair value. The inputs or methodology used for valuing securities may not be an indication of the risk associated with investing in those securities. For more information on valuation inputs, and their aggregation into the levels used in the table below, please refer to the Investment Valuation section in the accompanying Notes to Financial Statements. |
|
Valuation Inputs at Reporting Date: |
||||
|
Description |
Total |
Level 1 |
Level 2 |
Level 3 |
|
Investments in Securities: |
||||
|
Common Stocks |
$ 386,516,614 |
$ 383,621,003 |
$ 2,895,611 |
$ - |
|
Money Market Funds |
20,815,664 |
20,815,664 |
- |
- |
|
Total Investments in Securities: |
$ 407,332,278 |
$ 404,436,667 |
$ 2,895,611 |
$ - |
|
Distribution of investments by country or territory of incorporation, as a percentage of total net assets, is as follows. (Unaudited) |
|
United States of America |
89.2% |
|
United Kingdom |
4.4% |
|
Brazil |
1.9% |
|
Singapore |
1.5% |
|
Mexico |
1.0% |
|
Others (Individually Less Than 1%) |
2.0% |
|
|
100.0% |
See accompanying notes which are an integral part of the financial statements.
Annual Report
Telecommunications Portfolio
Financial Statements
Statement of Assets and Liabilities
|
|
February 28, 2013 |
|
|
|
|
|
|
Assets |
|
|
|
Investment in securities, at value (including securities loaned of $7,933,343) - See accompanying schedule: Unaffiliated issuers (cost $399,839,378) |
$ 386,516,614 |
|
|
Fidelity Central Funds (cost $20,815,664) |
20,815,664 |
|
|
Total Investments (cost $420,655,042) |
|
$ 407,332,278 |
|
Receivable for investments sold |
|
6,938,541 |
|
Receivable for fund shares sold |
|
140,517 |
|
Dividends receivable |
|
66,205 |
|
Distributions receivable from Fidelity Central Funds |
|
22,752 |
|
Prepaid expenses |
|
874 |
|
Receivable from investment adviser for expense reductions |
|
350 |
|
Other receivables |
|
24,377 |
|
Total assets |
|
414,525,894 |
|
|
|
|
|
Liabilities |
|
|
|
Payable for investments purchased |
$ 9,698,693 |
|
|
Payable for fund shares redeemed |
173,973 |
|
|
Accrued management fee |
185,668 |
|
|
Distribution and service plan fees payable |
7,161 |
|
|
Other affiliated payables |
88,075 |
|
|
Other payables and accrued expenses |
34,560 |
|
|
Collateral on securities loaned, at value |
8,239,903 |
|
|
Total liabilities |
|
18,428,033 |
|
|
|
|
|
Net Assets |
|
$ 396,097,861 |
|
Net Assets consist of: |
|
|
|
Paid in capital |
|
$ 421,537,330 |
|
Undistributed net investment income |
|
1,584,319 |
|
Accumulated undistributed net realized gain (loss) on investments and foreign currency transactions |
|
(13,698,894) |
|
Net unrealized appreciation (depreciation) on investments and assets and liabilities in foreign currencies |
|
(13,324,894) |
|
Net Assets |
|
$ 396,097,861 |
Statement of Assets and Liabilities - continued
|
|
February 28, 2013 |
|
|
|
|
|
|
Calculation of Maximum Offering Price Class A: |
|
$ 51.58 |
|
|
|
|
|
Maximum offering price per share (100/94.25 of $51.58) |
|
$ 54.73 |
|
Class T: |
|
$ 51.41 |
|
|
|
|
|
Maximum offering price per share (100/96.50 of $51.41) |
|
$ 53.27 |
|
Class B: |
|
$ 51.63 |
|
|
|
|
|
Class C: |
|
$ 51.47 |
|
|
|
|
|
Telecommunications: |
|
$ 51.75 |
|
|
|
|
|
Institutional Class: |
|
$ 51.65 |
A Redemption price per share is equal to net asset value less any applicable contingent deferred sales charge.
See accompanying notes which are an integral part of the financial statements.
Annual Report
Telecommunications Portfolio
Financial Statements - continued
Statement of Operations
|
|
Year ended February 28, 2013 |
|
|
|
|
|
|
Investment Income |
|
|
|
Dividends |
|
$ 12,424,007 |
|
Interest |
|
72 |
|
Income from Fidelity Central Funds |
|
345,747 |
|
Total income |
|
12,769,826 |
|
|
|
|
|
Expenses |
|
|
|
Management fee |
$ 2,234,749 |
|
|
Transfer agent fees |
947,758 |
|
|
Distribution and service plan fees |
77,446 |
|
|
Accounting and security lending fees |
159,773 |
|
|
Custodian fees and expenses |
10,570 |
|
|
Independent trustees' compensation |
2,693 |
|
|
Registration fees |
79,762 |
|
|
Audit |
50,173 |
|
|
Legal |
2,845 |
|
|
Miscellaneous |
3,614 |
|
|
Total expenses before reductions |
3,569,383 |
|
|
Expense reductions |
(61,113) |
3,508,270 |
|
Net investment income (loss) |
|
9,261,556 |
|
Realized and Unrealized Gain (Loss) Net realized gain (loss) on: |
|
|
|
Investment securities: |
|
|
|
Unaffiliated issuers |
44,363,660 |
|
|
Foreign currency transactions |
(6,576) |
|
|
Total net realized gain (loss) |
|
44,357,084 |
|
Change in net unrealized appreciation (depreciation) on: Investment securities |
3,166,454 |
|
|
Assets and liabilities in foreign currencies |
(713) |
|
|
Total change in net unrealized appreciation (depreciation) |
|
3,165,741 |
|
Net gain (loss) |
|
47,522,825 |
|
Net increase (decrease) in net assets resulting from operations |
|
$ 56,784,381 |
Statement of Changes in Net Assets
|
|
Year ended |
Year ended |
|
Increase (Decrease) in Net Assets |
|
|
|
Operations |
|
|
|
Net investment income (loss) |
$ 9,261,556 |
$ 5,541,550 |
|
Net realized gain (loss) |
44,357,084 |
24,725,843 |
|
Change in net unrealized appreciation (depreciation) |
3,165,741 |
(35,725,245) |
|
Net increase (decrease) in net assets resulting from operations |
56,784,381 |
(5,457,852) |
|
Distributions to shareholders from net investment income |
(8,401,078) |
(4,955,219) |
|
Share transactions - net increase (decrease) |
(7,060,825) |
(2,457,615) |
|
Redemption fees |
3,280 |
35,055 |
|
Total increase (decrease) in net assets |
41,325,758 |
(12,835,631) |
|
|
|
|
|
Net Assets |
|
|
|
Beginning of period |
354,772,103 |
367,607,734 |
|
End of period (including undistributed net investment income of $1,584,319 and undistributed net investment income of $730,417, respectively) |
$ 396,097,861 |
$ 354,772,103 |
See accompanying notes which are an integral part of the financial statements.
Annual Report
Financial Highlights - Class A
|
Years ended February 28, |
2013 |
2012 H |
2011 |
2010 |
2009 |
|
Selected Per-Share Data |
|
|
|
|
|
|
Net asset value, beginning of period |
$ 46.12 |
$ 46.93 |
$ 37.64 |
$ 26.66 |
$ 42.56 |
|
Income from Investment Operations |
|
|
|
|
|
|
Net investment income (loss) C |
.99 |
.56 |
.57 |
.67 |
.22 |
|
Net realized and unrealized gain (loss) |
5.43 |
(.86) |
9.49 |
10.55 |
(15.60) |
|
Total from investment operations |
6.42 |
(.30) |
10.06 |
11.22 |
(15.38) |
|
Distributions from net investment income |
(.96) |
(.51) |
(.77) |
(.19) |
(.35) F |
|
Distributions from net realized gain |
- |
- |
- |
(.05) |
(.18) F |
|
Total distributions |
(.96) |
(.51) |
(.77) |
(.24) J |
(.52) K |
|
Redemption fees added to paid in capital C,I |
- |
- |
- |
- |
- |
|
Net asset value, end of period |
$ 51.58 |
$ 46.12 |
$ 46.93 |
$ 37.64 |
$ 26.66 |
|
Total Return A, B |
13.97% |
(.54)% |
26.87% |
42.07% |
(36.16)% |
|
Ratios to Average Net Assets D, G |
|
|
|
|
|
|
Expenses before reductions |
1.18% |
1.20% |
1.20% |
1.26% |
1.21% |
|
Expenses net of fee waivers, if any |
1.18% |
1.20% |
1.20% |
1.26% |
1.21% |
|
Expenses net of all reductions |
1.17% |
1.18% |
1.18% |
1.24% |
1.21% |
|
Net investment income (loss) |
2.01% |
1.21% |
1.35% |
1.89% |
.61% |
|
Supplemental Data |
|
|
|
|
|
|
Net assets, end of period (000 omitted) |
$ 6,449 |
$ 4,677 |
$ 4,305 |
$ 3,343 |
$ 2,112 |
|
Portfolio turnover rate E |
76% |
72% |
72% |
90% |
168% |
|
A Total returns would have been lower if certain expenses had not been reduced during the applicable periods shown. B Total returns do not include the effect of the sales charges. C Calculated based on average shares outstanding during the period. D Fees and expenses of any underlying Fidelity Central Funds are not included in the Fund's expense ratio. The Fund indirectly bears its proportionate share of the expenses of any underlying Fidelity Central Funds. E Amount does not include the portfolio activity of any underlying Fidelity Central Funds. F The amounts shown reflect certain reclassifications related to book to tax differences that were made in the year shown. G Expense ratios reflect operating expenses of the class. Expenses before reductions do not reflect amounts reimbursed by the investment adviser or reductions from brokerage service arrangements or reductions from other expense offset arrangements and do not represent the amount paid by the class during periods when reimbursements or reductions occur. Expenses net of fee waivers reflect expenses after reimbursement by the investment adviser but prior to reductions from brokerage service arrangements or other expense offset arrangements. Expenses net of all reductions represent the net expenses paid by the class. H For the year ended February 29. I Amount represents less than $.01 per share. J Total distributions of $.24 per share is comprised of distributions from net investment income of $.187 and distributions from net realized gain of $.048 per share. K Total distributions of $.52 per share is comprised of distributions from net investment income of $.347 and distributions from net realized gain of $.175 per share. |
Financial Highlights - Class T
|
Years ended February 28, |
2013 |
2012 H |
2011 |
2010 |
2009 |
|
Selected Per-Share Data |
|
|
|
|
|
|
Net asset value, beginning of period |
$ 46.01 |
$ 46.81 |
$ 37.55 |
$ 26.68 |
$ 42.49 |
|
Income from Investment Operations |
|
|
|
|
|
|
Net investment income (loss) C |
.85 |
.42 |
.45 |
.57 |
.12 |
|
Net realized and unrealized gain (loss) |
5.39 |
(.84) |
9.47 |
10.54 |
(15.56) |
|
Total from investment operations |
6.24 |
(.42) |
9.92 |
11.11 |
(15.44) |
|
Distributions from net investment income |
(.84) |
(.38) |
(.66) |
(.22) |
(.24) F |
|
Distributions from net realized gain |
- |
- |
- |
(.03) |
(.13) F |
|
Total distributions |
(.84) |
(.38) |
(.66) |
(.24) J |
(.37) K |
|
Redemption fees added to paid in capital C,I |
- |
- |
- |
- |
- |
|
Net asset value, end of period |
$ 51.41 |
$ 46.01 |
$ 46.81 |
$ 37.55 |
$ 26.68 |
|
Total Return A, B |
13.61% |
(.82)% |
26.54% |
41.64% |
(36.34)% |
|
Ratios to Average Net Assets D, G |
|
|
|
|
|
|
Expenses before reductions |
1.48% |
1.49% |
1.48% |
1.55% |
1.49% |
|
Expenses net of fee waivers, if any |
1.48% |
1.49% |
1.48% |
1.55% |
1.49% |
|
Expenses net of all reductions |
1.46% |
1.47% |
1.46% |
1.53% |
1.48% |
|
Net investment income (loss) |
1.72% |
.92% |
1.06% |
1.60% |
.33% |
|
Supplemental Data |
|
|
|
|
|
|
Net assets, end of period (000 omitted) |
$ 4,237 |
$ 2,702 |
$ 2,882 |
$ 2,051 |
$ 620 |
|
Portfolio turnover rate E |
76% |
72% |
72% |
90% |
168% |
|
A Total returns would have been lower if certain expenses had not been reduced during the applicable periods shown. B Total returns do not include the effect of the sales charges. C Calculated based on average shares outstanding during the period. D Fees and expenses of any underlying Fidelity Central Funds are not included in the Fund's expense ratio. The Fund indirectly bears its proportionate share of the expenses of any underlying Fidelity Central Funds. E Amount does not include the portfolio activity of any underlying Fidelity Central Funds. F The amounts shown reflect certain reclassifications related to book to tax differences that were made in the year shown. G Expense ratios reflect operating expenses of the class. Expenses before reductions do not reflect amounts reimbursed by the investment adviser or reductions from brokerage service arrangements or reductions from other expense offset arrangements and do not represent the amount paid by the class during periods when reimbursements or reductions occur. Expenses net of fee waivers reflect expenses after reimbursement by the investment adviser but prior to reductions from brokerage service arrangements or other expense offset arrangements. Expenses net of all reductions represent the net expenses paid by the class. H For the year ended February 29. I Amount represents less than $.01 per share. J Total distributions of $.24 per share is comprised of distributions from net investment income of $.216 and distributions from net realized gain of $.028 per share. K Total distributions of $.37 per share is comprised of distributions from net investment income of $.244 and distributions from net realized gain of $.127 per share. |
See accompanying notes which are an integral part of the financial statements.
Annual Report
Financial Highlights - Class B
|
Years ended February 28, |
2013 |
2012 H |
2011 |
2010 |
2009 |
|
Selected Per-Share Data |
|
|
|
|
|
|
Net asset value, beginning of period |
$ 46.14 |
$ 46.93 |
$ 37.60 |
$ 26.71 |
$ 42.42 |
|
Income from Investment Operations |
|
|
|
|
|
|
Net investment income (loss) C |
.62 |
.21 |
.25 |
.40 |
(.05) |
|
Net realized and unrealized gain (loss) |
5.42 |
(.83) |
9.48 |
10.54 |
(15.49) |
|
Total from investment operations |
6.04 |
(.62) |
9.73 |
10.94 |
(15.54) |
|
Distributions from net investment income |
(.55) |
(.17) |
(.40) |
(.04) |
(.11) F |
|
Distributions from net realized gain |
- |
- |
- |
(.01) |
(.06) F |
|
Total distributions |
(.55) |
(.17) |
(.40) |
(.05) J |
(.17) K |
|
Redemption fees added to paid in capital C,I |
- |
- |
- |
- |
- |
|
Net asset value, end of period |
$ 51.63 |
$ 46.14 |
$ 46.93 |
$ 37.60 |
$ 26.71 |
|
Total Return A, B |
13.11% |
(1.29)% |
25.96% |
40.97% |
(36.64)% |
|
Ratios to Average Net Assets D, G |
|
|
|
|
|
|
Expenses before reductions |
1.93% |
1.95% |
1.95% |
2.01% |
1.97% |
|
Expenses net of fee waivers, if any |
1.93% |
1.95% |
1.95% |
2.01% |
1.97% |
|
Expenses net of all reductions |
1.92% |
1.93% |
1.93% |
2.00% |
1.96% |
|
Net investment income (loss) |
1.26% |
.47% |
.60% |
1.13% |
(.15)% |
|
Supplemental Data |
|
|
|
|
|
|
Net assets, end of period (000 omitted) |
$ 576 |
$ 596 |
$ 706 |
$ 641 |
$ 363 |
|
Portfolio turnover rate E |
76% |
72% |
72% |
90% |
168% |
|
A Total returns would have been lower if certain expenses had not been reduced during the applicable periods shown. B Total returns do not include the effect of the contingent deferred sales charge. C Calculated based on average shares outstanding during the period. D Fees and expenses of any underlying Fidelity Central Funds are not included in the Fund's expense ratio. The Fund indirectly bears its proportionate share of the expenses of any underlying Fidelity Central Funds. E Amount does not include the portfolio activity of any underlying Fidelity Central Funds. F The amounts shown reflect certain reclassifications related to book to tax differences that were made in the year shown. G Expense ratios reflect operating expenses of the class. Expenses before reductions do not reflect amounts reimbursed by the investment adviser or reductions from brokerage service arrangements or reductions from other expense offset arrangements and do not represent the amount paid by the class during periods when reimbursements or reductions occur. Expenses net of fee waivers reflect expenses after reimbursement by the investment adviser but prior to reductions from brokerage service arrangements or other expense offset arrangements. Expenses net of all reductions represent the net expenses paid by the class. H For the year ended February 29. I Amount represents less than $.01 per share. J Total distributions of $.05 per share is comprised of distributions from net investment income of $.044 and distributions from net realized gain of $.009 per share. K Total distributions of $.17 per share is comprised of distributions from net investment income of $.105 and distributions from net realized gain of $.063 per share. |
Financial Highlights - Class C
|
Years ended February 28, |
2013 |
2012 H |
2011 |
2010 |
2009 |
|
Selected Per-Share Data |
|
|
|
|
|
|
Net asset value, beginning of period |
$ 46.02 |
$ 46.89 |
$ 37.61 |
$ 26.76 |
$ 42.42 |
|
Income from Investment Operations |
|
|
|
|
|
|
Net investment income (loss) C |
.63 |
.22 |
.26 |
.41 |
(.05) |
|
Net realized and unrealized gain (loss) |
5.41 |
(.84) |
9.46 |
10.56 |
(15.50) |
|
Total from investment operations |
6.04 |
(.62) |
9.72 |
10.97 |
(15.55) |
|
Distributions from net investment income |
(.59) |
(.25) |
(.44) |
(.10) |
(.07) F |
|
Distributions from net realized gain |
- |
- |
- |
(.02) |
(.05) F |
|
Total distributions |
(.59) |
(.25) |
(.44) |
(.12) J |
(.11) K |
|
Redemption fees added to paid in capital C,I |
- |
- |
- |
- |
- |
|
Net asset value, end of period |
$ 51.47 |
$ 46.02 |
$ 46.89 |
$ 37.61 |
$ 26.76 |
|
Total Return A, B |
13.14% |
(1.27)% |
25.95% |
41.00% |
(36.64)% |
|
Ratios to Average Net Assets D, G |
|
|
|
|
|
|
Expenses before reductions |
1.90% |
1.93% |
1.94% |
2.01% |
1.97% |
|
Expenses net of fee waivers, if any |
1.90% |
1.93% |
1.94% |
2.01% |
1.97% |
|
Expenses net of all reductions |
1.89% |
1.91% |
1.92% |
2.00% |
1.96% |
|
Net investment income (loss) |
1.29% |
.48% |
.61% |
1.13% |
(.14)% |
|
Supplemental Data |
|
|
|
|
|
|
Net assets, end of period (000 omitted) |
$ 4,353 |
$ 3,514 |
$ 3,035 |
$ 2,151 |
$ 371 |
|
Portfolio turnover rate E |
76% |
72% |
72% |
90% |
168% |
|
A Total returns would have been lower if certain expenses had not been reduced during the applicable periods shown. B Total returns do not include the effect of the contingent deferred sales charge. C Calculated based on average shares outstanding during the period. D Fees and expenses of any underlying Fidelity Central Funds are not included in the Fund's expense ratio. The Fund indirectly bears its proportionate share of the expenses of any underlying Fidelity Central Funds. E Amount does not include the portfolio activity of any underlying Fidelity Central Funds. F The amounts shown reflect certain reclassifications related to book to tax differences that were made in the year shown. G Expense ratios reflect operating expenses of the class. Expenses before reductions do not reflect amounts reimbursed by the investment adviser or reductions from brokerage service arrangements or reductions from other expense offset arrangements and do not represent the amount paid by the class during periods when reimbursements or reductions occur. Expenses net of fee waivers reflect expenses after reimbursement by the investment adviser but prior to reductions from brokerage service arrangements or other expense offset arrangements. Expenses net of all reductions represent the net expenses paid by the class. H For the year ended February 29. I Amount represents less than $.01 per share. J Total distributions of $.12 per share is comprised of distributions from net investment income of $.098 and distributions from net realized gain of $.023 per share. K Total distributions of $.11 per share is comprised of distributions from net investment income of $.068 and distributions from net realized gain of $.046 per share. |
See accompanying notes which are an integral part of the financial statements.
Annual Report
Financial Highlights - Telecommunications
|
Years ended February 28, |
2013 |
2012 G |
2011 |
2010 |
2009 |
|
Selected Per-Share Data |
|
|
|
|
|
|
Net asset value, beginning of period |
$ 46.26 |
$ 47.07 |
$ 37.73 |
$ 26.74 |
$ 42.70 |
|
Income from Investment Operations |
|
|
|
|
|
|
Net investment income (loss) B |
1.15 |
.70 |
.69 |
.76 |
.30 |
|
Net realized and unrealized gain (loss) |
5.43 |
(.86) |
9.52 |
10.59 |
(15.65) |
|
Total from investment operations |
6.58 |
(.16) |
10.21 |
11.35 |
(15.35) |
|
Distributions from net investment income |
(1.09) |
(.65) |
(.87) |
(.31) |
(.41) E |
|
Distributions from net realized gain |
- |
- |
- |
(.05) |
(.20) E |
|
Total distributions |
(1.09) |
(.65) |
(.87) |
(.36) I |
(.61) J |
|
Redemption fees added to paid in capital B, H |
- |
- |
- |
- |
- |
|
Net asset value, end of period |
$ 51.75 |
$ 46.26 |
$ 47.07 |
$ 37.73 |
$ 26.74 |
|
Total Return A |
14.30% |
(.23)% |
27.24% |
42.43% |
(36.00)% |
|
Ratios to Average Net Assets C, F |
|
|
|
|
|
|
Expenses before reductions |
.87% |
.90% |
.92% |
.99% |
.97% |
|
Expenses net of fee waivers, if any |
.87% |
.90% |
.92% |
.99% |
.97% |
|
Expenses net of all reductions |
.85% |
.88% |
.91% |
.98% |
.96% |
|
Net investment income (loss) |
2.33% |
1.52% |
1.62% |
2.15% |
.85% |
|
Supplemental Data |
|
|
|
|
|
|
Net assets, end of period (000 omitted) |
$ 377,841 |
$ 342,262 |
$ 354,938 |
$ 279,704 |
$ 196,231 |
|
Portfolio turnover rate D |
76% |
72% |
72% |
90% |
168% |
|
A Total returns would have been lower if certain expenses had not been reduced during the applicable periods shown. B Calculated based on average shares outstanding during the period. C Fees and expenses of any underlying Fidelity Central Funds are not included in the Fund's expense ratio. The Fund indirectly bears its proportionate share of the expenses of any underlying Fidelity Central Funds. D Amount does not include the portfolio activity of any underlying Fidelity Central Funds. E The amounts shown reflect certain reclassifications related to book to tax differences that were made in the year shown. F Expense ratios reflect operating expenses of the class. Expenses before reductions do not reflect amounts reimbursed by the investment adviser or reductions from brokerage service arrangements or reductions from other expense offset arrangements and do not represent the amount paid by the class during periods when reimbursements or reductions occur. Expenses net of fee waivers reflect expenses after reimbursement by the investment adviser but prior to reductions from brokerage service arrangements or other expense offset arrangements. Expenses net of all reductions represent the net expenses paid by the class. G For the year ended February 29. H Amount represents less than $.01 per share. I Total distributions of $.36 per share is comprised of distributions from net investment income of $.310 and distributions from net realized gain of $.048 per share. J Total distributions of $.61 per share is comprised of distributions from net investment income of $.408 and distributions from net realized gain of $.202 per share. |
Financial Highlights - Institutional Class
|
Years ended February 28, |
2013 |
2012 G |
2011 |
2010 |
2009 |
|
Selected Per-Share Data |
|
|
|
|
|
|
Net asset value, beginning of period |
$ 46.20 |
$ 47.02 |
$ 37.69 |
$ 26.73 |
$ 42.65 |
|
Income from Investment Operations |
|
|
|
|
|
|
Net investment income (loss) B |
1.17 |
.70 |
.71 |
.84 |
.34 |
|
Net realized and unrealized gain (loss) |
5.42 |
(.88) |
9.50 |
10.55 |
(15.67) |
|
Total from investment operations |
6.59 |
(.18) |
10.21 |
11.39 |
(15.33) |
|
Distributions from net investment income |
(1.14) |
(.64) |
(.88) |
(.38) |
(.40) E |
|
Distributions from net realized gain |
- |
- |
- |
(.05) |
(.20) E |
|
Total distributions |
(1.14) |
(.64) |
(.88) |
(.43) I |
(.59) J |
|
Redemption fees added to paid in capital B, H |
- |
- |
- |
- |
- |
|
Net asset value, end of period |
$ 51.65 |
$ 46.20 |
$ 47.02 |
$ 37.69 |
$ 26.73 |
|
Total Return A |
14.33% |
(.26)% |
27.27% |
42.59% |
(35.99)% |
|
Ratios to Average Net Assets C, F |
|
|
|
|
|
|
Expenses before reductions |
.85% |
.89% |
.91% |
.86% |
.91% |
|
Expenses net of fee waivers, if any |
.85% |
.89% |
.91% |
.86% |
.91% |
|
Expenses net of all reductions |
.83% |
.87% |
.89% |
.84% |
.90% |
|
Net investment income (loss) |
2.35% |
1.52% |
1.64% |
2.29% |
.91% |
|
Supplemental Data |
|
|
|
|
|
|
Net assets, end of period (000 omitted) |
$ 2,641 |
$ 1,022 |
$ 1,743 |
$ 1,101 |
$ 68 |
|
Portfolio turnover rate D |
76% |
72% |
72% |
90% |
168% |
|
A Total returns would have been lower if certain expenses had not been reduced during the applicable periods shown. B Calculated based on average shares outstanding during the period. C Fees and expenses of any underlying Fidelity Central Funds are not included in the Fund's expense ratio. The Fund indirectly bears its proportionate share of the expenses of any underlying Fidelity Central Funds. D Amount does not include the portfolio activity of any underlying Fidelity Central Funds. E The amounts shown reflect certain reclassifications related to book to tax differences that were made in the year shown. F Expense ratios reflect operating expenses of the class. Expenses before reductions do not reflect amounts reimbursed by the investment adviser or reductions from brokerage service arrangements or reductions from other expense offset arrangements and do not represent the amount paid by the class during periods when reimbursements or reductions occur. Expenses net of fee waivers reflect expenses after reimbursement by the investment adviser but prior to reductions from brokerage service arrangements or other expense offset arrangements. Expenses net of all reductions represent the net expenses paid by the class. G For the year ended February 29. H Amount represents less than $.01 per share. I Total distributions of $.43 per share is comprised of distributions from net investment income of $.379 and distributions from net realized gain of $.057 per share. J Total distributions of $.59 per share is comprised of distributions from net investment income of $.395 and distributions from net realized gain of $.197 per share. |
See accompanying notes which are an integral part of the financial statements.
Annual Report
Notes to Financial Statements
For the period ended February 28, 2013
1. Organization.
Telecommunications Portfolio (the Fund) is a non-diversified fund of Fidelity Select Portfolios (the Trust) and is authorized to issue an unlimited number of shares. The Trust is registered under the Investment Company Act of 1940, as amended (the 1940 Act), as an open-end management investment company organized as a Massachusetts business trust. The Fund invests primarily in securities of companies whose principal business activities fall within specific industries. The Fund offers Class A, Class T, Class C, Telecommunications and Institutional Class shares, each of which, along with Class B shares, has equal rights as to assets and voting privileges. Class B shares are closed to new accounts and additional purchases, except for exchanges and reinvestments. Each class has exclusive voting rights with respect to matters that affect that class. Class B shares will automatically convert to Class A shares after a holding period of seven years from the initial date of purchase. Investment income, realized and unrealized capital gains and losses, the common expenses of the Fund, and certain fund-level expense reductions, if any, are allocated on a pro-rata basis to each class based on the relative net assets of each class to the total net assets of the Fund. Each class differs with respect to transfer agent and distribution and service plan fees incurred. Certain expense reductions may also differ by class.
2. Investments in Fidelity Central Funds.
The Fund invests in Fidelity Central Funds, which are open-end investment companies available only to other investment companies and accounts managed by Fidelity Management & Research Company (FMR) and its affiliates. The Fund's Schedule of Investments lists each of the Fidelity Central Funds held as of period end, if any, as an investment of the Fund, but does not include the underlying holdings of each Fidelity Central Fund. As an Investing Fund, the Fund indirectly bears its proportionate share of the expenses of the underlying Fidelity Central Funds.
The Money Market Central Funds seek preservation of capital and current income and are managed by Fidelity Investments Money Management, Inc. (FIMM), an affiliate of FMR.
A complete unaudited list of holdings for each Fidelity Central Fund is available upon request or at the Securities and Exchange Commission (the SEC) website at www.sec.gov. In addition, the financial statements of the Fidelity Central Funds, which are not covered by the Fund's Report of Independent Registered Public Accounting Firm, are available on the SEC website or upon request.
3. Significant Accounting Policies.
The financial statements have been prepared in conformity with accounting principles generally accepted in the United States of America (GAAP), which require management to make certain estimates and assumptions at the date of the financial statements. Actual results could differ from those estimates. Subsequent events, if any, through the date that the financial statements were issued have been evaluated in the preparation of the financial statements. The following summarizes the significant accounting policies of the Fund:
Investment Valuation. Investments are valued as of 4:00 p.m. Eastern time on the last calendar day of the period. In accordance with valuation policies and procedures approved by the Board of Trustees (the Board), the Fund attempts to obtain prices from one or more third party pricing vendors or brokers to value its investments. When current market prices, quotations or currency exchange rates are not readily available or reliable, investments will be fair valued in good faith by the FMR Fair Value Committee (the Committee), in accordance with procedures adopted by the Fund's Board. Factors used in determining fair value vary by investment type and may include market or investment specific events. The frequency with which these procedures are used cannot be predicted and they may be utilized to a significant extent. The Committee oversees the Fund's valuation policies and procedures and is responsible for approving and reporting to the Board all fair value determinations.
The Fund categorizes the inputs to valuation techniques used to value its investments into a disclosure hierarchy consisting of three levels as shown below:
Level 1 - quoted prices in active markets for identical investments
Level 2 - other significant observable inputs (including quoted prices for similar investments, interest rates, prepayment speeds, etc.)
Level 3 - unobservable inputs (including the Fund's own assumptions based on the best information available)
Valuation techniques used to value the Fund's investments by major category are as follows:
Equity securities, including restricted securities, for which market quotations are readily available, are valued at the last reported sale price or official closing price as reported by a third party pricing vendor on the primary market or exchange on which they are traded and are categorized as Level 1 in the hierarchy. In the event there were no sales during the day or closing prices are not available, securities are valued at the last quoted bid price or may be valued using the last available price and are generally categorized as Level 2 in the hierarchy. For foreign equity securities, when significant market or security specific events arise, comparisons to the valuation of American Depositary Receipts (ADRs), futures contracts, Exchange-Traded Funds (ETFs) and certain indexes as well as quoted prices for similar securities are used and are categorized as Level 2 in the hierarchy. Utilizing these techniques may result in transfers between Level 1 and Level 2.
Annual Report
3. Significant Accounting Policies - continued
Investment Valuation - continued
Investments in open-end mutual funds, including the Fidelity Central Funds, are valued at their closing net asset value (NAV) each business day and are categorized as Level 1 in the hierarchy.
Changes in valuation techniques may result in transfers in or out of an assigned level within the disclosure hierarchy. The aggregate value of investments by input level, as of February 28, 2013 is included at the end of the Fund's Schedule of Investments.
Foreign Currency. The Fund may use foreign currency contracts to facilitate transactions in foreign-denominated securities. Gains and losses from these transactions may arise from changes in the value of the foreign currency or if the counterparties do not perform under the contracts' terms.
Foreign-denominated assets, including investment securities, and liabilities are translated into U.S. dollars at the exchange rates at period end. Purchases and sales of investment securities, income and dividends received and expenses denominated in foreign currencies are translated into U.S. dollars at the exchange rate in effect on the transaction date.
The effects of exchange rate fluctuations on investments are included with the net realized and unrealized gain (loss) on investment securities. Other foreign currency transactions resulting in realized and unrealized gain (loss) are disclosed separately.
Investment Transactions and Income. For financial reporting purposes, the Fund's investment holdings and NAV include trades executed through the end of the last business day of the period. The NAV per share for processing shareholder transactions is calculated as of the close of business of the New York Stock Exchange (NYSE) normally 4:00 p.m. Eastern time and includes trades executed through the end of the prior business day. Gains and losses on securities sold are determined on the basis of identified cost and may include proceeds received from litigation. Dividend income is recorded on the ex-dividend date, except for certain dividends from foreign securities where the ex-dividend date may have passed, which are recorded as soon as the Fund is informed of the ex-dividend date. Non-cash dividends included in dividend income, if any, are recorded at the fair market value of the securities received. Distributions received on securities that represent a return of capital or capital gain are recorded as a reduction of cost of investments and/or as a realized gain. The Fund estimates the components of distributions received that may be considered return of capital distributions or capital gain distributions. Interest income and distributions from the Fidelity Central Funds are accrued as earned. Interest income includes coupon interest and amortization of premium and accretion of discount on debt securities. Investment income is recorded net of foreign taxes withheld where recovery of such taxes is uncertain.
Expenses. Expenses directly attributable to a fund are charged to that fund. Expenses attributable to more than one fund are allocated among the respective funds on the basis of relative net assets or other appropriate methods. Expense estimates are accrued in the period to which they relate and adjustments are made when actual amounts are known.
Income Tax Information and Distributions to Shareholders. Each year, the Fund intends to qualify as a regulated investment company under Subchapter M of the Internal Revenue Code, including distributing substantially all of its taxable income and realized gains. As a result, no provision for income taxes is required. As of February 28, 2013, the Fund did not have any unrecognized tax benefits in the financial statements; nor is the Fund aware of any tax positions for which it is reasonably possible that the total amounts of unrecognized tax benefits will significantly change in the next twelve months. The Fund files a U.S. federal tax return, in addition to state and local tax returns as required. A fund's federal income tax returns are subject to examination by the Internal Revenue Service (IRS) for a period of three fiscal years after they are filed. State and local tax returns may be subject to examination for an additional fiscal year depending on the jurisdiction. Foreign taxes are provided for based on the Fund's understanding of the tax rules and rates that exist in the foreign markets in which it invests.
Distributions are declared and recorded on the ex-dividend date. Income dividends and capital gain distributions are declared separately for each class. Income and capital gain distributions are determined in accordance with income tax regulations, which may differ from GAAP.
Capital accounts within the financial statements are adjusted for permanent book-tax differences. These adjustments have no impact on net assets or the results of operations. Temporary book-tax differences will reverse in a subsequent period.
Book-tax differences are primarily due to foreign currency transactions, deferred trustees compensation, capital loss carryforwards, losses deferred due to wash sales and excise tax regulations.
The federal tax cost of investment securities and unrealized appreciation (depreciation) as of period end were as follows:
|
Gross unrealized appreciation |
$ 31,237,253 |
|
Gross unrealized depreciation |
(53,653,112) |
|
Net unrealized appreciation (depreciation) on securities and other investments |
$ (22,415,859) |
|
|
|
|
Tax Cost |
$ 429,748,137 |
Annual Report
Notes to Financial Statements - continued
3. Significant Accounting Policies - continued
Income Tax Information and Distributions to Shareholders - continued
The tax-based components of distributable earnings as of period end were as follows:
|
Undistributed ordinary income |
$ 1,584,607 |
|
Capital loss carryforward |
$ (4,605,799) |
|
Net unrealized appreciation (depreciation) |
$ (22,417,989) |
Capital loss carryforwards are only available to offset future capital gains of the Fund to the extent provided by regulations and may be limited. Under the Regulated Investment Company Modernization Act of 2010 (the Act), the Fund is permitted to carry forward capital losses incurred in taxable years beginning after December 22, 2010 for an unlimited period and such capital losses are required to be used prior to any losses that expire. Capital loss carryforwards were as follows:
|
Fiscal year of expiration |
|
|
2018 |
$ (4,605,799) |
The tax character of distributions paid was as follows:
|
|
February 28, 2013 |
February 29, 2012 |
|
Ordinary Income |
$ 8,401,078 |
$ 4,955,219 |
Trading (Redemption) Fees. Shares held by investors in the Fund less than 30 days are subject to a redemption fee equal to .75% of the net asset value of shares redeemed. All redemption fees, which reduce the proceeds of the shareholder redemption, are retained by the Fund and accounted for as an addition to paid in capital.
4. Purchases and Sales of Investments.
Purchases and sales of securities, other than short-term securities, aggregated $292,408,210 and $291,614,126, respectively.
5. Fees and Other Transactions with Affiliates.
Management Fee. FMR and its affiliates provide the Fund with investment management related services for which the Fund pays a monthly management fee. The management fee is the sum of an individual fund fee rate that is based on an annual rate of .30% of the Fund's average net assets and an annualized group fee rate that averaged .26% during the period. The group fee rate is based upon the average net assets of all the mutual funds advised by FMR. The group fee rate decreases as assets under management increase and increases as assets under management decrease. For the period, the total annual management fee rate was .56% of the Fund's average net assets.
Distribution and Service Plan Fees. In accordance with Rule 12b-1 of the 1940 Act, the Fund has adopted separate Distribution and Service Plans for each class of shares. Certain classes pay Fidelity Distributors Corporation (FDC), an affiliate of FMR, separate Distribution and Service Fees, each of which is based on an annual percentage of each class' average net assets. In addition, FDC may pay financial intermediaries for selling shares of the Fund and providing shareholder support services. For the period, the Distribution and Service Fee rates, total fees and amounts retained by FDC were as follows:
|
|
Distribution |
Service |
Total Fees |
Retained |
|
Class A |
-% |
.25% |
$ 14,849 |
$ 541 |
|
Class T |
.25% |
.25% |
17,870 |
70 |
|
Class B |
.75% |
.25% |
6,575 |
4,941 |
|
Class C |
.75% |
.25% |
38,152 |
9,096 |
|
|
|
|
$ 77,446 |
$ 14,648 |
Sales Load. FDC may receive a front-end sales charge of up to 5.75% for selling Class A shares and 3.50% for selling Class T shares, some of which is paid to financial intermediaries for selling shares of the Fund. Depending on the holding period, FDC may receive contingent deferred sales charges levied on Class A, Class T, Class B and Class C redemptions. The deferred sales charges range from 5.00% to 1.00% for Class B shares, 1.00% for Class C shares, 1.00% for certain purchases of Class A shares and .25% for certain purchases of Class T shares.
Annual Report
5. Fees and Other Transactions with Affiliates - continued
Sales Load - continued
For the period, sales charge amounts retained by FDC were as follows:
|
|
Retained |
|
Class A |
$ 5,421 |
|
Class T |
2,485 |
|
Class B* |
1,042 |
|
Class C* |
869 |
|
|
$ 9,817 |
* When Class B and Class C shares are initially sold, FDC pays commissions from its own resources to financial intermediaries through which the sales are made.
Transfer Agent Fees. Fidelity Investments Institutional Operations Company, Inc., (FIIOC), an affiliate of FMR, is the transfer, dividend disbursing and shareholder servicing agent for each class of the Fund. FIIOC receives account fees and asset-based fees that vary according to the account size and type of account of the shareholders of the respective classes of the Fund. FIIOC pays for typesetting, printing and mailing of shareholder reports, except proxy statements. For the period, transfer agent fees for each class were as follows:
|
|
Amount |
% of |
|
Class A |
$ 17,802 |
.30 |
|
Class T |
12,230 |
.34 |
|
Class B |
1,983 |
.30 |
|
Class C |
10,279 |
.27 |
|
Telecommunications |
902,150 |
.23 |
|
Institutional Class |
3,314 |
.21 |
|
|
$ 947,758 |
|
Accounting and Security Lending Fees. Fidelity Service Company, Inc. (FSC), an affiliate of FMR, maintains the Fund's accounting records. The accounting fee is based on the level of average net assets for each month. Under a separate contract, FSC administers the security lending program. The security lending fee is based on the number and duration of lending transactions.
Brokerage Commissions. The Fund placed a portion of its portfolio transactions with brokerage firms which are affiliates of the investment adviser. The commissions paid to these affiliated firms were $17,997 for the period.
6. Committed Line of Credit.
The Fund participates with other funds managed by FMR or an affiliate in a $4.25 billion credit facility (the "line of credit") to be utilized for temporary or emergency purposes to fund shareholder redemptions or for other short-term liquidity purposes. The Fund has agreed to pay commitment fees on its pro-rata portion of the line of credit, which amounted to $1,031 and is reflected in Miscellaneous expenses on the Statement of Operations. During the period, there were no borrowings on this line of credit.
7. Security Lending.
The Fund lends portfolio securities through a lending agent from time to time in order to earn additional income. For equity securities, a lending agent is used and may loan securities to certain qualified borrowers, including Fidelity Capital Markets (FCM), a broker-dealer affiliated with the Fund. On the settlement date of the loan, the Fund receives collateral (in the form of U.S. Treasury obligations, letters of credit and/or cash) against the loaned securities and maintains collateral in an amount not less than 100% of the market value of the loaned securities during the period of the loan. The market value of the loaned securities is determined at the close of business of the Fund and any additional required collateral is delivered to the Fund on the next business day. If the borrower defaults on its obligation to return the securities loaned because of insolvency or other reasons, a fund could experience delays and costs in recovering the securities loaned or in gaining access to the collateral. Any cash collateral received is invested in the Fidelity Securities Lending Cash Central Fund. The value of loaned securities and cash collateral at period end are disclosed on the Fund's Statement of Assets and Liabilities. The value of securities loaned to FCM at period end was $2,380,500. Security lending income represents the income earned on investing cash collateral, less rebates paid to borrowers and any lending agent fees associated with the loan, plus any premium payments received for
Annual Report
Notes to Financial Statements - continued
7. Security Lending - continued
lending certain types of securities. Security lending income is presented in the Statement of Operations as a component of income from Fidelity Central Funds. Total security lending income during the period amounted to $316,632, including $55,252 from securities loaned to FCM.
8. Expense Reductions.
Many of the brokers with whom FMR places trades on behalf of the Fund provided services to the Fund in addition to trade execution. These services included payments of certain expenses on behalf of the Fund totaling $60,763 for the period.
In addition, FMR reimbursed a portion of the Fund's operating expenses during the period in the amount of $350.
9. Distributions to Shareholders.
Distributions to shareholders of each class were as follows:
|
|
Year ended February 28, 2013 |
Year ended February 29, 2012 |
|
From net investment income |
|
|
|
Class A |
$ 115,461 |
$ 54,285 |
|
Class T |
65,641 |
24,009 |
|
Class B |
6,964 |
2,206 |
|
Class C |
43,780 |
19,099 |
|
Telecommunications |
8,113,006 |
4,833,836 |
|
Institutional Class |
56,226 |
21,784 |
|
Total |
$ 8,401,078 |
$ 4,955,219 |
10. Share Transactions.
Transactions for each class of shares were as follows:
|
|
Shares |
Dollars |
||
|
|
Year ended |
Year ended |
Year ended |
Year ended |
|
Class A |
|
|
|
|
|
Shares sold |
76,572 |
70,128 |
$ 3,760,739 |
$ 3,321,351 |
|
Reinvestment of distributions |
1,839 |
1,116 |
92,540 |
47,447 |
|
Shares redeemed |
(54,776) |
(61,569) |
(2,738,397) |
(2,787,444) |
|
Net increase (decrease) |
23,635 |
9,675 |
$ 1,114,882 |
$ 581,354 |
|
Class T |
|
|
|
|
|
Shares sold |
48,620 |
24,101 |
$ 2,392,044 |
$ 1,100,865 |
|
Reinvestment of distributions |
1,268 |
557 |
63,823 |
23,555 |
|
Shares redeemed |
(26,195) |
(27,493) |
(1,317,712) |
(1,235,915) |
|
Net increase (decrease) |
23,693 |
(2,835) |
$ 1,138,155 |
$ (111,495) |
|
Class B |
|
|
|
|
|
Shares sold |
3,053 |
1,659 |
$ 144,445 |
$ 77,673 |
|
Reinvestment of distributions |
133 |
46 |
6,751 |
1,965 |
|
Shares redeemed |
(4,941) |
(3,832) |
(248,673) |
(176,016) |
|
Net increase (decrease) |
(1,755) |
(2,127) |
$ (97,477) |
$ (96,378) |
|
Class C |
|
|
|
|
|
Shares sold |
26,248 |
30,950 |
$ 1,304,972 |
$ 1,412,876 |
|
Reinvestment of distributions |
594 |
313 |
29,972 |
13,236 |
|
Shares redeemed |
(18,620) |
(19,633) |
(912,596) |
(879,199) |
|
Net increase (decrease) |
8,222 |
11,630 |
$ 422,348 |
$ 546,913 |
|
Telecommunications |
|
|
|
|
|
Shares sold |
3,283,802 |
3,856,487 |
$ 158,174,294 |
$ 180,498,933 |
|
Reinvestment of distributions |
156,090 |
108,713 |
7,859,416 |
4,652,114 |
|
Shares redeemed |
(3,538,446) |
(4,106,690) |
(177,183,415) |
(188,141,891) |
|
Net increase (decrease) |
(98,554) |
(141,490) |
$ (11,149,705) |
$ (2,990,844) |
Annual Report
10. Share Transactions - continued
|
|
Shares |
Dollars |
||
|
|
Year ended |
Year ended |
Year ended |
Year ended |
|
Institutional Class |
|
|
|
|
|
Shares sold |
41,031 |
107,857 |
$ 2,107,286 |
$ 5,158,491 |
|
Reinvestment of distributions |
986 |
401 |
49,926 |
17,134 |
|
Shares redeemed |
(13,014) |
(123,190) |
(646,240) |
(5,562,790) |
|
Net increase (decrease) |
29,003 |
(14,932) |
$ 1,510,972 |
$ (387,165) |
11. Other.
The Fund's organizational documents provide former and current trustees and officers with a limited indemnification against liabilities arising in connection with the performance of their duties to the Fund. In the normal course of business, the Fund may also enter into contracts that provide general indemnifications. The Fund's maximum exposure under these arrangements is unknown as this would be dependent on future claims that may be made against the Fund. The risk of material loss from such claims is considered remote.
At the end of the period, Fidelity VIP FundsManager 60% Portfolio was the owner of record of approximately 20% of the total outstanding shares of the Fund. Mutual funds managed by FMR or its affiliates were the owners of record, in the aggregate, of approximately 32% of the total outstanding shares of the Fund.
Annual Report
Report of Independent Registered Public Accounting Firm
To the Trustees of Fidelity Select Portfolios and the Shareholders of Consumer Staples Portfolio, Gold Portfolio, Materials Portfolio and Telecommunications Portfolio:
In our opinion, the accompanying statements of assets and liabilities (consolidated statement of assets and liabilities for Gold Portfolio), including the schedules of investments (consolidated schedule of investments for Gold Portfolio), and the related statements of operations (consolidated statement of operations for Gold Portfolio) and of changes in net assets (consolidated changes in net assets for Gold Portfolio) and the financial highlights present fairly, in all material respects, the financial position of Consumer Staples Portfolio, Gold Portfolio, Materials Portfolio and Telecommunications Portfolio(funds of Fidelity Select Portfolios) at February 28, 2013, the results of each of their operations for the year then ended, the changes in each of their net assets for the two years in the period then ended and each of their financial highlights for the five years in the period then ended, in conformity with accounting principles generally accepted in the United States of America. These financial statements and financial highlights (hereafter referred to as "financial statements") are the responsibility of the Fidelity Select Portfolios' management. Our responsibility is to express an opinion on these financial statements based on our audits. We conducted our audits of these financial statements in accordance with the standards of the Public Company Accounting Oversight Board (United States). Those standards require that we plan and perform the audit to obtain reasonable assurance about whether the financial statements are free of material misstatement. An audit includes examining, on a test basis, evidence supporting the amounts and disclosures in the financial statements, assessing the accounting principles used and significant estimates made by management, and evaluating the overall financial statement presentation. We believe that our audits, which included confirmation of securities at February 28, 2013 by correspondence with the custodian and brokers, provide a reasonable basis for our opinion.
PricewaterhouseCoopers LLP
Boston, Massachusetts
April 18, 2013
Annual Report
Trustees and Officers
The Trustees, Members of the Advisory Board, and executive officers of the trust and funds, as applicable, are listed below. The Board of Trustees governs each fund and is responsible for protecting the interests of shareholders. The Trustees are experienced executives who meet periodically throughout the year to oversee each fund's activities, review contractual arrangements with companies that provide services to each fund, oversee management of the risks associated with such activities and contractual arrangements, and review each fund's performance. Except for James C. Curvey, each of the Trustees oversees 234 Fidelity funds. Mr. Curvey oversees 453 Fidelity funds.
The Trustees hold office without limit in time except that (a) any Trustee may resign; (b) any Trustee may be removed by written instrument, signed by at least two-thirds of the number of Trustees prior to such removal; (c) any Trustee who requests to be retired or who has become incapacitated by illness or injury may be retired by written instrument signed by a majority of the other Trustees; and (d) any Trustee may be removed at any special meeting of shareholders by a two-thirds vote of the outstanding voting securities of the trust. Each Trustee who is not an interested person of the trust and the funds (as defined in the 1940 Act) (Independent Trustee), shall retire not later than the last day of the calendar year in which his or her 75th birthday occurs. The Independent Trustees may waive this mandatory retirement age policy with respect to individual Trustees. The executive officers and Advisory Board Members hold office without limit in time, except that any officer and Advisory Board Member may resign or may be removed by a vote of a majority of the Trustees at any regular meeting or any special meeting of the Trustees. Except as indicated, each individual has held the office shown or other offices in the same company for the past five years.
Experience, Skills, Attributes, and Qualifications of the Funds' Trustees. The Governance and Nominating Committee has adopted a statement of policy that describes the experience, qualifications, attributes, and skills that are necessary and desirable for potential Independent Trustee candidates (Statement of Policy). The Board believes that each Trustee satisfied at the time he or she was initially elected or appointed a Trustee, and continues to satisfy, the standards contemplated by the Statement of Policy. The Governance and Nominating Committee also engages professional search firms to help identify potential Independent Trustee candidates who have the experience, qualifications, attributes, and skills consistent with the Statement of Policy. From time to time, additional criteria based on the composition and skills of the current Independent Trustees, as well as experience or skills that may be appropriate in light of future changes to board composition, business conditions, and regulatory or other developments, have also been considered by the professional search firms and the Governance and Nominating Committee. In addition, the Board takes into account the Trustees' commitment and participation in Board and committee meetings, as well as their leadership of standing and ad hoc committees throughout their tenure.
In determining that a particular Trustee was and continues to be qualified to serve as a Trustee, the Board has considered a variety of criteria, none of which, in isolation, was controlling. The Board believes that, collectively, the Trustees have balanced and diverse experience, qualifications, attributes, and skills, which allow the Board to operate effectively in governing each fund and protecting the interests of shareholders. Information about the specific experience, skills, attributes, and qualifications of each Trustee, which in each case led to the Board's conclusion that the Trustee should serve (or continue to serve) as a trustee of the funds, is provided below.
Board Structure and Oversight Function. James C. Curvey is an interested person (as defined in the 1940 Act) and currently serves as Chairman. The Trustees have determined that an interested Chairman is appropriate and benefits shareholders because an interested Chairman has a personal and professional stake in the quality and continuity of services provided to the funds. Independent Trustees exercise their informed business judgment to appoint an individual of their choosing to serve as Chairman, regardless of whether the Trustee happens to be independent or a member of management. The Independent Trustees have determined that they can act independently and effectively without having an Independent Trustee serve as Chairman and that a key structural component for assuring that they are in a position to do so is for the Independent Trustees to constitute a substantial majority for the Board. The Independent Trustees also regularly meet in executive session. Ned C. Lautenbach serves as Chairman of the Independent Trustees and as such (i) acts as a liaison between the Independent Trustees and management with respect to matters important to the Independent Trustees and (ii) with management prepares agendas for Board meetings.
Fidelity funds are overseen by different Boards of Trustees. The funds' Board oversees Fidelity's equity and high income funds and another Board oversees Fidelity's investment-grade bond, money market, and asset allocation funds. The asset allocation funds may invest in Fidelity funds overseen by the funds' Board. The use of separate Boards, each with its own committee structure, allows the Trustees of each group of Fidelity funds to focus on the unique issues of the funds they oversee, including common research, investment, and operational issues. On occasion, the separate Boards establish joint committees to address issues of overlapping consequences for the Fidelity funds overseen by each Board.
The Trustees operate using a system of committees to facilitate the timely and efficient consideration of all matters of importance to the Trustees, each fund, and fund shareholders and to facilitate compliance with legal and regulatory requirements and oversight of the funds' activities and associated risks. The Board, acting through its committees, has charged FMR and its affiliates with (i) identifying events or circumstances the occurrence of which could have demonstrably adverse effects on the funds' business and/or reputation; (ii) implementing processes and controls to lessen the possibility that such events or circumstances occur or to mitigate the effects of such events or circumstances if they do occur; and (iii) creating and maintaining a system designed to evaluate continuously business and market conditions in order to facilitate the identification and implementation processes described in (i) and (ii) above. Because the day-to-day operations and activities of the funds are carried out by or through FMR, its affiliates and other service providers, the funds' exposure to risks is mitigated but not eliminated by the processes overseen by the Trustees. While each of the Board's committees has responsibility for overseeing different aspects of the funds' activities, oversight is exercised primarily through the Operations, Audit, and Compliance Committees. In addition, the Independent Trustees have worked with FMR to enhance the Board's oversight of investment and financial risks, legal and regulatory risks, technology risks, and operational risks, including the development of additional risk reporting to the Board. For example, a working group comprised of Independent Trustees and FMR has worked and continues to work to review the Fidelity funds' valuation-related activities, reporting and risk management. Appropriate personnel, including but not limited to the funds' Chief Compliance Officer (CCO), FMR's internal auditor, the independent accountants, the funds' Treasurer and portfolio management personnel, make periodic reports to the Board's committees, as appropriate, including an annual review of FMR's risk management program for the Fidelity funds. The responsibilities of each standing committee, including their oversight responsibilities, are described further under "Standing Committees of the Funds' Trustees."
Annual Report
Trustees and Officers - continued
The fund's Statement of Additional Information (SAI) includes more information about the Trustees. To request a free copy, call Fidelity at 1-877-208-0098.
Interested Trustees*:
Correspondence intended for each Trustee who is an interested person may be sent to Fidelity Investments, 245 Summer Street, Boston, Massachusetts 02210.
|
Name, Year of Birth; Principal Occupations and Other Relevant Experience+ |
|
|
James C. Curvey (1935) |
|
|
|
Year of Election or Appointment: 2007 Mr. Curvey is Trustee and Chairman of the Board of Trustees of certain Trusts. Mr. Curvey also serves as Trustee (2007-present) of other investment companies advised by FMR. Mr. Curvey is a Director of Fidelity Investments Money Management, Inc. (2009-present), Director of Fidelity Research & Analysis Co. (2009-present) and Director of FMR and FMR Co., Inc. (2007-present). Mr. Curvey is also Vice Chairman (2007-present) and Director of FMR LLC. In addition, Mr. Curvey serves as an Overseer for the Boston Symphony Orchestra and a member of the Trustees of Villanova University. Previously, Mr. Curvey was the Vice Chairman (2006-2007) and Director (2000-2007) of FMR Corp. |
|
Ronald P. O'Hanley (1957) |
|
|
|
Year of Election or Appointment: 2011 Mr. O'Hanley is Director of FMR Co., Inc. (2010-present), Director of Fidelity Investments Money Management, Inc. (2010-present), Director of Fidelity Research & Analysis Company (2010-present), President of Fidelity Asset Management and Corporate Services and a member of Fidelity's Executive Committee (2010-present). Previously, Mr. O'Hanley served as President and Chief Executive Officer of BNY Mellon Asset Management (2007-2010). Mr. O'Hanley also served as Vice Chairman of Bank New York Mellon Corp. and a member of that firm's Executive Committee. Prior to the 2007 merger of The Bank of New York and Mellon Financial Corporation, he was Vice Chairman of Mellon Financial Corporation and President and Chief Executive Officer of Mellon Asset Management. He joined Mellon in February 1997. Mr. O'Hanley currently serves as Chairman of the Boston Public Library Foundation Board of Directors and sits on the Board of Directors of Beth Israel Deaconess Medical Center, the Board of Trustees of the Marine Biological Laboratory and the Advisory Board of the Maxwell School of Citizenship and Public Administration at Syracuse University. Mr. O'Hanley also chairs the Council on Asset Management for the Financial Services Roundtable and is a member of the Board of Directors of Institutional Investor's U.S. Institute. |
* Trustees have been determined to be "Interested Trustees" by virtue of, among other things, their affiliation with the trust or various entities under common control with FMR.
+ The information above includes each Trustee's principal occupation during the last five years and other information relating to the experience, attributes, and skills relevant to each Trustee's qualifications to serve as a Trustee, which led to the conclusion that each Trustee should serve as a Trustee for each fund.
Independent Trustees:
Correspondence intended for each Independent Trustee (that is, the Trustees other than the Interested Trustees) may be sent to Fidelity Investments, P.O. Box 55235, Boston, Massachusetts 02205-5235.
|
Name, Year of Birth; Principal Occupations and Other Relevant Experience+ |
|
|
Dennis J. Dirks (1948) |
|
|
|
Year of Election or Appointment: 2005 Prior to his retirement in May 2003, Mr. Dirks was Chief Operating Officer and a member of the Board of The Depository Trust & Clearing Corporation (DTCC). He also served as President, Chief Operating Officer, and Board member of The Depository Trust Company (DTC) and President and Board member of the National Securities Clearing Corporation (NSCC). In addition, Mr. Dirks served as Chief Executive Officer and Board member of the Government Securities Clearing Corporation, Chief Executive Officer and Board member of the Mortgage-Backed Securities Clearing Corporation, as a Trustee and a member of the Finance Committee of Manhattan College (2005-2008), and as a Trustee and a member of the Finance Committee of AHRC of Nassau County (2006-2008). Mr. Dirks is a member of the Independent Directors Council (IDC) Governing Council (2010-present) and Board of Directors for The Brookville Center for Children's Services, Inc. (2009-present). |
|
Alan J. Lacy (1953) |
|
|
|
Year of Election or Appointment: 2008 Mr. Lacy serves as Senior Adviser (2007-present) of Oak Hill Capital Partners, L.P. (private equity). Mr. Lacy also served as Chief Executive Officer (2000-2005) and Vice Chairman (2005-2006) of Sears Holdings Corporation and Sears, Roebuck and Co. (retail). In addition, Mr. Lacy serves as a member of the Board of Directors of Dave & Buster's Entertainment, Inc. (restaurant and entertainment complexes, 2010-present), Earth Fare, Inc. (retail grocery, 2012-present), The Hillman Companies, Inc. (hardware wholesalers, 2010-present), and Bristol-Myers Squibb Company (global pharmaceuticals, 2008-present). Mr. Lacy is a member of the Board of Trustees of The National Parks Conservation Association (2006-present). Previously, Mr. Lacy served as Chairman of the Board of Trustees of the National Parks Conservation Association (2008-2011) and as a member of the Board of Directors for the Western Union Company (global money transfer, 2006-2011). |
|
Ned C. Lautenbach (1944) |
|
|
|
Year of Election or Appointment: 2000 Mr. Lautenbach is Chairman of the Independent Trustees of the Equity and High Income Funds (2006-present). Mr. Lautenbach currently serves as the Lead Director of the Eaton Corporation Board of Directors (diversified industrial, 1997-present). Mr. Lautenbach is Chairman of the Board of Directors of the Philharmonic Center for the Arts in Naples, Florida (2012-present) and a member of the Council on Foreign Relations (1994-present). Previously, Mr. Lautenbach was a Partner/Advisory Partner at Clayton, Dubilier & Rice, LLC (private equity investment, 1998-2010), as well as a Director of Sony Corporation (2006-2007). |
|
Joseph Mauriello (1944) |
|
|
|
Year of Election or Appointment: 2008 Prior to his retirement in January 2006, Mr. Mauriello served in numerous senior management positions including Deputy Chairman and Chief Operating Officer (2004-2005), and Vice Chairman of Financial Services (2002-2004) of KPMG LLP US (professional services, 1965-2005). Mr. Mauriello currently serves as a member of the Board of Directors of XL Group plc. (global insurance and re-insurance, 2006-present). Previously, Mr. Mauriello served as a Director of the Hamilton Funds of the Bank of New York (2006-2007) and of Arcadia Resources Inc. (health care services and products, 2007-2012). |
|
Robert W. Selander (1950) |
|
|
|
Year of Election or Appointment: 2011 Previously, Mr. Selander served as a Member of the Advisory Board of Fidelity's Equity and High Income Funds (2011), Executive Vice Chairman (2010), Chief Executive Officer (2009-2010), and President and Chief Executive Officer (1997-2009) of Mastercard, Inc. |
|
Cornelia M. Small (1944) |
|
|
|
Year of Election or Appointment: 2005 Ms. Small is a member of the Board of Directors (2009-present) and Chair of the Investment Committee (2010-present) of the Teagle Foundation. Ms. Small also serves on the Investment Committee of the Berkshire Taconic Community Foundation (2008-present). Previously, Ms. Small served as Chairperson (2002-2008) and a member of the Investment Committee and Chairperson (2008-2012) and a member of the Board of Trustees of Smith College. In addition, Ms. Small served as Chief Investment Officer, Director of Global Equity Investments, and a member of the Board of Directors of Scudder, Stevens & Clark and Scudder Kemper Investments. |
|
William S. Stavropoulos (1939) |
|
|
|
Year of Election or Appointment: 2001 Mr. Stavropoulos is Vice Chairman of the Independent Trustees of the Equity and High Income Funds (2006-present). Mr. Stavropoulos serves as President and Founder of the Michigan Baseball Foundation, the Great Lakes Loons (2007-present). Mr. Stavropoulos is Chairman Emeritus of the Board of Directors of The Dow Chemical Company, where he previously served in numerous senior management positions, including President, CEO (1995-2000; 2002-2004), Chairman of the Executive Committee (2000-2006), and as a member of the Board of Directors (1990-2006). Currently, Mr. Stavropoulos is a Director of Univar Inc. (global distributor of commodity and specialty chemicals, Chairman from 2010-May 2012 and Lead Director from May 2012-present), Teradata Corporation (data warehousing and technology solutions, 2008-present), Maersk Inc. (industrial conglomerate), and Tyco International, Ltd. (multinational manufacturing and services, 2007-present), and a member of the Advisory Board for Metalmark Capital LLC (private equity investment, 2005-present). Mr. Stavropoulos is an operating advisor to Clayton, Dubilier & Rice, LLC (private equity investment). In addition, Mr. Stavropoulos is a member of the University of Notre Dame Advisory Council for the College of Science, a Trustee of the Rollin L. Gerstacker Foundation, and a Director of the Naples Philharmonic Center for the Arts. Previously, Mr. Stavropoulos served as a Director of Chemical Financial Corporation (bank holding company, 1993-2012). |
|
David M. Thomas (1949) |
|
|
|
Year of Election or Appointment: 2008 Previously, Mr. Thomas served as Executive Chairman (2005-2006) and Chairman and Chief Executive Officer (2000-2005) of IMS Health, Inc. (pharmaceutical and healthcare information solutions), and a Director of Fortune Brands, Inc. (consumer products, 2000-2011). In addition, Mr. Thomas serves as Non-Executive Chairman of the Board of Directors of Fortune Brands Home and Security (home and security products, 2011-present), and as a member of the Board of Directors of Interpublic Group of Companies, Inc. (marketing communication, 2004-present). |
|
Michael E. Wiley (1950) |
|
|
|
Year of Election or Appointment: 2008 Mr. Wiley also serves as a Director of Asia Pacific Exploration Consolidated (international oil and gas exploration and production, 2008-present). Mr. Wiley serves as a Director of Tesoro Corporation (independent oil refiner and marketer, 2005-present), and a Director of Bill Barrett Corporation (exploration and production, 2005-present). In addition, Mr. Wiley also serves as a Director of Post Oak Bank (privately-held bank, 2004-present). Previously, Mr. Wiley served as a member of the Board of Trustees of the University of Tulsa (2000-2006; 2007-2010), as a Senior Energy Advisor of Katzenbach Partners, LLC (consulting, 2006-2007), as an Advisory Director of Riverstone Holdings (private investment), Chairman, President, and CEO of Baker Hughes, Inc. (oilfield services, 2000-2004), and as Director of Spinnaker Exploration Company (exploration and production, 2001-2005). |
+ The information above includes each Trustee's principal occupation during the last five years and other information relating to the experience, attributes, and skills relevant to each Trustee's qualifications to serve as a Trustee, which led to the conclusion that each Trustee should serve as a Trustee for each fund.
Advisory Board Members and Executive Officers:
Correspondence intended for David A. Rosow and Garnett A. Smith may be sent to Fidelity Investments, P.O. Box 55235, Boston, Massachusetts 02205-5235. Correspondence intended for each executive officer and Peter S. Lynch may be sent to Fidelity Investments, 245 Summer Street, Boston, Massachusetts 02210.
|
Name, Year of Birth; Principal Occupation |
|
|
Peter S. Lynch (1944) |
|
|
|
Year of Election or Appointment: 2003 Member of the Advisory Board of Fidelity's Equity and High Income Funds. Mr. Lynch is Vice Chairman and a Director of FMR and FMR Co., Inc. In addition, Mr. Lynch serves as a Trustee of Boston College and as the Chairman of the Inner-City Scholarship Fund. Previously, Mr. Lynch served on the Special Olympics International Board of Directors (1997-2006). |
|
David A. Rosow (1942) |
|
|
|
Year of Election or Appointment: 2012 Member of the Advisory Board of Fidelity's Equity and High Income Funds. Chairman and Chief Executive Officer of International Golf Group, Inc. (golf course development, 1989-present). Previously, Mr. Rosow served as Chairman and Chief Executive Officer of Rosow & Company, Inc. (private investment company, 1989-2011), a Lead Director of Hudson United Bancorp (2001-2006) and as a Director of TD Banknorth (1996-2006). In addition, Mr. Rosow is a member (2008-present) and President (2009-present) of the Town Council of Palm Beach, Florida. |
|
Garnett A. Smith (1947) |
|
|
|
Year of Election or Appointment: 2012 Member of the Advisory Board of Fidelity's Equity and High Income Funds. Prior to Mr. Smith's retirement, he served as Chairman and Chief Executive Officer of Inbrand Corp. (manufacturer of personal absorbent products, 1990-1997). He also served as President (1986-1990) of Inbrand Corp. Prior to his employment with Inbrand Corp., he was employed by a retail fabric chain and North Carolina National Bank. In addition, Mr. Smith is a board member of the Jackson Hole Land Trust (2009-present). |
|
Kenneth B. Robins (1969) |
|
|
|
Year of Election or Appointment: 2008 President and Treasurer of Fidelity's Equity and High Income Funds. Mr. Robins also serves as President and Treasurer (2010-present) and Assistant Treasurer (2009-present) of other Fidelity funds and is an employee of Fidelity Investments (2004-present). Previously, Mr. Robins served as Deputy Treasurer of the Fidelity funds (2005-2008) and Treasurer and Chief Financial Officer of The North Carolina Capital Management Trust: Cash and Term Portfolios (2006-2008). |
|
Brian B. Hogan (1964) |
|
|
|
Year of Election or Appointment: 2009 Vice President of Equity and High Income Funds. Mr. Hogan also serves as President of FMR's Equity Division (2009-present). Previously, Mr. Hogan served as Senior Vice President, Equity Research of FMR (2006-2009) and as a portfolio manager. |
|
Christopher S. Bartel (1971) |
|
|
|
Year of Election or Appointment: 2009 Vice President of Fidelity's Sector and Real Estate Equity Funds. Mr. Bartel also serves as a Director, President, and Chief Executive Officer of Fidelity Management & Research (Japan) Inc. (2012-present), a Director of Fidelity Management & Research (Hong Kong) (2012-present), and Senior Vice President of Global Equity Research (2010-present). Previously, Mr. Bartel served as Senior Vice President of Equity Research (2009-2010), Managing Director of Research (2006-2009), and an analyst and portfolio manager (2000-2006). |
|
Scott C. Goebel (1968) |
|
|
|
Year of Election or Appointment: 2008 Secretary and Chief Legal Officer (CLO) of the Fidelity funds. Mr. Goebel also serves as Secretary of Fidelity Investments Money Management, Inc. (FIMM) (2010-present) and Fidelity Research and Analysis Company (FRAC) (2010-present); Secretary and CLO of The North Carolina Capital Management Trust: Cash and Term Portfolios (2008-present); General Counsel, Secretary, and Senior Vice President of FMR (2008-present) and FMR Co., Inc. (2008-present); employed by FMR LLC or an affiliate (2001-present); Chief Legal Officer of Fidelity Management & Research (Hong Kong) Limited (2008-present) and Assistant Secretary of Fidelity Management & Research (Japan) Inc. (2008-present), and Fidelity Management & Research (U.K.) Inc. (2008-present). Previously, Mr. Goebel served as Assistant Secretary of FIMM (2008-2010), FRAC (2008-2010), and the Funds (2007-2008) and as Vice President and Secretary of Fidelity Distributors Corporation (FDC) (2005-2007). |
|
William C. Coffey (1969) |
|
|
|
Year of Election or Appointment: 2009 Assistant Secretary of Fidelity's Equity and High Income Funds. Mr. Coffey also serves as Senior Vice President and Deputy General Counsel of FMR LLC (2010-present), and is an employee of Fidelity Investments. Previously, Mr. Coffey served as Vice President and Associate General Counsel of FMR LLC (2005-2009). |
|
Elizabeth Paige Baumann (1968) |
|
|
|
Year of Election or Appointment: 2012 Anti-Money Laundering (AML) Officer of the Fidelity funds. Ms. Baumann also serves as AML Officer of The North Carolina Capital Management Trust: Cash and Term Portfolios (2012-present), Chief AML Officer of FMR LLC (2012-present), and is an employee of Fidelity Investments. Previously, Ms. Baumann served as Vice President and Deputy Anti-Money Laundering Officer (2007-2012). |
|
Christine Reynolds (1958) |
|
|
|
Year of Election or Appointment: 2008 Chief Financial Officer of the Fidelity funds. Ms. Reynolds became President of Fidelity Pricing and Cash Management Services (FPCMS) in August 2008. Ms. Reynolds served as Chief Operating Officer of FPCMS (2007-2008). Previously, Ms. Reynolds served as President, Treasurer, and Anti-Money Laundering officer of the Fidelity funds (2004-2007). |
|
Joseph A. Hanlon (1968) |
|
|
|
Year of Election or Appointment: 2012 Chief Compliance Officer of Fidelity's Equity and High Income Funds. Mr. Hanlon serves as Compliance Officer of FMR, FMR Co., Inc., Fidelity Investments Money Management, Inc. (FIMM), Fidelity Research and Analysis Company (FRAC), Fidelity Management & Research (Japan) Inc., Fidelity Management & Research (U.K.) Inc., Fidelity Management & Research (Hong Kong), and Strategic Advisers, Inc. (2009-present), as Senior Vice President of the Fidelity Asset Management Division (2009-present), and is an employee of Fidelity Investments. |
|
Joseph F. Zambello (1957) |
|
|
|
Year of Election or Appointment: 2011 Deputy Treasurer of the Fidelity funds. Mr. Zambello is an employee of Fidelity Investments. Previously, Mr. Zambello served as Vice President of FMR's Program Management Group (2009-2011) and Vice President of the Transfer Agent Oversight Group (2005-2009). |
|
Adrien E. Deberghes (1967) |
|
|
|
Year of Election or Appointment: 2008 Deputy Treasurer of Fidelity's Equity and High Income Funds. Mr. Deberghes also serves as Vice President (2011-present) and Assistant Treasurer (2010-present) of other Fidelity funds, and is an employee of Fidelity Investments (2008-present). Previously, Mr. Deberghes served as Senior Vice President of Mutual Fund Administration at State Street Corporation (2007-2008), Senior Director of Mutual Fund Administration at Investors Bank & Trust (2005-2007), and Director of Finance for Dunkin' Brands (2000-2005). |
|
Stephen Sadoski (1971) |
|
|
|
Year of Election or Appointment: 2012 Deputy Treasurer of Fidelity's Equity and High Income Funds. Mr. Sadoski also serves as Deputy Treasurer of other Fidelity funds (2013-present) and is an employee of Fidelity Investments (2012-present). Previously, Mr. Sadoski served as Assistant Treasurer of Fidelity's Fixed Income and Asset Allocation Funds (2012-2013), an assistant chief accountant in the Division of Investment Management of the Securities and Exchange Commission (SEC) (2009-2012) and as a senior manager at Deloitte & Touche (1997-2009). |
|
Stacie Smith (1974) |
|
|
|
Year of Election or Appointment: 2013 Deputy Treasurer of Fidelity's Equity and High Income Funds. Ms. Smith is an employee of Fidelity Investments (2009-present). Previously, Ms. Smith served as Senior Audit Manager of Ernst & Young LLP (1996-2009). |
|
Stephanie J. Dorsey (1969) |
|
|
|
Year of Election or Appointment: 2010 Assistant Treasurer of Fidelity's Equity and High Income Funds. Ms. Dorsey also serves as President and Treasurer (2013-present) and Assistant Treasurer (2012-present) of other Fidelity funds and is an employee of Fidelity Investments (2008-present). Previously, Ms. Dorsey served as Deputy Treasurer of Fidelity's Fixed Income and Asset Allocation Funds (2008-2013), Treasurer (2004-2008) of the JPMorgan Mutual Funds and Vice President (2004-2008) of JPMorgan Chase Bank. |
|
John R. Hebble (1958) |
|
|
|
Year of Election or Appointment: 2009 Assistant Treasurer of Fidelity's Equity and High Income Funds. Mr. Hebble also serves as President (2011-present), Treasurer, and Chief Financial Officer of The North Carolina Capital Management Trust: Cash and Term Portfolios (2008-present) and is an employee of Fidelity Investments. Previously, Mr. Hebble served as President and Treasurer of Fidelity's Fixed Income and Asset Allocation Funds (2008-2013). |
|
Gary W. Ryan (1958) |
|
|
|
Year of Election or Appointment: 2005 Assistant Treasurer of the Fidelity funds. Mr. Ryan is an employee of Fidelity Investments. Previously, Mr. Ryan served as Vice President of Fund Reporting in Fidelity Pricing and Cash Management Services (FPCMS) (1999-2005). |
|
Jonathan Davis (1968) |
|
|
|
Year of Election or Appointment: 2010 Assistant Treasurer of the Fidelity funds. Mr. Davis is also Assistant Treasurer of Fidelity Rutland Square Trust II and Fidelity Commonwealth Trust II. Mr. Davis is an employee of Fidelity Investments. Previously, Mr. Davis served as Vice President and Associate General Counsel of FMR LLC (2003-2010). |
Annual Report
Distributions (Unaudited)
The Board of Trustees of each fund voted to pay to shareholders of record at the opening of business on record date, the following distributions per share derived from capital gains realized from sales of portfolio securities and dividends derived from net investment income:
|
Consumer Staples Portfolio |
Pay Date |
Record Date |
Dividends |
Capital Gains |
|
Class A |
04/15/13 |
04/12/13 |
$0.178 |
$2.121 |
|
Class T |
04/15/13 |
04/12/13 |
$0.142 |
$2.121 |
|
Class B |
04/15/13 |
04/12/13 |
$0.061 |
$2.121 |
|
Class C |
04/15/13 |
04/12/13 |
$0.081 |
$2.121 |
|
Gold Portfolio |
Pay Date |
Record Date |
Dividends |
Capital Gains |
|
Class A |
04/15/13 |
04/12/13 |
$0.000 |
$0.000 |
|
Class T |
04/15/13 |
04/12/13 |
$0.000 |
$0.000 |
|
Class B |
04/15/13 |
04/12/13 |
$0.000 |
$0.000 |
|
Class C |
04/15/13 |
04/12/13 |
$0.000 |
$0.000 |
|
Materials Portfolio |
Pay Date |
Record Date |
Dividends |
Capital Gains |
|
Class A |
04/15/13 |
04/12/13 |
$0.032 |
$0.017 |
|
Class T |
04/15/13 |
04/12/13 |
$0.000 |
$0.017 |
|
Class B |
04/15/13 |
04/12/13 |
$0.000 |
$0.017 |
|
Class C |
04/15/13 |
04/12/13 |
$0.000 |
$0.017 |
|
Telecommunications Portfolio |
Pay Date |
Record Date |
Dividends |
Capital Gains |
|
Class A |
04/15/13 |
04/12/13 |
$0.173 |
$0.000 |
|
Class T |
04/15/13 |
04/12/13 |
$0.147 |
$0.000 |
|
Class B |
04/15/13 |
04/12/13 |
$0.095 |
$0.000 |
|
Class C |
04/15/13 |
04/12/13 |
$0.119 |
$0.000 |
The funds hereby designate as capital gain dividend the amounts noted below for the taxable year ended February 28, 2013, or, if subsequently determined to be different, the net capital gain of such year.
|
Fund |
|
|
Consumer Staples Portfolio |
$81,679,202 |
|
Materials Portfolio |
$25,407,156 |
A percentage of the dividends distributed during the fiscal year for the following funds qualifies for the dividends-received deduction for corporate shareholders:
|
|
April 2012 |
December 2012 |
|
Consumer Staples Portfolio |
|
|
|
Class A |
100% |
100% |
|
Class T |
100% |
100% |
|
Class B |
100% |
100% |
|
Class C |
100% |
100% |
|
Gold Portfolio |
|
|
|
Class A |
0% |
0% |
|
Class T |
0% |
0% |
|
Class B |
0% |
0% |
|
Class C |
0% |
0% |
|
Materials Portfolio |
|
|
|
Class A |
100% |
100% |
|
Class T |
0% |
100% |
|
Class B |
0% |
100% |
|
Class C |
0% |
100% |
|
|
April 2012 |
December 2012 |
|
Telecommunications Portfolio |
|
|
|
Class A |
100% |
100% |
|
Class T |
100% |
100% |
|
Class B |
100% |
100% |
|
Class C |
100% |
100% |
A percentage of the dividends distributed during the fiscal year for the following funds may be taken into account as a dividend for purposes of the maximum rate under section 1(h)(11) of the Internal Revenue Code.
|
|
April 2012 |
December 2012 |
|
Consumer Staples Portfolio |
|
|
|
Class A |
100% |
100% |
|
Class T |
100% |
100% |
|
Class B |
100% |
100% |
|
Class C |
100% |
100% |
|
Gold Portfolio |
|
|
|
Class A |
0% |
0% |
|
Class T |
0% |
0% |
|
Class B |
0% |
0% |
|
Class C |
0% |
0% |
|
Materials Portfolio |
|
|
|
Class A |
100% |
100% |
|
Class T |
0% |
100% |
|
Class B |
0% |
100% |
|
Class C |
0% |
100% |
|
Telecommunications Portfolio |
|
|
|
Class A |
100% |
100% |
|
Class T |
100% |
100% |
|
Class B |
100% |
100% |
|
Class C |
100% |
100% |
The fund will notify shareholders in January 2014 of amounts for use in preparing 2013 income tax returns.
Annual Report
Board Approval of Investment Advisory Contracts and Management Fees
Consumer Staples Portfolio
Gold Portfolio
Materials Portfolio
Telecommunications Portfolio
On November 14, 2012, the Board of Trustees, including the Independent Trustees (together, the Board), voted to approve a new management contract (the New Contracts) between each fund and Fidelity SelectCo, LLC (SelectCo) and to submit the New Contracts to shareholders for their approval. If the New Contracts are approved by shareholders, effective August 1, 2013, SelectCo will serve as investment adviser to each fund. The terms of the New Contracts are identical to those of the current management contracts with FMR (the Current Contracts), except with respect to the name of the investment adviser and the dates of execution and the initial two-year term of the contract. The Board, assisted by the advice of fund counsel and Independent Trustees' counsel, considered a broad range of information.
In determining whether to approve the New Contracts for the funds, the Board was aware that shareholders in the funds have a broad range of investment choices available to them, including a wide choice among mutual funds offered by competitors to Fidelity, and that each fund's shareholders, with the opportunity to review and weigh the disclosure provided by the fund in its prospectus and other public disclosures, have chosen to invest in the fund, managed by Fidelity.
Nature, Extent, and Quality of Services Provided. The Board considered the nature, quality, cost and extent of the services to be provided by SelectCo under the New Contracts as well as the nature, quality, cost and extent of the advisory, administrative, distribution and shareholder services performed by the FMR and the sub-advisers, and by affiliated companies. The Board considered that, upon shareholder approval, SelectCo will render the same services to the funds under the New Contracts that FMR currently renders to the funds under the Current Contracts. The Board also considered that the New Contracts would not result in any changes to (i) the investment process or strategies employed in the management of the funds' assets or (ii) the day-to-day management of the funds or the persons primarily responsible for such management.
Throughout the year, the Trustees had discussions with FMR about plans to establish SelectCo as a new investment adviser to manage sector-based funds and products. The Trustees considered Fidelity's rationale for creating a separate investment adviser and noted that a separate investment adviser may be better positioned to focus on opportunities for growth within the sector investing space and to focus on a distinct approach to sector investing and research.
Shareholder and Administrative Services. The Board noted that the growth of fund assets across the complex allows Fidelity to reinvest in the development of services designed to enhance the value or convenience of the Fidelity funds as investment vehicles. These services include 24-hour access to account information and market information through phone representatives and over the Internet, and investor education materials and asset allocation tools.
Investment in a Large Fund Family. The Board considered the benefits to shareholders of investing in a Fidelity fund, including the benefits of investing in a fund that is part of a large family of funds offering a variety of investment disciplines and providing for a large variety of mutual fund shareholder services.
Investment Performance. The Board did not consider performance to be a material factor in its decision to approve the New Contracts because the New Contracts would not result in any changes to the funds' investment processes or strategies or in the persons primarily responsible for the day-to-day management of the funds.
Based on its review, the Board concluded that the nature, extent, and quality of the services provided to each fund will benefit the fund's shareholders, particularly in light of the Board's view that the fund's shareholders benefit from investing in a fund that is part of a large family of funds offering a variety of investment disciplines and services.
Competitiveness of Management Fee and Total Fund Expenses. The Board considered that, if approved by shareholders, the New Contracts would not result in any changes to the amount of the management fees paid by the funds, except that such fees would be paid to SelectCo rather than FMR. The Board noted that at previous meetings during the year it received and considered materials relating to its review of the management fee of each fund. This information includes comparisons that focus on a fund's standing relative to the total universe of comparable funds available to investors in terms of gross management fees before expense reimbursements or caps, as well as a fund's standing relative to non-Fidelity funds similar in size to the fund within the comparison group.
Based on its review, the Board concluded that each fund's management fee was fair and reasonable in light of the services that the fund receives and the other factors considered.
Annual Report
Board Approval of Investment Advisory Contracts and Management Fees - continued
Because there are no expected changes in the funds' management fees under the New Contracts, the Board will review each fund's total expenses compared to competitive fund median expenses in connection with its future consideration of the renewal of the funds' management contracts and sub-advisory agreements.
In its review of total expenses, the Board also noted that at previous meetings during the year it received and considered materials relating to its review of total expenses for each Fidelity fund. This information includes Fidelity fee structures and other information with respect to clients of FMR and its affiliates, such as other mutual funds advised or sub-advised by FMR or its affiliates, pension plan clients, and other institutional clients.
Costs of the Services and Profitability. Because there were no changes to the services to be provided or fees to be charged to the funds under the New Contracts, the Board did not consider data regarding the impact on Fidelity's costs of services, revenues, or profitability from the new arrangements to be a significant factor in its decision.
In connection with its future consideration of the renewal of each fund's management contract and sub-advisory agreements, the Board will consider the revenues earned and the expenses incurred by Fidelity in conducting the business of developing, marketing, distributing, managing, administering and servicing the funds and their shareholders.
Economies of Scale. The Board recognized that the New Contracts, like the Current Contracts, incorporate a "group fee" structure, which provides for lower fee rates as total fund assets under FMR's management increase, and for higher fee rates as total fund assets under FMR's management decrease. The Board considered that the group fee is designed to deliver the benefits of economies of scale to fund shareholders when total fund assets increase, even if assets of any particular fund are unchanged or have declined, because some portion of Fidelity's costs are attributable to services provided to all Fidelity funds, and all funds benefit if those costs can be allocated among more assets. The Board concluded that, given the group fee structure, fund shareholders will achieve a certain level of economies of scale as assets under FMR's management increase at the fund complex level, regardless of whether Fidelity achieves any such economies of scale.
In connection with its future consideration of the renewal of each fund's management contract and sub-advisory agreements, the Board will consider whether there have been economies of scale in respect of the management of the Fidelity funds, whether the Fidelity funds (including the funds) have appropriately benefited from any such economies of scale, and whether there is potential for realization of any further economies of scale.
Based on its evaluation of all of the conclusions noted above, and after considering all material factors, the Board ultimately concluded that each New Contract is fair and reasonable, and that the New Contracts should be approved and submitted to the applicable funds' shareholders for their approval.
Annual Report
Investment Adviser
Fidelity Management & Research Company
Boston, MA
Investment Sub-Advisers
FMR Co., Inc.
Fidelity Management & Research
(U.K.) Inc.
Fidelity Management & Research
(Hong Kong) Limited
Fidelity Management & Research
(Japan) Inc.
General Distributor
Fidelity Distributors Corporation
Smithfield, RI
Transfer and Service Agents
Fidelity Investments Institutional
Operations Company, Inc.
Boston, MA
Fidelity Service Company, Inc.
Boston, MA
Custodian
Brown Brothers Harriman & Co.
Boston, MA
(Fidelity Investment logo)(registered trademark)
Corporate Headquarters
245 Summer St., Boston, MA 02210
www.fidelity.com
ASGMT-UANN-0413
1.845779.106
Fidelity Advisor
Focus Funds®
Institutional Class
Fidelity Advisor® Consumer Staples Fund
Fidelity Advisor Gold Fund
Fidelity Advisor Materials Fund
Fidelity Advisor Telecommunications Fund
Each Advisor fund listed above is a class
of the Fidelity® Select Portfolios®.
Annual Report
February 28, 2013
(Fidelity Cover Art)
Contents
|
Fidelity Advisor® Consumer Staples Fund |
Performance |
|
|
|
Management's Discussion |
|
|
|
Shareholder Expense Example |
|
|
|
Investment Changes |
|
|
|
Investments |
|
|
|
Financial Statements |
|
|
|
Notes to the Financial Statements |
|
|
Fidelity Advisor Gold Fund |
Performance |
|
|
|
Management's Discussion |
|
|
|
Shareholder Expense Example |
|
|
|
Consolidated Investment Changes |
|
|
|
Consolidated Investments |
|
|
|
Consolidated Financial Statements |
|
|
|
Notes to the Consolidated Financial Statements |
|
|
Fidelity Advisor Materials Fund |
Performance |
|
|
|
Management's Discussion |
|
|
|
Shareholder Expense Example |
|
|
|
Investment Changes |
|
|
|
Investments |
|
|
|
Financial Statements |
|
|
|
Notes to the Financial Statements |
|
|
Fidelity Advisor Telecommunications Fund |
Performance |
|
|
|
Management's Discussion |
|
|
|
Shareholder Expense Example |
|
|
|
Investment Changes |
|
|
|
Investments |
|
|
|
Financial Statements |
|
|
|
Notes to the Financial Statements |
|
|
Report of Independent Registered Public Accounting Firm |
|
|
|
Trustees and Officers |
|
|
|
Distributions |
|
|
|
Board Approval of Investment Advisory Contracts and Management Fees |
|
To view a fund's proxy voting guidelines and proxy voting record for the 12-month period ended June 30, visit http://www.fidelity.com/proxyvotingresults or visit the Securities and Exchange Commission's (SEC) web site at http://www.sec.gov. You may also call 1-877-208-0098 to request a free copy of the proxy voting guidelines.
Standard & Poor's, S&P and S&P 500 are registered service marks of The McGraw-Hill Companies, Inc. and have been licensed for use by Fidelity Distributors Corporation.
Other third-party marks appearing herein are the property of their respective owners.
All other marks appearing herein are registered or unregistered trademarks or service marks of FMR LLC or an affiliated company. © 2013 FMR LLC. All rights reserved.
This report and the financial statements contained herein are submitted for the general information of the shareholders of the funds. This report is not authorized for distribution to prospective investors in the funds unless preceded or accompanied by an effective prospectus.
A fund files its complete schedule of portfolio holdings with the SEC for the first and third quarters of each fiscal year on Form N-Q. Forms N-Q are available on the SEC's web site at http://www.sec.gov. A fund's Forms N-Q may be reviewed and copied at the SEC's Public Reference Room in Washington, DC. Information regarding the operation of the SEC's Public Reference Room may be obtained by calling 1-800-SEC-0330. For a complete list of a fund's portfolio holdings, view the most recent holdings listing, semiannual report, or annual report on Fidelity's web site at http://www.fidelity.com, http://www.advisor.fidelity.com, or http://www.401k.com, as applicable.
NOT FDIC INSURED • MAY LOSE VALUE • NO BANK GUARANTEE
Neither the funds nor Fidelity Distributors Corporation is a bank.
Annual Report
Fidelity Advisor® Consumer Staples Fund - Institutional Class
Performance: The Bottom Line
Average annual total return reflects the change in the value of an investment, assuming reinvestment of the class' distributions from dividend income and capital gains (the profits earned upon the sale of securities that have grown in value, if any) and assuming a constant rate of performance each year. The $10,000 table and the fund's returns do not reflect the deduction of taxes that a shareholder would pay on fund distributions or the redemption of fund shares. During periods of reimbursement by Fidelity, a fund's total return will be greater than it would be had the reimbursement not occurred. How a fund did yesterday is no guarantee of how it will do tomorrow.
Average Annual Total Returns
|
Periods ended February 28, 2013 |
Past 1 |
Past 5 |
Past 10 |
|
Institutional Class A |
17.90% |
9.02% |
12.50% |
A The initial offering of Institutional Class shares took place on December 12, 2006. Returns prior to December 12, 2006, are those of Consumer Staples Portfolio, the original class of the fund.
Prior to October 1, 2006, the fund operated under certain different investment policies. The historical performance of the fund may not represent its current investment policies.
$10,000 Over 10 Years
Let's say hypothetically that $10,000 was invested in Fidelity Advisor Consumer Staples Fund - Institutional Class on February 28, 2003. The chart shows how the value of your investment would have changed, and also shows how the S&P 500® Index performed over the same period. The initial offering of Institutional Class took place on December 12, 2006. See the Average Annual Total Returns table for additional information regarding the performance of Institutional Class.
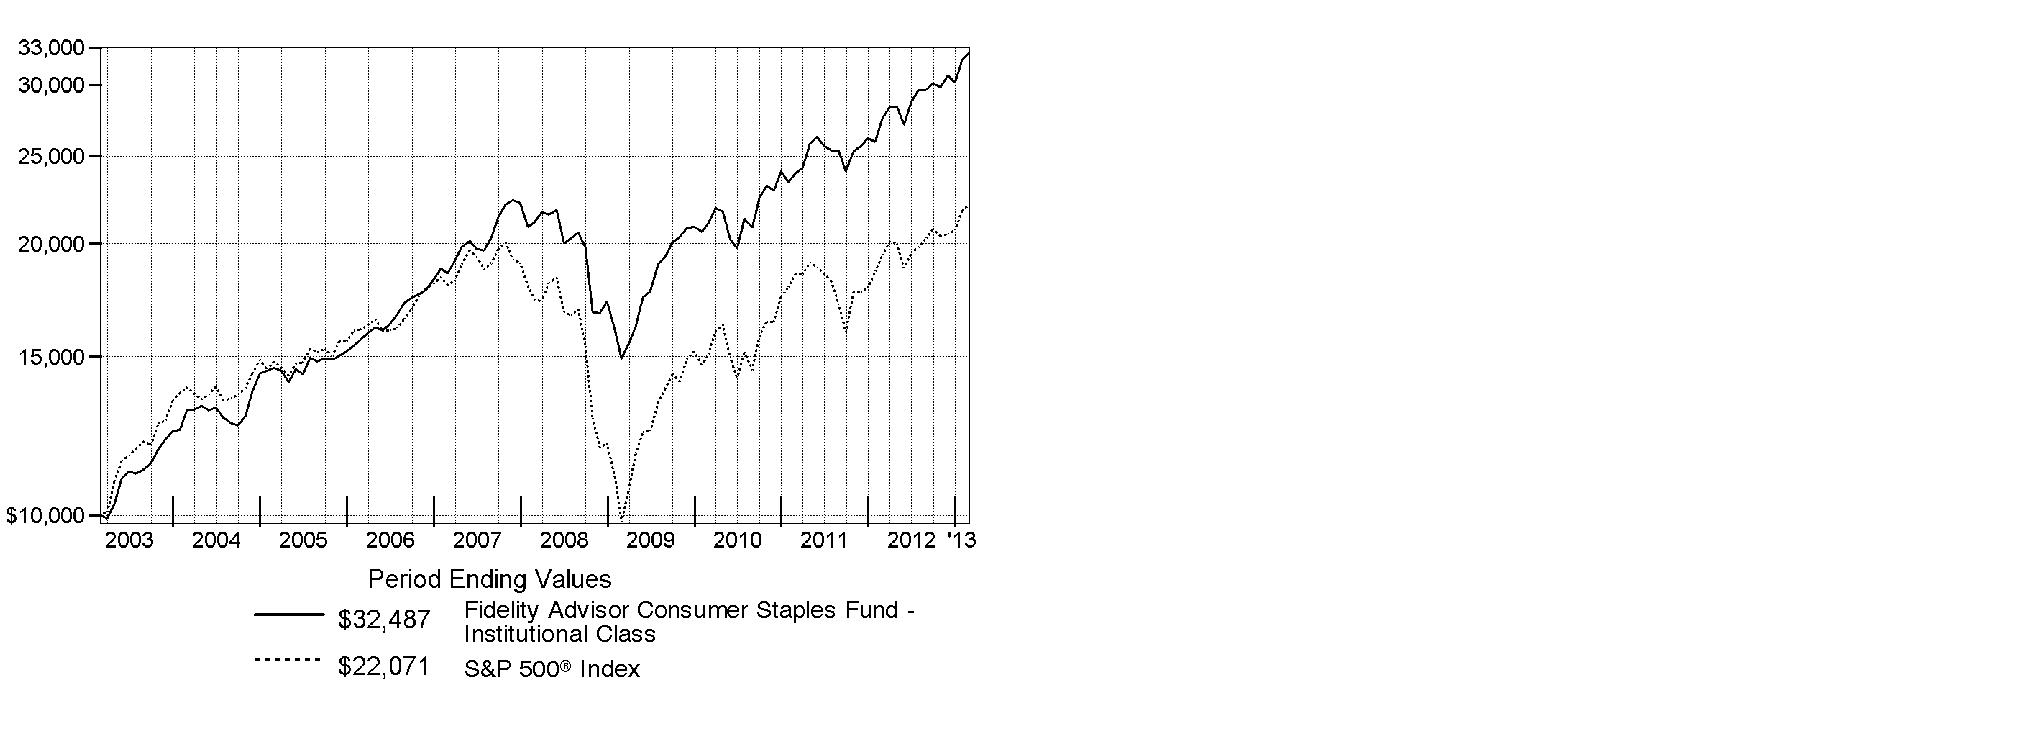
Annual Report
Fidelity Advisor Consumer Staples Fund
Management's Discussion of Fund Performance
Market Recap: U.S. stocks posted solid gains for the year ending February 28, 2013, sparked by a late-period rally that pushed major equity benchmarks to multiyear highs. Improvement in the global economy and more monetary stimulus from the U.S. Federal Reserve kept markets on the upswing for much of the year, shrugging off an early decline brought on by debt woes in Europe, and another dip later in the period amid Congressional gridlock on the federal budget. Renewed optimism over employment, the housing market, corporate earnings and record dividends made stocks a favorite with investors during the 12 months, which helped push the broad-based S&P 500® Index across the milestone 1,500 mark at the end of January. The S&P 500® finished the period up 13.46%. Seven of the 10 major market sectors tracked by MSCI U.S. IMI 25-50 classifications produced double-digit gains, led by health care and financials, while information technology, energy and materials trailed the broad equity market with only modest advances.
Comments from Robert Lee, Portfolio Manager of Fidelity Advisor® Consumer Staples Fund: For the 12 months ending February 28, 2013, the fund's Institutional Class shares returned 17.90%, modestly underperforming the 18.07% advance of the MSCI® U.S. IMI Consumer Staples 25-50 Index, but solidly outpacing the S&P 500®. The consumer staples sector outperformed during the period, driven by household products and packaged foods/meats - both groups where the fund had unfavorable positioning. However, the biggest headwind hindering performance was the portfolio's positioning in tobacco, including a very large out-of-index stake in British American Tobacco, which was the fund's biggest individual detractor. Investors became concerned with new efforts by some countries to discourage smoking, and the stock price fell. An underweighting and weak stock picking in packaged foods/meats also hurt, especially not owning H.J. Heinz, a strong-performing index component. Heinz stock got a boost in February when Warren Buffet's Berkshire Hathaway, along with Brazilian private equity group 3G Capital, announced they would acquire the ketchup maker at a premium price. Household products was another group that detracted, including not owning personal paper products manufacturer and index stock Kimberly-Clark, which outperformed the benchmark, and overweighting Procter & Gamble, the fund's single largest position, on average. In other areas, underweighting the hypermarkets/super centers area hurt, as did a position in Nu Skin Enterprises, a direct-seller of anti-aging skin care products. Elsewhere, the fund's cash position detracted, as did currency fluctuations. Since consumer staples companies tend to conduct business in many countries, exchange rate movements during the period impacted most stocks in the sector, including many held by the fund. On the positive side, positioning in distillers/vintners and stock picking in brewers buoyed the fund's relative return. In the first category, global wine and spirits distributor Constellation Brands - which was sold prior to period end - was the fund's top individual contributor. Global brewer Anheuser-Busch InBev - a non-index name also among the fund's top contributors - announced in June it would acquire the 50% of Mexican brewer Grupo Modelo that it didn't already own. As part of the deal, Anheuser-Busch allowed Constellation to take full control of the joint venture it had with the Mexican brewer for the U.S. distribution rights to Corona, Modelo's premium beer brand, which lifted Constellation's stock. A non-index position in British global spirits producer Diageo also helped here. Elsewhere, an underweighting in nutritional and weight management direct-seller Herbalife helped, as the stock took a big hit late in 2012 when a prominent investor suggested the company was a pyramid scheme, rather then a sustainable business enterprise. In the tobacco group, there were a few offsets to British American Tobacco, including an underweighting in Philip Morris International.
The views expressed above reflect those of the portfolio manager(s) only through the end of the period as stated on the cover of this report and do not necessarily represent the views of Fidelity or any other person in the Fidelity organization. Any such views are subject to change at any time based upon market or other conditions and Fidelity disclaims any responsibility to update such views. These views may not be relied on as investment advice and, because investment decisions for a Fidelity fund are based on numerous factors, may not be relied on as an indication of trading intent on behalf of any Fidelity fund.
Annual Report
Consumer Staples Portfolio
Shareholder Expense Example
As a shareholder of the Fund, you incur two types of costs: (1) transaction costs, including sales charges (loads) on purchase payments or redemption proceeds, redemption fees and (2) ongoing costs, including management fees, distribution and/or service (12b-1) fees and other Fund expenses. This Example is intended to help you understand your ongoing costs (in dollars) of investing in the Fund and to compare these costs with the ongoing costs of investing in other mutual funds.
The Example is based on an investment of $1,000 invested at the beginning of the period and held for the entire period (September 1, 2012 to February 28, 2013).
Actual Expenses
The first line of the accompanying table for each class of the Fund provides information about actual account values and actual expenses. You may use the information in this line, together with the amount you invested, to estimate the expenses that you paid over the period. Simply divide your account value by $1,000.00 (for example, an $8,600 account value divided by $1,000.00 = 8.6), then multiply the result by the number in the first line for a class of the Fund under the heading entitled "Expenses Paid During Period" to estimate the expenses you paid on your account during this period. A small balance maintenance fee of $12.00 that is charged once a year may apply for certain accounts with a value of less than $2,000. This fee is not included in the table below. If it was, the estimate of expenses you paid during the period would be higher, and your ending account value lower, by this amount. In addition, the Fund, as a shareholder in the underlying Fidelity Central Funds, will indirectly bear its pro-rata share of the fees and expenses incurred by the underlying Fidelity Central Funds. These fees and expenses are not included in the Fund's annualized expense ratio used to calculate the expense estimate in the table below.
Hypothetical Example for Comparison Purposes
The second line of the accompanying table for each class of the Fund provides information about hypothetical account values and hypothetical expenses based on a Class' actual expense ratio and an assumed rate of return of 5% per year before expenses, which is not the Class' actual return. The hypothetical account values and expenses may not be used to estimate the actual ending account balance or expenses you paid for the period. You may use this information to compare the ongoing costs of investing in the Fund and other funds. To do so, compare this 5% hypothetical example with the 5% hypothetical examples that appear in the shareholder reports of the other funds. A small balance maintenance fee of $12.00 that is charged once a year may apply for certain accounts with a value of less than $2,000. This fee is not included in the table below. If it was, the estimate of expenses you paid during the period would be higher, and your ending account value lower, by this amount. In addition, the Fund, as a shareholder in the underlying Fidelity Central Funds, will indirectly bear its pro-rata share of the fees and expenses incurred by the underlying Fidelity Central Funds. These fees and expenses are not included in the Fund's annualized expense ratio used to calculate the expense estimate in the table below.
Please note that the expenses shown in the table are meant to highlight your ongoing costs only and do not reflect any transaction costs. Therefore, the second line of the table is useful in comparing ongoing costs only, and will not help you determine the relative total costs of owning different funds. In addition, if these transactional costs were included, your costs would have been higher.
|
|
Annualized |
Beginning |
Ending |
Expenses Paid |
|
Class A |
1.08% |
|
|
|
|
Actual |
|
$ 1,000.00 |
$ 1,096.50 |
$ 5.61 |
|
HypotheticalA |
|
$ 1,000.00 |
$ 1,019.44 |
$ 5.41 |
|
Class T |
1.35% |
|
|
|
|
Actual |
|
$ 1,000.00 |
$ 1,095.00 |
$ 7.01 |
|
HypotheticalA |
|
$ 1,000.00 |
$ 1,018.10 |
$ 6.76 |
|
Class B |
1.88% |
|
|
|
|
Actual |
|
$ 1,000.00 |
$ 1,092.30 |
$ 9.75 |
|
HypotheticalA |
|
$ 1,000.00 |
$ 1,015.47 |
$ 9.39 |
|
Class C |
1.82% |
|
|
|
|
Actual |
|
$ 1,000.00 |
$ 1,092.40 |
$ 9.44 |
|
HypotheticalA |
|
$ 1,000.00 |
$ 1,015.77 |
$ 9.10 |
|
Consumer Staples |
.81% |
|
|
|
|
Actual |
|
$ 1,000.00 |
$ 1,098.10 |
$ 4.21 |
|
HypotheticalA |
|
$ 1,000.00 |
$ 1,020.78 |
$ 4.06 |
|
Institutional Class |
.85% |
|
|
|
|
Actual |
|
$ 1,000.00 |
$ 1,097.80 |
$ 4.42 |
|
HypotheticalA |
|
$ 1,000.00 |
$ 1,020.58 |
$ 4.26 |
A 5% return per year before expenses
* Expenses are equal to each Class' annualized expense ratio, multiplied by the average account value over the period, multiplied by 181/365 (to reflect the one-half year period).
Annual Report
Consumer Staples Portfolio
Investment Changes (Unaudited)
|
Top Ten Stocks as of February 28, 2013 |
||
|
|
% of fund's |
% of fund's net assets |
|
British American Tobacco PLC sponsored ADR |
13.9 |
13.8 |
|
Procter & Gamble Co. |
13.1 |
14.9 |
|
The Coca-Cola Co. |
11.7 |
10.8 |
|
CVS Caremark Corp. |
7.3 |
7.1 |
|
Altria Group, Inc. |
4.8 |
4.5 |
|
Colgate-Palmolive Co. |
3.0 |
2.9 |
|
Wal-Mart Stores, Inc. |
2.9 |
2.0 |
|
Philip Morris International, Inc. |
2.5 |
2.4 |
|
Diageo PLC sponsored ADR |
2.5 |
3.1 |
|
Bunge Ltd. |
2.2 |
2.1 |
|
|
63.9 |
|
|
Top Industries (% of fund's net assets) |
|||
|
As of February 28, 2013 |
|||
 |
Beverages |
25.4% |
|
 |
Tobacco |
22.7% |
|
 |
Household Products |
16.1% |
|
 |
Food & Staples Retailing |
15.1% |
|
 |
Food Products |
10.7% |
|
 |
All Others* |
10.0% |
|

|
As of August 31, 2012 |
|||
|
Beverages |
28.9% |
|
|
Tobacco |
21.6% |
|
|
Household Products |
18.4% |
|
|
Food & Staples Retailing |
12.4% |
|
|
Food Products |
9.4% |
|
|
All Others* |
9.3% |
|

|
* Includes short-term investments and net other assets. |
Annual Report
Consumer Staples Portfolio
Investments February 28, 2013
Showing Percentage of Net Assets
|
Common Stocks - 94.4% |
|||
|
Shares |
Value |
||
|
BEVERAGES - 25.4% |
|||
|
Brewers - 4.3% |
|||
|
Anheuser-Busch InBev SA NV |
518,028 |
$ 48,546,936 |
|
|
Companhia de Bebidas das Americas (AmBev) (PN) sponsored ADR |
246,385 |
10,934,566 |
|
|
Compania Cervecerias Unidas SA sponsored ADR |
174,000 |
5,688,060 |
|
|
SABMiller PLC |
651,700 |
32,398,437 |
|
|
|
97,567,999 |
||
|
Distillers & Vintners - 5.9% |
|||
|
Diageo PLC sponsored ADR |
472,177 |
56,524,309 |
|
|
Pernod Ricard SA |
351,601 |
45,623,258 |
|
|
Remy Cointreau SA |
260,060 |
32,865,665 |
|
|
|
135,013,232 |
||
|
Soft Drinks - 15.2% |
|||
|
Coca-Cola Bottling Co. CONSOLIDATED |
92,245 |
6,035,590 |
|
|
Coca-Cola FEMSA SAB de CV sponsored ADR (d) |
34,829 |
5,873,563 |
|
|
Coca-Cola Hellenic Bottling Co. SA sponsored ADR |
78,006 |
2,105,382 |
|
|
Coca-Cola Icecek A/S |
363,162 |
8,580,140 |
|
|
Embotelladora Andina SA: |
|
|
|
|
ADR |
43,689 |
1,438,242 |
|
|
sponsored ADR (d) |
241,600 |
10,110,960 |
|
|
Fomento Economico Mexicano S.A.B. de CV sponsored ADR |
51,187 |
5,719,635 |
|
|
PepsiCo, Inc. |
528,471 |
40,042,248 |
|
|
The Coca-Cola Co. |
6,925,452 |
268,153,501 |
|
|
|
348,059,261 |
||
|
TOTAL BEVERAGES |
580,640,492 |
||
|
FOOD & STAPLES RETAILING - 15.1% |
|||
|
Drug Retail - 9.1% |
|||
|
CVS Caremark Corp. |
3,263,883 |
166,849,699 |
|
|
Drogasil SA |
516,400 |
5,953,444 |
|
|
Walgreen Co. |
856,660 |
35,071,660 |
|
|
|
207,874,803 |
||
|
Food Distributors - 0.2% |
|||
|
Chefs' Warehouse Holdings (a) |
230,800 |
4,154,400 |
|
|
Food Retail - 2.9% |
|||
|
Fresh Market, Inc. (a) |
120,828 |
5,633,001 |
|
|
Kroger Co. |
1,746,368 |
51,011,409 |
|
|
Susser Holdings Corp. (a) |
67,400 |
2,984,472 |
|
|
The Pantry, Inc. (a) |
473,635 |
5,892,019 |
|
|
|
65,520,901 |
||
|
Hypermarkets & Super Centers - 2.9% |
|||
|
Wal-Mart Stores, Inc. |
946,186 |
66,971,045 |
|
|
TOTAL FOOD & STAPLES RETAILING |
344,521,149 |
||
|
|
|||
|
Shares |
Value |
||
|
FOOD PRODUCTS - 10.7% |
|||
|
Agricultural Products - 3.3% |
|||
|
Archer Daniels Midland Co. |
618,163 |
$ 19,694,673 |
|
|
Bunge Ltd. |
690,273 |
51,156,132 |
|
|
First Resources Ltd. |
1,413,000 |
2,219,222 |
|
|
SLC Agricola SA |
253,600 |
2,482,958 |
|
|
|
75,552,985 |
||
|
Packaged Foods & Meats - 7.4% |
|||
|
Annie's, Inc. |
133,141 |
5,586,596 |
|
|
Green Mountain Coffee Roasters, Inc. (a) |
290,737 |
13,885,599 |
|
|
Hain Celestial Group, Inc. (a)(d) |
144,901 |
7,933,330 |
|
|
Lindt & Spruengli AG |
141 |
6,016,532 |
|
|
Mead Johnson Nutrition Co. Class A |
582,216 |
43,613,801 |
|
|
Nestle SA |
490,726 |
34,257,861 |
|
|
Orion Corp. |
2,360 |
2,328,767 |
|
|
TreeHouse Foods, Inc. (a) |
116,200 |
6,784,918 |
|
|
Ulker Biskuvi Sanayi A/S |
647,525 |
4,085,615 |
|
|
Unilever NV (NY Reg.) |
1,106,950 |
43,082,494 |
|
|
Want Want China Holdings Ltd. |
1,408,000 |
1,975,223 |
|
|
|
169,550,736 |
||
|
TOTAL FOOD PRODUCTS |
245,103,721 |
||
|
HOUSEHOLD PRODUCTS - 16.1% |
|||
|
Household Products - 16.1% |
|||
|
Colgate-Palmolive Co. |
587,471 |
67,224,307 |
|
|
Procter & Gamble Co. |
3,940,134 |
300,159,408 |
|
|
|
367,383,715 |
||
|
PERSONAL PRODUCTS - 2.4% |
|||
|
Personal Products - 2.4% |
|||
|
Hengan International Group Co. Ltd. |
556,500 |
5,647,087 |
|
|
Herbalife Ltd. |
128,590 |
5,180,891 |
|
|
L'Oreal SA |
197,600 |
29,551,229 |
|
|
Natura Cosmeticos SA |
38,700 |
999,075 |
|
|
Nu Skin Enterprises, Inc. Class A (d) |
311,404 |
12,829,845 |
|
|
|
54,208,127 |
||
|
PHARMACEUTICALS - 2.0% |
|||
|
Pharmaceuticals - 2.0% |
|||
|
Johnson & Johnson |
604,160 |
45,982,618 |
|
|
TOBACCO - 22.7% |
|||
|
Tobacco - 22.7% |
|||
|
Altria Group, Inc. |
3,272,917 |
109,806,365 |
|
|
British American Tobacco PLC sponsored ADR |
3,040,566 |
317,070,226 |
|
|
Imperial Tobacco Group PLC |
90,889 |
3,295,407 |
|
|
ITC Ltd. |
865,740 |
4,694,136 |
|
|
Japan Tobacco, Inc. |
176,200 |
5,560,308 |
|
|
Lorillard, Inc. |
357,233 |
13,767,760 |
|
|
Philip Morris International, Inc. |
618,358 |
56,734,347 |
|
|
Common Stocks - continued |
|||
|
Shares |
Value |
||
|
TOBACCO - CONTINUED |
|||
|
Tobacco - continued |
|||
|
Souza Cruz SA |
548,600 |
$ 8,755,317 |
|
|
Swedish Match Co. AB |
23,600 |
772,873 |
|
|
|
520,456,739 |
||
|
TOTAL COMMON STOCKS (Cost $1,604,527,630) |
|
||
|
Money Market Funds - 6.8% |
|||
|
|
|
|
|
|
Fidelity Cash Central Fund, 0.16% (b) |
135,004,801 |
135,004,801 |
|
|
Fidelity Securities Lending Cash Central Fund, 0.16% (b)(c) |
19,694,623 |
19,694,623 |
|
|
TOTAL MONEY MARKET FUNDS (Cost $154,699,424) |
|
||
|
TOTAL INVESTMENT PORTFOLIO - 101.2% (Cost $1,759,227,054) |
2,312,995,985 |
|
|
NET OTHER ASSETS (LIABILITIES) - (1.2)% |
(26,342,857) |
|
|
NET ASSETS - 100% |
$ 2,286,653,128 |
|
|
Legend |
|
(a) Non-income producing |
|
(b) Affiliated fund that is generally available only to investment companies and other accounts managed by Fidelity Investments. The rate quoted is the annualized seven-day yield of the fund at period end. A complete unaudited listing of the fund's holdings as of its most recent quarter end is available upon request. In addition, each Fidelity Central Fund's financial statements, which are not covered by the Fund's Report of Independent Registered Public Accounting Firm, are available on the SEC's websiteor upon request. |
|
(c) Investment made with cash collateral received from securities on loan. |
|
(d) Security or a portion of the security is on loan at period end. |
|
Affiliated Central Funds |
|
Information regarding fiscal year to date income earned by the Fund from investments in Fidelity Central Funds is as follows: |
|
Fund |
Income earned |
|
Fidelity Cash Central Fund |
$ 120,502 |
|
Fidelity Securities Lending Cash Central Fund |
405,984 |
|
Total |
$ 526,486 |
|
Other Information |
|
The following is a summary of the inputs used, as of February 28, 2013, involving the Fund's assets and liabilities carried at fair value. The inputs or methodology used for valuing securities may not be an indication of the risk associated with investing in those securities. For more information on valuation inputs, and their aggregation into the levels used in the tables below, please refer to the Investment Valuation section in the accompanying Notes to Financial Statements. |
|
Valuation Inputs at Reporting Date: |
||||
|
Description |
Total |
Level 1 |
Level 2 |
Level 3 |
|
Investments in Securities: |
||||
|
Common Stocks |
$ 2,158,296,561 |
$ 2,075,491,764 |
$ 82,804,797 |
$ - |
|
Money Market Funds |
154,699,424 |
154,699,424 |
- |
- |
|
Total Investments in Securities: |
$ 2,312,995,985 |
$ 2,230,191,188 |
$ 82,804,797 |
$ - |
|
The following is a summary of transfers between Level 1 and Level 2 for the period ended February 28, 2013. Transfers are assumed to have occurred at the beginning of the period, and are primarily attributable to the valuation techniques used for foreign equity securities, as discussed in the accompanying Notes to Financial Statements: |
|
Transfers |
Total |
|
Level 1 to Level 2 |
$ 23,412,228 |
|
Level 2 to Level 1 |
$ 0 |
|
Distribution of investments by country or territory of incorporation, as a percentage of total net assets, is as follows. (Unaudited) |
|
United States of America |
64.9% |
|
United Kingdom |
17.9% |
|
France |
4.7% |
|
Bermuda |
2.2% |
|
Belgium |
2.1% |
|
Netherlands |
1.9% |
|
Switzerland |
1.8% |
|
Brazil |
1.3% |
|
Others (Individually Less Than 1%) |
3.2% |
|
|
100.0% |
See accompanying notes which are an integral part of the financial statements.
Annual Report
Consumer Staples Portfolio
Financial Statements
Statement of Assets and Liabilities
|
|
February 28, 2013 |
|
|
|
|
|
|
Assets |
|
|
|
Investment in securities, at value (including securities loaned of $19,706,774) - See accompanying schedule: Unaffiliated issuers (cost $1,604,527,630) |
$ 2,158,296,561 |
|
|
Fidelity Central Funds (cost $154,699,424) |
154,699,424 |
|
|
Total Investments (cost $1,759,227,054) |
|
$ 2,312,995,985 |
|
Receivable for investments sold |
|
1,783,758 |
|
Receivable for fund shares sold |
|
5,431,937 |
|
Dividends receivable |
|
2,627,051 |
|
Distributions receivable from Fidelity Central Funds |
|
24,231 |
|
Prepaid expenses |
|
4,222 |
|
Receivable from investment advisor for expense reductions |
|
5,568 |
|
Other receivables |
|
36,756 |
|
Total assets |
|
2,322,909,508 |
|
|
|
|
|
Liabilities |
|
|
|
Payable for investments purchased |
$ 12,421,277 |
|
|
Payable for fund shares redeemed |
2,355,633 |
|
|
Accrued management fee |
1,047,248 |
|
|
Distribution and service plan fees payable |
204,748 |
|
|
Other affiliated payables |
440,332 |
|
|
Other payables and accrued expenses |
92,519 |
|
|
Collateral on securities loaned, at value |
19,694,623 |
|
|
Total liabilities |
|
36,256,380 |
|
|
|
|
|
Net Assets |
|
$ 2,286,653,128 |
|
Net Assets consist of: |
|
|
|
Paid in capital |
|
$ 1,671,219,940 |
|
Undistributed net investment income |
|
5,461,626 |
|
Accumulated undistributed net realized gain (loss) on investments and foreign currency transactions |
|
56,208,926 |
|
Net unrealized appreciation (depreciation) on investments and assets and liabilities in foreign currencies |
|
553,762,636 |
|
Net Assets |
|
$ 2,286,653,128 |
Statement of Assets and Liabilities - continued
|
|
February 28, 2013 |
|
|
|
|
|
|
Calculation of Maximum Offering Price Class A: |
|
$ 85.67 |
|
|
|
|
|
Maximum offering price per share (100/94.25 of $85.67) |
|
$ 90.90 |
|
Class T: |
|
$ 85.18 |
|
|
|
|
|
Maximum offering price per share (100/96.50 of $85.18) |
|
$ 88.27 |
|
Class B: |
|
$ 84.72 |
|
|
|
|
|
Class C: |
|
$ 84.28 |
|
|
|
|
|
Consumer Staples: |
|
$ 86.17 |
|
|
|
|
|
Institutional Class: |
|
$ 85.92 |
A Redemption price per share is equal to net asset value less any applicable contingent deferred sales charge.
See accompanying notes which are an integral part of the financial statements.
Annual Report
Statement of Operations
|
|
Year ended February 28, 2013 |
|
|
|
|
|
|
Investment Income |
|
|
|
Dividends |
|
$ 52,098,555 |
|
Interest |
|
18 |
|
Income from Fidelity Central Funds |
|
526,486 |
|
Total income |
|
52,625,059 |
|
|
|
|
|
Expenses |
|
|
|
Management fee |
$ 11,043,981 |
|
|
Transfer agent fees |
4,239,572 |
|
|
Distribution and service plan fees |
2,164,521 |
|
|
Accounting and security lending fees |
606,347 |
|
|
Custodian fees and expenses |
83,430 |
|
|
Independent trustees' compensation |
12,804 |
|
|
Registration fees |
202,756 |
|
|
Audit |
46,276 |
|
|
Legal |
7,103 |
|
|
Interest |
887 |
|
|
Miscellaneous |
16,586 |
|
|
Total expenses before reductions |
18,424,263 |
|
|
Expense reductions |
(125,364) |
18,298,899 |
|
Net investment income (loss) |
|
34,326,160 |
|
Realized and Unrealized Gain (Loss) Net realized gain (loss) on: |
|
|
|
Investment securities: |
|
|
|
Unaffiliated issuers |
94,857,369 |
|
|
Foreign currency transactions |
(47,642) |
|
|
Total net realized gain (loss) |
|
94,809,727 |
|
Change in net unrealized appreciation (depreciation) on: Investment securities (net of increase in deferred foreign taxes of $5,845) |
198,080,167 |
|
|
Assets and liabilities in foreign currencies |
(8,773) |
|
|
Total change in net unrealized appreciation (depreciation) |
|
198,071,394 |
|
Net gain (loss) |
|
292,881,121 |
|
Net increase (decrease) in net assets resulting from operations |
|
$ 327,207,281 |
Statement of Changes in Net Assets
|
|
Year ended |
Year ended |
|
Increase (Decrease) in Net Assets |
|
|
|
Operations |
|
|
|
Net investment income (loss) |
$ 34,326,160 |
$ 29,195,620 |
|
Net realized gain (loss) |
94,809,727 |
36,347,219 |
|
Change in net unrealized appreciation (depreciation) |
198,071,394 |
157,954,804 |
|
Net increase (decrease) in net assets resulting from operations |
327,207,281 |
223,497,643 |
|
Distributions to shareholders from net investment income |
(31,344,671) |
(25,900,882) |
|
Distributions to shareholders from net realized gain |
(29,546,659) |
(36,216,657) |
|
Total distributions |
(60,891,330) |
(62,117,539) |
|
Share transactions - net increase (decrease) |
287,768,850 |
162,381,495 |
|
Redemption fees |
35,035 |
45,851 |
|
Total increase (decrease) in net assets |
554,119,836 |
323,807,450 |
|
|
|
|
|
Net Assets |
|
|
|
Beginning of period |
1,732,533,292 |
1,408,725,842 |
|
End of period (including undistributed net investment income of $5,461,626 and undistributed net investment income of $3,220,648, respectively) |
$ 2,286,653,128 |
$ 1,732,533,292 |
See accompanying notes which are an integral part of the financial statements.
Annual Report
Financial Highlights - Class A
|
Years ended February 28, |
2013 |
2012 G |
2011 |
2010 |
2009 |
|
Selected Per-Share Data |
|
|
|
|
|
|
Net asset value, beginning of period |
$ 74.90 |
$ 67.65 |
$ 61.06 |
$ 43.94 |
$ 63.13 |
|
Income from Investment Operations |
|
|
|
|
|
|
Net investment income (loss) C |
1.26 |
1.22 |
.98 |
.84 |
.67 |
|
Net realized and unrealized gain (loss) |
11.73 |
8.73 |
7.10 |
17.02 |
(19.19) |
|
Total from investment operations |
12.99 |
9.95 |
8.08 |
17.86 |
(18.52) |
|
Distributions from net investment income |
(1.08) |
(1.06) |
(.83) |
(.74) |
(.66) |
|
Distributions from net realized gain |
(1.14) |
(1.64) |
(.66) |
- |
(.02) |
|
Total distributions |
(2.22) |
(2.70) |
(1.49) |
(.74) |
(.68) I |
|
Redemption fees added to paid in capital C |
- H |
- H |
- H |
- H |
.01 |
|
Net asset value, end of period |
$ 85.67 |
$ 74.90 |
$ 67.65 |
$ 61.06 |
$ 43.94 |
|
Total Return A,B |
17.60% |
15.00% |
13.27% |
40.66% |
(29.43)% |
|
Ratios to Average Net Assets D,F |
|
|
|
|
|
|
Expenses before reductions |
1.08% |
1.10% |
1.11% |
1.13% |
1.19% |
|
Expenses net of fee waivers, if any |
1.08% |
1.10% |
1.11% |
1.13% |
1.19% |
|
Expenses net of all reductions |
1.08% |
1.09% |
1.11% |
1.13% |
1.18% |
|
Net investment income (loss) |
1.58% |
1.74% |
1.53% |
1.51% |
1.27% |
|
Supplemental Data |
|
|
|
|
|
|
Net assets, end of period (000 omitted) |
$ 277,329 |
$ 205,851 |
$ 160,526 |
$ 162,370 |
$ 121,193 |
|
Portfolio turnover rate E |
28% |
35% |
57% |
69% |
70% |
A Total returns would have been lower if certain expenses had not been reduced during the applicable periods shown.
B Total returns do not include the effect of the sales charges.
C Calculated based on average shares outstanding during the period.
D Fees and expenses of any underlying Fidelity Central Funds are not included in the Fund's expense ratio. The Fund indirectly bears its proportionate share of the expenses of any underlying Fidelity Central Funds.
E Amount does not include the portfolio activity of any underlying Fidelity Central Funds.
F Expense ratios reflect operating expenses of the class. Expenses before reductions do not reflect amounts reimbursed by the investment adviser or reductions from brokerage service arrangements or reductions from other expense offset arrangements and do not represent the amount paid by the class during periods when reimbursements or reductions occur. Expenses net of fee waivers reflect expenses after reimbursement by the investment adviser but prior to reductions from brokerage service arrangements or other expense offset arrangements. Expenses net of all reductions represent the net expenses paid by the class.
G For the year ended February 29.
H Amount represents less than $.01 per share.
I Total distributions of $.68 per share is comprised of distributions from net investment income of $.655 and distributions from net realized gain of $.024 per share.
Financial Highlights - Class T
|
Years ended February 28, |
2013 |
2012 G |
2011 |
2010 |
2009 |
|
Selected Per-Share Data |
|
|
|
|
|
|
Net asset value, beginning of period |
$ 74.49 |
$ 67.30 |
$ 60.77 |
$ 43.75 |
$ 62.93 |
|
Income from Investment Operations |
|
|
|
|
|
|
Net investment income (loss) C |
1.03 |
1.01 |
.79 |
.66 |
.53 |
|
Net realized and unrealized gain (loss) |
11.68 |
8.68 |
7.05 |
16.95 |
(19.12) |
|
Total from investment operations |
12.71 |
9.69 |
7.84 |
17.61 |
(18.59) |
|
Distributions from net investment income |
(.88) |
(.86) |
(.65) |
(.59) |
(.60) |
|
Distributions from net realized gain |
(1.14) |
(1.64) |
(.66) |
- |
- |
|
Total distributions |
(2.02) |
(2.50) |
(1.31) |
(.59) |
(.60) I |
|
Redemption fees added to paid in capital C |
- H |
- H |
- H |
- H |
.01 |
|
Net asset value, end of period |
$ 85.18 |
$ 74.49 |
$ 67.30 |
$ 60.77 |
$ 43.75 |
|
Total Return A,B |
17.29% |
14.67% |
12.93% |
40.24% |
(29.61)% |
|
Ratios to Average Net Assets D,F |
|
|
|
|
|
|
Expenses before reductions |
1.36% |
1.38% |
1.40% |
1.44% |
1.46% |
|
Expenses net of fee waivers, if any |
1.36% |
1.38% |
1.40% |
1.44% |
1.46% |
|
Expenses net of all reductions |
1.35% |
1.38% |
1.40% |
1.44% |
1.46% |
|
Net investment income (loss) |
1.30% |
1.45% |
1.24% |
1.21% |
.99% |
|
Supplemental Data |
|
|
|
|
|
|
Net assets, end of period (000 omitted) |
$ 52,024 |
$ 39,047 |
$ 31,496 |
$ 29,662 |
$ 22,624 |
|
Portfolio turnover rate E |
28% |
35% |
57% |
69% |
70% |
A Total returns would have been lower if certain expenses had not been reduced during the applicable periods shown.
B Total returns do not include the effect of the sales charges.
C Calculated based on average shares outstanding during the period.
D Fees and expenses of any underlying Fidelity Central Funds are not included in the Fund's expense ratio. The Fund indirectly bears its proportionate share of the expenses of any underlying Fidelity Central Funds.
E Amount does not include the portfolio activity of any underlying Fidelity Central Funds.
F Expense ratios reflect operating expenses of the class. Expenses before reductions do not reflect amounts reimbursed by the investment adviser or reductions from brokerage service arrangements or reductions from other expense offset arrangements and do not represent the amount paid by the class during periods when reimbursements or reductions occur. Expenses net of fee waivers reflect expenses after reimbursement by the investment adviser but prior to reductions from brokerage service arrangements or other expense offset arrangements. Expenses net of all reductions represent the net expenses paid by the class.
G For the year ended February 29.
H Amount represents less than $.01 per share.
I Total distributions of $.60 per share is comprised of distributions from net investment income of $.599 and distributions from net realized gain of $.000 per share.
See accompanying notes which are an integral part of the financial statements.
Annual Report
Financial Highlights - Class B
|
Years ended February 28, |
2013 |
2012 G |
2011 |
2010 |
2009 |
|
Selected Per-Share Data |
|
|
|
|
|
|
Net asset value, beginning of period |
$ 74.01 |
$ 66.83 |
$ 60.37 |
$ 43.53 |
$ 62.69 |
|
Income from Investment Operations |
|
|
|
|
|
|
Net investment income (loss) C |
.61 |
.64 |
.46 |
.37 |
.26 |
|
Net realized and unrealized gain (loss) |
11.61 |
8.61 |
6.98 |
16.82 |
(19.01) |
|
Total from investment operations |
12.22 |
9.25 |
7.44 |
17.19 |
(18.75) |
|
Distributions from net investment income |
(.37) |
(.43) |
(.32) |
(.35) |
(.42) |
|
Distributions from net realized gain |
(1.14) |
(1.64) |
(.66) |
- |
- |
|
Total distributions |
(1.51) |
(2.07) |
(.98) |
(.35) |
(.42) I |
|
Redemption fees added to paid in capital C |
- H |
- H |
- H |
- H |
.01 |
|
Net asset value, end of period |
$ 84.72 |
$ 74.01 |
$ 66.83 |
$ 60.37 |
$ 43.53 |
|
Total Return A,B |
16.68% |
14.06% |
12.35% |
39.48% |
(29.96)% |
|
Ratios to Average Net Assets D,F |
|
|
|
|
|
|
Expenses before reductions |
1.89% |
1.91% |
1.91% |
1.97% |
1.96% |
|
Expenses net of fee waivers, if any |
1.89% |
1.91% |
1.91% |
1.97% |
1.96% |
|
Expenses net of all reductions |
1.88% |
1.90% |
1.91% |
1.97% |
1.96% |
|
Net investment income (loss) |
.78% |
.93% |
.73% |
.68% |
.50% |
|
Supplemental Data |
|
|
|
|
|
|
Net assets, end of period (000 omitted) |
$ 18,548 |
$ 19,330 |
$ 20,033 |
$ 21,099 |
$ 14,929 |
|
Portfolio turnover rate E |
28% |
35% |
57% |
69% |
70% |
A Total returns would have been lower if certain expenses had not been reduced during the applicable periods shown.
B Total returns do not include the effect of the contingent deferred sales charge.
C Calculated based on average shares outstanding during the period.
D Fees and expenses of any underlying Fidelity Central Funds are not included in the Fund's expense ratio. The Fund indirectly bears its proportionate share of the expenses of any underlying Fidelity Central Funds.
E Amount does not include the portfolio activity of any underlying Fidelity Central Funds.
F Expense ratios reflect operating expenses of the class. Expenses before reductions do not reflect amounts reimbursed by the investment adviser or reductions from brokerage service arrangements or reductions from other expense offset arrangements and do not represent the amount paid by the class during periods when reimbursements or reductions occur. Expenses net of fee waivers reflect expenses after reimbursement by the investment adviser but prior to reductions from brokerage service arrangements or other expense offset arrangements. Expenses net of all reductions represent the net expenses paid by the class.
G For the year ended February 29.
H Amount represents less than $.01 per share.
I Total distributions of $.42 per share is comprised of distributions from net investment income of $.418 and distributions from net realized gain of $.000 per share.
Financial Highlights - Class C
|
Years ended February 28, |
2013 |
2012 G |
2011 |
2010 |
2009 |
|
Selected Per-Share Data |
|
|
|
|
|
|
Net asset value, beginning of period |
$ 73.75 |
$ 66.71 |
$ 60.29 |
$ 43.46 |
$ 62.61 |
|
Income from Investment Operations |
|
|
|
|
|
|
Net investment income (loss) C |
.65 |
.68 |
.49 |
.41 |
.28 |
|
Net realized and unrealized gain (loss) |
11.55 |
8.59 |
7.00 |
16.80 |
(19.00) |
|
Total from investment operations |
12.20 |
9.27 |
7.49 |
17.21 |
(18.72) |
|
Distributions from net investment income |
(.53) |
(.59) |
(.41) |
(.38) |
(.44) |
|
Distributions from net realized gain |
(1.14) |
(1.64) |
(.66) |
- |
- |
|
Total distributions |
(1.67) |
(2.23) |
(1.07) |
(.38) |
(.44) I |
|
Redemption fees added to paid in capital C |
- H |
- H |
- H |
- H |
.01 |
|
Net asset value, end of period |
$ 84.28 |
$ 73.75 |
$ 66.71 |
$ 60.29 |
$ 43.46 |
|
Total Return A,B |
16.73% |
14.14% |
12.44% |
39.59% |
(29.94)% |
|
Ratios to Average Net Assets D,F |
|
|
|
|
|
|
Expenses before reductions |
1.83% |
1.85% |
1.86% |
1.90% |
1.93% |
|
Expenses net of fee waivers, if any |
1.83% |
1.85% |
1.86% |
1.90% |
1.93% |
|
Expenses net of all reductions |
1.82% |
1.84% |
1.85% |
1.89% |
1.93% |
|
Net investment income (loss) |
.83% |
.99% |
.79% |
.75% |
.52% |
|
Supplemental Data |
|
|
|
|
|
|
Net assets, end of period (000 omitted) |
$ 134,966 |
$ 102,321 |
$ 81,239 |
$ 73,829 |
$ 54,902 |
|
Portfolio turnover rate E |
28% |
35% |
57% |
69% |
70% |
A Total returns would have been lower if certain expenses had not been reduced during the applicable periods shown.
B Total returns do not include the effect of the contingent deferred sales charge.
C Calculated based on average shares outstanding during the period.
D Fees and expenses of any underlying Fidelity Central Funds are not included in the Fund's expense ratio. The Fund indirectly bears its proportionate share of the expenses of any underlying Fidelity Central Funds.
E Amount does not include the portfolio activity of any underlying Fidelity Central Funds.
F Expense ratios reflect operating expenses of the class. Expenses before reductions do not reflect amounts reimbursed by the investment adviser or reductions from brokerage service arrangements or reductions from other expense offset arrangements and do not represent the amount paid by the class during periods when reimbursements or reductions occur. Expenses net of fee waivers reflect expenses after reimbursement by the investment adviser but prior to reductions from brokerage service arrangements or other expense offset arrangements. Expenses net of all reductions represent the net expenses paid by the class.
G For the year ended February 29.
H Amount represents less than $.01 per share.
I Total distributions of $.44 per share is comprised of distributions from net investment income of $.443 and distributions from net realized gain of $.000 per share.
See accompanying notes which are an integral part of the financial statements.
Annual Report
Financial Highlights - Consumer Staples
|
Years ended February 28, |
2013 |
2012 G |
2011 |
2010 |
2009 |
|
Selected Per-Share Data |
|
|
|
|
|
|
Net asset value, beginning of period |
$ 75.29 |
$ 67.98 |
$ 61.34 |
$ 44.14 |
$ 63.25 |
|
Income from Investment Operations |
|
|
|
|
|
|
Net investment income (loss) C |
1.48 |
1.42 |
1.14 |
.96 |
.88 |
|
Net realized and unrealized gain (loss) |
11.82 |
8.76 |
7.14 |
17.11 |
(19.31) |
|
Total from investment operations |
13.30 |
10.18 |
8.28 |
18.07 |
(18.43) |
|
Distributions from net investment income |
(1.28) |
(1.24) |
(.98) |
(.87) |
(.67) |
|
Distributions from net realized gain |
(1.14) |
(1.64) |
(.66) |
- |
(.03) |
|
Total distributions |
(2.42) |
(2.87) J |
(1.64) |
(.87) |
(.69) I |
|
Redemption fees added to paid in capital C |
- H |
- H |
- H |
- H |
.01 |
|
Net asset value, end of period |
$ 86.17 |
$ 75.29 |
$ 67.98 |
$ 61.34 |
$ 44.14 |
|
Total Return A,B |
17.94% |
15.30% |
13.55% |
40.96% |
(29.23)% |
|
Ratios to Average Net Assets D,F |
|
|
|
|
|
|
Expenses before reductions |
.81% |
.83% |
.86% |
.92% |
.91% |
|
Expenses net of fee waivers, if any |
.81% |
.83% |
.86% |
.92% |
.91% |
|
Expenses net of all reductions |
.80% |
.82% |
.86% |
.91% |
.90% |
|
Net investment income (loss) |
1.85% |
2.01% |
1.78% |
1.73% |
1.55% |
|
Supplemental Data |
|
|
|
|
|
|
Net assets, end of period (000 omitted) |
$ 1,425,055 |
$ 1,202,440 |
$ 877,548 |
$ 946,455 |
$ 657,263 |
|
Portfolio turnover rate E |
28% |
35% |
57% |
69% |
70% |
A Total returns would have been lower if certain expenses had not been reduced during the applicable periods shown.
B Total returns do not include the effect of the former sales charges.
C Calculated based on average shares outstanding during the period.
D Fees and expenses of any underlying Fidelity Central Funds are not included in the Fund's expense ratio. The Fund indirectly bears its proportionate share of the expenses of any underlying Fidelity Central Funds.
E Amount does not include the portfolio activity of any underlying Fidelity Central Funds.
F Expense ratios reflect operating expenses of the class. Expenses before reductions do not reflect amounts reimbursed by the investment adviser or reductions from brokerage service arrangements or reductions from other expense offset arrangements and do not represent the amount paid by the class during periods when reimbursements or reductions occur. Expenses net of fee waivers reflect expenses after reimbursement by the investment adviser but prior to reductions from brokerage service arrangements or other expense offset arrangements. Expenses net of all reductions represent the net expenses paid by the class.
G For the year ended February 29.
H Amount represents less than $.01 per share.
I Total distributions of $.69 per share is comprised of distributions from net investment income of $.668 and distributions from net realized gain of $.025 per share.
J Total distributions of $2.87 per share is comprised of distributions from net investment income of $1.236 and distributions from net realized gain of $1.637 per share.
Financial Highlights - Institutional Class
|
Years ended February 28, |
2013 |
2012 F |
2011 |
2010 |
2009 |
|
Selected Per-Share Data |
|
|
|
|
|
|
Net asset value, beginning of period |
$ 75.14 |
$ 67.84 |
$ 61.26 |
$ 44.07 |
$ 63.22 |
|
Income from Investment Operations |
|
|
|
|
|
|
Net investment income (loss) B |
1.45 |
1.39 |
1.15 |
.98 |
.82 |
|
Net realized and unrealized gain (loss) |
11.79 |
8.73 |
7.13 |
17.09 |
(19.23) |
|
Total from investment operations |
13.24 |
10.12 |
8.28 |
18.07 |
(18.41) |
|
Distributions from net investment income |
(1.32) |
(1.19) |
(1.04) |
(.88) |
(.73) |
|
Distributions from net realized gain |
(1.14) |
(1.64) |
(.66) |
- |
(.03) |
|
Total distributions |
(2.46) |
(2.82) I |
(1.70) |
(.88) |
(.75) H |
|
Redemption fees added to paid in capital B |
- G |
- G |
- G |
- G |
.01 |
|
Net asset value, end of period |
$ 85.92 |
$ 75.14 |
$ 67.84 |
$ 61.26 |
$ 44.07 |
|
Total Return A |
17.90% |
15.24% |
13.57% |
41.03% |
(29.22)% |
|
Ratios to Average Net Assets C,E |
|
|
|
|
|
|
Expenses before reductions |
.85% |
.87% |
.87% |
.86% |
.91% |
|
Expenses net of fee waivers, if any |
.85% |
.87% |
.87% |
.86% |
.91% |
|
Expenses net of all reductions |
.84% |
.87% |
.87% |
.86% |
.91% |
|
Net investment income (loss) |
1.81% |
1.96% |
1.77% |
1.78% |
1.54% |
|
Supplemental Data |
|
|
|
|
|
|
Net assets, end of period (000 omitted) |
$ 378,731 |
$ 163,544 |
$ 237,883 |
$ 36,152 |
$ 30,922 |
|
Portfolio turnover rate D |
28% |
35% |
57% |
69% |
70% |
A Total returns would have been lower if certain expenses had not been reduced during the applicable periods shown.
B Calculated based on average shares outstanding during the period.
C Fees and expenses of any underlying Fidelity Central Funds are not included in the Fund's expense ratio. The Fund indirectly bears its proportionate share of the expenses of any underlying Fidelity Central Funds.
D Amount does not include the portfolio activity of any underlying Fidelity Central Funds.
E Expense ratios reflect operating expenses of the class. Expenses before reductions do not reflect amounts reimbursed by the investment adviser or reductions from brokerage service arrangements or reductions from other expense offset arrangements and do not represent the amount paid by the class during periods when reimbursements or reductions occur. Expenses net of fee waivers reflect expenses after reimbursement by the investment adviser but prior to reductions from brokerage service arrangements or other expense offset arrangements. Expenses net of all reductions represent the net expenses paid by the class.
F For the year ended February 29.
G Amount represents less than $.01 per share.
H Total distributions of $.75 per share is comprised of distributions from net investment income of $.726 and distributions from net realized gain of $.025 per share.
I Total distributions of $2.82 per share is comprised of distributions from net investment income of $1.186 and distributions from net realized gain of $1.637 per share.
See accompanying notes which are an integral part of the financial statements.
Annual Report
Notes to Financial Statements
For the period ended February 28, 2013
1. Organization.
Consumer Staples Portfolio (the Fund) is a non-diversified fund of Fidelity Select Portfolios (the Trust) and is authorized to issue an unlimited number of shares. The Trust is registered under the Investment Company Act of 1940, as amended (the 1940 Act), as an open-end management investment company organized as a Massachusetts business trust. The Fund invests primarily in securities of companies whose principal business activities fall within specific industries. The Fund offers Class A, Class T, Class C, Consumer Staples, and Institutional Class shares, each of which, along with Class B shares, has equal rights as to assets and voting privileges. Class B shares are closed to new accounts and additional purchases, except for exchanges and reinvestments. Each class has exclusive voting rights with respect to matters that affect that class. Class B shares will automatically convert to Class A shares after a holding period of seven years from the initial date of purchase. Investment income, realized and unrealized capital gains and losses, the common expenses of the Fund, and certain fund-level expense reductions, if any, are allocated on a pro-rata basis to each class based on the relative net assets of each class to the total net assets of the Fund. Each class differs with respect to transfer agent and distribution and service plan fees incurred. Certain expense reductions may also differ by class.
2. Investments in Fidelity Central Funds.
The Fund invests in Fidelity Central Funds, which are open-end investment companies available only to other investment companies and accounts managed by Fidelity Management & Research Company (FMR) and its affiliates. The Fund's Schedule of Investments lists each of the Fidelity Central Funds held as of period end, if any, as an investment of the Fund, but does not include the underlying holdings of each Fidelity Central Fund. As an Investing Fund, the Fund indirectly bears its proportionate share of the expenses of the underlying Fidelity Central Funds.
The Money Market Central Funds seek preservation of capital and current income and are managed by Fidelity Investments Money Management, Inc. (FIMM), an affiliate of FMR.
A complete unaudited list of holdings for each Fidelity Central Fund is available upon request or at the Securities and Exchange Commission (the SEC) website at www.sec.gov. In addition, the financial statements of the Fidelity Central Funds, which are not covered by the Fund's Report of Independent Registered Public Accounting Firm, are available on the SEC website or upon request.
3. Significant Accounting Policies.
The financial statements have been prepared in conformity with accounting principles generally accepted in the United States of America (GAAP), which require management to make certain estimates and assumptions at the date of the financial statements. Actual results could differ from those estimates. Subsequent events, if any, through the date that the financial statements were issued have been evaluated in the preparation of the financial statements. The following summarizes the significant accounting policies of the Fund:
Investment Valuation. Investments are valued as of 4:00 p.m. Eastern time on the last calendar day of the period. In accordance with valuation policies and procedures approved by the Board of Trustees (the Board), the Fund attempts to obtain prices from one or more third party pricing vendors or brokers to value its investments. When current market prices, quotations or currency exchange rates are not readily available or reliable, investments will be fair valued in good faith by the FMR Fair Value Committee (the Committee), in accordance with procedures adopted by the Fund's Board. Factors used in determining fair value vary by investment type and may include market or investment specific events. The frequency with which these procedures are used cannot be predicted and they may be utilized to a significant extent. The Committee oversees the Fund's valuation policies and procedures and is responsible for approving and reporting to the Board all fair value determinations.
The Fund categorizes the inputs to valuation techniques used to value its investments into a disclosure hierarchy consisting of three levels as shown below:
Level 1 - quoted prices in active markets for identical investments
Level 2 - other significant observable inputs (including quoted prices for similar investments, interest rates, prepayment speeds, etc.)
Level 3 - unobservable inputs (including the Fund's own assumptions based on the best information available)
Valuation techniques used to value the Fund's investments by major category are as follows:
Equity securities, including restricted securities, for which market quotations are readily available, are valued at the last reported sale price or official closing price as reported by a third party pricing vendor on the primary market or exchange on which they are traded and are categorized as Level 1 in the hierarchy. In the event there were no sales during the day or closing prices are not available, securities are valued at the last quoted bid price or may be valued using the last available price and are generally categorized as Level 2 in the hierarchy. For foreign equity securities, when significant market or security specific events arise, comparisons to the valuation of American Depositary Receipts (ADRs), futures contracts, Exchange-Traded Funds (ETFs) and certain indexes as well as quoted prices for similar securities are used and are categorized as Level 2 in the hierarchy. Utilizing these techniques may result in transfers between Level 1 and Level 2.
Annual Report
3. Significant Accounting Policies - continued
Investment Valuation - continued
Investments in open-end mutual funds ,including the Fidelity Central Funds, are valued at their closing net asset value (NAV) each business day and are categorized as Level 1 in the hierarchy.
Changes in valuation techniques may result in transfers in or out of an assigned level within the disclosure hierarchy. The aggregate value of investments by input level, as of February 28, 2013, including information on transfers between Levels 1 and 2, is included at the end of the Fund's Schedule of Investments.
Foreign Currency. The Fund may use foreign currency contracts to facilitate transactions in foreign-denominated securities. Gains and losses from these transactions may arise from changes in the value of the foreign currency or if the counterparties do not perform under the contracts' terms.
Foreign-denominated assets, including investment securities, and liabilities are translated into U.S. dollars at the exchange rates at period end. Purchases and sales of investment securities, income and dividends received and expenses denominated in foreign currencies are translated into U.S. dollars at the exchange rate in effect on the transaction date.
The effects of exchange rate fluctuations on investments are included with the net realized and unrealized gain (loss) on investment securities. Other foreign currency transactions resulting in realized and unrealized gain (loss) are disclosed separately.
Investment Transactions and Income. For financial reporting purposes, the Fund's investment holdings and NAV include trades executed through the end of the last business day of the period. The NAV per share for processing shareholder transactions is calculated as of the close of business of the New York Stock Exchange (NYSE), normally 4:00 p.m. Eastern time and includes trades executed through the end of the prior business day. Gains and losses on securities sold are determined on the basis of identified cost and may include proceeds received from litigation. Dividend income is recorded on the ex-dividend date, except for certain dividends from foreign securities where the ex-dividend date may have passed, which are recorded as soon as the Fund is informed of the ex-dividend date. Non-cash dividends included in dividend income, if any, are recorded at the fair market value of the securities received. Interest income and distributions from the Fidelity Central Funds are accrued as earned. Interest income includes coupon interest and amortization of premium and accretion of discount on debt securities. Investment income is recorded net of foreign taxes withheld where recovery of such taxes is uncertain.
Expenses. Expenses directly attributable to a fund are charged to that fund. Expenses attributable to more than one fund are allocated among the respective funds on the basis of relative net assets or other appropriate methods. Expense estimates are accrued in the period to which they relate and adjustments are made when actual amounts are known.
Income Tax Information and Distributions to Shareholders. Each year, the Fund intends to qualify as a regulated investment company under Subchapter M of the Internal Revenue Code, including distributing substantially all of its taxable income and realized gains. As a result, no provision for income taxes is required. As of February 28, 2013, the Fund did not have any unrecognized tax benefits in the financial statements; nor is the Fund aware of any tax positions for which it is reasonably possible that the total amounts of unrecognized tax benefits will significantly change in the next twelve months. The Fund files a U.S. federal tax return, in addition to state and local tax returns as required. A fund's federal income tax returns are subject to examination by the Internal Revenue Service (IRS) for a period of three fiscal years after they are filed. State and local tax returns may be subject to examination for an additional fiscal year depending on the jurisdiction. Foreign taxes are provided for based on the Fund's understanding of the tax rules and rates that exist in the foreign markets in which it invests.
Distributions are declared and recorded on the ex-dividend date. Income dividends and capital gain distributions are declared separately for each class. Income and capital gain distributions are determined in accordance with income tax regulations, which may differ from GAAP. In addition, the Fund claimed a portion of the payment made to redeeming shareholders as a distribution for income tax purposes.
Capital accounts within the financial statements are adjusted for permanent book-tax differences. These adjustments have no impact on net assets or the results of operations. Temporary book-tax differences will reverse in a subsequent period.
Book-tax differences are primarily due to foreign currency transactions, deferred trustees compensation and losses deferred due to wash sales and excise tax regulations.
The federal tax cost of investment securities and unrealized appreciation (depreciation) as of period end were as follows:
|
Gross unrealized appreciation |
$ 553,242,221 |
|
Gross unrealized depreciation |
(2,258,134) |
|
Net unrealized appreciation (depreciation) on securities and other investments |
$ 550,984,087 |
|
Tax Cost |
$ 1,762,011,898 |
Annual Report
Notes to Financial Statements - continued
3. Significant Accounting Policies - continued
Income Tax Information and Distributions to Shareholders - continued
The tax-based components of distributable earnings as of period end were as follows:
|
Undistributed ordinary income |
$ 6,885,738 |
|
Undistributed long-term capital gain |
$ 57,569,918 |
|
Net unrealized appreciation (depreciation) |
$ 550,983,637 |
The tax character of distributions paid was as follows:
|
|
February 28, 2013 |
February 29, 2012 |
|
Ordinary Income |
$ 31,344,671 |
$ 31,774,273 |
|
Long-term Capital Gains |
29,546,659 |
30,343,266 |
|
Total |
$ 60,891,330 |
$ 62,117,539 |
Trading (Redemption) Fees. Shares held by investors in the Fund less than 30 days are subject to a redemption fee equal to .75% of the net asset value of shares redeemed. All redemption fees, which reduce the proceeds of the shareholder redemption, are retained by the Fund and accounted for as an addition to paid in capital.
4. Purchases and Sales of Investments.
Purchases and sales of securities other than short-term securities, aggregated $716,429,728 and $535,013,896, respectively.
5. Fees and Other Transactions with Affiliates.
Management Fee. FMR and its affiliates provide the Fund with investment management related services for which the Fund pays a monthly management fee. The management fee is the sum of an individual fund fee rate that is based on an annual rate of .30% of the Fund's average net assets and an annualized group fee rate that averaged .26% during the period. The group fee rate is based upon the average net assets of all the mutual funds advised by FMR. The group fee rate decreases as assets under management increase and increases as assets under management decrease. For the period, the total annual management fee rate was .56% of the Fund's average net assets.
Distribution and Service Plan Fees. In accordance with Rule 12b-1 of the 1940 Act, the Fund has adopted separate Distribution and Service Plans for each class of shares. Certain classes pay Fidelity Distributors Corporation (FDC), an affiliate of FMR, separate Distribution and Service Fees, each of which is based on an annual percentage of each class' average net assets. In addition, FDC may pay financial intermediaries for selling shares of the Fund and providing shareholder support services. For the period, the Distribution and Service Fee rates, total fees and amounts retained by FDC were as follows:
|
|
Distribution |
Service |
Total Fees |
Retained |
|
Class A |
-% |
.25% |
$ 586,812 |
$ 10,136 |
|
Class T |
.25% |
.25% |
220,654 |
1,120 |
|
Class B |
.75% |
.25% |
186,750 |
140,226 |
|
Class C |
.75% |
.25% |
1,170,305 |
250,108 |
|
|
|
|
$ 2,164,521 |
$ 401,590 |
Sales Load. FDC may receive a front-end sales charge of up to 5.75% for selling Class A shares and 3.50% for selling Class T shares, some of which is paid to financial intermediaries for selling shares of the Fund. Depending on the holding period, FDC may receive contingent deferred sales charges levied on Class A, Class T, Class B, and Class C redemptions. The deferred sales charges range from 5.00% to 1.00% for Class B shares, 1.00% for Class C shares, 1.00% for certain purchases of Class A shares and .25% for certain purchases of Class T shares.
Annual Report
5. Fees and Other Transactions with Affiliates - continued
Sales Load - continued
For the period, sales charge amounts retained by FDC were as follows:
|
|
Retained |
|
Class A |
$ 190,041 |
|
Class T |
24,402 |
|
Class B* |
35,420 |
|
Class C* |
15,416 |
|
|
$ 265,279 |
* When Class B and Class C shares are initially sold, FDC pays commissions from its own resources to financial intermediaries through which the sales are made.
Transfer Agent Fees. Fidelity Investments Institutional Operations Company, Inc., (FIIOC), an affiliate of FMR, is the transfer, dividend disbursing and shareholder servicing agent for each class of the Fund. FIIOC receives account fees and asset-based fees that vary according to the account size and type of account of the shareholders of the respective classes of the Fund. FIIOC receives no fees for providing transfer agency services to Class F. FIIOC pays for typesetting, printing and mailing of shareholder reports, except proxy statements. For the period, transfer agent fees for each class were as follows:
|
|
Amount |
% of |
|
Class A |
$ 526,828 |
.22 |
|
Class T |
110,772 |
.25 |
|
Class B |
52,559 |
.28 |
|
Class C |
257,870 |
.22 |
|
Consumer Staples |
2,660,688 |
.20 |
|
Institutional Class |
630,855 |
.24 |
|
|
$ 4,239,572 |
|
Accounting and Security Lending Fees. Fidelity Service Company, Inc. (FSC), an affiliate of FMR, maintains the Fund's accounting records. The accounting fee is based on the level of average net assets for each month. Under a separate contract, FSC administers the security lending program. The security lending fee is based on the number and duration of lending transactions.
Brokerage Commissions. The Fund placed a portion of its portfolio transactions with brokerage firms which are affiliates of the investment adviser. The commissions paid to these affiliated firms were $11,055 for the period.
Interfund Lending Program. Pursuant to an Exemptive Order issued by the SEC, the Fund, along with other registered investment companies having management contracts with FMR, may participate in an interfund lending program. This program provides an alternative credit facility allowing the funds to borrow from, or lend money to, other participating affiliated funds. At period end, there were no interfund loans outstanding. The Fund's activity in this program during the period for which loans were outstanding was as follows:
|
Borrower or Lender |
Average Loan |
Weighted Average Interest Rate |
Interest Expense |
|
Borrower |
$ 12,984,167 |
.41% |
$ 887 |
6. Committed Line of Credit.
The Fund participates with other funds managed by FMR or an affiliate in a $4.25 billion credit facility (the "line of credit") to be utilized for temporary or emergency purposes to fund shareholder redemptions or for other short-term liquidity purposes. The Fund has agreed to pay commitment fees on its pro-rata portion of the line of credit, which amounted to $4,976 and is reflected in Miscellaneous expenses on the Statement of Operations. During the period, there were no borrowings on this line of credit.
Annual Report
Notes to Financial Statements - continued
7. Security Lending.
The Fund lends portfolio securities through a lending agent from time to time in order to earn additional income. On the settlement date of the loan, the Fund receives collateral (in the form of U.S. Treasury obligations, letters of credit and/or cash) against the loaned securities and maintains collateral in an amount not less than 100% of the market value of the loaned securities during the period of the loan. The market value of the loaned securities is determined at the close of business of the Fund and any additional required collateral is delivered to the Fund on the next business day. If the borrower defaults on its obligation to return the securities loaned because of insolvency or other reasons, a fund could experience delays and costs in recovering the securities loaned or in gaining access to the collateral. Any cash collateral received is invested in the Fidelity Securities Lending Cash Central Fund. The value of loaned securities and cash collateral at period end are disclosed on the Fund's Statement of Assets and Liabilities. At period end, there were no security loans outstanding with FCM. Security lending income represents the income earned on investing cash collateral, less rebates paid to borrowers and any lending agent fees associated with the loan, plus any premium payments received for lending certain types of securities. Security lending income is presented in the Statement of Operations as a component of income from Fidelity Central Funds. Total security lending income during the period amounted to $405,984, including $260 from securities loaned to FCM.
8. Expense Reductions.
Many of the brokers with whom FMR places trades on behalf of the Fund provided services to the Fund in addition to trade execution. These services included payments of certain expenses on behalf of the Fund totaling $119,711 for the period. In addition, through arrangements with the Fund's custodian, credits realized as a result of uninvested cash balances were used to reduce the Fund's expenses. During the period, these credits reduced the Fund's custody expenses by $85.
In addition, FMR reimbursed a portion of the Fund's operating expenses during the period in the amount of $5,568.
9. Distributions to Shareholders.
Distributions to shareholders of each class were as follows:
|
|
Year ended |
Year ended |
|
From net investment income |
|
|
|
Class A |
$ 3,290,973 |
$ 2,690,167 |
|
Class T |
500,306 |
422,197 |
|
Class B |
82,480 |
114,208 |
|
Class C |
820,066 |
829,469 |
|
Consumer Staples |
20,759,081 |
18,061,907 |
|
Institutional Class |
5,891,765 |
3,782,934 |
|
Total |
$ 31,344,671 |
$ 25,900,882 |
|
From net realized gain |
|
|
|
Class A |
$ 3,434,776 |
$ 4,102,363 |
|
Class T |
646,006 |
795,051 |
|
Class B |
260,273 |
441,952 |
|
Class C |
1,739,884 |
2,213,680 |
|
Consumer Staples |
18,561,423 |
23,446,773 |
|
Institutional Class |
4,904,297 |
5,216,838 |
|
Total |
$ 29,546,659 |
$ 36,216,657 |
Annual Report
10. Share Transactions.
Transactions for each class of shares were as follows:
|
|
Shares |
Dollars |
||
|
|
Year ended |
Year ended |
Year ended |
Year ended |
|
Class A |
|
|
|
|
|
Shares sold |
1,172,691 |
1,107,874 |
$ 93,404,427 |
$ 77,974,428 |
|
Reinvestment of distributions |
72,806 |
84,526 |
5,768,631 |
5,924,948 |
|
Shares redeemed |
(756,998) |
(816,686) |
(59,959,929) |
(57,527,748) |
|
Net increase (decrease) |
488,499 |
375,714 |
$ 39,213,129 |
$ 26,371,628 |
|
Class T |
|
|
|
|
|
Shares sold |
146,374 |
130,126 |
$ 11,640,258 |
$ 9,133,799 |
|
Reinvestment of distributions |
13,628 |
16,351 |
1,073,877 |
1,140,509 |
|
Shares redeemed |
(73,443) |
(90,239) |
(5,785,079) |
(6,276,410) |
|
Net increase (decrease) |
86,559 |
56,238 |
$ 6,929,056 |
$ 3,997,898 |
|
Class B |
|
|
|
|
|
Shares sold |
11,096 |
22,727 |
$ 868,729 |
$ 1,569,035 |
|
Reinvestment of distributions |
3,553 |
6,332 |
278,056 |
439,355 |
|
Shares redeemed |
(56,866) |
(67,638) |
(4,452,338) |
(4,695,265) |
|
Net increase (decrease) |
(42,217) |
(38,579) |
$ (3,305,553) |
$ (2,686,875) |
|
Class C |
|
|
|
|
|
Shares sold |
479,940 |
536,557 |
$ 37,531,069 |
$ 37,168,209 |
|
Reinvestment of distributions |
25,332 |
33,216 |
1,978,186 |
2,295,907 |
|
Shares redeemed |
(291,408) |
(400,115) |
(22,752,561) |
(28,068,157) |
|
Net increase (decrease) |
213,864 |
169,658 |
$ 16,756,694 |
$ 11,395,959 |
|
Consumer Staples |
|
|
|
|
|
Shares sold |
5,353,585 |
7,156,716 |
$ 425,841,967 |
$ 509,488,908 |
|
Reinvestment of distributions |
474,945 |
566,253 |
37,790,378 |
39,874,596 |
|
Shares redeemed |
(5,260,820) |
(4,661,196) |
(416,646,931) |
(330,401,040) |
|
Net increase (decrease) |
567,710 |
3,061,773 |
$ 46,985,414 |
$ 218,962,464 |
|
Institutional Class |
|
|
|
|
|
Shares sold |
3,475,040 |
2,454,993 |
$ 279,763,267 |
$ 173,115,499 |
|
Reinvestment of distributions |
125,836 |
115,398 |
10,030,919 |
8,111,953 |
|
Shares redeemed |
(1,369,230) |
(3,900,689) |
(108,604,076) |
(276,887,031) |
|
Net increase (decrease) |
2,231,646 |
(1,330,298) |
$ 181,190,110 |
$ (95,659,579) |
11. Other.
The Fund's organizational documents provide former and current trustees and officers with a limited indemnification against liabilities arising in connection with the performance of their duties to the Fund. In the normal course of business, the Fund may also enter into contracts that provide general indemnifications. The Fund's maximum exposure under these arrangements is unknown as this would be dependent on future claims that may be made against the Fund. The risk of material loss from such claims is considered remote.
At the end of the period, Strategic Advisers U. S. Opportunity Fund was the owner of record of approximately 11% of the total outstanding shares of the Fund. Mutual funds managed by FMR or its affiliates were the owners of record, in the aggregate, of approximately 26% of the total outstanding shares of the Fund.
Annual Report
Fidelity Advisor Gold Fund - Institutional Class
Performance: The Bottom Line
Average annual total return reflects the change in the value of an investment, assuming reinvestment of the class' distributions from dividend income and capital gains (the profits earned upon the sale of securities that have grown in value, if any) and assuming a constant rate of performance each year. The $10,000 table and the fund's returns do not reflect the deduction of taxes that a shareholder would pay on fund distributions or the redemption of fund shares. During periods of reimbursement by Fidelity, a fund's total return will be greater than it would be had the reimbursement not occurred. How a fund did yesterday is no guarantee of how it will do tomorrow.
Average Annual Total Returns
|
Periods ended February 28, 2013 |
Past 1 |
Past 5 |
Past 10 |
|
Institutional Class A |
-33.09% |
-4.89% |
9.59% |
A The initial offering of Institutional Class shares took place on December 12, 2006. Returns prior to December 12, 2006, are those of Gold Portfolio, the original class of the fund.
$10,000 Over 10 Years
Let's say hypothetically that $10,000 was invested in Fidelity Advisor Gold Fund - Institutional Class on February 28, 2003. The chart shows how the value of your investment would have changed, and also shows how the S&P 500 Index performed over the same period. The initial offering of Institutional Class shares took place on December 12, 2006. See the Average Annual Total Returns table for additional information regarding the performance of Institutional Class.
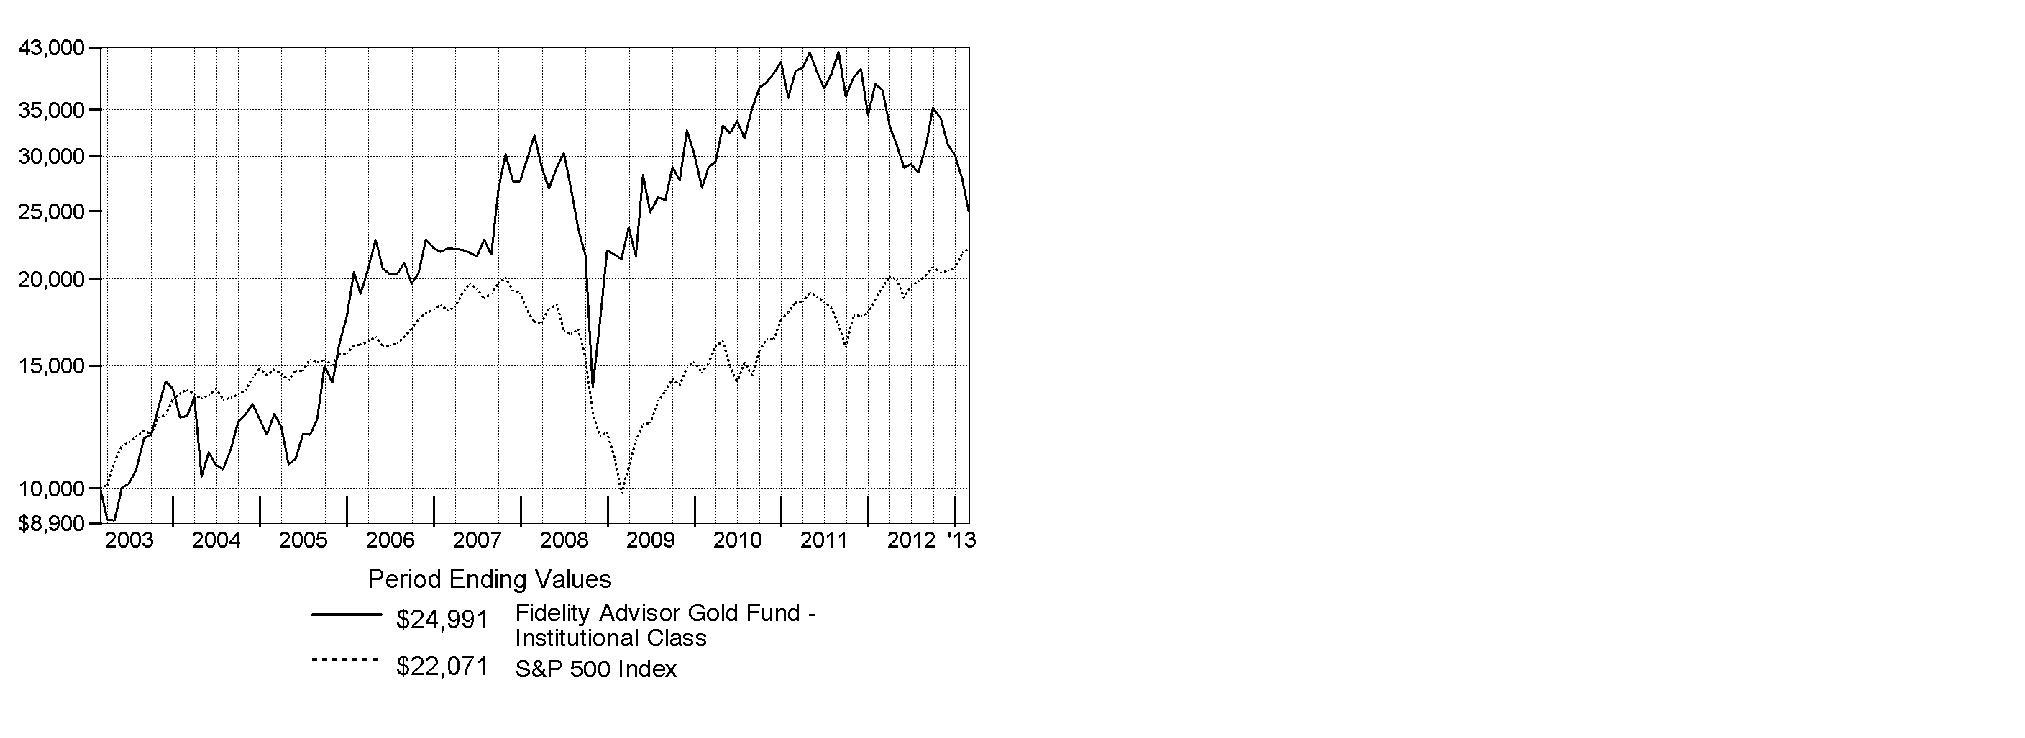
Annual Report
Fidelity Advisor Gold Fund
Management's Discussion of Fund Performance
Market Recap: U.S. stocks posted solid gains for the year ending February 28, 2013, sparked by a late-period rally that pushed major equity benchmarks to multiyear highs. Improvement in the global economy and more monetary stimulus from the U.S. Federal Reserve kept markets on the upswing for much of the year, shrugging off an early decline brought on by debt woes in Europe, and another dip later in the period amid Congressional gridlock on the federal budget. Renewed optimism over employment, the housing market, corporate earnings and record dividends made stocks a favorite with investors during the 12 months, which helped push the broad-based S&P 500® Index across the milestone 1,500 mark at the end of January. The S&P 500® finished the period up 13.46%. Seven of the 10 major market sectors tracked by MSCI U.S. IMI 25-50 classifications produced double-digit gains, led by health care and financials, while information technology, energy and materials trailed the broad equity market with only modest advances.
Comments from S. Joseph Wickwire, II, Portfolio Manager of Fidelity Advisor® Gold Fund: For the year, the fund's Institutional Class shares returned -33.09%, lagging its industry benchmark, the S&P® Global BMI Gold Capped Index, which returned -32.73%, and the S&P 500®. Gold and gold stocks were hard hit during the period, due in part to fluctuating concern about the robustness of the U.S. economy and the U.S. dollar in a world where Europe and China were struggling economically. The fund was hurt by our overweighting, on average, in Premier Gold Mines, Avion Gold and Rainy River Resources, as these companies struggled in a difficult environment. Little-to-no ownership of China's Zijin Mining Group, Turkey's Koza Altin Isletmeleri and Canada's Nevsun Resources hurt, as these benchmark components outperformed. All three were not held at period end. Currency fluctuations also hindered performance, given the fund's investments in foreign stocks. A good balance between stock picking in gold stocks, an out-of-benchmark stake in gold bullion and a small allocation to silver bullion - no longer held - aided relative performance. Underweighting some poor-performing stocks helped, including Compania de Minas Buenaventura and Gabriel Resources, as did not owning index component Jaguar Mining. Stakes in Agnico-Eagle Mines and Randgold Resources proved beneficial.
The views expressed above reflect those of the portfolio manager(s) only through the end of the period as stated on the cover of this report and do not necessarily represent the views of Fidelity or any other person in the Fidelity organization. Any such views are subject to change at any time based upon market or other conditions and Fidelity disclaims any responsibility to update such views. These views may not be relied on as investment advice and, because investment decisions for a Fidelity fund are based on numerous factors, may not be relied on as an indication of trading intent on behalf of any Fidelity fund.
Annual Report
Gold Portfolio
Shareholder Expense Example
As a shareholder of the Fund, you incur two types of costs: (1) transaction costs, including sales charges (loads) on purchase payments or redemption proceeds, redemption fees and (2) ongoing costs, including management fees, distribution and/or service (12b-1) fees and other Fund expenses. This Example is intended to help you understand your ongoing costs (in dollars) of investing in the Fund and to compare these costs with the ongoing costs of investing in other mutual funds.
The Example is based on an investment of $1,000 invested at the beginning of the period and held for the entire period (September 1, 2012 to February 28, 2013).
Actual Expenses
The first line of the accompanying table for each class of the Fund provides information about actual account values and actual expenses. You may use the information in this line, together with the amount you invested, to estimate the expenses that you paid over the period. Simply divide your account value by $1,000.00 (for example, an $8,600 account value divided by $1,000.00 = 8.6), then multiply the result by the number in the first line for a class of the Fund under the heading entitled "Expenses Paid During Period" to estimate the expenses you paid on your account during this period. A small balance maintenance fee of $12.00 that is charged once a year may apply for certain accounts with a value of less than $2,000. This fee is not included in the table below. If it was, the estimate of expenses you paid during the period would be higher, and your ending account value lower, by this amount. In addition, the Fund, as a shareholder in the underlying Fidelity Central Funds, will indirectly bear its pro-rata share of the fees and expenses incurred by the underlying Fidelity Central Funds. These fees and expenses are not included in the Fund's annualized expense ratio used to calculate the expense estimate in the table below.
Hypothetical Example for Comparison Purposes
The second line of the accompanying table for each class of the Fund provides information about hypothetical account values and hypothetical expenses based on a Class' actual expense ratio and an assumed rate of return of 5% per year before expenses, which is not the Class' actual return. The hypothetical account values and expenses may not be used to estimate the actual ending account balance or expenses you paid for the period. You may use this information to compare the ongoing costs of investing in the Fund and other funds. To do so, compare this 5% hypothetical example with the 5% hypothetical examples that appear in the shareholder reports of the other funds. A small balance maintenance fee of $12.00 that is charged once a year may apply for certain accounts with a value of less than $2,000. This fee is not included in the table below. If it was, the estimate of expenses you paid during the period would be higher, and your ending account value lower, by this amount. In addition, the Fund, as a shareholder in the underlying Fidelity Central Funds, will indirectly bear its pro-rata share of the fees and expenses incurred by the underlying Fidelity Central Funds. These fees and expenses are not included in the Fund's annualized expense ratio used to calculate the expense estimate in the table below.
Please note that the expenses shown in the table are meant to highlight your ongoing costs only and do not reflect any transaction costs. Therefore, the second line of the table is useful in comparing ongoing costs only, and will not help you determine the relative total costs of owning different funds. In addition, if these transactional costs were included, your costs would have been higher.
|
|
Annualized |
Beginning |
Ending |
Expenses Paid |
|
Class A |
1.17% |
|
|
|
|
Actual |
|
$ 1,000.00 |
$ 799.60 |
$ 5.22 |
|
HypotheticalA |
|
$ 1,000.00 |
$ 1,018.99 |
$ 5.86 |
|
Class T |
1.44% |
|
|
|
|
Actual |
|
$ 1,000.00 |
$ 798.70 |
$ 6.42 |
|
HypotheticalA |
|
$ 1,000.00 |
$ 1,017.65 |
$ 7.20 |
|
Class B |
1.92% |
|
|
|
|
Actual |
|
$ 1,000.00 |
$ 796.50 |
$ 8.55 |
|
HypotheticalA |
|
$ 1,000.00 |
$ 1,015.27 |
$ 9.59 |
|
Class C |
1.91% |
|
|
|
|
Actual |
|
$ 1,000.00 |
$ 796.70 |
$ 8.51 |
|
HypotheticalA |
|
$ 1,000.00 |
$ 1,015.32 |
$ 9.54 |
|
Gold |
.92% |
|
|
|
|
Actual |
|
$ 1,000.00 |
$ 800.60 |
$ 4.11 |
|
HypotheticalA |
|
$ 1,000.00 |
$ 1,020.23 |
$ 4.61 |
|
Institutional Class |
.82% |
|
|
|
|
Actual |
|
$ 1,000.00 |
$ 801.10 |
$ 3.66 |
|
HypotheticalA |
|
$ 1,000.00 |
$ 1,020.73 |
$ 4.11 |
A 5% return per year before expenses
* Expenses are equal to each Class' annualized expense ratio, multiplied by the average account value over the period, multiplied by 181/365 (to reflect the one-half year period).
Annual Report
Gold Portfolio
Consolidated Investment Changes (Unaudited)
|
Top Ten Holdings as of February 28, 2013 |
||
|
|
% of fund's |
% of fund's net assets |
|
Barrick Gold Corp. |
12.6 |
11.1 |
|
Goldcorp, Inc. |
12.1 |
13.0 |
|
Newcrest Mining Ltd. |
7.7 |
6.9 |
|
Yamana Gold, Inc. |
5.3 |
4.5 |
|
Randgold Resources Ltd. sponsored ADR |
4.5 |
4.0 |
|
Gold Bullion |
4.4 |
3.7 |
|
Kinross Gold Corp. |
4.3 |
3.6 |
|
AngloGold Ashanti Ltd. sponsored ADR |
4.2 |
4.3 |
|
Newmont Mining Corp. |
4.0 |
8.1 |
|
Eldorado Gold Corp. |
3.6 |
3.6 |
|
|
62.7 |
|
|
Top Industries (% of fund's net assets) |
|||
|
As of February 28, 2013 |
|||
|
Gold |
94.3% |
|
 |
Commodities & Related Investments** |
4.4% |
|
|
Precious Metals & Minerals |
0.7% |
|
|
Diversified Metals & Mining |
0.2% |
|
|
Coal & Consumable Fuels |
0.2% |
|
|
Steel |
0.1% |
|
|
All Others* |
0.1% |
|

|
As of August 31, 2012 |
|||
|
Gold |
94.7% |
|
 |
Commodities & Related Investments** |
3.8% |
|
 |
Precious Metals & Minerals |
0.7% |
|
 |
Diversified Metals & Mining |
0.3% |
|
|
Coal & Consumable Fuels |
0.2% |
|
|
All Others* |
0.3% |
|

|
* Includes short-term investments and net other assets. |
|
** Includes gold bullion and/or silver bullion. |
|
Geographic Diversification (% of fund's net assets) |
|||
|
As of February 28, 2013 |
|||
|
Canada |
62.2% |
|
|
Australia |
11.4% |
|
|
United States of America |
11.1% |
|
|
South Africa |
8.5% |
|
|
Bailiwick of Jersey |
5.7% |
|
|
Bermuda |
0.5% |
|
|
Cayman Islands |
0.3% |
|
 |
United Kingdom |
0.3% |
|
|
Peru |
0.0% |
|
|
Other |
0.0% |
|

|
Percentages are based on country or territory of incorporation and are adjusted for the effect of futures contracts, if applicable. |
|
As of August 31, 2012 |
|||
|
Canada |
58.4% |
|
|
United States of America |
15.6% |
|
|
Australia |
9.9% |
|
|
South Africa |
8.8% |
|
|
Bailiwick of Jersey |
4.9% |
|
|
Peru |
1.2% |
|
|
United Kingdom |
0.6% |
|
|
China |
0.5% |
|
|
Bermuda |
0.1% |
|
|
Other |
0.0% |
|

|
Percentages are based on country or territory of incorporation and are adjusted for the effect of futures contracts, if applicable. |
Annual Report
Gold Portfolio
Consolidated Investments February 28, 2013
Showing Percentage of Net Assets
|
Common Stocks - 95.5% |
|||
|
Shares |
Value |
||
|
Australia - 11.4% |
|||
|
METALS & MINING - 11.4% |
|||
|
Gold - 11.4% |
|||
|
ABM Resources NL (a) |
2,300,000 |
$ 91,624 |
|
|
Alkane Resources Ltd. |
195,000 |
122,497 |
|
|
Ampella Mining Ltd. (a)(d) |
2,785,000 |
853,421 |
|
|
Beadell Resources Ltd. (a) |
9,968,618 |
8,247,780 |
|
|
Evolution Mining Ltd. (a) |
2,566,395 |
3,565,164 |
|
|
Gold One International Ltd. (a) |
90,277 |
25,820 |
|
|
Gryphon Minerals Ltd. (a) |
5,590,010 |
1,969,921 |
|
|
Intrepid Mines Ltd.: |
|
|
|
|
(Australia) (a) |
9,209,798 |
2,022,580 |
|
|
(Canada) (a) |
320,000 |
68,267 |
|
|
Kingsgate Consolidated NL (d) |
1,843,274 |
6,740,468 |
|
|
Medusa Mining Ltd. |
2,576,085 |
11,262,144 |
|
|
Newcrest Mining Ltd. |
8,706,620 |
201,523,923 |
|
|
Papillon Resources Ltd. (a)(d) |
1,964,068 |
2,567,932 |
|
|
Perseus Mining Ltd.: |
|
|
|
|
(Australia) (a) |
6,340,134 |
10,426,569 |
|
|
(Canada) (a) |
1,300,000 |
2,029,576 |
|
|
Ramelius Resources Ltd. (a)(d) |
980,000 |
320,327 |
|
|
Red 5 Ltd. (a) |
1,326,000 |
1,232,543 |
|
|
Regis Resources Ltd. (a) |
3,944,294 |
17,928,601 |
|
|
Resolute Mining Ltd. |
2,988,261 |
4,151,209 |
|
|
Saracen Mineral Holdings Ltd. (a) |
2,992,488 |
1,085,120 |
|
|
Silver Lake Resources Ltd. (a) |
4,547,781 |
10,173,275 |
|
|
St Barbara Ltd. (a) |
6,018,377 |
8,114,662 |
|
|
Tanami Gold NL (a)(d) |
130,000 |
29,877 |
|
|
Tanami Gold NL rights 3/12/13 (a)(d) |
162,500 |
2,324 |
|
|
Troy Resources NL |
195,000 |
587,589 |
|
|
Troy Resources NL (f) |
734,826 |
2,258,811 |
|
|
|
297,402,024 |
||
|
Bailiwick of Jersey - 5.7% |
|||
|
METALS & MINING - 5.7% |
|||
|
Gold - 5.7% |
|||
|
Centamin PLC (a) |
9,471,900 |
7,716,339 |
|
|
Lydian International Ltd. (a) |
1,525,300 |
2,336,944 |
|
|
Polyus Gold International Ltd. |
422,400 |
1,406,560 |
|
|
Polyus Gold International Ltd. sponsored GDR |
5,884,931 |
19,067,176 |
|
|
Randgold Resources Ltd. sponsored ADR |
1,424,595 |
118,056,188 |
|
|
|
148,583,207 |
||
|
Precious Metals & Minerals - 0.0% |
|||
|
Polymetal International PLC |
20,000 |
303,107 |
|
|
TOTAL METALS & MINING |
148,886,314 |
||
|
Bermuda - 0.5% |
|||
|
METALS & MINING - 0.5% |
|||
|
Gold - 0.4% |
|||
|
Continental Gold Ltd. (a) |
1,505,100 |
9,194,793 |
|
|
|
|||
|
Shares |
Value |
||
|
Steel - 0.1% |
|||
|
African Minerals Ltd. (a)(d) |
585,800 |
$ 2,521,652 |
|
|
TOTAL METALS & MINING |
11,716,445 |
||
|
Canada - 62.2% |
|||
|
METALS & MINING - 62.2% |
|||
|
Diversified Metals & Mining - 0.2% |
|||
|
East Asia Minerals Corp. (a) |
5,000 |
1,285 |
|
|
Eastmain Resources, Inc. (a) |
10,000 |
6,885 |
|
|
Kimber Resources, Inc. (a)(e) |
16,100 |
3,981 |
|
|
Kimber Resources, Inc. (a)(e)(f) |
5,577,500 |
1,379,164 |
|
|
NovaCopper, Inc. (a)(d) |
488,333 |
928,129 |
|
|
Sabina Gold & Silver Corp. (a) |
600,000 |
1,058,909 |
|
|
Turquoise Hill Resources Ltd. (a) |
285,000 |
1,821,236 |
|
|
|
5,199,589 |
||
|
Gold - 61.4% |
|||
|
Agnico-Eagle Mines Ltd. (Canada) (d) |
1,940,600 |
77,830,997 |
|
|
Alacer Gold Corp. (a) |
3,409,063 |
11,702,384 |
|
|
Alamos Gold, Inc. |
1,829,700 |
25,637,978 |
|
|
Americas Bullion Royalty Corp. (a) |
5,000 |
1,479 |
|
|
Argonaut Gold, Inc. (a) |
2,110,962 |
16,580,647 |
|
|
ATAC Resources Ltd. (a) |
67,200 |
71,680 |
|
|
AuRico Gold, Inc. (a) |
20,000 |
125,091 |
|
|
B2Gold Corp. (a) |
11,848,648 |
35,847,546 |
|
|
Banro Corp. (a) |
3,836,482 |
8,519,315 |
|
|
Barrick Gold Corp. (d) |
10,840,619 |
328,713,845 |
|
|
Belo Sun Mining Corp. (a)(d) |
5,680,400 |
5,838,763 |
|
|
Canaco Resources, Inc. (a)(f) |
121,100 |
55,779 |
|
|
Centerra Gold, Inc. |
2,047,200 |
13,300,596 |
|
|
Claude Resources, Inc. (a) |
320,000 |
127,224 |
|
|
Colossus Minerals, Inc. (a) |
3,087,200 |
8,621,708 |
|
|
Detour Gold Corp. (a) |
1,476,000 |
28,825,833 |
|
|
Detour Gold Corp. (a)(f) |
785,900 |
15,348,389 |
|
|
Eldorado Gold Corp. |
9,545,208 |
94,225,666 |
|
|
Exeter Resource Corp. (a) |
272,300 |
319,499 |
|
|
Franco-Nevada Corp. (d) |
1,612,500 |
77,994,182 |
|
|
Gabriel Resources Ltd. (a) |
950,600 |
2,276,831 |
|
|
Gold Canyon Resources, Inc. (a) |
800,000 |
360,727 |
|
|
Goldcorp, Inc. |
9,664,100 |
315,436,224 |
|
|
Golden Queen Mining Co. Ltd. (a) |
15,000 |
25,309 |
|
|
GoldQuest Mining Corp. (a) |
2,318,500 |
966,744 |
|
|
Gran Colombia Gold Corp. (a)(d) |
1,765,000 |
385,091 |
|
|
Guyana Goldfields, Inc. (a)(d) |
2,243,700 |
6,984,026 |
|
|
Guyana Goldfields, Inc. (a)(f) |
155,000 |
482,473 |
|
|
IAMGOLD Corp. |
4,024,500 |
27,122,691 |
|
|
International Minerals Corp. (Switzerland) |
15,000 |
61,133 |
|
|
International Tower Hill Mines Ltd. (a) |
546,700 |
906,528 |
|
|
Kinross Gold Corp. |
14,516,091 |
110,498,244 |
|
|
Kinross Gold Corp. warrants 9/17/14 (a) |
1,192,793 |
231,330 |
|
|
Kirkland Lake Gold, Inc. (a) |
791,000 |
4,694,225 |
|
|
Lake Shore Gold Corp. (a)(d) |
4,056,600 |
2,281,530 |
|
|
Common Stocks - continued |
|||
|
Shares |
Value |
||
|
Canada - continued |
|||
|
METALS & MINING - CONTINUED |
|||
|
Gold - continued |
|||
|
Marengo Mining Canada Ltd. (a) |
560,000 |
$ 77,222 |
|
|
Midas Gold Corp. (a) |
80,000 |
107,830 |
|
|
New Gold, Inc. (a) |
7,686,355 |
68,571,603 |
|
|
NGEx Resources, Inc. (a) |
50,000 |
145,455 |
|
|
Novagold Resources, Inc. (a)(d) |
2,930,000 |
11,620,558 |
|
|
OceanaGold Corp. (a) |
3,262,300 |
7,655,531 |
|
|
Orezone Gold Corp. (a) |
372,100 |
440,206 |
|
|
Orvana Minerals Corp. (a) |
10,000 |
9,988 |
|
|
Osisko Mining Corp. (a) |
3,972,631 |
22,997,922 |
|
|
Osisko Mining Corp. (a)(f) |
3,000,000 |
17,367,273 |
|
|
Pilot Gold, Inc. (a)(d) |
668,150 |
1,192,142 |
|
|
Premier Gold Mines Ltd. (a) |
4,996,322 |
13,711,119 |
|
|
Pretium Resources, Inc. (a) |
430,938 |
3,322,140 |
|
|
Pretium Resources, Inc. (a)(f) |
225,000 |
1,734,545 |
|
|
Pretium Resources, Inc. (a)(g) |
225,000 |
1,734,545 |
|
|
Primero Mining Corp. (a) |
911,200 |
5,009,943 |
|
|
Probe Mines Ltd. (a) |
85,000 |
140,121 |
|
|
Rainy River Resources Ltd. (a) |
3,056,400 |
8,328,227 |
|
|
Richmont Mines, Inc. (a) |
220,300 |
578,922 |
|
|
Romarco Minerals, Inc. (a) |
12,632,600 |
10,044,831 |
|
|
Romarco Minerals, Inc. (a)(f) |
5,900,000 |
4,691,394 |
|
|
Rubicon Minerals Corp. (a) |
4,568,502 |
9,967,641 |
|
|
San Gold Corp. (a) |
2,006,900 |
554,634 |
|
|
Sandstorm Gold Ltd. (a) |
30,000 |
280,727 |
|
|
Seabridge Gold, Inc. (a)(d) |
601,905 |
7,493,716 |
|
|
SEMAFO, Inc. (d) |
4,406,900 |
12,136,336 |
|
|
St. Andrew Goldfields Ltd. (a) |
440,000 |
192,000 |
|
|
Sulliden Gold Corp. Ltd. (a)(d) |
3,070,400 |
2,560,527 |
|
|
Teranga Gold Corp. (a) |
35,000 |
47,515 |
|
|
Teranga Gold Corp. CDI unit (a) |
3,430,974 |
4,906,396 |
|
|
Torex Gold Resources, Inc. (a) |
11,936,400 |
21,065,937 |
|
|
Volta Resources, Inc. (a) |
55,000 |
16,000 |
|
|
Yamana Gold, Inc. |
9,275,100 |
136,529,472 |
|
|
|
1,597,634,125 |
||
|
Precious Metals & Minerals - 0.6% |
|||
|
Chesapeake Gold Corp. (a) |
6,000 |
45,207 |
|
|
Dalradian Resources, Inc. (a) |
51,000 |
48,960 |
|
|
Gold Standard Ventures Corp. (a) |
415,400 |
410,868 |
|
|
Kaminak Gold Corp. Class A (a) |
20,000 |
21,333 |
|
|
MAG Silver Corp. (a) |
35,400 |
336,751 |
|
|
Pan American Silver Corp. |
88,387 |
1,457,501 |
|
|
Pan American Silver Corp. warrants 12/7/14 (a) |
232,460 |
65,048 |
|
|
Silver Wheaton Corp. |
39,000 |
1,236,655 |
|
|
|
|||
|
Shares |
Value |
||
|
Tahoe Resources, Inc. (a) |
736,300 |
$ 11,131,071 |
|
|
Wildcat Silver Corp. (a) |
75,200 |
50,316 |
|
|
|
14,803,710 |
||
|
TOTAL METALS & MINING |
1,617,637,424 |
||
|
Cayman Islands - 0.3% |
|||
|
METALS & MINING - 0.3% |
|||
|
Gold - 0.3% |
|||
|
Endeavour Mining Corp. (a) |
5,288,400 |
8,410,159 |
|
|
Netherlands - 0.0% |
|||
|
METALS & MINING - 0.0% |
|||
|
Gold - 0.0% |
|||
|
Nord Gold NV GDR (Reg. S) (a) |
15,000 |
63,000 |
|
|
Peru - 0.0% |
|||
|
METALS & MINING - 0.0% |
|||
|
Gold - 0.0% |
|||
|
Compania de Minas Buenaventura SA sponsored ADR |
5,000 |
128,100 |
|
|
South Africa - 8.5% |
|||
|
METALS & MINING - 8.5% |
|||
|
Gold - 8.5% |
|||
|
AngloGold Ashanti Ltd. sponsored ADR |
4,487,152 |
108,768,564 |
|
|
Gold Fields Ltd. |
55,000 |
450,798 |
|
|
Gold Fields Ltd. sponsored ADR |
8,462,226 |
70,151,854 |
|
|
Harmony Gold Mining Co. Ltd. |
1,484,000 |
9,301,172 |
|
|
Harmony Gold Mining Co. Ltd. sponsored ADR (d) |
3,347,300 |
20,686,314 |
|
|
Sibanye Gold Ltd. ADR (a) |
2,141,806 |
12,122,622 |
|
|
|
221,481,324 |
||
|
United Kingdom - 0.3% |
|||
|
METALS & MINING - 0.3% |
|||
|
Gold - 0.3% |
|||
|
Patagonia Gold PLC (a) |
260,000 |
57,193 |
|
|
Petropavlovsk PLC |
1,649,228 |
7,550,919 |
|
|
|
7,608,112 |
||
|
United States of America - 6.6% |
|||
|
METALS & MINING - 6.4% |
|||
|
Gold - 6.3% |
|||
|
Allied Nevada Gold Corp. (a) |
1,326,900 |
24,282,270 |
|
|
Allied Nevada Gold Corp. (Canada) (a) |
45,000 |
819,055 |
|
|
Gold Resource Corp. (d) |
40,000 |
524,000 |
|
|
Newmont Mining Corp. |
2,576,450 |
103,805,171 |
|
|
Royal Gold, Inc. |
526,113 |
34,481,446 |
|
|
|
163,911,942 |
||
|
Common Stocks - continued |
|||
|
Shares |
Value |
||
|
United States of America - continued |
|||
|
METALS & MINING - CONTINUED |
|||
|
Precious Metals & Minerals - 0.1% |
|||
|
McEwen Mining, Inc. (a) |
943,810 |
$ 2,293,458 |
|
|
TOTAL METALS & MINING |
166,205,400 |
||
|
OIL, GAS & CONSUMABLE FUELS - 0.2% |
|||
|
Coal & Consumable Fuels - 0.2% |
|||
|
Alpha Natural Resources, Inc. (a) |
320,000 |
2,553,600 |
|
|
Peabody Energy Corp. |
122,700 |
2,645,412 |
|
|
|
5,199,012 |
||
|
TOTAL UNITED STATES OF AMERICA |
171,404,412 |
||
|
TOTAL COMMON STOCKS (Cost $2,751,166,563) |
|
||
|
Commodities - 4.4% |
|||
|
Troy Ounces |
|
||
|
Gold Bullion (a) |
73,500 |
|
|
|
Money Market Funds - 16.4% |
|||
|
Shares |
|
||
|
Fidelity Cash Central Fund, 0.16% (b) |
8,528,230 |
8,528,230 |
|
|
Fidelity Securities Lending Cash Central Fund, 0.16% (b)(c) |
417,856,605 |
417,856,605 |
|
|
TOTAL MONEY MARKET FUNDS (Cost $426,384,835) |
|
||
|
TOTAL INVESTMENT PORTFOLIO - 116.3% (Cost $3,280,595,648) |
3,027,280,079 |
||
|
NET OTHER ASSETS (LIABILITIES) - (16.3)% |
(424,674,380) |
||
|
NET ASSETS - 100% |
$ 2,602,605,699 |
||
|
Legend |
|
(a) Non-income producing |
|
(b) Affiliated fund that is generally available only to investment companies and other accounts managed by Fidelity Investments. The rate quoted is the annualized seven-day yield of the fund at period end. A complete unaudited listing of the fund's holdings as of its most recent quarter end is available upon request. In addition, each Fidelity Central Fund's financial statements, which are not covered by the Fund's Report of Independent Registered Public Accounting Firm, are available on the SEC's website or upon request. |
|
(c) Investment made with cash collateral received from securities on loan. |
|
(d) Security or a portion of the security is on loan at period end. |
|
(e) Affiliated company |
|
(f) Security exempt from registration under Rule 144A of the Securities Act of 1933. These securities may be resold in transactions exempt from registration, normally to qualified institutional buyers. At the end of the period, the value of these securities amounted to $43,317,828 or 1.7% of net assets. |
|
(g) Restricted securities - Investment in securities not registered under the Securities Act of 1933 (excluding 144A issues). At the end of the period, the value of restricted securities (excluding 144A issues) amounted to $1,734,545 or 0.1% of net assets. |
|
Additional information on each restricted holding is as follows: |
|
Security |
Acquisition Date |
Acquisition Cost |
|
Pretium Resources, Inc. |
3/31/11 |
$ 2,172,293 |
|
Affiliated Central Funds |
|
Information regarding fiscal year to date income earned by the Fund from investments in Fidelity Central Funds is as follows: |
|
Fund |
Income earned |
|
Fidelity Cash Central Fund |
$ 13,702 |
|
Fidelity Securities Lending Cash Central Fund |
777,921 |
|
Total |
$ 791,623 |
|
Consolidated Subsidiary |
|
|
Value, |
Purchases |
Sales |
Dividend |
Value, |
|
Fidelity Select Gold Cayman Ltd. |
$ 43,125,922 |
$ 121,246,969 |
$ 43,684,769 |
$ - |
$ 116,121,090 |
|
Other Affiliated Issuers |
|
An affiliated company is a company in which the Fund has ownership of at least 5% of the voting securities. Fiscal year to date transactions with companies which are or were affiliates are as follows: |
|
Affiliate |
Value, |
Purchases |
Sales |
Dividend |
Value, |
|
Kimber Resources, Inc. |
$ 16,919 |
$ - |
$ - |
$ - |
$ 3,981 |
|
Kimber Resources, Inc. (144A) |
6,128,712 |
- |
140,075 |
- |
1,379,164 |
|
Total |
$ 6,145,631 |
$ - |
$ 140,075 |
$ - |
$ 1,383,145 |
|
Other Information |
|
The following is a summary of the inputs used, as of February 28, 2013, involving the Fund's assets and liabilities carried at fair value. The inputs or methodology used for valuing securities may not be an indication of the risk associated with investing in those securities. For more information on valuation inputs, and their aggregation into the levels used in the table below, please refer to the Investment Valuation section in the accompanying Notes to Consolidated Financial Statements. |
|
Valuation Inputs at Reporting Date: |
||||
|
Description |
Total |
Level 1 |
Level 2 |
Level 3 |
|
Investments in Securities: |
||||
|
Common Stocks |
$ 2,484,737,314 |
$ 2,474,920,296 |
$ 9,817,018 |
$ - |
|
Commodities |
116,157,930 |
116,157,930 |
- |
- |
|
Money Market Funds |
426,384,835 |
426,384,835 |
- |
- |
|
Total Investments in Securities: |
$ 3,027,280,079 |
$ 3,017,463,061 |
$ 9,817,018 |
$ - |
See accompanying notes which are an integral part of the consolidated financial statements.
Annual Report
Gold Portfolio
Consolidated Financial Statements
Consolidated Statement of Assets and Liabilities
|
|
February 28, 2013 |
|
|
|
|
|
|
Assets |
|
|
|
Investment in securities, at value (including securities loaned of $392,112,195) - See accompanying schedule: Unaffiliated issuers (cost $2,746,227,320) |
$ 2,483,354,169 |
|
|
Fidelity Central Funds (cost $426,384,835) |
426,384,835 |
|
|
Commodities (cost $103,044,250) |
116,157,930 |
|
|
Other affiliated issuers (cost $4,939,243) |
1,383,145 |
|
|
Total Investments (cost $3,280,595,648) |
|
$ 3,027,280,079 |
|
Cash |
|
715 |
|
Foreign currency held at value (cost $82,684) |
|
82,684 |
|
Receivable for investments sold |
|
5,257,999 |
|
Delayed delivery |
|
192,461 |
|
Receivable for fund shares sold |
|
3,459,026 |
|
Dividends receivable |
|
2,194,055 |
|
Distributions receivable from Fidelity Central Funds |
|
70,162 |
|
Prepaid expenses |
|
4,607 |
|
Receivable from investment adviser for expense reductions |
|
11,638 |
|
Other receivables |
|
88,669 |
|
Total assets |
|
3,038,642,095 |
|
|
|
|
|
Liabilities |
|
|
|
Payable for investments purchased |
$ 11,615,091 |
|
|
Payable for fund shares redeemed |
4,157,824 |
|
|
Accrued management fee |
1,301,169 |
|
|
Distribution and service plan fees payable |
76,605 |
|
|
Other affiliated payables |
880,568 |
|
|
Other payables and accrued expenses |
148,534 |
|
|
Collateral on securities loaned, at value |
417,856,605 |
|
|
Total liabilities |
|
436,036,396 |
|
|
|
|
|
Net Assets |
|
$ 2,602,605,699 |
|
Net Assets consist of: |
|
|
|
Paid in capital |
|
$ 3,303,577,289 |
|
Accumulated net investment loss |
|
(129,693,237) |
|
Accumulated undistributed net realized gain (loss) on investments and foreign currency transactions |
|
(317,951,928) |
|
Net unrealized appreciation (depreciation) on investments and assets and liabilities in foreign currencies |
|
(253,326,425) |
|
Net Assets |
|
$ 2,602,605,699 |
Consolidated Statement of Assets and Liabilities -
continued
|
|
February 28, 2013 |
|
|
Calculation of Maximum Offering Price Class A: |
|
$ 30.25 |
|
|
|
|
|
Maximum offering price per share (100/94.25 of $30.25) |
|
$ 32.10 |
|
Class T: |
|
$ 29.95 |
|
|
|
|
|
Maximum offering price per share (100/96.50 of $29.95) |
|
$ 31.04 |
|
Class B: |
|
$ 29.27 |
|
|
|
|
|
Class C: |
|
$ 29.15 |
|
|
|
|
|
|
|
|
|
Gold: |
|
$ 30.72 |
|
|
|
|
|
Institutional Class: |
|
$ 30.69 |
A Redemption price per share is equal to net asset value less any applicable contingent deferred sales charge.
See accompanying notes which are an integral part of the consolidated financial statements.
Annual Report
Consolidated Statement of Operations
|
|
Year ended February 28, 2013 |
|
|
|
|
|
|
Investment Income |
|
|
|
Dividends |
|
$ 45,886,618 |
|
Interest |
|
111 |
|
Income from Fidelity Central Funds |
|
791,623 |
|
Total income |
|
46,678,352 |
|
|
|
|
|
Expenses |
|
|
|
Management fee |
$ 19,638,737 |
|
|
Transfer agent fees |
10,364,827 |
|
|
Distribution and service plan fees |
1,124,567 |
|
|
Accounting and security lending fees |
1,461,846 |
|
|
Custodian fees and expenses |
395,094 |
|
|
Independent trustees' compensation |
23,350 |
|
|
Registration fees |
243,295 |
|
|
Audit |
48,549 |
|
|
Legal |
13,865 |
|
|
Interest |
6,213 |
|
|
Miscellaneous |
39,252 |
|
|
Total expenses before reductions |
33,359,595 |
|
|
Expense reductions |
(515,705) |
32,843,890 |
|
Net investment income (loss) |
|
13,834,462 |
|
Realized and Unrealized Gain (Loss) Net realized gain (loss) on: |
|
|
|
Investments: |
|
|
|
Unaffiliated issuers |
(148,732,522) |
|
|
Other affiliated issuers |
(218,170) |
|
|
Commodities |
(522,357) |
|
|
Foreign currency transactions |
56,194 |
|
|
Total net realized gain (loss) |
|
(149,416,855) |
|
Change in net unrealized appreciation (depreciation) on: Investments |
(1,259,403,752) |
|
|
Assets and liabilities in foreign currencies |
(20,196) |
|
|
Commodities |
(3,691,935) |
|
|
Total change in net unrealized appreciation (depreciation) |
|
(1,263,115,883) |
|
Net gain (loss) |
|
(1,412,532,738) |
|
Net increase (decrease) in net assets resulting from operations |
|
$ (1,398,698,276) |
Consolidated Statement of Changes in Net Assets
|
|
Year ended |
Year ended |
|
Increase (Decrease) in Net Assets |
|
|
|
Operations |
|
|
|
Net investment income (loss) |
$ 13,834,462 |
$ (2,911,115) |
|
Net realized gain (loss) |
(149,416,855) |
69,474,908 |
|
Change in net unrealized appreciation (depreciation) |
(1,263,115,883) |
(363,910,363) |
|
Net increase (decrease) in net assets resulting from operations |
(1,398,698,276) |
(297,346,570) |
|
Distributions to shareholders from net realized gain |
- |
(238,750,097) |
|
Share transactions - net increase (decrease) |
(374,414,799) |
229,358,064 |
|
Redemption fees |
209,222 |
461,104 |
|
Total increase (decrease) in net assets |
(1,772,903,853) |
(306,277,499) |
|
|
|
|
|
Net Assets |
|
|
|
Beginning of period |
4,375,509,552 |
4,681,787,051 |
|
End of period (including accumulated net investment loss of $129,693,237 and accumulated net investment loss of $30,304,890, respectively) |
$ 2,602,605,699 |
$ 4,375,509,552 |
See accompanying notes which are an integral part of the consolidated financial statements.
Annual Report
Consolidated Financial Highlights - Class A
|
Years ended February 28, |
2013 |
2012 G |
2011 |
2010 |
2009 |
|
Selected Per-Share Data |
|
|
|
|
|
|
Net asset value, beginning of period |
$ 45.37 |
$ 50.92 |
$ 40.50 |
$ 30.45 |
$ 46.19 |
|
Income from Investment Operations |
|
|
|
|
|
|
Net investment income (loss) C |
.07 |
(.13) |
(.30) |
(.25) |
(.15) |
|
Net realized and unrealized gain (loss) |
(15.19) |
(2.83) |
15.28 |
11.00 |
(15.44) |
|
Total from investment operations |
(15.12) |
(2.96) |
14.98 |
10.75 |
(15.59) |
|
Distributions from net realized gain |
- |
(2.59) |
(4.57) |
(.71) |
(.17) |
|
Redemption fees added to paid in capital C |
- H |
- H |
.01 |
.01 |
.02 |
|
Net asset value, end of period |
$ 30.25 |
$ 45.37 |
$ 50.92 |
$ 40.50 |
$ 30.45 |
|
Total Return A, B |
(33.33)% |
(6.24)% |
36.99% |
35.19% |
(33.81)% |
|
Ratios to Average Net Assets D, F |
|
|
|
|
|
|
Expenses before reductions |
1.18% |
1.14% |
1.16% |
1.21% |
1.21% |
|
Expenses net of fee waivers, if any |
1.17% |
1.14% |
1.15% |
1.19% |
1.19% |
|
Expenses net of all reductions |
1.17% |
1.14% |
1.14% |
1.17% |
1.15% |
|
Net investment income (loss) |
.18% |
(.28)% |
(.63)% |
(.63)% |
(.45)% |
|
Supplemental Data |
|
|
|
|
|
|
Net assets, end of period (000 omitted) |
$ 101,202 |
$ 152,969 |
$ 149,178 |
$ 82,413 |
$ 39,144 |
|
Portfolio turnover rate E |
18% |
22% |
35% |
46% |
42% |
|
A Total returns would have been lower if certain expenses had not been reduced during the applicable periods shown. B Total returns do not include the effect of the sales charges. C Calculated based on average shares outstanding during the period. D Fees and expenses of any underlying Fidelity Central Funds are not included in the Fund's expense ratio. The Fund indirectly bears its proportionate share of the expenses of any underlying Fidelity Central Funds. E Amount does not include the portfolio activity of any underlying Fidelity Central Funds. F Expense ratios reflect operating expenses of the class. Expenses before reductions do not reflect amounts reimbursed by the investment adviser or reductions from brokerage service arrangements or reductions from other expense offset arrangements and do not represent the amount paid by the class during periods when reimbursements or reductions occur. Expenses net of fee waivers reflect expenses after reimbursement by the investment adviser but prior to reductions from brokerage service arrangements or other expense offset arrangements. Expenses net of all reductions represent the net expenses paid by the class. G For the year ended February 29. H Amount represents less than $.01 per share. |
Consolidated Financial Highlights - Class T
|
Years ended February 28, |
2013 |
2012 G |
2011 |
2010 |
2009 |
|
Selected Per-Share Data |
|
|
|
|
|
|
Net asset value, beginning of period |
$ 45.04 |
$ 50.68 |
$ 40.34 |
$ 30.36 |
$ 46.17 |
|
Income from Investment Operations |
|
|
|
|
|
|
Net investment income (loss) C |
(.03) |
(.27) |
(.43) |
(.36) |
(.24) |
|
Net realized and unrealized gain (loss) |
(15.06) |
(2.80) |
15.21 |
10.96 |
(15.42) |
|
Total from investment operations |
(15.09) |
(3.07) |
14.78 |
10.60 |
(15.66) |
|
Distributions from net realized gain |
- |
(2.57) |
(4.45) |
(.63) |
(.17) |
|
Redemption fees added to paid in capital C |
- H |
- H |
.01 |
.01 |
.02 |
|
Net asset value, end of period |
$ 29.95 |
$ 45.04 |
$ 50.68 |
$ 40.34 |
$ 30.36 |
|
Total Return A, B |
(33.50)% |
(6.49)% |
36.62% |
34.79% |
(33.98)% |
|
Ratios to Average Net Assets D, F |
|
|
|
|
|
|
Expenses before reductions |
1.45% |
1.43% |
1.44% |
1.51% |
1.47% |
|
Expenses net of fee waivers, if any |
1.44% |
1.42% |
1.42% |
1.49% |
1.45% |
|
Expenses net of all reductions |
1.44% |
1.42% |
1.42% |
1.47% |
1.41% |
|
Net investment income (loss) |
(.09)% |
(.57)% |
(.90)% |
(.93)% |
(.71)% |
|
Supplemental Data |
|
|
|
|
|
|
Net assets, end of period (000 omitted) |
$ 24,913 |
$ 40,664 |
$ 45,846 |
$ 26,256 |
$ 15,284 |
|
Portfolio turnover rate E |
18% |
22% |
35% |
46% |
42% |
|
A Total returns would have been lower if certain expenses had not been reduced during the applicable periods shown. B Total returns do not include the effect of the sales charges. C Calculated based on average shares outstanding during the period. D Fees and expenses of any underlying Fidelity Central Funds are not included in the Fund's expense ratio. The Fund indirectly bears its proportionate share of the expenses of any underlying Fidelity Central Funds. E Amount does not include the portfolio activity of any underlying Fidelity Central Funds. F Expense ratios reflect operating expenses of the class. Expenses before reductions do not reflect amounts reimbursed by the investment adviser or reductions from brokerage service arrangements or reductions from other expense offset arrangements and do not represent the amount paid by the class during periods when reimbursements or reductions occur. Expenses net of fee waivers reflect expenses after reimbursement by the investment adviser but prior to reductions from brokerage service arrangements or other expense offset arrangements. Expenses net of all reductions represent the net expenses paid by the class. G For the year ended February 29. H Amount represents less than $.01 per share. |
See accompanying notes which are an integral part of the consolidated financial statements.
Annual Report
Consolidated Financial Highlights - Class B
|
Years ended February 28, |
2013 |
2012 G |
2011 |
2010 |
2009 |
|
Selected Per-Share Data |
|
|
|
|
|
|
Net asset value, beginning of period |
$ 44.24 |
$ 50.02 |
$ 39.87 |
$ 30.08 |
$ 45.97 |
|
Income from Investment Operations |
|
|
|
|
|
|
Net investment income (loss) C |
(.21) |
(.49) |
(.66) |
(.55) |
(.40) |
|
Net realized and unrealized gain (loss) |
(14.76) |
(2.76) |
15.02 |
10.84 |
(15.34) |
|
Total from investment operations |
(14.97) |
(3.25) |
14.36 |
10.29 |
(15.74) |
|
Distributions from net realized gain |
- |
(2.53) |
(4.21) |
(.51) |
(.17) |
|
Redemption fees added to paid in capital C |
- H |
- H |
- H |
.01 |
.02 |
|
Net asset value, end of period |
$ 29.27 |
$ 44.24 |
$ 50.02 |
$ 39.87 |
$ 30.08 |
|
Total Return A, B |
(33.84)% |
(6.95)% |
35.97% |
34.12% |
(34.30)% |
|
Ratios to Average Net Assets D, F |
|
|
|
|
|
|
Expenses before reductions |
1.93% |
1.90% |
1.93% |
2.00% |
1.97% |
|
Expenses net of fee waivers, if any |
1.92% |
1.90% |
1.92% |
1.98% |
1.95% |
|
Expenses net of all reductions |
1.91% |
1.90% |
1.91% |
1.96% |
1.89% |
|
Net investment income (loss) |
(.57)% |
(1.04)% |
(1.39)% |
(1.42)% |
(1.20)% |
|
Supplemental Data |
|
|
|
|
|
|
Net assets, end of period (000 omitted) |
$ 9,423 |
$ 20,894 |
$ 26,837 |
$ 18,340 |
$ 8,421 |
|
Portfolio turnover rate E |
18% |
22% |
35% |
46% |
42% |
|
A Total returns would have been lower if certain expenses had not been reduced during the applicable periods shown. B Total returns do not include the effect of the contingent deferred sales charge. C Calculated based on average shares outstanding during the period. D Fees and expenses of any underlying Fidelity Central Funds are not included in the Fund's expense ratio. The Fund indirectly bears its proportionate share of the expenses of any underlying Fidelity Central Funds. E Amount does not include the portfolio activity of any underlying Fidelity Central Funds. F Expense ratios reflect operating expenses of the class. Expenses before reductions do not reflect amounts reimbursed by the investment adviser or reductions from brokerage service arrangements or reductions from other expense offset arrangements and do not represent the amount paid by the class during periods when reimbursements or reductions occur. Expenses net of fee waivers reflect expenses after reimbursement by the investment adviser but prior to reductions from brokerage service arrangements or other expense offset arrangements. Expenses net of all reductions represent the net expenses paid by the class. G For the year ended February 29. H Amount represents less than $.01 per share. |
Consolidated Financial Highlights - Class C
|
Years ended February 28, |
2013 |
2012 G |
2011 |
2010 |
2009 |
|
Selected Per-Share Data |
|
|
|
|
|
|
Net asset value, beginning of period |
$ 44.05 |
$ 49.81 |
$ 39.75 |
$ 30.00 |
$ 45.85 |
|
Income from Investment Operations |
|
|
|
|
|
|
Net investment income (loss) C |
(.20) |
(.47) |
(.64) |
(.53) |
(.39) |
|
Net realized and unrealized gain (loss) |
(14.70) |
(2.76) |
14.98 |
10.80 |
(15.30) |
|
Total from investment operations |
(14.90) |
(3.23) |
14.34 |
10.27 |
(15.69) |
|
Distributions from net realized gain |
- |
(2.53) |
(4.28) |
(.53) |
(.17) |
|
Redemption fees added to paid in capital C |
- H |
- H |
- H |
.01 |
.01 |
|
Net asset value, end of period |
$ 29.15 |
$ 44.05 |
$ 49.81 |
$ 39.75 |
$ 30.00 |
|
Total Return A, B |
(33.83)% |
(6.93)% |
36.01% |
34.15% |
(34.30)% |
|
Ratios to Average Net Assets D, F |
|
|
|
|
|
|
Expenses before reductions |
1.93% |
1.87% |
1.89% |
1.97% |
1.97% |
|
Expenses net of fee waivers, if any |
1.92% |
1.87% |
1.88% |
1.95% |
1.95% |
|
Expenses net of all reductions |
1.91% |
1.87% |
1.87% |
1.93% |
1.89% |
|
Net investment income (loss) |
(.57)% |
(1.01)% |
(1.35)% |
(1.39)% |
(1.20)% |
|
Supplemental Data |
|
|
|
|
|
|
Net assets, end of period (000 omitted) |
$ 37,787 |
$ 67,996 |
$ 72,431 |
$ 38,624 |
$ 17,544 |
|
Portfolio turnover rate E |
18% |
22% |
35% |
46% |
42% |
|
A Total returns would have been lower if certain expenses had not been reduced during the applicable periods shown. B Total returns do not include the effect of the contingent deferred sales charge. C Calculated based on average shares outstanding during the period. D Fees and expenses of any underlying Fidelity Central Funds are not included in the Fund's expense ratio. The Fund indirectly bears its proportionate share of the expenses of any underlying Fidelity Central Funds. E Amount does not include the portfolio activity of any underlying Fidelity Central Funds. F Expense ratios reflect operating expenses of the class. Expenses before reductions do not reflect amounts reimbursed by the investment adviser or reductions from brokerage service arrangements or reductions from other expense offset arrangements and do not represent the amount paid by the class during periods when reimbursements or reductions occur. Expenses net of fee waivers reflect expenses after reimbursement by the investment adviser but prior to reductions from brokerage service arrangements or other expense offset arrangements. Expenses net of all reductions represent the net expenses paid by the class. G For the year ended February 29. H Amount represents less than $.01 per share. |
See accompanying notes which are an integral part of the consolidated financial statements.
Annual Report
Consolidated Financial Highlights - Gold
|
Years ended February 28, |
2013 |
2012 F |
2011 |
2010 |
2009 |
|
Selected Per-Share Data |
|
|
|
|
|
|
Net asset value, beginning of period |
$ 45.96 |
$ 51.44 |
$ 40.85 |
$ 30.67 |
$ 46.37 |
|
Income from Investment Operations |
|
|
|
|
|
|
Net investment income (loss) B |
.16 |
(.02) |
(.18) |
(.16) |
(.04) |
|
Net realized and unrealized gain (loss) |
(15.40) |
(2.85) |
15.43 |
11.10 |
(15.51) |
|
Total from investment operations |
(15.24) |
(2.87) |
15.25 |
10.94 |
(15.55) |
|
Distributions from net realized gain |
- |
(2.61) |
(4.67) |
(.77) |
(.17) |
|
Redemption fees added to paid in capital B |
- G |
- G |
.01 |
.01 |
.02 |
|
Net asset value, end of period |
$ 30.72 |
$ 45.96 |
$ 51.44 |
$ 40.85 |
$ 30.67 |
|
Total Return A |
(33.16)% |
(6.00)% |
37.35% |
35.52% |
(33.59)% |
|
Ratios to Average Net Assets C, E |
|
|
|
|
|
|
Expenses before reductions |
.93% |
.89% |
.91% |
.98% |
.89% |
|
Expenses net of fee waivers, if any |
.92% |
.89% |
.90% |
.96% |
.87% |
|
Expenses net of all reductions |
.92% |
.89% |
.89% |
.94% |
.86% |
|
Net investment income (loss) |
.43% |
(.03)% |
(.37)% |
(.40)% |
(.13)% |
|
Supplemental Data |
|
|
|
|
|
|
Net assets, end of period (000 omitted) |
$ 2,301,019 |
$ 3,924,439 |
$ 4,250,249 |
$ 2,839,664 |
$ 1,881,600 |
|
Portfolio turnover rate D |
18% |
22% |
35% |
46% |
42% |
|
A Total returns would have been lower if certain expenses had not been reduced during the applicable periods shown. B Calculated based on average shares outstanding during the period. C Fees and expenses of any underlying Fidelity Central Funds are not included in the Fund's expense ratio. The Fund indirectly bears its proportionate share of the expenses of any underlying Fidelity Central Funds. D Amount does not include the portfolio activity of any underlying Fidelity Central Funds. E Expense ratios reflect operating expenses of the class. Expenses before reductions do not reflect amounts reimbursed by the investment adviser or reductions from brokerage service arrangements or reductions from other expense offset arrangements and do not represent the amount paid by the class during periods when reimbursements or reductions occur. Expenses net of fee waivers reflect expenses after reimbursement by the investment adviser but prior to reductions from brokerage service arrangements or other expense offset arrangements. Expenses net of all reductions represent the net expenses paid by the class. F For the year ended February 29. G Amount represents less than $.01 per share. |
Consolidated Financial Highlights - Institutional Class
|
Years ended February 28, |
2013 |
2012 F |
2011 |
2010 |
2009 |
|
Selected Per-Share Data |
|
|
|
|
|
|
Net asset value, beginning of period |
$ 45.87 |
$ 51.32 |
$ 40.77 |
$ 30.65 |
$ 46.34 |
|
Income from Investment Operations |
|
|
|
|
|
|
Net investment income (loss) B |
.20 |
.02 |
(.15) |
(.15) |
(.05) |
|
Net realized and unrealized gain (loss) |
(15.38) |
(2.85) |
15.41 |
11.08 |
(15.49) |
|
Total from investment operations |
(15.18) |
(2.83) |
15.26 |
10.93 |
(15.54) |
|
Distributions from net realized gain |
- |
(2.62) |
(4.72) |
(.82) |
(.17) |
|
Redemption fees added to paid in capital B |
- G |
- G |
.01 |
.01 |
.02 |
|
Net asset value, end of period |
$ 30.69 |
$ 45.87 |
$ 51.32 |
$ 40.77 |
$ 30.65 |
|
Total Return A |
(33.09)% |
(5.94)% |
37.45% |
35.50% |
(33.59)% |
|
Ratios to Average Net Assets C, E |
|
|
|
|
|
|
Expenses before reductions |
.84% |
.82% |
.85% |
.95% |
.91% |
|
Expenses net of fee waivers, if any |
.83% |
.81% |
.84% |
.93% |
.89% |
|
Expenses net of all reductions |
.82% |
.81% |
.83% |
.91% |
.86% |
|
Net investment income (loss) |
.52% |
.04% |
(.31)% |
(.37)% |
(.14)% |
|
Supplemental Data |
|
|
|
|
|
|
Net assets, end of period (000 omitted) |
$ 128,262 |
$ 168,548 |
$ 137,246 |
$ 38,037 |
$ 6,070 |
|
Portfolio turnover rate D |
18% |
22% |
35% |
46% |
42% |
|
A Total returns would have been lower if certain expenses had not been reduced during the applicable periods shown. B Calculated based on average shares outstanding during the period. C Fees and expenses of any underlying Fidelity Central Funds are not included in the Fund's expense ratio. The Fund indirectly bears its proportionate share of the expenses of any underlying Fidelity Central Funds. D Amount does not include the portfolio activity of any underlying Fidelity Central Funds. E Expense ratios reflect operating expenses of the class. Expenses before reductions do not reflect amounts reimbursed by the investment adviser or reductions from brokerage service arrangements or reductions from other expense offset arrangements and do not represent the amount paid by the class during periods when reimbursements or reductions occur. Expenses net of fee waivers reflect expenses after reimbursement by the investment adviser but prior to reductions from brokerage service arrangements or other expense offset arrangements. Expenses net of all reductions represent the net expenses paid by the class. F For the year ended February 29. G Amount represents less than $.01 per share. |
See accompanying notes which are an integral part of the consolidated financial statements.
Annual Report
Notes to Consolidated Financial Statements
For the period ended February 28, 2013
1. Organization.
Gold Portfolio (the Fund) is a non-diversified fund of Fidelity Select Portfolios (the Trust) and is authorized to issue an unlimited number of shares. The Trust is registered under the Investment Company Act of 1940, as amended (the 1940 Act), as an open-end management investment company organized as a Massachusetts business trust. The Fund invests primarily in securities of companies whose principal business activities fall within specific industries. The Fund offers Class A, Class T, Class C, Gold, and Institutional Class shares, each of which, along with Class B shares, has equal rights as to assets and voting privileges. Class B shares are closed to new accounts and additional purchases, except for exchanges and reinvestments. Each class has exclusive voting rights with respect to matters that affect that class. Class B shares will automatically convert to Class A shares after a holding period of seven years from the initial date of purchase. Investment income, realized and unrealized capital gains and losses, the common expenses of the Fund, and certain fund-level expense reductions, if any, are allocated on a pro-rata basis to each class based on the relative net assets of each class to the total net assets of the Fund. Each class differs with respect to transfer agent and distribution and service plan fees incurred. Certain expense reductions may also differ by class.
2. Consolidated Subsidiary
The Fund invests in certain commodity-related investments through Fidelity Select Gold Cayman Ltd., a wholly owned subsidiary (the "Subsidiary"). As of February 28, 2013, the Fund held $116,121,090 in the Subsidiary, representing 4.5% of the Fund's net assets.
The financial statements have been consolidated and include accounts of the Fund and the Subsidiary. Accordingly, all inter-company transactions and balances have been eliminated.
3. Investments in Fidelity Central Funds.
The Fund invests in Fidelity Central Funds, which are open-end investment companies available only to other investment companies and accounts managed by Fidelity Management & Research Company (FMR) and its affiliates. The Fund's Consolidated Schedule of Investments lists each of the Fidelity Central Funds held as of period end, if any, as an investment of the Fund, but does not include the underlying holdings of each Fidelity Central Fund. As an Investing Fund, the Fund indirectly bears its proportionate share of the expenses of the underlying Fidelity Central Funds.
The Money Market Central Funds seek preservation of capital and current income and are managed by Fidelity Investments Money Management, Inc. (FIMM), an affiliate of FMR.
A complete unaudited list of holdings for each Fidelity Central Fund is available upon request or at the Securities and Exchange Commission (the SEC) website at www.sec.gov. In addition, the financial statements of the Fidelity Central Funds, which are not covered by the Fund's Report of Independent Registered Public Accounting Firm, are available on the SEC website or upon request.
4. Significant Accounting Policies.
The consolidated financial statements have been prepared in conformity with accounting principles generally accepted in the United States of America (GAAP), which require management to make certain estimates and assumptions at the date of the consolidated financial statements. Actual results could differ from those estimates. Subsequent events, if any, through the date that the consolidated financial statements were issued have been evaluated in the preparation of the consolidated financial statements. The following summarizes the significant accounting policies of the Fund:
Investment Valuation. Investments are valued as of 4:00 p.m. Eastern time on the last calendar day of the period. In accordance with valuation policies and procedures approved by the Board of Trustees (the Board), the Fund attempts to obtain prices from one or more third party pricing vendors or brokers to value its investments. When current market prices, quotations or currency exchange rates are not readily available or reliable, investments will be fair valued in good faith by FMR Fair Value Committee (the Committee), in accordance with procedures adopted by the Fund's Board. Factors used in determining fair value vary by investment type and may include market or investment specific events. The frequency with which these procedures are used cannot be predicted and they may be utilized to a significant extent. The Committee oversees the Fund's valuation policies and procedures and is responsible for approving and reporting to the Board all fair value determinations.
The Fund categorizes the inputs to valuation techniques used to value its investments into a disclosure hierarchy consisting of three levels as shown below:
Level 1 - quoted prices in active markets for identical investments
Level 2 - other significant observable inputs (including quoted prices for similar investments, interest rates, prepayment speeds, etc.)
Level 3 - unobservable inputs (including the Fund's own assumptions based on the best information available)
Valuation techniques used to value the Fund's investments by major category are as follows:
Annual Report
4. Significant Accounting Policies - continued
Investment Valuation - continued
Equity securities, including restricted securities, for which market quotations are readily available, are valued at the last reported sale price or official closing price as reported by a third party pricing vendor on the primary market or exchange on which they are traded and are categorized as Level 1 in the hierarchy. In the event there were no sales during the day or closing prices are not available, securities are valued at the last quoted bid price or may be valued using the last available price and are generally categorized as Level 2 in the hierarchy. For foreign equity securities, when significant market or security specific events arise, comparisons to the valuation of American Depositary Receipts (ADRs), futures contracts, Exchange-Traded Funds (ETFs) and certain indexes as well as quoted prices for similar securities are used and are categorized as Level 2 in the hierarchy. Utilizing these techniques may result in transfers between Level 1 and Level 2. For restricted equity securities and private placements where observable inputs are limited, assumptions about market activity and risk are used and these securities are generally categorized as Level 3 in the hierarchy.
Investments in commodities are valued at their last traded price at 4:00 p.m. Eastern time each business day and are categorized as Level 1 in the hierarchy. Investments in open-end mutual funds, including the Fidelity Central Funds, are valued at their closing net asset value (NAV) each business day and are categorized as Level 1 in the hierarchy.
Changes in valuation techniques may result in transfers in or out of an assigned level within the disclosure hierarchy. The aggregate value of investments by input level, as of February 28, 2013, is included at the end of the Fund's Consolidated Schedule of Investments.
Foreign Currency. The Fund may use foreign currency contracts to facilitate transactions in foreign-denominated securities. Gains and losses from these transactions may arise from changes in the value of the foreign currency or if the counterparties do not perform under the contracts' terms.
Foreign-denominated assets, including investment securities, and liabilities are translated into U.S. dollars at the exchange rates at period end. Purchases and sales of investment securities, income and dividends received and expenses denominated in foreign currencies are translated into U.S. dollars at the exchange rate in effect on the transaction date.
The effects of exchange rate fluctuations on investments are included with the net realized and unrealized gain (loss) on investment securities. Other foreign currency transactions resulting in realized and unrealized gain (loss) are disclosed separately.
Investment Transactions and Income. For financial reporting purposes, the Fund's investment holdings and NAV include trades executed through the end of the last business day of the period. The NAV per share for processing shareholder transactions is calculated as of the close of business of the New York Stock Exchange (NYSE), normally 4:00 p.m. Eastern time and includes trades executed through the end of the prior business day. Gains and losses on securities sold are determined on the basis of identified cost. Dividend income is recorded on the ex-dividend date, except for certain dividends from foreign securities where the ex-dividend date may have passed, which are recorded as soon as the Fund is informed of the ex-dividend date. Non-cash dividends included in dividend income, if any, are recorded at the fair market value of the securities received. Distributions received on securities that represent a return of capital or capital gain are recorded as a reduction of cost of investments and/or as a realized gain. The Fund estimates the components of distributions received that may be considered return of capital distributions or capital gain distributions. Interest income and distributions from the Fidelity Central Funds are accrued as earned. Interest income includes coupon interest and amortization of premium and accretion of discount on debt securities. Investment income is recorded net of foreign taxes withheld where recovery of such taxes is uncertain.
Expenses. Expenses directly attributable to a fund are charged to that fund. Expenses attributable to more than one fund are allocated among the respective funds on the basis of relative net assets or other appropriate methods. Expense estimates are accrued in the period to which they relate and adjustments are made when actual amounts are known.
Income Tax Information and Distributions to Shareholders. Each year, the Fund intends to qualify as a regulated investment company under Subchapter M of the Internal Revenue Code, including distributing substantially all of its taxable income and realized gains. As a result, no provision for income taxes is required. As of February 28, 2013, the Fund did not have any unrecognized tax benefits in the consolidated financial statements; nor is the Fund aware of any tax positions for which it is reasonably possible that the total amounts of unrecognized tax benefits will significantly change in the next twelve months. The Fund files a U.S. federal tax return, in addition to state and local tax returns as required. A fund's federal income tax returns are subject to examination by the Internal Revenue Service (IRS) for a period of three fiscal years after they are filed. State and local tax returns may be subject to examination for an additional fiscal year depending on the jurisdiction. Foreign taxes are provided for based on the Fund's understanding of the tax rules and rates that exist in the foreign markets in which it invests.
The Subsidiary is classified as a controlled foreign corporation under Subchapter N of the Internal Revenue Code. Therefore, the Fund is required to increase its taxable income by its share of the Subsidiary's income. Net investment losses of the Subsidiary cannot be deducted by the Fund in the current period nor carried forward to offset taxable income in future periods.
Annual Report
Notes to Consolidated Financial Statements - continued
4. Significant Accounting Policies - continued
Income Tax Information and Distributions to Shareholders - continued
Distributions are declared and recorded on the ex-dividend date. Income dividends and capital gain distributions are declared separately for each class. Income and capital gain distributions are determined in accordance with income tax regulations, which may differ from GAAP. In addition, the Fund claimed a portion of the payment made to redeeming shareholders as a distribution for income tax purposes.
Capital accounts within the consolidated financial statements are adjusted for permanent book-tax differences. These adjustments have no impact on net assets or the results of operations. Temporary book-tax differences will reverse in a subsequent period.
Book-tax differences are primarily due to foreign currency transactions, passive foreign investment companies (PFIC), controlled foreign corporation, deferred trustees compensation, net operating losses and losses deferred due to wash sales and excise tax regulations.
The federal tax cost of investment securities and unrealized appreciation (depreciation) as of period end on an unconsolidated basis were as follows:
|
Gross unrealized appreciation |
$ 353,036,986 |
|
Gross unrealized depreciation |
(764,931,082) |
|
Net unrealized appreciation (depreciation) on securities and other investments |
$ (411,894,096) |
|
|
|
|
Tax Cost |
$ 3,439,137,336 |
The tax-based components of distributable earnings as of period end were as follows:
|
Capital loss carryforward |
$ (170,232,605) |
|
Net unrealized appreciation (depreciation) |
$ (411,904,952) |
Capital loss carryforwards are only available to offset future capital gains of the Fund to the extent provided by regulations and may be limited. Under the Regulated Investment Company Modernization Act of 2010 (the Act), the Fund is permitted to carry forward capital losses incurred in taxable years beginning after December 22, 2010 for an unlimited period and such capital losses are required to be used prior to any losses that expire. Capital loss carryforwards were as follows:
|
Short-term |
$ (67,261,086) |
|
Long-term |
(102,971,519) |
|
Total capital loss carryforward |
$ (170,232,605) |
The Fund intends to elect to defer to its fiscal year ending February 28, 2014 approximately $129,692,316 of ordinary losses recognized during the period November 1, 2012 to February 28, 2013.
The tax character of distributions paid was as follows:
|
|
February 28, 2013 |
February 29, 2012 |
|
Ordinary Income |
$ - |
$ 158,364,329 |
|
Long-term Capital Gains |
- |
80,385,768 |
|
Total |
$ - |
$ 238,750,097 |
Trading (Redemption) Fees. Shares held by investors in the Fund less than 30 days are subject to a redemption fee equal to .75% of the net asset value of shares redeemed. All redemption fees, which reduce the proceeds of the shareholder redemption, are retained by the Fund and accounted for as an addition to paid in capital.
Delayed Delivery Transactions and When-Issued Securities. During the period, the Fund transacted in securities on a delayed delivery or when-issued basis. Payment and delivery may take place after the customary settlement period for that security. The price of the underlying securities and the date when the securities will be delivered and paid for are fixed at the time the transaction is negotiated. The Fund may receive compensation for interest forgone in the purchase of a delayed delivery or when-issued security. With respect to purchase commitments, the Fund identifies securities as segregated in its records with a value at least equal to the amount of the commitment. Losses may arise due to changes in the value of the underlying securities or if the counterparty does not perform under the contract's terms, or if the issuer does not issue the securities due to political, economic, or other factors.
Restricted Securities. The Fund may invest in securities that are subject to legal or contractual restrictions on resale. These securities generally may be resold in transactions exempt from registration or to the public if the securities are registered. Disposal of these securities may involve time-consuming negotiations and expense, and prompt sale at an acceptable price may be difficult. Information regarding restricted securities is included at the end of the Fund's Consolidated Schedule of Investments.
Annual Report
5. Purchases and Sales of Investments.
Purchases and sales of securities, other than short-term securities, aggregated $625,093,559 and $972,324,125, respectively.
6. Fees and Other Transactions with Affiliates.
Management Fee. FMR and its affiliates provide the Fund with investment management related services for which the Fund pays a monthly management fee. The management fee is the sum of an individual fund fee rate that is based on an annual rate of .30% of the Fund's average net assets and an annualized group fee rate that averaged .26% during the period. The group fee rate is based upon the average net assets of all the mutual funds advised by FMR. The group fee rate decreases as assets under management increase and increases as assets under management decrease. For the period, the total annual management fee rate was .56% of the Fund's average net assets.
FMR and its affiliates also provide investment management related services to the Subsidiary. The Subsidiary pays FMR a monthly management fee at the annual rate of .30% of its net assets. Under the management contract, FMR pays all other expenses of the Subsidiary, except custodian fees.
During the period, FMR waived a portion of its management fee as described in the Expense Reductions note.
Distribution and Service Plan Fees. In accordance with Rule 12b-1 of the 1940 Act, the Fund has adopted separate Distribution and Service Plans for each class of shares. Certain classes pay Fidelity Distributors Corporation (FDC), an affiliate of FMR, separate Distribution and Service Fees, each of which is based on an annual percentage of each class' average net assets. In addition, FDC may pay financial intermediaries for selling shares of the Fund and providing shareholder support services. For the period, the Distribution and Service Fee rates, total fees and amounts retained by FDC were as follows:
|
|
Distribution |
Service |
Total Fees |
Retained |
|
Class A |
-% |
.25% |
$ 315,882 |
$ 5,739 |
|
Class T |
.25% |
.25% |
157,988 |
814 |
|
Class B |
.75% |
.25% |
141,475 |
106,141 |
|
Class C |
.75% |
.25% |
509,222 |
77,647 |
|
|
|
|
$ 1,124,567 |
$ 190,341 |
Sales Load. FDC may receive a front-end sales charge of up to 5.75% for selling Class A shares and 3.50% for selling Class T shares, some of which is paid to financial intermediaries for selling shares of the Fund. Depending on the holding period, FDC may receive contingent deferred sales charges levied on Class A, Class T, Class B, and Class C redemptions. The deferred sales charges range from 5.00% to 1.00% for Class B shares, 1.00% for Class C shares, 1.00% for certain purchases of Class A shares and .25% for certain purchases of Class T shares.
For the period, sales charge amounts retained by FDC were as follows:
|
|
Retained |
|
Class A |
$ 54,740 |
|
Class T |
12,343 |
|
Class B* |
43,859 |
|
Class C* |
7,084 |
|
|
$ 118,026 |
* When Class B and Class C shares are initially sold, FDC pays commissions from its own resources to financial intermediaries through which the sales are made.
Transfer Agent Fees. Fidelity Investments Institutional Operations Company, Inc., (FIIOC), an affiliate of FMR, is the transfer, dividend disbursing and shareholder servicing agent for each class of the Fund. FIIOC receives account fees and asset-based fees that vary according to the account size and type of account of the shareholders of the respective classes of the Fund. FIIOC pays for typesetting, printing and mailing of shareholder reports, except proxy statements. For the period, transfer agent fees for each class were as follows:
|
|
Amount |
% of |
|
Class A |
$ 380,022 |
.30 |
|
Class T |
101,679 |
.32 |
|
Class B |
42,879 |
.30 |
|
Class C |
151,514 |
.30 |
|
Gold |
9,385,666 |
.30 |
|
Institutional Class |
303,067 |
.21 |
|
|
$ 10,364,827 |
|
Annual Report
Notes to Consolidated Financial Statements - continued
6. Fees and Other Transactions with Affiliates - continued
Accounting and Security Lending Fees. Fidelity Service Company, Inc. (FSC), an affiliate of FMR, maintains the Fund's accounting records. The accounting fee is based on the level of average net assets for each month. Under a separate contract, FSC administers the security lending program. The security lending fee is based on the number and duration of lending transactions.
Brokerage Commissions. The Fund placed a portion of its portfolio transactions with brokerage firms which are affiliates of the investment adviser. The commissions paid to these affiliated firms were $4,289 for the period.
Interfund Lending Program. Pursuant to an Exemptive Order issued by the SEC, the Fund, along with other registered investment companies having management contracts with FMR, may participate in an interfund lending program. This program provides an alternative credit facility allowing the funds to borrow from, or lend money to, other participating affiliated funds. At period end, there were no interfund loans outstanding. The Fund's activity in this program during the period for which loans were outstanding was as follows:
|
Borrower or Lender |
Average Loan |
Weighted Average |
Interest |
|
Borrower |
$ 7,919,951 |
.41% |
$ 5,520 |
7. Committed Line of Credit.
The Fund participates with other funds managed by FMR or an affiliate in a $4.25 billion credit facility (the "line of credit") to be utilized for temporary or emergency purposes to fund shareholder redemptions or for other short-term liquidity purposes. The Fund has agreed to pay commitment fees on its pro-rata portion of the line of credit, which amounted to $9,688 and is reflected in Miscellaneous expenses on the Consolidated Statement of Operations. During the period, there were no borrowings on this line of credit.
8. Security Lending.
The Fund lends portfolio securities through a lending agent from time to time in order to earn additional income. For equity securities, a lending agent is used and may loan securities to certain qualified borrowers, including Fidelity Capital Markets (FCM), a broker-dealer affiliated with the Fund. On the settlement date of the loan, the Fund receives collateral (in the form of U.S. Treasury obligations, letters of credit and/or cash) against the loaned securities and maintains collateral in an amount not less than 100% of the market value of the loaned securities during the period of the loan. The market value of the loaned securities is determined at the close of business of the Fund and any additional required collateral is delivered to the Fund on the next business day. If the borrower defaults on its obligation to return the securities loaned because of insolvency or other reasons, a fund could experience delays and costs in recovering the securities loaned or in gaining access to the collateral. Any cash collateral received is invested in the Fidelity Securities Lending Cash Central Fund. The value of loaned securities and cash collateral at period end are disclosed on the Fund's Consolidated Statement of Assets and Liabilities. At period end, there were no security loans outstanding with FCM. Security lending income represents the income earned on investing cash collateral, less rebates paid to borrowers and any lending agent fees associated with the loan, plus any premium payments received for lending certain types of securities. Security lending income is presented in the Consolidated Statement of Operations as a component of income from Fidelity Central Funds. Total security lending income during the period amounted to $777,921, including $19,129 from securities loaned to FCM.
9. Bank Borrowings.
The Fund is permitted to have bank borrowings for temporary or emergency purposes to fund shareholder redemptions or for other short-term liquidity requirements. The Fund has established borrowing arrangements with certain banks. The interest rate on the borrowings is the bank's base rate, as revised from time to time. The average loan balance during the period for which loans were outstanding amounted to $6,452,333. The weighted average interest rate was .64%. The interest expense amounted to $693 under the bank borrowing program. At period end, there were no bank borrowings outstanding.
10. Expense Reductions.
FMR has contractually agreed to waive the Fund's management fee in an amount equal to the management fee of the Subsidiary. During the period, this waiver reduced the Fund's management fee by $330,253. Many of the brokers with whom FMR places trades on behalf of the Fund provided services to the Fund in addition to trade execution. These services included payments of certain expenses on behalf of the Fund totaling $173,463 for the period. In addition, through arrangements with the Fund's custodian, credits realized as a result of uninvested cash balances were used to reduce the Fund's expenses. During the period, these credits reduced the Fund's expenses by $351.
In addition, FMR reimbursed a portion of the Fund's operating expenses during the period in the amount of $11,638.
Annual Report
11. Distributions to Shareholders.
Distributions to shareholders of each class were as follows:
|
|
Year ended |
Year ended |
|
From net realized gain |
|
|
|
Class A |
$ - |
$ 7,834,928 |
|
Class T |
- |
2,382,367 |
|
Class B |
- |
1,303,107 |
|
Class C |
- |
3,798,844 |
|
Gold |
- |
215,607,839 |
|
Institutional Class |
- |
7,823,012 |
|
Total |
$ - |
$ 238,750,097 |
12. Share Transactions.
Transactions for each class of shares were as follows:
|
|
Shares |
Dollars |
||
|
|
Year ended |
Year ended |
Year ended |
Year ended |
|
Class A |
|
|
|
|
|
Shares sold |
1,412,697 |
1,589,102 |
$ 53,420,103 |
$ 76,690,664 |
|
Reinvestment of distributions |
- |
145,713 |
- |
7,265,756 |
|
Shares redeemed |
(1,438,620) |
(1,293,053) |
(53,775,838) |
(61,867,749) |
|
Net increase (decrease) |
(25,923) |
441,762 |
$ (355,735) |
$ 22,088,671 |
|
Class T |
|
|
|
|
|
Shares sold |
284,748 |
326,122 |
$ 10,411,769 |
$ 15,663,258 |
|
Reinvestment of distributions |
- |
46,446 |
- |
2,308,310 |
|
Shares redeemed |
(355,685) |
(374,234) |
(13,010,570) |
(17,626,829) |
|
Net increase (decrease) |
(70,937) |
(1,666) |
$ (2,598,801) |
$ 344,739 |
|
Class B |
|
|
|
|
|
Shares sold |
16,804 |
55,740 |
$ 624,661 |
$ 2,638,278 |
|
Reinvestment of distributions |
- |
22,881 |
- |
1,122,370 |
|
Shares redeemed |
(167,215) |
(142,844) |
(6,101,257) |
(6,672,300) |
|
Net increase (decrease) |
(150,411) |
(64,223) |
$ (5,476,596) |
$ (2,911,652) |
|
Class C |
|
|
|
|
|
Shares sold |
311,882 |
510,073 |
$ 11,372,831 |
$ 24,191,165 |
|
Reinvestment of distributions |
- |
63,636 |
- |
3,100,723 |
|
Shares redeemed |
(559,180) |
(484,293) |
(20,004,404) |
(22,585,009) |
|
Net increase (decrease) |
(247,298) |
89,416 |
$ (8,631,573) |
$ 4,706,879 |
|
Gold |
|
|
|
|
|
Shares sold |
22,313,552 |
30,555,727 |
$ 848,495,476 |
$ 1,483,101,053 |
|
Reinvestment of distributions |
- |
4,125,294 |
- |
208,463,091 |
|
Shares redeemed |
(32,795,078) |
(31,912,749) |
(1,225,752,483) |
(1,536,990,789) |
|
Net increase (decrease) |
(10,481,526) |
2,768,272 |
$ (377,257,007) |
$ 154,573,355 |
|
Institutional Class |
|
|
|
|
|
Shares sold |
1,354,134 |
1,664,357 |
$ 51,488,741 |
$ 81,430,250 |
|
Reinvestment of distributions |
- |
146,226 |
- |
7,344,695 |
|
Shares redeemed |
(849,045) |
(810,698) |
(31,583,828) |
(38,218,873) |
|
Net increase (decrease) |
505,089 |
999,885 |
$ 19,904,913 |
$ 50,556,072 |
13. Other.
The Fund's organizational documents provide former and current trustees and officers with a limited indemnification against liabilities arising in connection with the performance of their duties to the Fund. In the normal course of business, the Fund may also enter into contracts that provide general indemnifications. The Fund's maximum exposure under these arrangements is unknown as this would be dependent on future claims that may be made against the Fund. The risk of material loss from such claims is considered remote.
Annual Report
Fidelity Advisor Materials Fund - Institutional Class
Performance: The Bottom Line
Average annual total return reflects the change in the value of an investment, assuming reinvestment of the class' distributions from dividend income and capital gains (the profits earned upon the sale of securities that have grown in value, if any) and assuming a constant rate of performance each year. The $10,000 table and the fund's returns do not reflect the deduction of taxes that a shareholder would pay on fund distributions or the redemption of fund shares. During periods of reimbursement by Fidelity, a fund's total return will be greater than it would be had the reimbursement not occurred. How a fund did yesterday is no guarantee of how it will do tomorrow.
Average Annual Total Returns
|
Periods ended February 28, 2013 |
Past 1 |
Past 5 |
Past 10 |
|
Institutional Class A |
9.71% |
6.99% |
15.26% |
A The initial offering of Institutional Class shares took place on December 12, 2006. Returns prior to December 12, 2006, are those of Materials Portfolio, the original class of the fund.
Prior to October 1, 2006, the fund operated under certain different investment policies. The historical performance for the fund may not represent its current investment policies.
$10,000 Over 10 Years
Let's say hypothetically that $10,000 was invested in Fidelity Advisor Materials Fund - Institutional Class on February 28, 2003. The chart shows how the value of your investment would have changed, and also shows how the S&P 500 Index performed over the same period. The initial offering of Institutional Class shares took place on December 12, 2006. See the Average Annual Total Returns table for additional information regarding the performance of Institutional Class.
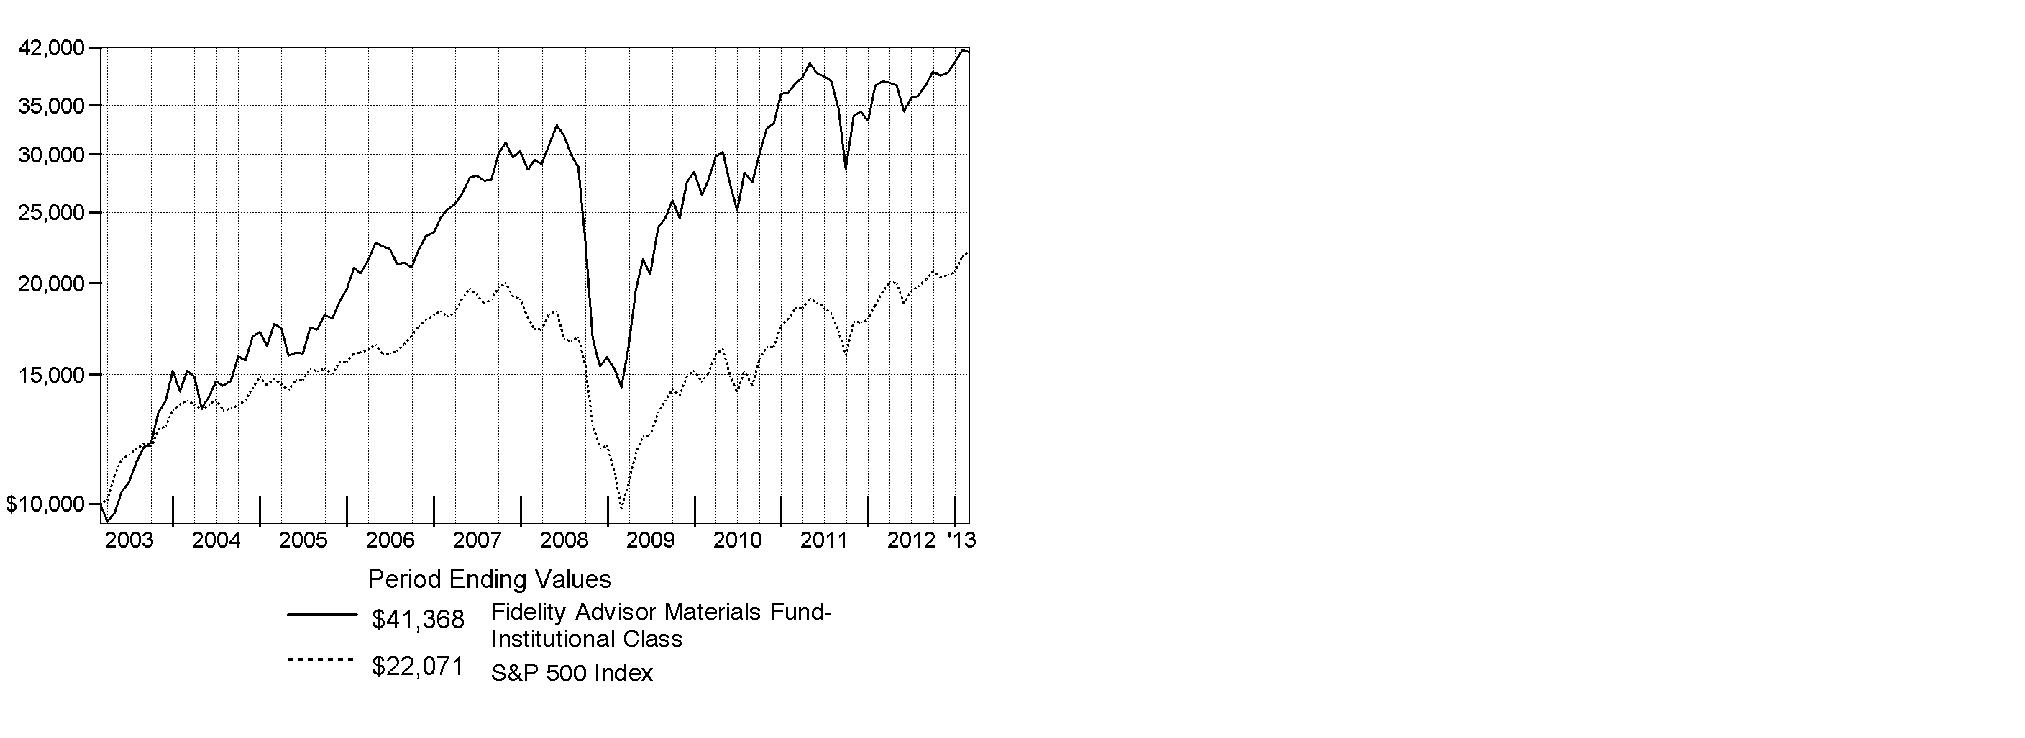
Annual Report
Fidelity Advisor Materials Fund
Management's Discussion of Fund Performance
Market Recap: U.S. stocks posted solid gains for the year ending February 28, 2013, sparked by a late-period rally that pushed major equity benchmarks to multiyear highs. Improvement in the global economy and more monetary stimulus from the U.S. Federal Reserve kept markets on the upswing for much of the year, shrugging off an early decline brought on by debt woes in Europe, and another dip later in the period amid Congressional gridlock on the federal budget. Renewed optimism over employment, the housing market, corporate earnings and record dividends made stocks a favorite with investors during the 12 months, which helped push the broad-based S&P 500® Index across the milestone 1,500 mark at the end of January. The S&P 500® finished the period up 13.46%. Seven of the 10 major market sectors tracked by MSCI U.S. IMI 25-50 classifications produced double-digit gains, led by health care and financials, while information technology, energy and materials trailed the broad equity market with only modest advances.
Comments from Tobias Welo, Portfolio Manager of Fidelity Advisor Materials Fund: For the year, the fund's Institutional Class shares returned 9.71%, outpacing the 7.68% advance of the MSCI® U.S. IMI Materials 25-50 Index but trailing the S&P 500®. Compared with the broader market, the materials sector was held back in part by weakness in various metals-related groups during the first several months of the period. Versus the MSCI index, the portfolio benefited from both industry weightings and stock selection, especially in commodity chemicals, where I increased the fund's exposure to companies with ties to the construction industry. Stock picking in fertilizers/agricultural chemicals and steel also benefited the fund's results. Not owning iron-ore producer and index component Cliffs Natural Resources had a positive impact, given this stock's decline of roughly 58% against the backdrop of increasingly unfavorable supply/demand conditions for the commodity. The fund also was helped by its underweightings in metals producer Freeport-McMoRan Copper & Gold and gold miner Newmont Mining - both weak-performing constituents of the MSCI index. I sold the former and significantly reduced the latter during the period. Among overweighted positions, one key contributor was an out-of-benchmark stake in Rentech Nitrogen Partners, which I sold to lock in profits. In absolute terms, agricultural chemicals producer Monsanto was the fund's top contributor and also its largest holding, although this stock had only a small positive impact on performance relative to the index. Conversely, performance was dampened by weak picks in diversified metals/mining, a group whose allocation in the fund I significantly reduced during the period, as slowing demand from China and ample supply weighed on the share prices of these stocks. The fund's holdings in cash and cash equivalents, averaging around 3.6% of net assets during the period, also muted the fund's gain in a rising market. At the stock level, out-of-benchmark positions in two Canada-based copper mines hampered the fund's results. One of these - and the fund's biggest relative detractor - was Ivanhoe Mines, which was renamed Turquoise Hill Resources in August. This stock sold off in part on concerns about the attempt of mining giant Rio Tinto, a minority owner in Ivanhoe, to gain control of the company. Subsequently, pressure from the Mongolian government for more control and a larger share of the profits from the company's Oyu Tolgoi mine - slated to begin production in June 2013 - further depressed the stock. The shares of Copper Mountain Mining also posted a sizable loss during the period amid disappointing production numbers, which I used as an opportunity to roughly double the fund's exposure by period end. Canadian gold producer Goldcorp, another non-index position, was hampered by softness in that metal's price.
The views expressed above reflect those of the portfolio manager(s) only through the end of the period as stated on the cover of this report and do not necessarily represent the views of Fidelity or any other person in the Fidelity organization. Any such views are subject to change at any time based upon market or other conditions and Fidelity disclaims any responsibility to update such views. These views may not be relied on as investment advice and, because investment decisions for a Fidelity fund are based on numerous factors, may not be relied on as an indication of trading intent on behalf of any Fidelity fund.
Annual Report
Materials Portfolio
Shareholder Expense Example
As a shareholder of the Fund, you incur two types of costs: (1) transaction costs, including sales charges (loads) on purchase payments or redemption proceeds, redemption fees and (2) ongoing costs, including management fees, distribution and/or service (12b-1) fees and other Fund expenses. This Example is intended to help you understand your ongoing costs (in dollars) of investing in the Fund and to compare these costs with the ongoing costs of investing in other mutual funds.
The Example is based on an investment of $1,000 invested at the beginning of the period and held for the entire period (September 1, 2012 to February 28, 2013).
Actual Expenses
The first line of the accompanying table for each class of the Fund provides information about actual account values and actual expenses. You may use the information in this line, together with the amount you invested, to estimate the expenses that you paid over the period. Simply divide your account value by $1,000.00 (for example, an $8,600 account value divided by $1,000.00 = 8.6), then multiply the result by the number in the first line for a class of the Fund under the heading entitled "Expenses Paid During Period" to estimate the expenses you paid on your account during this period. A small balance maintenance fee of $12.00 that is charged once a year may apply for certain accounts with a value of less than $2,000. This fee is not included in the table below. If it was, the estimate of expenses you paid during the period would be higher, and your ending account value lower, by this amount. In addition, the Fund, as a shareholder in the underlying Fidelity Central Funds, will indirectly bear its pro-rata share of the fees and expenses incurred by the underlying Fidelity Central Funds. These fees and expenses are not included in the Fund's annualized expense ratio used to calculate the expense estimate in the table below.
Hypothetical Example for Comparison Purposes
The second line of the accompanying table for each class of the Fund provides information about hypothetical account values and hypothetical expenses based on a Class' actual expense ratio and an assumed rate of return of 5% per year before expenses, which is not the Class' actual return. The hypothetical account values and expenses may not be used to estimate the actual ending account balance or expenses you paid for the period. You may use this information to compare the ongoing costs of investing in the Fund and other funds. To do so, compare this 5% hypothetical example with the 5% hypothetical examples that appear in the shareholder reports of the other funds. A small balance maintenance fee of $12.00 that is charged once a year may apply for certain accounts with a value of less than $2,000. This fee is not included in the table below. If it was, the estimate of expenses you paid during the period would be higher, and your ending account value lower, by this amount. In addition, the Fund, as a shareholder in the underlying Fidelity Central Funds, will indirectly bear its pro-rata share of the fees and expenses incurred by the underlying Fidelity Central Funds. These fees and expenses are not included in the Fund's annualized expense ratio used to calculate the expense estimate in the table below.
Please note that the expenses shown in the table are meant to highlight your ongoing costs only and do not reflect any transaction costs. Therefore, the second line of the table is useful in comparing ongoing costs only, and will not help you determine the relative total costs of owning different funds. In addition, if these transactional costs were included, your costs would have been higher.
|
|
Annualized |
Beginning |
Ending |
Expenses Paid |
|
Class A |
1.13% |
|
|
|
|
Actual |
|
$ 1,000.00 |
$ 1,105.40 |
$ 5.90 |
|
HypotheticalA |
|
$ 1,000.00 |
$ 1,019.19 |
$ 5.66 |
|
Class T |
1.42% |
|
|
|
|
Actual |
|
$ 1,000.00 |
$ 1,103.80 |
$ 7.41 |
|
HypotheticalA |
|
$ 1,000.00 |
$ 1,017.75 |
$ 7.10 |
|
Class B |
1.92% |
|
|
|
|
Actual |
|
$ 1,000.00 |
$ 1,101.10 |
$ 10.00 |
|
HypotheticalA |
|
$ 1,000.00 |
$ 1,015.27 |
$ 9.59 |
|
Class C |
1.88% |
|
|
|
|
Actual |
|
$ 1,000.00 |
$ 1,101.40 |
$ 9.80 |
|
HypotheticalA |
|
$ 1,000.00 |
$ 1,015.47 |
$ 9.39 |
|
Materials |
.84% |
|
|
|
|
Actual |
|
$ 1,000.00 |
$ 1,107.10 |
$ 4.39 |
|
HypotheticalA |
|
$ 1,000.00 |
$ 1,020.63 |
$ 4.21 |
|
Institutional Class |
.84% |
|
|
|
|
Actual |
|
$ 1,000.00 |
$ 1,107.00 |
$ 4.39 |
|
HypotheticalA |
|
$ 1,000.00 |
$ 1,020.63 |
$ 4.21 |
A 5% return per year before expenses
* Expenses are equal to each Class' annualized expense ratio, multiplied by the average account value over the period, multiplied by 181/365 (to reflect the one-half year period).
Annual Report
Materials Portfolio
Investment Changes (Unaudited)
|
Top Ten Stocks as of February 28, 2013 |
||
|
|
% of fund's |
% of fund's net assets |
|
Monsanto Co. |
9.6 |
8.1 |
|
LyondellBasell Industries NV Class A |
4.9 |
4.2 |
|
Air Products & Chemicals, Inc. |
4.7 |
5.7 |
|
E.I. du Pont de Nemours & Co. |
4.3 |
8.3 |
|
Ecolab, Inc. |
4.1 |
3.5 |
|
PPG Industries, Inc. |
4.0 |
3.6 |
|
International Paper Co. |
3.8 |
1.2 |
|
Eastman Chemical Co. |
3.6 |
3.8 |
|
The Dow Chemical Co. |
3.3 |
0.7 |
|
Rock-Tenn Co. Class A |
3.1 |
3.2 |
|
|
45.4 |
|
|
Top Industries (% of fund's net assets) |
|||
|
As of February 28, 2013 |
|||
|
Chemicals |
65.9% |
|
|
Metals & Mining |
12.3% |
|
|
Containers & Packaging |
8.6% |
|
|
Paper & Forest Products |
6.0% |
|
|
Construction Materials |
3.7% |
|
|
All Others* |
3.5% |
|

|
As of August 31, 2012 |
|||
|
Chemicals |
62.5% |
|
|
Metals & Mining |
19.5% |
|
|
Containers & Packaging |
8.6% |
|
|
Construction Materials |
1.5% |
|
|
Paper & Forest Products |
1.2% |
|
|
All Others* |
6.7% |
|

|
* Includes short-term investments and net other assets. |
Annual Report
Materials Portfolio
Investments February 28, 2013
Showing Percentage of Net Assets
|
Common Stocks - 97.2% |
|||
|
Shares |
Value |
||
|
CHEMICALS - 65.9% |
|||
|
Commodity Chemicals - 10.1% |
|||
|
Arkema SA |
115,041 |
$ 11,687,924 |
|
|
Axiall Corp. |
632,739 |
35,800,373 |
|
|
Cabot Corp. |
513,283 |
18,878,549 |
|
|
LyondellBasell Industries NV Class A (d) |
1,463,462 |
85,788,142 |
|
|
Westlake Chemical Corp. |
273,610 |
23,590,654 |
|
|
|
175,745,642 |
||
|
Diversified Chemicals - 18.5% |
|||
|
E.I. du Pont de Nemours & Co. |
1,551,829 |
74,332,609 |
|
|
Eastman Chemical Co. |
894,076 |
62,343,919 |
|
|
FMC Corp. |
881,753 |
53,134,436 |
|
|
Lanxess AG |
49,593 |
4,203,319 |
|
|
PPG Industries, Inc. |
514,803 |
69,323,372 |
|
|
The Dow Chemical Co. |
1,793,202 |
56,880,367 |
|
|
|
320,218,022 |
||
|
Fertilizers & Agricultural Chemicals - 9.6% |
|||
|
Monsanto Co. |
1,643,348 |
166,027,448 |
|
|
Industrial Gases - 6.5% |
|||
|
Air Products & Chemicals, Inc. |
947,891 |
81,840,909 |
|
|
Airgas, Inc. |
308,866 |
30,973,082 |
|
|
|
112,813,991 |
||
|
Specialty Chemicals - 21.2% |
|||
|
Albemarle Corp. |
671,011 |
43,669,396 |
|
|
Ashland, Inc. |
626,486 |
48,847,113 |
|
|
Balchem Corp. |
32,824 |
1,323,792 |
|
|
Cytec Industries, Inc. |
352,330 |
25,505,169 |
|
|
Ecolab, Inc. |
933,679 |
71,473,127 |
|
|
NewMarket Corp. |
4,004 |
1,007,687 |
|
|
PolyOne Corp. |
333,286 |
7,595,588 |
|
|
Rockwood Holdings, Inc. |
592,132 |
37,067,463 |
|
|
Sherwin-Williams Co. |
302,027 |
48,804,543 |
|
|
Sigma Aldrich Corp. |
511,144 |
39,388,757 |
|
|
W.R. Grace & Co. (a) |
612,196 |
43,820,990 |
|
|
|
368,503,625 |
||
|
TOTAL CHEMICALS |
1,143,308,728 |
||
|
COMMERCIAL SERVICES & SUPPLIES - 0.0% |
|||
|
Environmental & Facility Services - 0.0% |
|||
|
Swisher Hygiene, Inc. (a) |
262,171 |
369,661 |
|
|
CONSTRUCTION MATERIALS - 3.7% |
|||
|
Construction Materials - 3.7% |
|||
|
Lafarge SA (Bearer) |
139,600 |
9,411,637 |
|
|
|
|||
|
Shares |
Value |
||
|
Martin Marietta Materials, Inc. (d) |
206,511 |
$ 20,058,413 |
|
|
Vulcan Materials Co. |
670,556 |
34,151,417 |
|
|
|
63,621,467 |
||
|
CONTAINERS & PACKAGING - 8.6% |
|||
|
Metal & Glass Containers - 5.2% |
|||
|
Aptargroup, Inc. |
668,539 |
36,060,994 |
|
|
Ball Corp. |
937,435 |
41,631,488 |
|
|
Silgan Holdings, Inc. |
316,978 |
13,607,866 |
|
|
|
91,300,348 |
||
|
Paper Packaging - 3.4% |
|||
|
Graphic Packaging Holding Co. (a) |
602,665 |
4,471,774 |
|
|
Rock-Tenn Co. Class A |
611,384 |
54,076,915 |
|
|
|
58,548,689 |
||
|
TOTAL CONTAINERS & PACKAGING |
149,849,037 |
||
|
METALS & MINING - 12.3% |
|||
|
Diversified Metals & Mining - 2.8% |
|||
|
Copper Mountain Mining Corp. (a) |
3,528,527 |
11,017,558 |
|
|
First Quantum Minerals Ltd. (d) |
825,600 |
15,379,177 |
|
|
SunCoke Energy, Inc. (a) |
237,112 |
3,909,977 |
|
|
Turquoise Hill Resources Ltd. (a) |
1,499,940 |
9,585,071 |
|
|
Walter Energy, Inc. (d) |
273,776 |
8,703,339 |
|
|
|
48,595,122 |
||
|
Gold - 4.5% |
|||
|
Allied Nevada Gold Corp. (a) |
630,372 |
11,535,808 |
|
|
Franco-Nevada Corp. |
191,900 |
9,281,912 |
|
|
Goldcorp, Inc. |
786,200 |
25,661,568 |
|
|
Newmont Mining Corp. |
295,221 |
11,894,454 |
|
|
Royal Gold, Inc. |
298,383 |
19,556,022 |
|
|
|
77,929,764 |
||
|
Steel - 5.0% |
|||
|
Carpenter Technology Corp. |
527,172 |
24,898,334 |
|
|
Commercial Metals Co. |
1,157,189 |
18,873,753 |
|
|
Haynes International, Inc. |
275,652 |
14,196,078 |
|
|
Reliance Steel & Aluminum Co. |
445,602 |
29,672,637 |
|
|
|
87,640,802 |
||
|
TOTAL METALS & MINING |
214,165,688 |
||
|
OIL, GAS & CONSUMABLE FUELS - 0.7% |
|||
|
Coal & Consumable Fuels - 0.7% |
|||
|
Peabody Energy Corp. |
554,871 |
11,963,019 |
|
|
PAPER & FOREST PRODUCTS - 6.0% |
|||
|
Forest Products - 0.6% |
|||
|
Canfor Corp. (a) |
499,100 |
9,403,649 |
|
|
Common Stocks - continued |
|||
|
Shares |
Value |
||
|
PAPER & FOREST PRODUCTS - CONTINUED |
|||
|
Paper Products - 5.4% |
|||
|
International Paper Co. |
1,520,766 |
$ 66,928,912 |
|
|
MeadWestvaco Corp. |
762,580 |
27,231,732 |
|
|
|
94,160,644 |
||
|
TOTAL PAPER & FOREST PRODUCTS |
103,564,293 |
||
|
TOTAL COMMON STOCKS (Cost $1,361,969,249) |
|
||
|
Convertible Bonds - 0.4% |
||||
|
|
Principal Amount |
|
||
|
BUILDING PRODUCTS - 0.4% |
||||
|
Building Products - 0.4% |
||||
|
Aspen Aerogels, Inc. 8% 6/1/14 (f) |
|
$ 7,861,200 |
|
|
|
U.S. Treasury Obligations - 0.0% |
||||
|
|
||||
|
U.S. Treasury Bills, yield at date of purchase 0.1% 4/18/13 (e) |
|
290,000 |
|
|
|
Money Market Funds - 8.5% |
|||
|
Shares |
|
||
|
Fidelity Cash Central Fund, 0.16% (b) |
40,086,153 |
40,086,153 |
|
|
Fidelity Securities Lending Cash Central Fund, 0.16% (b)(c) |
107,374,488 |
107,374,488 |
|
|
TOTAL MONEY MARKET FUNDS (Cost $147,460,641) |
|
||
|
TOTAL INVESTMENT PORTFOLIO - 106.1% (Cost $1,517,581,053) |
1,842,453,701 |
||
|
NET OTHER ASSETS (LIABILITIES) - (6.1)% |
(106,263,651) |
||
|
NET ASSETS - 100% |
$ 1,736,190,050 |
||
|
Futures Contracts |
|||||
|
|
Expiration |
Underlying |
Unrealized |
||
|
Purchased |
|||||
|
Equity Index Contracts |
|||||
|
191 CME E-mini S&P Select Sector Materials Index Contracts |
March 2013 |
$ 7,737,410 |
$ 417,650 |
||
|
|
|
The face value of futures purchased as a percentage of net assets is 0.4% |
|
Legend |
|
(a) Non-income producing |
|
(b) Affiliated fund that is generally available only to investment companies and other accounts managed by Fidelity Investments. The rate quoted is the annualized seven-day yield of the fund at period end. A complete unaudited listing of the fund's holdings as of its most recent quarter end is available upon request. In addition, each Fidelity Central Fund's financial statements, which are not covered by the Fund's Report of Independent Registered Public Accounting Firm, are available on the SEC's website or upon request. |
|
(c) Investment made with cash collateral received from securities on loan. |
|
(d) Security or a portion of the security is on loan at period end. |
|
(e) Security or a portion of the security was pledged to cover margin requirements for futures contracts. At the period end, the value of securities pledged amounted to $289,967. |
|
(f) Restricted securities - Investment in securities not registered under the Securities Act of 1933 (excluding 144A issues). At the end of the period, the value of restricted securities (excluding 144A issues) amounted to $7,861,200 or 0.4% of net assets. |
|
Additional information on each restricted holding is as follows: |
|
Security |
Acquisition Date |
Acquisition Cost |
|
Aspen Aerogels, Inc. 8% 6/1/14 |
6/1/11 |
$ 7,861,200 |
|
Affiliated Central Funds |
|
Information regarding fiscal year to date income earned by the Fund from investments in Fidelity Central Funds is as follows: |
|
Fund |
Income earned |
|
Fidelity Cash Central Fund |
$ 104,759 |
|
Fidelity Securities Lending Cash Central Fund |
520,779 |
|
Total |
$ 625,538 |
|
Other Information |
|
The following is a summary of the inputs used, as of February 28, 2013, involving the Fund's assets and liabilities carried at fair value. The inputs or methodology used for valuing securities may not be an indication of the risk associated with investing in those securities. For more information on valuation inputs, and their aggregation into the levels used in the table below, please refer to the Investment Valuation section in the accompanying Notes to Financial Statements. |
|
Valuation Inputs at Reporting Date: |
||||
|
Description |
Total |
Level 1 |
Level 2 |
Level 3 |
|
Investments in Securities: |
||||
|
Common Stocks |
$ 1,686,841,893 |
$ 1,686,841,893 |
$ - |
$ - |
|
Convertible Bonds |
7,861,200 |
- |
- |
7,861,200 |
|
U.S. Treasury Obligations |
289,967 |
- |
289,967 |
- |
|
Money Market Funds |
147,460,641 |
147,460,641 |
- |
- |
|
Total Investments in Securities: |
$ 1,842,453,701 |
$ 1,834,302,534 |
$ 289,967 |
$ 7,861,200 |
|
Derivative Instruments: |
||||
|
Assets |
||||
|
Futures Contracts |
$ 417,650 |
$ 417,650 |
$ - |
$ - |
|
Value of Derivative Instruments |
|
The following table is a summary of the Fund's value of derivative instruments by primary risk exposure as of February 28, 2013. For additional information on derivative instruments, please refer to the Derivative Instruments section in the accompanying Notes to Financial Statements. |
|
Primary Risk Exposure / |
Value |
|
|
|
Asset |
Liability |
|
Equity Risk |
||
|
Futures Contracts (a) |
$ 417,650 |
$ - |
|
Total Value of Derivatives |
$ 417,650 |
$ - |
|
(a) Reflects cumulative appreciation/(depreciation) on futures contracts as disclosed on the Schedule of Investments. Only the period end variation margin is separately disclosed on the Statement of Assets and Liabilities. |
|
Distribution of investments by country or territory of incorporation, as a percentage of total net assets, is as follows. (Unaudited) |
|
United States of America |
89.0% |
|
Netherlands |
4.9% |
|
Canada |
4.7% |
|
France |
1.2% |
|
Others (Individually Less Than 1%) |
0.2% |
|
|
100.0% |
See accompanying notes which are an integral part of the financial statements.
Annual Report
Materials Portfolio
Financial Statements
Statement of Assets and Liabilities
|
|
February 28, 2013 |
|
|
|
|
|
|
Assets |
|
|
|
Investment in securities, at value (including securities loaned of $105,779,869) - See accompanying schedule: Unaffiliated issuers (cost $1,370,120,412) |
$ 1,694,993,060 |
|
|
Fidelity Central Funds (cost $147,460,641) |
147,460,641 |
|
|
Total Investments (cost $1,517,581,053) |
|
$ 1,842,453,701 |
|
Receivable for investments sold |
|
2,511,165 |
|
Receivable for fund shares sold |
|
3,698,364 |
|
Dividends receivable |
|
3,018,349 |
|
Interest receivable |
|
1,100,568 |
|
Distributions receivable from Fidelity Central Funds |
|
45,381 |
|
Receivable for daily variation margin on futures contracts |
|
3,820 |
|
Prepaid expenses |
|
2,248 |
|
Receivable from investment adviser for expense reductions |
|
2,610 |
|
Other receivables |
|
50,560 |
|
Total assets |
|
1,852,886,766 |
|
|
|
|
|
Liabilities |
|
|
|
Payable for investments purchased |
$ 1,546,840 |
|
|
Payable for fund shares redeemed |
6,400,199 |
|
|
Accrued management fee |
805,701 |
|
|
Distribution and service plan fees payable |
131,095 |
|
|
Other affiliated payables |
367,142 |
|
|
Other payables and accrued expenses |
71,251 |
|
|
Collateral on securities loaned, at value |
107,374,488 |
|
|
Total liabilities |
|
116,696,716 |
|
|
|
|
|
Net Assets |
|
$ 1,736,190,050 |
|
Net Assets consist of: |
|
|
|
Paid in capital |
|
$ 1,426,561,342 |
|
Undistributed net investment income |
|
1,139,006 |
|
Accumulated undistributed net realized gain (loss) on investments and foreign currency transactions |
|
(16,797,613) |
|
Net unrealized appreciation (depreciation) on investments and assets and liabilities in foreign currencies |
|
325,287,315 |
|
Net Assets |
|
$ 1,736,190,050 |
Statement of Assets and Liabilities - continued
|
|
February 28, 2013 |
|
|
|
|
|
|
Calculation of Maximum Offering Price Class A: |
|
$ 73.44 |
|
|
|
|
|
Maximum offering price per share (100/94.25 of $73.44) |
|
$ 77.92 |
|
Class T: |
|
$ 73.05 |
|
|
|
|
|
Maximum offering price per share (100/96.50 of $73.05) |
|
$ 75.70 |
|
Class B: |
|
$ 72.21 |
|
|
|
|
|
Class C: |
|
$ 71.96 |
|
|
|
|
|
Materials: |
|
$ 73.68 |
|
|
|
|
|
Institutional Class: |
|
$ 73.57 |
A Redemption price per share is equal to net asset value less any applicable contingent deferred sales charge.
See accompanying notes which are an integral part of the financial statements.
Annual Report
Statement of Operations
|
|
Year ended February 28, 2013 |
|
|
|
|
|
|
Investment Income |
|
|
|
Dividends |
|
$ 29,263,795 |
|
Interest |
|
631,374 |
|
Income from Fidelity Central Funds |
|
625,538 |
|
Total income |
|
30,520,707 |
|
|
|
|
|
Expenses |
|
|
|
Management fee |
$ 7,954,444 |
|
|
Transfer agent fees |
3,476,538 |
|
|
Distribution and service plan fees |
1,291,538 |
|
|
Accounting and security lending fees |
454,958 |
|
|
Custodian fees and expenses |
35,218 |
|
|
Independent trustees' compensation |
9,216 |
|
|
Registration fees |
204,637 |
|
|
Audit |
49,183 |
|
|
Legal |
5,043 |
|
|
Miscellaneous |
14,328 |
|
|
Total expenses before reductions |
13,495,103 |
|
|
Expense reductions |
(137,302) |
13,357,801 |
|
Net investment income (loss) |
|
17,162,906 |
|
Realized and Unrealized Gain (Loss) Net realized gain (loss) on: |
|
|
|
Investment securities: |
|
|
|
Unaffiliated issuers |
18,685,188 |
|
|
Foreign currency transactions |
(38,891) |
|
|
Futures contracts |
1,204,377 |
|
|
Total net realized gain (loss) |
|
19,850,674 |
|
Change in net unrealized appreciation (depreciation) on: Investment securities |
92,958,506 |
|
|
Assets and liabilities in foreign currencies |
(2,983) |
|
|
Futures contracts |
(743,685) |
|
|
Total change in net unrealized appreciation (depreciation) |
|
92,211,838 |
|
Net gain (loss) |
|
112,062,512 |
|
Net increase (decrease) in net assets resulting from operations |
|
$ 129,225,418 |
Statement of Changes in Net Assets
|
|
Year ended |
Year ended |
|
Increase (Decrease) in Net Assets |
|
|
|
Operations |
|
|
|
Net investment income (loss) |
$ 17,162,906 |
$ 11,168,253 |
|
Net realized gain (loss) |
19,850,674 |
34,880,798 |
|
Change in net unrealized appreciation (depreciation) |
92,211,838 |
(65,841,883) |
|
Net increase (decrease) in net assets resulting from operations |
129,225,418 |
(19,792,832) |
|
Distributions to shareholders from net investment income |
(15,064,080) |
(9,840,737) |
|
Distributions to shareholders from net realized gain |
(31,892,999) |
(7,461,289) |
|
Total distributions |
(46,957,079) |
(17,302,026) |
|
Share transactions - net increase (decrease) |
219,532,050 |
(18,941,790) |
|
Redemption fees |
63,898 |
99,276 |
|
Total increase (decrease) in net assets |
301,864,287 |
(55,937,372) |
|
|
|
|
|
Net Assets |
|
|
|
Beginning of period |
1,434,325,763 |
1,490,263,135 |
|
End of period (including undistributed net investment income of $1,139,006 and undistributed net investment income of $797,816, respectively) |
$ 1,736,190,050 |
$ 1,434,325,763 |
See accompanying notes which are an integral part of the financial statements.
Annual Report
Financial Highlights - Class A
|
Years ended February 28, |
2013 |
2012 J |
2011 |
2010 |
2009 |
|
Selected Per-Share Data |
|
|
|
|
|
|
Net asset value, beginning of period |
$ 69.23 |
$ 69.96 |
$ 52.54 |
$ 27.65 |
$ 57.00 |
|
Income from Investment Operations |
|
|
|
|
|
|
Net investment income (loss) C |
.70 |
.40 |
1.08 F |
.30 G |
.22 |
|
Net realized and unrealized gain (loss) |
5.69 |
(.35) |
17.40 |
24.90 |
(29.46) |
|
Total from investment operations |
6.39 |
.05 |
18.48 |
25.20 |
(29.24) |
|
Distributions from net investment income |
(.63) |
(.40) |
(1.06) |
(.32) |
(.12) |
|
Distributions from net realized gain |
(1.55) |
(.38) |
(.01) |
- |
- |
|
Total distributions |
(2.18) |
(.78) |
(1.07) |
(.32) |
(.12) |
|
Redemption fees added to paid in capital C |
- K |
- K |
.01 |
.01 |
.01 |
|
Net asset value, end of period |
$ 73.44 |
$ 69.23 |
$ 69.96 |
$ 52.54 |
$ 27.65 |
|
Total Return A, B |
9.40% |
.21% |
35.33% |
91.25% |
(51.30)% |
|
Ratios to Average Net Assets D, H |
|
|
|
|
|
|
Expenses before reductions |
1.13% |
1.13% |
1.16% |
1.23% |
1.21% |
|
Expenses net of fee waivers, if any |
1.13% |
1.13% |
1.16% |
1.23% |
1.21% |
|
Expenses net of all reductions |
1.12% |
1.13% |
1.15% |
1.22% |
1.20% |
|
Net investment income (loss) |
1.02% |
.61% |
1.81% F |
.65% G |
.47% |
|
Supplemental Data |
|
|
|
|
|
|
Net assets, end of period (000 omitted) |
$ 219,627 |
$ 157,781 |
$ 124,160 |
$ 52,352 |
$ 10,796 |
|
Portfolio turnover rate E |
61% |
94% |
87% |
104% I |
117% |
|
A Total returns would have been lower if certain expenses had not been reduced during the applicable periods shown. B Total returns do not include the effect of the sales charges. C Calculated based on average shares outstanding during the period. D Fees and expenses of any underlying Fidelity Central Funds are not included in the Fund's expense ratio. The Fund indirectly bears its proportionate share of the expenses of any underlying Fidelity Central Funds. E Amount does not include the portfolio activity of any underlying Fidelity Central Funds. F Investment income per share reflects a large, non-recurring dividend which amounted to $.83 per share. Excluding this non-recurring dividend, the ratio of net investment income (loss) to average net assets would have been .41%. G Investment income per share reflects a large, non-recurring dividend which amounted to $.10 per share. Excluding this non-recurring dividend, the ratio of net investment income (loss) to average net assets would have been .43%. H Expense ratios reflect operating expenses of the class. Expenses before reductions do not reflect amounts reimbursed by the investment adviser or reductions from brokerage service arrangements or reductions from other expense offset arrangements and do not represent the amount paid by the class during periods when reimbursements or reductions occur. Expenses net of fee waivers reflect expenses after reimbursement by the investment adviser but prior to reductions from brokerage service arrangements or other expense offset arrangements. Expenses net of all reductions represent the net expenses paid by the class. I The portfolio turnover rate does not include the assets acquired in the merger. J For the year ended February 29. K Amount represents less than $.01 per share. |
Financial Highlights - Class T
|
Years ended February 28, |
2013 |
2012 J |
2011 |
2010 |
2009 |
|
Selected Per-Share Data |
|
|
|
|
|
|
Net asset value, beginning of period |
$ 68.91 |
$ 69.68 |
$ 52.35 |
$ 27.56 |
$ 56.80 |
|
Income from Investment Operations |
|
|
|
|
|
|
Net investment income (loss) C |
.50 |
.21 |
.90 F |
.16 G |
.10 |
|
Net realized and unrealized gain (loss) |
5.66 |
(.35) |
17.34 |
24.81 |
(29.32) |
|
Total from investment operations |
6.16 |
(.14) |
18.24 |
24.97 |
(29.22) |
|
Distributions from net investment income |
(.46) |
(.25) |
(.92) |
(.19) |
(.03) |
|
Distributions from net realized gain |
(1.55) |
(.38) |
- |
- |
- |
|
Total distributions |
(2.02) L |
(.63) |
(.92) |
(.19) |
(.03) |
|
Redemption fees added to paid in capital C |
- K |
- K |
.01 |
.01 |
.01 |
|
Net asset value, end of period |
$ 73.05 |
$ 68.91 |
$ 69.68 |
$ 52.35 |
$ 27.56 |
|
Total Return A, B |
9.10% |
(.09)% |
34.98% |
90.70% |
(51.43)% |
|
Ratios to Average Net Assets D, H |
|
|
|
|
|
|
Expenses before reductions |
1.42% |
1.42% |
1.44% |
1.52% |
1.46% |
|
Expenses net of fee waivers, if any |
1.42% |
1.42% |
1.44% |
1.52% |
1.46% |
|
Expenses net of all reductions |
1.41% |
1.41% |
1.43% |
1.51% |
1.46% |
|
Net investment income (loss) |
.73% |
.33% |
1.54% F |
.35% G |
.22% |
|
Supplemental Data |
|
|
|
|
|
|
Net assets, end of period (000 omitted) |
$ 37,860 |
$ 28,290 |
$ 25,570 |
$ 14,712 |
$ 4,944 |
|
Portfolio turnover rate E |
61% |
94% |
87% |
104% I |
117% |
|
A Total returns would have been lower if certain expenses had not been reduced during the applicable periods shown. B Total returns do not include the effect of the sales charges. C Calculated based on average shares outstanding during the period. D Fees and expenses of any underlying Fidelity Central Funds are not included in the Fund's expense ratio. The Fund indirectly bears its proportionate share of the expenses of any underlying Fidelity Central Funds. E Amount does not include the portfolio activity of any underlying Fidelity Central Funds. F Investment income per share reflects a large, non-recurring dividend which amounted to $.83 per share. Excluding this non-recurring dividend, the ratio of net investment income (loss) to average net assets would have been .14%. G Investment income per share reflects a large, non-recurring dividend which amounted to $.10 per share. Excluding this non-recurring dividend, the ratio of net investment income (loss) to average net assets would have been .14%. H Expense ratios reflect operating expenses of the class. Expenses before reductions do not reflect amounts reimbursed by the investment adviser or reductions from brokerage service arrangements or reductions from other expense offset arrangements and do not represent the amount paid by the class during periods when reimbursements or reductions occur. Expenses net of fee waivers reflect expenses after reimbursement by the investment adviser but prior to reductions from brokerage service arrangements or other expense offset arrangements. Expenses net of all reductions represent the net expenses paid by the class. I The portfolio turnover rate does not include the assets acquired in the merger. J For the year ended February 29. K Amount represents less than $.01 per share. L Total distributions of $2.02 per share is comprised of distributions from net investment income of $.463 and distributions from net realized gain of $1.552 per share. |
See accompanying notes which are an integral part of the financial statements.
Annual Report
Financial Highlights - Class B
|
Years ended February 28, |
2013 |
2012 J |
2011 |
2010 |
2009 |
|
Selected Per-Share Data |
|
|
|
|
|
|
Net asset value, beginning of period |
$ 68.13 |
$ 68.95 |
$ 51.86 |
$ 27.35 |
$ 56.59 |
|
Income from Investment Operations |
|
|
|
|
|
|
Net investment income (loss) C |
.16 |
(.11) |
.60 F |
(.07) G |
(.12) |
|
Net realized and unrealized gain (loss) |
5.57 |
(.33) |
17.13 |
24.61 |
(29.13) |
|
Total from investment operations |
5.73 |
(.44) |
17.73 |
24.54 |
(29.25) |
|
Distributions from net investment income |
(.10) |
- |
(.65) |
(.04) |
- |
|
Distributions from net realized gain |
(1.55) |
(.38) |
- |
- |
- |
|
Total distributions |
(1.65) |
(.38) |
(.65) |
(.04) |
- |
|
Redemption fees added to paid in capital C |
- K |
- K |
.01 |
.01 |
.01 |
|
Net asset value, end of period |
$ 72.21 |
$ 68.13 |
$ 68.95 |
$ 51.86 |
$ 27.35 |
|
Total Return A, B |
8.55% |
(.57)% |
34.29% |
89.79% |
(51.67)% |
|
Ratios to Average Net Assets D, H |
|
|
|
|
|
|
Expenses before reductions |
1.92% |
1.91% |
1.93% |
2.02% |
1.95% |
|
Expenses net of fee waivers, if any |
1.92% |
1.91% |
1.93% |
2.02% |
1.95% |
|
Expenses net of all reductions |
1.91% |
1.91% |
1.92% |
2.01% |
1.95% |
|
Net investment income (loss) |
.24% |
(.17)% |
1.04% F |
(.15)% G |
(.27)% |
|
Supplemental Data |
|
|
|
|
|
|
Net assets, end of period (000 omitted) |
$ 10,218 |
$ 11,040 |
$ 13,507 |
$ 9,538 |
$ 2,601 |
|
Portfolio turnover rate E |
61% |
94% |
87% |
104% I |
117% |
|
A Total returns would have been lower if certain expenses had not been reduced during the applicable periods shown. B Total returns do not include the effect of the contingent deferred sales charge. C Calculated based on average shares outstanding during the period. D Fees and expenses of any underlying Fidelity Central Funds are not included in the Fund's expense ratio. The Fund indirectly bears its proportionate share of the expenses of any underlying Fidelity Central Funds. E Amount does not include the portfolio activity of any underlying Fidelity Central Funds. F Investment income per share reflects a large, non-recurring dividend which amounted to $.83 per share. Excluding this non-recurring dividend, the ratio of net investment income (loss) to average net assets would have been (.35)%. G Investment income per share reflects a large, non-recurring dividend which amounted to $.10 per share. Excluding this non-recurring dividend, the ratio of net investment income (loss) to average net assets would have been (.36)%. H Expense ratios reflect operating expenses of the class. Expenses before reductions do not reflect amounts reimbursed by the investment adviser or reductions from brokerage service arrangements or reductions from other expense offset arrangements and do not represent the amount paid by the class during periods when reimbursements or reductions occur. Expenses net of fee waivers reflect expenses after reimbursement by the investment adviser but prior to reductions from brokerage service arrangements or other expense offset arrangements. Expenses net of all reductions represent the net expenses paid by the class. I The portfolio turnover rate does not include the assets acquired in the merger. J For the year ended February 29. K Amount represents less than $.01 per share. |
Financial Highlights - Class C
|
Years ended February 28, |
2013 |
2012 J |
2011 |
2010 |
2009 |
|
Selected Per-Share Data |
|
|
|
|
|
|
Net asset value, beginning of period |
$ 67.98 |
$ 68.78 |
$ 51.79 |
$ 27.31 |
$ 56.50 |
|
Income from Investment Operations |
|
|
|
|
|
|
Net investment income (loss) C |
.18 |
(.10) |
.61 F |
(.06) G |
(.13) |
|
Net realized and unrealized gain (loss) |
5.55 |
(.32) |
17.09 |
24.57 |
(29.07) |
|
Total from investment operations |
5.73 |
(.42) |
17.70 |
24.51 |
(29.20) |
|
Distributions from net investment income |
(.20) |
- |
(.72) |
(.04) |
- |
|
Distributions from net realized gain |
(1.55) |
(.38) |
- |
- |
- |
|
Total distributions |
(1.75) |
(.38) |
(.72) |
(.04) |
- |
|
Redemption fees added to paid in capital C |
- K |
- K |
.01 |
.01 |
.01 |
|
Net asset value, end of period |
$ 71.96 |
$ 67.98 |
$ 68.78 |
$ 51.79 |
$ 27.31 |
|
Total Return A, B |
8.58% |
(.55)% |
34.29% |
89.82% |
(51.66)% |
|
Ratios to Average Net Assets D, H |
|
|
|
|
|
|
Expenses before reductions |
1.89% |
1.89% |
1.93% |
2.01% |
1.95% |
|
Expenses net of fee waivers, if any |
1.89% |
1.89% |
1.93% |
2.01% |
1.95% |
|
Expenses net of all reductions |
1.88% |
1.89% |
1.92% |
2.00% |
1.95% |
|
Net investment income (loss) |
.26% |
(.15)% |
1.04% F |
(.13)% G |
(.27)% |
|
Supplemental Data |
|
|
|
|
|
|
Net assets, end of period (000 omitted) |
$ 75,007 |
$ 58,296 |
$ 46,525 |
$ 20,469 |
$ 5,509 |
|
Portfolio turnover rate E |
61% |
94% |
87% |
104% I |
117% |
|
A Total returns would have been lower if certain expenses had not been reduced during the applicable periods shown. B Total returns do not include the effect of the contingent deferred sales charge. C Calculated based on average shares outstanding during the period. D Fees and expenses of any underlying Fidelity Central Funds are not included in the Fund's expense ratio. The Fund indirectly bears its proportionate share of the expenses of any underlying Fidelity Central Funds. E Amount does not include the portfolio activity of any underlying Fidelity Central Funds. F Investment income per share reflects a large, non-recurring dividend which amounted to $.83 per share. Excluding this non-recurring dividend, the ratio of net investment income (loss) to average net assets would have been (.35)%. G Investment income per share reflects a large, non-recurring dividend which amounted to $.10 per share. Excluding this non-recurring dividend, the ratio of net investment income (loss) to average net assets would have been (.35)%. H Expense ratios reflect operating expenses of the class. Expenses before reductions do not reflect amounts reimbursed by the investment adviser or reductions from brokerage service arrangements or reductions from other expense offset arrangements and do not represent the amount paid by the class during periods when reimbursements or reductions occur. Expenses net of fee waivers reflect expenses after reimbursement by the investment adviser but prior to reductions from brokerage service arrangements or other expense offset arrangements. Expenses net of all reductions represent the net expenses paid by the class. I The portfolio turnover rate does not include the assets acquired in the merger. J For the year ended February 29. K Amount represents less than $.01 per share. |
See accompanying notes which are an integral part of the financial statements.
Annual Report
Financial Highlights - Materials
|
Years ended February 28, |
2013 |
2012 I |
2011 |
2010 |
2009 |
|
Selected Per-Share Data |
|
|
|
|
|
|
Net asset value, beginning of period |
$ 69.41 |
$ 70.11 |
$ 52.61 |
$ 27.66 |
$ 57.01 |
|
Income from Investment Operations |
|
|
|
|
|
|
Net investment income (loss) B |
.90 |
.60 |
1.25 E |
.43 F |
.38 |
|
Net realized and unrealized gain (loss) |
5.71 |
(.37) |
17.43 |
24.91 |
(29.54) |
|
Total from investment operations |
6.61 |
.23 |
18.68 |
25.34 |
(29.16) |
|
Distributions from net investment income |
(.79) |
(.55) |
(1.16) |
(.40) |
(.20) |
|
Distributions from net realized gain |
(1.55) |
(.38) |
(.03) |
- |
- |
|
Total distributions |
(2.34) |
(.93) |
(1.19) |
(.40) |
(.20) |
|
Redemption fees added to paid in capital B |
- J |
- J |
.01 |
.01 |
.01 |
|
Net asset value, end of period |
$ 73.68 |
$ 69.41 |
$ 70.11 |
$ 52.61 |
$ 27.66 |
|
Total Return A |
9.71% |
.49% |
35.70% |
91.77% |
(51.15)% |
|
Ratios to Average Net Assets C, G |
|
|
|
|
|
|
Expenses before reductions |
.85% |
.85% |
.88% |
.96% |
.90% |
|
Expenses net of fee waivers, if any |
.85% |
.85% |
.88% |
.96% |
.90% |
|
Expenses net of all reductions |
.84% |
.84% |
.87% |
.94% |
.90% |
|
Net investment income (loss) |
1.30% |
.90% |
2.10% E |
.92% F |
.78% |
|
Supplemental Data |
|
|
|
|
|
|
Net assets, end of period (000 omitted) |
$ 1,146,782 |
$ 1,089,619 |
$ 1,195,371 |
$ 604,475 |
$ 127,551 |
|
Portfolio turnover rate D |
61% |
94% |
87% |
104% H |
117% |
|
A Total returns would have been lower if certain expenses had not been reduced during the applicable periods shown. B Calculated based on average shares outstanding during the period. C Fees and expenses of any underlying Fidelity Central Funds are not included in the Fund's expense ratio. The Fund indirectly bears its proportionate share of the expenses of any underlying Fidelity Central Funds. D Amount does not include the portfolio activity of any underlying Fidelity Central Funds. E Investment income per share reflects a large, non-recurring dividend which amounted to $.83 per share. Excluding this non-recurring dividend, the ratio of net investment income (loss) to average net assets would have been ..70%. F Investment income per share reflects a large, non-recurring dividend which amounted to $.10 per share. Excluding this non-recurring dividend, the ratio of net investment income (loss) to average net assets would have been .70%. G Expense ratios reflect operating expenses of the class. Expenses before reductions do not reflect amounts reimbursed by the investment adviser or reductions from brokerage service arrangements or reductions from other expense offset arrangements and do not represent the amount paid by the class during periods when reimbursements or reductions occur. Expenses net of fee waivers reflect expenses after reimbursement by the investment adviser but prior to reductions from brokerage service arrangements or other expense offset arrangements. Expenses net of all reductions represent the net expenses paid by the class. H The portfolio turnover rate does not include the assets acquired in the merger. I For the year ended February 29. J Amount represents less than $.01 per share. |
Financial Highlights - Institutional Class
|
Years ended February 28, |
2013 |
2012 I |
2011 |
2010 |
2009 |
|
Selected Per-Share Data |
|
|
|
|
|
|
Net asset value, beginning of period |
$ 69.35 |
$ 70.05 |
$ 52.58 |
$ 27.66 |
$ 57.00 |
|
Income from Investment Operations |
|
|
|
|
|
|
Net investment income (loss) B |
.90 |
.60 |
1.28 E |
.46 F |
.38 |
|
Net realized and unrealized gain (loss) |
5.70 |
(.36) |
17.40 |
24.89 |
(29.53) |
|
Total from investment operations |
6.60 |
.24 |
18.68 |
25.35 |
(29.15) |
|
Distributions from net investment income |
(.83) |
(.56) |
(1.19) |
(.44) |
(.20) |
|
Distributions from net realized gain |
(1.55) |
(.38) |
(.03) |
- |
- |
|
Total distributions |
(2.38) |
(.94) |
(1.22) |
(.44) |
(.20) |
|
Redemption fees added to paid in capital B |
- J |
- J |
.01 |
.01 |
.01 |
|
Net asset value, end of period |
$ 73.57 |
$ 69.35 |
$ 70.05 |
$ 52.58 |
$ 27.66 |
|
Total Return A |
9.71% |
.50% |
35.73% |
91.79% |
(51.15)% |
|
Ratios to Average Net Assets C, G |
|
|
|
|
|
|
Expenses before reductions |
.85% |
.84% |
.86% |
.94% |
.90% |
|
Expenses net of fee waivers, if any |
.85% |
.84% |
.86% |
.94% |
.90% |
|
Expenses net of all reductions |
.84% |
.83% |
.85% |
.93% |
.90% |
|
Net investment income (loss) |
1.30% |
.91% |
2.11% E |
.94% F |
.78% |
|
Supplemental Data |
|
|
|
|
|
|
Net assets, end of period (000 omitted) |
$ 246,696 |
$ 89,299 |
$ 85,130 |
$ 13,670 |
$ 719 |
|
Portfolio turnover rate D |
61% |
94% |
87% |
104% H |
117% |
|
A Total returns would have been lower if certain expenses had not been reduced during the applicable periods shown. B Calculated based on average shares outstanding during the period. C Fees and expenses of any underlying Fidelity Central Funds are not included in the Fund's expense ratio. The Fund indirectly bears its proportionate share of the expenses of any underlying Fidelity Central Funds. D Amount does not include the portfolio activity of any underlying Fidelity Central Funds. E Investment income per share reflects a large, non-recurring dividend which amounted to $.83 per share. Excluding this non-recurring dividend, the ratio of net investment income (loss) to average net assets would have been ..72%. F Investment income per share reflects a large, non-recurring dividend which amounted to $.10 per share. Excluding this non-recurring dividend, the ratio of net investment income (loss) to average net assets would have been .72%. G Expense ratios reflect operating expenses of the class. Expenses before reductions do not reflect amounts reimbursed by the investment adviser or reductions from brokerage service arrangements or reductions from other expense offset arrangements and do not represent the amount paid by the class during periods when reimbursements or reductions occur. Expenses net of fee waivers reflect expenses after reimbursement by the investment adviser but prior to reductions from brokerage service arrangements or other expense offset arrangements. Expenses net of all reductions represent the net expenses paid by the class. H The portfolio turnover rate does not include the assets acquired in the merger. I For the year ended February 29. J Amount represents less than $.01 per share. |
See accompanying notes which are an integral part of the financial statements.
Annual Report
Notes to Financial Statements
For the period ended February 28, 2013
1. Organization.
Materials Portfolio (the Fund) is a non-diversified fund of Fidelity Select Portfolios (the Trust) and is authorized to issue an unlimited number of shares. The Trust is registered under the Investment Company Act of 1940, as amended (the 1940 Act), as an open-end management investment company organized as a Massachusetts business trust. The Fund invests primarily in securities of companies whose principal business activities fall within specific industries. The Fund offers Class A, Class T, Class C, Materials, and Institutional Class shares, each of which, along with Class B shares, has equal rights as to assets and voting privileges. Class B shares are closed to new accounts and additional purchases, except for exchanges and reinvestments. Each class has exclusive voting rights with respect to matters that affect that class. Class B shares will automatically convert to Class A shares after a holding period of seven years from the initial date of purchase. Investment income, realized and unrealized capital gains and losses, the common expenses of the Fund, and certain fund-level expense reductions, if any, are allocated on a pro-rata basis to each class based on the relative net assets of each class to the total net assets of the Fund. Each class differs with respect to transfer agent and distribution and service plan fees incurred. Certain expense reductions may also differ by class.
2. Investments in Fidelity Central Funds.
The Fund invests in Fidelity Central Funds, which are open-end investment companies available only to other investment companies and accounts managed by Fidelity Management & Research Company (FMR) and its affiliates. The Fund's Schedule of Investments lists each of the Fidelity Central Funds held as of period end, if any, as an investment of the Fund, but does not include the underlying holdings of each Fidelity Central Fund. As an Investing Fund, the Fund indirectly bears its proportionate share of the expenses of the underlying Fidelity Central Funds.
The Money Market Central Funds seek preservation of capital and current income and are managed by Fidelity Investments Money Management, Inc. (FIMM), an affiliate of FMR.
A complete unaudited list of holdings for each Fidelity Central Fund is available upon request or at the Securities and Exchange Commission (the SEC) website at www.sec.gov. In addition, the financial statements of the Fidelity Central Funds, which are not covered by the Fund's Report of Independent Registered Public Accounting Firm, are available on the SEC website or upon request.
3. Significant Accounting Policies.
The financial statements have been prepared in conformity with accounting principles generally accepted in the United States of America (GAAP), which require management to make certain estimates and assumptions at the date of the financial statements. Actual results could differ from those estimates. Subsequent events, if any, through the date that the financial statements were issued have been evaluated in the preparation of the financial statements. The following summarizes the significant accounting policies of the Fund:
Investment Valuation. Investments are valued as of 4:00 p.m. Eastern time on the last calendar day of the period. In accordance with valuation policies and procedures approved by the Board of Trustees (the Board), the Fund attempts to obtain prices from one or more third party pricing vendors or brokers to value its investments. When current market prices, quotations or currency exchange rates are not readily available or reliable, investments will be fair valued in good faith by the FMR Fair Value Committee (the Committee), in accordance with procedures adopted by the Fund's Board. Factors used in determining fair value vary by investment type and may include market or investment specific events, changes in interest rates and credit quality. The frequency with which these procedures are used cannot be predicted and they may be utilized to a significant extent. The Committee oversees the Fund's valuation policies and procedures and is responsible for approving and reporting to the Board all fair value determinations.
The Fund categorizes the inputs to valuation techniques used to value its investments into a disclosure hierarchy consisting of three levels as shown below:
Level 1 - quoted prices in active markets for identical investments
Level 2 - other significant observable inputs (including quoted prices for similar investments, interest rates, prepayment speeds, etc.)
Level 3 - unobservable inputs (including the Fund's own assumptions based on the best information available)
Valuation techniques used to value the Fund's investments by major category are as follows:
Equity securities, including restricted securities, for which market quotations are readily available, are valued at the last reported sale price or official closing price as reported by a third party pricing vendor on the primary market or exchange on which they are traded and are categorized as Level 1 in the hierarchy. In the event there were no sales during the day or closing prices are not available, securities are valued at the last quoted bid price or may be valued using the last available price and are generally categorized as Level 2 in the hierarchy. For foreign equity securities, when significant market or security specific events arise, comparisons to the valuation of American Depositary Receipts (ADRs), futures contracts, Exchange-Traded
Annual Report
3. Significant Accounting Policies - continued
Investment Valuation - continued
Funds (ETFs) and certain indexes as well as quoted prices for similar securities are used and are categorized as Level 2 in the hierarchy. Utilizing these techniques may result in transfers between Level 1 and Level 2.
Debt securities, including restricted securities, are valued based on evaluated prices received from third party pricing vendors or from brokers who make markets in such securities. For corporate bonds and U.S. government and government agency obligations, pricing vendors utilize matrix pricing which considers yield or price of bonds of comparable quality, coupon, maturity and type as well as broker-supplied prices. When independent prices are unavailable or unreliable, debt securities may be valued utilizing pricing methodologies which consider similar factors that would be used by third party pricing vendors. Debt securities are generally categorized as Level 2 in the hierarchy but may be Level 3 depending on the circumstances.
Futures contracts are valued at the settlement price established each day by the board of trade or exchange on which they are traded and are categorized as Level 1 in the hierarchy. Investments in open-end mutual funds, including the Fidelity Central Funds, are valued at their closing net asset value (NAV) each business day and are categorized as Level 1 in the hierarchy.
Changes in valuation techniques may result in transfers in or out of an assigned level within the disclosure hierarchy. The aggregate value of investments by input level, as of February 28, 2013, is included at the end of the Fund's Schedule of Investments.
Foreign Currency. The Fund may use foreign currency contracts to facilitate transactions in foreign-denominated securities. Gains and losses from these transactions may arise from changes in the value of the foreign currency or if the counterparties do not perform under the contracts' terms.
Foreign-denominated assets, including investment securities, and liabilities are translated into U.S. dollars at the exchange rates at period end. Purchases and sales of investment securities, income and dividends received and expenses denominated in foreign currencies are translated into U.S. dollars at the exchange rate in effect on the transaction date.
The effects of exchange rate fluctuations on investments are included with the net realized and unrealized gain (loss) on investment securities. Other foreign currency transactions resulting in realized and unrealized gain (loss) are disclosed separately.
Investment Transactions and Income. For financial reporting purposes, the Fund's investment holdings and NAV include trades executed through the end of the last business day of the period. The NAV per share for processing shareholder transactions is calculated as of the close of business of the New York Stock Exchange (NYSE), normally 4:00 p.m. Eastern time and includes trades executed through the end of the prior business day. Gains and losses on securities sold are determined on the basis of identified cost and may include proceeds received from litigation. Dividend income is recorded on the ex-dividend date, except for certain dividends from foreign securities where the ex-dividend date may have passed, which are recorded as soon as the Fund is informed of the ex-dividend date. Non-cash dividends included in dividend income, if any, are recorded at the fair market value of the securities received. Distributions received on securities that represent a return of capital or capital gain are recorded as a reduction of cost of investments and/or as a realized gain. The Fund estimates the components of distributions received that may be considered return of capital distributions or capital gain distributions. Interest income and distributions from the Fidelity Central Funds are accrued as earned. Interest income includes coupon interest and amortization of premium and accretion of discount on debt securities. Investment income is recorded net of foreign taxes withheld where recovery of such taxes is uncertain.
Expenses. Expenses directly attributable to a fund are charged to that fund. Expenses attributable to more than one fund are allocated among the respective funds on the basis of relative net assets or other appropriate methods. Expense estimates are accrued in the period to which they relate and adjustments are made when actual amounts are known.
Income Tax Information and Distributions to Shareholders. Each year, the Fund intends to qualify as a regulated investment company under Subchapter M of the Internal Revenue Code, including distributing substantially all of its taxable income and realized gains. As a result, no provision for income taxes is required. As of February 28, 2013, the Fund did not have any unrecognized tax benefits in the financial statements; nor is the Fund aware of any tax positions for which it is reasonably possible that the total amounts of unrecognized tax benefits will significantly change in the next twelve months. The Fund files a U.S. federal tax return, in addition to state and local tax returns as required. A fund's federal income tax returns are subject to examination by the Internal Revenue Service (IRS) for a period of three fiscal years after they are filed. State and local tax returns may be subject to examination for an additional fiscal year depending on the jurisdiction. Foreign taxes are provided for based on the Fund's understanding of the tax rules and rates that exist in the foreign markets in which it invests.
Distributions are declared and recorded on the ex-dividend date. Income dividends and capital gain distributions are declared separately for each class. Income and capital gain distributions are determined in accordance with income tax regulations, which may differ from GAAP. In addition, the Fund claimed a portion of the payment made to redeeming shareholders as a distribution for income tax purposes.
Capital accounts within the financial statements are adjusted for permanent book-tax differences. These adjustments have no impact on net assets or the results of operations. Temporary book-tax differences will reverse in a subsequent period.
Annual Report
Notes to Financial Statements - continued
3. Significant Accounting Policies - continued
Income Tax Information and Distributions to Shareholders - continued
Book-tax differences are primarily due to futures contracts, foreign currency transactions, partnerships, passive foreign investment companies (PFIC), deferred trustees compensation, capital loss carryforwards, and losses deferred due to wash sales and excise tax regulations.
The federal tax cost of investment securities and unrealized appreciation (depreciation) as of period end were as follows:
|
Gross unrealized appreciation |
$ 369,676,346 |
|
Gross unrealized depreciation |
(47,344,015) |
|
Net unrealized appreciation (depreciation) on securities and other investments |
$ 322,332,331 |
|
|
|
|
Tax Cost |
$ 1,520,121,370 |
The tax-based components of distributable earnings as of period end were as follows:
|
Undistributed ordinary income |
$ 1,139,008 |
|
Undistributed long-term capital gain |
$ 374,657 |
|
Net unrealized appreciation (depreciation) |
$ 322,329,348 |
The tax character of distributions paid was as follows:
|
|
February 28, 2013 |
February 29, 2012 |
|
Ordinary Income |
$ 15,064,080 |
$ 9,840,737 |
|
Long-term Capital Gains |
31,892,999 |
7,461,289 |
|
Total |
$ 46,957,079 |
$ 17,302,026 |
Capital loss carryforwards are only available to offset future capital gains of the Fund to the extent provided by regulations and may be limited. Under the Regulated Investment Company Modernization Act of 2010 (the Act), the Fund is permitted to carry forward capital losses incurred in taxable years beginning after December 22, 2010 for an unlimited period and such capital losses are required to be used prior to any losses that expire. At February 28, 2013 capital loss carryforwards were as follows:
|
Fiscal year of expiration: |
|
|
2017 |
$ (2,033,557) |
|
2018 |
(1,022,988) |
|
2019 |
(80,787) |
|
Total with expiration |
$ (3,137,332) |
The Fund acquired $3,137,332 of its capital loss carryforward as part of a merger in a prior period. The losses acquired that will be available to offset future capital gains of the Fund will be limited to approximately $611,309 per year.
Trading (Redemption) Fees. Shares held by investors in the Fund less than 30 days are subject to a redemption fee equal to .75% of the net asset value of shares redeemed. All redemption fees, which reduce the proceeds of the shareholder redemption, are retained by the Fund and accounted for as an addition to paid in capital.
Restricted Securities. The Fund may invest in securities that are subject to legal or contractual restrictions on resale. These securities generally may be resold in transactions exempt from registration or to the public if the securities are registered. Disposal of these securities may involve time-consuming negotiations and expense, and prompt sale at an acceptable price may be difficult. Information regarding restricted securities is included at the end of the Fund's Schedule of Investments.
New Accounting Pronouncement. The Financial Accounting Standards Board issued in December 2011, Accounting Standard Update No. 2011-11, Disclosures about Offsetting Assets and Liabilities, and in January 2013, Accounting Standards Update No. 2013-1 Clarifying the Scope of Disclosures about Offsetting Assets and Liabilities. These updates create new disclosure requirements requiring entities to disclose both gross and net information for derivatives and other financial instruments that are either offset in the Statement of Assets and Liabilities or subject to an enforceable master netting arrangement or similar agreement. The disclosure requirements are effective for annual reporting periods beginning on or after January 1, 2013, and interim periods within those annual periods. Management is currently evaluating the impact of the update's adoption on the Fund's financial statement disclosures.
Annual Report
4. Derivative Instruments.
Risk Exposures and the Use of Derivative Instruments. The Fund's investment objective allows the Fund to enter into various types of derivative contracts, including futures contracts. Derivatives are investments whose value is primarily derived from underlying assets, indices or reference rates and may be transacted on an exchange or over-the-counter (OTC). Derivatives may involve a future commitment to buy or sell a specified asset based on specified terms, to exchange future cash flows at periodic intervals based on a notional principal amount, or for one party to make one or more payments upon the occurrence of specified events in exchange for periodic payments from the other party.
The Fund used derivatives to increase returns and to manage exposure to certain risks as defined below. The success of any strategy involving derivatives depends on analysis of numerous economic factors, and if the strategies for investment do not work as intended, the Fund may not achieve its objectives.
The Fund's use of derivatives increased or decreased its exposure to the following risk:
|
Equity Risk |
Equity risk relates to the fluctuations in the value of financial instruments as a result of changes in market prices (other than those arising from interest rate risk or foreign exchange risk), whether caused by factors specific to an individual investment, its issuer, or all factors affecting all instruments traded in a market or market segment. |
The Fund is also exposed to additional risks from investing in derivatives, such as liquidity risk and counterparty credit risk. Liquidity risk is the risk that the Fund will be unable to close out the derivative in the open market in a timely manner. Counterparty credit risk is the risk that the counterparty will not be able to fulfill its obligation to the Fund. Counterparty credit risk related to exchange-traded futures contracts is mitigated by the protection provided by the exchange on which they trade.
Investing in derivatives may involve greater risks than investing in the underlying assets directly and, to varying degrees, may involve risk of loss in excess of any initial investment and collateral received and amounts recognized in the Statement of Assets and Liabilities. In addition, there may be the risk that the change in value of the derivative contract does not correspond to the change in value of the underlying instrument.
Futures Contracts. A futures contract is an agreement between two parties to buy or sell a specified underlying instrument for a fixed price at a specified future date. The Fund used futures contracts to manage its exposure to the stock market.
Upon entering into a futures contract, a fund is required to deposit either cash or securities (initial margin) with a clearing broker in an amount equal to a certain percentage of the face value of the contract. Futures contracts are marked-to-market daily and subsequent payments (variation margin) are made or received by a fund depending on the daily fluctuations in the value of the futures contracts and are recorded as unrealized appreciation or (depreciation). This receivable and/or payable, if any, is included in daily variation margin on futures contracts in the Statement of Assets and Liabilities. Realized gain or (loss) is recorded upon the expiration or closing of a futures contract.
Any open futures contracts at period end are presented in the Schedule of Investments under the caption "Futures Contracts." The underlying face amount at value reflects each contract's exposure to the underlying instrument or index at period end and is representative of activity for the period. Securities deposited to meet initial margin requirements are identified in the Schedule of Investments.
During the period the Fund recognized net realized gain (loss) of $1,204,377 and a change in net unrealized appreciation (depreciation) of $(743,685) related to its investment in futures contracts. These amounts are included in the Statement of Operations.
5. Purchases and Sales of Investments.
Purchases and sales of securities, other than short-term securities, aggregated $1,052,076,740 and $837,936,289, respectively.
6. Fees and Other Transactions with Affiliates.
Management Fee. FMR and its affiliates provide the Fund with investment management related services for which the Fund pays a monthly management fee. The management fee is the sum of an individual fund fee rate that is based on an annual rate of .30% of the Fund's average net assets and an annualized group fee rate that averaged .26% during the period. The group fee rate is based upon the average net assets of all the mutual funds advised by FMR. The group fee rate decreases as assets under management increase and increases as assets under management decrease. For the period, the total annual management fee rate was .56% of the Fund's average net assets.
Annual Report
Notes to Financial Statements - continued
6. Fees and Other Transactions with Affiliates - continued
Distribution and Service Plan Fees. In accordance with Rule 12b-1 of the 1940 Act, the Fund has adopted separate Distribution and Service Plans for each class of shares. Certain classes pay Fidelity Distributors Corporation (FDC), an affiliate of FMR, separate Distribution and Service Fees, each of which is based on an annual percentage of each class' average net assets. In addition, FDC may pay financial intermediaries for selling shares of the Fund and providing shareholder support services. For the period, the Distribution and Service Fee rates, total fees and amounts retained by FDC were as follows:
|
|
Distribution |
Service |
Total Fees |
Retained |
|
Class A |
-% |
.25% |
$ 427,638 |
$ 10,034 |
|
Class T |
.25% |
.25% |
153,568 |
902 |
|
Class B |
.75% |
.25% |
102,442 |
76,934 |
|
Class C |
.75% |
.25% |
607,890 |
167,651 |
|
|
|
|
$ 1,291,538 |
$ 255,521 |
Sales Load. FDC may receive a front-end sales charge of up to 5.75% for selling Class A shares and 3.50% for selling Class T shares, some of which is paid to financial intermediaries for selling shares of the Fund. Depending on the holding period, FDC may receive contingent deferred sales charges levied on Class A, Class T, Class B and Class C redemptions. The deferred sales charges range from 5.00% to 1.00% for Class B shares, 1.00% for Class C shares, 1.00% for certain purchases of Class A shares and .25% for certain purchases of Class T shares.
For the period, sales charge amounts retained by FDC were as follows:
|
|
Retained |
|
Class A |
$ 151,786 |
|
Class T |
13,666 |
|
Class B* |
18,449 |
|
Class C* |
13,222 |
|
|
$ 197,123 |
* When Class B and Class C shares are initially sold, FDC pays commissions from its own resources to financial intermediaries through which the sales are made.
Transfer Agent Fees. Fidelity Investments Institutional Operations Company, Inc., (FIIOC), an affiliate of FMR, is the transfer, dividend disbursing and shareholder servicing agent for each class of the Fund. FIIOC receives account fees and asset-based fees that vary according to the account size and type of account of the shareholders of the respective classes of the Fund. FIIOC pays for typesetting, printing and mailing of shareholder reports, except proxy statements. For the period, transfer agent fees for each class were as follows:
|
|
Amount |
% of |
|
Class A |
$ 461,680 |
.27 |
|
Class T |
94,591 |
.31 |
|
Class B |
30,998 |
.30 |
|
Class C |
165,490 |
.27 |
|
Materials |
2,436,019 |
.24 |
|
Institutional Class |
287,760 |
.24 |
|
|
$ 3,476,538 |
|
Accounting and Security Lending Fees. Fidelity Service Company, Inc. (FSC), an affiliate of FMR, maintains the Fund's accounting records. The accounting fee is based on the level of average net assets for each month. Under a separate contract, FSC administers the security lending program. The security lending fee is based on the number and duration of lending transactions.
Brokerage Commissions. The Fund placed a portion of its portfolio transactions with brokerage firms which are affiliates of the investment adviser. The commissions paid to these affiliated firms were $14,947 for the period.
7. Committed Line of Credit.
The Fund participates with other funds managed by FMR or an affiliate in a $4.25 billion credit facility (the "line of credit") to be utilized for temporary or emergency purposes to fund shareholder redemptions or for other short-term liquidity purposes. The Fund has agreed to pay commitment fees on its pro-rata portion of the line of credit, which amounted to $3,636 and is reflected in Miscellaneous expenses on the Statement of Operations. During the period, there were no borrowings on this line of credit.
Annual Report
8. Security Lending.
The Fund lends portfolio securities through a lending agent from time to time in order to earn additional income. For equity securities, a lending agent is used and may loan securities to certain qualified borrowers, including Fidelity Capital Markets (FCM), a broker-dealer affiliated with the Fund. On the settlement date of the loan, the Fund receives collateral (in the form of U.S. Treasury obligations, letters of credit and/or cash) against the loaned securities and maintains collateral in an amount not less than 100% of the market value of the loaned securities during the period of the loan. The market value of the loaned securities is determined at the close of business of the Fund and any additional required collateral is delivered to the Fund on the next business day. If the borrower defaults on its obligation to return the securities loaned because of insolvency or other reasons, a fund could experience delays and costs in recovering the securities loaned or in gaining access to the collateral. Any cash collateral received is invested in the Fidelity Securities Lending Cash Central Fund. The value of loaned securities and cash collateral at period end are disclosed on the Fund's Statement of Assets and Liabilities. Security lending income represents the income earned on investing cash collateral, less rebates paid to borrowers and any lending agent fees associated with the loan, plus any premium payments received for lending certain types of securities. Security lending income is presented in the Statement of Operations as a component of income from Fidelity Central Funds. Total security lending income during the period amounted to $520,779. During the period, there were no securities loaned to FCM.
9. Expense Reductions.
Many of the brokers with whom FMR places trades on behalf of the Fund provided services to the Fund in addition to trade execution. These services included payments of certain expenses on behalf of the Fund totaling $134,582 for the period. In addition, through arrangements with the Fund's custodian, credits realized as a result of uninvested cash balances were used to reduce the Fund's expenses. During the period, these credits reduced the Fund's custody expenses by $110.
In addition, FMR reimbursed a portion of the Fund's operating expenses during the period in the amount of $2,610.
10. Distributions to Shareholders.
Distributions to shareholders of each class were as follows:
|
|
Year Ended |
Year Ended |
|
From net investment income |
|
|
|
Class A |
$ 1,631,593 |
$ 868,107 |
|
Class T |
221,281 |
100,314 |
|
Class B |
14,451 |
- |
|
Class C |
183,511 |
- |
|
Materials |
11,420,509 |
8,266,851 |
|
Institutional Class |
1,592,735 |
605,465 |
|
Total |
$ 15,064,080 |
$ 9,840,737 |
|
From net realized gain |
|
|
|
Class A |
$ 3,967,803 |
$ 816,536 |
|
Class T |
717,303 |
151,869 |
|
Class B |
228,009 |
66,321 |
|
Class C |
1,411,838 |
312,224 |
|
Materials |
22,783,457 |
5,701,275 |
|
Institutional Class |
2,784,589 |
413,064 |
|
Total |
$ 31,892,999 |
$ 7,461,289 |
11. Share Transactions.
Transactions for each class of shares were as follows:
|
|
Shares |
Dollars |
||
|
|
Year Ended |
Year Ended |
Year Ended |
Year Ended |
|
Class A |
|
|
|
|
|
Shares sold |
1,611,922 |
1,406,389 |
$ 112,576,195 |
$ 95,285,956 |
|
Reinvestment of distributions |
68,775 |
23,605 |
4,804,595 |
1,462,799 |
|
Shares redeemed |
(969,159) |
(925,476) |
(66,285,158) |
(60,145,567) |
|
Net increase (decrease) |
711,538 |
504,518 |
$ 51,095,632 |
$ 36,603,188 |
Annual Report
Notes to Financial Statements - continued
11. Share Transactions - continued
|
|
Shares |
Dollars |
||
|
|
Year Ended |
Year Ended |
Year Ended |
Year Ended |
|
Class T |
|
|
|
|
|
Shares sold |
205,283 |
150,265 |
$ 14,234,477 |
$ 10,197,019 |
|
Reinvestment of distributions |
12,892 |
3,964 |
896,667 |
244,682 |
|
Shares redeemed |
(110,407) |
(110,682) |
(7,498,384) |
(7,174,563) |
|
Net increase (decrease) |
107,768 |
43,547 |
$ 7,632,760 |
$ 3,267,138 |
|
Class B |
|
|
|
|
|
Shares sold |
21,997 |
35,651 |
$ 1,493,049 |
$ 2,318,398 |
|
Reinvestment of distributions |
3,022 |
909 |
207,121 |
55,554 |
|
Shares redeemed |
(45,545) |
(70,403) |
(3,081,508) |
(4,524,937) |
|
Net increase (decrease) |
(20,526) |
(33,843) |
$ (1,381,338) |
$ (2,150,985) |
|
Class C |
|
|
|
|
|
Shares sold |
423,105 |
456,374 |
$ 29,248,360 |
$ 30,369,453 |
|
Reinvestment of distributions |
19,249 |
4,184 |
1,317,196 |
254,995 |
|
Shares redeemed |
(257,585) |
(279,339) |
(17,263,032) |
(17,740,501) |
|
Net increase (decrease) |
184,769 |
181,219 |
$ 13,302,524 |
$ 12,883,947 |
|
Materials |
|
|
|
|
|
Shares sold |
5,306,846 |
6,950,456 |
$ 372,534,797 |
$ 471,314,225 |
|
Reinvestment of distributions |
464,930 |
214,200 |
32,543,457 |
13,299,700 |
|
Shares redeemed |
(5,905,812) |
(8,516,169) |
(406,043,890) |
(562,008,908) |
|
Net increase (decrease) |
(134,036) |
(1,351,513) |
$ (965,636) |
$ (77,394,983) |
|
Institutional Class |
|
|
|
|
|
Shares sold |
2,986,457 |
1,444,894 |
$ 212,651,449 |
$ 97,144,756 |
|
Reinvestment of distributions |
54,139 |
13,291 |
3,797,777 |
824,595 |
|
Shares redeemed |
(975,090) |
(1,385,770) |
(66,601,118) |
(90,119,446) |
|
Net increase (decrease) |
2,065,506 |
72,415 |
$ 149,848,108 |
$ 7,849,905 |
12. Other.
The Fund's organizational documents provide former and current trustees and officers with a limited indemnification against liabilities arising in connection with the performance of their duties to the Fund. In the normal course of business, the Fund may also enter into contracts that provide general indemnifications. The Fund's maximum exposure under these arrangements is unknown as this would be dependent on future claims that may be made against the Fund. The risk of material loss from such claims is considered remote.
Annual Report
Fidelity Advisor Telecommunications Fund - Institutional Class
Performance: The Bottom Line
Average annual total return reflects the change in the value of an investment, assuming reinvestment of the class' distributions from dividend income and capital gains (the profits earned upon the sale of securities that have grown in value, if any) and assuming a constant rate of performance each year. The $10,000 table and the fund's returns do not reflect the deduction of taxes that a shareholder would pay on fund distributions or the redemption of fund shares. During periods of reimbursement by Fidelity, a fund's total return will be greater than it would be had the reimbursement not occurred. How a fund did yesterday is no guarantee of how it will do tomorrow.
Average Annual Total Returns
|
Periods ended February 28, 2013 |
Past 1 |
Past 5 |
Past 10 |
|
Institutional Class A |
14.33% |
5.78% |
9.62% |
A The initial offering of Institutional Class shares took place on December 12, 2006. Returns prior to December 12, 2006, are those of Telecommunications Portfolio, the original class of the fund.
$10,000 Over 10 Years
Let's say hypothetically that $10,000 was invested in Fidelity Advisor Telecommunications Fund - Institutional Class on February 28, 2003. The chart shows how the value of your investment would have changed, and also shows how the S&P 500 Index performed over the same period. The initial offering of Institutional Class shares took place on December 12, 2006. See the Average Annual Total Returns table for additional information regarding the performance of Institutional Class.
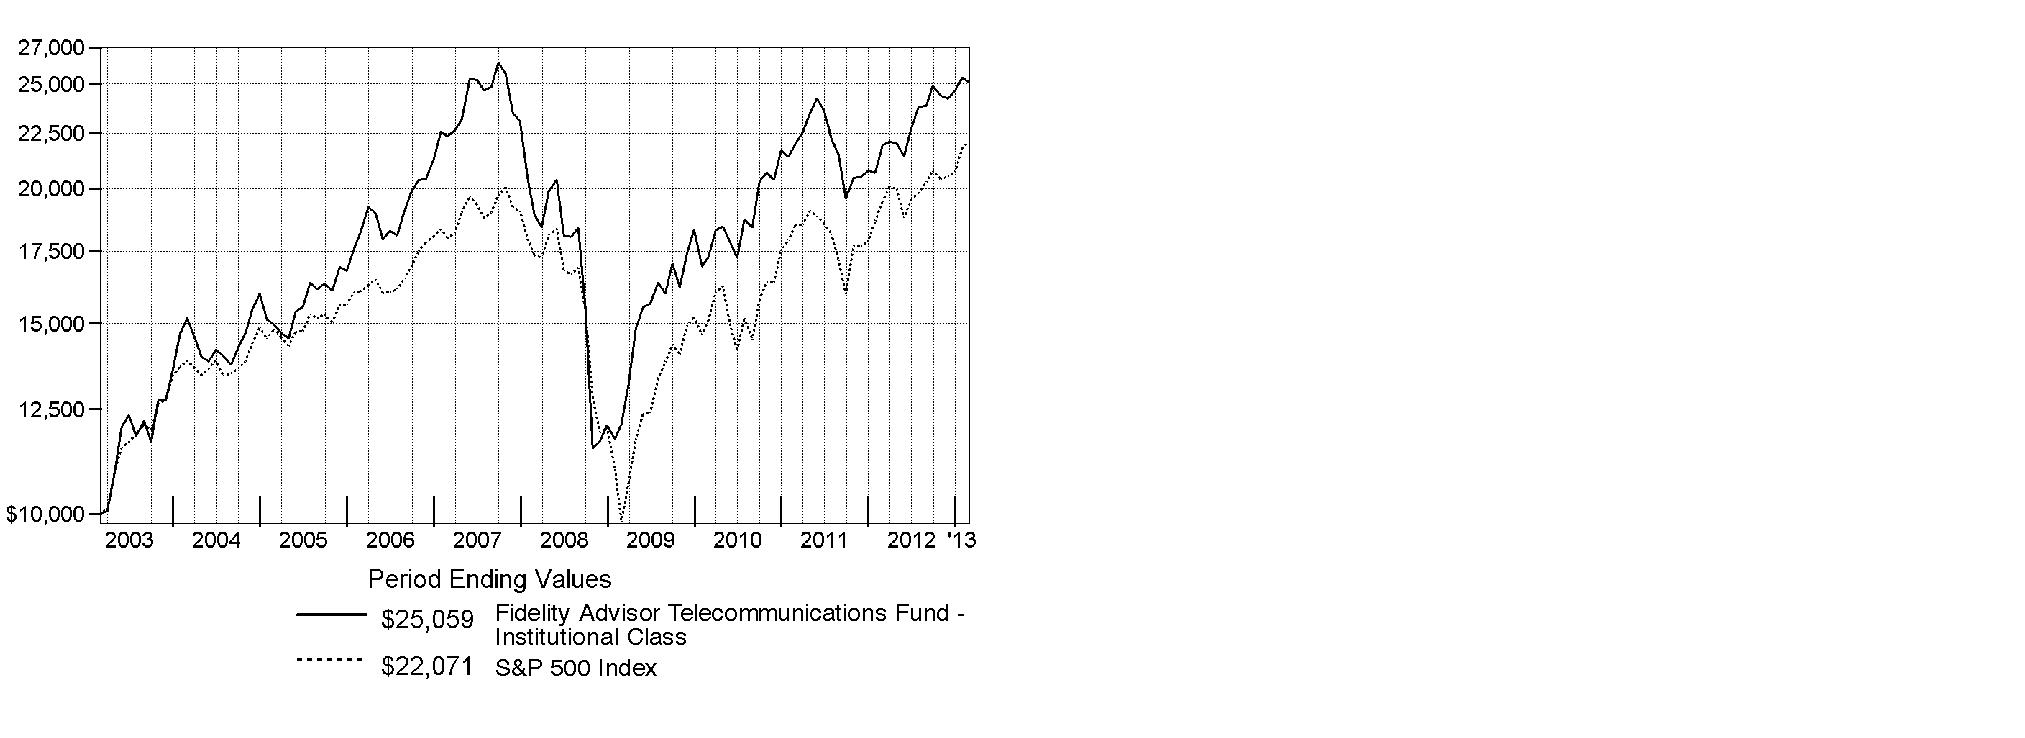
Annual Report
Fidelity Advisor Telecommunications Fund
Management's Discussion of Fund Performance
Market Recap: U.S. stocks posted solid gains for the year ending February 28, 2013, sparked by a late-period rally that pushed major equity benchmarks to multiyear highs. Improvement in the global economy and more monetary stimulus from the U.S. Federal Reserve kept markets on the upswing for much of the year, shrugging off an early decline brought on by debt woes in Europe, and another dip later in the period amid Congressional gridlock on the federal budget. Renewed optimism over employment, the housing market, corporate earnings and record dividends made stocks a favorite with investors during the 12 months, which helped push the broad-based S&P 500® Index across the milestone 1,500 mark at the end of January. The S&P 500® finished the period up 13.46%. Seven of the 10 major market sectors tracked by MSCI U.S. IMI 25-50 classifications produced double-digit gains, led by health care and financials, while information technology, energy and materials trailed the broad equity market with only modest advances.
Comments from Matthew Drukker, who became Portfolio Manager of Fidelity Advisor® Telecommunications Fund on January 22, 2013: For the year, the fund's Institutional Class shares advanced 14.33%, trailing the 15.35% result of the MSCI® U.S. IMI Telecommunications Services 25-50 Index, but outpacing the S&P 500®. The market experienced some turbulent swings this period, and investors generally favored large integrated telecom stocks because of their high dividend yields and more-defensive characteristics. Not surprisingly, a significant driver of the fund's and index's solid absolute returns was their heavy exposure - 55% and 63% average weightings, respectively - to the group. That said, the fund did give up some ground to the MSCI index during the period due to forced underweightings - stemming from diversification rules imposed under the Internal Revenue Code - in telecom giants Verizon Communications and AT&T, which together comprised about 45% of the sector benchmark. Verizon, the fund's biggest relative detractor, and AT&T performed quite well over the one-year stretch, each boasting a double-digit return. Alaskan telecom provider General Communications was another miss. The fund owned a larger-than-benchmark stake in the stock, as the prior manager believed this company would grow faster than many of its U.S. integrated telecom counterparts. Unfortunately, stocks of companies with exposure to Alaska were often influenced by temperamental oil prices. Overweighting integrated telecom CenturyLink weighed on performance, particularly when the stock plunged late in the period after the company reported weak fourth-quarter results, cut its quarterly dividend and issued mixed guidance. Elsewhere, wireless broadband mobile services provider MetroPCS Communications lagged the sector benchmark early on and the fund's slightly overweighted position at that time hurt performance. Conversely, the fund tended to steer clear of small-cap integrated telecom companies with subscale operations and declining revenues, which was the right call during the year, as largely avoiding benchmark components that fit these criteria - such as Elephant Talk Communications, Lumos Networks and Alaska Communications Systems Group, and underweighting Windstream - were among the fund's biggest contributors. Elephant Talk provides software and services to telecom companies across the globe. Its exposure to the hard-hit eurozone, along with disappointing financial results, caused shares to plummet. Avoiding Lumos Networks, a fiber-based network services provider operating in the Mid-Atlantic region, and underweighting integrated telecom firm Windstream was beneficial, as shares of both index components tumbled on poor financial results. Lastly, Alaska Communications was hurt by its exposure to this state, as the price of oil - the state's primary source of revenue - was volatile during the period.
The views expressed above reflect those of the portfolio manager(s) only through the end of the period as stated on the cover of this report and do not necessarily represent the views of Fidelity or any other person in the Fidelity organization. Any such views are subject to change at any time based upon market or other conditions and Fidelity disclaims any responsibility to update such views. These views may not be relied on as investment advice and, because investment decisions for a Fidelity fund are based on numerous factors, may not be relied on as an indication of trading intent on behalf of any Fidelity fund.
Annual Report
Telecommunications Portfolio
Shareholder Expense Example
As a shareholder of the Fund, you incur two types of costs: (1) transaction costs, including sales charges (loads) on purchase payments or redemption proceeds, redemption fees and (2) ongoing costs, including management fees, distribution and/or service (12b-1) fees and other Fund expenses. This Example is intended to help you understand your ongoing costs (in dollars) of investing in the Fund and to compare these costs with the ongoing costs of investing in other mutual funds.
The Example is based on an investment of $1,000 invested at the beginning of the period and held for the entire period (September 1, 2012 to February 28, 2013).
Actual Expenses
The first line of the accompanying table for each class of the Fund provides information about actual account values and actual expenses. You may use the information in this line, together with the amount you invested, to estimate the expenses that you paid over the period. Simply divide your account value by $1,000.00 (for example, an $8,600 account value divided by $1,000.00 = 8.6), then multiply the result by the number in the first line for a class of the Fund under the heading entitled "Expenses Paid During Period" to estimate the expenses you paid on your account during this period. A small balance maintenance fee of $12.00 that is charged once a year may apply for certain accounts with a value of less than $2,000. This fee is not included in the table below. If it was, the estimate of expenses you paid during the period would be higher, and your ending account value lower, by this amount. In addition, the Fund, as a shareholder in the underlying Fidelity Central Funds, will indirectly bear its pro-rata share of the fees and expenses incurred by the underlying Fidelity Central Funds. These fees and expenses are not included in the Fund's annualized expense ratio used to calculate the expense estimate in the table below.
Hypothetical Example for Comparison Purposes
The second line of the accompanying table for each class of the Fund provides information about hypothetical account values and hypothetical expenses based on a Class' actual expense ratio and an assumed rate of return of 5% per year before expenses, which is not the Class' actual return. The hypothetical account values and expenses may not be used to estimate the actual ending account balance or expenses you paid for the period. You may use this information to compare the ongoing costs of investing in the Fund and other funds. To do so, compare this 5% hypothetical example with the 5% hypothetical examples that appear in the shareholder reports of the other funds. A small balance maintenance fee of $12.00 that is charged once a year may apply for certain accounts with a value of less than $2,000. This fee is not included in the table below. If it was, the estimate of expenses you paid during the period would be higher, and your ending account value lower, by this amount. In addition, the Fund, as a shareholder in the underlying Fidelity Central Funds, will indirectly bear its pro-rata share of the fees and expenses incurred by the underlying Fidelity Central Funds. These fees and expenses are not included in the Fund's annualized expense ratio used to calculate the expense estimate in the table below.
Please note that the expenses shown in the table are meant to highlight your ongoing costs only and do not reflect any transaction costs. Therefore, the second line of the table is useful in comparing ongoing costs only, and will not help you determine the relative total costs of owning different funds. In addition, if these transactional costs were included, your costs would have been higher.
|
|
Annualized |
Beginning |
Ending |
Expenses Paid |
|
Class A |
1.18% |
|
|
|
|
Actual |
|
$ 1,000.00 |
$ 1,049.00 |
$ 5.99 |
|
HypotheticalA |
|
$ 1,000.00 |
$ 1,018.94 |
$ 5.91 |
|
Class T |
1.47% |
|
|
|
|
Actual |
|
$ 1,000.00 |
$ 1,047.60 |
$ 7.46 |
|
HypotheticalA |
|
$ 1,000.00 |
$ 1,017.50 |
$ 7.35 |
|
Class B |
1.93% |
|
|
|
|
Actual |
|
$ 1,000.00 |
$ 1,045.20 |
$ 9.79 |
|
HypotheticalA |
|
$ 1,000.00 |
$ 1,015.22 |
$ 9.64 |
|
Class C |
1.90% |
|
|
|
|
Actual |
|
$ 1,000.00 |
$ 1,045.20 |
$ 9.63 |
|
HypotheticalA |
|
$ 1,000.00 |
$ 1,015.37 |
$ 9.49 |
|
Telecommunications |
.86% |
|
|
|
|
Actual |
|
$ 1,000.00 |
$ 1,050.80 |
$ 4.37 |
|
HypotheticalA |
|
$ 1,000.00 |
$ 1,020.53 |
$ 4.31 |
|
Institutional Class |
.82% |
|
|
|
|
Actual |
|
$ 1,000.00 |
$ 1,051.00 |
$ 4.17 |
|
HypotheticalA |
|
$ 1,000.00 |
$ 1,020.73 |
$ 4.11 |
A 5% return per year before expenses
* Expenses are equal to each Class' annualized expense ratio, multiplied by the average account value over the period, multiplied by 181/365 (to reflect the one-half year period).
Annual Report
Telecommunications Portfolio
Investment Changes (Unaudited)
|
Top Ten Stocks as of February 28, 2013 |
||
|
|
% of fund's |
% of fund's net assets |
|
Verizon Communications, Inc. |
25.3 |
18.1 |
|
American Tower Corp. |
7.1 |
0.0 |
|
AT&T, Inc. |
6.6 |
21.5 |
|
SBA Communications Corp. Class A |
5.6 |
5.0 |
|
CenturyLink, Inc. |
5.6 |
9.6 |
|
Vodafone Group PLC sponsored ADR |
4.4 |
3.3 |
|
Sprint Nextel Corp. |
3.9 |
5.1 |
|
Telephone & Data Systems, Inc. |
2.9 |
2.9 |
|
Clearwire Corp. Class A |
2.6 |
1.7 |
|
General Communications, Inc. Class A |
2.5 |
2.6 |
|
|
66.5 |
|
|
Top Industries (% of fund's net assets) |
|||
|
As of February 28, 2013 |
|||
|
Diversified Telecommunication Services |
56.9% |
|
|
Wireless Telecommunication Services |
28.0% |
|
|
Real Estate Investment Trusts |
7.1% |
|
|
Media |
2.1% |
|
|
Electronic Equipment & Components |
1.5% |
|
|
All Others* |
4.4% |
|

|
As of August 31, 2012 |
|||
|
Diversified Telecommunication Services |
67.3% |
|
|
Wireless Telecommunication Services |
27.5% |
|
|
Media |
1.7% |
|
|
Software |
0.2% |
|
 |
Communications Equipment |
0.0% |
|
|
All Others* |
3.3% |
|

|
* Includes short-term investments and net other assets. |
Annual Report
Telecommunications Portfolio
Investments February 28, 2013
Showing Percentage of Net Assets
|
Common Stocks - 97.6% |
|||
|
Shares |
Value |
||
|
COMMUNICATIONS EQUIPMENT - 0.4% |
|||
|
Communications Equipment - 0.4% |
|||
|
Symmetricom, Inc. (a) |
338,300 |
$ 1,671,202 |
|
|
COMPUTERS & PERIPHERALS - 0.3% |
|||
|
Computer Hardware - 0.3% |
|||
|
Apple, Inc. |
2,241 |
989,177 |
|
|
DIVERSIFIED TELECOMMUNICATION SERVICES - 56.9% |
|||
|
Alternative Carriers - 9.8% |
|||
|
Cogent Communications Group, Inc. |
378,402 |
9,516,810 |
|
|
inContact, Inc. (a) |
262,200 |
1,780,338 |
|
|
Iridium Communications, Inc. (a) |
16,600 |
101,426 |
|
|
Level 3 Communications, Inc. (a) |
479,895 |
9,588,302 |
|
|
Lumos Networks Corp. |
301,762 |
3,446,122 |
|
|
tw telecom, inc. (a) |
343,657 |
8,701,395 |
|
|
Vonage Holdings Corp. (a) |
2,186,000 |
5,771,040 |
|
|
|
38,905,433 |
||
|
Integrated Telecommunication Services - 47.1% |
|||
|
AT&T, Inc. |
721,319 |
25,902,565 |
|
|
Atlantic Tele-Network, Inc. |
137,400 |
6,457,800 |
|
|
CenturyLink, Inc. |
642,484 |
22,274,920 |
|
|
Cincinnati Bell, Inc. (a) |
808,400 |
2,627,300 |
|
|
Consolidated Communications Holdings, Inc. |
53,298 |
895,406 |
|
|
Elephant Talk Communication, Inc. (a)(d) |
326,540 |
391,848 |
|
|
Frontier Communications Corp. (d) |
2,098,500 |
8,687,790 |
|
|
General Communications, Inc. Class A (a) |
1,160,061 |
9,802,515 |
|
|
IDT Corp. Class B |
51,100 |
516,621 |
|
|
Koninklijke KPN NV (d) |
461,212 |
1,573,982 |
|
|
Telecom Italia SpA |
1,147,800 |
844,086 |
|
|
Telefonica Brasil SA sponsored ADR |
236,963 |
6,246,345 |
|
|
Verizon Communications, Inc. |
2,155,147 |
100,278,991 |
|
|
Windstream Corp. |
182 |
1,563 |
|
|
|
186,501,732 |
||
|
TOTAL DIVERSIFIED TELECOMMUNICATION SERVICES |
225,407,165 |
||
|
ELECTRONIC EQUIPMENT & COMPONENTS - 1.5% |
|||
|
Electronic Manufacturing Services - 1.5% |
|||
|
Flextronics International Ltd. (a) |
899,300 |
5,980,345 |
|
|
INTERNET SOFTWARE & SERVICES - 0.1% |
|||
|
Internet Software & Services - 0.1% |
|||
|
Velti PLC (a) |
145,900 |
536,912 |
|
|
MEDIA - 2.1% |
|||
|
Cable & Satellite - 2.1% |
|||
|
Cablevision Systems Corp. - NY Group Class A |
54,425 |
761,406 |
|
|
Comcast Corp. Class A |
65,700 |
2,614,203 |
|
|
|
|||
|
Shares |
Value |
||
|
Liberty Global, Inc. Class A (a) |
42,318 |
$ 2,915,287 |
|
|
Time Warner Cable, Inc. |
22,881 |
1,976,690 |
|
|
|
8,267,586 |
||
|
REAL ESTATE INVESTMENT TRUSTS - 7.1% |
|||
|
Specialized REITs - 7.1% |
|||
|
American Tower Corp. |
362,800 |
28,153,280 |
|
|
SEMICONDUCTORS & SEMICONDUCTOR EQUIPMENT - 0.8% |
|||
|
Semiconductors - 0.8% |
|||
|
Broadcom Corp. Class A |
94,031 |
3,207,397 |
|
|
SOFTWARE - 0.4% |
|||
|
Application Software - 0.4% |
|||
|
Synchronoss Technologies, Inc. (a) |
45,603 |
1,375,843 |
|
|
WIRELESS TELECOMMUNICATION SERVICES - 28.0% |
|||
|
Wireless Telecommunication Services - 28.0% |
|||
|
America Movil S.A.B. de CV Series L sponsored ADR |
197,000 |
4,115,330 |
|
|
Boingo Wireless, Inc. (a) |
262,815 |
1,597,915 |
|
|
Clearwire Corp. Class A (a) |
3,309,836 |
10,326,688 |
|
|
Crown Castle International Corp. (a) |
102,183 |
7,132,373 |
|
|
Leap Wireless International, Inc. (a)(d) |
89,900 |
480,965 |
|
|
MetroPCS Communications, Inc. (a) |
877,806 |
8,602,499 |
|
|
Millicom International Cellular SA (depository receipt) |
11,000 |
863,175 |
|
|
Mobile TeleSystems OJSC sponsored ADR |
114,694 |
2,373,019 |
|
|
NII Holdings, Inc. (a) |
492,400 |
2,373,368 |
|
|
NTELOS Holdings Corp. |
15,706 |
196,011 |
|
|
NTT DoCoMo, Inc. |
1,327 |
2,051,525 |
|
|
SBA Communications Corp. Class A (a) |
313,556 |
22,300,103 |
|
|
Sprint Nextel Corp. (a) |
2,668,950 |
15,479,910 |
|
|
Telephone & Data Systems, Inc. |
506,600 |
11,596,074 |
|
|
TIM Participacoes SA |
229,200 |
1,001,607 |
|
|
U.S. Cellular Corp. (a) |
79,700 |
2,932,163 |
|
|
Vodafone Group PLC sponsored ADR |
696,300 |
17,504,982 |
|
|
|
110,927,707 |
||
|
TOTAL COMMON STOCKS (Cost $399,839,378) |
|
||
|
Money Market Funds - 5.2% |
|||
|
Shares |
Value |
||
|
Fidelity Cash Central Fund, 0.16% (b) |
12,575,761 |
$ 12,575,761 |
|
|
Fidelity Securities Lending Cash Central Fund, 0.16% (b)(c) |
8,239,903 |
8,239,903 |
|
|
TOTAL MONEY MARKET FUNDS (Cost $20,815,664) |
|
||
|
TOTAL INVESTMENT PORTFOLIO - 102.8% (Cost $420,655,042) |
407,332,278 |
||
|
NET OTHER ASSETS (LIABILITIES) - (2.8)% |
(11,234,417) |
||
|
NET ASSETS - 100% |
$ 396,097,861 |
||
|
Legend |
|
(a) Non-income producing |
|
(b) Affiliated fund that is generally available only to investment companies and other accounts managed by Fidelity Investments. The rate quoted is the annualized seven-day yield of the fund at period end. A complete unaudited listing of the fund's holdings as of its most recent quarter end is available upon request. In addition, each Fidelity Central Fund's financial statements, which are not covered by the Fund's Report of Independent Registered Public Accounting Firm, are available on the SEC's website or upon request. |
|
(c) Investment made with cash collateral received from securities on loan. |
|
(d) Security or a portion of the security is on loan at period end. |
|
Affiliated Central Funds |
|
Information regarding fiscal year to date income earned by the Fund from investments in Fidelity Central Funds is as follows: |
|
Fund |
Income earned |
|
Fidelity Cash Central Fund |
$ 29,115 |
|
Fidelity Securities Lending Cash Central Fund |
316,632 |
|
Total |
$ 345,747 |
|
Other Information |
|
The following is a summary of the inputs used, as of February 28, 2013, involving the Fund's assets and liabilities carried at fair value. The inputs or methodology used for valuing securities may not be an indication of the risk associated with investing in those securities. For more information on valuation inputs, and their aggregation into the levels used in the table below, please refer to the Investment Valuation section in the accompanying Notes to Financial Statements. |
|
Valuation Inputs at Reporting Date: |
||||
|
Description |
Total |
Level 1 |
Level 2 |
Level 3 |
|
Investments in Securities: |
||||
|
Common Stocks |
$ 386,516,614 |
$ 383,621,003 |
$ 2,895,611 |
$ - |
|
Money Market Funds |
20,815,664 |
20,815,664 |
- |
- |
|
Total Investments in Securities: |
$ 407,332,278 |
$ 404,436,667 |
$ 2,895,611 |
$ - |
|
Distribution of investments by country or territory of incorporation, as a percentage of total net assets, is as follows. (Unaudited) |
|
United States of America |
89.2% |
|
United Kingdom |
4.4% |
|
Brazil |
1.9% |
|
Singapore |
1.5% |
|
Mexico |
1.0% |
|
Others (Individually Less Than 1%) |
2.0% |
|
|
100.0% |
See accompanying notes which are an integral part of the financial statements.
Annual Report
Telecommunications Portfolio
Financial Statements
Statement of Assets and Liabilities
|
|
February 28, 2013 |
|
|
|
|
|
|
Assets |
|
|
|
Investment in securities, at value (including securities loaned of $7,933,343) - See accompanying schedule: Unaffiliated issuers (cost $399,839,378) |
$ 386,516,614 |
|
|
Fidelity Central Funds (cost $20,815,664) |
20,815,664 |
|
|
Total Investments (cost $420,655,042) |
|
$ 407,332,278 |
|
Receivable for investments sold |
|
6,938,541 |
|
Receivable for fund shares sold |
|
140,517 |
|
Dividends receivable |
|
66,205 |
|
Distributions receivable from Fidelity Central Funds |
|
22,752 |
|
Prepaid expenses |
|
874 |
|
Receivable from investment adviser for expense reductions |
|
350 |
|
Other receivables |
|
24,377 |
|
Total assets |
|
414,525,894 |
|
|
|
|
|
Liabilities |
|
|
|
Payable for investments purchased |
$ 9,698,693 |
|
|
Payable for fund shares redeemed |
173,973 |
|
|
Accrued management fee |
185,668 |
|
|
Distribution and service plan fees payable |
7,161 |
|
|
Other affiliated payables |
88,075 |
|
|
Other payables and accrued expenses |
34,560 |
|
|
Collateral on securities loaned, at value |
8,239,903 |
|
|
Total liabilities |
|
18,428,033 |
|
|
|
|
|
Net Assets |
|
$ 396,097,861 |
|
Net Assets consist of: |
|
|
|
Paid in capital |
|
$ 421,537,330 |
|
Undistributed net investment income |
|
1,584,319 |
|
Accumulated undistributed net realized gain (loss) on investments and foreign currency transactions |
|
(13,698,894) |
|
Net unrealized appreciation (depreciation) on investments and assets and liabilities in foreign currencies |
|
(13,324,894) |
|
Net Assets |
|
$ 396,097,861 |
Statement of Assets and Liabilities - continued
|
|
February 28, 2013 |
|
|
|
|
|
|
Calculation of Maximum Offering Price Class A: |
|
$ 51.58 |
|
|
|
|
|
Maximum offering price per share (100/94.25 of $51.58) |
|
$ 54.73 |
|
Class T: |
|
$ 51.41 |
|
|
|
|
|
Maximum offering price per share (100/96.50 of $51.41) |
|
$ 53.27 |
|
Class B: |
|
$ 51.63 |
|
|
|
|
|
Class C: |
|
$ 51.47 |
|
|
|
|
|
Telecommunications: |
|
$ 51.75 |
|
|
|
|
|
Institutional Class: |
|
$ 51.65 |
A Redemption price per share is equal to net asset value less any applicable contingent deferred sales charge.
See accompanying notes which are an integral part of the financial statements.
Annual Report
Telecommunications Portfolio
Financial Statements - continued
Statement of Operations
|
|
Year ended February 28, 2013 |
|
|
|
|
|
|
Investment Income |
|
|
|
Dividends |
|
$ 12,424,007 |
|
Interest |
|
72 |
|
Income from Fidelity Central Funds |
|
345,747 |
|
Total income |
|
12,769,826 |
|
|
|
|
|
Expenses |
|
|
|
Management fee |
$ 2,234,749 |
|
|
Transfer agent fees |
947,758 |
|
|
Distribution and service plan fees |
77,446 |
|
|
Accounting and security lending fees |
159,773 |
|
|
Custodian fees and expenses |
10,570 |
|
|
Independent trustees' compensation |
2,693 |
|
|
Registration fees |
79,762 |
|
|
Audit |
50,173 |
|
|
Legal |
2,845 |
|
|
Miscellaneous |
3,614 |
|
|
Total expenses before reductions |
3,569,383 |
|
|
Expense reductions |
(61,113) |
3,508,270 |
|
Net investment income (loss) |
|
9,261,556 |
|
Realized and Unrealized Gain (Loss) Net realized gain (loss) on: |
|
|
|
Investment securities: |
|
|
|
Unaffiliated issuers |
44,363,660 |
|
|
Foreign currency transactions |
(6,576) |
|
|
Total net realized gain (loss) |
|
44,357,084 |
|
Change in net unrealized appreciation (depreciation) on: Investment securities |
3,166,454 |
|
|
Assets and liabilities in foreign currencies |
(713) |
|
|
Total change in net unrealized appreciation (depreciation) |
|
3,165,741 |
|
Net gain (loss) |
|
47,522,825 |
|
Net increase (decrease) in net assets resulting from operations |
|
$ 56,784,381 |
Statement of Changes in Net Assets
|
|
Year ended |
Year ended |
|
Increase (Decrease) in Net Assets |
|
|
|
Operations |
|
|
|
Net investment income (loss) |
$ 9,261,556 |
$ 5,541,550 |
|
Net realized gain (loss) |
44,357,084 |
24,725,843 |
|
Change in net unrealized appreciation (depreciation) |
3,165,741 |
(35,725,245) |
|
Net increase (decrease) in net assets resulting from operations |
56,784,381 |
(5,457,852) |
|
Distributions to shareholders from net investment income |
(8,401,078) |
(4,955,219) |
|
Share transactions - net increase (decrease) |
(7,060,825) |
(2,457,615) |
|
Redemption fees |
3,280 |
35,055 |
|
Total increase (decrease) in net assets |
41,325,758 |
(12,835,631) |
|
|
|
|
|
Net Assets |
|
|
|
Beginning of period |
354,772,103 |
367,607,734 |
|
End of period (including undistributed net investment income of $1,584,319 and undistributed net investment income of $730,417, respectively) |
$ 396,097,861 |
$ 354,772,103 |
See accompanying notes which are an integral part of the financial statements.
Annual Report
Financial Highlights - Class A
|
Years ended February 28, |
2013 |
2012 H |
2011 |
2010 |
2009 |
|
Selected Per-Share Data |
|
|
|
|
|
|
Net asset value, beginning of period |
$ 46.12 |
$ 46.93 |
$ 37.64 |
$ 26.66 |
$ 42.56 |
|
Income from Investment Operations |
|
|
|
|
|
|
Net investment income (loss) C |
.99 |
.56 |
.57 |
.67 |
.22 |
|
Net realized and unrealized gain (loss) |
5.43 |
(.86) |
9.49 |
10.55 |
(15.60) |
|
Total from investment operations |
6.42 |
(.30) |
10.06 |
11.22 |
(15.38) |
|
Distributions from net investment income |
(.96) |
(.51) |
(.77) |
(.19) |
(.35) F |
|
Distributions from net realized gain |
- |
- |
- |
(.05) |
(.18) F |
|
Total distributions |
(.96) |
(.51) |
(.77) |
(.24) J |
(.52) K |
|
Redemption fees added to paid in capital C,I |
- |
- |
- |
- |
- |
|
Net asset value, end of period |
$ 51.58 |
$ 46.12 |
$ 46.93 |
$ 37.64 |
$ 26.66 |
|
Total Return A, B |
13.97% |
(.54)% |
26.87% |
42.07% |
(36.16)% |
|
Ratios to Average Net Assets D, G |
|
|
|
|
|
|
Expenses before reductions |
1.18% |
1.20% |
1.20% |
1.26% |
1.21% |
|
Expenses net of fee waivers, if any |
1.18% |
1.20% |
1.20% |
1.26% |
1.21% |
|
Expenses net of all reductions |
1.17% |
1.18% |
1.18% |
1.24% |
1.21% |
|
Net investment income (loss) |
2.01% |
1.21% |
1.35% |
1.89% |
.61% |
|
Supplemental Data |
|
|
|
|
|
|
Net assets, end of period (000 omitted) |
$ 6,449 |
$ 4,677 |
$ 4,305 |
$ 3,343 |
$ 2,112 |
|
Portfolio turnover rate E |
76% |
72% |
72% |
90% |
168% |
|
A Total returns would have been lower if certain expenses had not been reduced during the applicable periods shown. B Total returns do not include the effect of the sales charges. C Calculated based on average shares outstanding during the period. D Fees and expenses of any underlying Fidelity Central Funds are not included in the Fund's expense ratio. The Fund indirectly bears its proportionate share of the expenses of any underlying Fidelity Central Funds. E Amount does not include the portfolio activity of any underlying Fidelity Central Funds. F The amounts shown reflect certain reclassifications related to book to tax differences that were made in the year shown. G Expense ratios reflect operating expenses of the class. Expenses before reductions do not reflect amounts reimbursed by the investment adviser or reductions from brokerage service arrangements or reductions from other expense offset arrangements and do not represent the amount paid by the class during periods when reimbursements or reductions occur. Expenses net of fee waivers reflect expenses after reimbursement by the investment adviser but prior to reductions from brokerage service arrangements or other expense offset arrangements. Expenses net of all reductions represent the net expenses paid by the class. H For the year ended February 29. I Amount represents less than $.01 per share. J Total distributions of $.24 per share is comprised of distributions from net investment income of $.187 and distributions from net realized gain of $.048 per share. K Total distributions of $.52 per share is comprised of distributions from net investment income of $.347 and distributions from net realized gain of $.175 per share. |
Financial Highlights - Class T
|
Years ended February 28, |
2013 |
2012 H |
2011 |
2010 |
2009 |
|
Selected Per-Share Data |
|
|
|
|
|
|
Net asset value, beginning of period |
$ 46.01 |
$ 46.81 |
$ 37.55 |
$ 26.68 |
$ 42.49 |
|
Income from Investment Operations |
|
|
|
|
|
|
Net investment income (loss) C |
.85 |
.42 |
.45 |
.57 |
.12 |
|
Net realized and unrealized gain (loss) |
5.39 |
(.84) |
9.47 |
10.54 |
(15.56) |
|
Total from investment operations |
6.24 |
(.42) |
9.92 |
11.11 |
(15.44) |
|
Distributions from net investment income |
(.84) |
(.38) |
(.66) |
(.22) |
(.24) F |
|
Distributions from net realized gain |
- |
- |
- |
(.03) |
(.13) F |
|
Total distributions |
(.84) |
(.38) |
(.66) |
(.24) J |
(.37) K |
|
Redemption fees added to paid in capital C,I |
- |
- |
- |
- |
- |
|
Net asset value, end of period |
$ 51.41 |
$ 46.01 |
$ 46.81 |
$ 37.55 |
$ 26.68 |
|
Total Return A, B |
13.61% |
(.82)% |
26.54% |
41.64% |
(36.34)% |
|
Ratios to Average Net Assets D, G |
|
|
|
|
|
|
Expenses before reductions |
1.48% |
1.49% |
1.48% |
1.55% |
1.49% |
|
Expenses net of fee waivers, if any |
1.48% |
1.49% |
1.48% |
1.55% |
1.49% |
|
Expenses net of all reductions |
1.46% |
1.47% |
1.46% |
1.53% |
1.48% |
|
Net investment income (loss) |
1.72% |
.92% |
1.06% |
1.60% |
.33% |
|
Supplemental Data |
|
|
|
|
|
|
Net assets, end of period (000 omitted) |
$ 4,237 |
$ 2,702 |
$ 2,882 |
$ 2,051 |
$ 620 |
|
Portfolio turnover rate E |
76% |
72% |
72% |
90% |
168% |
|
A Total returns would have been lower if certain expenses had not been reduced during the applicable periods shown. B Total returns do not include the effect of the sales charges. C Calculated based on average shares outstanding during the period. D Fees and expenses of any underlying Fidelity Central Funds are not included in the Fund's expense ratio. The Fund indirectly bears its proportionate share of the expenses of any underlying Fidelity Central Funds. E Amount does not include the portfolio activity of any underlying Fidelity Central Funds. F The amounts shown reflect certain reclassifications related to book to tax differences that were made in the year shown. G Expense ratios reflect operating expenses of the class. Expenses before reductions do not reflect amounts reimbursed by the investment adviser or reductions from brokerage service arrangements or reductions from other expense offset arrangements and do not represent the amount paid by the class during periods when reimbursements or reductions occur. Expenses net of fee waivers reflect expenses after reimbursement by the investment adviser but prior to reductions from brokerage service arrangements or other expense offset arrangements. Expenses net of all reductions represent the net expenses paid by the class. H For the year ended February 29. I Amount represents less than $.01 per share. J Total distributions of $.24 per share is comprised of distributions from net investment income of $.216 and distributions from net realized gain of $.028 per share. K Total distributions of $.37 per share is comprised of distributions from net investment income of $.244 and distributions from net realized gain of $.127 per share. |
See accompanying notes which are an integral part of the financial statements.
Annual Report
Financial Highlights - Class B
|
Years ended February 28, |
2013 |
2012 H |
2011 |
2010 |
2009 |
|
Selected Per-Share Data |
|
|
|
|
|
|
Net asset value, beginning of period |
$ 46.14 |
$ 46.93 |
$ 37.60 |
$ 26.71 |
$ 42.42 |
|
Income from Investment Operations |
|
|
|
|
|
|
Net investment income (loss) C |
.62 |
.21 |
.25 |
.40 |
(.05) |
|
Net realized and unrealized gain (loss) |
5.42 |
(.83) |
9.48 |
10.54 |
(15.49) |
|
Total from investment operations |
6.04 |
(.62) |
9.73 |
10.94 |
(15.54) |
|
Distributions from net investment income |
(.55) |
(.17) |
(.40) |
(.04) |
(.11) F |
|
Distributions from net realized gain |
- |
- |
- |
(.01) |
(.06) F |
|
Total distributions |
(.55) |
(.17) |
(.40) |
(.05) J |
(.17) K |
|
Redemption fees added to paid in capital C,I |
- |
- |
- |
- |
- |
|
Net asset value, end of period |
$ 51.63 |
$ 46.14 |
$ 46.93 |
$ 37.60 |
$ 26.71 |
|
Total Return A, B |
13.11% |
(1.29)% |
25.96% |
40.97% |
(36.64)% |
|
Ratios to Average Net Assets D, G |
|
|
|
|
|
|
Expenses before reductions |
1.93% |
1.95% |
1.95% |
2.01% |
1.97% |
|
Expenses net of fee waivers, if any |
1.93% |
1.95% |
1.95% |
2.01% |
1.97% |
|
Expenses net of all reductions |
1.92% |
1.93% |
1.93% |
2.00% |
1.96% |
|
Net investment income (loss) |
1.26% |
.47% |
.60% |
1.13% |
(.15)% |
|
Supplemental Data |
|
|
|
|
|
|
Net assets, end of period (000 omitted) |
$ 576 |
$ 596 |
$ 706 |
$ 641 |
$ 363 |
|
Portfolio turnover rate E |
76% |
72% |
72% |
90% |
168% |
|
A Total returns would have been lower if certain expenses had not been reduced during the applicable periods shown. B Total returns do not include the effect of the contingent deferred sales charge. C Calculated based on average shares outstanding during the period. D Fees and expenses of any underlying Fidelity Central Funds are not included in the Fund's expense ratio. The Fund indirectly bears its proportionate share of the expenses of any underlying Fidelity Central Funds. E Amount does not include the portfolio activity of any underlying Fidelity Central Funds. F The amounts shown reflect certain reclassifications related to book to tax differences that were made in the year shown. G Expense ratios reflect operating expenses of the class. Expenses before reductions do not reflect amounts reimbursed by the investment adviser or reductions from brokerage service arrangements or reductions from other expense offset arrangements and do not represent the amount paid by the class during periods when reimbursements or reductions occur. Expenses net of fee waivers reflect expenses after reimbursement by the investment adviser but prior to reductions from brokerage service arrangements or other expense offset arrangements. Expenses net of all reductions represent the net expenses paid by the class. H For the year ended February 29. I Amount represents less than $.01 per share. J Total distributions of $.05 per share is comprised of distributions from net investment income of $.044 and distributions from net realized gain of $.009 per share. K Total distributions of $.17 per share is comprised of distributions from net investment income of $.105 and distributions from net realized gain of $.063 per share. |
Financial Highlights - Class C
|
Years ended February 28, |
2013 |
2012 H |
2011 |
2010 |
2009 |
|
Selected Per-Share Data |
|
|
|
|
|
|
Net asset value, beginning of period |
$ 46.02 |
$ 46.89 |
$ 37.61 |
$ 26.76 |
$ 42.42 |
|
Income from Investment Operations |
|
|
|
|
|
|
Net investment income (loss) C |
.63 |
.22 |
.26 |
.41 |
(.05) |
|
Net realized and unrealized gain (loss) |
5.41 |
(.84) |
9.46 |
10.56 |
(15.50) |
|
Total from investment operations |
6.04 |
(.62) |
9.72 |
10.97 |
(15.55) |
|
Distributions from net investment income |
(.59) |
(.25) |
(.44) |
(.10) |
(.07) F |
|
Distributions from net realized gain |
- |
- |
- |
(.02) |
(.05) F |
|
Total distributions |
(.59) |
(.25) |
(.44) |
(.12) J |
(.11) K |
|
Redemption fees added to paid in capital C,I |
- |
- |
- |
- |
- |
|
Net asset value, end of period |
$ 51.47 |
$ 46.02 |
$ 46.89 |
$ 37.61 |
$ 26.76 |
|
Total Return A, B |
13.14% |
(1.27)% |
25.95% |
41.00% |
(36.64)% |
|
Ratios to Average Net Assets D, G |
|
|
|
|
|
|
Expenses before reductions |
1.90% |
1.93% |
1.94% |
2.01% |
1.97% |
|
Expenses net of fee waivers, if any |
1.90% |
1.93% |
1.94% |
2.01% |
1.97% |
|
Expenses net of all reductions |
1.89% |
1.91% |
1.92% |
2.00% |
1.96% |
|
Net investment income (loss) |
1.29% |
.48% |
.61% |
1.13% |
(.14)% |
|
Supplemental Data |
|
|
|
|
|
|
Net assets, end of period (000 omitted) |
$ 4,353 |
$ 3,514 |
$ 3,035 |
$ 2,151 |
$ 371 |
|
Portfolio turnover rate E |
76% |
72% |
72% |
90% |
168% |
|
A Total returns would have been lower if certain expenses had not been reduced during the applicable periods shown. B Total returns do not include the effect of the contingent deferred sales charge. C Calculated based on average shares outstanding during the period. D Fees and expenses of any underlying Fidelity Central Funds are not included in the Fund's expense ratio. The Fund indirectly bears its proportionate share of the expenses of any underlying Fidelity Central Funds. E Amount does not include the portfolio activity of any underlying Fidelity Central Funds. F The amounts shown reflect certain reclassifications related to book to tax differences that were made in the year shown. G Expense ratios reflect operating expenses of the class. Expenses before reductions do not reflect amounts reimbursed by the investment adviser or reductions from brokerage service arrangements or reductions from other expense offset arrangements and do not represent the amount paid by the class during periods when reimbursements or reductions occur. Expenses net of fee waivers reflect expenses after reimbursement by the investment adviser but prior to reductions from brokerage service arrangements or other expense offset arrangements. Expenses net of all reductions represent the net expenses paid by the class. H For the year ended February 29. I Amount represents less than $.01 per share. J Total distributions of $.12 per share is comprised of distributions from net investment income of $.098 and distributions from net realized gain of $.023 per share. K Total distributions of $.11 per share is comprised of distributions from net investment income of $.068 and distributions from net realized gain of $.046 per share. |
See accompanying notes which are an integral part of the financial statements.
Annual Report
Financial Highlights - Telecommunications
|
Years ended February 28, |
2013 |
2012 G |
2011 |
2010 |
2009 |
|
Selected Per-Share Data |
|
|
|
|
|
|
Net asset value, beginning of period |
$ 46.26 |
$ 47.07 |
$ 37.73 |
$ 26.74 |
$ 42.70 |
|
Income from Investment Operations |
|
|
|
|
|
|
Net investment income (loss) B |
1.15 |
.70 |
.69 |
.76 |
.30 |
|
Net realized and unrealized gain (loss) |
5.43 |
(.86) |
9.52 |
10.59 |
(15.65) |
|
Total from investment operations |
6.58 |
(.16) |
10.21 |
11.35 |
(15.35) |
|
Distributions from net investment income |
(1.09) |
(.65) |
(.87) |
(.31) |
(.41) E |
|
Distributions from net realized gain |
- |
- |
- |
(.05) |
(.20) E |
|
Total distributions |
(1.09) |
(.65) |
(.87) |
(.36) I |
(.61) J |
|
Redemption fees added to paid in capital B, H |
- |
- |
- |
- |
- |
|
Net asset value, end of period |
$ 51.75 |
$ 46.26 |
$ 47.07 |
$ 37.73 |
$ 26.74 |
|
Total Return A |
14.30% |
(.23)% |
27.24% |
42.43% |
(36.00)% |
|
Ratios to Average Net Assets C, F |
|
|
|
|
|
|
Expenses before reductions |
.87% |
.90% |
.92% |
.99% |
.97% |
|
Expenses net of fee waivers, if any |
.87% |
.90% |
.92% |
.99% |
.97% |
|
Expenses net of all reductions |
.85% |
.88% |
.91% |
.98% |
.96% |
|
Net investment income (loss) |
2.33% |
1.52% |
1.62% |
2.15% |
.85% |
|
Supplemental Data |
|
|
|
|
|
|
Net assets, end of period (000 omitted) |
$ 377,841 |
$ 342,262 |
$ 354,938 |
$ 279,704 |
$ 196,231 |
|
Portfolio turnover rate D |
76% |
72% |
72% |
90% |
168% |
|
A Total returns would have been lower if certain expenses had not been reduced during the applicable periods shown. B Calculated based on average shares outstanding during the period. C Fees and expenses of any underlying Fidelity Central Funds are not included in the Fund's expense ratio. The Fund indirectly bears its proportionate share of the expenses of any underlying Fidelity Central Funds. D Amount does not include the portfolio activity of any underlying Fidelity Central Funds. E The amounts shown reflect certain reclassifications related to book to tax differences that were made in the year shown. F Expense ratios reflect operating expenses of the class. Expenses before reductions do not reflect amounts reimbursed by the investment adviser or reductions from brokerage service arrangements or reductions from other expense offset arrangements and do not represent the amount paid by the class during periods when reimbursements or reductions occur. Expenses net of fee waivers reflect expenses after reimbursement by the investment adviser but prior to reductions from brokerage service arrangements or other expense offset arrangements. Expenses net of all reductions represent the net expenses paid by the class. G For the year ended February 29. H Amount represents less than $.01 per share. I Total distributions of $.36 per share is comprised of distributions from net investment income of $.310 and distributions from net realized gain of $.048 per share. J Total distributions of $.61 per share is comprised of distributions from net investment income of $.408 and distributions from net realized gain of $.202 per share. |
Financial Highlights - Institutional Class
|
Years ended February 28, |
2013 |
2012 G |
2011 |
2010 |
2009 |
|
Selected Per-Share Data |
|
|
|
|
|
|
Net asset value, beginning of period |
$ 46.20 |
$ 47.02 |
$ 37.69 |
$ 26.73 |
$ 42.65 |
|
Income from Investment Operations |
|
|
|
|
|
|
Net investment income (loss) B |
1.17 |
.70 |
.71 |
.84 |
.34 |
|
Net realized and unrealized gain (loss) |
5.42 |
(.88) |
9.50 |
10.55 |
(15.67) |
|
Total from investment operations |
6.59 |
(.18) |
10.21 |
11.39 |
(15.33) |
|
Distributions from net investment income |
(1.14) |
(.64) |
(.88) |
(.38) |
(.40) E |
|
Distributions from net realized gain |
- |
- |
- |
(.05) |
(.20) E |
|
Total distributions |
(1.14) |
(.64) |
(.88) |
(.43) I |
(.59) J |
|
Redemption fees added to paid in capital B, H |
- |
- |
- |
- |
- |
|
Net asset value, end of period |
$ 51.65 |
$ 46.20 |
$ 47.02 |
$ 37.69 |
$ 26.73 |
|
Total Return A |
14.33% |
(.26)% |
27.27% |
42.59% |
(35.99)% |
|
Ratios to Average Net Assets C, F |
|
|
|
|
|
|
Expenses before reductions |
.85% |
.89% |
.91% |
.86% |
.91% |
|
Expenses net of fee waivers, if any |
.85% |
.89% |
.91% |
.86% |
.91% |
|
Expenses net of all reductions |
.83% |
.87% |
.89% |
.84% |
.90% |
|
Net investment income (loss) |
2.35% |
1.52% |
1.64% |
2.29% |
.91% |
|
Supplemental Data |
|
|
|
|
|
|
Net assets, end of period (000 omitted) |
$ 2,641 |
$ 1,022 |
$ 1,743 |
$ 1,101 |
$ 68 |
|
Portfolio turnover rate D |
76% |
72% |
72% |
90% |
168% |
|
A Total returns would have been lower if certain expenses had not been reduced during the applicable periods shown. B Calculated based on average shares outstanding during the period. C Fees and expenses of any underlying Fidelity Central Funds are not included in the Fund's expense ratio. The Fund indirectly bears its proportionate share of the expenses of any underlying Fidelity Central Funds. D Amount does not include the portfolio activity of any underlying Fidelity Central Funds. E The amounts shown reflect certain reclassifications related to book to tax differences that were made in the year shown. F Expense ratios reflect operating expenses of the class. Expenses before reductions do not reflect amounts reimbursed by the investment adviser or reductions from brokerage service arrangements or reductions from other expense offset arrangements and do not represent the amount paid by the class during periods when reimbursements or reductions occur. Expenses net of fee waivers reflect expenses after reimbursement by the investment adviser but prior to reductions from brokerage service arrangements or other expense offset arrangements. Expenses net of all reductions represent the net expenses paid by the class. G For the year ended February 29. H Amount represents less than $.01 per share. I Total distributions of $.43 per share is comprised of distributions from net investment income of $.379 and distributions from net realized gain of $.057 per share. J Total distributions of $.59 per share is comprised of distributions from net investment income of $.395 and distributions from net realized gain of $.197 per share. |
See accompanying notes which are an integral part of the financial statements.
Annual Report
Notes to Financial Statements
For the period ended February 28, 2013
1. Organization.
Telecommunications Portfolio (the Fund) is a non-diversified fund of Fidelity Select Portfolios (the Trust) and is authorized to issue an unlimited number of shares. The Trust is registered under the Investment Company Act of 1940, as amended (the 1940 Act), as an open-end management investment company organized as a Massachusetts business trust. The Fund invests primarily in securities of companies whose principal business activities fall within specific industries. The Fund offers Class A, Class T, Class C, Telecommunications and Institutional Class shares, each of which, along with Class B shares, has equal rights as to assets and voting privileges. Class B shares are closed to new accounts and additional purchases, except for exchanges and reinvestments. Each class has exclusive voting rights with respect to matters that affect that class. Class B shares will automatically convert to Class A shares after a holding period of seven years from the initial date of purchase. Investment income, realized and unrealized capital gains and losses, the common expenses of the Fund, and certain fund-level expense reductions, if any, are allocated on a pro-rata basis to each class based on the relative net assets of each class to the total net assets of the Fund. Each class differs with respect to transfer agent and distribution and service plan fees incurred. Certain expense reductions may also differ by class.
2. Investments in Fidelity Central Funds.
The Fund invests in Fidelity Central Funds, which are open-end investment companies available only to other investment companies and accounts managed by Fidelity Management & Research Company (FMR) and its affiliates. The Fund's Schedule of Investments lists each of the Fidelity Central Funds held as of period end, if any, as an investment of the Fund, but does not include the underlying holdings of each Fidelity Central Fund. As an Investing Fund, the Fund indirectly bears its proportionate share of the expenses of the underlying Fidelity Central Funds.
The Money Market Central Funds seek preservation of capital and current income and are managed by Fidelity Investments Money Management, Inc. (FIMM), an affiliate of FMR.
A complete unaudited list of holdings for each Fidelity Central Fund is available upon request or at the Securities and Exchange Commission (the SEC) website at www.sec.gov. In addition, the financial statements of the Fidelity Central Funds, which are not covered by the Fund's Report of Independent Registered Public Accounting Firm, are available on the SEC website or upon request.
3. Significant Accounting Policies.
The financial statements have been prepared in conformity with accounting principles generally accepted in the United States of America (GAAP), which require management to make certain estimates and assumptions at the date of the financial statements. Actual results could differ from those estimates. Subsequent events, if any, through the date that the financial statements were issued have been evaluated in the preparation of the financial statements. The following summarizes the significant accounting policies of the Fund:
Investment Valuation. Investments are valued as of 4:00 p.m. Eastern time on the last calendar day of the period. In accordance with valuation policies and procedures approved by the Board of Trustees (the Board), the Fund attempts to obtain prices from one or more third party pricing vendors or brokers to value its investments. When current market prices, quotations or currency exchange rates are not readily available or reliable, investments will be fair valued in good faith by the FMR Fair Value Committee (the Committee), in accordance with procedures adopted by the Fund's Board. Factors used in determining fair value vary by investment type and may include market or investment specific events. The frequency with which these procedures are used cannot be predicted and they may be utilized to a significant extent. The Committee oversees the Fund's valuation policies and procedures and is responsible for approving and reporting to the Board all fair value determinations.
The Fund categorizes the inputs to valuation techniques used to value its investments into a disclosure hierarchy consisting of three levels as shown below:
Level 1 - quoted prices in active markets for identical investments
Level 2 - other significant observable inputs (including quoted prices for similar investments, interest rates, prepayment speeds, etc.)
Level 3 - unobservable inputs (including the Fund's own assumptions based on the best information available)
Valuation techniques used to value the Fund's investments by major category are as follows:
Equity securities, including restricted securities, for which market quotations are readily available, are valued at the last reported sale price or official closing price as reported by a third party pricing vendor on the primary market or exchange on which they are traded and are categorized as Level 1 in the hierarchy. In the event there were no sales during the day or closing prices are not available, securities are valued at the last quoted bid price or may be valued using the last available price and are generally categorized as Level 2 in the hierarchy. For foreign equity securities, when significant market or security specific events arise, comparisons to the valuation of American Depositary Receipts (ADRs), futures contracts, Exchange-Traded Funds (ETFs) and certain indexes as well as quoted prices for similar securities are used and are categorized as Level 2 in the hierarchy. Utilizing these techniques may result in transfers between Level 1 and Level 2.
Annual Report
3. Significant Accounting Policies - continued
Investment Valuation - continued
Investments in open-end mutual funds, including the Fidelity Central Funds, are valued at their closing net asset value (NAV) each business day and are categorized as Level 1 in the hierarchy.
Changes in valuation techniques may result in transfers in or out of an assigned level within the disclosure hierarchy. The aggregate value of investments by input level, as of February 28, 2013 is included at the end of the Fund's Schedule of Investments.
Foreign Currency. The Fund may use foreign currency contracts to facilitate transactions in foreign-denominated securities. Gains and losses from these transactions may arise from changes in the value of the foreign currency or if the counterparties do not perform under the contracts' terms.
Foreign-denominated assets, including investment securities, and liabilities are translated into U.S. dollars at the exchange rates at period end. Purchases and sales of investment securities, income and dividends received and expenses denominated in foreign currencies are translated into U.S. dollars at the exchange rate in effect on the transaction date.
The effects of exchange rate fluctuations on investments are included with the net realized and unrealized gain (loss) on investment securities. Other foreign currency transactions resulting in realized and unrealized gain (loss) are disclosed separately.
Investment Transactions and Income. For financial reporting purposes, the Fund's investment holdings and NAV include trades executed through the end of the last business day of the period. The NAV per share for processing shareholder transactions is calculated as of the close of business of the New York Stock Exchange (NYSE) normally 4:00 p.m. Eastern time and includes trades executed through the end of the prior business day. Gains and losses on securities sold are determined on the basis of identified cost and may include proceeds received from litigation. Dividend income is recorded on the ex-dividend date, except for certain dividends from foreign securities where the ex-dividend date may have passed, which are recorded as soon as the Fund is informed of the ex-dividend date. Non-cash dividends included in dividend income, if any, are recorded at the fair market value of the securities received. Distributions received on securities that represent a return of capital or capital gain are recorded as a reduction of cost of investments and/or as a realized gain. The Fund estimates the components of distributions received that may be considered return of capital distributions or capital gain distributions. Interest income and distributions from the Fidelity Central Funds are accrued as earned. Interest income includes coupon interest and amortization of premium and accretion of discount on debt securities. Investment income is recorded net of foreign taxes withheld where recovery of such taxes is uncertain.
Expenses. Expenses directly attributable to a fund are charged to that fund. Expenses attributable to more than one fund are allocated among the respective funds on the basis of relative net assets or other appropriate methods. Expense estimates are accrued in the period to which they relate and adjustments are made when actual amounts are known.
Income Tax Information and Distributions to Shareholders. Each year, the Fund intends to qualify as a regulated investment company under Subchapter M of the Internal Revenue Code, including distributing substantially all of its taxable income and realized gains. As a result, no provision for income taxes is required. As of February 28, 2013, the Fund did not have any unrecognized tax benefits in the financial statements; nor is the Fund aware of any tax positions for which it is reasonably possible that the total amounts of unrecognized tax benefits will significantly change in the next twelve months. The Fund files a U.S. federal tax return, in addition to state and local tax returns as required. A fund's federal income tax returns are subject to examination by the Internal Revenue Service (IRS) for a period of three fiscal years after they are filed. State and local tax returns may be subject to examination for an additional fiscal year depending on the jurisdiction. Foreign taxes are provided for based on the Fund's understanding of the tax rules and rates that exist in the foreign markets in which it invests.
Distributions are declared and recorded on the ex-dividend date. Income dividends and capital gain distributions are declared separately for each class. Income and capital gain distributions are determined in accordance with income tax regulations, which may differ from GAAP.
Capital accounts within the financial statements are adjusted for permanent book-tax differences. These adjustments have no impact on net assets or the results of operations. Temporary book-tax differences will reverse in a subsequent period.
Book-tax differences are primarily due to foreign currency transactions, deferred trustees compensation, capital loss carryforwards, losses deferred due to wash sales and excise tax regulations.
The federal tax cost of investment securities and unrealized appreciation (depreciation) as of period end were as follows:
|
Gross unrealized appreciation |
$ 31,237,253 |
|
Gross unrealized depreciation |
(53,653,112) |
|
Net unrealized appreciation (depreciation) on securities and other investments |
$ (22,415,859) |
|
|
|
|
Tax Cost |
$ 429,748,137 |
Annual Report
Notes to Financial Statements - continued
3. Significant Accounting Policies - continued
Income Tax Information and Distributions to Shareholders - continued
The tax-based components of distributable earnings as of period end were as follows:
|
Undistributed ordinary income |
$ 1,584,607 |
|
Capital loss carryforward |
$ (4,605,799) |
|
Net unrealized appreciation (depreciation) |
$ (22,417,989) |
Capital loss carryforwards are only available to offset future capital gains of the Fund to the extent provided by regulations and may be limited. Under the Regulated Investment Company Modernization Act of 2010 (the Act), the Fund is permitted to carry forward capital losses incurred in taxable years beginning after December 22, 2010 for an unlimited period and such capital losses are required to be used prior to any losses that expire. Capital loss carryforwards were as follows:
|
Fiscal year of expiration |
|
|
2018 |
$ (4,605,799) |
The tax character of distributions paid was as follows:
|
|
February 28, 2013 |
February 29, 2012 |
|
Ordinary Income |
$ 8,401,078 |
$ 4,955,219 |
Trading (Redemption) Fees. Shares held by investors in the Fund less than 30 days are subject to a redemption fee equal to .75% of the net asset value of shares redeemed. All redemption fees, which reduce the proceeds of the shareholder redemption, are retained by the Fund and accounted for as an addition to paid in capital.
4. Purchases and Sales of Investments.
Purchases and sales of securities, other than short-term securities, aggregated $292,408,210 and $291,614,126, respectively.
5. Fees and Other Transactions with Affiliates.
Management Fee. FMR and its affiliates provide the Fund with investment management related services for which the Fund pays a monthly management fee. The management fee is the sum of an individual fund fee rate that is based on an annual rate of .30% of the Fund's average net assets and an annualized group fee rate that averaged .26% during the period. The group fee rate is based upon the average net assets of all the mutual funds advised by FMR. The group fee rate decreases as assets under management increase and increases as assets under management decrease. For the period, the total annual management fee rate was .56% of the Fund's average net assets.
Distribution and Service Plan Fees. In accordance with Rule 12b-1 of the 1940 Act, the Fund has adopted separate Distribution and Service Plans for each class of shares. Certain classes pay Fidelity Distributors Corporation (FDC), an affiliate of FMR, separate Distribution and Service Fees, each of which is based on an annual percentage of each class' average net assets. In addition, FDC may pay financial intermediaries for selling shares of the Fund and providing shareholder support services. For the period, the Distribution and Service Fee rates, total fees and amounts retained by FDC were as follows:
|
|
Distribution |
Service |
Total Fees |
Retained |
|
Class A |
-% |
.25% |
$ 14,849 |
$ 541 |
|
Class T |
.25% |
.25% |
17,870 |
70 |
|
Class B |
.75% |
.25% |
6,575 |
4,941 |
|
Class C |
.75% |
.25% |
38,152 |
9,096 |
|
|
|
|
$ 77,446 |
$ 14,648 |
Sales Load. FDC may receive a front-end sales charge of up to 5.75% for selling Class A shares and 3.50% for selling Class T shares, some of which is paid to financial intermediaries for selling shares of the Fund. Depending on the holding period, FDC may receive contingent deferred sales charges levied on Class A, Class T, Class B and Class C redemptions. The deferred sales charges range from 5.00% to 1.00% for Class B shares, 1.00% for Class C shares, 1.00% for certain purchases of Class A shares and .25% for certain purchases of Class T shares.
Annual Report
5. Fees and Other Transactions with Affiliates - continued
Sales Load - continued
For the period, sales charge amounts retained by FDC were as follows:
|
|
Retained |
|
Class A |
$ 5,421 |
|
Class T |
2,485 |
|
Class B* |
1,042 |
|
Class C* |
869 |
|
|
$ 9,817 |
* When Class B and Class C shares are initially sold, FDC pays commissions from its own resources to financial intermediaries through which the sales are made.
Transfer Agent Fees. Fidelity Investments Institutional Operations Company, Inc., (FIIOC), an affiliate of FMR, is the transfer, dividend disbursing and shareholder servicing agent for each class of the Fund. FIIOC receives account fees and asset-based fees that vary according to the account size and type of account of the shareholders of the respective classes of the Fund. FIIOC pays for typesetting, printing and mailing of shareholder reports, except proxy statements. For the period, transfer agent fees for each class were as follows:
|
|
Amount |
% of |
|
Class A |
$ 17,802 |
.30 |
|
Class T |
12,230 |
.34 |
|
Class B |
1,983 |
.30 |
|
Class C |
10,279 |
.27 |
|
Telecommunications |
902,150 |
.23 |
|
Institutional Class |
3,314 |
.21 |
|
|
$ 947,758 |
|
Accounting and Security Lending Fees. Fidelity Service Company, Inc. (FSC), an affiliate of FMR, maintains the Fund's accounting records. The accounting fee is based on the level of average net assets for each month. Under a separate contract, FSC administers the security lending program. The security lending fee is based on the number and duration of lending transactions.
Brokerage Commissions. The Fund placed a portion of its portfolio transactions with brokerage firms which are affiliates of the investment adviser. The commissions paid to these affiliated firms were $17,997 for the period.
6. Committed Line of Credit.
The Fund participates with other funds managed by FMR or an affiliate in a $4.25 billion credit facility (the "line of credit") to be utilized for temporary or emergency purposes to fund shareholder redemptions or for other short-term liquidity purposes. The Fund has agreed to pay commitment fees on its pro-rata portion of the line of credit, which amounted to $1,031 and is reflected in Miscellaneous expenses on the Statement of Operations. During the period, there were no borrowings on this line of credit.
7. Security Lending.
The Fund lends portfolio securities through a lending agent from time to time in order to earn additional income. For equity securities, a lending agent is used and may loan securities to certain qualified borrowers, including Fidelity Capital Markets (FCM), a broker-dealer affiliated with the Fund. On the settlement date of the loan, the Fund receives collateral (in the form of U.S. Treasury obligations, letters of credit and/or cash) against the loaned securities and maintains collateral in an amount not less than 100% of the market value of the loaned securities during the period of the loan. The market value of the loaned securities is determined at the close of business of the Fund and any additional required collateral is delivered to the Fund on the next business day. If the borrower defaults on its obligation to return the securities loaned because of insolvency or other reasons, a fund could experience delays and costs in recovering the securities loaned or in gaining access to the collateral. Any cash collateral received is invested in the Fidelity Securities Lending Cash Central Fund. The value of loaned securities and cash collateral at period end are disclosed on the Fund's Statement of Assets and Liabilities. The value of securities loaned to FCM at period end was $2,380,500. Security lending income represents the income earned on investing cash collateral, less rebates paid to borrowers and any lending agent fees associated with the loan, plus any premium payments received for
Annual Report
Notes to Financial Statements - continued
7. Security Lending - continued
lending certain types of securities. Security lending income is presented in the Statement of Operations as a component of income from Fidelity Central Funds. Total security lending income during the period amounted to $316,632, including $55,252 from securities loaned to FCM.
8. Expense Reductions.
Many of the brokers with whom FMR places trades on behalf of the Fund provided services to the Fund in addition to trade execution. These services included payments of certain expenses on behalf of the Fund totaling $60,763 for the period.
In addition, FMR reimbursed a portion of the Fund's operating expenses during the period in the amount of $350.
9. Distributions to Shareholders.
Distributions to shareholders of each class were as follows:
|
|
Year ended February 28, 2013 |
Year ended February 29, 2012 |
|
From net investment income |
|
|
|
Class A |
$ 115,461 |
$ 54,285 |
|
Class T |
65,641 |
24,009 |
|
Class B |
6,964 |
2,206 |
|
Class C |
43,780 |
19,099 |
|
Telecommunications |
8,113,006 |
4,833,836 |
|
Institutional Class |
56,226 |
21,784 |
|
Total |
$ 8,401,078 |
$ 4,955,219 |
10. Share Transactions.
Transactions for each class of shares were as follows:
|
|
Shares |
Dollars |
||
|
|
Year ended |
Year ended |
Year ended |
Year ended |
|
Class A |
|
|
|
|
|
Shares sold |
76,572 |
70,128 |
$ 3,760,739 |
$ 3,321,351 |
|
Reinvestment of distributions |
1,839 |
1,116 |
92,540 |
47,447 |
|
Shares redeemed |
(54,776) |
(61,569) |
(2,738,397) |
(2,787,444) |
|
Net increase (decrease) |
23,635 |
9,675 |
$ 1,114,882 |
$ 581,354 |
|
Class T |
|
|
|
|
|
Shares sold |
48,620 |
24,101 |
$ 2,392,044 |
$ 1,100,865 |
|
Reinvestment of distributions |
1,268 |
557 |
63,823 |
23,555 |
|
Shares redeemed |
(26,195) |
(27,493) |
(1,317,712) |
(1,235,915) |
|
Net increase (decrease) |
23,693 |
(2,835) |
$ 1,138,155 |
$ (111,495) |
|
Class B |
|
|
|
|
|
Shares sold |
3,053 |
1,659 |
$ 144,445 |
$ 77,673 |
|
Reinvestment of distributions |
133 |
46 |
6,751 |
1,965 |
|
Shares redeemed |
(4,941) |
(3,832) |
(248,673) |
(176,016) |
|
Net increase (decrease) |
(1,755) |
(2,127) |
$ (97,477) |
$ (96,378) |
|
Class C |
|
|
|
|
|
Shares sold |
26,248 |
30,950 |
$ 1,304,972 |
$ 1,412,876 |
|
Reinvestment of distributions |
594 |
313 |
29,972 |
13,236 |
|
Shares redeemed |
(18,620) |
(19,633) |
(912,596) |
(879,199) |
|
Net increase (decrease) |
8,222 |
11,630 |
$ 422,348 |
$ 546,913 |
|
Telecommunications |
|
|
|
|
|
Shares sold |
3,283,802 |
3,856,487 |
$ 158,174,294 |
$ 180,498,933 |
|
Reinvestment of distributions |
156,090 |
108,713 |
7,859,416 |
4,652,114 |
|
Shares redeemed |
(3,538,446) |
(4,106,690) |
(177,183,415) |
(188,141,891) |
|
Net increase (decrease) |
(98,554) |
(141,490) |
$ (11,149,705) |
$ (2,990,844) |
Annual Report
10. Share Transactions - continued
|
|
Shares |
Dollars |
||
|
|
Year ended |
Year ended |
Year ended |
Year ended |
|
Institutional Class |
|
|
|
|
|
Shares sold |
41,031 |
107,857 |
$ 2,107,286 |
$ 5,158,491 |
|
Reinvestment of distributions |
986 |
401 |
49,926 |
17,134 |
|
Shares redeemed |
(13,014) |
(123,190) |
(646,240) |
(5,562,790) |
|
Net increase (decrease) |
29,003 |
(14,932) |
$ 1,510,972 |
$ (387,165) |
11. Other.
The Fund's organizational documents provide former and current trustees and officers with a limited indemnification against liabilities arising in connection with the performance of their duties to the Fund. In the normal course of business, the Fund may also enter into contracts that provide general indemnifications. The Fund's maximum exposure under these arrangements is unknown as this would be dependent on future claims that may be made against the Fund. The risk of material loss from such claims is considered remote.
At the end of the period, Fidelity VIP FundsManager 60% Portfolio was the owner of record of approximately 20% of the total outstanding shares of the Fund. Mutual funds managed by FMR or its affiliates were the owners of record, in the aggregate, of approximately 32% of the total outstanding shares of the Fund.
Annual Report
Report of Independent Registered Public Accounting Firm
To the Trustees of Fidelity Select Portfolios and the Shareholders of Consumer Staples Portfolio, Gold Portfolio, Materials Portfolio and Telecommunications Portfolio:
In our opinion, the accompanying statements of assets and liabilities (consolidated statement of assets and liabilities for Gold Portfolio), including the schedules of investments (consolidated schedule of investments for Gold Portfolio), and the related statements of operations (consolidated statement of operations for Gold Portfolio) and of changes in net assets (consolidated changes in net assets for Gold Portfolio) and the financial highlights present fairly, in all material respects, the financial position of Consumer Staples Portfolio, Gold Portfolio, Materials Portfolio and Telecommunications Portfolio(funds of Fidelity Select Portfolios) at February 28, 2013, the results of each of their operations for the year then ended, the changes in each of their net assets for the two years in the period then ended and each of their financial highlights for the five years in the period then ended, in conformity with accounting principles generally accepted in the United States of America. These financial statements and financial highlights (hereafter referred to as "financial statements") are the responsibility of the Fidelity Select Portfolios' management. Our responsibility is to express an opinion on these financial statements based on our audits. We conducted our audits of these financial statements in accordance with the standards of the Public Company Accounting Oversight Board (United States). Those standards require that we plan and perform the audit to obtain reasonable assurance about whether the financial statements are free of material misstatement. An audit includes examining, on a test basis, evidence supporting the amounts and disclosures in the financial statements, assessing the accounting principles used and significant estimates made by management, and evaluating the overall financial statement presentation. We believe that our audits, which included confirmation of securities at February 28, 2013 by correspondence with the custodian and brokers, provide a reasonable basis for our opinion.
PricewaterhouseCoopers LLP
Boston, Massachusetts
April 18, 2013
Annual Report
Trustees and Officers
The Trustees, Members of the Advisory Board, and executive officers of the trust and funds, as applicable, are listed below. The Board of Trustees governs each fund and is responsible for protecting the interests of shareholders. The Trustees are experienced executives who meet periodically throughout the year to oversee each fund's activities, review contractual arrangements with companies that provide services to each fund, oversee management of the risks associated with such activities and contractual arrangements, and review each fund's performance. Except for James C. Curvey, each of the Trustees oversees 234 Fidelity funds. Mr. Curvey oversees 453 Fidelity funds.
The Trustees hold office without limit in time except that (a) any Trustee may resign; (b) any Trustee may be removed by written instrument, signed by at least two-thirds of the number of Trustees prior to such removal; (c) any Trustee who requests to be retired or who has become incapacitated by illness or injury may be retired by written instrument signed by a majority of the other Trustees; and (d) any Trustee may be removed at any special meeting of shareholders by a two-thirds vote of the outstanding voting securities of the trust. Each Trustee who is not an interested person of the trust and the funds (as defined in the 1940 Act) (Independent Trustee), shall retire not later than the last day of the calendar year in which his or her 75th birthday occurs. The Independent Trustees may waive this mandatory retirement age policy with respect to individual Trustees. The executive officers and Advisory Board Members hold office without limit in time, except that any officer and Advisory Board Member may resign or may be removed by a vote of a majority of the Trustees at any regular meeting or any special meeting of the Trustees. Except as indicated, each individual has held the office shown or other offices in the same company for the past five years.
Experience, Skills, Attributes, and Qualifications of the Funds' Trustees. The Governance and Nominating Committee has adopted a statement of policy that describes the experience, qualifications, attributes, and skills that are necessary and desirable for potential Independent Trustee candidates (Statement of Policy). The Board believes that each Trustee satisfied at the time he or she was initially elected or appointed a Trustee, and continues to satisfy, the standards contemplated by the Statement of Policy. The Governance and Nominating Committee also engages professional search firms to help identify potential Independent Trustee candidates who have the experience, qualifications, attributes, and skills consistent with the Statement of Policy. From time to time, additional criteria based on the composition and skills of the current Independent Trustees, as well as experience or skills that may be appropriate in light of future changes to board composition, business conditions, and regulatory or other developments, have also been considered by the professional search firms and the Governance and Nominating Committee. In addition, the Board takes into account the Trustees' commitment and participation in Board and committee meetings, as well as their leadership of standing and ad hoc committees throughout their tenure.
In determining that a particular Trustee was and continues to be qualified to serve as a Trustee, the Board has considered a variety of criteria, none of which, in isolation, was controlling. The Board believes that, collectively, the Trustees have balanced and diverse experience, qualifications, attributes, and skills, which allow the Board to operate effectively in governing each fund and protecting the interests of shareholders. Information about the specific experience, skills, attributes, and qualifications of each Trustee, which in each case led to the Board's conclusion that the Trustee should serve (or continue to serve) as a trustee of the funds, is provided below.
Board Structure and Oversight Function. James C. Curvey is an interested person (as defined in the 1940 Act) and currently serves as Chairman. The Trustees have determined that an interested Chairman is appropriate and benefits shareholders because an interested Chairman has a personal and professional stake in the quality and continuity of services provided to the funds. Independent Trustees exercise their informed business judgment to appoint an individual of their choosing to serve as Chairman, regardless of whether the Trustee happens to be independent or a member of management. The Independent Trustees have determined that they can act independently and effectively without having an Independent Trustee serve as Chairman and that a key structural component for assuring that they are in a position to do so is for the Independent Trustees to constitute a substantial majority for the Board. The Independent Trustees also regularly meet in executive session. Ned C. Lautenbach serves as Chairman of the Independent Trustees and as such (i) acts as a liaison between the Independent Trustees and management with respect to matters important to the Independent Trustees and (ii) with management prepares agendas for Board meetings.
Fidelity funds are overseen by different Boards of Trustees. The funds' Board oversees Fidelity's equity and high income funds and another Board oversees Fidelity's investment-grade bond, money market, and asset allocation funds. The asset allocation funds may invest in Fidelity funds overseen by the funds' Board. The use of separate Boards, each with its own committee structure, allows the Trustees of each group of Fidelity funds to focus on the unique issues of the funds they oversee, including common research, investment, and operational issues. On occasion, the separate Boards establish joint committees to address issues of overlapping consequences for the Fidelity funds overseen by each Board.
The Trustees operate using a system of committees to facilitate the timely and efficient consideration of all matters of importance to the Trustees, each fund, and fund shareholders and to facilitate compliance with legal and regulatory requirements and oversight of the funds' activities and associated risks. The Board, acting through its committees, has charged FMR and its affiliates with (i) identifying events or circumstances the occurrence of which could have demonstrably adverse effects on the funds' business and/or reputation; (ii) implementing processes and controls to lessen the possibility that such events or circumstances occur or to mitigate the effects of such events or circumstances if they do occur; and (iii) creating and maintaining a system designed to evaluate continuously business and market conditions in order to facilitate the identification and implementation processes described in (i) and (ii) above. Because the day-to-day operations and activities of the funds are carried out by or through FMR, its affiliates and other service providers, the funds' exposure to risks is mitigated but not eliminated by the processes overseen by the Trustees. While each of the Board's committees has responsibility for overseeing different aspects of the funds' activities, oversight is exercised primarily through the Operations, Audit, and Compliance Committees. In addition, the Independent Trustees have worked with FMR to enhance the Board's oversight of investment and financial risks, legal and regulatory risks, technology risks, and operational risks, including the development of additional risk reporting to the Board. For example, a working group comprised of Independent Trustees and FMR has worked and continues to work to review the Fidelity funds' valuation-related activities, reporting and risk management. Appropriate personnel, including but not limited to the funds' Chief Compliance Officer (CCO), FMR's internal auditor, the independent accountants, the funds' Treasurer and portfolio management personnel, make periodic reports to the Board's committees, as appropriate, including an annual review of FMR's risk management program for the Fidelity funds. The responsibilities of each standing committee, including their oversight responsibilities, are described further under "Standing Committees of the Funds' Trustees."
Annual Report
Trustees and Officers - continued
The fund's Statement of Additional Information (SAI) includes more information about the Trustees. To request a free copy, call Fidelity at 1-877-208-0098.
Interested Trustees*:
Correspondence intended for each Trustee who is an interested person may be sent to Fidelity Investments, 245 Summer Street, Boston, Massachusetts 02210.
|
Name, Year of Birth; Principal Occupations and Other Relevant Experience+ |
|
|
James C. Curvey (1935) |
|
|
|
Year of Election or Appointment: 2007 Mr. Curvey is Trustee and Chairman of the Board of Trustees of certain Trusts. Mr. Curvey also serves as Trustee (2007-present) of other investment companies advised by FMR. Mr. Curvey is a Director of Fidelity Investments Money Management, Inc. (2009-present), Director of Fidelity Research & Analysis Co. (2009-present) and Director of FMR and FMR Co., Inc. (2007-present). Mr. Curvey is also Vice Chairman (2007-present) and Director of FMR LLC. In addition, Mr. Curvey serves as an Overseer for the Boston Symphony Orchestra and a member of the Trustees of Villanova University. Previously, Mr. Curvey was the Vice Chairman (2006-2007) and Director (2000-2007) of FMR Corp. |
|
Ronald P. O'Hanley (1957) |
|
|
|
Year of Election or Appointment: 2011 Mr. O'Hanley is Director of FMR Co., Inc. (2010-present), Director of Fidelity Investments Money Management, Inc. (2010-present), Director of Fidelity Research & Analysis Company (2010-present), President of Fidelity Asset Management and Corporate Services and a member of Fidelity's Executive Committee (2010-present). Previously, Mr. O'Hanley served as President and Chief Executive Officer of BNY Mellon Asset Management (2007-2010). Mr. O'Hanley also served as Vice Chairman of Bank New York Mellon Corp. and a member of that firm's Executive Committee. Prior to the 2007 merger of The Bank of New York and Mellon Financial Corporation, he was Vice Chairman of Mellon Financial Corporation and President and Chief Executive Officer of Mellon Asset Management. He joined Mellon in February 1997. Mr. O'Hanley currently serves as Chairman of the Boston Public Library Foundation Board of Directors and sits on the Board of Directors of Beth Israel Deaconess Medical Center, the Board of Trustees of the Marine Biological Laboratory and the Advisory Board of the Maxwell School of Citizenship and Public Administration at Syracuse University. Mr. O'Hanley also chairs the Council on Asset Management for the Financial Services Roundtable and is a member of the Board of Directors of Institutional Investor's U.S. Institute. |
* Trustees have been determined to be "Interested Trustees" by virtue of, among other things, their affiliation with the trust or various entities under common control with FMR.
+ The information above includes each Trustee's principal occupation during the last five years and other information relating to the experience, attributes, and skills relevant to each Trustee's qualifications to serve as a Trustee, which led to the conclusion that each Trustee should serve as a Trustee for each fund.
Independent Trustees:
Correspondence intended for each Independent Trustee (that is, the Trustees other than the Interested Trustees) may be sent to Fidelity Investments, P.O. Box 55235, Boston, Massachusetts 02205-5235.
|
Name, Year of Birth; Principal Occupations and Other Relevant Experience+ |
|
|
Dennis J. Dirks (1948) |
|
|
|
Year of Election or Appointment: 2005 Prior to his retirement in May 2003, Mr. Dirks was Chief Operating Officer and a member of the Board of The Depository Trust & Clearing Corporation (DTCC). He also served as President, Chief Operating Officer, and Board member of The Depository Trust Company (DTC) and President and Board member of the National Securities Clearing Corporation (NSCC). In addition, Mr. Dirks served as Chief Executive Officer and Board member of the Government Securities Clearing Corporation, Chief Executive Officer and Board member of the Mortgage-Backed Securities Clearing Corporation, as a Trustee and a member of the Finance Committee of Manhattan College (2005-2008), and as a Trustee and a member of the Finance Committee of AHRC of Nassau County (2006-2008). Mr. Dirks is a member of the Independent Directors Council (IDC) Governing Council (2010-present) and Board of Directors for The Brookville Center for Children's Services, Inc. (2009-present). |
|
Alan J. Lacy (1953) |
|
|
|
Year of Election or Appointment: 2008 Mr. Lacy serves as Senior Adviser (2007-present) of Oak Hill Capital Partners, L.P. (private equity). Mr. Lacy also served as Chief Executive Officer (2000-2005) and Vice Chairman (2005-2006) of Sears Holdings Corporation and Sears, Roebuck and Co. (retail). In addition, Mr. Lacy serves as a member of the Board of Directors of Dave & Buster's Entertainment, Inc. (restaurant and entertainment complexes, 2010-present), Earth Fare, Inc. (retail grocery, 2012-present), The Hillman Companies, Inc. (hardware wholesalers, 2010-present), and Bristol-Myers Squibb Company (global pharmaceuticals, 2008-present). Mr. Lacy is a member of the Board of Trustees of The National Parks Conservation Association (2006-present). Previously, Mr. Lacy served as Chairman of the Board of Trustees of the National Parks Conservation Association (2008-2011) and as a member of the Board of Directors for the Western Union Company (global money transfer, 2006-2011). |
|
Ned C. Lautenbach (1944) |
|
|
|
Year of Election or Appointment: 2000 Mr. Lautenbach is Chairman of the Independent Trustees of the Equity and High Income Funds (2006-present). Mr. Lautenbach currently serves as the Lead Director of the Eaton Corporation Board of Directors (diversified industrial, 1997-present). Mr. Lautenbach is Chairman of the Board of Directors of the Philharmonic Center for the Arts in Naples, Florida (2012-present) and a member of the Council on Foreign Relations (1994-present). Previously, Mr. Lautenbach was a Partner/Advisory Partner at Clayton, Dubilier & Rice, LLC (private equity investment, 1998-2010), as well as a Director of Sony Corporation (2006-2007). |
|
Joseph Mauriello (1944) |
|
|
|
Year of Election or Appointment: 2008 Prior to his retirement in January 2006, Mr. Mauriello served in numerous senior management positions including Deputy Chairman and Chief Operating Officer (2004-2005), and Vice Chairman of Financial Services (2002-2004) of KPMG LLP US (professional services, 1965-2005). Mr. Mauriello currently serves as a member of the Board of Directors of XL Group plc. (global insurance and re-insurance, 2006-present). Previously, Mr. Mauriello served as a Director of the Hamilton Funds of the Bank of New York (2006-2007) and of Arcadia Resources Inc. (health care services and products, 2007-2012). |
|
Robert W. Selander (1950) |
|
|
|
Year of Election or Appointment: 2011 Previously, Mr. Selander served as a Member of the Advisory Board of Fidelity's Equity and High Income Funds (2011), Executive Vice Chairman (2010), Chief Executive Officer (2009-2010), and President and Chief Executive Officer (1997-2009) of Mastercard, Inc. |
|
Cornelia M. Small (1944) |
|
|
|
Year of Election or Appointment: 2005 Ms. Small is a member of the Board of Directors (2009-present) and Chair of the Investment Committee (2010-present) of the Teagle Foundation. Ms. Small also serves on the Investment Committee of the Berkshire Taconic Community Foundation (2008-present). Previously, Ms. Small served as Chairperson (2002-2008) and a member of the Investment Committee and Chairperson (2008-2012) and a member of the Board of Trustees of Smith College. In addition, Ms. Small served as Chief Investment Officer, Director of Global Equity Investments, and a member of the Board of Directors of Scudder, Stevens & Clark and Scudder Kemper Investments. |
|
William S. Stavropoulos (1939) |
|
|
|
Year of Election or Appointment: 2001 Mr. Stavropoulos is Vice Chairman of the Independent Trustees of the Equity and High Income Funds (2006-present). Mr. Stavropoulos serves as President and Founder of the Michigan Baseball Foundation, the Great Lakes Loons (2007-present). Mr. Stavropoulos is Chairman Emeritus of the Board of Directors of The Dow Chemical Company, where he previously served in numerous senior management positions, including President, CEO (1995-2000; 2002-2004), Chairman of the Executive Committee (2000-2006), and as a member of the Board of Directors (1990-2006). Currently, Mr. Stavropoulos is a Director of Univar Inc. (global distributor of commodity and specialty chemicals, Chairman from 2010-May 2012 and Lead Director from May 2012-present), Teradata Corporation (data warehousing and technology solutions, 2008-present), Maersk Inc. (industrial conglomerate), and Tyco International, Ltd. (multinational manufacturing and services, 2007-present), and a member of the Advisory Board for Metalmark Capital LLC (private equity investment, 2005-present). Mr. Stavropoulos is an operating advisor to Clayton, Dubilier & Rice, LLC (private equity investment). In addition, Mr. Stavropoulos is a member of the University of Notre Dame Advisory Council for the College of Science, a Trustee of the Rollin L. Gerstacker Foundation, and a Director of the Naples Philharmonic Center for the Arts. Previously, Mr. Stavropoulos served as a Director of Chemical Financial Corporation (bank holding company, 1993-2012). |
|
David M. Thomas (1949) |
|
|
|
Year of Election or Appointment: 2008 Previously, Mr. Thomas served as Executive Chairman (2005-2006) and Chairman and Chief Executive Officer (2000-2005) of IMS Health, Inc. (pharmaceutical and healthcare information solutions), and a Director of Fortune Brands, Inc. (consumer products, 2000-2011). In addition, Mr. Thomas serves as Non-Executive Chairman of the Board of Directors of Fortune Brands Home and Security (home and security products, 2011-present), and as a member of the Board of Directors of Interpublic Group of Companies, Inc. (marketing communication, 2004-present). |
|
Michael E. Wiley (1950) |
|
|
|
Year of Election or Appointment: 2008 Mr. Wiley also serves as a Director of Asia Pacific Exploration Consolidated (international oil and gas exploration and production, 2008-present). Mr. Wiley serves as a Director of Tesoro Corporation (independent oil refiner and marketer, 2005-present), and a Director of Bill Barrett Corporation (exploration and production, 2005-present). In addition, Mr. Wiley also serves as a Director of Post Oak Bank (privately-held bank, 2004-present). Previously, Mr. Wiley served as a member of the Board of Trustees of the University of Tulsa (2000-2006; 2007-2010), as a Senior Energy Advisor of Katzenbach Partners, LLC (consulting, 2006-2007), as an Advisory Director of Riverstone Holdings (private investment), Chairman, President, and CEO of Baker Hughes, Inc. (oilfield services, 2000-2004), and as Director of Spinnaker Exploration Company (exploration and production, 2001-2005). |
+ The information above includes each Trustee's principal occupation during the last five years and other information relating to the experience, attributes, and skills relevant to each Trustee's qualifications to serve as a Trustee, which led to the conclusion that each Trustee should serve as a Trustee for each fund.
Advisory Board Members and Executive Officers:
Correspondence intended for David A. Rosow and Garnett A. Smith may be sent to Fidelity Investments, P.O. Box 55235, Boston, Massachusetts 02205-5235. Correspondence intended for each executive officer and Peter S. Lynch may be sent to Fidelity Investments, 245 Summer Street, Boston, Massachusetts 02210.
|
Name, Year of Birth; Principal Occupation |
|
|
Peter S. Lynch (1944) |
|
|
|
Year of Election or Appointment: 2003 Member of the Advisory Board of Fidelity's Equity and High Income Funds. Mr. Lynch is Vice Chairman and a Director of FMR and FMR Co., Inc. In addition, Mr. Lynch serves as a Trustee of Boston College and as the Chairman of the Inner-City Scholarship Fund. Previously, Mr. Lynch served on the Special Olympics International Board of Directors (1997-2006). |
|
David A. Rosow (1942) |
|
|
|
Year of Election or Appointment: 2012 Member of the Advisory Board of Fidelity's Equity and High Income Funds. Chairman and Chief Executive Officer of International Golf Group, Inc. (golf course development, 1989-present). Previously, Mr. Rosow served as Chairman and Chief Executive Officer of Rosow & Company, Inc. (private investment company, 1989-2011), a Lead Director of Hudson United Bancorp (2001-2006) and as a Director of TD Banknorth (1996-2006). In addition, Mr. Rosow is a member (2008-present) and President (2009-present) of the Town Council of Palm Beach, Florida. |
|
Garnett A. Smith (1947) |
|
|
|
Year of Election or Appointment: 2012 Member of the Advisory Board of Fidelity's Equity and High Income Funds. Prior to Mr. Smith's retirement, he served as Chairman and Chief Executive Officer of Inbrand Corp. (manufacturer of personal absorbent products, 1990-1997). He also served as President (1986-1990) of Inbrand Corp. Prior to his employment with Inbrand Corp., he was employed by a retail fabric chain and North Carolina National Bank. In addition, Mr. Smith is a board member of the Jackson Hole Land Trust (2009-present). |
|
Kenneth B. Robins (1969) |
|
|
|
Year of Election or Appointment: 2008 President and Treasurer of Fidelity's Equity and High Income Funds. Mr. Robins also serves as President and Treasurer (2010-present) and Assistant Treasurer (2009-present) of other Fidelity funds and is an employee of Fidelity Investments (2004-present). Previously, Mr. Robins served as Deputy Treasurer of the Fidelity funds (2005-2008) and Treasurer and Chief Financial Officer of The North Carolina Capital Management Trust: Cash and Term Portfolios (2006-2008). |
|
Brian B. Hogan (1964) |
|
|
|
Year of Election or Appointment: 2009 Vice President of Equity and High Income Funds. Mr. Hogan also serves as President of FMR's Equity Division (2009-present). Previously, Mr. Hogan served as Senior Vice President, Equity Research of FMR (2006-2009) and as a portfolio manager. |
|
Christopher S. Bartel (1971) |
|
|
|
Year of Election or Appointment: 2009 Vice President of Fidelity's Sector and Real Estate Equity Funds. Mr. Bartel also serves as a Director, President, and Chief Executive Officer of Fidelity Management & Research (Japan) Inc. (2012-present), a Director of Fidelity Management & Research (Hong Kong) (2012-present), and Senior Vice President of Global Equity Research (2010-present). Previously, Mr. Bartel served as Senior Vice President of Equity Research (2009-2010), Managing Director of Research (2006-2009), and an analyst and portfolio manager (2000-2006). |
|
Scott C. Goebel (1968) |
|
|
|
Year of Election or Appointment: 2008 Secretary and Chief Legal Officer (CLO) of the Fidelity funds. Mr. Goebel also serves as Secretary of Fidelity Investments Money Management, Inc. (FIMM) (2010-present) and Fidelity Research and Analysis Company (FRAC) (2010-present); Secretary and CLO of The North Carolina Capital Management Trust: Cash and Term Portfolios (2008-present); General Counsel, Secretary, and Senior Vice President of FMR (2008-present) and FMR Co., Inc. (2008-present); employed by FMR LLC or an affiliate (2001-present); Chief Legal Officer of Fidelity Management & Research (Hong Kong) Limited (2008-present) and Assistant Secretary of Fidelity Management & Research (Japan) Inc. (2008-present), and Fidelity Management & Research (U.K.) Inc. (2008-present). Previously, Mr. Goebel served as Assistant Secretary of FIMM (2008-2010), FRAC (2008-2010), and the Funds (2007-2008) and as Vice President and Secretary of Fidelity Distributors Corporation (FDC) (2005-2007). |
|
William C. Coffey (1969) |
|
|
|
Year of Election or Appointment: 2009 Assistant Secretary of Fidelity's Equity and High Income Funds. Mr. Coffey also serves as Senior Vice President and Deputy General Counsel of FMR LLC (2010-present), and is an employee of Fidelity Investments. Previously, Mr. Coffey served as Vice President and Associate General Counsel of FMR LLC (2005-2009). |
|
Elizabeth Paige Baumann (1968) |
|
|
|
Year of Election or Appointment: 2012 Anti-Money Laundering (AML) Officer of the Fidelity funds. Ms. Baumann also serves as AML Officer of The North Carolina Capital Management Trust: Cash and Term Portfolios (2012-present), Chief AML Officer of FMR LLC (2012-present), and is an employee of Fidelity Investments. Previously, Ms. Baumann served as Vice President and Deputy Anti-Money Laundering Officer (2007-2012). |
|
Christine Reynolds (1958) |
|
|
|
Year of Election or Appointment: 2008 Chief Financial Officer of the Fidelity funds. Ms. Reynolds became President of Fidelity Pricing and Cash Management Services (FPCMS) in August 2008. Ms. Reynolds served as Chief Operating Officer of FPCMS (2007-2008). Previously, Ms. Reynolds served as President, Treasurer, and Anti-Money Laundering officer of the Fidelity funds (2004-2007). |
|
Joseph A. Hanlon (1968) |
|
|
|
Year of Election or Appointment: 2012 Chief Compliance Officer of Fidelity's Equity and High Income Funds. Mr. Hanlon serves as Compliance Officer of FMR, FMR Co., Inc., Fidelity Investments Money Management, Inc. (FIMM), Fidelity Research and Analysis Company (FRAC), Fidelity Management & Research (Japan) Inc., Fidelity Management & Research (U.K.) Inc., Fidelity Management & Research (Hong Kong), and Strategic Advisers, Inc. (2009-present), as Senior Vice President of the Fidelity Asset Management Division (2009-present), and is an employee of Fidelity Investments. |
|
Joseph F. Zambello (1957) |
|
|
|
Year of Election or Appointment: 2011 Deputy Treasurer of the Fidelity funds. Mr. Zambello is an employee of Fidelity Investments. Previously, Mr. Zambello served as Vice President of FMR's Program Management Group (2009-2011) and Vice President of the Transfer Agent Oversight Group (2005-2009). |
|
Adrien E. Deberghes (1967) |
|
|
|
Year of Election or Appointment: 2008 Deputy Treasurer of Fidelity's Equity and High Income Funds. Mr. Deberghes also serves as Vice President (2011-present) and Assistant Treasurer (2010-present) of other Fidelity funds, and is an employee of Fidelity Investments (2008-present). Previously, Mr. Deberghes served as Senior Vice President of Mutual Fund Administration at State Street Corporation (2007-2008), Senior Director of Mutual Fund Administration at Investors Bank & Trust (2005-2007), and Director of Finance for Dunkin' Brands (2000-2005). |
|
Stephen Sadoski (1971) |
|
|
|
Year of Election or Appointment: 2012 Deputy Treasurer of Fidelity's Equity and High Income Funds. Mr. Sadoski also serves as Deputy Treasurer of other Fidelity funds (2013-present) and is an employee of Fidelity Investments (2012-present). Previously, Mr. Sadoski served as Assistant Treasurer of Fidelity's Fixed Income and Asset Allocation Funds (2012-2013), an assistant chief accountant in the Division of Investment Management of the Securities and Exchange Commission (SEC) (2009-2012) and as a senior manager at Deloitte & Touche (1997-2009). |
|
Stacie Smith (1974) |
|
|
|
Year of Election or Appointment: 2013 Deputy Treasurer of Fidelity's Equity and High Income Funds. Ms. Smith is an employee of Fidelity Investments (2009-present). Previously, Ms. Smith served as Senior Audit Manager of Ernst & Young LLP (1996-2009). |
|
Stephanie J. Dorsey (1969) |
|
|
|
Year of Election or Appointment: 2010 Assistant Treasurer of Fidelity's Equity and High Income Funds. Ms. Dorsey also serves as President and Treasurer (2013-present) and Assistant Treasurer (2012-present) of other Fidelity funds and is an employee of Fidelity Investments (2008-present). Previously, Ms. Dorsey served as Deputy Treasurer of Fidelity's Fixed Income and Asset Allocation Funds (2008-2013), Treasurer (2004-2008) of the JPMorgan Mutual Funds and Vice President (2004-2008) of JPMorgan Chase Bank. |
|
John R. Hebble (1958) |
|
|
|
Year of Election or Appointment: 2009 Assistant Treasurer of Fidelity's Equity and High Income Funds. Mr. Hebble also serves as President (2011-present), Treasurer, and Chief Financial Officer of The North Carolina Capital Management Trust: Cash and Term Portfolios (2008-present) and is an employee of Fidelity Investments. Previously, Mr. Hebble served as President and Treasurer of Fidelity's Fixed Income and Asset Allocation Funds (2008-2013). |
|
Gary W. Ryan (1958) |
|
|
|
Year of Election or Appointment: 2005 Assistant Treasurer of the Fidelity funds. Mr. Ryan is an employee of Fidelity Investments. Previously, Mr. Ryan served as Vice President of Fund Reporting in Fidelity Pricing and Cash Management Services (FPCMS) (1999-2005). |
|
Jonathan Davis (1968) |
|
|
|
Year of Election or Appointment: 2010 Assistant Treasurer of the Fidelity funds. Mr. Davis is also Assistant Treasurer of Fidelity Rutland Square Trust II and Fidelity Commonwealth Trust II. Mr. Davis is an employee of Fidelity Investments. Previously, Mr. Davis served as Vice President and Associate General Counsel of FMR LLC (2003-2010). |
Annual Report
Distributions (Unaudited)
The Board of Trustees of each fund voted to pay to shareholders of record at the opening of business on record date, the following distributions per share derived from capital gains realized from sales of portfolio securities and dividends derived from net investment income:
|
Consumer Staples Portfolio |
Pay Date |
Record Date |
Dividends |
Capital Gains |
|
Institutional Class |
04/15/13 |
04/12/13 |
$0.206 |
$2.121 |
|
Gold Portfolio |
Pay Date |
Record Date |
Dividends |
Capital Gains |
|
Institutional Class |
04/15/13 |
04/12/13 |
$0.000 |
$0.000 |
|
Materials Portfolio |
Pay Date |
Record Date |
Dividends |
Capital Gains |
|
Institutional Class |
04/15/13 |
04/12/13 |
$0.052 |
$0.017 |
|
Telecommunications Portfolio |
Pay Date |
Record Date |
Dividends |
Capital Gains |
|
Institutional Class |
04/15/13 |
04/12/13 |
$0.178 |
$0.000 |
The funds hereby designate as capital gain dividend the amounts noted below for the taxable year ended February 28, 2013, or, if subsequently determined to be different, the net capital gain of such year.
|
Fund |
|
|
Consumer Staples Portfolio |
$81,679,202 |
|
Materials Portfolio |
$25,407,156 |
A percentage of the dividends distributed during the fiscal year for the following funds qualifies for the dividends-received deduction for corporate shareholders:
|
Fund |
April 2012 |
December 2012 |
|
Consumer Staples Portfolio |
|
|
|
Institutional Class |
100% |
100% % |
|
Gold Portfolio |
|
|
|
Institutional Class |
0% |
0% |
|
Materials Portfolio |
|
|
|
Institutional Class |
100% |
100% |
|
Telecommunications Portfolio |
|
|
|
Institutional Class |
100% |
100% |
A percentage of the dividends distributed during the fiscal year for the following funds may be taken into account as a dividend for purposes of the maximum rate under section 1(h)(11) of the Internal Revenue Code.
|
|
April 2012 |
December 2012 |
|
Consumers Staples Portfolio |
|
|
|
Institutional Class |
100% |
|
|
Gold Portfolio |
|
|
|
Institutional Class |
0% |
0% |
|
Materials Portfolio |
|
|
|
Institutional Class |
100% |
100% |
|
Telecommunications Portfolio |
|
|
|
Institutional Class |
100% |
100% |
The fund will notify shareholders in January 2014 of amounts for use in preparing 2013 income tax returns.
Annual Report
Board Approval of Investment Advisory Contracts and Management Fees
Consumer Staples Portfolio
Gold Portfolio
Materials Portfolio
Telecommunications Portfolio
On November 14, 2012, the Board of Trustees, including the Independent Trustees (together, the Board), voted to approve a new management contract (the New Contracts) between each fund and Fidelity SelectCo, LLC (SelectCo) and to submit the New Contracts to shareholders for their approval. If the New Contracts are approved by shareholders, effective August 1, 2013, SelectCo will serve as investment adviser to each fund. The terms of the New Contracts are identical to those of the current management contracts with FMR (the Current Contracts), except with respect to the name of the investment adviser and the dates of execution and the initial two-year term of the contract. The Board, assisted by the advice of fund counsel and Independent Trustees' counsel, considered a broad range of information.
In determining whether to approve the New Contracts for the funds, the Board was aware that shareholders in the funds have a broad range of investment choices available to them, including a wide choice among mutual funds offered by competitors to Fidelity, and that each fund's shareholders, with the opportunity to review and weigh the disclosure provided by the fund in its prospectus and other public disclosures, have chosen to invest in the fund, managed by Fidelity.
Nature, Extent, and Quality of Services Provided. The Board considered the nature, quality, cost and extent of the services to be provided by SelectCo under the New Contracts as well as the nature, quality, cost and extent of the advisory, administrative, distribution and shareholder services performed by the FMR and the sub-advisers, and by affiliated companies. The Board considered that, upon shareholder approval, SelectCo will render the same services to the funds under the New Contracts that FMR currently renders to the funds under the Current Contracts. The Board also considered that the New Contracts would not result in any changes to (i) the investment process or strategies employed in the management of the funds' assets or (ii) the day-to-day management of the funds or the persons primarily responsible for such management.
Throughout the year, the Trustees had discussions with FMR about plans to establish SelectCo as a new investment adviser to manage sector-based funds and products. The Trustees considered Fidelity's rationale for creating a separate investment adviser and noted that a separate investment adviser may be better positioned to focus on opportunities for growth within the sector investing space and to focus on a distinct approach to sector investing and research.
Shareholder and Administrative Services. The Board noted that the growth of fund assets across the complex allows Fidelity to reinvest in the development of services designed to enhance the value or convenience of the Fidelity funds as investment vehicles. These services include 24-hour access to account information and market information through phone representatives and over the Internet, and investor education materials and asset allocation tools.
Investment in a Large Fund Family. The Board considered the benefits to shareholders of investing in a Fidelity fund, including the benefits of investing in a fund that is part of a large family of funds offering a variety of investment disciplines and providing for a large variety of mutual fund shareholder services.
Investment Performance. The Board did not consider performance to be a material factor in its decision to approve the New Contracts because the New Contracts would not result in any changes to the funds' investment processes or strategies or in the persons primarily responsible for the day-to-day management of the funds.
Based on its review, the Board concluded that the nature, extent, and quality of the services provided to each fund will benefit the fund's shareholders, particularly in light of the Board's view that the fund's shareholders benefit from investing in a fund that is part of a large family of funds offering a variety of investment disciplines and services.
Competitiveness of Management Fee and Total Fund Expenses. The Board considered that, if approved by shareholders, the New Contracts would not result in any changes to the amount of the management fees paid by the funds, except that such fees would be paid to SelectCo rather than FMR. The Board noted that at previous meetings during the year it received and considered materials relating to its review of the management fee of each fund. This information includes comparisons that focus on a fund's standing relative to the total universe of comparable funds available to investors in terms of gross management fees before expense reimbursements or caps, as well as a fund's standing relative to non-Fidelity funds similar in size to the fund within the comparison group.
Based on its review, the Board concluded that each fund's management fee was fair and reasonable in light of the services that the fund receives and the other factors considered.
Annual Report
Because there are no expected changes in the funds' management fees under the New Contracts, the Board will review each fund's total expenses compared to competitive fund median expenses in connection with its future consideration of the renewal of the funds' management contracts and sub-advisory agreements.
In its review of total expenses, the Board also noted that at previous meetings during the year it received and considered materials relating to its review of total expenses for each Fidelity fund. This information includes Fidelity fee structures and other information with respect to clients of FMR and its affiliates, such as other mutual funds advised or sub-advised by FMR or its affiliates, pension plan clients, and other institutional clients.
Costs of the Services and Profitability. Because there were no changes to the services to be provided or fees to be charged to the funds under the New Contracts, the Board did not consider data regarding the impact on Fidelity's costs of services, revenues, or profitability from the new arrangements to be a significant factor in its decision.
In connection with its future consideration of the renewal of each fund's management contract and sub-advisory agreements, the Board will consider the revenues earned and the expenses incurred by Fidelity in conducting the business of developing, marketing, distributing, managing, administering and servicing the funds and their shareholders.
Economies of Scale. The Board recognized that the New Contracts, like the Current Contracts, incorporate a "group fee" structure, which provides for lower fee rates as total fund assets under FMR's management increase, and for higher fee rates as total fund assets under FMR's management decrease. The Board considered that the group fee is designed to deliver the benefits of economies of scale to fund shareholders when total fund assets increase, even if assets of any particular fund are unchanged or have declined, because some portion of Fidelity's costs are attributable to services provided to all Fidelity funds, and all funds benefit if those costs can be allocated among more assets. The Board concluded that, given the group fee structure, fund shareholders will achieve a certain level of economies of scale as assets under FMR's management increase at the fund complex level, regardless of whether Fidelity achieves any such economies of scale.
In connection with its future consideration of the renewal of each fund's management contract and sub-advisory agreements, the Board will consider whether there have been economies of scale in respect of the management of the Fidelity funds, whether the Fidelity funds (including the funds) have appropriately benefited from any such economies of scale, and whether there is potential for realization of any further economies of scale.
Based on its evaluation of all of the conclusions noted above, and after considering all material factors, the Board ultimately concluded that each New Contract is fair and reasonable, and that the New Contracts should be approved and submitted to the applicable funds' shareholders for their approval.
Annual Report
Investment Adviser
Fidelity Management & Research Company
Boston, MA
Investment Sub-Advisers
FMR Co., Inc.
Fidelity Management & Research
(U.K.) Inc.
Fidelity Management & Research
(Hong Kong) Limited
Fidelity Management & Research
(Japan) Inc.
General Distributor
Fidelity Distributors Corporation
Smithfield, RI
Transfer and Service Agents
Fidelity Investments Institutional
Operations Company, Inc.
Boston, MA
Fidelity Service Company, Inc.
Boston, MA
Custodian
Brown Brothers Harriman & Co.
Boston, MA
(Fidelity Investment logo)(registered trademark)
Corporate Headquarters
245 Summer St., Boston, MA 02210
www.fidelity.com
ASGMTI-UANN-0413
1.845768.106
Fidelity®
Select Portfolios®
Consumer Staples Sector
Consumer Staples Portfolio
Annual Report
February 28, 2013
(Fidelity Cover Art)
Contents
|
Performance |
How the fund has done over time. |
|
|
Management's Discussion of Fund Performance |
The Portfolio Manager's review of fund performance and strategy. |
|
|
Shareholder Expense Example |
|
|
|
Investment Changes |
|
|
|
Investments |
|
|
|
Financial Statements |
|
|
|
Notes to Financial Statements |
|
|
|
Report of Independent Registered Public Accounting Firm |
|
|
|
Trustees and Officers |
|
|
|
Distributions |
|
|
|
Board Approval of Investment Advisory Contracts and Management Fees |
|
To view a fund's proxy voting guidelines and proxy voting record for the 12-month period ended June 30, visit http://www.fidelity.com/proxyvotingresults or visit the Securities and Exchange Commission's (SEC) web site at http://www.sec.gov. You may also call 1-800-544-8544 to request a free copy of the proxy voting guidelines.
Standard & Poor's, S&P and S&P 500 are registered service marks of The McGraw-Hill Companies, Inc. and have been licensed for use by Fidelity Distributors Corporation.
Other third-party marks appearing herein are the property of their respective owners.
All other marks appearing herein are registered or unregistered trademarks or service marks of FMR LLC or an affiliated company. © 2013 FMR LLC. All rights reserved.
This report and the financial statements contained herein are submitted for the general information of the shareholders of the fund. This report is not authorized for distribution to prospective investors in the fund unless preceded or accompanied by an effective prospectus.
A fund files its complete schedule of portfolio holdings with the SEC for the first and third quarters of each fiscal year on Form N-Q. Forms N-Q are available on the SEC's web site at http://www.sec.gov. A fund's Forms N-Q may be reviewed and copied at the SEC's Public Reference Room in Washington, DC. Information regarding the operation of the SEC's Public Reference Room may be obtained by calling 1-800-SEC-0330. For a complete list of a fund's portfolio holdings, view the most recent holdings listing, semiannual report, or annual report on Fidelity's web site at http://www.fidelity.com, http://www.advisor.fidelity.com, or http://www.401k.com, as applicable.
NOT FDIC INSURED • MAY LOSE VALUE • NO BANK GUARANTEE
Neither the fund nor Fidelity Distributors Corporation is a bank.
Annual Report
Consumer Staples Portfolio
Performance: The Bottom Line
Average annual total return reflects the change in the value of an investment, assuming reinvestment of the class' distributions from dividend income and capital gains (the profits earned upon the sale of securities that have grown in value, if any) and assuming a constant rate of performance each year. The $10,000 table and the fund's returns do not reflect the deduction of taxes that a shareholder would pay on fund distributions or the redemption of fund shares. During periods of reimbursement by Fidelity, a fund's total return will be greater than it would be had the reimbursement not occurred. How a fund did yesterday is no guarantee of how it will do tomorrow.
Average Annual Total Returns
|
Periods ended February 28, 2013 |
Past 1 |
Past 5 |
Past 10 |
|
Consumer Staples Portfolio A |
17.94% |
9.03% |
12.50% |
A Prior to October 1, 2006, Consumer Staples Portfolio operated under certain different investment policies. The historical performance for the fund may not represent its current investment policies.
$10,000 Over 10 Years
Let's say hypothetically that $10,000 was invested in Consumer Staples Portfolio, a class of the fund, on February 28, 2003. The chart shows how the value of your investment would have changed, and also shows how the S&P 500® Index performed over the same period.
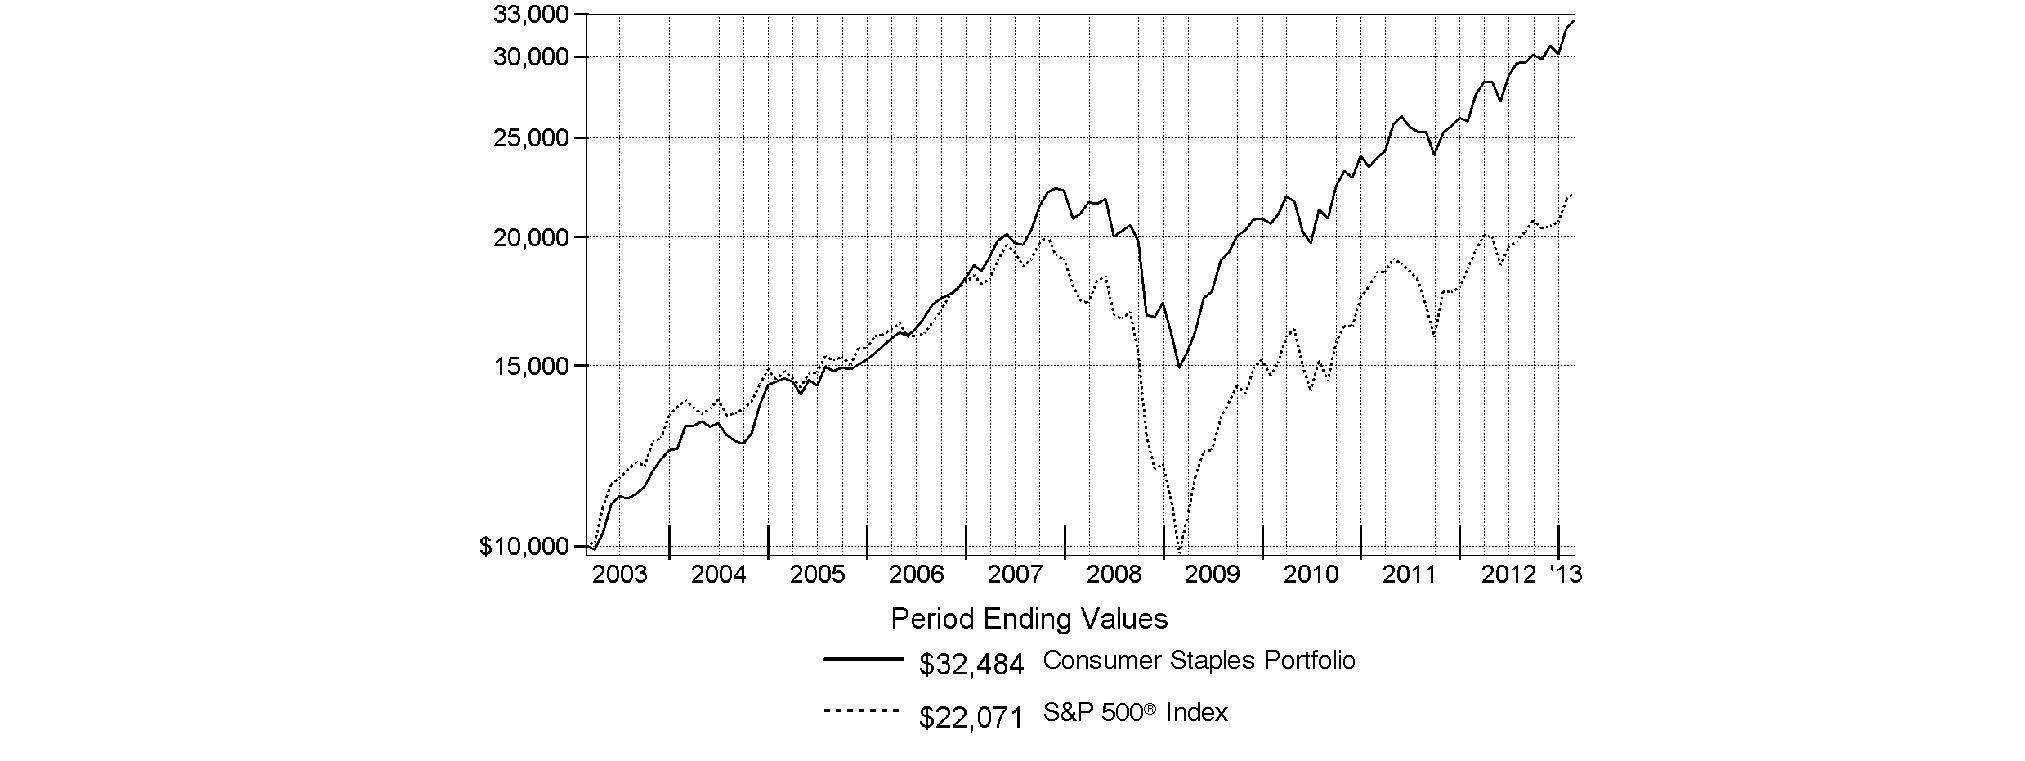
Annual Report
Consumer Staples Portfolio
Management's Discussion of Fund Performance
Market Recap: U.S. stocks posted solid gains for the year ending February 28, 2013, sparked by a late-period rally that pushed major equity benchmarks to multiyear highs. Improvement in the global economy and more monetary stimulus from the U.S. Federal Reserve kept markets on the upswing for much of the year, shrugging off an early decline brought on by debt woes in Europe, and another dip later in the period amid Congressional gridlock on the federal budget. Renewed optimism over employment, the housing market, corporate earnings and record dividends made stocks a favorite with investors during the 12 months, which helped push the broad-based S&P 500® Index across the milestone 1,500 mark at the end of January. The S&P 500® finished the period up 13.46%. Seven of the 10 major market sectors tracked by MSCI U.S. IMI 25-50 classifications produced double-digit gains, led by health care and financials, while information technology, energy and materials trailed the broad equity market with only modest advances.
Comments from Robert Lee, Portfolio Manager of Consumer Staples Portfolio: For the 12 months ending February 28, 2013, the fund's Retail Class shares returned 17.94%, modestly underperforming the 18.07% advance of the MSCI® U.S. IMI Consumer Staples 25-50 Index, but solidly outpacing the S&P 500®. The consumer staples sector outperformed during the period, driven by household products and packaged foods/meats - both groups where the fund had unfavorable positioning. However, the biggest headwind hindering performance was the portfolio's positioning in tobacco, including a very large out-of-index stake in British American Tobacco, which was the fund's biggest individual detractor. Investors became concerned with new efforts by some countries to discourage smoking, and the stock price fell. An underweighting and weak stock picking in packaged foods/meats also hurt, especially not owning H.J. Heinz, a strong-performing index component. Heinz stock got a boost in February when Warren Buffet's Berkshire Hathaway, along with Brazilian private equity group 3G Capital, announced they would acquire the ketchup maker at a premium price. Household products was another group that detracted, including not owning personal paper products manufacturer and index stock Kimberly-Clark, which outperformed the benchmark, and overweighting Procter & Gamble, the fund's single largest position, on average. In other areas, underweighting the hypermarkets/super centers area hurt, as did a position in Nu Skin Enterprises, a direct-seller of anti-aging skin care products. Elsewhere, the fund's cash position detracted, as did currency fluctuations. Since consumer staples companies tend to conduct business in many countries, exchange rate movements during the period impacted most stocks in the sector, including many held by the fund. On the positive side, positioning in distillers/vintners and stock picking in brewers buoyed the fund's relative return. In the first category, global wine and spirits distributor Constellation Brands - which was sold prior to period end - was the fund's top individual contributor. Global brewer Anheuser-Busch InBev - a non-index name also among the fund's top relative contributors - announced in June it would acquire the 50% of Mexican brewer Grupo Modelo that it didn't already own. As part of the deal, Anheuser-Busch allowed Constellation to take full control of the joint venture it had with the Mexican brewer for the U.S. distribution rights to Corona, Modelo's premium beer brand, which lifted Constellation's stock. A non-index position in British global spirits producer Diageo also helped here. Elsewhere, an underweighting in nutritional and weight management direct-seller Herbalife helped, as the stock took a big hit late in 2012 when a prominent investor suggested the company was a pyramid scheme, rather then a sustainable business enterprise. In the tobacco group, there were a few offsets to British American Tobacco, including an underweighting in Philip Morris International.
The views expressed above reflect those of the portfolio manager(s) only through the end of the period as stated on the cover of this report and do not necessarily represent the views of Fidelity or any other person in the Fidelity organization. Any such views are subject to change at any time based upon market or other conditions and Fidelity disclaims any responsibility to update such views. These views may not be relied on as investment advice and, because investment decisions for a Fidelity fund are based on numerous factors, may not be relied on as an indication of trading intent on behalf of any Fidelity fund.
Annual Report
Consumer Staples Portfolio
Shareholder Expense Example
As a shareholder of the Fund, you incur two types of costs: (1) transaction costs, including sales charges (loads) on purchase payments or redemption proceeds, redemption fees and (2) ongoing costs, including management fees, distribution and/or service (12b-1) fees and other Fund expenses. This Example is intended to help you understand your ongoing costs (in dollars) of investing in the Fund and to compare these costs with the ongoing costs of investing in other mutual funds.
The Example is based on an investment of $1,000 invested at the beginning of the period and held for the entire period (September 1, 2012 to February 28, 2013).
Actual Expenses
The first line of the accompanying table for each class of the Fund provides information about actual account values and actual expenses. You may use the information in this line, together with the amount you invested, to estimate the expenses that you paid over the period. Simply divide your account value by $1,000.00 (for example, an $8,600 account value divided by $1,000.00 = 8.6), then multiply the result by the number in the first line for a class of the Fund under the heading entitled "Expenses Paid During Period" to estimate the expenses you paid on your account during this period. A small balance maintenance fee of $12.00 that is charged once a year may apply for certain accounts with a value of less than $2,000. This fee is not included in the table below. If it was, the estimate of expenses you paid during the period would be higher, and your ending account value lower, by this amount. In addition, the Fund, as a shareholder in the underlying Fidelity Central Funds, will indirectly bear its pro-rata share of the fees and expenses incurred by the underlying Fidelity Central Funds. These fees and expenses are not included in the Fund's annualized expense ratio used to calculate the expense estimate in the table below.
Hypothetical Example for Comparison Purposes
The second line of the accompanying table for each class of the Fund provides information about hypothetical account values and hypothetical expenses based on a Class' actual expense ratio and an assumed rate of return of 5% per year before expenses, which is not the Class' actual return. The hypothetical account values and expenses may not be used to estimate the actual ending account balance or expenses you paid for the period. You may use this information to compare the ongoing costs of investing in the Fund and other funds. To do so, compare this 5% hypothetical example with the 5% hypothetical examples that appear in the shareholder reports of the other funds. A small balance maintenance fee of $12.00 that is charged once a year may apply for certain accounts with a value of less than $2,000. This fee is not included in the table below. If it was, the estimate of expenses you paid during the period would be higher, and your ending account value lower, by this amount. In addition, the Fund, as a shareholder in the underlying Fidelity Central Funds, will indirectly bear its pro-rata share of the fees and expenses incurred by the underlying Fidelity Central Funds. These fees and expenses are not included in the Fund's annualized expense ratio used to calculate the expense estimate in the table below.
Please note that the expenses shown in the table are meant to highlight your ongoing costs only and do not reflect any transaction costs. Therefore, the second line of the table is useful in comparing ongoing costs only, and will not help you determine the relative total costs of owning different funds. In addition, if these transactional costs were included, your costs would have been higher.
|
|
Annualized |
Beginning |
Ending |
Expenses Paid |
|
Class A |
1.08% |
|
|
|
|
Actual |
|
$ 1,000.00 |
$ 1,096.50 |
$ 5.61 |
|
HypotheticalA |
|
$ 1,000.00 |
$ 1,019.44 |
$ 5.41 |
|
Class T |
1.35% |
|
|
|
|
Actual |
|
$ 1,000.00 |
$ 1,095.00 |
$ 7.01 |
|
HypotheticalA |
|
$ 1,000.00 |
$ 1,018.10 |
$ 6.76 |
|
Class B |
1.88% |
|
|
|
|
Actual |
|
$ 1,000.00 |
$ 1,092.30 |
$ 9.75 |
|
HypotheticalA |
|
$ 1,000.00 |
$ 1,015.47 |
$ 9.39 |
|
Class C |
1.82% |
|
|
|
|
Actual |
|
$ 1,000.00 |
$ 1,092.40 |
$ 9.44 |
|
HypotheticalA |
|
$ 1,000.00 |
$ 1,015.77 |
$ 9.10 |
|
Consumer Staples |
.81% |
|
|
|
|
Actual |
|
$ 1,000.00 |
$ 1,098.10 |
$ 4.21 |
|
HypotheticalA |
|
$ 1,000.00 |
$ 1,020.78 |
$ 4.06 |
|
Institutional Class |
.85% |
|
|
|
|
Actual |
|
$ 1,000.00 |
$ 1,097.80 |
$ 4.42 |
|
HypotheticalA |
|
$ 1,000.00 |
$ 1,020.58 |
$ 4.26 |
A 5% return per year before expenses
* Expenses are equal to each Class' annualized expense ratio, multiplied by the average account value over the period, multiplied by 181/365 (to reflect the one-half year period).
Annual Report
Consumer Staples Portfolio
Investment Changes (Unaudited)
|
Top Ten Stocks as of February 28, 2013 |
||
|
|
% of fund's |
% of fund's net assets |
|
British American Tobacco PLC sponsored ADR |
13.9 |
13.8 |
|
Procter & Gamble Co. |
13.1 |
14.9 |
|
The Coca-Cola Co. |
11.7 |
10.8 |
|
CVS Caremark Corp. |
7.3 |
7.1 |
|
Altria Group, Inc. |
4.8 |
4.5 |
|
Colgate-Palmolive Co. |
3.0 |
2.9 |
|
Wal-Mart Stores, Inc. |
2.9 |
2.0 |
|
Philip Morris International, Inc. |
2.5 |
2.4 |
|
Diageo PLC sponsored ADR |
2.5 |
3.1 |
|
Bunge Ltd. |
2.2 |
2.1 |
|
|
63.9 |
|
|
Top Industries (% of fund's net assets) |
|||
|
As of February 28, 2013 |
|||
|
Beverages |
25.4% |
|
|
Tobacco |
22.7% |
|
|
Household Products |
16.1% |
|
|
Food & Staples Retailing |
15.1% |
|
|
Food Products |
10.7% |
|
|
All Others* |
10.0% |
|

|
As of August 31, 2012 |
|||
|
Beverages |
28.9% |
|
|
Tobacco |
21.6% |
|
|
Household Products |
18.4% |
|
|
Food & Staples Retailing |
12.4% |
|
|
Food Products |
9.4% |
|
|
All Others* |
9.3% |
|

|
* Includes short-term investments and net other assets. |
Annual Report
Consumer Staples Portfolio
Investments February 28, 2013
Showing Percentage of Net Assets
|
Common Stocks - 94.4% |
|||
|
Shares |
Value |
||
|
BEVERAGES - 25.4% |
|||
|
Brewers - 4.3% |
|||
|
Anheuser-Busch InBev SA NV |
518,028 |
$ 48,546,936 |
|
|
Companhia de Bebidas das Americas (AmBev) (PN) sponsored ADR |
246,385 |
10,934,566 |
|
|
Compania Cervecerias Unidas SA sponsored ADR |
174,000 |
5,688,060 |
|
|
SABMiller PLC |
651,700 |
32,398,437 |
|
|
|
97,567,999 |
||
|
Distillers & Vintners - 5.9% |
|||
|
Diageo PLC sponsored ADR |
472,177 |
56,524,309 |
|
|
Pernod Ricard SA |
351,601 |
45,623,258 |
|
|
Remy Cointreau SA |
260,060 |
32,865,665 |
|
|
|
135,013,232 |
||
|
Soft Drinks - 15.2% |
|||
|
Coca-Cola Bottling Co. CONSOLIDATED |
92,245 |
6,035,590 |
|
|
Coca-Cola FEMSA SAB de CV sponsored ADR (d) |
34,829 |
5,873,563 |
|
|
Coca-Cola Hellenic Bottling Co. SA sponsored ADR |
78,006 |
2,105,382 |
|
|
Coca-Cola Icecek A/S |
363,162 |
8,580,140 |
|
|
Embotelladora Andina SA: |
|
|
|
|
ADR |
43,689 |
1,438,242 |
|
|
sponsored ADR (d) |
241,600 |
10,110,960 |
|
|
Fomento Economico Mexicano S.A.B. de CV sponsored ADR |
51,187 |
5,719,635 |
|
|
PepsiCo, Inc. |
528,471 |
40,042,248 |
|
|
The Coca-Cola Co. |
6,925,452 |
268,153,501 |
|
|
|
348,059,261 |
||
|
TOTAL BEVERAGES |
580,640,492 |
||
|
FOOD & STAPLES RETAILING - 15.1% |
|||
|
Drug Retail - 9.1% |
|||
|
CVS Caremark Corp. |
3,263,883 |
166,849,699 |
|
|
Drogasil SA |
516,400 |
5,953,444 |
|
|
Walgreen Co. |
856,660 |
35,071,660 |
|
|
|
207,874,803 |
||
|
Food Distributors - 0.2% |
|||
|
Chefs' Warehouse Holdings (a) |
230,800 |
4,154,400 |
|
|
Food Retail - 2.9% |
|||
|
Fresh Market, Inc. (a) |
120,828 |
5,633,001 |
|
|
Kroger Co. |
1,746,368 |
51,011,409 |
|
|
Susser Holdings Corp. (a) |
67,400 |
2,984,472 |
|
|
The Pantry, Inc. (a) |
473,635 |
5,892,019 |
|
|
|
65,520,901 |
||
|
Hypermarkets & Super Centers - 2.9% |
|||
|
Wal-Mart Stores, Inc. |
946,186 |
66,971,045 |
|
|
TOTAL FOOD & STAPLES RETAILING |
344,521,149 |
||
|
|
|||
|
Shares |
Value |
||
|
FOOD PRODUCTS - 10.7% |
|||
|
Agricultural Products - 3.3% |
|||
|
Archer Daniels Midland Co. |
618,163 |
$ 19,694,673 |
|
|
Bunge Ltd. |
690,273 |
51,156,132 |
|
|
First Resources Ltd. |
1,413,000 |
2,219,222 |
|
|
SLC Agricola SA |
253,600 |
2,482,958 |
|
|
|
75,552,985 |
||
|
Packaged Foods & Meats - 7.4% |
|||
|
Annie's, Inc. |
133,141 |
5,586,596 |
|
|
Green Mountain Coffee Roasters, Inc. (a) |
290,737 |
13,885,599 |
|
|
Hain Celestial Group, Inc. (a)(d) |
144,901 |
7,933,330 |
|
|
Lindt & Spruengli AG |
141 |
6,016,532 |
|
|
Mead Johnson Nutrition Co. Class A |
582,216 |
43,613,801 |
|
|
Nestle SA |
490,726 |
34,257,861 |
|
|
Orion Corp. |
2,360 |
2,328,767 |
|
|
TreeHouse Foods, Inc. (a) |
116,200 |
6,784,918 |
|
|
Ulker Biskuvi Sanayi A/S |
647,525 |
4,085,615 |
|
|
Unilever NV (NY Reg.) |
1,106,950 |
43,082,494 |
|
|
Want Want China Holdings Ltd. |
1,408,000 |
1,975,223 |
|
|
|
169,550,736 |
||
|
TOTAL FOOD PRODUCTS |
245,103,721 |
||
|
HOUSEHOLD PRODUCTS - 16.1% |
|||
|
Household Products - 16.1% |
|||
|
Colgate-Palmolive Co. |
587,471 |
67,224,307 |
|
|
Procter & Gamble Co. |
3,940,134 |
300,159,408 |
|
|
|
367,383,715 |
||
|
PERSONAL PRODUCTS - 2.4% |
|||
|
Personal Products - 2.4% |
|||
|
Hengan International Group Co. Ltd. |
556,500 |
5,647,087 |
|
|
Herbalife Ltd. |
128,590 |
5,180,891 |
|
|
L'Oreal SA |
197,600 |
29,551,229 |
|
|
Natura Cosmeticos SA |
38,700 |
999,075 |
|
|
Nu Skin Enterprises, Inc. Class A (d) |
311,404 |
12,829,845 |
|
|
|
54,208,127 |
||
|
PHARMACEUTICALS - 2.0% |
|||
|
Pharmaceuticals - 2.0% |
|||
|
Johnson & Johnson |
604,160 |
45,982,618 |
|
|
TOBACCO - 22.7% |
|||
|
Tobacco - 22.7% |
|||
|
Altria Group, Inc. |
3,272,917 |
109,806,365 |
|
|
British American Tobacco PLC sponsored ADR |
3,040,566 |
317,070,226 |
|
|
Imperial Tobacco Group PLC |
90,889 |
3,295,407 |
|
|
ITC Ltd. |
865,740 |
4,694,136 |
|
|
Japan Tobacco, Inc. |
176,200 |
5,560,308 |
|
|
Lorillard, Inc. |
357,233 |
13,767,760 |
|
|
Philip Morris International, Inc. |
618,358 |
56,734,347 |
|
|
Common Stocks - continued |
|||
|
Shares |
Value |
||
|
TOBACCO - CONTINUED |
|||
|
Tobacco - continued |
|||
|
Souza Cruz SA |
548,600 |
$ 8,755,317 |
|
|
Swedish Match Co. AB |
23,600 |
772,873 |
|
|
|
520,456,739 |
||
|
TOTAL COMMON STOCKS (Cost $1,604,527,630) |
|
||
|
Money Market Funds - 6.8% |
|||
|
|
|
|
|
|
Fidelity Cash Central Fund, 0.16% (b) |
135,004,801 |
135,004,801 |
|
|
Fidelity Securities Lending Cash Central Fund, 0.16% (b)(c) |
19,694,623 |
19,694,623 |
|
|
TOTAL MONEY MARKET FUNDS (Cost $154,699,424) |
|
||
|
TOTAL INVESTMENT PORTFOLIO - 101.2% (Cost $1,759,227,054) |
2,312,995,985 |
|
|
NET OTHER ASSETS (LIABILITIES) - (1.2)% |
(26,342,857) |
|
|
NET ASSETS - 100% |
$ 2,286,653,128 |
|
|
Legend |
|
(a) Non-income producing |
|
(b) Affiliated fund that is generally available only to investment companies and other accounts managed by Fidelity Investments. The rate quoted is the annualized seven-day yield of the fund at period end. A complete unaudited listing of the fund's holdings as of its most recent quarter end is available upon request. In addition, each Fidelity Central Fund's financial statements, which are not covered by the Fund's Report of Independent Registered Public Accounting Firm, are available on the SEC's websiteor upon request. |
|
(c) Investment made with cash collateral received from securities on loan. |
|
(d) Security or a portion of the security is on loan at period end. |
|
Affiliated Central Funds |
|
Information regarding fiscal year to date income earned by the Fund from investments in Fidelity Central Funds is as follows: |
|
Fund |
Income earned |
|
Fidelity Cash Central Fund |
$ 120,502 |
|
Fidelity Securities Lending Cash Central Fund |
405,984 |
|
Total |
$ 526,486 |
|
Other Information |
|
The following is a summary of the inputs used, as of February 28, 2013, involving the Fund's assets and liabilities carried at fair value. The inputs or methodology used for valuing securities may not be an indication of the risk associated with investing in those securities. For more information on valuation inputs, and their aggregation into the levels used in the tables below, please refer to the Investment Valuation section in the accompanying Notes to Financial Statements. |
|
Valuation Inputs at Reporting Date: |
||||
|
Description |
Total |
Level 1 |
Level 2 |
Level 3 |
|
Investments in Securities: |
||||
|
Common Stocks |
$ 2,158,296,561 |
$ 2,075,491,764 |
$ 82,804,797 |
$ - |
|
Money Market Funds |
154,699,424 |
154,699,424 |
- |
- |
|
Total Investments in Securities: |
$ 2,312,995,985 |
$ 2,230,191,188 |
$ 82,804,797 |
$ - |
|
The following is a summary of transfers between Level 1 and Level 2 for the period ended February 28, 2013. Transfers are assumed to have occurred at the beginning of the period, and are primarily attributable to the valuation techniques used for foreign equity securities, as discussed in the accompanying Notes to Financial Statements: |
|
Transfers |
Total |
|
Level 1 to Level 2 |
$ 23,412,228 |
|
Level 2 to Level 1 |
$ 0 |
|
Distribution of investments by country or territory of incorporation, as a percentage of total net assets, is as follows. (Unaudited) |
|
United States of America |
64.9% |
|
United Kingdom |
17.9% |
|
France |
4.7% |
|
Bermuda |
2.2% |
|
Belgium |
2.1% |
|
Netherlands |
1.9% |
|
Switzerland |
1.8% |
|
Brazil |
1.3% |
|
Others (Individually Less Than 1%) |
3.2% |
|
|
100.0% |
See accompanying notes which are an integral part of the financial statements.
Annual Report
Consumer Staples Portfolio
Financial Statements
Statement of Assets and Liabilities
|
|
February 28, 2013 |
|
|
|
|
|
|
Assets |
|
|
|
Investment in securities, at value (including securities loaned of $19,706,774) - See accompanying schedule: Unaffiliated issuers (cost $1,604,527,630) |
$ 2,158,296,561 |
|
|
Fidelity Central Funds (cost $154,699,424) |
154,699,424 |
|
|
Total Investments (cost $1,759,227,054) |
|
$ 2,312,995,985 |
|
Receivable for investments sold |
|
1,783,758 |
|
Receivable for fund shares sold |
|
5,431,937 |
|
Dividends receivable |
|
2,627,051 |
|
Distributions receivable from Fidelity Central Funds |
|
24,231 |
|
Prepaid expenses |
|
4,222 |
|
Receivable from investment advisor for expense reductions |
|
5,568 |
|
Other receivables |
|
36,756 |
|
Total assets |
|
2,322,909,508 |
|
|
|
|
|
Liabilities |
|
|
|
Payable for investments purchased |
$ 12,421,277 |
|
|
Payable for fund shares redeemed |
2,355,633 |
|
|
Accrued management fee |
1,047,248 |
|
|
Distribution and service plan fees payable |
204,748 |
|
|
Other affiliated payables |
440,332 |
|
|
Other payables and accrued expenses |
92,519 |
|
|
Collateral on securities loaned, at value |
19,694,623 |
|
|
Total liabilities |
|
36,256,380 |
|
|
|
|
|
Net Assets |
|
$ 2,286,653,128 |
|
Net Assets consist of: |
|
|
|
Paid in capital |
|
$ 1,671,219,940 |
|
Undistributed net investment income |
|
5,461,626 |
|
Accumulated undistributed net realized gain (loss) on investments and foreign currency transactions |
|
56,208,926 |
|
Net unrealized appreciation (depreciation) on investments and assets and liabilities in foreign currencies |
|
553,762,636 |
|
Net Assets |
|
$ 2,286,653,128 |
Statement of Assets and Liabilities - continued
|
|
February 28, 2013 |
|
|
|
|
|
|
Calculation of Maximum Offering Price Class A: |
|
$ 85.67 |
|
|
|
|
|
Maximum offering price per share (100/94.25 of $85.67) |
|
$ 90.90 |
|
Class T: |
|
$ 85.18 |
|
|
|
|
|
Maximum offering price per share (100/96.50 of $85.18) |
|
$ 88.27 |
|
Class B: |
|
$ 84.72 |
|
|
|
|
|
Class C: |
|
$ 84.28 |
|
|
|
|
|
Consumer Staples: |
|
$ 86.17 |
|
|
|
|
|
Institutional Class: |
|
$ 85.92 |
A Redemption price per share is equal to net asset value less any applicable contingent deferred sales charge.
See accompanying notes which are an integral part of the financial statements.
Annual Report
Statement of Operations
|
|
Year ended February 28, 2013 |
|
|
|
|
|
|
Investment Income |
|
|
|
Dividends |
|
$ 52,098,555 |
|
Interest |
|
18 |
|
Income from Fidelity Central Funds |
|
526,486 |
|
Total income |
|
52,625,059 |
|
|
|
|
|
Expenses |
|
|
|
Management fee |
$ 11,043,981 |
|
|
Transfer agent fees |
4,239,572 |
|
|
Distribution and service plan fees |
2,164,521 |
|
|
Accounting and security lending fees |
606,347 |
|
|
Custodian fees and expenses |
83,430 |
|
|
Independent trustees' compensation |
12,804 |
|
|
Registration fees |
202,756 |
|
|
Audit |
46,276 |
|
|
Legal |
7,103 |
|
|
Interest |
887 |
|
|
Miscellaneous |
16,586 |
|
|
Total expenses before reductions |
18,424,263 |
|
|
Expense reductions |
(125,364) |
18,298,899 |
|
Net investment income (loss) |
|
34,326,160 |
|
Realized and Unrealized Gain (Loss) Net realized gain (loss) on: |
|
|
|
Investment securities: |
|
|
|
Unaffiliated issuers |
94,857,369 |
|
|
Foreign currency transactions |
(47,642) |
|
|
Total net realized gain (loss) |
|
94,809,727 |
|
Change in net unrealized appreciation (depreciation) on: Investment securities (net of increase in deferred foreign taxes of $5,845) |
198,080,167 |
|
|
Assets and liabilities in foreign currencies |
(8,773) |
|
|
Total change in net unrealized appreciation (depreciation) |
|
198,071,394 |
|
Net gain (loss) |
|
292,881,121 |
|
Net increase (decrease) in net assets resulting from operations |
|
$ 327,207,281 |
Statement of Changes in Net Assets
|
|
Year ended |
Year ended |
|
Increase (Decrease) in Net Assets |
|
|
|
Operations |
|
|
|
Net investment income (loss) |
$ 34,326,160 |
$ 29,195,620 |
|
Net realized gain (loss) |
94,809,727 |
36,347,219 |
|
Change in net unrealized appreciation (depreciation) |
198,071,394 |
157,954,804 |
|
Net increase (decrease) in net assets resulting from operations |
327,207,281 |
223,497,643 |
|
Distributions to shareholders from net investment income |
(31,344,671) |
(25,900,882) |
|
Distributions to shareholders from net realized gain |
(29,546,659) |
(36,216,657) |
|
Total distributions |
(60,891,330) |
(62,117,539) |
|
Share transactions - net increase (decrease) |
287,768,850 |
162,381,495 |
|
Redemption fees |
35,035 |
45,851 |
|
Total increase (decrease) in net assets |
554,119,836 |
323,807,450 |
|
|
|
|
|
Net Assets |
|
|
|
Beginning of period |
1,732,533,292 |
1,408,725,842 |
|
End of period (including undistributed net investment income of $5,461,626 and undistributed net investment income of $3,220,648, respectively) |
$ 2,286,653,128 |
$ 1,732,533,292 |
See accompanying notes which are an integral part of the financial statements.
Annual Report
Financial Highlights - Class A
|
Years ended February 28, |
2013 |
2012 G |
2011 |
2010 |
2009 |
|
Selected Per-Share Data |
|
|
|
|
|
|
Net asset value, beginning of period |
$ 74.90 |
$ 67.65 |
$ 61.06 |
$ 43.94 |
$ 63.13 |
|
Income from Investment Operations |
|
|
|
|
|
|
Net investment income (loss) C |
1.26 |
1.22 |
.98 |
.84 |
.67 |
|
Net realized and unrealized gain (loss) |
11.73 |
8.73 |
7.10 |
17.02 |
(19.19) |
|
Total from investment operations |
12.99 |
9.95 |
8.08 |
17.86 |
(18.52) |
|
Distributions from net investment income |
(1.08) |
(1.06) |
(.83) |
(.74) |
(.66) |
|
Distributions from net realized gain |
(1.14) |
(1.64) |
(.66) |
- |
(.02) |
|
Total distributions |
(2.22) |
(2.70) |
(1.49) |
(.74) |
(.68) I |
|
Redemption fees added to paid in capital C |
- H |
- H |
- H |
- H |
.01 |
|
Net asset value, end of period |
$ 85.67 |
$ 74.90 |
$ 67.65 |
$ 61.06 |
$ 43.94 |
|
Total Return A,B |
17.60% |
15.00% |
13.27% |
40.66% |
(29.43)% |
|
Ratios to Average Net Assets D,F |
|
|
|
|
|
|
Expenses before reductions |
1.08% |
1.10% |
1.11% |
1.13% |
1.19% |
|
Expenses net of fee waivers, if any |
1.08% |
1.10% |
1.11% |
1.13% |
1.19% |
|
Expenses net of all reductions |
1.08% |
1.09% |
1.11% |
1.13% |
1.18% |
|
Net investment income (loss) |
1.58% |
1.74% |
1.53% |
1.51% |
1.27% |
|
Supplemental Data |
|
|
|
|
|
|
Net assets, end of period (000 omitted) |
$ 277,329 |
$ 205,851 |
$ 160,526 |
$ 162,370 |
$ 121,193 |
|
Portfolio turnover rate E |
28% |
35% |
57% |
69% |
70% |
A Total returns would have been lower if certain expenses had not been reduced during the applicable periods shown.
B Total returns do not include the effect of the sales charges.
C Calculated based on average shares outstanding during the period.
D Fees and expenses of any underlying Fidelity Central Funds are not included in the Fund's expense ratio. The Fund indirectly bears its proportionate share of the expenses of any underlying Fidelity Central Funds.
E Amount does not include the portfolio activity of any underlying Fidelity Central Funds.
F Expense ratios reflect operating expenses of the class. Expenses before reductions do not reflect amounts reimbursed by the investment adviser or reductions from brokerage service arrangements or reductions from other expense offset arrangements and do not represent the amount paid by the class during periods when reimbursements or reductions occur. Expenses net of fee waivers reflect expenses after reimbursement by the investment adviser but prior to reductions from brokerage service arrangements or other expense offset arrangements. Expenses net of all reductions represent the net expenses paid by the class.
G For the year ended February 29.
H Amount represents less than $.01 per share.
I Total distributions of $.68 per share is comprised of distributions from net investment income of $.655 and distributions from net realized gain of $.024 per share.
Financial Highlights - Class T
|
Years ended February 28, |
2013 |
2012 G |
2011 |
2010 |
2009 |
|
Selected Per-Share Data |
|
|
|
|
|
|
Net asset value, beginning of period |
$ 74.49 |
$ 67.30 |
$ 60.77 |
$ 43.75 |
$ 62.93 |
|
Income from Investment Operations |
|
|
|
|
|
|
Net investment income (loss) C |
1.03 |
1.01 |
.79 |
.66 |
.53 |
|
Net realized and unrealized gain (loss) |
11.68 |
8.68 |
7.05 |
16.95 |
(19.12) |
|
Total from investment operations |
12.71 |
9.69 |
7.84 |
17.61 |
(18.59) |
|
Distributions from net investment income |
(.88) |
(.86) |
(.65) |
(.59) |
(.60) |
|
Distributions from net realized gain |
(1.14) |
(1.64) |
(.66) |
- |
- |
|
Total distributions |
(2.02) |
(2.50) |
(1.31) |
(.59) |
(.60) I |
|
Redemption fees added to paid in capital C |
- H |
- H |
- H |
- H |
.01 |
|
Net asset value, end of period |
$ 85.18 |
$ 74.49 |
$ 67.30 |
$ 60.77 |
$ 43.75 |
|
Total Return A,B |
17.29% |
14.67% |
12.93% |
40.24% |
(29.61)% |
|
Ratios to Average Net Assets D,F |
|
|
|
|
|
|
Expenses before reductions |
1.36% |
1.38% |
1.40% |
1.44% |
1.46% |
|
Expenses net of fee waivers, if any |
1.36% |
1.38% |
1.40% |
1.44% |
1.46% |
|
Expenses net of all reductions |
1.35% |
1.38% |
1.40% |
1.44% |
1.46% |
|
Net investment income (loss) |
1.30% |
1.45% |
1.24% |
1.21% |
.99% |
|
Supplemental Data |
|
|
|
|
|
|
Net assets, end of period (000 omitted) |
$ 52,024 |
$ 39,047 |
$ 31,496 |
$ 29,662 |
$ 22,624 |
|
Portfolio turnover rate E |
28% |
35% |
57% |
69% |
70% |
A Total returns would have been lower if certain expenses had not been reduced during the applicable periods shown.
B Total returns do not include the effect of the sales charges.
C Calculated based on average shares outstanding during the period.
D Fees and expenses of any underlying Fidelity Central Funds are not included in the Fund's expense ratio. The Fund indirectly bears its proportionate share of the expenses of any underlying Fidelity Central Funds.
E Amount does not include the portfolio activity of any underlying Fidelity Central Funds.
F Expense ratios reflect operating expenses of the class. Expenses before reductions do not reflect amounts reimbursed by the investment adviser or reductions from brokerage service arrangements or reductions from other expense offset arrangements and do not represent the amount paid by the class during periods when reimbursements or reductions occur. Expenses net of fee waivers reflect expenses after reimbursement by the investment adviser but prior to reductions from brokerage service arrangements or other expense offset arrangements. Expenses net of all reductions represent the net expenses paid by the class.
G For the year ended February 29.
H Amount represents less than $.01 per share.
I Total distributions of $.60 per share is comprised of distributions from net investment income of $.599 and distributions from net realized gain of $.000 per share.
See accompanying notes which are an integral part of the financial statements.
Annual Report
Financial Highlights - Class B
|
Years ended February 28, |
2013 |
2012 G |
2011 |
2010 |
2009 |
|
Selected Per-Share Data |
|
|
|
|
|
|
Net asset value, beginning of period |
$ 74.01 |
$ 66.83 |
$ 60.37 |
$ 43.53 |
$ 62.69 |
|
Income from Investment Operations |
|
|
|
|
|
|
Net investment income (loss) C |
.61 |
.64 |
.46 |
.37 |
.26 |
|
Net realized and unrealized gain (loss) |
11.61 |
8.61 |
6.98 |
16.82 |
(19.01) |
|
Total from investment operations |
12.22 |
9.25 |
7.44 |
17.19 |
(18.75) |
|
Distributions from net investment income |
(.37) |
(.43) |
(.32) |
(.35) |
(.42) |
|
Distributions from net realized gain |
(1.14) |
(1.64) |
(.66) |
- |
- |
|
Total distributions |
(1.51) |
(2.07) |
(.98) |
(.35) |
(.42) I |
|
Redemption fees added to paid in capital C |
- H |
- H |
- H |
- H |
.01 |
|
Net asset value, end of period |
$ 84.72 |
$ 74.01 |
$ 66.83 |
$ 60.37 |
$ 43.53 |
|
Total Return A,B |
16.68% |
14.06% |
12.35% |
39.48% |
(29.96)% |
|
Ratios to Average Net Assets D,F |
|
|
|
|
|
|
Expenses before reductions |
1.89% |
1.91% |
1.91% |
1.97% |
1.96% |
|
Expenses net of fee waivers, if any |
1.89% |
1.91% |
1.91% |
1.97% |
1.96% |
|
Expenses net of all reductions |
1.88% |
1.90% |
1.91% |
1.97% |
1.96% |
|
Net investment income (loss) |
.78% |
.93% |
.73% |
.68% |
.50% |
|
Supplemental Data |
|
|
|
|
|
|
Net assets, end of period (000 omitted) |
$ 18,548 |
$ 19,330 |
$ 20,033 |
$ 21,099 |
$ 14,929 |
|
Portfolio turnover rate E |
28% |
35% |
57% |
69% |
70% |
A Total returns would have been lower if certain expenses had not been reduced during the applicable periods shown.
B Total returns do not include the effect of the contingent deferred sales charge.
C Calculated based on average shares outstanding during the period.
D Fees and expenses of any underlying Fidelity Central Funds are not included in the Fund's expense ratio. The Fund indirectly bears its proportionate share of the expenses of any underlying Fidelity Central Funds.
E Amount does not include the portfolio activity of any underlying Fidelity Central Funds.
F Expense ratios reflect operating expenses of the class. Expenses before reductions do not reflect amounts reimbursed by the investment adviser or reductions from brokerage service arrangements or reductions from other expense offset arrangements and do not represent the amount paid by the class during periods when reimbursements or reductions occur. Expenses net of fee waivers reflect expenses after reimbursement by the investment adviser but prior to reductions from brokerage service arrangements or other expense offset arrangements. Expenses net of all reductions represent the net expenses paid by the class.
G For the year ended February 29.
H Amount represents less than $.01 per share.
I Total distributions of $.42 per share is comprised of distributions from net investment income of $.418 and distributions from net realized gain of $.000 per share.
Financial Highlights - Class C
|
Years ended February 28, |
2013 |
2012 G |
2011 |
2010 |
2009 |
|
Selected Per-Share Data |
|
|
|
|
|
|
Net asset value, beginning of period |
$ 73.75 |
$ 66.71 |
$ 60.29 |
$ 43.46 |
$ 62.61 |
|
Income from Investment Operations |
|
|
|
|
|
|
Net investment income (loss) C |
.65 |
.68 |
.49 |
.41 |
.28 |
|
Net realized and unrealized gain (loss) |
11.55 |
8.59 |
7.00 |
16.80 |
(19.00) |
|
Total from investment operations |
12.20 |
9.27 |
7.49 |
17.21 |
(18.72) |
|
Distributions from net investment income |
(.53) |
(.59) |
(.41) |
(.38) |
(.44) |
|
Distributions from net realized gain |
(1.14) |
(1.64) |
(.66) |
- |
- |
|
Total distributions |
(1.67) |
(2.23) |
(1.07) |
(.38) |
(.44) I |
|
Redemption fees added to paid in capital C |
- H |
- H |
- H |
- H |
.01 |
|
Net asset value, end of period |
$ 84.28 |
$ 73.75 |
$ 66.71 |
$ 60.29 |
$ 43.46 |
|
Total Return A,B |
16.73% |
14.14% |
12.44% |
39.59% |
(29.94)% |
|
Ratios to Average Net Assets D,F |
|
|
|
|
|
|
Expenses before reductions |
1.83% |
1.85% |
1.86% |
1.90% |
1.93% |
|
Expenses net of fee waivers, if any |
1.83% |
1.85% |
1.86% |
1.90% |
1.93% |
|
Expenses net of all reductions |
1.82% |
1.84% |
1.85% |
1.89% |
1.93% |
|
Net investment income (loss) |
.83% |
.99% |
.79% |
.75% |
.52% |
|
Supplemental Data |
|
|
|
|
|
|
Net assets, end of period (000 omitted) |
$ 134,966 |
$ 102,321 |
$ 81,239 |
$ 73,829 |
$ 54,902 |
|
Portfolio turnover rate E |
28% |
35% |
57% |
69% |
70% |
A Total returns would have been lower if certain expenses had not been reduced during the applicable periods shown.
B Total returns do not include the effect of the contingent deferred sales charge.
C Calculated based on average shares outstanding during the period.
D Fees and expenses of any underlying Fidelity Central Funds are not included in the Fund's expense ratio. The Fund indirectly bears its proportionate share of the expenses of any underlying Fidelity Central Funds.
E Amount does not include the portfolio activity of any underlying Fidelity Central Funds.
F Expense ratios reflect operating expenses of the class. Expenses before reductions do not reflect amounts reimbursed by the investment adviser or reductions from brokerage service arrangements or reductions from other expense offset arrangements and do not represent the amount paid by the class during periods when reimbursements or reductions occur. Expenses net of fee waivers reflect expenses after reimbursement by the investment adviser but prior to reductions from brokerage service arrangements or other expense offset arrangements. Expenses net of all reductions represent the net expenses paid by the class.
G For the year ended February 29.
H Amount represents less than $.01 per share.
I Total distributions of $.44 per share is comprised of distributions from net investment income of $.443 and distributions from net realized gain of $.000 per share.
See accompanying notes which are an integral part of the financial statements.
Annual Report
Financial Highlights - Consumer Staples
|
Years ended February 28, |
2013 |
2012 G |
2011 |
2010 |
2009 |
|
Selected Per-Share Data |
|
|
|
|
|
|
Net asset value, beginning of period |
$ 75.29 |
$ 67.98 |
$ 61.34 |
$ 44.14 |
$ 63.25 |
|
Income from Investment Operations |
|
|
|
|
|
|
Net investment income (loss) C |
1.48 |
1.42 |
1.14 |
.96 |
.88 |
|
Net realized and unrealized gain (loss) |
11.82 |
8.76 |
7.14 |
17.11 |
(19.31) |
|
Total from investment operations |
13.30 |
10.18 |
8.28 |
18.07 |
(18.43) |
|
Distributions from net investment income |
(1.28) |
(1.24) |
(.98) |
(.87) |
(.67) |
|
Distributions from net realized gain |
(1.14) |
(1.64) |
(.66) |
- |
(.03) |
|
Total distributions |
(2.42) |
(2.87) J |
(1.64) |
(.87) |
(.69) I |
|
Redemption fees added to paid in capital C |
- H |
- H |
- H |
- H |
.01 |
|
Net asset value, end of period |
$ 86.17 |
$ 75.29 |
$ 67.98 |
$ 61.34 |
$ 44.14 |
|
Total Return A,B |
17.94% |
15.30% |
13.55% |
40.96% |
(29.23)% |
|
Ratios to Average Net Assets D,F |
|
|
|
|
|
|
Expenses before reductions |
.81% |
.83% |
.86% |
.92% |
.91% |
|
Expenses net of fee waivers, if any |
.81% |
.83% |
.86% |
.92% |
.91% |
|
Expenses net of all reductions |
.80% |
.82% |
.86% |
.91% |
.90% |
|
Net investment income (loss) |
1.85% |
2.01% |
1.78% |
1.73% |
1.55% |
|
Supplemental Data |
|
|
|
|
|
|
Net assets, end of period (000 omitted) |
$ 1,425,055 |
$ 1,202,440 |
$ 877,548 |
$ 946,455 |
$ 657,263 |
|
Portfolio turnover rate E |
28% |
35% |
57% |
69% |
70% |
A Total returns would have been lower if certain expenses had not been reduced during the applicable periods shown.
B Total returns do not include the effect of the former sales charges.
C Calculated based on average shares outstanding during the period.
D Fees and expenses of any underlying Fidelity Central Funds are not included in the Fund's expense ratio. The Fund indirectly bears its proportionate share of the expenses of any underlying Fidelity Central Funds.
E Amount does not include the portfolio activity of any underlying Fidelity Central Funds.
F Expense ratios reflect operating expenses of the class. Expenses before reductions do not reflect amounts reimbursed by the investment adviser or reductions from brokerage service arrangements or reductions from other expense offset arrangements and do not represent the amount paid by the class during periods when reimbursements or reductions occur. Expenses net of fee waivers reflect expenses after reimbursement by the investment adviser but prior to reductions from brokerage service arrangements or other expense offset arrangements. Expenses net of all reductions represent the net expenses paid by the class.
G For the year ended February 29.
H Amount represents less than $.01 per share.
I Total distributions of $.69 per share is comprised of distributions from net investment income of $.668 and distributions from net realized gain of $.025 per share.
J Total distributions of $2.87 per share is comprised of distributions from net investment income of $1.236 and distributions from net realized gain of $1.637 per share.
Financial Highlights - Institutional Class
|
Years ended February 28, |
2013 |
2012 F |
2011 |
2010 |
2009 |
|
Selected Per-Share Data |
|
|
|
|
|
|
Net asset value, beginning of period |
$ 75.14 |
$ 67.84 |
$ 61.26 |
$ 44.07 |
$ 63.22 |
|
Income from Investment Operations |
|
|
|
|
|
|
Net investment income (loss) B |
1.45 |
1.39 |
1.15 |
.98 |
.82 |
|
Net realized and unrealized gain (loss) |
11.79 |
8.73 |
7.13 |
17.09 |
(19.23) |
|
Total from investment operations |
13.24 |
10.12 |
8.28 |
18.07 |
(18.41) |
|
Distributions from net investment income |
(1.32) |
(1.19) |
(1.04) |
(.88) |
(.73) |
|
Distributions from net realized gain |
(1.14) |
(1.64) |
(.66) |
- |
(.03) |
|
Total distributions |
(2.46) |
(2.82) I |
(1.70) |
(.88) |
(.75) H |
|
Redemption fees added to paid in capital B |
- G |
- G |
- G |
- G |
.01 |
|
Net asset value, end of period |
$ 85.92 |
$ 75.14 |
$ 67.84 |
$ 61.26 |
$ 44.07 |
|
Total Return A |
17.90% |
15.24% |
13.57% |
41.03% |
(29.22)% |
|
Ratios to Average Net Assets C,E |
|
|
|
|
|
|
Expenses before reductions |
.85% |
.87% |
.87% |
.86% |
.91% |
|
Expenses net of fee waivers, if any |
.85% |
.87% |
.87% |
.86% |
.91% |
|
Expenses net of all reductions |
.84% |
.87% |
.87% |
.86% |
.91% |
|
Net investment income (loss) |
1.81% |
1.96% |
1.77% |
1.78% |
1.54% |
|
Supplemental Data |
|
|
|
|
|
|
Net assets, end of period (000 omitted) |
$ 378,731 |
$ 163,544 |
$ 237,883 |
$ 36,152 |
$ 30,922 |
|
Portfolio turnover rate D |
28% |
35% |
57% |
69% |
70% |
A Total returns would have been lower if certain expenses had not been reduced during the applicable periods shown.
B Calculated based on average shares outstanding during the period.
C Fees and expenses of any underlying Fidelity Central Funds are not included in the Fund's expense ratio. The Fund indirectly bears its proportionate share of the expenses of any underlying Fidelity Central Funds.
D Amount does not include the portfolio activity of any underlying Fidelity Central Funds.
E Expense ratios reflect operating expenses of the class. Expenses before reductions do not reflect amounts reimbursed by the investment adviser or reductions from brokerage service arrangements or reductions from other expense offset arrangements and do not represent the amount paid by the class during periods when reimbursements or reductions occur. Expenses net of fee waivers reflect expenses after reimbursement by the investment adviser but prior to reductions from brokerage service arrangements or other expense offset arrangements. Expenses net of all reductions represent the net expenses paid by the class.
F For the year ended February 29.
G Amount represents less than $.01 per share.
H Total distributions of $.75 per share is comprised of distributions from net investment income of $.726 and distributions from net realized gain of $.025 per share.
I Total distributions of $2.82 per share is comprised of distributions from net investment income of $1.186 and distributions from net realized gain of $1.637 per share.
See accompanying notes which are an integral part of the financial statements.
Annual Report
Notes to Financial Statements
For the period ended February 28, 2013
1. Organization.
Consumer Staples Portfolio (the Fund) is a non-diversified fund of Fidelity Select Portfolios (the Trust) and is authorized to issue an unlimited number of shares. The Trust is registered under the Investment Company Act of 1940, as amended (the 1940 Act), as an open-end management investment company organized as a Massachusetts business trust. The Fund invests primarily in securities of companies whose principal business activities fall within specific industries. The Fund offers Class A, Class T, Class C, Consumer Staples, and Institutional Class shares, each of which, along with Class B shares, has equal rights as to assets and voting privileges. Class B shares are closed to new accounts and additional purchases, except for exchanges and reinvestments. Each class has exclusive voting rights with respect to matters that affect that class. Class B shares will automatically convert to Class A shares after a holding period of seven years from the initial date of purchase. Investment income, realized and unrealized capital gains and losses, the common expenses of the Fund, and certain fund-level expense reductions, if any, are allocated on a pro-rata basis to each class based on the relative net assets of each class to the total net assets of the Fund. Each class differs with respect to transfer agent and distribution and service plan fees incurred. Certain expense reductions may also differ by class.
2. Investments in Fidelity Central Funds.
The Fund invests in Fidelity Central Funds, which are open-end investment companies available only to other investment companies and accounts managed by Fidelity Management & Research Company (FMR) and its affiliates. The Fund's Schedule of Investments lists each of the Fidelity Central Funds held as of period end, if any, as an investment of the Fund, but does not include the underlying holdings of each Fidelity Central Fund. As an Investing Fund, the Fund indirectly bears its proportionate share of the expenses of the underlying Fidelity Central Funds.
The Money Market Central Funds seek preservation of capital and current income and are managed by Fidelity Investments Money Management, Inc. (FIMM), an affiliate of FMR.
A complete unaudited list of holdings for each Fidelity Central Fund is available upon request or at the Securities and Exchange Commission (the SEC) website at www.sec.gov. In addition, the financial statements of the Fidelity Central Funds, which are not covered by the Fund's Report of Independent Registered Public Accounting Firm, are available on the SEC website or upon request.
3. Significant Accounting Policies.
The financial statements have been prepared in conformity with accounting principles generally accepted in the United States of America (GAAP), which require management to make certain estimates and assumptions at the date of the financial statements. Actual results could differ from those estimates. Subsequent events, if any, through the date that the financial statements were issued have been evaluated in the preparation of the financial statements. The following summarizes the significant accounting policies of the Fund:
Investment Valuation. Investments are valued as of 4:00 p.m. Eastern time on the last calendar day of the period. In accordance with valuation policies and procedures approved by the Board of Trustees (the Board), the Fund attempts to obtain prices from one or more third party pricing vendors or brokers to value its investments. When current market prices, quotations or currency exchange rates are not readily available or reliable, investments will be fair valued in good faith by the FMR Fair Value Committee (the Committee), in accordance with procedures adopted by the Fund's Board. Factors used in determining fair value vary by investment type and may include market or investment specific events. The frequency with which these procedures are used cannot be predicted and they may be utilized to a significant extent. The Committee oversees the Fund's valuation policies and procedures and is responsible for approving and reporting to the Board all fair value determinations.
The Fund categorizes the inputs to valuation techniques used to value its investments into a disclosure hierarchy consisting of three levels as shown below:
Level 1 - quoted prices in active markets for identical investments
Level 2 - other significant observable inputs (including quoted prices for similar investments, interest rates, prepayment speeds, etc.)
Level 3 - unobservable inputs (including the Fund's own assumptions based on the best information available)
Valuation techniques used to value the Fund's investments by major category are as follows:
Equity securities, including restricted securities, for which market quotations are readily available, are valued at the last reported sale price or official closing price as reported by a third party pricing vendor on the primary market or exchange on which they are traded and are categorized as Level 1 in the hierarchy. In the event there were no sales during the day or closing prices are not available, securities are valued at the last quoted bid price or may be valued using the last available price and are generally categorized as Level 2 in the hierarchy. For foreign equity securities, when significant market or security specific events arise, comparisons to the valuation of American Depositary Receipts (ADRs), futures contracts, Exchange-Traded Funds (ETFs) and certain indexes as well as quoted prices for similar securities are used and are categorized as Level 2 in the hierarchy. Utilizing these techniques may result in transfers between Level 1 and Level 2.
Annual Report
3. Significant Accounting Policies - continued
Investment Valuation - continued
Investments in open-end mutual funds ,including the Fidelity Central Funds, are valued at their closing net asset value (NAV) each business day and are categorized as Level 1 in the hierarchy.
Changes in valuation techniques may result in transfers in or out of an assigned level within the disclosure hierarchy. The aggregate value of investments by input level, as of February 28, 2013, including information on transfers between Levels 1 and 2, is included at the end of the Fund's Schedule of Investments.
Foreign Currency. The Fund may use foreign currency contracts to facilitate transactions in foreign-denominated securities. Gains and losses from these transactions may arise from changes in the value of the foreign currency or if the counterparties do not perform under the contracts' terms.
Foreign-denominated assets, including investment securities, and liabilities are translated into U.S. dollars at the exchange rates at period end. Purchases and sales of investment securities, income and dividends received and expenses denominated in foreign currencies are translated into U.S. dollars at the exchange rate in effect on the transaction date.
The effects of exchange rate fluctuations on investments are included with the net realized and unrealized gain (loss) on investment securities. Other foreign currency transactions resulting in realized and unrealized gain (loss) are disclosed separately.
Investment Transactions and Income. For financial reporting purposes, the Fund's investment holdings and NAV include trades executed through the end of the last business day of the period. The NAV per share for processing shareholder transactions is calculated as of the close of business of the New York Stock Exchange (NYSE), normally 4:00 p.m. Eastern time and includes trades executed through the end of the prior business day. Gains and losses on securities sold are determined on the basis of identified cost and may include proceeds received from litigation. Dividend income is recorded on the ex-dividend date, except for certain dividends from foreign securities where the ex-dividend date may have passed, which are recorded as soon as the Fund is informed of the ex-dividend date. Non-cash dividends included in dividend income, if any, are recorded at the fair market value of the securities received. Interest income and distributions from the Fidelity Central Funds are accrued as earned. Interest income includes coupon interest and amortization of premium and accretion of discount on debt securities. Investment income is recorded net of foreign taxes withheld where recovery of such taxes is uncertain.
Expenses. Expenses directly attributable to a fund are charged to that fund. Expenses attributable to more than one fund are allocated among the respective funds on the basis of relative net assets or other appropriate methods. Expense estimates are accrued in the period to which they relate and adjustments are made when actual amounts are known.
Income Tax Information and Distributions to Shareholders. Each year, the Fund intends to qualify as a regulated investment company under Subchapter M of the Internal Revenue Code, including distributing substantially all of its taxable income and realized gains. As a result, no provision for income taxes is required. As of February 28, 2013, the Fund did not have any unrecognized tax benefits in the financial statements; nor is the Fund aware of any tax positions for which it is reasonably possible that the total amounts of unrecognized tax benefits will significantly change in the next twelve months. The Fund files a U.S. federal tax return, in addition to state and local tax returns as required. A fund's federal income tax returns are subject to examination by the Internal Revenue Service (IRS) for a period of three fiscal years after they are filed. State and local tax returns may be subject to examination for an additional fiscal year depending on the jurisdiction. Foreign taxes are provided for based on the Fund's understanding of the tax rules and rates that exist in the foreign markets in which it invests.
Distributions are declared and recorded on the ex-dividend date. Income dividends and capital gain distributions are declared separately for each class. Income and capital gain distributions are determined in accordance with income tax regulations, which may differ from GAAP. In addition, the Fund claimed a portion of the payment made to redeeming shareholders as a distribution for income tax purposes.
Capital accounts within the financial statements are adjusted for permanent book-tax differences. These adjustments have no impact on net assets or the results of operations. Temporary book-tax differences will reverse in a subsequent period.
Book-tax differences are primarily due to foreign currency transactions, deferred trustees compensation and losses deferred due to wash sales and excise tax regulations.
The federal tax cost of investment securities and unrealized appreciation (depreciation) as of period end were as follows:
|
Gross unrealized appreciation |
$ 553,242,221 |
|
Gross unrealized depreciation |
(2,258,134) |
|
Net unrealized appreciation (depreciation) on securities and other investments |
$ 550,984,087 |
|
Tax Cost |
$ 1,762,011,898 |
Annual Report
Notes to Financial Statements - continued
3. Significant Accounting Policies - continued
Income Tax Information and Distributions to Shareholders - continued
The tax-based components of distributable earnings as of period end were as follows:
|
Undistributed ordinary income |
$ 6,885,738 |
|
Undistributed long-term capital gain |
$ 57,569,918 |
|
Net unrealized appreciation (depreciation) |
$ 550,983,637 |
The tax character of distributions paid was as follows:
|
|
February 28, 2013 |
February 29, 2012 |
|
Ordinary Income |
$ 31,344,671 |
$ 31,774,273 |
|
Long-term Capital Gains |
29,546,659 |
30,343,266 |
|
Total |
$ 60,891,330 |
$ 62,117,539 |
Trading (Redemption) Fees. Shares held by investors in the Fund less than 30 days are subject to a redemption fee equal to .75% of the net asset value of shares redeemed. All redemption fees, which reduce the proceeds of the shareholder redemption, are retained by the Fund and accounted for as an addition to paid in capital.
4. Purchases and Sales of Investments.
Purchases and sales of securities other than short-term securities, aggregated $716,429,728 and $535,013,896, respectively.
5. Fees and Other Transactions with Affiliates.
Management Fee. FMR and its affiliates provide the Fund with investment management related services for which the Fund pays a monthly management fee. The management fee is the sum of an individual fund fee rate that is based on an annual rate of .30% of the Fund's average net assets and an annualized group fee rate that averaged .26% during the period. The group fee rate is based upon the average net assets of all the mutual funds advised by FMR. The group fee rate decreases as assets under management increase and increases as assets under management decrease. For the period, the total annual management fee rate was .56% of the Fund's average net assets.
Distribution and Service Plan Fees. In accordance with Rule 12b-1 of the 1940 Act, the Fund has adopted separate Distribution and Service Plans for each class of shares. Certain classes pay Fidelity Distributors Corporation (FDC), an affiliate of FMR, separate Distribution and Service Fees, each of which is based on an annual percentage of each class' average net assets. In addition, FDC may pay financial intermediaries for selling shares of the Fund and providing shareholder support services. For the period, the Distribution and Service Fee rates, total fees and amounts retained by FDC were as follows:
|
|
Distribution |
Service |
Total Fees |
Retained |
|
Class A |
-% |
.25% |
$ 586,812 |
$ 10,136 |
|
Class T |
.25% |
.25% |
220,654 |
1,120 |
|
Class B |
.75% |
.25% |
186,750 |
140,226 |
|
Class C |
.75% |
.25% |
1,170,305 |
250,108 |
|
|
|
|
$ 2,164,521 |
$ 401,590 |
Sales Load. FDC may receive a front-end sales charge of up to 5.75% for selling Class A shares and 3.50% for selling Class T shares, some of which is paid to financial intermediaries for selling shares of the Fund. Depending on the holding period, FDC may receive contingent deferred sales charges levied on Class A, Class T, Class B, and Class C redemptions. The deferred sales charges range from 5.00% to 1.00% for Class B shares, 1.00% for Class C shares, 1.00% for certain purchases of Class A shares and .25% for certain purchases of Class T shares.
Annual Report
5. Fees and Other Transactions with Affiliates - continued
Sales Load - continued
For the period, sales charge amounts retained by FDC were as follows:
|
|
Retained |
|
Class A |
$ 190,041 |
|
Class T |
24,402 |
|
Class B* |
35,420 |
|
Class C* |
15,416 |
|
|
$ 265,279 |
* When Class B and Class C shares are initially sold, FDC pays commissions from its own resources to financial intermediaries through which the sales are made.
Transfer Agent Fees. Fidelity Investments Institutional Operations Company, Inc., (FIIOC), an affiliate of FMR, is the transfer, dividend disbursing and shareholder servicing agent for each class of the Fund. FIIOC receives account fees and asset-based fees that vary according to the account size and type of account of the shareholders of the respective classes of the Fund. FIIOC receives no fees for providing transfer agency services to Class F. FIIOC pays for typesetting, printing and mailing of shareholder reports, except proxy statements. For the period, transfer agent fees for each class were as follows:
|
|
Amount |
% of |
|
Class A |
$ 526,828 |
.22 |
|
Class T |
110,772 |
.25 |
|
Class B |
52,559 |
.28 |
|
Class C |
257,870 |
.22 |
|
Consumer Staples |
2,660,688 |
.20 |
|
Institutional Class |
630,855 |
.24 |
|
|
$ 4,239,572 |
|
Accounting and Security Lending Fees. Fidelity Service Company, Inc. (FSC), an affiliate of FMR, maintains the Fund's accounting records. The accounting fee is based on the level of average net assets for each month. Under a separate contract, FSC administers the security lending program. The security lending fee is based on the number and duration of lending transactions.
Brokerage Commissions. The Fund placed a portion of its portfolio transactions with brokerage firms which are affiliates of the investment adviser. The commissions paid to these affiliated firms were $11,055 for the period.
Interfund Lending Program. Pursuant to an Exemptive Order issued by the SEC, the Fund, along with other registered investment companies having management contracts with FMR, may participate in an interfund lending program. This program provides an alternative credit facility allowing the funds to borrow from, or lend money to, other participating affiliated funds. At period end, there were no interfund loans outstanding. The Fund's activity in this program during the period for which loans were outstanding was as follows:
|
Borrower or Lender |
Average Loan |
Weighted Average Interest Rate |
Interest Expense |
|
Borrower |
$ 12,984,167 |
.41% |
$ 887 |
6. Committed Line of Credit.
The Fund participates with other funds managed by FMR or an affiliate in a $4.25 billion credit facility (the "line of credit") to be utilized for temporary or emergency purposes to fund shareholder redemptions or for other short-term liquidity purposes. The Fund has agreed to pay commitment fees on its pro-rata portion of the line of credit, which amounted to $4,976 and is reflected in Miscellaneous expenses on the Statement of Operations. During the period, there were no borrowings on this line of credit.
Annual Report
Notes to Financial Statements - continued
7. Security Lending.
The Fund lends portfolio securities through a lending agent from time to time in order to earn additional income. On the settlement date of the loan, the Fund receives collateral (in the form of U.S. Treasury obligations, letters of credit and/or cash) against the loaned securities and maintains collateral in an amount not less than 100% of the market value of the loaned securities during the period of the loan. The market value of the loaned securities is determined at the close of business of the Fund and any additional required collateral is delivered to the Fund on the next business day. If the borrower defaults on its obligation to return the securities loaned because of insolvency or other reasons, a fund could experience delays and costs in recovering the securities loaned or in gaining access to the collateral. Any cash collateral received is invested in the Fidelity Securities Lending Cash Central Fund. The value of loaned securities and cash collateral at period end are disclosed on the Fund's Statement of Assets and Liabilities. At period end, there were no security loans outstanding with FCM. Security lending income represents the income earned on investing cash collateral, less rebates paid to borrowers and any lending agent fees associated with the loan, plus any premium payments received for lending certain types of securities. Security lending income is presented in the Statement of Operations as a component of income from Fidelity Central Funds. Total security lending income during the period amounted to $405,984, including $260 from securities loaned to FCM.
8. Expense Reductions.
Many of the brokers with whom FMR places trades on behalf of the Fund provided services to the Fund in addition to trade execution. These services included payments of certain expenses on behalf of the Fund totaling $119,711 for the period. In addition, through arrangements with the Fund's custodian, credits realized as a result of uninvested cash balances were used to reduce the Fund's expenses. During the period, these credits reduced the Fund's custody expenses by $85.
In addition, FMR reimbursed a portion of the Fund's operating expenses during the period in the amount of $5,568.
9. Distributions to Shareholders.
Distributions to shareholders of each class were as follows:
|
|
Year ended |
Year ended |
|
From net investment income |
|
|
|
Class A |
$ 3,290,973 |
$ 2,690,167 |
|
Class T |
500,306 |
422,197 |
|
Class B |
82,480 |
114,208 |
|
Class C |
820,066 |
829,469 |
|
Consumer Staples |
20,759,081 |
18,061,907 |
|
Institutional Class |
5,891,765 |
3,782,934 |
|
Total |
$ 31,344,671 |
$ 25,900,882 |
|
From net realized gain |
|
|
|
Class A |
$ 3,434,776 |
$ 4,102,363 |
|
Class T |
646,006 |
795,051 |
|
Class B |
260,273 |
441,952 |
|
Class C |
1,739,884 |
2,213,680 |
|
Consumer Staples |
18,561,423 |
23,446,773 |
|
Institutional Class |
4,904,297 |
5,216,838 |
|
Total |
$ 29,546,659 |
$ 36,216,657 |
Annual Report
10. Share Transactions.
Transactions for each class of shares were as follows:
|
|
Shares |
Dollars |
||
|
|
Year ended |
Year ended |
Year ended |
Year ended |
|
Class A |
|
|
|
|
|
Shares sold |
1,172,691 |
1,107,874 |
$ 93,404,427 |
$ 77,974,428 |
|
Reinvestment of distributions |
72,806 |
84,526 |
5,768,631 |
5,924,948 |
|
Shares redeemed |
(756,998) |
(816,686) |
(59,959,929) |
(57,527,748) |
|
Net increase (decrease) |
488,499 |
375,714 |
$ 39,213,129 |
$ 26,371,628 |
|
Class T |
|
|
|
|
|
Shares sold |
146,374 |
130,126 |
$ 11,640,258 |
$ 9,133,799 |
|
Reinvestment of distributions |
13,628 |
16,351 |
1,073,877 |
1,140,509 |
|
Shares redeemed |
(73,443) |
(90,239) |
(5,785,079) |
(6,276,410) |
|
Net increase (decrease) |
86,559 |
56,238 |
$ 6,929,056 |
$ 3,997,898 |
|
Class B |
|
|
|
|
|
Shares sold |
11,096 |
22,727 |
$ 868,729 |
$ 1,569,035 |
|
Reinvestment of distributions |
3,553 |
6,332 |
278,056 |
439,355 |
|
Shares redeemed |
(56,866) |
(67,638) |
(4,452,338) |
(4,695,265) |
|
Net increase (decrease) |
(42,217) |
(38,579) |
$ (3,305,553) |
$ (2,686,875) |
|
Class C |
|
|
|
|
|
Shares sold |
479,940 |
536,557 |
$ 37,531,069 |
$ 37,168,209 |
|
Reinvestment of distributions |
25,332 |
33,216 |
1,978,186 |
2,295,907 |
|
Shares redeemed |
(291,408) |
(400,115) |
(22,752,561) |
(28,068,157) |
|
Net increase (decrease) |
213,864 |
169,658 |
$ 16,756,694 |
$ 11,395,959 |
|
Consumer Staples |
|
|
|
|
|
Shares sold |
5,353,585 |
7,156,716 |
$ 425,841,967 |
$ 509,488,908 |
|
Reinvestment of distributions |
474,945 |
566,253 |
37,790,378 |
39,874,596 |
|
Shares redeemed |
(5,260,820) |
(4,661,196) |
(416,646,931) |
(330,401,040) |
|
Net increase (decrease) |
567,710 |
3,061,773 |
$ 46,985,414 |
$ 218,962,464 |
|
Institutional Class |
|
|
|
|
|
Shares sold |
3,475,040 |
2,454,993 |
$ 279,763,267 |
$ 173,115,499 |
|
Reinvestment of distributions |
125,836 |
115,398 |
10,030,919 |
8,111,953 |
|
Shares redeemed |
(1,369,230) |
(3,900,689) |
(108,604,076) |
(276,887,031) |
|
Net increase (decrease) |
2,231,646 |
(1,330,298) |
$ 181,190,110 |
$ (95,659,579) |
11. Other.
The Fund's organizational documents provide former and current trustees and officers with a limited indemnification against liabilities arising in connection with the performance of their duties to the Fund. In the normal course of business, the Fund may also enter into contracts that provide general indemnifications. The Fund's maximum exposure under these arrangements is unknown as this would be dependent on future claims that may be made against the Fund. The risk of material loss from such claims is considered remote.
At the end of the period, Strategic Advisers U. S. Opportunity Fund was the owner of record of approximately 11% of the total outstanding shares of the Fund. Mutual funds managed by FMR or its affiliates were the owners of record, in the aggregate, of approximately 26% of the total outstanding shares of the Fund.
Annual Report
Report of Independent Registered Public Accounting Firm
To the Trustees of Fidelity Select Portfolios and the Shareholders of Consumer Staples Portfolio:
In our opinion, the accompanying statement of assets and liabilities, including the schedule of investments, and the related statements of operations and of changes in net assets and the financial highlights present fairly, in all material respects, the financial position of Consumer Staples Portfolio (a fund of Fidelity Select Portfolios) at February 28, 2013, the results of its operations for the year then ended, the changes in its net assets for each of the two years in the period then ended and the financial highlights for each of the five years in the period then ended, in conformity with accounting principles generally accepted in the United States of America. These financial statements and financial highlights (hereafter referred to as "financial statements") are the responsibility of the Consumer Staples Portfolio's management. Our responsibility is to express an opinion on these financial statements based on our audits. We conducted our audits of these financial statements in accordance with the standards of the Public Company Accounting Oversight Board (United States). Those standards require that we plan and perform the audit to obtain reasonable assurance about whether the financial statements are free of material misstatement. An audit includes examining, on a test basis, evidence supporting the amounts and disclosures in the financial statements, assessing the accounting principles used and significant estimates made by management, and evaluating the overall financial statement presentation. We believe that our audits, which included confirmation of securities at February 28, 2013 by correspondence with the custodian and brokers, provide a reasonable basis for our opinion.
PricewaterhouseCoopers LLP
Boston, Massachusetts
April 18, 2013
Annual Report
Trustees and Officers
The Trustees, Members of the Advisory Board, and executive officers of the trust and fund, as applicable, are listed below. The Board of Trustees governs the fund and is responsible for protecting the interests of shareholders. The Trustees are experienced executives who meet periodically throughout the year to oversee the fund's activities, review contractual arrangements with companies that provide services to the fund, oversee management of the risks associated with such activities and contractual arrangements, and review the fund's performance. Except for James C. Curvey, each of the Trustees oversees 234 Fidelity funds. Mr. Curvey oversees 453 Fidelity funds.
The Trustees hold office without limit in time except that (a) any Trustee may resign; (b) any Trustee may be removed by written instrument, signed by at least two-thirds of the number of Trustees prior to such removal; (c) any Trustee who requests to be retired or who has become incapacitated by illness or injury may be retired by written instrument signed by a majority of the other Trustees; and (d) any Trustee may be removed at any special meeting of shareholders by a two-thirds vote of the outstanding voting securities of the trust. Each Trustee who is not an interested person of the trust and the fund (as defined in the 1940 Act) (Independent Trustee), shall retire not later than the last day of the calendar year in which his or her 75th birthday occurs. The Independent Trustees may waive this mandatory retirement age policy with respect to individual Trustees. The executive officers and Advisory Board Members hold office without limit in time, except that any officer and Advisory Board Member may resign or may be removed by a vote of a majority of the Trustees at any regular meeting or any special meeting of the Trustees. Except as indicated, each individual has held the office shown or other offices in the same company for the past five years.
Experience, Skills, Attributes, and Qualifications of the Fund's Trustees. The Governance and Nominating Committee has adopted a statement of policy that describes the experience, qualifications, attributes, and skills that are necessary and desirable for potential Independent Trustee candidates (Statement of Policy). The Board believes that each Trustee satisfied at the time he or she was initially elected or appointed a Trustee, and continues to satisfy, the standards contemplated by the Statement of Policy. The Governance and Nominating Committee also engages professional search firms to help identify potential Independent Trustee candidates who have the experience, qualifications, attributes, and skills consistent with the Statement of Policy. From time to time, additional criteria based on the composition and skills of the current Independent Trustees, as well as experience or skills that may be appropriate in light of future changes to board composition, business conditions, and regulatory or other developments, have also been considered by the professional search firms and the Governance and Nominating Committee. In addition, the Board takes into account the Trustees' commitment and participation in Board and committee meetings, as well as their leadership of standing and ad hoc committees throughout their tenure.
In determining that a particular Trustee was and continues to be qualified to serve as a Trustee, the Board has considered a variety of criteria, none of which, in isolation, was controlling. The Board believes that, collectively, the Trustees have balanced and diverse experience, qualifications, attributes, and skills, which allow the Board to operate effectively in governing each fund and protecting the interests of shareholders. Information about the specific experience, skills, attributes, and qualifications of each Trustee, which in each case led to the Board's conclusion that the Trustee should serve (or continue to serve) as a trustee of the funds, is provided below.
Board Structure and Oversight Function. James C. Curvey is an interested person (as defined in the 1940 Act) and currently serves as Chairman. The Trustees have determined that an interested Chairman is appropriate and benefits shareholders because an interested Chairman has a personal and professional stake in the quality and continuity of services provided to the funds. Independent Trustees exercise their informed business judgment to appoint an individual of their choosing to serve as Chairman, regardless of whether the Trustee happens to be independent or a member of management. The Independent Trustees have determined that they can act independently and effectively without having an Independent Trustee serve as Chairman and that a key structural component for assuring that they are in a position to do so is for the Independent Trustees to constitute a substantial majority for the Board. The Independent Trustees also regularly meet in executive session. Ned C. Lautenbach serves as Chairman of the Independent Trustees and as such (i) acts as a liaison between the Independent Trustees and management with respect to matters important to the Independent Trustees and (ii) with management prepares agendas for Board meetings.
Fidelity funds are overseen by different Boards of Trustees. The fund's Board oversees Fidelity's equity and high income funds and another Board oversees Fidelity's investment-grade bond, money market, and asset allocation funds. The asset allocation funds may invest in Fidelity funds overseen by the fund's Board. The use of separate Boards, each with its own committee structure, allows the Trustees of each group of Fidelity funds to focus on the unique issues of the funds they oversee, including common research, investment, and operational issues. On occasion, the separate Boards establish joint committees to address issues of overlapping consequences for the Fidelity funds overseen by each Board.
The Trustees operate using a system of committees to facilitate the timely and efficient consideration of all matters of importance to the Trustees, the fund, and fund shareholders and to facilitate compliance with legal and regulatory requirements and oversight of the fund's activities and associated risks. The Board, acting through its committees, has charged FMR and its affiliates with (i) identifying events or circumstances the occurrence of which could have demonstrably adverse effects on the fund's business and/or reputation; (ii) implementing processes and controls to lessen the possibility that such events or circumstances occur or to mitigate the effects of such events or circumstances if they do occur; and (iii) creating and maintaining a system designed to evaluate continuously business and market conditions in order to facilitate the identification and implementation processes described in (i) and (ii) above. Because the day-to-day operations and activities of the fund are carried out by or through FMR, its affiliates and other service providers, the fund's exposure to risks is mitigated but not eliminated by the processes overseen by the Trustees. While each of the Board's committees has responsibility for overseeing different aspects of the fund's activities, oversight is exercised primarily through the Operations, Audit, and Compliance Committees. In addition, the Independent Trustees have worked with FMR to enhance the Board's oversight of investment and financial risks, legal and regulatory risks, technology risks, and operational risks, including the development of additional risk reporting to the Board. For example, a working group comprised of Independent Trustees and FMR has worked and continues to work to review the Fidelity funds' valuation-related activities, reporting and risk management. Appropriate personnel, including but not limited to the funds' Chief Compliance Officer (CCO), FMR's internal auditor, the independent accountants, the fund's Treasurer and portfolio management personnel, make periodic reports to the Board's committees, as appropriate, including an annual review of FMR's risk management program for the Fidelity funds. The responsibilities of each standing committee, including their oversight responsibilities, are described further under "Standing Committees of the Fund's Trustees."
Annual Report
The fund's Statement of Additional Information (SAI) includes more information about the Trustees. To request a free copy, call Fidelity at 1-800-544-8544.
Interested Trustees*:
Correspondence intended for each Trustee who is an interested person may be sent to Fidelity Investments, 245 Summer Street, Boston, Massachusetts 02210.
|
Name, Year of Birth; Principal Occupations and Other Relevant Experience+ |
|
|
James C. Curvey (1935) |
|
|
|
Year of Election or Appointment: 2007 Mr. Curvey is Trustee and Chairman of the Board of Trustees of certain Trusts. Mr. Curvey also serves as Trustee (2007-present) of other investment companies advised by FMR. Mr. Curvey is a Director of Fidelity Investments Money Management, Inc. (2009-present), Director of Fidelity Research & Analysis Co. (2009-present) and Director of FMR and FMR Co., Inc. (2007-present). Mr. Curvey is also Vice Chairman (2007-present) and Director of FMR LLC. In addition, Mr. Curvey serves as an Overseer for the Boston Symphony Orchestra and a member of the Trustees of Villanova University. Previously, Mr. Curvey was the Vice Chairman (2006-2007) and Director (2000-2007) of FMR Corp. |
|
Ronald P. O'Hanley (1957) |
|
|
|
Year of Election or Appointment: 2011 Mr. O'Hanley is Director of FMR Co., Inc. (2010-present), Director of Fidelity Investments Money Management, Inc. (2010-present), Director of Fidelity Research & Analysis Company (2010-present), President of Fidelity Asset Management and Corporate Services and a member of Fidelity's Executive Committee (2010-present). Previously, Mr. O'Hanley served as President and Chief Executive Officer of BNY Mellon Asset Management (2007-2010). Mr. O'Hanley also served as Vice Chairman of Bank New York Mellon Corp. and a member of that firm's Executive Committee. Prior to the 2007 merger of The Bank of New York and Mellon Financial Corporation, he was Vice Chairman of Mellon Financial Corporation and President and Chief Executive Officer of Mellon Asset Management. He joined Mellon in February 1997. Mr. O'Hanley currently serves as Chairman of the Boston Public Library Foundation Board of Directors and sits on the Board of Directors of Beth Israel Deaconess Medical Center, the Board of Trustees of the Marine Biological Laboratory and the Advisory Board of the Maxwell School of Citizenship and Public Administration at Syracuse University. Mr. O'Hanley also chairs the Council on Asset Management for the Financial Services Roundtable and is a member of the Board of Directors of Institutional Investor's U.S. Institute. |
* Trustees have been determined to be "Interested Trustees" by virtue of, among other things, their affiliation with the trust or various entities under common control with FMR.
+ The information above includes each Trustee's principal occupation during the last five years and other information relating to the experience, attributes, and skills relevant to each Trustee's qualifications to serve as a Trustee, which led to the conclusion that each Trustee should serve as a Trustee for the fund.
Independent Trustees:
Correspondence intended for each Independent Trustee (that is, the Trustees other than the Interested Trustees) may be sent to Fidelity Investments, P.O. Box 55235, Boston, Massachusetts 02205-5235.
|
Name, Year of Birth; Principal Occupations and Other Relevant Experience+ |
|
|
Dennis J. Dirks (1948) |
|
|
|
Year of Election or Appointment: 2005 Prior to his retirement in May 2003, Mr. Dirks was Chief Operating Officer and a member of the Board of The Depository Trust & Clearing Corporation (DTCC). He also served as President, Chief Operating Officer, and Board member of The Depository Trust Company (DTC) and President and Board member of the National Securities Clearing Corporation (NSCC). In addition, Mr. Dirks served as Chief Executive Officer and Board member of the Government Securities Clearing Corporation, Chief Executive Officer and Board member of the Mortgage-Backed Securities Clearing Corporation, as a Trustee and a member of the Finance Committee of Manhattan College (2005-2008), and as a Trustee and a member of the Finance Committee of AHRC of Nassau County (2006-2008). Mr. Dirks is a member of the Independent Directors Council (IDC) Governing Council (2010-present) and Board of Directors for The Brookville Center for Children's Services, Inc. (2009-present). |
|
Alan J. Lacy (1953) |
|
|
|
Year of Election or Appointment: 2008 Mr. Lacy serves as Senior Adviser (2007-present) of Oak Hill Capital Partners, L.P. (private equity). Mr. Lacy also served as Chief Executive Officer (2000-2005) and Vice Chairman (2005-2006) of Sears Holdings Corporation and Sears, Roebuck and Co. (retail). In addition, Mr. Lacy serves as a member of the Board of Directors of Dave & Buster's Entertainment, Inc. (restaurant and entertainment complexes, 2010-present), Earth Fare, Inc. (retail grocery, 2012-present), The Hillman Companies, Inc. (hardware wholesalers, 2010-present), and Bristol-Myers Squibb Company (global pharmaceuticals, 2008-present). Mr. Lacy is a member of the Board of Trustees of The National Parks Conservation Association (2006-present). Previously, Mr. Lacy served as Chairman of the Board of Trustees of the National Parks Conservation Association (2008-2011) and as a member of the Board of Directors for the Western Union Company (global money transfer, 2006-2011). |
|
Ned C. Lautenbach (1944) |
|
|
|
Year of Election or Appointment: 2000 Mr. Lautenbach is Chairman of the Independent Trustees of the Equity and High Income Funds (2006-present). Mr. Lautenbach currently serves as the Lead Director of the Eaton Corporation Board of Directors (diversified industrial, 1997-present). Mr. Lautenbach is Chairman of the Board of Directors of the Philharmonic Center for the Arts in Naples, Florida (2012-present) and a member of the Council on Foreign Relations (1994-present). Previously, Mr. Lautenbach was a Partner/Advisory Partner at Clayton, Dubilier & Rice, LLC (private equity investment, 1998-2010), as well as a Director of Sony Corporation (2006-2007). |
|
Joseph Mauriello (1944) |
|
|
|
Year of Election or Appointment: 2008 Prior to his retirement in January 2006, Mr. Mauriello served in numerous senior management positions including Deputy Chairman and Chief Operating Officer (2004-2005), and Vice Chairman of Financial Services (2002-2004) of KPMG LLP US (professional services, 1965-2005). Mr. Mauriello currently serves as a member of the Board of Directors of XL Group plc. (global insurance and re-insurance, 2006-present). Previously, Mr. Mauriello served as a Director of the Hamilton Funds of the Bank of New York (2006-2007) and of Arcadia Resources Inc. (health care services and products, 2007-2012). |
|
Robert W. Selander (1950) |
|
|
|
Year of Election or Appointment: 2011 Previously, Mr. Selander served as a Member of the Advisory Board of Fidelity's Equity and High Income Funds (2011), Executive Vice Chairman (2010), Chief Executive Officer (2009-2010), and President and Chief Executive Officer (1997-2009) of Mastercard, Inc. |
|
Cornelia M. Small (1944) |
|
|
|
Year of Election or Appointment: 2005 Ms. Small is a member of the Board of Directors (2009-present) and Chair of the Investment Committee (2010-present) of the Teagle Foundation. Ms. Small also serves on the Investment Committee of the Berkshire Taconic Community Foundation (2008-present). Previously, Ms. Small served as Chairperson (2002-2008) and a member of the Investment Committee and Chairperson (2008-2012) and a member of the Board of Trustees of Smith College. In addition, Ms. Small served as Chief Investment Officer, Director of Global Equity Investments, and a member of the Board of Directors of Scudder, Stevens & Clark and Scudder Kemper Investments. |
|
William S. Stavropoulos (1939) |
|
|
|
Year of Election or Appointment: 2001 Mr. Stavropoulos is Vice Chairman of the Independent Trustees of the Equity and High Income Funds (2006-present). Mr. Stavropoulos serves as President and Founder of the Michigan Baseball Foundation, the Great Lakes Loons (2007-present). Mr. Stavropoulos is Chairman Emeritus of the Board of Directors of The Dow Chemical Company, where he previously served in numerous senior management positions, including President, CEO (1995-2000; 2002-2004), Chairman of the Executive Committee (2000-2006), and as a member of the Board of Directors (1990-2006). Currently, Mr. Stavropoulos is a Director of Univar Inc. (global distributor of commodity and specialty chemicals, Chairman from 2010-May 2012 and Lead Director from May 2012-present), Teradata Corporation (data warehousing and technology solutions, 2008-present), Maersk Inc. (industrial conglomerate), and Tyco International, Ltd. (multinational manufacturing and services, 2007-present), and a member of the Advisory Board for Metalmark Capital LLC (private equity investment, 2005-present). Mr. Stavropoulos is an operating advisor to Clayton, Dubilier & Rice, LLC (private equity investment). In addition, Mr. Stavropoulos is a member of the University of Notre Dame Advisory Council for the College of Science, a Trustee of the Rollin L. Gerstacker Foundation, and a Director of the Naples Philharmonic Center for the Arts. Previously, Mr. Stavropoulos served as a Director of Chemical Financial Corporation (bank holding company, 1993-2012). |
|
David M. Thomas (1949) |
|
|
|
Year of Election or Appointment: 2008 |
|
Michael E. Wiley (1950) |
|
|
|
Year of Election or Appointment: 2008 Mr. Wiley also serves as a Director of Asia Pacific Exploration Consolidated (international oil and gas exploration and production, 2008-present). Mr. Wiley serves as a Director of Tesoro Corporation (independent oil refiner and marketer, 2005-present), and a Director of Bill Barrett Corporation (exploration and production, 2005-present). In addition, Mr. Wiley also serves as a Director of Post Oak Bank (privately-held bank, 2004-present). Previously, Mr. Wiley served as a member of the Board of Trustees of the University of Tulsa (2000-2006; 2007-2010), as a Senior Energy Advisor of Katzenbach Partners, LLC (consulting, 2006-2007), as an Advisory Director of Riverstone Holdings (private investment), Chairman, President, and CEO of Baker Hughes, Inc. (oilfield services, 2000-2004), and as Director of Spinnaker Exploration Company (exploration and production, 2001-2005). |
+ The information above includes each Trustee's principal occupation during the last five years and other information relating to the experience, attributes, and skills relevant to each Trustee's qualifications to serve as a Trustee, which led to the conclusion that each Trustee should serve as a Trustee for the fund.
Advisory Board Members and Executive Officers:
Correspondence intended for David A. Rosow and Garnett A. Smith may be sent to Fidelity Investments, P.O. Box 55235, Boston, Massachusetts 02205-5235. Correspondence intended for each executive officer and Peter S. Lynch may be sent to Fidelity Investments, 245 Summer Street, Boston, Massachusetts 02210.
|
Name, Year of Birth; Principal Occupation |
|
|
Peter S. Lynch (1944) |
|
|
|
Year of Election or Appointment: 2003 Member of the Advisory Board of Fidelity's Equity and High Income Funds. Mr. Lynch is Vice Chairman and a Director of FMR and FMR Co., Inc. In addition, Mr. Lynch serves as a Trustee of Boston College and as the Chairman of the Inner-City Scholarship Fund. Previously, Mr. Lynch served on the Special Olympics International Board of Directors (1997-2006). |
|
David A. Rosow (1942) |
|
|
|
Year of Election or Appointment: 2012 Member of the Advisory Board of Fidelity's Equity and High Income Funds. Chairman and Chief Executive Officer of International Golf Group, Inc. (golf course development, 1989-present). Previously, Mr. Rosow served as Chairman and Chief Executive Officer of Rosow & Company, Inc. (private investment company, 1989-2011), a Lead Director of Hudson United Bancorp (2001-2006) and as a Director of TD Banknorth (1996-2006). In addition, Mr. Rosow is a member (2008-present) and President (2009-present) of the Town Council of Palm Beach, Florida. |
|
Garnett A. Smith (1947) |
|
|
|
Year of Election or Appointment: 2012 Member of the Advisory Board of Fidelity's Equity and High Income Funds. Prior to Mr. Smith's retirement, he served as Chairman and Chief Executive Officer of Inbrand Corp. (manufacturer of personal absorbent products, 1990-1997). He also served as President (1986-1990) of Inbrand Corp. Prior to his employment with Inbrand Corp., he was employed by a retail fabric chain and North Carolina National Bank. In addition, Mr. Smith is a board member of the Jackson Hole Land Trust (2009-present). |
|
Kenneth B. Robins (1969) |
|
|
|
Year of Election or Appointment: 2008 President and Treasurer of Fidelity's Equity and High Income Funds. Mr. Robins also serves as President and Treasurer (2010-present) and Assistant Treasurer (2009-present) of other Fidelity funds and is an employee of Fidelity Investments (2004-present). Previously, Mr. Robins served as Deputy Treasurer of the Fidelity funds (2005-2008) and Treasurer and Chief Financial Officer of The North Carolina Capital Management Trust: Cash and Term Portfolios (2006-2008). |
|
Brian B. Hogan (1964) |
|
|
|
Year of Election or Appointment: 2009 Vice President of Equity and High Income Funds. Mr. Hogan also serves as President of FMR's Equity Division (2009-present). Previously, Mr. Hogan served as Senior Vice President, Equity Research of FMR (2006-2009) and as a portfolio manager. |
|
Christopher S. Bartel (1971) |
|
|
|
Year of Election or Appointment: 2009 Vice President of Fidelity's Sector and Real Estate Equity Funds. Mr. Bartel also serves as a Director, President, and Chief Executive Officer of Fidelity Management & Research (Japan) Inc. (2012-present), a Director of Fidelity Management & Research (Hong Kong) (2012-present), and Senior Vice President of Global Equity Research (2010-present). Previously, Mr. Bartel served as Senior Vice President of Equity Research (2009-2010), Managing Director of Research (2006-2009), and an analyst and portfolio manager (2000-2006). |
|
Scott C. Goebel (1968) |
|
|
|
Year of Election or Appointment: 2008 Secretary and Chief Legal Officer (CLO) of the Fidelity funds. Mr. Goebel also serves as Secretary of Fidelity Investments Money Management, Inc. (FIMM) (2010-present) and Fidelity Research and Analysis Company (FRAC) (2010-present); Secretary and CLO of The North Carolina Capital Management Trust: Cash and Term Portfolios (2008-present); General Counsel, Secretary, and Senior Vice President of FMR (2008-present) and FMR Co., Inc. (2008-present); employed by FMR LLC or an affiliate (2001-present); Chief Legal Officer of Fidelity Management & Research (Hong Kong) Limited (2008-present) and Assistant Secretary of Fidelity Management & Research (Japan) Inc. (2008-present), and Fidelity Management & Research (U.K.) Inc. (2008-present). Previously, Mr. Goebel served as Assistant Secretary of FIMM (2008-2010), FRAC (2008-2010), and the Funds (2007-2008) and as Vice President and Secretary of Fidelity Distributors Corporation (FDC) (2005-2007). |
|
William C. Coffey (1969) |
|
|
|
Year of Election or Appointment: 2009 Assistant Secretary of Fidelity's Equity and High Income Funds. Mr. Coffey also serves as Senior Vice President and Deputy General Counsel of FMR LLC (2010-present), and is an employee of Fidelity Investments. Previously, Mr. Coffey served as Vice President and Associate General Counsel of FMR LLC (2005-2009). |
|
Elizabeth Paige Baumann (1968) |
|
|
|
Year of Election or Appointment: 2012 Anti-Money Laundering (AML) Officer of the Fidelity funds. Ms. Baumann also serves as AML Officer of The North Carolina Capital Management Trust: Cash and Term Portfolios (2012-present), Chief AML Officer of FMR LLC (2012-present), and is an employee of Fidelity Investments. Previously, Ms. Baumann served as Vice President and Deputy Anti-Money Laundering Officer (2007-2012). |
|
Christine Reynolds (1958) |
|
|
|
Year of Election or Appointment: 2008 Chief Financial Officer of the Fidelity funds. Ms. Reynolds became President of Fidelity Pricing and Cash Management Services (FPCMS) in August 2008. Ms. Reynolds served as Chief Operating Officer of FPCMS (2007-2008). Previously, Ms. Reynolds served as President, Treasurer, and Anti-Money Laundering officer of the Fidelity funds (2004-2007). |
|
Joseph A. Hanlon (1968) |
|
|
|
Year of Election or Appointment: 2012 Chief Compliance Officer of Fidelity's Equity and High Income Funds. Mr. Hanlon serves as Compliance Officer of FMR, FMR Co., Inc., Fidelity Investments Money Management, Inc. (FIMM), Fidelity Research and Analysis Company (FRAC), Fidelity Management & Research (Japan) Inc., Fidelity Management & Research (U.K.) Inc., Fidelity Management & Research (Hong Kong), and Strategic Advisers, Inc. (2009-present), as Senior Vice President of the Fidelity Asset Management Division (2009-present), and is an employee of Fidelity Investments. |
|
Joseph F. Zambello (1957) |
|
|
|
Year of Election or Appointment: 2011 Deputy Treasurer of the Fidelity funds. Mr. Zambello is an employee of Fidelity Investments. Previously, Mr. Zambello served as Vice President of FMR's Program Management Group (2009-2011) and Vice President of the Transfer Agent Oversight Group (2005-2009). |
|
Adrien E. Deberghes (1967) |
|
|
|
Year of Election or Appointment: 2008 Deputy Treasurer of Fidelity's Equity and High Income Funds. Mr. Deberghes also serves as Vice President (2011-present) and Assistant Treasurer (2010-present) of other Fidelity funds, and is an employee of Fidelity Investments (2008-present). Previously, Mr. Deberghes served as Senior Vice President of Mutual Fund Administration at State Street Corporation (2007-2008), Senior Director of Mutual Fund Administration at Investors Bank & Trust (2005-2007), and Director of Finance for Dunkin' Brands (2000-2005). |
|
Stephen Sadoski (1971) |
|
|
|
Year of Election or Appointment: 2012 Deputy Treasurer of Fidelity's Equity and High Income Funds. Mr. Sadoski also serves as Deputy Treasurer of other Fidelity funds (2013-present) and is an employee of Fidelity Investments (2012-present). Previously, Mr. Sadoski served as Assistant Treasurer of Fidelity's Fixed Income and Asset Allocation Funds (2012-2013), an assistant chief accountant in the Division of Investment Management of the Securities and Exchange Commission (SEC) (2009-2012) and as a senior manager at Deloitte & Touche (1997-2009). |
|
Stacie Smith (1974) |
|
|
|
Year of Election or Appointment: 2013 Deputy Treasurer of Fidelity's Equity and High Income Funds. Ms. Smith is an employee of Fidelity Investments (2009-present). Previously, Ms. Smith served as Senior Audit Manager of Ernst & Young LLP (1996-2009). |
|
Stephanie J. Dorsey (1969) |
|
|
|
Year of Election or Appointment: 2010 Assistant Treasurer of Fidelity's Equity and High Income Funds. Ms. Dorsey also serves as President and Treasurer (2013-present) and Assistant Treasurer (2012-present) of other Fidelity funds and is an employee of Fidelity Investments (2008-present). Previously, Ms. Dorsey served as Deputy Treasurer of Fidelity's Fixed Income and Asset Allocation Funds (2008-2013), Treasurer (2004-2008) of the JPMorgan Mutual Funds and Vice President (2004-2008) of JPMorgan Chase Bank. |
|
John R. Hebble (1958) |
|
|
|
Year of Election or Appointment: 2009 Assistant Treasurer of Fidelity's Equity and High Income Funds. Mr. Hebble also serves as President (2011-present), Treasurer, and Chief Financial Officer of The North Carolina Capital Management Trust: Cash and Term Portfolios (2008-present) and is an employee of Fidelity Investments. Previously, Mr. Hebble served as President and Treasurer of Fidelity's Fixed Income and Asset Allocation Funds (2008-2013). |
|
Gary W. Ryan (1958) |
|
|
|
Year of Election or Appointment: 2005 Assistant Treasurer of the Fidelity funds. Mr. Ryan is an employee of Fidelity Investments. Previously, Mr. Ryan served as Vice President of Fund Reporting in Fidelity Pricing and Cash Management Services (FPCMS) (1999-2005). |
|
Jonathan Davis (1968) |
|
|
|
Year of Election or Appointment: 2010 Assistant Treasurer of the Fidelity funds. Mr. Davis is also Assistant Treasurer of Fidelity Rutland Square Trust II and Fidelity Commonwealth Trust II. Mr. Davis is an employee of Fidelity Investments. Previously, Mr. Davis served as Vice President and Associate General Counsel of FMR LLC (2003-2010). |
Annual Report
Distributions (Unaudited)
The Board of Trustees of Consumer Staples Portfolio voted to pay on April 15, 2013 to shareholders of record at the opening of business on April 12, 2013, a distribution of $2.121 per share derived from capital gains realized from sales of portfolio securities and a dividend of $0.212 per share from net investment income.
The fund hereby designates as a capital gain dividend with respect to the taxable year ended February 28, 2013, $81,679,202 or, if subsequently determined to be different, the net capital gain of such year.
Consumer Staples designates 100% of the dividends distributed during the fiscal year as qualifying for the dividends-received deduction for corporate shareholders.
Consumer Staples designates 100% of the dividends distributed during the fiscal year as amounts which may be taken into account as a dividend for the purposes of the maximum rate under section 1(h)(11) of the Internal Revenue Code.
The fund will notify shareholders in January 2014 of amounts for use in preparing 2013 income tax returns.
Annual Report
Board Approval of Investment Advisory Contracts and Management Fees
Consumer Staples Portfolio
On November 14, 2012, the Board of Trustees, including the Independent Trustees (together, the Board), voted to approve a new management contract (the New Contract) between the fund and Fidelity SelectCo, LLC (SelectCo) and to submit the New Contract to shareholders for their approval. If the New Contract is approved by shareholders, effective August 1, 2013, SelectCo will serve as investment adviser to the fund. The terms of the New Contract are identical to those of the current management contract with FMR (the Current Contract), except with respect to the name of the investment adviser and the dates of execution and the initial two-year term of the contract. The Board, assisted by the advice of fund counsel and Independent Trustees' counsel, considered a broad range of information.
In determining whether to approve the New Contract for the fund, the Board was aware that shareholders in the fund have a broad range of investment choices available to them, including a wide choice among mutual funds offered by competitors to Fidelity, and that the fund's shareholders, with the opportunity to review and weigh the disclosure provided by the fund in its prospectus and other public disclosures, have chosen to invest in the fund, managed by Fidelity.
Nature, Extent, and Quality of Services Provided. The Board considered the nature, quality, cost and extent of the services to be provided by SelectCo under the New Contract as well as the nature, quality, cost and extent of the advisory, administrative, distribution and shareholder services performed by the FMR and the sub-advisers, and by affiliated companies. The Board considered that, upon shareholder approval, SelectCo will render the same services to the fund under the New Contract that FMR currently renders to the fund under the Current Contract. The Board also considered that the New Contract would not result in any changes to (i) the investment process or strategies employed in the management of the fund's assets or (ii) the day-to-day management of the fund or the persons primarily responsible for such management.
Throughout the year, the Trustees had discussions with FMR about plans to establish SelectCo as a new investment adviser to manage sector-based funds and products. The Trustees considered Fidelity's rationale for creating a separate investment adviser and noted that a separate investment adviser may be better positioned to focus on opportunities for growth within the sector investing space and to focus on a distinct approach to sector investing and research.
Shareholder and Administrative Services. The Board noted that the growth of fund assets across the complex allows Fidelity to reinvest in the development of services designed to enhance the value or convenience of the Fidelity funds as investment vehicles. These services include 24-hour access to account information and market information through phone representatives and over the Internet, and investor education materials and asset allocation tools.
Investment in a Large Fund Family. The Board considered the benefits to shareholders of investing in a Fidelity fund, including the benefits of investing in a fund that is part of a large family of funds offering a variety of investment disciplines and providing for a large variety of mutual fund shareholder services.
Investment Performance. The Board did not consider performance to be a material factor in its decision to approve the New Contract because the New Contract would not result in any changes to the fund's investment processes or strategies or in the persons primarily responsible for the day-to-day management of the fund.
Based on its review, the Board concluded that the nature, extent, and quality of the services provided to the fund will benefit the fund's shareholders, particularly in light of the Board's view that the fund's shareholders benefit from investing in a fund that is part of a large family of funds offering a variety of investment disciplines and services.
Competitiveness of Management Fee and Total Fund Expenses. The Board considered that, if approved by shareholders, the New Contract would not result in any changes to the amount of the management fee paid by the fund, except that such fee would be paid to SelectCo rather than FMR. The Board noted that at previous meetings during the year it received and considered materials relating to its review of the management fee of the fund. This information includes comparisons that focus on the fund's standing relative to the total universe of comparable funds available to investors in terms of gross management fees before expense reimbursements or caps, as well as the fund's standing relative to non-Fidelity funds similar in size to the fund within the comparison group.
Based on its review, the Board concluded that the fund's management fee was fair and reasonable in light of the services that the fund receives and the other factors considered.
Because there are no expected changes in the fund's management fee under the New Contract, the Board will review the fund's total expenses compared to competitive fund median expenses in connection with its future consideration of the renewal of the fund's management contract and sub-advisory agreements.
In its review of total expenses, the Board also noted that at previous meetings during the year it received and considered materials relating to its review of total expenses for each Fidelity fund. This information includes Fidelity fee structures and other information with respect to clients of FMR and its affiliates, such as other mutual funds advised or sub-advised by FMR or its affiliates, pension plan clients, and other institutional clients.
Annual Report
Board Approval of Investment Advisory Contracts and Management Fees - continued
Costs of the Services and Profitability. Because there were no changes to the services to be provided or fees to be charged to the fund under the New Contract, the Board did not consider data regarding the impact on Fidelity's costs of services, revenues, or profitability from the new arrangement to be a significant factor in its decision.
In connection with its future consideration of the renewal of the fund's management contract and sub-advisory agreements, the Board will consider the revenues earned and the expenses incurred by Fidelity in conducting the business of developing, marketing, distributing, managing, administering and servicing the fund and its shareholders.
Economies of Scale. The Board recognized that the New Contract, like the Current Contract, incorporates a "group fee" structure, which provides for lower fee rates as total fund assets under FMR's management increase, and for higher fee rates as total fund assets under FMR's management decrease. The Board considered that the group fee is designed to deliver the benefits of economies of scale to fund shareholders when total fund assets increase, even if assets of any particular fund are unchanged or have declined, because some portion of Fidelity's costs are attributable to services provided to all Fidelity funds, and all funds benefit if those costs can be allocated among more assets. The Board concluded that, given the group fee structure, fund shareholders will achieve a certain level of economies of scale as assets under FMR's management increase at the fund complex level, regardless of whether Fidelity achieves any such economies of scale.
In connection with its future consideration of the renewal of the fund's management contract and sub-advisory agreements, the Board will consider whether there have been economies of scale in respect of the management of the Fidelity funds, whether the Fidelity funds (including the fund) have appropriately benefited from any such economies of scale, and whether there is potential for realization of any further economies of scale.
Based on its evaluation of all of the conclusions noted above, and after considering all material factors, the Board ultimately concluded that the New Contract is fair and reasonable, and that the New Contract should be approved and submitted to the fund's shareholders for their approval.
Annual Report
Investment Adviser
Fidelity Management & Research Company
Boston, MA
Investment Sub-Advisers
FMR Co., Inc.
Fidelity Management & Research
(U.K.) Inc.
Fidelity Management & Research
(Hong Kong) Limited
Fidelity Management & Research
(Japan) Inc.
General Distributor
Fidelity Distributors Corporation
Smithfield, RI
Transfer and Service Agents
Fidelity Investments Institutional
Operations Company, Inc.
Boston, MA
Fidelity Service Company, Inc.
Boston, MA
Custodian
Brown Brothers Harriman & Co.
Boston, MA
Corporate Headquarters
245 Summer Street
Boston, MA 02210
1-800-544-8888
The Fidelity Telephone Connection
Mutual Fund 24-Hour Service
Exchanges/Redemptions
and Account Assistance 1-800-544-6666
Product Information 1-800-544-8888
Retirement Accounts 1-800-544-4774
(8 a.m. - 9 p.m.)
TDD Service 1-800-544-0118
for the deaf and hearing impaired
(9 a.m. - 9 p.m. Eastern time)
Fidelity Automated Service
Telephone (FAST®) 
1-800-544-5555
Automated line for quickest service
SELCS-UANNPRO-0413
1.910418.103
Fidelity®
Select Portfolios®
Industrials Sector
Air Transportation Portfolio
Defense and Aerospace Portfolio
Environment and Alternative Energy Portfolio
Industrial Equipment Portfolio
Industrials Portfolio
Transportation Portfolio
Annual Report
February 28, 2013
(Fidelity Cover Art)
Contents
|
Shareholder Expense Example |
|
|
|
Air Transportation Portfolio |
Performance |
|
|
|
Management's Discussion |
|
|
|
Investment Changes |
|
|
|
Investments |
|
|
|
Financial Statements |
|
|
Defense and Aerospace Portfolio |
Performance |
|
|
|
Management's Discussion |
|
|
|
Investment Changes |
|
|
|
Investments |
|
|
|
Financial Statements |
|
|
Environment and Alternative Energy Portfolio |
Performance |
|
|
|
Management's Discussion |
|
|
|
Investment Changes |
|
|
|
Investments |
|
|
|
Financial Statements |
|
|
Industrial Equipment Portfolio |
Performance |
|
|
|
Management's Discussion |
|
|
|
Investment Changes |
|
|
|
Investments |
|
|
|
Financial Statements |
|
|
Industrials Portfolio |
Performance |
|
|
|
Management's Discussion |
|
|
|
Investment Changes |
|
|
|
Investments |
|
|
|
Financial Statements |
|
|
Transportation Portfolio |
Performance |
|
|
|
Management's Discussion |
|
|
|
Investment Changes |
|
|
|
Investments |
|
|
|
Financial Statements |
|
|
Notes to Financial Statements |
|
|
|
Report of Independent Registered Public Accounting Firm |
|
|
|
Trustees and Officers |
|
|
|
Distributions |
|
|
|
Board Approval of Investment Advisory Contracts and Management Fees |
|
Annual Report
To view a fund's proxy voting guidelines and proxy voting record for the 12-month period ended June 30, visit http://www.fidelity.com/proxyvotingresults or visit the Securities and Exchange Commission's (SEC) web site at http://www.sec.gov. You may also call 1-800-544-8544 to request a free copy of the proxy voting guidelines.
Standard & Poor's, S&P and S&P 500 are registered service marks of The McGraw-Hill Companies, Inc. and have been licensed for use by Fidelity Distributors Corporation.
Other third-party marks appearing herein are the property of their respective owners.
All other marks appearing herein are registered or unregistered trademarks or service marks of FMR LLC or an affiliated company. © 2013 FMR LLC. All rights reserved.
This report and the financial statements contained herein are submitted for the general information of the shareholders of the funds. This report is not authorized for distribution to prospective investors in the funds unless preceded or accompanied by an effective prospectus.
A fund files its complete schedule of portfolio holdings with the SEC for the first and third quarters of each fiscal year on Form N-Q. Forms N-Q are available on the SEC's web site at http://www.sec.gov. A fund's Forms N-Q may be reviewed and copied at the SEC's Public Reference Room in Washington, DC. Information regarding the operation of the SEC's Public Reference Room may be obtained by calling 1-800-SEC-0330. For a complete list of a fund's portfolio holdings, view the most recent holdings listing, semiannual report, or annual report on Fidelity's web site at http://www.fidelity.com, http://www.advisor.fidelity.com, or http://www.401k.com, as applicable.
NOT FDIC INSURED • MAY LOSE VALUE • NO BANK GUARANTEE
Neither the funds nor Fidelity Distributors Corporation is a bank.
Annual Report
Select Portfolios
Shareholder Expense Example
As a shareholder of a Fund, you incur two types of costs: (1) transaction costs, including redemption fees and (2) ongoing costs, including management fees and other Fund expenses. This Example is intended to help you understand your ongoing costs (in dollars) of investing in the Funds and to compare these costs with the ongoing costs of investing in other mutual funds.
The Example is based on an investment of $1,000 invested at the beginning of the period and held for the entire period (September 1, 2012 to February 28, 2013).
Actual Expenses
The first line of the accompanying table for each fund provides information about actual account values and actual expenses. You may use the information in this line, together with the amount you invested, to estimate the expenses that you paid over the period. Simply divide your account value by $1,000.00 (for example, an $8,600 account value divided by $1,000.00 = 8.6), then multiply the result by the number in the first line for a fund under the heading entitled "Expenses Paid During Period" to estimate the expenses you paid on your account during this period. A small balance maintenance fee of $12.00 that is charged once a year may apply for certain accounts with a value of less than $2,000. This fee is not included in the table below. If it was, the estimate of expenses you paid during the period would be higher, and your ending account value lower, by this amount. In addition, each Fund, as a shareholder in the underlying Fidelity Central Funds, will indirectly bear its pro-rata share of the fees and expenses incurred by the underlying Fidelity Central Funds. These fees and expenses are not included in the Fund's annualized expense ratio used to calculate the expense estimate in the table below.
Hypothetical Example for Comparison Purposes
The second line of the accompanying table for each fund provides information about hypothetical account values and hypothetical expenses based on a fund's actual expense ratio and an assumed rate of return of 5% per year before expenses, which is not the Fund's actual return. The hypothetical account values and expenses may not be used to estimate the actual ending account balance or expenses you paid for the period. You may use this information to compare the ongoing costs of investing in the Fund and other funds. To do so, compare this 5% hypothetical example with the 5% hypothetical examples that appear in the shareholder reports of the other funds. A small balance maintenance fee of $12.00 that is charged once a year may apply for certain accounts with a value of less than $2,000. This fee is not included in the table below. If it was, the estimate of expenses you paid during the period would be higher, and your ending account value lower, by this amount. In addition, each Fund, as a shareholder in the underlying Fidelity Central Funds, will indirectly bear its pro-rata share of the fees and expenses incurred by the underlying Fidelity Central Funds. These fees and expenses are not included in the Fund's annualized expense ratio used to calculate the expense estimate in the table below.
Please note that the expenses shown in the table are meant to highlight your ongoing costs only and do not reflect any transaction costs. Therefore, the second line of the table is useful in comparing ongoing costs only, and will not help you determine the relative total costs of owning different funds. In addition, if these transactional costs were included, your costs would have been higher.
|
|
Annualized |
Beginning |
Ending |
Expenses Paid |
|
Air Transportation Portfolio |
.92% |
|
|
|
|
Actual |
|
$ 1,000.00 |
$ 1,219.40 |
$ 5.06 |
|
Hypothetical A |
|
$ 1,000.00 |
$ 1,020.23 |
$ 4.61 |
|
Defense and Aerospace Portfolio |
.84% |
|
|
|
|
Actual |
|
$ 1,000.00 |
$ 1,124.90 |
$ 4.43 |
|
Hypothetical A |
|
$ 1,000.00 |
$ 1,020.63 |
$ 4.21 |
|
Environment and Alternative Energy Portfolio |
.97% |
|
|
|
|
Actual |
|
$ 1,000.00 |
$ 1,154.00 |
$ 5.18 |
|
Hypothetical A |
|
$ 1,000.00 |
$ 1,019.98 |
$ 4.86 |
|
Industrial Equipment Portfolio |
.81% |
|
|
|
|
Actual |
|
$ 1,000.00 |
$ 1,143.50 |
$ 4.30 |
|
Hypothetical A |
|
$ 1,000.00 |
$ 1,020.78 |
$ 4.06 |
|
Industrials Portfolio |
.84% |
|
|
|
|
Actual |
|
$ 1,000.00 |
$ 1,169.70 |
$ 4.52 |
|
HypotheticalA |
|
$ 1,000.00 |
$ 1,020.63 |
$ 4.21 |
|
Transportation Portfolio |
.88% |
|
|
|
|
Actual |
|
$ 1,000.00 |
$ 1,192.80 |
$ 4.78 |
|
Hypothetical A |
|
$ 1,000.00 |
$ 1,020.43 |
$ 4.41 |
A 5% return per year before expenses
* Expenses are equal to each Fund's annualized expense ratio, multiplied by the average account value over the period, multiplied by 181/365 (to reflect the one-half year period).
Annual Report
Air Transportation Portfolio
Performance: The Bottom Line
Average annual total return reflects the change in the value of an investment, assuming reinvestment of the fund's distributions from dividend income and capital gains (the profits earned upon the sale of securities that have grown in value, if any) and assuming a constant rate of performance each year. The $10,000 table and the fund's returns do not reflect the deduction of taxes that a shareholder would pay on fund distributions or the redemption of fund shares. During periods of reimbursement by Fidelity, a fund's total return will be greater than it would be had the reimbursement not occurred. How a fund did yesterday is no guarantee of how it will do tomorrow.
Average Annual Total Returns
|
Periods ended February 28, 2013 |
Past 1 |
Past 5 |
Past 10 |
|
Air Transportation Portfolio |
17.62% |
8.59% |
13.12% |
$10,000 Over 10 Years
Let's say hypothetically that $10,000 was invested in Air Transportation Portfolio on February 28, 2003. The chart shows how the value of your investment would have changed, and also shows how the S&P 500® Index performed over the same period.
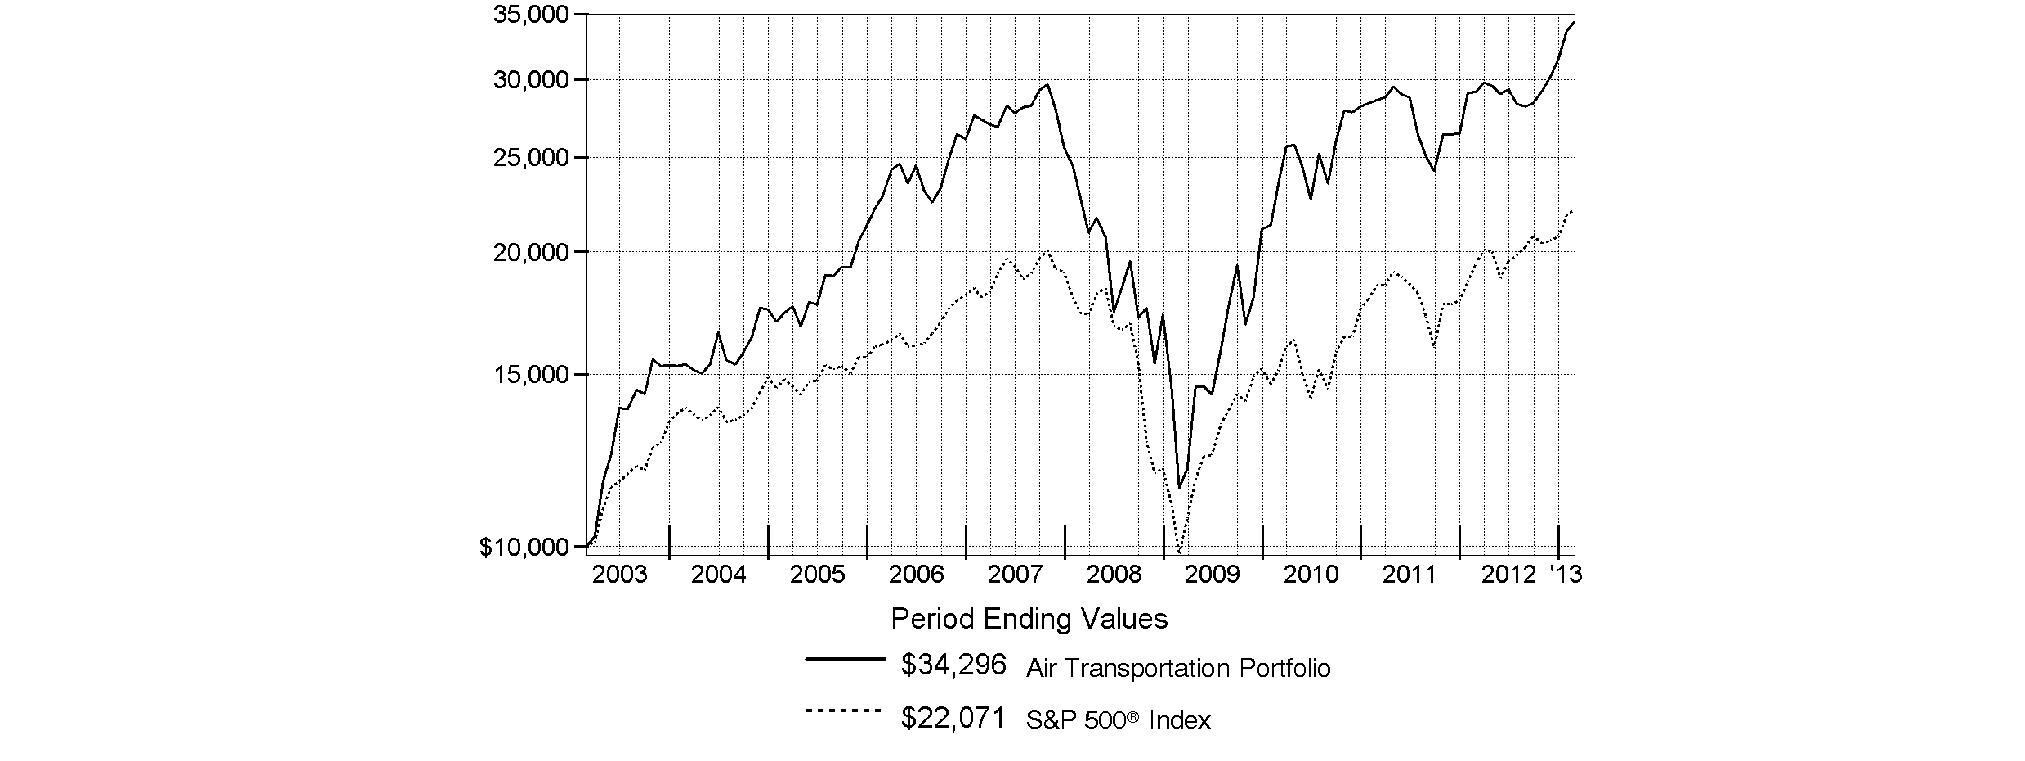
Annual Report
Air Transportation Portfolio
Management's Discussion of Fund Performance
Market Recap: U.S. stocks posted solid gains for the year ending February 28, 2013, sparked by a late-period rally that pushed major equity benchmarks to multiyear highs. Improvement in the global economy and more monetary stimulus from the U.S. Federal Reserve kept markets on the upswing for much of the year, shrugging off an early decline brought on by debt woes in Europe, and another dip later in the period amid Congressional gridlock on the federal budget. Renewed optimism over employment, the housing market, corporate earnings and record dividends made stocks a favorite with investors during the 12 months, which helped push the broad-based S&P 500® Index across the milestone 1,500 mark at the end of January. The S&P 500® finished the period up 13.46%. Seven of the 10 major market sectors tracked by MSCI U.S. IMI 25-50 classifications produced double-digit gains, led by health care and financials, while information technology, energy and materials trailed the broad equity market with only modest advances.
Comments from Matthew Moulis, who became sole Portfolio Manager of Air Transportation Portfolio on June 30, 2012, after serving as Co-Manager: For the year, the fund returned 17.62%, well ahead of the 15.65% gain of the S&P® Custom Air Transportation Index and the 13.46% advance of the broadly based S&P 500® Index. Stocks in the fund's universe were lifted by extremely strong performance in the airline group, which accounts for almost one-third of our industry benchmark. Compared with its industry index, the fund was aided the most by stock selection and an underweighting in the aerospace and defense group, which managed only a modest gain during the period. I reduced the fund's exposure here and added to its stake in airlines during the period. Also bolstering the fund's results were stock picking and an underweighting in air freight and logistics. Timely ownership of Spirit AeroSystems Holdings, the fund's top relative contributor and an important subcontractor of commercial aircraft maker Boeing, made this stock the fund's top relative contributor. The share price of this manufacturer of fuselages and other key aircraft components took a hit near the end of October, after the company announced some charges against third-quarter earnings. I established an underweighted position in the stock around this time, but not owning it in October was what really benefited us here. Underweighting Boeing itself also proved rewarding, as did lighter-than-index exposure to Bombardier, a manufacturer of regional jets and rail equipment, and freight forwarding provider Expeditors International of Washington. Among stocks I liked, I'll mention three airline holdings that helped the fund's performance: U.K.-based Dart Group, SkyWest and Panama's Copa Holdings. All of these companies operate in profitable niches that enabled them to avoid direct competition with the industry's major players. Dart Group and Copa Holdings were non-index positions. Conversely, a cash position averaging 6% of the fund's net assets weighed on performance against the backdrop of a strongly rising market. Currency fluctuation also hindered performance, given the fund's investments in foreign stocks. At the stock level, not owning index component Air Canada worked against us. Although this legacy airline had some structural challenges that I thought it prudent to avoid, including high labor costs and a stretched balance sheet, the stock responded positively to some progress the company made in addressing its pension liabilities. In the case of US Airways Group, the fund was underweighted for much of the period, which detracted because this stock rallied strongly. Rockwell Collins was one of the few aerospace and defense holdings in which the fund had heavier-than-benchmark exposure. While I liked the company's niche in avionics and its strong financial position, the stock lagged.
The views expressed above reflect those of the portfolio manager(s) only through the end of the period as stated on the cover of this report and do not necessarily represent the views of Fidelity or any other person in the Fidelity organization. Any such views are subject to change at any time based upon market or other conditions and Fidelity disclaims any responsibility to update such views. These views may not be relied on as investment advice and, because investment decisions for a Fidelity fund are based on numerous factors, may not be relied on as an indication of trading intent on behalf of any Fidelity fund.
Annual Report
Air Transportation Portfolio
Investment Changes (Unaudited)
|
Top Ten Stocks as of February 28, 2013 |
||
|
|
% of fund's |
% of fund's net assets |
|
United Parcel Service, Inc. Class B |
13.4 |
12.6 |
|
FedEx Corp. |
8.8 |
6.6 |
|
Delta Air Lines, Inc. |
6.4 |
4.2 |
|
Textron, Inc. |
6.2 |
5.9 |
|
Rockwell Collins, Inc. |
4.8 |
5.3 |
|
The Boeing Co. |
4.6 |
5.6 |
|
United Continental Holdings, Inc. |
4.6 |
3.3 |
|
WestJet Airlines Ltd. |
4.3 |
4.0 |
|
Precision Castparts Corp. |
3.7 |
4.8 |
|
C.H. Robinson Worldwide, Inc. |
3.5 |
3.0 |
|
|
60.3 |
|
|
Top Industries (% of fund's net assets) |
|||
|
As of February 28, 2013 |
|||
 |
Airlines |
34.4% |
|
 |
Air Freight & Logistics |
31.9% |
|
 |
Aerospace & Defense |
24.6% |
|
 |
Road & Rail |
1.5% |
|
 |
Industrial Conglomerates |
0.5% |
|
 |
All Others* |
7.1% |
|

|
As of August 31, 2012 |
|||
|
Air Freight & Logistics |
32.4% |
|
|
Airlines |
31.3% |
|
|
Aerospace & Defense |
26.1% |
|
|
Road & Rail |
0.5% |
|
|
Transportation Infrastructure |
0.5% |
|
|
All Others* |
9.2% |
|

|
* Includes short-term investments and net other assets. |
Annual Report
Air Transportation Portfolio
Investments February 28, 2013
Showing Percentage of Net Assets
|
Common Stocks - 93.3% |
|||
|
Shares |
Value |
||
|
AEROSPACE & DEFENSE - 24.6% |
|||
|
Aerospace & Defense - 24.6% |
|||
|
Bombardier, Inc. Class B (sub. vtg.) |
190,700 |
$ 767,423 |
|
|
Ducommun, Inc. (a) |
101,000 |
1,565,500 |
|
|
General Dynamics Corp. |
6,400 |
435,008 |
|
|
Meggitt PLC |
66,545 |
458,928 |
|
|
Precision Castparts Corp. |
17,800 |
3,321,302 |
|
|
Rockwell Collins, Inc. |
73,000 |
4,388,030 |
|
|
Spirit AeroSystems Holdings, Inc. |
69,400 |
1,208,254 |
|
|
Textron, Inc. (d) |
193,800 |
5,591,130 |
|
|
The Boeing Co. |
54,200 |
4,167,980 |
|
|
United Technologies Corp. |
5,000 |
452,750 |
|
|
|
22,356,305 |
||
|
AIR FREIGHT & LOGISTICS - 31.9% |
|||
|
Air Freight & Logistics - 31.9% |
|||
|
Atlas Air Worldwide Holdings, Inc. (a) |
34,400 |
1,623,336 |
|
|
C.H. Robinson Worldwide, Inc. |
55,700 |
3,176,014 |
|
|
Expeditors International of Washington, Inc. |
27,400 |
1,064,490 |
|
|
FedEx Corp. |
75,600 |
7,970,508 |
|
|
Forward Air Corp. |
55,900 |
2,108,548 |
|
|
Hub Group, Inc. Class A (a) |
6,100 |
230,153 |
|
|
Kintetsu World Express, Inc. |
3,100 |
110,368 |
|
|
United Parcel Service, Inc. Class B |
147,300 |
12,174,345 |
|
|
UTI Worldwide, Inc. |
32,800 |
499,544 |
|
|
|
28,957,306 |
||
|
AIRLINES - 34.4% |
|||
|
Airlines - 34.4% |
|||
|
Alaska Air Group, Inc. (a) |
49,500 |
2,551,725 |
|
|
Copa Holdings SA Class A |
4,300 |
449,006 |
|
|
Dart Group PLC |
353,386 |
777,351 |
|
|
Delta Air Lines, Inc. (a) |
408,402 |
5,827,897 |
|
|
JetBlue Airways Corp. (a)(d) |
76,700 |
464,802 |
|
|
Republic Airways Holdings, Inc. (a) |
175,900 |
1,655,219 |
|
|
Ryanair Holdings PLC sponsored ADR |
64,900 |
2,509,034 |
|
|
SkyWest, Inc. |
181,500 |
2,541,000 |
|
|
Southwest Airlines Co. |
267,400 |
3,128,580 |
|
|
Spirit Airlines, Inc. (a) |
4,600 |
93,150 |
|
|
United Continental Holdings, Inc. (a) |
155,985 |
4,166,359 |
|
|
US Airways Group, Inc. (a) |
232,000 |
3,115,760 |
|
|
WestJet Airlines Ltd. |
186,600 |
3,944,611 |
|
|
|
31,224,494 |
||
|
|
|||
|
Shares |
Value |
||
|
INDUSTRIAL CONGLOMERATES - 0.5% |
|||
|
Industrial Conglomerates - 0.5% |
|||
|
General Electric Co. |
19,500 |
$ 452,790 |
|
|
MACHINERY - 0.2% |
|||
|
Construction & Farm Machinery & Heavy Trucks - 0.2% |
|||
|
ASL Marine Holdings Ltd. |
240,000 |
139,535 |
|
|
MEDIA - 0.2% |
|||
|
Movies & Entertainment - 0.2% |
|||
|
Advanced Inflight Alliance AG |
28,200 |
198,809 |
|
|
ROAD & RAIL - 1.5% |
|||
|
Trucking - 1.5% |
|||
|
Landstar System, Inc. |
12,300 |
692,367 |
|
|
Ryder System, Inc. |
3,800 |
213,560 |
|
|
Universal Truckload Services, Inc. |
27,600 |
503,424 |
|
|
|
1,409,351 |
||
|
TOTAL COMMON STOCKS (Cost $63,527,958) |
|
||
|
Money Market Funds - 9.3% |
|||
|
|
|
|
|
|
Fidelity Cash Central Fund, 0.16% (b) |
5,823,591 |
5,823,591 |
|
|
Fidelity Securities Lending Cash Central Fund, 0.16% (b)(c) |
2,663,650 |
2,663,650 |
|
|
TOTAL MONEY MARKET FUNDS (Cost $8,487,241) |
|
||
|
TOTAL INVESTMENT PORTFOLIO - 102.6% (Cost $72,015,199) |
93,225,831 |
||
|
NET OTHER ASSETS (LIABILITIES) - (2.6)% |
(2,388,949) |
||
|
NET ASSETS - 100% |
$ 90,836,882 |
||
|
Legend |
|
(a) Non-income producing |
|
(b) Affiliated fund that is available only to investment companies and other accounts managed by Fidelity Investments. The rate quoted is the annualized seven-day yield of the fund at period end. A complete unaudited listing of the fund's holdings as of its most recent quarter end is available upon request. In addition, each Fidelity Central Fund's financial statements, which are not covered by the Fund's Report of Independent Registered Public Accounting Firm, are available on the SEC's website or upon request. |
|
(c) Investment made with cash collateral received from securities on loan. |
|
(d) Security or a portion of the security is on loan at period end. |
|
Affiliated Central Funds |
|
Information regarding fiscal year to date income earned by the Fund from investments in Fidelity Central Funds is as follows: |
|
Fund |
Income earned |
|
Fidelity Cash Central Fund |
$ 7,184 |
|
Fidelity Securities Lending Cash Central Fund |
3,992 |
|
Total |
$ 11,176 |
|
Other Information |
|
All investments are categorized as Level 1 under the Fair Value Hierarchy. The inputs or methodology used for valuing securities may not be an indication of the risk associated with investing in those securities. For more information on valuation inputs, please refer to the Investment Valuation section in the accompanying Notes to Financial Statements. |
|
Distribution of investments by country or territory of incorporation, as a percentage of total net assets, is as follows. (Unaudited) |
|
United States of America |
89.2% |
|
Canada |
5.1% |
|
Ireland |
2.8% |
|
United Kingdom |
1.4% |
|
Others (Individually Less Than 1%) |
1.5% |
|
|
100.0% |
See accompanying notes which are an integral part of the financial statements.
Annual Report
Air Transportation Portfolio
Financial Statements
Statement of Assets and Liabilities
|
|
February 28, 2013 |
|
|
|
|
|
|
Assets |
|
|
|
Investment in securities, at value (including securities loaned of $2,592,995) - See accompanying schedule: Unaffiliated issuers (cost $63,527,958) |
$ 84,738,590 |
|
|
Fidelity Central Funds (cost $8,487,241) |
8,487,241 |
|
|
Total Investments (cost $72,015,199) |
|
$ 93,225,831 |
|
Receivable for fund shares sold |
|
321,072 |
|
Dividends receivable |
|
175,856 |
|
Distributions receivable from Fidelity Central Funds |
|
622 |
|
Prepaid expenses |
|
123 |
|
Receivable from investment adviser for expense reductions |
|
5 |
|
Other receivables |
|
7,251 |
|
Total assets |
|
93,730,760 |
|
|
|
|
|
Liabilities |
|
|
|
Payable for fund shares redeemed |
$ 135,798 |
|
|
Accrued management fee |
43,080 |
|
|
Other affiliated payables |
18,809 |
|
|
Other payables and accrued expenses |
32,541 |
|
|
Collateral on securities loaned, at value |
2,663,650 |
|
|
Total liabilities |
|
2,893,878 |
|
|
|
|
|
Net Assets |
|
$ 90,836,882 |
|
Net Assets consist of: |
|
|
|
Paid in capital |
|
$ 68,517,359 |
|
Undistributed net investment income |
|
77,786 |
|
Accumulated undistributed net realized gain (loss) on investments and foreign currency transactions |
|
1,031,105 |
|
Net unrealized appreciation (depreciation) on investments |
|
21,210,632 |
|
Net Assets, for 2,065,977 shares outstanding |
|
$ 90,836,882 |
|
Net Asset Value, offering price and redemption price per share ($90,836,882 ÷ 2,065,977 shares) |
|
$ 43.97 |
Statement of Operations
|
|
Year ended February 28, 2013 |
|
|
|
|
|
|
Investment Income |
|
|
|
Dividends |
|
$ 890,747 |
|
Special dividends |
|
133,537 |
|
Interest |
|
42 |
|
Income from Fidelity Central Funds |
|
11,176 |
|
Total income |
|
1,035,502 |
|
|
|
|
|
Expenses |
|
|
|
Management fee |
$ 398,124 |
|
|
Transfer agent fees |
171,928 |
|
|
Accounting and security lending fees |
28,053 |
|
|
Custodian fees and expenses |
10,543 |
|
|
Independent trustees' compensation |
464 |
|
|
Registration fees |
24,317 |
|
|
Audit |
38,303 |
|
|
Legal |
255 |
|
|
Miscellaneous |
566 |
|
|
Total expenses before reductions |
672,553 |
|
|
Expense reductions |
(19,808) |
652,745 |
|
Net investment income (loss) |
|
382,757 |
|
Realized and Unrealized Gain (Loss) Net realized gain (loss) on: |
|
|
|
Investment securities: |
|
|
|
Unaffiliated issuers |
3,386,222 |
|
|
Foreign currency transactions |
(2,786) |
|
|
Total net realized gain (loss) |
|
3,383,436 |
|
Change in net unrealized appreciation (depreciation) on investment securities |
|
8,701,316 |
|
Net gain (loss) |
|
12,084,752 |
|
Net increase (decrease) in net assets resulting from operations |
|
$ 12,467,509 |
See accompanying notes which are an integral part of the financial statements.
Annual Report
Air Transportation Portfolio
Financial Statements - continued
Statement of Changes in Net Assets
|
|
Year ended |
Year ended |
|
Increase (Decrease) in Net Assets |
|
|
|
Operations |
|
|
|
Net investment income (loss) |
$ 382,757 |
$ 90,065 |
|
Net realized gain (loss) |
3,383,436 |
5,278,424 |
|
Change in net unrealized appreciation (depreciation) |
8,701,316 |
(6,836,239) |
|
Net increase (decrease) in net assets resulting from operations |
12,467,509 |
(1,467,750) |
|
Distributions to shareholders from net investment income |
(278,547) |
(110,454) |
|
Distributions to shareholders from net realized gain |
(1,241,145) |
(10,568,849) |
|
Total distributions |
(1,519,692) |
(10,679,303) |
|
Share transactions |
54,589,719 |
45,337,897 |
|
Reinvestment of distributions |
1,484,377 |
9,888,534 |
|
Cost of shares redeemed |
(48,841,974) |
(83,900,972) |
|
Net increase (decrease) in net assets resulting from share transactions |
7,232,122 |
(28,674,541) |
|
Redemption fees |
4,540 |
3,029 |
|
Total increase (decrease) in net assets |
18,184,479 |
(40,818,565) |
|
|
|
|
|
Net Assets |
|
|
|
Beginning of period |
72,652,403 |
113,470,968 |
|
End of period (including undistributed net investment income of $77,786 and undistributed net investment income of $0, respectively) |
$ 90,836,882 |
$ 72,652,403 |
|
Other Information Shares |
|
|
|
Sold |
1,356,924 |
1,190,480 |
|
Issued in reinvestment of distributions |
36,507 |
264,574 |
|
Redeemed |
(1,233,402) |
(2,184,942) |
|
Net increase (decrease) |
160,029 |
(729,888) |
Financial Highlights
|
Years ended February 28, |
2013 |
2012 I |
2011 |
2010 |
2009 |
|
Selected Per-Share Data |
|
|
|
|
|
|
Net asset value, beginning of period |
$ 38.12 |
$ 43.05 |
$ 35.32 |
$ 17.35 |
$ 37.47 |
|
Income from Investment Operations |
|
|
|
|
|
|
Net investment income (loss) B |
.21 E |
.05 |
.17 F |
(.07) |
(.10) |
|
Net realized and unrealized gain (loss) |
6.44 |
.46 G |
7.68 |
18.04 |
(17.05) |
|
Total from investment operations |
6.65 |
.51 |
7.85 |
17.97 |
(17.15) |
|
Distributions from net investment income |
(.15) |
(.05) |
(.13) |
- |
- |
|
Distributions from net realized gain |
(.66) |
(5.39) |
- |
- |
(2.99) |
|
Total distributions |
(.80) K |
(5.44) |
(.13) |
- |
(2.99) |
|
Redemption fees added to paid in capital B |
- J |
- J |
.01 |
- J |
.02 |
|
Net asset value, end of period |
$ 43.97 |
$ 38.12 |
$ 43.05 |
$ 35.32 |
$ 17.35 |
|
Total Return A |
17.62% |
2.01% |
22.26% |
103.57% |
(49.44)% |
|
Ratios to Average Net Assets C,H |
|
|
|
|
|
|
Expenses before reductions |
.94% |
.96% |
.92% |
1.05% |
1.08% |
|
Expenses net of fee waivers, if any |
.94% |
.96% |
.92% |
1.05% |
1.08% |
|
Expenses net of all reductions |
.92% |
.95% |
.91% |
1.01% |
1.07% |
|
Net investment income (loss) |
.54% E |
.12% |
.43% F |
(.28)% |
(.37)% |
|
Supplemental Data |
|
|
|
|
|
|
Net assets, end of period (000 omitted) |
$ 90,837 |
$ 72,652 |
$ 113,471 |
$ 94,425 |
$ 34,911 |
|
Portfolio turnover rate D |
74% |
102% |
161% |
165% |
66% |
|
A Total returns would have been lower if certain expenses had not been reduced during the applicable periods shown. B Calculated based on average shares outstanding during the period. C Fees and expenses of any underlying Fidelity Central Funds are not included in the Fund's expense ratio. The Fund indirectly bears its proportionate share of the expenses of any underlying Fidelity Central Funds. D Amount does not include the portfolio activity of any underlying Fidelity Central Funds. E Investment income per share reflects a large, non-recurring dividend which amounted to $.07 per share. Excluding this non-recurring dividend, the ratio of net investment income (loss) to average net assets would have been ..35%. F Investment income per share reflects a large, non-recurring dividend which amounted to $.12 per share. Excluding this non-recurring dividend, the ratio of net investment income (loss) to average net assets would have been .14%. G The amount shown for a share outstanding does not correspond with the aggregate net gain (loss) on investments for the period due to the timing of sales and repurchases of shares in relation to fluctuating market values of the investments of the Fund. H Expense ratios reflect operating expenses of the Fund. Expenses before reductions do not reflect amounts reimbursed by the investment adviser or reductions from brokerage service arrangements or reductions from other expense offset arrangements and do not represent the amount paid by the Fund during periods when reimbursements or reductions occur. Expenses net of fee waivers reflect expenses after reimbursement by the investment adviser but prior to reductions from brokerage service arrangements or other expense offset arrangements. Expenses net of all reductions represent the net expenses paid by the Fund. I For the year ended February 29. J Amount represents less than $.01 per share. K Total distributions of $.80 per share is comprised of distributions from net investment income of $.147 and distributions from net realized gain of $.655 per share. |
See accompanying notes which are an integral part of the financial statements.
Annual Report
Defense and Aerospace Portfolio
Performance: The Bottom Line
Average annual total return reflects the change in the value of an investment, assuming reinvestment of the fund's distributions from dividend income and capital gains (the profits earned upon the sale of securities that have grown in value, if any) and assuming a constant rate of performance each year. The $10,000 table and the fund's returns do not reflect the deduction of taxes that a shareholder would pay on fund distributions or the redemption of fund shares. During periods of reimbursement by Fidelity, a fund's total return will be greater than it would be had the reimbursement not occurred. How a fund did yesterday is no guarantee of how it will do tomorrow.
Average Annual Total Returns
|
Periods ended February 28, 2013 |
Past 1 |
Past 5 |
Past 10 |
|
Defense and Aerospace Portfolio |
8.37% |
5.28% |
13.45% |
$10,000 Over 10 Years
Let's say hypothetically that $10,000 was invested in Defense and Aerospace Portfolio on February 28, 2003. The chart shows how the value of your investment would have changed, and also shows how the S&P 500 Index performed over the same period.
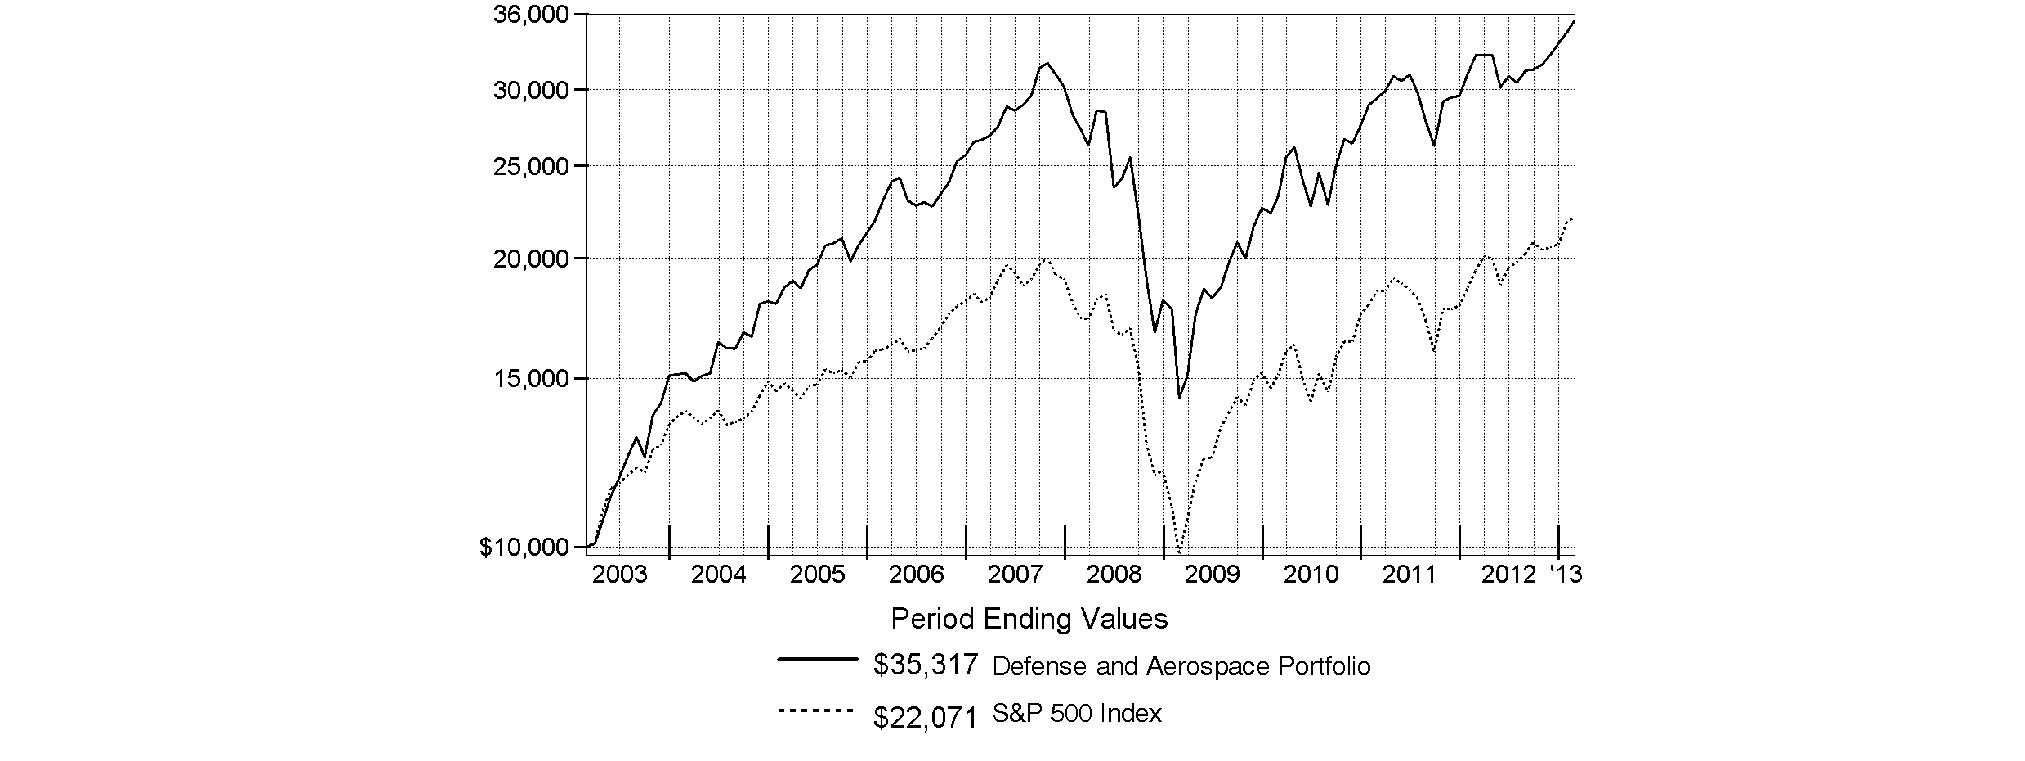
Annual Report
Defense and Aerospace Portfolio
Management's Discussion of Fund Performance
Market Recap: U.S. stocks posted solid gains for the year ending February 28, 2013, sparked by a late-period rally that pushed major equity benchmarks to multiyear highs. Improvement in the global economy and more monetary stimulus from the U.S. Federal Reserve kept markets on the upswing for much of the year, shrugging off an early decline brought on by debt woes in Europe, and another dip later in the period amid Congressional gridlock on the federal budget. Renewed optimism over employment, the housing market, corporate earnings and record dividends made stocks a favorite with investors during the 12 months, which helped push the broad-based S&P 500® Index across the milestone 1,500 mark at the end of January. The S&P 500® finished the period up 13.46%. Seven of the 10 major market sectors tracked by MSCI U.S. IMI 25-50 classifications produced double-digit gains, led by health care and financials, while information technology, energy and materials trailed the broad equity market with only modest advances.
Comments from Douglas Scott, who became sole Portfolio Manager of Defense and Aerospace Portfolio on June 30, 2012, after serving as Co-Manager: For the year, the fund returned 8.37%, trailing the 12.15% gain of the MSCI® U.S. IMI Aerospace & Defense 25-50 Index and also lagging the S&P 500®. As a group, defense and aerospace stocks lagged the broader market during the first six months of the period, as stocks in the group responded poorly to renewed tension about the European sovereign debt crisis and concerns about global economic growth, and aerospace companies struggled with strong prior-year revenue and earnings comparisons. Versus the MSCI index, most of the portfolio's underperformance occurred in the first half of the period, when the fund's underweighting in defense and overweighting in commercial aerospace worked against it. At that time, defense stocks were helped by solid execution on legacy contracts and cost cutting from aggressive headcount reductions. Also, some defense companies - among them, Northrop Grumman, which was the fund's third-largest relative detractor because we did not own this index component when it rose during the first half of the period - benefited from one-time accounting reversals that temporarily boosted earnings in the short term. The other major detractors were index components that performed well, and the fund was penalized for underweighting or not owning them. The biggest relative detractor was a sizable underweighting in index heavyweight Honeywell International, a diversified company with businesses in commercial aerospace, building control and security, and automotive products, among other areas. Among stocks the fund didn't own that detracted were GenCorp, which makes propulsion systems for defense and aerospace customers, stun gun maker Taser International and GeoEye, a commercial satellite firm. Conversely, not owning weak-performing index component Spirit AeroSystems Holdings bolstered the fund's results. The shares of this manufacturer of fuselages and other key aircraft components took a hit near the end of October, after the company announced sizeable charges against third-quarter earnings. Also bolstering fund performance were overweighted stakes in earth imagery provider DigitalGlobe - which agreed to merge with GeoEye during the period and was profitably sold from the fund - Teledyne Technologies, a supplier of electronic subsystems and instrumentation for defense and aerospace customers, and TransDigm Group, a maker of commercial aerospace aftermarket parts.
The views expressed above reflect those of the portfolio manager(s) only through the end of the period as stated on the cover of this report and do not necessarily represent the views of Fidelity or any other person in the Fidelity organization. Any such views are subject to change at any time based upon market or other conditions and Fidelity disclaims any responsibility to update such views. These views may not be relied on as investment advice and, because investment decisions for a Fidelity fund are based on numerous factors, may not be relied on as an indication of trading intent on behalf of any Fidelity fund.
Annual Report
Defense and Aerospace Portfolio
Investment Changes (Unaudited)
|
Top Ten Stocks as of February 28, 2013 |
||
|
|
% of fund's |
% of fund's net assets |
|
United Technologies Corp. |
23.8 |
20.5 |
|
The Boeing Co. |
12.9 |
13.6 |
|
Precision Castparts Corp. |
6.9 |
6.6 |
|
General Dynamics Corp. |
5.6 |
3.5 |
|
Honeywell International, Inc. |
4.8 |
4.6 |
|
Teledyne Technologies, Inc. |
4.8 |
2.4 |
|
Textron, Inc. |
4.8 |
4.5 |
|
Meggitt PLC |
4.6 |
1.5 |
|
TransDigm Group, Inc. |
4.5 |
4.7 |
|
Esterline Technologies Corp. |
3.2 |
3.9 |
|
|
75.9 |
|
|
Top Industries (% of fund's net assets) |
|||
|
As of February 28, 2013 |
|||
|
Aerospace & Defense |
89.8% |
|
|
Metals & Mining |
2.3% |
|
|
Trading Companies & Distributors |
1.9% |
|
|
Electrical Equipment |
1.2% |
|
|
Chemicals |
1.0% |
|
|
All Others* |
3.8% |
|

|
As of August 31, 2012 |
|||
|
Aerospace & Defense |
93.7% |
|
|
Metals & Mining |
2.1% |
|
|
Trading Companies & Distributors |
1.4% |
|
|
Electrical Equipment |
1.1% |
|
|
Electronic Equipment & Components |
0.7% |
|
|
All Others* |
1.0% |
|

|
* Includes short-term investments and net other assets. |
Annual Report
Defense and Aerospace Portfolio
Investments February 28, 2013
Showing Percentage of Net Assets
|
Common Stocks - 96.6% |
|||
|
Shares |
Value |
||
|
AEROSPACE & DEFENSE - 89.8% |
|||
|
Aerospace & Defense - 89.8% |
|||
|
Astronics Corp. (a) |
123,872 |
$ 3,412,674 |
|
|
Ducommun, Inc. (a) |
442,318 |
6,855,929 |
|
|
Esterline Technologies Corp. (a) |
278,934 |
19,226,921 |
|
|
General Dynamics Corp. |
497,606 |
33,822,280 |
|
|
HEICO Corp. |
435,334 |
18,897,849 |
|
|
Honeywell International, Inc. |
418,651 |
29,347,435 |
|
|
L-3 Communications Holdings, Inc. |
102,239 |
7,797,769 |
|
|
Lockheed Martin Corp. |
75,940 |
6,682,720 |
|
|
Meggitt PLC |
4,086,516 |
28,182,696 |
|
|
MTU Aero Engines Holdings AG |
92,712 |
8,620,480 |
|
|
Northrop Grumman Corp. |
128,542 |
8,442,639 |
|
|
Precision Castparts Corp. |
223,267 |
41,659,390 |
|
|
Raytheon Co. |
250,056 |
13,645,556 |
|
|
Rockwell Collins, Inc. |
54,854 |
3,297,274 |
|
|
Rolls-Royce Group PLC |
339,600 |
5,296,155 |
|
|
Rolls-Royce Group PLC (C Shares) (a) |
26,341,600 |
39,962 |
|
|
SIFCO Industries, Inc. |
82,763 |
1,327,519 |
|
|
Teledyne Technologies, Inc. (a) |
397,626 |
29,257,321 |
|
|
Textron, Inc. |
1,006,636 |
29,041,449 |
|
|
The Boeing Co. |
1,017,037 |
78,210,145 |
|
|
TransDigm Group, Inc. |
192,033 |
27,333,977 |
|
|
United Technologies Corp. |
1,595,185 |
144,443,998 |
|
|
|
544,842,138 |
||
|
CHEMICALS - 1.0% |
|||
|
Specialty Chemicals - 1.0% |
|||
|
Cytec Industries, Inc. |
87,216 |
6,313,566 |
|
|
ELECTRICAL EQUIPMENT - 1.2% |
|||
|
Electrical Components & Equipment - 1.2% |
|||
|
AMETEK, Inc. |
176,414 |
7,379,398 |
|
|
ELECTRONIC EQUIPMENT & COMPONENTS - 0.4% |
|||
|
Electronic Manufacturing Services - 0.4% |
|||
|
Mercury Systems, Inc. (a) |
379,705 |
2,600,979 |
|
|
|
|||
|
Shares |
Value |
||
|
METALS & MINING - 2.3% |
|||
|
Steel - 2.3% |
|||
|
Carpenter Technology Corp. |
202,800 |
$ 9,578,244 |
|
|
Haynes International, Inc. |
80,559 |
4,148,789 |
|
|
|
13,727,033 |
||
|
TRADING COMPANIES & DISTRIBUTORS - 1.9% |
|||
|
Trading Companies & Distributors - 1.9% |
|||
|
AerCap Holdings NV (a) |
728,729 |
11,309,874 |
|
|
TOTAL COMMON STOCKS (Cost $465,668,146) |
|
||
|
Money Market Funds - 3.1% |
|||
|
|
|
|
|
|
Fidelity Cash Central Fund, 0.16% (b) |
18,942,893 |
|
|
|
TOTAL INVESTMENT PORTFOLIO - 99.7% (Cost $484,611,039) |
605,115,881 |
||
|
NET OTHER ASSETS (LIABILITIES) - 0.3% |
1,743,396 |
||
|
NET ASSETS - 100% |
$ 606,859,277 |
||
|
Legend |
|
(a) Non-income producing |
|
(b) Affiliated fund that is available only to investment companies and other accounts managed by Fidelity Investments. The rate quoted is the annualized seven-day yield of the fund at period end. A complete unaudited listing of the fund's holdings as of its most recent quarter end is available upon request. In addition, each Fidelity Central Fund's financial statements, which are not covered by the Fund's Report of Independent Registered Public Accounting Firm, are available on the SEC's website or upon request. |
|
Affiliated Central Funds |
|
Information regarding fiscal year to date income earned by the Fund from investments in Fidelity Central Funds is as follows: |
|
Fund |
Income earned |
|
Fidelity Cash Central Fund |
$ 29,874 |
|
Fidelity Securities Lending Cash Central Fund |
36,871 |
|
Total |
$ 66,745 |
|
Other Affiliated Issuers |
|
An affiliated company is a company in which the Fund has ownership of at least 5% of the voting securities. Fiscal year to date transactions with companies which are or were affiliates are as follows: |
|
Affiliate |
Value, beginning of period |
Purchases |
Sales Proceeds |
Dividend Income |
Value, end of period |
|
Ducommun, Inc. |
$ - |
$ 7,699,469 |
$ 1,740,563 |
$ - |
$ - |
|
Total |
$ - |
$ 7,699,469 |
$ 1,740,563 |
$ - |
$ - |
|
Other Information |
|
All investments are categorized as Level 1 under the Fair Value Hierarchy. The inputs or methodology used for valuing securities may not be an indication of the risk associated with investing in those securities. For more information on valuation inputs, please refer to the Investment Valuation section in the accompanying Notes to Financial Statements. |
See accompanying notes which are an integral part of the financial statements.
Annual Report
Defense and Aerospace Portfolio
Financial Statements
Statement of Assets and Liabilities
|
|
February 28, 2013 |
|
|
|
|
|
|
Assets |
|
|
|
Investment in securities, at value - See accompanying schedule: Unaffiliated issuers (cost $465,668,146) |
$ 586,172,988 |
|
|
Fidelity Central Funds (cost $18,942,893) |
18,942,893 |
|
|
Total Investments (cost $484,611,039) |
|
$ 605,115,881 |
|
Receivable for investments sold |
|
1,747,910 |
|
Receivable for fund shares sold |
|
267,440 |
|
Dividends receivable |
|
1,825,864 |
|
Distributions receivable from Fidelity Central Funds |
|
2,094 |
|
Prepaid expenses |
|
1,100 |
|
Receivable from investment adviser for expense reductions |
|
735 |
|
Other receivables |
|
22,869 |
|
Total assets |
|
608,983,893 |
|
|
|
|
|
Liabilities |
|
|
|
Payable for fund shares redeemed |
$ 1,672,423 |
|
|
Accrued management fee |
282,873 |
|
|
Transfer agent fee payable |
116,606 |
|
|
Other affiliated payables |
18,761 |
|
|
Other payables and accrued expenses |
33,953 |
|
|
Total liabilities |
|
2,124,616 |
|
|
|
|
|
Net Assets |
|
$ 606,859,277 |
|
Net Assets consist of: |
|
|
|
Paid in capital |
|
$ 483,850,481 |
|
Undistributed net investment income |
|
1,049,954 |
|
Accumulated undistributed net realized gain (loss) on investments and foreign currency transactions |
|
1,454,000 |
|
Net unrealized appreciation (depreciation) on investments |
|
120,504,842 |
|
Net Assets, for 6,615,393 shares outstanding |
|
$ 606,859,277 |
|
Net Asset Value, offering price and redemption price per share ($606,859,277 ÷ 6,615,393 shares) |
|
$ 91.73 |
Statement of Operations
|
|
Year ended February 28, 2013 |
|
|
|
|
|
|
Investment Income |
|
|
|
Dividends |
|
$ 11,361,998 |
|
Special dividends |
|
2,516,454 |
|
Income from Fidelity Central Funds |
|
66,745 |
|
Total income |
|
13,945,197 |
|
|
|
|
|
Expenses |
|
|
|
Management fee |
$ 3,486,116 |
|
|
Transfer agent fees |
1,469,019 |
|
|
Accounting and security lending fees |
231,515 |
|
|
Custodian fees and expenses |
11,627 |
|
|
Independent trustees' compensation |
4,184 |
|
|
Registration fees |
28,987 |
|
|
Audit |
39,235 |
|
|
Legal |
2,442 |
|
|
Miscellaneous |
6,485 |
|
|
Total expenses before reductions |
5,279,610 |
|
|
Expense reductions |
(66,644) |
5,212,966 |
|
Net investment income (loss) |
|
8,732,231 |
|
Realized and Unrealized Gain (Loss) Net realized gain (loss) on: |
|
|
|
Investment securities: |
|
|
|
Unaffiliated issuers |
6,320,917 |
|
|
Other affiliated issuers |
74,352 |
|
|
Foreign currency transactions |
5,281 |
|
|
Total net realized gain (loss) |
|
6,400,550 |
|
Change in net unrealized appreciation (depreciation) on investment securities |
|
32,785,011 |
|
Net gain (loss) |
|
39,185,561 |
|
Net increase (decrease) in net assets resulting from operations |
|
$ 47,917,792 |
See accompanying notes which are an integral part of the financial statements.
Annual Report
Statement of Changes in Net Assets
|
|
Year ended |
Year ended |
|
Increase (Decrease) in Net Assets |
|
|
|
Operations |
|
|
|
Net investment income (loss) |
$ 8,732,231 |
$ 4,716,023 |
|
Net realized gain (loss) |
6,400,550 |
81,261,739 |
|
Change in net unrealized appreciation (depreciation) |
32,785,011 |
(23,583,052) |
|
Net increase (decrease) in net assets resulting from operations |
47,917,792 |
62,394,710 |
|
Distributions to shareholders from net investment income |
(8,717,067) |
(4,239,094) |
|
Distributions to shareholders from net realized gain |
(1,406,058) |
(953,357) |
|
Total distributions |
(10,123,125) |
(5,192,451) |
|
Share transactions |
121,232,601 |
165,263,521 |
|
Reinvestment of distributions |
9,789,696 |
5,004,209 |
|
Cost of shares redeemed |
(243,116,903) |
(224,292,010) |
|
Net increase (decrease) in net assets resulting from share transactions |
(112,094,606) |
(54,024,280) |
|
Redemption fees |
4,868 |
15,836 |
|
Total increase (decrease) in net assets |
(74,295,071) |
3,193,815 |
|
|
|
|
|
Net Assets |
|
|
|
Beginning of period |
681,154,348 |
677,960,533 |
|
End of period (including undistributed net investment income of $1,049,954 and undistributed net investment income of $1,041,863, respectively) |
$ 606,859,277 |
$ 681,154,348 |
|
Other Information Shares |
|
|
|
Sold |
1,438,094 |
2,079,372 |
|
Issued in reinvestment of distributions |
113,226 |
64,501 |
|
Redeemed |
(2,854,335) |
(2,893,816) |
|
Net increase (decrease) |
(1,303,015) |
(749,943) |
Financial Highlights
|
Years ended February 28, |
2013 |
2012 H |
2011 |
2010 |
2009 |
|
Selected Per-Share Data |
|
|
|
|
|
|
Net asset value, beginning of period |
$ 86.02 |
$ 78.21 |
$ 62.05 |
$ 38.96 |
$ 79.93 |
|
Income from Investment Operations |
|
|
|
|
|
|
Net investment income (loss) B |
1.17 E |
.56 |
.42 |
.73 F |
.58 |
|
Net realized and unrealized gain (loss) |
5.94 |
7.87 |
16.17 |
23.32 |
(36.29) |
|
Total from investment operations |
7.11 |
8.43 |
16.59 |
24.05 |
(35.71) |
|
Distributions from net investment income |
(1.21) |
(.51) |
(.43) |
(.96) |
(.51) |
|
Distributions from net realized gain |
(.19) |
(.12) |
- |
- |
(4.75) |
|
Total distributions |
(1.40) |
(.62) J |
(.43) |
(.96) |
(5.26) |
|
Redemption fees added to paid in capital B,I |
- |
- |
- |
- |
- |
|
Net asset value, end of period |
$ 91.73 |
$ 86.02 |
$ 78.21 |
$ 62.05 |
$ 38.96 |
|
Total Return A |
8.37% |
10.87% |
26.79% |
62.05% |
(47.61)% |
|
Ratios to Average Net Assets C,G |
|
|
|
|
|
|
Expenses before reductions |
.84% |
.86% |
.88% |
.95% |
.88% |
|
Expenses net of fee waivers, if any |
.84% |
.86% |
.88% |
.95% |
.88% |
|
Expenses net of all reductions |
.83% |
.86% |
.88% |
.94% |
.88% |
|
Net investment income (loss) |
1.39% E |
.72% |
.62% |
1.39% F |
.91% |
|
Supplemental Data |
|
|
|
|
|
|
Net assets, end of period (000 omitted) |
$ 606,859 |
$ 681,154 |
$ 677,961 |
$ 609,095 |
$ 436,291 |
|
Portfolio turnover rate D |
56% |
56% |
43% |
70% |
58% |
|
A Total returns would have been lower if certain expenses had not been reduced during the applicable periods shown. B Calculated based on average shares outstanding during the period. C Fees and expenses of any underlying Fidelity Central Funds are not included in the Fund's expense ratio. The Fund indirectly bears its proportionate share of the expenses of any underlying Fidelity Central Funds. D Amount does not include the portfolio activity of any underlying Fidelity Central Funds. E Investment income per share reflects a large, non-recurring dividend which amounted to $.34 per share. Excluding this non-recurring dividend, the ratio of net investment income (loss) to average net assets would have been ..99%. F Investment income per share reflects a large, non-recurring dividend which amounted to $.20 per share. Excluding this non-recurring dividend, the ratio of net investment income (loss) to average net assets would have been 1.01%. G Expense ratios reflect operating expenses of the Fund. Expenses before reductions do not reflect amounts reimbursed by the investment adviser or reductions from brokerage service arrangements or reductions from other expense offset arrangements and do not represent the amount paid by the Fund during periods when reimbursements or reductions occur. Expenses net of fee waivers reflect expenses after reimbursement by the investment adviser but prior to reductions from brokerage service arrangements or other expense offset arrangements. Expenses net of all reductions represent the net expenses paid by the Fund. H For the year ended February 29. I Amount represents less than $.01 per share. J Total distributions of $.623 per share is comprised of distributions from net investment income of $.508 and distributions from net realized gain of $.115 per share. |
See accompanying notes which are an integral part of the financial statements.
Annual Report
Environment and Alternative Energy Portfolio
Performance: The Bottom Line
Average annual total return reflects the change in the value of an investment, assuming reinvestment of the fund's distributions from dividend income and capital gains (the profits earned upon the sale of securities that have grown in value, if any) and assuming a constant rate of performance each year. The $10,000 table and the fund's returns do not reflect the deduction of taxes that a shareholder would pay on fund distributions or the redemption of fund shares. During periods of reimbursement by Fidelity, a fund's total return will be greater than it would be had the reimbursement not occurred. How a fund did yesterday is no guarantee of how it will do tomorrow.
Average Annual Total Returns
|
Periods ended February 28, 2013 |
Past 1 |
Past 5 |
Past 10 |
|
Environment and Alternative Energy Portfolio A |
12.02% |
1.26% |
6.90% |
A Prior to July 1, 2010, Environment and Alternative Energy Portfolio operated under certain different investment policies. The historical performance for the fund may not represent its current investment policies.
$10,000 Over 10 Years
Let's say hypothetically that $10,000 was invested in Environment and Alternative Energy Portfolio on February 28, 2003. The chart shows how the value of your investment would have changed, and also shows how the S&P 500 Index performed over the same period.
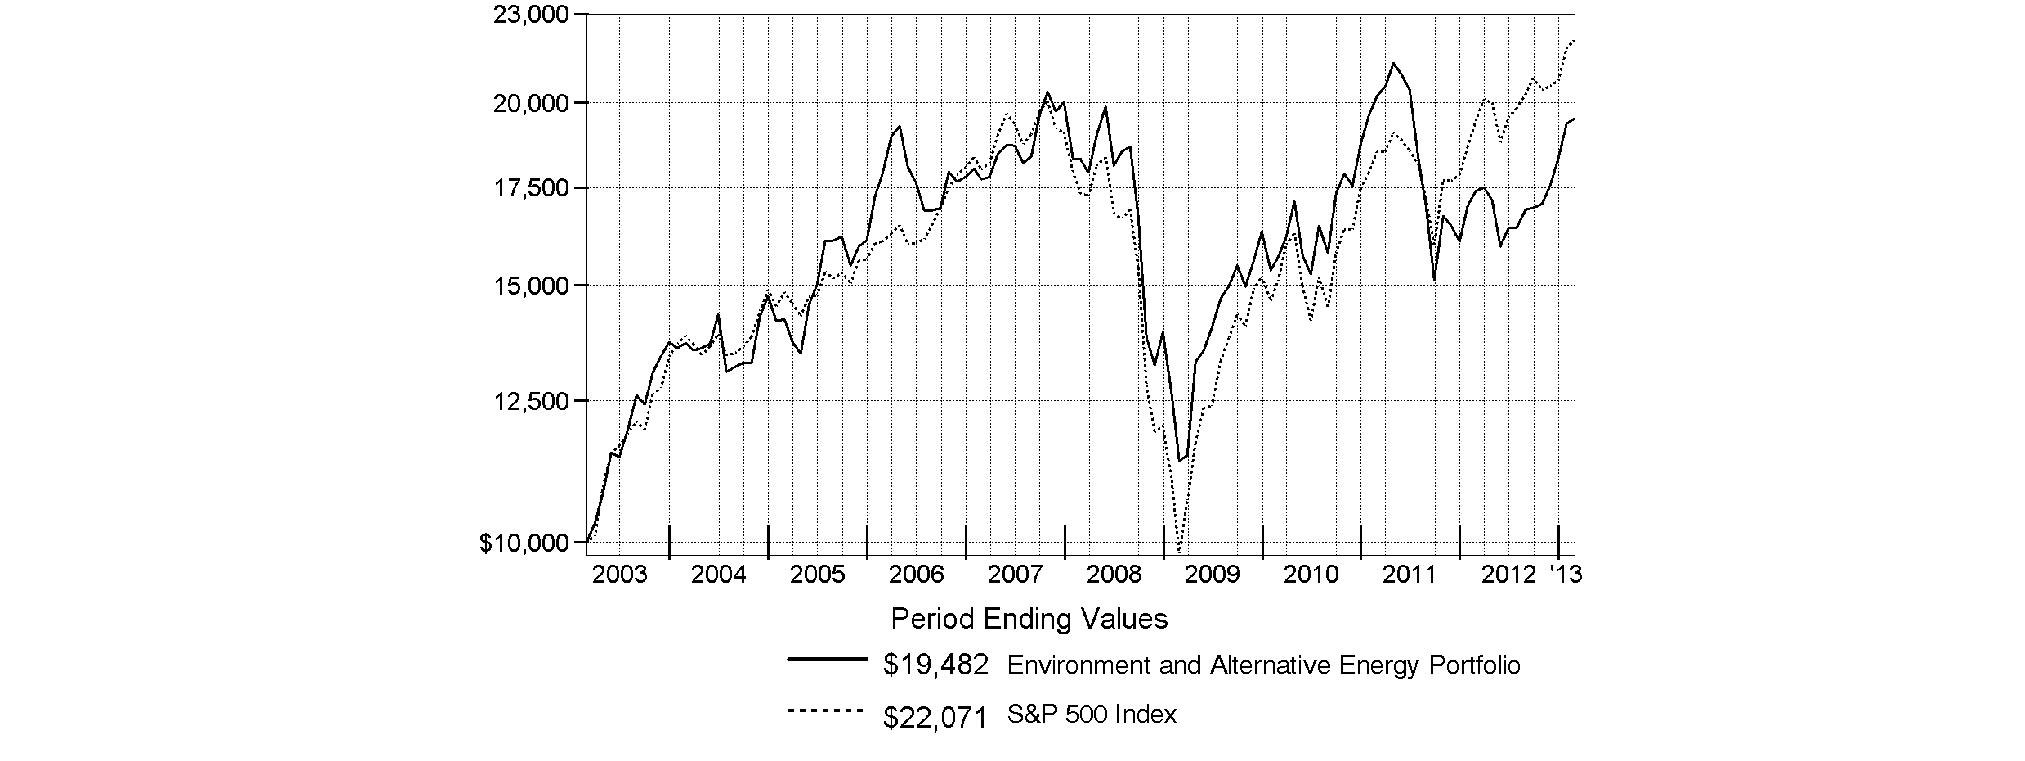
Annual Report
Environment and Alternative Energy Portfolio
Management's Discussion of Fund Performance
Market Recap: U.S. stocks posted solid gains for the year ending February 28, 2013, sparked by a late-period rally that pushed major equity benchmarks to multiyear highs. Improvement in the global economy and more monetary stimulus from the U.S. Federal Reserve kept markets on the upswing for much of the year, shrugging off an early decline brought on by debt woes in Europe, and another dip later in the period amid Congressional gridlock on the federal budget. Renewed optimism over employment, the housing market, corporate earnings and record dividends made stocks a favorite with investors during the 12 months, which helped push the broad-based S&P 500® Index across the milestone 1,500 mark at the end of January. The S&P 500® finished the period up 13.46%. Seven of the 10 major market sectors tracked by MSCI U.S. IMI 25-50 classifications produced double-digit gains, led by health care and financials, while information technology, energy and materials trailed the broad equity market with only modest advances.
Comments from Anna Davydova, Portfolio Manager of Environment and Alternative Energy Portfolio: For the year, the fund returned 12.02%, underperforming the 13.04% gain of its industry benchmark, the FTSE® Environmental Opportunities & Alternative Energy Index, and the broadly based S&P 500®. The environment and alternative energy sector fared well during the period. During the first half, the group overcame macroeconomic headwinds, including fear of a recession in the U.S. and Europe, a slowdown in emerging markets and the deterioration of global policy support for renewable energy. These negative factors subsided during the latter half. The fund's performance relative to the FTSE index was hurt by an overweighting in environmental/facility services, a lack of exposure to security/alarm services and its positioning in industrial conglomerates. Among individual stocks, detractors included not owning chemicals company and index component PPG Industries, an underweighting in industrial conglomerate 3M, an overweighting in recycled metals manufacturer Schnitzer Steel, and investments in nuclear waste management company EnergySolutions and early-stage, next-generation renewable biochemical company Amyris. Amyris was added to the index during the period. Currency fluctuations also hindered fund performance, given its investments in foreign stocks. On the plus side, positioning in electric utilities, auto parts and equipment, and building products boosted relative performance. Individually, timely ownership of Italian electric utility Enel and auto parts/equipment company Johnson Controls helped, as did an investment in LED lighting technology leader and semiconductor company Cree, and not owning systems software provider and underperforming index constituent VMware. EnergySolutions and Enel were not held by the fund at period end.
The views expressed above reflect those of the portfolio manager(s) only through the end of the period as stated on the cover of this report and do not necessarily represent the views of Fidelity or any other person in the Fidelity organization. Any such views are subject to change at any time based upon market or other conditions and Fidelity disclaims any responsibility to update such views. These views may not be relied on as investment advice and, because investment decisions for a Fidelity fund are based on numerous factors, may not be relied on as an indication of trading intent on behalf of any Fidelity fund.
Annual Report
Environment and Alternative Energy Portfolio
Investment Changes (Unaudited)
|
Top Ten Stocks as of February 28, 2013 |
||
|
|
% of fund's |
% of fund's net assets |
|
Danaher Corp. |
9.5 |
10.1 |
|
Emerson Electric Co. |
8.4 |
9.2 |
|
Air Products & Chemicals, Inc. |
5.6 |
5.0 |
|
Republic Services, Inc. |
5.6 |
6.3 |
|
Iberdrola SA |
4.7 |
0.0 |
|
Ecolab, Inc. |
4.7 |
4.4 |
|
Stericycle, Inc. |
4.6 |
5.4 |
|
Ashland, Inc. |
4.5 |
4.8 |
|
Ingersoll-Rand PLC |
4.2 |
4.2 |
|
Eaton Corp. Plc |
4.1 |
3.9 |
|
|
55.9 |
|
|
Top Industries (% of fund's net assets) |
|||
|
As of February 28, 2013 |
|||
|
Energy Efficiency |
35.7% |
|
|
Water Infrastructure & Technologies |
20.6% |
|
|
Waste Management & Technologies |
18.6% |
|
|
Environmental Support Services |
14.3% |
|
|
Renewable & Alternative Energy |
9.3% |
|
|
All Others* |
1.5% |
|

|
As of August 31, 2012 |
|||
|
Energy Efficiency |
35.6% |
|
|
Water Infrastructure & Technologies |
21.1% |
|
|
Waste Management & Technologies |
19.7% |
|
|
Environmental Support Services |
13.4% |
|
|
Renewable & Alternative Energy |
8.3% |
|
|
All Others* |
1.9% |
|

|
* Includes short-term investments and net other assets. |
Annual Report
Environment and Alternative Energy Portfolio
Investments February 28, 2013
Showing Percentage of Net Assets
|
Common Stocks - 99.5% |
|||
|
Shares |
Value |
||
|
Energy Efficiency - 35.4% |
|||
|
Buildings Energy Efficiency - 13.1% |
|||
|
Cree, Inc. (a)(d) |
35,100 |
$ 1,587,573 |
|
|
Ingersoll-Rand PLC |
65,400 |
3,443,310 |
|
|
Johnson Controls, Inc. |
90,500 |
2,848,035 |
|
|
Lennox International, Inc. |
19,300 |
1,140,051 |
|
|
Owens Corning (a) |
32,100 |
1,245,801 |
|
|
Zumtobel AG |
30,800 |
461,018 |
|
|
TOTAL BUILDINGS ENERGY EFFICIENCY |
10,725,788 |
||
|
Diversified Energy Efficiency - 1.2% |
|||
|
Corning, Inc. |
63,200 |
796,952 |
|
|
Honeywell International, Inc. |
2,500 |
175,250 |
|
|
TOTAL DIVERSIFIED ENERGY EFFICIENCY |
972,202 |
||
|
Industrial Energy Efficiency - 1.6% |
|||
|
ON Semiconductor Corp. (a) |
159,900 |
1,279,200 |
|
|
Power Network Efficiency - 18.2% |
|||
|
Eaton Corp. PLC |
54,400 |
3,371,168 |
|
|
Emerson Electric Co. |
121,600 |
6,894,720 |
|
|
ESCO Technologies, Inc. |
13,800 |
559,728 |
|
|
Hubbell, Inc. Class B |
33,500 |
3,112,485 |
|
|
Quanta Services, Inc. (a) |
35,100 |
996,840 |
|
|
TOTAL POWER NETWORK EFFICIENCY |
14,934,941 |
||
|
Transport Energy Efficiency - 1.3% |
|||
|
Sensata Technologies Holding BV (a) |
33,100 |
1,075,419 |
|
|
TOTAL ENERGY EFFICIENCY |
28,987,550 |
||
|
Environmental Support Services - 14.3% |
|||
|
Diversified Environmental - 10.8% |
|||
|
3M Co. |
9,300 |
967,200 |
|
|
Air Products & Chemicals, Inc. |
53,600 |
4,627,824 |
|
|
Parker Hannifin Corp. |
34,400 |
3,250,112 |
|
|
TOTAL DIVERSIFIED ENVIRONMENTAL |
8,845,136 |
||
|
Environmental Consultancies - 3.5% |
|||
|
AECOM Technology Corp. (a) |
24,700 |
748,657 |
|
|
Jacobs Engineering Group, Inc. (a) |
43,900 |
2,144,076 |
|
|
TOTAL ENVIRONMENTAL CONSULTANCIES |
2,892,733 |
||
|
TOTAL ENVIRONMENTAL SUPPORT SERVICES |
11,737,869 |
||
|
Pollution Control - 1.3% |
|||
|
Pollution Control Solutions - 1.3% |
|||
|
Tenneco, Inc. (a) |
29,900 |
1,059,357 |
|
|
|
|||
|
Shares |
Value |
||
|
Renewable & Alternative Energy - 9.3% |
|||
|
Biofuels - 0.4% |
|||
|
Amyris, Inc. (a)(d) |
115,100 |
$ 337,243 |
|
|
Renewable Energy Developers and Independent Power |
|||
|
EDP Renovaveis SA (a) |
180,994 |
931,009 |
|
|
Empresa Nacional de Electricidad SA sponsored ADR |
14,800 |
752,876 |
|
|
Iberdrola SA |
779,700 |
3,857,982 |
|
|
Pentair Ltd. |
28,000 |
1,491,560 |
|
|
TOTAL RENEWABLE ENERGY DEVELOPERS AN |
7,033,427 |
||
|
Solar Energy Generation Equipment - 0.3% |
|||
|
GT Advanced Technologies, Inc. (a)(d) |
93,900 |
268,554 |
|
|
TOTAL RENEWABLE & ALTERNATIVE ENERGY |
7,639,224 |
||
|
Waste Management & Technologies - 18.6% |
|||
|
General Waste Management - 7.0% |
|||
|
Republic Services, Inc. |
147,100 |
4,624,824 |
|
|
Waste Management, Inc. |
30,900 |
1,153,188 |
|
|
TOTAL GENERAL WASTE MANAGEMENT |
5,778,012 |
||
|
Hazardous Waste Management - 6.6% |
|||
|
Clean Harbors, Inc. (a) |
20,700 |
1,066,050 |
|
|
Stericycle, Inc. (a) |
39,100 |
3,750,472 |
|
|
US Ecology, Inc. |
23,000 |
572,010 |
|
|
TOTAL HAZARDOUS WASTE MANAGEMENT |
5,388,532 |
||
|
Recycling and Value Added Waste Processing - 5.0% |
|||
|
Commercial Metals Co. |
70,800 |
1,154,748 |
|
|
Covanta Holding Corp. |
84,300 |
1,648,908 |
|
|
Interface, Inc. |
35,000 |
640,850 |
|
|
Schnitzer Steel Industries, Inc. Class A |
22,800 |
652,308 |
|
|
TOTAL RECYCLING AND VALUE ADDED WAST |
4,096,814 |
||
|
TOTAL WASTE MANAGEMENT & TECHNOLOGIES |
15,263,358 |
||
|
Water Infrastructure & Technologies - 20.6% |
|||
|
Water Infrastructure - 1.9% |
|||
|
Aegion Corp. (a) |
65,300 |
1,569,159 |
|
|
Water Treatment Equipment - 18.7% |
|||
|
Ashland, Inc. |
47,700 |
3,719,169 |
|
|
Common Stocks - continued |
|||
|
Shares |
Value |
||
|
Water Infrastructure & Technologies - continued |
|||
|
Water Treatment Equipment - continued |
|||
|
Danaher Corp. |
126,200 |
$ 7,773,921 |
|
|
Ecolab, Inc. |
50,300 |
3,850,465 |
|
|
TOTAL WATER TREATMENT EQUIPMENT |
15,343,555 |
||
|
TOTAL WATER INFRASTRUCTURE & TECHNOLOGIES |
16,912,714 |
||
|
TOTAL COMMON STOCKS (Cost $71,551,174) |
|
||
|
Convertible Bonds - 0.3% |
|||
|
Principal |
|
||
|
Energy Efficiency - 0.3% |
|||
|
Buildings Energy Efficiency - 0.3% |
|||
|
Aspen Aerogels, Inc. 8% 6/1/14 (e) |
$ 275,800 |
|
|
|
Cash Equivalents - 2.1% |
|||
|
Shares |
|
||
|
Fidelity Cash Central Fund, 0.16% (b) |
111,824 |
111,824 |
|
|
Fidelity Securities Lending Cash Central Fund, 0.16% (b)(c) |
1,610,475 |
1,610,475 |
|
|
TOTAL CASH EQUIVALENTS (Cost $1,722,299) |
|
||
|
TOTAL INVESTMENT PORTFOLIO - 101.9% (Cost $73,549,273) |
83,598,171 |
||
|
NET OTHER ASSETS (LIABILITIES) - (1.9)% |
(1,580,318) |
||
|
NET ASSETS - 100% |
$ 82,017,853 |
||
|
Legend |
|
(a) Non-income producing |
|
(b) Affiliated fund that is generally available only to investment companies and other accounts managed by Fidelity Investments. The rate quoted is the annualized seven-day yield of the fund at period end. A complete unaudited listing of the fund's holdings as of its most recent quarter end is available upon request. In addition, each Fidelity Central Fund's financial statements, which are not covered by the Fund's Report of Independent Registered Public Accounting Firm, are available on the SEC's website or upon request. |
|
(c) Investment made with cash collateral received from securities on loan. |
|
(d) Security or a portion of the security is on loan at period end. |
|
(e) Restricted securities - Investment in securities not registered under the Securities Act of 1933 (excluding 144A issues). At the end of the period, the value of restricted securities (excluding 144A issues) amounted to $275,800 or 0.3% of net assets. |
|
Additional information on each restricted holding is as follows: |
|
Security |
Acquisition Date |
Acquisition Cost |
|
Aspen Aerogels, Inc. 8% 6/1/14 |
6/1/11 |
$ 275,800 |
|
Affiliated Central Funds |
|
Information regarding fiscal year to date income earned by the Fund from investments in Fidelity Central Funds is as follows: |
|
Fund |
Income earned |
|
Fidelity Cash Central Fund |
$ 1,321 |
|
Fidelity Securities Lending Cash Central Fund |
54,638 |
|
Total |
$ 55,959 |
|
Other Information |
|
The following is a summary of the inputs used, as of February 28, 2013, involving the Fund's assets and liabilities carried at fair value. The inputs or methodology used for valuing securities may not be an indication of the risk associated with investing in those securities. For more information on valuation inputs, and their aggregation into the levels used in the table below, please refer to the Investment Valuation section in the accompanying Notes to Financial Statements. |
|
Valuation Inputs at Reporting Date: |
||||
|
Description |
Total |
Level 1 |
Level 2 |
Level 3 |
|
Investments in Securities: |
||||
|
Common Stocks |
$ 81,600,072 |
$ 81,600,072 |
$ - |
$ - |
|
Convertible Bonds |
275,800 |
- |
- |
275,800 |
|
Money Market Funds |
1,722,299 |
1,722,299 |
- |
- |
|
Total Investments in Securities: |
$ 83,598,171 |
$ 83,322,371 |
$ - |
$ 275,800 |
|
Distribution of investments by country or territory of incorporation, as a percentage of total net assets, is as follows. (Unaudited) |
|
United States of America |
83.0% |
|
Ireland |
8.3% |
|
Spain |
5.9% |
|
Netherlands |
1.3% |
|
Others (Individually Less Than 1%) |
1.5% |
|
|
100.0% |
See accompanying notes which are an integral part of the financial statements.
Annual Report
Environment and Alternative Energy Portfolio
Financial Statements
Statement of Assets and Liabilities
|
|
February 28, 2013 |
|
|
|
|
|
|
Assets |
|
|
|
Investment in securities, at value (including securities loaned of $1,558,422) - See accompanying schedule: Unaffiliated issuers (cost $71,826,974) |
$ 81,875,872 |
|
|
Fidelity Central Funds (cost $1,722,299) |
1,722,299 |
|
|
Total Investments (cost $73,549,273) |
|
$ 83,598,171 |
|
Receivable for fund shares sold |
|
91,404 |
|
Dividends receivable |
|
109,158 |
|
Interest receivable |
|
38,612 |
|
Distributions receivable from Fidelity Central Funds |
|
2,918 |
|
Prepaid expenses |
|
79 |
|
Receivable from investment adviser for expense reductions |
|
343 |
|
Other receivables |
|
1,841 |
|
Total assets |
|
83,842,526 |
|
|
|
|
|
Liabilities |
|
|
|
Payable for fund shares redeemed |
$ 122,489 |
|
|
Accrued management fee |
38,302 |
|
|
Other affiliated payables |
23,154 |
|
|
Other payables and accrued expenses |
30,253 |
|
|
Collateral on securities loaned, at value |
1,610,475 |
|
|
Total liabilities |
|
1,824,673 |
|
|
|
|
|
Net Assets |
|
$ 82,017,853 |
|
Net Assets consist of: |
|
|
|
Paid in capital |
|
$ 83,246,923 |
|
Undistributed net investment income |
|
122,028 |
|
Accumulated undistributed net realized gain (loss) on investments and foreign currency transactions |
|
(11,399,908) |
|
Net unrealized appreciation (depreciation) on investments and assets and liabilities in foreign currencies |
|
10,048,810 |
|
Net Assets, for 4,526,138 shares outstanding |
|
$ 82,017,853 |
|
Net Asset Value, offering price and redemption price per share ($82,017,853 ÷ 4,526,138 shares) |
|
$ 18.12 |
Statement of Operations
|
|
Year ended February 28, 2013 |
|
|
|
|
|
|
Investment Income |
|
|
|
Dividends |
|
$ 1,362,573 |
|
Interest |
|
22,125 |
|
Income from Fidelity Central Funds |
|
55,959 |
|
Total income |
|
1,440,657 |
|
|
|
|
|
Expenses |
|
|
|
Management fee |
$ 388,361 |
|
|
Transfer agent fees |
210,376 |
|
|
Accounting and security lending fees |
27,526 |
|
|
Custodian fees and expenses |
4,588 |
|
|
Independent trustees' compensation |
464 |
|
|
Registration fees |
16,791 |
|
|
Audit |
37,903 |
|
|
Legal |
285 |
|
|
Miscellaneous |
719 |
|
|
Total expenses before reductions |
687,013 |
|
|
Expense reductions |
(10,085) |
676,928 |
|
Net investment income (loss) |
|
763,729 |
|
Realized and Unrealized Gain (Loss) Net realized gain (loss) on: |
|
|
|
Investment securities: |
|
|
|
Unaffiliated issuers |
192,338 |
|
|
Foreign currency transactions |
(13,065) |
|
|
Total net realized gain (loss) |
|
179,273 |
|
Change in net unrealized appreciation (depreciation) on: Investment securities |
7,347,761 |
|
|
Assets and liabilities in foreign currencies |
(37) |
|
|
Total change in net unrealized appreciation (depreciation) |
|
7,347,724 |
|
Net gain (loss) |
|
7,526,997 |
|
Net increase (decrease) in net assets resulting from operations |
|
$ 8,290,726 |
See accompanying notes which are an integral part of the financial statements.
Annual Report
Statement of Changes in Net Assets
|
|
Year ended |
Year ended |
|
Increase (Decrease) in Net Assets |
|
|
|
Operations |
|
|
|
Net investment income (loss) |
$ 763,729 |
$ 1,005,199 |
|
Net realized gain (loss) |
179,273 |
(5,141,157) |
|
Change in net unrealized appreciation (depreciation) |
7,347,724 |
(10,791,584) |
|
Net increase (decrease) in net assets resulting from operations |
8,290,726 |
(14,927,542) |
|
Distributions to shareholders from net investment income |
(630,649) |
(910,843) |
|
Share transactions |
25,657,131 |
43,448,137 |
|
Reinvestment of distributions |
608,268 |
874,813 |
|
Cost of shares redeemed |
(29,853,602) |
(47,411,226) |
|
Net increase (decrease) in net assets resulting from share transactions |
(3,588,203) |
(3,088,276) |
|
Redemption fees |
2,483 |
5,933 |
|
Total increase (decrease) in net assets |
4,074,357 |
(18,920,728) |
|
|
|
|
|
Net Assets |
|
|
|
Beginning of period |
77,943,496 |
96,864,224 |
|
End of period (including undistributed net investment income of $122,028 and undistributed net investment income of $2,013, respectively) |
$ 82,017,853 |
$ 77,943,496 |
|
Other Information Shares |
|
|
|
Sold |
1,538,263 |
2,426,768 |
|
Issued in reinvestment of distributions |
36,928 |
56,886 |
|
Redeemed |
(1,825,673) |
(2,755,970) |
|
Net increase (decrease) |
(250,482) |
(272,316) |
Financial Highlights
|
Years ended February 28, |
2013 |
2012 F |
2011 |
2010 |
2009 |
|
Selected Per-Share Data |
|
|
|
|
|
|
Net asset value, beginning of period |
$ 16.32 |
$ 19.19 |
$ 14.94 |
$ 10.94 |
$ 17.71 |
|
Income from Investment Operations |
|
|
|
|
|
|
Net investment income (loss) B |
.18 |
.20 |
.10 |
.11 |
.06 |
|
Net realized and unrealized gain (loss) |
1.77 |
(2.88) |
4.22 |
4.03 |
(6.76) |
|
Total from investment operations |
1.95 |
(2.68) |
4.32 |
4.14 |
(6.70) |
|
Distributions from net investment income |
(.15) |
(.19) |
(.07) |
(.14) |
(.07) |
|
Redemption fees added to paid in capital B,G |
- |
- |
- |
- |
- |
|
Net asset value, end of period |
$ 18.12 |
$ 16.32 |
$ 19.19 |
$ 14.94 |
$ 10.94 |
|
Total Return A |
12.02% |
(13.92)% |
28.96% |
37.77% |
(37.88)% |
|
Ratios to Average Net Assets C,E |
|
|
|
|
|
|
Expenses before reductions |
.99% |
1.01% |
1.08% |
1.08% |
1.06% |
|
Expenses net of fee waivers, if any |
.99% |
1.01% |
1.08% |
1.08% |
1.06% |
|
Expenses net of all reductions |
.97% |
1.00% |
1.07% |
1.08% |
1.06% |
|
Net investment income (loss) |
1.10% |
1.15% |
.59% |
.82% |
.37% |
|
Supplemental Data |
|
|
|
|
|
|
Net assets, end of period (000 omitted) |
$ 82,018 |
$ 77,943 |
$ 96,864 |
$ 47,186 |
$ 39,004 |
|
Portfolio turnover rate D |
54% |
183% |
190% |
132% |
107% |
|
A Total returns would have been lower if certain expenses had not been reduced during the applicable periods shown. B Calculated based on average shares outstanding during the period. C Fees and expenses of any underlying Fidelity Central Funds are not included in the Fund's expense ratio. The Fund indirectly bears its proportionate share of the expenses of any underlying Fidelity Central Funds. D Amount does not include the portfolio activity of any underlying Fidelity Central Funds. E Expense ratios reflect operating expenses of the Fund. Expenses before reductions do not reflect amounts reimbursed by the investment adviser or reductions from brokerage service arrangements or reductions from other expense offset arrangements and do not represent the amount paid by the Fund during periods when reimbursements or reductions occur. Expenses net of fee waivers reflect expenses after reimbursement by the investment adviser but prior to reductions from brokerage service arrangements or other expense offset arrangements. Expenses net of all reductions represent the net expenses paid by the Fund. F For the year ended February 29. G Amount represents less than $.01 per share. |
See accompanying notes which are an integral part of the financial statements.
Annual Report
Industrial Equipment Portfolio
Performance: The Bottom Line
Average annual total return reflects the change in the value of an investment, assuming reinvestment of the fund's distributions from dividend income and capital gains (the profits earned upon the sale of securities that have grown in value, if any) and assuming a constant rate of performance each year. The $10,000 table and the fund's returns do not reflect the deduction of taxes that a shareholder would pay on fund distributions or the redemption of fund shares. During periods of reimbursement by Fidelity, a fund's total return will be greater than it would be had the reimbursement not occurred. How a fund did yesterday is no guarantee of how it will do tomorrow.
Average Annual Total Returns
|
Periods ended February 28, 2013 |
Past 1 |
Past 5 |
Past 10 |
|
Industrial Equipment Portfolio |
10.19% |
5.55% |
12.25% |
$10,000 Over 10 Years
Let's say hypothetically that $10,000 was invested in Industrial Equipment Portfolio on February 28, 2003. The chart shows how the value of your investment would have changed, and also shows how the S&P 500 Index performed over the same period.
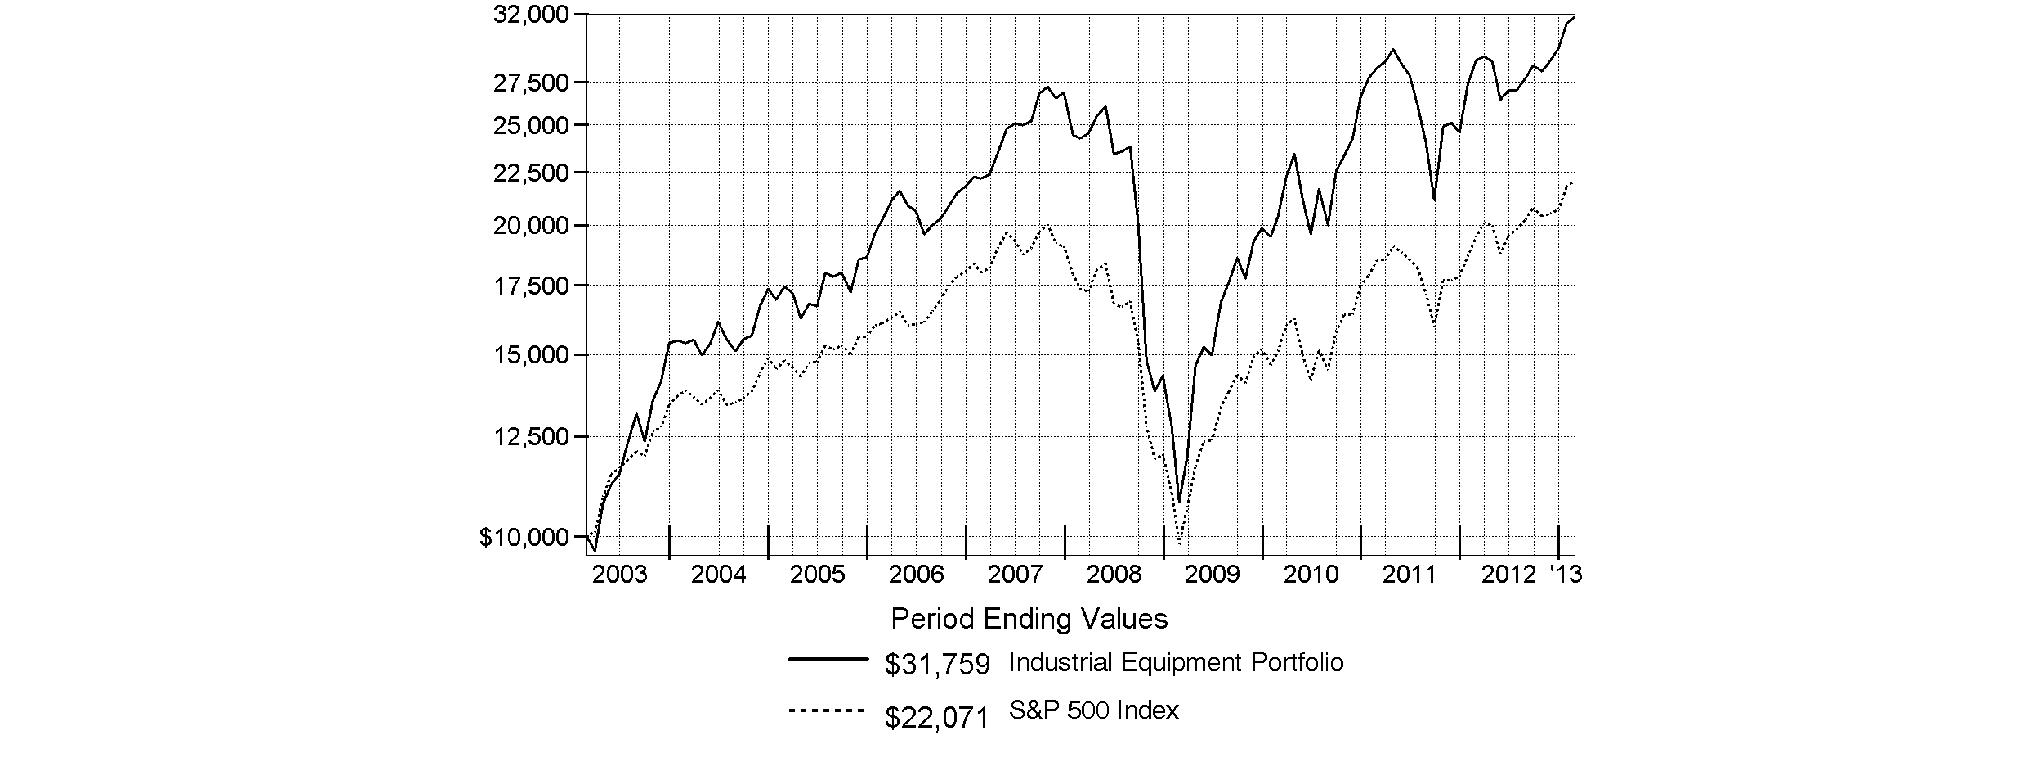
Annual Report
Industrial Equipment Portfolio
Management's Discussion of Fund Performance
Market Recap: U.S. stocks posted solid gains for the year ending February 28, 2013, sparked by a late-period rally that pushed major equity benchmarks to multiyear highs. Improvement in the global economy and more monetary stimulus from the U.S. Federal Reserve kept markets on the upswing for much of the year, shrugging off an early decline brought on by debt woes in Europe, and another dip later in the period amid Congressional gridlock on the federal budget. Renewed optimism over employment, the housing market, corporate earnings and record dividends made stocks a favorite with investors during the 12 months, which helped push the broad-based S&P 500® Index across the milestone 1,500 mark at the end of January. The S&P 500® finished the period up 13.46%. Seven of the 10 major market sectors tracked by MSCI U.S. IMI 25-50 classifications produced double-digit gains, led by health care and financials, while information technology, energy and materials trailed the broad equity market with only modest advances.
Comments from Boris Shepov, who became sole Portfolio Manager of Industrial Equipment Portfolio on January 2, 2013, after serving as Co-Manager: For the year, the fund rose 10.19%, lagging its industry benchmark, the MSCI® U.S. IMI Capital Goods 25-50 Index, which gained 14.29%, and the S&P 500®. During the 12-month period, the MSCI index struggled until late 2012 due to a variety of factors, including uncertainty surrounding the European debt crisis and political gridlock in the U.S. Investors also were concerned about the economic slowdown in China and the government transition in that important end market for industrials companies. However, during the final few months of the reporting period, investors became more optimistic, largely due to continued strength in the U.S. housing recovery and stabilization in Europe and China. Relative to the MSCI index, it hurt to overweight heavy machinery companies that had exposure to the mining and truck markets. Weaker-than-expected growth in China hurt commodities-related groups, which, in turn, prompted mining firms to cut future spending on previously announced projects. Unfortunately, the fund was overweight Caterpillar and Joy Global, two mining equipment manufacturers. On the heavy equipment side of the group, shares of diesel engine manufacturer Cummins faltered due to declines in truck production in China, India and Brazil. An average underweight in industrial conglomerate and benchmark heavyweight General Electric also weighed on relative performance. On the other hand, the fund was well-positioned to benefit amid improved non-residential construction spending in the U.S. and better-than-expected housing market growth, including our significant position in Ingersoll-Rand. The heating, ventilation and air conditioning (HVAC) manufacturer was our top relative contributor, gaining on these themes, as well as improved execution in its residential HVAC business. An overweight in building products added value, including Quanex Building Products. A significant underweight in aerospace/defense helped the most, and largely avoiding aircraft manufacturer and major benchmark component Boeing was the right call. Our small position here helped when shares struggled last May amid uncertainty about the firm's 787 Dreamliner® program.
The views expressed above reflect those of the portfolio manager(s) only through the end of the period as stated on the cover of this report and do not necessarily represent the views of Fidelity or any other person in the Fidelity organization. Any such views are subject to change at any time based upon market or other conditions and Fidelity disclaims any responsibility to update such views. These views may not be relied on as investment advice and, because investment decisions for a Fidelity fund are based on numerous factors, may not be relied on as an indication of trading intent on behalf of any Fidelity fund.
Annual Report
Industrial Equipment Portfolio
Investment Changes (Unaudited)
|
Top Ten Stocks as of February 28, 2013 |
||
|
|
% of fund's |
% of fund's net assets |
|
General Electric Co. |
16.9 |
17.8 |
|
United Technologies Corp. |
7.2 |
5.8 |
|
Caterpillar, Inc. |
5.2 |
5.6 |
|
3M Co. |
4.3 |
6.0 |
|
Cummins, Inc. |
3.9 |
3.6 |
|
Honeywell International, Inc. |
3.6 |
3.8 |
|
Illinois Tool Works, Inc. |
3.6 |
3.2 |
|
Emerson Electric Co. |
3.4 |
3.8 |
|
Danaher Corp. |
2.6 |
2.8 |
|
Ingersoll-Rand PLC |
2.6 |
2.2 |
|
|
53.3 |
|
|
Top Industries (% of fund's net assets) |
|||
|
As of February 28, 2013 |
|||
|
Machinery |
31.3% |
|
|
Industrial Conglomerates |
24.7% |
|
|
Aerospace & Defense |
18.3% |
|
|
Electrical Equipment |
10.7% |
|
|
Construction & Engineering |
3.2% |
|
|
All Others* |
11.8% |
|

|
As of August 31, 2012 |
|||
|
Industrial Conglomerates |
26.9% |
|
|
Machinery |
26.8% |
|
|
Aerospace & Defense |
17.5% |
|
|
Electrical Equipment |
12.1% |
|
 |
Construction & Engineering |
2.9% |
|
|
All Others* |
13.8% |
|

|
* Includes short-term investments and net other assets. |
Annual Report
Industrial Equipment Portfolio
Investments February 28, 2013
Showing Percentage of Net Assets
|
Common Stocks - 96.3% |
|||
|
Shares |
Value |
||
|
AEROSPACE & DEFENSE - 18.3% |
|||
|
Aerospace & Defense - 18.3% |
|||
|
Alliant Techsystems, Inc. |
22,500 |
$ 1,480,500 |
|
|
American Science & Engineering, Inc. |
11,900 |
744,226 |
|
|
Ducommun, Inc. (a) |
12,500 |
193,750 |
|
|
Honeywell International, Inc. |
192,000 |
13,459,200 |
|
|
Precision Castparts Corp. |
39,600 |
7,388,964 |
|
|
Rockwell Collins, Inc. |
51,700 |
3,107,687 |
|
|
Teledyne Technologies, Inc. (a) |
22,500 |
1,655,550 |
|
|
Textron, Inc. |
265,200 |
7,651,020 |
|
|
The Boeing Co. |
11,600 |
892,040 |
|
|
TransDigm Group, Inc. |
32,200 |
4,583,348 |
|
|
United Technologies Corp. |
294,500 |
26,666,975 |
|
|
|
67,823,260 |
||
|
AIR FREIGHT & LOGISTICS - 0.4% |
|||
|
Air Freight & Logistics - 0.4% |
|||
|
C.H. Robinson Worldwide, Inc. |
13,800 |
786,876 |
|
|
Expeditors International of Washington, Inc. |
20,100 |
780,885 |
|
|
|
1,567,761 |
||
|
AIRLINES - 0.7% |
|||
|
Airlines - 0.7% |
|||
|
Copa Holdings SA Class A |
24,600 |
2,568,732 |
|
|
BUILDING PRODUCTS - 1.9% |
|||
|
Building Products - 1.9% |
|||
|
AAON, Inc. |
42,200 |
1,015,332 |
|
|
Armstrong World Industries, Inc. |
15,900 |
812,967 |
|
|
Gibraltar Industries, Inc. (a) |
70,241 |
1,204,633 |
|
|
Quanex Building Products Corp. |
136,778 |
2,723,250 |
|
|
Simpson Manufacturing Co. Ltd. |
43,600 |
1,268,760 |
|
|
|
7,024,942 |
||
|
CHEMICALS - 0.6% |
|||
|
Commodity Chemicals - 0.6% |
|||
|
Cabot Corp. |
56,900 |
2,092,782 |
|
|
COMMERCIAL SERVICES & SUPPLIES - 0.5% |
|||
|
Diversified Support Services - 0.5% |
|||
|
Aggreko PLC |
70,200 |
1,806,188 |
|
|
CONSTRUCTION & ENGINEERING - 3.2% |
|||
|
Construction & Engineering - 3.2% |
|||
|
FLSmidth & Co. A/S |
52,300 |
3,571,122 |
|
|
Jacobs Engineering Group, Inc. (a) |
83,700 |
4,087,908 |
|
|
KBR, Inc. |
64,800 |
1,969,272 |
|
|
Larsen & Toubro Ltd. |
18,430 |
463,648 |
|
|
Primoris Services Corp. |
86,500 |
1,621,875 |
|
|
|
11,713,825 |
||
|
ELECTRICAL EQUIPMENT - 10.7% |
|||
|
Electrical Components & Equipment - 10.2% |
|||
|
Acuity Brands, Inc. |
24,700 |
1,682,811 |
|
|
|
|||
|
Shares |
Value |
||
|
AMETEK, Inc. |
79,650 |
$ 3,331,760 |
|
|
Emerson Electric Co. |
221,400 |
12,553,380 |
|
|
Hubbell, Inc. Class B |
26,000 |
2,415,660 |
|
|
Prysmian SpA |
87,200 |
1,900,056 |
|
|
Regal-Beloit Corp. |
92,928 |
7,181,476 |
|
|
Rockwell Automation, Inc. |
55,300 |
4,995,802 |
|
|
Roper Industries, Inc. |
30,400 |
3,788,144 |
|
|
|
37,849,089 |
||
|
Heavy Electrical Equipment - 0.5% |
|||
|
AZZ, Inc. |
27,600 |
1,232,616 |
|
|
Bharat Heavy Electricals Ltd. |
165,641 |
612,814 |
|
|
|
1,845,430 |
||
|
TOTAL ELECTRICAL EQUIPMENT |
39,694,519 |
||
|
ELECTRONIC EQUIPMENT & COMPONENTS - 0.3% |
|||
|
Electronic Equipment & Instruments - 0.3% |
|||
|
FLIR Systems, Inc. |
41,300 |
1,087,842 |
|
|
INDUSTRIAL CONGLOMERATES - 24.7% |
|||
|
Industrial Conglomerates - 24.7% |
|||
|
3M Co. |
152,900 |
15,901,600 |
|
|
Danaher Corp. |
155,400 |
9,572,640 |
|
|
General Electric Co. |
2,700,455 |
62,704,566 |
|
|
Koninklijke Philips Electronics NV |
77,200 |
2,181,008 |
|
|
Raven Industries, Inc. |
32,800 |
925,944 |
|
|
|
91,285,758 |
||
|
MACHINERY - 31.3% |
|||
|
Construction & Farm Machinery & Heavy Trucks - 16.4% |
|||
|
Ashok Leyland Ltd. |
1,508,133 |
617,178 |
|
|
Caterpillar, Inc. |
206,800 |
19,102,116 |
|
|
Cummins, Inc. |
125,400 |
14,530,098 |
|
|
Fiat Industrial SpA |
210,300 |
2,557,500 |
|
|
Joy Global, Inc. |
67,400 |
4,269,116 |
|
|
Manitowoc Co., Inc. |
237,800 |
4,404,056 |
|
|
Oshkosh Truck Corp. (a) |
77,500 |
2,988,400 |
|
|
PACCAR, Inc. |
168,900 |
8,010,927 |
|
|
WABCO Holdings, Inc. (a) |
15,600 |
1,072,032 |
|
|
Wabtec Corp. |
21,000 |
2,053,590 |
|
|
Weichai Power Co. Ltd. (H Shares) |
265,000 |
1,004,564 |
|
|
|
60,609,577 |
||
|
Industrial Machinery - 14.9% |
|||
|
Actuant Corp. Class A |
42,800 |
1,301,548 |
|
|
Alfa Laval AB |
43,200 |
1,005,288 |
|
|
Blount International, Inc. (a) |
59,800 |
901,186 |
|
|
Donaldson Co., Inc. |
109,400 |
3,941,682 |
|
|
Flowserve Corp. |
19,100 |
3,065,550 |
|
|
Gorman-Rupp Co. |
31,200 |
899,808 |
|
|
Graco, Inc. |
30,100 |
1,748,810 |
|
|
Illinois Tool Works, Inc. |
215,800 |
13,271,700 |
|
|
Ingersoll-Rand PLC |
181,000 |
9,529,650 |
|
|
Lincoln Electric Holdings, Inc. |
36,200 |
2,029,010 |
|
|
Middleby Corp. (a) |
11,800 |
1,761,858 |
|
|
Common Stocks - continued |
|||
|
Shares |
Value |
||
|
MACHINERY - CONTINUED |
|||
|
Industrial Machinery - continued |
|||
|
Nordson Corp. |
26,500 |
$ 1,680,100 |
|
|
Pall Corp. |
41,400 |
2,822,652 |
|
|
Parker Hannifin Corp. |
54,700 |
5,168,056 |
|
|
Sun Hydraulics Corp. |
35,500 |
990,095 |
|
|
Timken Co. |
55,500 |
3,014,760 |
|
|
Weg SA |
68,200 |
912,710 |
|
|
Woodward, Inc. |
35,800 |
1,339,994 |
|
|
|
55,384,457 |
||
|
TOTAL MACHINERY |
115,994,034 |
||
|
PROFESSIONAL SERVICES - 0.5% |
|||
|
Research & Consulting Services - 0.5% |
|||
|
Dun & Bradstreet Corp. |
22,700 |
1,829,620 |
|
|
ROAD & RAIL - 0.4% |
|||
|
Railroads - 0.4% |
|||
|
Globaltrans Investment PLC GDR (Reg. S) |
95,000 |
1,519,050 |
|
|
TRADING COMPANIES & DISTRIBUTORS - 2.6% |
|||
|
Trading Companies & Distributors - 2.6% |
|||
|
Applied Industrial Technologies, Inc. |
30,700 |
1,332,687 |
|
|
Houston Wire & Cable Co. |
103,519 |
1,204,961 |
|
|
MSC Industrial Direct Co., Inc. Class A |
24,100 |
2,056,212 |
|
|
Watsco, Inc. |
16,500 |
1,284,855 |
|
|
WESCO International, Inc. (a) |
48,800 |
3,606,320 |
|
|
|
9,485,035 |
||
|
TRANSPORTATION INFRASTRUCTURE - 0.2% |
|||
|
Highways & Railtracks - 0.2% |
|||
|
CCR SA |
87,700 |
879,481 |
|
|
TOTAL COMMON STOCKS (Cost $283,714,928) |
|
||
|
Nonconvertible Preferred Stocks - 0.7% |
|||
|
Shares |
Value |
||
|
AUTOMOBILES - 0.7% |
|||
|
Automobile Manufacturers - 0.7% |
|||
|
Volkswagen AG |
10,900 |
$ 2,380,050 |
|
|
Money Market Funds - 2.4% |
|||
|
|
|
|
|
|
Fidelity Cash Central Fund, 0.16% (b) |
8,932,988 |
|
|
|
TOTAL INVESTMENT PORTFOLIO - 99.4% (Cost $295,122,196) |
367,685,867 |
||
|
NET OTHER ASSETS (LIABILITIES) - 0.6% |
2,265,052 |
||
|
NET ASSETS - 100% |
$ 369,950,919 |
||
|
Legend |
|
(a) Non-income producing |
|
(b) Affiliated fund that is available only to investment companies and other accounts managed by Fidelity Investments. The rate quoted is the annualized seven-day yield of the fund at period end. A complete unaudited listing of the fund's holdings as of its most recent quarter end is available upon request. In addition, each Fidelity Central Fund's financial statements, which are not covered by the Fund's Report of Independent Registered Public Accounting Firm, are available on the SEC's website or upon request. |
|
Affiliated Central Funds |
|
Information regarding fiscal year to date income earned by the Fund from investments in Fidelity Central Funds is as follows: |
|
Fund |
Income earned |
|
Fidelity Cash Central Fund |
$ 27,462 |
|
Fidelity Securities Lending Cash Central Fund |
1,015 |
|
Total |
$ 28,477 |
|
Other Affiliated Issuers |
|
An affiliated company is a company in which the Fund has ownership of at least 5% of the voting securities. Fiscal year to date transactions with companies which are or were affiliates are as follows: |
|
Affiliate |
Value, beginning of period |
Purchases |
Sales Proceeds |
Dividend Income |
Value, end of period |
|
Key Technology, Inc. |
$ 3,964,961 |
$ - |
$ 2,818,293 |
$ - |
$ - |
|
Total |
$ 3,964,961 |
$ - |
$ 2,818,293 |
$ - |
$ - |
|
Other Information |
|
The following is a summary of the inputs used, as of February 28, 2013, involving the Fund's assets and liabilities carried at fair value. The inputs or methodology used for valuing securities may not be an indication of the risk associated with investing in those securities. For more information on valuation inputs, and their aggregation into the levels used in the table below, please refer to the Investment Valuation section in the accompanying Notes to Financial Statements. |
|
Valuation Inputs at Reporting Date: |
||||
|
Description |
Total |
Level 1 |
Level 2 |
Level 3 |
|
Investments in Securities: |
||||
|
Common Stocks |
$ 356,372,829 |
$ 354,191,821 |
$ 2,181,008 |
$ - |
|
Nonconvertible Preferred Stocks |
2,380,050 |
2,380,050 |
- |
- |
|
Money Market Funds |
8,932,988 |
8,932,988 |
- |
- |
|
Total Investments in Securities: |
$ 367,685,867 |
$ 365,504,859 |
$ 2,181,008 |
$ - |
See accompanying notes which are an integral part of the financial statements.
Annual Report
Industrial Equipment Portfolio
Financial Statements
Statement of Assets and Liabilities
|
|
February 28, 2013 |
|
|
|
|
|
|
Assets |
|
|
|
Investment in securities, at value - See accompanying schedule: Unaffiliated issuers (cost $286,189,208) |
$ 358,752,879 |
|
|
Fidelity Central Funds (cost $8,932,988) |
8,932,988 |
|
|
Total Investments (cost $295,122,196) |
|
$ 367,685,867 |
|
Receivable for investments sold |
|
1,661,497 |
|
Receivable for fund shares sold |
|
173,719 |
|
Dividends receivable |
|
1,191,741 |
|
Distributions receivable from Fidelity Central Funds |
|
1,534 |
|
Prepaid expenses |
|
501 |
|
Receivable from investment adviser for expense reductions |
|
279 |
|
Other receivables |
|
8,252 |
|
Total assets |
|
370,723,390 |
|
|
|
|
|
Liabilities |
|
|
|
Payable for fund shares redeemed |
$ 502,958 |
|
|
Accrued management fee |
169,270 |
|
|
Transfer agent fee payable |
51,182 |
|
|
Other affiliated payables |
11,857 |
|
|
Other payables and accrued expenses |
37,204 |
|
|
Total liabilities |
|
772,471 |
|
|
|
|
|
Net Assets |
|
$ 369,950,919 |
|
Net Assets consist of: |
|
|
|
Paid in capital |
|
$ 300,202,562 |
|
Undistributed net investment income |
|
548,351 |
|
Accumulated undistributed net realized gain (loss) on investments and foreign currency transactions |
|
(3,363,818) |
|
Net unrealized appreciation (depreciation) on investments and assets and liabilities in foreign currencies |
|
72,563,824 |
|
Net Assets, for 9,345,612 shares outstanding |
|
$ 369,950,919 |
|
Net Asset Value, offering price and redemption price per share ($369,950,919 ÷ 9,345,612 shares) |
|
$ 39.59 |
Statement of Operations
|
|
Year ended February 28, 2013 |
|
|
|
|
|
|
Investment Income |
|
|
|
Dividends |
|
$ 6,463,842 |
|
Interest |
|
55 |
|
Income from Fidelity Central Funds |
|
28,477 |
|
Total income |
|
6,492,374 |
|
|
|
|
|
Expenses |
|
|
|
Management fee |
$ 1,755,612 |
|
|
Transfer agent fees |
603,549 |
|
|
Accounting and security lending fees |
122,883 |
|
|
Custodian fees and expenses |
14,280 |
|
|
Independent trustees' compensation |
2,064 |
|
|
Registration fees |
28,019 |
|
|
Audit |
51,441 |
|
|
Legal |
1,172 |
|
|
Miscellaneous |
2,744 |
|
|
Total expenses before reductions |
2,581,764 |
|
|
Expense reductions |
(22,380) |
2,559,384 |
|
Net investment income (loss) |
|
3,932,990 |
|
Realized and Unrealized Gain (Loss) Net realized gain (loss) on: |
|
|
|
Investment securities: |
|
|
|
Unaffiliated issuers (net of foreign taxes of $17,726) |
4,856,800 |
|
|
Other affiliated issuers |
(2,048,055) |
|
|
Foreign currency transactions |
47,345 |
|
|
Total net realized gain (loss) |
|
2,856,090 |
|
Change in net unrealized appreciation (depreciation) on: Investment securities (net of decrease in deferred foreign taxes of $31,751) |
21,842,327 |
|
|
Assets and liabilities in foreign currencies |
(2,389) |
|
|
Total change in net unrealized appreciation (depreciation) |
|
21,839,938 |
|
Net gain (loss) |
|
24,696,028 |
|
Net increase (decrease) in net assets resulting from operations |
|
$ 28,629,018 |
See accompanying notes which are an integral part of the financial statements.
Annual Report
Industrial Equipment Portfolio
Financial Statements - continued
Statement of Changes in Net Assets
|
|
Year ended |
Year ended |
|
Increase (Decrease) in Net Assets |
|
|
|
Operations |
|
|
|
Net investment income (loss) |
$ 3,932,990 |
$ 2,683,212 |
|
Net realized gain (loss) |
2,856,090 |
6,338,922 |
|
Change in net unrealized appreciation (depreciation) |
21,839,938 |
(7,805,695) |
|
Net increase (decrease) in net assets resulting from operations |
28,629,018 |
1,216,439 |
|
Distributions to shareholders from net investment income |
(3,820,438) |
(2,550,520) |
|
Distributions to shareholders from net realized gain |
(33,809) |
(1,033,874) |
|
Total distributions |
(3,854,247) |
(3,584,394) |
|
Share transactions |
107,872,573 |
175,476,236 |
|
Reinvestment of distributions |
3,805,295 |
3,511,222 |
|
Cost of shares redeemed |
(118,178,190) |
(187,624,495) |
|
Net increase (decrease) in net assets resulting from share transactions |
(6,500,322) |
(8,637,037) |
|
Redemption fees |
2,455 |
8,044 |
|
Total increase (decrease) in net assets |
18,276,904 |
(10,996,948) |
|
|
|
|
|
Net Assets |
|
|
|
Beginning of period |
351,674,015 |
362,670,963 |
|
End of period (including undistributed net investment income of $548,351 and undistributed net investment income of $613,405, respectively) |
$ 369,950,919 |
$ 351,674,015 |
|
Other Information Shares |
|
|
|
Sold |
2,933,692 |
5,105,217 |
|
Issued in reinvestment of distributions |
103,978 |
104,395 |
|
Redeemed |
(3,361,719) |
(5,569,458) |
|
Net increase (decrease) |
(324,049) |
(359,846) |
Financial Highlights
|
Years ended February 28, |
2013 |
2012 G |
2011 |
2010 |
2009 |
|
Selected Per-Share Data |
|
|
|
|
|
|
Net asset value, beginning of period |
$ 36.37 |
$ 36.16 |
$ 26.16 |
$ 13.98 |
$ 32.45 |
|
Income from Investment Operations |
|
|
|
|
|
|
Net investment income (loss) B |
.45 |
.28 |
.26 |
.19 |
.33 |
|
Net realized and unrealized gain (loss) |
3.22 |
.29 E |
9.89 |
12.22 |
(17.96) |
|
Total from investment operations |
3.67 |
.57 |
10.15 |
12.41 |
(17.63) |
|
Distributions from net investment income |
(.45) |
(.26) |
(.15) |
(.23) |
(.34) |
|
Distributions from net realized gain |
- |
(.10) |
- |
- |
(.50) |
|
Total distributions |
(.45) |
(.36) |
(.15) |
(.23) |
(.84) |
|
Redemption fees added to paid in capital B,H |
- |
- |
- |
- |
- |
|
Net asset value, end of period |
$ 39.59 |
$ 36.37 |
$ 36.16 |
$ 26.16 |
$ 13.98 |
|
Total Return A |
10.19% |
1.66% |
38.87% |
89.06% |
(55.46)% |
|
Ratios to Average Net Assets C,F |
|
|
|
|
|
|
Expenses before reductions |
.82% |
.84% |
.89% |
.95% |
.90% |
|
Expenses net of fee waivers, if any |
.82% |
.84% |
.89% |
.95% |
.90% |
|
Expenses net of all reductions |
.81% |
.84% |
.88% |
.94% |
.90% |
|
Net investment income (loss) |
1.25% |
.85% |
.85% |
.87% |
1.22% |
|
Supplemental Data |
|
|
|
|
|
|
Net assets, end of period (000 omitted) |
$ 369,951 |
$ 351,674 |
$ 362,671 |
$ 120,368 |
$ 47,260 |
|
Portfolio turnover rate D |
69% |
101% |
82% |
74% |
136% |
|
A Total returns would have been lower if certain expenses had not been reduced during the applicable periods shown. B Calculated based on average shares outstanding during the period. C Fees and expenses of any underlying Fidelity Central Funds are not included in the Fund's expense ratio. The Fund indirectly bears its proportionate share of the expenses of any underlying Fidelity Central Funds. D Amount does not include the portfolio activity of any underlying Fidelity Central Funds. E The amount shown for a share outstanding does not correspond with the aggregate net gain (loss) on investments for the period due to the timing of sales and repurchases of shares in relation to fluctuating market values of the investments of the Fund. F Expense ratios reflect operating expenses of the Fund. Expenses before reductions do not reflect amounts reimbursed by the investment adviser or reductions from brokerage service arrangements or reductions from other expense offset arrangements and do not represent the amount paid by the Fund during periods when reimbursements or reductions occur. Expenses net of fee waivers reflect expenses after reimbursement by the investment adviser but prior to reductions from brokerage service arrangements or other expense offset arrangements. Expenses net of all reductions represent the net expenses paid by the Fund. G For the year ended February 29. H Amount represents less than $.01 per share. |
See accompanying notes which are an integral part of the financial statements.
Annual Report
Industrials Portfolio
Performance: The Bottom Line
Average annual total return reflects the change in the value of an investment, assuming reinvestment of the fund's distributions from dividend income and capital gains (the profits earned upon the sale of securities that have grown in value, if any) and assuming a constant rate of performance each year. The $10,000 table and the fund's returns do not reflect the deduction of taxes that a shareholder would pay on fund distributions or the redemption of fund shares. During periods of reimbursement by Fidelity, a fund's total return will be greater than it would be had the reimbursement not occurred. How a fund did yesterday is no guarantee of how it will do tomorrow.
Average Annual Total Returns
|
Periods ended February 28, 2013 |
Past 1 |
Past 5 |
Past 10 |
|
Industrials Portfolio A |
15.71% |
8.09% |
14.22% |
A Prior to October 1, 2006, Industrials Portfolio operated under certain different investment policies. The historical performance for the fund may not represent its current investment policies.
$10,000 Over 10 Years
Let's say hypothetically that $10,000 was invested in Industrials Portfolio on February 28, 2003. The chart shows how the value of your investment would have changed, and also shows how the S&P 500 Index performed over the same period.
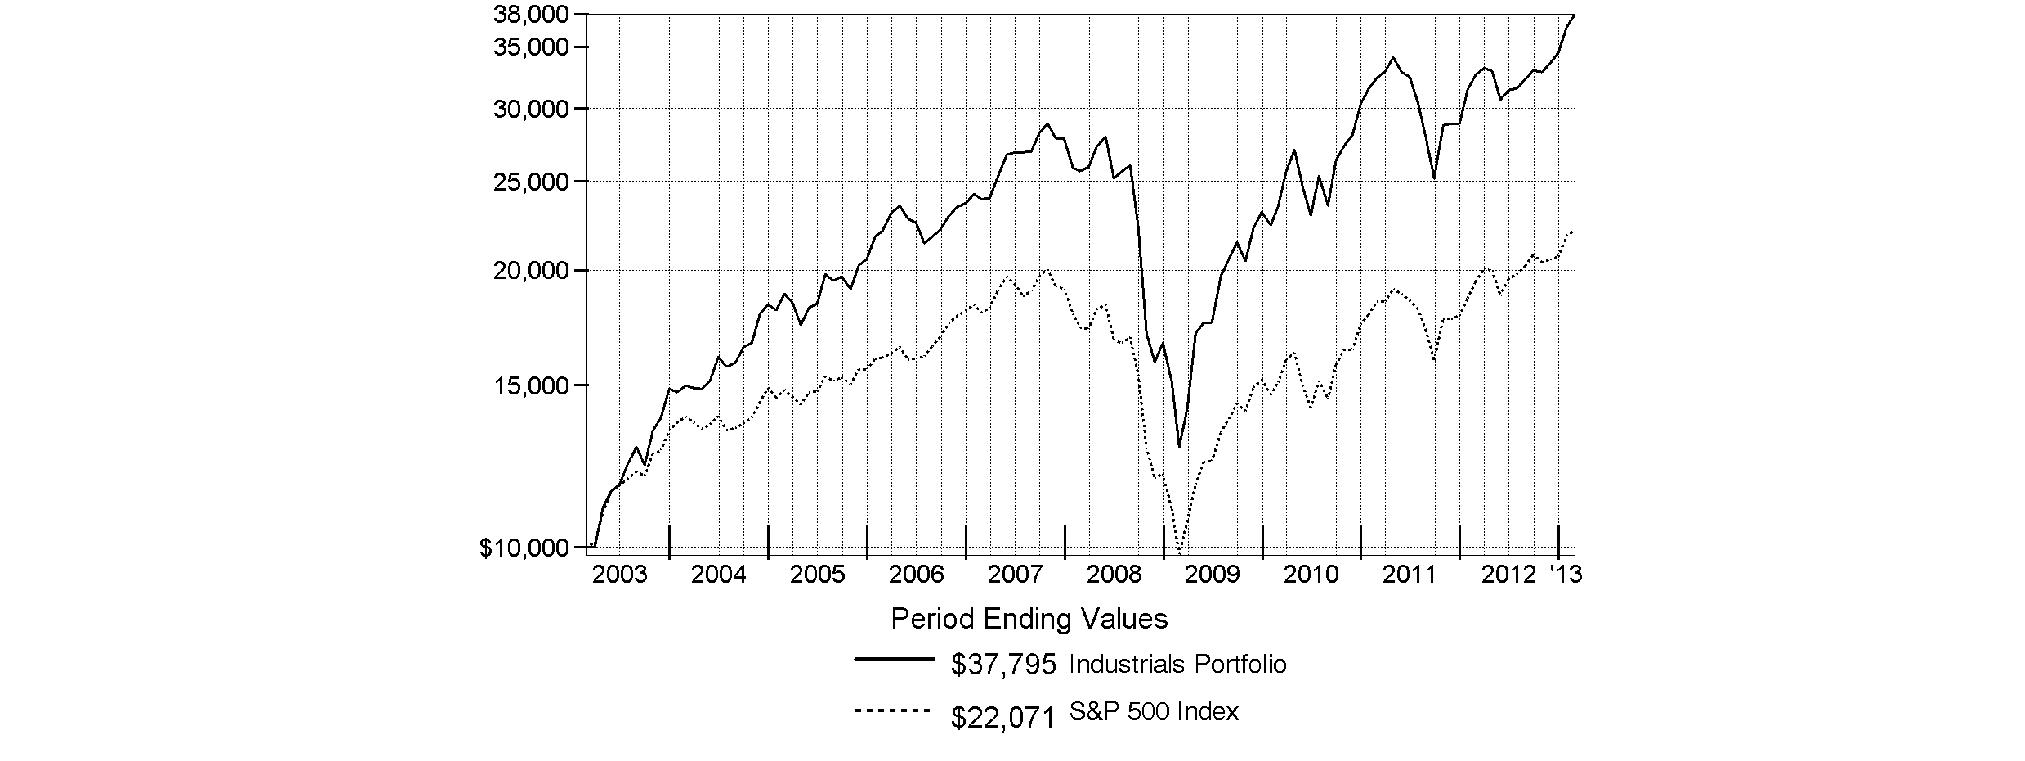
Annual Report
Industrials Portfolio
Management's Discussion of Fund Performance
Market Recap: U.S. stocks posted solid gains for the year ending February 28, 2013, sparked by a late-period rally that pushed major equity benchmarks to multiyear highs. Improvement in the global economy and more monetary stimulus from the U.S. Federal Reserve kept markets on the upswing for much of the year, shrugging off an early decline brought on by debt woes in Europe, and another dip later in the period amid Congressional gridlock on the federal budget. Renewed optimism over employment, the housing market, corporate earnings and record dividends made stocks a favorite with investors during the 12 months, which helped push the broad-based S&P 500® Index across the milestone 1,500 mark at the end of January. The S&P 500® finished the period up 13.46%. Seven of the 10 major market sectors tracked by MSCI U.S. IMI 25-50 classifications produced double-digit gains, led by health care and financials, while information technology, energy and materials trailed the broad equity market with only modest advances.
Comments from Tobias Welo, Portfolio Manager of Industrials Portfolio: For the year, the fund returned 15.71%, topping the 15.32% gain of the MSCI® U.S. IMI Industrials 25-50 Index and finishing well ahead of the S&P 500®. Versus the broader market, industrials stocks enjoyed particularly strong performance in the second half of the period, buoyed by a rising ISM Manufacturing Index - which reflects U.S. manufacturing activity - as well as signs of a rebounding U.S. construction market and a stabilizing Chinese economy. Compared with the MSCI index, both stock selection and industry weightings aided the fund's performance, especially in the construction and farm machinery/heavy trucks group. Here, a large underweighting in benchmark component Caterpillar was quite helpful. This stock, which headed our list of contributors to relative performance, registered a loss during the period, as weakness in the mining industry - in part, due to reduced exploration activity in China - prompted the company to reduce its earnings estimates later in the year. Consequently, I was glad I had sold Caterpillar in May. Not owning commercial aircraft manufacturer and benchmark component Boeing also lifted results, as its shares lagged the broader market amid uncertainty about whether early deliveries of the firm's 787 Dreamliner® would live up to expectations. Among stocks I liked that boosted performance, one standout was a non-index position was Bureau Veritas, a French multinational firm providing a variety of business support services, including certification, testing and training. Consistent earnings growth during the period, with the potential for even better results going forward, lifted this stock to a robust gain. Also bolstering fund performance was a large overweighting in EMCOR Group, a global supplier of electrical and mechanical construction services. Firming worldwide construction markets provided a favorable backdrop for this firm's shares. I'll also mention industrial conglomerate General Electric, by far the fund's largest position. While some timing issues led to this stock detracting a bit versus our MSCI benchmark, GE was the fund's largest contributor in absolute terms, recording a solid, double-digit gain. On the negative side, a cash/cash equivalents stake averaging about 3% of the fund's net assets was a drag on performance in a rising market. Weak picks in building products also notably detracted. At the stock level, the fund's significant overweighting in diesel-engine maker Cummins was counterproductive. Partly as a result of slower-than-expected growth in China, in July the company lowered its fiscal 2012 revenue guidance, which hurt its stock. In the case of construction and engineering stock Fluor, the stock fared poorly during the first half of the period, and then I sold it around midyear, missing out on this benchmark component's subsequent rally. The share price of Textron, a maker of regional jets, posted a gain but trailed the fund's MSCI benchmark, and the negative impact on relative performance was magnified by the fund's large overweighting here. Also weighing on the fund's results was GrafTech International, a maker of graphite electrodes used in steel mini-mills. Tepid demand for steel caused the company to issue weak guidance. As a result, I bit the bullet and sold the stock for a loss in October.
The views expressed above reflect those of the portfolio manager(s) only through the end of the period as stated on the cover of this report and do not necessarily represent the views of Fidelity or any other person in the Fidelity organization. Any such views are subject to change at any time based upon market or other conditions and Fidelity disclaims any responsibility to update such views. These views may not be relied on as investment advice and, because investment decisions for a Fidelity fund are based on numerous factors, may not be relied on as an indication of trading intent on behalf of any Fidelity fund.
Annual Report
Industrials Portfolio
Investment Changes (Unaudited)
|
Top Ten Stocks as of February 28, 2013 |
||
|
|
% of fund's |
% of fund's net assets |
|
General Electric Co. |
13.9 |
14.8 |
|
United Technologies Corp. |
6.2 |
6.2 |
|
3M Co. |
4.3 |
4.1 |
|
Danaher Corp. |
3.8 |
3.9 |
|
Honeywell International, Inc. |
3.2 |
3.4 |
|
Cummins, Inc. |
2.9 |
3.2 |
|
Eaton Corp. PLC |
2.8 |
0.0 |
|
Towers Watson & Co. |
2.3 |
1.3 |
|
Parker Hannifin Corp. |
2.1 |
1.6 |
|
Textron, Inc. |
2.1 |
2.4 |
|
|
43.6 |
|
|
Top Industries (% of fund's net assets) |
|||
|
As of February 28, 2013 |
|||
|
Machinery |
27.3% |
|
|
Industrial Conglomerates |
22.9% |
|
|
Aerospace & Defense |
16.6% |
|
|
Professional Services |
7.7% |
|
|
Electrical Equipment |
7.6% |
|
|
All Others* |
17.9% |
|

|
As of August 31, 2012 |
|||
|
Industrial Conglomerates |
26.2% |
|
|
Machinery |
20.3% |
|
|
Aerospace & Defense |
14.0% |
|
|
Electrical Equipment |
7.7% |
|
|
Road & Rail |
7.2% |
|
|
All Others* |
24.6% |
|

|
* Includes short-term investments and net other assets. |
Annual Report
Industrials Portfolio
Investments February 28, 2013
Showing Percentage of Net Assets
|
Common Stocks - 96.3% |
|||
|
Shares |
Value |
||
|
AEROSPACE & DEFENSE - 16.4% |
|||
|
Aerospace & Defense - 16.4% |
|||
|
General Dynamics Corp. |
201,456 |
$ 13,692,964 |
|
|
Honeywell International, Inc. |
401,616 |
28,153,282 |
|
|
Precision Castparts Corp. |
83,013 |
15,489,396 |
|
|
Teledyne Technologies, Inc. (a) |
180,222 |
13,260,735 |
|
|
Textron, Inc. |
639,999 |
18,463,971 |
|
|
United Technologies Corp. |
594,485 |
53,830,617 |
|
|
|
142,890,965 |
||
|
AIR FREIGHT & LOGISTICS - 0.3% |
|||
|
Air Freight & Logistics - 0.3% |
|||
|
Hub Group, Inc. Class A (a) |
68,313 |
2,577,449 |
|
|
AUTO COMPONENTS - 0.8% |
|||
|
Auto Parts & Equipment - 0.8% |
|||
|
Johnson Controls, Inc. |
227,260 |
7,151,872 |
|
|
BUILDING PRODUCTS - 0.9% |
|||
|
Building Products - 0.9% |
|||
|
American Woodmark Corp. (a) |
110,476 |
3,546,280 |
|
|
Armstrong World Industries, Inc. |
91,501 |
4,678,446 |
|
|
|
8,224,726 |
||
|
CHEMICALS - 0.5% |
|||
|
Specialty Chemicals - 0.5% |
|||
|
Cytec Industries, Inc. |
56,739 |
4,107,336 |
|
|
COMMERCIAL SERVICES & SUPPLIES - 3.2% |
|||
|
Diversified Support Services - 0.7% |
|||
|
Aggreko PLC |
164,000 |
4,219,584 |
|
|
Copart, Inc. (a) |
63,023 |
2,151,605 |
|
|
|
6,371,189 |
||
|
Environmental & Facility Services - 2.5% |
|||
|
Republic Services, Inc. |
533,961 |
16,787,734 |
|
|
Stericycle, Inc. (a) |
51,815 |
4,970,095 |
|
|
|
21,757,829 |
||
|
TOTAL COMMERCIAL SERVICES & SUPPLIES |
28,129,018 |
||
|
CONSTRUCTION & ENGINEERING - 3.1% |
|||
|
Construction & Engineering - 3.1% |
|||
|
EMCOR Group, Inc. |
202,642 |
7,815,902 |
|
|
Jacobs Engineering Group, Inc. (a) |
214,416 |
10,472,077 |
|
|
URS Corp. |
202,984 |
8,578,104 |
|
|
|
26,866,083 |
||
|
ELECTRICAL EQUIPMENT - 7.6% |
|||
|
Electrical Components & Equipment - 7.6% |
|||
|
AMETEK, Inc. |
309,012 |
12,925,972 |
|
|
Brady Corp. Class A |
69,421 |
2,363,785 |
|
|
Eaton Corp. PLC |
401,629 |
24,888,949 |
|
|
Generac Holdings, Inc. |
75,400 |
2,597,530 |
|
|
|
|||
|
Shares |
Value |
||
|
Hubbell, Inc. Class B |
160,123 |
$ 14,877,028 |
|
|
Regal-Beloit Corp. |
116,612 |
9,011,775 |
|
|
|
66,665,039 |
||
|
INDUSTRIAL CONGLOMERATES - 22.9% |
|||
|
Industrial Conglomerates - 22.9% |
|||
|
3M Co. |
363,850 |
37,840,400 |
|
|
Carlisle Companies, Inc. |
111,546 |
7,570,627 |
|
|
Danaher Corp. |
546,666 |
33,674,626 |
|
|
General Electric Co. |
5,214,715 |
121,085,684 |
|
|
|
200,171,337 |
||
|
LIFE SCIENCES TOOLS & SERVICES - 0.3% |
|||
|
Life Sciences Tools & Services - 0.3% |
|||
|
Eurofins Scientific SA |
13,085 |
2,594,926 |
|
|
MACHINERY - 27.3% |
|||
|
Construction & Farm Machinery & Heavy Trucks - 9.2% |
|||
|
Cummins, Inc. |
217,613 |
25,214,818 |
|
|
Manitowoc Co., Inc. |
557,574 |
10,326,270 |
|
|
Oshkosh Truck Corp. (a) |
260,506 |
10,045,111 |
|
|
PACCAR, Inc. |
218,381 |
10,357,811 |
|
|
Toro Co. |
164,586 |
7,422,829 |
|
|
WABCO Holdings, Inc. (a) |
60,645 |
4,167,524 |
|
|
Wabtec Corp. |
132,050 |
12,913,170 |
|
|
|
80,447,533 |
||
|
Industrial Machinery - 18.1% |
|||
|
Actuant Corp. Class A |
129,816 |
3,947,705 |
|
|
Donaldson Co., Inc. |
147,400 |
5,310,822 |
|
|
Dover Corp. |
201,451 |
14,776,431 |
|
|
GEA Group AG |
153,948 |
5,481,915 |
|
|
Graco, Inc. |
170,313 |
9,895,185 |
|
|
Harsco Corp. |
359,330 |
8,616,733 |
|
|
IDEX Corp. |
163,683 |
8,336,375 |
|
|
Illinois Tool Works, Inc. |
262,879 |
16,167,059 |
|
|
Ingersoll-Rand PLC |
280,217 |
14,753,425 |
|
|
Pall Corp. |
141,130 |
9,622,243 |
|
|
Parker Hannifin Corp. |
196,237 |
18,540,472 |
|
|
Pentair Ltd. |
196,494 |
10,467,235 |
|
|
Stanley Black & Decker, Inc. |
146,093 |
11,497,519 |
|
|
Timken Co. |
215,437 |
11,702,538 |
|
|
TriMas Corp. (a) |
311,161 |
8,927,209 |
|
|
|
158,042,866 |
||
|
TOTAL MACHINERY |
238,490,399 |
||
|
PROFESSIONAL SERVICES - 7.7% |
|||
|
Human Resource & Employment Services - 3.0% |
|||
|
Manpower, Inc. |
111,063 |
6,064,040 |
|
|
Towers Watson & Co. |
298,548 |
19,874,340 |
|
|
|
25,938,380 |
||
|
Research & Consulting Services - 4.7% |
|||
|
Bureau Veritas SA |
24,077 |
3,105,338 |
|
|
Dun & Bradstreet Corp. |
202,849 |
16,349,629 |
|
|
Common Stocks - continued |
|||
|
Shares |
Value |
||
|
PROFESSIONAL SERVICES - CONTINUED |
|||
|
Research & Consulting Services - continued |
|||
|
IHS, Inc. Class A (a) |
59,160 |
$ 6,285,750 |
|
|
Nielsen Holdings B.V. |
231,944 |
7,814,193 |
|
|
Verisk Analytics, Inc. (a) |
128,072 |
7,494,773 |
|
|
|
41,049,683 |
||
|
TOTAL PROFESSIONAL SERVICES |
66,988,063 |
||
|
ROAD & RAIL - 2.2% |
|||
|
Railroads - 1.4% |
|||
|
Union Pacific Corp. |
86,751 |
11,894,430 |
|
|
Trucking - 0.8% |
|||
|
J.B. Hunt Transport Services, Inc. |
107,655 |
7,484,176 |
|
|
TOTAL ROAD & RAIL |
19,378,606 |
||
|
TRADING COMPANIES & DISTRIBUTORS - 3.1% |
|||
|
Trading Companies & Distributors - 3.1% |
|||
|
W.W. Grainger, Inc. |
42,269 |
9,572,238 |
|
|
Watsco, Inc. |
94,629 |
7,368,760 |
|
|
WESCO International, Inc. (a) |
131,949 |
9,751,031 |
|
|
|
26,692,029 |
||
|
TOTAL COMMON STOCKS (Cost $676,468,252) |
|
||
|
Convertible Preferred Stocks - 0.2% |
|||
|
|
|
|
|
|
AEROSPACE & DEFENSE - 0.2% |
|||
|
Aerospace & Defense - 0.2% |
|||
|
United Technologies Corp. 7.50% |
26,900 |
|
|
|
Convertible Bonds - 0.3% |
||||
|
|
Principal Amount |
|
||
|
BUILDING PRODUCTS - 0.3% |
||||
|
Building Products - 0.3% |
||||
|
Aspen Aerogels, Inc.: |
|
|
|
|
|
8% 6/1/14 (d) |
|
$ 1,179,681 |
1,179,681 |
|
|
8% 12/6/14 (d) |
|
1,348,600 |
1,348,600 |
|
|
TOTAL CONVERTIBLE BONDS (Cost $2,528,281) |
|
|
U.S. Treasury Obligations - 0.0% |
||||
|
|
||||
|
U.S. Treasury Bills, yield at date of purchase 0.1% 4/18/13 (c) |
|
120,000 |
|
|
|
Money Market Funds - 3.9% |
|||
|
Shares |
Value |
||
|
Fidelity Cash Central Fund, 0.16% (b) |
34,547,349 |
$ 34,547,349 |
|
|
TOTAL INVESTMENT PORTFOLIO - 100.7% (Cost $715,051,889) |
879,690,389 |
||
|
NET OTHER ASSETS (LIABILITIES) - (0.7)% |
(6,424,145) |
||
|
NET ASSETS - 100% |
$ 873,266,244 |
||
|
Futures Contracts |
|||||
|
|
Expiration Date |
Underlying Face Amount at Value |
Unrealized Appreciation/(Depreciation) |
||
|
Purchased |
|||||
|
Equity Index Contracts |
|||||
|
86 CME E-mini S&P Select Sector Industrial Index Contracts |
March 2013 |
$ 3,513,100 |
$ 304,345 |
||
|
|
|
The face value of futures purchased as a percentage of net assets is 0.4% |
|
Legend |
|
(a) Non-income producing |
|
(b) Affiliated fund that is available only to investment companies and other accounts managed by Fidelity Investments. The rate quoted is the annualized seven-day yield of the fund at period end. A complete unaudited listing of the fund's holdings as of its most recent quarter end is available upon request. In addition, each Fidelity Central Fund's financial statements, which are not covered by the Fund's Report of Independent Registered Public Accounting Firm, are available on the SEC's website or upon request. |
|
(c) Security or a portion of the security was pledged to cover margin requirements for futures contracts. At the period end, the value of securities pledged amounted to $119,986. |
|
(d) Restricted securities - Investment in securities not registered under the Securities Act of 1933 (excluding 144A issues). At the end of the period, the value of restricted securities (excluding 144A issues) amounted to $2,528,281 or 0.3% of net assets. |
|
Additional information on each restricted holding is as follows: |
|
Security |
Acquisition Date |
Acquisition Cost |
|
Aspen Aerogels, Inc. 8% 6/1/14 |
6/14/11 |
$ 1,179,681 |
|
Aspen Aerogels, Inc. 8% 12/6/14 |
12/6/11-6/12/12 |
$ 1,348,600 |
|
Affiliated Central Funds |
|
Information regarding fiscal year to date income earned by the Fund from investments in Fidelity Central Funds is as follows: |
|
Fund |
Income earned |
|
Fidelity Cash Central Fund |
$ 41,222 |
|
Fidelity Securities Lending Cash Central Fund |
24,657 |
|
Total |
$ 65,879 |
|
Other Information |
|
The following is a summary of the inputs used, as of February 28, 2013, involving the Fund's assets and liabilities carried at fair value. The inputs or methodology used for valuing securities may not be an indication of the risk associated with investing in those securities. For more information on valuation inputs, and their aggregation into the levels used in the table below, please refer to the Investment Valuation section in the accompanying Notes to Financial Statements. |
|
Valuation Inputs at Reporting Date: |
||||
|
Description |
Total |
Level 1 |
Level 2 |
Level 3 |
|
Investments in Securities: |
||||
|
Common Stocks |
$ 840,927,848 |
$ 840,927,848 |
$ - |
$ - |
|
Convertible Preferred Stocks |
1,566,925 |
1,566,925 |
- |
- |
|
Convertible Bonds |
2,528,281 |
- |
- |
2,528,281 |
|
U.S. Treasury Obligations |
119,986 |
- |
119,986 |
- |
|
Money Market Funds |
34,547,349 |
34,547,349 |
- |
- |
|
Total Investments in Securities: |
$ 879,690,389 |
$ 877,042,122 |
$ 119,986 |
$ 2,528,281 |
|
Derivative Instruments: |
||||
|
Assets |
||||
|
Futures Contracts |
$ 304,345 |
$ 304,345 |
$ - |
$ - |
|
Value of Derivative Instruments |
|
The following table is a summary of the Fund's value of derivative instruments by primary risk exposure as of February 28, 2013. For additional information on derivative instruments, please refer to the Derivative Instruments section in the accompanying Notes to Financial Statements. |
|
Risk Exposure / |
Value |
|
|
|
Asset |
Liability |
|
Equity Risk |
||
|
Futures Contracts (a) |
$ 304,345 |
$ - |
|
Total Value of Derivatives |
$ 304,345 |
$ - |
|
(a) Reflects cumulative appreciation/(depreciation) on futures contracts as disclosed on the Schedule of Investments. Only the period end variation margin is separately disclosed on the Statement of Assets and Liabilities. |
See accompanying notes which are an integral part of the financial statements.
Annual Report
Industrials Portfolio
Financial Statements
Statement of Assets and Liabilities
|
|
February 28, 2013 |
|
|
|
|
|
|
Assets |
|
|
|
Investment in securities, at value - See accompanying schedule: Unaffiliated issuers (cost $680,504,540) |
$ 845,143,040 |
|
|
Fidelity Central Funds (cost $34,547,349) |
34,547,349 |
|
|
Total Investments (cost $715,051,889) |
|
$ 879,690,389 |
|
Receivable for investments sold |
|
3,203,363 |
|
Receivable for fund shares sold |
|
3,186,444 |
|
Dividends receivable |
|
2,283,895 |
|
Interest receivable |
|
285,172 |
|
Distributions receivable from Fidelity Central Funds |
|
5,363 |
|
Prepaid expenses |
|
1,063 |
|
Receivable from investment adviser for expense reductions |
|
191 |
|
Other receivables |
|
19,663 |
|
Total assets |
|
888,675,543 |
|
|
|
|
|
Liabilities |
|
|
|
Payable for investments purchased |
$ 14,169,888 |
|
|
Payable for fund shares redeemed |
648,005 |
|
|
Accrued management fee |
381,924 |
|
|
Payable for daily variation margin on futures contracts |
4,300 |
|
|
Other affiliated payables |
154,469 |
|
|
Other payables and accrued expenses |
50,713 |
|
|
Total liabilities |
|
15,409,299 |
|
|
|
|
|
Net Assets |
|
$ 873,266,244 |
|
Net Assets consist of: |
|
|
|
Paid in capital |
|
$ 685,646,763 |
|
Undistributed net investment income |
|
1,394,833 |
|
Accumulated undistributed net realized gain (loss) on investments and foreign currency transactions |
|
21,281,803 |
|
Net unrealized appreciation (depreciation) on investments |
|
164,942,845 |
|
Net Assets, for 31,144,552 shares outstanding |
|
$ 873,266,244 |
|
Net Asset Value, offering price and redemption price per share ($873,266,244 ÷ 31,144,552 shares) |
|
$ 28.04 |
Statement of Operations
|
|
Year ended February 28, 2013 |
|
|
|
|
|
|
Investment Income |
|
|
|
Dividends |
|
$ 11,573,181 |
|
Interest |
|
197,668 |
|
Income from Fidelity Central Funds |
|
65,879 |
|
Total income |
|
11,836,728 |
|
|
|
|
|
Expenses |
|
|
|
Management fee |
$ 3,355,530 |
|
|
Transfer agent fees |
1,372,487 |
|
|
Accounting and security lending fees |
223,276 |
|
|
Custodian fees and expenses |
25,459 |
|
|
Independent trustees' compensation |
3,809 |
|
|
Registration fees |
56,043 |
|
|
Audit |
49,454 |
|
|
Legal |
2,062 |
|
|
Miscellaneous |
5,597 |
|
|
Total expenses before reductions |
5,093,717 |
|
|
Expense reductions |
(52,057) |
5,041,660 |
|
Net investment income (loss) |
|
6,795,068 |
|
Realized and Unrealized Gain (Loss) Net realized gain (loss) on: |
|
|
|
Investment securities: |
|
|
|
Unaffiliated issuers |
25,790,855 |
|
|
Foreign currency transactions |
(10,953) |
|
|
Futures contracts |
642,163 |
|
|
Total net realized gain (loss) |
|
26,422,065 |
|
Change in net unrealized appreciation (depreciation) on: Investment securities |
69,342,056 |
|
|
Assets and liabilities in foreign currencies |
6,228 |
|
|
Futures contracts |
(180,034) |
|
|
Total change in net unrealized appreciation (depreciation) |
|
69,168,250 |
|
Net gain (loss) |
|
95,590,315 |
|
Net increase (decrease) in net assets resulting from operations |
|
$ 102,385,383 |
See accompanying notes which are an integral part of the financial statements.
Annual Report
Statement of Changes in Net Assets
|
|
Year ended |
Year ended |
|
Increase (Decrease) in Net Assets |
|
|
|
Operations |
|
|
|
Net investment income (loss) |
$ 6,795,068 |
$ 4,310,507 |
|
Net realized gain (loss) |
26,422,065 |
9,524,497 |
|
Change in net unrealized appreciation (depreciation) |
69,168,250 |
(21,575,556) |
|
Net increase (decrease) in net assets resulting from operations |
102,385,383 |
(7,740,552) |
|
Distributions to shareholders from net investment income |
(6,549,531) |
(2,779,155) |
|
Distributions to shareholders from net realized gain |
(4,823,532) |
(14,525,491) |
|
Total distributions |
(11,373,063) |
(17,304,646) |
|
Share transactions |
353,142,093 |
270,843,106 |
|
Reinvestment of distributions |
11,164,393 |
16,826,943 |
|
Cost of shares redeemed |
(133,203,317) |
(283,961,470) |
|
Net increase (decrease) in net assets resulting from share transactions |
231,103,169 |
3,708,579 |
|
Redemption fees |
6,726 |
29,536 |
|
Total increase (decrease) in net assets |
322,122,215 |
(21,307,083) |
|
|
|
|
|
Net Assets |
|
|
|
Beginning of period |
551,144,029 |
572,451,112 |
|
End of period (including undistributed net investment income of $1,394,833 and undistributed net investment income of $1,189,055, respectively) |
$ 873,266,244 |
$ 551,144,029 |
|
Other Information Shares |
|
|
|
Sold |
13,820,565 |
11,294,394 |
|
Issued in reinvestment of distributions |
446,984 |
710,628 |
|
Redeemed |
(5,442,107) |
(12,365,187) |
|
Net increase (decrease) |
8,825,442 |
(360,165) |
Financial Highlights
|
Years ended February 28, |
2013 |
2012 G |
2011 |
2010 |
2009 |
|
Selected Per-Share Data |
|
|
|
|
|
|
Net asset value, beginning of period |
$ 24.69 |
$ 25.24 |
$ 18.39 |
$ 10.12 |
$ 20.50 |
|
Income from Investment Operations |
|
|
|
|
|
|
Net investment income (loss) B |
.28 |
.19 |
.15 |
.11 |
.18 |
|
Net realized and unrealized gain (loss) |
3.54 |
.01 E |
6.80 |
8.27 |
(10.35) |
|
Total from investment operations |
3.82 |
.20 |
6.95 |
8.38 |
(10.17) |
|
Distributions from net investment income |
(.26) |
(.13) |
(.10) |
(.11) |
(.15) |
|
Distributions from net realized gain |
(.21) |
(.62) |
- |
- |
(.06) |
|
Total distributions |
(.47) |
(.75) |
(.10) |
(.11) |
(.21) |
|
Redemption fees added to paid in capital B,H |
- |
- |
- |
- |
- |
|
Net asset value, end of period |
$ 28.04 |
$ 24.69 |
$ 25.24 |
$ 18.39 |
$ 10.12 |
|
Total Return A |
15.71% |
.94% |
37.85% |
82.95% |
(49.92)% |
|
Ratios to Average Net Assets C,F |
|
|
|
|
|
|
Expenses before reductions |
.85% |
.87% |
.90% |
.97% |
1.00% |
|
Expenses net of fee waivers, if any |
.85% |
.87% |
.90% |
.97% |
1.00% |
|
Expenses net of all reductions |
.84% |
.86% |
.90% |
.97% |
.99% |
|
Net investment income (loss) |
1.13% |
.83% |
.69% |
.71% |
1.08% |
|
Supplemental Data |
|
|
|
|
|
|
Net assets, end of period (000 omitted) |
$ 873,266 |
$ 551,144 |
$ 572,451 |
$ 253,287 |
$ 83,542 |
|
Portfolio turnover rate D |
75% |
102% |
80% |
106% |
132% |
|
A Total returns would have been lower if certain expenses had not been reduced during the applicable periods shown. B Calculated based on average shares outstanding during the period. C Fees and expenses of any underlying Fidelity Central Funds are not included in the Fund's expense ratio. The Fund indirectly bears its proportionate share of the expenses of any underlying Fidelity Central Funds. D Amount does not include the portfolio activity of any underlying Fidelity Central Funds. E The amount shown for a share outstanding does not correspond with the aggregate net gain (loss) on investments for the period due to the timing of sales and repurchases of shares in relation to fluctuating market values of the investments of the Fund. F Expense ratios reflect operating expenses of the Fund. Expenses before reductions do not reflect amounts reimbursed by the investment adviser or reductions from brokerage service arrangements or reductions from other expense offset arrangements and do not represent the amount paid by the Fund during periods when reimbursements or reductions occur. Expenses net of fee waivers reflect expenses after reimbursement by the investment adviser but prior to reductions from brokerage service arrangements or other expense offset arrangements. Expenses net of all reductions represent the net expenses paid by the Fund. G For the year ended February 29. H Amount represents less than $.01 per share. |
See accompanying notes which are an integral part of the financial statements.
Annual Report
Transportation Portfolio
Performance: The Bottom Line
Average annual total return reflects the change in the value of an investment, assuming reinvestment of the fund's distributions from dividend income and capital gains (the profits earned upon the sale of securities that have grown in value, if any) and assuming a constant rate of performance each year. The $10,000 table and the fund's returns do not reflect the deduction of taxes that a shareholder would pay on fund distributions or the redemption of fund shares. During periods of reimbursement by Fidelity, a fund's total return will be greater than it would be had the reimbursement not occurred. How a fund did yesterday is no guarantee of how it will do tomorrow.
Average Annual Total Returns
|
Periods ended February 28, 2013 |
Past 1 |
Past 5 |
Past 10 |
|
Transportation Portfolio |
16.10% |
9.13% |
13.17% |
$10,000 Over 10 Years
Let's say hypothetically that $10,000 was invested in Transportation Portfolio on February 28, 2003. The chart shows how the value of your investment would have changed, and also shows how the S&P 500 Index performed over the same period.
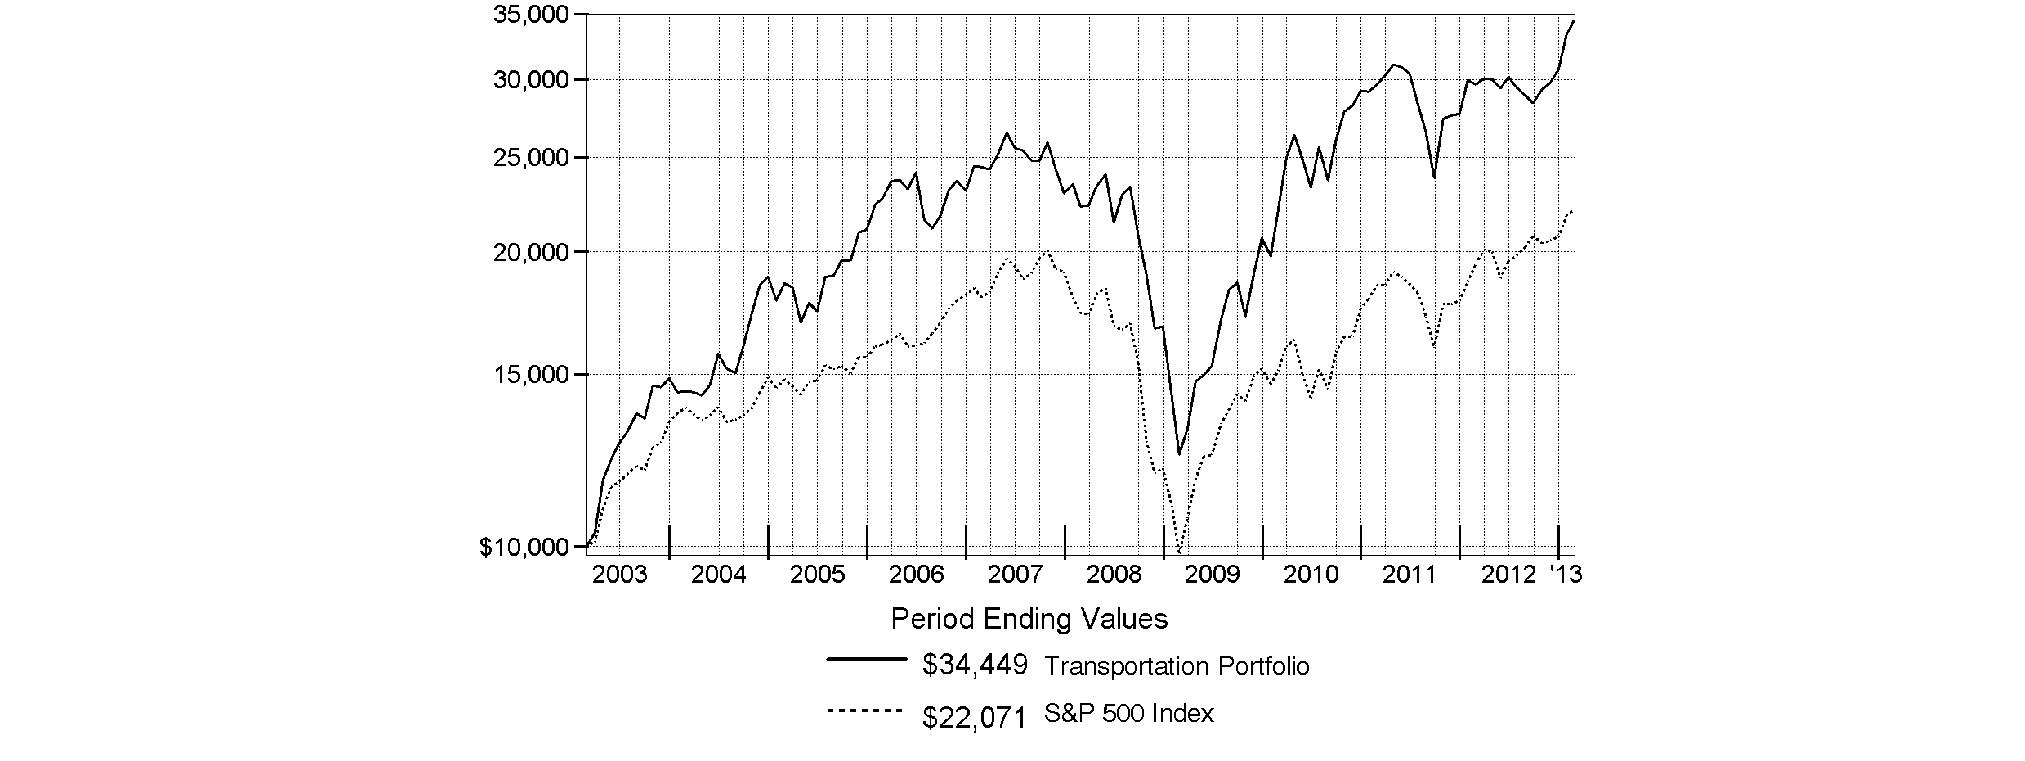
Annual Report
Transportation Portfolio
Management's Discussion of Fund Performance
Market Recap: U.S. stocks posted solid gains for the year ending February 28, 2013, sparked by a late-period rally that pushed major equity benchmarks to multiyear highs. Improvement in the global economy and more monetary stimulus from the U.S. Federal Reserve kept markets on the upswing for much of the year, shrugging off an early decline brought on by debt woes in Europe, and another dip later in the period amid Congressional gridlock on the federal budget. Renewed optimism over employment, the housing market, corporate earnings and record dividends made stocks a favorite with investors during the 12 months, which helped push the broad-based S&P 500® Index across the milestone 1,500 mark at the end of January. The S&P 500® finished the period up 13.46%. Seven of the 10 major market sectors tracked by MSCI U.S. IMI 25-50 classifications produced double-digit gains, led by health care and financials, while information technology, energy and materials trailed the broad equity market with only modest advances.
Comments from Matthew Moulis, who became sole Portfolio Manager of Transportation Portfolio on June 30, 2012, after serving as Co-Manager: For the year, the fund returned 16.10%, trailing the 19.88% advance of the MSCI® U.S. IMI Transportation 25-50 Index but ahead of the S&P 500®. Transportation stocks were lifted by strong performance in three of the four major groups in the MSCI index: airlines, trucking and railroads. Only the air freight and logistics segment lagged the broader market. Compared with the MSCI index, stock selection in railroads and trucking held back the fund's results. Within the first group, a large underweighting, on average, in benchmark component Kansas City Southern made this stock the fund's biggest relative detractor, as good volume growth and firm pricing boosted its share price by almost 50%. I avoided Kansas City Southern until November because of its rich valuation and sold the fund's modest position here by period end. Inland waterway carrier Kirby saw demand for its hydraulic fracturing equipment services fall as a result of a slowdown in energy exploration at the Marcellus Shale formation in the eastern United States, and I sold it. A non-index position in Navios Maritime Acquisition, a marine shipper, also fared poorly, in part because of unfavorable supply/demand conditions for product tankers. I sold this stock as well. Performance was further hampered by not owning two auto rental stocks in the trucking segment of the benchmark: Avis Budget Group and Hertz Global Holdings. While industry consolidation spurred investors' interest in both stocks, I view auto rental businesses as capital-intensive, low-margin operations, so I avoided them. Conversely, the fund benefited from underweighting two freight-forwarding firms, Expeditors International of Washington and C.H. Robinson Worldwide - both weak-performing index constituents. Also contributing was a position in Ryder System, which I avoided until after the company retracted its overly optimistic second-quarter guidance and the stock sank to what I thought was a more attractive valuation. Out-of-index exposure to Panamanian airline Copa Holdings paid off, and I took advantage of this stock's robust advance to significantly reduce the position. In absolute terms, rail carrier Union Pacific and package delivery provider United Parcel Service were the top contributors to the fund's performance and its two largest holdings at period end, although their impact on relative performance was minimal.
The views expressed above reflect those of the portfolio manager(s) only through the end of the period as stated on the cover of this report and do not necessarily represent the views of Fidelity or any other person in the Fidelity organization. Any such views are subject to change at any time based upon market or other conditions and Fidelity disclaims any responsibility to update such views. These views may not be relied on as investment advice and, because investment decisions for a Fidelity fund are based on numerous factors, may not be relied on as an indication of trading intent on behalf of any Fidelity fund.
Annual Report
Transportation Portfolio
Investment Changes (Unaudited)
|
Top Ten Stocks as of February 28, 2013 |
||
|
|
% of fund's |
% of fund's net assets |
|
Union Pacific Corp. |
18.5 |
19.7 |
|
United Parcel Service, Inc. Class B |
18.4 |
17.0 |
|
FedEx Corp. |
7.5 |
5.0 |
|
Norfolk Southern Corp. |
3.9 |
5.7 |
|
CSX Corp. |
3.4 |
5.7 |
|
Delta Air Lines, Inc. |
3.4 |
3.5 |
|
J.B. Hunt Transport Services, Inc. |
3.1 |
2.6 |
|
United Continental Holdings, Inc. |
2.4 |
2.4 |
|
C.H. Robinson Worldwide, Inc. |
2.1 |
2.5 |
|
Hub Group, Inc. Class A |
2.1 |
1.1 |
|
|
64.8 |
|
|
Top Industries (% of fund's net assets) |
|||
|
As of February 28, 2013 |
|||
|
Road & Rail |
38.5% |
|
|
Air Freight & Logistics |
32.3% |
|
|
Airlines |
14.6% |
|
|
Aerospace & Defense |
2.4% |
|
|
Machinery |
1.7% |
|
|
All Others* |
10.5% |
|

|
As of August 31, 2012 |
|||
|
Road & Rail |
41.5% |
|
|
Air Freight & Logistics |
30.0% |
|
|
Airlines |
14.9% |
|
|
Marine |
2.7% |
|
|
Oil, Gas & Consumable Fuels |
1.8% |
|
|
All Others* |
9.1% |
|

|
* Includes short-term investments and net other assets. |
Annual Report
Transportation Portfolio
Investments February 28, 2013
Showing Percentage of Net Assets
|
Common Stocks - 92.3% |
|||
|
Shares |
Value |
||
|
AEROSPACE & DEFENSE - 2.4% |
|||
|
Aerospace & Defense - 2.4% |
|||
|
Ducommun, Inc. (a) |
206,800 |
$ 3,205,400 |
|
|
General Dynamics Corp. |
6,100 |
414,617 |
|
|
Rockwell Collins, Inc. |
24,000 |
1,442,640 |
|
|
|
5,062,657 |
||
|
AIR FREIGHT & LOGISTICS - 32.3% |
|||
|
Air Freight & Logistics - 32.3% |
|||
|
Air Transport Services Group, Inc. (a) |
120,908 |
667,412 |
|
|
Atlas Air Worldwide Holdings, Inc. (a) |
25,500 |
1,203,345 |
|
|
C.H. Robinson Worldwide, Inc. |
80,496 |
4,589,882 |
|
|
Expeditors International of Washington, Inc. |
12,200 |
473,970 |
|
|
FedEx Corp. |
150,800 |
15,898,844 |
|
|
Forward Air Corp. |
52,800 |
1,991,616 |
|
|
Hub Group, Inc. Class A (a) |
117,700 |
4,440,821 |
|
|
United Parcel Service, Inc. Class B |
473,100 |
39,101,715 |
|
|
UTI Worldwide, Inc. |
23,300 |
354,859 |
|
|
|
68,722,464 |
||
|
AIRLINES - 14.6% |
|||
|
Airlines - 14.6% |
|||
|
Alaska Air Group, Inc. (a) |
73,800 |
3,804,390 |
|
|
Copa Holdings SA Class A |
9,800 |
1,023,316 |
|
|
Dart Group PLC |
443,317 |
975,174 |
|
|
Delta Air Lines, Inc. (a) |
507,202 |
7,237,773 |
|
|
Republic Airways Holdings, Inc. (a) |
243,700 |
2,293,217 |
|
|
SkyWest, Inc. |
220,200 |
3,082,800 |
|
|
Southwest Airlines Co. |
249,200 |
2,915,640 |
|
|
Spirit Airlines, Inc. (a) |
69,200 |
1,401,300 |
|
|
United Continental Holdings, Inc. (a) |
190,936 |
5,099,901 |
|
|
US Airways Group, Inc. (a) |
243,600 |
3,271,548 |
|
|
|
31,105,059 |
||
|
AUTO COMPONENTS - 0.2% |
|||
|
Auto Parts & Equipment - 0.2% |
|||
|
Stoneridge, Inc. (a) |
64,208 |
414,142 |
|
|
CONSTRUCTION & ENGINEERING - 0.0% |
|||
|
Construction & Engineering - 0.0% |
|||
|
Cosco International Holdings Ltd. |
24,000 |
10,645 |
|
|
INSURANCE - 1.0% |
|||
|
Property & Casualty Insurance - 1.0% |
|||
|
Berkshire Hathaway, Inc. Class B (a) |
20,200 |
2,063,632 |
|
|
|
|||
|
Shares |
Value |
||
|
MACHINERY - 1.7% |
|||
|
Construction & Farm Machinery & Heavy Trucks - 1.0% |
|||
|
ASL Marine Holdings Ltd. |
1,299,200 |
$ 755,349 |
|
|
Wabtec Corp. |
13,100 |
1,281,049 |
|
|
|
2,036,398 |
||
|
Industrial Machinery - 0.7% |
|||
|
Harsco Corp. |
62,900 |
1,508,342 |
|
|
TOTAL MACHINERY |
3,544,740 |
||
|
MARINE - 0.1% |
|||
|
Marine - 0.1% |
|||
|
Diana Shipping, Inc. (a) |
25,100 |
213,099 |
|
|
MEDIA - 0.3% |
|||
|
Movies & Entertainment - 0.3% |
|||
|
Advanced Inflight Alliance AG |
87,100 |
614,052 |
|
|
OIL, GAS & CONSUMABLE FUELS - 1.0% |
|||
|
Oil & Gas Storage & Transport - 1.0% |
|||
|
Scorpio Tankers, Inc. (a) |
260,633 |
2,215,381 |
|
|
ROAD & RAIL - 38.5% |
|||
|
Railroads - 25.8% |
|||
|
CSX Corp. |
318,719 |
7,311,414 |
|
|
Norfolk Southern Corp. |
112,300 |
8,203,515 |
|
|
Union Pacific Corp. |
287,268 |
39,387,315 |
|
|
|
54,902,244 |
||
|
Trucking - 12.7% |
|||
|
AMERCO |
11,900 |
1,793,449 |
|
|
Arkansas Best Corp. |
36,300 |
418,902 |
|
|
Con-way, Inc. |
91,100 |
3,202,165 |
|
|
Contrans Group, Inc.: |
|
|
|
|
(sub. vtg.) (a)(c) |
12,800 |
130,327 |
|
|
Class A |
181,500 |
1,848,000 |
|
|
J.B. Hunt Transport Services, Inc. |
95,200 |
6,618,304 |
|
|
Landstar System, Inc. |
70,700 |
3,979,703 |
|
|
Marten Transport Ltd. |
70,700 |
1,463,490 |
|
|
Quality Distribution, Inc. (a) |
158,700 |
1,252,143 |
|
|
Roadrunner Transportation Systems, Inc. (a) |
39,800 |
906,644 |
|
|
Ryder System, Inc. |
41,900 |
2,354,780 |
|
|
Swift Transporation Co. (a) |
152,600 |
2,064,678 |
|
|
Universal Truckload Services, Inc. |
57,400 |
1,046,976 |
|
|
|
27,079,561 |
||
|
TOTAL ROAD & RAIL |
81,981,805 |
||
|
SPECIALTY RETAIL - 0.2% |
|||
|
Specialty Stores - 0.2% |
|||
|
Staples, Inc. |
39,700 |
523,246 |
|
|
TOTAL COMMON STOCKS (Cost $148,493,877) |
|
||
|
Convertible Bonds - 0.4% |
||||
|
|
Principal Amount |
Value |
||
|
MARINE - 0.4% |
||||
|
Marine - 0.4% |
||||
|
DryShips, Inc. 5% 12/1/14 |
|
$ 1,020,000 |
$ 869,550 |
|
|
Money Market Funds - 7.8% |
|||
|
Shares |
|
||
|
Fidelity Cash Central Fund, 0.16% (b) |
16,643,674 |
|
|
|
TOTAL INVESTMENT PORTFOLIO - 100.5% (Cost $165,946,763) |
213,984,146 |
||
|
NET OTHER ASSETS (LIABILITIES) - (0.5)% |
(1,028,109) |
||
|
NET ASSETS - 100% |
$ 212,956,037 |
||
|
Legend |
|
(a) Non-income producing |
|
(b) Affiliated fund that is available only to investment companies and other accounts managed by Fidelity Investments. The rate quoted is the annualized seven-day yield of the fund at period end. A complete unaudited listing of the fund's holdings as of its most recent quarter end is available upon request. In addition, each Fidelity Central Fund's financial statements, which are not covered by the Fund's Report of Independent Registered Public Accounting Firm, are available on the SEC's website or upon request. |
|
(c) Security exempt from registration under Rule 144A of the Securities Act of 1933. These securities may be resold in transactions exempt from registration, normally to qualified institutional buyers. At the end of the period, the value of these securities amounted to $130,327 or 0.1% of net assets. |
|
Affiliated Central Funds |
|
Information regarding fiscal year to date income earned by the Fund from investments in Fidelity Central Funds is as follows: |
|
Fund |
Income earned |
|
Fidelity Cash Central Fund |
$ 13,747 |
|
Fidelity Securities Lending Cash Central Fund |
22,497 |
|
Total |
$ 36,244 |
|
Other Information |
|
The following is a summary of the inputs used, as of February 28, 2013, involving the Fund's assets and liabilities carried at fair value. The inputs or methodology used for valuing securities may not be an indication of the risk associated with investing in those securities. For more information on valuation inputs, and their aggregation into the levels used in the table below, please refer to the Investment Valuation section in the accompanying Notes to Financial Statements. |
|
Valuation Inputs at Reporting Date: |
||||
|
Description |
Total |
Level 1 |
Level 2 |
Level 3 |
|
Investments in Securities: |
||||
|
Common Stocks |
$ 196,470,922 |
$ 196,470,922 |
$ - |
$ - |
|
Convertible Bonds |
869,550 |
- |
869,550 |
- |
|
Money Market Funds |
16,643,674 |
16,643,674 |
- |
- |
|
Total Investments in Securities: |
$ 213,984,146 |
$ 213,114,596 |
$ 869,550 |
$ - |
See accompanying notes which are an integral part of the financial statements.
Annual Report
Transportation Portfolio
Financial Statements
Statement of Assets and Liabilities
|
|
February 28, 2013 |
|
|
|
|
|
|
Assets |
|
|
|
Investment in securities, at value - See accompanying schedule: Unaffiliated issuers (cost $149,303,089) |
$ 197,340,472 |
|
|
Fidelity Central Funds (cost $16,643,674) |
16,643,674 |
|
|
Total Investments (cost $165,946,763) |
|
$ 213,984,146 |
|
Receivable for investments sold |
|
2,199,770 |
|
Receivable for fund shares sold |
|
1,730,294 |
|
Dividends receivable |
|
633,708 |
|
Interest receivable |
|
12,750 |
|
Distributions receivable from Fidelity Central Funds |
|
1,509 |
|
Prepaid expenses |
|
289 |
|
Receivable from investment adviser for expense reductions |
|
59 |
|
Other receivables |
|
13,342 |
|
Total assets |
|
218,575,867 |
|
|
|
|
|
Liabilities |
|
|
|
Payable for investments purchased |
$ 5,205,748 |
|
|
Payable for fund shares redeemed |
246,783 |
|
|
Accrued management fee |
93,265 |
|
|
Other affiliated payables |
43,365 |
|
|
Other payables and accrued expenses |
30,669 |
|
|
Total liabilities |
|
5,619,830 |
|
|
|
|
|
Net Assets |
|
$ 212,956,037 |
|
Net Assets consist of: |
|
|
|
Paid in capital |
|
$ 162,159,603 |
|
Undistributed net investment income |
|
516,572 |
|
Accumulated undistributed net realized gain (loss) on investments and foreign currency transactions |
|
2,242,460 |
|
Net unrealized appreciation (depreciation) on investments and assets and liabilities in foreign currencies |
|
48,037,402 |
|
Net Assets, for 3,687,837 shares outstanding |
|
$ 212,956,037 |
|
Net Asset Value, offering price and redemption price per share ($212,956,037 ÷ 3,687,837 shares) |
|
$ 57.75 |
Statement of Operations
|
|
Year ended February 28, 2013 |
|
|
|
|
|
|
Investment Income |
|
|
|
Dividends |
|
$ 3,214,511 |
|
Interest |
|
183,185 |
|
Income from Fidelity Central Funds |
|
36,244 |
|
Total income |
|
3,433,940 |
|
|
|
|
|
Expenses |
|
|
|
Management fee |
$ 1,037,159 |
|
|
Transfer agent fees |
469,117 |
|
|
Accounting and security lending fees |
72,785 |
|
|
Custodian fees and expenses |
7,322 |
|
|
Independent trustees' compensation |
1,243 |
|
|
Registration fees |
20,652 |
|
|
Audit |
39,350 |
|
|
Legal |
721 |
|
|
Miscellaneous |
1,986 |
|
|
Total expenses before reductions |
1,650,335 |
|
|
Expense reductions |
(44,811) |
1,605,524 |
|
Net investment income (loss) |
|
1,828,416 |
|
Realized and Unrealized Gain (Loss) Net realized gain (loss) on: |
|
|
|
Investment securities: |
|
|
|
Unaffiliated issuers |
10,690,851 |
|
|
Foreign currency transactions |
(2,550) |
|
|
Total net realized gain (loss) |
|
10,688,301 |
|
Change in net unrealized appreciation (depreciation) on: Investment securities |
13,212,473 |
|
|
Assets and liabilities in foreign currencies |
19 |
|
|
Total change in net unrealized appreciation (depreciation) |
|
13,212,492 |
|
Net gain (loss) |
|
23,900,793 |
|
Net increase (decrease) in net assets resulting from operations |
|
$ 25,729,209 |
See accompanying notes which are an integral part of the financial statements.
Annual Report
Statement of Changes in Net Assets
|
|
Year ended |
Year ended |
|
Increase (Decrease) in Net Assets |
|
|
|
Operations |
|
|
|
Net investment income (loss) |
$ 1,828,416 |
$ 1,316,210 |
|
Net realized gain (loss) |
10,688,301 |
26,283,910 |
|
Change in net unrealized appreciation (depreciation) |
13,212,492 |
(33,149,377) |
|
Net increase (decrease) in net assets resulting from operations |
25,729,209 |
(5,549,257) |
|
Distributions to shareholders from net investment income |
(1,327,915) |
(833,762) |
|
Distributions to shareholders from net realized gain |
(9,827,441) |
(13,901,565) |
|
Total distributions |
(11,155,356) |
(14,735,327) |
|
Share transactions |
92,391,282 |
76,064,406 |
|
Reinvestment of distributions |
10,805,999 |
14,262,117 |
|
Cost of shares redeemed |
(117,466,819) |
(324,641,792) |
|
Net increase (decrease) in net assets resulting from share transactions |
(14,269,538) |
(234,315,269) |
|
Redemption fees |
4,424 |
17,488 |
|
Total increase (decrease) in net assets |
308,739 |
(254,582,365) |
|
|
|
|
|
Net Assets |
|
|
|
Beginning of period |
212,647,298 |
467,229,663 |
|
End of period (including undistributed net investment income of $516,572 and undistributed net investment income of $320,332, respectively) |
$ 212,956,037 |
$ 212,647,298 |
|
Other Information Shares |
|
|
|
Sold |
1,719,810 |
1,419,391 |
|
Issued in reinvestment of distributions |
208,394 |
277,875 |
|
Redeemed |
(2,251,011) |
(5,990,879) |
|
Net increase (decrease) |
(322,807) |
(4,293,613) |
Financial Highlights
|
Years ended February 28, |
2013 |
2012 F |
2011 |
2010 |
2009 |
|
Selected Per-Share Data |
|
|
|
|
|
|
Net asset value, beginning of period |
$ 53.02 |
$ 56.26 |
$ 42.01 |
$ 23.89 |
$ 44.34 |
|
Income from Investment Operations |
|
|
|
|
|
|
Net investment income (loss) B |
.51 |
.26 |
.27 |
.29 |
.29 |
|
Net realized and unrealized gain (loss) |
7.59 |
(.34) |
14.13 |
18.21 |
(19.29) |
|
Total from investment operations |
8.10 |
(.08) |
14.40 |
18.50 |
(19.00) |
|
Distributions from net investment income |
(.41) |
(.17) |
(.17) |
(.36) |
(.25) |
|
Distributions from net realized gain |
(2.96) |
(2.99) |
- |
(.02) |
(1.21) |
|
Total distributions |
(3.37) |
(3.16) |
(.17) |
(.38) |
(1.46) |
|
Redemption fees added to paid in capital B |
- G |
- G |
.02 |
- G |
.01 |
|
Net asset value, end of period |
$ 57.75 |
$ 53.02 |
$ 56.26 |
$ 42.01 |
$ 23.89 |
|
Total Return A |
16.10% |
.16% |
34.32% |
77.62% |
(44.20)% |
|
Ratios to Average Net Assets C,E |
|
|
|
|
|
|
Expenses before reductions |
.89% |
.88% |
.90% |
1.03% |
1.03% |
|
Expenses net of fee waivers, if any |
.89% |
.88% |
.90% |
1.03% |
1.03% |
|
Expenses net of all reductions |
.86% |
.87% |
.90% |
1.00% |
1.03% |
|
Net investment income (loss) |
.98% |
.49% |
.53% |
.90% |
.79% |
|
Supplemental Data |
|
|
|
|
|
|
Net assets, end of period (000 omitted) |
$ 212,956 |
$ 212,647 |
$ 467,230 |
$ 107,842 |
$ 79,705 |
|
Portfolio turnover rate D |
47% |
82% |
114% |
265% |
81% |
|
A Total returns would have been lower if certain expenses had not been reduced during the applicable periods shown. B Calculated based on average shares outstanding during the period. C Fees and expenses of any underlying Fidelity Central Funds are not included in the Fund's expense ratio. The Fund indirectly bears its proportionate share of the expenses of any underlying Fidelity Central Funds. D Amount does not include the portfolio activity of any underlying Fidelity Central Funds. E Expense ratios reflect operating expenses of the Fund. Expenses before reductions do not reflect amounts reimbursed by the investment adviser or reductions from brokerage service arrangements or reductions from other expense offset arrangements and do not represent the amount paid by the Fund during periods when reimbursements or reductions occur. Expenses net of fee waivers reflect expenses after reimbursement by the investment adviser but prior to reductions from brokerage service arrangements or other expense offset arrangements. Expenses net of all reductions represent the net expenses paid by the Fund. F For the year ended February 29. G Amount represents less than $.01 per share. |
See accompanying notes which are an integral part of the financial statements.
Annual Report
Notes to Financial Statements
For the period ended February 28, 2013
1. Organization.
Air Transportation Portfolio, Defense and Aerospace Portfolio, Environment and Alternative Energy Portfolio, Industrial Equipment Portfolio, Industrials Portfolio, and Transportation Portfolio (the Funds) are non-diversified funds of Fidelity Select Portfolios (the Trust). The Trust is registered under the Investment Company Act of 1940, as amended (the 1940 Act), as an open-end management investment company organized as a Massachusetts business trust. The Funds invest primarily in securities of companies whose principal business activities fall within specific industries. Each Fund is authorized to issue an unlimited number of shares.
2. Investments in Fidelity Central Funds.
The Funds invest in Fidelity Central Funds, which are open-end investment companies available only to other investment companies and accounts managed by Fidelity Management & Research Company (FMR) and its affiliates. The Funds' Schedules of Investments list each of the Fidelity Central Funds held as of period end, if any, as an investment of each Fund, but do not include the underlying holdings of each Fidelity Central Fund. As an Investing Fund, each Fund indirectly bears its proportionate share of the expenses of the underlying Fidelity Central Funds.
The Money Market Central Funds seek preservation of capital and current income and are managed by Fidelity Investments Money Management, Inc. (FIMM), an affiliate of FMR.
A complete unaudited list of holdings for each Fidelity Central Fund is available upon request or at the Securities and Exchange Commission (the SEC) website at www.sec.gov. In addition, the financial statements of the Fidelity Central Funds, which are not covered by the Funds' Report of Independent Registered Public Accounting Firm, are available on the SEC website or upon request.
3. Significant Accounting Policies.
The financial statements have been prepared in conformity with accounting principles generally accepted in the United States of America (GAAP), which require management to make certain estimates and assumptions at the date of the financial statements. Actual results could differ from those estimates. Subsequent events, if any, through the date that the financial statements were issued have been evaluated in the preparation of the financial statements. The following summarizes the significant accounting policies of the Funds:
Investment Valuation. Investments are valued as of 4:00 p.m. Eastern time on the last calendar day of the period. In accordance with valuation policies and procedures approved by the Board of Trustees (the Board), each Fund attempts to obtain prices from one or more third party pricing vendors or brokers to value its investments. When current market prices, quotations or currency exchange rates are not readily available or reliable, investments will be fair valued in good faith by the FMR Fair Value Committee (the Committee), in accordance with procedures adopted by each Fund's Board. Factors used in determining fair value vary by investment type and may include market or investment specific events, changes in interest rates and credit quality. The frequency with which these procedures are used cannot be predicted and they may be utilized to a significant extent. The Committee oversees each Fund's valuation policies and procedures and is responsible for approving and reporting to the Board all fair value determinations.
Each Fund categorizes the inputs to valuation techniques used to value their investments into a disclosure hierarchy consisting of three levels as shown below:
Level 1 - quoted prices in active markets for identical investments
Level 2 - other significant observable inputs (including quoted prices for similar investments, interest rates, prepayment speeds, etc.)
Level 3 - unobservable inputs (including the Fund's own assumptions based on the best information available)
Valuation techniques used to value each Fund's investments by major category are as follows:
Equity securities, including restricted securities, for which market quotations are readily available, are valued at the last reported sale price or official closing price as reported by a third party pricing vendor on the primary market or exchange on which they are traded and are categorized as Level 1 in the hierarchy. In the event there were no sales during the day or closing prices are not available, securities are valued at the last quoted bid price or may be valued using the last available price and are generally categorized as Level 2 in the hierarchy. For foreign equity securities, when significant market or security specific events arise, comparisons to the valuation of American Depositary Receipts (ADRs), futures contracts, Exchange-Traded Funds (ETFs) and certain indexes as well as quoted prices for similar securities are used and are categorized as Level 2 in the hierarchy. Utilizing these techniques may result in transfers between Level 1 and Level 2. For restricted equity securities and private placements where observable inputs are limited, assumptions about market activity and risk are used and these securities are generally categorized as Level 3 in the hierarchy.
Debt securities, including restricted securities, are valued based on evaluated prices received from third party pricing vendors or from brokers who make markets in such securities. For corporate bonds and U.S. government and government agency obligations pricing vendors utilize matrix pricing which considers yield or price of bonds of comparable quality, coupon, maturity and type as well as broker-supplied prices. When independent prices
Annual Report
Notes to Financial Statements - continued
3. Significant Accounting Policies - continued
Investment Valuation - continued
are unavailable or unreliable, debt securities may be valued utilizing pricing methodologies which consider similar factors that would be used by third party pricing vendors. Debt securities are generally categorized as Level 2 in the hierarchy but may be Level 3 depending on the circumstances.
Futures contracts are valued at the settlement price established each day by the board of trade or exchange on which they are traded and are categorized as Level 1 in the hierarchy. Investments in open-end mutual funds ,including the Fidelity Central Funds, are valued at their closing net asset value (NAV) each business day and are categorized as Level 1 in the hierarchy.
Changes in valuation techniques may result in transfers in or out of an assigned level within the disclosure hierarchy. The aggregate value of investments by input level, as of February 28, 2013 is included at the end of each applicable Fund's Schedule of Investments.
Foreign Currency. The Funds may use foreign currency contracts to facilitate transactions in foreign-denominated securities. Gains and losses from these transactions may arise from changes in the value of the foreign currency or if the counterparties do not perform under the contracts' terms.
Foreign-denominated assets, including investment securities, and liabilities are translated into U.S. dollars at the exchange rates at period end. Purchases and sales of investment securities, income and dividends received and expenses denominated in foreign currencies are translated into U.S. dollars at the exchange rate in effect on the transaction date.
The effects of exchange rate fluctuations on investments are included with the net realized and unrealized gain (loss) on investment securities. Other foreign currency transactions resulting in realized and unrealized gain (loss) are disclosed separately.
Investment Transactions and Income. For financial reporting purposes, the Funds' investment holdings and NAV include trades executed through the end of the last business day of the period. The NAV per share for processing shareholder transactions is calculated as of the close of business of the New York Stock Exchange (NYSE), normally 4:00 p.m. Eastern time and includes trades executed through the end of the prior business day. Gains and losses on securities sold are determined on the basis of identified cost and may include proceeds received from litigation. Dividend income is recorded on the ex-dividend date, except for certain dividends from foreign securities where the ex-dividend date may have passed, which are recorded as soon as the Funds are informed of the ex-dividend date. Non-cash dividends included in dividend income, if any, are recorded at the fair market value of the securities received. Distributions received on securities that represent a return of capital or capital gain are recorded as a reduction of cost of investments and/or as a realized gain. The Funds estimate the components of distributions received that may be considered return of capital distributions or capital gain distributions. Large, non-recurring dividends recognized by the Funds are presented separately on the Statement of Operations as "Special Dividends" and the impact of these dividends is presented in the Financial Highlights. Interest income and distributions from the Fidelity Central Funds are accrued as earned. Interest income includes coupon interest and amortization of premium and accretion of discount on debt securities. Investment income is recorded net of foreign taxes withheld where recovery of such taxes is uncertain.
Expenses. Expenses directly attributable to a fund are charged to that fund. Expenses attributable to more than one fund are allocated among the respective funds on the basis of relative net assets or other appropriate methods. Expense estimates are accrued in the period to which they relate and adjustments are made when actual amounts are known.
Income Tax Information and Distributions to Shareholders. Each year, each Fund intends to qualify as a regulated investment company under Subchapter M of the Internal Revenue Code, including distributing substantially all of its taxable income and realized gains. As a result, no provision for income taxes is required. As of February 28, 2013, each Fund did not have any unrecognized tax benefits in the financial statements; nor is each Fund aware of any tax positions for which it is reasonably possible that the total amounts of unrecognized tax benefits will significantly change in the next twelve months. Each Fund files a U.S. federal tax return, in addition to state and local tax returns as required. A fund's federal income tax returns are subject to examination by the Internal Revenue Service (IRS) for a period of three fiscal years after they are filed. State and local tax returns may be subject to examination for an additional fiscal year depending on the jurisdiction. Foreign taxes are provided for based on each Fund's understanding of the tax rules and rates that exist in the foreign markets in which it invests.
Distributions are declared and recorded on the ex-dividend date. Income and capital gain distributions are determined in accordance with income tax regulations, which may differ from GAAP. In addition, certain Funds claimed a portion of the payment made to redeeming shareholders as a distribution for income tax purposes.
Capital accounts within the financial statements are adjusted for permanent book-tax differences. These adjustments have no impact on net assets or the results of operations. Temporary book-tax differences will reverse in a subsequent period.
Book-tax differences are primarily due to futures contracts, foreign currency transactions, certain foreign taxes, market discount, equity-debt classifications, deferred trustees compensation, capital loss carryforwards and losses deferred due to wash sales and excise tax regulations.
Annual Report
3. Significant Accounting Policies - continued
Income Tax Information and Distributions to Shareholders - continued
The federal tax cost of investment securities and unrealized appreciation (depreciation) as of period end were as follows for each Fund:
|
|
Tax cost |
Gross unrealized |
Gross unrealized |
Net unrealized |
|
Air Transportation Portfolio |
$ 72,234,701 |
$ 21,328,610 |
$ (337,480) |
$ 20,991,130 |
|
Defense and Aerospace Portfolio |
487,432,768 |
122,280,211 |
(4,597,098) |
117,683,113 |
|
Environment and Alternative Energy Portfolio |
74,358,763 |
13,032,994 |
(3,793,586) |
9,239,408 |
|
Industrial Equipment Portfolio |
295,580,834 |
74,291,962 |
(2,186,929) |
72,105,033 |
|
Industrials Portfolio |
716,379,173 |
166,218,364 |
(2,907,148) |
163,311,216 |
|
Transportation Portfolio |
166,103,849 |
48,765,710 |
(885,413) |
47,880,297 |
The tax-based components of distributable earnings as of period end were as follows for each Fund:
|
|
Undistributed |
Undistributed |
Capital loss |
Net unrealized |
|
Air Transportation Portfolio |
$ 184,916 |
$ 1,143,478 |
$ - |
$ 20,991,130 |
|
Defense and Aerospace Portfolio |
1,049,960 |
4,275,729 |
- |
117,683,113 |
|
Environment and Alternative Energy Portfolio |
122,097 |
- |
(10,590,418) |
9,239,320 |
|
Industrial Equipment Portfolio |
548,351 |
- |
(2,905,180) |
72,105,186 |
|
Industrials Portfolio |
10,058,341 |
14,250,192 |
- |
163,311,216 |
|
Transportation Portfolio |
991,964 |
1,924,156 |
- |
47,880,316 |
Capital loss carryforwards are only available to offset future capital gains of the Funds to the extent provided by regulations and may be limited. Under the Regulated Investment Company Modernization Act of 2010 (the Act), the Funds are permitted to carry forward capital losses incurred in taxable years beginning after December 22, 2010 for an unlimited period and such capital losses are required to be used prior to any losses that expire. Capital loss carryforwards were as follows:
|
|
Fiscal year of |
|
|
|
2018 |
Total with |
|
Environment and Alternative Energy Portfolio |
$ (6,465,946) |
$ (6,465,946) |
|
|
No expiration |
|
|
|
|
|
Short-term |
Long-term |
Total |
Total capital loss |
|
Industrial Equipment Portfolio |
$ (2,451,955) |
$ (453,226) |
$ (2,905,180) |
$ (2,905,180) |
|
Environment and Alternative Energy Portfolio |
(3,880,208) |
(244,264) |
(4,124,472) |
(10,590,418) |
The tax character of distributions paid was as follows:
|
February 28, 2013 |
|
|
|
|
|
Ordinary Income |
Long-term |
Total |
|
Air Transportation Portfolio |
$ 278,547 |
$ 1,241,145 |
$ 1,519,692 |
|
Defense and Aerospace Portfolio |
8,717,067 |
1,406,058 |
10,123,125 |
|
Environment and Alternative Energy Portfolio |
630,649 |
- |
630,649 |
|
Industrial Equipment Portfolio |
3,854,247 |
- |
3,854,247 |
|
Industrials Portfolio |
6,549,531 |
4,823,532 |
11,373,063 |
|
Transportation Portfolio |
1,327,915 |
9,827,441 |
11,155,356 |
Annual Report
Notes to Financial Statements - continued
3. Significant Accounting Policies - continued
Income Tax Information and Distributions to Shareholders - continued
|
February 29, 2012 |
|
|
|
|
|
Ordinary Income |
Long-term |
Total |
|
Air Transportation Portfolio |
$ 110,454 |
$ 10,568,849 |
$ 10,679,303 |
|
Defense and Aerospace Portfolio |
4,239,094 |
953,357 |
5,192,451 |
|
Environment and Alternative Energy Portfolio |
910,843 |
- |
910,843 |
|
Industrial Equipment Portfolio |
2,550,520 |
1,033,874 |
3,584,394 |
|
Industrials Portfolio |
2,779,155 |
14,525,491 |
17,304,646 |
|
Transportation Portfolio |
2,358,640 |
12,376,687 |
14,735,327 |
Trading (Redemption) Fees. Shares held by investors in the Funds less than 30 days are subject to a redemption fee equal to .75% of the net asset value of shares redeemed. All redemption fees, which reduce the proceeds of the shareholder redemption, are retained by the Funds and accounted for as an addition to paid in capital.
Restricted Securities. The Funds may invest in securities that are subject to legal or contractual restrictions on resale. These securities generally may be resold in transactions exempt from registration or to the public if the securities are registered. Disposal of these securities may involve time-consuming negotiations and expense, and prompt sale at an acceptable price may be difficult. Information regarding restricted securities is included at the end of each applicable Fund's Schedule of Investments.
New Accounting Pronouncement. The Financial Accounting Standards Board issued in December 2011, Accounting Standard Update No. 2011-11, Disclosures about Offsetting Assets and Liabilities, and in January 2013, Accounting Standards Update No. 2013-1 Clarifying the Scope of Disclosures about Offsetting Assets and Liabilities. These updates create new disclosure requirements requiring entities to disclose both gross and net information for derivatives and other financial instruments that are either offset in the Statement of Assets and Liabilities or subject to an enforceable master netting arrangement or similar agreement. The disclosure requirements are effective for annual reporting periods beginning on or after January 1, 2013, and interim periods within those annual periods. Management is currently evaluating the impact of the update's adoption on the Funds' financial statement disclosures.
4. Derivative Instruments.
Risk Exposures and the Use of Derivative Instruments. Industrials Portfolio's (the Fund) investment objective allows the Fund to enter into various types of derivative contracts, including futures contracts. Derivatives are investments whose value is primarily derived from underlying assets, indices or reference rates and may be transacted on an exchange or over-the-counter (OTC). Derivatives may involve a future commitment to buy or sell a specified asset based on specified terms, to exchange future cash flows at periodic intervals based on a notional principal amount, or for one party to make one or more payments upon the occurrence of specified events in exchange for periodic payments from the other party.
The Fund used derivatives to increase returns, to gain exposure to certain types of assets and to manage exposure to certain risks as defined below. The success of any strategy involving derivatives depends on analysis of numerous economic factors, and if the strategies for investment do not work as intended, the Fund may not achieve its objectives.
The Fund's use of derivatives increased or decreased its exposure to the following risk:
|
Equity Risk |
Equity risk relates to the fluctuations in the value of financial instruments as a result of changes in market prices (other than those arising from interest rate risk or foreign exchange risk), whether caused by factors specific to an individual investment, its issuer, or all factors affecting all instruments traded in a market or market segment. |
The Fund is also exposed to additional risks from investing in derivatives, such as liquidity risk and counterparty credit risk. Liquidity risk is the risk that the Fund will be unable to close out the derivative in the open market in a timely manner. Counterparty credit risk is the risk that the counterparty will not be able to fulfill its obligation to the Fund. Counterparty credit risk related to exchange-traded futures contracts is mitigated by the protection provided by the exchange on which they trade.
Investing in derivatives may involve greater risks than investing in the underlying assets directly and, to varying degrees, may involve risk of loss in excess of any initial investment and collateral received and amounts recognized in the Statement of Assets and Liabilities. In addition, there may be the risk that the change in value of the derivative contract does not correspond to the change in value of the underlying instrument.
Futures Contracts. A futures contract is an agreement between two parties to buy or sell a specified underlying instrument for a fixed price at a specified future date. The Fund used futures contracts to manage it's exposure to the stock market.
Annual Report
4. Derivative Instruments - continued
Futures Contracts - continued
Upon entering into a futures contract, a fund is required to deposit either cash or securities (initial margin) with a clearing broker in an amount equal to a certain percentage of the face value of the contract. Futures contracts are marked-to-market daily and subsequent payments (variation margin) are made or received by a fund depending on the daily fluctuations in the value of the futures contracts and are recorded as unrealized appreciation or (depreciation). This receivable and/or payable, if any, is included in daily variation margin on futures contracts in the Statement of Assets and Liabilities. Realized gain or (loss) is recorded upon the expiration or closing of a futures contract. The net realized gain (loss) and change in net unrealized appreciation (depreciation) on futures contracts during the period is included in the Statement of Operations.
Any open futures contracts at period end are presented in the Schedule of Investments under the caption "Futures Contracts." The underlying face amount at value reflects each contract's exposure to the underlying instrument or index at period end and is representative of activity for the period.
Securities deposited to meet initial margin requirements are identified in the Schedule of Investments.
During the period the Fund recognized net realized gain (loss) of $642,163 and a change in net unrealized appreciation (depreciation) of $(180,034) related to its investment in futures contracts. These amounts are included in the Statement of Operations.
5. Purchases and Sales of Investments.
Purchases and sales of securities, other than short-term securities, are noted in the table below.
|
|
Purchases ($) |
Sales ($) |
|
Air Transportation Portfolio |
52,511,070 |
50,332,529 |
|
Defense and Aerospace Portfolio |
343,641,487 |
457,282,791 |
|
Environment and Alternative Energy Portfolio |
38,149,788 |
41,720,181 |
|
Industrial Equipment Portfolio |
208,784,233 |
218,310,238 |
|
Industrials Portfolio |
652,481,323 |
441,087,629 |
|
Transportation Portfolio |
85,050,395 |
122,749,416 |
6. Fees and Other Transactions with Affiliates.
Management Fee. FMR and its affiliates provide the Funds with investment management related services for which the Funds pay a monthly management fee. The management fee is the sum of an individual fund fee rate and an annualized group fee rate. The individual fund fee rate is applied to each Fund's average net assets. The group fee rate is based upon the average net assets of all the mutual funds advised by FMR. The group fee rate decreases as assets under management increase and increases as assets under management decrease. For the period, each Fund's annual management fee rate expressed as a percentage of each Fund's average net assets was as follows:
|
|
Individual Rate |
Group Rate |
Total |
|
Air Transportation Portfolio |
.30% |
.26% |
.56% |
|
Defense and Aerospace Portfolio |
.30% |
.26% |
.56% |
|
Environment and Alternative Energy Portfolio |
.30% |
.26% |
.56% |
|
Industrial Equipment Portfolio |
.30% |
.26% |
.56% |
|
Industrials Portfolio |
.30% |
.26% |
.56% |
|
Transportation Portfolio |
.30% |
.26% |
.56% |
Transfer Agent Fees. Fidelity Investments Institutional Operations Company, Inc. (FIIOC), an affiliate of FMR, is the Funds' transfer, dividend disbursing and shareholder servicing agent. FIIOC receives account fees and asset-based fees that vary according to account size and type of account. FIIOC pays for typesetting, printing and mailing of shareholder reports, except proxy statements. For the period, transfer agent fees were equivalent to the following annual rates expressed as a percentage of average net assets:
|
Air Transportation Portfolio |
.24% |
|
Defense and Aerospace Portfolio |
.23% |
|
Environment and Alternative Energy Portfolio |
.30% |
|
Industrial Equipment Portfolio |
.19% |
|
Industrials Portfolio |
.23% |
|
Transportation Portfolio |
.25% |
Annual Report
Notes to Financial Statements - continued
6. Fees and Other Transactions with Affiliates - continued
Accounting and Security Lending Fees. Fidelity Service Company, Inc. (FSC), an affiliate of FMR, maintains each Fund's accounting records. The accounting fee is based on the level of average net assets for each month. Under a separate contract, FSC administers the security lending program. The security lending fee is based on the number and duration of lending transactions.
Brokerage Commissions. Certain Funds placed a portion of their portfolio transactions with brokerage firms which are affiliates of the investment adviser. The commissions paid to these affiliated firms were as follows:
|
|
Amount |
|
Air Transportation Portfolio |
$ 2,268 |
|
Defense and Aerospace Portfolio |
3,860 |
|
Environmental and Alternative Energy Portfolio |
1,586 |
|
Industrial Equipment Portfolio |
7,038 |
|
Industrials Portfolio |
11,684 |
|
Transportation Portfolio |
7,542 |
7. Committed Line of Credit.
Certain Funds participate with other funds managed by FMR or an affiliate in a $4.25 billion credit facility (the "line of credit") to be utilized for temporary or emergency purposes to fund shareholder redemptions or for other short-term liquidity purposes. The participating funds have agreed to pay commitment fees on their pro-rata portion of the line of credit, which are reflected in Miscellaneous expenses on the Statement of Operations, and are as follows:
|
Air Transportation Portfolio |
$ 179 |
|
Defense and Aerospace Portfolio |
1,689 |
|
Environment and Alternative Energy Portfolio |
184 |
|
Industrial Equipment Portfolio |
826 |
|
Industrials Portfolio |
1,478 |
|
Transportation Portfolio |
513 |
During the period, there were no borrowings on this line of credit.
8. Security Lending.
Certain Funds lend portfolio securities through a lending agent from time to time in order to earn additional income. For equity securities, a lending agent is used and may loan securities to certain qualified borrowers, including Fidelity Capital Markets (FCM), a broker-dealer affiliated with the Funds. On the settlement date of the loan, each applicable Fund receives collateral (in the form of U.S. Treasury obligations, letters of credit and/or cash) against the loaned securities and maintains collateral in an amount not less than 100% of the market value of the loaned securities during the period of the loan. The market value of the loaned securities is determined at the close of business of the Funds and any additional required collateral is delivered to the Funds on the next business day. If the borrower defaults on its obligation to return the securities loaned because of insolvency or other reasons, a fund could experience delays and costs in recovering the securities loaned or in gaining access to the collateral. Any cash collateral received is invested in the Fidelity Securities Lending Cash Central Fund. The value of loaned securities and cash collateral at period end are disclosed on each applicable Fund's Statement of Assets and Liabilities. At period end, there were no security loans outstanding with FCM. Security lending income represents the income earned on investing cash collateral, less rebates paid to borrowers and any lending agent fees associated with the loan, plus any premium payments received for lending certain types of securities. Security lending income is presented on each applicable Fund's Statement of Operations as a component of income from Fidelity Central Funds. FCM security lending activity as of and during the period was as follows:
|
|
Total Security |
|
Air Transportation Portfolio |
$ 3,992 |
|
Defense and Aerospace Portfolio |
36,871 |
|
Environment and Alternative Energy Portfolio |
54,638 |
|
Industrial Equipment Portfolio |
1,015 |
|
Industrials Portfolio |
24,657 |
|
Transportation Portfolio |
22,497 |
|
|
Security Lending |
|
Air Transportation Portfolio |
$ 1 |
|
Environment and Alternative Energy Portfolio |
2,503 |
Annual Report
9. Expense Reductions.
Many of the brokers with whom FMR places trades on behalf of certain Funds provided services to these Funds in addition to trade execution. These services included payments of expenses on behalf of each applicable Fund. In addition, through arrangements with each applicable Fund's custodian, credits realized as a result of uninvested cash balances were used to reduce each applicable Fund's expenses. All of the applicable expense reductions are noted in the table below.
|
|
Brokerage Service |
Custody expense |
|
|
|
|
|
Air Transportation Portfolio |
$ 19,803 |
$ - |
|
Defense and Aerospace Portfolio |
65,909 |
- |
|
Environment and Alternative Energy Portfolio |
9,742 |
- |
|
Industrial Equipment Portfolio |
22,101 |
- |
|
Industrials Portfolio |
51,861 |
5 |
|
Transportation Portfolio |
44,752 |
- |
In addition, FMR reimbursed a portion of each Fund's operating expenses during the period as follows:
|
|
Reimbursements |
|
|
|
|
Air Transportation Portfolio |
$ 5 |
|
Defense and Aerospace Portfolio |
735 |
|
Environment and Alternative Energy Portfolio |
343 |
|
Industrial Equipment Portfolio |
279 |
|
Industrials Portfolio |
191 |
|
Transportation Portfolio |
59 |
10. Other.
The Funds' organizational documents provide former and current trustees and officers with a limited indemnification against liabilities arising in connection with the performance of their duties to the Funds. In the normal course of business, the Funds may also enter into contracts that provide general indemnifications. The Funds' maximum exposure under these arrangements is unknown as this would be dependent on future claims that may be made against the Funds. The risk of material loss from such claims is considered remote.
At the end of the period, Fidelity VIP FundsManager 60% was the owner of record of approximately 26% and 16% of the total outstanding shares of the Industrial Equipment Portfolio and Industrials Portfolio, respectively. Strategic Advisers U.S. Opportunities Fund was the owner of record of approximately 12% and 22% of the total outstanding shares of the Industrial Equipment Portfolio and Industrials Portfolio, respectively. Mutual funds managed by FMR or its affiliates were the owners of record in the aggregate, of approximately 50% and 53% of the total outstanding shares of Industrial Equipment Portfolio and Industrials Portfolio, respectively.
Annual Report
Report of Independent Registered Public Accounting Firm
To the Trustees of Fidelity Select Portfolios and the Shareholders of Air Transportation Portfolio, Defense and Aerospace Portfolio, Environment and Alternative Energy Portfolio, Industrial Equipment Portfolio, Industrials Portfolio and Transportation Portfolio:
In our opinion, the accompanying statements of assets and liabilities, including the schedules of investments, and the related statements of operations and of changes in net assets and the financial highlights present fairly, in all material respects, the financial position of Air Transportation Portfolio, Defense and Aerospace Portfolio, Environment and Alternative Energy Portfolio, Industrial Equipment Portfolio, Industrials Portfolio and Transportation Portfolio (funds of Fidelity Select Portfolios) at February 28, 2013, the results of each of their operations for the year then ended, the changes in each of their net assets for each of the two years in the period then ended and the financial highlights for each of the five years in the period then ended, in conformity with accounting principles generally accepted in the United States of America. These financial statements and financial highlights (hereafter referred to as "financial statements") are the responsibility of the Fidelity Select Portfolios' management. Our responsibility is to express an opinion on these financial statements based on our audits. We conducted our audits of these financial statements in accordance with the standards of the Public Company Accounting Oversight Board (United States). Those standards require that we plan and perform the audit to obtain reasonable assurance about whether the financial statements are free of material misstatement. An audit includes examining, on a test basis, evidence supporting the amounts and disclosures in the financial statements, assessing the accounting principles used and significant estimates made by management, and evaluating the overall financial statement presentation. We believe that our audits, which included confirmation of securities at February 28, 2013 by correspondence with the custodian and brokers, provide a reasonable basis for our opinion.
Boston, Massachusetts
April 16, 2013
Annual Report
Trustees and Officers
The Trustees, Members of the Advisory Board, and executive officers of the trust and funds, as applicable, are listed below. The Board of Trustees governs each fund and is responsible for protecting the interests of shareholders. The Trustees are experienced executives who meet periodically throughout the year to oversee each fund's activities, review contractual arrangements with companies that provide services to each fund, oversee management of the risks associated with such activities and contractual arrangements, and review each fund's performance. Except for James C. Curvey, each of the Trustees oversees 234 Fidelity funds. Mr. Curvey oversees 453 Fidelity funds.
The Trustees hold office without limit in time except that (a) any Trustee may resign; (b) any Trustee may be removed by written instrument, signed by at least two-thirds of the number of Trustees prior to such removal; (c) any Trustee who requests to be retired or who has become incapacitated by illness or injury may be retired by written instrument signed by a majority of the other Trustees; and (d) any Trustee may be removed at any special meeting of shareholders by a two-thirds vote of the outstanding voting securities of the trust. Each Trustee who is not an interested person of the trust and the funds (as defined in the 1940 Act) (Independent Trustee), shall retire not later than the last day of the calendar year in which his or her 75th birthday occurs. The Independent Trustees may waive this mandatory retirement age policy with respect to individual Trustees. The executive officers and Advisory Board Members hold office without limit in time, except that any officer and Advisory Board Member may resign or may be removed by a vote of a majority of the Trustees at any regular meeting or any special meeting of the Trustees. Except as indicated, each individual has held the office shown or other offices in the same company for the past five years.
Experience, Skills, Attributes, and Qualifications of the Funds' Trustees. The Governance and Nominating Committee has adopted a statement of policy that describes the experience, qualifications, attributes, and skills that are necessary and desirable for potential Independent Trustee candidates (Statement of Policy). The Board believes that each Trustee satisfied at the time he or she was initially elected or appointed a Trustee, and continues to satisfy, the standards contemplated by the Statement of Policy. The Governance and Nominating Committee also engages professional search firms to help identify potential Independent Trustee candidates who have the experience, qualifications, attributes, and skills consistent with the Statement of Policy. From time to time, additional criteria based on the composition and skills of the current Independent Trustees, as well as experience or skills that may be appropriate in light of future changes to board composition, business conditions, and regulatory or other developments, have also been considered by the professional search firms and the Governance and Nominating Committee. In addition, the Board takes into account the Trustees' commitment and participation in Board and committee meetings, as well as their leadership of standing and ad hoc committees throughout their tenure.
In determining that a particular Trustee was and continues to be qualified to serve as a Trustee, the Board has considered a variety of criteria, none of which, in isolation, was controlling. The Board believes that, collectively, the Trustees have balanced and diverse experience, qualifications, attributes, and skills, which allow the Board to operate effectively in governing each fund and protecting the interests of shareholders. Information about the specific experience, skills, attributes, and qualifications of each Trustee, which in each case led to the Board's conclusion that the Trustee should serve (or continue to serve) as a trustee of the funds, is provided below.
Board Structure and Oversight Function. James C. Curvey is an interested person (as defined in the 1940 Act) and currently serves as Chairman. The Trustees have determined that an interested Chairman is appropriate and benefits shareholders because an interested Chairman has a personal and professional stake in the quality and continuity of services provided to the funds. Independent Trustees exercise their informed business judgment to appoint an individual of their choosing to serve as Chairman, regardless of whether the Trustee happens to be independent or a member of management. The Independent Trustees have determined that they can act independently and effectively without having an Independent Trustee serve as Chairman and that a key structural component for assuring that they are in a position to do so is for the Independent Trustees to constitute a substantial majority for the Board. The Independent Trustees also regularly meet in executive session. Ned C. Lautenbach serves as Chairman of the Independent Trustees and as such (i) acts as a liaison between the Independent Trustees and management with respect to matters important to the Independent Trustees and (ii) with management prepares agendas for Board meetings.
Fidelity funds are overseen by different Boards of Trustees. The funds' Board oversees Fidelity's equity and high income funds and another Board oversees Fidelity's investment-grade bond, money market, and asset allocation funds. The asset allocation funds may invest in Fidelity funds overseen by the funds' Board. The use of separate Boards, each with its own committee structure, allows the Trustees of each group of Fidelity funds to focus on the unique issues of the funds they oversee, including common research, investment, and operational issues. On occasion, the separate Boards establish joint committees to address issues of overlapping consequences for the Fidelity funds overseen by each Board.
The Trustees operate using a system of committees to facilitate the timely and efficient consideration of all matters of importance to the Trustees, each fund, and fund shareholders and to facilitate compliance with legal and regulatory requirements and oversight of the funds' activities and associated risks. The Board, acting through its committees, has charged FMR and its affiliates with (i) identifying events or circumstances the occurrence of which could have demonstrably adverse effects on the funds' business and/or reputation; (ii) implementing processes and controls to lessen the possibility that such events or circumstances occur or to mitigate the effects of such events or circumstances if they do occur; and (iii) creating and maintaining a system designed to evaluate continuously business and market conditions in order to facilitate the identification and implementation processes described in (i) and (ii) above. Because the day-to-day operations and activities of the funds are carried out by or through FMR, its affiliates and other service providers, the funds' exposure to risks is mitigated but not eliminated by the processes overseen by the Trustees. While each of the Board's committees has responsibility for overseeing different aspects of the funds' activities, oversight is exercised primarily through the Operations, Audit, and Compliance Committees. In addition, the Independent Trustees have worked with FMR to enhance the Board's oversight of investment and financial risks, legal and regulatory risks, technology risks, and operational risks, including the development of additional risk reporting to the Board. For example, a working group comprised of Independent Trustees and FMR has worked and continues to work to review the Fidelity funds' valuation-related activities, reporting and risk management. Appropriate personnel, including but not limited to the funds' Chief Compliance Officer (CCO), FMR's internal auditor, the independent accountants, the funds' Treasurer and portfolio management personnel, make periodic reports to the Board's committees, as appropriate, including an annual review of FMR's risk management program for the Fidelity funds. The responsibilities of each standing committee, including their oversight responsibilities, are described further under "Standing Committees of the Funds' Trustees."
Annual Report
The funds' Statement of Additional Information (SAI) includes more information about the Trustees. To request a free copy, call Fidelity at 1-800-544-8544.
Interested Trustees*:
Correspondence intended for each Trustee who is an interested person may be sent to Fidelity Investments, 245 Summer Street, Boston, Massachusetts 02210.
|
Name, Year of Birth; Principal Occupations and Other Relevant Experience+ |
|
|
James C. Curvey (1935) |
|
|
|
Year of Election or Appointment: 2007 Mr. Curvey is Trustee and Chairman of the Board of Trustees of certain Trusts. Mr. Curvey also serves as Trustee (2007-present) of other investment companies advised by FMR. Mr. Curvey is a Director of Fidelity Investments Money Management, Inc. (2009-present), Director of Fidelity Research & Analysis Co. (2009-present) and Director of FMR and FMR Co., Inc. (2007-present). Mr. Curvey is also Vice Chairman (2007-present) and Director of FMR LLC. In addition, Mr. Curvey serves as an Overseer for the Boston Symphony Orchestra and a member of the Trustees of Villanova University. Previously, Mr. Curvey was the Vice Chairman (2006-2007) and Director (2000-2007) of FMR Corp. |
|
Ronald P. O'Hanley (1957) |
|
|
|
Year of Election or Appointment: 2011 Mr. O'Hanley is Director of FMR Co., Inc. (2010-present), Director of Fidelity Investments Money Management, Inc. (2010-present), Director of Fidelity Research & Analysis Company (2010-present), President of Fidelity Asset Management and Corporate Services and a member of Fidelity's Executive Committee (2010-present). Previously, Mr. O'Hanley served as President and Chief Executive Officer of BNY Mellon Asset Management (2007-2010). Mr. O'Hanley also served as Vice Chairman of Bank New York Mellon Corp. and a member of that firm's Executive Committee. Prior to the 2007 merger of The Bank of New York and Mellon Financial Corporation, he was Vice Chairman of Mellon Financial Corporation and President and Chief Executive Officer of Mellon Asset Management. He joined Mellon in February 1997. Mr. O'Hanley currently serves as Chairman of the Boston Public Library Foundation Board of Directors and sits on the Board of Directors of Beth Israel Deaconess Medical Center, the Board of Trustees of the Marine Biological Laboratory and the Advisory Board of the Maxwell School of Citizenship and Public Administration at Syracuse University. Mr. O'Hanley also chairs the Council on Asset Management for the Financial Services Roundtable and is a member of the Board of Directors of Institutional Investor's U.S. Institute. |
* Trustees have been determined to be "Interested Trustees" by virtue of, among other things, their affiliation with the trust or various entities under common control with FMR.
+ The information above includes each Trustee's principal occupation during the last five years and other information relating to the experience, attributes, and skills relevant to each Trustee's qualifications to serve as a Trustee, which led to the conclusion that each Trustee should serve as a Trustee for each fund.
Independent Trustees:
Correspondence intended for each Independent Trustee (that is, the Trustees other than the Interested Trustees) may be sent to Fidelity Investments, P.O. Box 55235, Boston, Massachusetts 02205-5235.
|
Name, Year of Birth; Principal Occupations and Other Relevant Experience+ |
|
|
Dennis J. Dirks (1948) |
|
|
|
Year of Election or Appointment: 2005 Prior to his retirement in May 2003, Mr. Dirks was Chief Operating Officer and a member of the Board of The Depository Trust & Clearing Corporation (DTCC). He also served as President, Chief Operating Officer, and Board member of The Depository Trust Company (DTC) and President and Board member of the National Securities Clearing Corporation (NSCC). In addition, Mr. Dirks served as Chief Executive Officer and Board member of the Government Securities Clearing Corporation, Chief Executive Officer and Board member of the Mortgage-Backed Securities Clearing Corporation, as a Trustee and a member of the Finance Committee of Manhattan College (2005-2008), and as a Trustee and a member of the Finance Committee of AHRC of Nassau County (2006-2008). Mr. Dirks is a member of the Independent Directors Council (IDC) Governing Council (2010-present) and Board of Directors for The Brookville Center for Children's Services, Inc. (2009-present). |
|
Alan J. Lacy (1953) |
|
|
|
Year of Election or Appointment: 2008 Mr. Lacy serves as Senior Adviser (2007-present) of Oak Hill Capital Partners, L.P. (private equity). Mr. Lacy also served as Chief Executive Officer (2000-2005) and Vice Chairman (2005-2006) of Sears Holdings Corporation and Sears, Roebuck and Co. (retail). In addition, Mr. Lacy serves as a member of the Board of Directors of Dave & Buster's Entertainment, Inc. (restaurant and entertainment complexes, 2010-present), Earth Fare, Inc. (retail grocery, 2012-present), The Hillman Companies, Inc. (hardware wholesalers, 2010-present), and Bristol-Myers Squibb Company (global pharmaceuticals, 2008-present). Mr. Lacy is a member of the Board of Trustees of The National Parks Conservation Association (2006-present). Previously, Mr. Lacy served as Chairman of the Board of Trustees of the National Parks Conservation Association (2008-2011) and as a member of the Board of Directors for the Western Union Company (global money transfer, 2006-2011). |
|
Ned C. Lautenbach (1944) |
|
|
|
Year of Election or Appointment: 2000 Mr. Lautenbach is Chairman of the Independent Trustees of the Equity and High Income Funds (2006-present). Mr. Lautenbach currently serves as the Lead Director of the Eaton Corporation Board of Directors (diversified industrial, 1997-present). Mr. Lautenbach is Chairman of the Board of Directors of the Philharmonic Center for the Arts in Naples, Florida (2012-present) and a member of the Council on Foreign Relations (1994-present). Previously, Mr. Lautenbach was a Partner/Advisory Partner at Clayton, Dubilier & Rice, LLC (private equity investment, 1998-2010), as well as a Director of Sony Corporation (2006-2007). |
|
Joseph Mauriello (1944) |
|
|
|
Year of Election or Appointment: 2008 Prior to his retirement in January 2006, Mr. Mauriello served in numerous senior management positions including Deputy Chairman and Chief Operating Officer (2004-2005), and Vice Chairman of Financial Services (2002-2004) of KPMG LLP US (professional services, 1965-2005). Mr. Mauriello currently serves as a member of the Board of Directors of XL Group plc. (global insurance and re-insurance, 2006-present). Previously, Mr. Mauriello served as a Director of the Hamilton Funds of the Bank of New York (2006-2007) and of Arcadia Resources Inc. (health care services and products, 2007-2012). |
|
Robert W. Selander (1950) |
|
|
|
Year of Election or Appointment: 2011 Previously, Mr. Selander served as a Member of the Advisory Board of Fidelity's Equity and High Income Funds (2011), Executive Vice Chairman (2010), Chief Executive Officer (2009-2010), and President and Chief Executive Officer (1997-2009) of Mastercard, Inc. |
|
Cornelia M. Small (1944) |
|
|
|
Year of Election or Appointment: 2005 Ms. Small is a member of the Board of Directors (2009-present) and Chair of the Investment Committee (2010-present) of the Teagle Foundation. Ms. Small also serves on the Investment Committee of the Berkshire Taconic Community Foundation (2008-present). Previously, Ms. Small served as Chairperson (2002-2008) and a member of the Investment Committee and Chairperson (2008-2012) and a member of the Board of Trustees of Smith College. In addition, Ms. Small served as Chief Investment Officer, Director of Global Equity Investments, and a member of the Board of Directors of Scudder, Stevens & Clark and Scudder Kemper Investments. |
|
William S. Stavropoulos (1939) |
|
|
|
Year of Election or Appointment: 2001 Mr. Stavropoulos is Vice Chairman of the Independent Trustees of the Equity and High Income Funds (2006-present). Mr. Stavropoulos serves as President and Founder of the Michigan Baseball Foundation, the Great Lakes Loons (2007-present). Mr. Stavropoulos is Chairman Emeritus of the Board of Directors of The Dow Chemical Company, where he previously served in numerous senior management positions, including President, CEO (1995-2000; 2002-2004), Chairman of the Executive Committee (2000-2006), and as a member of the Board of Directors (1990-2006). Currently, Mr. Stavropoulos is a Director of Univar Inc. (global distributor of commodity and specialty chemicals, Chairman from 2010-May 2012 and Lead Director from May 2012-present), Teradata Corporation (data warehousing and technology solutions, 2008-present), Maersk Inc. (industrial conglomerate), and Tyco International, Ltd. (multinational manufacturing and services, 2007-present), and a member of the Advisory Board for Metalmark Capital LLC (private equity investment, 2005-present). Mr. Stavropoulos is an operating advisor to Clayton, Dubilier & Rice, LLC (private equity investment). In addition, Mr. Stavropoulos is a member of the University of Notre Dame Advisory Council for the College of Science, a Trustee of the Rollin L. Gerstacker Foundation, and a Director of the Naples Philharmonic Center for the Arts. Previously, Mr. Stavropoulos served as a Director of Chemical Financial Corporation (bank holding company, 1993-2012). |
|
David M. Thomas (1949) |
|
|
|
Year of Election or Appointment: 2008 Previously, Mr. Thomas served as Executive Chairman (2005-2006) and Chairman and Chief Executive Officer (2000-2005) of IMS Health, Inc. (pharmaceutical and healthcare information solutions), and a Director of Fortune Brands, Inc. (consumer products, 2000-2011). In addition, Mr. Thomas serves as Non-Executive Chairman of the Board of Directors of Fortune Brands Home and Security (home and security products, 2011-present), and as a member of the Board of Directors of Interpublic Group of Companies, Inc. (marketing communication, 2004-present). |
|
Michael E. Wiley (1950) |
|
|
|
Year of Election or Appointment: 2008 Mr. Wiley also serves as a Director of Asia Pacific Exploration Consolidated (international oil and gas exploration and production, 2008-present). Mr. Wiley serves as a Director of Tesoro Corporation (independent oil refiner and marketer, 2005-present), and a Director of Bill Barrett Corporation (exploration and production, 2005-present). In addition, Mr. Wiley also serves as a Director of Post Oak Bank (privately-held bank, 2004-present). Previously, Mr. Wiley served as a member of the Board of Trustees of the University of Tulsa (2000-2006; 2007-2010), as a Senior Energy Advisor of Katzenbach Partners, LLC (consulting, 2006-2007), as an Advisory Director of Riverstone Holdings (private investment), Chairman, President, and CEO of Baker Hughes, Inc. (oilfield services, 2000-2004), and as Director of Spinnaker Exploration Company (exploration and production, 2001-2005). |
+ The information above includes each Trustee's principal occupation during the last five years and other information relating to the experience, attributes, and skills relevant to each Trustee's qualifications to serve as a Trustee, which led to the conclusion that each Trustee should serve as a Trustee for each fund.
Advisory Board Members and Executive Officers:
Correspondence intended for David A. Rosow and Garnett A. Smith may be sent to Fidelity Investments, P.O. Box 55235, Boston, Massachusetts 02205-5235. Correspondence intended for each executive officer and Peter S. Lynch may be sent to Fidelity Investments, 245 Summer Street, Boston, Massachusetts 02210.
|
Name, Year of Birth; Principal Occupation |
|
|
Peter S. Lynch (1944) |
|
|
|
Year of Election or Appointment: 2003 Member of the Advisory Board of Fidelity's Equity and High Income Funds. Mr. Lynch is Vice Chairman and a Director of FMR and FMR Co., Inc. In addition, Mr. Lynch serves as a Trustee of Boston College and as the Chairman of the Inner-City Scholarship Fund. Previously, Mr. Lynch served on the Special Olympics International Board of Directors (1997-2006). |
|
David A. Rosow (1942) |
|
|
|
Year of Election or Appointment: 2012 Member of the Advisory Board of Fidelity's Equity and High Income Funds. Chairman and Chief Executive Officer of International Golf Group, Inc. (golf course development, 1989-present). Previously, Mr. Rosow served as Chairman and Chief Executive Officer of Rosow & Company, Inc. (private investment company, 1989-2011), a Lead Director of Hudson United Bancorp (2001-2006) and as a Director of TD Banknorth (1996-2006). In addition, Mr. Rosow is a member (2008-present) and President (2009-present) of the Town Council of Palm Beach, Florida. |
|
Garnett A. Smith (1947) |
|
|
|
Year of Election or Appointment: 2012 Member of the Advisory Board of Fidelity's Equity and High Income Funds. Prior to Mr. Smith's retirement, he served as Chairman and Chief Executive Officer of Inbrand Corp. (manufacturer of personal absorbent products, 1990-1997). He also served as President (1986-1990) of Inbrand Corp. Prior to his employment with Inbrand Corp., he was employed by a retail fabric chain and North Carolina National Bank. In addition, Mr. Smith is a board member of the Jackson Hole Land Trust (2009-present). |
|
Kenneth B. Robins (1969) |
|
|
|
Year of Election or Appointment: 2008 President and Treasurer of Fidelity's Equity and High Income Funds. Mr. Robins also serves as President and Treasurer (2010-present) and Assistant Treasurer (2009-present) of other Fidelity funds and is an employee of Fidelity Investments (2004-present). Previously, Mr. Robins served as Deputy Treasurer of the Fidelity funds (2005-2008) and Treasurer and Chief Financial Officer of The North Carolina Capital Management Trust: Cash and Term Portfolios (2006-2008). |
|
Brian B. Hogan (1964) |
|
|
|
Year of Election or Appointment: 2009 Vice President of Equity and High Income Funds. Mr. Hogan also serves as President of FMR's Equity Division (2009-present). Previously, Mr. Hogan served as Senior Vice President, Equity Research of FMR (2006-2009) and as a portfolio manager. |
|
Christopher S. Bartel (1971) |
|
|
|
Year of Election or Appointment: 2009 Vice President of Fidelity's Sector and Real Estate Equity Funds. Mr. Bartel also serves as a Director, President, and Chief Executive Officer of Fidelity Management & Research (Japan) Inc. (2012-present), a Director of Fidelity Management & Research (Hong Kong) (2012-present), and Senior Vice President of Global Equity Research (2010-present). Previously, Mr. Bartel served as Senior Vice President of Equity Research (2009-2010), Managing Director of Research (2006-2009), and an analyst and portfolio manager (2000-2006). |
|
Scott C. Goebel (1968) |
|
|
|
Year of Election or Appointment: 2008 Secretary and Chief Legal Officer (CLO) of the Fidelity funds. Mr. Goebel also serves as Secretary of Fidelity Investments Money Management, Inc. (FIMM) (2010-present) and Fidelity Research and Analysis Company (FRAC) (2010-present); Secretary and CLO of The North Carolina Capital Management Trust: Cash and Term Portfolios (2008-present); General Counsel, Secretary, and Senior Vice President of FMR (2008-present) and FMR Co., Inc. (2008-present); employed by FMR LLC or an affiliate (2001-present); Chief Legal Officer of Fidelity Management & Research (Hong Kong) Limited (2008-present) and Assistant Secretary of Fidelity Management & Research (Japan) Inc. (2008-present), and Fidelity Management & Research (U.K.) Inc. (2008-present). Previously, Mr. Goebel served as Assistant Secretary of FIMM (2008-2010), FRAC (2008-2010), and the Funds (2007-2008) and as Vice President and Secretary of Fidelity Distributors Corporation (FDC) (2005-2007). |
|
William C. Coffey (1969) |
|
|
|
Year of Election or Appointment: 2009 Assistant Secretary of Fidelity's Equity and High Income Funds. Mr. Coffey also serves as Senior Vice President and Deputy General Counsel of FMR LLC (2010-present), and is an employee of Fidelity Investments. Previously, Mr. Coffey served as Vice President and Associate General Counsel of FMR LLC (2005-2009). |
|
Elizabeth Paige Baumann (1968) |
|
|
|
Year of Election or Appointment: 2012 Anti-Money Laundering (AML) Officer of the Fidelity funds. Ms. Baumann also serves as AML Officer of The North Carolina Capital Management Trust: Cash and Term Portfolios (2012-present), Chief AML Officer of FMR LLC (2012-present), and is an employee of Fidelity Investments. Previously, Ms. Baumann served as Vice President and Deputy Anti-Money Laundering Officer (2007-2012). |
|
Christine Reynolds (1958) |
|
|
|
Year of Election or Appointment: 2008 Chief Financial Officer of the Fidelity funds. Ms. Reynolds became President of Fidelity Pricing and Cash Management Services (FPCMS) in August 2008. Ms. Reynolds served as Chief Operating Officer of FPCMS (2007-2008). Previously, Ms. Reynolds served as President, Treasurer, and Anti-Money Laundering officer of the Fidelity funds (2004-2007). |
|
Joseph A. Hanlon (1968) |
|
|
|
Year of Election or Appointment: 2012 Chief Compliance Officer of Fidelity's Equity and High Income Funds. Mr. Hanlon serves as Compliance Officer of FMR, FMR Co., Inc., Fidelity Investments Money Management, Inc. (FIMM), Fidelity Research and Analysis Company (FRAC), Fidelity Management & Research (Japan) Inc., Fidelity Management & Research (U.K.) Inc., Fidelity Management & Research (Hong Kong), and Strategic Advisers, Inc. (2009-present), as Senior Vice President of the Fidelity Asset Management Division (2009-present), and is an employee of Fidelity Investments. |
|
Joseph F. Zambello (1957) |
|
|
|
Year of Election or Appointment: 2011 Deputy Treasurer of the Fidelity funds. Mr. Zambello is an employee of Fidelity Investments. Previously, Mr. Zambello served as Vice President of FMR's Program Management Group (2009-2011) and Vice President of the Transfer Agent Oversight Group (2005-2009). |
|
Adrien E. Deberghes (1967) |
|
|
|
Year of Election or Appointment: 2008 Deputy Treasurer of Fidelity's Equity and High Income Funds. Mr. Deberghes also serves as Vice President (2011-present) and Assistant Treasurer (2010-present) of other Fidelity funds, and is an employee of Fidelity Investments (2008-present). Previously, Mr. Deberghes served as Senior Vice President of Mutual Fund Administration at State Street Corporation (2007-2008), Senior Director of Mutual Fund Administration at Investors Bank & Trust (2005-2007), and Director of Finance for Dunkin' Brands (2000-2005). |
|
Stephen Sadoski (1971) |
|
|
|
Year of Election or Appointment: 2012 Deputy Treasurer of Fidelity's Equity and High Income Funds. Mr. Sadoski also serves as Deputy Treasurer of other Fidelity funds (2013-present) and is an employee of Fidelity Investments (2012-present). Previously, Mr. Sadoski served as Assistant Treasurer of Fidelity's Fixed Income and Asset Allocation Funds (2012-2013), an assistant chief accountant in the Division of Investment Management of the Securities and Exchange Commission (SEC) (2009-2012) and as a senior manager at Deloitte & Touche (1997-2009). |
|
Stacie Smith (1974) |
|
|
|
Year of Election or Appointment: 2013 Deputy Treasurer of Fidelity's Equity and High Income Funds. Ms. Smith is an employee of Fidelity Investments (2009-present). Previously, Ms. Smith served as Senior Audit Manager of Ernst & Young LLP (1996-2009). |
|
Stephanie J. Dorsey (1969) |
|
|
|
Year of Election or Appointment: 2010 Assistant Treasurer of Fidelity's Equity and High Income Funds. Ms. Dorsey also serves as President and Treasurer (2013-present) and Assistant Treasurer (2012-present) of other Fidelity funds and is an employee of Fidelity Investments (2008-present). Previously, Ms. Dorsey served as Deputy Treasurer of Fidelity's Fixed Income and Asset Allocation Funds (2008-2013), Treasurer (2004-2008) of the JPMorgan Mutual Funds and Vice President (2004-2008) of JPMorgan Chase Bank. |
|
John R. Hebble (1958) |
|
|
|
Year of Election or Appointment: 2009 Assistant Treasurer of Fidelity's Equity and High Income Funds. Mr. Hebble also serves as President (2011-present), Treasurer, and Chief Financial Officer of The North Carolina Capital Management Trust: Cash and Term Portfolios (2008-present) and is an employee of Fidelity Investments. Previously, Mr. Hebble served as President and Treasurer of Fidelity's Fixed Income and Asset Allocation Funds (2008-2013). |
|
Gary W. Ryan (1958) |
|
|
|
Year of Election or Appointment: 2005 Assistant Treasurer of the Fidelity funds. Mr. Ryan is an employee of Fidelity Investments. Previously, Mr. Ryan served as Vice President of Fund Reporting in Fidelity Pricing and Cash Management Services (FPCMS) (1999-2005). |
|
Jonathan Davis (1968) |
|
|
|
Year of Election or Appointment: 2010 Assistant Treasurer of the Fidelity funds. Mr. Davis is also Assistant Treasurer of Fidelity Rutland Square Trust II and Fidelity Commonwealth Trust II. Mr. Davis is an employee of Fidelity Investments. Previously, Mr. Davis served as Vice President and Associate General Counsel of FMR LLC (2003-2010). |
Annual Report
Distributions (Unaudited)
The Board of Trustees of each fund voted to pay to shareholders of record at the opening of business on record date the following distributions per share derived from capital gains realized from sales of portfolio securities and dividends derived from net investment income:
|
|
Pay Date |
Record Date |
Dividends |
Capital Gains |
|
Air Transportation Portfolio |
04/15/13 |
04/12/13 |
$0.025 |
$0.392 |
|
Defense and Aerospace Portfolio |
04/15/13 |
04/12/13 |
$0.160 |
$0.649 |
|
Environment & Alternative Energy Portfolio |
04/15/13 |
04/12/13 |
$0.030 |
$0.000 |
|
Industrial Equipment Portfolio |
04/15/13 |
04/12/13 |
$0.061 |
$0.000 |
|
Industrials Portfolio |
04/15/13 |
04/12/13 |
$0.043 |
$0.699 |
|
Transportation Portfolio |
04/15/13 |
04/12/13 |
$0.071 |
$0.457 |
The funds hereby designate as capital gain dividend the amounts noted below for the taxable year ended February 28, 2013, or, if subsequently determined to be different, the net capital gain of such year.
|
Air Transportation Portfolio |
$2,384,623 |
|
Defense and Aerospace Portfolio |
$4,332,179 |
|
Industrials Portfolio |
$15,909,162 |
|
Transportation Portfolio |
$7,955,535 |
A percentage of the dividends distributed during the fiscal year for the following funds qualify for the dividends-received deduction for corporate shareholders:
|
|
April 2012 |
December 2012 |
|
Air Transportation Portfolio |
0% |
100% |
|
Defense and Aerospace Portfolio |
100% |
100% |
|
Environment and Alternative Energy Portfolio |
100% |
100% |
|
Industrial Equipment Portfolio |
100% |
100% |
|
Industrials Portfolio |
100% |
100% |
|
Transportation Portfolio |
100% |
100% |
A percentage of the dividends distributed during the fiscal year for the following funds may be taken into account as a dividend for purposes of the maximum rate under section 1(h) (11) of the Internal Revenue Code:
|
|
April 2012 |
December 2012 |
|
Air Transportation Portfolio |
0% |
100% |
|
Defense and Aerospace Portfolio |
100% |
100% |
|
Environment and Alternative Energy Portfolio |
100% |
100% |
|
Industrial Equipment Portfolio |
100% |
100% |
|
Industrials Portfolio |
100% |
100% |
|
Transportation Portfolio |
100% |
100% |
The funds will notify shareholders in January 2014 of amounts for use in preparing 2013 income tax returns.
Annual Report
Board Approval of Investment Advisory Contracts and Management Fees
Air Transportation Portfolio
Defense and Aerospace Portfolio
Environment and Alternative Energy Portfolio
Industrial Equipment Portfolio
Industrials Portfolio
Transportation Portfolio
On November 14, 2012, the Board of Trustees, including the Independent Trustees (together, the Board), voted to approve a new management contract (the New Contracts) between each fund and Fidelity SelectCo, LLC (SelectCo) and to submit the New Contracts to shareholders for their approval. If the New Contracts are approved by shareholders, effective August 1, 2013, SelectCo will serve as investment adviser to each fund. The terms of the New Contracts are identical to those of the current management contracts with FMR (the Current Contracts), except with respect to the name of the investment adviser and the dates of execution and the initial two-year term of the contract. The Board, assisted by the advice of fund counsel and Independent Trustees' counsel, considered a broad range of information.
In determining whether to approve the New Contracts for the funds, the Board was aware that shareholders in the funds have a broad range of investment choices available to them, including a wide choice among mutual funds offered by competitors to Fidelity, and that each fund's shareholders, with the opportunity to review and weigh the disclosure provided by the fund in its prospectus and other public disclosures, have chosen to invest in the fund, managed by Fidelity.
Nature, Extent, and Quality of Services Provided. The Board considered the nature, quality, cost and extent of the services to be provided by SelectCo under the New Contracts as well as the nature, quality, cost and extent of the advisory, administrative, distribution and shareholder services performed by the FMR and the sub-advisers, and by affiliated companies. The Board considered that, upon shareholder approval, SelectCo will render the same services to the funds under the New Contracts that FMR currently renders to the funds under the Current Contracts. The Board also considered that the New Contracts would not result in any changes to (i) the investment process or strategies employed in the management of the funds' assets or (ii) the day-to-day management of the funds or the persons primarily responsible for such management.
Throughout the year, the Trustees had discussions with FMR about plans to establish SelectCo as a new investment adviser to manage sector-based funds and products. The Trustees considered Fidelity's rationale for creating a separate investment adviser and noted that a separate investment adviser may be better positioned to focus on opportunities for growth within the sector investing space and to focus on a distinct approach to sector investing and research.
Shareholder and Administrative Services. The Board noted that the growth of fund assets across the complex allows Fidelity to reinvest in the development of services designed to enhance the value or convenience of the Fidelity funds as investment vehicles. These services include 24-hour access to account information and market information through phone representatives and over the Internet, and investor education materials and asset allocation tools.
Investment in a Large Fund Family. The Board considered the benefits to shareholders of investing in a Fidelity fund, including the benefits of investing in a fund that is part of a large family of funds offering a variety of investment disciplines and providing for a large variety of mutual fund shareholder services.
Investment Performance. The Board did not consider performance to be a material factor in its decision to approve the New Contracts because the New Contracts would not result in any changes to the funds' investment processes or strategies or in the persons primarily responsible for the day-to-day management of the funds.
Based on its review, the Board concluded that the nature, extent, and quality of the services provided to each fund will benefit the fund's shareholders, particularly in light of the Board's view that the fund's shareholders benefit from investing in a fund that is part of a large family of funds offering a variety of investment disciplines and services.
Competitiveness of Management Fee and Total Fund Expenses. The Board considered that, if approved by shareholders, the New Contracts would not result in any changes to the amount of the management fees paid by the funds, except that such fees would be paid to SelectCo rather than FMR. The Board noted that at previous meetings during the year it received and considered materials relating to its review of the management fee of each fund. This information includes comparisons that focus on a fund's standing relative to the total universe of comparable funds available to investors in terms of gross management fees before expense reimbursements or caps, as well as a fund's standing relative to non-Fidelity funds similar in size to the fund within the comparison group.
Based on its review, the Board concluded that each fund's management fee was fair and reasonable in light of the services that the fund receives and the other factors considered.
Annual Report
Board Approval of Investment Advisory Contracts and Management Fees - continued
Because there are no expected changes in the funds' management fees under the New Contracts, the Board will review each fund's total expenses compared to competitive fund median expenses in connection with its future consideration of the renewal of the funds' management contracts and sub-advisory agreements.
In its review of total expenses, the Board also noted that at previous meetings during the year it received and considered materials relating to its review of total expenses for each Fidelity fund. This information includes Fidelity fee structures and other information with respect to clients of FMR and its affiliates, such as other mutual funds advised or sub-advised by FMR or its affiliates, pension plan clients, and other institutional clients.
Costs of the Services and Profitability. Because there were no changes to the services to be provided or fees to be charged to the funds under the New Contracts, the Board did not consider data regarding the impact on Fidelity's costs of services, revenues, or profitability from the new arrangements to be a significant factor in its decision.
In connection with its future consideration of the renewal of each fund's management contract and sub-advisory agreements, the Board will consider the revenues earned and the expenses incurred by Fidelity in conducting the business of developing, marketing, distributing, managing, administering and servicing the funds and their shareholders.
Economies of Scale. The Board recognized that the New Contracts, like the Current Contracts, incorporate a "group fee" structure, which provides for lower fee rates as total fund assets under FMR's management increase, and for higher fee rates as total fund assets under FMR's management decrease. The Board considered that the group fee is designed to deliver the benefits of economies of scale to fund shareholders when total fund assets increase, even if assets of any particular fund are unchanged or have declined, because some portion of Fidelity's costs are attributable to services provided to all Fidelity funds, and all funds benefit if those costs can be allocated among more assets. The Board concluded that, given the group fee structure, fund shareholders will achieve a certain level of economies of scale as assets under FMR's management increase at the fund complex level, regardless of whether Fidelity achieves any such economies of scale.
In connection with its future consideration of the renewal of each fund's management contract and sub-advisory agreements, the Board will consider whether there have been economies of scale in respect of the management of the Fidelity funds, whether the Fidelity funds (including the funds) have appropriately benefited from any such economies of scale, and whether there is potential for realization of any further economies of scale.
Based on its evaluation of all of the conclusions noted above, and after considering all material factors, the Board ultimately concluded that each New Contract is fair and reasonable, and that the New Contracts should be approved and submitted to the applicable funds' shareholders for their approval.
Annual Report
Investment Adviser
Fidelity Management & Research Company
Boston, MA
Investment Sub-Advisers
FMR Co., Inc.
Fidelity Management & Research
(U.K.) Inc.
Fidelity Management & Research
(Hong Kong) Limited
Fidelity Management & Research
(Japan) Inc.
General Distributor
Fidelity Distributors Corporation
Smithfield, RI
Transfer and Service Agents
Fidelity Investments Institutional Operations Company, Inc.
Boston, MA
Fidelity Service Company, Inc.
Boston, MA
Custodian
Brown Brothers Harriman & Co.
Boston, MA
Corporate Headquarters
245 Summer Street
Boston, MA 02210
1-800-544-8888
The Fidelity Telephone Connection
Mutual Fund 24-Hour Service
Exchanges/Redemptions
and Account Assistance 1-800-544-6666
Product Information 1-800-544-8888
Retirement Accounts 1-800-544-4774
(8 a.m. - 9 p.m.)
TDD Service 1-800-544-0118
for the deaf and hearing impaired
(9 a.m. - 9 p.m. Eastern time)
Fidelity Automated Service
Telephone (FAST®) 
1-800-544-5555
Automated line for quickest service
SELCI-UANNPRO-0413
1.910422.103
Fidelity®
Select Portfolios®
Materials Sector
Chemicals Portfolio
Gold Portfolio
Materials Portfolio
Annual Report
February 28, 2013
(Fidelity Cover Art)
Contents
|
Chemicals |
Performance |
|
|
|
Management's Discussion |
|
|
|
Shareholder Expense Example |
|
|
|
Investment Changes |
|
|
|
Investments |
|
|
|
Financial Statements |
|
|
|
Notes to the Financial Statements |
|
|
Gold |
Performance |
|
|
|
Management's Discussion |
|
|
|
Shareholder Expense Example |
|
|
|
Consolidated Investment Changes |
|
|
|
Consolidated Investments |
|
|
|
Consolidated Financial Statements |
|
|
|
Notes to the Consolidated Financial Statements |
|
|
Materials |
Performance |
|
|
|
Management's Discussion |
|
|
|
Shareholder Expense Example |
|
|
|
Investment Changes |
|
|
|
Investments |
|
|
|
Financial Statements |
|
|
|
Notes to the Financial Statements |
|
|
Report of Independent Registered Public Accounting Firm |
|
|
|
Trustees and Officers |
|
|
|
Distributions |
|
|
|
Board Approval of Investment Advisory Contracts and Management Fees |
|
To view a fund's proxy voting guidelines and proxy voting record for the 12-month period ended June 30, visit http://www.fidelity.com/proxyvotingresults or visit the Securities and Exchange Commission's (SEC) web site at http://www.sec.gov. You may also call 1-800-544-8544 to request a free copy of the proxy voting guidelines.
Standard & Poor's, S&P and S&P 500 are registered service marks of The McGraw-Hill Companies, Inc. and have been licensed for use by Fidelity Distributors Corporation.
Other third-party marks appearing herein are the property of their respective owners.
All other marks appearing herein are registered or unregistered trademarks or service marks of FMR LLC or an affiliated company. © 2013 FMR LLC. All rights reserved.
This report and the financial statements contained herein are submitted for the general information of the shareholders of the funds. This report is not authorized for distribution to prospective investors in the funds unless preceded or accompanied by an effective prospectus.
A fund files its complete schedule of portfolio holdings with the SEC for the first and third quarters of each fiscal year on Form N-Q. Forms N-Q are available on the SEC's web site at http://www.sec.gov. A fund's Forms N-Q may be reviewed and copied at the SEC's Public Reference Room in Washington, DC. Information regarding the operation of the SEC's Public Reference Room may be obtained by calling 1-800-SEC-0330. For a complete list of a fund's portfolio holdings, view the most recent holdings listing, semiannual report, or annual report on Fidelity's web site at http://www.fidelity.com, http://www.advisor.fidelity.com, or http://www.401k.com, as applicable.
NOT FDIC INSURED • MAY LOSE VALUE • NO BANK GUARANTEE
Neither the funds nor Fidelity Distributors Corporation is a bank.
Annual Report
Performance: The Bottom Line
Average annual total return reflects the change in the value of an investment, assuming reinvestment of the fund's distributions from dividend income and capital gains (the profits earned upon the sale of securities that have grown in value, if any) and assuming a constant rate of performance each year. The $10,000 table and the fund's returns do not reflect the deduction of taxes that a shareholder would pay on fund distributions or the redemption of fund shares. During periods of reimbursement by Fidelity, a fund's total return will be greater than it would be had the reimbursement not occurred. How a fund did yesterday is no guarantee of how it will do tomorrow.
Average Annual Total Returns
|
Periods ended February 28, 2013 |
Past 1 |
Past 5 |
Past 10 |
|
Chemicals Portfolio |
15.61% |
10.91% |
16.77% |
$10,000 Over 10 Years
Let's say hypothetically that $10,000 was invested in Chemicals Portfolio on February 28, 2003. The chart shows how the value of your investment would have changed, and also shows how the S&P 500® Index performed over the same period.
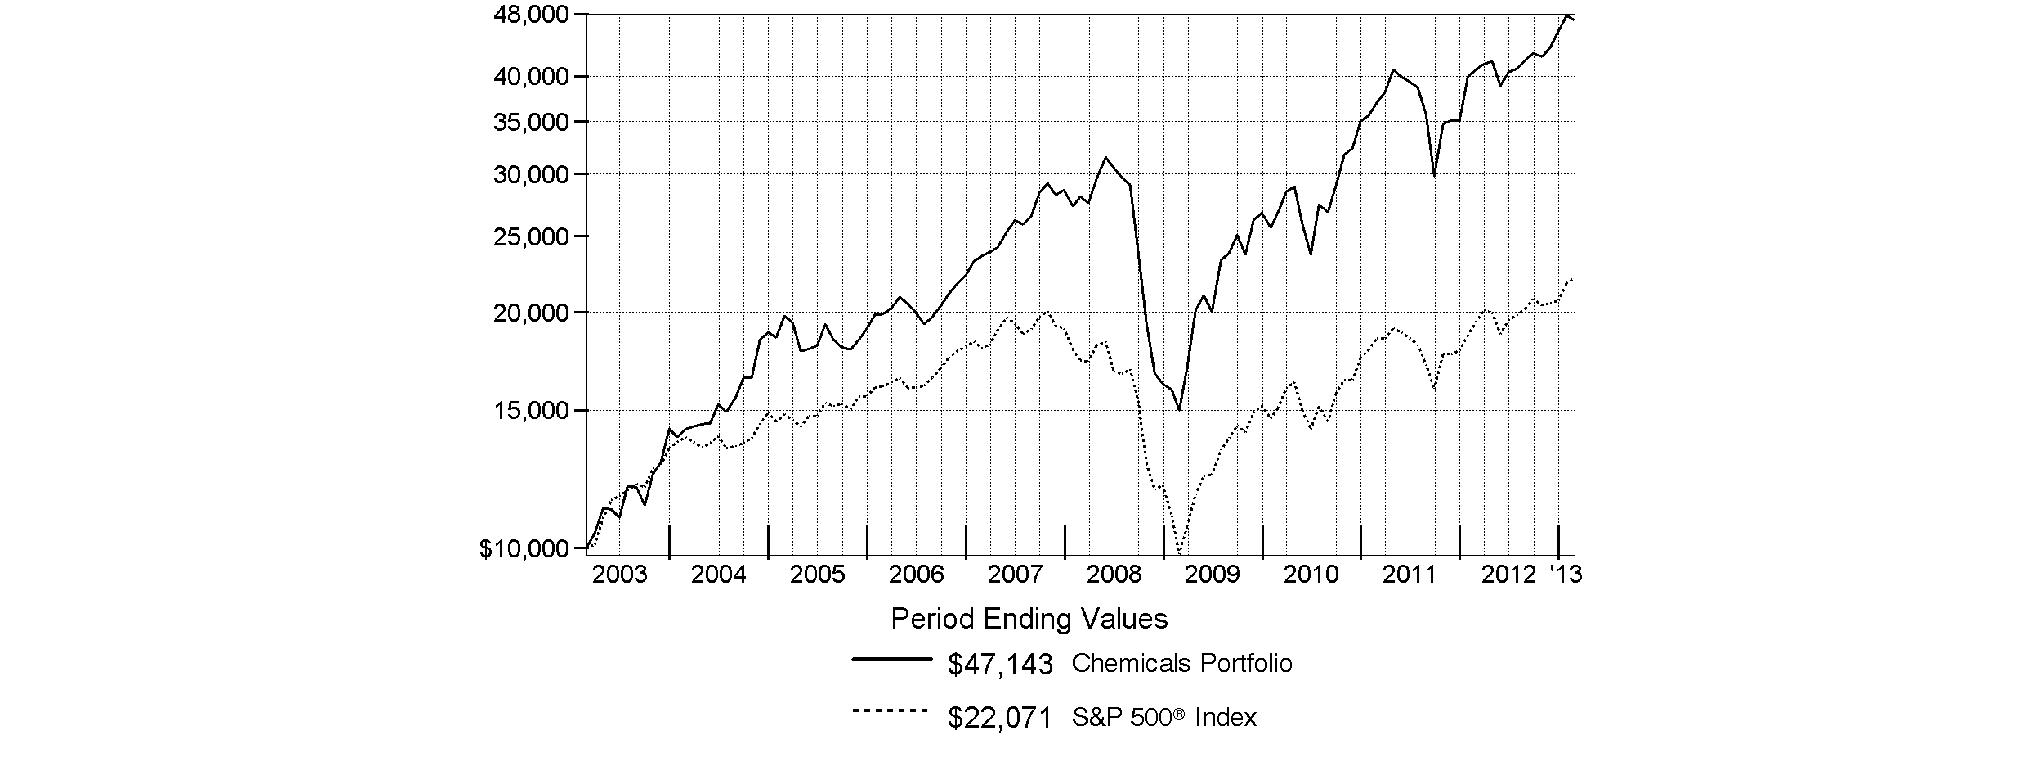
Annual Report
Chemicals Portfolio
Management's Discussion of Fund Performance
Market Recap: U.S. stocks posted solid gains for the year ending February 28, 2013, sparked by a late-period rally that pushed major equity benchmarks to multiyear highs. Improvement in the global economy and more monetary stimulus from the U.S. Federal Reserve kept markets on the upswing for much of the year, shrugging off an early decline brought on by debt woes in Europe, and another dip later in the period amid Congressional gridlock on the federal budget. Renewed optimism over employment, the housing market, corporate earnings and record dividends made stocks a favorite with investors during the 12 months, which helped push the broad-based S&P 500® Index across the milestone 1,500 mark at the end of January. The S&P 500® finished the period up 13.46%. Seven of the 10 major market sectors tracked by MSCI U.S. IMI 25-50 classifications produced double-digit gains, led by health care and financials, while information technology, energy and materials trailed the broad equity market with only modest advances.
Comments from Mahmoud Sharaf, Portfolio Manager of Chemicals Portfolio: For the year, the fund returned 15.61%, trailing the 16.75% gain of the MSCI® U.S. IMI Chemicals 25-50 Index, but easily outpacing the broad-based S&P 500®. From an absolute standpoint, the past year was a solid period for the fund, with results driven largely by our concentration in names levered to cheap domestic natural gas versus international crude oil, as well as companies with exposure to a renaissance in U.S. manufacturing. I continued to believe that U.S. chemicals firms were at an advantage over global producers, due to low domestic natural gas prices relative to international oil, and I focused my investments on names best positioned to benefit. Four of the fund's top-five contributors versus the industry benchmark fit this description - Eastman Chemical, LyondellBasell Industries, Westlake Chemical and Axiall. Our biggest success this past year was a sizable holding in Eastman, which engages in global sales and manufacturing of chemicals and plastics. Eastman has been undergoing a structural change from a commodity chemicals company to a vertically integrated specialty chemicals company. I added to our position in Eastman following the firm's July acquisition of rival Solutia. Wall Street was negative on Solutia and, in our opinion, underappreciated the merits of the deal, but we believed acquiring Solutia would help thrust Eastman into the higher-margin, less-cyclical products market. Similarly, LyondellBasell Industries, a Netherlands-based seller of polypropylene and related compounds, and commodity chemicals firms Westlake and Axiall - both of which I added to the fund during the period - each were unappreciated beneficiaries of the disparity between U.S. gas and international oil prices. The fund experienced significant inflows during the year, and the fund was hurt by not being fully invested in an up market. Among major individual detractors were underweightings in high-quality stocks with high valuation multiples, including PPG Industries and Monsanto. PPG is a global supplier of paints, coatings, optical products and other specialty materials - markets with generally defensive characteristics. I was underweighted the stock primarily due to its valuation, but also because for most of the year we had a pessimistic view of the domestic housing market, believing that its impact on the chemicals space would be less intense than it was during the previous economic recovery. Monsanto, a multinational agricultural biotechnology corporation, is a leading producer of seeds and the herbicide glyphosate, which it markets under the Roundup® brand. My negative stance on the pricing dynamics of genetically modified seeds has led me to continually underweight the large benchmark component, and this hurt the fund when the stock performed well during the period.
The views expressed above reflect those of the portfolio manager(s) only through the end of the period as stated on the cover of this report and do not necessarily represent the views of Fidelity or any other person in the Fidelity organization. Any such views are subject to change at any time based upon market or other conditions and Fidelity disclaims any responsibility to update such views. These views may not be relied on as investment advice and, because investment decisions for a Fidelity fund are based on numerous factors, may not be relied on as an indication of trading intent on behalf of any Fidelity fund.
Annual Report
Chemicals Portfolio
Shareholder Expense Example
As a shareholder of the Fund, you incur two types of costs: (1) transaction costs, including redemption fees and (2) ongoing costs, including management fees and other Fund expenses. This Example is intended to help you understand your ongoing costs (in dollars) of investing in the Fund and to compare these costs with the ongoing costs of investing in other mutual funds.
The Example is based on an investment of $1,000 invested at the beginning of the period and held for the entire period (September 1, 2012 to February 28, 2013).
Actual Expenses
The first line of the accompanying table provides information about actual account values and actual expenses. You may use the information in this line, together with the amount you invested, to estimate the expenses that you paid over the period. Simply divide your account value by $1,000.00 (for example, an $8,600 account value divided by $1,000.00 = 8.6), then multiply the result by the number in the first line under the heading entitled "Expenses Paid During Period" to estimate the expenses you paid on your account during this period. A small balance maintenance fee of $12.00 that is charged once a year may apply for certain accounts with a value of less than $2,000. This fee is not included in the table below. If it was, the estimate of expenses you paid during the period would be higher, and your ending account value lower, by this amount. In addition, the Fund, as a shareholder in the underlying Fidelity Central Funds, will indirectly bear its pro-rata share of the fees and expenses incurred by the underlying Fidelity Central Funds. These fees and expenses are not included in the Fund's annualized expense ratio used to calculate the expense estimate in the table below.
Hypothetical Example for Comparison Purposes
The second line of the accompanying table provides information about hypothetical account values and hypothetical expenses based on the Fund's actual expense ratio and an assumed rate of return of 5% per year before expenses, which is not the Fund's actual return. The hypothetical account values and expenses may not be used to estimate the actual ending account balance or expenses you paid for the period. You may use this information to compare the ongoing costs of investing in the Fund and other funds. To do so, compare this 5% hypothetical example with the 5% hypothetical examples that appear in the shareholder reports of the other funds. A small balance maintenance fee of $12.00 that is charged once a year may apply for certain accounts with a value of less than $2,000. This fee is not included in the table below. If it was, the estimate of expenses you paid during the period would be higher, and your ending account value lower, by this amount. In addition, the Fund, as a shareholder in the underlying Fidelity Central Funds, will indirectly bear its pro-rata share of the fees and expenses incurred by the underlying Fidelity Central Funds. These fees and expenses are not included in the Fund's annualized expense ratio used to calculate the expense estimate in the table below.
Please note that the expenses shown in the table are meant to highlight your ongoing costs only and do not reflect any transaction costs. Therefore, the second line of the table is useful in comparing ongoing costs only, and will not help you determine the relative total costs of owning different funds. In addition, if these transactional costs were included, your costs would have been higher.
|
|
Annualized |
Beginning |
Ending |
Expenses Paid |
|
Actual |
.82% |
$ 1,000.00 |
$ 1,123.60 |
$ 4.32 |
|
Hypothetical (5% return per year before expenses) |
|
$ 1,000.00 |
$ 1,020.73 |
$ 4.11 |
* Expenses are equal to the Fund's annualized expense ratio, multiplied by the average account value over the period, multiplied by 181/365 (to reflect the one-half year period).
Annual Report
Chemicals Portfolio
Investment Changes (Unaudited)
|
Top Ten Stocks as of February 28, 2013 |
||
|
|
% of fund's |
% of fund's net assets |
|
Monsanto Co. |
8.4 |
8.7 |
|
LyondellBasell Industries NV Class A |
7.5 |
6.6 |
|
Eastman Chemical Co. |
7.4 |
6.6 |
|
The Dow Chemical Co. |
6.9 |
6.5 |
|
Praxair, Inc. |
6.6 |
7.9 |
|
Ashland, Inc. |
4.9 |
4.0 |
|
E.I. du Pont de Nemours & Co. |
4.9 |
7.9 |
|
Ecolab, Inc. |
4.6 |
5.0 |
|
FMC Corp. |
3.7 |
0.0 |
|
Sigma Aldrich Corp. |
3.3 |
3.3 |
|
|
58.2 |
|
|
Top Industries (% of fund's net assets) |
|||
|
As of February 28, 2013 |
|||
 |
Chemicals |
92.8% |
|
 |
Oil, Gas & Consumable Fuels |
1.9% |
|
 |
Metals & Mining |
0.4% |
|
 |
Energy Equipment & Services |
0.2% |
|
 |
Marine |
0.2% |
|
 |
All Others* |
4.5% |
|

|
As of August 31, 2012 |
|||
|
Chemicals |
90.2% |
|
 |
Energy Equipment & Services |
1.6% |
|
 |
Marine |
0.7% |
|
|
Commercial Services & Supplies |
0.2% |
|
|
All Others* |
7.3% |
|

|
* Includes short-term investments and net other assets. |
Annual Report
Chemicals Portfolio
Investments February 28, 2013
Showing Percentage of Net Assets
|
Common Stocks - 95.5% |
|||
|
Shares |
Value |
||
|
CHEMICALS - 92.8% |
|||
|
Commodity Chemicals - 18.8% |
|||
|
Arkema SA |
298,200 |
$ 30,296,494 |
|
|
Axiall Corp. (d) |
381,175 |
21,566,882 |
|
|
Cabot Corp. |
803,803 |
29,563,874 |
|
|
LyondellBasell Industries NV Class A (d) |
1,459,122 |
85,533,732 |
|
|
Mexichem SAB de CV |
1,788,500 |
8,965,934 |
|
|
PetroLogistics LP |
340,712 |
5,321,921 |
|
|
Westlake Chemical Corp. (d) |
370,885 |
31,977,705 |
|
|
|
213,226,542 |
||
|
Diversified Chemicals - 26.2% |
|||
|
E.I. du Pont de Nemours & Co. |
1,165,700 |
55,837,030 |
|
|
Eastman Chemical Co. |
1,205,751 |
84,077,017 |
|
|
FMC Corp. |
687,600 |
41,434,776 |
|
|
Lanxess AG |
132,900 |
11,264,113 |
|
|
PPG Industries, Inc. |
196,104 |
26,407,365 |
|
|
The Dow Chemical Co. |
2,458,538 |
77,984,825 |
|
|
|
297,005,126 |
||
|
Fertilizers & Agricultural Chemicals - 10.9% |
|||
|
CF Industries Holdings, Inc. |
110,053 |
22,101,944 |
|
|
Monsanto Co. |
937,753 |
94,741,185 |
|
|
The Mosaic Co. |
124,542 |
7,290,689 |
|
|
|
124,133,818 |
||
|
Industrial Gases - 6.6% |
|||
|
Praxair, Inc. |
657,407 |
74,319,861 |
|
|
Specialty Chemicals - 30.3% |
|||
|
Albemarle Corp. |
516,902 |
33,639,982 |
|
|
American Pacific Corp. (a) |
22,400 |
414,400 |
|
|
Ashland, Inc. |
718,950 |
56,056,532 |
|
|
Cytec Industries, Inc. |
279,943 |
20,265,074 |
|
|
Ecolab, Inc. |
684,999 |
52,436,673 |
|
|
Innophos Holdings, Inc. |
269,312 |
13,150,505 |
|
|
Innospec, Inc. |
642,823 |
25,873,626 |
|
|
NewMarket Corp. |
10,000 |
2,516,700 |
|
|
Rockwood Holdings, Inc. |
490,927 |
30,732,030 |
|
|
Royal DSM NV |
286,300 |
16,760,249 |
|
|
Sherwin-Williams Co. |
111,700 |
18,049,603 |
|
|
Sigma Aldrich Corp. |
487,400 |
37,559,044 |
|
|
W.R. Grace & Co. (a) |
456,684 |
32,689,441 |
|
|
Zoltek Companies, Inc. (a)(d) |
423,687 |
3,961,473 |
|
|
|
344,105,332 |
||
|
TOTAL CHEMICALS |
1,052,790,679 |
||
|
COMMERCIAL SERVICES & SUPPLIES - 0.1% |
|||
|
Environmental & Facility Services - 0.1% |
|||
|
Swisher Hygiene, Inc. (a) |
549,240 |
774,429 |
|
|
Swisher Hygiene, Inc. (Canada) (a)(d) |
559,700 |
789,176 |
|
|
|
1,563,605 |
||
|
|
|||
|
Shares |
Value |
||
|
ENERGY EQUIPMENT & SERVICES - 0.2% |
|||
|
Oil & Gas Drilling - 0.2% |
|||
|
Ocean Rig UDW, Inc. (United States) (a) |
188,823 |
$ 2,751,151 |
|
|
Seadrill Ltd. |
600 |
22,002 |
|
|
|
2,773,153 |
||
|
FOOD PRODUCTS - 0.1% |
|||
|
Packaged Foods & Meats - 0.1% |
|||
|
Sanderson Farms, Inc. |
15,000 |
760,950 |
|
|
MARINE - 0.0% |
|||
|
Marine - 0.0% |
|||
|
DryShips, Inc. (a) |
20 |
39 |
|
|
METALS & MINING - 0.4% |
|||
|
Diversified Metals & Mining - 0.4% |
|||
|
Kenmare Resources PLC (a) |
8,276,695 |
4,394,656 |
|
|
OIL, GAS & CONSUMABLE FUELS - 1.9% |
|||
|
Oil & Gas Refining & Marketing - 1.0% |
|||
|
Marathon Petroleum Corp. |
71,300 |
5,909,344 |
|
|
Phillips 66 |
90,600 |
5,704,176 |
|
|
|
11,613,520 |
||
|
Oil & Gas Storage & Transport - 0.9% |
|||
|
Access Midstream Partners LP |
128,300 |
4,777,892 |
|
|
Tesoro Logistics LP |
110,600 |
5,518,940 |
|
|
|
10,296,832 |
||
|
TOTAL OIL, GAS & CONSUMABLE FUELS |
21,910,352 |
||
|
TOTAL COMMON STOCKS (Cost $857,472,619) |
|
||
|
Convertible Bonds - 0.2% |
||||
|
|
Principal Amount |
|
||
|
MARINE - 0.2% |
||||
|
Marine - 0.2% |
||||
|
DryShips, Inc. 5% 12/1/14 |
|
$ 2,790,000 |
|
|
|
Money Market Funds - 5.8% |
|||
|
Shares |
Value |
||
|
Fidelity Cash Central Fund, 0.16% (b) |
53,207,264 |
$ 53,207,264 |
|
|
Fidelity Securities Lending Cash Central Fund, 0.16% (b)(c) |
12,014,695 |
12,014,695 |
|
|
TOTAL MONEY MARKET FUNDS (Cost $65,221,959) |
|
||
|
TOTAL INVESTMENT PORTFOLIO - 101.5% (Cost $925,202,186) |
1,151,793,868 |
||
|
NET OTHER ASSETS (LIABILITIES) - (1.5)% |
(17,016,373) |
||
|
NET ASSETS - 100% |
$ 1,134,777,495 |
||
|
Legend |
|
(a) Non-income producing |
|
(b) Affiliated fund that is generally available only to investment companies and other accounts managed by Fidelity Investments. The rate quoted is the annualized seven-day yield of the fund at period end. A complete unaudited listing of the fund's holdings as of its most recent quarter end is available upon request. In addition, each Fidelity Central Fund's financial statements, which are not covered by the Fund's Report of Independent Registered Public Accounting Firm, are available on the SEC's website or upon request. |
|
(c) Investment made with cash collateral received from securities on loan. |
|
(d) Security or a portion of the security is on loan at period end. |
|
Affiliated Central Funds |
|
Information regarding fiscal year to date income earned by the Fund from investments in Fidelity Central Funds is as follows: |
|
Fund |
Income earned |
|
Fidelity Cash Central Fund |
$ 94,386 |
|
Fidelity Securities Lending Cash Central Fund |
305,709 |
|
Total |
$ 400,095 |
|
Other Information |
|
The following is a summary of the inputs used, as of February 28, 2013, involving the Fund's assets and liabilities carried at fair value. The inputs or methodology used for valuing securities may not be an indication of the risk associated with investing in those securities. For more information on valuation inputs, and their aggregation into the levels used in the table below, please refer to the Investment Valuation section in the accompanying Notes to Financial Statements. |
|
Valuation Inputs at Reporting Date: |
||||
|
Description |
Total |
Level 1 |
Level 2 |
Level 3 |
|
Investments in Securities: |
||||
|
Common Stocks |
$ 1,084,193,434 |
$ 1,084,193,434 |
$ - |
$ - |
|
Convertible Bonds |
2,378,475 |
- |
2,378,475 |
- |
|
Money Market Funds |
65,221,959 |
65,221,959 |
- |
- |
|
Total Investments in Securities: |
$ 1,151,793,868 |
$ 1,149,415,393 |
$ 2,378,475 |
$ - |
|
Distribution of investments by country or territory of incorporation, as a percentage of total net assets, is as follows. (Unaudited) |
|
United States of America |
85.7% |
|
Netherlands |
9.0% |
|
France |
2.7% |
|
Germany |
1.0% |
|
Others (Individually Less Than 1%) |
1.6% |
|
|
100.0% |
See accompanying notes which are an integral part of the financial statements.
Annual Report
Chemicals Portfolio
Financial Statements
Statement of Assets and Liabilities
|
|
February 28, 2013 |
|
|
|
|
|
|
Assets |
|
|
|
Investment in securities, at value (including securities loaned of $11,737,071) - See accompanying schedule: Unaffiliated issuers (cost $859,980,227) |
$ 1,086,571,909 |
|
|
Fidelity Central Funds (cost $65,221,959) |
65,221,959 |
|
|
Total Investments (cost $925,202,186) |
|
$ 1,151,793,868 |
|
Receivable for investments sold |
|
18,349,536 |
|
Receivable for fund shares sold |
|
3,126,382 |
|
Dividends receivable |
|
1,682,995 |
|
Interest receivable |
|
34,875 |
|
Distributions receivable from Fidelity Central Funds |
|
24,189 |
|
Prepaid expenses |
|
1,711 |
|
Receivable from investment adviser for expense reductions |
|
1,179 |
|
Other receivables |
|
54,636 |
|
Total assets |
|
1,175,069,371 |
|
|
|
|
|
Liabilities |
|
|
|
Payable for investments purchased |
$ 24,228,826 |
|
|
Payable for fund shares redeemed |
3,256,188 |
|
|
Accrued management fee |
529,405 |
|
|
Other affiliated payables |
211,548 |
|
|
Other payables and accrued expenses |
51,214 |
|
|
Collateral on securities loaned, at value |
12,014,695 |
|
|
Total liabilities |
|
40,291,876 |
|
|
|
|
|
Net Assets |
|
$ 1,134,777,495 |
|
Net Assets consist of: |
|
|
|
Paid in capital |
|
$ 906,774,635 |
|
Undistributed net investment income |
|
3,006,684 |
|
Accumulated undistributed net realized gain (loss) on investments and foreign currency transactions |
|
(1,578,780) |
|
Net unrealized appreciation (depreciation) on investments and assets and liabilities in foreign currencies |
|
226,574,956 |
|
Net Assets, for 9,227,448 shares outstanding |
|
$ 1,134,777,495 |
|
Net Asset Value, offering price and redemption price per share ($1,134,777,495 ÷ 9,227,448 shares) |
|
$ 122.98 |
Statement of Operations
|
|
Year ended February 28, 2013 |
|
|
|
|
|
|
Investment Income |
|
|
|
Dividends |
|
$ 18,675,842 |
|
Special dividends |
|
2,351,504 |
|
Interest |
|
279,137 |
|
Income from Fidelity Central Funds |
|
400,095 |
|
Total income |
|
21,706,578 |
|
|
|
|
|
Expenses |
|
|
|
Management fee |
$ 4,986,632 |
|
|
Transfer agent fees |
1,924,498 |
|
|
Accounting and security lending fees |
306,145 |
|
|
Custodian fees and expenses |
16,025 |
|
|
Independent trustees' compensation |
5,765 |
|
|
Registration fees |
98,060 |
|
|
Audit |
43,387 |
|
|
Legal |
3,143 |
|
|
Miscellaneous |
8,239 |
|
|
Total expenses before reductions |
7,391,894 |
|
|
Expense reductions |
(131,983) |
7,259,911 |
|
Net investment income (loss) |
|
14,446,667 |
|
Realized and Unrealized Gain (Loss) Net realized gain (loss) on: |
|
|
|
Investment securities: |
|
|
|
Unaffiliated issuers |
32,115,194 |
|
|
Foreign currency transactions |
27,946 |
|
|
Total net realized gain (loss) |
|
32,143,140 |
|
Change in net unrealized appreciation (depreciation) on: Investment securities |
74,664,380 |
|
|
Assets and liabilities in foreign currencies |
(27,253) |
|
|
Total change in net unrealized appreciation (depreciation) |
|
74,637,127 |
|
Net gain (loss) |
|
106,780,267 |
|
Net increase (decrease) in net assets resulting from operations |
|
$ 121,226,934 |
See accompanying notes which are an integral part of the financial statements.
Annual Report
Chemicals Portfolio
Financial Statements - continued
Statement of Changes in Net Assets
|
|
Year ended |
Year ended |
|
Increase (Decrease) in Net Assets |
|
|
|
Operations |
|
|
|
Net investment income (loss) |
$ 14,446,667 |
$ 5,722,596 |
|
Net realized gain (loss) |
32,143,140 |
15,241,817 |
|
Change in net unrealized appreciation (depreciation) |
74,637,127 |
35,952,257 |
|
Net increase (decrease) in net assets resulting from operations |
121,226,934 |
56,916,670 |
|
Distributions to shareholders from net investment income |
(11,402,559) |
(4,429,446) |
|
Distributions to shareholders from net realized gain |
(21,839,025) |
- |
|
Total distributions |
(33,241,584) |
(4,429,446) |
|
Share transactions |
548,680,903 |
571,810,704 |
|
Reinvestment of distributions |
32,252,680 |
4,296,838 |
|
Cost of shares redeemed |
(395,723,811) |
(459,470,250) |
|
Net increase (decrease) in net assets resulting from share transactions |
185,209,772 |
116,637,292 |
|
Redemption fees |
43,229 |
82,316 |
|
Total increase (decrease) in net assets |
273,238,351 |
169,206,832 |
|
|
|
|
|
Net Assets |
|
|
|
Beginning of period |
861,539,144 |
692,332,312 |
|
End of period (including undistributed net investment income of $3,006,684 and undistributed net investment income of $623,552, respectively) |
$ 1,134,777,495 |
$ 861,539,144 |
|
Other Information Shares |
|
|
|
Sold |
4,641,695 |
5,550,618 |
|
Issued in reinvestment of distributions |
277,790 |
45,627 |
|
Redeemed |
(3,487,085) |
(4,666,200) |
|
Net increase (decrease) |
1,432,400 |
930,045 |
Financial Highlights
|
Years ended February 28, |
2013 |
2012 H |
2011 |
2010 |
2009 |
|
Selected Per-Share Data |
|
|
|
|
|
|
Net asset value, beginning of period |
$ 110.52 |
$ 100.85 |
$ 75.43 |
$ 42.74 |
$ 81.31 |
|
Income from Investment Operations |
|
|
|
|
|
|
Net investment income (loss) B |
1.84 E |
.76 |
.69 |
1.00 F |
.73 |
|
Net realized and unrealized gain (loss) |
15.10 |
9.52 |
27.20 |
32.77 |
(38.63) |
|
Total from investment operations |
16.94 |
10.28 |
27.89 |
33.77 |
(37.90) |
|
Distributions from net investment income |
(1.55) |
(.62) |
(.57) |
(1.08) |
(.68) |
|
Distributions from net realized gain |
(2.95) |
- |
(1.91) |
- |
(.02) |
|
Total distributions |
(4.49) J |
(.62) |
(2.47) K |
(1.08) |
(.70) |
|
Redemption fees added to paid in capital B |
.01 |
.01 |
- I |
- I |
.03 |
|
Net asset value, end of period |
$ 122.98 |
$ 110.52 |
$ 100.85 |
$ 75.43 |
$ 42.74 |
|
Total Return A |
15.61% |
10.31% |
37.74% |
79.15% |
(46.68)% |
|
Ratios to Average Net Assets C, G |
|
|
|
|
|
|
Expenses before reductions |
.83% |
.85% |
.90% |
.96% |
.91% |
|
Expenses net of fee waivers, if any |
.83% |
.85% |
.90% |
.96% |
.91% |
|
Expenses net of all reductions |
.81% |
.84% |
.89% |
.95% |
.90% |
|
Net investment income (loss) |
1.62% E |
.77% |
.84% |
1.53% F |
1.05% |
|
Supplemental Data |
|
|
|
|
|
|
Net assets, end of period (000 omitted) |
$ 1,134,777 |
$ 861,539 |
$ 692,332 |
$ 417,761 |
$ 243,144 |
|
Portfolio turnover rate D |
60% |
119% |
108% |
228% |
201% |
|
A Total returns would have been lower if certain expenses had not been reduced during the applicable periods shown. B Calculated based on average shares outstanding during the period. C Fees and expenses of any underlying Fidelity Central Funds are not included in the Fund's expense ratio. The Fund indirectly bears its proportionate share of the expenses of any underlying Fidelity Central Funds. D Amount does not include the portfolio activity of any underlying Fidelity Central Funds. E Investment income per share reflects a large, non-recurring dividend which amounted to $.30 per share. Excluding this non-recurring dividend, the ratio of net investment income (loss) to average net assets would have been 1.35%. F Investment income per share reflects a large, non-recurring dividend which amounted to $.18 per share. Excluding this non-recurring dividend, the ratio of net investment income (loss) to average net assets would have been 1.25%. G Expense ratios reflect operating expenses of the Fund. Expenses before reductions do not reflect amounts reimbursed by the investment adviser or reductions from brokerage service arrangements or reductions from other expense offset arrangements and do not represent the amount paid by the Fund during periods when reimbursements or reductions occur. Expenses net of fee waivers reflect expenses after reimbursement by the investment adviser but prior to reductions from brokerage service arrangements or other expense offset arrangements. Expenses net of all reductions represent the net expenses paid by the Fund. H For the year ended February 29. I Amount represents less than $.01 per share. J Total distributions of $4.49 per share is comprised of distributions from net investment income of $1.547 and distributions from net realized gain of $2.947 per share. K Total distributions of $2.47 per share is comprised of distributions from net investment income of $.565 and distributions from net realized gain of $1.905 per share. |
See accompanying notes which are an integral part of the financial statements.
Annual Report
Notes to Financial Statements
For the period ended February 28, 2013
1. Organization.
Chemicals Portfolio (the Fund) is a non-diversified fund of Fidelity Select Portfolios (the Trust) and is authorized to issue an unlimited number of shares. The Trust is registered under the Investment Company Act of 1940, as amended (the 1940 Act), as an open-end management investment company organized as a Massachusetts business trust. The Fund invests primarily in securities of companies whose principal business activities fall within specific industries.
2. Investments in Fidelity Central Funds.
The Fund invests in Fidelity Central Funds, which are open-end investment companies available only to other investment companies and accounts managed by Fidelity Management & Research Company (FMR) and its affiliates. The Fund's Schedule of Investments lists each of the Fidelity Central Funds held as of period end, if any, as an investment of the Fund, but does not include the underlying holdings of each Fidelity Central Fund. As an Investing Fund, the Fund indirectly bears its proportionate share of the expenses of the underlying Fidelity Central Funds.
The Money Market Central Funds seek preservation of capital and current income and are managed by Fidelity Investments Money Management, Inc. (FIMM), an affiliate of FMR.
A complete unaudited list of holdings for each Fidelity Central Fund is available upon request or at the Securities and Exchange Commission (the SEC) website at www.sec.gov. In addition, the financial statements of the Fidelity Central Funds, which are not covered by the Fund's Report of Independent Registered Public Accounting Firm, are available on the SEC website or upon request.
3. Significant Accounting Policies.
The financial statements have been prepared in conformity with accounting principles generally accepted in the United States of America (GAAP), which require management to make certain estimates and assumptions at the date of the financial statements. Actual results could differ from those estimates. Subsequent events, if any, through the date that the financial statements were issued have been evaluated in the preparation of the financial statements. The following summarizes the significant accounting policies of the Fund:
Investment Valuation. Investments are valued as of 4:00 p.m. Eastern time on the last calendar day of the period. In accordance with valuation policies and procedures approved by the Board of Trustees (the Board), the Fund attempts to obtain prices from one or more third party pricing vendors or brokers to value its investments. When current market prices, quotations or currency exchange rates are not readily available or reliable, investments will be fair valued in good faith by the FMR Fair Value Committee (the Committee), in accordance with procedures adopted by the Fund's Board. Factors used in determining fair value vary by investment type and may include market or investment specific events, changes in interest rates and credit quality. The frequency with which these procedures are used cannot be predicted and they may be utilized to a significant extent. The Committee oversees the Fund's valuation policies and procedures and is responsible for approving and reporting to the Board all fair value determinations.
The Fund categorizes the inputs to valuation techniques used to value its investments into a disclosure hierarchy consisting of three levels as shown below:
Level 1 - quoted prices in active markets for identical investments
Level 2 - other significant observable inputs (including quoted prices for similar investments, interest rates, prepayment speeds, etc.)
Level 3 - unobservable inputs (including the Fund's own assumptions based on the best information available)
Valuation techniques used to value the Fund's investments by major category are as follows:
Equity securities, including restricted securities, for which market quotations are readily available, are valued at the last reported sale price or official closing price as reported by a third party pricing vendor on the primary market or exchange on which they are traded and are categorized as Level 1 in the hierarchy. In the event there were no sales during the day or closing prices are not available, securities are valued at the last quoted bid price or may be valued using the last available price and are generally categorized as Level 2 in the hierarchy. For foreign equity securities, when significant market or security specific events arise, comparisons to the valuation of American Depositary Receipts (ADRs), futures contracts, Exchange-Traded Funds (ETFs) and certain indexes as well as quoted prices for similar securities are used and are categorized as Level 2 in the hierarchy. Utilizing these techniques may result in transfers between Level 1 and Level 2.
Debt securities, including restricted securities, are valued based on evaluated prices received from third party pricing vendors or from brokers who make markets in such securities. For corporate bonds, pricing vendors utilize matrix pricing which considers yield or price of bonds of comparable quality, coupon, maturity and type as well as broker-supplied prices. When independent prices are unavailable or unreliable, debt securities may be valued utilizing pricing methodologies which consider similar factors that would be used by third party pricing vendors. Debt securities are generally categorized as Level 2 in the hierarchy but may be Level 3 depending on the circumstances.
Annual Report
Notes to Financial Statements - continued
3. Significant Accounting Policies - continued
Investment Valuation - continued
Investments in open-end mutual funds, including the Fidelity Central Funds, are valued at their closing net asset value (NAV) each business day and are categorized as Level 1 in the hierarchy.
Changes in valuation techniques may result in transfers in or out of an assigned level within the disclosure hierarchy. The aggregate value of investments by input level, as of February 28, 2013, is included at the end of the Fund's Schedule of Investments.
Foreign Currency. The Fund may use foreign currency contracts to facilitate transactions in foreign-denominated securities. Gains and losses from these transactions may arise from changes in the value of the foreign currency or if the counterparties do not perform under the contracts' terms.
Foreign-denominated assets, including investment securities, and liabilities are translated into U.S. dollars at the exchange rates at period end. Purchases and sales of investment securities, income and dividends received and expenses denominated in foreign currencies are translated into U.S. dollars at the exchange rate in effect on the transaction date.
The effects of exchange rate fluctuations on investments are included with the net realized and unrealized gain (loss) on investment securities. Other foreign currency transactions resulting in realized and unrealized gain (loss) are disclosed separately.
Investment Transactions and Income. For financial reporting purposes, the Fund's investment holdings and NAV include trades executed through the end of the last business day of the period. The NAV per share for processing shareholder transactions is calculated as of the close of business of the New York Stock Exchange (NYSE), normally 4:00 p.m. Eastern time and includes trades executed through the end of the prior business day. Gains and losses on securities sold are determined on the basis of identified cost. Dividend income is recorded on the ex-dividend date, except for certain dividends from foreign securities where the ex-dividend date may have passed, which are recorded as soon as the Fund is informed of the ex-dividend date. Non-cash dividends included in dividend income, if any, are recorded at the fair market value of the securities received. Distributions received on securities that represent a return of capital or capital gain are recorded as a reduction of cost of investments and/or as a realized gain. The Fund estimates the components of distributions received that may be considered return of capital distributions or capital gain distributions. Large, non-recurring dividends recognized by the Fund are presented separately on the Statement of Operations as "Special Dividends" and the impact of these dividends is presented in the Financial Highlights. Interest income and distributions from the Fidelity Central Funds are accrued as earned. Interest income includes coupon interest and amortization of premium and accretion of discount on debt securities. Investment income is recorded net of foreign taxes withheld where recovery of such taxes is uncertain.
Expenses. Expenses directly attributable to a fund are charged to that fund. Expenses attributable to more than one fund are allocated among the respective funds on the basis of relative net assets or other appropriate methods. Expense estimates are accrued in the period to which they relate and adjustments are made when actual amounts are known.
Income Tax Information and Distributions to Shareholders. Each year, the Fund intends to qualify as a regulated investment company under Subchapter M of the Internal Revenue Code, including distributing substantially all of its taxable income and realized gains. As a result, no provision for income taxes is required. As of February 28, 2013, the Fund did not have any unrecognized tax benefits in the financial statements; nor is the Fund aware of any tax positions for which it is reasonably possible that the total amounts of unrecognized tax benefits will significantly change in the next twelve months. The Fund files a U.S. federal tax return, in addition to state and local tax returns as required. A fund's federal income tax returns are subject to examination by the Internal Revenue Service (IRS) for a period of three fiscal years after they are filed. State and local tax returns may be subject to examination for an additional fiscal year depending on the jurisdiction. Foreign taxes are provided for based on the Fund's understanding of the tax rules and rates that exist in the foreign markets in which it invests.
Distributions are declared and recorded on the ex-dividend date. Income and capital gain distributions are determined in accordance with income tax regulations, which may differ from GAAP. In addition, the Fund claimed a portion of the payment made to redeeming shareholders as a distribution for income tax purposes.
Capital accounts within the financial statements are adjusted for permanent book-tax differences. These adjustments have no impact on net assets or the results of operations. Temporary book-tax differences will reverse in a subsequent period.
Book-tax differences are primarily due to foreign currency transactions, partnerships, market discount, deferred trustees compensation, and losses deferred due to wash sales and excise tax regulations.
The federal tax cost of investment securities and unrealized appreciation (depreciation) as of period end were as follows:
|
Gross unrealized appreciation |
$ 233,666,585 |
|
Gross unrealized depreciation |
(17,542,226) |
|
Net unrealized appreciation (depreciation) on securities and other investments |
$ 216,124,359 |
|
|
|
|
Tax Cost |
$ 935,669,509 |
Annual Report
3. Significant Accounting Policies - continued
Income Tax Information and Distributions to Shareholders - continued
The tax-based components of distributable earnings as of period end were as follows:
|
Undistributed ordinary income |
$ 3,630,515 |
|
Undistributed long-term capital gain |
$ 13,770,272 |
|
Net unrealized appreciation (depreciation) |
$ 216,107,633 |
The tax character of distributions paid was as follows:
|
|
February 28, 2013 |
February 29, 2012 |
|
Ordinary Income |
$ 17,990,233 |
$ 4,429,446 |
|
Long-term Capital Gains |
15,251,351 |
- |
|
Total |
$ 33,241,584 |
$ 4,429,446 |
Trading (Redemption) Fees. Shares held by investors in the Fund less than 30 days are subject to a redemption fee equal to .75% of the net asset value of shares redeemed. All redemption fees, which reduce the proceeds of the shareholder redemption, are retained by the Fund and accounted for as an addition to paid in capital.
4. Purchases and Sales of Investments.
Purchases and sales of securities, other than short-term securities, aggregated $664,553,332 and $514,556,678, respectively.
5. Fees and Other Transactions with Affiliates.
Management Fee. FMR and its affiliates provide the Fund with investment management related services for which the Fund pays a monthly management fee. The management fee is the sum of an individual fund fee rate that is based on an annual rate of .30% of the Fund's average net assets and an annualized group fee rate that averaged .26% during the period. The group fee rate is based upon the average net assets of all the mutual funds advised by FMR. The group fee rate decreases as assets under management increase and increases as assets under management decrease. For the period, the total annual management fee rate was .56% of the Fund's average net assets.
Transfer Agent Fees. Fidelity Investments Institutional Operations Company, Inc. (FIIOC), an affiliate of FMR, is the Fund's transfer, dividend disbursing and shareholder servicing agent. FIIOC receives account fees and asset-based fees that vary according to account size and type of account. FIIOC pays for typesetting, printing and mailing of shareholder reports, except proxy statements. For the period, the transfer agent fees were equivalent to an annual rate of .22% of average net assets.
Accounting and Security Lending Fees. Fidelity Service Company, Inc. (FSC), an affiliate of FMR, maintains the Fund's accounting records. The accounting fee is based on the level of average net assets for each month. Under a separate contract, FSC administers the security lending program. The security lending fee is based on the number and duration of lending transactions.
Brokerage Commissions. The Fund placed a portion of its portfolio transactions with brokerage firms which are affiliates of the investment adviser. The commissions paid to these affiliated firms were $10,361 for the period.
6. Committed Line of Credit.
The Fund participates with other funds managed by FMR or an affiliate in a $4.25 billion credit facility (the "line of credit") to be utilized for temporary or emergency purposes to fund shareholder redemptions or for other short-term liquidity purposes. The Fund has agreed to pay commitment fees on its pro-rata portion of the line of credit, which amounted to $2,234 and is reflected in Miscellaneous expenses on the Statement of Operations. During the period, there were no borrowings on this line of credit.
7. Security Lending.
The Fund lends portfolio securities through a lending agent from time to time in order to earn additional income. For equity securities, a lending agent is used and may loan securities to certain qualified borrowers, including Fidelity Capital Markets (FCM), a broker-dealer affiliated with the Fund. On the settlement date of the loan, the Fund receives collateral (in the form of U.S. Treasury obligations, letters of credit and/or cash) against the loaned securities and maintains collateral in an amount not less than 100% of the market value of the loaned securities during the period of the loan. The market value of the loaned securities is determined at the close of business of the Fund and any additional required collateral is delivered to the Fund
Annual Report
Notes to Financial Statements - continued
7. Security Lending - continued
on the next business day. If the borrower defaults on its obligation to return the securities loaned because of insolvency or other reasons, a fund could experience delays and costs in recovering the securities loaned or in gaining access to the collateral. Any cash collateral received is invested in the Fidelity Securities Lending Cash Central Fund. The value of loaned securities and cash collateral at period end are disclosed on the Fund's Statement of Assets and Liabilities. Security lending income represents the income earned on investing cash collateral, less rebates paid to borrowers and any lending agent fees associated with the loan, plus any premium payments received for lending certain types of securities. Security lending income is presented in the Statement of Operations as a component of income from Fidelity Central Funds. Total security lending income during the period amounted to $305,709. During the period, there were no securities loaned to FCM.
8. Expense Reductions.
Many of the brokers with whom FMR places trades on behalf of the Fund provided services to the Fund in addition to trade execution. These services included payments of certain expenses on behalf of the Fund totaling $130,735 for the period. In addition, through arrangements with the Fund's custodian, credits realized as a result of uninvested cash balances were used to reduce the Fund's expenses. During the period, these credits reduced the Fund's custody expenses by $69.
In addition, FMR reimbursed a portion of the Fund's operating expenses during the period in the amount of $1,179.
9. Other.
The Fund's organizational documents provide former and current trustees and officers with a limited indemnification against liabilities arising in connection with the performance of their duties to the Fund. In the normal course of business, the Fund may also enter into contracts that provide general indemnifications. The Fund's maximum exposure under these arrangements is unknown as this would be dependent on future claims that may be made against the Fund. The risk of material loss from such claims is considered remote.
Annual Report
Performance: The Bottom Line
Average annual total return reflects the change in the value of an investment, assuming reinvestment of the class' distributions from dividend income and capital gains (the profits earned upon the sale of securities that have grown in value, if any) and assuming a constant rate of performance each year. The $10,000 table and the fund's returns do not reflect the deduction of taxes that a shareholder would pay on fund distributions or the redemption of fund shares. During periods of reimbursement by Fidelity, a fund's total return will be greater than it would be had the reimbursement not occurred. How a fund did yesterday is no guarantee of how it will do tomorrow.
Average Annual Total Returns
|
Periods ended February 28, 2013 |
Past 1 |
Past 5 |
Past 10 |
|
Gold Portfolio |
-33.16% |
-4.93% |
9.57% |
$10,000 Over 10 Years
Let's say hypothetically that $10,000 was invested in Gold Portfolio, a class of the fund, on February 28, 2003. The chart shows how the value of your investment would have changed, and also shows how the S&P 500 Index performed over the same period.
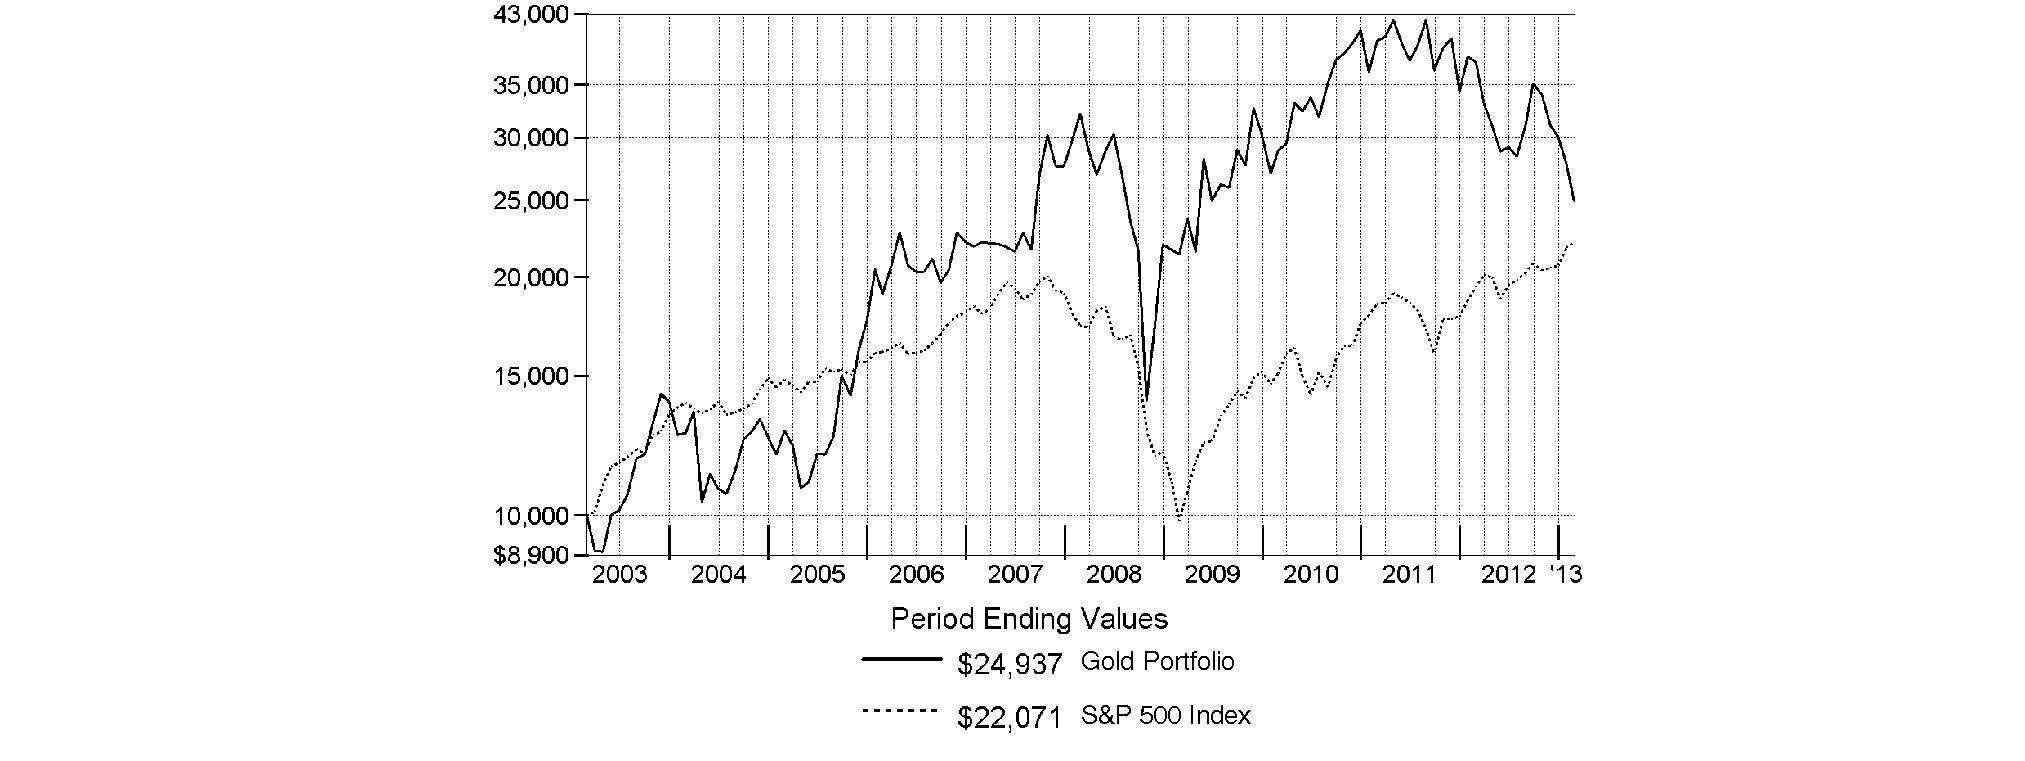
Annual Report
Gold Portfolio
Management's Discussion of Fund Performance
Market Recap: U.S. stocks posted solid gains for the year ending February 28, 2013, sparked by a late-period rally that pushed major equity benchmarks to multiyear highs. Improvement in the global economy and more monetary stimulus from the U.S. Federal Reserve kept markets on the upswing for much of the year, shrugging off an early decline brought on by debt woes in Europe, and another dip later in the period amid Congressional gridlock on the federal budget. Renewed optimism over employment, the housing market, corporate earnings and record dividends made stocks a favorite with investors during the 12 months, which helped push the broad-based S&P 500® Index across the milestone 1,500 mark at the end of January. The S&P 500® finished the period up 13.46%. Seven of the 10 major market sectors tracked by MSCI U.S. IMI 25-50 classifications produced double-digit gains, led by health care and financials, while information technology, energy and materials trailed the broad equity market with only modest advances.
Comments from S. Joseph Wickwire, II, Portfolio Manager of Gold Portfolio: For the year, the fund's Retail Class shares returned -33.16%, lagging its industry benchmark, the S&P® Global BMI Gold Capped Index, which returned -32.73%, and the S&P 500®. Gold and gold stocks were hard hit during the period, due in part to fluctuating concern about the robustness of the U.S. economy and the U.S. dollar in a world where Europe and China were struggling economically. The fund was hurt by our overweighting, on average, in Premier Gold Mines, Avion Gold and Rainy River Resources, as these companies struggled in a difficult environment. Little-to-no ownership of China's Zijin Mining Group, Turkey's Koza Altin Isletmeleri and Canada's Nevsun Resources hurt, as these benchmark components outperformed. All three were not held at period end. Currency fluctuations also hindered performance, given the fund's investments in foreign stocks. A good balance between stock picking in gold stocks, an out-of-benchmark stake in gold bullion and a small allocation to silver bullion - no longer held - aided relative performance. Underweighting some poor-performing stocks helped, including Compania de Minas Buenaventura and Gabriel Resources, as did not owning index component Jaguar Mining. Stakes in Agnico-Eagle Mines and Randgold Resources proved beneficial.
The views expressed above reflect those of the portfolio manager(s) only through the end of the period as stated on the cover of this report and do not necessarily represent the views of Fidelity or any other person in the Fidelity organization. Any such views are subject to change at any time based upon market or other conditions and Fidelity disclaims any responsibility to update such views. These views may not be relied on as investment advice and, because investment decisions for a Fidelity fund are based on numerous factors, may not be relied on as an indication of trading intent on behalf of any Fidelity fund.
Annual Report
Gold Portfolio
Shareholder Expense Example
As a shareholder of the Fund, you incur two types of costs: (1) transaction costs, including sales charges (loads) on purchase payments or redemption proceeds, redemption fees and (2) ongoing costs, including management fees, distribution and/or service (12b-1) fees and other Fund expenses. This Example is intended to help you understand your ongoing costs (in dollars) of investing in the Fund and to compare these costs with the ongoing costs of investing in other mutual funds.
The Example is based on an investment of $1,000 invested at the beginning of the period and held for the entire period (September 1, 2012 to February 28, 2013).
Actual Expenses
The first line of the accompanying table for each class of the Fund provides information about actual account values and actual expenses. You may use the information in this line, together with the amount you invested, to estimate the expenses that you paid over the period. Simply divide your account value by $1,000.00 (for example, an $8,600 account value divided by $1,000.00 = 8.6), then multiply the result by the number in the first line for a class of the Fund under the heading entitled "Expenses Paid During Period" to estimate the expenses you paid on your account during this period. A small balance maintenance fee of $12.00 that is charged once a year may apply for certain accounts with a value of less than $2,000. This fee is not included in the table below. If it was, the estimate of expenses you paid during the period would be higher, and your ending account value lower, by this amount. In addition, the Fund, as a shareholder in the underlying Fidelity Central Funds, will indirectly bear its pro-rata share of the fees and expenses incurred by the underlying Fidelity Central Funds. These fees and expenses are not included in the Fund's annualized expense ratio used to calculate the expense estimate in the table below.
Hypothetical Example for Comparison Purposes
The second line of the accompanying table for each class of the Fund provides information about hypothetical account values and hypothetical expenses based on a Class' actual expense ratio and an assumed rate of return of 5% per year before expenses, which is not the Class' actual return. The hypothetical account values and expenses may not be used to estimate the actual ending account balance or expenses you paid for the period. You may use this information to compare the ongoing costs of investing in the Fund and other funds. To do so, compare this 5% hypothetical example with the 5% hypothetical examples that appear in the shareholder reports of the other funds. A small balance maintenance fee of $12.00 that is charged once a year may apply for certain accounts with a value of less than $2,000. This fee is not included in the table below. If it was, the estimate of expenses you paid during the period would be higher, and your ending account value lower, by this amount. In addition, the Fund, as a shareholder in the underlying Fidelity Central Funds, will indirectly bear its pro-rata share of the fees and expenses incurred by the underlying Fidelity Central Funds. These fees and expenses are not included in the Fund's annualized expense ratio used to calculate the expense estimate in the table below.
Please note that the expenses shown in the table are meant to highlight your ongoing costs only and do not reflect any transaction costs. Therefore, the second line of the table is useful in comparing ongoing costs only, and will not help you determine the relative total costs of owning different funds. In addition, if these transactional costs were included, your costs would have been higher.
|
|
Annualized |
Beginning |
Ending |
Expenses Paid |
|
Class A |
1.17% |
|
|
|
|
Actual |
|
$ 1,000.00 |
$ 799.60 |
$ 5.22 |
|
HypotheticalA |
|
$ 1,000.00 |
$ 1,018.99 |
$ 5.86 |
|
Class T |
1.44% |
|
|
|
|
Actual |
|
$ 1,000.00 |
$ 798.70 |
$ 6.42 |
|
HypotheticalA |
|
$ 1,000.00 |
$ 1,017.65 |
$ 7.20 |
|
Class B |
1.92% |
|
|
|
|
Actual |
|
$ 1,000.00 |
$ 796.50 |
$ 8.55 |
|
HypotheticalA |
|
$ 1,000.00 |
$ 1,015.27 |
$ 9.59 |
|
Class C |
1.91% |
|
|
|
|
Actual |
|
$ 1,000.00 |
$ 796.70 |
$ 8.51 |
|
HypotheticalA |
|
$ 1,000.00 |
$ 1,015.32 |
$ 9.54 |
|
Gold |
.92% |
|
|
|
|
Actual |
|
$ 1,000.00 |
$ 800.60 |
$ 4.11 |
|
HypotheticalA |
|
$ 1,000.00 |
$ 1,020.23 |
$ 4.61 |
|
Institutional Class |
.82% |
|
|
|
|
Actual |
|
$ 1,000.00 |
$ 801.10 |
$ 3.66 |
|
HypotheticalA |
|
$ 1,000.00 |
$ 1,020.73 |
$ 4.11 |
A 5% return per year before expenses
* Expenses are equal to each Class' annualized expense ratio, multiplied by the average account value over the period, multiplied by 181/365 (to reflect the one-half year period).
Annual Report
Gold Portfolio
Consolidated Investment Changes (Unaudited)
|
Top Ten Holdings as of February 28, 2013 |
||
|
|
% of fund's |
% of fund's net assets |
|
Barrick Gold Corp. |
12.6 |
11.1 |
|
Goldcorp, Inc. |
12.1 |
13.0 |
|
Newcrest Mining Ltd. |
7.7 |
6.9 |
|
Yamana Gold, Inc. |
5.3 |
4.5 |
|
Randgold Resources Ltd. sponsored ADR |
4.5 |
4.0 |
|
Gold Bullion |
4.4 |
3.7 |
|
Kinross Gold Corp. |
4.3 |
3.6 |
|
AngloGold Ashanti Ltd. sponsored ADR |
4.2 |
4.3 |
|
Newmont Mining Corp. |
4.0 |
8.1 |
|
Eldorado Gold Corp. |
3.6 |
3.6 |
|
|
62.7 |
|
|
Top Industries (% of fund's net assets) |
|||
|
As of February 28, 2013 |
|||
|
Gold |
94.3% |
|
 |
Commodities & Related Investments** |
4.4% |
|
|
Precious Metals & Minerals |
0.7% |
|
|
Diversified Metals & Mining |
0.2% |
|
|
Coal & Consumable Fuels |
0.2% |
|
|
Steel |
0.1% |
|
|
All Others* |
0.1% |
|

|
As of August 31, 2012 |
|||
|
Gold |
94.7% |
|
 |
Commodities & Related Investments** |
3.8% |
|
|
Precious Metals & Minerals |
0.7% |
|
|
Diversified Metals & Mining |
0.3% |
|
|
Coal & Consumable Fuels |
0.2% |
|
|
All Others* |
0.3% |
|

|
* Includes short-term investments and net other assets. |
|
** Includes gold bullion and/or silver bullion. |
|
Geographic Diversification (% of fund's net assets) |
|||
|
As of February 28, 2013 |
|||
|
Canada |
62.2% |
|
|
Australia |
11.4% |
|
|
United States of America |
11.1% |
|
|
South Africa |
8.5% |
|
|
Bailiwick of Jersey |
5.7% |
|
|
Bermuda |
0.5% |
|
|
Cayman Islands |
0.3% |
|
 |
United Kingdom |
0.3% |
|
|
Peru |
0.0% |
|
|
Other |
0.0% |
|

|
Percentages are based on country or territory of incorporation and are adjusted for the effect of futures contracts, if applicable. |
|
As of August 31, 2012 |
|||
|
Canada |
58.4% |
|
|
United States of America |
15.6% |
|
|
Australia |
9.9% |
|
|
South Africa |
8.8% |
|
|
Bailiwick of Jersey |
4.9% |
|
|
Peru |
1.2% |
|
|
United Kingdom |
0.6% |
|
|
China |
0.5% |
|
|
Bermuda |
0.1% |
|
|
Other |
0.0% |
|

|
Percentages are based on country or territory of incorporation and are adjusted for the effect of futures contracts, if applicable. |
Annual Report
Gold Portfolio
Consolidated Investments February 28, 2013
Showing Percentage of Net Assets
|
Common Stocks - 95.5% |
|||
|
Shares |
Value |
||
|
Australia - 11.4% |
|||
|
METALS & MINING - 11.4% |
|||
|
Gold - 11.4% |
|||
|
ABM Resources NL (a) |
2,300,000 |
$ 91,624 |
|
|
Alkane Resources Ltd. |
195,000 |
122,497 |
|
|
Ampella Mining Ltd. (a)(d) |
2,785,000 |
853,421 |
|
|
Beadell Resources Ltd. (a) |
9,968,618 |
8,247,780 |
|
|
Evolution Mining Ltd. (a) |
2,566,395 |
3,565,164 |
|
|
Gold One International Ltd. (a) |
90,277 |
25,820 |
|
|
Gryphon Minerals Ltd. (a) |
5,590,010 |
1,969,921 |
|
|
Intrepid Mines Ltd.: |
|
|
|
|
(Australia) (a) |
9,209,798 |
2,022,580 |
|
|
(Canada) (a) |
320,000 |
68,267 |
|
|
Kingsgate Consolidated NL (d) |
1,843,274 |
6,740,468 |
|
|
Medusa Mining Ltd. |
2,576,085 |
11,262,144 |
|
|
Newcrest Mining Ltd. |
8,706,620 |
201,523,923 |
|
|
Papillon Resources Ltd. (a)(d) |
1,964,068 |
2,567,932 |
|
|
Perseus Mining Ltd.: |
|
|
|
|
(Australia) (a) |
6,340,134 |
10,426,569 |
|
|
(Canada) (a) |
1,300,000 |
2,029,576 |
|
|
Ramelius Resources Ltd. (a)(d) |
980,000 |
320,327 |
|
|
Red 5 Ltd. (a) |
1,326,000 |
1,232,543 |
|
|
Regis Resources Ltd. (a) |
3,944,294 |
17,928,601 |
|
|
Resolute Mining Ltd. |
2,988,261 |
4,151,209 |
|
|
Saracen Mineral Holdings Ltd. (a) |
2,992,488 |
1,085,120 |
|
|
Silver Lake Resources Ltd. (a) |
4,547,781 |
10,173,275 |
|
|
St Barbara Ltd. (a) |
6,018,377 |
8,114,662 |
|
|
Tanami Gold NL (a)(d) |
130,000 |
29,877 |
|
|
Tanami Gold NL rights 3/12/13 (a)(d) |
162,500 |
2,324 |
|
|
Troy Resources NL |
195,000 |
587,589 |
|
|
Troy Resources NL (f) |
734,826 |
2,258,811 |
|
|
|
297,402,024 |
||
|
Bailiwick of Jersey - 5.7% |
|||
|
METALS & MINING - 5.7% |
|||
|
Gold - 5.7% |
|||
|
Centamin PLC (a) |
9,471,900 |
7,716,339 |
|
|
Lydian International Ltd. (a) |
1,525,300 |
2,336,944 |
|
|
Polyus Gold International Ltd. |
422,400 |
1,406,560 |
|
|
Polyus Gold International Ltd. sponsored GDR |
5,884,931 |
19,067,176 |
|
|
Randgold Resources Ltd. sponsored ADR |
1,424,595 |
118,056,188 |
|
|
|
148,583,207 |
||
|
Precious Metals & Minerals - 0.0% |
|||
|
Polymetal International PLC |
20,000 |
303,107 |
|
|
TOTAL METALS & MINING |
148,886,314 |
||
|
Bermuda - 0.5% |
|||
|
METALS & MINING - 0.5% |
|||
|
Gold - 0.4% |
|||
|
Continental Gold Ltd. (a) |
1,505,100 |
9,194,793 |
|
|
|
|||
|
Shares |
Value |
||
|
Steel - 0.1% |
|||
|
African Minerals Ltd. (a)(d) |
585,800 |
$ 2,521,652 |
|
|
TOTAL METALS & MINING |
11,716,445 |
||
|
Canada - 62.2% |
|||
|
METALS & MINING - 62.2% |
|||
|
Diversified Metals & Mining - 0.2% |
|||
|
East Asia Minerals Corp. (a) |
5,000 |
1,285 |
|
|
Eastmain Resources, Inc. (a) |
10,000 |
6,885 |
|
|
Kimber Resources, Inc. (a)(e) |
16,100 |
3,981 |
|
|
Kimber Resources, Inc. (a)(e)(f) |
5,577,500 |
1,379,164 |
|
|
NovaCopper, Inc. (a)(d) |
488,333 |
928,129 |
|
|
Sabina Gold & Silver Corp. (a) |
600,000 |
1,058,909 |
|
|
Turquoise Hill Resources Ltd. (a) |
285,000 |
1,821,236 |
|
|
|
5,199,589 |
||
|
Gold - 61.4% |
|||
|
Agnico-Eagle Mines Ltd. (Canada) (d) |
1,940,600 |
77,830,997 |
|
|
Alacer Gold Corp. (a) |
3,409,063 |
11,702,384 |
|
|
Alamos Gold, Inc. |
1,829,700 |
25,637,978 |
|
|
Americas Bullion Royalty Corp. (a) |
5,000 |
1,479 |
|
|
Argonaut Gold, Inc. (a) |
2,110,962 |
16,580,647 |
|
|
ATAC Resources Ltd. (a) |
67,200 |
71,680 |
|
|
AuRico Gold, Inc. (a) |
20,000 |
125,091 |
|
|
B2Gold Corp. (a) |
11,848,648 |
35,847,546 |
|
|
Banro Corp. (a) |
3,836,482 |
8,519,315 |
|
|
Barrick Gold Corp. (d) |
10,840,619 |
328,713,845 |
|
|
Belo Sun Mining Corp. (a)(d) |
5,680,400 |
5,838,763 |
|
|
Canaco Resources, Inc. (a)(f) |
121,100 |
55,779 |
|
|
Centerra Gold, Inc. |
2,047,200 |
13,300,596 |
|
|
Claude Resources, Inc. (a) |
320,000 |
127,224 |
|
|
Colossus Minerals, Inc. (a) |
3,087,200 |
8,621,708 |
|
|
Detour Gold Corp. (a) |
1,476,000 |
28,825,833 |
|
|
Detour Gold Corp. (a)(f) |
785,900 |
15,348,389 |
|
|
Eldorado Gold Corp. |
9,545,208 |
94,225,666 |
|
|
Exeter Resource Corp. (a) |
272,300 |
319,499 |
|
|
Franco-Nevada Corp. (d) |
1,612,500 |
77,994,182 |
|
|
Gabriel Resources Ltd. (a) |
950,600 |
2,276,831 |
|
|
Gold Canyon Resources, Inc. (a) |
800,000 |
360,727 |
|
|
Goldcorp, Inc. |
9,664,100 |
315,436,224 |
|
|
Golden Queen Mining Co. Ltd. (a) |
15,000 |
25,309 |
|
|
GoldQuest Mining Corp. (a) |
2,318,500 |
966,744 |
|
|
Gran Colombia Gold Corp. (a)(d) |
1,765,000 |
385,091 |
|
|
Guyana Goldfields, Inc. (a)(d) |
2,243,700 |
6,984,026 |
|
|
Guyana Goldfields, Inc. (a)(f) |
155,000 |
482,473 |
|
|
IAMGOLD Corp. |
4,024,500 |
27,122,691 |
|
|
International Minerals Corp. (Switzerland) |
15,000 |
61,133 |
|
|
International Tower Hill Mines Ltd. (a) |
546,700 |
906,528 |
|
|
Kinross Gold Corp. |
14,516,091 |
110,498,244 |
|
|
Kinross Gold Corp. warrants 9/17/14 (a) |
1,192,793 |
231,330 |
|
|
Kirkland Lake Gold, Inc. (a) |
791,000 |
4,694,225 |
|
|
Lake Shore Gold Corp. (a)(d) |
4,056,600 |
2,281,530 |
|
|
Common Stocks - continued |
|||
|
Shares |
Value |
||
|
Canada - continued |
|||
|
METALS & MINING - CONTINUED |
|||
|
Gold - continued |
|||
|
Marengo Mining Canada Ltd. (a) |
560,000 |
$ 77,222 |
|
|
Midas Gold Corp. (a) |
80,000 |
107,830 |
|
|
New Gold, Inc. (a) |
7,686,355 |
68,571,603 |
|
|
NGEx Resources, Inc. (a) |
50,000 |
145,455 |
|
|
Novagold Resources, Inc. (a)(d) |
2,930,000 |
11,620,558 |
|
|
OceanaGold Corp. (a) |
3,262,300 |
7,655,531 |
|
|
Orezone Gold Corp. (a) |
372,100 |
440,206 |
|
|
Orvana Minerals Corp. (a) |
10,000 |
9,988 |
|
|
Osisko Mining Corp. (a) |
3,972,631 |
22,997,922 |
|
|
Osisko Mining Corp. (a)(f) |
3,000,000 |
17,367,273 |
|
|
Pilot Gold, Inc. (a)(d) |
668,150 |
1,192,142 |
|
|
Premier Gold Mines Ltd. (a) |
4,996,322 |
13,711,119 |
|
|
Pretium Resources, Inc. (a) |
430,938 |
3,322,140 |
|
|
Pretium Resources, Inc. (a)(f) |
225,000 |
1,734,545 |
|
|
Pretium Resources, Inc. (a)(g) |
225,000 |
1,734,545 |
|
|
Primero Mining Corp. (a) |
911,200 |
5,009,943 |
|
|
Probe Mines Ltd. (a) |
85,000 |
140,121 |
|
|
Rainy River Resources Ltd. (a) |
3,056,400 |
8,328,227 |
|
|
Richmont Mines, Inc. (a) |
220,300 |
578,922 |
|
|
Romarco Minerals, Inc. (a) |
12,632,600 |
10,044,831 |
|
|
Romarco Minerals, Inc. (a)(f) |
5,900,000 |
4,691,394 |
|
|
Rubicon Minerals Corp. (a) |
4,568,502 |
9,967,641 |
|
|
San Gold Corp. (a) |
2,006,900 |
554,634 |
|
|
Sandstorm Gold Ltd. (a) |
30,000 |
280,727 |
|
|
Seabridge Gold, Inc. (a)(d) |
601,905 |
7,493,716 |
|
|
SEMAFO, Inc. (d) |
4,406,900 |
12,136,336 |
|
|
St. Andrew Goldfields Ltd. (a) |
440,000 |
192,000 |
|
|
Sulliden Gold Corp. Ltd. (a)(d) |
3,070,400 |
2,560,527 |
|
|
Teranga Gold Corp. (a) |
35,000 |
47,515 |
|
|
Teranga Gold Corp. CDI unit (a) |
3,430,974 |
4,906,396 |
|
|
Torex Gold Resources, Inc. (a) |
11,936,400 |
21,065,937 |
|
|
Volta Resources, Inc. (a) |
55,000 |
16,000 |
|
|
Yamana Gold, Inc. |
9,275,100 |
136,529,472 |
|
|
|
1,597,634,125 |
||
|
Precious Metals & Minerals - 0.6% |
|||
|
Chesapeake Gold Corp. (a) |
6,000 |
45,207 |
|
|
Dalradian Resources, Inc. (a) |
51,000 |
48,960 |
|
|
Gold Standard Ventures Corp. (a) |
415,400 |
410,868 |
|
|
Kaminak Gold Corp. Class A (a) |
20,000 |
21,333 |
|
|
MAG Silver Corp. (a) |
35,400 |
336,751 |
|
|
Pan American Silver Corp. |
88,387 |
1,457,501 |
|
|
Pan American Silver Corp. warrants 12/7/14 (a) |
232,460 |
65,048 |
|
|
Silver Wheaton Corp. |
39,000 |
1,236,655 |
|
|
|
|||
|
Shares |
Value |
||
|
Tahoe Resources, Inc. (a) |
736,300 |
$ 11,131,071 |
|
|
Wildcat Silver Corp. (a) |
75,200 |
50,316 |
|
|
|
14,803,710 |
||
|
TOTAL METALS & MINING |
1,617,637,424 |
||
|
Cayman Islands - 0.3% |
|||
|
METALS & MINING - 0.3% |
|||
|
Gold - 0.3% |
|||
|
Endeavour Mining Corp. (a) |
5,288,400 |
8,410,159 |
|
|
Netherlands - 0.0% |
|||
|
METALS & MINING - 0.0% |
|||
|
Gold - 0.0% |
|||
|
Nord Gold NV GDR (Reg. S) (a) |
15,000 |
63,000 |
|
|
Peru - 0.0% |
|||
|
METALS & MINING - 0.0% |
|||
|
Gold - 0.0% |
|||
|
Compania de Minas Buenaventura SA sponsored ADR |
5,000 |
128,100 |
|
|
South Africa - 8.5% |
|||
|
METALS & MINING - 8.5% |
|||
|
Gold - 8.5% |
|||
|
AngloGold Ashanti Ltd. sponsored ADR |
4,487,152 |
108,768,564 |
|
|
Gold Fields Ltd. |
55,000 |
450,798 |
|
|
Gold Fields Ltd. sponsored ADR |
8,462,226 |
70,151,854 |
|
|
Harmony Gold Mining Co. Ltd. |
1,484,000 |
9,301,172 |
|
|
Harmony Gold Mining Co. Ltd. sponsored ADR (d) |
3,347,300 |
20,686,314 |
|
|
Sibanye Gold Ltd. ADR (a) |
2,141,806 |
12,122,622 |
|
|
|
221,481,324 |
||
|
United Kingdom - 0.3% |
|||
|
METALS & MINING - 0.3% |
|||
|
Gold - 0.3% |
|||
|
Patagonia Gold PLC (a) |
260,000 |
57,193 |
|
|
Petropavlovsk PLC |
1,649,228 |
7,550,919 |
|
|
|
7,608,112 |
||
|
United States of America - 6.6% |
|||
|
METALS & MINING - 6.4% |
|||
|
Gold - 6.3% |
|||
|
Allied Nevada Gold Corp. (a) |
1,326,900 |
24,282,270 |
|
|
Allied Nevada Gold Corp. (Canada) (a) |
45,000 |
819,055 |
|
|
Gold Resource Corp. (d) |
40,000 |
524,000 |
|
|
Newmont Mining Corp. |
2,576,450 |
103,805,171 |
|
|
Royal Gold, Inc. |
526,113 |
34,481,446 |
|
|
|
163,911,942 |
||
|
Common Stocks - continued |
|||
|
Shares |
Value |
||
|
United States of America - continued |
|||
|
METALS & MINING - CONTINUED |
|||
|
Precious Metals & Minerals - 0.1% |
|||
|
McEwen Mining, Inc. (a) |
943,810 |
$ 2,293,458 |
|
|
TOTAL METALS & MINING |
166,205,400 |
||
|
OIL, GAS & CONSUMABLE FUELS - 0.2% |
|||
|
Coal & Consumable Fuels - 0.2% |
|||
|
Alpha Natural Resources, Inc. (a) |
320,000 |
2,553,600 |
|
|
Peabody Energy Corp. |
122,700 |
2,645,412 |
|
|
|
5,199,012 |
||
|
TOTAL UNITED STATES OF AMERICA |
171,404,412 |
||
|
TOTAL COMMON STOCKS (Cost $2,751,166,563) |
|
||
|
Commodities - 4.4% |
|||
|
Troy Ounces |
|
||
|
Gold Bullion (a) |
73,500 |
|
|
|
Money Market Funds - 16.4% |
|||
|
Shares |
|
||
|
Fidelity Cash Central Fund, 0.16% (b) |
8,528,230 |
8,528,230 |
|
|
Fidelity Securities Lending Cash Central Fund, 0.16% (b)(c) |
417,856,605 |
417,856,605 |
|
|
TOTAL MONEY MARKET FUNDS (Cost $426,384,835) |
|
||
|
TOTAL INVESTMENT PORTFOLIO - 116.3% (Cost $3,280,595,648) |
3,027,280,079 |
||
|
NET OTHER ASSETS (LIABILITIES) - (16.3)% |
(424,674,380) |
||
|
NET ASSETS - 100% |
$ 2,602,605,699 |
||
|
Legend |
|
(a) Non-income producing |
|
(b) Affiliated fund that is generally available only to investment companies and other accounts managed by Fidelity Investments. The rate quoted is the annualized seven-day yield of the fund at period end. A complete unaudited listing of the fund's holdings as of its most recent quarter end is available upon request. In addition, each Fidelity Central Fund's financial statements, which are not covered by the Fund's Report of Independent Registered Public Accounting Firm, are available on the SEC's website or upon request. |
|
(c) Investment made with cash collateral received from securities on loan. |
|
(d) Security or a portion of the security is on loan at period end. |
|
(e) Affiliated company |
|
(f) Security exempt from registration under Rule 144A of the Securities Act of 1933. These securities may be resold in transactions exempt from registration, normally to qualified institutional buyers. At the end of the period, the value of these securities amounted to $43,317,828 or 1.7% of net assets. |
|
(g) Restricted securities - Investment in securities not registered under the Securities Act of 1933 (excluding 144A issues). At the end of the period, the value of restricted securities (excluding 144A issues) amounted to $1,734,545 or 0.1% of net assets. |
|
Additional information on each restricted holding is as follows: |
|
Security |
Acquisition Date |
Acquisition Cost |
|
Pretium Resources, Inc. |
3/31/11 |
$ 2,172,293 |
|
Affiliated Central Funds |
|
Information regarding fiscal year to date income earned by the Fund from investments in Fidelity Central Funds is as follows: |
|
Fund |
Income earned |
|
Fidelity Cash Central Fund |
$ 13,702 |
|
Fidelity Securities Lending Cash Central Fund |
777,921 |
|
Total |
$ 791,623 |
|
Consolidated Subsidiary |
|
|
Value, |
Purchases |
Sales |
Dividend |
Value, |
|
Fidelity Select Gold Cayman Ltd. |
$ 43,125,922 |
$ 121,246,969 |
$ 43,684,769 |
$ - |
$ 116,121,090 |
|
Other Affiliated Issuers |
|
An affiliated company is a company in which the Fund has ownership of at least 5% of the voting securities. Fiscal year to date transactions with companies which are or were affiliates are as follows: |
|
Affiliate |
Value, |
Purchases |
Sales |
Dividend |
Value, |
|
Kimber Resources, Inc. |
$ 16,919 |
$ - |
$ - |
$ - |
$ 3,981 |
|
Kimber Resources, Inc. (144A) |
6,128,712 |
- |
140,075 |
- |
1,379,164 |
|
Total |
$ 6,145,631 |
$ - |
$ 140,075 |
$ - |
$ 1,383,145 |
|
Other Information |
|
The following is a summary of the inputs used, as of February 28, 2013, involving the Fund's assets and liabilities carried at fair value. The inputs or methodology used for valuing securities may not be an indication of the risk associated with investing in those securities. For more information on valuation inputs, and their aggregation into the levels used in the table below, please refer to the Investment Valuation section in the accompanying Notes to Consolidated Financial Statements. |
|
Valuation Inputs at Reporting Date: |
||||
|
Description |
Total |
Level 1 |
Level 2 |
Level 3 |
|
Investments in Securities: |
||||
|
Common Stocks |
$ 2,484,737,314 |
$ 2,474,920,296 |
$ 9,817,018 |
$ - |
|
Commodities |
116,157,930 |
116,157,930 |
- |
- |
|
Money Market Funds |
426,384,835 |
426,384,835 |
- |
- |
|
Total Investments in Securities: |
$ 3,027,280,079 |
$ 3,017,463,061 |
$ 9,817,018 |
$ - |
See accompanying notes which are an integral part of the consolidated financial statements.
Annual Report
Gold Portfolio
Consolidated Financial Statements
Consolidated Statement of Assets and Liabilities
|
|
February 28, 2013 |
|
|
|
|
|
|
Assets |
|
|
|
Investment in securities, at value (including securities loaned of $392,112,195) - See accompanying schedule: Unaffiliated issuers (cost $2,746,227,320) |
$ 2,483,354,169 |
|
|
Fidelity Central Funds (cost $426,384,835) |
426,384,835 |
|
|
Commodities (cost $103,044,250) |
116,157,930 |
|
|
Other affiliated issuers (cost $4,939,243) |
1,383,145 |
|
|
Total Investments (cost $3,280,595,648) |
|
$ 3,027,280,079 |
|
Cash |
|
715 |
|
Foreign currency held at value (cost $82,684) |
|
82,684 |
|
Receivable for investments sold |
|
5,257,999 |
|
Delayed delivery |
|
192,461 |
|
Receivable for fund shares sold |
|
3,459,026 |
|
Dividends receivable |
|
2,194,055 |
|
Distributions receivable from Fidelity Central Funds |
|
70,162 |
|
Prepaid expenses |
|
4,607 |
|
Receivable from investment adviser for expense reductions |
|
11,638 |
|
Other receivables |
|
88,669 |
|
Total assets |
|
3,038,642,095 |
|
|
|
|
|
Liabilities |
|
|
|
Payable for investments purchased |
$ 11,615,091 |
|
|
Payable for fund shares redeemed |
4,157,824 |
|
|
Accrued management fee |
1,301,169 |
|
|
Distribution and service plan fees payable |
76,605 |
|
|
Other affiliated payables |
880,568 |
|
|
Other payables and accrued expenses |
148,534 |
|
|
Collateral on securities loaned, at value |
417,856,605 |
|
|
Total liabilities |
|
436,036,396 |
|
|
|
|
|
Net Assets |
|
$ 2,602,605,699 |
|
Net Assets consist of: |
|
|
|
Paid in capital |
|
$ 3,303,577,289 |
|
Accumulated net investment loss |
|
(129,693,237) |
|
Accumulated undistributed net realized gain (loss) on investments and foreign currency transactions |
|
(317,951,928) |
|
Net unrealized appreciation (depreciation) on investments and assets and liabilities in foreign currencies |
|
(253,326,425) |
|
Net Assets |
|
$ 2,602,605,699 |
Consolidated Statement of Assets and Liabilities -
continued
|
|
February 28, 2013 |
|
|
Calculation of Maximum Offering Price Class A: |
|
$ 30.25 |
|
|
|
|
|
Maximum offering price per share (100/94.25 of $30.25) |
|
$ 32.10 |
|
Class T: |
|
$ 29.95 |
|
|
|
|
|
Maximum offering price per share (100/96.50 of $29.95) |
|
$ 31.04 |
|
Class B: |
|
$ 29.27 |
|
|
|
|
|
Class C: |
|
$ 29.15 |
|
|
|
|
|
|
|
|
|
Gold: |
|
$ 30.72 |
|
|
|
|
|
Institutional Class: |
|
$ 30.69 |
A Redemption price per share is equal to net asset value less any applicable contingent deferred sales charge.
See accompanying notes which are an integral part of the consolidated financial statements.
Annual Report
Consolidated Statement of Operations
|
|
Year ended February 28, 2013 |
|
|
|
|
|
|
Investment Income |
|
|
|
Dividends |
|
$ 45,886,618 |
|
Interest |
|
111 |
|
Income from Fidelity Central Funds |
|
791,623 |
|
Total income |
|
46,678,352 |
|
|
|
|
|
Expenses |
|
|
|
Management fee |
$ 19,638,737 |
|
|
Transfer agent fees |
10,364,827 |
|
|
Distribution and service plan fees |
1,124,567 |
|
|
Accounting and security lending fees |
1,461,846 |
|
|
Custodian fees and expenses |
395,094 |
|
|
Independent trustees' compensation |
23,350 |
|
|
Registration fees |
243,295 |
|
|
Audit |
48,549 |
|
|
Legal |
13,865 |
|
|
Interest |
6,213 |
|
|
Miscellaneous |
39,252 |
|
|
Total expenses before reductions |
33,359,595 |
|
|
Expense reductions |
(515,705) |
32,843,890 |
|
Net investment income (loss) |
|
13,834,462 |
|
Realized and Unrealized Gain (Loss) Net realized gain (loss) on: |
|
|
|
Investments: |
|
|
|
Unaffiliated issuers |
(148,732,522) |
|
|
Other affiliated issuers |
(218,170) |
|
|
Commodities |
(522,357) |
|
|
Foreign currency transactions |
56,194 |
|
|
Total net realized gain (loss) |
|
(149,416,855) |
|
Change in net unrealized appreciation (depreciation) on: Investments |
(1,259,403,752) |
|
|
Assets and liabilities in foreign currencies |
(20,196) |
|
|
Commodities |
(3,691,935) |
|
|
Total change in net unrealized appreciation (depreciation) |
|
(1,263,115,883) |
|
Net gain (loss) |
|
(1,412,532,738) |
|
Net increase (decrease) in net assets resulting from operations |
|
$ (1,398,698,276) |
Consolidated Statement of Changes in Net Assets
|
|
Year ended |
Year ended |
|
Increase (Decrease) in Net Assets |
|
|
|
Operations |
|
|
|
Net investment income (loss) |
$ 13,834,462 |
$ (2,911,115) |
|
Net realized gain (loss) |
(149,416,855) |
69,474,908 |
|
Change in net unrealized appreciation (depreciation) |
(1,263,115,883) |
(363,910,363) |
|
Net increase (decrease) in net assets resulting from operations |
(1,398,698,276) |
(297,346,570) |
|
Distributions to shareholders from net realized gain |
- |
(238,750,097) |
|
Share transactions - net increase (decrease) |
(374,414,799) |
229,358,064 |
|
Redemption fees |
209,222 |
461,104 |
|
Total increase (decrease) in net assets |
(1,772,903,853) |
(306,277,499) |
|
|
|
|
|
Net Assets |
|
|
|
Beginning of period |
4,375,509,552 |
4,681,787,051 |
|
End of period (including accumulated net investment loss of $129,693,237 and accumulated net investment loss of $30,304,890, respectively) |
$ 2,602,605,699 |
$ 4,375,509,552 |
See accompanying notes which are an integral part of the consolidated financial statements.
Annual Report
Consolidated Financial Highlights - Class A
|
Years ended February 28, |
2013 |
2012 G |
2011 |
2010 |
2009 |
|
Selected Per-Share Data |
|
|
|
|
|
|
Net asset value, beginning of period |
$ 45.37 |
$ 50.92 |
$ 40.50 |
$ 30.45 |
$ 46.19 |
|
Income from Investment Operations |
|
|
|
|
|
|
Net investment income (loss) C |
.07 |
(.13) |
(.30) |
(.25) |
(.15) |
|
Net realized and unrealized gain (loss) |
(15.19) |
(2.83) |
15.28 |
11.00 |
(15.44) |
|
Total from investment operations |
(15.12) |
(2.96) |
14.98 |
10.75 |
(15.59) |
|
Distributions from net realized gain |
- |
(2.59) |
(4.57) |
(.71) |
(.17) |
|
Redemption fees added to paid in capital C |
- H |
- H |
.01 |
.01 |
.02 |
|
Net asset value, end of period |
$ 30.25 |
$ 45.37 |
$ 50.92 |
$ 40.50 |
$ 30.45 |
|
Total Return A, B |
(33.33)% |
(6.24)% |
36.99% |
35.19% |
(33.81)% |
|
Ratios to Average Net Assets D, F |
|
|
|
|
|
|
Expenses before reductions |
1.18% |
1.14% |
1.16% |
1.21% |
1.21% |
|
Expenses net of fee waivers, if any |
1.17% |
1.14% |
1.15% |
1.19% |
1.19% |
|
Expenses net of all reductions |
1.17% |
1.14% |
1.14% |
1.17% |
1.15% |
|
Net investment income (loss) |
.18% |
(.28)% |
(.63)% |
(.63)% |
(.45)% |
|
Supplemental Data |
|
|
|
|
|
|
Net assets, end of period (000 omitted) |
$ 101,202 |
$ 152,969 |
$ 149,178 |
$ 82,413 |
$ 39,144 |
|
Portfolio turnover rate E |
18% |
22% |
35% |
46% |
42% |
|
A Total returns would have been lower if certain expenses had not been reduced during the applicable periods shown. B Total returns do not include the effect of the sales charges. C Calculated based on average shares outstanding during the period. D Fees and expenses of any underlying Fidelity Central Funds are not included in the Fund's expense ratio. The Fund indirectly bears its proportionate share of the expenses of any underlying Fidelity Central Funds. E Amount does not include the portfolio activity of any underlying Fidelity Central Funds. F Expense ratios reflect operating expenses of the class. Expenses before reductions do not reflect amounts reimbursed by the investment adviser or reductions from brokerage service arrangements or reductions from other expense offset arrangements and do not represent the amount paid by the class during periods when reimbursements or reductions occur. Expenses net of fee waivers reflect expenses after reimbursement by the investment adviser but prior to reductions from brokerage service arrangements or other expense offset arrangements. Expenses net of all reductions represent the net expenses paid by the class. G For the year ended February 29. H Amount represents less than $.01 per share. |
Consolidated Financial Highlights - Class T
|
Years ended February 28, |
2013 |
2012 G |
2011 |
2010 |
2009 |
|
Selected Per-Share Data |
|
|
|
|
|
|
Net asset value, beginning of period |
$ 45.04 |
$ 50.68 |
$ 40.34 |
$ 30.36 |
$ 46.17 |
|
Income from Investment Operations |
|
|
|
|
|
|
Net investment income (loss) C |
(.03) |
(.27) |
(.43) |
(.36) |
(.24) |
|
Net realized and unrealized gain (loss) |
(15.06) |
(2.80) |
15.21 |
10.96 |
(15.42) |
|
Total from investment operations |
(15.09) |
(3.07) |
14.78 |
10.60 |
(15.66) |
|
Distributions from net realized gain |
- |
(2.57) |
(4.45) |
(.63) |
(.17) |
|
Redemption fees added to paid in capital C |
- H |
- H |
.01 |
.01 |
.02 |
|
Net asset value, end of period |
$ 29.95 |
$ 45.04 |
$ 50.68 |
$ 40.34 |
$ 30.36 |
|
Total Return A, B |
(33.50)% |
(6.49)% |
36.62% |
34.79% |
(33.98)% |
|
Ratios to Average Net Assets D, F |
|
|
|
|
|
|
Expenses before reductions |
1.45% |
1.43% |
1.44% |
1.51% |
1.47% |
|
Expenses net of fee waivers, if any |
1.44% |
1.42% |
1.42% |
1.49% |
1.45% |
|
Expenses net of all reductions |
1.44% |
1.42% |
1.42% |
1.47% |
1.41% |
|
Net investment income (loss) |
(.09)% |
(.57)% |
(.90)% |
(.93)% |
(.71)% |
|
Supplemental Data |
|
|
|
|
|
|
Net assets, end of period (000 omitted) |
$ 24,913 |
$ 40,664 |
$ 45,846 |
$ 26,256 |
$ 15,284 |
|
Portfolio turnover rate E |
18% |
22% |
35% |
46% |
42% |
|
A Total returns would have been lower if certain expenses had not been reduced during the applicable periods shown. B Total returns do not include the effect of the sales charges. C Calculated based on average shares outstanding during the period. D Fees and expenses of any underlying Fidelity Central Funds are not included in the Fund's expense ratio. The Fund indirectly bears its proportionate share of the expenses of any underlying Fidelity Central Funds. E Amount does not include the portfolio activity of any underlying Fidelity Central Funds. F Expense ratios reflect operating expenses of the class. Expenses before reductions do not reflect amounts reimbursed by the investment adviser or reductions from brokerage service arrangements or reductions from other expense offset arrangements and do not represent the amount paid by the class during periods when reimbursements or reductions occur. Expenses net of fee waivers reflect expenses after reimbursement by the investment adviser but prior to reductions from brokerage service arrangements or other expense offset arrangements. Expenses net of all reductions represent the net expenses paid by the class. G For the year ended February 29. H Amount represents less than $.01 per share. |
See accompanying notes which are an integral part of the consolidated financial statements.
Annual Report
Consolidated Financial Highlights - Class B
|
Years ended February 28, |
2013 |
2012 G |
2011 |
2010 |
2009 |
|
Selected Per-Share Data |
|
|
|
|
|
|
Net asset value, beginning of period |
$ 44.24 |
$ 50.02 |
$ 39.87 |
$ 30.08 |
$ 45.97 |
|
Income from Investment Operations |
|
|
|
|
|
|
Net investment income (loss) C |
(.21) |
(.49) |
(.66) |
(.55) |
(.40) |
|
Net realized and unrealized gain (loss) |
(14.76) |
(2.76) |
15.02 |
10.84 |
(15.34) |
|
Total from investment operations |
(14.97) |
(3.25) |
14.36 |
10.29 |
(15.74) |
|
Distributions from net realized gain |
- |
(2.53) |
(4.21) |
(.51) |
(.17) |
|
Redemption fees added to paid in capital C |
- H |
- H |
- H |
.01 |
.02 |
|
Net asset value, end of period |
$ 29.27 |
$ 44.24 |
$ 50.02 |
$ 39.87 |
$ 30.08 |
|
Total Return A, B |
(33.84)% |
(6.95)% |
35.97% |
34.12% |
(34.30)% |
|
Ratios to Average Net Assets D, F |
|
|
|
|
|
|
Expenses before reductions |
1.93% |
1.90% |
1.93% |
2.00% |
1.97% |
|
Expenses net of fee waivers, if any |
1.92% |
1.90% |
1.92% |
1.98% |
1.95% |
|
Expenses net of all reductions |
1.91% |
1.90% |
1.91% |
1.96% |
1.89% |
|
Net investment income (loss) |
(.57)% |
(1.04)% |
(1.39)% |
(1.42)% |
(1.20)% |
|
Supplemental Data |
|
|
|
|
|
|
Net assets, end of period (000 omitted) |
$ 9,423 |
$ 20,894 |
$ 26,837 |
$ 18,340 |
$ 8,421 |
|
Portfolio turnover rate E |
18% |
22% |
35% |
46% |
42% |
|
A Total returns would have been lower if certain expenses had not been reduced during the applicable periods shown. B Total returns do not include the effect of the contingent deferred sales charge. C Calculated based on average shares outstanding during the period. D Fees and expenses of any underlying Fidelity Central Funds are not included in the Fund's expense ratio. The Fund indirectly bears its proportionate share of the expenses of any underlying Fidelity Central Funds. E Amount does not include the portfolio activity of any underlying Fidelity Central Funds. F Expense ratios reflect operating expenses of the class. Expenses before reductions do not reflect amounts reimbursed by the investment adviser or reductions from brokerage service arrangements or reductions from other expense offset arrangements and do not represent the amount paid by the class during periods when reimbursements or reductions occur. Expenses net of fee waivers reflect expenses after reimbursement by the investment adviser but prior to reductions from brokerage service arrangements or other expense offset arrangements. Expenses net of all reductions represent the net expenses paid by the class. G For the year ended February 29. H Amount represents less than $.01 per share. |
Consolidated Financial Highlights - Class C
|
Years ended February 28, |
2013 |
2012 G |
2011 |
2010 |
2009 |
|
Selected Per-Share Data |
|
|
|
|
|
|
Net asset value, beginning of period |
$ 44.05 |
$ 49.81 |
$ 39.75 |
$ 30.00 |
$ 45.85 |
|
Income from Investment Operations |
|
|
|
|
|
|
Net investment income (loss) C |
(.20) |
(.47) |
(.64) |
(.53) |
(.39) |
|
Net realized and unrealized gain (loss) |
(14.70) |
(2.76) |
14.98 |
10.80 |
(15.30) |
|
Total from investment operations |
(14.90) |
(3.23) |
14.34 |
10.27 |
(15.69) |
|
Distributions from net realized gain |
- |
(2.53) |
(4.28) |
(.53) |
(.17) |
|
Redemption fees added to paid in capital C |
- H |
- H |
- H |
.01 |
.01 |
|
Net asset value, end of period |
$ 29.15 |
$ 44.05 |
$ 49.81 |
$ 39.75 |
$ 30.00 |
|
Total Return A, B |
(33.83)% |
(6.93)% |
36.01% |
34.15% |
(34.30)% |
|
Ratios to Average Net Assets D, F |
|
|
|
|
|
|
Expenses before reductions |
1.93% |
1.87% |
1.89% |
1.97% |
1.97% |
|
Expenses net of fee waivers, if any |
1.92% |
1.87% |
1.88% |
1.95% |
1.95% |
|
Expenses net of all reductions |
1.91% |
1.87% |
1.87% |
1.93% |
1.89% |
|
Net investment income (loss) |
(.57)% |
(1.01)% |
(1.35)% |
(1.39)% |
(1.20)% |
|
Supplemental Data |
|
|
|
|
|
|
Net assets, end of period (000 omitted) |
$ 37,787 |
$ 67,996 |
$ 72,431 |
$ 38,624 |
$ 17,544 |
|
Portfolio turnover rate E |
18% |
22% |
35% |
46% |
42% |
|
A Total returns would have been lower if certain expenses had not been reduced during the applicable periods shown. B Total returns do not include the effect of the contingent deferred sales charge. C Calculated based on average shares outstanding during the period. D Fees and expenses of any underlying Fidelity Central Funds are not included in the Fund's expense ratio. The Fund indirectly bears its proportionate share of the expenses of any underlying Fidelity Central Funds. E Amount does not include the portfolio activity of any underlying Fidelity Central Funds. F Expense ratios reflect operating expenses of the class. Expenses before reductions do not reflect amounts reimbursed by the investment adviser or reductions from brokerage service arrangements or reductions from other expense offset arrangements and do not represent the amount paid by the class during periods when reimbursements or reductions occur. Expenses net of fee waivers reflect expenses after reimbursement by the investment adviser but prior to reductions from brokerage service arrangements or other expense offset arrangements. Expenses net of all reductions represent the net expenses paid by the class. G For the year ended February 29. H Amount represents less than $.01 per share. |
See accompanying notes which are an integral part of the consolidated financial statements.
Annual Report
Consolidated Financial Highlights - Gold
|
Years ended February 28, |
2013 |
2012 F |
2011 |
2010 |
2009 |
|
Selected Per-Share Data |
|
|
|
|
|
|
Net asset value, beginning of period |
$ 45.96 |
$ 51.44 |
$ 40.85 |
$ 30.67 |
$ 46.37 |
|
Income from Investment Operations |
|
|
|
|
|
|
Net investment income (loss) B |
.16 |
(.02) |
(.18) |
(.16) |
(.04) |
|
Net realized and unrealized gain (loss) |
(15.40) |
(2.85) |
15.43 |
11.10 |
(15.51) |
|
Total from investment operations |
(15.24) |
(2.87) |
15.25 |
10.94 |
(15.55) |
|
Distributions from net realized gain |
- |
(2.61) |
(4.67) |
(.77) |
(.17) |
|
Redemption fees added to paid in capital B |
- G |
- G |
.01 |
.01 |
.02 |
|
Net asset value, end of period |
$ 30.72 |
$ 45.96 |
$ 51.44 |
$ 40.85 |
$ 30.67 |
|
Total Return A |
(33.16)% |
(6.00)% |
37.35% |
35.52% |
(33.59)% |
|
Ratios to Average Net Assets C, E |
|
|
|
|
|
|
Expenses before reductions |
.93% |
.89% |
.91% |
.98% |
.89% |
|
Expenses net of fee waivers, if any |
.92% |
.89% |
.90% |
.96% |
.87% |
|
Expenses net of all reductions |
.92% |
.89% |
.89% |
.94% |
.86% |
|
Net investment income (loss) |
.43% |
(.03)% |
(.37)% |
(.40)% |
(.13)% |
|
Supplemental Data |
|
|
|
|
|
|
Net assets, end of period (000 omitted) |
$ 2,301,019 |
$ 3,924,439 |
$ 4,250,249 |
$ 2,839,664 |
$ 1,881,600 |
|
Portfolio turnover rate D |
18% |
22% |
35% |
46% |
42% |
|
A Total returns would have been lower if certain expenses had not been reduced during the applicable periods shown. B Calculated based on average shares outstanding during the period. C Fees and expenses of any underlying Fidelity Central Funds are not included in the Fund's expense ratio. The Fund indirectly bears its proportionate share of the expenses of any underlying Fidelity Central Funds. D Amount does not include the portfolio activity of any underlying Fidelity Central Funds. E Expense ratios reflect operating expenses of the class. Expenses before reductions do not reflect amounts reimbursed by the investment adviser or reductions from brokerage service arrangements or reductions from other expense offset arrangements and do not represent the amount paid by the class during periods when reimbursements or reductions occur. Expenses net of fee waivers reflect expenses after reimbursement by the investment adviser but prior to reductions from brokerage service arrangements or other expense offset arrangements. Expenses net of all reductions represent the net expenses paid by the class. F For the year ended February 29. G Amount represents less than $.01 per share. |
Consolidated Financial Highlights - Institutional Class
|
Years ended February 28, |
2013 |
2012 F |
2011 |
2010 |
2009 |
|
Selected Per-Share Data |
|
|
|
|
|
|
Net asset value, beginning of period |
$ 45.87 |
$ 51.32 |
$ 40.77 |
$ 30.65 |
$ 46.34 |
|
Income from Investment Operations |
|
|
|
|
|
|
Net investment income (loss) B |
.20 |
.02 |
(.15) |
(.15) |
(.05) |
|
Net realized and unrealized gain (loss) |
(15.38) |
(2.85) |
15.41 |
11.08 |
(15.49) |
|
Total from investment operations |
(15.18) |
(2.83) |
15.26 |
10.93 |
(15.54) |
|
Distributions from net realized gain |
- |
(2.62) |
(4.72) |
(.82) |
(.17) |
|
Redemption fees added to paid in capital B |
- G |
- G |
.01 |
.01 |
.02 |
|
Net asset value, end of period |
$ 30.69 |
$ 45.87 |
$ 51.32 |
$ 40.77 |
$ 30.65 |
|
Total Return A |
(33.09)% |
(5.94)% |
37.45% |
35.50% |
(33.59)% |
|
Ratios to Average Net Assets C, E |
|
|
|
|
|
|
Expenses before reductions |
.84% |
.82% |
.85% |
.95% |
.91% |
|
Expenses net of fee waivers, if any |
.83% |
.81% |
.84% |
.93% |
.89% |
|
Expenses net of all reductions |
.82% |
.81% |
.83% |
.91% |
.86% |
|
Net investment income (loss) |
.52% |
.04% |
(.31)% |
(.37)% |
(.14)% |
|
Supplemental Data |
|
|
|
|
|
|
Net assets, end of period (000 omitted) |
$ 128,262 |
$ 168,548 |
$ 137,246 |
$ 38,037 |
$ 6,070 |
|
Portfolio turnover rate D |
18% |
22% |
35% |
46% |
42% |
|
A Total returns would have been lower if certain expenses had not been reduced during the applicable periods shown. B Calculated based on average shares outstanding during the period. C Fees and expenses of any underlying Fidelity Central Funds are not included in the Fund's expense ratio. The Fund indirectly bears its proportionate share of the expenses of any underlying Fidelity Central Funds. D Amount does not include the portfolio activity of any underlying Fidelity Central Funds. E Expense ratios reflect operating expenses of the class. Expenses before reductions do not reflect amounts reimbursed by the investment adviser or reductions from brokerage service arrangements or reductions from other expense offset arrangements and do not represent the amount paid by the class during periods when reimbursements or reductions occur. Expenses net of fee waivers reflect expenses after reimbursement by the investment adviser but prior to reductions from brokerage service arrangements or other expense offset arrangements. Expenses net of all reductions represent the net expenses paid by the class. F For the year ended February 29. G Amount represents less than $.01 per share. |
See accompanying notes which are an integral part of the consolidated financial statements.
Annual Report
Notes to Consolidated Financial Statements
For the period ended February 28, 2013
1. Organization.
Gold Portfolio (the Fund) is a non-diversified fund of Fidelity Select Portfolios (the Trust) and is authorized to issue an unlimited number of shares. The Trust is registered under the Investment Company Act of 1940, as amended (the 1940 Act), as an open-end management investment company organized as a Massachusetts business trust. The Fund invests primarily in securities of companies whose principal business activities fall within specific industries. The Fund offers Class A, Class T, Class C, Gold, and Institutional Class shares, each of which, along with Class B shares, has equal rights as to assets and voting privileges. Class B shares are closed to new accounts and additional purchases, except for exchanges and reinvestments. Each class has exclusive voting rights with respect to matters that affect that class. Class B shares will automatically convert to Class A shares after a holding period of seven years from the initial date of purchase. Investment income, realized and unrealized capital gains and losses, the common expenses of the Fund, and certain fund-level expense reductions, if any, are allocated on a pro-rata basis to each class based on the relative net assets of each class to the total net assets of the Fund. Each class differs with respect to transfer agent and distribution and service plan fees incurred. Certain expense reductions may also differ by class.
2. Consolidated Subsidiary
The Fund invests in certain commodity-related investments through Fidelity Select Gold Cayman Ltd., a wholly owned subsidiary (the "Subsidiary"). As of February 28, 2013, the Fund held $116,121,090 in the Subsidiary, representing 4.5% of the Fund's net assets.
The financial statements have been consolidated and include accounts of the Fund and the Subsidiary. Accordingly, all inter-company transactions and balances have been eliminated.
3. Investments in Fidelity Central Funds.
The Fund invests in Fidelity Central Funds, which are open-end investment companies available only to other investment companies and accounts managed by Fidelity Management & Research Company (FMR) and its affiliates. The Fund's Consolidated Schedule of Investments lists each of the Fidelity Central Funds held as of period end, if any, as an investment of the Fund, but does not include the underlying holdings of each Fidelity Central Fund. As an Investing Fund, the Fund indirectly bears its proportionate share of the expenses of the underlying Fidelity Central Funds.
The Money Market Central Funds seek preservation of capital and current income and are managed by Fidelity Investments Money Management, Inc. (FIMM), an affiliate of FMR.
A complete unaudited list of holdings for each Fidelity Central Fund is available upon request or at the Securities and Exchange Commission (the SEC) website at www.sec.gov. In addition, the financial statements of the Fidelity Central Funds, which are not covered by the Fund's Report of Independent Registered Public Accounting Firm, are available on the SEC website or upon request.
4. Significant Accounting Policies.
The consolidated financial statements have been prepared in conformity with accounting principles generally accepted in the United States of America (GAAP), which require management to make certain estimates and assumptions at the date of the consolidated financial statements. Actual results could differ from those estimates. Subsequent events, if any, through the date that the consolidated financial statements were issued have been evaluated in the preparation of the consolidated financial statements. The following summarizes the significant accounting policies of the Fund:
Investment Valuation. Investments are valued as of 4:00 p.m. Eastern time on the last calendar day of the period. In accordance with valuation policies and procedures approved by the Board of Trustees (the Board), the Fund attempts to obtain prices from one or more third party pricing vendors or brokers to value its investments. When current market prices, quotations or currency exchange rates are not readily available or reliable, investments will be fair valued in good faith by FMR Fair Value Committee (the Committee), in accordance with procedures adopted by the Fund's Board. Factors used in determining fair value vary by investment type and may include market or investment specific events. The frequency with which these procedures are used cannot be predicted and they may be utilized to a significant extent. The Committee oversees the Fund's valuation policies and procedures and is responsible for approving and reporting to the Board all fair value determinations.
The Fund categorizes the inputs to valuation techniques used to value its investments into a disclosure hierarchy consisting of three levels as shown below:
Level 1 - quoted prices in active markets for identical investments
Level 2 - other significant observable inputs (including quoted prices for similar investments, interest rates, prepayment speeds, etc.)
Level 3 - unobservable inputs (including the Fund's own assumptions based on the best information available)
Valuation techniques used to value the Fund's investments by major category are as follows:
Annual Report
4. Significant Accounting Policies - continued
Investment Valuation - continued
Equity securities, including restricted securities, for which market quotations are readily available, are valued at the last reported sale price or official closing price as reported by a third party pricing vendor on the primary market or exchange on which they are traded and are categorized as Level 1 in the hierarchy. In the event there were no sales during the day or closing prices are not available, securities are valued at the last quoted bid price or may be valued using the last available price and are generally categorized as Level 2 in the hierarchy. For foreign equity securities, when significant market or security specific events arise, comparisons to the valuation of American Depositary Receipts (ADRs), futures contracts, Exchange-Traded Funds (ETFs) and certain indexes as well as quoted prices for similar securities are used and are categorized as Level 2 in the hierarchy. Utilizing these techniques may result in transfers between Level 1 and Level 2. For restricted equity securities and private placements where observable inputs are limited, assumptions about market activity and risk are used and these securities are generally categorized as Level 3 in the hierarchy.
Investments in commodities are valued at their last traded price at 4:00 p.m. Eastern time each business day and are categorized as Level 1 in the hierarchy. Investments in open-end mutual funds, including the Fidelity Central Funds, are valued at their closing net asset value (NAV) each business day and are categorized as Level 1 in the hierarchy.
Changes in valuation techniques may result in transfers in or out of an assigned level within the disclosure hierarchy. The aggregate value of investments by input level, as of February 28, 2013, is included at the end of the Fund's Consolidated Schedule of Investments.
Foreign Currency. The Fund may use foreign currency contracts to facilitate transactions in foreign-denominated securities. Gains and losses from these transactions may arise from changes in the value of the foreign currency or if the counterparties do not perform under the contracts' terms.
Foreign-denominated assets, including investment securities, and liabilities are translated into U.S. dollars at the exchange rates at period end. Purchases and sales of investment securities, income and dividends received and expenses denominated in foreign currencies are translated into U.S. dollars at the exchange rate in effect on the transaction date.
The effects of exchange rate fluctuations on investments are included with the net realized and unrealized gain (loss) on investment securities. Other foreign currency transactions resulting in realized and unrealized gain (loss) are disclosed separately.
Investment Transactions and Income. For financial reporting purposes, the Fund's investment holdings and NAV include trades executed through the end of the last business day of the period. The NAV per share for processing shareholder transactions is calculated as of the close of business of the New York Stock Exchange (NYSE), normally 4:00 p.m. Eastern time and includes trades executed through the end of the prior business day. Gains and losses on securities sold are determined on the basis of identified cost. Dividend income is recorded on the ex-dividend date, except for certain dividends from foreign securities where the ex-dividend date may have passed, which are recorded as soon as the Fund is informed of the ex-dividend date. Non-cash dividends included in dividend income, if any, are recorded at the fair market value of the securities received. Distributions received on securities that represent a return of capital or capital gain are recorded as a reduction of cost of investments and/or as a realized gain. The Fund estimates the components of distributions received that may be considered return of capital distributions or capital gain distributions. Interest income and distributions from the Fidelity Central Funds are accrued as earned. Interest income includes coupon interest and amortization of premium and accretion of discount on debt securities. Investment income is recorded net of foreign taxes withheld where recovery of such taxes is uncertain.
Expenses. Expenses directly attributable to a fund are charged to that fund. Expenses attributable to more than one fund are allocated among the respective funds on the basis of relative net assets or other appropriate methods. Expense estimates are accrued in the period to which they relate and adjustments are made when actual amounts are known.
Income Tax Information and Distributions to Shareholders. Each year, the Fund intends to qualify as a regulated investment company under Subchapter M of the Internal Revenue Code, including distributing substantially all of its taxable income and realized gains. As a result, no provision for income taxes is required. As of February 28, 2013, the Fund did not have any unrecognized tax benefits in the consolidated financial statements; nor is the Fund aware of any tax positions for which it is reasonably possible that the total amounts of unrecognized tax benefits will significantly change in the next twelve months. The Fund files a U.S. federal tax return, in addition to state and local tax returns as required. A fund's federal income tax returns are subject to examination by the Internal Revenue Service (IRS) for a period of three fiscal years after they are filed. State and local tax returns may be subject to examination for an additional fiscal year depending on the jurisdiction. Foreign taxes are provided for based on the Fund's understanding of the tax rules and rates that exist in the foreign markets in which it invests.
The Subsidiary is classified as a controlled foreign corporation under Subchapter N of the Internal Revenue Code. Therefore, the Fund is required to increase its taxable income by its share of the Subsidiary's income. Net investment losses of the Subsidiary cannot be deducted by the Fund in the current period nor carried forward to offset taxable income in future periods.
Annual Report
Notes to Consolidated Financial Statements - continued
4. Significant Accounting Policies - continued
Income Tax Information and Distributions to Shareholders - continued
Distributions are declared and recorded on the ex-dividend date. Income dividends and capital gain distributions are declared separately for each class. Income and capital gain distributions are determined in accordance with income tax regulations, which may differ from GAAP. In addition, the Fund claimed a portion of the payment made to redeeming shareholders as a distribution for income tax purposes.
Capital accounts within the consolidated financial statements are adjusted for permanent book-tax differences. These adjustments have no impact on net assets or the results of operations. Temporary book-tax differences will reverse in a subsequent period.
Book-tax differences are primarily due to foreign currency transactions, passive foreign investment companies (PFIC), controlled foreign corporation, deferred trustees compensation, net operating losses and losses deferred due to wash sales and excise tax regulations.
The federal tax cost of investment securities and unrealized appreciation (depreciation) as of period end on an unconsolidated basis were as follows:
|
Gross unrealized appreciation |
$ 353,036,986 |
|
Gross unrealized depreciation |
(764,931,082) |
|
Net unrealized appreciation (depreciation) on securities and other investments |
$ (411,894,096) |
|
|
|
|
Tax Cost |
$ 3,439,137,336 |
The tax-based components of distributable earnings as of period end were as follows:
|
Capital loss carryforward |
$ (170,232,605) |
|
Net unrealized appreciation (depreciation) |
$ (411,904,952) |
Capital loss carryforwards are only available to offset future capital gains of the Fund to the extent provided by regulations and may be limited. Under the Regulated Investment Company Modernization Act of 2010 (the Act), the Fund is permitted to carry forward capital losses incurred in taxable years beginning after December 22, 2010 for an unlimited period and such capital losses are required to be used prior to any losses that expire. Capital loss carryforwards were as follows:
|
Short-term |
$ (67,261,086) |
|
Long-term |
(102,971,519) |
|
Total capital loss carryforward |
$ (170,232,605) |
The Fund intends to elect to defer to its fiscal year ending February 28, 2014 approximately $129,692,316 of ordinary losses recognized during the period November 1, 2012 to February 28, 2013.
The tax character of distributions paid was as follows:
|
|
February 28, 2013 |
February 29, 2012 |
|
Ordinary Income |
$ - |
$ 158,364,329 |
|
Long-term Capital Gains |
- |
80,385,768 |
|
Total |
$ - |
$ 238,750,097 |
Trading (Redemption) Fees. Shares held by investors in the Fund less than 30 days are subject to a redemption fee equal to .75% of the net asset value of shares redeemed. All redemption fees, which reduce the proceeds of the shareholder redemption, are retained by the Fund and accounted for as an addition to paid in capital.
Delayed Delivery Transactions and When-Issued Securities. During the period, the Fund transacted in securities on a delayed delivery or when-issued basis. Payment and delivery may take place after the customary settlement period for that security. The price of the underlying securities and the date when the securities will be delivered and paid for are fixed at the time the transaction is negotiated. The Fund may receive compensation for interest forgone in the purchase of a delayed delivery or when-issued security. With respect to purchase commitments, the Fund identifies securities as segregated in its records with a value at least equal to the amount of the commitment. Losses may arise due to changes in the value of the underlying securities or if the counterparty does not perform under the contract's terms, or if the issuer does not issue the securities due to political, economic, or other factors.
Restricted Securities. The Fund may invest in securities that are subject to legal or contractual restrictions on resale. These securities generally may be resold in transactions exempt from registration or to the public if the securities are registered. Disposal of these securities may involve time-consuming negotiations and expense, and prompt sale at an acceptable price may be difficult. Information regarding restricted securities is included at the end of the Fund's Consolidated Schedule of Investments.
Annual Report
5. Purchases and Sales of Investments.
Purchases and sales of securities, other than short-term securities, aggregated $625,093,559 and $972,324,125, respectively.
6. Fees and Other Transactions with Affiliates.
Management Fee. FMR and its affiliates provide the Fund with investment management related services for which the Fund pays a monthly management fee. The management fee is the sum of an individual fund fee rate that is based on an annual rate of .30% of the Fund's average net assets and an annualized group fee rate that averaged .26% during the period. The group fee rate is based upon the average net assets of all the mutual funds advised by FMR. The group fee rate decreases as assets under management increase and increases as assets under management decrease. For the period, the total annual management fee rate was .56% of the Fund's average net assets.
FMR and its affiliates also provide investment management related services to the Subsidiary. The Subsidiary pays FMR a monthly management fee at the annual rate of .30% of its net assets. Under the management contract, FMR pays all other expenses of the Subsidiary, except custodian fees.
During the period, FMR waived a portion of its management fee as described in the Expense Reductions note.
Distribution and Service Plan Fees. In accordance with Rule 12b-1 of the 1940 Act, the Fund has adopted separate Distribution and Service Plans for each class of shares. Certain classes pay Fidelity Distributors Corporation (FDC), an affiliate of FMR, separate Distribution and Service Fees, each of which is based on an annual percentage of each class' average net assets. In addition, FDC may pay financial intermediaries for selling shares of the Fund and providing shareholder support services. For the period, the Distribution and Service Fee rates, total fees and amounts retained by FDC were as follows:
|
|
Distribution |
Service |
Total Fees |
Retained |
|
Class A |
-% |
.25% |
$ 315,882 |
$ 5,739 |
|
Class T |
.25% |
.25% |
157,988 |
814 |
|
Class B |
.75% |
.25% |
141,475 |
106,141 |
|
Class C |
.75% |
.25% |
509,222 |
77,647 |
|
|
|
|
$ 1,124,567 |
$ 190,341 |
Sales Load. FDC may receive a front-end sales charge of up to 5.75% for selling Class A shares and 3.50% for selling Class T shares, some of which is paid to financial intermediaries for selling shares of the Fund. Depending on the holding period, FDC may receive contingent deferred sales charges levied on Class A, Class T, Class B, and Class C redemptions. The deferred sales charges range from 5.00% to 1.00% for Class B shares, 1.00% for Class C shares, 1.00% for certain purchases of Class A shares and .25% for certain purchases of Class T shares.
For the period, sales charge amounts retained by FDC were as follows:
|
|
Retained |
|
Class A |
$ 54,740 |
|
Class T |
12,343 |
|
Class B* |
43,859 |
|
Class C* |
7,084 |
|
|
$ 118,026 |
* When Class B and Class C shares are initially sold, FDC pays commissions from its own resources to financial intermediaries through which the sales are made.
Transfer Agent Fees. Fidelity Investments Institutional Operations Company, Inc., (FIIOC), an affiliate of FMR, is the transfer, dividend disbursing and shareholder servicing agent for each class of the Fund. FIIOC receives account fees and asset-based fees that vary according to the account size and type of account of the shareholders of the respective classes of the Fund. FIIOC pays for typesetting, printing and mailing of shareholder reports, except proxy statements. For the period, transfer agent fees for each class were as follows:
|
|
Amount |
% of |
|
Class A |
$ 380,022 |
.30 |
|
Class T |
101,679 |
.32 |
|
Class B |
42,879 |
.30 |
|
Class C |
151,514 |
.30 |
|
Gold |
9,385,666 |
.30 |
|
Institutional Class |
303,067 |
.21 |
|
|
$ 10,364,827 |
|
Annual Report
Notes to Consolidated Financial Statements - continued
6. Fees and Other Transactions with Affiliates - continued
Accounting and Security Lending Fees. Fidelity Service Company, Inc. (FSC), an affiliate of FMR, maintains the Fund's accounting records. The accounting fee is based on the level of average net assets for each month. Under a separate contract, FSC administers the security lending program. The security lending fee is based on the number and duration of lending transactions.
Brokerage Commissions. The Fund placed a portion of its portfolio transactions with brokerage firms which are affiliates of the investment adviser. The commissions paid to these affiliated firms were $4,289 for the period.
Interfund Lending Program. Pursuant to an Exemptive Order issued by the SEC, the Fund, along with other registered investment companies having management contracts with FMR, may participate in an interfund lending program. This program provides an alternative credit facility allowing the funds to borrow from, or lend money to, other participating affiliated funds. At period end, there were no interfund loans outstanding. The Fund's activity in this program during the period for which loans were outstanding was as follows:
|
Borrower or Lender |
Average Loan |
Weighted Average |
Interest |
|
Borrower |
$ 7,919,951 |
.41% |
$ 5,520 |
7. Committed Line of Credit.
The Fund participates with other funds managed by FMR or an affiliate in a $4.25 billion credit facility (the "line of credit") to be utilized for temporary or emergency purposes to fund shareholder redemptions or for other short-term liquidity purposes. The Fund has agreed to pay commitment fees on its pro-rata portion of the line of credit, which amounted to $9,688 and is reflected in Miscellaneous expenses on the Consolidated Statement of Operations. During the period, there were no borrowings on this line of credit.
8. Security Lending.
The Fund lends portfolio securities through a lending agent from time to time in order to earn additional income. For equity securities, a lending agent is used and may loan securities to certain qualified borrowers, including Fidelity Capital Markets (FCM), a broker-dealer affiliated with the Fund. On the settlement date of the loan, the Fund receives collateral (in the form of U.S. Treasury obligations, letters of credit and/or cash) against the loaned securities and maintains collateral in an amount not less than 100% of the market value of the loaned securities during the period of the loan. The market value of the loaned securities is determined at the close of business of the Fund and any additional required collateral is delivered to the Fund on the next business day. If the borrower defaults on its obligation to return the securities loaned because of insolvency or other reasons, a fund could experience delays and costs in recovering the securities loaned or in gaining access to the collateral. Any cash collateral received is invested in the Fidelity Securities Lending Cash Central Fund. The value of loaned securities and cash collateral at period end are disclosed on the Fund's Consolidated Statement of Assets and Liabilities. At period end, there were no security loans outstanding with FCM. Security lending income represents the income earned on investing cash collateral, less rebates paid to borrowers and any lending agent fees associated with the loan, plus any premium payments received for lending certain types of securities. Security lending income is presented in the Consolidated Statement of Operations as a component of income from Fidelity Central Funds. Total security lending income during the period amounted to $777,921, including $19,129 from securities loaned to FCM.
9. Bank Borrowings.
The Fund is permitted to have bank borrowings for temporary or emergency purposes to fund shareholder redemptions or for other short-term liquidity requirements. The Fund has established borrowing arrangements with certain banks. The interest rate on the borrowings is the bank's base rate, as revised from time to time. The average loan balance during the period for which loans were outstanding amounted to $6,452,333. The weighted average interest rate was .64%. The interest expense amounted to $693 under the bank borrowing program. At period end, there were no bank borrowings outstanding.
10. Expense Reductions.
FMR has contractually agreed to waive the Fund's management fee in an amount equal to the management fee of the Subsidiary. During the period, this waiver reduced the Fund's management fee by $330,253. Many of the brokers with whom FMR places trades on behalf of the Fund provided services to the Fund in addition to trade execution. These services included payments of certain expenses on behalf of the Fund totaling $173,463 for the period. In addition, through arrangements with the Fund's custodian, credits realized as a result of uninvested cash balances were used to reduce the Fund's expenses. During the period, these credits reduced the Fund's expenses by $351.
In addition, FMR reimbursed a portion of the Fund's operating expenses during the period in the amount of $11,638.
Annual Report
11. Distributions to Shareholders.
Distributions to shareholders of each class were as follows:
|
|
Year ended |
Year ended |
|
From net realized gain |
|
|
|
Class A |
$ - |
$ 7,834,928 |
|
Class T |
- |
2,382,367 |
|
Class B |
- |
1,303,107 |
|
Class C |
- |
3,798,844 |
|
Gold |
- |
215,607,839 |
|
Institutional Class |
- |
7,823,012 |
|
Total |
$ - |
$ 238,750,097 |
12. Share Transactions.
Transactions for each class of shares were as follows:
|
|
Shares |
Dollars |
||
|
|
Year ended |
Year ended |
Year ended |
Year ended |
|
Class A |
|
|
|
|
|
Shares sold |
1,412,697 |
1,589,102 |
$ 53,420,103 |
$ 76,690,664 |
|
Reinvestment of distributions |
- |
145,713 |
- |
7,265,756 |
|
Shares redeemed |
(1,438,620) |
(1,293,053) |
(53,775,838) |
(61,867,749) |
|
Net increase (decrease) |
(25,923) |
441,762 |
$ (355,735) |
$ 22,088,671 |
|
Class T |
|
|
|
|
|
Shares sold |
284,748 |
326,122 |
$ 10,411,769 |
$ 15,663,258 |
|
Reinvestment of distributions |
- |
46,446 |
- |
2,308,310 |
|
Shares redeemed |
(355,685) |
(374,234) |
(13,010,570) |
(17,626,829) |
|
Net increase (decrease) |
(70,937) |
(1,666) |
$ (2,598,801) |
$ 344,739 |
|
Class B |
|
|
|
|
|
Shares sold |
16,804 |
55,740 |
$ 624,661 |
$ 2,638,278 |
|
Reinvestment of distributions |
- |
22,881 |
- |
1,122,370 |
|
Shares redeemed |
(167,215) |
(142,844) |
(6,101,257) |
(6,672,300) |
|
Net increase (decrease) |
(150,411) |
(64,223) |
$ (5,476,596) |
$ (2,911,652) |
|
Class C |
|
|
|
|
|
Shares sold |
311,882 |
510,073 |
$ 11,372,831 |
$ 24,191,165 |
|
Reinvestment of distributions |
- |
63,636 |
- |
3,100,723 |
|
Shares redeemed |
(559,180) |
(484,293) |
(20,004,404) |
(22,585,009) |
|
Net increase (decrease) |
(247,298) |
89,416 |
$ (8,631,573) |
$ 4,706,879 |
|
Gold |
|
|
|
|
|
Shares sold |
22,313,552 |
30,555,727 |
$ 848,495,476 |
$ 1,483,101,053 |
|
Reinvestment of distributions |
- |
4,125,294 |
- |
208,463,091 |
|
Shares redeemed |
(32,795,078) |
(31,912,749) |
(1,225,752,483) |
(1,536,990,789) |
|
Net increase (decrease) |
(10,481,526) |
2,768,272 |
$ (377,257,007) |
$ 154,573,355 |
|
Institutional Class |
|
|
|
|
|
Shares sold |
1,354,134 |
1,664,357 |
$ 51,488,741 |
$ 81,430,250 |
|
Reinvestment of distributions |
- |
146,226 |
- |
7,344,695 |
|
Shares redeemed |
(849,045) |
(810,698) |
(31,583,828) |
(38,218,873) |
|
Net increase (decrease) |
505,089 |
999,885 |
$ 19,904,913 |
$ 50,556,072 |
13. Other.
The Fund's organizational documents provide former and current trustees and officers with a limited indemnification against liabilities arising in connection with the performance of their duties to the Fund. In the normal course of business, the Fund may also enter into contracts that provide general indemnifications. The Fund's maximum exposure under these arrangements is unknown as this would be dependent on future claims that may be made against the Fund. The risk of material loss from such claims is considered remote.
Annual Report
Performance: The Bottom Line
Average annual total return reflects the change in the value of an investment, assuming reinvestment of the class' distributions from dividend income and capital gains (the profits earned upon the sale of securities that have grown in value, if any) and assuming a constant rate of performance each year. The $10,000 table and the fund's returns do not reflect the deduction of taxes that a shareholder would pay on fund distributions or the redemption of fund shares. During periods of reimbursement by Fidelity, a fund's total return will be greater than it would be had the reimbursement not occurred. How a fund did yesterday is no guarantee of how it will do tomorrow.
Average Annual Total Returns
|
Periods ended February 28, 2013 |
Past 1 |
Past 5 |
Past 10 |
|
Materials Portfolio A |
9.71% |
6.98% |
15.26% |
A Prior to October 1, 2006, Materials Portfolio operated under certain different investment policies. The historical performance for the fund may not represent its current investment policies.
$10,000 Over 10 Years
Let's say hypothetically that $10,000 was invested in Materials Portfolio, a class of the fund, on February 28, 2003. The chart shows how the value of your investment would have changed, and also shows how the S&P 500 Index performed over the same period.
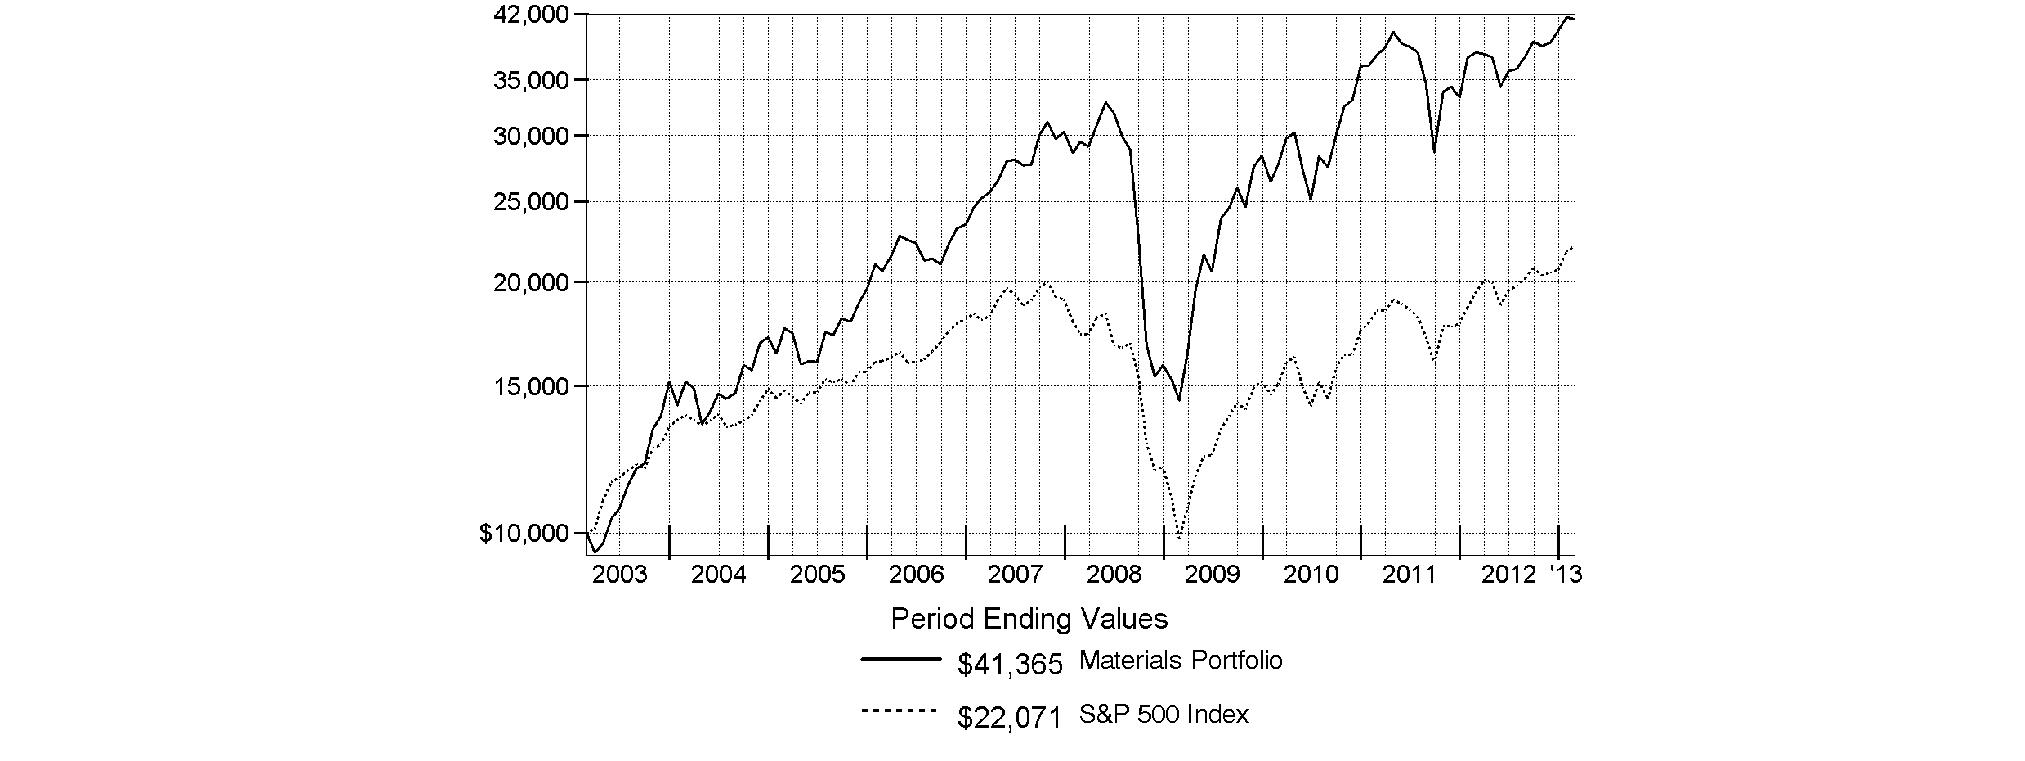
Annual Report
Materials Portfolio
Management's Discussion of Fund Performance
Market Recap: U.S. stocks posted solid gains for the year ending February 28, 2013, sparked by a late-period rally that pushed major equity benchmarks to multiyear highs. Improvement in the global economy and more monetary stimulus from the U.S. Federal Reserve kept markets on the upswing for much of the year, shrugging off an early decline brought on by debt woes in Europe, and another dip later in the period amid Congressional gridlock on the federal budget. Renewed optimism over employment, the housing market, corporate earnings and record dividends made stocks a favorite with investors during the 12 months, which helped push the broad-based S&P 500® Index across the milestone 1,500 mark at the end of January. The S&P 500® finished the period up 13.46%. Seven of the 10 major market sectors tracked by MSCI U.S. IMI 25-50 classifications produced double-digit gains, led by health care and financials, while information technology, energy and materials trailed the broad equity market with only modest advances.
Comments from Tobias Welo, Portfolio Manager of Materials Portfolio: For the year, the fund's Retail Class shares returned 9.71%, outpacing the 7.68% advance of the MSCI® U.S. IMI Materials 25-50 Index but trailing the S&P 500®. Compared with the broader market, the materials sector was held back in part by weakness in various metals-related groups during the first several months of the period. Versus the MSCI index, the portfolio benefited from both industry weightings and stock selection, especially in commodity chemicals, where I increased the fund's exposure to companies with ties to the construction industry. Stock picking in fertilizers/agricultural chemicals and steel also benefited the fund's results. Not owning iron-ore producer and index component Cliffs Natural Resources had a positive impact, given this stock's decline of roughly 58% against the backdrop of increasingly unfavorable supply/demand conditions for the commodity. The fund also was helped by its underweightings in metals producer Freeport-McMoRan Copper & Gold and gold miner Newmont Mining - both weak-performing constituents of the MSCI index. I sold the former and significantly reduced the latter during the period. Among overweighted positions, one key contributor was an out-of-benchmark stake in Rentech Nitrogen Partners, which I sold to lock in profits. In absolute terms, agricultural chemicals producer Monsanto was the fund's top contributor and also its largest holding, although this stock had only a small positive impact on performance relative to the index. Conversely, performance was dampened by weak picks in diversified metals/mining, a group whose allocation in the fund I significantly reduced during the period, as slowing demand from China and ample supply weighed on the share prices of these stocks. The fund's holdings in cash and cash equivalents, averaging around 3.6% of net assets during the period, also muted the fund's gain in a rising market. At the stock level, out-of-benchmark positions in two Canada-based copper mines hampered the fund's results. One of these - and the fund's biggest relative detractor - was Ivanhoe Mines, which was renamed Turquoise Hill Resources in August. This stock sold off in part on concerns about the attempt of mining giant Rio Tinto, a minority owner in Ivanhoe, to gain control of the company. Subsequently, pressure from the Mongolian government for more control and a larger share of the profits from the company's Oyu Tolgoi mine - slated to begin production in late-June 2013 - further depressed the stock. The shares of Copper Mountain Mining also posted a sizable loss during the period amid disappointing production numbers, which I used as an opportunity to roughly double the fund's exposure by period end. Canadian gold producer Goldcorp, another non-index position, was hampered by softness in that metal's price.
The views expressed above reflect those of the portfolio manager(s) only through the end of the period as stated on the cover of this report and do not necessarily represent the views of Fidelity or any other person in the Fidelity organization. Any such views are subject to change at any time based upon market or other conditions and Fidelity disclaims any responsibility to update such views. These views may not be relied on as investment advice and, because investment decisions for a Fidelity fund are based on numerous factors, may not be relied on as an indication of trading intent on behalf of any Fidelity fund.
Annual Report
Materials Portfolio
Shareholder Expense Example
As a shareholder of the Fund, you incur two types of costs: (1) transaction costs, including sales charges (loads) on purchase payments or redemption proceeds, redemption fees and (2) ongoing costs, including management fees, distribution and/or service (12b-1) fees and other Fund expenses. This Example is intended to help you understand your ongoing costs (in dollars) of investing in the Fund and to compare these costs with the ongoing costs of investing in other mutual funds.
The Example is based on an investment of $1,000 invested at the beginning of the period and held for the entire period (September 1, 2012 to February 28, 2013).
Actual Expenses
The first line of the accompanying table for each class of the Fund provides information about actual account values and actual expenses. You may use the information in this line, together with the amount you invested, to estimate the expenses that you paid over the period. Simply divide your account value by $1,000.00 (for example, an $8,600 account value divided by $1,000.00 = 8.6), then multiply the result by the number in the first line for a class of the Fund under the heading entitled "Expenses Paid During Period" to estimate the expenses you paid on your account during this period. A small balance maintenance fee of $12.00 that is charged once a year may apply for certain accounts with a value of less than $2,000. This fee is not included in the table below. If it was, the estimate of expenses you paid during the period would be higher, and your ending account value lower, by this amount. In addition, the Fund, as a shareholder in the underlying Fidelity Central Funds, will indirectly bear its pro-rata share of the fees and expenses incurred by the underlying Fidelity Central Funds. These fees and expenses are not included in the Fund's annualized expense ratio used to calculate the expense estimate in the table below.
Hypothetical Example for Comparison Purposes
The second line of the accompanying table for each class of the Fund provides information about hypothetical account values and hypothetical expenses based on a Class' actual expense ratio and an assumed rate of return of 5% per year before expenses, which is not the Class' actual return. The hypothetical account values and expenses may not be used to estimate the actual ending account balance or expenses you paid for the period. You may use this information to compare the ongoing costs of investing in the Fund and other funds. To do so, compare this 5% hypothetical example with the 5% hypothetical examples that appear in the shareholder reports of the other funds. A small balance maintenance fee of $12.00 that is charged once a year may apply for certain accounts with a value of less than $2,000. This fee is not included in the table below. If it was, the estimate of expenses you paid during the period would be higher, and your ending account value lower, by this amount. In addition, the Fund, as a shareholder in the underlying Fidelity Central Funds, will indirectly bear its pro-rata share of the fees and expenses incurred by the underlying Fidelity Central Funds. These fees and expenses are not included in the Fund's annualized expense ratio used to calculate the expense estimate in the table below.
Please note that the expenses shown in the table are meant to highlight your ongoing costs only and do not reflect any transaction costs. Therefore, the second line of the table is useful in comparing ongoing costs only, and will not help you determine the relative total costs of owning different funds. In addition, if these transactional costs were included, your costs would have been higher.
|
|
Annualized |
Beginning |
Ending |
Expenses Paid |
|
Class A |
1.13% |
|
|
|
|
Actual |
|
$ 1,000.00 |
$ 1,105.40 |
$ 5.90 |
|
HypotheticalA |
|
$ 1,000.00 |
$ 1,019.19 |
$ 5.66 |
|
Class T |
1.42% |
|
|
|
|
Actual |
|
$ 1,000.00 |
$ 1,103.80 |
$ 7.41 |
|
HypotheticalA |
|
$ 1,000.00 |
$ 1,017.75 |
$ 7.10 |
|
Class B |
1.92% |
|
|
|
|
Actual |
|
$ 1,000.00 |
$ 1,101.10 |
$ 10.00 |
|
HypotheticalA |
|
$ 1,000.00 |
$ 1,015.27 |
$ 9.59 |
|
Class C |
1.88% |
|
|
|
|
Actual |
|
$ 1,000.00 |
$ 1,101.40 |
$ 9.80 |
|
HypotheticalA |
|
$ 1,000.00 |
$ 1,015.47 |
$ 9.39 |
|
Materials |
.84% |
|
|
|
|
Actual |
|
$ 1,000.00 |
$ 1,107.10 |
$ 4.39 |
|
HypotheticalA |
|
$ 1,000.00 |
$ 1,020.63 |
$ 4.21 |
|
Institutional Class |
.84% |
|
|
|
|
Actual |
|
$ 1,000.00 |
$ 1,107.00 |
$ 4.39 |
|
HypotheticalA |
|
$ 1,000.00 |
$ 1,020.63 |
$ 4.21 |
A 5% return per year before expenses
* Expenses are equal to each Class' annualized expense ratio, multiplied by the average account value over the period, multiplied by 181/365 (to reflect the one-half year period).
Annual Report
Materials Portfolio
Investment Changes (Unaudited)
|
Top Ten Stocks as of February 28, 2013 |
||
|
|
% of fund's |
% of fund's net assets |
|
Monsanto Co. |
9.6 |
8.1 |
|
LyondellBasell Industries NV Class A |
4.9 |
4.2 |
|
Air Products & Chemicals, Inc. |
4.7 |
5.7 |
|
E.I. du Pont de Nemours & Co. |
4.3 |
8.3 |
|
Ecolab, Inc. |
4.1 |
3.5 |
|
PPG Industries, Inc. |
4.0 |
3.6 |
|
International Paper Co. |
3.8 |
1.2 |
|
Eastman Chemical Co. |
3.6 |
3.8 |
|
The Dow Chemical Co. |
3.3 |
0.7 |
|
Rock-Tenn Co. Class A |
3.1 |
3.2 |
|
|
45.4 |
|
|
Top Industries (% of fund's net assets) |
|||
|
As of February 28, 2013 |
|||
|
Chemicals |
65.9% |
|
|
Metals & Mining |
12.3% |
|
|
Containers & Packaging |
8.6% |
|
|
Paper & Forest Products |
6.0% |
|
|
Construction Materials |
3.7% |
|
|
All Others* |
3.5% |
|

|
As of August 31, 2012 |
|||
|
Chemicals |
62.5% |
|
|
Metals & Mining |
19.5% |
|
|
Containers & Packaging |
8.6% |
|
|
Construction Materials |
1.5% |
|
|
Paper & Forest Products |
1.2% |
|
|
All Others* |
6.7% |
|

|
* Includes short-term investments and net other assets. |
Annual Report
Materials Portfolio
Investments February 28, 2013
Showing Percentage of Net Assets
|
Common Stocks - 97.2% |
|||
|
Shares |
Value |
||
|
CHEMICALS - 65.9% |
|||
|
Commodity Chemicals - 10.1% |
|||
|
Arkema SA |
115,041 |
$ 11,687,924 |
|
|
Axiall Corp. |
632,739 |
35,800,373 |
|
|
Cabot Corp. |
513,283 |
18,878,549 |
|
|
LyondellBasell Industries NV Class A (d) |
1,463,462 |
85,788,142 |
|
|
Westlake Chemical Corp. |
273,610 |
23,590,654 |
|
|
|
175,745,642 |
||
|
Diversified Chemicals - 18.5% |
|||
|
E.I. du Pont de Nemours & Co. |
1,551,829 |
74,332,609 |
|
|
Eastman Chemical Co. |
894,076 |
62,343,919 |
|
|
FMC Corp. |
881,753 |
53,134,436 |
|
|
Lanxess AG |
49,593 |
4,203,319 |
|
|
PPG Industries, Inc. |
514,803 |
69,323,372 |
|
|
The Dow Chemical Co. |
1,793,202 |
56,880,367 |
|
|
|
320,218,022 |
||
|
Fertilizers & Agricultural Chemicals - 9.6% |
|||
|
Monsanto Co. |
1,643,348 |
166,027,448 |
|
|
Industrial Gases - 6.5% |
|||
|
Air Products & Chemicals, Inc. |
947,891 |
81,840,909 |
|
|
Airgas, Inc. |
308,866 |
30,973,082 |
|
|
|
112,813,991 |
||
|
Specialty Chemicals - 21.2% |
|||
|
Albemarle Corp. |
671,011 |
43,669,396 |
|
|
Ashland, Inc. |
626,486 |
48,847,113 |
|
|
Balchem Corp. |
32,824 |
1,323,792 |
|
|
Cytec Industries, Inc. |
352,330 |
25,505,169 |
|
|
Ecolab, Inc. |
933,679 |
71,473,127 |
|
|
NewMarket Corp. |
4,004 |
1,007,687 |
|
|
PolyOne Corp. |
333,286 |
7,595,588 |
|
|
Rockwood Holdings, Inc. |
592,132 |
37,067,463 |
|
|
Sherwin-Williams Co. |
302,027 |
48,804,543 |
|
|
Sigma Aldrich Corp. |
511,144 |
39,388,757 |
|
|
W.R. Grace & Co. (a) |
612,196 |
43,820,990 |
|
|
|
368,503,625 |
||
|
TOTAL CHEMICALS |
1,143,308,728 |
||
|
COMMERCIAL SERVICES & SUPPLIES - 0.0% |
|||
|
Environmental & Facility Services - 0.0% |
|||
|
Swisher Hygiene, Inc. (a) |
262,171 |
369,661 |
|
|
CONSTRUCTION MATERIALS - 3.7% |
|||
|
Construction Materials - 3.7% |
|||
|
Lafarge SA (Bearer) |
139,600 |
9,411,637 |
|
|
|
|||
|
Shares |
Value |
||
|
Martin Marietta Materials, Inc. (d) |
206,511 |
$ 20,058,413 |
|
|
Vulcan Materials Co. |
670,556 |
34,151,417 |
|
|
|
63,621,467 |
||
|
CONTAINERS & PACKAGING - 8.6% |
|||
|
Metal & Glass Containers - 5.2% |
|||
|
Aptargroup, Inc. |
668,539 |
36,060,994 |
|
|
Ball Corp. |
937,435 |
41,631,488 |
|
|
Silgan Holdings, Inc. |
316,978 |
13,607,866 |
|
|
|
91,300,348 |
||
|
Paper Packaging - 3.4% |
|||
|
Graphic Packaging Holding Co. (a) |
602,665 |
4,471,774 |
|
|
Rock-Tenn Co. Class A |
611,384 |
54,076,915 |
|
|
|
58,548,689 |
||
|
TOTAL CONTAINERS & PACKAGING |
149,849,037 |
||
|
METALS & MINING - 12.3% |
|||
|
Diversified Metals & Mining - 2.8% |
|||
|
Copper Mountain Mining Corp. (a) |
3,528,527 |
11,017,558 |
|
|
First Quantum Minerals Ltd. (d) |
825,600 |
15,379,177 |
|
|
SunCoke Energy, Inc. (a) |
237,112 |
3,909,977 |
|
|
Turquoise Hill Resources Ltd. (a) |
1,499,940 |
9,585,071 |
|
|
Walter Energy, Inc. (d) |
273,776 |
8,703,339 |
|
|
|
48,595,122 |
||
|
Gold - 4.5% |
|||
|
Allied Nevada Gold Corp. (a) |
630,372 |
11,535,808 |
|
|
Franco-Nevada Corp. |
191,900 |
9,281,912 |
|
|
Goldcorp, Inc. |
786,200 |
25,661,568 |
|
|
Newmont Mining Corp. |
295,221 |
11,894,454 |
|
|
Royal Gold, Inc. |
298,383 |
19,556,022 |
|
|
|
77,929,764 |
||
|
Steel - 5.0% |
|||
|
Carpenter Technology Corp. |
527,172 |
24,898,334 |
|
|
Commercial Metals Co. |
1,157,189 |
18,873,753 |
|
|
Haynes International, Inc. |
275,652 |
14,196,078 |
|
|
Reliance Steel & Aluminum Co. |
445,602 |
29,672,637 |
|
|
|
87,640,802 |
||
|
TOTAL METALS & MINING |
214,165,688 |
||
|
OIL, GAS & CONSUMABLE FUELS - 0.7% |
|||
|
Coal & Consumable Fuels - 0.7% |
|||
|
Peabody Energy Corp. |
554,871 |
11,963,019 |
|
|
PAPER & FOREST PRODUCTS - 6.0% |
|||
|
Forest Products - 0.6% |
|||
|
Canfor Corp. (a) |
499,100 |
9,403,649 |
|
|
Common Stocks - continued |
|||
|
Shares |
Value |
||
|
PAPER & FOREST PRODUCTS - CONTINUED |
|||
|
Paper Products - 5.4% |
|||
|
International Paper Co. |
1,520,766 |
$ 66,928,912 |
|
|
MeadWestvaco Corp. |
762,580 |
27,231,732 |
|
|
|
94,160,644 |
||
|
TOTAL PAPER & FOREST PRODUCTS |
103,564,293 |
||
|
TOTAL COMMON STOCKS (Cost $1,361,969,249) |
|
||
|
Convertible Bonds - 0.4% |
||||
|
|
Principal Amount |
|
||
|
BUILDING PRODUCTS - 0.4% |
||||
|
Building Products - 0.4% |
||||
|
Aspen Aerogels, Inc. 8% 6/1/14 (f) |
|
$ 7,861,200 |
|
|
|
U.S. Treasury Obligations - 0.0% |
||||
|
|
||||
|
U.S. Treasury Bills, yield at date of purchase 0.1% 4/18/13 (e) |
|
290,000 |
|
|
|
Money Market Funds - 8.5% |
|||
|
Shares |
|
||
|
Fidelity Cash Central Fund, 0.16% (b) |
40,086,153 |
40,086,153 |
|
|
Fidelity Securities Lending Cash Central Fund, 0.16% (b)(c) |
107,374,488 |
107,374,488 |
|
|
TOTAL MONEY MARKET FUNDS (Cost $147,460,641) |
|
||
|
TOTAL INVESTMENT PORTFOLIO - 106.1% (Cost $1,517,581,053) |
1,842,453,701 |
||
|
NET OTHER ASSETS (LIABILITIES) - (6.1)% |
(106,263,651) |
||
|
NET ASSETS - 100% |
$ 1,736,190,050 |
||
|
Futures Contracts |
|||||
|
|
Expiration |
Underlying |
Unrealized |
||
|
Purchased |
|||||
|
Equity Index Contracts |
|||||
|
191 CME E-mini S&P Select Sector Materials Index Contracts |
March 2013 |
$ 7,737,410 |
$ 417,650 |
||
|
|
|
The face value of futures purchased as a percentage of net assets is 0.4% |
|
Legend |
|
(a) Non-income producing |
|
(b) Affiliated fund that is generally available only to investment companies and other accounts managed by Fidelity Investments. The rate quoted is the annualized seven-day yield of the fund at period end. A complete unaudited listing of the fund's holdings as of its most recent quarter end is available upon request. In addition, each Fidelity Central Fund's financial statements, which are not covered by the Fund's Report of Independent Registered Public Accounting Firm, are available on the SEC's website or upon request. |
|
(c) Investment made with cash collateral received from securities on loan. |
|
(d) Security or a portion of the security is on loan at period end. |
|
(e) Security or a portion of the security was pledged to cover margin requirements for futures contracts. At the period end, the value of securities pledged amounted to $289,967. |
|
(f) Restricted securities - Investment in securities not registered under the Securities Act of 1933 (excluding 144A issues). At the end of the period, the value of restricted securities (excluding 144A issues) amounted to $7,861,200 or 0.4% of net assets. |
|
Additional information on each restricted holding is as follows: |
|
Security |
Acquisition Date |
Acquisition Cost |
|
Aspen Aerogels, Inc. 8% 6/1/14 |
6/1/11 |
$ 7,861,200 |
|
Affiliated Central Funds |
|
Information regarding fiscal year to date income earned by the Fund from investments in Fidelity Central Funds is as follows: |
|
Fund |
Income earned |
|
Fidelity Cash Central Fund |
$ 104,759 |
|
Fidelity Securities Lending Cash Central Fund |
520,779 |
|
Total |
$ 625,538 |
|
Other Information |
|
The following is a summary of the inputs used, as of February 28, 2013, involving the Fund's assets and liabilities carried at fair value. The inputs or methodology used for valuing securities may not be an indication of the risk associated with investing in those securities. For more information on valuation inputs, and their aggregation into the levels used in the table below, please refer to the Investment Valuation section in the accompanying Notes to Financial Statements. |
|
Valuation Inputs at Reporting Date: |
||||
|
Description |
Total |
Level 1 |
Level 2 |
Level 3 |
|
Investments in Securities: |
||||
|
Common Stocks |
$ 1,686,841,893 |
$ 1,686,841,893 |
$ - |
$ - |
|
Convertible Bonds |
7,861,200 |
- |
- |
7,861,200 |
|
U.S. Treasury Obligations |
289,967 |
- |
289,967 |
- |
|
Money Market Funds |
147,460,641 |
147,460,641 |
- |
- |
|
Total Investments in Securities: |
$ 1,842,453,701 |
$ 1,834,302,534 |
$ 289,967 |
$ 7,861,200 |
|
Derivative Instruments: |
||||
|
Assets |
||||
|
Futures Contracts |
$ 417,650 |
$ 417,650 |
$ - |
$ - |
|
Value of Derivative Instruments |
|
The following table is a summary of the Fund's value of derivative instruments by primary risk exposure as of February 28, 2013. For additional information on derivative instruments, please refer to the Derivative Instruments section in the accompanying Notes to Financial Statements. |
|
Primary Risk Exposure / |
Value |
|
|
|
Asset |
Liability |
|
Equity Risk |
||
|
Futures Contracts (a) |
$ 417,650 |
$ - |
|
Total Value of Derivatives |
$ 417,650 |
$ - |
|
(a) Reflects cumulative appreciation/(depreciation) on futures contracts as disclosed on the Schedule of Investments. Only the period end variation margin is separately disclosed on the Statement of Assets and Liabilities. |
|
Distribution of investments by country or territory of incorporation, as a percentage of total net assets, is as follows. (Unaudited) |
|
United States of America |
89.0% |
|
Netherlands |
4.9% |
|
Canada |
4.7% |
|
France |
1.2% |
|
Others (Individually Less Than 1%) |
0.2% |
|
|
100.0% |
See accompanying notes which are an integral part of the financial statements.
Annual Report
Materials Portfolio
Financial Statements
Statement of Assets and Liabilities
|
|
February 28, 2013 |
|
|
|
|
|
|
Assets |
|
|
|
Investment in securities, at value (including securities loaned of $105,779,869) - See accompanying schedule: Unaffiliated issuers (cost $1,370,120,412) |
$ 1,694,993,060 |
|
|
Fidelity Central Funds (cost $147,460,641) |
147,460,641 |
|
|
Total Investments (cost $1,517,581,053) |
|
$ 1,842,453,701 |
|
Receivable for investments sold |
|
2,511,165 |
|
Receivable for fund shares sold |
|
3,698,364 |
|
Dividends receivable |
|
3,018,349 |
|
Interest receivable |
|
1,100,568 |
|
Distributions receivable from Fidelity Central Funds |
|
45,381 |
|
Receivable for daily variation margin on futures contracts |
|
3,820 |
|
Prepaid expenses |
|
2,248 |
|
Receivable from investment adviser for expense reductions |
|
2,610 |
|
Other receivables |
|
50,560 |
|
Total assets |
|
1,852,886,766 |
|
|
|
|
|
Liabilities |
|
|
|
Payable for investments purchased |
$ 1,546,840 |
|
|
Payable for fund shares redeemed |
6,400,199 |
|
|
Accrued management fee |
805,701 |
|
|
Distribution and service plan fees payable |
131,095 |
|
|
Other affiliated payables |
367,142 |
|
|
Other payables and accrued expenses |
71,251 |
|
|
Collateral on securities loaned, at value |
107,374,488 |
|
|
Total liabilities |
|
116,696,716 |
|
|
|
|
|
Net Assets |
|
$ 1,736,190,050 |
|
Net Assets consist of: |
|
|
|
Paid in capital |
|
$ 1,426,561,342 |
|
Undistributed net investment income |
|
1,139,006 |
|
Accumulated undistributed net realized gain (loss) on investments and foreign currency transactions |
|
(16,797,613) |
|
Net unrealized appreciation (depreciation) on investments and assets and liabilities in foreign currencies |
|
325,287,315 |
|
Net Assets |
|
$ 1,736,190,050 |
Statement of Assets and Liabilities - continued
|
|
February 28, 2013 |
|
|
|
|
|
|
Calculation of Maximum Offering Price Class A: |
|
$ 73.44 |
|
|
|
|
|
Maximum offering price per share (100/94.25 of $73.44) |
|
$ 77.92 |
|
Class T: |
|
$ 73.05 |
|
|
|
|
|
Maximum offering price per share (100/96.50 of $73.05) |
|
$ 75.70 |
|
Class B: |
|
$ 72.21 |
|
|
|
|
|
Class C: |
|
$ 71.96 |
|
|
|
|
|
Materials: |
|
$ 73.68 |
|
|
|
|
|
Institutional Class: |
|
$ 73.57 |
A Redemption price per share is equal to net asset value less any applicable contingent deferred sales charge.
See accompanying notes which are an integral part of the financial statements.
Annual Report
Statement of Operations
|
|
Year ended February 28, 2013 |
|
|
|
|
|
|
Investment Income |
|
|
|
Dividends |
|
$ 29,263,795 |
|
Interest |
|
631,374 |
|
Income from Fidelity Central Funds |
|
625,538 |
|
Total income |
|
30,520,707 |
|
|
|
|
|
Expenses |
|
|
|
Management fee |
$ 7,954,444 |
|
|
Transfer agent fees |
3,476,538 |
|
|
Distribution and service plan fees |
1,291,538 |
|
|
Accounting and security lending fees |
454,958 |
|
|
Custodian fees and expenses |
35,218 |
|
|
Independent trustees' compensation |
9,216 |
|
|
Registration fees |
204,637 |
|
|
Audit |
49,183 |
|
|
Legal |
5,043 |
|
|
Miscellaneous |
14,328 |
|
|
Total expenses before reductions |
13,495,103 |
|
|
Expense reductions |
(137,302) |
13,357,801 |
|
Net investment income (loss) |
|
17,162,906 |
|
Realized and Unrealized Gain (Loss) Net realized gain (loss) on: |
|
|
|
Investment securities: |
|
|
|
Unaffiliated issuers |
18,685,188 |
|
|
Foreign currency transactions |
(38,891) |
|
|
Futures contracts |
1,204,377 |
|
|
Total net realized gain (loss) |
|
19,850,674 |
|
Change in net unrealized appreciation (depreciation) on: Investment securities |
92,958,506 |
|
|
Assets and liabilities in foreign currencies |
(2,983) |
|
|
Futures contracts |
(743,685) |
|
|
Total change in net unrealized appreciation (depreciation) |
|
92,211,838 |
|
Net gain (loss) |
|
112,062,512 |
|
Net increase (decrease) in net assets resulting from operations |
|
$ 129,225,418 |
Statement of Changes in Net Assets
|
|
Year ended |
Year ended |
|
Increase (Decrease) in Net Assets |
|
|
|
Operations |
|
|
|
Net investment income (loss) |
$ 17,162,906 |
$ 11,168,253 |
|
Net realized gain (loss) |
19,850,674 |
34,880,798 |
|
Change in net unrealized appreciation (depreciation) |
92,211,838 |
(65,841,883) |
|
Net increase (decrease) in net assets resulting from operations |
129,225,418 |
(19,792,832) |
|
Distributions to shareholders from net investment income |
(15,064,080) |
(9,840,737) |
|
Distributions to shareholders from net realized gain |
(31,892,999) |
(7,461,289) |
|
Total distributions |
(46,957,079) |
(17,302,026) |
|
Share transactions - net increase (decrease) |
219,532,050 |
(18,941,790) |
|
Redemption fees |
63,898 |
99,276 |
|
Total increase (decrease) in net assets |
301,864,287 |
(55,937,372) |
|
|
|
|
|
Net Assets |
|
|
|
Beginning of period |
1,434,325,763 |
1,490,263,135 |
|
End of period (including undistributed net investment income of $1,139,006 and undistributed net investment income of $797,816, respectively) |
$ 1,736,190,050 |
$ 1,434,325,763 |
See accompanying notes which are an integral part of the financial statements.
Annual Report
Financial Highlights - Class A
|
Years ended February 28, |
2013 |
2012 J |
2011 |
2010 |
2009 |
|
Selected Per-Share Data |
|
|
|
|
|
|
Net asset value, beginning of period |
$ 69.23 |
$ 69.96 |
$ 52.54 |
$ 27.65 |
$ 57.00 |
|
Income from Investment Operations |
|
|
|
|
|
|
Net investment income (loss) C |
.70 |
.40 |
1.08 F |
.30 G |
.22 |
|
Net realized and unrealized gain (loss) |
5.69 |
(.35) |
17.40 |
24.90 |
(29.46) |
|
Total from investment operations |
6.39 |
.05 |
18.48 |
25.20 |
(29.24) |
|
Distributions from net investment income |
(.63) |
(.40) |
(1.06) |
(.32) |
(.12) |
|
Distributions from net realized gain |
(1.55) |
(.38) |
(.01) |
- |
- |
|
Total distributions |
(2.18) |
(.78) |
(1.07) |
(.32) |
(.12) |
|
Redemption fees added to paid in capital C |
- K |
- K |
.01 |
.01 |
.01 |
|
Net asset value, end of period |
$ 73.44 |
$ 69.23 |
$ 69.96 |
$ 52.54 |
$ 27.65 |
|
Total Return A, B |
9.40% |
.21% |
35.33% |
91.25% |
(51.30)% |
|
Ratios to Average Net Assets D, H |
|
|
|
|
|
|
Expenses before reductions |
1.13% |
1.13% |
1.16% |
1.23% |
1.21% |
|
Expenses net of fee waivers, if any |
1.13% |
1.13% |
1.16% |
1.23% |
1.21% |
|
Expenses net of all reductions |
1.12% |
1.13% |
1.15% |
1.22% |
1.20% |
|
Net investment income (loss) |
1.02% |
.61% |
1.81% F |
.65% G |
.47% |
|
Supplemental Data |
|
|
|
|
|
|
Net assets, end of period (000 omitted) |
$ 219,627 |
$ 157,781 |
$ 124,160 |
$ 52,352 |
$ 10,796 |
|
Portfolio turnover rate E |
61% |
94% |
87% |
104% I |
117% |
|
A Total returns would have been lower if certain expenses had not been reduced during the applicable periods shown. B Total returns do not include the effect of the sales charges. C Calculated based on average shares outstanding during the period. D Fees and expenses of any underlying Fidelity Central Funds are not included in the Fund's expense ratio. The Fund indirectly bears its proportionate share of the expenses of any underlying Fidelity Central Funds. E Amount does not include the portfolio activity of any underlying Fidelity Central Funds. F Investment income per share reflects a large, non-recurring dividend which amounted to $.83 per share. Excluding this non-recurring dividend, the ratio of net investment income (loss) to average net assets would have been .41%. G Investment income per share reflects a large, non-recurring dividend which amounted to $.10 per share. Excluding this non-recurring dividend, the ratio of net investment income (loss) to average net assets would have been .43%. H Expense ratios reflect operating expenses of the class. Expenses before reductions do not reflect amounts reimbursed by the investment adviser or reductions from brokerage service arrangements or reductions from other expense offset arrangements and do not represent the amount paid by the class during periods when reimbursements or reductions occur. Expenses net of fee waivers reflect expenses after reimbursement by the investment adviser but prior to reductions from brokerage service arrangements or other expense offset arrangements. Expenses net of all reductions represent the net expenses paid by the class. I The portfolio turnover rate does not include the assets acquired in the merger. J For the year ended February 29. K Amount represents less than $.01 per share. |
Financial Highlights - Class T
|
Years ended February 28, |
2013 |
2012 J |
2011 |
2010 |
2009 |
|
Selected Per-Share Data |
|
|
|
|
|
|
Net asset value, beginning of period |
$ 68.91 |
$ 69.68 |
$ 52.35 |
$ 27.56 |
$ 56.80 |
|
Income from Investment Operations |
|
|
|
|
|
|
Net investment income (loss) C |
.50 |
.21 |
.90 F |
.16 G |
.10 |
|
Net realized and unrealized gain (loss) |
5.66 |
(.35) |
17.34 |
24.81 |
(29.32) |
|
Total from investment operations |
6.16 |
(.14) |
18.24 |
24.97 |
(29.22) |
|
Distributions from net investment income |
(.46) |
(.25) |
(.92) |
(.19) |
(.03) |
|
Distributions from net realized gain |
(1.55) |
(.38) |
- |
- |
- |
|
Total distributions |
(2.02) L |
(.63) |
(.92) |
(.19) |
(.03) |
|
Redemption fees added to paid in capital C |
- K |
- K |
.01 |
.01 |
.01 |
|
Net asset value, end of period |
$ 73.05 |
$ 68.91 |
$ 69.68 |
$ 52.35 |
$ 27.56 |
|
Total Return A, B |
9.10% |
(.09)% |
34.98% |
90.70% |
(51.43)% |
|
Ratios to Average Net Assets D, H |
|
|
|
|
|
|
Expenses before reductions |
1.42% |
1.42% |
1.44% |
1.52% |
1.46% |
|
Expenses net of fee waivers, if any |
1.42% |
1.42% |
1.44% |
1.52% |
1.46% |
|
Expenses net of all reductions |
1.41% |
1.41% |
1.43% |
1.51% |
1.46% |
|
Net investment income (loss) |
.73% |
.33% |
1.54% F |
.35% G |
.22% |
|
Supplemental Data |
|
|
|
|
|
|
Net assets, end of period (000 omitted) |
$ 37,860 |
$ 28,290 |
$ 25,570 |
$ 14,712 |
$ 4,944 |
|
Portfolio turnover rate E |
61% |
94% |
87% |
104% I |
117% |
|
A Total returns would have been lower if certain expenses had not been reduced during the applicable periods shown. B Total returns do not include the effect of the sales charges. C Calculated based on average shares outstanding during the period. D Fees and expenses of any underlying Fidelity Central Funds are not included in the Fund's expense ratio. The Fund indirectly bears its proportionate share of the expenses of any underlying Fidelity Central Funds. E Amount does not include the portfolio activity of any underlying Fidelity Central Funds. F Investment income per share reflects a large, non-recurring dividend which amounted to $.83 per share. Excluding this non-recurring dividend, the ratio of net investment income (loss) to average net assets would have been .14%. G Investment income per share reflects a large, non-recurring dividend which amounted to $.10 per share. Excluding this non-recurring dividend, the ratio of net investment income (loss) to average net assets would have been .14%. H Expense ratios reflect operating expenses of the class. Expenses before reductions do not reflect amounts reimbursed by the investment adviser or reductions from brokerage service arrangements or reductions from other expense offset arrangements and do not represent the amount paid by the class during periods when reimbursements or reductions occur. Expenses net of fee waivers reflect expenses after reimbursement by the investment adviser but prior to reductions from brokerage service arrangements or other expense offset arrangements. Expenses net of all reductions represent the net expenses paid by the class. I The portfolio turnover rate does not include the assets acquired in the merger. J For the year ended February 29. K Amount represents less than $.01 per share. L Total distributions of $2.02 per share is comprised of distributions from net investment income of $.463 and distributions from net realized gain of $1.552 per share. |
See accompanying notes which are an integral part of the financial statements.
Annual Report
Financial Highlights - Class B
|
Years ended February 28, |
2013 |
2012 J |
2011 |
2010 |
2009 |
|
Selected Per-Share Data |
|
|
|
|
|
|
Net asset value, beginning of period |
$ 68.13 |
$ 68.95 |
$ 51.86 |
$ 27.35 |
$ 56.59 |
|
Income from Investment Operations |
|
|
|
|
|
|
Net investment income (loss) C |
.16 |
(.11) |
.60 F |
(.07) G |
(.12) |
|
Net realized and unrealized gain (loss) |
5.57 |
(.33) |
17.13 |
24.61 |
(29.13) |
|
Total from investment operations |
5.73 |
(.44) |
17.73 |
24.54 |
(29.25) |
|
Distributions from net investment income |
(.10) |
- |
(.65) |
(.04) |
- |
|
Distributions from net realized gain |
(1.55) |
(.38) |
- |
- |
- |
|
Total distributions |
(1.65) |
(.38) |
(.65) |
(.04) |
- |
|
Redemption fees added to paid in capital C |
- K |
- K |
.01 |
.01 |
.01 |
|
Net asset value, end of period |
$ 72.21 |
$ 68.13 |
$ 68.95 |
$ 51.86 |
$ 27.35 |
|
Total Return A, B |
8.55% |
(.57)% |
34.29% |
89.79% |
(51.67)% |
|
Ratios to Average Net Assets D, H |
|
|
|
|
|
|
Expenses before reductions |
1.92% |
1.91% |
1.93% |
2.02% |
1.95% |
|
Expenses net of fee waivers, if any |
1.92% |
1.91% |
1.93% |
2.02% |
1.95% |
|
Expenses net of all reductions |
1.91% |
1.91% |
1.92% |
2.01% |
1.95% |
|
Net investment income (loss) |
.24% |
(.17)% |
1.04% F |
(.15)% G |
(.27)% |
|
Supplemental Data |
|
|
|
|
|
|
Net assets, end of period (000 omitted) |
$ 10,218 |
$ 11,040 |
$ 13,507 |
$ 9,538 |
$ 2,601 |
|
Portfolio turnover rate E |
61% |
94% |
87% |
104% I |
117% |
|
A Total returns would have been lower if certain expenses had not been reduced during the applicable periods shown. B Total returns do not include the effect of the contingent deferred sales charge. C Calculated based on average shares outstanding during the period. D Fees and expenses of any underlying Fidelity Central Funds are not included in the Fund's expense ratio. The Fund indirectly bears its proportionate share of the expenses of any underlying Fidelity Central Funds. E Amount does not include the portfolio activity of any underlying Fidelity Central Funds. F Investment income per share reflects a large, non-recurring dividend which amounted to $.83 per share. Excluding this non-recurring dividend, the ratio of net investment income (loss) to average net assets would have been (.35)%. G Investment income per share reflects a large, non-recurring dividend which amounted to $.10 per share. Excluding this non-recurring dividend, the ratio of net investment income (loss) to average net assets would have been (.36)%. H Expense ratios reflect operating expenses of the class. Expenses before reductions do not reflect amounts reimbursed by the investment adviser or reductions from brokerage service arrangements or reductions from other expense offset arrangements and do not represent the amount paid by the class during periods when reimbursements or reductions occur. Expenses net of fee waivers reflect expenses after reimbursement by the investment adviser but prior to reductions from brokerage service arrangements or other expense offset arrangements. Expenses net of all reductions represent the net expenses paid by the class. I The portfolio turnover rate does not include the assets acquired in the merger. J For the year ended February 29. K Amount represents less than $.01 per share. |
Financial Highlights - Class C
|
Years ended February 28, |
2013 |
2012 J |
2011 |
2010 |
2009 |
|
Selected Per-Share Data |
|
|
|
|
|
|
Net asset value, beginning of period |
$ 67.98 |
$ 68.78 |
$ 51.79 |
$ 27.31 |
$ 56.50 |
|
Income from Investment Operations |
|
|
|
|
|
|
Net investment income (loss) C |
.18 |
(.10) |
.61 F |
(.06) G |
(.13) |
|
Net realized and unrealized gain (loss) |
5.55 |
(.32) |
17.09 |
24.57 |
(29.07) |
|
Total from investment operations |
5.73 |
(.42) |
17.70 |
24.51 |
(29.20) |
|
Distributions from net investment income |
(.20) |
- |
(.72) |
(.04) |
- |
|
Distributions from net realized gain |
(1.55) |
(.38) |
- |
- |
- |
|
Total distributions |
(1.75) |
(.38) |
(.72) |
(.04) |
- |
|
Redemption fees added to paid in capital C |
- K |
- K |
.01 |
.01 |
.01 |
|
Net asset value, end of period |
$ 71.96 |
$ 67.98 |
$ 68.78 |
$ 51.79 |
$ 27.31 |
|
Total Return A, B |
8.58% |
(.55)% |
34.29% |
89.82% |
(51.66)% |
|
Ratios to Average Net Assets D, H |
|
|
|
|
|
|
Expenses before reductions |
1.89% |
1.89% |
1.93% |
2.01% |
1.95% |
|
Expenses net of fee waivers, if any |
1.89% |
1.89% |
1.93% |
2.01% |
1.95% |
|
Expenses net of all reductions |
1.88% |
1.89% |
1.92% |
2.00% |
1.95% |
|
Net investment income (loss) |
.26% |
(.15)% |
1.04% F |
(.13)% G |
(.27)% |
|
Supplemental Data |
|
|
|
|
|
|
Net assets, end of period (000 omitted) |
$ 75,007 |
$ 58,296 |
$ 46,525 |
$ 20,469 |
$ 5,509 |
|
Portfolio turnover rate E |
61% |
94% |
87% |
104% I |
117% |
|
A Total returns would have been lower if certain expenses had not been reduced during the applicable periods shown. B Total returns do not include the effect of the contingent deferred sales charge. C Calculated based on average shares outstanding during the period. D Fees and expenses of any underlying Fidelity Central Funds are not included in the Fund's expense ratio. The Fund indirectly bears its proportionate share of the expenses of any underlying Fidelity Central Funds. E Amount does not include the portfolio activity of any underlying Fidelity Central Funds. F Investment income per share reflects a large, non-recurring dividend which amounted to $.83 per share. Excluding this non-recurring dividend, the ratio of net investment income (loss) to average net assets would have been (.35)%. G Investment income per share reflects a large, non-recurring dividend which amounted to $.10 per share. Excluding this non-recurring dividend, the ratio of net investment income (loss) to average net assets would have been (.35)%. H Expense ratios reflect operating expenses of the class. Expenses before reductions do not reflect amounts reimbursed by the investment adviser or reductions from brokerage service arrangements or reductions from other expense offset arrangements and do not represent the amount paid by the class during periods when reimbursements or reductions occur. Expenses net of fee waivers reflect expenses after reimbursement by the investment adviser but prior to reductions from brokerage service arrangements or other expense offset arrangements. Expenses net of all reductions represent the net expenses paid by the class. I The portfolio turnover rate does not include the assets acquired in the merger. J For the year ended February 29. K Amount represents less than $.01 per share. |
See accompanying notes which are an integral part of the financial statements.
Annual Report
Financial Highlights - Materials
|
Years ended February 28, |
2013 |
2012 I |
2011 |
2010 |
2009 |
|
Selected Per-Share Data |
|
|
|
|
|
|
Net asset value, beginning of period |
$ 69.41 |
$ 70.11 |
$ 52.61 |
$ 27.66 |
$ 57.01 |
|
Income from Investment Operations |
|
|
|
|
|
|
Net investment income (loss) B |
.90 |
.60 |
1.25 E |
.43 F |
.38 |
|
Net realized and unrealized gain (loss) |
5.71 |
(.37) |
17.43 |
24.91 |
(29.54) |
|
Total from investment operations |
6.61 |
.23 |
18.68 |
25.34 |
(29.16) |
|
Distributions from net investment income |
(.79) |
(.55) |
(1.16) |
(.40) |
(.20) |
|
Distributions from net realized gain |
(1.55) |
(.38) |
(.03) |
- |
- |
|
Total distributions |
(2.34) |
(.93) |
(1.19) |
(.40) |
(.20) |
|
Redemption fees added to paid in capital B |
- J |
- J |
.01 |
.01 |
.01 |
|
Net asset value, end of period |
$ 73.68 |
$ 69.41 |
$ 70.11 |
$ 52.61 |
$ 27.66 |
|
Total Return A |
9.71% |
.49% |
35.70% |
91.77% |
(51.15)% |
|
Ratios to Average Net Assets C, G |
|
|
|
|
|
|
Expenses before reductions |
.85% |
.85% |
.88% |
.96% |
.90% |
|
Expenses net of fee waivers, if any |
.85% |
.85% |
.88% |
.96% |
.90% |
|
Expenses net of all reductions |
.84% |
.84% |
.87% |
.94% |
.90% |
|
Net investment income (loss) |
1.30% |
.90% |
2.10% E |
.92% F |
.78% |
|
Supplemental Data |
|
|
|
|
|
|
Net assets, end of period (000 omitted) |
$ 1,146,782 |
$ 1,089,619 |
$ 1,195,371 |
$ 604,475 |
$ 127,551 |
|
Portfolio turnover rate D |
61% |
94% |
87% |
104% H |
117% |
|
A Total returns would have been lower if certain expenses had not been reduced during the applicable periods shown. B Calculated based on average shares outstanding during the period. C Fees and expenses of any underlying Fidelity Central Funds are not included in the Fund's expense ratio. The Fund indirectly bears its proportionate share of the expenses of any underlying Fidelity Central Funds. D Amount does not include the portfolio activity of any underlying Fidelity Central Funds. E Investment income per share reflects a large, non-recurring dividend which amounted to $.83 per share. Excluding this non-recurring dividend, the ratio of net investment income (loss) to average net assets would have been ..70%. F Investment income per share reflects a large, non-recurring dividend which amounted to $.10 per share. Excluding this non-recurring dividend, the ratio of net investment income (loss) to average net assets would have been .70%. G Expense ratios reflect operating expenses of the class. Expenses before reductions do not reflect amounts reimbursed by the investment adviser or reductions from brokerage service arrangements or reductions from other expense offset arrangements and do not represent the amount paid by the class during periods when reimbursements or reductions occur. Expenses net of fee waivers reflect expenses after reimbursement by the investment adviser but prior to reductions from brokerage service arrangements or other expense offset arrangements. Expenses net of all reductions represent the net expenses paid by the class. H The portfolio turnover rate does not include the assets acquired in the merger. I For the year ended February 29. J Amount represents less than $.01 per share. |
Financial Highlights - Institutional Class
|
Years ended February 28, |
2013 |
2012 I |
2011 |
2010 |
2009 |
|
Selected Per-Share Data |
|
|
|
|
|
|
Net asset value, beginning of period |
$ 69.35 |
$ 70.05 |
$ 52.58 |
$ 27.66 |
$ 57.00 |
|
Income from Investment Operations |
|
|
|
|
|
|
Net investment income (loss) B |
.90 |
.60 |
1.28 E |
.46 F |
.38 |
|
Net realized and unrealized gain (loss) |
5.70 |
(.36) |
17.40 |
24.89 |
(29.53) |
|
Total from investment operations |
6.60 |
.24 |
18.68 |
25.35 |
(29.15) |
|
Distributions from net investment income |
(.83) |
(.56) |
(1.19) |
(.44) |
(.20) |
|
Distributions from net realized gain |
(1.55) |
(.38) |
(.03) |
- |
- |
|
Total distributions |
(2.38) |
(.94) |
(1.22) |
(.44) |
(.20) |
|
Redemption fees added to paid in capital B |
- J |
- J |
.01 |
.01 |
.01 |
|
Net asset value, end of period |
$ 73.57 |
$ 69.35 |
$ 70.05 |
$ 52.58 |
$ 27.66 |
|
Total Return A |
9.71% |
.50% |
35.73% |
91.79% |
(51.15)% |
|
Ratios to Average Net Assets C, G |
|
|
|
|
|
|
Expenses before reductions |
.85% |
.84% |
.86% |
.94% |
.90% |
|
Expenses net of fee waivers, if any |
.85% |
.84% |
.86% |
.94% |
.90% |
|
Expenses net of all reductions |
.84% |
.83% |
.85% |
.93% |
.90% |
|
Net investment income (loss) |
1.30% |
.91% |
2.11% E |
.94% F |
.78% |
|
Supplemental Data |
|
|
|
|
|
|
Net assets, end of period (000 omitted) |
$ 246,696 |
$ 89,299 |
$ 85,130 |
$ 13,670 |
$ 719 |
|
Portfolio turnover rate D |
61% |
94% |
87% |
104% H |
117% |
|
A Total returns would have been lower if certain expenses had not been reduced during the applicable periods shown. B Calculated based on average shares outstanding during the period. C Fees and expenses of any underlying Fidelity Central Funds are not included in the Fund's expense ratio. The Fund indirectly bears its proportionate share of the expenses of any underlying Fidelity Central Funds. D Amount does not include the portfolio activity of any underlying Fidelity Central Funds. E Investment income per share reflects a large, non-recurring dividend which amounted to $.83 per share. Excluding this non-recurring dividend, the ratio of net investment income (loss) to average net assets would have been ..72%. F Investment income per share reflects a large, non-recurring dividend which amounted to $.10 per share. Excluding this non-recurring dividend, the ratio of net investment income (loss) to average net assets would have been .72%. G Expense ratios reflect operating expenses of the class. Expenses before reductions do not reflect amounts reimbursed by the investment adviser or reductions from brokerage service arrangements or reductions from other expense offset arrangements and do not represent the amount paid by the class during periods when reimbursements or reductions occur. Expenses net of fee waivers reflect expenses after reimbursement by the investment adviser but prior to reductions from brokerage service arrangements or other expense offset arrangements. Expenses net of all reductions represent the net expenses paid by the class. H The portfolio turnover rate does not include the assets acquired in the merger. I For the year ended February 29. J Amount represents less than $.01 per share. |
See accompanying notes which are an integral part of the financial statements.
Annual Report
Notes to Financial Statements
For the period ended February 28, 2013
1. Organization.
Materials Portfolio (the Fund) is a non-diversified fund of Fidelity Select Portfolios (the Trust) and is authorized to issue an unlimited number of shares. The Trust is registered under the Investment Company Act of 1940, as amended (the 1940 Act), as an open-end management investment company organized as a Massachusetts business trust. The Fund invests primarily in securities of companies whose principal business activities fall within specific industries. The Fund offers Class A, Class T, Class C, Materials, and Institutional Class shares, each of which, along with Class B shares, has equal rights as to assets and voting privileges. Class B shares are closed to new accounts and additional purchases, except for exchanges and reinvestments. Each class has exclusive voting rights with respect to matters that affect that class. Class B shares will automatically convert to Class A shares after a holding period of seven years from the initial date of purchase. Investment income, realized and unrealized capital gains and losses, the common expenses of the Fund, and certain fund-level expense reductions, if any, are allocated on a pro-rata basis to each class based on the relative net assets of each class to the total net assets of the Fund. Each class differs with respect to transfer agent and distribution and service plan fees incurred. Certain expense reductions may also differ by class.
2. Investments in Fidelity Central Funds.
The Fund invests in Fidelity Central Funds, which are open-end investment companies available only to other investment companies and accounts managed by Fidelity Management & Research Company (FMR) and its affiliates. The Fund's Schedule of Investments lists each of the Fidelity Central Funds held as of period end, if any, as an investment of the Fund, but does not include the underlying holdings of each Fidelity Central Fund. As an Investing Fund, the Fund indirectly bears its proportionate share of the expenses of the underlying Fidelity Central Funds.
The Money Market Central Funds seek preservation of capital and current income and are managed by Fidelity Investments Money Management, Inc. (FIMM), an affiliate of FMR.
A complete unaudited list of holdings for each Fidelity Central Fund is available upon request or at the Securities and Exchange Commission (the SEC) website at www.sec.gov. In addition, the financial statements of the Fidelity Central Funds, which are not covered by the Fund's Report of Independent Registered Public Accounting Firm, are available on the SEC website or upon request.
3. Significant Accounting Policies.
The financial statements have been prepared in conformity with accounting principles generally accepted in the United States of America (GAAP), which require management to make certain estimates and assumptions at the date of the financial statements. Actual results could differ from those estimates. Subsequent events, if any, through the date that the financial statements were issued have been evaluated in the preparation of the financial statements. The following summarizes the significant accounting policies of the Fund:
Investment Valuation. Investments are valued as of 4:00 p.m. Eastern time on the last calendar day of the period. In accordance with valuation policies and procedures approved by the Board of Trustees (the Board), the Fund attempts to obtain prices from one or more third party pricing vendors or brokers to value its investments. When current market prices, quotations or currency exchange rates are not readily available or reliable, investments will be fair valued in good faith by the FMR Fair Value Committee (the Committee), in accordance with procedures adopted by the Fund's Board. Factors used in determining fair value vary by investment type and may include market or investment specific events, changes in interest rates and credit quality. The frequency with which these procedures are used cannot be predicted and they may be utilized to a significant extent. The Committee oversees the Fund's valuation policies and procedures and is responsible for approving and reporting to the Board all fair value determinations.
The Fund categorizes the inputs to valuation techniques used to value its investments into a disclosure hierarchy consisting of three levels as shown below:
Level 1 - quoted prices in active markets for identical investments
Level 2 - other significant observable inputs (including quoted prices for similar investments, interest rates, prepayment speeds, etc.)
Level 3 - unobservable inputs (including the Fund's own assumptions based on the best information available)
Valuation techniques used to value the Fund's investments by major category are as follows:
Equity securities, including restricted securities, for which market quotations are readily available, are valued at the last reported sale price or official closing price as reported by a third party pricing vendor on the primary market or exchange on which they are traded and are categorized as Level 1 in the hierarchy. In the event there were no sales during the day or closing prices are not available, securities are valued at the last quoted bid price or may be valued using the last available price and are generally categorized as Level 2 in the hierarchy. For foreign equity securities, when significant market or security specific events arise, comparisons to the valuation of American Depositary Receipts (ADRs), futures contracts, Exchange-Traded
Annual Report
3. Significant Accounting Policies - continued
Investment Valuation - continued
Funds (ETFs) and certain indexes as well as quoted prices for similar securities are used and are categorized as Level 2 in the hierarchy. Utilizing these techniques may result in transfers between Level 1 and Level 2.
Debt securities, including restricted securities, are valued based on evaluated prices received from third party pricing vendors or from brokers who make markets in such securities. For corporate bonds and U.S. government and government agency obligations, pricing vendors utilize matrix pricing which considers yield or price of bonds of comparable quality, coupon, maturity and type as well as broker-supplied prices. When independent prices are unavailable or unreliable, debt securities may be valued utilizing pricing methodologies which consider similar factors that would be used by third party pricing vendors. Debt securities are generally categorized as Level 2 in the hierarchy but may be Level 3 depending on the circumstances.
Futures contracts are valued at the settlement price established each day by the board of trade or exchange on which they are traded and are categorized as Level 1 in the hierarchy. Investments in open-end mutual funds, including the Fidelity Central Funds, are valued at their closing net asset value (NAV) each business day and are categorized as Level 1 in the hierarchy.
Changes in valuation techniques may result in transfers in or out of an assigned level within the disclosure hierarchy. The aggregate value of investments by input level, as of February 28, 2013, is included at the end of the Fund's Schedule of Investments.
Foreign Currency. The Fund may use foreign currency contracts to facilitate transactions in foreign-denominated securities. Gains and losses from these transactions may arise from changes in the value of the foreign currency or if the counterparties do not perform under the contracts' terms.
Foreign-denominated assets, including investment securities, and liabilities are translated into U.S. dollars at the exchange rates at period end. Purchases and sales of investment securities, income and dividends received and expenses denominated in foreign currencies are translated into U.S. dollars at the exchange rate in effect on the transaction date.
The effects of exchange rate fluctuations on investments are included with the net realized and unrealized gain (loss) on investment securities. Other foreign currency transactions resulting in realized and unrealized gain (loss) are disclosed separately.
Investment Transactions and Income. For financial reporting purposes, the Fund's investment holdings and NAV include trades executed through the end of the last business day of the period. The NAV per share for processing shareholder transactions is calculated as of the close of business of the New York Stock Exchange (NYSE), normally 4:00 p.m. Eastern time and includes trades executed through the end of the prior business day. Gains and losses on securities sold are determined on the basis of identified cost and may include proceeds received from litigation. Dividend income is recorded on the ex-dividend date, except for certain dividends from foreign securities where the ex-dividend date may have passed, which are recorded as soon as the Fund is informed of the ex-dividend date. Non-cash dividends included in dividend income, if any, are recorded at the fair market value of the securities received. Distributions received on securities that represent a return of capital or capital gain are recorded as a reduction of cost of investments and/or as a realized gain. The Fund estimates the components of distributions received that may be considered return of capital distributions or capital gain distributions. Interest income and distributions from the Fidelity Central Funds are accrued as earned. Interest income includes coupon interest and amortization of premium and accretion of discount on debt securities. Investment income is recorded net of foreign taxes withheld where recovery of such taxes is uncertain.
Expenses. Expenses directly attributable to a fund are charged to that fund. Expenses attributable to more than one fund are allocated among the respective funds on the basis of relative net assets or other appropriate methods. Expense estimates are accrued in the period to which they relate and adjustments are made when actual amounts are known.
Income Tax Information and Distributions to Shareholders. Each year, the Fund intends to qualify as a regulated investment company under Subchapter M of the Internal Revenue Code, including distributing substantially all of its taxable income and realized gains. As a result, no provision for income taxes is required. As of February 28, 2013, the Fund did not have any unrecognized tax benefits in the financial statements; nor is the Fund aware of any tax positions for which it is reasonably possible that the total amounts of unrecognized tax benefits will significantly change in the next twelve months. The Fund files a U.S. federal tax return, in addition to state and local tax returns as required. A fund's federal income tax returns are subject to examination by the Internal Revenue Service (IRS) for a period of three fiscal years after they are filed. State and local tax returns may be subject to examination for an additional fiscal year depending on the jurisdiction. Foreign taxes are provided for based on the Fund's understanding of the tax rules and rates that exist in the foreign markets in which it invests.
Distributions are declared and recorded on the ex-dividend date. Income dividends and capital gain distributions are declared separately for each class. Income and capital gain distributions are determined in accordance with income tax regulations, which may differ from GAAP. In addition, the Fund claimed a portion of the payment made to redeeming shareholders as a distribution for income tax purposes.
Capital accounts within the financial statements are adjusted for permanent book-tax differences. These adjustments have no impact on net assets or the results of operations. Temporary book-tax differences will reverse in a subsequent period.
Annual Report
Notes to Financial Statements - continued
3. Significant Accounting Policies - continued
Income Tax Information and Distributions to Shareholders - continued
Book-tax differences are primarily due to futures contracts, foreign currency transactions, partnerships, passive foreign investment companies (PFIC), deferred trustees compensation, capital loss carryforwards, and losses deferred due to wash sales and excise tax regulations.
The federal tax cost of investment securities and unrealized appreciation (depreciation) as of period end were as follows:
|
Gross unrealized appreciation |
$ 369,676,346 |
|
Gross unrealized depreciation |
(47,344,015) |
|
Net unrealized appreciation (depreciation) on securities and other investments |
$ 322,332,331 |
|
|
|
|
Tax Cost |
$ 1,520,121,370 |
The tax-based components of distributable earnings as of period end were as follows:
|
Undistributed ordinary income |
$ 1,139,008 |
|
Undistributed long-term capital gain |
$ 374,657 |
|
Net unrealized appreciation (depreciation) |
$ 322,329,348 |
The tax character of distributions paid was as follows:
|
|
February 28, 2013 |
February 29, 2012 |
|
Ordinary Income |
$ 15,064,080 |
$ 9,840,737 |
|
Long-term Capital Gains |
31,892,999 |
7,461,289 |
|
Total |
$ 46,957,079 |
$ 17,302,026 |
Capital loss carryforwards are only available to offset future capital gains of the Fund to the extent provided by regulations and may be limited. Under the Regulated Investment Company Modernization Act of 2010 (the Act), the Fund is permitted to carry forward capital losses incurred in taxable years beginning after December 22, 2010 for an unlimited period and such capital losses are required to be used prior to any losses that expire. At February 28, 2013 capital loss carryforwards were as follows:
|
Fiscal year of expiration: |
|
|
2017 |
$ (2,033,557) |
|
2018 |
(1,022,988) |
|
2019 |
(80,787) |
|
Total with expiration |
$ (3,137,332) |
The Fund acquired $3,137,332 of its capital loss carryforward as part of a merger in a prior period. The losses acquired that will be available to offset future capital gains of the Fund will be limited to approximately $611,309 per year.
Trading (Redemption) Fees. Shares held by investors in the Fund less than 30 days are subject to a redemption fee equal to .75% of the net asset value of shares redeemed. All redemption fees, which reduce the proceeds of the shareholder redemption, are retained by the Fund and accounted for as an addition to paid in capital.
Restricted Securities. The Fund may invest in securities that are subject to legal or contractual restrictions on resale. These securities generally may be resold in transactions exempt from registration or to the public if the securities are registered. Disposal of these securities may involve time-consuming negotiations and expense, and prompt sale at an acceptable price may be difficult. Information regarding restricted securities is included at the end of the Fund's Schedule of Investments.
New Accounting Pronouncement. The Financial Accounting Standards Board issued in December 2011, Accounting Standard Update No. 2011-11, Disclosures about Offsetting Assets and Liabilities, and in January 2013, Accounting Standards Update No. 2013-1 Clarifying the Scope of Disclosures about Offsetting Assets and Liabilities. These updates create new disclosure requirements requiring entities to disclose both gross and net information for derivatives and other financial instruments that are either offset in the Statement of Assets and Liabilities or subject to an enforceable master netting arrangement or similar agreement. The disclosure requirements are effective for annual reporting periods beginning on or after January 1, 2013, and interim periods within those annual periods. Management is currently evaluating the impact of the update's adoption on the Fund's financial statement disclosures.
Annual Report
4. Derivative Instruments.
Risk Exposures and the Use of Derivative Instruments. The Fund's investment objective allows the Fund to enter into various types of derivative contracts, including futures contracts. Derivatives are investments whose value is primarily derived from underlying assets, indices or reference rates and may be transacted on an exchange or over-the-counter (OTC). Derivatives may involve a future commitment to buy or sell a specified asset based on specified terms, to exchange future cash flows at periodic intervals based on a notional principal amount, or for one party to make one or more payments upon the occurrence of specified events in exchange for periodic payments from the other party.
The Fund used derivatives to increase returns and to manage exposure to certain risks as defined below. The success of any strategy involving derivatives depends on analysis of numerous economic factors, and if the strategies for investment do not work as intended, the Fund may not achieve its objectives.
The Fund's use of derivatives increased or decreased its exposure to the following risk:
|
Equity Risk |
Equity risk relates to the fluctuations in the value of financial instruments as a result of changes in market prices (other than those arising from interest rate risk or foreign exchange risk), whether caused by factors specific to an individual investment, its issuer, or all factors affecting all instruments traded in a market or market segment. |
The Fund is also exposed to additional risks from investing in derivatives, such as liquidity risk and counterparty credit risk. Liquidity risk is the risk that the Fund will be unable to close out the derivative in the open market in a timely manner. Counterparty credit risk is the risk that the counterparty will not be able to fulfill its obligation to the Fund. Counterparty credit risk related to exchange-traded futures contracts is mitigated by the protection provided by the exchange on which they trade.
Investing in derivatives may involve greater risks than investing in the underlying assets directly and, to varying degrees, may involve risk of loss in excess of any initial investment and collateral received and amounts recognized in the Statement of Assets and Liabilities. In addition, there may be the risk that the change in value of the derivative contract does not correspond to the change in value of the underlying instrument.
Futures Contracts. A futures contract is an agreement between two parties to buy or sell a specified underlying instrument for a fixed price at a specified future date. The Fund used futures contracts to manage its exposure to the stock market.
Upon entering into a futures contract, a fund is required to deposit either cash or securities (initial margin) with a clearing broker in an amount equal to a certain percentage of the face value of the contract. Futures contracts are marked-to-market daily and subsequent payments (variation margin) are made or received by a fund depending on the daily fluctuations in the value of the futures contracts and are recorded as unrealized appreciation or (depreciation). This receivable and/or payable, if any, is included in daily variation margin on futures contracts in the Statement of Assets and Liabilities. Realized gain or (loss) is recorded upon the expiration or closing of a futures contract.
Any open futures contracts at period end are presented in the Schedule of Investments under the caption "Futures Contracts." The underlying face amount at value reflects each contract's exposure to the underlying instrument or index at period end and is representative of activity for the period. Securities deposited to meet initial margin requirements are identified in the Schedule of Investments.
During the period the Fund recognized net realized gain (loss) of $1,204,377 and a change in net unrealized appreciation (depreciation) of $(743,685) related to its investment in futures contracts. These amounts are included in the Statement of Operations.
5. Purchases and Sales of Investments.
Purchases and sales of securities, other than short-term securities, aggregated $1,052,076,740 and $837,936,289, respectively.
6. Fees and Other Transactions with Affiliates.
Management Fee. FMR and its affiliates provide the Fund with investment management related services for which the Fund pays a monthly management fee. The management fee is the sum of an individual fund fee rate that is based on an annual rate of .30% of the Fund's average net assets and an annualized group fee rate that averaged .26% during the period. The group fee rate is based upon the average net assets of all the mutual funds advised by FMR. The group fee rate decreases as assets under management increase and increases as assets under management decrease. For the period, the total annual management fee rate was .56% of the Fund's average net assets.
Annual Report
Notes to Financial Statements - continued
6. Fees and Other Transactions with Affiliates - continued
Distribution and Service Plan Fees. In accordance with Rule 12b-1 of the 1940 Act, the Fund has adopted separate Distribution and Service Plans for each class of shares. Certain classes pay Fidelity Distributors Corporation (FDC), an affiliate of FMR, separate Distribution and Service Fees, each of which is based on an annual percentage of each class' average net assets. In addition, FDC may pay financial intermediaries for selling shares of the Fund and providing shareholder support services. For the period, the Distribution and Service Fee rates, total fees and amounts retained by FDC were as follows:
|
|
Distribution |
Service |
Total Fees |
Retained |
|
Class A |
-% |
.25% |
$ 427,638 |
$ 10,034 |
|
Class T |
.25% |
.25% |
153,568 |
902 |
|
Class B |
.75% |
.25% |
102,442 |
76,934 |
|
Class C |
.75% |
.25% |
607,890 |
167,651 |
|
|
|
|
$ 1,291,538 |
$ 255,521 |
Sales Load. FDC may receive a front-end sales charge of up to 5.75% for selling Class A shares and 3.50% for selling Class T shares, some of which is paid to financial intermediaries for selling shares of the Fund. Depending on the holding period, FDC may receive contingent deferred sales charges levied on Class A, Class T, Class B and Class C redemptions. The deferred sales charges range from 5.00% to 1.00% for Class B shares, 1.00% for Class C shares, 1.00% for certain purchases of Class A shares and .25% for certain purchases of Class T shares.
For the period, sales charge amounts retained by FDC were as follows:
|
|
Retained |
|
Class A |
$ 151,786 |
|
Class T |
13,666 |
|
Class B* |
18,449 |
|
Class C* |
13,222 |
|
|
$ 197,123 |
* When Class B and Class C shares are initially sold, FDC pays commissions from its own resources to financial intermediaries through which the sales are made.
Transfer Agent Fees. Fidelity Investments Institutional Operations Company, Inc., (FIIOC), an affiliate of FMR, is the transfer, dividend disbursing and shareholder servicing agent for each class of the Fund. FIIOC receives account fees and asset-based fees that vary according to the account size and type of account of the shareholders of the respective classes of the Fund. FIIOC pays for typesetting, printing and mailing of shareholder reports, except proxy statements. For the period, transfer agent fees for each class were as follows:
|
|
Amount |
% of |
|
Class A |
$ 461,680 |
.27 |
|
Class T |
94,591 |
.31 |
|
Class B |
30,998 |
.30 |
|
Class C |
165,490 |
.27 |
|
Materials |
2,436,019 |
.24 |
|
Institutional Class |
287,760 |
.24 |
|
|
$ 3,476,538 |
|
Accounting and Security Lending Fees. Fidelity Service Company, Inc. (FSC), an affiliate of FMR, maintains the Fund's accounting records. The accounting fee is based on the level of average net assets for each month. Under a separate contract, FSC administers the security lending program. The security lending fee is based on the number and duration of lending transactions.
Brokerage Commissions. The Fund placed a portion of its portfolio transactions with brokerage firms which are affiliates of the investment adviser. The commissions paid to these affiliated firms were $14,947 for the period.
7. Committed Line of Credit.
The Fund participates with other funds managed by FMR or an affiliate in a $4.25 billion credit facility (the "line of credit") to be utilized for temporary or emergency purposes to fund shareholder redemptions or for other short-term liquidity purposes. The Fund has agreed to pay commitment fees on its pro-rata portion of the line of credit, which amounted to $3,636 and is reflected in Miscellaneous expenses on the Statement of Operations. During the period, there were no borrowings on this line of credit.
Annual Report
8. Security Lending.
The Fund lends portfolio securities through a lending agent from time to time in order to earn additional income. For equity securities, a lending agent is used and may loan securities to certain qualified borrowers, including Fidelity Capital Markets (FCM), a broker-dealer affiliated with the Fund. On the settlement date of the loan, the Fund receives collateral (in the form of U.S. Treasury obligations, letters of credit and/or cash) against the loaned securities and maintains collateral in an amount not less than 100% of the market value of the loaned securities during the period of the loan. The market value of the loaned securities is determined at the close of business of the Fund and any additional required collateral is delivered to the Fund on the next business day. If the borrower defaults on its obligation to return the securities loaned because of insolvency or other reasons, a fund could experience delays and costs in recovering the securities loaned or in gaining access to the collateral. Any cash collateral received is invested in the Fidelity Securities Lending Cash Central Fund. The value of loaned securities and cash collateral at period end are disclosed on the Fund's Statement of Assets and Liabilities. Security lending income represents the income earned on investing cash collateral, less rebates paid to borrowers and any lending agent fees associated with the loan, plus any premium payments received for lending certain types of securities. Security lending income is presented in the Statement of Operations as a component of income from Fidelity Central Funds. Total security lending income during the period amounted to $520,779. During the period, there were no securities loaned to FCM.
9. Expense Reductions.
Many of the brokers with whom FMR places trades on behalf of the Fund provided services to the Fund in addition to trade execution. These services included payments of certain expenses on behalf of the Fund totaling $134,582 for the period. In addition, through arrangements with the Fund's custodian, credits realized as a result of uninvested cash balances were used to reduce the Fund's expenses. During the period, these credits reduced the Fund's custody expenses by $110.
In addition, FMR reimbursed a portion of the Fund's operating expenses during the period in the amount of $2,610.
10. Distributions to Shareholders.
Distributions to shareholders of each class were as follows:
|
|
Year Ended |
Year Ended |
|
From net investment income |
|
|
|
Class A |
$ 1,631,593 |
$ 868,107 |
|
Class T |
221,281 |
100,314 |
|
Class B |
14,451 |
- |
|
Class C |
183,511 |
- |
|
Materials |
11,420,509 |
8,266,851 |
|
Institutional Class |
1,592,735 |
605,465 |
|
Total |
$ 15,064,080 |
$ 9,840,737 |
|
From net realized gain |
|
|
|
Class A |
$ 3,967,803 |
$ 816,536 |
|
Class T |
717,303 |
151,869 |
|
Class B |
228,009 |
66,321 |
|
Class C |
1,411,838 |
312,224 |
|
Materials |
22,783,457 |
5,701,275 |
|
Institutional Class |
2,784,589 |
413,064 |
|
Total |
$ 31,892,999 |
$ 7,461,289 |
11. Share Transactions.
Transactions for each class of shares were as follows:
|
|
Shares |
Dollars |
||
|
|
Year Ended |
Year Ended |
Year Ended |
Year Ended |
|
Class A |
|
|
|
|
|
Shares sold |
1,611,922 |
1,406,389 |
$ 112,576,195 |
$ 95,285,956 |
|
Reinvestment of distributions |
68,775 |
23,605 |
4,804,595 |
1,462,799 |
|
Shares redeemed |
(969,159) |
(925,476) |
(66,285,158) |
(60,145,567) |
|
Net increase (decrease) |
711,538 |
504,518 |
$ 51,095,632 |
$ 36,603,188 |
Annual Report
Notes to Financial Statements - continued
11. Share Transactions - continued
|
|
Shares |
Dollars |
||
|
|
Year Ended |
Year Ended |
Year Ended |
Year Ended |
|
Class T |
|
|
|
|
|
Shares sold |
205,283 |
150,265 |
$ 14,234,477 |
$ 10,197,019 |
|
Reinvestment of distributions |
12,892 |
3,964 |
896,667 |
244,682 |
|
Shares redeemed |
(110,407) |
(110,682) |
(7,498,384) |
(7,174,563) |
|
Net increase (decrease) |
107,768 |
43,547 |
$ 7,632,760 |
$ 3,267,138 |
|
Class B |
|
|
|
|
|
Shares sold |
21,997 |
35,651 |
$ 1,493,049 |
$ 2,318,398 |
|
Reinvestment of distributions |
3,022 |
909 |
207,121 |
55,554 |
|
Shares redeemed |
(45,545) |
(70,403) |
(3,081,508) |
(4,524,937) |
|
Net increase (decrease) |
(20,526) |
(33,843) |
$ (1,381,338) |
$ (2,150,985) |
|
Class C |
|
|
|
|
|
Shares sold |
423,105 |
456,374 |
$ 29,248,360 |
$ 30,369,453 |
|
Reinvestment of distributions |
19,249 |
4,184 |
1,317,196 |
254,995 |
|
Shares redeemed |
(257,585) |
(279,339) |
(17,263,032) |
(17,740,501) |
|
Net increase (decrease) |
184,769 |
181,219 |
$ 13,302,524 |
$ 12,883,947 |
|
Materials |
|
|
|
|
|
Shares sold |
5,306,846 |
6,950,456 |
$ 372,534,797 |
$ 471,314,225 |
|
Reinvestment of distributions |
464,930 |
214,200 |
32,543,457 |
13,299,700 |
|
Shares redeemed |
(5,905,812) |
(8,516,169) |
(406,043,890) |
(562,008,908) |
|
Net increase (decrease) |
(134,036) |
(1,351,513) |
$ (965,636) |
$ (77,394,983) |
|
Institutional Class |
|
|
|
|
|
Shares sold |
2,986,457 |
1,444,894 |
$ 212,651,449 |
$ 97,144,756 |
|
Reinvestment of distributions |
54,139 |
13,291 |
3,797,777 |
824,595 |
|
Shares redeemed |
(975,090) |
(1,385,770) |
(66,601,118) |
(90,119,446) |
|
Net increase (decrease) |
2,065,506 |
72,415 |
$ 149,848,108 |
$ 7,849,905 |
12. Other.
The Fund's organizational documents provide former and current trustees and officers with a limited indemnification against liabilities arising in connection with the performance of their duties to the Fund. In the normal course of business, the Fund may also enter into contracts that provide general indemnifications. The Fund's maximum exposure under these arrangements is unknown as this would be dependent on future claims that may be made against the Fund. The risk of material loss from such claims is considered remote.
Annual Report
Report of Independent Registered Public Accounting Firm
To the Trustees of Fidelity Select Portfolios and the Shareholders of Chemicals Portfolio, Gold Portfolio and Materials Portfolio:
In our opinion, the accompanying statements of assets and liabilities (consolidated statement of assets and liabilities for Gold Portfolio), including the schedules of investments (consolidated schedule of investments for Gold Portfolio), and the related statements of operations (consolidated statement of operations for Gold Portfolio) and of changes in net assets (consolidated changes in net assets for Gold Portfolio) and the financial highlights present fairly, in all material respects, the financial position of Chemicals Portfolio, Gold Portfolio and Materials Portfolio (funds of Fidelity Select Portfolios) at February 28, 2013, the results of each of their operations for the year then ended, the changes in each of their net assets for the two years in the period then ended and each of their financial highlights for the five years in the period then ended, in conformity with accounting principles generally accepted in the United States of America. These financial statements and financial highlights (hereafter referred to as "financial statements") are the responsibility of the Fidelity Select Portfolios' management. Our responsibility is to express an opinion on these financial statements based on our audits. We conducted our audits of these financial statements in accordance with the standards of the Public Company Accounting Oversight Board (United States). Those standards require that we plan and perform the audit to obtain reasonable assurance about whether the financial statements are free of material misstatement. An audit includes examining, on a test basis, evidence supporting the amounts and disclosures in the financial statements, assessing the accounting principles used and significant estimates made by management, and evaluating the overall financial statement presentation. We believe that our audits, which included confirmation of securities at February 28, 2013 by correspondence with the custodian and brokers, provide a reasonable basis for our opinion.
PricewaterhouseCoopers LLP
Boston, Massachusetts
Annual Report
Trustees and Officers
The Trustees, Members of the Advisory Board, and executive officers of the trust and funds, as applicable, are listed below. The Board of Trustees governs each fund and is responsible for protecting the interests of shareholders. The Trustees are experienced executives who meet periodically throughout the year to oversee each fund's activities, review contractual arrangements with companies that provide services to each fund, oversee management of the risks associated with such activities and contractual arrangements, and review each fund's performance. Except for James C. Curvey, each of the Trustees oversees 234 Fidelity funds. Mr. Curvey oversees 453 Fidelity funds.
The Trustees hold office without limit in time except that (a) any Trustee may resign; (b) any Trustee may be removed by written instrument, signed by at least two-thirds of the number of Trustees prior to such removal; (c) any Trustee who requests to be retired or who has become incapacitated by illness or injury may be retired by written instrument signed by a majority of the other Trustees; and (d) any Trustee may be removed at any special meeting of shareholders by a two-thirds vote of the outstanding voting securities of the trust. Each Trustee who is not an interested person of the trust and the funds (as defined in the 1940 Act) (Independent Trustee), shall retire not later than the last day of the calendar year in which his or her 75th birthday occurs. The Independent Trustees may waive this mandatory retirement age policy with respect to individual Trustees. The executive officers and Advisory Board Members hold office without limit in time, except that any officer and Advisory Board Member may resign or may be removed by a vote of a majority of the Trustees at any regular meeting or any special meeting of the Trustees. Except as indicated, each individual has held the office shown or other offices in the same company for the past five years.
Experience, Skills, Attributes, and Qualifications of the Funds' Trustees. The Governance and Nominating Committee has adopted a statement of policy that describes the experience, qualifications, attributes, and skills that are necessary and desirable for potential Independent Trustee candidates (Statement of Policy). The Board believes that each Trustee satisfied at the time he or she was initially elected or appointed a Trustee, and continues to satisfy, the standards contemplated by the Statement of Policy. The Governance and Nominating Committee also engages professional search firms to help identify potential Independent Trustee candidates who have the experience, qualifications, attributes, and skills consistent with the Statement of Policy. From time to time, additional criteria based on the composition and skills of the current Independent Trustees, as well as experience or skills that may be appropriate in light of future changes to board composition, business conditions, and regulatory or other developments, have also been considered by the professional search firms and the Governance and Nominating Committee. In addition, the Board takes into account the Trustees' commitment and participation in Board and committee meetings, as well as their leadership of standing and ad hoc committees throughout their tenure.
In determining that a particular Trustee was and continues to be qualified to serve as a Trustee, the Board has considered a variety of criteria, none of which, in isolation, was controlling. The Board believes that, collectively, the Trustees have balanced and diverse experience, qualifications, attributes, and skills, which allow the Board to operate effectively in governing each fund and protecting the interests of shareholders. Information about the specific experience, skills, attributes, and qualifications of each Trustee, which in each case led to the Board's conclusion that the Trustee should serve (or continue to serve) as a trustee of the funds, is provided below.
Board Structure and Oversight Function. James C. Curvey is an interested person (as defined in the 1940 Act) and currently serves as Chairman. The Trustees have determined that an interested Chairman is appropriate and benefits shareholders because an interested Chairman has a personal and professional stake in the quality and continuity of services provided to the funds. Independent Trustees exercise their informed business judgment to appoint an individual of their choosing to serve as Chairman, regardless of whether the Trustee happens to be independent or a member of management. The Independent Trustees have determined that they can act independently and effectively without having an Independent Trustee serve as Chairman and that a key structural component for assuring that they are in a position to do so is for the Independent Trustees to constitute a substantial majority for the Board. The Independent Trustees also regularly meet in executive session. Ned C. Lautenbach serves as Chairman of the Independent Trustees and as such (i) acts as a liaison between the Independent Trustees and management with respect to matters important to the Independent Trustees and (ii) with management prepares agendas for Board meetings.
Fidelity funds are overseen by different Boards of Trustees. The funds' Board oversees Fidelity's equity and high income funds and another Board oversees Fidelity's investment-grade bond, money market, and asset allocation funds. The asset allocation funds may invest in Fidelity funds overseen by the funds' Board. The use of separate Boards, each with its own committee structure, allows the Trustees of each group of Fidelity funds to focus on the unique issues of the funds they oversee, including common research, investment, and operational issues. On occasion, the separate Boards establish joint committees to address issues of overlapping consequences for the Fidelity funds overseen by each Board.
The Trustees operate using a system of committees to facilitate the timely and efficient consideration of all matters of importance to the Trustees, each fund, and fund shareholders and to facilitate compliance with legal and regulatory requirements and oversight of the funds' activities and associated risks. The Board, acting through its committees, has charged FMR and its affiliates with (i) identifying events or circumstances the occurrence of which could have demonstrably adverse effects on the funds' business and/or reputation; (ii) implementing processes and controls to lessen the possibility that such events or circumstances occur or to mitigate the effects of such events or circumstances if they do occur; and (iii) creating and maintaining a system designed to evaluate continuously business and market conditions in order to facilitate the identification and implementation processes described in (i) and (ii) above. Because the day-to-day operations and activities of the funds are carried out by or through FMR, its affiliates and other service providers, the funds' exposure to risks is mitigated but not eliminated by the processes overseen by the Trustees. While each of the Board's committees has responsibility for overseeing different aspects of the funds' activities, oversight is exercised primarily through the Operations, Audit, and Compliance Committees. In addition, the Independent Trustees have worked with FMR to enhance the Board's oversight of investment and financial risks, legal and regulatory risks, technology risks, and operational risks, including the development of additional risk reporting to the Board. For example, a working group comprised of Independent Trustees and FMR has worked and continues to work to review the Fidelity funds' valuation-related activities, reporting and risk management. Appropriate personnel, including but not limited to the funds' Chief Compliance Officer (CCO), FMR's internal auditor, the independent accountants, the funds' Treasurer and portfolio management personnel, make periodic reports to the Board's committees, as appropriate, including an annual review of FMR's risk management program for the Fidelity funds. The responsibilities of each standing committee, including their oversight responsibilities, are described further under "Standing Committees of the Funds' Trustees."
Annual Report
The funds' Statement of Additional Information (SAI) includes more information about the Trustees. To request a free copy, call Fidelity at 1-800-544-8544.
Interested Trustees*:
Correspondence intended for each Trustee who is an interested person may be sent to Fidelity Investments, 245 Summer Street, Boston, Massachusetts 02210.
|
Name, Year of Birth; Principal Occupations and Other Relevant Experience+ |
|
|
James C. Curvey (1935) |
|
|
|
Year of Election or Appointment: 2007 Mr. Curvey is Trustee and Chairman of the Board of Trustees of certain Trusts. Mr. Curvey also serves as Trustee (2007-present) of other investment companies advised by FMR. Mr. Curvey is a Director of Fidelity Investments Money Management, Inc. (2009-present), Director of Fidelity Research & Analysis Co. (2009-present) and Director of FMR and FMR Co., Inc. (2007-present). Mr. Curvey is also Vice Chairman (2007-present) and Director of FMR LLC. In addition, Mr. Curvey serves as an Overseer for the Boston Symphony Orchestra and a member of the Trustees of Villanova University. Previously, Mr. Curvey was the Vice Chairman (2006-2007) and Director (2000-2007) of FMR Corp. |
|
Ronald P. O'Hanley (1957) |
|
|
|
Year of Election or Appointment: 2011 Mr. O'Hanley is Director of FMR Co., Inc. (2010-present), Director of Fidelity Investments Money Management, Inc. (2010-present), Director of Fidelity Research & Analysis Company (2010-present), President of Fidelity Asset Management and Corporate Services and a member of Fidelity's Executive Committee (2010-present). Previously, Mr. O'Hanley served as President and Chief Executive Officer of BNY Mellon Asset Management (2007-2010). Mr. O'Hanley also served as Vice Chairman of Bank New York Mellon Corp. and a member of that firm's Executive Committee. Prior to the 2007 merger of The Bank of New York and Mellon Financial Corporation, he was Vice Chairman of Mellon Financial Corporation and President and Chief Executive Officer of Mellon Asset Management. He joined Mellon in February 1997. Mr. O'Hanley currently serves as Chairman of the Boston Public Library Foundation Board of Directors and sits on the Board of Directors of Beth Israel Deaconess Medical Center, the Board of Trustees of the Marine Biological Laboratory and the Advisory Board of the Maxwell School of Citizenship and Public Administration at Syracuse University. Mr. O'Hanley also chairs the Council on Asset Management for the Financial Services Roundtable and is a member of the Board of Directors of Institutional Investor's U.S. Institute. |
* Trustees have been determined to be "Interested Trustees" by virtue of, among other things, their affiliation with the trust or various entities under common control with FMR.
+ The information above includes each Trustee's principal occupation during the last five years and other information relating to the experience, attributes, and skills relevant to each Trustee's qualifications to serve as a Trustee, which led to the conclusion that each Trustee should serve as a Trustee for each fund.
Independent Trustees:
Correspondence intended for each Independent Trustee (that is, the Trustees other than the Interested Trustees) may be sent to Fidelity Investments, P.O. Box 55235, Boston, Massachusetts 02205-5235.
|
Name, Year of Birth; Principal Occupations and Other Relevant Experience+ |
|
|
Dennis J. Dirks (1948) |
|
|
|
Year of Election or Appointment: 2005 Prior to his retirement in May 2003, Mr. Dirks was Chief Operating Officer and a member of the Board of The Depository Trust & Clearing Corporation (DTCC). He also served as President, Chief Operating Officer, and Board member of The Depository Trust Company (DTC) and President and Board member of the National Securities Clearing Corporation (NSCC). In addition, Mr. Dirks served as Chief Executive Officer and Board member of the Government Securities Clearing Corporation, Chief Executive Officer and Board member of the Mortgage-Backed Securities Clearing Corporation, as a Trustee and a member of the Finance Committee of Manhattan College (2005-2008), and as a Trustee and a member of the Finance Committee of AHRC of Nassau County (2006-2008). Mr. Dirks is a member of the Independent Directors Council (IDC) Governing Council (2010-present) and Board of Directors for The Brookville Center for Children's Services, Inc. (2009-present). |
|
Alan J. Lacy (1953) |
|
|
|
Year of Election or Appointment: 2008 Mr. Lacy serves as Senior Adviser (2007-present) of Oak Hill Capital Partners, L.P. (private equity). Mr. Lacy also served as Chief Executive Officer (2000-2005) and Vice Chairman (2005-2006) of Sears Holdings Corporation and Sears, Roebuck and Co. (retail). In addition, Mr. Lacy serves as a member of the Board of Directors of Dave & Buster's Entertainment, Inc. (restaurant and entertainment complexes, 2010-present), Earth Fare, Inc. (retail grocery, 2012-present), The Hillman Companies, Inc. (hardware wholesalers, 2010-present), and Bristol-Myers Squibb Company (global pharmaceuticals, 2008-present). Mr. Lacy is a member of the Board of Trustees of The National Parks Conservation Association (2006-present). Previously, Mr. Lacy served as Chairman of the Board of Trustees of the National Parks Conservation Association (2008-2011) and as a member of the Board of Directors for the Western Union Company (global money transfer, 2006-2011). |
|
Ned C. Lautenbach (1944) |
|
|
|
Year of Election or Appointment: 2000 Mr. Lautenbach is Chairman of the Independent Trustees of the Equity and High Income Funds (2006-present). Mr. Lautenbach currently serves as the Lead Director of the Eaton Corporation Board of Directors (diversified industrial, 1997-present). Mr. Lautenbach is Chairman of the Board of Directors of the Philharmonic Center for the Arts in Naples, Florida (2012-present) and a member of the Council on Foreign Relations (1994-present). Previously, Mr. Lautenbach was a Partner/Advisory Partner at Clayton, Dubilier & Rice, LLC (private equity investment, 1998-2010), as well as a Director of Sony Corporation (2006-2007). |
|
Joseph Mauriello (1944) |
|
|
|
Year of Election or Appointment: 2008 Prior to his retirement in January 2006, Mr. Mauriello served in numerous senior management positions including Deputy Chairman and Chief Operating Officer (2004-2005), and Vice Chairman of Financial Services (2002-2004) of KPMG LLP US (professional services, 1965-2005). Mr. Mauriello currently serves as a member of the Board of Directors of XL Group plc. (global insurance and re-insurance, 2006-present). Previously, Mr. Mauriello served as a Director of the Hamilton Funds of the Bank of New York (2006-2007) and of Arcadia Resources Inc. (health care services and products, 2007-2012). |
|
Robert W. Selander (1950) |
|
|
|
Year of Election or Appointment: 2011 Previously, Mr. Selander served as a Member of the Advisory Board of Fidelity's Equity and High Income Funds (2011), Executive Vice Chairman (2010), Chief Executive Officer (2009-2010), and President and Chief Executive Officer (1997-2009) of Mastercard, Inc. |
|
Cornelia M. Small (1944) |
|
|
|
Year of Election or Appointment: 2005 Ms. Small is a member of the Board of Directors (2009-present) and Chair of the Investment Committee (2010-present) of the Teagle Foundation. Ms. Small also serves on the Investment Committee of the Berkshire Taconic Community Foundation (2008-present). Previously, Ms. Small served as Chairperson (2002-2008) and a member of the Investment Committee and Chairperson (2008-2012) and a member of the Board of Trustees of Smith College. In addition, Ms. Small served as Chief Investment Officer, Director of Global Equity Investments, and a member of the Board of Directors of Scudder, Stevens & Clark and Scudder Kemper Investments. |
|
William S. Stavropoulos (1939) |
|
|
|
Year of Election or Appointment: 2001 Mr. Stavropoulos is Vice Chairman of the Independent Trustees of the Equity and High Income Funds (2006-present). Mr. Stavropoulos serves as President and Founder of the Michigan Baseball Foundation, the Great Lakes Loons (2007-present). Mr. Stavropoulos is Chairman Emeritus of the Board of Directors of The Dow Chemical Company, where he previously served in numerous senior management positions, including President, CEO (1995-2000; 2002-2004), Chairman of the Executive Committee (2000-2006), and as a member of the Board of Directors (1990-2006). Currently, Mr. Stavropoulos is a Director of Univar Inc. (global distributor of commodity and specialty chemicals, Chairman from 2010-May 2012 and Lead Director from May 2012-present), Teradata Corporation (data warehousing and technology solutions, 2008-present), Maersk Inc. (industrial conglomerate), and Tyco International, Ltd. (multinational manufacturing and services, 2007-present), and a member of the Advisory Board for Metalmark Capital LLC (private equity investment, 2005-present). Mr. Stavropoulos is an operating advisor to Clayton, Dubilier & Rice, LLC (private equity investment). In addition, Mr. Stavropoulos is a member of the University of Notre Dame Advisory Council for the College of Science, a Trustee of the Rollin L. Gerstacker Foundation, and a Director of the Naples Philharmonic Center for the Arts. Previously, Mr. Stavropoulos served as a Director of Chemical Financial Corporation (bank holding company, 1993-2012). |
|
David M. Thomas (1949) |
|
|
|
Year of Election or Appointment: 2008 Previously, Mr. Thomas served as Executive Chairman (2005-2006) and Chairman and Chief Executive Officer (2000-2005) of IMS Health, Inc. (pharmaceutical and healthcare information solutions), and a Director of Fortune Brands, Inc. (consumer products, 2000-2011). In addition, Mr. Thomas serves as Non-Executive Chairman of the Board of Directors of Fortune Brands Home and Security (home and security products, 2011-present), and as a member of the Board of Directors of Interpublic Group of Companies, Inc. (marketing communication, 2004-present). |
|
Michael E. Wiley (1950) |
|
|
|
Year of Election or Appointment: 2008 Mr. Wiley also serves as a Director of Asia Pacific Exploration Consolidated (international oil and gas exploration and production, 2008-present). Mr. Wiley serves as a Director of Tesoro Corporation (independent oil refiner and marketer, 2005-present), and a Director of Bill Barrett Corporation (exploration and production, 2005-present). In addition, Mr. Wiley also serves as a Director of Post Oak Bank (privately-held bank, 2004-present). Previously, Mr. Wiley served as a member of the Board of Trustees of the University of Tulsa (2000-2006; 2007-2010), as a Senior Energy Advisor of Katzenbach Partners, LLC (consulting, 2006-2007), as an Advisory Director of Riverstone Holdings (private investment), Chairman, President, and CEO of Baker Hughes, Inc. (oilfield services, 2000-2004), and as Director of Spinnaker Exploration Company (exploration and production, 2001-2005). |
+ The information above includes each Trustee's principal occupation during the last five years and other information relating to the experience, attributes, and skills relevant to each Trustee's qualifications to serve as a Trustee, which led to the conclusion that each Trustee should serve as a Trustee for each fund.
Advisory Board Members and Executive Officers:
Correspondence intended for David A. Rosow and Garnett A. Smith may be sent to Fidelity Investments, P.O. Box 55235, Boston, Massachusetts 02205-5235. Correspondence intended for each executive officer and Peter S. Lynch may be sent to Fidelity Investments, 245 Summer Street, Boston, Massachusetts 02210.
|
Name, Year of Birth; Principal Occupation |
|
|
Peter S. Lynch (1944) |
|
|
|
Year of Election or Appointment: 2003 Member of the Advisory Board of Fidelity's Equity and High Income Funds. Mr. Lynch is Vice Chairman and a Director of FMR and FMR Co., Inc. In addition, Mr. Lynch serves as a Trustee of Boston College and as the Chairman of the Inner-City Scholarship Fund. Previously, Mr. Lynch served on the Special Olympics International Board of Directors (1997-2006). |
|
David A. Rosow (1942) |
|
|
|
Year of Election or Appointment: 2012 Member of the Advisory Board of Fidelity's Equity and High Income Funds. Chairman and Chief Executive Officer of International Golf Group, Inc. (golf course development, 1989-present). Previously, Mr. Rosow served as Chairman and Chief Executive Officer of Rosow & Company, Inc. (private investment company, 1989-2011), a Lead Director of Hudson United Bancorp (2001-2006) and as a Director of TD Banknorth (1996-2006). In addition, Mr. Rosow is a member (2008-present) and President (2009-present) of the Town Council of Palm Beach, Florida. |
|
Garnett A. Smith (1947) |
|
|
|
Year of Election or Appointment: 2012 Member of the Advisory Board of Fidelity's Equity and High Income Funds. Prior to Mr. Smith's retirement, he served as Chairman and Chief Executive Officer of Inbrand Corp. (manufacturer of personal absorbent products, 1990-1997). He also served as President (1986-1990) of Inbrand Corp. Prior to his employment with Inbrand Corp., he was employed by a retail fabric chain and North Carolina National Bank. In addition, Mr. Smith is a board member of the Jackson Hole Land Trust (2009-present). |
|
Kenneth B. Robins (1969) |
|
|
|
Year of Election or Appointment: 2008 President and Treasurer of Fidelity's Equity and High Income Funds. Mr. Robins also serves as President and Treasurer (2010-present) and Assistant Treasurer (2009-present) of other Fidelity funds and is an employee of Fidelity Investments (2004-present). Previously, Mr. Robins served as Deputy Treasurer of the Fidelity funds (2005-2008) and Treasurer and Chief Financial Officer of The North Carolina Capital Management Trust: Cash and Term Portfolios (2006-2008). |
|
Brian B. Hogan (1964) |
|
|
|
Year of Election or Appointment: 2009 Vice President of Equity and High Income Funds. Mr. Hogan also serves as President of FMR's Equity Division (2009-present). Previously, Mr. Hogan served as Senior Vice President, Equity Research of FMR (2006-2009) and as a portfolio manager. |
|
Christopher S. Bartel (1971) |
|
|
|
Year of Election or Appointment: 2009 Vice President of Fidelity's Sector and Real Estate Equity Funds. Mr. Bartel also serves as a Director, President, and Chief Executive Officer of Fidelity Management & Research (Japan) Inc. (2012-present), a Director of Fidelity Management & Research (Hong Kong) (2012-present), and Senior Vice President of Global Equity Research (2010-present). Previously, Mr. Bartel served as Senior Vice President of Equity Research (2009-2010), Managing Director of Research (2006-2009), and an analyst and portfolio manager (2000-2006). |
|
Scott C. Goebel (1968) |
|
|
|
Year of Election or Appointment: 2008 Secretary and Chief Legal Officer (CLO) of the Fidelity funds. Mr. Goebel also serves as Secretary of Fidelity Investments Money Management, Inc. (FIMM) (2010-present) and Fidelity Research and Analysis Company (FRAC) (2010-present); Secretary and CLO of The North Carolina Capital Management Trust: Cash and Term Portfolios (2008-present); General Counsel, Secretary, and Senior Vice President of FMR (2008-present) and FMR Co., Inc. (2008-present); employed by FMR LLC or an affiliate (2001-present); Chief Legal Officer of Fidelity Management & Research (Hong Kong) Limited (2008-present) and Assistant Secretary of Fidelity Management & Research (Japan) Inc. (2008-present), and Fidelity Management & Research (U.K.) Inc. (2008-present). Previously, Mr. Goebel served as Assistant Secretary of FIMM (2008-2010), FRAC (2008-2010), and the Funds (2007-2008) and as Vice President and Secretary of Fidelity Distributors Corporation (FDC) (2005-2007). |
|
William C. Coffey (1969) |
|
|
|
Year of Election or Appointment: 2009 Assistant Secretary of Fidelity's Equity and High Income Funds. Mr. Coffey also serves as Senior Vice President and Deputy General Counsel of FMR LLC (2010-present), and is an employee of Fidelity Investments. Previously, Mr. Coffey served as Vice President and Associate General Counsel of FMR LLC (2005-2009). |
|
Elizabeth Paige Baumann (1968) |
|
|
|
Year of Election or Appointment: 2012 Anti-Money Laundering (AML) Officer of the Fidelity funds. Ms. Baumann also serves as AML Officer of The North Carolina Capital Management Trust: Cash and Term Portfolios (2012-present), Chief AML Officer of FMR LLC (2012-present), and is an employee of Fidelity Investments. Previously, Ms. Baumann served as Vice President and Deputy Anti-Money Laundering Officer (2007-2012). |
|
Christine Reynolds (1958) |
|
|
|
Year of Election or Appointment: 2008 Chief Financial Officer of the Fidelity funds. Ms. Reynolds became President of Fidelity Pricing and Cash Management Services (FPCMS) in August 2008. Ms. Reynolds served as Chief Operating Officer of FPCMS (2007-2008). Previously, Ms. Reynolds served as President, Treasurer, and Anti-Money Laundering officer of the Fidelity funds (2004-2007). |
|
Joseph A. Hanlon (1968) |
|
|
|
Year of Election or Appointment: 2012 Chief Compliance Officer of Fidelity's Equity and High Income Funds. Mr. Hanlon serves as Compliance Officer of FMR, FMR Co., Inc., Fidelity Investments Money Management, Inc. (FIMM), Fidelity Research and Analysis Company (FRAC), Fidelity Management & Research (Japan) Inc., Fidelity Management & Research (U.K.) Inc., Fidelity Management & Research (Hong Kong), and Strategic Advisers, Inc. (2009-present), as Senior Vice President of the Fidelity Asset Management Division (2009-present), and is an employee of Fidelity Investments. |
|
Joseph F. Zambello (1957) |
|
|
|
Year of Election or Appointment: 2011 Deputy Treasurer of the Fidelity funds. Mr. Zambello is an employee of Fidelity Investments. Previously, Mr. Zambello served as Vice President of FMR's Program Management Group (2009-2011) and Vice President of the Transfer Agent Oversight Group (2005-2009). |
|
Adrien E. Deberghes (1967) |
|
|
|
Year of Election or Appointment: 2008 Deputy Treasurer of Fidelity's Equity and High Income Funds. Mr. Deberghes also serves as Vice President (2011-present) and Assistant Treasurer (2010-present) of other Fidelity funds, and is an employee of Fidelity Investments (2008-present). Previously, Mr. Deberghes served as Senior Vice President of Mutual Fund Administration at State Street Corporation (2007-2008), Senior Director of Mutual Fund Administration at Investors Bank & Trust (2005-2007), and Director of Finance for Dunkin' Brands (2000-2005). |
|
Stephen Sadoski (1971) |
|
|
|
Year of Election or Appointment: 2012 Deputy Treasurer of Fidelity's Equity and High Income Funds. Mr. Sadoski also serves as Deputy Treasurer of other Fidelity funds (2013-present) and is an employee of Fidelity Investments (2012-present). Previously, Mr. Sadoski served as Assistant Treasurer of Fidelity's Fixed Income and Asset Allocation Funds (2012-2013), an assistant chief accountant in the Division of Investment Management of the Securities and Exchange Commission (SEC) (2009-2012) and as a senior manager at Deloitte & Touche (1997-2009). |
|
Stacie Smith (1974) |
|
|
|
Year of Election or Appointment: 2013 Deputy Treasurer of Fidelity's Equity and High Income Funds. Ms. Smith is an employee of Fidelity Investments (2009-present). Previously, Ms. Smith served as Senior Audit Manager of Ernst & Young LLP (1996-2009). |
|
Stephanie J. Dorsey (1969) |
|
|
|
Year of Election or Appointment: 2010 Assistant Treasurer of Fidelity's Equity and High Income Funds. Ms. Dorsey also serves as President and Treasurer (2013-present) and Assistant Treasurer (2012-present) of other Fidelity funds and is an employee of Fidelity Investments (2008-present). Previously, Ms. Dorsey served as Deputy Treasurer of Fidelity's Fixed Income and Asset Allocation Funds (2008-2013), Treasurer (2004-2008) of the JPMorgan Mutual Funds and Vice President (2004-2008) of JPMorgan Chase Bank. |
|
John R. Hebble (1958) |
|
|
|
Year of Election or Appointment: 2009 Assistant Treasurer of Fidelity's Equity and High Income Funds. Mr. Hebble also serves as President (2011-present), Treasurer, and Chief Financial Officer of The North Carolina Capital Management Trust: Cash and Term Portfolios (2008-present) and is an employee of Fidelity Investments. Previously, Mr. Hebble served as President and Treasurer of Fidelity's Fixed Income and Asset Allocation Funds (2008-2013). |
|
Gary W. Ryan (1958) |
|
|
|
Year of Election or Appointment: 2005 Assistant Treasurer of the Fidelity funds. Mr. Ryan is an employee of Fidelity Investments. Previously, Mr. Ryan served as Vice President of Fund Reporting in Fidelity Pricing and Cash Management Services (FPCMS) (1999-2005). |
|
Jonathan Davis (1968) |
|
|
|
Year of Election or Appointment: 2010 Assistant Treasurer of the Fidelity funds. Mr. Davis is also Assistant Treasurer of Fidelity Rutland Square Trust II and Fidelity Commonwealth Trust II. Mr. Davis is an employee of Fidelity Investments. Previously, Mr. Davis served as Vice President and Associate General Counsel of FMR LLC (2003-2010). |
Annual Report
Distributions (Unaudited)
The Board of Trustees of each fund voted to pay to shareholders of record at the opening of business on record date the following distributions per share derived from capital gains realized from sales of portfolio securities and dividends derived from net investment income:
|
|
Pay Date |
Record Date |
Dividends |
Capital Gains |
|
Chemicals Portfolio |
04/15/13 |
$0.327 |
$1.659 |
|
|
Gold Portfolio |
04/15/13 |
04/12/13 |
$0.000 |
$0.000 |
|
Materials Portfolio |
04/15/13 |
04/12/13 |
$0.062 |
$0.017 |
The funds hereby designate as capital gain dividend the amounts noted below for the taxable year ended February 28, 2013, or, if subsequently determined to be different, the net capital gain of such year.
|
Chemicals Portfolio |
$23,247,045 |
|
Materials Portfolio |
$25,407,156 |
A percentage of the dividends distributed during the fiscal year for the following funds qualify for the dividends-received deduction for corporate shareholders:
|
|
April 2012 |
December 2012 |
|
Chemicals Portfolio |
100% |
74% |
|
Materials Portfolio |
100% |
100% |
A percentage of the dividends distributed during the fiscal year for the following funds may be taken into account as a dividend for purposes of the maximum rate under section 1(h) (11) of the Internal Revenue Code:
|
|
April 2012 |
December 2012 |
|
Chemicals Portfolio |
100% |
75% |
|
Materials Portfolio |
100% |
100% |
The funds will notify shareholders in January 2014 of amounts for use in preparing 2013 income tax returns.
Annual Report
Board Approval of Investment Advisory Contracts and Management Fees
Chemicals Portfolio
Gold Portfolio
Materials Portfolio
On November 14, 2012, the Board of Trustees, including the Independent Trustees (together, the Board), voted to approve a new management contract (the New Contracts) between each fund and Fidelity SelectCo, LLC (SelectCo) to submit the New Contracts to shareholders for their approval. If the New Contracts are approved by shareholders, effective August 1, 2013, SelectCo will serve as investment adviser to each fund. The terms of the New Contracts are identical to those of the current management contracts with FMR (the Current Contracts), except with respect to the name of the investment adviser and the dates of execution and the initial two-year term of the contract. The Board, assisted by the advice of fund counsel and Independent Trustees' counsel, considered a broad range of information.
In determining whether to approve the New Contracts for the funds, the Board was aware that shareholders in the funds have a broad range of investment choices available to them, including a wide choice among mutual funds offered by competitors to Fidelity, and that each fund's shareholders, with the opportunity to review and weigh the disclosure provided by the fund in its prospectus and other public disclosures, have chosen to invest in the fund, managed by Fidelity.
Nature, Extent, and Quality of Services Provided. The Board considered the nature, quality, cost and extent of the services to be provided by SelectCo under the New Contracts as well as the nature, quality, cost and extent of the advisory, administrative, distribution and shareholder services performed by the FMR and the sub-advisers, and by affiliated companies. The Board considered that, upon shareholder approval, SelectCo will render the same services to the funds under the New Contracts that FMR currently renders to the funds under the Current Contracts. The Board also considered that the New Contracts would not result in any changes to (i) the investment process or strategies employed in the management of the funds' assets or (ii) the day-to-day management of the funds or the persons primarily responsible for such management.
Throughout the year, the Trustees had discussions with FMR about plans to establish SelectCo as a new investment adviser to manage sector-based funds and products. The Trustees considered Fidelity's rationale for creating a separate investment adviser and noted that a separate investment adviser may be better positioned to focus on opportunities for growth within the sector investing space and to focus on a distinct approach to sector investing and research.
Shareholder and Administrative Services. The Board noted that the growth of fund assets across the complex allows Fidelity to reinvest in the development of services designed to enhance the value or convenience of the Fidelity funds as investment vehicles. These services include 24-hour access to account information and market information through phone representatives and over the Internet, and investor education materials and asset allocation tools.
Investment in a Large Fund Family. The Board considered the benefits to shareholders of investing in a Fidelity fund, including the benefits of investing in a fund that is part of a large family of funds offering a variety of investment disciplines and providing for a large variety of mutual fund shareholder services.
Investment Performance. The Board did not consider performance to be a material factor in its decision to approve the New Contracts because the New Contracts would not result in any changes to the funds' investment processes or strategies or in the persons primarily responsible for the day-to-day management of the funds.
Based on its review, the Board concluded that the nature, extent, and quality of the services provided to each fund will benefit the fund's shareholders, particularly in light of the Board's view that the fund's shareholders benefit from investing in a fund that is part of a large family of funds offering a variety of investment disciplines and services.
Competitiveness of Management Fee and Total Fund Expenses. The Board considered that, if approved by shareholders, the New Contracts would not result in any changes to the amount of the management fees paid by the funds, except that such fees would be paid to SelectCo rather than FMR. The Board noted that at previous meetings during the year it received and considered materials relating to its review of the management fee of each fund. This information includes comparisons that focus on a fund's standing relative to the total universe of comparable funds available to investors in terms of gross management fees before expense reimbursements or caps, as well as a fund's standing relative to non-Fidelity funds similar in size to the fund within the comparison group.
Based on its review, the Board concluded that each fund's management fee was fair and reasonable in light of the services that the fund receives and the other factors considered.
Because there are no expected changes in the funds' management fees under the New Contracts, the Board will review each fund's total expenses compared to competitive fund median expenses in connection with its future consideration of the renewal of the funds' management contracts and sub-advisory agreements.
Annual Report
Board Approval of Investment Advisory Contracts and Management Fees - continued
In its review of total expenses, the Board also noted that at previous meetings during the year it received and considered materials relating to its review of total expenses for each Fidelity fund. This information includes Fidelity fee structures and other information with respect to clients of FMR and its affiliates, such as other mutual funds advised or sub-advised by FMR or its affiliates, pension plan clients, and other institutional clients.
Costs of the Services and Profitability. Because there were no changes to the services to be provided or fees to be charged to the funds under the New Contracts, the Board did not consider data regarding the impact on Fidelity's costs of services, revenues, or profitability from the new arrangements to be a significant factor in its decision.
In connection with its future consideration of the renewal of each fund's management contract and sub-advisory agreements, the Board will consider the revenues earned and the expenses incurred by Fidelity in conducting the business of developing, marketing, distributing, managing, administering and servicing the funds and their shareholders.
Economies of Scale. The Board recognized that the New Contracts, like the Current Contracts, incorporate a "group fee" structure, which provides for lower fee rates as total fund assets under FMR's management increase, and for higher fee rates as total fund assets under FMR's management decrease. The Board considered that the group fee is designed to deliver the benefits of economies of scale to fund shareholders when total fund assets increase, even if assets of any particular fund are unchanged or have declined, because some portion of Fidelity's costs are attributable to services provided to all Fidelity funds, and all funds benefit if those costs can be allocated among more assets. The Board concluded that, given the group fee structure, fund shareholders will achieve a certain level of economies of scale as assets under FMR's management increase at the fund complex level, regardless of whether Fidelity achieves any such economies of scale.
In connection with its future consideration of the renewal of each fund's management contract and sub-advisory agreements, the Board will consider whether there have been economies of scale in respect of the management of the Fidelity funds, whether the Fidelity funds (including the funds) have appropriately benefited from any such economies of scale, and whether there is potential for realization of any further economies of scale.
Based on its evaluation of all of the conclusions noted above, and after considering all material factors, the Board ultimately concluded that each New Contract is fair and reasonable, and that the New Contracts should be approved and submitted to the applicable funds' shareholders for their approval.
Annual Report
Investment Adviser
Fidelity Management & Research Company
Boston, MA
Investment Sub-Advisers
FMR Co., Inc.
Fidelity Management & Research
(U.K.) Inc.
Fidelity Management & Research
(Japan) Inc.
Fidelity Management & Research
(Hong Kong) Limited
General Distributor
Fidelity Distributors Corporation
Smithfield, RI
Transfer and Service Agents
Fidelity Investments Institutional Operations Company, Inc.
Boston, MA
Fidelity Service Company, Inc.
Boston, MA
Custodian
Brown Brothers Harriman & Co.
Boston, MA
Corporate Headquarters
245 Summer Street
Boston, MA 02210
1-800-544-8888
The Fidelity Telephone Connection
Mutual Fund 24-Hour Service
Exchanges/Redemptions
and Account Assistance 1-800-544-6666
Product Information 1-800-544-8888
Retirement Accounts 1-800-544-4774
(8 a.m. - 9 p.m.)
TDD Service 1-800-544-0118
for the deaf and hearing impaired
(9 a.m. - 9 p.m. Eastern time)
Fidelity Automated Service
Telephone (FAST®)
1-800-544-5555
Automated line for quickest service

SELMT-UANNPRO-0413
1.910424.103
Fidelity®
Select Portfolios®
Telecommunications Services Sector
Telecommunications Portfolio
Wireless Portfolio
Annual Report
February 28, 2013
(Fidelity Cover Art)
Contents
|
Telecommunications Portfolio |
Performance |
|
|
|
Management's Discussion |
|
|
|
Shareholder Expense Example |
|
|
|
Investment Changes |
|
|
|
Investments |
|
|
|
Financial Statements |
|
|
|
Notes to the Financial Statements |
|
|
Wireless Portfolio |
Performance |
|
|
|
Management's Discussion |
|
|
|
Shareholder Expense Example |
|
|
|
Investment Changes |
|
|
|
Investments |
|
|
|
Financial Statements |
|
|
|
Notes to the Financial Statements |
|
|
Report of Independent Registered Public Accounting Firm |
|
|
|
Trustees and Officers |
|
|
|
Distributions |
|
|
|
Board Approval of Investment Advisory Contracts and Management Fees |
|
To view a fund's proxy voting guidelines and proxy voting record for the 12-month period ended June 30, visit http://www.fidelity.com/proxyvotingresults or visit the Securities and Exchange Commission's (SEC) web site at http://www.sec.gov. You may also call 1-800-544-8544 to request a free copy of the proxy voting guidelines.
Standard & Poor's, S&P and S&P 500 are registered service marks of The McGraw-Hill Companies, Inc. and have been licensed for use by Fidelity Distributors Corporation.
Other third-party marks appearing herein are the property of their respective owners.
All other marks appearing herein are registered or unregistered trademarks or service marks of FMR LLC or an affiliated company. © 2013 FMR LLC. All rights reserved.
This report and the financial statements contained herein are submitted for the general information of the shareholders of the funds. This report is not authorized for distribution to prospective investors in the funds unless preceded or accompanied by an effective prospectus.
A fund files its complete schedule of portfolio holdings with the SEC for the first and third quarters of each fiscal year on Form N-Q. Forms N-Q are available on the SEC's web site at http://www.sec.gov. A fund's Forms N-Q may be reviewed and copied at the SEC's Public Reference Room in Washington, DC. Information regarding the operation of the SEC's Public Reference Room may be obtained by calling 1-800-SEC-0330. For a complete list of a fund's portfolio holdings, view the most recent holdings listing, semiannual report, or annual report on Fidelity's web site at http://www.fidelity.com, http://www.advisor.fidelity.com, or http://www.401k.com, as applicable.
NOT FDIC INSURED • MAY LOSE VALUE • NO BANK GUARANTEE
Neither the funds nor Fidelity Distributors Corporation is a bank.
Annual Report
Performance: The Bottom Line
Average annual total return reflects the change in the value of an investment, assuming reinvestment of the class' distributions from dividend income and capital gains (the profits earned upon the sale of securities that have grown in value, if any) and assuming a constant rate of performance each year. The $10,000 table and the fund's returns do not reflect the deduction of taxes that a shareholder would pay on fund distributions or the redemption of fund shares. During periods of reimbursement by Fidelity, a fund's total returns will be greater than it would be had the reimbursement not occurred. How a fund did yesterday is no guarantee of how it will do tomorrow.
Average Annual Total Returns
|
Periods ended February 28, 2013 |
Past 1 |
Past 5 |
Past 10 |
|
Telecommunications Portfolio |
14.30% |
5.75% |
9.60% |
$10,000 Over 10 Years
Let's say hypothetically that $10,000 was invested in Telecommunications Portfolio, a class of the fund, on February 28, 2003. The chart shows how the value of your investment would have changed, and also shows how the S&P 500® Index performed over the same period.
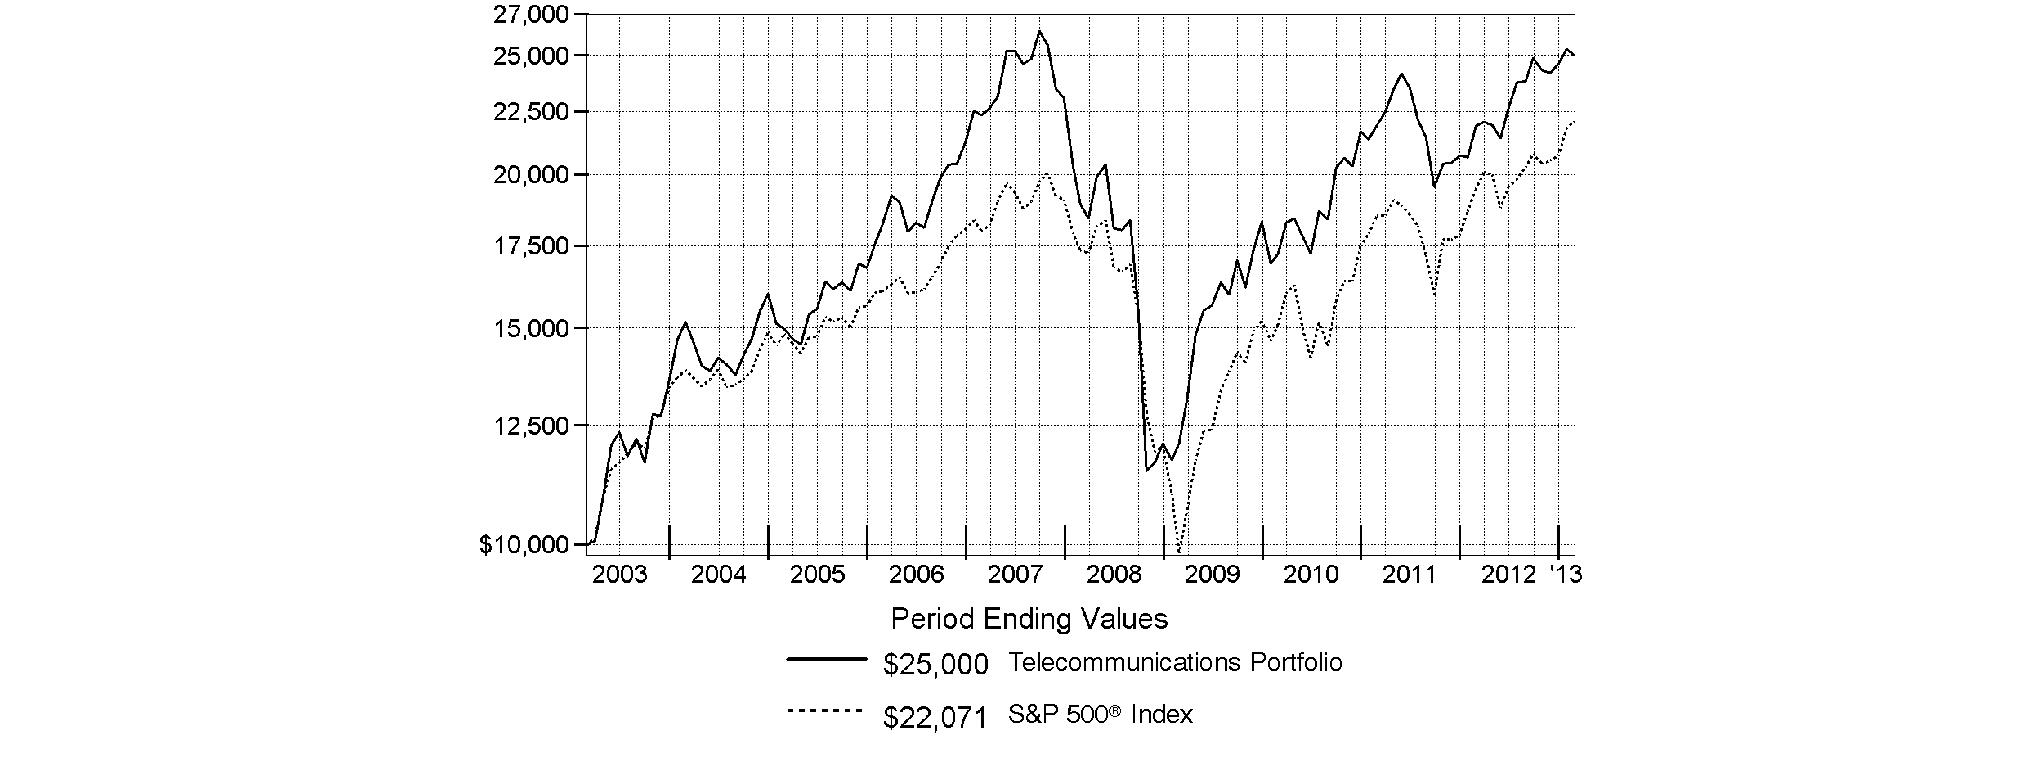
Annual Report
Telecommunications Portfolio
Management's Discussion of Fund Performance
Market Recap: U.S. stocks posted solid gains for the year ending February 28, 2013, sparked by a late-period rally that pushed major equity benchmarks to multiyear highs. Improvement in the global economy and more monetary stimulus from the U.S. Federal Reserve kept markets on the upswing for much of the year, shrugging off an early decline brought on by debt woes in Europe, and another dip later in the period amid Congressional gridlock on the federal budget. Renewed optimism over employment, the housing market, corporate earnings and record dividends made stocks a favorite with investors during the 12 months, which helped push the broad-based S&P 500® Index across the milestone 1,500 mark at the end of January. The S&P 500® finished the period up 13.46%. Seven of the 10 major market sectors tracked by MSCI U.S. IMI 25-50 classifications produced double-digit gains, led by health care and financials, while information technology, energy and materials trailed the broad equity market with only modest advances.
Comments from Matthew Drukker, who became Portfolio Manager of Telecommunications Portfolio on January 22, 2013: For the year, the fund's Retail Class shares advanced 14.30%, trailing the 15.35% result of the MSCI® U.S. IMI Telecommunications Services 25-50 Index, but outpacing the S&P 500®. The market experienced some turbulent swings this period, and investors generally favored large integrated telecom stocks because of their high dividend yields and more-defensive characteristics. Not surprisingly, a significant driver of the fund's and index's solid absolute returns was their heavy exposure - 55% and 63% average weightings, respectively - to the group. That said, the fund did give up some ground to the MSCI index during the period due to forced underweightings - stemming from diversification rules imposed under the Internal Revenue Code - in telecom giants Verizon Communications and AT&T, which together comprised about 45% of the sector benchmark. Verizon, the fund's biggest relative detractor, and AT&T performed quite well over the one-year stretch, each boasting a double-digit return. Alaskan telecom provider General Communications was another miss. The fund owned a larger-than-benchmark stake in the stock, as the prior manager believed this company would grow faster than many of its U.S. integrated telecom counterparts. Unfortunately, stocks of companies with exposure to Alaska were often influenced by temperamental oil prices. Overweighting integrated telecom CenturyLink weighed on performance, particularly when the stock plunged late in the period after the company reported weak fourth-quarter results, cut its quarterly dividend and issued mixed guidance. Elsewhere, wireless broadband mobile services provider MetroPCS Communications lagged the sector benchmark early on and the fund's slightly overweighted position at that time hurt performance. Conversely, the fund tended to steer clear of small-cap integrated telecom companies with subscale operations and declining revenues, which was the right call during the year, as largely avoiding benchmark components that fit these criteria - such as Elephant Talk Communications, Lumos Networks and Alaska Communications Systems Group, and underweighting Windstream - were among the fund's biggest contributors. Elephant Talk provides software and services to telecom companies across the globe. Its exposure to the hard-hit eurozone, along with disappointing financial results, caused shares to plummet. Avoiding Lumos Networks, a fiber-based network services provider operating in the Mid-Atlantic region, and underweighting integrated telecom firm Windstream was beneficial, as shares of both index components tumbled on poor financial results. Lastly, Alaska Communications was hurt by its exposure to this state, as the price of oil - the state's primary source of revenue - was volatile during the period.
The views expressed above reflect those of the portfolio manager(s) only through the end of the period as stated on the cover of this report and do not necessarily represent the views of Fidelity or any other person in the Fidelity organization. Any such views are subject to change at any time based upon market or other conditions and Fidelity disclaims any responsibility to update such views. These views may not be relied on as investment advice and, because investment decisions for a Fidelity fund are based on numerous factors, may not be relied on as an indication of trading intent on behalf of any Fidelity fund.
Annual Report
Telecommunications Portfolio
Shareholder Expense Example
As a shareholder of the Fund, you incur two types of costs: (1) transaction costs, including sales charges (loads) on purchase payments or redemption proceeds, redemption fees and (2) ongoing costs, including management fees, distribution and/or service (12b-1) fees and other Fund expenses. This Example is intended to help you understand your ongoing costs (in dollars) of investing in the Fund and to compare these costs with the ongoing costs of investing in other mutual funds.
The Example is based on an investment of $1,000 invested at the beginning of the period and held for the entire period (September 1, 2012 to February 28, 2013).
Actual Expenses
The first line of the accompanying table for each class of the Fund provides information about actual account values and actual expenses. You may use the information in this line, together with the amount you invested, to estimate the expenses that you paid over the period. Simply divide your account value by $1,000.00 (for example, an $8,600 account value divided by $1,000.00 = 8.6), then multiply the result by the number in the first line for a class of the Fund under the heading entitled "Expenses Paid During Period" to estimate the expenses you paid on your account during this period. A small balance maintenance fee of $12.00 that is charged once a year may apply for certain accounts with a value of less than $2,000. This fee is not included in the table below. If it was, the estimate of expenses you paid during the period would be higher, and your ending account value lower, by this amount. In addition, the Fund, as a shareholder in the underlying Fidelity Central Funds, will indirectly bear its pro-rata share of the fees and expenses incurred by the underlying Fidelity Central Funds. These fees and expenses are not included in the Fund's annualized expense ratio used to calculate the expense estimate in the table below.
Hypothetical Example for Comparison Purposes
The second line of the accompanying table for each class of the Fund provides information about hypothetical account values and hypothetical expenses based on a Class' actual expense ratio and an assumed rate of return of 5% per year before expenses, which is not the Class' actual return. The hypothetical account values and expenses may not be used to estimate the actual ending account balance or expenses you paid for the period. You may use this information to compare the ongoing costs of investing in the Fund and other funds. To do so, compare this 5% hypothetical example with the 5% hypothetical examples that appear in the shareholder reports of the other funds. A small balance maintenance fee of $12.00 that is charged once a year may apply for certain accounts with a value of less than $2,000. This fee is not included in the table below. If it was, the estimate of expenses you paid during the period would be higher, and your ending account value lower, by this amount. In addition, the Fund, as a shareholder in the underlying Fidelity Central Funds, will indirectly bear its pro-rata share of the fees and expenses incurred by the underlying Fidelity Central Funds. These fees and expenses are not included in the Fund's annualized expense ratio used to calculate the expense estimate in the table below.
Please note that the expenses shown in the table are meant to highlight your ongoing costs only and do not reflect any transaction costs. Therefore, the second line of the table is useful in comparing ongoing costs only, and will not help you determine the relative total costs of owning different funds. In addition, if these transactional costs were included, your costs would have been higher.
|
|
Annualized |
Beginning |
Ending |
Expenses Paid |
|
Class A |
1.18% |
|
|
|
|
Actual |
|
$ 1,000.00 |
$ 1,049.00 |
$ 5.99 |
|
HypotheticalA |
|
$ 1,000.00 |
$ 1,018.94 |
$ 5.91 |
|
Class T |
1.47% |
|
|
|
|
Actual |
|
$ 1,000.00 |
$ 1,047.60 |
$ 7.46 |
|
HypotheticalA |
|
$ 1,000.00 |
$ 1,017.50 |
$ 7.35 |
|
Class B |
1.93% |
|
|
|
|
Actual |
|
$ 1,000.00 |
$ 1,045.20 |
$ 9.79 |
|
HypotheticalA |
|
$ 1,000.00 |
$ 1,015.22 |
$ 9.64 |
|
Class C |
1.90% |
|
|
|
|
Actual |
|
$ 1,000.00 |
$ 1,045.20 |
$ 9.63 |
|
HypotheticalA |
|
$ 1,000.00 |
$ 1,015.37 |
$ 9.49 |
|
Telecommunications |
.86% |
|
|
|
|
Actual |
|
$ 1,000.00 |
$ 1,050.80 |
$ 4.37 |
|
HypotheticalA |
|
$ 1,000.00 |
$ 1,020.53 |
$ 4.31 |
|
Institutional Class |
.82% |
|
|
|
|
Actual |
|
$ 1,000.00 |
$ 1,051.00 |
$ 4.17 |
|
HypotheticalA |
|
$ 1,000.00 |
$ 1,020.73 |
$ 4.11 |
A 5% return per year before expenses
* Expenses are equal to each Class' annualized expense ratio, multiplied by the average account value over the period, multiplied by 181/365 (to reflect the one-half year period).
Annual Report
Telecommunications Portfolio
Investment Changes (Unaudited)
|
Top Ten Stocks as of February 28, 2013 |
||
|
|
% of fund's |
% of fund's net assets |
|
Verizon Communications, Inc. |
25.3 |
18.1 |
|
American Tower Corp. |
7.1 |
0.0 |
|
AT&T, Inc. |
6.6 |
21.5 |
|
SBA Communications Corp. Class A |
5.6 |
5.0 |
|
CenturyLink, Inc. |
5.6 |
9.6 |
|
Vodafone Group PLC sponsored ADR |
4.4 |
3.3 |
|
Sprint Nextel Corp. |
3.9 |
5.1 |
|
Telephone & Data Systems, Inc. |
2.9 |
2.9 |
|
Clearwire Corp. Class A |
2.6 |
1.7 |
|
General Communications, Inc. Class A |
2.5 |
2.6 |
|
|
66.5 |
|
|
Top Industries (% of fund's net assets) |
|||
|
As of February 28, 2013 |
|||
|
Diversified Telecommunication Services |
56.9% |
|
|
Wireless Telecommunication Services |
28.0% |
|
|
Real Estate Investment Trusts |
7.1% |
|
|
Media |
2.1% |
|
|
Electronic Equipment & Components |
1.5% |
|
|
All Others* |
4.4% |
|

|
As of August 31, 2012 |
|||
|
Diversified Telecommunication Services |
67.3% |
|
|
Wireless Telecommunication Services |
27.5% |
|
|
Media |
1.7% |
|
|
Software |
0.2% |
|
 |
Communications Equipment |
0.0% |
|
|
All Others* |
3.3% |
|

|
* Includes short-term investments and net other assets. |
Annual Report
Telecommunications Portfolio
Investments February 28, 2013
Showing Percentage of Net Assets
|
Common Stocks - 97.6% |
|||
|
Shares |
Value |
||
|
COMMUNICATIONS EQUIPMENT - 0.4% |
|||
|
Communications Equipment - 0.4% |
|||
|
Symmetricom, Inc. (a) |
338,300 |
$ 1,671,202 |
|
|
COMPUTERS & PERIPHERALS - 0.3% |
|||
|
Computer Hardware - 0.3% |
|||
|
Apple, Inc. |
2,241 |
989,177 |
|
|
DIVERSIFIED TELECOMMUNICATION SERVICES - 56.9% |
|||
|
Alternative Carriers - 9.8% |
|||
|
Cogent Communications Group, Inc. |
378,402 |
9,516,810 |
|
|
inContact, Inc. (a) |
262,200 |
1,780,338 |
|
|
Iridium Communications, Inc. (a) |
16,600 |
101,426 |
|
|
Level 3 Communications, Inc. (a) |
479,895 |
9,588,302 |
|
|
Lumos Networks Corp. |
301,762 |
3,446,122 |
|
|
tw telecom, inc. (a) |
343,657 |
8,701,395 |
|
|
Vonage Holdings Corp. (a) |
2,186,000 |
5,771,040 |
|
|
|
38,905,433 |
||
|
Integrated Telecommunication Services - 47.1% |
|||
|
AT&T, Inc. |
721,319 |
25,902,565 |
|
|
Atlantic Tele-Network, Inc. |
137,400 |
6,457,800 |
|
|
CenturyLink, Inc. |
642,484 |
22,274,920 |
|
|
Cincinnati Bell, Inc. (a) |
808,400 |
2,627,300 |
|
|
Consolidated Communications Holdings, Inc. |
53,298 |
895,406 |
|
|
Elephant Talk Communication, Inc. (a)(d) |
326,540 |
391,848 |
|
|
Frontier Communications Corp. (d) |
2,098,500 |
8,687,790 |
|
|
General Communications, Inc. Class A (a) |
1,160,061 |
9,802,515 |
|
|
IDT Corp. Class B |
51,100 |
516,621 |
|
|
Koninklijke KPN NV (d) |
461,212 |
1,573,982 |
|
|
Telecom Italia SpA |
1,147,800 |
844,086 |
|
|
Telefonica Brasil SA sponsored ADR |
236,963 |
6,246,345 |
|
|
Verizon Communications, Inc. |
2,155,147 |
100,278,991 |
|
|
Windstream Corp. |
182 |
1,563 |
|
|
|
186,501,732 |
||
|
TOTAL DIVERSIFIED TELECOMMUNICATION SERVICES |
225,407,165 |
||
|
ELECTRONIC EQUIPMENT & COMPONENTS - 1.5% |
|||
|
Electronic Manufacturing Services - 1.5% |
|||
|
Flextronics International Ltd. (a) |
899,300 |
5,980,345 |
|
|
INTERNET SOFTWARE & SERVICES - 0.1% |
|||
|
Internet Software & Services - 0.1% |
|||
|
Velti PLC (a) |
145,900 |
536,912 |
|
|
MEDIA - 2.1% |
|||
|
Cable & Satellite - 2.1% |
|||
|
Cablevision Systems Corp. - NY Group Class A |
54,425 |
761,406 |
|
|
Comcast Corp. Class A |
65,700 |
2,614,203 |
|
|
|
|||
|
Shares |
Value |
||
|
Liberty Global, Inc. Class A (a) |
42,318 |
$ 2,915,287 |
|
|
Time Warner Cable, Inc. |
22,881 |
1,976,690 |
|
|
|
8,267,586 |
||
|
REAL ESTATE INVESTMENT TRUSTS - 7.1% |
|||
|
Specialized REITs - 7.1% |
|||
|
American Tower Corp. |
362,800 |
28,153,280 |
|
|
SEMICONDUCTORS & SEMICONDUCTOR EQUIPMENT - 0.8% |
|||
|
Semiconductors - 0.8% |
|||
|
Broadcom Corp. Class A |
94,031 |
3,207,397 |
|
|
SOFTWARE - 0.4% |
|||
|
Application Software - 0.4% |
|||
|
Synchronoss Technologies, Inc. (a) |
45,603 |
1,375,843 |
|
|
WIRELESS TELECOMMUNICATION SERVICES - 28.0% |
|||
|
Wireless Telecommunication Services - 28.0% |
|||
|
America Movil S.A.B. de CV Series L sponsored ADR |
197,000 |
4,115,330 |
|
|
Boingo Wireless, Inc. (a) |
262,815 |
1,597,915 |
|
|
Clearwire Corp. Class A (a) |
3,309,836 |
10,326,688 |
|
|
Crown Castle International Corp. (a) |
102,183 |
7,132,373 |
|
|
Leap Wireless International, Inc. (a)(d) |
89,900 |
480,965 |
|
|
MetroPCS Communications, Inc. (a) |
877,806 |
8,602,499 |
|
|
Millicom International Cellular SA (depository receipt) |
11,000 |
863,175 |
|
|
Mobile TeleSystems OJSC sponsored ADR |
114,694 |
2,373,019 |
|
|
NII Holdings, Inc. (a) |
492,400 |
2,373,368 |
|
|
NTELOS Holdings Corp. |
15,706 |
196,011 |
|
|
NTT DoCoMo, Inc. |
1,327 |
2,051,525 |
|
|
SBA Communications Corp. Class A (a) |
313,556 |
22,300,103 |
|
|
Sprint Nextel Corp. (a) |
2,668,950 |
15,479,910 |
|
|
Telephone & Data Systems, Inc. |
506,600 |
11,596,074 |
|
|
TIM Participacoes SA |
229,200 |
1,001,607 |
|
|
U.S. Cellular Corp. (a) |
79,700 |
2,932,163 |
|
|
Vodafone Group PLC sponsored ADR |
696,300 |
17,504,982 |
|
|
|
110,927,707 |
||
|
TOTAL COMMON STOCKS (Cost $399,839,378) |
|
||
|
Money Market Funds - 5.2% |
|||
|
Shares |
Value |
||
|
Fidelity Cash Central Fund, 0.16% (b) |
12,575,761 |
$ 12,575,761 |
|
|
Fidelity Securities Lending Cash Central Fund, 0.16% (b)(c) |
8,239,903 |
8,239,903 |
|
|
TOTAL MONEY MARKET FUNDS (Cost $20,815,664) |
|
||
|
TOTAL INVESTMENT PORTFOLIO - 102.8% (Cost $420,655,042) |
407,332,278 |
||
|
NET OTHER ASSETS (LIABILITIES) - (2.8)% |
(11,234,417) |
||
|
NET ASSETS - 100% |
$ 396,097,861 |
||
|
Legend |
|
(a) Non-income producing |
|
(b) Affiliated fund that is generally available only to investment companies and other accounts managed by Fidelity Investments. The rate quoted is the annualized seven-day yield of the fund at period end. A complete unaudited listing of the fund's holdings as of its most recent quarter end is available upon request. In addition, each Fidelity Central Fund's financial statements, which are not covered by the Fund's Report of Independent Registered Public Accounting Firm, are available on the SEC's website or upon request. |
|
(c) Investment made with cash collateral received from securities on loan. |
|
(d) Security or a portion of the security is on loan at period end. |
|
Affiliated Central Funds |
|
Information regarding fiscal year to date income earned by the Fund from investments in Fidelity Central Funds is as follows: |
|
Fund |
Income earned |
|
Fidelity Cash Central Fund |
$ 29,115 |
|
Fidelity Securities Lending Cash Central Fund |
316,632 |
|
Total |
$ 345,747 |
|
Other Information |
|
The following is a summary of the inputs used, as of February 28, 2013, involving the Fund's assets and liabilities carried at fair value. The inputs or methodology used for valuing securities may not be an indication of the risk associated with investing in those securities. For more information on valuation inputs, and their aggregation into the levels used in the table below, please refer to the Investment Valuation section in the accompanying Notes to Financial Statements. |
|
Valuation Inputs at Reporting Date: |
||||
|
Description |
Total |
Level 1 |
Level 2 |
Level 3 |
|
Investments in Securities: |
||||
|
Common Stocks |
$ 386,516,614 |
$ 383,621,003 |
$ 2,895,611 |
$ - |
|
Money Market Funds |
20,815,664 |
20,815,664 |
- |
- |
|
Total Investments in Securities: |
$ 407,332,278 |
$ 404,436,667 |
$ 2,895,611 |
$ - |
|
Distribution of investments by country or territory of incorporation, as a percentage of total net assets, is as follows. (Unaudited) |
|
United States of America |
89.2% |
|
United Kingdom |
4.4% |
|
Brazil |
1.9% |
|
Singapore |
1.5% |
|
Mexico |
1.0% |
|
Others (Individually Less Than 1%) |
2.0% |
|
|
100.0% |
See accompanying notes which are an integral part of the financial statements.
Annual Report
Telecommunications Portfolio
Financial Statements
Statement of Assets and Liabilities
|
|
February 28, 2013 |
|
|
|
|
|
|
Assets |
|
|
|
Investment in securities, at value (including securities loaned of $7,933,343) - See accompanying schedule: Unaffiliated issuers (cost $399,839,378) |
$ 386,516,614 |
|
|
Fidelity Central Funds (cost $20,815,664) |
20,815,664 |
|
|
Total Investments (cost $420,655,042) |
|
$ 407,332,278 |
|
Receivable for investments sold |
|
6,938,541 |
|
Receivable for fund shares sold |
|
140,517 |
|
Dividends receivable |
|
66,205 |
|
Distributions receivable from Fidelity Central Funds |
|
22,752 |
|
Prepaid expenses |
|
874 |
|
Receivable from investment adviser for expense reductions |
|
350 |
|
Other receivables |
|
24,377 |
|
Total assets |
|
414,525,894 |
|
|
|
|
|
Liabilities |
|
|
|
Payable for investments purchased |
$ 9,698,693 |
|
|
Payable for fund shares redeemed |
173,973 |
|
|
Accrued management fee |
185,668 |
|
|
Distribution and service plan fees payable |
7,161 |
|
|
Other affiliated payables |
88,075 |
|
|
Other payables and accrued expenses |
34,560 |
|
|
Collateral on securities loaned, at value |
8,239,903 |
|
|
Total liabilities |
|
18,428,033 |
|
|
|
|
|
Net Assets |
|
$ 396,097,861 |
|
Net Assets consist of: |
|
|
|
Paid in capital |
|
$ 421,537,330 |
|
Undistributed net investment income |
|
1,584,319 |
|
Accumulated undistributed net realized gain (loss) on investments and foreign currency transactions |
|
(13,698,894) |
|
Net unrealized appreciation (depreciation) on investments and assets and liabilities in foreign currencies |
|
(13,324,894) |
|
Net Assets |
|
$ 396,097,861 |
Statement of Assets and Liabilities - continued
|
|
February 28, 2013 |
|
|
|
|
|
|
Calculation of Maximum Offering Price Class A: |
|
$ 51.58 |
|
|
|
|
|
Maximum offering price per share (100/94.25 of $51.58) |
|
$ 54.73 |
|
Class T: |
|
$ 51.41 |
|
|
|
|
|
Maximum offering price per share (100/96.50 of $51.41) |
|
$ 53.27 |
|
Class B: |
|
$ 51.63 |
|
|
|
|
|
Class C: |
|
$ 51.47 |
|
|
|
|
|
Telecommunications: |
|
$ 51.75 |
|
|
|
|
|
Institutional Class: |
|
$ 51.65 |
A Redemption price per share is equal to net asset value less any applicable contingent deferred sales charge.
See accompanying notes which are an integral part of the financial statements.
Annual Report
Statement of Operations
|
|
Year ended February 28, 2013 |
|
|
|
|
|
|
Investment Income |
|
|
|
Dividends |
|
$ 12,424,007 |
|
Interest |
|
72 |
|
Income from Fidelity Central Funds |
|
345,747 |
|
Total income |
|
12,769,826 |
|
|
|
|
|
Expenses |
|
|
|
Management fee |
$ 2,234,749 |
|
|
Transfer agent fees |
947,758 |
|
|
Distribution and service plan fees |
77,446 |
|
|
Accounting and security lending fees |
159,773 |
|
|
Custodian fees and expenses |
10,570 |
|
|
Independent trustees' compensation |
2,693 |
|
|
Registration fees |
79,762 |
|
|
Audit |
50,173 |
|
|
Legal |
2,845 |
|
|
Miscellaneous |
3,614 |
|
|
Total expenses before reductions |
3,569,383 |
|
|
Expense reductions |
(61,113) |
3,508,270 |
|
Net investment income (loss) |
|
9,261,556 |
|
Realized and Unrealized Gain (Loss) Net realized gain (loss) on: |
|
|
|
Investment securities: |
|
|
|
Unaffiliated issuers |
44,363,660 |
|
|
Foreign currency transactions |
(6,576) |
|
|
Total net realized gain (loss) |
|
44,357,084 |
|
Change in net unrealized appreciation (depreciation) on: Investment securities |
3,166,454 |
|
|
Assets and liabilities in foreign currencies |
(713) |
|
|
Total change in net unrealized appreciation (depreciation) |
|
3,165,741 |
|
Net gain (loss) |
|
47,522,825 |
|
Net increase (decrease) in net assets resulting from operations |
|
$ 56,784,381 |
Statement of Changes in Net Assets
|
|
Year ended |
Year ended |
|
Increase (Decrease) in Net Assets |
|
|
|
Operations |
|
|
|
Net investment income (loss) |
$ 9,261,556 |
$ 5,541,550 |
|
Net realized gain (loss) |
44,357,084 |
24,725,843 |
|
Change in net unrealized appreciation (depreciation) |
3,165,741 |
(35,725,245) |
|
Net increase (decrease) in net assets resulting from operations |
56,784,381 |
(5,457,852) |
|
Distributions to shareholders from net investment income |
(8,401,078) |
(4,955,219) |
|
Share transactions - net increase (decrease) |
(7,060,825) |
(2,457,615) |
|
Redemption fees |
3,280 |
35,055 |
|
Total increase (decrease) in net assets |
41,325,758 |
(12,835,631) |
|
|
|
|
|
Net Assets |
|
|
|
Beginning of period |
354,772,103 |
367,607,734 |
|
End of period (including undistributed net investment income of $1,584,319 and undistributed net investment income of $730,417, respectively) |
$ 396,097,861 |
$ 354,772,103 |
See accompanying notes which are an integral part of the financial statements.
Annual Report
Financial Highlights - Class A
|
Years ended February 28, |
2013 |
2012 H |
2011 |
2010 |
2009 |
|
Selected Per-Share Data |
|
|
|
|
|
|
Net asset value, beginning of period |
$ 46.12 |
$ 46.93 |
$ 37.64 |
$ 26.66 |
$ 42.56 |
|
Income from Investment Operations |
|
|
|
|
|
|
Net investment income (loss) C |
.99 |
.56 |
.57 |
.67 |
.22 |
|
Net realized and unrealized gain (loss) |
5.43 |
(.86) |
9.49 |
10.55 |
(15.60) |
|
Total from investment operations |
6.42 |
(.30) |
10.06 |
11.22 |
(15.38) |
|
Distributions from net investment income |
(.96) |
(.51) |
(.77) |
(.19) |
(.35) F |
|
Distributions from net realized gain |
- |
- |
- |
(.05) |
(.18) F |
|
Total distributions |
(.96) |
(.51) |
(.77) |
(.24) J |
(.52) K |
|
Redemption fees added to paid in capital C,I |
- |
- |
- |
- |
- |
|
Net asset value, end of period |
$ 51.58 |
$ 46.12 |
$ 46.93 |
$ 37.64 |
$ 26.66 |
|
Total Return A, B |
13.97% |
(.54)% |
26.87% |
42.07% |
(36.16)% |
|
Ratios to Average Net Assets D, G |
|
|
|
|
|
|
Expenses before reductions |
1.18% |
1.20% |
1.20% |
1.26% |
1.21% |
|
Expenses net of fee waivers, if any |
1.18% |
1.20% |
1.20% |
1.26% |
1.21% |
|
Expenses net of all reductions |
1.17% |
1.18% |
1.18% |
1.24% |
1.21% |
|
Net investment income (loss) |
2.01% |
1.21% |
1.35% |
1.89% |
.61% |
|
Supplemental Data |
|
|
|
|
|
|
Net assets, end of period (000 omitted) |
$ 6,449 |
$ 4,677 |
$ 4,305 |
$ 3,343 |
$ 2,112 |
|
Portfolio turnover rate E |
76% |
72% |
72% |
90% |
168% |
|
A Total returns would have been lower if certain expenses had not been reduced during the applicable periods shown. B Total returns do not include the effect of the sales charges. C Calculated based on average shares outstanding during the period. D Fees and expenses of any underlying Fidelity Central Funds are not included in the Fund's expense ratio. The Fund indirectly bears its proportionate share of the expenses of any underlying Fidelity Central Funds. E Amount does not include the portfolio activity of any underlying Fidelity Central Funds. F The amounts shown reflect certain reclassifications related to book to tax differences that were made in the year shown. G Expense ratios reflect operating expenses of the class. Expenses before reductions do not reflect amounts reimbursed by the investment adviser or reductions from brokerage service arrangements or reductions from other expense offset arrangements and do not represent the amount paid by the class during periods when reimbursements or reductions occur. Expenses net of fee waivers reflect expenses after reimbursement by the investment adviser but prior to reductions from brokerage service arrangements or other expense offset arrangements. Expenses net of all reductions represent the net expenses paid by the class. H For the year ended February 29. I Amount represents less than $.01 per share. J Total distributions of $.24 per share is comprised of distributions from net investment income of $.187 and distributions from net realized gain of $.048 per share. K Total distributions of $.52 per share is comprised of distributions from net investment income of $.347 and distributions from net realized gain of $.175 per share. |
Financial Highlights - Class T
|
Years ended February 28, |
2013 |
2012 H |
2011 |
2010 |
2009 |
|
Selected Per-Share Data |
|
|
|
|
|
|
Net asset value, beginning of period |
$ 46.01 |
$ 46.81 |
$ 37.55 |
$ 26.68 |
$ 42.49 |
|
Income from Investment Operations |
|
|
|
|
|
|
Net investment income (loss) C |
.85 |
.42 |
.45 |
.57 |
.12 |
|
Net realized and unrealized gain (loss) |
5.39 |
(.84) |
9.47 |
10.54 |
(15.56) |
|
Total from investment operations |
6.24 |
(.42) |
9.92 |
11.11 |
(15.44) |
|
Distributions from net investment income |
(.84) |
(.38) |
(.66) |
(.22) |
(.24) F |
|
Distributions from net realized gain |
- |
- |
- |
(.03) |
(.13) F |
|
Total distributions |
(.84) |
(.38) |
(.66) |
(.24) J |
(.37) K |
|
Redemption fees added to paid in capital C,I |
- |
- |
- |
- |
- |
|
Net asset value, end of period |
$ 51.41 |
$ 46.01 |
$ 46.81 |
$ 37.55 |
$ 26.68 |
|
Total Return A, B |
13.61% |
(.82)% |
26.54% |
41.64% |
(36.34)% |
|
Ratios to Average Net Assets D, G |
|
|
|
|
|
|
Expenses before reductions |
1.48% |
1.49% |
1.48% |
1.55% |
1.49% |
|
Expenses net of fee waivers, if any |
1.48% |
1.49% |
1.48% |
1.55% |
1.49% |
|
Expenses net of all reductions |
1.46% |
1.47% |
1.46% |
1.53% |
1.48% |
|
Net investment income (loss) |
1.72% |
.92% |
1.06% |
1.60% |
.33% |
|
Supplemental Data |
|
|
|
|
|
|
Net assets, end of period (000 omitted) |
$ 4,237 |
$ 2,702 |
$ 2,882 |
$ 2,051 |
$ 620 |
|
Portfolio turnover rate E |
76% |
72% |
72% |
90% |
168% |
|
A Total returns would have been lower if certain expenses had not been reduced during the applicable periods shown. B Total returns do not include the effect of the sales charges. C Calculated based on average shares outstanding during the period. D Fees and expenses of any underlying Fidelity Central Funds are not included in the Fund's expense ratio. The Fund indirectly bears its proportionate share of the expenses of any underlying Fidelity Central Funds. E Amount does not include the portfolio activity of any underlying Fidelity Central Funds. F The amounts shown reflect certain reclassifications related to book to tax differences that were made in the year shown. G Expense ratios reflect operating expenses of the class. Expenses before reductions do not reflect amounts reimbursed by the investment adviser or reductions from brokerage service arrangements or reductions from other expense offset arrangements and do not represent the amount paid by the class during periods when reimbursements or reductions occur. Expenses net of fee waivers reflect expenses after reimbursement by the investment adviser but prior to reductions from brokerage service arrangements or other expense offset arrangements. Expenses net of all reductions represent the net expenses paid by the class. H For the year ended February 29. I Amount represents less than $.01 per share. J Total distributions of $.24 per share is comprised of distributions from net investment income of $.216 and distributions from net realized gain of $.028 per share. K Total distributions of $.37 per share is comprised of distributions from net investment income of $.244 and distributions from net realized gain of $.127 per share. |
See accompanying notes which are an integral part of the financial statements.
Annual Report
Financial Highlights - Class B
|
Years ended February 28, |
2013 |
2012 H |
2011 |
2010 |
2009 |
|
Selected Per-Share Data |
|
|
|
|
|
|
Net asset value, beginning of period |
$ 46.14 |
$ 46.93 |
$ 37.60 |
$ 26.71 |
$ 42.42 |
|
Income from Investment Operations |
|
|
|
|
|
|
Net investment income (loss) C |
.62 |
.21 |
.25 |
.40 |
(.05) |
|
Net realized and unrealized gain (loss) |
5.42 |
(.83) |
9.48 |
10.54 |
(15.49) |
|
Total from investment operations |
6.04 |
(.62) |
9.73 |
10.94 |
(15.54) |
|
Distributions from net investment income |
(.55) |
(.17) |
(.40) |
(.04) |
(.11) F |
|
Distributions from net realized gain |
- |
- |
- |
(.01) |
(.06) F |
|
Total distributions |
(.55) |
(.17) |
(.40) |
(.05) J |
(.17) K |
|
Redemption fees added to paid in capital C,I |
- |
- |
- |
- |
- |
|
Net asset value, end of period |
$ 51.63 |
$ 46.14 |
$ 46.93 |
$ 37.60 |
$ 26.71 |
|
Total Return A, B |
13.11% |
(1.29)% |
25.96% |
40.97% |
(36.64)% |
|
Ratios to Average Net Assets D, G |
|
|
|
|
|
|
Expenses before reductions |
1.93% |
1.95% |
1.95% |
2.01% |
1.97% |
|
Expenses net of fee waivers, if any |
1.93% |
1.95% |
1.95% |
2.01% |
1.97% |
|
Expenses net of all reductions |
1.92% |
1.93% |
1.93% |
2.00% |
1.96% |
|
Net investment income (loss) |
1.26% |
.47% |
.60% |
1.13% |
(.15)% |
|
Supplemental Data |
|
|
|
|
|
|
Net assets, end of period (000 omitted) |
$ 576 |
$ 596 |
$ 706 |
$ 641 |
$ 363 |
|
Portfolio turnover rate E |
76% |
72% |
72% |
90% |
168% |
|
A Total returns would have been lower if certain expenses had not been reduced during the applicable periods shown. B Total returns do not include the effect of the contingent deferred sales charge. C Calculated based on average shares outstanding during the period. D Fees and expenses of any underlying Fidelity Central Funds are not included in the Fund's expense ratio. The Fund indirectly bears its proportionate share of the expenses of any underlying Fidelity Central Funds. E Amount does not include the portfolio activity of any underlying Fidelity Central Funds. F The amounts shown reflect certain reclassifications related to book to tax differences that were made in the year shown. G Expense ratios reflect operating expenses of the class. Expenses before reductions do not reflect amounts reimbursed by the investment adviser or reductions from brokerage service arrangements or reductions from other expense offset arrangements and do not represent the amount paid by the class during periods when reimbursements or reductions occur. Expenses net of fee waivers reflect expenses after reimbursement by the investment adviser but prior to reductions from brokerage service arrangements or other expense offset arrangements. Expenses net of all reductions represent the net expenses paid by the class. H For the year ended February 29. I Amount represents less than $.01 per share. J Total distributions of $.05 per share is comprised of distributions from net investment income of $.044 and distributions from net realized gain of $.009 per share. K Total distributions of $.17 per share is comprised of distributions from net investment income of $.105 and distributions from net realized gain of $.063 per share. |
Financial Highlights - Class C
|
Years ended February 28, |
2013 |
2012 H |
2011 |
2010 |
2009 |
|
Selected Per-Share Data |
|
|
|
|
|
|
Net asset value, beginning of period |
$ 46.02 |
$ 46.89 |
$ 37.61 |
$ 26.76 |
$ 42.42 |
|
Income from Investment Operations |
|
|
|
|
|
|
Net investment income (loss) C |
.63 |
.22 |
.26 |
.41 |
(.05) |
|
Net realized and unrealized gain (loss) |
5.41 |
(.84) |
9.46 |
10.56 |
(15.50) |
|
Total from investment operations |
6.04 |
(.62) |
9.72 |
10.97 |
(15.55) |
|
Distributions from net investment income |
(.59) |
(.25) |
(.44) |
(.10) |
(.07) F |
|
Distributions from net realized gain |
- |
- |
- |
(.02) |
(.05) F |
|
Total distributions |
(.59) |
(.25) |
(.44) |
(.12) J |
(.11) K |
|
Redemption fees added to paid in capital C,I |
- |
- |
- |
- |
- |
|
Net asset value, end of period |
$ 51.47 |
$ 46.02 |
$ 46.89 |
$ 37.61 |
$ 26.76 |
|
Total Return A, B |
13.14% |
(1.27)% |
25.95% |
41.00% |
(36.64)% |
|
Ratios to Average Net Assets D, G |
|
|
|
|
|
|
Expenses before reductions |
1.90% |
1.93% |
1.94% |
2.01% |
1.97% |
|
Expenses net of fee waivers, if any |
1.90% |
1.93% |
1.94% |
2.01% |
1.97% |
|
Expenses net of all reductions |
1.89% |
1.91% |
1.92% |
2.00% |
1.96% |
|
Net investment income (loss) |
1.29% |
.48% |
.61% |
1.13% |
(.14)% |
|
Supplemental Data |
|
|
|
|
|
|
Net assets, end of period (000 omitted) |
$ 4,353 |
$ 3,514 |
$ 3,035 |
$ 2,151 |
$ 371 |
|
Portfolio turnover rate E |
76% |
72% |
72% |
90% |
168% |
|
A Total returns would have been lower if certain expenses had not been reduced during the applicable periods shown. B Total returns do not include the effect of the contingent deferred sales charge. C Calculated based on average shares outstanding during the period. D Fees and expenses of any underlying Fidelity Central Funds are not included in the Fund's expense ratio. The Fund indirectly bears its proportionate share of the expenses of any underlying Fidelity Central Funds. E Amount does not include the portfolio activity of any underlying Fidelity Central Funds. F The amounts shown reflect certain reclassifications related to book to tax differences that were made in the year shown. G Expense ratios reflect operating expenses of the class. Expenses before reductions do not reflect amounts reimbursed by the investment adviser or reductions from brokerage service arrangements or reductions from other expense offset arrangements and do not represent the amount paid by the class during periods when reimbursements or reductions occur. Expenses net of fee waivers reflect expenses after reimbursement by the investment adviser but prior to reductions from brokerage service arrangements or other expense offset arrangements. Expenses net of all reductions represent the net expenses paid by the class. H For the year ended February 29. I Amount represents less than $.01 per share. J Total distributions of $.12 per share is comprised of distributions from net investment income of $.098 and distributions from net realized gain of $.023 per share. K Total distributions of $.11 per share is comprised of distributions from net investment income of $.068 and distributions from net realized gain of $.046 per share. |
See accompanying notes which are an integral part of the financial statements.
Annual Report
Financial Highlights - Telecommunications
|
Years ended February 28, |
2013 |
2012 G |
2011 |
2010 |
2009 |
|
Selected Per-Share Data |
|
|
|
|
|
|
Net asset value, beginning of period |
$ 46.26 |
$ 47.07 |
$ 37.73 |
$ 26.74 |
$ 42.70 |
|
Income from Investment Operations |
|
|
|
|
|
|
Net investment income (loss) B |
1.15 |
.70 |
.69 |
.76 |
.30 |
|
Net realized and unrealized gain (loss) |
5.43 |
(.86) |
9.52 |
10.59 |
(15.65) |
|
Total from investment operations |
6.58 |
(.16) |
10.21 |
11.35 |
(15.35) |
|
Distributions from net investment income |
(1.09) |
(.65) |
(.87) |
(.31) |
(.41) E |
|
Distributions from net realized gain |
- |
- |
- |
(.05) |
(.20) E |
|
Total distributions |
(1.09) |
(.65) |
(.87) |
(.36) I |
(.61) J |
|
Redemption fees added to paid in capital B, H |
- |
- |
- |
- |
- |
|
Net asset value, end of period |
$ 51.75 |
$ 46.26 |
$ 47.07 |
$ 37.73 |
$ 26.74 |
|
Total Return A |
14.30% |
(.23)% |
27.24% |
42.43% |
(36.00)% |
|
Ratios to Average Net Assets C, F |
|
|
|
|
|
|
Expenses before reductions |
.87% |
.90% |
.92% |
.99% |
.97% |
|
Expenses net of fee waivers, if any |
.87% |
.90% |
.92% |
.99% |
.97% |
|
Expenses net of all reductions |
.85% |
.88% |
.91% |
.98% |
.96% |
|
Net investment income (loss) |
2.33% |
1.52% |
1.62% |
2.15% |
.85% |
|
Supplemental Data |
|
|
|
|
|
|
Net assets, end of period (000 omitted) |
$ 377,841 |
$ 342,262 |
$ 354,938 |
$ 279,704 |
$ 196,231 |
|
Portfolio turnover rate D |
76% |
72% |
72% |
90% |
168% |
|
A Total returns would have been lower if certain expenses had not been reduced during the applicable periods shown. B Calculated based on average shares outstanding during the period. C Fees and expenses of any underlying Fidelity Central Funds are not included in the Fund's expense ratio. The Fund indirectly bears its proportionate share of the expenses of any underlying Fidelity Central Funds. D Amount does not include the portfolio activity of any underlying Fidelity Central Funds. E The amounts shown reflect certain reclassifications related to book to tax differences that were made in the year shown. F Expense ratios reflect operating expenses of the class. Expenses before reductions do not reflect amounts reimbursed by the investment adviser or reductions from brokerage service arrangements or reductions from other expense offset arrangements and do not represent the amount paid by the class during periods when reimbursements or reductions occur. Expenses net of fee waivers reflect expenses after reimbursement by the investment adviser but prior to reductions from brokerage service arrangements or other expense offset arrangements. Expenses net of all reductions represent the net expenses paid by the class. G For the year ended February 29. H Amount represents less than $.01 per share. I Total distributions of $.36 per share is comprised of distributions from net investment income of $.310 and distributions from net realized gain of $.048 per share. J Total distributions of $.61 per share is comprised of distributions from net investment income of $.408 and distributions from net realized gain of $.202 per share. |
Financial Highlights - Institutional Class
|
Years ended February 28, |
2013 |
2012 G |
2011 |
2010 |
2009 |
|
Selected Per-Share Data |
|
|
|
|
|
|
Net asset value, beginning of period |
$ 46.20 |
$ 47.02 |
$ 37.69 |
$ 26.73 |
$ 42.65 |
|
Income from Investment Operations |
|
|
|
|
|
|
Net investment income (loss) B |
1.17 |
.70 |
.71 |
.84 |
.34 |
|
Net realized and unrealized gain (loss) |
5.42 |
(.88) |
9.50 |
10.55 |
(15.67) |
|
Total from investment operations |
6.59 |
(.18) |
10.21 |
11.39 |
(15.33) |
|
Distributions from net investment income |
(1.14) |
(.64) |
(.88) |
(.38) |
(.40) E |
|
Distributions from net realized gain |
- |
- |
- |
(.05) |
(.20) E |
|
Total distributions |
(1.14) |
(.64) |
(.88) |
(.43) I |
(.59) J |
|
Redemption fees added to paid in capital B, H |
- |
- |
- |
- |
- |
|
Net asset value, end of period |
$ 51.65 |
$ 46.20 |
$ 47.02 |
$ 37.69 |
$ 26.73 |
|
Total Return A |
14.33% |
(.26)% |
27.27% |
42.59% |
(35.99)% |
|
Ratios to Average Net Assets C, F |
|
|
|
|
|
|
Expenses before reductions |
.85% |
.89% |
.91% |
.86% |
.91% |
|
Expenses net of fee waivers, if any |
.85% |
.89% |
.91% |
.86% |
.91% |
|
Expenses net of all reductions |
.83% |
.87% |
.89% |
.84% |
.90% |
|
Net investment income (loss) |
2.35% |
1.52% |
1.64% |
2.29% |
.91% |
|
Supplemental Data |
|
|
|
|
|
|
Net assets, end of period (000 omitted) |
$ 2,641 |
$ 1,022 |
$ 1,743 |
$ 1,101 |
$ 68 |
|
Portfolio turnover rate D |
76% |
72% |
72% |
90% |
168% |
|
A Total returns would have been lower if certain expenses had not been reduced during the applicable periods shown. B Calculated based on average shares outstanding during the period. C Fees and expenses of any underlying Fidelity Central Funds are not included in the Fund's expense ratio. The Fund indirectly bears its proportionate share of the expenses of any underlying Fidelity Central Funds. D Amount does not include the portfolio activity of any underlying Fidelity Central Funds. E The amounts shown reflect certain reclassifications related to book to tax differences that were made in the year shown. F Expense ratios reflect operating expenses of the class. Expenses before reductions do not reflect amounts reimbursed by the investment adviser or reductions from brokerage service arrangements or reductions from other expense offset arrangements and do not represent the amount paid by the class during periods when reimbursements or reductions occur. Expenses net of fee waivers reflect expenses after reimbursement by the investment adviser but prior to reductions from brokerage service arrangements or other expense offset arrangements. Expenses net of all reductions represent the net expenses paid by the class. G For the year ended February 29. H Amount represents less than $.01 per share. I Total distributions of $.43 per share is comprised of distributions from net investment income of $.379 and distributions from net realized gain of $.057 per share. J Total distributions of $.59 per share is comprised of distributions from net investment income of $.395 and distributions from net realized gain of $.197 per share. |
See accompanying notes which are an integral part of the financial statements.
Annual Report
Notes to Financial Statements
For the period ended February 28, 2013
1. Organization.
Telecommunications Portfolio (the Fund) is a non-diversified fund of Fidelity Select Portfolios (the Trust) and is authorized to issue an unlimited number of shares. The Trust is registered under the Investment Company Act of 1940, as amended (the 1940 Act), as an open-end management investment company organized as a Massachusetts business trust. The Fund invests primarily in securities of companies whose principal business activities fall within specific industries. The Fund offers Class A, Class T, Class C, Telecommunications and Institutional Class shares, each of which, along with Class B shares, has equal rights as to assets and voting privileges. Class B shares are closed to new accounts and additional purchases, except for exchanges and reinvestments. Each class has exclusive voting rights with respect to matters that affect that class. Class B shares will automatically convert to Class A shares after a holding period of seven years from the initial date of purchase. Investment income, realized and unrealized capital gains and losses, the common expenses of the Fund, and certain fund-level expense reductions, if any, are allocated on a pro-rata basis to each class based on the relative net assets of each class to the total net assets of the Fund. Each class differs with respect to transfer agent and distribution and service plan fees incurred. Certain expense reductions may also differ by class.
2. Investments in Fidelity Central Funds.
The Fund invests in Fidelity Central Funds, which are open-end investment companies available only to other investment companies and accounts managed by Fidelity Management & Research Company (FMR) and its affiliates. The Fund's Schedule of Investments lists each of the Fidelity Central Funds held as of period end, if any, as an investment of the Fund, but does not include the underlying holdings of each Fidelity Central Fund. As an Investing Fund, the Fund indirectly bears its proportionate share of the expenses of the underlying Fidelity Central Funds.
The Money Market Central Funds seek preservation of capital and current income and are managed by Fidelity Investments Money Management, Inc. (FIMM), an affiliate of FMR.
A complete unaudited list of holdings for each Fidelity Central Fund is available upon request or at the Securities and Exchange Commission (the SEC) website at www.sec.gov. In addition, the financial statements of the Fidelity Central Funds, which are not covered by the Fund's Report of Independent Registered Public Accounting Firm, are available on the SEC website or upon request.
3. Significant Accounting Policies.
The financial statements have been prepared in conformity with accounting principles generally accepted in the United States of America (GAAP), which require management to make certain estimates and assumptions at the date of the financial statements. Actual results could differ from those estimates. Subsequent events, if any, through the date that the financial statements were issued have been evaluated in the preparation of the financial statements. The following summarizes the significant accounting policies of the Fund:
Investment Valuation. Investments are valued as of 4:00 p.m. Eastern time on the last calendar day of the period. In accordance with valuation policies and procedures approved by the Board of Trustees (the Board), the Fund attempts to obtain prices from one or more third party pricing vendors or brokers to value its investments. When current market prices, quotations or currency exchange rates are not readily available or reliable, investments will be fair valued in good faith by the FMR Fair Value Committee (the Committee), in accordance with procedures adopted by the Fund's Board. Factors used in determining fair value vary by investment type and may include market or investment specific events. The frequency with which these procedures are used cannot be predicted and they may be utilized to a significant extent. The Committee oversees the Fund's valuation policies and procedures and is responsible for approving and reporting to the Board all fair value determinations.
The Fund categorizes the inputs to valuation techniques used to value its investments into a disclosure hierarchy consisting of three levels as shown below:
Level 1 - quoted prices in active markets for identical investments
Level 2 - other significant observable inputs (including quoted prices for similar investments, interest rates, prepayment speeds, etc.)
Level 3 - unobservable inputs (including the Fund's own assumptions based on the best information available)
Valuation techniques used to value the Fund's investments by major category are as follows:
Equity securities, including restricted securities, for which market quotations are readily available, are valued at the last reported sale price or official closing price as reported by a third party pricing vendor on the primary market or exchange on which they are traded and are categorized as Level 1 in the hierarchy. In the event there were no sales during the day or closing prices are not available, securities are valued at the last quoted bid price or may be valued using the last available price and are generally categorized as Level 2 in the hierarchy. For foreign equity securities, when significant market or security specific events arise, comparisons to the valuation of American Depositary Receipts (ADRs), futures contracts, Exchange-Traded Funds (ETFs) and certain indexes as well as quoted prices for similar securities are used and are categorized as Level 2 in the hierarchy. Utilizing these techniques may result in transfers between Level 1 and Level 2.
Annual Report
3. Significant Accounting Policies - continued
Investment Valuation - continued
Investments in open-end mutual funds, including the Fidelity Central Funds, are valued at their closing net asset value (NAV) each business day and are categorized as Level 1 in the hierarchy.
Changes in valuation techniques may result in transfers in or out of an assigned level within the disclosure hierarchy. The aggregate value of investments by input level, as of February 28, 2013 is included at the end of the Fund's Schedule of Investments.
Foreign Currency. The Fund may use foreign currency contracts to facilitate transactions in foreign-denominated securities. Gains and losses from these transactions may arise from changes in the value of the foreign currency or if the counterparties do not perform under the contracts' terms.
Foreign-denominated assets, including investment securities, and liabilities are translated into U.S. dollars at the exchange rates at period end. Purchases and sales of investment securities, income and dividends received and expenses denominated in foreign currencies are translated into U.S. dollars at the exchange rate in effect on the transaction date.
The effects of exchange rate fluctuations on investments are included with the net realized and unrealized gain (loss) on investment securities. Other foreign currency transactions resulting in realized and unrealized gain (loss) are disclosed separately.
Investment Transactions and Income. For financial reporting purposes, the Fund's investment holdings and NAV include trades executed through the end of the last business day of the period. The NAV per share for processing shareholder transactions is calculated as of the close of business of the New York Stock Exchange (NYSE) normally 4:00 p.m. Eastern time and includes trades executed through the end of the prior business day. Gains and losses on securities sold are determined on the basis of identified cost and may include proceeds received from litigation. Dividend income is recorded on the ex-dividend date, except for certain dividends from foreign securities where the ex-dividend date may have passed, which are recorded as soon as the Fund is informed of the ex-dividend date. Non-cash dividends included in dividend income, if any, are recorded at the fair market value of the securities received. Distributions received on securities that represent a return of capital or capital gain are recorded as a reduction of cost of investments and/or as a realized gain. The Fund estimates the components of distributions received that may be considered return of capital distributions or capital gain distributions. Interest income and distributions from the Fidelity Central Funds are accrued as earned. Interest income includes coupon interest and amortization of premium and accretion of discount on debt securities. Investment income is recorded net of foreign taxes withheld where recovery of such taxes is uncertain.
Expenses. Expenses directly attributable to a fund are charged to that fund. Expenses attributable to more than one fund are allocated among the respective funds on the basis of relative net assets or other appropriate methods. Expense estimates are accrued in the period to which they relate and adjustments are made when actual amounts are known.
Income Tax Information and Distributions to Shareholders. Each year, the Fund intends to qualify as a regulated investment company under Subchapter M of the Internal Revenue Code, including distributing substantially all of its taxable income and realized gains. As a result, no provision for income taxes is required. As of February 28, 2013, the Fund did not have any unrecognized tax benefits in the financial statements; nor is the Fund aware of any tax positions for which it is reasonably possible that the total amounts of unrecognized tax benefits will significantly change in the next twelve months. The Fund files a U.S. federal tax return, in addition to state and local tax returns as required. A fund's federal income tax returns are subject to examination by the Internal Revenue Service (IRS) for a period of three fiscal years after they are filed. State and local tax returns may be subject to examination for an additional fiscal year depending on the jurisdiction. Foreign taxes are provided for based on the Fund's understanding of the tax rules and rates that exist in the foreign markets in which it invests.
Distributions are declared and recorded on the ex-dividend date. Income dividends and capital gain distributions are declared separately for each class. Income and capital gain distributions are determined in accordance with income tax regulations, which may differ from GAAP.
Capital accounts within the financial statements are adjusted for permanent book-tax differences. These adjustments have no impact on net assets or the results of operations. Temporary book-tax differences will reverse in a subsequent period.
Book-tax differences are primarily due to foreign currency transactions, deferred trustees compensation, capital loss carryforwards, losses deferred due to wash sales and excise tax regulations.
The federal tax cost of investment securities and unrealized appreciation (depreciation) as of period end were as follows:
|
Gross unrealized appreciation |
$ 31,237,253 |
|
Gross unrealized depreciation |
(53,653,112) |
|
Net unrealized appreciation (depreciation) on securities and other investments |
$ (22,415,859) |
|
|
|
|
Tax Cost |
$ 429,748,137 |
Annual Report
Notes to Financial Statements - continued
3. Significant Accounting Policies - continued
Income Tax Information and Distributions to Shareholders - continued
The tax-based components of distributable earnings as of period end were as follows:
|
Undistributed ordinary income |
$ 1,584,607 |
|
Capital loss carryforward |
$ (4,605,799) |
|
Net unrealized appreciation (depreciation) |
$ (22,417,989) |
Capital loss carryforwards are only available to offset future capital gains of the Fund to the extent provided by regulations and may be limited. Under the Regulated Investment Company Modernization Act of 2010 (the Act), the Fund is permitted to carry forward capital losses incurred in taxable years beginning after December 22, 2010 for an unlimited period and such capital losses are required to be used prior to any losses that expire. Capital loss carryforwards were as follows:
|
Fiscal year of expiration |
|
|
2018 |
$ (4,605,799) |
The tax character of distributions paid was as follows:
|
|
February 28, 2013 |
February 29, 2012 |
|
Ordinary Income |
$ 8,401,078 |
$ 4,955,219 |
Trading (Redemption) Fees. Shares held by investors in the Fund less than 30 days are subject to a redemption fee equal to .75% of the net asset value of shares redeemed. All redemption fees, which reduce the proceeds of the shareholder redemption, are retained by the Fund and accounted for as an addition to paid in capital.
4. Purchases and Sales of Investments.
Purchases and sales of securities, other than short-term securities, aggregated $292,408,210 and $291,614,126, respectively.
5. Fees and Other Transactions with Affiliates.
Management Fee. FMR and its affiliates provide the Fund with investment management related services for which the Fund pays a monthly management fee. The management fee is the sum of an individual fund fee rate that is based on an annual rate of .30% of the Fund's average net assets and an annualized group fee rate that averaged .26% during the period. The group fee rate is based upon the average net assets of all the mutual funds advised by FMR. The group fee rate decreases as assets under management increase and increases as assets under management decrease. For the period, the total annual management fee rate was .56% of the Fund's average net assets.
Distribution and Service Plan Fees. In accordance with Rule 12b-1 of the 1940 Act, the Fund has adopted separate Distribution and Service Plans for each class of shares. Certain classes pay Fidelity Distributors Corporation (FDC), an affiliate of FMR, separate Distribution and Service Fees, each of which is based on an annual percentage of each class' average net assets. In addition, FDC may pay financial intermediaries for selling shares of the Fund and providing shareholder support services. For the period, the Distribution and Service Fee rates, total fees and amounts retained by FDC were as follows:
|
|
Distribution |
Service |
Total Fees |
Retained |
|
Class A |
-% |
.25% |
$ 14,849 |
$ 541 |
|
Class T |
.25% |
.25% |
17,870 |
70 |
|
Class B |
.75% |
.25% |
6,575 |
4,941 |
|
Class C |
.75% |
.25% |
38,152 |
9,096 |
|
|
|
|
$ 77,446 |
$ 14,648 |
Sales Load. FDC may receive a front-end sales charge of up to 5.75% for selling Class A shares and 3.50% for selling Class T shares, some of which is paid to financial intermediaries for selling shares of the Fund. Depending on the holding period, FDC may receive contingent deferred sales charges levied on Class A, Class T, Class B and Class C redemptions. The deferred sales charges range from 5.00% to 1.00% for Class B shares, 1.00% for Class C shares, 1.00% for certain purchases of Class A shares and .25% for certain purchases of Class T shares.
Annual Report
5. Fees and Other Transactions with Affiliates - continued
Sales Load - continued
For the period, sales charge amounts retained by FDC were as follows:
|
|
Retained |
|
Class A |
$ 5,421 |
|
Class T |
2,485 |
|
Class B* |
1,042 |
|
Class C* |
869 |
|
|
$ 9,817 |
* When Class B and Class C shares are initially sold, FDC pays commissions from its own resources to financial intermediaries through which the sales are made.
Transfer Agent Fees. Fidelity Investments Institutional Operations Company, Inc., (FIIOC), an affiliate of FMR, is the transfer, dividend disbursing and shareholder servicing agent for each class of the Fund. FIIOC receives account fees and asset-based fees that vary according to the account size and type of account of the shareholders of the respective classes of the Fund. FIIOC pays for typesetting, printing and mailing of shareholder reports, except proxy statements. For the period, transfer agent fees for each class were as follows:
|
|
Amount |
% of |
|
Class A |
$ 17,802 |
.30 |
|
Class T |
12,230 |
.34 |
|
Class B |
1,983 |
.30 |
|
Class C |
10,279 |
.27 |
|
Telecommunications |
902,150 |
.23 |
|
Institutional Class |
3,314 |
.21 |
|
|
$ 947,758 |
|
Accounting and Security Lending Fees. Fidelity Service Company, Inc. (FSC), an affiliate of FMR, maintains the Fund's accounting records. The accounting fee is based on the level of average net assets for each month. Under a separate contract, FSC administers the security lending program. The security lending fee is based on the number and duration of lending transactions.
Brokerage Commissions. The Fund placed a portion of its portfolio transactions with brokerage firms which are affiliates of the investment adviser. The commissions paid to these affiliated firms were $17,997 for the period.
6. Committed Line of Credit.
The Fund participates with other funds managed by FMR or an affiliate in a $4.25 billion credit facility (the "line of credit") to be utilized for temporary or emergency purposes to fund shareholder redemptions or for other short-term liquidity purposes. The Fund has agreed to pay commitment fees on its pro-rata portion of the line of credit, which amounted to $1,031 and is reflected in Miscellaneous expenses on the Statement of Operations. During the period, there were no borrowings on this line of credit.
7. Security Lending.
The Fund lends portfolio securities through a lending agent from time to time in order to earn additional income. For equity securities, a lending agent is used and may loan securities to certain qualified borrowers, including Fidelity Capital Markets (FCM), a broker-dealer affiliated with the Fund. On the settlement date of the loan, the Fund receives collateral (in the form of U.S. Treasury obligations, letters of credit and/or cash) against the loaned securities and maintains collateral in an amount not less than 100% of the market value of the loaned securities during the period of the loan. The market value of the loaned securities is determined at the close of business of the Fund and any additional required collateral is delivered to the Fund on the next business day. If the borrower defaults on its obligation to return the securities loaned because of insolvency or other reasons, a fund could experience delays and costs in recovering the securities loaned or in gaining access to the collateral. Any cash collateral received is invested in the Fidelity Securities Lending Cash Central Fund. The value of loaned securities and cash collateral at period end are disclosed on the Fund's Statement of Assets and Liabilities. The value of securities loaned to FCM at period end was $2,380,500. Security lending income represents the income earned on investing cash collateral, less rebates paid to borrowers and any lending agent fees associated with the loan, plus any premium payments received for
Annual Report
Notes to Financial Statements - continued
7. Security Lending - continued
lending certain types of securities. Security lending income is presented in the Statement of Operations as a component of income from Fidelity Central Funds. Total security lending income during the period amounted to $316,632, including $55,252 from securities loaned to FCM.
8. Expense Reductions.
Many of the brokers with whom FMR places trades on behalf of the Fund provided services to the Fund in addition to trade execution. These services included payments of certain expenses on behalf of the Fund totaling $60,763 for the period.
In addition, FMR reimbursed a portion of the Fund's operating expenses during the period in the amount of $350.
9. Distributions to Shareholders.
Distributions to shareholders of each class were as follows:
|
|
Year ended February 28, 2013 |
Year ended February 29, 2012 |
|
From net investment income |
|
|
|
Class A |
$ 115,461 |
$ 54,285 |
|
Class T |
65,641 |
24,009 |
|
Class B |
6,964 |
2,206 |
|
Class C |
43,780 |
19,099 |
|
Telecommunications |
8,113,006 |
4,833,836 |
|
Institutional Class |
56,226 |
21,784 |
|
Total |
$ 8,401,078 |
$ 4,955,219 |
10. Share Transactions.
Transactions for each class of shares were as follows:
|
|
Shares |
Dollars |
||
|
|
Year ended |
Year ended |
Year ended |
Year ended |
|
Class A |
|
|
|
|
|
Shares sold |
76,572 |
70,128 |
$ 3,760,739 |
$ 3,321,351 |
|
Reinvestment of distributions |
1,839 |
1,116 |
92,540 |
47,447 |
|
Shares redeemed |
(54,776) |
(61,569) |
(2,738,397) |
(2,787,444) |
|
Net increase (decrease) |
23,635 |
9,675 |
$ 1,114,882 |
$ 581,354 |
|
Class T |
|
|
|
|
|
Shares sold |
48,620 |
24,101 |
$ 2,392,044 |
$ 1,100,865 |
|
Reinvestment of distributions |
1,268 |
557 |
63,823 |
23,555 |
|
Shares redeemed |
(26,195) |
(27,493) |
(1,317,712) |
(1,235,915) |
|
Net increase (decrease) |
23,693 |
(2,835) |
$ 1,138,155 |
$ (111,495) |
|
Class B |
|
|
|
|
|
Shares sold |
3,053 |
1,659 |
$ 144,445 |
$ 77,673 |
|
Reinvestment of distributions |
133 |
46 |
6,751 |
1,965 |
|
Shares redeemed |
(4,941) |
(3,832) |
(248,673) |
(176,016) |
|
Net increase (decrease) |
(1,755) |
(2,127) |
$ (97,477) |
$ (96,378) |
|
Class C |
|
|
|
|
|
Shares sold |
26,248 |
30,950 |
$ 1,304,972 |
$ 1,412,876 |
|
Reinvestment of distributions |
594 |
313 |
29,972 |
13,236 |
|
Shares redeemed |
(18,620) |
(19,633) |
(912,596) |
(879,199) |
|
Net increase (decrease) |
8,222 |
11,630 |
$ 422,348 |
$ 546,913 |
|
Telecommunications |
|
|
|
|
|
Shares sold |
3,283,802 |
3,856,487 |
$ 158,174,294 |
$ 180,498,933 |
|
Reinvestment of distributions |
156,090 |
108,713 |
7,859,416 |
4,652,114 |
|
Shares redeemed |
(3,538,446) |
(4,106,690) |
(177,183,415) |
(188,141,891) |
|
Net increase (decrease) |
(98,554) |
(141,490) |
$ (11,149,705) |
$ (2,990,844) |
Annual Report
10. Share Transactions - continued
|
|
Shares |
Dollars |
||
|
|
Year ended |
Year ended |
Year ended |
Year ended |
|
Institutional Class |
|
|
|
|
|
Shares sold |
41,031 |
107,857 |
$ 2,107,286 |
$ 5,158,491 |
|
Reinvestment of distributions |
986 |
401 |
49,926 |
17,134 |
|
Shares redeemed |
(13,014) |
(123,190) |
(646,240) |
(5,562,790) |
|
Net increase (decrease) |
29,003 |
(14,932) |
$ 1,510,972 |
$ (387,165) |
11. Other.
The Fund's organizational documents provide former and current trustees and officers with a limited indemnification against liabilities arising in connection with the performance of their duties to the Fund. In the normal course of business, the Fund may also enter into contracts that provide general indemnifications. The Fund's maximum exposure under these arrangements is unknown as this would be dependent on future claims that may be made against the Fund. The risk of material loss from such claims is considered remote.
At the end of the period, Fidelity VIP FundsManager 60% Portfolio was the owner of record of approximately 20% of the total outstanding shares of the Fund. Mutual funds managed by FMR or its affiliates were the owners of record, in the aggregate, of approximately 32% of the total outstanding shares of the Fund.
Annual Report
Performance: The Bottom Line
Average annual total return reflects the change in the value of an investment, assuming reinvestment of the fund's distributions from dividend income and capital gains (the profits earned upon the sale of securities that have grown in value, if any) and assuming a constant rate of performance each year. The $10,000 table and the fund's returns do not reflect the deduction of taxes that a shareholder would pay on fund distributions or the redemption of fund shares. During periods of reimbursement by Fidelity, a fund's total returns will be greater than it would be had the reimbursement not occurred. How a fund did yesterday is no guarantee of how it will do tomorrow.
Average Annual Total Returns
|
Periods ended February 28, 2013 |
Past 1 |
Past 5 |
Past 10 |
|
Wireless Portfolio |
13.89% |
5.67% |
15.75% |
$10,000 Over 10 Years
Let's say hypothetically that $10,000 was invested in Wireless Portfolio on February 28, 2003. The chart shows how the value of your investment would have changed, and also shows how the S&P 500 Index performed over the same period.
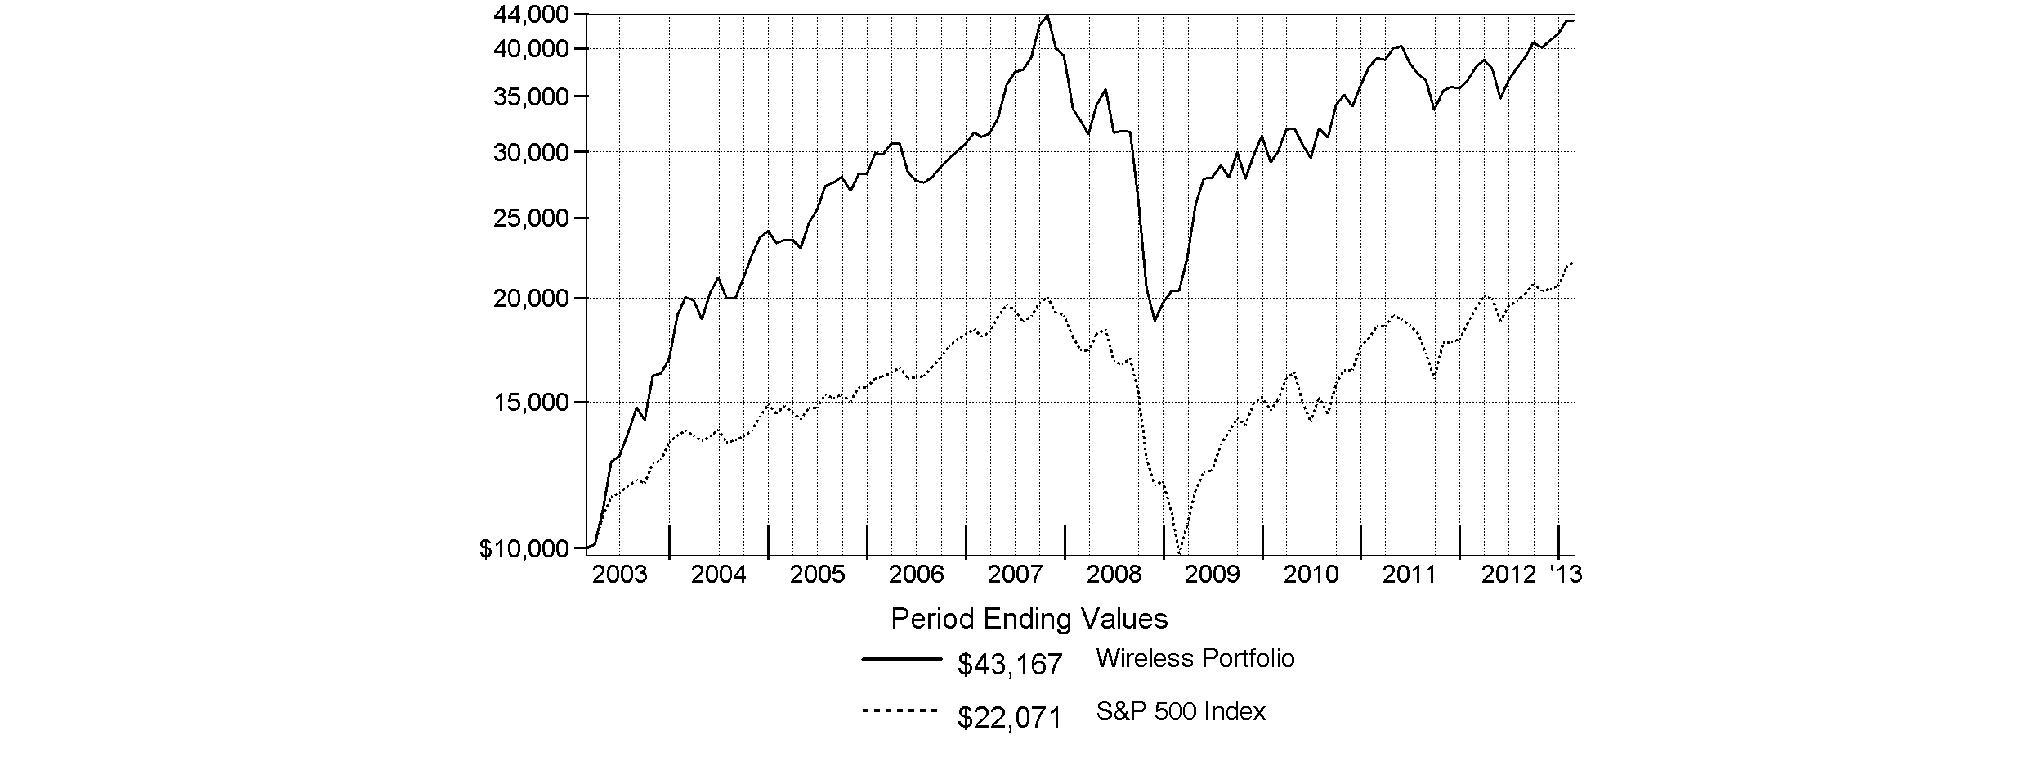
Annual Report
Wireless Portfolio
Management's Discussion of Fund Performance
Market Recap: U.S. stocks posted solid gains for the year ending February 28, 2013, sparked by a late-period rally that pushed major equity benchmarks to multiyear highs. Improvement in the global economy and more monetary stimulus from the U.S. Federal Reserve kept markets on the upswing for much of the year, shrugging off an early decline brought on by debt woes in Europe, and another dip later in the period amid Congressional gridlock on the federal budget. Renewed optimism over employment, the housing market, corporate earnings and record dividends made stocks a favorite with investors during the 12 months, which helped push the broad-based S&P 500® Index across the milestone 1,500 mark at the end of January. The S&P 500® finished the period up 13.46%. Seven of the 10 major market sectors tracked by MSCI U.S. IMI 25-50 classifications produced double-digit gains, led by health care and financials, while information technology, energy and materials trailed the broad equity market with only modest advances.
Comments from Kyle Weaver, who became sole Portfolio Manager of Wireless Portfolio on March 1, 2013: For the year, the fund returned 13.89%, surpassing the 12.49% gain of the S&P® Custom Wireless Index but trailing the S&P 500®. Wireless stocks benefited from consumers' desire for greater functionality in their mobile devices, which in turn drove the need for greater bandwidth, more-open-ended service plans and more-sophisticated smartphone features. Versus the wireless index, the fund was particularly aided by stock picking in wireless telecommunication services. Secondarily, modest out-of-benchmark exposure to the cable/satellite and Internet software/services groups gave a lift to our results. In cable/satellite, the positive impact was almost entirely attributable to Virgin Media, a U.K.-based cable company that did a good job of bundling wireless services with video broadband. This company's share price rallied smartly in early February, when rival media firm Liberty Global announced plans to purchase the company. The fund's top relative contributor was a sizable underweighting in the weak-performing shares of Finnish handset maker and benchmark component Nokia, which fell amid perceptions that the company was falling further behind its competitors in the race to turn out competitive smartphones. Other positives included an underweighting in Spain's Telefonica, which offers a mix of wireline and wireless services in Spain and Latin America. The share price of this firm was hurt by concerns about the company's extensive debt, its exposure to the European sovereign debt crisis and Spain's extremely weak economy. Underweighting Canada's Research In Motion, the beleaguered maker of the BlackBerry® smartphone, was helpful as well. Conversely, positioning in the integrated telecom services group dampened performance. Here, sizable underweightings in Verizon Communications and AT&T - the latter of which I bought partway through the period - worked against the fund, given the solid gains posted by these major index constituents. Although I continued to underweight these stocks and viewed the growth prospects of both companies as relatively unexciting, they represented the fund's fourth- and fifth-largest positions at period end. Polycom shed more than half of its value, as the company - a provider of high-definition videoconferencing software and equipment that's not in the index - struggled to manage a shift from being primarily a hardware vendor to mainly selling software. I'll also mention Vodafone Group, the fund's largest holding during the period. In this case, fear about the company's European exposure depressed its stock. Lastly, an out-of-benchmark stake in smartphone maker Apple was counterproductive, given the stock's substantial decline after mid-September, and I significantly reduced the fund's position here.
The views expressed above reflect those of the portfolio manager(s) only through the end of the period as stated on the cover of this report and do not necessarily represent the views of Fidelity or any other person in the Fidelity organization. Any such views are subject to change at any time based upon market or other conditions and Fidelity disclaims any responsibility to update such views. These views may not be relied on as investment advice and, because investment decisions for a Fidelity fund are based on numerous factors, may not be relied on as an indication of trading intent on behalf of any Fidelity fund.
Annual Report
Wireless Portfolio
Shareholder Expense Example
As a shareholder of the Fund, you incur two types of costs: (1) transaction costs, including redemption fees and (2) ongoing costs, including management fees and other Fund expenses. This Example is intended to help you understand your ongoing costs (in dollars) of investing in the Fund and to compare these costs with the ongoing costs of investing in other mutual funds.
The Example is based on an investment of $1,000 invested at the beginning of the period and held for the entire period (September 1, 2012 to February 28, 2013).
Actual Expenses
The first line of the accompanying table provides information about actual account values and actual expenses. You may use the information in this line, together with the amount you invested, to estimate the expenses that you paid over the period. Simply divide your account value by $1,000.00 (for example, an $8,600 account value divided by $1,000.00 = 8.6), then multiply the result by the number in the first line under the heading entitled "Expenses Paid During Period" to estimate the expenses you paid on your account during this period. A small balance maintenance fee of $12.00 that is charged once a year may apply for certain accounts with a value of less than $2,000. This fee is not included in the table below. If it was, the estimate of expenses you paid during the period would be higher, and your ending account value lower, by this amount. In addition, the Fund, as a shareholder in the underlying Fidelity Central Funds, will indirectly bear its pro-rata share of the fees and expenses incurred by the underlying Fidelity Central Funds. These fees and expenses are not included in the Fund's annualized expense ratio used to calculate the expense estimate in the table below.
Hypothetical Example for Comparison Purposes
The second line of the accompanying table provides information about hypothetical account values and hypothetical expenses based on the Fund's actual expense ratio and an assumed rate of return of 5% per year before expenses, which is not the Fund's actual return. The hypothetical account values and expenses may not be used to estimate the actual ending account balance or expenses you paid for the period. You may use this information to compare the ongoing costs of investing in the Fund and other funds. To do so, compare this 5% hypothetical example with the 5% hypothetical examples that appear in the shareholder reports of the other funds. A small balance maintenance fee of $12.00 that is charged once a year may apply for certain accounts with a value of less than $2,000. This fee is not included in the table below. If it was, the estimate of expenses you paid during the period would be higher, and your ending account value lower, by this amount. In addition, the Fund, as a shareholder in the underlying Fidelity Central Funds, will indirectly bear its pro-rata share of the fees and expenses incurred by the underlying Fidelity Central Funds. These fees and expenses are not included in the Fund's annualized expense ratio used to calculate the expense estimate in the table below.
Please note that the expenses shown in the table are meant to highlight your ongoing costs only and do not reflect any transaction costs. Therefore, the second line of the table is useful in comparing ongoing costs only, and will not help you determine the relative total costs of owning different funds. In addition, if these transactional costs were included, your costs would have been higher.
|
|
Annualized |
Beginning |
Ending |
Expenses Paid |
|
Actual |
.89% |
$ 1,000.00 |
$ 1,104.40 |
$ 4.64 |
|
Hypothetical (5% return per year before expenses) |
|
$ 1,000.00 |
$ 1,020.38 |
$ 4.46 |
* Expenses are equal to the Fund's annualized expense ratio, multiplied by the average account value over the period, multiplied by 181/365 (to reflect the one-half year period).
Annual Report
Wireless Portfolio
Investment Changes (Unaudited)
|
Top Ten Stocks as of February 28, 2013 |
||
|
|
% of fund's |
% of fund's net assets |
|
Vodafone Group PLC sponsored ADR |
11.7 |
13.9 |
|
QUALCOMM, Inc. |
10.0 |
8.7 |
|
American Tower Corp. |
7.5 |
4.5 |
|
Verizon Communications, Inc. |
4.8 |
4.6 |
|
AT&T, Inc. |
4.7 |
5.6 |
|
SBA Communications Corp. Class A |
4.5 |
3.8 |
|
NTT DoCoMo, Inc. sponsored ADR |
4.3 |
1.7 |
|
Motorola Solutions, Inc. |
4.1 |
3.8 |
|
Telefonaktiebolaget LM Ericsson (B Shares) sponsored ADR |
4.0 |
3.4 |
|
Rogers Communications, Inc. Class B (non-vtg.) |
3.7 |
2.2 |
|
|
59.3 |
|
|
Top Industries (% of fund's net assets) |
|||
|
As of February 28, 2013 |
|||
|
Wireless Telecommunication Services |
39.8% |
|
|
Communications Equipment |
27.0% |
|
|
Diversified Telecommunication Services |
13.0% |
|
|
Real Estate Investment Trusts |
7.5% |
|
|
Internet Software & Services |
4.5% |
|
|
All Others* |
8.2% |
|

|
As of August 31, 2012 |
|||
|
Wireless Telecommunication Services |
39.8% |
|
|
Communications Equipment |
25.3% |
|
|
Diversified Telecommunication Services |
15.0% |
|
|
Real Estate Investment Trusts |
4.5% |
|
|
Software |
2.8% |
|
|
All Others* |
12.6% |
|

|
* Includes short-term investments and net other assets. |
Annual Report
Wireless Portfolio
Investments February 28, 2013
Showing Percentage of Net Assets
|
Common Stocks - 98.5% |
|||
|
Shares |
Value |
||
|
AEROSPACE & DEFENSE - 0.6% |
|||
|
Aerospace & Defense - 0.6% |
|||
|
Kratos Defense & Security Solutions, Inc. (a)(d) |
325,500 |
$ 1,376,865 |
|
|
COMMUNICATIONS EQUIPMENT - 27.0% |
|||
|
Communications Equipment - 27.0% |
|||
|
Alcatel-Lucent SA sponsored ADR (a) |
435,100 |
596,087 |
|
|
Aruba Networks, Inc. (a) |
117,484 |
2,927,701 |
|
|
Globecomm Systems, Inc. (a) |
8,700 |
105,618 |
|
|
Harris Corp. |
61,700 |
2,965,919 |
|
|
InterDigital, Inc. (d) |
57,400 |
2,548,560 |
|
|
Juniper Networks, Inc. (a) |
60,900 |
1,259,412 |
|
|
Motorola Solutions, Inc. |
165,768 |
10,312,427 |
|
|
Nokia Corp. sponsored ADR (d) |
626,000 |
2,284,900 |
|
|
Polycom, Inc. (a) |
39,900 |
363,489 |
|
|
QUALCOMM, Inc. |
385,050 |
25,270,832 |
|
|
Research In Motion Ltd. (a)(d) |
298,400 |
3,983,641 |
|
|
Riverbed Technology, Inc. (a) |
82,600 |
1,262,128 |
|
|
Sierra Wireless, Inc. (a) |
76,600 |
861,634 |
|
|
Telefonaktiebolaget LM Ericsson |
830,900 |
10,145,289 |
|
|
Ubiquiti Networks, Inc. (d) |
18,100 |
249,237 |
|
|
ViaSat, Inc. (a) |
70,600 |
3,315,376 |
|
|
|
68,452,250 |
||
|
COMPUTERS & PERIPHERALS - 0.6% |
|||
|
Computer Hardware - 0.6% |
|||
|
Apple, Inc. |
3,550 |
1,566,970 |
|
|
DIVERSIFIED TELECOMMUNICATION SERVICES - 13.0% |
|||
|
Alternative Carriers - 0.0% |
|||
|
Lumos Networks Corp. |
12,400 |
141,608 |
|
|
Integrated Telecommunication Services - 13.0% |
|||
|
AT&T, Inc. |
330,700 |
11,875,437 |
|
|
China Unicom Ltd. sponsored ADR |
286,800 |
4,178,676 |
|
|
Telefonica Brasil SA sponsored ADR |
30,500 |
803,980 |
|
|
Telefonica SA sponsored ADR |
299,311 |
3,897,029 |
|
|
Verizon Communications, Inc. |
261,600 |
12,172,248 |
|
|
|
32,927,370 |
||
|
TOTAL DIVERSIFIED TELECOMMUNICATION SERVICES |
33,068,978 |
||
|
ELECTRONIC EQUIPMENT & COMPONENTS - 0.4% |
|||
|
Electronic Manufacturing Services - 0.4% |
|||
|
Flextronics International Ltd. (a) |
105,900 |
704,235 |
|
|
Uni-Pixel, Inc. (a)(d) |
16,900 |
398,840 |
|
|
|
1,103,075 |
||
|
INTERNET SOFTWARE & SERVICES - 4.5% |
|||
|
Internet Software & Services - 4.5% |
|||
|
Baidu.com, Inc. sponsored ADR (a) |
12,900 |
1,170,804 |
|
|
Google, Inc. Class A (a) |
8,300 |
6,649,960 |
|
|
|
|||
|
Shares |
Value |
||
|
Velti PLC (a)(d) |
150,000 |
$ 552,000 |
|
|
Web.com Group, Inc. (a) |
169,500 |
2,895,060 |
|
|
|
11,267,824 |
||
|
IT SERVICES - 0.0% |
|||
|
Data Processing & Outsourced Services - 0.0% |
|||
|
NeuStar, Inc. Class A (a) |
400 |
17,540 |
|
|
MEDIA - 0.0% |
|||
|
Cable & Satellite - 0.0% |
|||
|
DISH Network Corp. Class A |
900 |
31,320 |
|
|
Virgin Media, Inc. |
50 |
2,320 |
|
|
|
33,640 |
||
|
REAL ESTATE INVESTMENT TRUSTS - 7.5% |
|||
|
Specialized REITs - 7.5% |
|||
|
American Tower Corp. |
245,392 |
19,042,419 |
|
|
SEMICONDUCTORS & SEMICONDUCTOR EQUIPMENT - 3.3% |
|||
|
Semiconductors - 3.3% |
|||
|
Analog Devices, Inc. |
10,600 |
479,332 |
|
|
Avago Technologies Ltd. |
37,900 |
1,296,938 |
|
|
Broadcom Corp. Class A |
17,700 |
603,747 |
|
|
Freescale Semiconductor Holdings I Ltd. (a)(d) |
44,500 |
686,635 |
|
|
Mellanox Technologies Ltd. (a) |
7,300 |
384,929 |
|
|
RF Micro Devices, Inc. (a) |
666,300 |
3,071,643 |
|
|
Samsung Electronics Co. Ltd. |
481 |
684,893 |
|
|
Skyworks Solutions, Inc. (a) |
56,200 |
1,197,060 |
|
|
|
8,405,177 |
||
|
SOFTWARE - 1.8% |
|||
|
Application Software - 1.6% |
|||
|
AsiaInfo-Linkage, Inc. (a) |
54,750 |
603,893 |
|
|
Comverse, Inc. |
32,268 |
888,015 |
|
|
Gameloft Se (a) |
311,362 |
2,093,468 |
|
|
Synchronoss Technologies, Inc. (a) |
4,750 |
143,308 |
|
|
Verint Systems, Inc. (a) |
12,757 |
435,907 |
|
|
|
4,164,591 |
||
|
Systems Software - 0.2% |
|||
|
Allot Communications Ltd. (a) |
31,200 |
428,376 |
|
|
TOTAL SOFTWARE |
4,592,967 |
||
|
WIRELESS TELECOMMUNICATION SERVICES - 39.8% |
|||
|
Wireless Telecommunication Services - 39.8% |
|||
|
America Movil S.A.B. de CV Series L sponsored ADR |
58,100 |
1,213,709 |
|
|
China Mobile Ltd. sponsored ADR |
138,200 |
7,573,360 |
|
|
Clearwire Corp. Class A (a) |
969,950 |
3,026,244 |
|
|
Crown Castle International Corp. (a) |
123,200 |
8,599,360 |
|
|
Leap Wireless International, Inc. (a)(d) |
36,050 |
192,868 |
|
|
MetroPCS Communications, Inc. (a) |
352,450 |
3,454,010 |
|
|
NII Holdings, Inc. (a)(d) |
345,300 |
1,664,346 |
|
|
NTT DoCoMo, Inc. sponsored ADR (d) |
712,100 |
11,009,066 |
|
|
Common Stocks - continued |
|||
|
Shares |
Value |
||
|
WIRELESS TELECOMMUNICATION SERVICES - CONTINUED |
|||
|
Wireless Telecommunication Services - continued |
|||
|
Rogers Communications, Inc. |
199,100 |
$ 9,456,405 |
|
|
SBA Communications Corp. |
162,700 |
11,571,224 |
|
|
Sprint Nextel Corp. (a) |
1,359,131 |
7,882,960 |
|
|
Telephone & Data Systems, Inc. |
152,114 |
3,481,889 |
|
|
U.S. Cellular Corp. (a) |
50,600 |
1,861,574 |
|
|
USA Mobility, Inc. |
36,400 |
422,968 |
|
|
Vodafone Group PLC sponsored ADR |
1,179,800 |
29,660,171 |
|
|
|
101,070,154 |
||
|
TOTAL COMMON STOCKS (Cost $207,775,819) |
|
||
|
Money Market Funds - 10.6% |
|||
|
|
|
|
|
|
Fidelity Cash Central Fund, 0.16% (b) |
4,481,177 |
4,481,177 |
|
|
Fidelity Securities Lending Cash Central Fund, 0.16% (b)(c) |
22,387,205 |
22,387,205 |
|
|
TOTAL MONEY MARKET FUNDS (Cost $26,868,382) |
|
||
|
TOTAL INVESTMENT PORTFOLIO - 109.1% (Cost $234,644,201) |
276,866,241 |
||
|
NET OTHER ASSETS (LIABILITIES) - (9.1)% |
(23,072,004) |
||
|
NET ASSETS - 100% |
$ 253,794,237 |
||
|
Legend |
|
(a) Non-income producing |
|
(b) Affiliated fund that is generally available only to investment companies and other accounts managed by Fidelity Investments. The rate quoted is the annualized seven-day yield of the fund at period end. A complete unaudited listing of the fund's holdings as of its most recent quarter end is available upon request. In addition, each Fidelity Central Fund's financial statements, which are not covered by the Fund's Report of Independent Registered Public Accounting Firm, are available on the SEC's website or upon request. |
|
(c) Investment made with cash collateral received from securities on loan. |
|
(d) Security or a portion of the security is on loan at period end. |
|
Affiliated Central Funds |
|
Information regarding fiscal year to date income earned by the Fund from investments in Fidelity Central Funds is as follows: |
|
Fund |
Income earned |
|
Fidelity Cash Central Fund |
$ 5,173 |
|
Fidelity Securities Lending Cash Central Fund |
267,751 |
|
Total |
$ 272,924 |
|
Other Information |
|
All investments are categorized as Level 1 under the Fair Value Hierarchy. The inputs or methodology used for valuing securities may not be an indication of the risk associated with investing in those securities. For more information on valuation inputs, please refer to the Investment Valuation section in the accompanying Notes to Financial Statements. |
|
Distribution of investments by country or territory of incorporation, as a percentage of total net assets, is as follows. (Unaudited) |
|
United States of America |
63.1% |
|
United Kingdom |
11.7% |
|
Canada |
5.6% |
|
Hong Kong |
4.7% |
|
Japan |
4.3% |
|
Sweden |
4.0% |
|
Spain |
1.5% |
|
France |
1.0% |
|
Others (Individually Less Than 1%) |
4.1% |
|
|
100.0% |
See accompanying notes which are an integral part of the financial statements.
Annual Report
Wireless Portfolio
Financial Statements
Statement of Assets and Liabilities
|
|
February 28, 2013 |
|
|
|
|
|
|
Assets |
|
|
|
Investment in securities, at value (including securities loaned of $21,249,412) - See accompanying schedule: Unaffiliated issuers (cost $207,775,819) |
$ 249,997,859 |
|
|
Fidelity Central Funds (cost $26,868,382) |
26,868,382 |
|
|
Total Investments (cost $234,644,201) |
|
$ 276,866,241 |
|
Cash |
|
40 |
|
Receivable for fund shares sold |
|
276,074 |
|
Dividends receivable |
|
22,168 |
|
Distributions receivable from Fidelity Central Funds |
|
20,258 |
|
Prepaid expenses |
|
366 |
|
Receivable from investment adviser for expense reductions |
|
28 |
|
Other receivables |
|
42,433 |
|
Total assets |
|
277,227,608 |
|
|
|
|
|
Liabilities |
|
|
|
Payable for investments purchased |
$ 601,343 |
|
|
Payable for fund shares redeemed |
233,303 |
|
|
Accrued management fee |
118,286 |
|
|
Other affiliated payables |
60,834 |
|
|
Other payables and accrued expenses |
32,400 |
|
|
Collateral on securities loaned, at value |
22,387,205 |
|
|
Total liabilities |
|
23,433,371 |
|
|
|
|
|
Net Assets |
|
$ 253,794,237 |
|
Net Assets consist of: |
|
|
|
Paid in capital |
|
$ 230,464,240 |
|
Distributions in excess of net investment income |
|
(689,955) |
|
Accumulated undistributed net realized gain (loss) on investments and foreign currency transactions |
|
(18,195,683) |
|
Net unrealized appreciation (depreciation) on investments and assets and liabilities in foreign currencies |
|
42,215,635 |
|
Net Assets, for 29,514,456 shares outstanding |
|
$ 253,794,237 |
|
Net Asset Value, offering price and redemption price per share ($253,794,237 ÷ 29,514,456 shares) |
|
$ 8.60 |
Statement of Operations
|
|
Year ended February 28, 2013 |
|
|
|
|
|
|
Investment Income |
|
|
|
Dividends |
|
$ 5,541,619 |
|
Interest |
|
13 |
|
Income from Fidelity Central Funds |
|
272,924 |
|
Total income |
|
5,814,556 |
|
|
|
|
|
Expenses |
|
|
|
Management fee |
$ 1,366,464 |
|
|
Transfer agent fees |
642,999 |
|
|
Accounting and security lending fees |
101,219 |
|
|
Custodian fees and expenses |
22,028 |
|
|
Independent trustees' compensation |
1,619 |
|
|
Registration fees |
26,840 |
|
|
Audit |
37,800 |
|
|
Legal |
1,113 |
|
|
Miscellaneous |
2,262 |
|
|
Total expenses before reductions |
2,202,344 |
|
|
Expense reductions |
(75,585) |
2,126,759 |
|
Net investment income (loss) |
|
3,687,797 |
|
Realized and Unrealized Gain (Loss) Net realized gain (loss) on: |
|
|
|
Investment securities: |
|
|
|
Unaffiliated issuers |
(182,793) |
|
|
Foreign currency transactions |
(29,732) |
|
|
Total net realized gain (loss) |
|
(212,525) |
|
Change in net unrealized appreciation (depreciation) on: Investment securities |
27,752,526 |
|
|
Assets and liabilities in foreign currencies |
(2,352) |
|
|
Total change in net unrealized appreciation (depreciation) |
|
27,750,174 |
|
Net gain (loss) |
|
27,537,649 |
|
Net increase (decrease) in net assets resulting from operations |
|
$ 31,225,446 |
See accompanying notes which are an integral part of the financial statements.
Annual Report
Wireless Portfolio
Financial Statements - continued
Statement of Changes in Net Assets
|
|
Year ended |
Year ended |
|
Increase (Decrease) in Net Assets |
|
|
|
Operations |
|
|
|
Net investment income (loss) |
$ 3,687,797 |
$ 3,593,386 |
|
Net realized gain (loss) |
(212,525) |
7,882,810 |
|
Change in net unrealized appreciation (depreciation) |
27,750,174 |
(21,251,144) |
|
Net increase (decrease) in net assets resulting from operations |
31,225,446 |
(9,774,948) |
|
Distributions to shareholders from net investment income |
(4,135,652) |
(2,771,729) |
|
Distributions to shareholders from net realized gain |
- |
(10,255,385) |
|
Total distributions |
(4,135,652) |
(13,027,114) |
|
Share transactions |
47,598,521 |
59,170,659 |
|
Reinvestment of distributions |
3,963,751 |
12,540,423 |
|
Cost of shares redeemed |
(87,559,651) |
(147,309,703) |
|
Net increase (decrease) in net assets resulting from share transactions |
(35,997,379) |
(75,598,621) |
|
Redemption fees |
6,317 |
14,005 |
|
Total increase (decrease) in net assets |
(8,901,268) |
(98,386,678) |
|
|
|
|
|
Net Assets |
|
|
|
Beginning of period |
262,695,505 |
361,082,183 |
|
End of period (including distributions in excess of net investment income of $689,955 and distributions in excess of net investment income of $216,760, respectively) |
$ 253,794,237 |
$ 262,695,505 |
|
Other Information Shares |
|
|
|
Sold |
5,878,305 |
7,641,356 |
|
Issued in reinvestment of distributions |
483,848 |
1,729,713 |
|
Redeemed |
(11,054,527) |
(18,743,667) |
|
Net increase (decrease) |
(4,692,374) |
(9,372,598) |
Financial Highlights
|
Years ended February 28, |
2013 |
2012 G |
2011 |
2010 |
2009 |
|
Selected Per-Share Data |
|
|
|
|
|
|
Net asset value, beginning of period |
$ 7.68 |
$ 8.29 |
$ 6.47 |
$ 4.44 |
$ 7.23 |
|
Income from Investment Operations |
|
|
|
|
|
|
Net investment income (loss) B |
.12 |
.10 E |
.08 |
.06 |
.05 |
|
Net realized and unrealized gain (loss) |
.94 |
(.33) |
1.82 |
2.03 |
(2.78) |
|
Total from investment operations |
1.06 |
(.23) |
1.90 |
2.09 |
(2.73) |
|
Distributions from net investment income |
(.14) |
(.08) |
(.08) |
(.06) |
(.06) |
|
Distributions from net realized gain |
- |
(.30) |
- |
- |
- |
|
Total distributions |
(.14) |
(.38) |
(.08) |
(.06) |
(.06) |
|
Redemption fees added to paid in capital B, H |
- |
- |
- |
- |
- |
|
Net asset value, end of period |
$ 8.60 |
$ 7.68 |
$ 8.29 |
$ 6.47 |
$ 4.44 |
|
Total Return A |
13.89% |
(2.55)% |
29.55% |
47.06% |
(37.68)% |
|
Ratios to Average Net Assets C, F |
|
|
|
|
|
|
Expenses before reductions |
.90% |
.90% |
.92% |
.96% |
.95% |
|
Expenses net of fee waivers, if any |
.90% |
.90% |
.92% |
.96% |
.95% |
|
Expenses net of all reductions |
.87% |
.89% |
.91% |
.94% |
.94% |
|
Net investment income (loss) |
1.50% |
1.23% E |
1.08% |
.90% |
.85% |
|
Supplemental Data |
|
|
|
|
|
|
Net assets, end of period (000 omitted) |
$ 253,794 |
$ 262,696 |
$ 361,082 |
$ 304,896 |
$ 181,114 |
|
Portfolio turnover rate D |
100% |
114% |
111% |
154% |
191% |
|
A Total returns would have been lower if certain expenses had not been reduced during the applicable periods shown. B Calculated based on average shares outstanding during the period. C Fees and expenses of any underlying Fidelity Central Funds are not included in the Fund's expense ratio. The Fund indirectly bears its proportionate share of the expenses of any underlying Fidelity Central Funds. D Amount does not include the portfolio activity of any underlying Fidelity Central Funds. E Investment income per share reflects a large, non-recurring dividend which amounted to $.03 per share. Excluding this non-recurring dividend, the ratio of net investment income (loss) to average net assets would have been ..90%. F Expense ratios reflect operating expenses of the Fund. Expenses before reductions do not reflect amounts reimbursed by the investment adviser or reductions from brokerage service arrangements or reductions from other expense offset arrangements and do not represent the amount paid by the Fund during periods when reimbursements or reductions occur. Expenses net of fee waivers reflect expenses after reimbursement by the investment adviser but prior to reductions from brokerage service arrangements or other expense offset arrangements. Expenses net of all reductions represent the net expenses paid by the Fund. G For the year ended February 29. H Amount represents less than $.01 per share. |
See accompanying notes which are an integral part of the financial statements.
Annual Report
Notes to Financial Statements
For the period ended February 28, 2013
1. Organization.
Wireless Portfolio (the Fund) is a non-diversified fund of Fidelity Select Portfolios (the Trust) and is authorized to issue an unlimited number of shares. The Trust is registered under the Investment Company Act of 1940, as amended (the 1940 Act), as an open-end management investment company organized as a Massachusetts business trust. The Fund invests primarily in securities of companies whose principal business activities fall within specific industries.
2. Investments in Fidelity Central Funds.
The Fund invests in Fidelity Central Funds, which are open-end investment companies available only to other investment companies and accounts managed by Fidelity Management & Research Company (FMR) and its affiliates. The Fund's Schedule of Investments lists each of the Fidelity Central Funds held as of period end, if any, as an investment of the Fund, but does not include the underlying holdings of each Fidelity Central Fund. As an Investing Fund, the Fund indirectly bears its proportionate share of the expenses of the underlying Fidelity Central Funds.
The Money Market Central Funds seek preservation of capital and current income and are managed by Fidelity Investments Money Management, Inc. (FIMM), an affiliate of FMR.
A complete unaudited list of holdings for each Fidelity Central Fund is available upon request or at the Securities and Exchange Commission (the SEC) website at www.sec.gov. In addition, the financial statements of the Fidelity Central Funds, which are not covered by the Fund's Report of Independent Registered Public Accounting Firm, are available on the SEC website or upon request.
3. Significant Accounting Policies.
The financial statements have been prepared in conformity with accounting principles generally accepted in the United States of America (GAAP), which require management to make certain estimates and assumptions at the date of the financial statements. Actual results could differ from those estimates. Subsequent events, if any, through the date that the financial statements were issued have been evaluated in the preparation of the financial statements. The following summarizes the significant accounting policies of the Fund:
Investment Valuation. Investments are valued as of 4:00 p.m. Eastern time on the last calendar day of the period. In accordance with valuation policies and procedures approved by the Board of Trustees (the Board), the Fund attempts to obtain prices from one or more third party pricing vendors or brokers to value its investments. When current market prices, quotations or currency exchange rates are not readily available or reliable, investments will be fair valued in good faith by the FMR Fair Value Committee (the Committee), in accordance with procedures adopted by the Fund's Board. Factors used in determining fair value vary by investment type and may include market or investment specific events. The frequency with which these procedures are used cannot be predicted and they may be utilized to a significant extent. The Committee oversees the Fund's valuation policies and procedures and is responsible for approving and reporting to the Board all fair value determinations.
The Fund categorizes the inputs to valuation techniques used to value its investments into a disclosure hierarchy consisting of three levels as shown below:
Level 1 - quoted prices in active markets for identical investments
Level 2 - other significant observable inputs (including quoted prices for similar investments, interest rates, prepayment speeds, etc.)
Level 3 - unobservable inputs (including the Fund's own assumptions based on the best information available)
Valuation techniques used to value the Fund's investments by major category are as follows:
Equity securities, including restricted securities, for which market quotations are readily available, are valued at the last reported sale price or official closing price as reported by a third party pricing vendor on the primary market or exchange on which they are traded and are categorized as Level 1 in the hierarchy. In the event there were no sales during the day or closing prices are not available, securities are valued at the last quoted bid price or may be valued using the last available price and are generally categorized as Level 2 in the hierarchy. For foreign equity securities, when significant market or security specific events arise, comparisons to the valuation of American Depositary Receipts (ADRs, futures contracts, Exchange-Traded Funds (ETFs) and certain indexes as well as quoted prices for similar securities are used and are categorized as Level 2 in the hierarchy. Utilizing these techniques may result in transfers between Level 1 and Level 2.
Investments in open-end mutual funds, including the Fidelity Central Funds, are valued at their closing net asset value (NAV) each business day and are categorized as Level 1 in the hierarchy.
Changes in valuation techniques may result in transfers in or out of an assigned level within the disclosure hierarchy.
Foreign Currency. The Fund may use foreign currency contracts to facilitate transactions in foreign-denominated securities. Gains and losses from these transactions may arise from changes in the value of the foreign currency or if the counterparties do not perform under the contracts' terms.
Annual Report
Notes to Financial Statements - continued
3. Significant Accounting Policies - continued
Foreign Currency - continued
Foreign-denominated assets, including investment securities, and liabilities are translated into U.S. dollars at the exchange rates at period end. Purchases and sales of investment securities, income and dividends received and expenses denominated in foreign currencies are translated into U.S. dollars at the exchange rate in effect on the transaction date.
The effects of exchange rate fluctuations on investments are included with the net realized and unrealized gain (loss) on investment securities. Other foreign currency transactions resulting in realized and unrealized gain (loss) are disclosed separately.
Investment Transactions and Income. For financial reporting purposes, the Fund's investment holdings and NAV include trades executed through the end of the last business day of the period. The NAV per share for processing shareholder transactions is calculated as of the close of business of the New York Stock Exchange (NYSE), normally 4:00 p.m. Eastern time and includes trades executed through the end of the prior business day. Gains and losses on securities sold are determined on the basis of identified cost and may include proceeds received from litigation. Dividend income is recorded on the ex-dividend date, except for certain dividends from foreign securities where the ex-dividend date may have passed, which are recorded as soon as the Fund is informed of the ex-dividend date. Non-cash dividends included in dividend income, if any, are recorded at the fair market value of the securities received. Distributions received on securities that represent a return of capital or capital gain are recorded as a reduction of cost of investments and/or as a realized gain. The Fund estimates the components of distributions received that may be considered return of capital distributions or capital gain distributions. Interest income and distributions from the Fidelity Central Funds are accrued as earned. Interest income includes coupon interest and amortization of premium and accretion of discount on debt securities. Investment income is recorded net of foreign taxes withheld where recovery of such taxes is uncertain.
Expenses. Expenses directly attributable to a fund are charged to that fund. Expenses attributable to more than one fund are allocated among the respective funds on the basis of relative net assets or other appropriate methods. Expense estimates are accrued in the period to which they relate and adjustments are made when actual amounts are known.
Income Tax Information and Distributions to Shareholders. Each year, the Fund intends to qualify as a regulated investment company under Subchapter M of the Internal Revenue Code, including distributing substantially all of its taxable income and realized gains. As a result, no provision for income taxes is required. As of February 28, 2013, the Fund did not have any unrecognized tax benefits in the financial statements; nor is the Fund aware of any tax positions for which it is reasonably possible that the total amounts of unrecognized tax benefits will significantly change in the next twelve months. The Fund files a U.S. federal tax return, in addition to state and local tax returns as required. A fund's federal income tax returns are subject to examination by the Internal Revenue Service (IRS) for a period of three fiscal years after they are filed. State and local tax returns may be subject to examination for an additional fiscal year depending on the jurisdiction. Foreign taxes are provided for based on the Fund's understanding of the tax rules and rates that exist in the foreign markets in which it invests.
Distributions are declared and recorded on the ex-dividend date. Income and capital gain distributions are determined in accordance with income tax regulations, which may differ from GAAP.
Capital accounts within the financial statements are adjusted for permanent book-tax differences. These adjustments have no impact on net assets or the results of operations. Temporary book-tax differences will reverse in a subsequent period.
Book-tax differences are primarily due to foreign currency transactions, capital loss carryforwards, losses deferred due to wash sales and excise tax regulations.
The federal tax cost of investment securities and unrealized appreciation (depreciation) as of period end were as follows:
|
Gross unrealized appreciation |
$ 48,561,019 |
|
Gross unrealized depreciation |
(10,318,814) |
|
Net unrealized appreciation (depreciation) on securities and other investments |
$ 38,242,205 |
|
|
|
|
Tax Cost |
$ 238,624,036 |
The tax-based components of distributable earnings as of period end were as follows:
|
Capital loss carryforward |
$ (14,215,847) |
|
Net unrealized appreciation (depreciation) |
$ 38,235,800 |
Annual Report
3. Significant Accounting Policies - continued
Income Tax Information and Distributions to Shareholders - continued
Capital loss carryforwards are only available to offset future capital gains of the Fund to the extent provided by regulations and may be limited. Under the Regulated Investment Company Modernization Act of 2010 (the Act), the Fund is permitted to carry forward capital losses incurred in taxable years beginning after December 22, 2010 for an unlimited period and such capital losses are required to be used prior to any losses that expire. Capital loss carryforwards were as follows:
|
No expiration |
|
|
Short-term |
$ (10,136,298) |
|
Long-term |
(4,079,549) |
|
|
|
|
Total capital loss carryforward |
$ (14,215,847) |
The tax character of distributions paid was as follows:
|
|
February 28, 2013 |
February 29, 2012 |
|
Ordinary Income |
$ 4,135,652 |
$ 9,804,983 |
|
Long-term Capital Gains |
- |
3,222,131 |
|
Total |
$ 4,135,652 |
$ 13,027,114 |
Trading (Redemption) Fees. Shares held by investors in the Fund less than 30 days are subject to a redemption fee equal to .75% of the net asset value of shares redeemed. All redemption fees, which reduce the proceeds of the shareholder redemption, are retained by the Fund and accounted for as an addition to paid in capital.
4. Purchases and Sales of Investments.
Purchases and sales of securities other than short-term securities, aggregated $243,363,251 and $274,846,042, respectively.
5. Fees and Other Transactions with Affiliates.
Management Fee. FMR and its affiliates provide the Fund with investment management related services for which the Fund pays a monthly management fee. The management fee is the sum of an individual fund fee rate that is based on an annual rate of .30% of the Fund's average net assets and an annualized group fee rate that averaged .26% during the period. The group fee rate is based upon the average net assets of all the mutual funds advised by FMR. The group fee rate decreases as assets under management increase and increases as assets under management decrease. For the period, the total annual management fee rate was .56% of the Fund's average net assets.
Transfer Agent Fees. Fidelity Investments Institutional Operations Company, Inc. (FIIOC), an affiliate of FMR, is the Fund's transfer, dividend disbursing and shareholder servicing agent. FIIOC receives account fees and asset-based fees that vary according to account size and type of account. FIIOC pays for typesetting, printing and mailing of shareholder reports, except proxy statements. For the period, the transfer agent fees were equivalent to an annual rate of .26% of average net assets.
Accounting and Security Lending Fees. Fidelity Service Company, Inc. (FSC), an affiliate of FMR, maintains the Fund's accounting records. The accounting fee is based on the level of average net assets for each month. Under a separate contract, FSC administers the security lending program. The security lending fee is based on the number and duration of lending transactions.
Brokerage Commissions. The Fund placed a portion of its portfolio transactions with brokerage firms which are affiliates of the investment adviser. The commissions paid to these affiliated firms were $18,842 for the period.
6. Committed Line of Credit.
The Fund participates with other funds managed by FMR or an affiliate in a $4.25 billion credit facility (the "line of credit") to be utilized for temporary or emergency purposes to fund shareholder redemptions or for other short-term liquidity purposes. The Fund has agreed to pay commitment fees on its pro-rata portion of the line of credit, which amounted to $657 and is reflected in Miscellaneous expenses on the Statement of Operations. During the period, there were no borrowings on this line of credit.
7. Security Lending.
The Fund lends portfolio securities through a lending agent from time to time in order to earn additional income. For equity securities, a lending agent is used and may loan securities to certain qualified borrowers, including Fidelity Capital Markets (FCM), a broker-dealer affiliated with the Fund. On
Annual Report
Notes to Financial Statements - continued
7. Security Lending - continued
the settlement date of the loan, the Fund receives collateral (in the form of U.S. Treasury obligations, letters of credit and/or cash) against the loaned securities and maintains collateral in an amount not less than 100% of the market value of the loaned securities during the period of the loan. The market value of the loaned securities is determined at the close of business of the Fund and any additional required collateral is delivered to the Fund on the next business day. If the borrower defaults on its obligation to return the securities loaned because of insolvency or other reasons, a fund could experience delays and costs in recovering the securities loaned or in gaining access to the collateral. Any cash collateral received is invested in the Fidelity Securities Lending Cash Central Fund. The value of loaned securities and cash collateral at period end are disclosed on the Fund's Statement of Assets and Liabilities. The value of securities loaned to FCM at period end was $120,375. Security lending income represents the income earned on investing cash collateral, less rebates paid to borrowers and any lending agent fees associated with the loan, plus any premium payments received for lending certain types of securities. Security lending income is presented in the Statement of Operations as a component of income from Fidelity Central Funds. Total security lending income during the period amounted to $267,751, including $1,216 from securities loaned to FCM.
8. Expense Reductions.
Many of the brokers with whom FMR places trades on behalf of the Fund provided services to the Fund in addition to trade execution. These services included payments of certain expenses on behalf of the Fund totaling $75,557 for the period.
In addition, FMR reimbursed a portion of the Fund's operating expenses during the period in the amount of $28.
9. Other.
The Fund's organizational documents provide former and current trustees and officers with a limited indemnification against liabilities arising in connection with the performance of their duties to the Fund. In the normal course of business, the Fund may also enter into contracts that provide general indemnifications. The Fund's maximum exposure under these arrangements is unknown as this would be dependent on future claims that may be made against the Fund. The risk of material loss from such claims is considered remote.
Annual Report
Report of Independent Registered Public Accounting Firm
To the Trustees of Fidelity Select Portfolios and the Shareholders of Telecommunications Portfolio and Wireless Portfolio:
In our opinion, the accompanying statement of assets and liabilities, including the schedule of investments, and the related statements of operations and of changes in net assets and the financial highlights present fairly, in all material respects, the financial position of Telecommunications Portfolio and Wireless Portfolio (funds of Fidelity Select Portfolios) at February 28, 2013, the results of each of their operations for the year then ended, the changes in each of their net assets for each of the two years in the period then ended and their financial highlights for each of the five years in the period then ended, in conformity with accounting principles generally accepted in the United States of America. These financial statements and financial highlights (hereafter referred to as "financial statements") are the responsibility of the Telecommunications Portfolio's management and Wireless Portfolio's management. Our responsibility is to express an opinion on these financial statements based on our audits. We conducted our audits of these financial statements in accordance with the standards of the Public Company Accounting Oversight Board (United States). Those standards require that we plan and perform the audit to obtain reasonable assurance about whether the financial statements are free of material misstatement. An audit includes examining, on a test basis, evidence supporting the amounts and disclosures in the financial statements, assessing the accounting principles used and significant estimates made by management, and evaluating the overall financial statement presentation. We believe that our audits, which included confirmation of securities at February 28, 2013 by correspondence with the custodian and brokers, provide a reasonable basis for our opinion.
PricewaterhouseCoopers LLP
Boston, Massachusetts
April 18, 2013
Annual Report
Trustees and Officers
The Trustees, Members of the Advisory Board, and executive officers of the trust and funds, as applicable, are listed below. The Board of Trustees governs each fund and is responsible for protecting the interests of shareholders. The Trustees are experienced executives who meet periodically throughout the year to oversee each fund's activities, review contractual arrangements with companies that provide services to each fund, oversee management of the risks associated with such activities and contractual arrangements, and review each fund's performance. Except for James C. Curvey, each of the Trustees oversees 234 Fidelity funds. Mr. Curvey oversees 453 Fidelity funds.
The Trustees hold office without limit in time except that (a) any Trustee may resign; (b) any Trustee may be removed by written instrument, signed by at least two-thirds of the number of Trustees prior to such removal; (c) any Trustee who requests to be retired or who has become incapacitated by illness or injury may be retired by written instrument signed by a majority of the other Trustees; and (d) any Trustee may be removed at any special meeting of shareholders by a two-thirds vote of the outstanding voting securities of the trust. Each Trustee who is not an interested person of the trust and the funds (as defined in the 1940 Act) (Independent Trustee), shall retire not later than the last day of the calendar year in which his or her 75th birthday occurs. The Independent Trustees may waive this mandatory retirement age policy with respect to individual Trustees. The executive officers and Advisory Board Members hold office without limit in time, except that any officer and Advisory Board Member may resign or may be removed by a vote of a majority of the Trustees at any regular meeting or any special meeting of the Trustees. Except as indicated, each individual has held the office shown or other offices in the same company for the past five years.
Experience, Skills, Attributes, and Qualifications of the Funds' Trustees. The Governance and Nominating Committee has adopted a statement of policy that describes the experience, qualifications, attributes, and skills that are necessary and desirable for potential Independent Trustee candidates (Statement of Policy). The Board believes that each Trustee satisfied at the time he or she was initially elected or appointed a Trustee, and continues to satisfy, the standards contemplated by the Statement of Policy. The Governance and Nominating Committee also engages professional search firms to help identify potential Independent Trustee candidates who have the experience, qualifications, attributes, and skills consistent with the Statement of Policy. From time to time, additional criteria based on the composition and skills of the current Independent Trustees, as well as experience or skills that may be appropriate in light of future changes to board composition, business conditions, and regulatory or other developments, have also been considered by the professional search firms and the Governance and Nominating Committee. In addition, the Board takes into account the Trustees' commitment and participation in Board and committee meetings, as well as their leadership of standing and ad hoc committees throughout their tenure.
In determining that a particular Trustee was and continues to be qualified to serve as a Trustee, the Board has considered a variety of criteria, none of which, in isolation, was controlling. The Board believes that, collectively, the Trustees have balanced and diverse experience, qualifications, attributes, and skills, which allow the Board to operate effectively in governing each fund and protecting the interests of shareholders. Information about the specific experience, skills, attributes, and qualifications of each Trustee, which in each case led to the Board's conclusion that the Trustee should serve (or continue to serve) as a trustee of the funds, is provided below.
Board Structure and Oversight Function. James C. Curvey is an interested person (as defined in the 1940 Act) and currently serves as Chairman. The Trustees have determined that an interested Chairman is appropriate and benefits shareholders because an interested Chairman has a personal and professional stake in the quality and continuity of services provided to the funds. Independent Trustees exercise their informed business judgment to appoint an individual of their choosing to serve as Chairman, regardless of whether the Trustee happens to be independent or a member of management. The Independent Trustees have determined that they can act independently and effectively without having an Independent Trustee serve as Chairman and that a key structural component for assuring that they are in a position to do so is for the Independent Trustees to constitute a substantial majority for the Board. The Independent Trustees also regularly meet in executive session. Ned C. Lautenbach serves as Chairman of the Independent Trustees and as such (i) acts as a liaison between the Independent Trustees and management with respect to matters important to the Independent Trustees and (ii) with management prepares agendas for Board meetings.
Fidelity funds are overseen by different Boards of Trustees. The funds' Board oversees Fidelity's equity and high income funds and another Board oversees Fidelity's investment-grade bond, money market, and asset allocation funds. The asset allocation funds may invest in Fidelity funds overseen by the funds' Board. The use of separate Boards, each with its own committee structure, allows the Trustees of each group of Fidelity funds to focus on the unique issues of the funds they oversee, including common research, investment, and operational issues. On occasion, the separate Boards establish joint committees to address issues of overlapping consequences for the Fidelity funds overseen by each Board.
The Trustees operate using a system of committees to facilitate the timely and efficient consideration of all matters of importance to the Trustees, each fund, and fund shareholders and to facilitate compliance with legal and regulatory requirements and oversight of the funds' activities and associated risks. The Board, acting through its committees, has charged FMR and its affiliates with (i) identifying events or circumstances the occurrence of which could have demonstrably adverse effects on the funds' business and/or reputation; (ii) implementing processes and controls to lessen the possibility that such events or circumstances occur or to mitigate the effects of such events or circumstances if they do occur; and (iii) creating and maintaining a system designed to evaluate continuously business and market conditions in order to facilitate the identification and implementation processes described in (i) and (ii) above. Because the day-to-day operations and activities of the funds are carried out by or through FMR, its affiliates and other service providers, the funds' exposure to risks is mitigated but not eliminated by the processes overseen by the Trustees. While each of the Board's committees has responsibility for overseeing different aspects of the funds' activities, oversight is exercised primarily through the Operations, Audit, and Compliance Committees. In addition, the Independent Trustees have worked with FMR to enhance the Board's oversight of investment and financial risks, legal and regulatory risks, technology risks, and operational risks, including the development of additional risk reporting to the Board. For example, a working group comprised of Independent Trustees and FMR has worked and continues to work to review the Fidelity funds' valuation-related activities, reporting and risk management. Appropriate personnel, including but not limited to the funds' Chief Compliance Officer (CCO), FMR's internal auditor, the independent accountants, the funds' Treasurer and portfolio management personnel, make periodic reports to the Board's committees, as appropriate, including an annual review of FMR's risk management program for the Fidelity funds. The responsibilities of each standing committee, including their oversight responsibilities, are described further under "Standing Committees of the Funds' Trustees."
Annual Report
The funds' Statement of Additional Information (SAI) includes more information about the Trustees. To request a free copy, call Fidelity at 1-800-544-8544.
Interested Trustees*:
Correspondence intended for each Trustee who is an interested person may be sent to Fidelity Investments, 245 Summer Street, Boston, Massachusetts 02210.
|
Name, Year of Birth; Principal Occupations and Other Relevant Experience+ |
|
|
James C. Curvey (1935) |
|
|
|
Year of Election or Appointment: 2007 Mr. Curvey is Trustee and Chairman of the Board of Trustees of certain Trusts. Mr. Curvey also serves as Trustee (2007-present) of other investment companies advised by FMR. Mr. Curvey is a Director of Fidelity Investments Money Management, Inc. (2009-present), Director of Fidelity Research & Analysis Co. (2009-present) and Director of FMR and FMR Co., Inc. (2007-present). Mr. Curvey is also Vice Chairman (2007-present) and Director of FMR LLC. In addition, Mr. Curvey serves as an Overseer for the Boston Symphony Orchestra and a member of the Trustees of Villanova University. Previously, Mr. Curvey was the Vice Chairman (2006-2007) and Director (2000-2007) of FMR Corp. |
|
Ronald P. O'Hanley (1957) |
|
|
|
Year of Election or Appointment: 2011 Mr. O'Hanley is Director of FMR Co., Inc. (2010-present), Director of Fidelity Investments Money Management, Inc. (2010-present), Director of Fidelity Research & Analysis Company (2010-present), President of Fidelity Asset Management and Corporate Services and a member of Fidelity's Executive Committee (2010-present). Previously, Mr. O'Hanley served as President and Chief Executive Officer of BNY Mellon Asset Management (2007-2010). Mr. O'Hanley also served as Vice Chairman of Bank New York Mellon Corp. and a member of that firm's Executive Committee. Prior to the 2007 merger of The Bank of New York and Mellon Financial Corporation, he was Vice Chairman of Mellon Financial Corporation and President and Chief Executive Officer of Mellon Asset Management. He joined Mellon in February 1997. Mr. O'Hanley currently serves as Chairman of the Boston Public Library Foundation Board of Directors and sits on the Board of Directors of Beth Israel Deaconess Medical Center, the Board of Trustees of the Marine Biological Laboratory and the Advisory Board of the Maxwell School of Citizenship and Public Administration at Syracuse University. Mr. O'Hanley also chairs the Council on Asset Management for the Financial Services Roundtable and is a member of the Board of Directors of Institutional Investor's U.S. Institute. |
* Trustees have been determined to be "Interested Trustees" by virtue of, among other things, their affiliation with the trust or various entities under common control with FMR.
+ The information above includes each Trustee's principal occupation during the last five years and other information relating to the experience, attributes, and skills relevant to each Trustee's qualifications to serve as a Trustee, which led to the conclusion that each Trustee should serve as a Trustee for each fund.
Independent Trustees:
Correspondence intended for each Independent Trustee (that is, the Trustees other than the Interested Trustees) may be sent to Fidelity Investments, P.O. Box 55235, Boston, Massachusetts 02205-5235.
|
Name, Year of Birth; Principal Occupations and Other Relevant Experience+ |
|
|
Dennis J. Dirks (1948) |
|
|
|
Year of Election or Appointment: 2005 Prior to his retirement in May 2003, Mr. Dirks was Chief Operating Officer and a member of the Board of The Depository Trust & Clearing Corporation (DTCC). He also served as President, Chief Operating Officer, and Board member of The Depository Trust Company (DTC) and President and Board member of the National Securities Clearing Corporation (NSCC). In addition, Mr. Dirks served as Chief Executive Officer and Board member of the Government Securities Clearing Corporation, Chief Executive Officer and Board member of the Mortgage-Backed Securities Clearing Corporation, as a Trustee and a member of the Finance Committee of Manhattan College (2005-2008), and as a Trustee and a member of the Finance Committee of AHRC of Nassau County (2006-2008). Mr. Dirks is a member of the Independent Directors Council (IDC) Governing Council (2010-present) and Board of Directors for The Brookville Center for Children's Services, Inc. (2009-present). |
|
Alan J. Lacy (1953) |
|
|
|
Year of Election or Appointment: 2008 Mr. Lacy serves as Senior Adviser (2007-present) of Oak Hill Capital Partners, L.P. (private equity). Mr. Lacy also served as Chief Executive Officer (2000-2005) and Vice Chairman (2005-2006) of Sears Holdings Corporation and Sears, Roebuck and Co. (retail). In addition, Mr. Lacy serves as a member of the Board of Directors of Dave & Buster's Entertainment, Inc. (restaurant and entertainment complexes, 2010-present), Earth Fare, Inc. (retail grocery, 2012-present), The Hillman Companies, Inc. (hardware wholesalers, 2010-present), and Bristol-Myers Squibb Company (global pharmaceuticals, 2008-present). Mr. Lacy is a member of the Board of Trustees of The National Parks Conservation Association (2006-present). Previously, Mr. Lacy served as Chairman of the Board of Trustees of the National Parks Conservation Association (2008-2011) and as a member of the Board of Directors for the Western Union Company (global money transfer, 2006-2011). |
|
Ned C. Lautenbach (1944) |
|
|
|
Year of Election or Appointment: 2000 Mr. Lautenbach is Chairman of the Independent Trustees of the Equity and High Income Funds (2006-present). Mr. Lautenbach currently serves as the Lead Director of the Eaton Corporation Board of Directors (diversified industrial, 1997-present). Mr. Lautenbach is Chairman of the Board of Directors of the Philharmonic Center for the Arts in Naples, Florida (2012-present) and a member of the Council on Foreign Relations (1994-present). Previously, Mr. Lautenbach was a Partner/Advisory Partner at Clayton, Dubilier & Rice, LLC (private equity investment, 1998-2010), as well as a Director of Sony Corporation (2006-2007). |
|
Joseph Mauriello (1944) |
|
|
|
Year of Election or Appointment: 2008 Prior to his retirement in January 2006, Mr. Mauriello served in numerous senior management positions including Deputy Chairman and Chief Operating Officer (2004-2005), and Vice Chairman of Financial Services (2002-2004) of KPMG LLP US (professional services, 1965-2005). Mr. Mauriello currently serves as a member of the Board of Directors of XL Group plc. (global insurance and re-insurance, 2006-present). Previously, Mr. Mauriello served as a Director of the Hamilton Funds of the Bank of New York (2006-2007) and of Arcadia Resources Inc. (health care services and products, 2007-2012). |
|
Robert W. Selander (1950) |
|
|
|
Year of Election or Appointment: 2011 Previously, Mr. Selander served as a Member of the Advisory Board of Fidelity's Equity and High Income Funds (2011), Executive Vice Chairman (2010), Chief Executive Officer (2009-2010), and President and Chief Executive Officer (1997-2009) of Mastercard, Inc. |
|
Cornelia M. Small (1944) |
|
|
|
Year of Election or Appointment: 2005 Ms. Small is a member of the Board of Directors (2009-present) and Chair of the Investment Committee (2010-present) of the Teagle Foundation. Ms. Small also serves on the Investment Committee of the Berkshire Taconic Community Foundation (2008-present). Previously, Ms. Small served as Chairperson (2002-2008) and a member of the Investment Committee and Chairperson (2008-2012) and a member of the Board of Trustees of Smith College. In addition, Ms. Small served as Chief Investment Officer, Director of Global Equity Investments, and a member of the Board of Directors of Scudder, Stevens & Clark and Scudder Kemper Investments. |
|
William S. Stavropoulos (1939) |
|
|
|
Year of Election or Appointment: 2001 Mr. Stavropoulos is Vice Chairman of the Independent Trustees of the Equity and High Income Funds (2006-present). Mr. Stavropoulos serves as President and Founder of the Michigan Baseball Foundation, the Great Lakes Loons (2007-present). Mr. Stavropoulos is Chairman Emeritus of the Board of Directors of The Dow Chemical Company, where he previously served in numerous senior management positions, including President, CEO (1995-2000; 2002-2004), Chairman of the Executive Committee (2000-2006), and as a member of the Board of Directors (1990-2006). Currently, Mr. Stavropoulos is a Director of Univar Inc. (global distributor of commodity and specialty chemicals, Chairman from 2010-May 2012 and Lead Director from May 2012-present), Teradata Corporation (data warehousing and technology solutions, 2008-present), Maersk Inc. (industrial conglomerate), and Tyco International, Ltd. (multinational manufacturing and services, 2007-present), and a member of the Advisory Board for Metalmark Capital LLC (private equity investment, 2005-present). Mr. Stavropoulos is an operating advisor to Clayton, Dubilier & Rice, LLC (private equity investment). In addition, Mr. Stavropoulos is a member of the University of Notre Dame Advisory Council for the College of Science, a Trustee of the Rollin L. Gerstacker Foundation, and a Director of the Naples Philharmonic Center for the Arts. Previously, Mr. Stavropoulos served as a Director of Chemical Financial Corporation (bank holding company, 1993-2012). |
|
David M. Thomas (1949) |
|
|
|
Year of Election or Appointment: 2008 Previously, Mr. Thomas served as Executive Chairman (2005-2006) and Chairman and Chief Executive Officer (2000-2005) of IMS Health, Inc. (pharmaceutical and healthcare information solutions), and a Director of Fortune Brands, Inc. (consumer products, 2000-2011). In addition, Mr. Thomas serves as Non-Executive Chairman of the Board of Directors of Fortune Brands Home and Security (home and security products, 2011-present), and as a member of the Board of Directors of Interpublic Group of Companies, Inc. (marketing communication, 2004-present). |
|
Michael E. Wiley (1950) |
|
|
|
Year of Election or Appointment: 2008 Mr. Wiley also serves as a Director of Asia Pacific Exploration Consolidated (international oil and gas exploration and production, 2008-present). Mr. Wiley serves as a Director of Tesoro Corporation (independent oil refiner and marketer, 2005-present), and a Director of Bill Barrett Corporation (exploration and production, 2005-present). In addition, Mr. Wiley also serves as a Director of Post Oak Bank (privately-held bank, 2004-present). Previously, Mr. Wiley served as a member of the Board of Trustees of the University of Tulsa (2000-2006; 2007-2010), as a Senior Energy Advisor of Katzenbach Partners, LLC (consulting, 2006-2007), as an Advisory Director of Riverstone Holdings (private investment), Chairman, President, and CEO of Baker Hughes, Inc. (oilfield services, 2000-2004), and as Director of Spinnaker Exploration Company (exploration and production, 2001-2005). |
+ The information above includes each Trustee's principal occupation during the last five years and other information relating to the experience, attributes, and skills relevant to each Trustee's qualifications to serve as a Trustee, which led to the conclusion that each Trustee should serve as a Trustee for each fund.
Advisory Board Members and Executive Officers:
Correspondence intended for David A. Rosow and Garnett A. Smith may be sent to Fidelity Investments, P.O. Box 55235, Boston, Massachusetts 02205-5235. Correspondence intended for each executive officer and Peter S. Lynch may be sent to Fidelity Investments, 245 Summer Street, Boston, Massachusetts 02210.
|
Name, Year of Birth; Principal Occupation |
|
|
Peter S. Lynch (1944) |
|
|
|
Year of Election or Appointment: 2003 Member of the Advisory Board of Fidelity's Equity and High Income Funds. Mr. Lynch is Vice Chairman and a Director of FMR and FMR Co., Inc. In addition, Mr. Lynch serves as a Trustee of Boston College and as the Chairman of the Inner-City Scholarship Fund. Previously, Mr. Lynch served on the Special Olympics International Board of Directors (1997-2006). |
|
David A. Rosow (1942) |
|
|
|
Year of Election or Appointment: 2012 Member of the Advisory Board of Fidelity's Equity and High Income Funds. Chairman and Chief Executive Officer of International Golf Group, Inc. (golf course development, 1989-present). Previously, Mr. Rosow served as Chairman and Chief Executive Officer of Rosow & Company, Inc. (private investment company, 1989-2011), a Lead Director of Hudson United Bancorp (2001-2006) and as a Director of TD Banknorth (1996-2006). In addition, Mr. Rosow is a member (2008-present) and President (2009-present) of the Town Council of Palm Beach, Florida. |
|
Garnett A. Smith (1947) |
|
|
|
Year of Election or Appointment: 2012 Member of the Advisory Board of Fidelity's Equity and High Income Funds. Prior to Mr. Smith's retirement, he served as Chairman and Chief Executive Officer of Inbrand Corp. (manufacturer of personal absorbent products, 1990-1997). He also served as President (1986-1990) of Inbrand Corp. Prior to his employment with Inbrand Corp., he was employed by a retail fabric chain and North Carolina National Bank. In addition, Mr. Smith is a board member of the Jackson Hole Land Trust (2009-present). |
|
Kenneth B. Robins (1969) |
|
|
|
Year of Election or Appointment: 2008 President and Treasurer of Fidelity's Equity and High Income Funds. Mr. Robins also serves as President and Treasurer (2010-present) and Assistant Treasurer (2009-present) of other Fidelity funds and is an employee of Fidelity Investments (2004-present). Previously, Mr. Robins served as Deputy Treasurer of the Fidelity funds (2005-2008) and Treasurer and Chief Financial Officer of The North Carolina Capital Management Trust: Cash and Term Portfolios (2006-2008). |
|
Brian B. Hogan (1964) |
|
|
|
Year of Election or Appointment: 2009 Vice President of Equity and High Income Funds. Mr. Hogan also serves as President of FMR's Equity Division (2009-present). Previously, Mr. Hogan served as Senior Vice President, Equity Research of FMR (2006-2009) and as a portfolio manager. |
|
Christopher S. Bartel (1971) |
|
|
|
Year of Election or Appointment: 2009 Vice President of Fidelity's Sector and Real Estate Equity Funds. Mr. Bartel also serves as a Director, President, and Chief Executive Officer of Fidelity Management & Research (Japan) Inc. (2012-present), a Director of Fidelity Management & Research (Hong Kong) (2012-present), and Senior Vice President of Global Equity Research (2010-present). Previously, Mr. Bartel served as Senior Vice President of Equity Research (2009-2010), Managing Director of Research (2006-2009), and an analyst and portfolio manager (2000-2006). |
|
Scott C. Goebel (1968) |
|
|
|
Year of Election or Appointment: 2008 Secretary and Chief Legal Officer (CLO) of the Fidelity funds. Mr. Goebel also serves as Secretary of Fidelity Investments Money Management, Inc. (FIMM) (2010-present) and Fidelity Research and Analysis Company (FRAC) (2010-present); Secretary and CLO of The North Carolina Capital Management Trust: Cash and Term Portfolios (2008-present); General Counsel, Secretary, and Senior Vice President of FMR (2008-present) and FMR Co., Inc. (2008-present); employed by FMR LLC or an affiliate (2001-present); Chief Legal Officer of Fidelity Management & Research (Hong Kong) Limited (2008-present) and Assistant Secretary of Fidelity Management & Research (Japan) Inc. (2008-present), and Fidelity Management & Research (U.K.) Inc. (2008-present). Previously, Mr. Goebel served as Assistant Secretary of FIMM (2008-2010), FRAC (2008-2010), and the Funds (2007-2008) and as Vice President and Secretary of Fidelity Distributors Corporation (FDC) (2005-2007). |
|
William C. Coffey (1969) |
|
|
|
Year of Election or Appointment: 2009 Assistant Secretary of Fidelity's Equity and High Income Funds. Mr. Coffey also serves as Senior Vice President and Deputy General Counsel of FMR LLC (2010-present), and is an employee of Fidelity Investments. Previously, Mr. Coffey served as Vice President and Associate General Counsel of FMR LLC (2005-2009). |
|
Elizabeth Paige Baumann (1968) |
|
|
|
Year of Election or Appointment: 2012 Anti-Money Laundering (AML) Officer of the Fidelity funds. Ms. Baumann also serves as AML Officer of The North Carolina Capital Management Trust: Cash and Term Portfolios (2012-present), Chief AML Officer of FMR LLC (2012-present), and is an employee of Fidelity Investments. Previously, Ms. Baumann served as Vice President and Deputy Anti-Money Laundering Officer (2007-2012). |
|
Christine Reynolds (1958) |
|
|
|
Year of Election or Appointment: 2008 Chief Financial Officer of the Fidelity funds. Ms. Reynolds became President of Fidelity Pricing and Cash Management Services (FPCMS) in August 2008. Ms. Reynolds served as Chief Operating Officer of FPCMS (2007-2008). Previously, Ms. Reynolds served as President, Treasurer, and Anti-Money Laundering officer of the Fidelity funds (2004-2007). |
|
Joseph A. Hanlon (1968) |
|
|
|
Year of Election or Appointment: 2012 Chief Compliance Officer of Fidelity's Equity and High Income Funds. Mr. Hanlon serves as Compliance Officer of FMR, FMR Co., Inc., Fidelity Investments Money Management, Inc. (FIMM), Fidelity Research and Analysis Company (FRAC), Fidelity Management & Research (Japan) Inc., Fidelity Management & Research (U.K.) Inc., Fidelity Management & Research (Hong Kong), and Strategic Advisers, Inc. (2009-present), as Senior Vice President of the Fidelity Asset Management Division (2009-present), and is an employee of Fidelity Investments. |
|
Joseph F. Zambello (1957) |
|
|
|
Year of Election or Appointment: 2011 Deputy Treasurer of the Fidelity funds. Mr. Zambello is an employee of Fidelity Investments. Previously, Mr. Zambello served as Vice President of FMR's Program Management Group (2009-2011) and Vice President of the Transfer Agent Oversight Group (2005-2009). |
|
Adrien E. Deberghes (1967) |
|
|
|
Year of Election or Appointment: 2008 Deputy Treasurer of Fidelity's Equity and High Income Funds. Mr. Deberghes also serves as Vice President (2011-present) and Assistant Treasurer (2010-present) of other Fidelity funds, and is an employee of Fidelity Investments (2008-present). Previously, Mr. Deberghes served as Senior Vice President of Mutual Fund Administration at State Street Corporation (2007-2008), Senior Director of Mutual Fund Administration at Investors Bank & Trust (2005-2007), and Director of Finance for Dunkin' Brands (2000-2005). |
|
Stephen Sadoski (1971) |
|
|
|
Year of Election or Appointment: 2012 Deputy Treasurer of Fidelity's Equity and High Income Funds. Mr. Sadoski also serves as Deputy Treasurer of other Fidelity funds (2013-present) and is an employee of Fidelity Investments (2012-present). Previously, Mr. Sadoski served as Assistant Treasurer of Fidelity's Fixed Income and Asset Allocation Funds (2012-2013), an assistant chief accountant in the Division of Investment Management of the Securities and Exchange Commission (SEC) (2009-2012) and as a senior manager at Deloitte & Touche (1997-2009). |
|
Stacie Smith (1974) |
|
|
|
Year of Election or Appointment: 2013 Deputy Treasurer of Fidelity's Equity and High Income Funds. Ms. Smith is an employee of Fidelity Investments (2009-present). Previously, Ms. Smith served as Senior Audit Manager of Ernst & Young LLP (1996-2009). |
|
Stephanie J. Dorsey (1969) |
|
|
|
Year of Election or Appointment: 2010 Assistant Treasurer of Fidelity's Equity and High Income Funds. Ms. Dorsey also serves as President and Treasurer (2013-present) and Assistant Treasurer (2012-present) of other Fidelity funds and is an employee of Fidelity Investments (2008-present). Previously, Ms. Dorsey served as Deputy Treasurer of Fidelity's Fixed Income and Asset Allocation Funds (2008-2013), Treasurer (2004-2008) of the JPMorgan Mutual Funds and Vice President (2004-2008) of JPMorgan Chase Bank. |
|
John R. Hebble (1958) |
|
|
|
Year of Election or Appointment: 2009 Assistant Treasurer of Fidelity's Equity and High Income Funds. Mr. Hebble also serves as President (2011-present), Treasurer, and Chief Financial Officer of The North Carolina Capital Management Trust: Cash and Term Portfolios (2008-present) and is an employee of Fidelity Investments. Previously, Mr. Hebble served as President and Treasurer of Fidelity's Fixed Income and Asset Allocation Funds (2008-2013). |
|
Gary W. Ryan (1958) |
|
|
|
Year of Election or Appointment: 2005 Assistant Treasurer of the Fidelity funds. Mr. Ryan is an employee of Fidelity Investments. Previously, Mr. Ryan served as Vice President of Fund Reporting in Fidelity Pricing and Cash Management Services (FPCMS) (1999-2005). |
|
Jonathan Davis (1968) |
|
|
|
Year of Election or Appointment: 2010 Assistant Treasurer of the Fidelity funds. Mr. Davis is also Assistant Treasurer of Fidelity Rutland Square Trust II and Fidelity Commonwealth Trust II. Mr. Davis is an employee of Fidelity Investments. Previously, Mr. Davis served as Vice President and Associate General Counsel of FMR LLC (2003-2010). |
Annual Report
Distributions (Unaudited)
Select Telecommunications Portfolio designates 100% of the dividends distributed during the fiscal year as qualifying for the dividends-received deduction for corporate shareholders.
Select Telecommunications Portfolio designates 100% of the dividends distributed during the fiscal year as amounts which may be taken into account as a dividend for the purposes of the maximum rate under section 1(h)(11) of the Internal Revenue Code.
The fund will notify shareholders in January 2014 of amounts for use in preparing 2013 income tax returns.
Annual Report
Distributions (Unaudited)
Wireless Portfolio designates 57% of the dividends distributed during the fiscal year as qualifying for the dividends-received deduction for corporate shareholders.
Wireless Portfolio designates 100% of the dividends distributed during the fiscal year as amounts which may be taken into account as a dividend for the purposes of the maximum rate under section 1(h)(11) of the Internal Revenue Code.
The fund will notify shareholders in January 2014 of amounts for use in preparing 2013 income tax returns.
Annual Report
Board Approval of Investment Advisory Contracts and Management Fees
Telecommunications Portfolio
Wireless Portfolio
On November 14, 2012, the Board of Trustees, including the Independent Trustees (together, the Board), voted to approve a new management contract (the New Contracts) between each fund and Fidelity SelectCo, LLC (SelectCo) and to submit the New Contracts to shareholders for their approval. If the New Contracts are approved by shareholders, effective August 1, 2013, SelectCo will serve as investment adviser to each fund. The terms of the New Contracts are identical to those of the current management contracts with FMR (the Current Contracts), except with respect to the name of the investment adviser and the dates of execution and the initial two-year term of the contract. The Board, assisted by the advice of fund counsel and Independent Trustees' counsel, considered a broad range of information.
In determining whether to approve the New Contracts for the funds, the Board was aware that shareholders in the funds have a broad range of investment choices available to them, including a wide choice among mutual funds offered by competitors to Fidelity, and that each fund's shareholders, with the opportunity to review and weigh the disclosure provided by the fund in its prospectus and other public disclosures, have chosen to invest in the fund, managed by Fidelity.
Nature, Extent, and Quality of Services Provided. The Board considered the nature, quality, cost and extent of the services to be provided by SelectCo under the New Contracts as well as the nature, quality, cost and extent of the advisory, administrative, distribution and shareholder services performed by the FMR and the sub-advisers, and by affiliated companies. The Board considered that, upon shareholder approval, SelectCo will render the same services to the funds under the New Contracts that FMR currently renders to the funds under the Current Contracts. The Board also considered that the New Contracts would not result in any changes to (i) the investment process or strategies employed in the management of the funds' assets or (ii) the day-to-day management of the funds or the persons primarily responsible for such management.
Throughout the year, the Trustees had discussions with FMR about plans to establish SelectCo as a new investment adviser to manage sector-based funds and products. The Trustees considered Fidelity's rationale for creating a separate investment adviser and noted that a separate investment adviser may be better positioned to focus on opportunities for growth within the sector investing space and to focus on a distinct approach to sector investing and research.
Shareholder and Administrative Services. The Board noted that the growth of fund assets across the complex allows Fidelity to reinvest in the development of services designed to enhance the value or convenience of the Fidelity funds as investment vehicles. These services include 24-hour access to account information and market information through phone representatives and over the Internet, and investor education materials and asset allocation tools.
Investment in a Large Fund Family. The Board considered the benefits to shareholders of investing in a Fidelity fund, including the benefits of investing in a fund that is part of a large family of funds offering a variety of investment disciplines and providing for a large variety of mutual fund shareholder services.
Investment Performance. The Board did not consider performance to be a material factor in its decision to approve the New Contracts because the New Contracts would not result in any changes to the funds' investment processes or strategies or in the persons primarily responsible for the day-to-day management of the funds.
Based on its review, the Board concluded that the nature, extent, and quality of the services provided to each fund will benefit the fund's shareholders, particularly in light of the Board's view that the fund's shareholders benefit from investing in a fund that is part of a large family of funds offering a variety of investment disciplines and services.
Competitiveness of Management Fee and Total Fund Expenses. The Board considered that, if approved by shareholders, the New Contracts would not result in any changes to the amount of the management fees paid by the funds, except that such fees would be paid to SelectCo rather than FMR. The Board noted that at previous meetings during the year it received and considered materials relating to its review of the management fee of each fund. This information includes comparisons that focus on a fund's standing relative to the total universe of comparable funds available to investors in terms of gross management fees before expense reimbursements or caps, as well as a fund's standing relative to non-Fidelity funds similar in size to the fund within the comparison group.
Based on its review, the Board concluded that each fund's management fee was fair and reasonable in light of the services that the fund receives and the other factors considered.
Because there are no expected changes in the funds' management fees under the New Contracts, the Board will review each fund's total expenses compared to competitive fund median expenses in connection with its future consideration of the renewal of the funds' management contracts and sub-advisory agreements.
Annual Report
In its review of total expenses, the Board also noted that at previous meetings during the year it received and considered materials relating to its review of total expenses for each Fidelity fund. This information includes Fidelity fee structures and other information with respect to clients of FMR and its affiliates, such as other mutual funds advised or sub-advised by FMR or its affiliates, pension plan clients, and other institutional clients.
Costs of the Services and Profitability. Because there were no changes to the services to be provided or fees to be charged to the funds under the New Contracts, the Board did not consider data regarding the impact on Fidelity's costs of services, revenues, or profitability from the new arrangements to be a significant factor in its decision.
In connection with its future consideration of the renewal of each fund's management contract and sub-advisory agreements, the Board will consider the revenues earned and the expenses incurred by Fidelity in conducting the business of developing, marketing, distributing, managing, administering and servicing the funds and their shareholders.
Economies of Scale. The Board recognized that the New Contracts, like the Current Contracts, incorporate a "group fee" structure, which provides for lower fee rates as total fund assets under FMR's management increase, and for higher fee rates as total fund assets under FMR's management decrease. The Board considered that the group fee is designed to deliver the benefits of economies of scale to fund shareholders when total fund assets increase, even if assets of any particular fund are unchanged or have declined, because some portion of Fidelity's costs are attributable to services provided to all Fidelity funds, and all funds benefit if those costs can be allocated among more assets. The Board concluded that, given the group fee structure, fund shareholders will achieve a certain level of economies of scale as assets under FMR's management increase at the fund complex level, regardless of whether Fidelity achieves any such economies of scale.
In connection with its future consideration of the renewal of each fund's management contract and sub-advisory agreements, the Board will consider whether there have been economies of scale in respect of the management of the Fidelity funds, whether the Fidelity funds (including the funds) have appropriately benefited from any such economies of scale, and whether there is potential for realization of any further economies of scale.
Based on its evaluation of all of the conclusions noted above, and after considering all material factors, the Board ultimately concluded that each New Contract is fair and reasonable, and that the New Contracts should be approved and submitted to the applicable funds' shareholders for their approval.
Annual Report
Investment Adviser
Fidelity Management & Research Company
Boston, MA
Investment Sub-Advisers
FMR Co., Inc.
Fidelity Management & Research
(U.K.) Inc.
Fidelity Management & Research
(Hong Kong) Limited
Fidelity Management & Research
(Japan) Inc.
General Distributor
Fidelity Distributors Corporation
Smithfield, RI
Transfer and Service Agents
Fidelity Investments Institutional Operations Company, Inc.
Boston, MA
Fidelity Service Company, Inc.
Boston, MA
Custodian
Brown Brothers Harriman & Co.
Boston, MA
Corporate Headquarters
245 Summer Street
Boston, MA 02210
1-800-544-8888
The Fidelity Telephone Connection
Mutual Fund 24-Hour Service
Exchanges/Redemptions
and Account Assistance 1-800-544-6666
Product Information 1-800-544-8888
Retirement Accounts 1-800-544-4774
(8 a.m. - 9 p.m.)
TDD Service 1-800-544-0118
for the deaf and hearing impaired
(9 a.m. - 9 p.m. Eastern time)
Fidelity Automated Service
Telephone (FAST®)
1-800-544-5555
Automated line for quickest service
SELTS-UANNPRO-0413
1.910426.103
Fidelity®
Select Portfolios®
Information Technology Sector
Communications Equipment Portfolio
Computers Portfolio
Electronics Portfolio
IT Services Portfolio
Software and Computer Services Portfolio
Technology Portfolio
Annual Report
February 28, 2013
(Fidelity Cover Art)
Contents
|
Shareholder Expense Example |
|
|
|
Communications Equipment Portfolio |
Performance |
|
|
|
Management's Discussion |
|
|
|
Investment Changes |
|
|
|
Investments |
|
|
|
Financial Statements |
|
|
Computers Portfolio |
Performance |
|
|
|
Management's Discussion |
|
|
|
Investment Changes |
|
|
|
Investments |
|
|
|
Financial Statements |
|
|
Electronics Portfolio |
Performance |
|
|
|
Management's Discussion |
|
|
|
Investment Changes |
|
|
|
Investments |
|
|
|
Financial Statements |
|
|
IT Services Portfolio |
Performance |
|
|
|
Management's Discussion |
|
|
|
Investment Changes |
|
|
|
Investments |
|
|
|
Financial Statements |
|
|
Software and Computer Services Portfolio |
Performance |
|
|
|
Management's Discussion |
|
|
|
Investment Changes |
|
|
|
Investments |
|
|
|
Financial Statements |
|
|
Technology Portfolio |
Performance |
|
|
|
Management's Discussion |
|
|
|
Investment Changes |
|
|
|
Investments |
|
|
|
Financial Statements |
|
|
Notes to Financial Statements |
|
|
|
Report of Independent Registered Public Accounting Firm |
|
|
|
Trustees and Officers |
|
|
|
Distributions |
|
|
|
Board Approval of Investment Advisory Contracts and Management Fees |
|
Annual Report
To view a fund's proxy voting guidelines and proxy voting record for the 12-month period ended June 30, visit http://www.fidelity.com/proxyvotingresults or visit the Securities and Exchange Commission's (SEC) web site at http://www.sec.gov. You may also call 1-800-544-8544 to request a free copy of the proxy voting guidelines.
Standard & Poor's, S&P and S&P 500 are registered service marks of The McGraw-Hill Companies, Inc. and have been licensed for use by Fidelity Distributors Corporation.
Other third-party marks appearing herein are the property of their respective owners.
All other marks appearing herein are registered or unregistered trademarks or service marks of FMR LLC or an affiliated company. © 2013 FMR LLC. All rights reserved.
This report and the financial statements contained herein are submitted for the general information of the shareholders of the funds. This report is not authorized for distribution to prospective investors in the funds unless preceded or accompanied by an effective prospectus.
A fund files its complete schedule of portfolio holdings with the SEC for the first and third quarters of each fiscal year on Form N-Q. Forms N-Q are available on the SEC's web site at http://www.sec.gov. A fund's Forms N-Q may be reviewed and copied at the SEC's Public Reference Room in Washington, DC. Information regarding the operation of the SEC's Public Reference Room may be obtained by calling 1-800-SEC-0330. For a complete list of a fund's portfolio holdings, view the most recent holdings listing, semiannual report, or annual report on Fidelity's web site at http://www.fidelity.com, http://www.advisor.fidelity.com, or http://www.401k.com, as applicable.
NOT FDIC INSURED • MAY LOSE VALUE • NO BANK GUARANTEE
Neither the funds nor Fidelity Distributors Corporation is a bank.
Annual Report
Shareholder Expense Example
As a shareholder of a Fund, you incur two types of costs: (1) transaction costs, including redemption fees and (2) ongoing costs, including management fees and other Fund expenses. This Example is intended to help you understand your ongoing costs (in dollars) of investing in the Funds and to compare these costs with the ongoing costs of investing in other mutual funds.
The Example is based on an investment of $1,000 invested at the beginning of the period and held for the entire period (September 1, 2012 to February 28, 2013).
Actual Expenses
The first line of the accompanying table for each fund provides information about actual account values and actual expenses. You may use the information in this line, together with the amount you invested, to estimate the expenses that you paid over the period. Simply divide your account value by $1,000.00 (for example, an $8,600 account value divided by $1,000.00 = 8.6), then multiply the result by the number in the first line for a fund under the heading entitled "Expenses Paid During Period" to estimate the expenses you paid on your account during this period. A small balance maintenance fee of $12.00 that is charged once a year may apply for certain accounts with a value of less than $2,000. This fee is not included in the table below. If it was, the estimate of expenses you paid during the period would be higher, and your ending account value lower, by this amount. In addition, each Fund, as a shareholder in the underlying Fidelity Central Funds, will indirectly bear its pro-rata share of the fees and expenses incurred by the underlying Fidelity Central Funds. These fees and expenses are not included in the Fund's annualized expense ratio used to calculate the expense estimate in the table below.
Hypothetical Example for Comparison Purposes
The second line of the accompanying table for each fund provides information about hypothetical account values and hypothetical expenses based on a fund's actual expense ratio and an assumed rate of return of 5% per year before expenses, which is not the Fund's actual return. The hypothetical account values and expenses may not be used to estimate the actual ending account balance or expenses you paid for the period. You may use this information to compare the ongoing costs of investing in the Fund and other funds. To do so, compare this 5% hypothetical example with the 5% hypothetical examples that appear in the shareholder reports of the other funds. A small balance maintenance fee of $12.00 that is charged once a year may apply for certain accounts with a value of less than $2,000. This fee is not included in the table below. If it was, the estimate of expenses you paid during the period would be higher, and your ending account value lower, by this amount. In addition, each Fund, as a shareholder in the underlying Fidelity Central Funds, will indirectly bear its pro-rata share of the fees and expenses incurred by the underlying Fidelity Central Funds. These fees and expenses are not included in the Fund's annualized expense ratio used to calculate the expense estimate in the table below.
Please note that the expenses shown in the table are meant to highlight your ongoing costs only and do not reflect any transaction costs. Therefore, the second line of the table is useful in comparing ongoing costs only, and will not help you determine the relative total costs of owning different funds. In addition, if these transactional costs were included, your costs would have been higher.
|
|
Annualized |
Beginning |
Ending |
Expenses Paid |
|
Communications Equipment Portfolio |
.92% |
|
|
|
|
Actual |
|
$ 1,000.00 |
$ 1,117.20 |
$ 4.83 |
|
HypotheticalA |
|
$ 1,000.00 |
$ 1,020.23 |
$ 4.61 |
|
Computers Portfolio |
.84% |
|
|
|
|
Actual |
|
$ 1,000.00 |
$ 1,007.80 |
$ 4.18 |
|
HypotheticalA |
|
$ 1,000.00 |
$ 1,020.63 |
$ 4.21 |
|
Electronics Portfolio |
.85% |
|
|
|
|
Actual |
|
$ 1,000.00 |
$ 1,063.30 |
$ 4.35 |
|
HypotheticalA |
|
$ 1,000.00 |
$ 1,020.58 |
$ 4.26 |
|
IT Services Portfolio |
.86% |
|
|
|
|
Actual |
|
$ 1,000.00 |
$ 1,144.70 |
$ 4.57 |
|
HypotheticalA |
|
$ 1,000.00 |
$ 1,020.53 |
$ 4.31 |
|
Software and Computer Services Portfolio |
.81% |
|
|
|
|
Actual |
|
$ 1,000.00 |
$ 1,072.60 |
$ 4.16 |
|
HypotheticalA |
|
$ 1,000.00 |
$ 1,020.78 |
$ 4.06 |
|
Technology Portfolio |
.81% |
|
|
|
|
Actual |
|
$ 1,000.00 |
$ 1,007.90 |
$ 4.03 |
|
HypotheticalA |
|
$ 1,000.00 |
$ 1,020.78 |
$ 4.06 |
A 5% return per year before expenses
* Expenses are equal to each Fund's annualized expense ratio, multiplied by the average account value over the period, multiplied by 181/365 (to reflect the one-half year period).
Annual Report
Communications Equipment Portfolio
Performance: The Bottom Line
Average annual total return reflects the change in the value of an investment, assuming reinvestment of the fund's distributions from dividend income and capital gains (the profits earned upon the sale of securities that have grown in value, if any) and assuming a constant rate of performance each year. The $10,000 table and the fund's returns do not reflect the deduction of taxes that a shareholder would pay on fund distributions or the redemption of fund shares. During periods of reimbursement by Fidelity, a fund's total return will be greater than it would be had the reimbursement not occurred. How a fund did yesterday is no guarantee of how it will do tomorrow.
Average Annual Total Returns
|
Periods ended February 28, 2013 |
Past 1 |
Past 5 |
Past 10 |
|
Communications Equipment Portfolio A |
0.07% |
4.86% |
9.44% |
A Prior to October 1, 2006, Communications Equipment Portfolio operated under certain different investment policies. The historical performance for the fund may not represent its current investment policies.
$10,000 Over 10 Years
Let's say hypothetically that $10,000 was invested in Communications Equipment Portfolio on February 28, 2003. The chart shows how the value of your investment would have changed, and also shows how the S&P 500® Index performed over the same period.
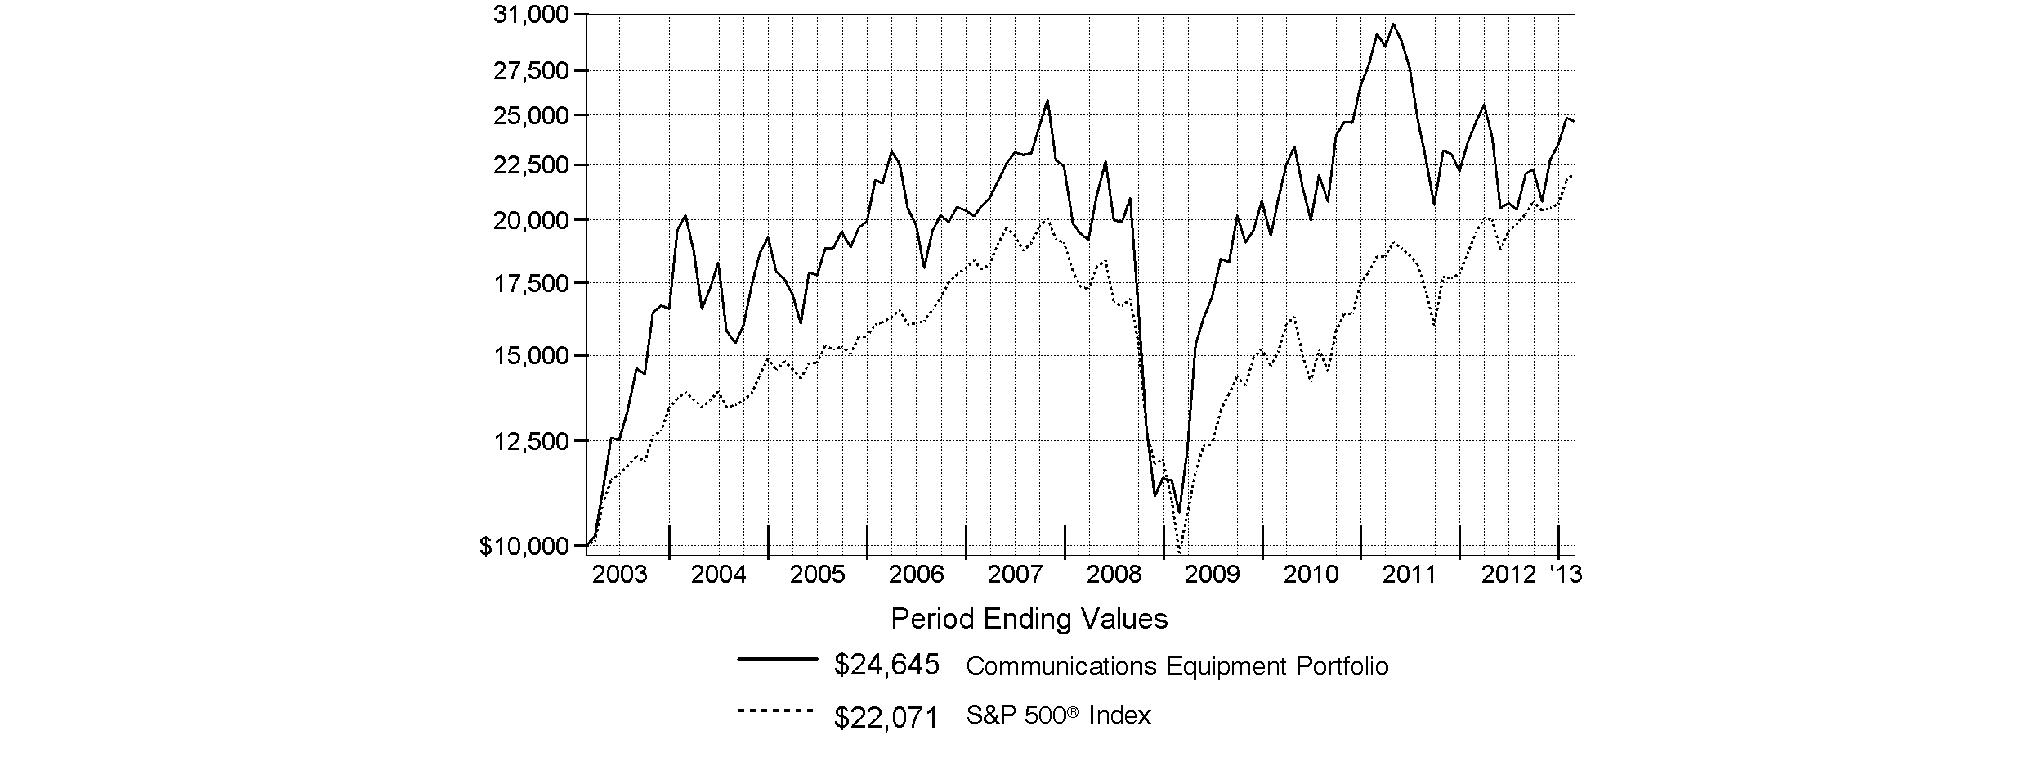
Annual Report
Communications Equipment Portfolio
Management's Discussion of Fund Performance
Market Recap: U.S. stocks posted solid gains for the year ending February 28, 2013, sparked by a late-period rally that pushed major equity benchmarks to multiyear highs. Improvement in the global economy and more monetary stimulus from the U.S. Federal Reserve kept markets on the upswing for much of the year, shrugging off an early decline brought on by debt woes in Europe, and another dip later in the period amid Congressional gridlock on the federal budget. Renewed optimism over employment, the housing market, corporate earnings and record dividends made stocks a favorite with investors during the 12 months, which helped push the broad-based S&P 500® Index across the milestone 1,500 mark at the end of January. The S&P 500® finished the period up 13.46%. Seven of the 10 major market sectors tracked by MSCI U.S. IMI 25-50 classifications produced double-digit gains, led by health care and financials, while information technology, energy and materials trailed the broad equity market with only modest advances.
Comments from Ali Khan, who became sole Portfolio Manager of Communications Equipment Portfolio on October 1, 2012, after serving as Co-Manager: For the year, the fund returned 0.07%, lagging the 1.55% mark of the S&P® Custom Communications Equipment Index and also trailing the S&P 500®. Stocks in the fund's universe struggled during the period against the backdrop of tepid spending on communications equipment by enterprise and telecom services customers. Versus the industry index, stock selection within the fund's primary universe of communications equipment dampened performance, as did a stake in cash and cash equivalents averaging roughly 4%. Holding cash was especially counterproductive during the second half of the period, when the market advanced smartly. The largest individual detractor on a relative basis was Polycom, a provider of high-definition videoconferencing software and equipment, and a large overweighting for the fund. This stock shed more than half of its value, as the company struggled to manage a shift from being primarily a hardware vendor to mainly selling software. I thought Polycom would eventually get these difficulties sorted out and - with risks here muted by the company's strong balance sheet - added to the position. A sizable underweighting in Swedish communications infrastructure provider Ericsson also proved unrewarding, as this stock showed a solid gain, driven in part by strong sales results for the fourth quarter of 2012. The remaining three of the five largest relative detractors were index components the fund didn't own: mobile device maker Motorola Mobility Holdings - which was bought by Google in May 2012 - cable equipment supplier Arris Group and Ixia, which provides testing and optimizing services for networks and data centers. Conversely, exposure to several non-index groups benefited our results, including semiconductors, semiconductor equipment and systems software. At the stock level, the three largest contributors were underweighted index constituents that fared poorly. Canada's Research In Motion saw its shares fall by roughly 5%, as doubts remained about the company's ability to reinvigorate its product line. That said, the stock's overall performance represented a considerable improvement from where it stood at the period's halfway mark, as anticipation grew for the firm's BlackBerry® 10 smartphone that was introduced at the end of January. I used this stock's mid-period swoon to significantly increase the position to an overweighting, making it the fund's seventh-largest holding by period end. Likewise, Finnish benchmark component Nokia - once an industry leader in the mobile handset space - was forced to play catch-up after its products were eclipsed by Apple's iPhone® smartphone and competitors based on the Android mobile operating system. I was less optimistic about Nokia's prospects for a turnaround and retained a sizable underweighting here. Another underweighted contributor, French network equipment provider Alcatel-Lucent, struggled with mediocre financial results but was one example of my attempt to boost the fund's exposure to telecom equipment companies. This stock ended the period as the fund's tenth-largest holding.
The views expressed above reflect those of the portfolio manager(s) only through the end of the period as stated on the cover of this report and do not necessarily represent the views of Fidelity or any other person in the Fidelity organization. Any such views are subject to change at any time based upon market or other conditions and Fidelity disclaims any responsibility to update such views. These views may not be relied on as investment advice and, because investment decisions for a Fidelity fund are based on numerous factors, may not be relied on as an indication of trading intent on behalf of any Fidelity fund.
Annual Report
Communications Equipment Portfolio
Investment Changes (Unaudited)
|
Top Ten Stocks as of February 28, 2013 |
||
|
|
% of fund's |
% of fund's net assets |
|
Cisco Systems, Inc. |
15.3 |
16.6 |
|
QUALCOMM, Inc. |
14.8 |
20.2 |
|
Telefonaktiebolaget LM Ericsson |
5.6 |
5.0 |
|
Juniper Networks, Inc. |
5.6 |
4.1 |
|
Motorola Solutions, Inc. |
3.6 |
3.4 |
|
Brocade Communications Systems, Inc. |
3.1 |
3.3 |
|
Research In Motion Ltd. |
3.0 |
1.5 |
|
F5 Networks, Inc. |
2.5 |
1.8 |
|
Polycom, Inc. |
2.3 |
2.6 |
|
Alcatel-Lucent SA sponsored ADR |
2.2 |
0.3 |
|
|
58.0 |
|
|
Top Industries (% of fund's net assets) |
|||
|
As of February 28, 2013 |
|||
 |
Communications Equipment |
82.6% |
|
 |
Semiconductors & Semiconductor Equipment |
3.8% |
|
 |
Electronic Equipment & Components |
3.7% |
|
 |
Computers |
2.3% |
|
 |
IT Services |
1.6% |
|
 |
All Others* |
6.0% |
|

|
As of August 31, 2012 |
|||
|
Communications Equipment |
80.4% |
|
|
Semiconductors & Semiconductor Equipment |
4.1% |
|
|
Electronic Equipment & Components |
3.8% |
|
|
Computers & Peripherals |
0.7% |
|
|
Media |
0.3% |
|
|
All Others* |
10.7% |
|

|
* Includes short-term investments and net other assets. |
Annual Report
Communications Equipment Portfolio
Investments February 28, 2013
Showing Percentage of Net Assets
|
Common Stocks - 94.8% |
|||
|
Shares |
Value |
||
|
COMMUNICATIONS EQUIPMENT - 82.6% |
|||
|
Communications Equipment - 82.6% |
|||
|
Acme Packet, Inc. (a) |
180,691 |
$ 5,272,563 |
|
|
ADTRAN, Inc. (d) |
270,000 |
6,031,800 |
|
|
ADVA AG Optical Networking (a) |
193,746 |
1,084,629 |
|
|
Alcatel-Lucent SA sponsored ADR (a) |
5,190,143 |
7,110,496 |
|
|
Anaren, Inc. (a) |
109,000 |
2,109,150 |
|
|
Aruba Networks, Inc. (a) |
111,323 |
2,774,169 |
|
|
Brocade Communications Systems, Inc. (a) |
1,768,941 |
9,923,759 |
|
|
Ciena Corp. (a) |
117,800 |
1,795,272 |
|
|
Cisco Systems, Inc. |
2,314,976 |
48,267,247 |
|
|
Comtech Telecommunications Corp. |
118,700 |
3,178,786 |
|
|
Emulex Corp. (a) |
76,000 |
490,200 |
|
|
F5 Networks, Inc. (a) |
84,935 |
8,020,412 |
|
|
Finisar Corp. (a)(d) |
430,852 |
6,311,982 |
|
|
Harris Corp. |
62,400 |
2,999,568 |
|
|
Infinera Corp. (a)(d) |
619,000 |
4,017,310 |
|
|
InterDigital, Inc. (d) |
72,200 |
3,205,680 |
|
|
JDS Uniphase Corp. (a) |
85,900 |
1,216,344 |
|
|
Juniper Networks, Inc. (a) |
852,512 |
17,629,948 |
|
|
Meru Networks, Inc. (a)(d) |
83,200 |
371,904 |
|
|
Motorola Solutions, Inc. |
182,181 |
11,333,480 |
|
|
NETGEAR, Inc. (a) |
171,150 |
5,827,658 |
|
|
Nokia Corp. sponsored ADR (d) |
1,432,630 |
5,229,100 |
|
|
Plantronics, Inc. |
61,300 |
2,474,068 |
|
|
Polycom, Inc. (a) |
782,863 |
7,131,882 |
|
|
QUALCOMM, Inc. |
714,019 |
46,861,067 |
|
|
Radware Ltd. (a) |
45,100 |
1,640,738 |
|
|
Research In Motion Ltd. (a)(d) |
700,800 |
9,355,682 |
|
|
Riverbed Technology, Inc. (a) |
424,942 |
6,493,114 |
|
|
Sonus Networks, Inc. (a) |
1,808,900 |
4,431,805 |
|
|
Symmetricom, Inc. (a) |
460,900 |
2,276,846 |
|
|
Telefonaktiebolaget LM Ericsson (B Shares) sponsored ADR (d) |
1,463,280 |
17,866,649 |
|
|
ViaSat, Inc. (a)(d) |
111,200 |
5,221,952 |
|
|
Wi-Lan, Inc. |
720,200 |
3,093,805 |
|
|
|
261,049,065 |
||
|
COMPUTERS & PERIPHERALS - 2.3% |
|||
|
Computer Hardware - 2.3% |
|||
|
Apple, Inc. |
13,400 |
5,914,760 |
|
|
Super Micro Computer, Inc. (a) |
111,000 |
1,298,700 |
|
|
|
7,213,460 |
||
|
ELECTRONIC EQUIPMENT & COMPONENTS - 3.7% |
|||
|
Electronic Manufacturing Services - 3.2% |
|||
|
Fabrinet (a) |
119,600 |
1,962,636 |
|
|
Flextronics International Ltd. (a) |
519,700 |
3,456,005 |
|
|
TE Connectivity Ltd. |
117,500 |
4,715,275 |
|
|
|
10,133,916 |
||
|
|
|||
|
Shares |
Value |
||
|
Technology Distributors - 0.5% |
|||
|
Arrow Electronics, Inc. (a) |
40,400 |
$ 1,622,060 |
|
|
TOTAL ELECTRONIC EQUIPMENT & COMPONENTS |
11,755,976 |
||
|
IT SERVICES - 1.6% |
|||
|
IT Consulting & Other Services - 1.6% |
|||
|
Amdocs Ltd. |
133,200 |
4,857,804 |
|
|
MEDIA - 0.2% |
|||
|
Advertising - 0.2% |
|||
|
Digital Generation, Inc. (a)(d) |
94,100 |
729,275 |
|
|
SEMICONDUCTORS & SEMICONDUCTOR EQUIPMENT - 3.8% |
|||
|
Semiconductors - 3.8% |
|||
|
Altera Corp. |
116,600 |
4,129,972 |
|
|
Analog Devices, Inc. |
55,800 |
2,523,276 |
|
|
Broadcom Corp. Class A |
73,300 |
2,500,263 |
|
|
GSI Technology, Inc. (a) |
203,500 |
1,306,470 |
|
|
Skyworks Solutions, Inc. (a) |
72,800 |
1,550,640 |
|
|
|
12,010,621 |
||
|
SOFTWARE - 0.6% |
|||
|
Application Software - 0.1% |
|||
|
BroadSoft, Inc. (a) |
20,500 |
430,500 |
|
|
Systems Software - 0.5% |
|||
|
Allot Communications Ltd. (a) |
105,500 |
1,448,515 |
|
|
TOTAL SOFTWARE |
1,879,015 |
||
|
TOTAL COMMON STOCKS (Cost $301,329,031) |
|
||
|
Money Market Funds - 19.1% |
|||
|
|
|
|
|
|
Fidelity Cash Central Fund, 0.16% (b) |
18,654,698 |
18,654,698 |
|
|
Fidelity Securities Lending Cash Central Fund, 0.16% (b)(c) |
41,873,417 |
41,873,417 |
|
|
TOTAL MONEY MARKET FUNDS (Cost $60,528,115) |
|
||
|
TOTAL INVESTMENT PORTFOLIO - 113.9% (Cost $361,857,146) |
360,023,331 |
|
NET OTHER ASSETS (LIABILITIES) - (13.9)% |
(44,010,996) |
||
|
NET ASSETS - 100% |
$ 316,012,335 |
||
|
Legend |
|
(a) Non-income producing |
|
(b) Affiliated fund that is generally available only to investment companies and other accounts managed by Fidelity Investments. The rate quoted is the annualized seven-day yield of the fund at period end. A complete unaudited listing of the fund's holdings as of its most recent quarter end is available upon request. In addition, each Fidelity Central Fund's financial statements, which are not covered by the Fund's Report of Independent Registered Public Accounting Firm, are available on the SEC's website or upon request. |
|
(c) Investment made with cash collateral received from securities on loan. |
|
(d) Security or a portion of the security is on loan at period end. |
|
Affiliated Central Funds |
|
Information regarding fiscal year to date income earned by the Fund from investments in Fidelity Central Funds is as follows: |
|
Fund |
Income earned |
|
Fidelity Cash Central Fund |
$ 18,720 |
|
Fidelity Securities Lending Cash Central Fund |
354,841 |
|
Total |
$ 373,561 |
|
Other Information |
|
All investments are categorized as Level 1 under the Fair Value Hierarchy. The inputs or methodology used for valuing securities may not be an indication of the risk associated with investing in those securities. For more information on valuation inputs, please refer to the Investment Valuation section in the accompanying Notes to Financial Statements. |
|
Distribution of investments by country or territory of incorporation, as a percentage of total net assets, is as follows. (Unaudited) |
|
United States of America |
80.4% |
|
Sweden |
5.6% |
|
Canada |
4.0% |
|
France |
2.2% |
|
Finland |
1.7% |
|
Bailiwick of Guernsey |
1.6% |
|
Switzerland |
1.5% |
|
Singapore |
1.1% |
|
Israel |
1.0% |
|
Others (Individually Less Than 1%) |
0.9% |
|
|
100.0% |
See accompanying notes which are an integral part of the financial statements.
Annual Report
Communications Equipment Portfolio
Financial Statements
Statement of Assets and Liabilities
|
|
February 28, 2013 |
|
|
|
|
|
|
Assets |
|
|
|
Investment in securities, at value (including securities loaned of $39,998,407) - See accompanying schedule: Unaffiliated issuers (cost $301,329,031) |
$ 299,495,216 |
|
|
Fidelity Central Funds (cost $60,528,115) |
60,528,115 |
|
|
Total Investments (cost $361,857,146) |
|
$ 360,023,331 |
|
Receivable for fund shares sold |
|
308,073 |
|
Dividends receivable |
|
66,019 |
|
Distributions receivable from Fidelity Central Funds |
|
48,991 |
|
Prepaid expenses |
|
135 |
|
Receivable from investment adviser for expense reductions |
|
170 |
|
Other receivables |
|
40,448 |
|
Total assets |
|
360,487,167 |
|
|
|
|
|
Liabilities |
|
|
|
Payable for investments purchased |
$ 1,984,005 |
|
|
Payable for fund shares redeemed |
357,374 |
|
|
Accrued management fee |
146,620 |
|
|
Other affiliated payables |
80,701 |
|
|
Other payables and accrued expenses |
32,715 |
|
|
Collateral on securities loaned, at value |
41,873,417 |
|
|
Total liabilities |
|
44,474,832 |
|
|
|
|
|
Net Assets |
|
$ 316,012,335 |
|
Net Assets consist of: |
|
|
|
Paid in capital |
|
$ 364,600,685 |
|
Distributions in excess of net investment income |
|
(161) |
|
Accumulated undistributed net realized gain (loss) on investments and foreign currency transactions |
|
(46,754,343) |
|
Net unrealized appreciation (depreciation) on investments and assets and liabilities in foreign currencies |
|
(1,833,846) |
|
Net Assets, for 12,996,704 shares outstanding |
|
$ 316,012,335 |
|
Net Asset Value, offering price and redemption price per share ($316,012,335 ÷ 12,996,704 shares) |
|
$ 24.31 |
Statement of Operations
|
|
Year ended February 28, 2013 |
|
|
|
|
|
|
Investment Income |
|
|
|
Dividends |
|
$ 2,436,755 |
|
Special dividends |
|
1,144,000 |
|
Interest |
|
17 |
|
Income from Fidelity Central Funds (including $354,841 from security lending) |
|
373,561 |
|
Total income |
|
3,954,333 |
|
|
|
|
|
Expenses |
|
|
|
Management fee |
$ 1,475,534 |
|
|
Transfer agent fees |
764,280 |
|
|
Accounting and security lending fees |
109,848 |
|
|
Custodian fees and expenses |
34,938 |
|
|
Independent trustees' compensation |
1,792 |
|
|
Registration fees |
22,865 |
|
|
Audit |
42,561 |
|
|
Legal |
3,112 |
|
|
Miscellaneous |
2,857 |
|
|
Total expenses before reductions |
2,457,787 |
|
|
Expense reductions |
(110,575) |
2,347,212 |
|
Net investment income (loss) |
|
1,607,121 |
|
Realized and Unrealized Gain (Loss) Net realized gain (loss) on: |
|
|
|
Investment securities: |
|
|
|
Unaffiliated issuers |
16,259,977 |
|
|
Foreign currency transactions |
914 |
|
|
Total net realized gain (loss) |
|
16,260,891 |
|
Change in net unrealized appreciation (depreciation) on: Investment securities |
(20,632,019) |
|
|
Assets and liabilities in foreign currencies |
(31) |
|
|
Total change in net unrealized appreciation (depreciation) |
|
(20,632,050) |
|
Net gain (loss) |
|
(4,371,159) |
|
Net increase (decrease) in net assets resulting from operations |
|
$ (2,764,038) |
See accompanying notes which are an integral part of the financial statements.
Annual Report
Financial Statements - continued
Statement of Changes in Net Assets
|
|
Year ended |
Year ended |
|
Increase (Decrease) in Net Assets |
|
|
|
Operations |
|
|
|
Net investment income (loss) |
$ 1,607,121 |
$ 471,999 |
|
Net realized gain (loss) |
16,260,891 |
(28,111,790) |
|
Change in net unrealized appreciation (depreciation) |
(20,632,050) |
(70,792,607) |
|
Net increase (decrease) in net assets resulting from operations |
(2,764,038) |
(98,432,398) |
|
Distributions to shareholders from net investment income |
(1,920,292) |
(390,659) |
|
Distributions to shareholders from return of capital |
(253,959) |
0 |
|
Total Distributions |
(2,174,251) |
(390,659) |
|
Share transactions Proceeds from sales of shares |
167,243,187 |
125,804,694 |
|
Reinvestment of distributions |
2,090,968 |
376,474 |
|
Cost of shares redeemed |
(180,990,018) |
(281,569,831) |
|
Net increase (decrease) in net assets resulting from share transactions |
(11,655,863) |
(155,388,663) |
|
Redemption fees |
8,319 |
15,056 |
|
Total increase (decrease) in net assets |
(16,585,833) |
(254,196,664) |
|
|
|
|
|
Net Assets |
|
|
|
Beginning of period |
332,598,168 |
586,794,832 |
|
End of period (including distributions in excess of net investment income of $161 and undistributed net investment income of $49,118, respectively) |
$ 316,012,335 |
$ 332,598,168 |
|
Other Information Shares |
|
|
|
Sold |
7,302,222 |
4,687,831 |
|
Issued in reinvestment of distributions |
91,852 |
16,777 |
|
Redeemed |
(7,970,510) |
(10,954,733) |
|
Net increase (decrease) |
(576,436) |
(6,250,125) |
Financial Highlights
|
Years ended February 28, |
2013 |
2012 I |
2011 |
2010 |
2009 |
|
Selected Per-Share Data |
|
|
|
|
|
|
Net asset value, beginning of period |
$ 24.50 |
$ 29.60 |
$ 20.79 |
$ 10.72 |
$ 19.50 |
|
Income from Investment Operations |
|
|
|
|
|
|
Net investment income (loss) B |
.14 E,K |
.03 |
(.10) |
(.07) F |
.04 |
|
Net realized and unrealized gain (loss) |
(.14) K |
(5.10) |
8.91 |
10.20 |
(8.77) |
|
Total from investment operations |
- |
(5.07) |
8.81 |
10.13 |
(8.73) |
|
Distributions from net investment income |
(.17) |
(.03) |
- |
(.06) |
(.05) |
|
Distributions from return of capital |
(.02) |
- |
- |
- |
- |
|
Total distributions |
(.19) |
(.03) |
- |
(.06) |
(.05) |
|
Redemption fees added to paid in capital B, J |
- |
- |
- |
- |
- |
|
Net asset value, end of period |
$ 24.31 |
$ 24.50 |
$ 29.60 |
$ 20.79 |
$ 10.72 |
|
Total Return A |
.07% K |
(17.13)% |
42.38% |
94.47% |
(44.79)% |
|
Ratios to Average Net Assets C, G |
|
|
|
|
|
|
Expenses before reductions |
.93% |
.90% |
.91% |
.97% |
.95% |
|
Expenses net of fee waivers, if any |
.93% |
.90% |
.91% |
.97% |
.95% |
|
Expenses net of all reductions |
.89% |
.89% |
.90% |
.95% |
.94% |
|
Net investment income (loss) |
.61% E |
.12% |
(.43)% |
(.41)% F |
.25% |
|
Supplemental Data |
|
|
|
|
|
|
Net assets, end of period (000 omitted) |
$ 316,012 |
$ 332,598 |
$ 586,795 |
$ 336,910 |
$ 125,918 |
|
Portfolio turnover rate D |
54% |
91% |
85% |
143% H |
120% |
A Total returns would have been lower if certain expenses had not been reduced during the applicable periods shown.
B Calculated based on average shares outstanding during the period.
C Fees and expenses of any underlying Fidelity Central Funds are not included in the Fund's expense ratio. The Fund indirectly bears its proportionate share of the expenses of any underlying Fidelity Central Funds.
D Amount does not include the portfolio activity of any underlying Fidelity Central Funds.
E Investment income per share reflects a large, non-recurring dividend which amounted to $.10 per share. Excluding this non-recurring dividend, the ratio of net investment income (loss) to average net assets would have been .18%.
F Investment income per share reflects a large, non-recurring dividend which amounted to $.04 per share. Excluding this non-recurring dividends, the ratio of net investment income (loss) to average net assets would have been (.63)%.
G Expense ratios reflect operating expenses of the Fund. Expenses before reductions do not reflect amounts reimbursed by the investment adviser or reductions from brokerage service arrangements or reductions from other expense offset arrangements and do not represent the amount paid by the Fund during periods when reimbursements or reductions occur. Expenses net of fee waivers reflect expenses after reimbursement by the investment adviser but prior to reductions from brokerage service arrangements or other expense offset arrangements. Expenses net of all reductions represent the net expenses paid by the Fund.
H The portfolio turnover rate does not include the assets acquired in the merger.
I For the year ended February 29.
J Amount represents less than $.01 per share.
K Net realized and unrealized gain (loss) per share reflects proceeds received from litigation which amounted to $.06 per share. Excluding these litigation proceeds, the total return would have been (.19)%.
See accompanying notes which are an integral part of the financial statements.
Annual Report
Computers Portfolio
Performance: The Bottom Line
Average annual total return reflects the change in the value of an investment, assuming reinvestment of the fund's distributions from dividend income and capital gains (the profits earned upon the sale of securities that have grown in value, if any) and assuming a constant rate of performance each year. The $10,000 table and the fund's returns do not reflect the deduction of taxes that a shareholder would pay on fund distributions or the redemption of fund shares. During periods of reimbursement by Fidelity, a fund's total return will be greater than it would be had the reimbursement not occurred. How a fund did yesterday is no guarantee of how it will do tomorrow.
Average Annual Total Returns
|
Periods ended February 28, 2013 |
Past 1 |
Past 5 |
Past 10 |
|
Computers Portfolio |
-0.38% |
9.93% |
11.20% |
$10,000 Over 10 Years
Let's say hypothetically that $10,000 was invested in Computers Portfolio on February 28, 2003. The chart shows how the value of your investment would have changed, and also shows how the S&P 500 Index performed over the same period.
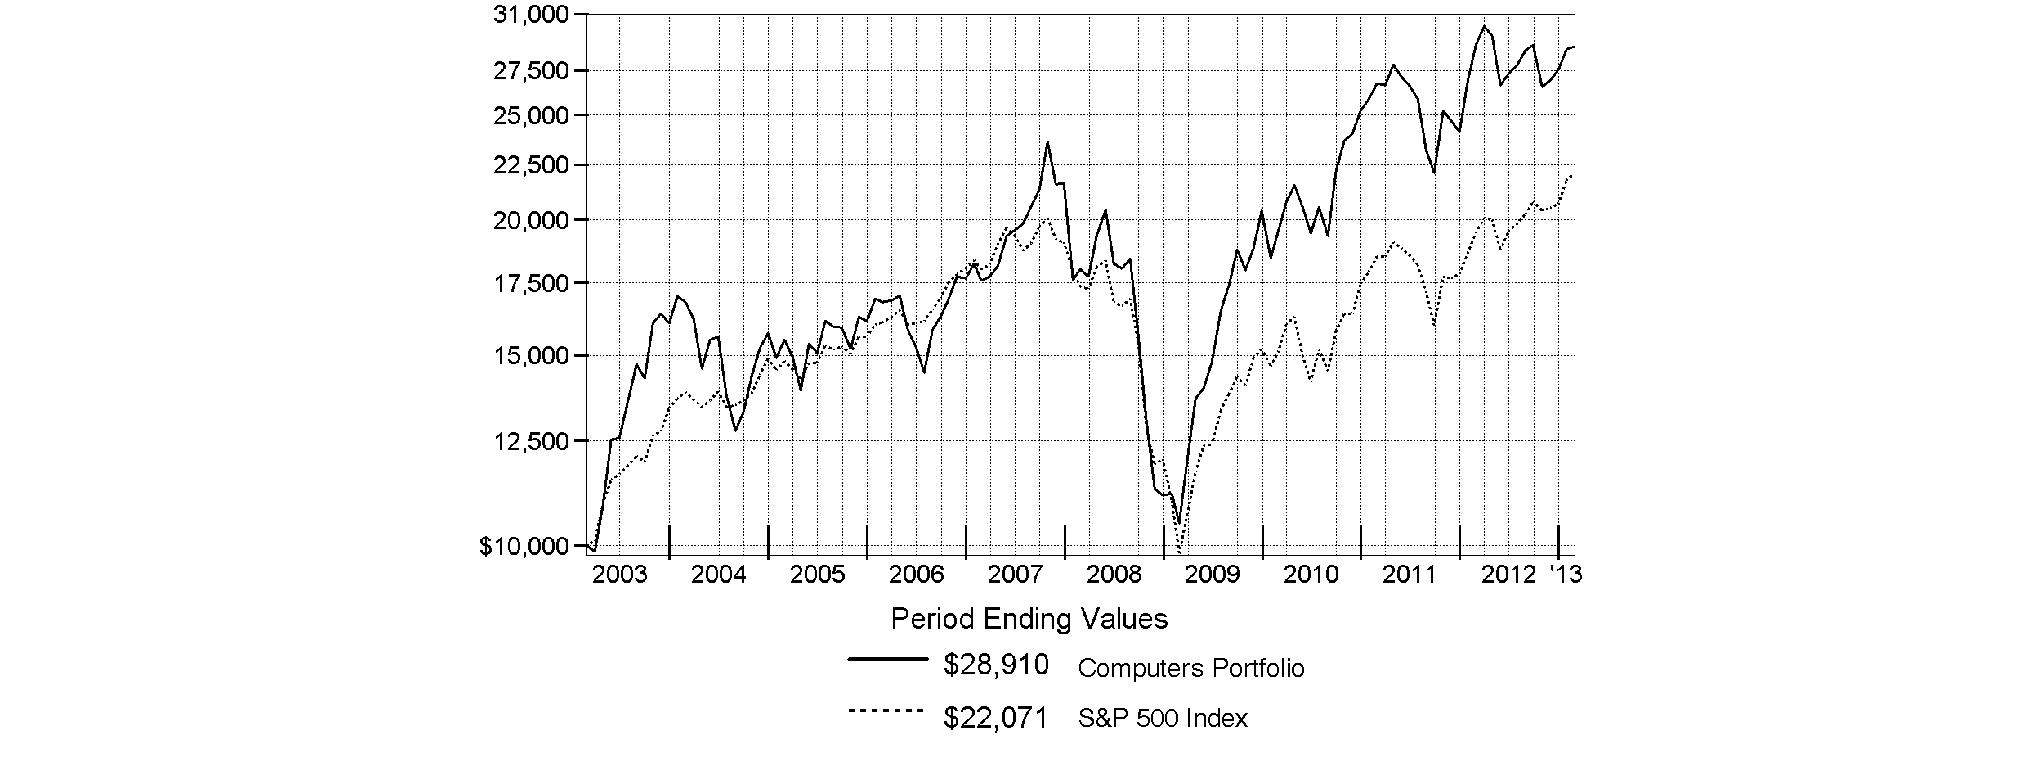
Annual Report
Computers Portfolio
Management's Discussion of Fund Performance
Market Recap: U.S. stocks posted solid gains for the year ending February 28, 2013, sparked by a late-period rally that pushed major equity benchmarks to multiyear highs. Improvement in the global economy and more monetary stimulus from the U.S. Federal Reserve kept markets on the upswing for much of the year, shrugging off an early decline brought on by debt woes in Europe, and another dip later in the period amid Congressional gridlock on the federal budget. Renewed optimism over employment, the housing market, corporate earnings and record dividends made stocks a favorite with investors during the 12 months, which helped push the broad-based S&P 500® Index across the milestone 1,500 mark at the end of January. The S&P 500® finished the period up 13.46%. Seven of the 10 major market sectors tracked by MSCI U.S. IMI 25-50 classifications produced double-digit gains, led by health care and financials, while information technology, energy and materials trailed the broad equity market with only modest advances.
Comments from Christopher Lin, who was named Portfolio Manager of Computers Portfolio on January 30, 2013: For the year, the fund returned -0.38%, considerably better than the -8.10% return of the S&P® Custom Computers & Peripherals Index but trailing the S&P 500®. Versus the broader market, computer-related stocks suffered from weakness in industry index heavyweight Apple and relatively stagnant demand for personal computers. Compared with its industry benchmark, the vast majority of the fund's outperformance came from stock selection in computer storage/peripherals and computer hardware, while positioning in IT consulting/other services and out-of-benchmark exposure to semiconductors also helped. A large average overweighting in ATM and point-of-sale device maker NCR was the fund's top contributor, as the stock benefited from strength in the company's operations in the hospitality industry. Electronics for Imaging, a maker of color digital print controllers and related equipment, also performed well, aided by the ongoing transition from analog to digital printing. I significantly reduced the former position and reduced the overweighting in the latter after taking over the fund. Our positioning in consumer electronics maker Apple - the fund's largest position during the period - also bolstered relative performance, although this stock was the fund's biggest detractor in absolute terms. The fund's overweighting here in the first half of the period, when the stock was doing well, was enough to produce an overall positive impact on relative performance. I reduced the fund's exposure to Apple when I began managing the fund, and it ended the period as a modest underweighting. A timely non-index position in Samsung Electronics, established in August, also lifted performance. Conversely, underweighting benchmark constituent Seagate Technology, which makes computer hard-disk drives, worked against us, as the stock rallied after floods in Thailand knocked out a production facility of its main competitor. A non-index stake in Polycom, a provider of high-definition videoconferencing software and equipment, also was unrewarding. This stock declined following the company's downwardly revised financial guidance early in the period and was sold from the fund by period end. Underweighting the strongly performing shares of server maker Silicon Graphics International worked against the fund as well.
The views expressed above reflect those of the portfolio manager(s) only through the end of the period as stated on the cover of this report and do not necessarily represent the views of Fidelity or any other person in the Fidelity organization. Any such views are subject to change at any time based upon market or other conditions and Fidelity disclaims any responsibility to update such views. These views may not be relied on as investment advice and, because investment decisions for a Fidelity fund are based on numerous factors, may not be relied on as an indication of trading intent on behalf of any Fidelity fund.
Annual Report
Computers Portfolio
Investment Changes (Unaudited)
|
Top Ten Stocks as of February 28, 2013 |
||
|
|
% of fund's |
% of fund's net assets |
|
Apple, Inc. |
14.7 |
25.0 |
|
IBM Corp. |
14.1 |
13.5 |
|
Hewlett-Packard Co. |
10.8 |
2.5 |
|
EMC Corp. |
6.1 |
6.4 |
|
Dell, Inc. |
5.0 |
2.1 |
|
SanDisk Corp. |
4.9 |
2.6 |
|
Western Digital Corp. |
4.9 |
3.2 |
|
NetApp, Inc. |
4.4 |
3.1 |
|
Seagate Technology |
4.0 |
3.0 |
|
Teradata Corp. |
3.6 |
3.7 |
|
|
72.5 |
|
|
Top Industries (% of fund's net assets) |
|||
|
As of February 28, 2013 |
|||
|
Computers & Peripherals |
74.2% |
|
|
IT Services |
17.7% |
|
|
Semiconductors & Semiconductor Equipment |
3.2% |
|
|
Internet Software & Services |
1.6% |
|
|
Electronic Equipment & Components |
0.5% |
|
|
All Others* |
2.8% |
|

|
As of August 31, 2012 |
|||
|
Computers & Peripherals |
68.7% |
|
|
IT Services |
18.1% |
|
|
Electronic Equipment & Components |
3.7% |
|
|
Communications Equipment |
2.5% |
|
|
Semiconductors & Semiconductor Equipment |
2.0% |
|
|
All Others* |
5.0% |
|

|
* Includes short-term investments and net other assets. |
Annual Report
Computers Portfolio
Investments February 28, 2013
Showing Percentage of Net Assets
|
Common Stocks - 97.2% |
|||
|
Shares |
Value |
||
|
COMPUTERS & PERIPHERALS - 74.2% |
|||
|
Computer Hardware - 37.7% |
|||
|
Apple, Inc. |
228,564 |
$ 100,888,150 |
|
|
Avid Technology, Inc. (a) |
798,700 |
5,534,991 |
|
|
Cray, Inc. (a) |
557,700 |
10,791,495 |
|
|
Dell, Inc. |
2,451,207 |
34,194,338 |
|
|
Diebold, Inc. |
445,900 |
12,592,216 |
|
|
Hewlett-Packard Co. |
3,684,005 |
74,195,861 |
|
|
NCR Corp. (a) |
236,700 |
6,528,186 |
|
|
Silicon Graphics International Corp. (a)(d) |
393,800 |
5,926,690 |
|
|
Super Micro Computer, Inc. (a) |
733,200 |
8,578,440 |
|
|
|
259,230,367 |
||
|
Computer Storage & Peripherals - 36.5% |
|||
|
Datalink Corp. (a) |
513,300 |
5,328,054 |
|
|
Dot Hill Systems Corp. (a) |
357,340 |
464,542 |
|
|
Electronics for Imaging, Inc. (a) |
519,915 |
11,989,240 |
|
|
EMC Corp. (a) |
1,837,178 |
42,273,466 |
|
|
Imation Corp. (a) |
1,077,300 |
3,673,593 |
|
|
Immersion Corp. (a) |
24,600 |
164,574 |
|
|
Intermec, Inc. (a) |
930,800 |
9,214,920 |
|
|
Intevac, Inc. (a) |
698,089 |
3,336,865 |
|
|
Lexmark International, Inc. Class A (d) |
489,100 |
10,769,982 |
|
|
NetApp, Inc. (a) |
888,260 |
30,049,836 |
|
|
Novatel Wireless, Inc. (a)(e) |
1,801,830 |
3,909,971 |
|
|
QLogic Corp. (a) |
1,039,600 |
11,830,648 |
|
|
Quantum Corp. (a) |
4,989,000 |
6,286,140 |
|
|
Rimage Corp. |
247,600 |
1,688,632 |
|
|
SanDisk Corp. (a) |
666,900 |
33,605,091 |
|
|
Seagate Technology |
851,100 |
27,371,376 |
|
|
Smart Technologies, Inc. Class A (a) |
1,026,500 |
1,539,755 |
|
|
Synaptics, Inc. (a) |
269,200 |
9,357,392 |
|
|
Western Digital Corp. |
708,784 |
33,426,253 |
|
|
Xyratex Ltd. |
515,838 |
4,761,185 |
|
|
|
251,041,515 |
||
|
TOTAL COMPUTERS & PERIPHERALS |
510,271,882 |
||
|
ELECTRONIC EQUIPMENT & COMPONENTS - 0.5% |
|||
|
Electronic Manufacturing Services - 0.5% |
|||
|
Jabil Circuit, Inc. |
178,600 |
3,345,178 |
|
|
INTERNET SOFTWARE & SERVICES - 1.6% |
|||
|
Internet Software & Services - 1.6% |
|||
|
Google, Inc. Class A (a) |
13,700 |
10,976,440 |
|
|
|
|||
|
Shares |
Value |
||
|
IT SERVICES - 17.7% |
|||
|
IT Consulting & Other Services - 17.7% |
|||
|
IBM Corp. |
482,848 |
$ 96,970,364 |
|
|
Teradata Corp. (a) |
424,057 |
24,620,749 |
|
|
|
121,591,113 |
||
|
SEMICONDUCTORS & SEMICONDUCTOR EQUIPMENT - 3.2% |
|||
|
Semiconductor Equipment - 0.7% |
|||
|
ASML Holding NV (Netherlands) |
67,400 |
4,783,800 |
|
|
Semiconductors - 2.5% |
|||
|
Micron Technology, Inc. (a) |
221,500 |
1,858,385 |
|
|
Samsung Electronics Co. Ltd. |
10,653 |
15,168,740 |
|
|
|
17,027,125 |
||
|
TOTAL SEMICONDUCTORS & SEMICONDUCTOR EQUIPMENT |
21,810,925 |
||
|
TOTAL COMMON STOCKS (Cost $635,833,810) |
|
||
|
Money Market Funds - 5.0% |
|||
|
|
|
|
|
|
Fidelity Cash Central Fund, 0.16% (b) |
21,732,930 |
21,732,930 |
|
|
Fidelity Securities Lending Cash Central Fund, 0.16% (b)(c) |
12,588,302 |
12,588,302 |
|
|
TOTAL MONEY MARKET FUNDS (Cost $34,321,232) |
|
||
|
TOTAL INVESTMENT PORTFOLIO - 102.2% (Cost $670,155,042) |
702,316,770 |
|
NET OTHER ASSETS (LIABILITIES) - (2.2)% |
(15,212,238) |
||
|
NET ASSETS - 100% |
$ 687,104,532 |
||
|
Legend |
|
(a) Non-income producing |
|
(b) Affiliated fund that is generally available only to investment companies and other accounts managed by Fidelity Investments. The rate quoted is the annualized seven-day yield of the fund at period end. A complete unaudited listing of the fund's holdings as of its most recent quarter end is available upon request. In addition, each Fidelity Central Fund's financial statements, which are not covered by the Fund's Report of Independent Registered Public Accounting Firm, are available on the SEC's website or upon request. |
|
(c) Investment made with cash collateral received from securities on loan. |
|
(d) Security or a portion of the security is on loan at period end. |
|
(e) Affiliated company |
|
Affiliated Central Funds |
|
Information regarding fiscal year to date income earned by the Fund from investments in Fidelity Central Funds is as follows: |
|
Fund |
Income earned |
|
Fidelity Cash Central Fund |
$ 33,113 |
|
Fidelity Securities Lending Cash Central Fund |
662,914 |
|
Total |
$ 696,027 |
|
Other Affiliated Issuers |
|
An affiliated company is a company in which the Fund has ownership of at least 5% of the voting securities. Fiscal year to date transactions with companies which are or were affiliates are as follows: |
|
Affiliate |
Value, beginning of period |
Purchases |
Sales Proceeds |
Dividend Income |
Value, |
|
Novatel Wireless, Inc. |
$ 3,280,534 |
$ 4,382,241 |
$ 2,333,550 |
$ - |
$ 3,909,971 |
|
Other Information |
|
The following is a summary of the inputs used, as of February 28, 2013, involving the Fund's assets and liabilities carried at fair value. The inputs or methodology used for valuing securities may not be an indication of the risk associated with investing in those securities. For more information on valuation inputs, and their aggregation into the levels used in the table below, please refer to the Investment Valuation section in the accompanying Notes to Financial Statements. |
|
Valuation Inputs at Reporting Date: |
||||
|
Description |
Total |
Level 1 |
Level 2 |
Level 3 |
|
Investments in Securities: |
||||
|
Common Stocks |
$ 667,995,538 |
$ 663,211,738 |
$ 4,783,800 |
$ - |
|
Money Market Funds |
34,321,232 |
34,321,232 |
- |
- |
|
Total Investments in Securities: |
$ 702,316,770 |
$ 697,532,970 |
$ 4,783,800 |
$ - |
See accompanying notes which are an integral part of the financial statements.
Annual Report
Computers Portfolio
Financial Statements
Statement of Assets and Liabilities
|
|
February 28, 2013 |
|
|
|
|
|
|
Assets |
|
|
|
Investment in securities, at value (including securities loaned of $11,951,385) - See accompanying schedule: Unaffiliated issuers (cost $631,654,616) |
$ 664,085,567 |
|
|
Fidelity Central Funds (cost $34,321,232) |
34,321,232 |
|
|
Other affiliated issuers (cost $4,179,194) |
3,909,971 |
|
|
Total Investments (cost $670,155,042) |
|
$ 702,316,770 |
|
Receivable for investments sold |
|
158,459 |
|
Receivable for fund shares sold |
|
136,520 |
|
Dividends receivable |
|
771,758 |
|
Distributions receivable from Fidelity Central Funds |
|
86,789 |
|
Prepaid expenses |
|
1,784 |
|
Receivable from investment adviser for expense reductions |
|
406 |
|
Other receivables |
|
266,148 |
|
Total assets |
|
703,738,634 |
|
|
|
|
|
Liabilities |
|
|
|
Payable for investments purchased |
$ 2,046,420 |
|
|
Payable for fund shares redeemed |
1,487,490 |
|
|
Accrued management fee |
321,831 |
|
|
Other affiliated payables |
152,181 |
|
|
Other payables and accrued expenses |
37,878 |
|
|
Collateral on securities loaned, at value |
12,588,302 |
|
|
Total liabilities |
|
16,634,102 |
|
|
|
|
|
Net Assets |
|
$ 687,104,532 |
|
Net Assets consist of: |
|
|
|
Paid in capital |
|
$ 642,436,774 |
|
Undistributed net investment income |
|
416,241 |
|
Accumulated undistributed net realized gain (loss) on investments and foreign currency transactions |
|
12,152,534 |
|
Net unrealized appreciation (depreciation) on investments and assets and liabilities in foreign currencies |
|
32,098,983 |
|
Net Assets, for 10,651,076 shares outstanding |
|
$ 687,104,532 |
|
Net Asset Value, offering price and redemption price per share ($687,104,532 ÷ 10,651,076 shares) |
|
$ 64.51 |
Statement of Operations
|
|
Year ended February 28, 2013 |
|
|
|
|
|
|
Investment Income |
|
|
|
Dividends |
|
$ 7,731,524 |
|
Interest |
|
94 |
|
Income from Fidelity Central Funds (including $662,914 from security lending) |
|
696,027 |
|
Total income |
|
8,427,645 |
|
|
|
|
|
Expenses |
|
|
|
Management fee |
$ 4,227,001 |
|
|
Transfer agent fees |
1,765,897 |
|
|
Accounting and security lending fees |
270,153 |
|
|
Custodian fees and expenses |
36,578 |
|
|
Independent trustees' compensation |
5,121 |
|
|
Registration fees |
56,527 |
|
|
Audit |
43,440 |
|
|
Legal |
3,999 |
|
|
Interest |
533 |
|
|
Miscellaneous |
6,427 |
|
|
Total expenses before reductions |
6,415,676 |
|
|
Expense reductions |
(181,533) |
6,234,143 |
|
Net investment income (loss) |
|
2,193,502 |
|
Realized and Unrealized Gain (Loss) Net realized gain (loss) on: |
|
|
|
Investment securities: |
|
|
|
Unaffiliated issuers |
74,598,398 |
|
|
Other affiliated issuers |
(2,798,078) |
|
|
Foreign currency transactions |
(6,371) |
|
|
Total net realized gain (loss) |
|
71,793,949 |
|
Change in net unrealized appreciation (depreciation) on: Investment securities |
(84,861,043) |
|
|
Assets and liabilities in foreign currencies |
(18,539) |
|
|
Total change in net unrealized appreciation (depreciation) |
|
(84,879,582) |
|
Net gain (loss) |
|
(13,085,633) |
|
Net increase (decrease) in net assets resulting from operations |
|
$ (10,892,131) |
See accompanying notes which are an integral part of the financial statements.
Annual Report
Statement of Changes in Net Assets
|
|
Year ended |
Year ended |
|
Increase (Decrease) in Net Assets |
|
|
|
Operations |
|
|
|
Net investment income (loss) |
$ 2,193,502 |
$ (1,808,619) |
|
Net realized gain (loss) |
71,793,949 |
(13,271,623) |
|
Change in net unrealized appreciation (depreciation) |
(84,879,582) |
67,711,464 |
|
Net increase (decrease) in net assets resulting from operations |
(10,892,131) |
52,631,222 |
|
Distributions to shareholders from net investment income |
(1,409,664) |
- |
|
Share transactions |
291,353,775 |
303,359,134 |
|
Reinvestment of distributions |
1,367,084 |
- |
|
Cost of shares redeemed |
(352,076,506) |
(206,780,928) |
|
Net increase (decrease) in net assets resulting from share transactions |
(59,355,647) |
96,578,206 |
|
Redemption fees |
48,976 |
16,407 |
|
Total increase (decrease) in net assets |
(71,608,466) |
149,225,835 |
|
|
|
|
|
Net Assets |
|
|
|
Beginning of period |
758,712,998 |
609,487,163 |
|
End of period (including undistributed net investment income of $416,241 and accumulated net investment loss of $361,226, respectively) |
$ 687,104,532 |
$ 758,712,998 |
|
Other Information Shares |
|
|
|
Sold |
4,507,134 |
5,122,159 |
|
Issued in reinvestment of distributions |
22,287 |
- |
|
Redeemed |
(5,570,165) |
(3,621,731) |
|
Net increase (decrease) |
(1,040,744) |
1,500,428 |
Financial Highlights
|
Years ended February 28, |
2013 |
2012 F |
2011 |
2010 |
2009 |
|
Selected Per-Share Data |
|
|
|
|
|
|
Net asset value, beginning of period |
$ 64.89 |
$ 59.80 |
$ 43.59 |
$ 23.44 |
$ 40.26 |
|
Income from Investment Operations |
|
|
|
|
|
|
Net investment income (loss) B |
.18 |
(.18) |
(.25) |
(.07) |
(.02) |
|
Net realized and unrealized gain (loss) |
(.43) |
5.27 |
16.46 |
20.22 |
(16.80) |
|
Total from investment operations |
(.25) |
5.09 |
16.21 |
20.15 |
(16.82) |
|
Distributions from net investment income |
(.13) |
- |
- |
- |
- |
|
Redemption fees added to paid in capital B, G |
- |
- |
- |
- |
- |
|
Net asset value, end of period |
$ 64.51 |
$ 64.89 |
$ 59.80 |
$ 43.59 |
$ 23.44 |
|
Total Return A |
(.38)% |
8.51% |
37.19% |
85.96% |
(41.78)% |
|
Ratios to Average Net Assets C, E |
|
|
|
|
|
|
Expenses before reductions |
.85% |
.86% |
.89% |
.95% |
.92% |
|
Expenses net of fee waivers, if any |
.85% |
.86% |
.89% |
.95% |
.92% |
|
Expenses net of all reductions |
.82% |
.85% |
.88% |
.92% |
.91% |
|
Net investment income (loss) |
.29% |
(.32)% |
(.50)% |
(.18)% |
(.05)% |
|
Supplemental Data |
|
|
|
|
|
|
Net assets, end of period (000 omitted) |
$ 687,105 |
$ 758,713 |
$ 609,487 |
$ 502,708 |
$ 207,163 |
|
Portfolio turnover rate D |
184% |
193% |
141% |
269% |
183% |
A Total returns would have been lower if certain expenses had not been reduced during the applicable periods shown.
B Calculated based on average shares outstanding during the period.
C Fees and expenses of any underlying Fidelity Central Funds are not included in the Fund's expense ratio. The Fund indirectly bears its proportionate share of the expenses of any underlying Fidelity Central Funds.
D Amount does not include the portfolio activity of any underlying Fidelity Central Funds.
E Expense ratios reflect operating expenses of the Fund. Expenses before reductions do not reflect amounts reimbursed by the investment adviser or reductions from brokerage service arrangements or reductions from other expense offset arrangements and do not represent the amount paid by the Fund during periods when reimbursements or reductions occur. Expenses net of fee waivers reflect expenses after reimbursement by the investment adviser but prior to reductions from brokerage service arrangements or other expense offset arrangements. Expenses net of all reductions represent the net expenses paid by the Fund.
F For the year ended February 29.
G Amount represents less than $.01 per share.
See accompanying notes which are an integral part of the financial statements.
Annual Report
Electronics Portfolio
Performance: The Bottom Line
Average annual total return reflects the change in the value of an investment, assuming reinvestment of the fund's distributions from dividend income and capital gains (the profits earned upon the sale of securities that have grown in value, if any) and assuming a constant rate of performance each year. The $10,000 table and the fund's returns do not reflect the deduction of taxes that a shareholder would pay on fund distributions or the redemption of fund shares. During periods of reimbursement by Fidelity, a fund's total return will be greater than it would be had the reimbursement not occurred. How a fund did yesterday is no guarantee of how it will do tomorrow.
Average Annual Total Returns
|
Periods ended February 28, 2013 |
Past 1 |
Past 5 |
Past 10 |
|
Electronics Portfolio |
-6.20% |
6.58% |
7.53% |
$10,000 Over 10 Years
Let's say hypothetically that $10,000 was invested in Electronics Portfolio on February 28, 2003. The chart shows how the value of your investment would have changed, and also shows how the S&P 500 Index performed over the same period.

Annual Report
Electronics Portfolio
Management's Discussion of Fund Performance
Market Recap: U.S. stocks posted solid gains for the year ending February 28, 2013, sparked by a late-period rally that pushed major equity benchmarks to multiyear highs. Improvement in the global economy and more monetary stimulus from the U.S. Federal Reserve kept markets on the upswing for much of the year, shrugging off an early decline brought on by debt woes in Europe, and another dip later in the period amid Congressional gridlock on the federal budget. Renewed optimism over employment, the housing market, corporate earnings and record dividends made stocks a favorite with investors during the 12 months, which helped push the broad-based S&P 500® Index across the milestone 1,500 mark at the end of January. The S&P 500® finished the period up 13.46%. Seven of the 10 major market sectors tracked by MSCI U.S. IMI 25-50 classifications produced double-digit gains, led by health care and financials, while information technology, energy and materials trailed the broad equity market with only modest advances.
Comments from Stephen Barwikowski, who became sole Portfolio Manager of Electronics Portfolio on January 30, 2013, after serving as Co-Manager: For the year, the fund returned -6.20%, considerably behind the -4.40% mark of its industry benchmark, the MSCI® U.S. IMI Semiconductors & Semiconductor Equipment 25-50 Index, and the broadly based S&P 500®. Versus the broader market, the electronics group was weighed down mainly by weakness in its primary component, semiconductors. Chip stocks with ties to the personal computer industry were particularly weak, reflecting tepid PC demand. Compared with the MSCI index, the fund's underperformance was completely attributable to the first half of the period, when concern intensified about the European sovereign debt crisis and decelerating global economic growth. At this time, investors shunned a number of semiconductor stocks - many with ties to the smartphone and tablet markets - where the fund had overweighted exposure, and they favored defensive stocks, such as PC chipmaker and index heavyweight Intel. The fund's fortunes improved in the second half of the period, when a number of our positions that had stumbled earlier perked up, enabling the fund to beat the MSCI index by more than two percentage points during this stretch. For the one-year period overall, a substantial overweighting in PC chipmaker Advanced Micro Devices worked against us, as lowered quarterly revenue guidance, issued in July, depressed the stock, and I sold it shortly thereafter. Another detractor was Marvell Technology Group, one of the fund's largest holdings during the period. This stock was hurt by the company's exposure to the faltering PC industry, among other factors. A sizable underweighting in strong-performing chip equipment maker Applied Materials - which I sold - also detracted. On the positive side, a large underweighting in PC chipmaker and index heavyweight Intel bolstered performance, given this stock's weak performance. The fund's results also got a boost from a non-index position in Dutch holding NXP Semiconductors, a leading maker of components for Near Field Communication (NFC) technology. During the period, NFC won increasing acceptance in smartphones. One of the fund's largest overweightings, Freescale Semiconductor, was another significant contributor, as the stock rallied near period end, in part reflecting the market's increasing confidence in the company's recently adopted strategic plan.
The views expressed above reflect those of the portfolio manager(s) only through the end of the period as stated on the cover of this report and do not necessarily represent the views of Fidelity or any other person in the Fidelity organization. Any such views are subject to change at any time based upon market or other conditions and Fidelity disclaims any responsibility to update such views. These views may not be relied on as investment advice and, because investment decisions for a Fidelity fund are based on numerous factors, may not be relied on as an indication of trading intent on behalf of any Fidelity fund.
Annual Report
Electronics Portfolio
Investment Changes (Unaudited)
|
Top Ten Stocks as of February 28, 2013 |
||
|
|
% of fund's |
% of fund's net assets |
|
Broadcom Corp. Class A |
10.7 |
9.5 |
|
Altera Corp. |
8.1 |
5.2 |
|
Intel Corp. |
6.7 |
3.3 |
|
Skyworks Solutions, Inc. |
5.5 |
2.1 |
|
Marvell Technology Group Ltd. |
4.9 |
4.2 |
|
Intersil Corp. Class A |
4.7 |
4.6 |
|
Avago Technologies Ltd. |
3.9 |
4.0 |
|
Flextronics International Ltd. |
3.7 |
2.3 |
|
Freescale Semiconductor Holdings I Ltd. |
3.6 |
4.5 |
|
Micron Technology, Inc. |
3.1 |
2.6 |
|
|
54.9 |
|
|
Top Industries (% of fund's net assets) |
|||
|
As of February 28, 2013 |
|||
|
Semiconductors |
75.3% |
|
|
Electronic Equipment & Components |
11.0% |
|
|
Computers & Peripherals |
4.4% |
|
|
Communications Equipment |
3.8% |
|
|
Software |
0.8% |
|
|
All Others* |
4.7% |
|

|
As of August 31, 2012 |
|||
|
Semiconductors |
78.2% |
|
|
Electronic Equipment & Components |
9.5% |
|
|
Communications Equipment |
6.6% |
|
|
Computers & Peripherals |
1.3% |
|
|
Software |
0.1% |
|
|
All Others* |
4.3% |
|

|
* Includes short-term investments and net other assets. |
Annual Report
Electronics Portfolio
Investments February 28, 2013
Showing Percentage of Net Assets
|
Common Stocks - 94.0% |
|||
|
Shares |
Value |
||
|
BIOTECHNOLOGY - 0.0% |
|||
|
Biotechnology - 0.0% |
|||
|
Arrowhead Research Corp. warrants 5/21/17 (a)(f) |
285,468 |
$ 3 |
|
|
COMMUNICATIONS EQUIPMENT - 3.8% |
|||
|
Communications Equipment - 3.8% |
|||
|
Brocade Communications Systems, Inc. (a) |
488,979 |
2,743,172 |
|
|
Polycom, Inc. (a) |
1,148,262 |
10,460,667 |
|
|
QUALCOMM, Inc. |
255,603 |
16,775,225 |
|
|
Riverbed Technology, Inc. (a) |
420,400 |
6,423,712 |
|
|
|
36,402,776 |
||
|
COMPUTERS & PERIPHERALS - 4.4% |
|||
|
Computer Hardware - 4.2% |
|||
|
Apple, Inc. |
64,742 |
28,577,119 |
|
|
Hewlett-Packard Co. |
556,328 |
11,204,446 |
|
|
|
39,781,565 |
||
|
Computer Storage & Peripherals - 0.2% |
|||
|
SanDisk Corp. (a) |
38,968 |
1,963,598 |
|
|
TOTAL COMPUTERS & PERIPHERALS |
41,745,163 |
||
|
ELECTRONIC EQUIPMENT & COMPONENTS - 11.0% |
|||
|
Electronic Components - 2.6% |
|||
|
Aeroflex Holding Corp. (a) |
1,777,595 |
16,442,754 |
|
|
Corning, Inc. |
315,141 |
3,973,928 |
|
|
InvenSense, Inc. (a) |
321,290 |
3,861,906 |
|
|
Universal Display Corp. (a) |
29,500 |
925,710 |
|
|
|
25,204,298 |
||
|
Electronic Manufacturing Services - 8.4% |
|||
|
Benchmark Electronics, Inc. (a) |
235,833 |
4,108,211 |
|
|
Flextronics International Ltd. (a) |
5,321,282 |
35,386,525 |
|
|
Jabil Circuit, Inc. |
1,280,843 |
23,990,189 |
|
|
Plexus Corp. (a) |
18 |
438 |
|
|
TTM Technologies, Inc. (a) |
2,002,559 |
16,420,984 |
|
|
|
79,906,347 |
||
|
TOTAL ELECTRONIC EQUIPMENT & COMPONENTS |
105,110,645 |
||
|
INTERNET SOFTWARE & SERVICES - 0.5% |
|||
|
Internet Software & Services - 0.5% |
|||
|
Demand Media, Inc. (a)(d) |
157,100 |
1,272,510 |
|
|
Facebook, Inc. Class A |
55,249 |
1,505,535 |
|
|
Google, Inc. Class A (a) |
1,800 |
1,442,160 |
|
|
|
4,220,205 |
||
|
IT SERVICES - 0.3% |
|||
|
Data Processing & Outsourced Services - 0.3% |
|||
|
VeriFone Systems, Inc. (a) |
145,000 |
2,750,650 |
|
|
|
|||
|
Shares |
Value |
||
|
SEMICONDUCTORS & SEMICONDUCTOR EQUIPMENT - 73.2% |
|||
|
Semiconductor Equipment - 0.3% |
|||
|
Amkor Technology, Inc. (a)(d) |
177,455 |
$ 718,693 |
|
|
Lam Research Corp. (a) |
64,573 |
2,731,438 |
|
|
|
3,450,131 |
||
|
Semiconductors - 72.9% |
|||
|
Alpha & Omega Semiconductor Ltd. (a) |
192,084 |
1,548,197 |
|
|
Altera Corp. |
2,175,569 |
77,058,654 |
|
|
ANADIGICS, Inc. (a) |
471,200 |
994,232 |
|
|
ARM Holdings PLC sponsored ADR |
17 |
740 |
|
|
Atmel Corp. (a) |
284,633 |
1,935,504 |
|
|
Avago Technologies Ltd. |
1,089,017 |
37,266,162 |
|
|
Broadcom Corp. Class A |
2,982,418 |
101,730,276 |
|
|
Cypress Semiconductor Corp. |
2,055,999 |
21,649,669 |
|
|
Entropic Communications, Inc. (a) |
600,452 |
2,647,993 |
|
|
EZchip Semiconductor Ltd. (a) |
128,014 |
3,105,620 |
|
|
First Solar, Inc. (a)(d) |
137,842 |
3,563,216 |
|
|
Freescale Semiconductor Holdings I Ltd. (a)(d) |
2,203,563 |
34,000,977 |
|
|
Inphi Corp. (a) |
946,471 |
9,142,910 |
|
|
Intel Corp. |
3,072,715 |
64,066,108 |
|
|
Intermolecular, Inc. (a) |
408,842 |
3,953,502 |
|
|
Intersil Corp. Class A |
5,300,714 |
45,003,062 |
|
|
Lattice Semiconductor Corp. (a) |
520,400 |
2,435,472 |
|
|
LSI Corp. (a) |
2,228,305 |
15,509,003 |
|
|
M/A-COM Technology Solutions, Inc. |
196,426 |
3,182,101 |
|
|
Marvell Technology Group Ltd. |
4,635,260 |
46,816,126 |
|
|
MediaTek, Inc. |
310,000 |
3,514,440 |
|
|
Mellanox Technologies Ltd. (a) |
46,700 |
2,462,491 |
|
|
Microchip Technology, Inc. (d) |
487,493 |
17,778,870 |
|
|
Micron Technology, Inc. (a) |
3,486,135 |
29,248,673 |
|
|
Motech Industries, Inc. (a) |
1 |
1 |
|
|
NVIDIA Corp. |
1,958,706 |
24,797,218 |
|
|
NXP Semiconductors NV (a) |
217,758 |
7,037,939 |
|
|
O2Micro International Ltd. sponsored ADR (a) |
838,078 |
2,690,230 |
|
|
ON Semiconductor Corp. (a) |
3,385,336 |
27,082,688 |
|
|
PMC-Sierra, Inc. (a) |
3,902,454 |
25,326,926 |
|
|
RDA Microelectronics, Inc. sponsored ADR |
69,482 |
753,185 |
|
|
Skyworks Solutions, Inc. (a) |
2,457,936 |
52,354,037 |
|
|
Spreadtrum Communications, Inc. ADR |
68,302 |
1,195,968 |
|
|
Texas Instruments, Inc. |
537,819 |
18,484,839 |
|
|
TriQuint Semiconductor, Inc. (a) |
521,597 |
2,451,506 |
|
|
Volterra Semiconductor Corp. (a) |
274,900 |
4,219,715 |
|
|
|
695,008,250 |
||
|
TOTAL SEMICONDUCTORS & SEMICONDUCTOR EQUIPMENT |
698,458,381 |
||
|
SOFTWARE - 0.8% |
|||
|
Application Software - 0.3% |
|||
|
Nuance Communications, Inc. (a) |
164,037 |
3,019,921 |
|
|
Common Stocks - continued |
|||
|
Shares |
Value |
||
|
SOFTWARE - CONTINUED |
|||
|
Home Entertainment Software - 0.0% |
|||
|
Zynga, Inc. (a) |
9,565 |
$ 32,425 |
|
|
Systems Software - 0.5% |
|||
|
Allot Communications Ltd. (a) |
166,350 |
2,283,986 |
|
|
Check Point Software Technologies Ltd. (a) |
400 |
21,004 |
|
|
VMware, Inc. Class A (a) |
31,500 |
2,262,645 |
|
|
|
4,567,635 |
||
|
TOTAL SOFTWARE |
7,619,981 |
||
|
TOTAL COMMON STOCKS (Cost $1,043,677,956) |
|
||
|
Convertible Bonds - 2.1% |
||||
|
|
Principal Amount |
|
||
|
SEMICONDUCTORS & SEMICONDUCTOR EQUIPMENT - 2.1% |
||||
|
Semiconductors - 2.1% |
||||
|
Micron Technology, Inc.: |
|
|
|
|
|
1.625% 2/15/33 (e) |
|
$ 1,970,000 |
2,068,500 |
|
|
1.875% 8/1/31 |
|
5,680,000 |
5,928,500 |
|
|
3.125% 5/1/32 (e) |
|
11,050,000 |
12,341,469 |
|
|
(Cost $17,669,109) |
20,338,469 |
|||
|
Money Market Funds - 8.9% |
|||
|
Shares |
|
||
|
Fidelity Cash Central Fund, 0.16% (b) |
41,018,189 |
41,018,189 |
|
|
Fidelity Securities Lending Cash Central Fund, 0.16% (b)(c) |
44,163,314 |
44,163,314 |
|
|
TOTAL MONEY MARKET FUNDS (Cost $85,181,503) |
|
||
|
TOTAL INVESTMENT PORTFOLIO - 105.0% (Cost $1,146,528,568) |
1,001,827,776 |
|
NET OTHER ASSETS (LIABILITIES) - (5.0)% |
(48,043,699) |
||
|
NET ASSETS - 100% |
$ 953,784,077 |
||
|
Legend |
|
(a) Non-income producing |
|
(b) Affiliated fund that is generally available only to investment companies and other accounts managed by Fidelity Investments. The rate quoted is the annualized seven-day yield of the fund at period end. A complete unaudited listing of the fund's holdings as of its most recent quarter end is available upon request. In addition, each Fidelity Central Fund's financial statements, which are not covered by the Fund's Report of Independent Registered Public Accounting Firm, are available on the SEC's website or upon request. |
|
(c) Investment made with cash collateral received from securities on loan. |
|
(d) Security or a portion of the security is on loan at period end. |
|
(e) Security exempt from registration under Rule 144A of the Securities Act of 1933. These securities may be resold in transactions exempt from registration, normally to qualified institutional buyers. At the end of the period, the value of these securities amounted to $14,409,969 or 1.5% of net assets. |
|
(f) Restricted securities - Investment in securities not registered under the Securities Act of 1933 (excluding 144A issues). At the end of the period, the value of restricted securities (excluding 144A issues) amounted to $3 or 0.0% of net assets. |
|
Additional information on each restricted holding is as follows: |
|
Security |
Acquisition Date |
Acquisition Cost |
|
Arrowhead Research Corp. warrants 5/21/17 |
5/18/07 |
$ 1,033,745 |
|
Affiliated Central Funds |
|
Information regarding fiscal year to date income earned by the Fund from investments in Fidelity Central Funds is as follows: |
|
Fund |
Income earned |
|
Fidelity Cash Central Fund |
$ 41,101 |
|
Fidelity Securities Lending Cash Central Fund |
336,950 |
|
Total |
$ 378,051 |
|
Other Affiliated Issuers |
|
An affiliated company is a company in which the Fund has ownership of at least 5% of the voting securities. Fiscal year to date transactions with companies which are or were affiliates are as follows: |
|
Affiliate |
Value, beginning of period |
Purchases |
Sales |
Dividend Income |
Value, |
|
BCD Semiconductor Manufacturing Ltd. ADR |
$ 7,544,993 |
$ 1,039,548 |
$ 12,328,589 |
$ - |
$ - |
|
Total |
$ 7,544,993 |
$ 1,039,548 |
$ 12,328,589 |
$ - |
$ - |
|
Other Information |
|
The following is a summary of the inputs used, as of February 28, 2013, involving the Fund's assets and liabilities carried at fair value. The inputs or methodology used for valuing securities may not be an indication of the risk associated with investing in those securities. For more information on valuation inputs, and their aggregation into the levels used in the table below, please refer to the Investment Valuation section in the accompanying Notes to Financial Statements. |
|
Valuation Inputs at Reporting Date: |
||||
|
Description |
Total |
Level 1 |
Level 2 |
Level 3 |
|
Investments in Securities: |
||||
|
Common Stocks |
$ 896,307,804 |
$ 892,793,360 |
$ 3,514,441 |
$ 3 |
|
Convertible Bonds |
20,338,469 |
- |
20,338,469 |
- |
|
Money Market Funds |
85,181,503 |
85,181,503 |
- |
- |
|
Total Investments in Securities: |
$ 1,001,827,776 |
$ 977,974,863 |
$ 23,852,910 |
$ 3 |
|
Distribution of investments by country or territory of incorporation, as a percentage of total net assets, is as follows. (Unaudited) |
|
United States of America |
81.2% |
|
Bermuda |
8.7% |
|
Singapore |
7.6% |
|
Others (Individually Less Than 1%) |
2.5% |
|
|
100.0% |
See accompanying notes which are an integral part of the financial statements.
Annual Report
Electronics Portfolio
Financial Statements
Statement of Assets and Liabilities
|
|
February 28, 2013 |
|
|
|
|
|
|
Assets |
|
|
|
Investment in securities, at value (including securities loaned of $42,529,761) - See accompanying schedule: Unaffiliated issuers (cost $1,061,347,065) |
$ 916,646,273 |
|
|
Fidelity Central Funds (cost $85,181,503) |
85,181,503 |
|
|
Total Investments (cost $1,146,528,568) |
|
$ 1,001,827,776 |
|
Cash |
|
1 |
|
Receivable for investments sold |
|
6,434,503 |
|
Receivable for fund shares sold |
|
2,270,507 |
|
Dividends receivable |
|
1,672,745 |
|
Interest receivable |
|
125,669 |
|
Distributions receivable from Fidelity Central Funds |
|
16,446 |
|
Prepaid expenses |
|
1,582 |
|
Receivable from investment adviser for expense reductions |
|
1,405 |
|
Other receivables |
|
122,689 |
|
Total assets |
|
1,012,473,323 |
|
|
|
|
|
Liabilities |
|
|
|
Payable for investments purchased |
$ 12,464,462 |
|
|
Payable for fund shares redeemed |
1,347,799 |
|
|
Accrued management fee |
436,126 |
|
|
Other affiliated payables |
200,626 |
|
|
Other payables and accrued expenses |
76,919 |
|
|
Collateral on securities loaned, at value |
44,163,314 |
|
|
Total liabilities |
|
58,689,246 |
|
|
|
|
|
Net Assets |
|
$ 953,784,077 |
|
Net Assets consist of: |
|
|
|
Paid in capital |
|
$ 1,377,068,929 |
|
Distributions in excess of net investment income |
|
(900) |
|
Accumulated undistributed net realized gain (loss) on investments and foreign currency transactions |
|
(278,583,010) |
|
Net unrealized appreciation (depreciation) on investments and assets and liabilities in foreign currencies |
|
(144,700,942) |
|
Net Assets, for 19,144,945 shares outstanding |
|
$ 953,784,077 |
|
Net Asset Value, offering price and redemption price per share ($953,784,077 ÷ 19,144,945 shares) |
|
$ 49.82 |
Statement of Operations
|
|
Year ended February 28, 2013 |
|
|
|
|
|
|
Investment Income |
|
|
|
Dividends |
|
$ 10,859,156 |
|
Interest |
|
136,357 |
|
Income from Fidelity Central Funds (including $336,950 from security lending) |
|
378,051 |
|
Total income |
|
11,373,564 |
|
|
|
|
|
Expenses |
|
|
|
Management fee |
$ 5,385,105 |
|
|
Transfer agent fees |
2,244,131 |
|
|
Accounting and security lending fees |
335,134 |
|
|
Custodian fees and expenses |
87,816 |
|
|
Independent trustees' compensation |
6,887 |
|
|
Depreciation in deferred trustee compensation account |
(28) |
|
|
Registration fees |
32,664 |
|
|
Audit |
41,829 |
|
|
Legal |
7,183 |
|
|
Interest |
1,409 |
|
|
Miscellaneous |
10,253 |
|
|
Total expenses before reductions |
8,152,383 |
|
|
Expense reductions |
(237,262) |
7,915,121 |
|
Net investment income (loss) |
|
3,458,443 |
|
Realized and Unrealized Gain (Loss) Net realized gain (loss) on: |
|
|
|
Investment securities: |
|
|
|
Unaffiliated issuers |
(21,143,965) |
|
|
Other affiliated issuers |
830,122 |
|
|
Foreign currency transactions |
2,098 |
|
|
Total net realized gain (loss) |
|
(20,311,745) |
|
Change in net unrealized appreciation (depreciation) on: Investment securities |
(73,076,982) |
|
|
Assets and liabilities in foreign currencies |
(150) |
|
|
Total change in net unrealized appreciation (depreciation) |
|
(73,077,132) |
|
Net gain (loss) |
|
(93,388,877) |
|
Net increase (decrease) in net assets resulting from operations |
|
$ (89,930,434) |
See accompanying notes which are an integral part of the financial statements.
Annual Report
Electronics Portfolio
Financial Statements - continued
Statement of Changes in Net Assets
|
|
Year ended |
Year ended |
|
Increase (Decrease) in Net Assets |
|
|
|
Operations |
|
|
|
Net investment income (loss) |
$ 3,458,443 |
$ 345,599 |
|
Net realized gain (loss) |
(20,311,745) |
164,105,931 |
|
Change in net unrealized appreciation (depreciation) |
(73,077,132) |
(175,704,422) |
|
Net increase (decrease) in net assets resulting from operations |
(89,930,434) |
(11,252,892) |
|
Distributions to shareholders from net investment income |
(2,800,318) |
(1,262,911) |
|
Share transactions |
181,948,250 |
318,638,191 |
|
Reinvestment of distributions |
2,646,881 |
1,197,593 |
|
Cost of shares redeemed |
(429,835,446) |
(402,899,738) |
|
Net increase (decrease) in net assets resulting from share transactions |
(245,240,315) |
(83,063,954) |
|
Redemption fees |
14,064 |
56,684 |
|
Total increase (decrease) in net assets |
(337,957,003) |
(95,523,073) |
|
|
|
|
|
Net Assets |
|
|
|
Beginning of period |
1,291,741,080 |
1,387,264,153 |
|
End of period (including distributions in excess of net investment income of $900 and distributions in excess of net investment income of $659,783, respectively) |
$ 953,784,077 |
$ 1,291,741,080 |
|
Other Information Shares |
|
|
|
Sold |
3,819,489 |
6,469,469 |
|
Issued in reinvestment of distributions |
59,545 |
25,727 |
|
Redeemed |
(8,974,424) |
(8,254,694) |
|
Net increase (decrease) |
(5,095,390) |
(1,759,498) |
Financial Highlights
|
Years ended February 28, |
2013 |
2012 F |
2011 |
2010 |
2009 |
|
Selected Per-Share Data |
|
|
|
|
|
|
Net asset value, beginning of period |
$ 53.29 |
$ 53.36 |
$ 39.66 |
$ 21.13 |
$ 37.17 |
|
Income from Investment Operations |
|
|
|
|
|
|
Net investment income (loss) B |
.17 |
.01 |
.06 |
.31 |
.34 |
|
Net realized and unrealized gain (loss) |
(3.49) |
(.02) |
13.75 |
18.57 |
(16.19) |
|
Total from investment operations |
(3.32) |
(.01) |
13.81 |
18.88 |
(15.85) |
|
Distributions from net investment income |
(.15) |
(.06) |
(.11) |
(.34) |
(.19) |
|
Distributions from net realized gain |
- |
- |
- |
(.01) |
- |
|
Total distributions |
(.15) |
(.06) |
(.11) |
(.35) |
(.19) |
|
Redemption fees added to paid in capital B, G |
- |
- |
- |
- |
- |
|
Net asset value, end of period |
$ 49.82 |
$ 53.29 |
$ 53.36 |
$ 39.66 |
$ 21.13 |
|
Total Return A |
(6.20)% |
(.01)% |
34.87% |
89.51% |
(42.63)% |
|
Ratios to Average Net Assets C, E |
|
|
|
|
|
|
Expenses before reductions |
.84% |
.84% |
.86% |
.92% |
.89% |
|
Expenses net of fee waivers, if any |
.84% |
.84% |
.86% |
.92% |
.89% |
|
Expenses net of all reductions |
.82% |
.83% |
.86% |
.91% |
.88% |
|
Net investment income (loss) |
.36% |
.03% |
.13% |
.92% |
1.05% |
|
Supplemental Data |
|
|
|
|
|
|
Net assets, end of period (000 omitted) |
$ 953,784 |
$ 1,291,741 |
$ 1,387,264 |
$ 1,104,541 |
$ 563,453 |
|
Portfolio turnover rate D |
118% |
137% |
101% |
71% |
91% |
A Total returns would have been lower if certain expenses had not been reduced during the applicable periods shown.
B Calculated based on average shares outstanding during the period.
C Fees and expenses of any underlying Fidelity Central Funds are not included in the Fund's expense ratio. The Fund indirectly bears its proportionate share of the expenses of any underlying Fidelity Central Funds.
D Amount does not include the portfolio activity of any underlying Fidelity Central Funds.
E Expense ratios reflect operating expenses of the Fund. Expenses before reductions do not reflect amounts reimbursed by the investment adviser or reductions from brokerage service arrangements or reductions from other expense offset arrangements and do not represent the amount paid by the Fund during periods when reimbursements or reductions occur. Expenses net of fee waivers reflect expenses after reimbursement by the investment adviser but prior to reductions from brokerage service arrangements or other expense offset arrangements. Expenses net of all reductions represent the net expenses paid by the Fund.
F For the year ended February 29.
G Amount represents less than $.01 per share.
See accompanying notes which are an integral part of the financial statements.
Annual Report
IT Services Portfolio
Performance: The Bottom Line
Average annual total return reflects the change in the value of an investment, assuming reinvestment of the fund's distributions from dividend income and capital gains (the profits earned upon the sale of securities that have grown in value, if any) and assuming a constant rate of performance each year. The $10,000 table and the fund's returns do not reflect the deduction of taxes that a shareholder would pay on fund distributions or the redemption of fund shares. During periods of reimbursement by Fidelity, a fund's total return will be greater than it would be had the reimbursement not occurred. How a fund did yesterday is no guarantee of how it will do tomorrow.
Average Annual Total Returns
|
Periods ended February 28, 2013 |
Past 1 |
Past 5 |
Past 10 |
|
IT Services Portfolio A |
17.22% |
13.88% |
13.97% |
A Prior to October 1, 2006, IT Services Portfolio operated under certain different investment policies. The historical performance for the fund may not represent its current investment policies.
$10,000 Over 10 Years
Let's say hypothetically that $10,000 was invested in IT Services Portfolio on February 28, 2003. The chart shows how the value of your investment would have changed, and also shows how the S&P 500 Index performed over the same period.
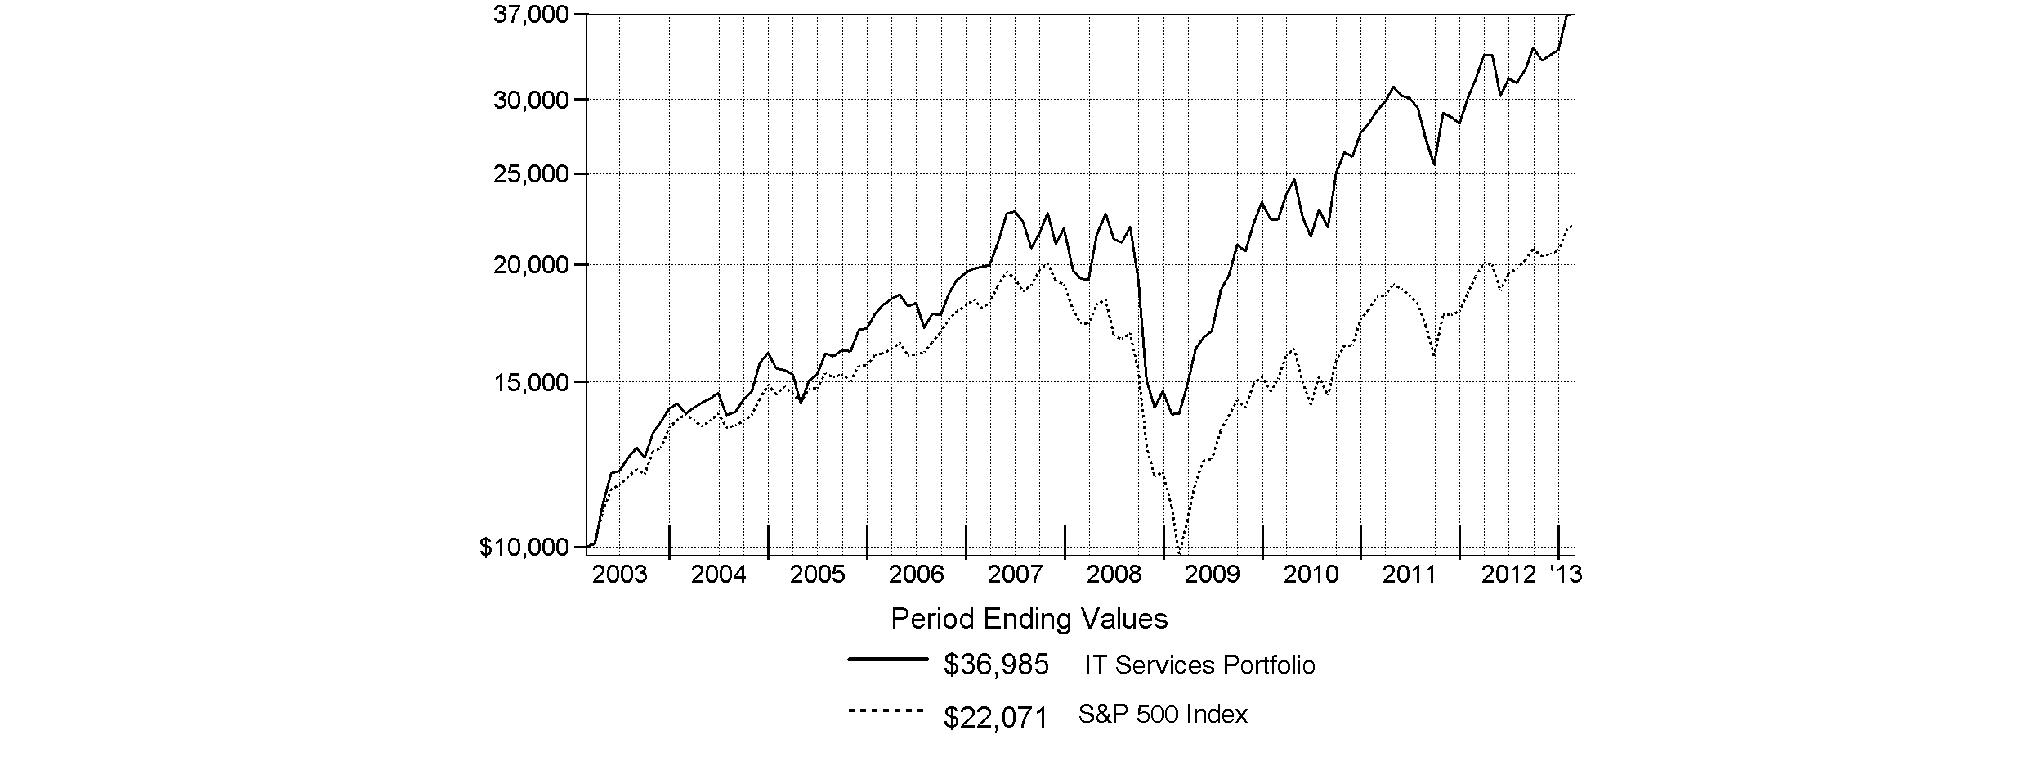
Annual Report
IT Services Portfolio
Management's Discussion of Fund Performance
Market Recap: U.S. stocks posted solid gains for the year ending February 28, 2013, sparked by a late-period rally that pushed major equity benchmarks to multiyear highs. Improvement in the global economy and more monetary stimulus from the U.S. Federal Reserve kept markets on the upswing for much of the year, shrugging off an early decline brought on by debt woes in Europe, and another dip later in the period amid Congressional gridlock on the federal budget. Renewed optimism over employment, the housing market, corporate earnings and record dividends made stocks a favorite with investors during the 12 months, which helped push the broad-based S&P 500® Index across the milestone 1,500 mark at the end of January. The S&P 500® finished the period up 13.46%. Seven of the 10 major market sectors tracked by MSCI U.S. IMI 25-50 classifications produced double-digit gains, led by health care and financials, while information technology, energy and materials trailed the broad equity market with only modest advances.
Comments from Kyle Weaver, Portfolio Manager of IT Services Portfolio: For the year, the fund returned 17.22%, handily outdistancing the 14.15% gain of the MSCI® U.S. IMI Information Technology Services 25-50 Index and also topping the S&P 500®. As a group, IT services stocks benefited from strong performance in the data processing/outsourced services segment, which posted a return of roughly 21% and comprised over half of the MSCI industry benchmark. Versus this benchmark, stock selection in IT consulting/other services contributed more than three percentage points of the fund's outperformance, while non-index exposure to the Internet software/services and application software groups also proved rewarding. Although security selection in data processing/outsourced services had a positive impact, it was cancelled out by an underweighting in this strong- performing segment. A large underweighting in benchmark heavyweight IBM - a member of the IT consulting/other services segment - made it the fund's top relative contributor, as this stock recorded a modest gain of approximately 4% during the period. At the beginning of the period, IBM was trading at a valuation premium to the broader market, and I questioned whether that was sustainable, given the company's single-digit revenue growth in recent years. This stock comprised roughly 22% of the MSCI benchmark during the period, so the fund's stake of about 8% - which made it our fourth-largest holding by average exposure weight - was a significant underweighting that paid off. Almost as significant in its impact on relative performance was the fund's overweighting in Virtusa, a small, fast-growing IT services firm. As the period progressed, investors began to reward this stock for the firm's stellar earnings growth. Another large overweighting that paid off was software engineering provider EPAM Systems. In absolute terms, electronic payment facilitators Visa and MasterCard, the fund's second- and third-largest positions by average exposure weight, respectively, were significant contributors to performance. Conversely, an out-of-benchmark position in consumer finance - consisting entirely of a stake in prepaid debit card provider Green Dot - worked against us. Prepaid cards are replacing traditional banking for many U.S. consumers, and I thought Green Dot was well-positioned to benefit as a leader in that space. However, this stock lost over half of its value in late July, after the company lowered its revenue and earnings guidance for fiscal 2012, as stiffer competition pressured the firm's profit margins. Given the uncertainty of a rapidly changing competitive environment, I sold the stock. In the case of VeriFone Systems, a leading provider of point-of-sale (POS) terminals, uncertainty about the company's ability to integrate a recent acquisition, coupled with concern about the longer-term prospects for POS equipment, hampered the stock, and I reduced the overweighting here during the period. Underweighting a strong-performing benchmark component, CoreLogic, further detracted. CoreLogic provides business information, primarily for companies in the financials sector. This stock was lifted by the boom in mortgage refinancing, which positively impacted CoreLogic's business. In general, I look for investments that are less cyclical in nature, but in this case I probably should have made an exception.
The views expressed above reflect those of the portfolio manager(s) only through the end of the period as stated on the cover of this report and do not necessarily represent the views of Fidelity or any other person in the Fidelity organization. Any such views are subject to change at any time based upon market or other conditions and Fidelity disclaims any responsibility to update such views. These views may not be relied on as investment advice and, because investment decisions for a Fidelity fund are based on numerous factors, may not be relied on as an indication of trading intent on behalf of any Fidelity fund.
Annual Report
IT Services Portfolio
Investment Changes (Unaudited)
|
Top Ten Stocks as of February 28, 2013 |
||
|
|
% of fund's |
% of fund's net assets |
|
Visa, Inc. Class A |
9.6 |
9.1 |
|
IBM Corp. |
9.2 |
8.2 |
|
Cognizant Technology Solutions Corp. Class A |
7.6 |
9.1 |
|
MasterCard, Inc. Class A |
6.1 |
7.6 |
|
Accenture PLC Class A |
5.1 |
7.0 |
|
Fidelity National Information Services, Inc. |
4.0 |
3.0 |
|
EPAM Systems, Inc. |
3.8 |
3.3 |
|
Virtusa Corp. |
3.3 |
5.3 |
|
Heartland Payment Systems, Inc. |
2.6 |
0.4 |
|
ExlService Holdings, Inc. |
2.6 |
3.2 |
|
|
53.9 |
|
|
Top Industries (% of fund's net assets) |
|||
|
As of February 28, 2013 |
|||
|
IT Services |
87.5% |
|
|
Software |
4.5% |
|
|
Internet Software & Services |
2.9% |
|
|
Professional Services |
2.5% |
|
|
Office Electronics |
1.0% |
|
|
All Others* |
1.6% |
|

|
As of August 31, 2012 |
|||
|
IT Services |
87.1% |
|
|
Software |
6.4% |
|
|
Internet Software & Services |
3.1% |
|
|
Office Electronics |
1.3% |
|
|
Computers & Peripherals |
1.0% |
|
|
All Others* |
1.1% |
|

|
* Includes short-term investments and net other assets. |
Annual Report
IT Services Portfolio
Investments February 28, 2013
Showing Percentage of Net Assets
|
Common Stocks - 98.9% |
|||
|
Shares |
Value |
||
|
COMMERCIAL SERVICES & SUPPLIES - 0.1% |
|||
|
Diversified Support Services - 0.1% |
|||
|
Performant Financial Corp. |
39,822 |
$ 527,642 |
|
|
COMMUNICATIONS EQUIPMENT - 0.0% |
|||
|
Communications Equipment - 0.0% |
|||
|
Palo Alto Networks, Inc. |
400 |
24,452 |
|
|
COMPUTERS & PERIPHERALS - 0.4% |
|||
|
Computer Hardware - 0.4% |
|||
|
NCR Corp. (a) |
79,500 |
2,192,610 |
|
|
INTERNET SOFTWARE & SERVICES - 2.9% |
|||
|
Internet Software & Services - 2.9% |
|||
|
Blucora, Inc. (a) |
107,790 |
1,670,745 |
|
|
Demandware, Inc. (d) |
71,420 |
1,889,059 |
|
|
E2open, Inc. (d) |
93,100 |
1,839,656 |
|
|
Web.com Group, Inc. (a) |
482,450 |
8,240,246 |
|
|
|
13,639,706 |
||
|
IT SERVICES - 87.5% |
|||
|
Data Processing & Outsourced Services - 45.4% |
|||
|
Alliance Data Systems Corp. (a)(d) |
47,380 |
7,518,732 |
|
|
Broadridge Financial Solutions, Inc. |
7,800 |
179,010 |
|
|
Cardtronics, Inc. (a) |
162,600 |
4,286,136 |
|
|
Cass Information Systems, Inc. |
13,552 |
579,348 |
|
|
Computer Sciences Corp. |
46,000 |
2,209,380 |
|
|
Convergys Corp. |
60,900 |
1,010,331 |
|
|
CoreLogic, Inc. (a) |
71,300 |
1,847,383 |
|
|
Euronet Worldwide, Inc. (a) |
82,200 |
1,984,308 |
|
|
ExlService Holdings, Inc. (a) |
396,900 |
12,014,163 |
|
|
Fidelity National Information Services, Inc. |
505,200 |
19,020,780 |
|
|
Fiserv, Inc. (a) |
73,000 |
5,994,030 |
|
|
FleetCor Technologies, Inc. (a) |
93,600 |
6,534,216 |
|
|
Genpact Ltd. |
409,500 |
7,211,295 |
|
|
Global Cash Access Holdings, Inc. (a) |
315,100 |
2,237,210 |
|
|
Global Payments, Inc. |
122,700 |
5,915,367 |
|
|
Heartland Payment Systems, Inc. |
388,000 |
12,066,800 |
|
|
Higher One Holdings, Inc. (a) |
2,700 |
24,138 |
|
|
Jack Henry & Associates, Inc. |
6,600 |
288,552 |
|
|
Lender Processing Services, Inc. |
36,400 |
893,984 |
|
|
MasterCard, Inc. Class A |
55,440 |
28,707,941 |
|
|
ModusLink Global Solutions, Inc. (a) |
4,400 |
12,672 |
|
|
NeuStar, Inc. Class A (a) |
85,600 |
3,753,560 |
|
|
Sykes Enterprises, Inc. (a) |
54,300 |
806,898 |
|
|
Syntel, Inc. |
57,900 |
3,483,264 |
|
|
Teletech Holdings, Inc. (a) |
2,000 |
37,420 |
|
|
The Western Union Co. |
611,700 |
8,582,151 |
|
|
Total System Services, Inc. |
378,200 |
8,986,032 |
|
|
Vantiv, Inc. |
470,300 |
10,233,728 |
|
|
VeriFone Systems, Inc. (a) |
218,000 |
4,135,460 |
|
|
Visa, Inc. Class A |
286,212 |
45,404,671 |
|
|
|
|||
|
Shares |
Value |
||
|
WEX, Inc. (a) |
600 |
$ 45,006 |
|
|
WNS Holdings Ltd. sponsored ADR (a) |
551,629 |
7,755,904 |
|
|
|
213,759,870 |
||
|
IT Consulting & Other Services - 42.1% |
|||
|
Accenture PLC Class A |
319,900 |
23,787,764 |
|
|
Acxiom Corp. (a) |
193,400 |
3,521,814 |
|
|
Atos Origin SA |
58,416 |
4,338,716 |
|
|
Booz Allen Hamilton Holding Corp. Class A |
26,900 |
344,320 |
|
|
Camelot Information Systems, Inc. ADR (a) |
805,344 |
1,296,604 |
|
|
CGI Group, Inc. Class A (sub. vtg.) (a) |
280,800 |
7,419,927 |
|
|
Ciber, Inc. (a) |
236,200 |
1,051,090 |
|
|
Cognizant Technology Solutions Corp. Class A (a) |
467,366 |
35,879,688 |
|
|
EPAM Systems, Inc. |
860,500 |
18,053,290 |
|
|
Forrester Research, Inc. |
97,600 |
2,680,096 |
|
|
Gartner, Inc. Class A (a) |
79,700 |
3,965,872 |
|
|
HCL Technologies Ltd. |
1,614 |
21,474 |
|
|
IBM Corp. |
215,850 |
43,349,156 |
|
|
IBS Group Holding Ltd. GDR (Reg. S) |
115,700 |
2,779,359 |
|
|
iGate Corp. (a) |
204,207 |
3,902,396 |
|
|
Maximus, Inc. |
43,000 |
3,129,540 |
|
|
NCI, Inc. Class A (a) |
199,300 |
1,002,479 |
|
|
Pactera Technology International Ltd. ADR (d) |
619,962 |
4,246,740 |
|
|
Sapient Corp. (a) |
655,300 |
7,352,466 |
|
|
ServiceSource International, Inc. (a) |
92,100 |
582,072 |
|
|
Teradata Corp. (a) |
112,900 |
6,554,974 |
|
|
Unisys Corp. (a) |
314,040 |
7,216,639 |
|
|
Virtusa Corp. (a) |
751,166 |
15,736,928 |
|
|
|
198,213,404 |
||
|
TOTAL IT SERVICES |
411,973,274 |
||
|
OFFICE ELECTRONICS - 1.0% |
|||
|
Office Electronics - 1.0% |
|||
|
Xerox Corp. |
574,200 |
4,656,762 |
|
|
PROFESSIONAL SERVICES - 2.5% |
|||
|
Research & Consulting Services - 2.5% |
|||
|
ICF International, Inc. (a) |
193,600 |
4,789,664 |
|
|
IHS, Inc. Class A (a) |
18,300 |
1,944,375 |
|
|
Nielsen Holdings B.V. |
59,800 |
2,014,662 |
|
|
Verisk Analytics, Inc. (a) |
50,900 |
2,978,668 |
|
|
|
11,727,369 |
||
|
SOFTWARE - 4.5% |
|||
|
Application Software - 2.8% |
|||
|
Bottomline Technologies, Inc. (a) |
170,300 |
4,620,239 |
|
|
Descartes Systems Group, Inc. (a) |
68,400 |
623,476 |
|
|
Guidewire Software, Inc. (a) |
109,100 |
3,987,605 |
|
|
Intuit, Inc. |
600 |
38,688 |
|
|
Jive Software, Inc. (a) |
67,900 |
1,125,782 |
|
|
MicroStrategy, Inc. Class A (a) |
100 |
10,188 |
|
|
Common Stocks - continued |
|||
|
Shares |
Value |
||
|
SOFTWARE - CONTINUED |
|||
|
Application Software - continued |
|||
|
Splunk, Inc. |
600 |
$ 21,678 |
|
|
Ultimate Software Group, Inc. (a) |
22,200 |
2,181,594 |
|
|
Workday, Inc. |
1,400 |
77,406 |
|
|
Zensar Technologies Ltd. |
138,123 |
571,850 |
|
|
|
13,258,506 |
||
|
Systems Software - 1.7% |
|||
|
Check Point Software Technologies Ltd. (a) |
129,200 |
6,784,292 |
|
|
Fortinet, Inc. (a) |
500 |
12,090 |
|
|
Qualys, Inc. |
93,200 |
1,105,352 |
|
|
|
7,901,734 |
||
|
TOTAL SOFTWARE |
21,160,240 |
||
|
TOTAL COMMON STOCKS (Cost $380,210,751) |
|
||
|
Money Market Funds - 3.2% |
|||
|
Shares |
|
||
|
Fidelity Cash Central Fund, 0.16% (b) |
6,639,899 |
6,639,899 |
|
|
Fidelity Securities Lending Cash Central Fund, 0.16% (b)(c) |
8,281,900 |
8,281,900 |
|
|
TOTAL MONEY MARKET FUNDS (Cost $14,921,799) |
|
||
|
TOTAL INVESTMENT PORTFOLIO - 102.1% (Cost $395,132,550) |
480,823,854 |
|
NET OTHER ASSETS (LIABILITIES) - (2.1)% |
(9,861,532) |
||
|
NET ASSETS - 100% |
$ 470,962,322 |
||
|
Legend |
|
(a) Non-income producing |
|
(b) Affiliated fund that is generally available only to investment companies and other accounts managed by Fidelity Investments. The rate quoted is the annualized seven-day yield of the fund at period end. A complete unaudited listing of the fund's holdings as of its most recent quarter end is available upon request. In addition, each Fidelity Central Fund's financial statements, which are not covered by the Fund's Report of Independent Registered Public Accounting Firm, are available on the SEC's website or upon request. |
|
(c) Investment made with cash collateral received from securities on loan. |
|
(d) Security or a portion of the security is on loan at period end. |
|
Affiliated Central Funds |
|
Information regarding fiscal year to date income earned by the Fund from investments in Fidelity Central Funds is as follows: |
|
Fund |
Income earned |
|
Fidelity Cash Central Fund |
$ 9,924 |
|
Fidelity Securities Lending Cash Central Fund |
46,240 |
|
Total |
$ 56,164 |
|
Other Information |
|
All investments are categorized as Level 1 under the Fair Value Hierarchy. The inputs or methodology used for valuing securities may not be an indication of the risk associated with investing in those securities. For more information on valuation inputs, please refer to the Investment Valuation section in the accompanying Notes to Financial Statements. |
|
Distribution of investments by country or territory of incorporation, as a percentage of total net assets, is as follows. (Unaudited) |
|
United States of America |
85.4% |
|
Ireland |
5.1% |
|
Canada |
1.7% |
|
Bailiwick of Jersey |
1.6% |
|
Bermuda |
1.5% |
|
Israel |
1.5% |
|
Others (Individually Less Than 1%) |
3.2% |
|
|
100.0% |
See accompanying notes which are an integral part of the financial statements.
Annual Report
IT Services Portfolio
Financial Statements
Statement of Assets and Liabilities
|
|
February 28, 2013 |
|
|
|
|
|
|
Assets |
|
|
|
Investment in securities, at value (including securities loaned of $8,147,070) - See accompanying schedule: Unaffiliated issuers (cost $380,210,751) |
$ 465,902,055 |
|
|
Fidelity Central Funds (cost $14,921,799) |
14,921,799 |
|
|
Total Investments (cost $395,132,550) |
|
$ 480,823,854 |
|
Receivable for investments sold |
|
1,112,814 |
|
Receivable for fund shares sold |
|
2,592,465 |
|
Dividends receivable |
|
227,594 |
|
Distributions receivable from Fidelity Central Funds |
|
3,544 |
|
Prepaid expenses |
|
749 |
|
Receivable from investment adviser for expense reductions |
|
220 |
|
Other receivables |
|
38,301 |
|
Total assets |
|
484,799,541 |
|
|
|
|
|
Liabilities |
|
|
|
Payable for investments purchased |
$ 4,993,575 |
|
|
Payable for fund shares redeemed |
232,986 |
|
|
Accrued management fee |
204,107 |
|
|
Other affiliated payables |
80,830 |
|
|
Other payables and accrued expenses |
43,821 |
|
|
Collateral on securities loaned, at value |
8,281,900 |
|
|
Total liabilities |
|
13,837,219 |
|
|
|
|
|
Net Assets |
|
$ 470,962,322 |
|
Net Assets consist of: |
|
|
|
Paid in capital |
|
$ 385,880,695 |
|
Accumulated net investment loss |
|
(441,491) |
|
Accumulated undistributed net realized gain (loss) on investments and foreign currency transactions |
|
(164,678) |
|
Net unrealized appreciation (depreciation) on investments and assets and liabilities in foreign currencies |
|
85,687,796 |
|
Net Assets, for 17,106,965 shares outstanding |
|
$ 470,962,322 |
|
Net Asset Value, offering price and redemption price per share ($470,962,322 ÷ 17,106,965 shares) |
|
$ 27.53 |
Statement of Operations
|
|
Year ended February 28, 2013 |
|
|
|
|
|
|
Investment Income |
|
|
|
Dividends |
|
$ 2,134,795 |
|
Special dividends |
|
334,298 |
|
Income from Fidelity Central Funds (including $46,240 from security lending) |
|
56,164 |
|
Total income |
|
2,525,257 |
|
|
|
|
|
Expenses |
|
|
|
Management fee |
$ 1,860,257 |
|
|
Transfer agent fees |
744,668 |
|
|
Accounting and security lending fees |
131,339 |
|
|
Custodian fees and expenses |
35,757 |
|
|
Independent trustees' compensation |
2,108 |
|
|
Registration fees |
42,650 |
|
|
Audit |
50,196 |
|
|
Legal |
1,146 |
|
|
Interest |
265 |
|
|
Miscellaneous |
2,337 |
|
|
Total expenses before reductions |
2,870,723 |
|
|
Expense reductions |
(35,583) |
2,835,140 |
|
Net investment income (loss) |
|
(309,883) |
|
Realized and Unrealized Gain (Loss) Net realized gain (loss) on: |
|
|
|
Investment securities: |
|
|
|
Unaffiliated issuers |
2,225,270 |
|
|
Foreign currency transactions |
(33,353) |
|
|
Total net realized gain (loss) |
|
2,191,917 |
|
Change in net unrealized appreciation (depreciation) on: Investment securities (net of increase in deferred foreign taxes of $16,492) |
46,583,297 |
|
|
Assets and liabilities in foreign currencies |
(1,904) |
|
|
Total change in net unrealized appreciation (depreciation) |
|
46,581,393 |
|
Net gain (loss) |
|
48,773,310 |
|
Net increase (decrease) in net assets resulting from operations |
|
$ 48,463,427 |
See accompanying notes which are an integral part of the financial statements.
Annual Report
IT Services Portfolio
Financial Statements - continued
Statement of Changes in Net Assets
|
|
Year ended |
Year ended |
|
Increase (Decrease) in Net Assets |
|
|
|
Operations |
|
|
|
Net investment income (loss) |
$ (309,883) |
$ (449,605) |
|
Net realized gain (loss) |
2,191,917 |
2,836,074 |
|
Change in net unrealized appreciation (depreciation) |
46,581,393 |
11,969,009 |
|
Net increase (decrease) in net assets resulting from operations |
48,463,427 |
14,355,478 |
|
Distributions to shareholders from net realized gain |
(4,164,408) |
(1,972,671) |
|
Share transactions |
265,908,531 |
205,367,309 |
|
Reinvestment of distributions |
4,072,995 |
1,911,677 |
|
Cost of shares redeemed |
(92,447,606) |
(102,517,642) |
|
Net increase (decrease) in net assets resulting from share transactions |
177,533,920 |
104,761,344 |
|
Redemption fees |
5,718 |
7,354 |
|
Total increase (decrease) in net assets |
221,838,657 |
117,151,505 |
|
|
|
|
|
Net Assets |
|
|
|
Beginning of period |
249,123,665 |
131,972,160 |
|
End of period (including accumulated net investment loss of $441,491 and accumulated net investment loss of $147,169, respectively) |
$ 470,962,322 |
$ 249,123,665 |
|
Other Information Shares |
|
|
|
Sold |
10,288,342 |
9,259,270 |
|
Issued in reinvestment of distributions |
165,233 |
83,735 |
|
Redeemed |
(3,828,491) |
(4,775,238) |
|
Net increase (decrease) |
6,625,084 |
4,567,767 |
Financial Highlights
|
Years ended February 28, |
2013 |
2012 G |
2011 |
2010 |
2009 |
|
Selected Per-Share Data |
|
|
|
|
|
|
Net asset value, beginning of period |
$ 23.77 |
$ 22.31 |
$ 17.08 |
$ 10.62 |
$ 14.77 |
|
Income from Investment Operations |
|
|
|
|
|
|
Net investment income (loss) B |
(.02) E |
(.05) |
(.03) |
(.05) |
(.02) |
|
Net realized and unrealized gain (loss) |
4.08 |
1.86 |
5.26 |
6.51 |
(4.14) |
|
Total from investment operations |
4.06 |
1.81 |
5.23 |
6.46 |
(4.16) |
|
Distributions from net realized gain |
(.30) |
(.35) |
- |
- |
- |
|
Redemption fees added to paid in capital B |
- H |
- H |
- H |
- H |
.01 |
|
Net asset value, end of period |
$ 27.53 |
$ 23.77 |
$ 22.31 |
$ 17.08 |
$ 10.62 |
|
Total Return A |
17.22% |
8.18% |
30.62% |
60.83% |
(28.10)% |
|
Ratios to Average Net Assets C, F |
|
|
|
|
|
|
Expenses before reductions |
.86% |
.91% |
.94% |
.99% |
1.00% |
|
Expenses net of fee waivers, if any |
.86% |
.91% |
.94% |
.99% |
1.00% |
|
Expenses net of all reductions |
.85% |
.91% |
.94% |
.99% |
1.00% |
|
Net investment income (loss) |
(.09)% E |
(.24)% |
(.16)% |
(.31)% |
(.14)% |
|
Supplemental Data |
|
|
|
|
|
|
Net assets, end of period (000 omitted) |
$ 470,962 |
$ 249,124 |
$ 131,972 |
$ 96,631 |
$ 48,039 |
|
Portfolio turnover rate D |
107% |
143% |
156% |
131% |
140% |
A Total returns would have been lower if certain expenses had not been reduced during the applicable periods shown.
B Calculated based on average shares outstanding during the period.
C Fees and expenses of any underlying Fidelity Central Funds are not included in the Fund's expense ratio. The Fund indirectly bears its proportionate share of the expenses of any underlying Fidelity Central Funds.
D Amount does not include the portfolio activity of any underlying Fidelity Central Funds.
E Investment income per share reflects a large, non-recurring dividend which amounted to $.02 per share. Excluding this non-recurring dividend, the ratio of net investment income (loss) to average net assets would have been (.19)%.
F Expense ratios reflect operating expenses of the Fund. Expenses before reductions do not reflect amounts reimbursed by the investment adviser or reductions from brokerage service arrangements or reductions from other expense offset arrangements and do not represent the amount paid by the Fund during periods when reimbursements or reductions occur. Expenses net of fee waivers reflect expenses after reimbursement by the investment adviser but prior to reductions from brokerage service arrangements or other expense offset arrangements. Expenses net of all reductions represent the net expenses paid by the Fund.
G For the year ended February 29.
H Amount represents less than $.01 per share.
See accompanying notes which are an integral part of the financial statements.
Annual Report
Software and Computer Services Portfolio
Performance: The Bottom Line
Average annual total return reflects the change in the value of an investment, assuming reinvestment of the fund's distributions from dividend income and capital gains (the profits earned upon the sale of securities that have grown in value, if any) and assuming a constant rate of performance each year. The $10,000 table and the fund's returns do not reflect the deduction of taxes that a shareholder would pay on fund distributions or the redemption of fund shares. During periods of reimbursement by Fidelity, a fund's total return will be greater than it would be had the reimbursement not occurred. How a fund did yesterday is no guarantee of how it will do tomorrow.
Average Annual Total Returns
|
Periods ended February 28, 2013 |
Past 1 |
Past 5 |
Past 10 |
|
Software and Computer Services Portfolio |
8.85% |
11.76% |
12.73% |
$10,000 Over 10 Years
Let's say hypothetically that $10,000 was invested in Software and Computer Services Portfolio on February 28, 2003. The chart shows how the value of your investment would have changed, and also shows how the S&P 500 Index performed over the same period.
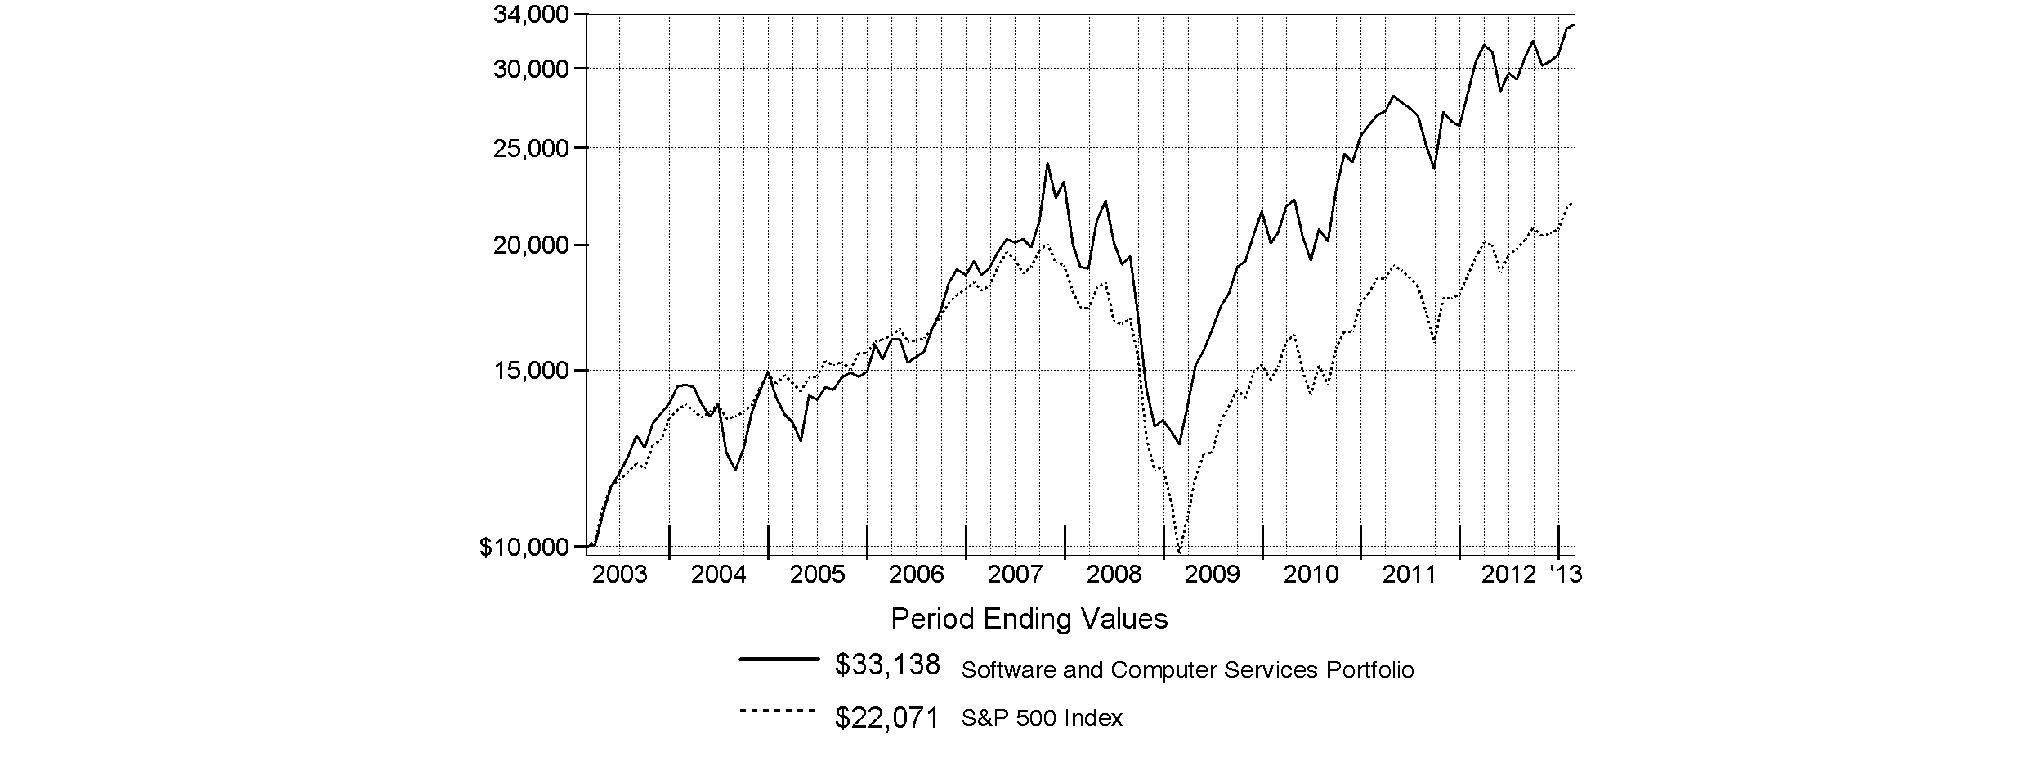
Annual Report
Software and Computer Services Portfolio
Management's Discussion of Fund Performance
Market Recap: U.S. stocks posted solid gains for the year ending February 28, 2013, sparked by a late-period rally that pushed major equity benchmarks to multiyear highs. Improvement in the global economy and more monetary stimulus from the U.S. Federal Reserve kept markets on the upswing for much of the year, shrugging off an early decline brought on by debt woes in Europe, and another dip later in the period amid Congressional gridlock on the federal budget. Renewed optimism over employment, the housing market, corporate earnings and record dividends made stocks a favorite with investors during the 12 months, which helped push the broad-based S&P 500® Index across the milestone 1,500 mark at the end of January. The S&P 500® finished the period up 13.46%. Seven of the 10 major market sectors tracked by MSCI U.S. IMI 25-50 classifications produced double-digit gains, led by health care and financials, while information technology, energy and materials trailed the broad equity market with only modest advances.
Comments from Brian Lempel, Portfolio Manager of Software and Computer Services Portfolio: For the year, the fund rose 8.85%, underperforming both the 12.48% increase of its industry benchmark, the MSCI® U.S. IMI Software & Services 25-50 Index, and the broad-based S&P 500® Index. Despite a bumpy ride resulting from numerous macroeconomic concerns, investors' confidence improved and software/computer services stocks benefited from a spirited rally in the back half of the period. Turning to the fund's performance versus the MSCI index, stock selection, particularly in the Internet software/services and communications equipment groups, was the most significant detractor. On an individual basis, the most notable detractor was a stake in Active Network, which provides organization-based cloud-computing services that include online event registrations. Even though the company struggled after a recent acquisition, I believed the stock was priced well and tripled the fund's stake here. Polycom, a provider of unified communication in video, was another detractor. The stock stumbled recently due to the company's somewhat volatile transition to a software-as-a-service (SaaS) business-model. I sold the fund's position by period end. KIT digital, a platform provider for Internet-protocol-based videos, also dragged on performance, as its stock fell amid accounting issues. Shares of Callidus Software, which provides cloud-based sales service solutions, never recovered from a precipitous drop in May. The decline was prompted by weak financial results, as well as the company's difficulties in working through a business-model transition to SaaS. Positions in Internet media company Bazaarvoice and Responsys, which provides on-demand software for marketing campaigns, also hurt. Each of the companies I've named here were not a part of the MSCI index. On the plus side, stock selection in systems software and IT consulting/other services was most beneficial. Comverse Technology, which provides software-based products, was the fund's top individual contributor on a relative basis. I added to the fund's position through October, when its subsidiary Comverse announced a spin off and share distribution, which boosted Comverse Technology's stock's price. To take profits, I began selling our holdings until February, when Comverse Technology was acquired by analytic software firm Verint Systems. At period end, the fund held stakes in both Comverse and Verint. Also adding to relative performance was timely positioning in Electronic Arts, which rose during the second half in anticipation of its new video games' release. Timely ownership of Apple also provided a boost. I eliminated this sizable position by period end. Lastly, underweighting IBM and Microsoft were particularly helpful.
The views expressed above reflect those of the portfolio manager(s) only through the end of the period as stated on the cover of this report and do not necessarily represent the views of Fidelity or any other person in the Fidelity organization. Any such views are subject to change at any time based upon market or other conditions and Fidelity disclaims any responsibility to update such views. These views may not be relied on as investment advice and, because investment decisions for a Fidelity fund are based on numerous factors, may not be relied on as an indication of trading intent on behalf of any Fidelity fund.
Annual Report
Software and Computer Services Portfolio
Investment Changes (Unaudited)
|
Top Ten Stocks as of February 28, 2013 |
||
|
|
% of fund's |
% of fund's net assets |
|
Google, Inc. Class A |
11.5 |
10.8 |
|
Microsoft Corp. |
8.8 |
13.9 |
|
Oracle Corp. |
7.2 |
6.8 |
|
IBM Corp. |
5.2 |
5.8 |
|
eBay, Inc. |
5.0 |
3.4 |
|
Visa, Inc. Class A |
3.8 |
3.0 |
|
MasterCard, Inc. Class A |
3.1 |
1.2 |
|
salesforce.com, Inc. |
3.0 |
2.7 |
|
Electronic Arts, Inc. |
2.6 |
0.1 |
|
EPAM Systems, Inc. |
2.2 |
0.8 |
|
|
52.4 |
|
|
Top Industries (% of fund's net assets) |
|||
|
As of February 28, 2013 |
|||
|
Software |
44.2% |
|
|
Internet Software & Services |
26.0% |
|
|
IT Services |
23.6% |
|
|
Media |
1.6% |
|
|
Electronic Equipment & Components |
1.3% |
|
|
All Others* |
3.3% |
|

|
As of August 31, 2012 |
|||
|
Software |
45.4% |
|
|
Internet Software & Services |
21.5% |
|
|
IT Services |
19.3% |
|
|
Computers & Peripherals |
3.6% |
|
|
Communications Equipment |
1.9% |
|
|
All Others* |
8.3% |
|

|
* Includes short-term investments and net other assets. |
Annual Report
Software and Computer Services Portfolio
Investments February 28, 2013
Showing Percentage of Net Assets
|
Common Stocks - 98.5% |
|||
|
Shares |
Value |
||
|
CAPITAL MARKETS - 0.2% |
|||
|
Asset Management & Custody Banks - 0.2% |
|||
|
ICG Group, Inc. (a) |
367,789 |
$ 4,792,291 |
|
|
COMMUNICATIONS EQUIPMENT - 0.3% |
|||
|
Communications Equipment - 0.3% |
|||
|
Infinera Corp. (a) |
400,000 |
2,596,000 |
|
|
Palo Alto Networks, Inc. (d) |
50,000 |
3,056,500 |
|
|
|
5,652,500 |
||
|
COMPUTERS & PERIPHERALS - 0.2% |
|||
|
Computer Hardware - 0.0% |
|||
|
Cray, Inc. (a) |
7 |
135 |
|
|
Computer Storage & Peripherals - 0.2% |
|||
|
Electronics for Imaging, Inc. (a) |
198,620 |
4,580,177 |
|
|
TOTAL COMPUTERS & PERIPHERALS |
4,580,312 |
||
|
DIVERSIFIED TELECOMMUNICATION SERVICES - 1.1% |
|||
|
Alternative Carriers - 1.1% |
|||
|
inContact, Inc. (a)(e) |
3,337,956 |
22,664,721 |
|
|
ELECTRONIC EQUIPMENT & COMPONENTS - 1.3% |
|||
|
Electronic Manufacturing Services - 1.3% |
|||
|
Fabrinet (a) |
211,234 |
3,466,350 |
|
|
Flextronics International Ltd. (a) |
1,616,800 |
10,751,720 |
|
|
Jabil Circuit, Inc. |
450,000 |
8,428,500 |
|
|
TE Connectivity Ltd. |
100,000 |
4,013,000 |
|
|
|
26,659,570 |
||
|
INTERNET SOFTWARE & SERVICES - 26.0% |
|||
|
Internet Software & Services - 26.0% |
|||
|
Active Network, Inc. (a)(e) |
5,913,533 |
27,734,470 |
|
|
Bazaarvoice, Inc. (d) |
1,021,900 |
7,153,300 |
|
|
Demandware, Inc. |
150,000 |
3,967,500 |
|
|
eBay, Inc. (a) |
1,837,400 |
100,469,032 |
|
|
Equinix, Inc. (a) |
74,300 |
15,718,165 |
|
|
ExactTarget, Inc. |
183,500 |
4,092,050 |
|
|
Facebook, Inc. Class A |
666,100 |
18,151,225 |
|
|
Google, Inc. Class A (a) |
290,900 |
233,069,082 |
|
|
IAC/InterActiveCorp |
121,400 |
4,947,050 |
|
|
KIT digital, Inc. (a) |
1,177,816 |
424,014 |
|
|
LogMeIn, Inc. (a) |
40,000 |
714,400 |
|
|
MercadoLibre, Inc. (d) |
40,800 |
3,492,888 |
|
|
Rackspace Hosting, Inc. (a) |
132,400 |
7,395,864 |
|
|
Responsys, Inc. (a) |
2,051,796 |
16,557,994 |
|
|
SciQuest, Inc. (a) |
952,100 |
18,232,715 |
|
|
SPS Commerce, Inc. (a) |
36 |
1,346 |
|
|
Velti PLC (a)(d) |
579,600 |
2,132,928 |
|
|
Web.com Group, Inc. (a) |
2,077,801 |
35,488,841 |
|
|
Yahoo!, Inc. (a) |
1,259,200 |
26,833,552 |
|
|
|
526,576,416 |
||
|
|
|||
|
Shares |
Value |
||
|
IT SERVICES - 23.6% |
|||
|
Data Processing & Outsourced Services - 11.3% |
|||
|
Fidelity National Information Services, Inc. |
888,200 |
$ 33,440,730 |
|
|
Fiserv, Inc. (a) |
175,000 |
14,369,250 |
|
|
FleetCor Technologies, Inc. (a) |
80,000 |
5,584,800 |
|
|
Genpact Ltd. |
170,000 |
2,993,700 |
|
|
Global Payments, Inc. |
283,000 |
13,643,430 |
|
|
MasterCard, Inc. Class A |
123,100 |
63,743,642 |
|
|
Total System Services, Inc. |
130,100 |
3,091,176 |
|
|
Visa, Inc. Class A |
486,100 |
77,114,904 |
|
|
WNS Holdings Ltd. sponsored ADR (a) |
1,033,473 |
14,530,630 |
|
|
|
228,512,262 |
||
|
IT Consulting & Other Services - 12.3% |
|||
|
Accenture PLC Class A |
217,200 |
16,150,992 |
|
|
Amdocs Ltd. |
474,300 |
17,297,721 |
|
|
Camelot Information Systems, Inc. ADR (a)(e) |
2,301,356 |
3,705,183 |
|
|
Cognizant Technology Solutions Corp. Class A (a) |
244,000 |
18,731,880 |
|
|
EPAM Systems, Inc. |
2,102,986 |
44,120,646 |
|
|
HCL Technologies Ltd. |
1 |
13 |
|
|
IBM Corp. |
521,189 |
104,670,387 |
|
|
Lionbridge Technologies, Inc. (a)(e) |
6,154,175 |
23,508,949 |
|
|
Teradata Corp. (a) |
50,200 |
2,914,612 |
|
|
Unisys Corp. (a) |
278,100 |
6,390,738 |
|
|
Virtusa Corp. (a) |
627,996 |
13,156,516 |
|
|
|
250,647,637 |
||
|
TOTAL IT SERVICES |
479,159,899 |
||
|
MEDIA - 1.6% |
|||
|
Advertising - 1.6% |
|||
|
MDC Partners, Inc. Class A (sub. vtg.) (e) |
2,274,308 |
31,271,740 |
|
|
SOFTWARE - 44.2% |
|||
|
Application Software - 21.5% |
|||
|
Actuate Corp. (a) |
245,000 |
1,472,450 |
|
|
Adobe Systems, Inc. (a) |
853,700 |
33,550,410 |
|
|
AsiaInfo-Linkage, Inc. (a) |
885,200 |
9,763,756 |
|
|
Aspen Technology, Inc. (a) |
162,215 |
4,989,733 |
|
|
Autodesk, Inc. (a) |
457,800 |
16,810,416 |
|
|
BroadSoft, Inc. (a) |
122,800 |
2,578,800 |
|
|
Callidus Software, Inc. (a)(d)(e) |
2,375,667 |
10,334,151 |
|
|
Citrix Systems, Inc. (a) |
393,000 |
27,863,700 |
|
|
Compuware Corp. (a) |
3,446,800 |
40,017,348 |
|
|
Comverse, Inc. (e) |
1,333,200 |
36,689,664 |
|
|
Concur Technologies, Inc. (a)(d) |
210,200 |
14,756,040 |
|
|
Descartes Systems Group, Inc. (a) |
1,429,500 |
13,030,109 |
|
|
Guidewire Software, Inc. (a) |
438,181 |
16,015,516 |
|
|
Informatica Corp. (a) |
182,700 |
6,396,327 |
|
|
Jive Software, Inc. (a)(d) |
634,400 |
10,518,352 |
|
|
Kingdee International Software Group Co. Ltd. (a) |
13,170,000 |
2,326,435 |
|
|
Common Stocks - continued |
|||
|
Shares |
Value |
||
|
SOFTWARE - CONTINUED |
|||
|
Application Software - continued |
|||
|
Mentor Graphics Corp. |
360,000 |
$ 6,375,600 |
|
|
Nuance Communications, Inc. (a) |
1,277,500 |
23,518,775 |
|
|
Parametric Technology Corp. (a) |
502,900 |
11,637,106 |
|
|
Pegasystems, Inc. |
24,100 |
660,099 |
|
|
QLIK Technologies, Inc. (a) |
512,800 |
13,332,800 |
|
|
salesforce.com, Inc. (a) |
360,578 |
61,017,009 |
|
|
SolarWinds, Inc. (a) |
153,500 |
8,666,610 |
|
|
Synchronoss Technologies, Inc. (a) |
62,932 |
1,898,658 |
|
|
Synopsys, Inc. (a) |
314,410 |
11,013,782 |
|
|
TIBCO Software, Inc. (a) |
576,100 |
12,357,345 |
|
|
TiVo, Inc. (a) |
267,100 |
3,309,369 |
|
|
Ultimate Software Group, Inc. (a) |
55,000 |
5,404,850 |
|
|
Verint Systems, Inc. (a) |
836,035 |
28,567,316 |
|
|
Workday, Inc. |
19,900 |
1,100,271 |
|
|
|
435,972,797 |
||
|
Home Entertainment Software - 3.3% |
|||
|
Activision Blizzard, Inc. |
745,900 |
10,666,370 |
|
|
Electronic Arts, Inc. (a) |
3,010,000 |
52,765,300 |
|
|
Take-Two Interactive Software, Inc. (a) |
131,500 |
1,925,160 |
|
|
|
65,356,830 |
||
|
Systems Software - 19.4% |
|||
|
CA Technologies, Inc. |
267,100 |
6,541,279 |
|
|
Fortinet, Inc. (a) |
116,300 |
2,812,134 |
|
|
Microsoft Corp. |
6,391,100 |
177,672,580 |
|
|
NetSuite, Inc. (a) |
17,600 |
1,228,304 |
|
|
Oracle Corp. |
4,267,700 |
146,211,402 |
|
|
Qualys, Inc. |
626,800 |
7,433,848 |
|
|
Red Hat, Inc. (a) |
214,500 |
10,898,745 |
|
|
Rovi Corp. (a) |
150,000 |
2,668,500 |
|
|
ServiceNow, Inc. |
33,800 |
1,097,486 |
|
|
|
|||
|
Shares |
Value |
||
|
Symantec Corp. (a) |
931,800 |
$ 21,841,392 |
|
|
VMware, Inc. Class A (a) |
214,600 |
15,414,718 |
|
|
|
393,820,388 |
||
|
TOTAL SOFTWARE |
895,150,015 |
||
|
TOTAL COMMON STOCKS (Cost $1,671,478,638) |
|
||
|
Money Market Funds - 2.6% |
|||
|
|
|
|
|
|
Fidelity Cash Central Fund, 0.16% (b) |
27,922,312 |
27,922,312 |
|
|
Fidelity Securities Lending Cash Central Fund, 0.16% (b)(c) |
25,720,114 |
25,720,114 |
|
|
TOTAL MONEY MARKET FUNDS (Cost $53,642,426) |
|
||
|
TOTAL INVESTMENT PORTFOLIO - 101.1% (Cost $1,725,121,064) |
2,050,149,890 |
|
NET OTHER ASSETS (LIABILITIES) - (1.1)% |
(22,418,917) |
||
|
NET ASSETS - 100% |
$ 2,027,730,973 |
||
|
Legend |
|
(a) Non-income producing |
|
(b) Affiliated fund that is generally available only to investment companies and other accounts managed by Fidelity Investments. The rate quoted is the annualized seven-day yield of the fund at period end. A complete unaudited listing of the fund's holdings as of its most recent quarter end is available upon request. In addition, each Fidelity Central Fund's financial statements, which are not covered by the Fund's Report of Independent Registered Public Accounting Firm, are available on the SEC's website or upon request. |
|
(c) Investment made with cash collateral received from securities on loan. |
|
(d) Security or a portion of the security is on loan at period end. |
|
(e) Affiliated company |
|
Affiliated Central Funds |
|
Information regarding fiscal year to date income earned by the Fund from investments in Fidelity Central Funds is as follows: |
|
Fund |
Income earned |
|
Fidelity Cash Central Fund |
$ 55,861 |
|
Fidelity Securities Lending Cash Central Fund |
1,756,486 |
|
Total |
$ 1,812,347 |
|
Other Affiliated Issuers |
|
An affiliated company is a company in which the Fund has ownership of at least 5% of the voting securities. Fiscal year to date transactions with companies which are or were affiliates are as follows: |
|
Affiliate |
Value, |
Purchases |
Sales |
Dividend |
Value, |
|
Active Network, Inc. |
$ 31,326,256 |
$ 41,793,081 |
$ 698,098 |
$ - |
$ 27,734,470 |
|
Callidus Software, Inc. |
16,897,742 |
406,500 |
- |
- |
10,334,151 |
|
Camelot Information Systems, Inc. ADR |
4,176,153 |
1,935,729 |
827,853 |
- |
3,705,183 |
|
Comverse Technology, Inc. |
8,625,912 |
72,631,518 |
60,561,873 |
- |
- |
|
Comverse, Inc. |
- |
40,736,445 |
2,202,975 |
- |
36,689,664 |
|
inContact, Inc. |
14,738,399 |
2,856,003 |
- |
- |
22,664,721 |
|
Lionbridge Technologies, Inc. |
13,016,304 |
3,256,430 |
- |
- |
23,508,949 |
|
MDC Partners, Inc. Class A (sub. vtg.) |
16,274,035 |
10,753,253 |
- |
932,540 |
31,271,740 |
|
Total |
$ 105,054,801 |
$ 174,368,959 |
$ 64,290,799 |
$ 932,540 |
$ 155,908,878 |
|
Other Information |
|
All investments are categorized as Level 1 under the Fair Value Hierarchy. The inputs or methodology used for valuing securities may not be an indication of the risk associated with investing in those securities. For more information on valuation inputs, please refer to the Investment Valuation section in the accompanying Notes to Financial Statements. |
See accompanying notes which are an integral part of the financial statements.
Annual Report
Software and Computer Services Portfolio
Financial Statements
Statement of Assets and Liabilities
|
|
February 28, 2013 |
|
|
|
|
|
|
Assets |
|
|
|
Investment in securities, at value (including securities loaned of $25,306,116) - See accompanying schedule: Unaffiliated issuers (cost $1,498,909,244) |
$ 1,840,598,586 |
|
|
Fidelity Central Funds (cost $53,642,426) |
53,642,426 |
|
|
Other affiliated issuers (cost $172,569,394) |
155,908,878 |
|
|
Total Investments (cost $1,725,121,064) |
|
$ 2,050,149,890 |
|
Cash |
|
53,326 |
|
Receivable for investments sold |
|
7,710,279 |
|
Receivable for fund shares sold |
|
1,804,989 |
|
Dividends receivable |
|
2,226,288 |
|
Distributions receivable from Fidelity Central Funds |
|
18,910 |
|
Prepaid expenses |
|
4,072 |
|
Receivable from investment adviser for expense reductions |
|
944 |
|
Other receivables |
|
225,384 |
|
Total assets |
|
2,062,194,082 |
|
|
|
|
|
Liabilities |
|
|
|
Payable for investments purchased |
$ 4,868,621 |
|
|
Payable for fund shares redeemed |
2,489,293 |
|
|
Accrued management fee |
935,221 |
|
|
Other affiliated payables |
383,107 |
|
|
Other payables and accrued expenses |
66,753 |
|
|
Collateral on securities loaned, at value |
25,720,114 |
|
|
Total liabilities |
|
34,463,109 |
|
|
|
|
|
Net Assets |
|
$ 2,027,730,973 |
|
Net Assets consist of: |
|
|
|
Paid in capital |
|
$ 1,729,247,604 |
|
Accumulated net investment loss |
|
(16,192,390) |
|
Accumulated undistributed net realized gain (loss) on investments and foreign currency transactions |
|
(10,303,552) |
|
Net unrealized appreciation (depreciation) on investments and assets and liabilities in foreign currencies |
|
324,979,311 |
|
Net Assets, for 23,051,066 shares outstanding |
|
$ 2,027,730,973 |
|
Net Asset Value, offering price and redemption price per share ($2,027,730,973 ÷ 23,051,066 shares) |
|
$ 87.97 |
Statement of Operations
|
|
Year ended February 28, 2013 |
|
|
|
|
|
|
Investment Income |
|
|
|
Dividends (including $932,540 earned from other affiliated issuers) |
|
$ 13,791,324 |
|
Interest |
|
79 |
|
Income from Fidelity Central Funds (including $1,756,486 from security lending) |
|
1,812,347 |
|
Total income |
|
15,603,750 |
|
|
|
|
|
Expenses |
|
|
|
Management fee |
$ 10,270,859 |
|
|
Transfer agent fees |
3,889,732 |
|
|
Accounting and security lending fees |
570,228 |
|
|
Custodian fees and expenses |
91,095 |
|
|
Independent trustees' compensation |
12,033 |
|
|
Registration fees |
134,686 |
|
|
Audit |
47,362 |
|
|
Legal |
7,798 |
|
|
Interest |
3,563 |
|
|
Miscellaneous |
14,939 |
|
|
Total expenses before reductions |
15,042,295 |
|
|
Expense reductions |
(257,841) |
14,784,454 |
|
Net investment income (loss) |
|
819,296 |
|
Realized and Unrealized Gain (Loss) Net realized gain (loss) on: |
|
|
|
Investment securities: |
|
|
|
Unaffiliated issuers |
73,825,250 |
|
|
Other affiliated issuers |
13,190,397 |
|
|
Foreign currency transactions |
(64,001) |
|
|
Total net realized gain (loss) |
|
86,951,646 |
|
Change in net unrealized appreciation (depreciation) on: Investment securities |
70,730,892 |
|
|
Assets and liabilities in foreign currencies |
33,978 |
|
|
Total change in net unrealized appreciation (depreciation) |
|
70,764,870 |
|
Net gain (loss) |
|
157,716,516 |
|
Net increase (decrease) in net assets resulting from operations |
|
$ 158,535,812 |
See accompanying notes which are an integral part of the financial statements.
Annual Report
Statement of Changes in Net Assets
|
|
Year ended |
Year ended |
|
Increase (Decrease) in Net Assets |
|
|
|
Operations |
|
|
|
Net investment income (loss) |
$ 819,296 |
$ (935,778) |
|
Net realized gain (loss) |
86,951,646 |
205,635,526 |
|
Change in net unrealized appreciation (depreciation) |
70,764,870 |
(18,881,690) |
|
Net increase (decrease) in net assets resulting from operations |
158,535,812 |
185,818,058 |
|
Distributions to shareholders from net investment income |
(16,945,649) |
- |
|
Distributions to shareholders from net realized gain |
(174,938,304) |
(181,184,664) |
|
Total distributions |
(191,883,953) |
(181,184,664) |
|
Share transactions |
745,604,994 |
585,190,987 |
|
Reinvestment of distributions |
185,033,890 |
174,047,914 |
|
Cost of shares redeemed |
(491,235,474) |
(441,554,331) |
|
Net increase (decrease) in net assets resulting from share transactions |
439,403,410 |
317,684,570 |
|
Redemption fees |
60,186 |
44,203 |
|
Total increase (decrease) in net assets |
406,115,455 |
322,362,167 |
|
|
|
|
|
Net Assets |
|
|
|
Beginning of period |
1,621,615,518 |
1,299,253,351 |
|
End of period (including accumulated net investment loss of $16,192,390 and accumulated net investment loss of $421, respectively) |
$ 2,027,730,973 |
$ 1,621,615,518 |
|
Other Information Shares |
|
|
|
Sold |
8,589,526 |
6,956,029 |
|
Issued in reinvestment of distributions |
2,198,587 |
2,132,816 |
|
Redeemed |
(5,763,915) |
(5,241,268) |
|
Net increase (decrease) |
5,024,198 |
3,847,577 |
Financial Highlights
|
Years ended February 28, |
2013 |
2012 F |
2011 |
2010 |
2009 |
|
Selected Per-Share Data |
|
|
|
|
|
|
Net asset value, beginning of period |
$ 89.96 |
$ 91.63 |
$ 72.29 |
$ 44.38 |
$ 66.77 |
|
Income from Investment Operations |
|
|
|
|
|
|
Net investment income (loss) B |
.04 |
(.06) |
(.11) |
(.04) |
(.07) |
|
Net realized and unrealized gain (loss) |
7.25 |
10.39 |
22.28 |
27.95 |
(22.32) |
|
Total from investment operations |
7.29 |
10.33 |
22.17 |
27.91 |
(22.39) |
|
Distributions from net investment income |
(.78) H |
- |
- |
- |
- |
|
Distributions from net realized gain |
(8.50) H |
(12.00) |
(2.83) |
- |
- |
|
Total distributions |
(9.28) |
(12.00) |
(2.83) |
- |
- |
|
Redemption fees added to paid in capital B, G |
- |
- |
- |
- |
- |
|
Net asset value, end of period |
$ 87.97 |
$ 89.96 |
$ 91.63 |
$ 72.29 |
$ 44.38 |
|
Total Return A |
8.85% |
13.08% |
30.85% |
62.89% |
(33.53)% |
|
Ratios to Average Net Assets C, E |
|
|
|
|
|
|
Expenses before reductions |
.82% |
.82% |
.84% |
.90% |
.87% |
|
Expenses net of fee waivers, if any |
.82% |
.82% |
.84% |
.90% |
.87% |
|
Expenses net of all reductions |
.80% |
.81% |
.83% |
.89% |
.87% |
|
Net investment income (loss) |
.04% |
(.07)% |
(.13)% |
(.07)% |
(.12)% |
|
Supplemental Data |
|
|
|
|
|
|
Net assets, end of period (000 omitted) |
$ 2,027,731 |
$ 1,621,616 |
$ 1,299,253 |
$ 984,803 |
$ 488,980 |
|
Portfolio turnover rate D |
96% |
238% |
189% |
56% |
49% |
A Total returns would have been lower if certain expenses had not been reduced during the applicable periods shown.
B Calculated based on average shares outstanding during the period.
C Fees and expenses of any underlying Fidelity Central Funds are not included in the Fund's expense ratio. The Fund indirectly bears its proportionate share of the expenses of any underlying Fidelity Central Funds.
D Amount does not include the portfolio activity of any underlying Fidelity Central Funds.
E Expense ratios reflect operating expenses of the Fund. Expenses before reductions do not reflect amounts reimbursed by the investment adviser or reductions from brokerage service arrangements or reductions from other expense offset arrangements and do not represent the amount paid by the Fund during periods when reimbursements or reductions occur. Expenses net of fee waivers reflect expenses after reimbursement by the investment adviser but prior to reductions from brokerage service arrangements or other expense offset arrangements. Expenses net of all reductions represent the net expenses paid by the Fund.
F For the year ended February 29.
G Amount represents less than $.01 per share.
H The amount shown reflects certain reclassifications related to book to tax differences.
See accompanying notes which are an integral part of the financial statements.
Annual Report
Technology Portfolio
Performance: The Bottom Line
Average annual total return reflects the change in the value of an investment, assuming reinvestment of the fund's distributions from dividend income and capital gains (the profits earned upon the sale of securities that have grown in value, if any) and assuming a constant rate of performance each year. The $10,000 table and the fund's returns do not reflect the deduction of taxes that a shareholder would pay on fund distributions or the redemption of fund shares. During periods of reimbursement by Fidelity, a fund's total return will be greater than it would be had the reimbursement not occurred. How a fund did yesterday is no guarantee of how it will do tomorrow.
Average Annual Total Returns
|
Periods ended February 28, 2013 |
Past 1 |
Past 5 |
Past 10 |
|
Technology Portfolio |
2.50% |
9.39% |
10.54% |
$10,000 Over 10 Years
Let's say hypothetically that $10,000 was invested in Technology Portfolio on February 28, 2003. The chart shows how the value of your investment would have changed, and also shows how the S&P 500 Index performed over the same period.
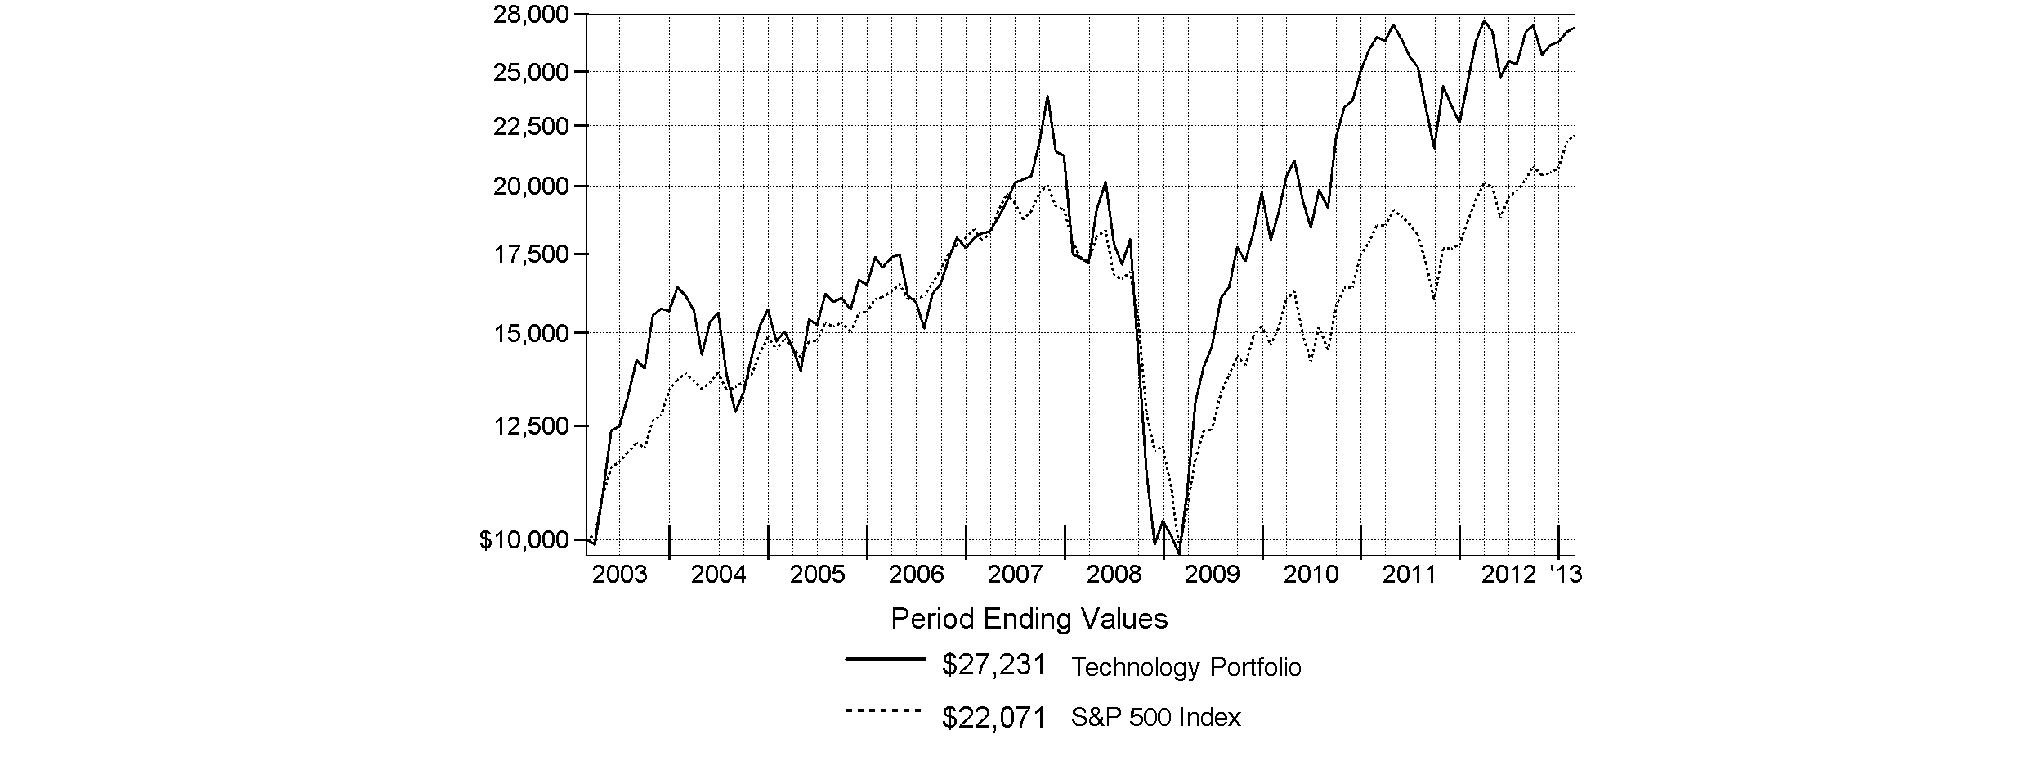
Annual Report
Technology Portfolio
Management's Discussion of Fund Performance
Market Recap: U.S. stocks posted solid gains for the year ending February 28, 2013, sparked by a late-period rally that pushed major equity benchmarks to multiyear highs. Improvement in the global economy and more monetary stimulus from the U.S. Federal Reserve kept markets on the upswing for much of the year, shrugging off an early decline brought on by debt woes in Europe, and another dip later in the period amid Congressional gridlock on the federal budget. Renewed optimism over employment, the housing market, corporate earnings and record dividends made stocks a favorite with investors during the 12 months, which helped push the broad-based S&P 500® Index across the milestone 1,500 mark at the end of January. The S&P 500® finished the period up 13.46%. Seven of the 10 major market sectors tracked by MSCI U.S. IMI 25-50 classifications produced double-digit gains, led by health care and financials, while information technology, energy and materials trailed the broad equity market with only modest advances.
Comments from Charlie Chai, Portfolio Manager of Technology Portfolio: For the year, the fund returned 2.50%, topping the 1.67% gain of the MSCI® U.S. IMI Information Technology 25-50 Index but considerably lagging the S&P 500®. Versus the broader market, technology stocks experienced weakness across many industry groups, especially computer hardware, which reflected lackluster personal computer demand. Compared with its sector index, the fund was aided the most by stock selection in semiconductors and computer hardware. Within both groups, my strategy was to focus on companies serving growing markets, such as smartphones and tablet devices, and to underweight or avoid stocks whose main driver was PCs or other legacy markets suffering from tepid demand. Noteworthy contributors to relative performance included weak-performing PC chipmaker and benchmark component Intel, which the fund didn't own. Underweighting two other weak performers in the index, PC software provider Microsoft and consumer electronics maker Apple, also helped. I significantly reduced the fund's position in Apple and sold Microsoft during the period. Among stocks I overweighted, the fund was lifted by its position in Cree, a manufacturer of semiconductors used in light-emitting diode (LED) products. Some exciting new products and an improving supply/demand picture helped this stock post a healthy double-digit gain during the period, and I significantly reduced this position to nail down profits. Conversely, my stock selection and a large underweighting in IT consulting/other services dampened the fund's performance, as the defensive stocks in this group - where the fund was underweighted - were some of the better performers during the period. Within this group, a sizable overweighting in ServiceSource International worked against us. The company, which uses cloud computing to manage the contract-renewal process for corporate clients, saw its stock falter at the beginning of August after issuing disappointing third-quarter financial guidance, and I significantly reduced this position. A similar fate befell VMware, a provider of hardware and software enabling corporate clients to operate virtual, cloud-based servers and related applications. This stock suffered a sharp drop in late January, after the company unveiled a disappointing outlook for 2013 and announced plans to cut 900 jobs. In this case, I thought the market might be overreacting and increased the fund's position. Underweighted exposure to enterprise software provider Oracle also hurt, and I considerably narrowed this underweighting during the period.
The views expressed above reflect those of the portfolio manager(s) only through the end of the period as stated on the cover of this report and do not necessarily represent the views of Fidelity or any other person in the Fidelity organization. Any such views are subject to change at any time based upon market or other conditions and Fidelity disclaims any responsibility to update such views. These views may not be relied on as investment advice and, because investment decisions for a Fidelity fund are based on numerous factors, may not be relied on as an indication of trading intent on behalf of any Fidelity fund.
Annual Report
Technology Portfolio
Investment Changes (Unaudited)
|
Top Ten Stocks as of February 28, 2013 |
||
|
|
% of fund's |
% of fund's net assets |
|
Google, Inc. Class A |
9.3 |
6.4 |
|
Apple, Inc. |
8.9 |
21.5 |
|
salesforce.com, Inc. |
3.7 |
2.6 |
|
Oracle Corp. |
3.7 |
1.6 |
|
eBay, Inc. |
3.1 |
2.2 |
|
MasterCard, Inc. Class A |
2.6 |
0.2 |
|
Visa, Inc. Class A |
2.5 |
3.6 |
|
Altera Corp. |
2.0 |
1.8 |
|
Juniper Networks, Inc. |
1.6 |
0.1 |
|
F5 Networks, Inc. |
1.5 |
0.1 |
|
|
38.9 |
|
|
Top Industries (% of fund's net assets) |
|||
|
As of February 28, 2013 |
|||
|
Software |
21.8% |
|
|
Internet Software & Services |
18.8% |
|
|
Semiconductors & Semiconductor Equipment |
14.2% |
|
|
Computers & Peripherals |
13.3% |
|
|
Communications Equipment |
10.1% |
|
|
All Others* |
21.8% |
|

|
As of August 31, 2012 |
|||
|
Computers & Peripherals |
24.4% |
|
|
Software |
17.5% |
|
|
Semiconductors & Semiconductor Equipment |
16.0% |
|
|
Internet Software & Services |
11.3% |
|
|
IT Services |
8.1% |
|
|
All Others* |
22.7% |
|

|
* Includes short-term investments and net other assets. |
Annual Report
Technology Portfolio
Investments February 28, 2013
Showing Percentage of Net Assets
|
Common Stocks - 98.2% |
|||
|
Shares |
Value |
||
|
AEROSPACE & DEFENSE - 0.0% |
|||
|
Aerospace & Defense - 0.0% |
|||
|
DigitalGlobe, Inc. (a) |
797 |
$ 20,786 |
|
|
AUTOMOBILES - 0.1% |
|||
|
Automobile Manufacturers - 0.1% |
|||
|
Tesla Motors, Inc. (a) |
40,095 |
1,396,509 |
|
|
CHEMICALS - 0.5% |
|||
|
Specialty Chemicals - 0.5% |
|||
|
JSR Corp. |
368,200 |
7,507,800 |
|
|
Nitto Denko Corp. |
39,600 |
2,328,406 |
|
|
|
9,836,206 |
||
|
COMMERCIAL SERVICES & SUPPLIES - 0.3% |
|||
|
Commercial Printing - 0.3% |
|||
|
Nissha Printing Co. Ltd. (a)(d) |
352,800 |
6,554,338 |
|
|
COMMUNICATIONS EQUIPMENT - 10.1% |
|||
|
Communications Equipment - 10.1% |
|||
|
AAC Acoustic Technology Holdings, Inc. |
501,000 |
2,128,520 |
|
|
Acme Packet, Inc. (a) |
566,731 |
16,537,211 |
|
|
ADTRAN, Inc. |
263,081 |
5,877,230 |
|
|
ADVA AG Optical Networking (a) |
146,464 |
819,935 |
|
|
Alcatel-Lucent SA sponsored ADR (a) |
13,531 |
18,537 |
|
|
Aruba Networks, Inc. (a) |
322,705 |
8,041,809 |
|
|
Brocade Communications Systems, Inc. (a) |
187,810 |
1,053,614 |
|
|
Ciena Corp. (a) |
527,488 |
8,038,917 |
|
|
Cisco Systems, Inc. |
931,585 |
19,423,547 |
|
|
Comba Telecom Systems Holdings Ltd. |
198,000 |
65,867 |
|
|
F5 Networks, Inc. (a) |
316,710 |
29,906,925 |
|
|
Finisar Corp. (a) |
636,337 |
9,322,337 |
|
|
Infinera Corp. (a) |
598,818 |
3,886,329 |
|
|
JDS Uniphase Corp. (a) |
168,878 |
2,391,312 |
|
|
Juniper Networks, Inc. (a) |
1,569,918 |
32,465,904 |
|
|
Motorola Solutions, Inc. |
182,679 |
11,364,461 |
|
|
Palo Alto Networks, Inc. (d) |
19,156 |
1,171,006 |
|
|
Polycom, Inc. (a) |
99,823 |
909,388 |
|
|
QUALCOMM, Inc. |
342,343 |
22,467,971 |
|
|
Research In Motion Ltd. (a) |
184,100 |
2,457,735 |
|
|
Riverbed Technology, Inc. (a) |
1,287 |
19,665 |
|
|
Sandvine Corp. (a) |
1,941,200 |
3,651,673 |
|
|
Sandvine Corp. (U.K.) (a) |
2,252,512 |
4,106,398 |
|
|
Sonus Networks, Inc. (a) |
4,631,142 |
11,346,298 |
|
|
Spirent Communications PLC |
87,200 |
203,060 |
|
|
Telefonaktiebolaget LM Ericsson (B Shares) sponsored ADR |
431,900 |
5,273,499 |
|
|
ZTE Corp. (H Shares) |
1,144,800 |
1,954,349 |
|
|
|
204,903,497 |
||
|
COMPUTERS & PERIPHERALS - 13.3% |
|||
|
Computer Hardware - 11.2% |
|||
|
3D Systems Corp. (a)(d) |
124,924 |
4,617,191 |
|
|
Advantech Co. Ltd. |
1,369,000 |
6,113,060 |
|
|
|
|||
|
Shares |
Value |
||
|
Apple, Inc. |
408,408 |
$ 180,271,291 |
|
|
Foxconn Technology Co. Ltd. |
42,050 |
117,043 |
|
|
Hewlett-Packard Co. |
1,669 |
33,614 |
|
|
Lenovo Group Ltd. |
26,536,000 |
29,630,430 |
|
|
Pegatron Corp. (a) |
1,292,000 |
1,772,433 |
|
|
Quanta Computer, Inc. |
95,000 |
205,593 |
|
|
Stratasys Ltd. (a) |
57,961 |
3,659,658 |
|
|
Wistron Corp. |
908,250 |
1,017,438 |
|
|
|
227,437,751 |
||
|
Computer Storage & Peripherals - 2.1% |
|||
|
ADLINK Technology, Inc. |
5,750 |
6,511 |
|
|
Catcher Technology Co. Ltd. |
4,000 |
18,340 |
|
|
Chicony Electronics Co. Ltd. |
1,532,000 |
4,041,156 |
|
|
EMC Corp. (a) |
856,350 |
19,704,614 |
|
|
Fusion-io, Inc. (a) |
140,000 |
2,363,200 |
|
|
Gemalto NV |
2,478 |
225,620 |
|
|
NetApp, Inc. (a) |
12 |
406 |
|
|
SanDisk Corp. (a) |
256,457 |
12,922,868 |
|
|
SIMPLO Technology Co. Ltd. |
5,000 |
22,526 |
|
|
Synaptics, Inc. (a) |
30,430 |
1,057,747 |
|
|
Wacom Co. Ltd. |
405 |
1,457,196 |
|
|
|
41,820,184 |
||
|
TOTAL COMPUTERS & PERIPHERALS |
269,257,935 |
||
|
DIVERSIFIED CONSUMER SERVICES - 0.2% |
|||
|
Education Services - 0.2% |
|||
|
Educomp Solutions Ltd. |
53,012 |
81,024 |
|
|
New Oriental Education & Technology Group, Inc. sponsored ADR (d) |
190,476 |
2,895,235 |
|
|
|
2,976,259 |
||
|
ELECTRICAL EQUIPMENT - 0.0% |
|||
|
Electrical Components & Equipment - 0.0% |
|||
|
Dynapack International Technology Corp. |
40,000 |
150,294 |
|
|
ELECTRONIC EQUIPMENT & COMPONENTS - 5.0% |
|||
|
Electronic Components - 1.8% |
|||
|
Aeroflex Holding Corp. (a) |
60,538 |
559,977 |
|
|
Amphenol Corp. Class A |
73,961 |
5,240,876 |
|
|
AU Optronics Corp. (a) |
5,124,000 |
2,251,396 |
|
|
AU Optronics Corp. sponsored ADR (a)(d) |
262,146 |
1,137,714 |
|
|
Cheng Uei Precision Industries Co. Ltd. |
109,739 |
210,071 |
|
|
Delta Electronics, Inc. |
888,000 |
3,344,115 |
|
|
FLEXium Interconnect, Inc. |
1,467 |
4,672 |
|
|
InvenSense, Inc. (a) |
314,164 |
3,776,251 |
|
|
Ledlink Optics, Inc. |
718,000 |
2,001,973 |
|
|
Omron Corp. |
45,600 |
1,104,456 |
|
|
Tong Hsing Electronics Industries Ltd. |
1,233,000 |
5,290,785 |
|
|
TXC Corp. |
1,225,000 |
1,946,858 |
|
|
Universal Display Corp. (a)(d) |
230,585 |
7,235,757 |
|
|
Common Stocks - continued |
|||
|
Shares |
Value |
||
|
ELECTRONIC EQUIPMENT & COMPONENTS - CONTINUED |
|||
|
Electronic Components - continued |
|||
|
Yageo Corp. (a) |
5,565,000 |
$ 1,701,517 |
|
|
Yaskawa Electric Corp. |
156,000 |
1,407,013 |
|
|
|
37,213,431 |
||
|
Electronic Equipment & Instruments - 1.0% |
|||
|
Chroma ATE, Inc. |
896,644 |
2,070,521 |
|
|
FEI Co. |
8,700 |
551,058 |
|
|
Hitachi High-Technologies Corp. |
20,500 |
423,757 |
|
|
Keyence Corp. |
7,550 |
2,126,772 |
|
|
National Instruments Corp. |
279,701 |
8,413,406 |
|
|
SNU Precision Co. Ltd. (a) |
22,427 |
131,127 |
|
|
Test Research, Inc. |
59,016 |
104,466 |
|
|
TPK Holding Co. Ltd. GDR (Reg. S) |
363,965 |
6,896,437 |
|
|
|
20,717,544 |
||
|
Electronic Manufacturing Services - 1.6% |
|||
|
Hon Hai Precision Industry Co. Ltd. (Foxconn) |
22,300 |
62,231 |
|
|
Jabil Circuit, Inc. |
219,207 |
4,105,747 |
|
|
Ju Teng International Holdings Ltd. |
9,772,000 |
5,291,970 |
|
|
KEMET Corp. (a) |
4,077 |
26,378 |
|
|
TE Connectivity Ltd. |
346,878 |
13,920,214 |
|
|
Trimble Navigation Ltd. (a) |
157,171 |
9,340,673 |
|
|
|
32,747,213 |
||
|
Technology Distributors - 0.6% |
|||
|
Arrow Electronics, Inc. (a) |
47 |
1,887 |
|
|
Digital China Holdings Ltd. (H Shares) |
3,156,000 |
4,956,429 |
|
|
Redington India Ltd. |
174,887 |
273,412 |
|
|
Synnex Technology International Corp. |
2,612,000 |
5,327,203 |
|
|
VST Holdings Ltd. |
2,990,000 |
790,332 |
|
|
WPG Holding Co. Ltd. |
18,200 |
20,878 |
|
|
WT Microelectronics Co. Ltd. |
52,529 |
63,949 |
|
|
|
11,434,090 |
||
|
TOTAL ELECTRONIC EQUIPMENT & COMPONENTS |
102,112,278 |
||
|
HEALTH CARE EQUIPMENT & SUPPLIES - 0.3% |
|||
|
Health Care Equipment - 0.3% |
|||
|
Biosensors International Group Ltd. (a) |
4,882,000 |
5,045,995 |
|
|
Trauson Holdings Co. Ltd. |
586,000 |
562,154 |
|
|
|
5,608,149 |
||
|
HEALTH CARE TECHNOLOGY - 0.9% |
|||
|
Health Care Technology - 0.9% |
|||
|
athenahealth, Inc. (a)(d) |
70,000 |
6,565,300 |
|
|
Cerner Corp. (a) |
72,111 |
6,306,828 |
|
|
So-net M3, Inc. |
3,219 |
5,542,695 |
|
|
|
18,414,823 |
||
|
|
|||
|
Shares |
Value |
||
|
HOUSEHOLD DURABLES - 0.2% |
|||
|
Consumer Electronics - 0.2% |
|||
|
Alpine Electronics, Inc. |
244,000 |
$ 2,350,761 |
|
|
Sony Corp. sponsored ADR (d) |
71,600 |
1,043,928 |
|
|
|
3,394,689 |
||
|
Household Appliances - 0.0% |
|||
|
Haier Electronics Group Co. Ltd. (a) |
53,000 |
95,673 |
|
|
TOTAL HOUSEHOLD DURABLES |
3,490,362 |
||
|
HOUSEHOLD PRODUCTS - 0.0% |
|||
|
Household Products - 0.0% |
|||
|
NVC Lighting Holdings Ltd. |
546,000 |
137,281 |
|
|
INDUSTRIAL CONGLOMERATES - 0.0% |
|||
|
Industrial Conglomerates - 0.0% |
|||
|
Samsung Techwin Co. Ltd. |
539 |
32,409 |
|
|
INTERNET & CATALOG RETAIL - 0.4% |
|||
|
Internet Retail - 0.4% |
|||
|
Amazon.com, Inc. (a) |
1,528 |
403,805 |
|
|
E-Commerce China Dangdang, Inc. ADR (a) |
990 |
3,821 |
|
|
Expedia, Inc. |
355 |
22,663 |
|
|
Groupon, Inc. Class A (a) |
336,600 |
1,524,798 |
|
|
priceline.com, Inc. (a) |
2,320 |
1,595,186 |
|
|
Rakuten, Inc. |
355,900 |
3,075,584 |
|
|
Start Today Co. Ltd. (d) |
154,300 |
1,643,048 |
|
|
TripAdvisor, Inc. (a) |
6,992 |
317,856 |
|
|
|
8,586,761 |
||
|
INTERNET SOFTWARE & SERVICES - 18.8% |
|||
|
Internet Software & Services - 18.8% |
|||
|
Active Network, Inc. (a) |
186,079 |
872,711 |
|
|
Akamai Technologies, Inc. (a) |
5,578 |
206,163 |
|
|
Angie's List, Inc. (a)(d) |
76,700 |
1,308,502 |
|
|
Bankrate, Inc. (a) |
77,119 |
867,589 |
|
|
Bazaarvoice, Inc. |
8,500 |
59,500 |
|
|
Blinkx PLC (a)(d) |
500,000 |
694,050 |
|
|
Cornerstone OnDemand, Inc. (a) |
226,340 |
7,663,872 |
|
|
DealerTrack Holdings, Inc. (a) |
79,673 |
2,349,557 |
|
|
Demandware, Inc. |
125,775 |
3,326,749 |
|
|
eBay, Inc. (a) |
1,141,063 |
62,393,325 |
|
|
ExactTarget, Inc. |
343,444 |
7,658,801 |
|
|
Facebook, Inc. Class A |
302,709 |
8,248,820 |
|
|
Google, Inc. Class A (a) |
235,674 |
188,822,005 |
|
|
INFO Edge India Ltd. |
114,388 |
732,887 |
|
|
IntraLinks Holdings, Inc. (a) |
323,486 |
1,902,098 |
|
|
Kakaku.com, Inc. |
26,800 |
1,040,889 |
|
|
Keynote Systems, Inc. |
66,858 |
1,021,590 |
|
|
LinkedIn Corp. (a) |
120,520 |
20,269,054 |
|
|
LogMeIn, Inc. (a) |
72,925 |
1,302,441 |
|
|
MercadoLibre, Inc. |
236 |
20,204 |
|
|
Millennial Media, Inc. (d) |
334,976 |
3,138,725 |
|
|
Common Stocks - continued |
|||
|
Shares |
Value |
||
|
INTERNET SOFTWARE & SERVICES - CONTINUED |
|||
|
Internet Software & Services - continued |
|||
|
NHN Corp. |
31,535 |
$ 7,648,546 |
|
|
Open Text Corp. (a) |
400 |
22,020 |
|
|
PChome Online, Inc. |
219,000 |
1,105,211 |
|
|
Qihoo 360 Technology Co. Ltd. ADR (a) |
770 |
23,693 |
|
|
Rackspace Hosting, Inc. (a) |
18,204 |
1,016,875 |
|
|
Renren, Inc. ADR (a) |
18,800 |
55,648 |
|
|
Responsys, Inc. (a) |
790,883 |
6,382,426 |
|
|
Saba Software, Inc. (a) |
10,000 |
87,400 |
|
|
SciQuest, Inc. (a) |
331,111 |
6,340,776 |
|
|
SINA Corp. (a) |
254,405 |
13,147,650 |
|
|
SouFun Holdings Ltd. ADR |
317 |
8,511 |
|
|
Tencent Holdings Ltd. |
290,800 |
10,056,290 |
|
|
VeriSign, Inc. (a) |
67,584 |
3,095,347 |
|
|
Vocus, Inc. (a) |
303,843 |
4,265,956 |
|
|
Web.com Group, Inc. (a) |
142,200 |
2,428,776 |
|
|
XO Group, Inc. (a) |
16,300 |
149,145 |
|
|
Yahoo!, Inc. (a) |
484,969 |
10,334,689 |
|
|
Yandex NV (a) |
41,749 |
968,159 |
|
|
YouKu.com, Inc. ADR (a) |
10,383 |
211,709 |
|
|
|
381,248,359 |
||
|
IT SERVICES - 9.6% |
|||
|
Data Processing & Outsourced Services - 8.4% |
|||
|
Automatic Data Processing, Inc. |
32 |
1,964 |
|
|
Fidelity National Information Services, Inc. |
597,924 |
22,511,839 |
|
|
Fiserv, Inc. (a) |
2,700 |
221,697 |
|
|
FleetCor Technologies, Inc. (a) |
40,694 |
2,840,848 |
|
|
Global Payments, Inc. |
246,882 |
11,902,181 |
|
|
Jack Henry & Associates, Inc. |
62,208 |
2,719,734 |
|
|
MasterCard, Inc. Class A |
100,081 |
51,823,943 |
|
|
Paychex, Inc. |
227,816 |
7,540,710 |
|
|
Syntel, Inc. |
23,201 |
1,395,772 |
|
|
The Western Union Co. |
511,633 |
7,178,211 |
|
|
Total System Services, Inc. |
430,756 |
10,234,763 |
|
|
VeriFone Systems, Inc. (a) |
5,919 |
112,283 |
|
|
Visa, Inc. Class A |
318,967 |
50,600,925 |
|
|
WNS Holdings Ltd. sponsored ADR (a) |
26,900 |
378,214 |
|
|
|
169,463,084 |
||
|
IT Consulting & Other Services - 1.2% |
|||
|
Accenture PLC Class A |
109,606 |
8,150,302 |
|
|
Bit-isle, Inc. |
4,900 |
56,618 |
|
|
Camelot Information Systems, Inc. ADR (a) |
555 |
894 |
|
|
ChinaSoft International Ltd. (a) |
50,000 |
11,927 |
|
|
Cognizant Technology Solutions Corp. Class A (a) |
15,483 |
1,188,630 |
|
|
EPAM Systems, Inc. |
113,900 |
2,389,622 |
|
|
IBM Corp. |
40,472 |
8,127,992 |
|
|
Pactera Technology International Ltd. ADR |
288,865 |
1,978,725 |
|
|
|
|||
|
Shares |
Value |
||
|
ServiceSource International, Inc. (a) |
227,262 |
$ 1,436,296 |
|
|
Teradata Corp. (a) |
3,397 |
197,230 |
|
|
Virtusa Corp. (a) |
49,000 |
1,026,550 |
|
|
|
24,564,786 |
||
|
TOTAL IT SERVICES |
194,027,870 |
||
|
LEISURE EQUIPMENT & PRODUCTS - 0.1% |
|||
|
Photographic Products - 0.1% |
|||
|
Sunny Optical Technology Group Co. Ltd. |
2,535,000 |
2,340,322 |
|
|
LIFE SCIENCES TOOLS & SERVICES - 0.1% |
|||
|
Life Sciences Tools & Services - 0.1% |
|||
|
Illumina, Inc. (a)(d) |
400 |
20,052 |
|
|
WuXi PharmaTech Cayman, Inc. sponsored ADR (a) |
87,200 |
1,424,848 |
|
|
|
1,444,900 |
||
|
MACHINERY - 1.0% |
|||
|
Industrial Machinery - 1.0% |
|||
|
Airtac International Group |
1,399,000 |
8,235,552 |
|
|
Fanuc Corp. |
13,300 |
2,053,328 |
|
|
HIWIN Technologies Corp. |
890,154 |
7,451,479 |
|
|
Mirle Automation Corp. |
301,893 |
207,546 |
|
|
Nippon Thompson Co. Ltd. |
129,000 |
585,921 |
|
|
Shin Zu Shing Co. Ltd. |
428,000 |
1,376,295 |
|
|
|
19,910,121 |
||
|
MEDIA - 0.3% |
|||
|
Advertising - 0.2% |
|||
|
Dentsu, Inc. |
500 |
15,557 |
|
|
Focus Media Holding Ltd. ADR |
125,217 |
3,156,721 |
|
|
ReachLocal, Inc. (a) |
43,033 |
539,203 |
|
|
|
3,711,481 |
||
|
Cable & Satellite - 0.0% |
|||
|
DIRECTV (a) |
429 |
20,665 |
|
|
DISH Network Corp. Class A |
7,233 |
251,708 |
|
|
|
272,373 |
||
|
Movies & Entertainment - 0.1% |
|||
|
IMAX Corp. (a) |
104,670 |
2,694,777 |
|
|
TOTAL MEDIA |
6,678,631 |
||
|
PHARMACEUTICALS - 0.1% |
|||
|
Pharmaceuticals - 0.1% |
|||
|
China Medical System Holdings Ltd. |
2,764,500 |
2,530,810 |
|
|
PROFESSIONAL SERVICES - 0.2% |
|||
|
Research & Consulting Services - 0.2% |
|||
|
Acacia Research Corp. (a) |
27,700 |
774,492 |
|
|
IHS, Inc. Class A (a) |
32,100 |
3,410,625 |
|
|
|
4,185,117 |
||
|
Common Stocks - continued |
|||
|
Shares |
Value |
||
|
REAL ESTATE INVESTMENT TRUSTS - 0.4% |
|||
|
Specialized REITs - 0.4% |
|||
|
American Tower Corp. |
96,604 |
$ 7,496,470 |
|
|
REAL ESTATE MANAGEMENT & DEVELOPMENT - 0.0% |
|||
|
Real Estate Services - 0.0% |
|||
|
E-House China Holdings Ltd. ADR |
43,722 |
193,688 |
|
|
SEMICONDUCTORS & SEMICONDUCTOR EQUIPMENT - 13.9% |
|||
|
Semiconductor Equipment - 1.4% |
|||
|
Amkor Technology, Inc. (a)(d) |
4,848 |
19,634 |
|
|
Applied Materials, Inc. |
151,010 |
2,068,837 |
|
|
Asia Pacific Systems, Inc. (a) |
2,337 |
18,793 |
|
|
ASM International NV (depositary receipt) |
71,991 |
2,855,883 |
|
|
ASML Holding NV |
16,843 |
1,195,516 |
|
|
Dainippon Screen Manufacturing Co. Ltd. |
228,000 |
1,136,433 |
|
|
Entegris, Inc. (a) |
322,643 |
3,068,335 |
|
|
GCL-Poly Energy Holdings Ltd. |
2,055,000 |
548,488 |
|
|
GT Advanced Technologies, Inc. (a) |
4,100 |
11,726 |
|
|
ICD Co. Ltd. |
16,152 |
203,324 |
|
|
Lam Research Corp. (a) |
6,213 |
262,810 |
|
|
Rubicon Technology, Inc. (a) |
1,926 |
9,938 |
|
|
Teradyne, Inc. (a)(d) |
251,505 |
4,215,224 |
|
|
Tessera Technologies, Inc. |
241,187 |
4,302,776 |
|
|
Ultratech, Inc. (a) |
209,095 |
8,568,713 |
|
|
|
28,486,430 |
||
|
Semiconductors - 12.5% |
|||
|
Advanced Micro Devices, Inc. (a) |
3,611 |
8,991 |
|
|
Alpha & Omega Semiconductor Ltd. (a) |
25,812 |
208,045 |
|
|
Altera Corp. |
1,133,570 |
40,151,049 |
|
|
Analog Devices, Inc. |
22,510 |
1,017,902 |
|
|
Applied Micro Circuits Corp. (a) |
453,625 |
3,606,319 |
|
|
ARM Holdings PLC sponsored ADR |
9,175 |
399,296 |
|
|
Atmel Corp. (a) |
136,196 |
926,133 |
|
|
Avago Technologies Ltd. |
95,055 |
3,252,782 |
|
|
Broadcom Corp. Class A |
178,091 |
6,074,684 |
|
|
Cavium, Inc. (a) |
463,198 |
17,101,270 |
|
|
Chipbond Technology Corp. |
2,082,000 |
4,341,555 |
|
|
ChipMOS TECHNOLOGIES (Bermuda) Ltd. |
213,063 |
2,311,734 |
|
|
Cirrus Logic, Inc. (a) |
36,530 |
878,181 |
|
|
Cree, Inc. (a)(d) |
202,069 |
9,139,581 |
|
|
Cypress Semiconductor Corp. |
122,925 |
1,294,400 |
|
|
Dialog Semiconductor PLC (a) |
11,134 |
206,120 |
|
|
Diodes, Inc. (a) |
1,138 |
22,680 |
|
|
Duksan Hi-Metal Co. Ltd. (a) |
1,376 |
32,485 |
|
|
Epistar Corp. |
126,000 |
248,818 |
|
|
Fairchild Semiconductor International, Inc. (a) |
1,421 |
20,263 |
|
|
Freescale Semiconductor Holdings I Ltd. (a)(d) |
279,078 |
4,306,174 |
|
|
|
|||
|
Shares |
Value |
||
|
Genesis Photonics, Inc. |
49,803 |
$ 37,129 |
|
|
Global Unichip Corp. |
73,000 |
235,593 |
|
|
Hittite Microwave Corp. (a) |
34,011 |
2,204,593 |
|
|
Imagination Technologies Group PLC (a) |
434,352 |
3,360,562 |
|
|
Infineon Technologies AG |
2,431 |
20,823 |
|
|
Inotera Memories, Inc. (a) |
23,948,000 |
5,237,422 |
|
|
Inphi Corp. (a) |
347,990 |
3,361,583 |
|
|
International Rectifier Corp. (a) |
24,126 |
507,129 |
|
|
Intersil Corp. Class A |
59,689 |
506,760 |
|
|
JA Solar Holdings Co. Ltd. ADR (a) |
937 |
4,170 |
|
|
Linear Technology Corp. |
46,182 |
1,766,000 |
|
|
LSI Corp. (a) |
1,315,263 |
9,154,230 |
|
|
MagnaChip Semiconductor Corp. (a) |
17,582 |
276,917 |
|
|
Marvell Technology Group Ltd. |
1,741 |
17,584 |
|
|
Maxim Integrated Products, Inc. |
53 |
1,653 |
|
|
MediaTek, Inc. |
206,506 |
2,341,138 |
|
|
Mellanox Technologies Ltd. (a) |
63,700 |
3,358,901 |
|
|
Micrel, Inc. |
22,021 |
231,661 |
|
|
Micron Technology, Inc. (a) |
2,129,402 |
17,865,683 |
|
|
Mindspeed Technologies, Inc. (a)(d) |
420,536 |
1,871,385 |
|
|
Monolithic Power Systems, Inc. |
447,105 |
10,994,312 |
|
|
MStar Semiconductor, Inc. |
306,000 |
2,314,968 |
|
|
Novatek Microelectronics Corp. |
1,943,000 |
8,210,335 |
|
|
NVIDIA Corp. |
332 |
4,203 |
|
|
NXP Semiconductors NV (a) |
48,099 |
1,554,560 |
|
|
O2Micro International Ltd. sponsored ADR (a) |
44,200 |
141,882 |
|
|
Omnivision Technologies, Inc. (a) |
75,565 |
1,164,457 |
|
|
ON Semiconductor Corp. (a) |
1,770,495 |
14,163,960 |
|
|
PMC-Sierra, Inc. (a) |
1,430,330 |
9,282,842 |
|
|
Power Integrations, Inc. |
48,583 |
2,031,255 |
|
|
Radiant Opto-Electronics Corp. |
5,710 |
20,851 |
|
|
Rambus, Inc. (a) |
450,961 |
2,543,420 |
|
|
RDA Microelectronics, Inc. sponsored ADR |
64,515 |
699,343 |
|
|
RF Micro Devices, Inc. (a) |
1,178,441 |
5,432,613 |
|
|
Samsung Electronics Co. Ltd. |
145 |
206,465 |
|
|
Semtech Corp. (a) |
185,899 |
5,682,932 |
|
|
Seoul Semiconductor Co. Ltd. |
695 |
18,523 |
|
|
Silicon Laboratories, Inc. (a) |
5,500 |
228,360 |
|
|
Silicon Motion Technology Corp. sponsored ADR (d) |
44,120 |
576,207 |
|
|
Siliconware Precision Industries Co. Ltd. |
964,000 |
1,036,814 |
|
|
Siliconware Precision Industries Co. Ltd. sponsored ADR |
134,900 |
713,621 |
|
|
SK Hynix, Inc. |
46,140 |
1,127,597 |
|
|
Skyworks Solutions, Inc. (a) |
471,811 |
10,049,574 |
|
|
Spreadtrum Communications, Inc. ADR |
1,168,451 |
20,459,577 |
|
|
STMicroelectronics NV (NY Shares) unit |
2,550 |
20,273 |
|
|
Taiwan Surface Mounting Technology Co. Ltd. |
326,750 |
474,483 |
|
|
Texas Instruments, Inc. |
8,405 |
288,880 |
|
|
Trina Solar Ltd. (a) |
406 |
1,624 |
|
|
United Microelectronics Corp. |
11,000 |
4,147 |
|
|
Common Stocks - continued |
|||
|
Shares |
Value |
||
|
SEMICONDUCTORS & SEMICONDUCTOR EQUIPMENT - CONTINUED |
|||
|
Semiconductors - continued |
|||
|
Vanguard International Semiconductor Corp. |
52,000 |
$ 46,098 |
|
|
Xilinx, Inc. |
177,070 |
6,599,399 |
|
|
YoungTek Electronics Corp. |
2,536 |
6,204 |
|
|
|
254,009,157 |
||
|
TOTAL SEMICONDUCTORS & SEMICONDUCTOR EQUIPMENT |
282,495,587 |
||
|
SOFTWARE - 21.8% |
|||
|
Application Software - 13.1% |
|||
|
Adobe Systems, Inc. (a) |
525,779 |
20,663,115 |
|
|
ANSYS, Inc. (a) |
87,536 |
6,635,229 |
|
|
AsiaInfo-Linkage, Inc. (a) |
248,041 |
2,735,892 |
|
|
Aspen Technology, Inc. (a) |
307,871 |
9,470,112 |
|
|
Autodesk, Inc. (a) |
449,350 |
16,500,132 |
|
|
Blackbaud, Inc. |
40,000 |
1,112,000 |
|
|
BroadSoft, Inc. (a) |
246,212 |
5,170,452 |
|
|
Citrix Systems, Inc. (a) |
140,529 |
9,963,506 |
|
|
Compuware Corp. (a) |
238,725 |
2,771,597 |
|
|
Comverse, Inc. |
2,623 |
72,185 |
|
|
Concur Technologies, Inc. (a)(d) |
279,211 |
19,600,612 |
|
|
Dassault Systemes SA |
18,983 |
2,154,656 |
|
|
Descartes Systems Group, Inc. (a) |
581,300 |
5,298,638 |
|
|
Ellie Mae, Inc. (a) |
46,351 |
940,925 |
|
|
Guidewire Software, Inc. (a) |
115,467 |
4,220,319 |
|
|
Informatica Corp. (a) |
5,877 |
205,754 |
|
|
Intuit, Inc. |
3,958 |
255,212 |
|
|
Jive Software, Inc. (a)(d) |
452,320 |
7,499,466 |
|
|
Kingdee International Software Group Co. Ltd. (a) |
34,913,600 |
6,167,367 |
|
|
Manhattan Associates, Inc. (a) |
14,555 |
1,016,812 |
|
|
MicroStrategy, Inc. Class A (a) |
48,198 |
4,910,412 |
|
|
Nuance Communications, Inc. (a) |
686,547 |
12,639,330 |
|
|
Parametric Technology Corp. (a) |
575,649 |
13,320,518 |
|
|
Pegasystems, Inc. (d) |
120,039 |
3,287,868 |
|
|
PROS Holdings, Inc. (a) |
26,200 |
682,772 |
|
|
QLIK Technologies, Inc. (a) |
241,854 |
6,288,204 |
|
|
RealPage, Inc. (a)(d) |
13,700 |
296,742 |
|
|
salesforce.com, Inc. (a) |
441,445 |
74,701,323 |
|
|
SAP AG |
13,159 |
1,027,591 |
|
|
SolarWinds, Inc. (a) |
48,695 |
2,749,320 |
|
|
Splunk, Inc. |
445 |
16,078 |
|
|
Synchronoss Technologies, Inc. (a) |
278,649 |
8,406,840 |
|
|
Synopsys, Inc. (a) |
7,993 |
279,995 |
|
|
|
|||
|
Shares |
Value |
||
|
TIBCO Software, Inc. (a) |
408,984 |
$ 8,772,707 |
|
|
TiVo, Inc. (a) |
26,100 |
323,379 |
|
|
Ultimate Software Group, Inc. (a) |
52,100 |
5,119,867 |
|
|
Verint Systems, Inc. (a) |
3,405 |
116,349 |
|
|
Workday, Inc. |
14,900 |
823,821 |
|
|
|
266,217,097 |
||
|
Home Entertainment Software - 1.1% |
|||
|
Activision Blizzard, Inc. |
771,203 |
11,028,203 |
|
|
Capcom Co. Ltd. (d) |
68,500 |
1,051,629 |
|
|
Giant Interactive Group, Inc. ADR (d) |
480,543 |
2,979,367 |
|
|
Nintendo Co. Ltd. |
1,700 |
164,454 |
|
|
Perfect World Co. Ltd. sponsored ADR Class B |
420,803 |
4,780,322 |
|
|
Take-Two Interactive Software, Inc. (a) |
135,228 |
1,979,738 |
|
|
|
21,983,713 |
||
|
Systems Software - 7.6% |
|||
|
Allot Communications Ltd. (a) |
58,500 |
803,205 |
|
|
BMC Software, Inc. (a) |
499 |
19,995 |
|
|
Check Point Software Technologies Ltd. (a) |
4,413 |
231,727 |
|
|
CommVault Systems, Inc. (a) |
100,253 |
7,413,709 |
|
|
Fortinet, Inc. (a) |
1,137 |
27,493 |
|
|
Imperva, Inc. (a) |
29,700 |
1,084,050 |
|
|
Infoblox, Inc. |
8,900 |
187,701 |
|
|
Insyde Software Corp. |
563,000 |
1,362,825 |
|
|
NetSuite, Inc. (a) |
134,600 |
9,393,734 |
|
|
Oracle Corp. |
2,172,822 |
74,440,882 |
|
|
Progress Software Corp. (a) |
64,222 |
1,446,279 |
|
|
Red Hat, Inc. (a) |
526,771 |
26,765,235 |
|
|
ServiceNow, Inc. |
34,300 |
1,113,721 |
|
|
Sourcefire, Inc. (a) |
170,819 |
9,161,023 |
|
|
Totvs SA |
192,100 |
4,245,920 |
|
|
VMware, Inc. Class A (a) |
232,675 |
16,713,045 |
|
|
|
154,410,544 |
||
|
TOTAL SOFTWARE |
442,611,354 |
||
|
WIRELESS TELECOMMUNICATION SERVICES - 0.6% |
|||
|
Wireless Telecommunication Services - 0.6% |
|||
|
SBA Communications Corp. Class A (a) |
181,720 |
12,923,926 |
|
|
TOTAL COMMON STOCKS (Cost $1,781,674,102) |
|
||
|
Convertible Bonds - 0.3% |
||||
|
|
Principal Amount |
|
||
|
SEMICONDUCTORS & SEMICONDUCTOR EQUIPMENT - 0.3% |
||||
|
Semiconductors - 0.3% |
||||
|
JA Solar Holdings Co. Ltd. 4.5% 5/15/13 |
|
$ 6,990,000 |
|
|
|
Money Market Funds - 3.7% |
|||
|
Shares |
Value |
||
|
Fidelity Cash Central Fund, 0.16% (b) |
29,390,960 |
$ 29,390,960 |
|
|
Fidelity Securities Lending Cash Central Fund, 0.16% (b)(c) |
46,169,529 |
46,169,529 |
|
|
TOTAL MONEY MARKET FUNDS (Cost $75,560,489) |
|
||
|
TOTAL INVESTMENT PORTFOLIO - 102.2% (Cost $1,863,955,489) |
2,073,766,031 |
|
NET OTHER ASSETS (LIABILITIES) - (2.2)% |
(45,442,525) |
||
|
NET ASSETS - 100% |
$ 2,028,323,506 |
||
|
Legend |
|
(a) Non-income producing |
|
(b) Affiliated fund that is generally available only to investment companies and other accounts managed by Fidelity Investments. The rate quoted is the annualized seven-day yield of the fund at period end. A complete unaudited listing of the fund's holdings as of its most recent quarter end is available upon request. In addition, each Fidelity Central Fund's financial statements, which are not covered by the Fund's Report of Independent Registered Public Accounting Firm, are available on the SEC's website or upon request. |
|
(c) Investment made with cash collateral received from securities on loan. |
|
(d) Security or a portion of the security is on loan at period end. |
|
Affiliated Central Funds |
|
Information regarding fiscal year to date income earned by the Fund from investments in Fidelity Central Funds is as follows: |
|
Fund |
Income earned |
|
Fidelity Cash Central Fund |
$ 228,452 |
|
Fidelity Securities Lending Cash Central Fund |
777,413 |
|
Total |
$ 1,005,865 |
|
Other Information |
|
The following is a summary of the inputs used, as of February 28, 2013, involving the Fund's assets and liabilities carried at fair value. The inputs or methodology used for valuing securities may not be an indication of the risk associated with investing in those securities. For more information on valuation inputs, and their aggregation into the levels used in the table below, please refer to the Investment Valuation section in the accompanying Notes to Financial Statements. |
|
Valuation Inputs at Reporting Date: |
||||
|
Description |
Total |
Level 1 |
Level 2 |
Level 3 |
|
Investments in Securities: |
||||
|
Common Stocks |
$ 1,991,565,042 |
$ 1,908,213,505 |
$ 83,351,537 |
$ - |
|
Convertible Bonds |
6,640,500 |
- |
6,640,500 |
- |
|
Money Market Funds |
75,560,489 |
75,560,489 |
- |
- |
|
Total Investments in Securities: |
$ 2,073,766,031 |
$ 1,983,773,994 |
$ 89,992,037 |
$ - |
|
The following is a summary of transfers between Level 1 and Level 2 for the period ended February 28, 2013. Transfers are assumed to have occurred at the beginning of the period, and are primarily attributable to the valuation techniques used for foreign equity securities, as discussed in the accompanying Notes to Financial Statements: |
|
Transfers |
Total |
|
Level 1 to Level 2 |
$ 33,185,961 |
|
Level 2 to Level 1 |
$ 0 |
|
Distribution of investments by country or territory of incorporation, as a percentage of total net assets, is as follows. (Unaudited) |
|
United States of America |
82.1% |
|
Cayman Islands |
5.2% |
|
Taiwan |
3.7% |
|
Japan |
2.2% |
|
Hong Kong |
1.5% |
|
Others (Individually Less Than 1%) |
5.3% |
|
|
100.0% |
See accompanying notes which are an integral part of the financial statements.
Annual Report
Technology Portfolio
Financial Statements
Statement of Assets and Liabilities
|
|
February 28, 2013 |
|
|
|
|
|
|
Assets |
|
|
|
Investment in securities, at value (including securities loaned of $45,097,230) - See accompanying schedule: Unaffiliated issuers (cost $1,788,395,000) |
$ 1,998,205,542 |
|
|
Fidelity Central Funds (cost $75,560,489) |
75,560,489 |
|
|
Total Investments (cost $1,863,955,489) |
|
$ 2,073,766,031 |
|
Cash |
|
63,782 |
|
Foreign currency held at value (cost $1,023,654) |
|
1,024,172 |
|
Receivable for investments sold |
|
48,123,392 |
|
Receivable for fund shares sold |
|
913,785 |
|
Dividends receivable |
|
566,122 |
|
Interest receivable |
|
92,618 |
|
Distributions receivable from Fidelity Central Funds |
|
63,776 |
|
Prepaid expenses |
|
3,720 |
|
Receivable from investment adviser for expense reductions |
|
2,751 |
|
Other receivables |
|
216,514 |
|
Total assets |
|
2,124,836,663 |
|
|
|
|
|
Liabilities |
|
|
|
Payable for investments purchased |
$ 44,600,527 |
|
|
Payable for fund shares redeemed |
4,184,015 |
|
|
Accrued management fee |
964,804 |
|
|
Other affiliated payables |
416,174 |
|
|
Other payables and accrued expenses |
178,108 |
|
|
Collateral on securities loaned, at value |
46,169,529 |
|
|
Total liabilities |
|
96,513,157 |
|
|
|
|
|
Net Assets |
|
$ 2,028,323,506 |
|
Net Assets consist of: |
|
|
|
Paid in capital |
|
$ 1,825,764,873 |
|
Undistributed net investment income |
|
428,148 |
|
Accumulated undistributed net realized gain (loss) on investments and foreign currency transactions |
|
(7,607,353) |
|
Net unrealized appreciation (depreciation) on investments and assets and liabilities in foreign currencies |
|
209,737,838 |
|
Net Assets, for 19,481,685 shares outstanding |
|
$ 2,028,323,506 |
|
Net Asset Value, offering price and redemption price per share ($2,028,323,506 ÷ 19,481,685 shares) |
|
$ 104.11 |
Statement of Operations
|
|
Year ended February 28, 2013 |
|
|
|
|
|
|
Investment Income |
|
|
|
Dividends |
|
$ 15,121,427 |
|
Interest |
|
1,485,148 |
|
Income from Fidelity Central Funds (incuding $777,413 from Security Lending) |
|
1,005,865 |
|
Total income |
|
17,612,440 |
|
|
|
|
|
Expenses |
|
|
|
Management fee |
$ 12,338,207 |
|
|
Transfer agent fees |
4,643,851 |
|
|
Accounting and security lending fees |
680,828 |
|
|
Custodian fees and expenses |
225,527 |
|
|
Independent trustees' compensation |
14,978 |
|
|
Registration fees |
55,960 |
|
|
Audit |
54,387 |
|
|
Legal |
11,693 |
|
|
Miscellaneous |
23,217 |
|
|
Total expenses before reductions |
18,048,648 |
|
|
Expense reductions |
(586,257) |
17,462,391 |
|
Net investment income (loss) |
|
150,049 |
|
Realized and Unrealized Gain (Loss) Net realized gain (loss) on: |
|
|
|
Investment securities: |
|
|
|
Unaffiliated issuers |
213,017,466 |
|
|
Foreign currency transactions |
(175,509) |
|
|
Total net realized gain (loss) |
|
212,841,957 |
|
Change in net unrealized appreciation (depreciation) on: Investment securities (net of increase in deferred foreign taxes of $64,889) |
(169,350,789) |
|
|
Assets and liabilities in foreign currencies |
34,756 |
|
|
Total change in net unrealized appreciation (depreciation) |
|
(169,316,033) |
|
Net gain (loss) |
|
43,525,924 |
|
Net increase (decrease) in net assets resulting from operations |
|
$ 43,675,973 |
See accompanying notes which are an integral part of the financial statements.
Annual Report
Technology Portfolio
Financial Statements - continued
Statement of Changes in Net Assets
|
|
Year ended |
Year ended |
|
Increase (Decrease) in Net Assets |
|
|
|
Operations |
|
|
|
Net investment income (loss) |
$ 150,049 |
$ (6,863,734) |
|
Net realized gain (loss) |
212,841,957 |
107,613,980 |
|
Change in net unrealized appreciation (depreciation) |
(169,316,033) |
(171,622,723) |
|
Net increase (decrease) in net assets resulting from operations |
43,675,973 |
(70,872,477) |
|
Share transactions |
409,925,959 |
465,453,767 |
|
Cost of shares redeemed |
(775,244,365) |
(930,572,293) |
|
Net increase (decrease) in net assets resulting from share transactions |
(365,318,406) |
(465,118,526) |
|
Redemption fees |
40,404 |
96,786 |
|
Total increase (decrease) in net assets |
(321,602,029) |
(535,894,217) |
|
|
|
|
|
Net Assets |
|
|
|
Beginning of period |
2,349,925,535 |
2,885,819,752 |
|
End of period (including undistributed net investment income of $428,148 and accumulated net investment loss of $761,212, respectively) |
$ 2,028,323,506 |
$ 2,349,925,535 |
|
Other Information Shares |
|
|
|
Sold |
4,019,573 |
4,881,110 |
|
Redeemed |
(7,674,977) |
(9,932,865) |
|
Net increase (decrease) |
(3,655,404) |
(5,051,755) |
Financial Highlights
|
Years ended February 28, |
2013 |
2012 F |
2011 |
2010 |
2009 |
|
Selected Per-Share Data |
|
|
|
|
|
|
Net asset value, beginning of period |
$ 101.57 |
$ 102.37 |
$ 72.24 |
$ 37.12 |
$ 66.65 |
|
Income from Investment Operations |
|
|
|
|
|
|
Net investment income (loss) B |
.01 |
(.27) |
(.37) |
(.13) |
.15 |
|
Net realized and unrealized gain (loss) |
2.53 |
(.53) |
30.50 |
35.25 |
(29.57) |
|
Total from investment operations |
2.54 |
(.80) |
30.13 |
35.12 |
(29.42) |
|
Distributions from net investment income |
- |
- |
- |
- |
(.11) |
|
Redemption fees added to paid in capital B, G |
- |
- |
- |
- |
- |
|
Net asset value, end of period |
$ 104.11 |
$ 101.57 |
$ 102.37 |
$ 72.24 |
$ 37.12 |
|
Total Return A |
2.50% |
(.78)% |
41.71% |
94.61% |
(44.15)% |
|
Ratios to Average Net Assets C, E |
|
|
|
|
|
|
Expenses before reductions |
.81% |
.82% |
.85% |
.92% |
.90% |
|
Expenses net of fee waivers, if any |
.81% |
.82% |
.85% |
.92% |
.90% |
|
Expenses net of all reductions |
.79% |
.81% |
.83% |
.89% |
.89% |
|
Net investment income (loss) |
.01% |
(.29)% |
(.44)% |
(.21)% |
.26% |
|
Supplemental Data |
|
|
|
|
|
|
Net assets, end of period (000 omitted) |
$ 2,028,324 |
$ 2,349,926 |
$ 2,885,820 |
$ 1,994,894 |
$ 773,373 |
|
Portfolio turnover rate D |
140% |
196% |
136% |
127% |
235% |
A Total returns would have been lower if certain expenses had not been reduced during the applicable periods shown.
B Calculated based on average shares outstanding during the period.
C Fees and expenses of any underlying Fidelity Central Funds are not included in the Fund's expense ratio. The Fund indirectly bears its proportionate share of the expenses of any underlying Fidelity Central Funds.
D Amount does not include the portfolio activity of any underlying Fidelity Central Funds.
E Expense ratios reflect operating expenses of the Fund. Expenses before reductions do not reflect amounts reimbursed by the investment adviser or reductions from brokerage service arrangements or reductions from other expense offset arrangements and do not represent the amount paid by the Fund during periods when reimbursements or reductions occur. Expenses net of fee waivers reflect expenses after reimbursement by the investment adviser but prior to reductions from brokerage service arrangements or other expense offset arrangements. Expenses net of all reductions represent the net expenses paid by the Fund.
F For the year ended February 29.
G Amount represents less than $.01 per share.
See accompanying notes which are an integral part of the financial statements.
Annual Report
Notes to Financial Statements
For the period ended February 28, 2013
1. Organization.
Communications Equipment Portfolio, Computers Portfolio, Electronics Portfolio, IT Services Portfolio, Software and Computer Services Portfolio and Technology Portfolio (the Funds) are non-diversified funds of Fidelity Select Portfolios (the Trust). The Trust is registered under the Investment Company Act of 1940, as amended (the 1940 Act), as an open-end management investment company organized as a Massachusetts business trust. The Funds invest primarily in securities of companies whose principal business activities fall within specific industries. Each Fund is authorized to issue an unlimited number of shares. Certain Funds' investments in emerging markets can be subject to social, economic, regulatory and political uncertainties and can be extremely volatile.
2. Investments in Fidelity Central Funds.
The Funds invest in Fidelity Central Funds, which are open-end investment companies available only to other investment companies and accounts managed by Fidelity Management & Research Company (FMR) and its affiliates. The Funds' Schedules of Investments list each of the Fidelity Central Funds held as of period end, if any, as an investment of each Fund, but do not include the underlying holdings of each Fidelity Central Fund. As an Investing Fund, each Fund indirectly bears its proportionate share of the expenses of the underlying Fidelity Central Funds.
The Money Market Central Funds seek preservation of capital and current income and are managed by Fidelity Investments Money Management, Inc. (FIMM), an affiliate of FMR.
A complete unaudited list of holdings for each Fidelity Central Fund is available upon request or at the Securities and Exchange Commission (the SEC) website at www.sec.gov. In addition, the financial statements of the Fidelity Central Funds, which are not covered by the Funds' Report of Independent Registered Public Accounting Firm, are available on the SEC website or upon request.
3. Significant Accounting Policies.
The financial statements have been prepared in conformity with accounting principles generally accepted in the United States of America (GAAP), which require management to make certain estimates and assumptions at the date of the financial statements. Actual results could differ from those estimates. Subsequent events, if any, through the date that the financial statements were issued have been evaluated in the preparation of the financial statements. The following summarizes the significant accounting policies of the Funds:
Investment Valuation. Investments are valued as of 4:00 p.m. Eastern time on the last calendar day of the period. In accordance with valuation policies and procedures approved by the Board of Trustees (the Board), each Fund attempts to obtain prices from one or more third party pricing vendors or brokers to value its investments. When current market prices, quotations or currency exchange rates are not readily available or reliable, investments will be fair valued in good faith by the FMR Fair Value Committee (the Committee), in accordance with procedures adopted by each Fund's Board. Factors used in determining fair value vary by investment type and may include market or investment specific events, changes in interest rates and credit quality. The frequency with which these procedures are used cannot be predicted and they may be utilized to a significant extent. The Committee oversees each Fund's valuation policies and procedures and is responsible for approving and reporting to the Board all fair value determinations.
Each Fund categorizes the inputs to valuation techniques used to value their investments into a disclosure hierarchy consisting of three levels as shown below:
Level 1 - quoted prices in active markets for identical investments
Level 2 - other significant observable inputs (including quoted prices for similar investments, interest rates, prepayment speeds, etc.)
Level 3 - unobservable inputs (including the Fund's own assumptions based on the best information available)
Valuation techniques used to value each Fund's investments by major category are as follows:
Equity securities, including restricted securities, for which market quotations are readily available, are valued at the last reported sale price or official closing price as reported by a third party pricing vendor on the primary market or exchange on which they are traded and are categorized as Level 1 in the hierarchy. In the event there were no sales during the day or closing prices are not available, securities are valued at the last quoted bid price or may be valued using the last available price and are generally categorized as Level 2 in the hierarchy. For foreign equity securities, when significant market or security specific events arise, comparisons to the valuation of American Depositary Receipts (ADRs), futures contracts, Exchange-Traded Funds (ETFs) and certain indexes as well as quoted prices for similar securities are used and are categorized as Level 2 in the hierarchy. Utilizing these techniques may result in transfers between Level 1 and Level 2. For restricted equity securities and private placements where observable inputs are limited, assumptions about market activity and risk are used and these securities are generally categorized as Level 3 in the hierarchy.
Annual Report
3. Significant Accounting Policies - continued
Investment Valuation - continued
Debt securities, including restricted securities, are valued based on evaluated prices received from third party pricing vendors or from brokers who make markets in such securities. For corporate bonds, pricing vendors utilize matrix pricing which considers yield or price of bonds of comparable quality, coupon, maturity and type as well as broker-supplied prices. When independent prices are unavailable or unreliable, debt securities may be valued utilizing pricing methodologies which consider similar factors that would be used by third party pricing vendors. Debt securities are generally categorized as Level 2 in the hierarchy but may be Level 3 depending on the circumstances.
Investments in open-end mutual funds, including the Fidelity Central Funds, are valued at their closing net asset value (NAV) each business day and are categorized as Level 1 in the hierarchy.
Changes in valuation techniques may result in transfers in or out of an assigned level within the disclosure hierarchy. The aggregate value of investments by input level, as of February 28, 2013, including information on transfers between Levels 1 and 2, is included at the end of each applicable Fund's Schedule of Investments.
Foreign Currency. The Funds may use foreign currency contracts to facilitate transactions in foreign-denominated securities. Gains and losses from these transactions may arise from changes in the value of the foreign currency or if the counterparties do not perform under the contracts' terms.
Foreign-denominated assets, including investment securities, and liabilities are translated into U.S. dollars at the exchange rates at period end. Purchases and sales of investment securities, income and dividends received and expenses denominated in foreign currencies are translated into U.S. dollars at the exchange rate in effect on the transaction date.
The effects of exchange rate fluctuations on investments are included with the net realized and unrealized gain (loss) on investment securities. Other foreign currency transactions resulting in realized and unrealized gain (loss) are disclosed separately.
Investment Transactions and Income. For financial reporting purposes, the Funds' investment holdings and NAV include trades executed through the end of the last business day of the period. The NAV per share for processing shareholder transactions is calculated as of the close of business of the New York Stock Exchange (NYSE), normally 4:00 p.m. Eastern time and includes trades executed through the end of the prior business day. Gains and losses on securities sold are determined on the basis of identified cost and may include proceeds received from litigation. Dividend income is recorded on the ex-dividend date, except for certain dividends from foreign securities where the ex-dividend date may have passed, which are recorded as soon as the Funds are informed of the ex-dividend date. Non-cash dividends included in dividend income, if any, are recorded at the fair market value of the securities received. Distributions received on securities that represent a return of capital or capital gain are recorded as a reduction of cost of investments and/or as a realized gain. The Funds estimate the components of distributions received that may be considered return of capital distributions or capital gain distributions. Large, non-recurring dividends recognized by the Funds are presented separately on the Statement of Operations as "Special Dividends" and the impact of these dividends is presented in the Financial Highlights. Interest income and distributions from the Fidelity Central Funds are accrued as earned. Interest income includes coupon interest and amortization of premium and accretion of discount on debt securities. Investment income is recorded net of foreign taxes withheld where recovery of such taxes is uncertain.
Expenses. Expenses directly attributable to a fund are charged to that fund. Expenses attributable to more than one fund are allocated among the respective funds on the basis of relative net assets or other appropriate methods. Expense estimates are accrued in the period to which they relate and adjustments are made when actual amounts are known.
Deferred Trustee Compensation. Under a Deferred Compensation Plan (the Plan) for Electronics Portfolio, independent Trustees may elect to defer receipt of a portion of their annual compensation. Deferred amounts are invested in a cross-section of Fidelity funds, are marked-to-market and remain in the Fund until distributed in accordance with the Plan. The investment of deferred amounts and the offsetting payable to the Trustees are included in the accompanying Statement of Assets and Liabilities.
Income Tax Information and Distributions to Shareholders. Each year, each Fund intends to qualify as a regulated investment company under Subchapter M of the Internal Revenue Code, including distributing substantially all of its taxable income and realized gains. As a result, no provision for income taxes is required. As of February 28, 2013, each Fund did not have any unrecognized tax benefits in the financial statements; nor is each Fund aware of any tax positions for which it is reasonably possible that the total amounts of unrecognized tax benefits will significantly change in the next twelve months. Each Fund files a U.S. federal tax return, in addition to state and local tax returns as required. A fund's federal income tax returns are subject to examination by the Internal Revenue Service (IRS) for a period of three fiscal years after they are filed. State and local tax returns may be subject to examination for an additional fiscal year depending on the jurisdiction. Foreign taxes are provided for based on each Fund's understanding of the tax rules and rates that exist in the foreign markets in which it invests.
Annual Report
Notes to Financial Statements - continued
3. Significant Accounting Policies - continued
Income Tax Information and Distributions to Shareholders - continued
Distributions are declared and recorded on the ex-dividend date. Income and capital gain distributions are determined in accordance with income tax regulations, which may differ from GAAP. These differences resulted in distribution reclassifications. In addition, certain Funds' claimed a portion of the payment made to redeeming shareholders as a distribution for income tax purposes.
Capital accounts within the financial statements are adjusted for permanent book-tax differences. These adjustments have no impact on net assets or the results of operations. Temporary book-tax differences will reverse in a subsequent period.
Book-tax differences are primarily due to foreign currency transactions, deferred trustees compensation, net operating losses, certain foreign taxes, market discount, capital loss carryforwards, and losses deferred due to wash sales and excise tax regulations.
The federal tax cost of investment securities and unrealized appreciation (depreciation) as of period end were as follows for each Fund:
|
|
Tax cost |
Gross unrealized |
Gross unrealized |
Net unrealized |
|
Communications Equipment Portfolio |
$ 366,274,386 |
$ 23,821,598 |
$ (30,072,653) |
$ (6,251,055) |
|
Computers Portfolio |
708,131,387 |
58,540,525 |
(64,355,142) |
(5,814,617) |
|
Electronics Portfolio |
1,159,437,989 |
19,485,788 |
(177,096,001) |
(157,610,213) |
|
IT Services Portfolio |
397,765,249 |
92,599,105 |
(9,540,500) |
83,058,605 |
|
Software and Computer Services Portfolio |
1,730,442,311 |
418,471,404 |
(98,763,825) |
319,707,579 |
|
Technology Portfolio |
1,887,221,471 |
281,804,370 |
(95,259,810) |
186,544,560 |
The tax-based components of distributable earnings as of period end were as follows for each Fund:
|
|
Undistributed |
Undistributed |
Capital loss |
Net unrealized |
|
Communications Equipment Portfolio |
$ - |
$ - |
$ (42,337,103) |
$ (6,251,086) |
|
Computers Portfolio |
416,443 |
50,128,880 |
- |
(5,877,362) |
|
Electronics Portfolio |
18,063 |
- |
(248,134,280) |
(157,610,364) |
|
IT Services Portfolio |
- |
2,468,021 |
- |
83,055,097 |
|
Software and Computer Services Portfolio |
- |
- |
- |
319,658,064 |
|
Technology Portfolio |
- |
17,255,652 |
- |
186,536,745 |
Capital loss carryforwards are only available to offset future capital gains of the Funds to the extent provided by regulations and may be limited. Under the Regulated Investment Company Modernization Act of 2010 (the Act), the Funds are permitted to carry forward capital losses incurred in taxable years beginning after December 22, 2010 for an unlimited period and such capital losses are required to be used prior to any losses that expire. Capital loss carryforwards were as follows:
|
|
Fiscal year of expiration |
|
||
|
|
2016 |
2017 |
2018 |
Total with |
|
Communications Equipment Portfolio |
$ (5,227,176) |
$ (9,371,394) |
$ - |
$ (14,598,570) |
|
Electronics Portfolio |
- |
(167,067,259) |
(71,079,130) |
(238,146,389) |
|
|
No expiration |
|
|
|
|
|
Short-term |
Long-term |
Total |
Total capital loss |
|
Communications Equipment Portfolio |
$ (12,382,484) |
$ (27,738,533) |
$ (42,337,103) |
|
|
Electronics Portfolio |
- |
(9,987,891) |
(9,987,891) |
(248,134,280) |
Communications Equipment Portfolio acquired $9,624,822 of capital loss carryforward as part of a merger in a prior period. The losses acquired that will be available to offset future capital gains of Communications Equipment Portfolio will be limited to approximately $3,069,521 per year.
Annual Report
3. Significant Accounting Policies - continued
Income Tax Information and Distributions to Shareholders - continued
In addition, certain of the Funds intend to elect to defer to the fiscal year ending February 28, 2014 capital losses recognized during the period November 1, 2012 to February 28, 2013. Loss deferrals were as follows:
|
|
Capital losses |
|
Electronics Portfolio |
$ (17,525,394) |
The tax character of distributions paid was as follows:
|
February 28, 2013 |
|
|
|
|
|
|
Ordinary Income |
Return of Capital |
Long-term |
Total |
|
Communications Equipment Portfolio |
$ 1,920,292 |
$ 253,959 |
$ - |
$ 2,174,251 |
|
Computers Portfolio |
1,409,664 |
- |
- |
1,409,664 |
|
Electronics Portfolio |
2,800,318 |
- |
- |
2,800,318 |
|
IT Services Portfolio |
- |
- |
4,164,408 |
4,164,408 |
|
Software and Computer Services Portfolio |
112,068,547 |
- |
79,815,406 |
191,883,953 |
For the period ended February 28, 2013, Communications Equipment Portfolio's distributions exceeded the aggregate amount of taxable income resulting in a return of capital for tax purposes. This was due to reductions in taxable income available for distribution after certain distributions had been made. The tax treatment of distributions for the 2012 calendar year was reported to shareholders in February of 2013.
|
February 29, 2012 |
|
|
|
|
|
Ordinary Income |
Long-term |
Total |
|
Communications Equipment Portfolio |
$ 390,659 |
$ - |
$ 390,659 |
|
Electronics Portfolio |
1,262,911 |
- |
1,262,911 |
|
IT Services Portfolio |
- |
1,972,671 |
1,972,671 |
|
Software and Computer Services Portfolio |
73,659,823 |
107,524,841 |
181,184,664 |
Trading (Redemption) Fees. Shares held by investors in the Funds less than 30 days are subject to a redemption fee equal to .75% of the net asset value of shares redeemed. All redemption fees, which reduce the proceeds of the shareholder redemption, are retained by the Funds and accounted for as an addition to paid in capital.
Restricted Securities. The Funds may invest in securities that are subject to legal or contractual restrictions on resale. These securities generally may be resold in transactions exempt from registration or to the public if the securities are registered. Disposal of these securities may involve time-consuming negotiations and expense, and prompt sale at an acceptable price may be difficult. Information regarding restricted securities is included at the end of each applicable Fund's Schedule of Investments.
4. Purchases and Sales of Investments.
Purchases and sales of securities, other than short-term securities, are noted in the table below.
|
|
Purchases ($) |
Sales ($) |
|
Communications Equipment Portfolio |
139,823,804 |
150,420,751 |
|
Computers Portfolio |
1,347,279,032 |
1,377,772,646 |
|
Electronics Portfolio |
1,134,528,561 |
1,380,349,931 |
|
IT Services Portfolio |
527,187,232 |
354,205,640 |
|
Software and Computer Services Portfolio |
1,973,163,048 |
1,735,586,193 |
|
Technology Portfolio |
2,923,393,639 |
3,234,032,214 |
Annual Report
Notes to Financial Statements - continued
5. Fees and Other Transactions with Affiliates.
Management Fee. FMR and its affiliates provide the Funds with investment management related services for which the Funds pay a monthly management fee. The management fee is the sum of an individual fund fee rate and an annualized group fee rate. The individual fund fee rate is applied to each Fund's average net assets. The group fee rate is based upon the average net assets of all the mutual funds advised by FMR. The group fee rate decreases as assets under management increase and increases as assets under management decrease. For the period, each Fund's annual management fee rate expressed as a percentage of each Fund's average net assets was as follows:
|
|
Individual Rate |
Group Rate |
Total |
|
Communications Equipment Portfolio |
.30% |
.26% |
.56% |
|
Computers Portfolio |
.30% |
.26% |
.56% |
|
Electronics Portfolio |
.30% |
.26% |
.56% |
|
IT Services Portfolio |
.30% |
.26% |
.56% |
|
Software and Computer Services Portfolio |
.30% |
.26% |
.56% |
|
Technology Portfolio |
.30% |
.26% |
.56% |
Transfer Agent Fees. Fidelity Investments Institutional Operations Company, Inc. (FIIOC), an affiliate of FMR, is the Funds' transfer, dividend disbursing and shareholder servicing agent. FIIOC receives account fees and asset-based fees that vary according to account size and type of account. FIIOC pays for typesetting, printing and mailing of shareholder reports, except proxy statements. For the period, transfer agent fees were equivalent to the following annual rates expressed as a percentage of average net assets:
|
Communications Equipment Portfolio |
.29% |
|
Computers Portfolio |
.23% |
|
Electronics Portfolio |
.23% |
|
IT Services Portfolio |
.22% |
|
Software and Computer Services Portfolio |
.21% |
|
Technology Portfolio |
.21% |
Accounting and Security Lending Fees. Fidelity Service Company, Inc. (FSC), an affiliate of FMR, maintains each Fund's accounting records. The accounting fee is based on the level of average net assets for each month. Under a separate contract, FSC administers the security lending program. The security lending fee is based on the number and duration of lending transactions.
Brokerage Commissions. Certain Funds placed a portion of their portfolio transactions with brokerage firms which are affiliates of the investment adviser. The commissions paid to these affiliated firms were as follows:
|
|
Amount |
|
Communications Equipment Portfolio |
$ 13,637 |
|
Computers Portfolio |
97,428 |
|
Electronics Portfolio |
143,559 |
|
IT Services Portfolio |
17,112 |
|
Software and Computer Services Portfolio |
90,870 |
|
Technology Portfolio |
98,072 |
Interfund Lending Program. Pursuant to an Exemptive Order issued by the SEC, the Funds, along with other registered investment companies having management contracts with FMR, may participate in an interfund lending program. This program provides an alternative credit facility allowing the funds to borrow from, or lend money to, other participating affiliated funds. At period end, there were no interfund loans outstanding. Each applicable fund's activity in this program during the period for which loans were outstanding was as follows:
|
|
Borrower or |
Average Loan Balance |
Weighted |
Interest Expense |
|
Computers Portfolio |
Borrower |
$ 21,863,000 |
.44% |
$ 533 |
|
Electronics Portfolio |
Borrower |
9,334,077 |
.42% |
1,409 |
|
IT Services Portfolio |
Borrower |
3,804,833 |
.42% |
265 |
|
Software and Computer Services Portfolio |
Borrower |
7,103,550 |
.42% |
3,338 |
Annual Report
6. Committed Line of Credit.
Certain Funds participate with other funds managed by FMR or an affiliate in a $4.25 billion credit facility (the "line of credit") to be utilized for temporary or emergency purposes to fund shareholder redemptions or for other short-term liquidity purposes. The participating funds have agreed to pay commitment fees on their pro-rata portion of the line of credit, which are reflected in Miscellaneous expenses on the Statement of Operations, and are as follows:
|
Communications Equipment Portfolio |
$ 714 |
|
Computers Portfolio |
1,970 |
|
Electronics Portfolio |
2,713 |
|
IT Services Portfolio |
801 |
|
Software and Computer Services Portfolio |
4,610 |
|
Technology Portfolio |
5,911 |
During the period, there were no borrowings on this line of credit.
7. Security Lending.
Certain Funds lend portfolio securities through a lending agent from time to time in order to earn additional income. For equity securities, a lending agent is used and may loan securities to certain qualified borrowers, including Fidelity Capital Markets (FCM), a broker-dealer affiliated with the Funds. On the settlement date of the loan, each applicable Fund receives collateral (in the form of U.S. Treasury obligations, letters of credit and/or cash) against the loaned securities and maintains collateral in an amount not less than 100% of the market value of the loaned securities during the period of the loan. The market value of the loaned securities is determined at the close of business of the Funds and any additional required collateral is delivered to the Funds on the next business day. If the borrower defaults on its obligation to return the securities loaned because of insolvency or other reasons, a fund could experience delays and costs in recovering the securities loaned or in gaining access to the collateral. Any cash collateral received is invested in the Fidelity Securities Lending Cash Central Fund. The value of loaned securities and cash collateral at period end are disclosed on each applicable Fund's Statement of Assets and Liabilities. Security lending income represents the income earned on investing cash collateral, less rebates paid to borrowers and any lending agent fees associated with the loan, plus any premium payments received for lending certain types of securities. Security lending income is presented on each applicable Fund's Statement of Operations as a component of income from Fidelity Central Funds. FCM security lending activity as of and during the period was as follows:
|
|
Security Lending Income From Securities Loaned to FCM |
Value of Securities
Loaned to FCM at |
|
Communications Equipment Portfolio |
$ 6,645 |
$ 321,810 |
|
Computers Portfolio |
25,838 |
- |
|
Electronics Portfolio |
20,515 |
- |
|
IT Services Portfolio |
2 |
- |
|
Software and Computer Services Portfolio |
40,431 |
- |
|
Technology Portfolio |
137,323 |
1,520,050 |
8. Bank Borrowings.
Each Fund is permitted to have bank borrowings for temporary or emergency purposes to fund shareholder redemptions or for other short-term liquidity requirements. Each Fund has established borrowing arrangements with certain banks. The interest rate on the borrowings is the bank's base rate, as revised from time to time. At period end, there were no bank borrowings outstanding. Each applicable Fund's activity in this program during the period for which loans were outstanding was as follows:
|
|
Average Loan |
Weighted Average Interest Rate |
Interest Expense |
|
Software and Computer Services Portfolio |
$ 4,086,000 |
.66% |
$ 225 |
Annual Report
Notes to Financial Statements - continued
9. Expense Reductions.
Many of the brokers with whom FMR places trades on behalf of certain Funds provided services to these Funds in addition to trade execution. These services included payments of expenses on behalf of each applicable Fund. In addition, through arrangements with each applicable Fund's custodian, credits realized as a result of uninvested cash balances were used to reduce each applicable Fund's expenses. All of the applicable expense reductions are noted in the table below.
|
|
Brokerage Service |
Custody |
|
Communications Equipment Portfolio |
$ 110,405 |
$ - |
|
Computers Portfolio |
181,092 |
35 |
|
Electronics Portfolio |
235,857 |
- |
|
IT Services Portfolio |
35,363 |
- |
|
Software and Computer Services Portfolio |
256,730 |
167 |
|
Technology Portfolio |
583,361 |
145 |
In addition, FMR reimbursed a portion of each Fund's operating expenses during the period as follows:
|
|
Reimbursement |
|
Communications Equipment Portfolio |
$ 170 |
|
Computers Portfolio |
406 |
|
Electronics Portfolio |
1,405 |
|
IT Services Portfolio |
220 |
|
Software and Computer Services Portfolio |
944 |
|
Technology Portfolio |
2,751 |
10. Other.
The Funds' organizational documents provide former and current trustees and officers with a limited indemnification against liabilities arising in connection with the performance of their duties to the Funds. In the normal course of business, the Funds may also enter into contracts that provide general indemnifications. The Funds' maximum exposure under these arrangements is unknown as this would be dependent on future claims that may be made against the Funds. The risk of material loss from such claims is considered remote.
At the end of the period, Strategic Advisers U.S. Opportunity Fund was the owner of record of approximately 21% and 16% of the total outstanding shares of IT Services Portfolio and Communications Equipment Portfolio, respectively. VIP Funds Manager 60% Portfolio was the owner of record of approximately 14% and 12% of the total outstanding shares of Computer Portfolio and IT Services Portfolio, respectively. Mutual funds managed by FMR or its affiliates, were the owners of record, in the aggregate, of approximately 29%, 40%, and 25% of the total outstanding shares of Computers Portfolio, IT Services Portfolio and Communications Equipment Portfolio, respectively.
Annual Report
Report of Independent Registered Public Accounting Firm
To the Trustees of Fidelity Select Portfolios and the Shareholders of Communications Equipment Portfolio, Computers Portfolio, Electronics Portfolio, IT Services Portfolio, Software and Computer Services Portfolio and Technology Portfolio:
In our opinion, the accompanying statements of assets and liabilities, including the schedules of investments, and the related statements of operations and of changes in net assets and the financial highlights present fairly, in all material respects, the financial positions of Communications Equipment Portfolio, Computers Portfolio, Electronics Portfolio, IT Services Portfolio, Software and Computer Services Portfolio and Technology Portfolio (funds of Fidelity Select Portfolios) at February 28, 2013, the results of each of their operations for the year then ended, the changes in each of their net assets for each of the two years in the period then ended and the financial highlights for each of the five years in the period then ended, in conformity with accounting principles generally accepted in the United States of America. These financial statements and financial highlights (hereafter referred to as "financial statements") are the responsibility of the Fidelity Select Portfolios' management. Our responsibility is to express an opinion on these financial statements based on our audits. We conducted our audits of these financial statements in accordance with the standards of the Public Company Accounting Oversight Board (United States). Those standards require that we plan and perform the audit to obtain reasonable assurance about whether the financial statements are free of material misstatement. An audit includes examining, on a test basis, evidence supporting the amounts and disclosures in the financial statements, assessing the accounting principles used and significant estimates made by management, and evaluating the overall financial statement presentation. We believe that our audits, which included confirmation of securities at February 28, 2013 by correspondence with the custodian and brokers, provide a reasonable basis for our opinion.
PricewaterhouseCoopers LLP
Boston, Massachusetts
April 22, 2013
Annual Report
Trustees and Officers
The Trustees, Members of the Advisory Board, and executive officers of the trust and funds, as applicable, are listed below. The Board of Trustees governs each fund and is responsible for protecting the interests of shareholders. The Trustees are experienced executives who meet periodically throughout the year to oversee each fund's activities, review contractual arrangements with companies that provide services to each fund, oversee management of the risks associated with such activities and contractual arrangements, and review each fund's performance. Except for James C. Curvey, each of the Trustees oversees 234 Fidelity funds. Mr. Curvey oversees 453 Fidelity funds.
The Trustees hold office without limit in time except that (a) any Trustee may resign; (b) any Trustee may be removed by written instrument, signed by at least two-thirds of the number of Trustees prior to such removal; (c) any Trustee who requests to be retired or who has become incapacitated by illness or injury may be retired by written instrument signed by a majority of the other Trustees; and (d) any Trustee may be removed at any special meeting of shareholders by a two-thirds vote of the outstanding voting securities of the trust. Each Trustee who is not an interested person of the trust and the funds (as defined in the 1940 Act) (Independent Trustee), shall retire not later than the last day of the calendar year in which his or her 75th birthday occurs. The Independent Trustees may waive this mandatory retirement age policy with respect to individual Trustees. The executive officers and Advisory Board Members hold office without limit in time, except that any officer and Advisory Board Member may resign or may be removed by a vote of a majority of the Trustees at any regular meeting or any special meeting of the Trustees. Except as indicated, each individual has held the office shown or other offices in the same company for the past five years.
Experience, Skills, Attributes, and Qualifications of the Funds' Trustees. The Governance and Nominating Committee has adopted a statement of policy that describes the experience, qualifications, attributes, and skills that are necessary and desirable for potential Independent Trustee candidates (Statement of Policy). The Board believes that each Trustee satisfied at the time he or she was initially elected or appointed a Trustee, and continues to satisfy, the standards contemplated by the Statement of Policy. The Governance and Nominating Committee also engages professional search firms to help identify potential Independent Trustee candidates who have the experience, qualifications, attributes, and skills consistent with the Statement of Policy. From time to time, additional criteria based on the composition and skills of the current Independent Trustees, as well as experience or skills that may be appropriate in light of future changes to board composition, business conditions, and regulatory or other developments, have also been considered by the professional search firms and the Governance and Nominating Committee. In addition, the Board takes into account the Trustees' commitment and participation in Board and committee meetings, as well as their leadership of standing and ad hoc committees throughout their tenure.
In determining that a particular Trustee was and continues to be qualified to serve as a Trustee, the Board has considered a variety of criteria, none of which, in isolation, was controlling. The Board believes that, collectively, the Trustees have balanced and diverse experience, qualifications, attributes, and skills, which allow the Board to operate effectively in governing each fund and protecting the interests of shareholders. Information about the specific experience, skills, attributes, and qualifications of each Trustee, which in each case led to the Board's conclusion that the Trustee should serve (or continue to serve) as a trustee of the funds, is provided below.
Board Structure and Oversight Function. James C. Curvey is an interested person (as defined in the 1940 Act) and currently serves as Chairman. The Trustees have determined that an interested Chairman is appropriate and benefits shareholders because an interested Chairman has a personal and professional stake in the quality and continuity of services provided to the funds. Independent Trustees exercise their informed business judgment to appoint an individual of their choosing to serve as Chairman, regardless of whether the Trustee happens to be independent or a member of management. The Independent Trustees have determined that they can act independently and effectively without having an Independent Trustee serve as Chairman and that a key structural component for assuring that they are in a position to do so is for the Independent Trustees to constitute a substantial majority for the Board. The Independent Trustees also regularly meet in executive session. Ned C. Lautenbach serves as Chairman of the Independent Trustees and as such (i) acts as a liaison between the Independent Trustees and management with respect to matters important to the Independent Trustees and (ii) with management prepares agendas for Board meetings.
Fidelity funds are overseen by different Boards of Trustees. The funds' Board oversees Fidelity's equity and high income funds and another Board oversees Fidelity's investment-grade bond, money market, and asset allocation funds. The asset allocation funds may invest in Fidelity funds overseen by the funds' Board. The use of separate Boards, each with its own committee structure, allows the Trustees of each group of Fidelity funds to focus on the unique issues of the funds they oversee, including common research, investment, and operational issues. On occasion, the separate Boards establish joint committees to address issues of overlapping consequences for the Fidelity funds overseen by each Board.
The Trustees operate using a system of committees to facilitate the timely and efficient consideration of all matters of importance to the Trustees, each fund, and fund shareholders and to facilitate compliance with legal and regulatory requirements and oversight of the funds' activities and associated risks. The Board, acting through its committees, has charged FMR and its affiliates with (i) identifying events or circumstances the occurrence of which could have demonstrably adverse effects on the funds' business and/or reputation; (ii) implementing processes and controls to lessen the possibility that such events or circumstances occur or to mitigate the effects of such events or circumstances if they do occur; and (iii) creating and maintaining a system designed to evaluate continuously business and market conditions in order to facilitate the identification and implementation processes described in (i) and (ii) above. Because the day-to-day operations and activities of the funds are carried out by or through FMR, its affiliates and other service providers, the funds' exposure to risks is mitigated but not eliminated by the processes overseen by the Trustees. While each of the Board's committees has responsibility for overseeing different aspects of the funds' activities, oversight is exercised primarily through the Operations, Audit, and Compliance Committees. In addition, the Independent Trustees have worked with FMR to enhance the Board's oversight of investment and financial risks, legal and regulatory risks, technology risks, and operational risks, including the development of additional risk reporting to the Board. For example, a working group comprised of Independent Trustees and FMR has worked and continues to work to review the Fidelity funds' valuation-related activities, reporting and risk management. Appropriate personnel, including but not limited to the funds' Chief Compliance Officer (CCO), FMR's internal auditor, the independent accountants, the funds' Treasurer and portfolio management personnel, make periodic reports to the Board's committees, as appropriate, including an annual review of FMR's risk management program for the Fidelity funds. The responsibilities of each standing committee, including their oversight responsibilities, are described further under "Standing Committees of the Funds' Trustees."
Annual Report
Trustees and Officers - continued
The funds' Statement of Additional Information (SAI) includes more information about the Trustees. To request a free copy, call Fidelity at 1-800-544-8544.
Interested Trustees*:
Correspondence intended for each Trustee who is an interested person may be sent to Fidelity Investments, 245 Summer Street, Boston, Massachusetts 02210.
|
Name, Year of Birth; Principal Occupations and Other Relevant Experience+ |
|
|
James C. Curvey (1935) |
|
|
|
Year of Election or Appointment: 2007 Mr. Curvey is Trustee and Chairman of the Board of Trustees of certain Trusts. Mr. Curvey also serves as Trustee (2007-present) of other investment companies advised by FMR. Mr. Curvey is a Director of Fidelity Investments Money Management, Inc. (2009-present), Director of Fidelity Research & Analysis Co. (2009-present) and Director of FMR and FMR Co., Inc. (2007-present). Mr. Curvey is also Vice Chairman (2007-present) and Director of FMR LLC. In addition, Mr. Curvey serves as an Overseer for the Boston Symphony Orchestra and a member of the Trustees of Villanova University. Previously, Mr. Curvey was the Vice Chairman (2006-2007) and Director (2000-2007) of FMR Corp. |
|
Ronald P. O'Hanley (1957) |
|
|
|
Year of Election or Appointment: 2011 Mr. O'Hanley is Director of FMR Co., Inc. (2010-present), Director of Fidelity Investments Money Management, Inc. (2010-present), Director of Fidelity Research & Analysis Company (2010-present), President of Fidelity Asset Management and Corporate Services and a member of Fidelity's Executive Committee (2010-present). Previously, Mr. O'Hanley served as President and Chief Executive Officer of BNY Mellon Asset Management (2007-2010). Mr. O'Hanley also served as Vice Chairman of Bank New York Mellon Corp. and a member of that firm's Executive Committee. Prior to the 2007 merger of The Bank of New York and Mellon Financial Corporation, he was Vice Chairman of Mellon Financial Corporation and President and Chief Executive Officer of Mellon Asset Management. He joined Mellon in February 1997. Mr. O'Hanley currently serves as Chairman of the Boston Public Library Foundation Board of Directors and sits on the Board of Directors of Beth Israel Deaconess Medical Center, the Board of Trustees of the Marine Biological Laboratory and the Advisory Board of the Maxwell School of Citizenship and Public Administration at Syracuse University. Mr. O'Hanley also chairs the Council on Asset Management for the Financial Services Roundtable and is a member of the Board of Directors of Institutional Investor's U.S. Institute. |
* Trustees have been determined to be "Interested Trustees" by virtue of, among other things, their affiliation with the trust or various entities under common control with FMR.
+ The information above includes each Trustee's principal occupation during the last five years and other information relating to the experience, attributes, and skills relevant to each Trustee's qualifications to serve as a Trustee, which led to the conclusion that each Trustee should serve as a Trustee for each fund.
Independent Trustees:
Correspondence intended for each Independent Trustee (that is, the Trustees other than the Interested Trustees) may be sent to Fidelity Investments, P.O. Box 55235, Boston, Massachusetts 02205-5235.
|
Name, Year of Birth; Principal Occupations and Other Relevant Experience+ |
|
|
Dennis J. Dirks (1948) |
|
|
|
Year of Election or Appointment: 2005 Prior to his retirement in May 2003, Mr. Dirks was Chief Operating Officer and a member of the Board of The Depository Trust & Clearing Corporation (DTCC). He also served as President, Chief Operating Officer, and Board member of The Depository Trust Company (DTC) and President and Board member of the National Securities Clearing Corporation (NSCC). In addition, Mr. Dirks served as Chief Executive Officer and Board member of the Government Securities Clearing Corporation, Chief Executive Officer and Board member of the Mortgage-Backed Securities Clearing Corporation, as a Trustee and a member of the Finance Committee of Manhattan College (2005-2008), and as a Trustee and a member of the Finance Committee of AHRC of Nassau County (2006-2008). Mr. Dirks is a member of the Independent Directors Council (IDC) Governing Council (2010-present) and Board of Directors for The Brookville Center for Children's Services, Inc. (2009-present). |
|
Alan J. Lacy (1953) |
|
|
|
Year of Election or Appointment: 2008 Mr. Lacy serves as Senior Adviser (2007-present) of Oak Hill Capital Partners, L.P. (private equity). Mr. Lacy also served as Chief Executive Officer (2000-2005) and Vice Chairman (2005-2006) of Sears Holdings Corporation and Sears, Roebuck and Co. (retail). In addition, Mr. Lacy serves as a member of the Board of Directors of Dave & Buster's Entertainment, Inc. (restaurant and entertainment complexes, 2010-present), Earth Fare, Inc. (retail grocery, 2012-present), The Hillman Companies, Inc. (hardware wholesalers, 2010-present), and Bristol-Myers Squibb Company (global pharmaceuticals, 2008-present). Mr. Lacy is a member of the Board of Trustees of The National Parks Conservation Association (2006-present). Previously, Mr. Lacy served as Chairman of the Board of Trustees of the National Parks Conservation Association (2008-2011) and as a member of the Board of Directors for the Western Union Company (global money transfer, 2006-2011). |
|
Ned C. Lautenbach (1944) |
|
|
|
Year of Election or Appointment: 2000 Mr. Lautenbach is Chairman of the Independent Trustees of the Equity and High Income Funds (2006-present). Mr. Lautenbach currently serves as the Lead Director of the Eaton Corporation Board of Directors (diversified industrial, 1997-present). Mr. Lautenbach is Chairman of the Board of Directors of the Philharmonic Center for the Arts in Naples, Florida (2012-present) and a member of the Council on Foreign Relations (1994-present). Previously, Mr. Lautenbach was a Partner/Advisory Partner at Clayton, Dubilier & Rice, LLC (private equity investment, 1998-2010), as well as a Director of Sony Corporation (2006-2007). |
|
Joseph Mauriello (1944) |
|
|
|
Year of Election or Appointment: 2008 Prior to his retirement in January 2006, Mr. Mauriello served in numerous senior management positions including Deputy Chairman and Chief Operating Officer (2004-2005), and Vice Chairman of Financial Services (2002-2004) of KPMG LLP US (professional services, 1965-2005). Mr. Mauriello currently serves as a member of the Board of Directors of XL Group plc. (global insurance and re-insurance, 2006-present). Previously, Mr. Mauriello served as a Director of the Hamilton Funds of the Bank of New York (2006-2007) and of Arcadia Resources Inc. (health care services and products, 2007-2012). |
|
Robert W. Selander (1950) |
|
|
|
Year of Election or Appointment: 2011 Previously, Mr. Selander served as a Member of the Advisory Board of Fidelity's Equity and High Income Funds (2011), Executive Vice Chairman (2010), Chief Executive Officer (2009-2010), and President and Chief Executive Officer (1997-2009) of Mastercard, Inc. |
|
Cornelia M. Small (1944) |
|
|
|
Year of Election or Appointment: 2005 Ms. Small is a member of the Board of Directors (2009-present) and Chair of the Investment Committee (2010-present) of the Teagle Foundation. Ms. Small also serves on the Investment Committee of the Berkshire Taconic Community Foundation (2008-present). Previously, Ms. Small served as Chairperson (2002-2008) and a member of the Investment Committee and Chairperson (2008-2012) and a member of the Board of Trustees of Smith College. In addition, Ms. Small served as Chief Investment Officer, Director of Global Equity Investments, and a member of the Board of Directors of Scudder, Stevens & Clark and Scudder Kemper Investments. |
|
William S. Stavropoulos (1939) |
|
|
|
Year of Election or Appointment: 2001 Mr. Stavropoulos is Vice Chairman of the Independent Trustees of the Equity and High Income Funds (2006-present). Mr. Stavropoulos serves as President and Founder of the Michigan Baseball Foundation, the Great Lakes Loons (2007-present). Mr. Stavropoulos is Chairman Emeritus of the Board of Directors of The Dow Chemical Company, where he previously served in numerous senior management positions, including President, CEO (1995-2000; 2002-2004), Chairman of the Executive Committee (2000-2006), and as a member of the Board of Directors (1990-2006). Currently, Mr. Stavropoulos is a Director of Univar Inc. (global distributor of commodity and specialty chemicals, Chairman from 2010-May 2012 and Lead Director from May 2012-present), Teradata Corporation (data warehousing and technology solutions, 2008-present), Maersk Inc. (industrial conglomerate), and Tyco International, Ltd. (multinational manufacturing and services, 2007-present), and a member of the Advisory Board for Metalmark Capital LLC (private equity investment, 2005-present). Mr. Stavropoulos is an operating advisor to Clayton, Dubilier & Rice, LLC (private equity investment). In addition, Mr. Stavropoulos is a member of the University of Notre Dame Advisory Council for the College of Science, a Trustee of the Rollin L. Gerstacker Foundation, and a Director of the Naples Philharmonic Center for the Arts. Previously, Mr. Stavropoulos served as a Director of Chemical Financial Corporation (bank holding company, 1993-2012). |
|
David M. Thomas (1949) |
|
|
|
Year of Election or Appointment: 2008 Previously, Mr. Thomas served as Executive Chairman (2005-2006) and Chairman and Chief Executive Officer (2000-2005) of IMS Health, Inc. (pharmaceutical and healthcare information solutions), and a Director of Fortune Brands, Inc. (consumer products, 2000-2011). In addition, Mr. Thomas serves as Non-Executive Chairman of the Board of Directors of Fortune Brands Home and Security (home and security products, 2011-present), and as a member of the Board of Directors of Interpublic Group of Companies, Inc. (marketing communication, 2004-present). |
|
Michael E. Wiley (1950) |
|
|
|
Year of Election or Appointment: 2008 Mr. Wiley also serves as a Director of Asia Pacific Exploration Consolidated (international oil and gas exploration and production, 2008-present). Mr. Wiley serves as a Director of Tesoro Corporation (independent oil refiner and marketer, 2005-present), and a Director of Bill Barrett Corporation (exploration and production, 2005-present). In addition, Mr. Wiley also serves as a Director of Post Oak Bank (privately-held bank, 2004-present). Previously, Mr. Wiley served as a member of the Board of Trustees of the University of Tulsa (2000-2006; 2007-2010), as a Senior Energy Advisor of Katzenbach Partners, LLC (consulting, 2006-2007), as an Advisory Director of Riverstone Holdings (private investment), Chairman, President, and CEO of Baker Hughes, Inc. (oilfield services, 2000-2004), and as Director of Spinnaker Exploration Company (exploration and production, 2001-2005). |
+ The information above includes each Trustee's principal occupation during the last five years and other information relating to the experience, attributes, and skills relevant to each Trustee's qualifications to serve as a Trustee, which led to the conclusion that each Trustee should serve as a Trustee for each fund.
Advisory Board Members and Executive Officers:
Correspondence intended for David A. Rosow and Garnett A. Smith may be sent to Fidelity Investments, P.O. Box 55235, Boston, Massachusetts 02205-5235. Correspondence intended for each executive officer and Peter S. Lynch may be sent to Fidelity Investments, 245 Summer Street, Boston, Massachusetts 02210.
|
Name, Year of Birth; Principal Occupation |
|
|
Peter S. Lynch (1944) |
|
|
|
Year of Election or Appointment: 2003 Member of the Advisory Board of Fidelity's Equity and High Income Funds. Mr. Lynch is Vice Chairman and a Director of FMR and FMR Co., Inc. In addition, Mr. Lynch serves as a Trustee of Boston College and as the Chairman of the Inner-City Scholarship Fund. Previously, Mr. Lynch served on the Special Olympics International Board of Directors (1997-2006). |
|
David A. Rosow (1942) |
|
|
|
Year of Election or Appointment: 2012 Member of the Advisory Board of Fidelity's Equity and High Income Funds. Chairman and Chief Executive Officer of International Golf Group, Inc. (golf course development, 1989-present). Previously, Mr. Rosow served as Chairman and Chief Executive Officer of Rosow & Company, Inc. (private investment company, 1989-2011), a Lead Director of Hudson United Bancorp (2001-2006) and as a Director of TD Banknorth (1996-2006). In addition, Mr. Rosow is a member (2008-present) and President (2009-present) of the Town Council of Palm Beach, Florida. |
|
Garnett A. Smith (1947) |
|
|
|
Year of Election or Appointment: 2012 Member of the Advisory Board of Fidelity's Equity and High Income Funds. Prior to Mr. Smith's retirement, he served as Chairman and Chief Executive Officer of Inbrand Corp. (manufacturer of personal absorbent products, 1990-1997). He also served as President (1986-1990) of Inbrand Corp. Prior to his employment with Inbrand Corp., he was employed by a retail fabric chain and North Carolina National Bank. In addition, Mr. Smith is a board member of the Jackson Hole Land Trust (2009-present). |
|
Kenneth B. Robins (1969) |
|
|
|
Year of Election or Appointment: 2008 President and Treasurer of Fidelity's Equity and High Income Funds. Mr. Robins also serves as President and Treasurer (2010-present) and Assistant Treasurer (2009-present) of other Fidelity funds and is an employee of Fidelity Investments (2004-present). Previously, Mr. Robins served as Deputy Treasurer of the Fidelity funds (2005-2008) and Treasurer and Chief Financial Officer of The North Carolina Capital Management Trust: Cash and Term Portfolios (2006-2008). |
|
Brian B. Hogan (1964) |
|
|
|
Year of Election or Appointment: 2009 Vice President of Equity and High Income Funds. Mr. Hogan also serves as President of FMR's Equity Division (2009-present). Previously, Mr. Hogan served as Senior Vice President, Equity Research of FMR (2006-2009) and as a portfolio manager. |
|
Christopher S. Bartel (1971) |
|
|
|
Year of Election or Appointment: 2009 Vice President of Fidelity's Sector and Real Estate Equity Funds. Mr. Bartel also serves as a Director, President, and Chief Executive Officer of Fidelity Management & Research (Japan) Inc. (2012-present), a Director of Fidelity Management & Research (Hong Kong) (2012-present), and Senior Vice President of Global Equity Research (2010-present). Previously, Mr. Bartel served as Senior Vice President of Equity Research (2009-2010), Managing Director of Research (2006-2009), and an analyst and portfolio manager (2000-2006). |
|
Scott C. Goebel (1968) |
|
|
|
Year of Election or Appointment: 2008 Secretary and Chief Legal Officer (CLO) of the Fidelity funds. Mr. Goebel also serves as Secretary of Fidelity Investments Money Management, Inc. (FIMM) (2010-present) and Fidelity Research and Analysis Company (FRAC) (2010-present); Secretary and CLO of The North Carolina Capital Management Trust: Cash and Term Portfolios (2008-present); General Counsel, Secretary, and Senior Vice President of FMR (2008-present) and FMR Co., Inc. (2008-present); employed by FMR LLC or an affiliate (2001-present); Chief Legal Officer of Fidelity Management & Research (Hong Kong) Limited (2008-present) and Assistant Secretary of Fidelity Management & Research (Japan) Inc. (2008-present), and Fidelity Management & Research (U.K.) Inc. (2008-present). Previously, Mr. Goebel served as Assistant Secretary of FIMM (2008-2010), FRAC (2008-2010), and the Funds (2007-2008) and as Vice President and Secretary of Fidelity Distributors Corporation (FDC) (2005-2007). |
|
William C. Coffey (1969) |
|
|
|
Year of Election or Appointment: 2009 Assistant Secretary of Fidelity's Equity and High Income Funds. Mr. Coffey also serves as Senior Vice President and Deputy General Counsel of FMR LLC (2010-present), and is an employee of Fidelity Investments. Previously, Mr. Coffey served as Vice President and Associate General Counsel of FMR LLC (2005-2009). |
|
Elizabeth Paige Baumann (1968) |
|
|
|
Year of Election or Appointment: 2012 Anti-Money Laundering (AML) Officer of the Fidelity funds. Ms. Baumann also serves as AML Officer of The North Carolina Capital Management Trust: Cash and Term Portfolios (2012-present), Chief AML Officer of FMR LLC (2012-present), and is an employee of Fidelity Investments. Previously, Ms. Baumann served as Vice President and Deputy Anti-Money Laundering Officer (2007-2012). |
|
Christine Reynolds (1958) |
|
|
|
Year of Election or Appointment: 2008 Chief Financial Officer of the Fidelity funds. Ms. Reynolds became President of Fidelity Pricing and Cash Management Services (FPCMS) in August 2008. Ms. Reynolds served as Chief Operating Officer of FPCMS (2007-2008). Previously, Ms. Reynolds served as President, Treasurer, and Anti-Money Laundering officer of the Fidelity funds (2004-2007). |
|
Joseph A. Hanlon (1968) |
|
|
|
Year of Election or Appointment: 2012 Chief Compliance Officer of Fidelity's Equity and High Income Funds. Mr. Hanlon serves as Compliance Officer of FMR, FMR Co., Inc., Fidelity Investments Money Management, Inc. (FIMM), Fidelity Research and Analysis Company (FRAC), Fidelity Management & Research (Japan) Inc., Fidelity Management & Research (U.K.) Inc., Fidelity Management & Research (Hong Kong), and Strategic Advisers, Inc. (2009-present), as Senior Vice President of the Fidelity Asset Management Division (2009-present), and is an employee of Fidelity Investments. |
|
Joseph F. Zambello (1957) |
|
|
|
Year of Election or Appointment: 2011 Deputy Treasurer of the Fidelity funds. Mr. Zambello is an employee of Fidelity Investments. Previously, Mr. Zambello served as Vice President of FMR's Program Management Group (2009-2011) and Vice President of the Transfer Agent Oversight Group (2005-2009). |
|
Adrien E. Deberghes (1967) |
|
|
|
Year of Election or Appointment: 2008 Deputy Treasurer of Fidelity's Equity and High Income Funds. Mr. Deberghes also serves as Vice President (2011-present) and Assistant Treasurer (2010-present) of other Fidelity funds, and is an employee of Fidelity Investments (2008-present). Previously, Mr. Deberghes served as Senior Vice President of Mutual Fund Administration at State Street Corporation (2007-2008), Senior Director of Mutual Fund Administration at Investors Bank & Trust (2005-2007), and Director of Finance for Dunkin' Brands (2000-2005). |
|
Stephen Sadoski (1971) |
|
|
|
Year of Election or Appointment: 2012 Deputy Treasurer of Fidelity's Equity and High Income Funds. Mr. Sadoski also serves as Deputy Treasurer of other Fidelity funds (2013-present) and is an employee of Fidelity Investments (2012-present). Previously, Mr. Sadoski served as Assistant Treasurer of Fidelity's Fixed Income and Asset Allocation Funds (2012-2013), an assistant chief accountant in the Division of Investment Management of the Securities and Exchange Commission (SEC) (2009-2012) and as a senior manager at Deloitte & Touche (1997-2009). |
|
Stacie Smith (1974) |
|
|
|
Year of Election or Appointment: 2013 Deputy Treasurer of Fidelity's Equity and High Income Funds. Ms. Smith is an employee of Fidelity Investments (2009-present). Previously, Ms. Smith served as Senior Audit Manager of Ernst & Young LLP (1996-2009). |
|
Stephanie J. Dorsey (1969) |
|
|
|
Year of Election or Appointment: 2010 Assistant Treasurer of Fidelity's Equity and High Income Funds. Ms. Dorsey also serves as President and Treasurer (2013-present) and Assistant Treasurer (2012-present) of other Fidelity funds and is an employee of Fidelity Investments (2008-present). Previously, Ms. Dorsey served as Deputy Treasurer of Fidelity's Fixed Income and Asset Allocation Funds (2008-2013), Treasurer (2004-2008) of the JPMorgan Mutual Funds and Vice President (2004-2008) of JPMorgan Chase Bank. |
|
John R. Hebble (1958) |
|
|
|
Year of Election or Appointment: 2009 Assistant Treasurer of Fidelity's Equity and High Income Funds. Mr. Hebble also serves as President (2011-present), Treasurer, and Chief Financial Officer of The North Carolina Capital Management Trust: Cash and Term Portfolios (2008-present) and is an employee of Fidelity Investments. Previously, Mr. Hebble served as President and Treasurer of Fidelity's Fixed Income and Asset Allocation Funds (2008-2013). |
|
Gary W. Ryan (1958) |
|
|
|
Year of Election or Appointment: 2005 Assistant Treasurer of the Fidelity funds. Mr. Ryan is an employee of Fidelity Investments. Previously, Mr. Ryan served as Vice President of Fund Reporting in Fidelity Pricing and Cash Management Services (FPCMS) (1999-2005). |
|
Jonathan Davis (1968) |
|
|
|
Year of Election or Appointment: 2010 Assistant Treasurer of the Fidelity funds. Mr. Davis is also Assistant Treasurer of Fidelity Rutland Square Trust II and Fidelity Commonwealth Trust II. Mr. Davis is an employee of Fidelity Investments. Previously, Mr. Davis served as Vice President and Associate General Counsel of FMR LLC (2003-2010). |
Annual Report
Distributions (Unaudited)
The Board of Trustees of each fund voted to pay to shareholders of record at the opening of business on record date the following distributions per share derived from capital gains realized from sales of portfolio securities and dividends derived from net investment income:
|
|
Pay Date |
Record Date |
Dividends |
Capital Gains |
|
Communications Equipment Portfolio |
04/15/13 |
04/12/13 |
$0.000 |
$0.000 |
|
Computers Portfolio |
04/15/13 |
04/12/13 |
$0.041 |
$4.871 |
|
Electronics Portfolio |
04/15/13 |
04/12/13 |
$0.002 |
$0.000 |
|
IT Services Portfolio |
04/15/13 |
04/12/13 |
$0.000 |
$0.124 |
|
Software and Computer Services Portfolio |
04/15/13 |
04/12/13 |
$0.000 |
$0.000 |
|
Technology Portfolio |
04/15/13 |
04/12/13 |
$0.000 |
$0.918 |
The funds hereby designate as capital gain dividend the amounts noted below for the taxable year ended February 28, 2013, or, if subsequently determined to be different, the net capital gain of such year.
|
Computers Portfolio |
$50,128,880 |
|
IT Services Portfolio |
$2,487,462 |
|
Software and Computer Services Portfolio |
$19,512,822 |
|
Technology Portfolio |
$17,255,652 |
A percentage of the dividends distributed during the fiscal year for the following funds qualify for the dividends-received deduction for corporate shareholders:
|
|
April 13, 2012 |
December 7, 2012 |
December 21, 2012 |
December 27, 2012 |
|
Communications Equipment Portfolio |
100% |
100% |
- |
0% |
|
Computers Portfolio |
0% |
- |
100% |
- |
|
Electronics Portfolio |
0% |
100% |
- |
100% |
|
Software and Computer Services Portfolio |
7% |
- |
42% |
- |
A percentage of the dividends distributed during the fiscal year for the following funds may be taken into account as a dividend for purposes of the maximum rate under section 1(h) (11) of the Internal Revenue Code:
|
|
April 13, 2012 |
December 7, 2012 |
December 21, 2012 |
December 27, 2012 |
|
Communications Equipment Portfolio |
100% |
100% |
- |
0% |
|
Computers Portfolio |
0% |
- |
100% |
- |
|
Electronics Portfolio |
0% |
100% |
- |
100% |
|
Software and Computer Services Portfolio |
8% |
- |
44% |
- |
The funds will notify shareholders in January 2014 of amounts for use in preparing 2013 income tax returns.
Annual Report
Board Approval of Investment Advisory Contracts and Management Fees
Communications Equipment Portfolio
Computers Portfolio
Electronics Portfolio
IT Services Portfolio
Software and Computer Services Portfolio
Technology Portfolio
On November 14, 2012, the Board of Trustees, including the Independent Trustees (together, the Board), voted to approve a new management contract (the New Contracts) between each fund and Fidelity SelectCo, LLC (SelectCo) and to submit the New Contracts to shareholders for their approval. If the New Contracts are approved by shareholders, effective August 1, 2013, SelectCo will serve as investment adviser to each fund. The terms of the New Contracts are identical to those of the current management contracts with FMR (the Current Contracts), except with respect to the name of the investment adviser and the dates of execution and the initial two-year term of the contract. The Board, assisted by the advice of fund counsel and Independent Trustees' counsel, considered a broad range of information.
In determining whether to approve the New Contracts for the funds, the Board was aware that shareholders in the funds have a broad range of investment choices available to them, including a wide choice among mutual funds offered by competitors to Fidelity, and that each fund's shareholders, with the opportunity to review and weigh the disclosure provided by the fund in its prospectus and other public disclosures, have chosen to invest in the fund, managed by Fidelity.
Nature, Extent, and Quality of Services Provided. The Board considered the nature, quality, cost and extent of the services to be provided by SelectCo under the New Contracts as well as the nature, quality, cost and extent of the advisory, administrative, distribution and shareholder services performed by the FMR and the sub-advisers, and by affiliated companies. The Board considered that, upon shareholder approval, SelectCo will render the same services to the funds under the New Contracts that FMR currently renders to the funds under the Current Contracts. The Board also considered that the New Contracts would not result in any changes to (i) the investment process or strategies employed in the management of the funds' assets or (ii) the day-to-day management of the funds or the persons primarily responsible for such management.
Throughout the year, the Trustees had discussions with FMR about plans to establish SelectCo as a new investment adviser to manage sector-based funds and products. The Trustees considered Fidelity's rationale for creating a separate investment adviser and noted that a separate investment adviser may be better positioned to focus on opportunities for growth within the sector investing space and to focus on a distinct approach to sector investing and research.
Shareholder and Administrative Services. The Board noted that the growth of fund assets across the complex allows Fidelity to reinvest in the development of services designed to enhance the value or convenience of the Fidelity funds as investment vehicles. These services include 24-hour access to account information and market information through phone representatives and over the Internet, and investor education materials and asset allocation tools.
Investment in a Large Fund Family. The Board considered the benefits to shareholders of investing in a Fidelity fund, including the benefits of investing in a fund that is part of a large family of funds offering a variety of investment disciplines and providing for a large variety of mutual fund shareholder services.
Investment Performance. The Board did not consider performance to be a material factor in its decision to approve the New Contracts because the New Contracts would not result in any changes to the funds' investment processes or strategies or in the persons primarily responsible for the day-to-day management of the funds.
Based on its review, the Board concluded that the nature, extent, and quality of the services provided to each fund will benefit the fund's shareholders, particularly in light of the Board's view that the fund's shareholders benefit from investing in a fund that is part of a large family of funds offering a variety of investment disciplines and services.
Competitiveness of Management Fee and Total Fund Expenses. The Board considered that, if approved by shareholders, the New Contracts would not result in any changes to the amount of the management fees paid by the funds, except that such fees would be paid to SelectCo rather than FMR. The Board noted that at previous meetings during the year it received and considered materials relating to its review of the management fee of each fund. This information includes comparisons that focus on a fund's standing relative to the total universe of comparable funds available to investors in terms of gross management fees before expense reimbursements or caps, as well as a fund's standing relative to non-Fidelity funds similar in size to the fund within the comparison group.
Based on its review, the Board concluded that each fund's management fee was fair and reasonable in light of the services that the fund receives and the other factors considered.
Annual Report
Because there are no expected changes in the funds' management fees under the New Contracts, the Board will review each fund's total expenses compared to competitive fund median expenses in connection with its future consideration of the renewal of the funds' management contracts and sub-advisory agreements.
In its review of total expenses, the Board also noted that at previous meetings during the year it received and considered materials relating to its review of total expenses for each Fidelity fund. This information includes Fidelity fee structures and other information with respect to clients of FMR and its affiliates, such as other mutual funds advised or sub-advised by FMR or its affiliates, pension plan clients, and other institutional clients.
Costs of the Services and Profitability. Because there were no changes to the services to be provided or fees to be charged to the funds under the New Contracts, the Board did not consider data regarding the impact on Fidelity's costs of services, revenues, or profitability from the new arrangements to be a significant factor in its decision.
In connection with its future consideration of the renewal of each fund's management contract and sub-advisory agreements, the Board will consider the revenues earned and the expenses incurred by Fidelity in conducting the business of developing, marketing, distributing, managing, administering and servicing the funds and their shareholders.
Economies of Scale. The Board recognized that the New Contracts, like the Current Contracts, incorporate a "group fee" structure, which provides for lower fee rates as total fund assets under FMR's management increase, and for higher fee rates as total fund assets under FMR's management decrease. The Board considered that the group fee is designed to deliver the benefits of economies of scale to fund shareholders when total fund assets increase, even if assets of any particular fund are unchanged or have declined, because some portion of Fidelity's costs are attributable to services provided to all Fidelity funds, and all funds benefit if those costs can be allocated among more assets. The Board concluded that, given the group fee structure, fund shareholders will achieve a certain level of economies of scale as assets under FMR's management increase at the fund complex level, regardless of whether Fidelity achieves any such economies of scale.
In connection with its future consideration of the renewal of each fund's management contract and sub-advisory agreements, the Board will consider whether there have been economies of scale in respect of the management of the Fidelity funds, whether the Fidelity funds (including the funds) have appropriately benefited from any such economies of scale, and whether there is potential for realization of any further economies of scale.
Based on its evaluation of all of the conclusions noted above, and after considering all material factors, the Board ultimately concluded that each New Contract is fair and reasonable, and that the New Contracts should be approved and submitted to the applicable funds' shareholders for their approval.
Annual Report
Investment Adviser
Fidelity Management & Research Company
Boston, MA
Investment Sub-Advisers
FMR Co., Inc.
Fidelity Management & Research (U.K.) Inc.
Fidelity Management & Research (Hong Kong) Limited
Fidelity Management & Research (Japan) Inc.
General Distributor
Fidelity Distributors Corporation
Smithfield, RI
Transfer and Service Agents
Fidelity Investments Institutional Operations Company, Inc.
Boston, MA
Fidelity Service Company, Inc.
Boston, MA
Custodian
Brown Brothers Harriman & Co.
Boston, MA
Corporate Headquarters
245 Summer Street
Boston, MA 02210
1-800-544-8888
The Fidelity Telephone Connection
Mutual Fund 24-Hour Service
Exchanges/Redemptions
and Account Assistance 1-800-544-6666
Product Information 1-800-544-8888
Retirement Accounts 1-800-544-4774
(8 a.m. - 9 p.m.)
TDD Service 1-800-544-0118
for the deaf and hearing impaired
(9 a.m. - 9 p.m. Eastern time)
Fidelity Automated Service
Telephone (FAST®) 
1-800-544-5555
Automated line for quickest service

SELTEC-UANNPRO-0413
1.910423.103
Item 2. Code of Ethics
As of the end of the period, February 28, 2013, Fidelity Select Portfolios (the trust) has adopted a code of ethics, as defined in Item 2 of Form N-CSR, that applies to its President and Treasurer and its Chief Financial Officer. A copy of the code of ethics is filed as an exhibit to this Form N-CSR.
Item 3. Audit Committee Financial Expert
The Board of Trustees of the trust has determined that Joseph Mauriello is an audit committee financial expert, as defined in Item 3 of Form N-CSR. Mr. Mauriello is independent for purposes of Item 3 of Form N-CSR.
Item 4. Principal Accountant Fees and Services
Fees and Services
The following table presents fees billed by PricewaterhouseCoopers LLP ("PwC") in each of the last two fiscal years for services rendered to Air Transportation Portfolio, Automotive Portfolio, Banking Portfolio, Biotechnology Portfolio, Brokerage and Investment Management Portfolio, Chemicals Portfolio, Communications Equipment Portfolio, Computers Portfolio, Construction and Housing Portfolio, Consumer Discretionary Portfolio, Consumer Finance Portfolio, Consumer Staples Portfolio, Defense and Aerospace Portfolio, Electronics Portfolio, Energy Portfolio, Energy Service Portfolio, Environment and Alternative Energy Portfolio, Financial Services Portfolio, Gold Portfolio, Health Care Portfolio, Industrial Equipment Portfolio, Industrials Portfolio, Insurance Portfolio, IT Services Portfolio, Leisure Portfolio, Materials Portfolio, Medical Delivery Portfolio, Medical Equipment and Systems Portfolio, Multimedia Portfolio, Natural Gas Portfolio, Natural Resources Portfolio, Pharmaceuticals Portfolio, Retailing Portfolio, Software and Computer Services Portfolio, Technology Portfolio, Telecommunications Portfolio, Transportation Portfolio, Utilities Portfolio and Wireless Portfolio (the "Funds"):
Services Billed by PwC
February 28, 2013 FeesA
|
|
Audit Fees |
Audit-Related Fees |
Tax Fees |
All Other Fees |
|
Air Transportation Portfolio |
$34,000 |
$- |
$2,700 |
$1,500 |
|
Automotive Portfolio |
$33,000 |
$- |
$2,700 |
$1,500 |
|
Banking Portfolio |
$34,000 |
$- |
$2,700 |
$1,700 |
|
Biotechnology Portfolio |
$41,000 |
$- |
$2,700 |
$2,400 |
|
Brokerage and Investment Management Portfolio |
$34,000 |
$- |
$2,700 |
$1,700 |
|
Chemicals Portfolio |
$35,000 |
$- |
$2,700 |
$1,900 |
|
Communications Equipment Portfolio |
$35,000 |
$- |
$2,700 |
$1,600 |
|
Computers Portfolio |
$35,000 |
$- |
$2,700 |
$1,800 |
|
Construction and Housing Portfolio |
$33,000 |
$- |
$2,700 |
$1,600 |
|
Consumer Discretionary Portfolio |
$38,000 |
$- |
$2,700 |
$1,600 |
|
Consumer Finance Portfolio |
$37,000 |
$- |
$2,700 |
$1,600 |
|
Consumer Staples Portfolio |
$40,000 |
$- |
$2,700 |
$2,300 |
|
Defense and Aerospace Portfolio |
$34,000 |
$- |
$2,700 |
$1,800 |
|
Electronics Portfolio |
$35,000 |
$- |
$2,700 |
$1,900 |
|
Energy Portfolio |
$36,000 |
$- |
$2,900 |
$2,400 |
|
Energy Service Portfolio |
$35,000 |
$- |
$2,700 |
$2,000 |
|
Environment and Alternative Energy Portfolio |
$33,000 |
$- |
$2,700 |
$1,500 |
|
Financial Services Portfolio |
$34,000 |
$- |
$2,700 |
$1,700 |
|
Gold Portfolio |
$57,000 |
$- |
$6,400 |
$2,900 |
|
Health Care Portfolio |
$37,000 |
$- |
$2,700 |
$2,500 |
|
Industrial Equipment Portfolio |
$38,000 |
$- |
$2,700 |
$1,600 |
|
Industrials Portfolio |
$34,000 |
$- |
$2,700 |
$1,700 |
|
Insurance Portfolio |
$37,000 |
$- |
$2,700 |
$1,600 |
|
IT Services Portfolio |
$34,000 |
$- |
$2,700 |
$1,600 |
|
Leisure Portfolio |
$35,000 |
$- |
$2,700 |
$1,700 |
|
Materials Portfolio |
$41,000 |
$- |
$2,700 |
$2,100 |
|
Medical Delivery Portfolio |
$35,000 |
$- |
$2,700 |
$1,800 |
|
Medical Equipment and Systems Portfolio |
$35,000 |
$- |
$2,700 |
$2,000 |
|
Multimedia Portfolio |
$34,000 |
$- |
$2,700 |
$1,600 |
|
Natural Gas Portfolio |
$34,000 |
$- |
$2,700 |
$1,800 |
|
Natural Resources Portfolio |
$34,000 |
$- |
$2,700 |
$2,000 |
|
Pharmaceuticals Portfolio |
$34,000 |
$- |
$2,700 |
$1,800 |
|
Retailing Portfolio |
$34,000 |
$- |
$2,700 |
$1,700 |
|
Software and Computer Services Portfolio |
$36,000 |
$- |
$2,700 |
$2,200 |
|
Technology Portfolio |
$36,000 |
$- |
$2,700 |
$2,400 |
|
Telecommunications Portfolio |
$38,000 |
$- |
$2,700 |
$1,700 |
|
Transportation Portfolio |
$35,000 |
$- |
$2,700 |
$1,600 |
|
Utilities Portfolio |
$34,000 |
$- |
$2,700 |
$1,700 |
|
Wireless Portfolio |
$33,000 |
$- |
$2,700 |
$1,600 |
February 29, 2012 FeesA
|
|
Audit Fees |
Audit-Related Fees |
Tax Fees |
All Other Fees |
|
Air Transportation Portfolio |
$33,000 |
$- |
$2,700 |
$1,600 |
|
Automotive Portfolio |
$33,000 |
$- |
$2,700 |
$1,600 |
|
Banking Portfolio |
$33,000 |
$- |
$2,700 |
$1,700 |
|
Biotechnology Portfolio |
$38,000 |
$- |
$2,700 |
$2,100 |
|
Brokerage and Investment Management Portfolio |
$33,000 |
$- |
$2,700 |
$1,700 |
|
Chemicals Portfolio |
$33,000 |
$- |
$2,700 |
$1,900 |
|
Communications Equipment Portfolio |
$33,000 |
$- |
$2,700 |
$1,700 |
|
Computers Portfolio |
$33,000 |
$- |
$2,700 |
$1,800 |
|
Construction and Housing Portfolio |
$32,000 |
$- |
$2,700 |
$1,600 |
|
Consumer Discretionary Portfolio |
$32,000 |
$- |
$2,700 |
$1,600 |
|
Consumer Finance Portfolio |
$32,000 |
$- |
$2,700 |
$1,600 |
|
Consumer Staples Portfolio |
$38,000 |
$- |
$2,700 |
$2,200 |
|
Defense and Aerospace Portfolio |
$33,000 |
$- |
$2,700 |
$1,800 |
|
Electronics Portfolio |
$34,000 |
$- |
$2,700 |
$2,000 |
|
Energy Portfolio |
$35,000 |
$- |
$2,900 |
$2,600 |
|
Energy Service Portfolio |
$34,000 |
$- |
$2,700 |
$2,200 |
|
Environment and Alternative Energy Portfolio |
$32,000 |
$- |
$2,700 |
$1,600 |
|
Financial Services Portfolio |
$33,000 |
$- |
$2,700 |
$1,700 |
|
Gold Portfolio |
$57,000 |
$- |
$6,400 |
$3,500 |
|
Health Care Portfolio |
$35,000 |
$- |
$2,700 |
$2,400 |
|
Industrial Equipment Portfolio |
$37,000 |
$- |
$2,700 |
$1,700 |
|
Industrials Portfolio |
$33,000 |
$- |
$2,700 |
$1,800 |
|
Insurance Portfolio |
$33,000 |
$- |
$2,700 |
$1,600 |
|
IT Services Portfolio |
$32,000 |
$- |
$2,700 |
$1,600 |
|
Leisure Portfolio |
$33,000 |
$- |
$2,700 |
$1,700 |
|
Materials Portfolio |
$38,000 |
$- |
$2,700 |
$2,100 |
|
Medical Delivery Portfolio |
$33,000 |
$- |
$2,700 |
$1,900 |
|
Medical Equipment and Systems Portfolio |
$35,000 |
$- |
$2,700 |
$2,100 |
|
Multimedia Portfolio |
$32,000 |
$- |
$2,700 |
$1,600 |
|
Natural Gas Portfolio |
$33,000 |
$- |
$2,700 |
$1,900 |
|
Natural Resources Portfolio |
$34,000 |
$- |
$2,700 |
$2,200 |
|
Pharmaceuticals Portfolio |
$33,000 |
$- |
$2,700 |
$1,800 |
|
Retailing Portfolio |
$33,000 |
$- |
$2,700 |
$1,700 |
|
Software and Computer Services Portfolio |
$34,000 |
$- |
$2,700 |
$2,100 |
|
Technology Portfolio |
$35,000 |
$- |
$2,700 |
$2,600 |
|
Telecommunications Portfolio |
$36,000 |
$- |
$2,700 |
$1,700 |
|
Transportation Portfolio |
$34,000 |
$- |
$2,700 |
$1,700 |
|
Utilities Portfolio |
$32,000 |
$- |
$2,700 |
$1,800 |
|
Wireless Portfolio |
$32,000 |
$- |
$2,700 |
$1,700 |
|
|
|
|
|
|
A Amounts may reflect rounding.
The following table presents fees billed by PwC that were required to be approved by the Audit Committee for services that relate directly to the operations and financial reporting of the Funds and that are rendered on behalf of Fidelity Management & Research Company ("FMR") and entities controlling, controlled by, or under common control with FMR (not including any sub-adviser whose role is primarily portfolio management and is subcontracted with or overseen by another investment adviser) that provide ongoing services to the Funds ("Fund Service Providers"):
Services Billed by PwC
|
|
February 28, 2013A |
February 29, 2012A |
|
Audit-Related Fees |
$4,755,000 |
$3,795,000 |
|
Tax Fees |
$- |
$- |
|
All Other Fees |
$- |
$- |
A Amounts may reflect rounding.
"Audit-Related Fees" represent fees billed for assurance and related services that are reasonably related to the performance of the fund audit or the review of the fund's financial statements and that are not reported under Audit Fees.
"Tax Fees" represent fees billed for tax compliance, tax advice or tax planning that relate directly to the operations and financial reporting of the fund.
"All Other Fees" represent fees billed for services provided to the fund or Fund Service Provider, a significant portion of which are assurance related, that relate directly to the operations and financial reporting of the fund, excluding those services that are reported under Audit Fees, Audit-Related Fees or Tax Fees.
Assurance services must be performed by an independent public accountant.
* * *
The aggregate non-audit fees billed by PwC for services rendered to the Funds, FMR (not including any sub-adviser whose role is primarily portfolio management and is subcontracted with or overseen by another investment adviser), and any Fund Service Provider for each of the last two fiscal years of the Funds are as follows:
|
Billed By |
February 28, 2013 A |
February 29, 2012 A |
|
PwC |
$5,585,000 |
$5,305,000 |
A Amounts may reflect rounding.
The trust's Audit Committee has considered non-audit services that were not pre-approved that were provided by PwC to Fund Service Providers to be compatible with maintaining the independence of PwC in its audit of the Funds, taking into account representations from PwC, in accordance with Public Company Accounting Oversight Board rules, regarding its independence from the Funds and their related entities and FMR's review of the appropriateness and permissibility under applicable law of such non-audit services prior to their provision to the Fund Service Providers.
Audit Committee Pre-Approval Policies and Procedures
The trust's Audit Committee must pre-approve all audit and non-audit services provided by a fund's independent registered public accounting firm relating to the operations or financial reporting of the fund. Prior to the commencement of any audit or non-audit services to a fund, the Audit Committee reviews the services to determine whether they are appropriate and permissible under applicable law.
The Audit Committee has adopted policies and procedures to, among other purposes, provide a framework for the Committee's consideration of non-audit services by the audit firms that audit the Fidelity funds. The policies and procedures require that any non-audit service provided by a fund audit firm to a Fidelity fund and any non-audit service provided by a fund auditor to a Fund Service Provider that relates directly to the operations and financial reporting of a Fidelity fund ("Covered Service") are subject to approval by the Audit Committee before such service is provided.
All Covered Services must be approved in advance of provision of the service either: (i) by formal resolution of the Audit Committee, or (ii) by oral or written approval of the service by the Chair of the Audit Committee (or if the Chair is unavailable, such other member of the Audit Committee as may be designated by the Chair to act in the Chair's absence). The approval contemplated by (ii) above is permitted where the Treasurer determines that action on such an engagement is necessary before the next meeting of the Audit Committee.
Non-audit services provided by a fund audit firm to a Fund Service Provider that do not relate directly to the operations and financial reporting of a Fidelity fund are reported to the Audit Committee on a periodic basis.
Non-Audit Services Approved Pursuant to Rule 2-01(c)(7)(i)(C) and (ii) of Regulation S-X ("De Minimis Exception")
There were no non-audit services approved or required to be approved by the Audit Committee pursuant to the De Minimis Exception during the Funds' last two fiscal years relating to services provided to (i) the Funds or (ii) any Fund Service Provider that relate directly to the operations and financial reporting of the Funds.
Item 5. Audit Committee of Listed Registrants
Not applicable.
Item 6. Investments
(a) Not applicable.
(b) Not applicable
Item 7. Disclosure of Proxy Voting Policies and Procedures for Closed-End Management Investment Companies
Not applicable.
Item 8. Portfolio Managers of Closed-End Management Investment Companies
Not applicable.
Item 9. Purchase of Equity Securities by Closed-End Management Investment Company and Affiliated Purchasers
Not applicable.
Item 10. Submission of Matters to a Vote of Security Holders
There were no material changes to the procedures by which shareholders may recommend nominees to the trust's Board of Trustees.
Item 11. Controls and Procedures
(a)(i) The President and Treasurer and the Chief Financial Officer have concluded that the trust's disclosure controls and procedures (as defined in Rule 30a-3(c) under the Investment Company Act) provide reasonable assurances that material information relating to the trust is made known to them by the appropriate persons, based on their evaluation of these controls and procedures as of a date within 90 days of the filing date of this report.
(a)(ii) There was no change in the trust's internal control over financial reporting (as defined in Rule 30a-3(d) under the Investment Company Act) that occurred during the second fiscal quarter of the period covered by this report that has materially affected, or is reasonably likely to materially affect, the trust's internal control over financial reporting.
Item 12. Exhibits
|
(a) |
(1) |
Code of Ethics pursuant to Item 2 of Form N-CSR is filed and attached hereto as EX-99.CODE ETH. |
|
(a) |
(2) |
Certification pursuant to Rule 30a-2(a) under the Investment Company Act of 1940 (17 CFR 270.30a-2(a)) is filed and attached hereto as Exhibit 99.CERT. |
|
(a) |
(3) |
Not applicable. |
|
(b) |
|
Certification pursuant to Rule 30a-2(b) under the Investment Company Act of 1940 (17 CFR 270.30a-2(b)) is furnished and attached hereto as Exhibit 99.906CERT. |
SIGNATURES
Pursuant to the requirements of the Securities Exchange Act of 1934 and the Investment Company Act of 1940, the registrant has duly caused this report to be signed on its behalf by the undersigned, thereunto duly authorized.
Fidelity Select Portfolios
|
By: |
/s/Kenneth B. Robins |
|
|
Kenneth B. Robins |
|
|
President and Treasurer |
|
|
|
|
Date: |
April 25, 2013 |
Pursuant to the requirements of the Securities Exchange Act of 1934 and the Investment Company Act of 1940, this report has been signed below by the following persons on behalf of the registrant and in the capacities and on the dates indicated.
|
By: |
/s/Kenneth B. Robins |
|
|
Kenneth B. Robins |
|
|
President and Treasurer |
|
|
|
|
Date: |
April 25, 2013 |
|
By: |
/s/Christine Reynolds |
|
|
Christine Reynolds |
|
|
Chief Financial Officer |
|
|
|
|
Date: |
April 25, 2013 |