UNITED STATES SECURITIES AND EXCHANGE COMMISSION
Washington, D.C. 20549
FORM N-CSR
CERTIFIED SHAREHOLDER REPORT OF REGISTERED
MANAGEMENT INVESTMENT COMPANIES
Investment Company Act File number: 811-03101
CALVERT MANAGEMENT SERIES
(Exact Name of Registrant as Specified in Charter)
1825 Connecticut Avenue NW, Suite 400, Washington, DC 20009
(Address of Principal Executive Offices)
Maureen A. Gemma
Two International Place, Boston, Massachusetts 02110
(Name and Address of Agent for Service)
(202) 238-2200
(Registrant's Telephone Number)
September 30
Date of Fiscal Year End
September 30, 2019
Date of Reporting Period
____________________________________________________________________________________
Item 1. Report to Stockholders.
Calvert Floating-Rate Advantage Fund
Calvert Floating-Rate Advantage Fund |
Important Note. Beginning on January 1, 2021, as permitted by regulations adopted by the Securities and Exchange Commission, paper copies of the Fund’s annual and semi-annual shareholder reports will no longer be sent by mail unless you specifically request paper copies of the reports. Instead, the reports will be made available on the Fund’s website (calvert.com/prospectus), and you will be notified by mail each time a report is posted and provided with a website address to access the report.
If you already elected to receive shareholder reports electronically, you will not be affected by this change and you need not take any action. If you are a direct investor, you may elect to receive shareholder reports and other communications from the Fund electronically by signing up for e-Delivery at calvert.com. If you own your shares through a financial intermediary (such as a broker-dealer or bank), you must contact your financial intermediary to sign up.
You may elect to receive all future Fund shareholder reports in paper free of charge. If you are a direct investor, you can inform the Fund that you wish to continue receiving paper copies of your shareholder reports by calling 1-800-368-2745. If you own these shares through a financial intermediary, you must contact your financial intermediary or follow instructions included with this disclosure, if applicable, to elect to continue to receive paper copies of your shareholder reports. Your election to receive reports in paper will apply to all Calvert funds held directly or to all funds held through your financial intermediary, as applicable.
Annual Report September 30, 2019 E-Delivery Sign-Up — Details Inside |  |
Commodity Futures Trading Commission Registration. Effective December 31, 2012, the Commodity Futures Trading Commission (“CFTC”) adopted certain regulatory changes that subject registered investment companies and advisers to regulation by the CFTC if a fund invests more than a prescribed level of its assets in certain CFTC-regulated instruments (including futures, certain options and swap agreements) or markets itself as providing investment exposure to such instruments. The Fund and its adviser have claimed an exclusion from the definition of the term “commodity pool operator” under the Commodity Exchange Act. Accordingly, neither the Fund nor the adviser is subject to CFTC regulation. Fund shares are not insured by the FDIC and are not deposits or other obligations of, or guaranteed by, any depository institution. Shares are subject to investment risks, including possible loss of principal invested. This report must be preceded or accompanied by a current summary prospectus or prospectus. Before investing, investors should consider carefully the investment objective, risks, and charges and expenses of a mutual fund. This and other important information is contained in the summary prospectus and prospectus, which can be obtained from a financial intermediary. Prospective investors should read the prospectus carefully before investing. For further information, please call 1-800-368-2745. |
Choose Planet-friendly E-delivery! Sign up now for on-line statements, prospectuses, and fund reports. In less than five minutes you can help reduce paper mail and lower fund costs. Just go to www.calvert.com. If you already have an online account with the Calvert funds, click on Login to access your Account and select the documents you would like to receive via e-mail. If you’re new to online account access, click on Login, then Register to create your user name and password. Once you’re in, click on the E-delivery sign-up on the Account Portfolio page and follow the quick, easy steps. Note: If your shares are not held directly with the Calvert funds but through a brokerage firm, you must contact your broker for electronic delivery options available through their firm. |
2 www.calvert.com CALVERT FLOATING-RATE ADVANTAGE FUND ANNUAL REPORT (UNAUDITED)
3 www.calvert.com CALVERT FLOATING-RATE ADVANTAGE FUND ANNUAL REPORT (UNAUDITED)
MANAGEMENT’S DISCUSSION OF FUND PERFORMANCE1
Economic and Market Conditions
Despite price volatility during the 12-month period ended September 30, 2019, the U.S. floating-rate market had positive returns with the S&P/LSTA Leveraged Loan Index (the Index),2 a broad barometer of the U.S. loan market, returning 3.10%.
Following a negative initial start to the period, returns turned positive in early 2019. While returns then retreated somewhat they remained in plus-territory overall for the remainder of the period.
With U.S. economic data largely positive in calendar year 2018, the U.S. Federal Reserve Board (the Fed) raised its benchmark federal funds rate four times ─ from a low range of 1.50%-1.75% to 2.25%-2.50% ─ with the last quarter-point increase on December 19, 2018.
After holding interest rates steady through the first half of 2019, the Fed cut its benchmark interest rate to 2.00%-2.25% on July 31 ─ its first reduction in over a decade ─ followed by a second interest-rate drop to 1.75%-2.00% on September 18. Lower rates are intended to help stimulate economic activity by making borrowing costs relatively more affordable.
Technical conditions within the floating-rate market were challenging during the period. Net redemptions in mutual funds largely drove the early period’s negative returns. After relenting for a time, redemptions picked up again later in the period. However, collateralized loan obligations were a significant source of demand for much of the period.
The average loan price within the Index began the period at $98.6, and fell to $96.3 by the end. The default rate, which started the period at 1.81% ─ already well below the long-term average ─ fell to 1.29% by the end. However, signs of market stress were evident in the percentage of loans trading below $80 within the Index, which stood at 2.7% at end of 2018, and rose to 4% by September 30, 2019.
Fund Performance
For the 12-month period ended September 30, 2019, Calvert Floating-Rate Advantage Fund (the Fund) returned 2.42% for Class A shares at net asset value (NAV), under- performing its benchmark, the Index, which returned 3.10%.
The Index is unmanaged and returns do not reflect the effect of any applicable sales charges, commissions, expenses, or leverage.
An overweight position in home furnishings and security selection within the sector were among detractors to relative
performance versus the Index during the period. A large detractor from performance was a specific holding within that industry that the Fund was overweight in relative to the Index during the period.
An underweight exposure to the lodging and casinos industry, an industry that outperformed the Index overall, also detracted from performance versus the Index during the period. Security selection within the industry further weighed on relative performance.
The Fund’s credit quality8 positioning was a leading contributor to relative performance versus the Index during the period. For the period, Index returns by credit quality were: 4.66% for BBB-rated; 4.05% for BB-rated; 3.22% for B-rated; -3.64% for CCC-rated; and -0.01% for D-rated (defaulted) loans. Given this performance mix, the Fund’s relative overweight to B-rated loans and higher, and the relative underweight to CCC-rated loans and defaulted loans during the period helped performance versus the Index.
With respect to sector allocations, the Fund’s avoidance of the oil and gas business ─ among the weakest performing areas in the Index as oil prices were soft during the period ─ was a contributor to performance versus the Index during the period.
Underweight exposures and security selections within the metals/mining industry and retail businesses further enhanced the Fund’s relative performance to the Index during the period.
The Fund’s use of investment leverage5 contributed to performance relative to the Index as it enhanced the returns of the Fund’s underlying holdings. The Index does not use leverage.
See Endnotes and Additional Disclosures in this report. Past performance is no guarantee of future results. Returns are historical and are calculated by determining the percentage change in net asset value (NAV) or offering price (as applicable) with all distributions reinvested. Investment return and principal value will fluctuate so that shares, when redeemed, may be worth more or less than their original cost. Performance less than or equal to one year is cumulative. Performance is for the stated time period only; due to market volatility, the Fund’s current performance may be lower or higher than quoted. Returns are before taxes unless otherwise noted. For performance as of the most recent month-end, please refer to www.calvert.com. |
2 www.calvert.com CALVERT FLOATING-RATE ADVANTAGE FUND ANNUAL REPORT (Unaudited)
PERFORMANCE
Performance2,3 | ||||||||||||||
Portfolio Managers Craig P. Russ and Catherine C. McDermott, each of Calvert Research and Management | ||||||||||||||
% Average Annual Total Returns | Class Inception Date | Performance Inception Date | One Year | Five Years | Since Inception | |||||||||
Class A at NAV | 10/10/2017 | 10/10/2017 | 2.42 | % | — | % | 2.88 | % | ||||||
Class A with 3.75% Maximum Sales Charge | — | — | -1.44 | — | 0.90 | |||||||||
Class I at NAV | 10/10/2017 | 10/10/2017 | 2.57 | — | 3.07 | |||||||||
Class R6 at NAV | 10/10/2017 | 10/10/2017 | 2.67 | — | 3.06 | |||||||||
S&P/LSTA Leveraged Loan Index | — | — | 3.10 | % | 3.98 | % | 4.08 | % | ||||||
% Total Annual Operating Expense Ratios4 | Class A | Class I | Class R6 | |||||||||||
Gross | 2.20 | % | 1.95 | % | 1.89 | % | ||||||||
Net | 1.83 | 1.58 | 1.52 | |||||||||||
% Total Leverage5 | ||||||||||||||
Borrowings | 25.36 | % | ||||||||||||
Growth of $10,000 |
This graph shows the change in value of a hypothetical investment of $10,000 in Class A of the Fund for the period indicated. For comparison, the same investment is shown in the indicated index. |
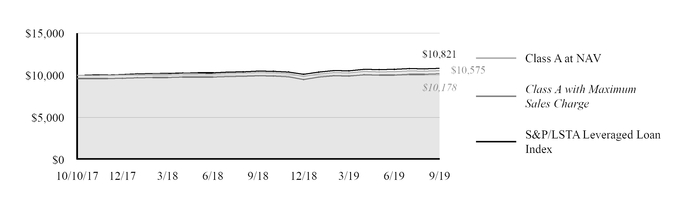
Growth of Investment | Amount Invested | Period Beginning | At NAV | With Maximum Sales Charge | ||||
Class I | $250,000 | 10/10/2017 | $265,371 | N.A. | ||||
Class R6 | $1,000,000 | 10/10/2017 | $1,061,162 | N.A. | ||||
See Endnotes and Additional Disclosures in this report.
Past performance is no guarantee of future results. Returns are historical and are calculated by determining the percentage change in net asset value (NAV) or offering price (as applicable) with all distributions reinvested. Investment return and principal value will fluctuate so that shares, when redeemed, may be worth more or less than their original cost. Performance less than or equal to one year is cumulative. Performance is for the stated time period only; due to market volatility, the Fund’s current performance may be lower or higher than quoted. Returns are before taxes unless otherwise noted. For performance as of the most recent month-end, please refer to www.calvert.com.
www.calvert.com CALVERT FLOATING-RATE ADVANTAGE FUND ANNUAL REPORT (Unaudited) 3
FUND PROFILE
TEN LARGEST SECTORS (% of total investments)6 | TEN LARGEST ISSUERS (% of total investments)6,7 | ||||||
Electronics/Electrical | 16.3 | % | Hyland Software, Inc. | 1.7 | % | ||
Business Equipment and Services | 12.5 | % | Kronos Incorporated | 1.6 | % | ||
Health Care | 10.6 | % | Infor (US), Inc. | 1.6 | % | ||
Industrial Equipment | 8.1 | % | SolarWinds Holdings, Inc. | 1.6 | % | ||
Telecommunications | 7.8 | % | Ziggo Secured Finance Partnership | 1.5 | % | ||
Leisure Goods/Activities/Movies | 4.9 | % | Sprint Communications, Inc. | 1.4 | % | ||
Insurance | 4.5 | % | American Builders & Contractors Supply Co., Inc. | 1.4 | % | ||
Building and Development | 3.4 | % | Zekelman Industries, Inc, | 1.4 | % | ||
Containers and Glass Products | 2.9 | % | Asurion, LLC | 1.4 | % | ||
Chemicals and Plastics | 2.9 | % | HCA, Inc. | 1.4 | % | ||
Total | 73.9 | % | Total | 15.0 | % | ||
CREDIT QUALITY (% of bond and loan holdings)8 | |||||||
BBB | 6.3 | % | |||||
BB | 24.9 | % | |||||
B | 61.1 | % | |||||
CCC or Lower | 3.5 | % | |||||
Not Rated | 4.2 | % | |||||
Total | 100.0 | % | |||||
See Endnotes and Additional Disclosures in this report.
4 www.calvert.com CALVERT FLOATING-RATE ADVANTAGE FUND ANNUAL REPORT (Unaudited)
Endnotes and Additional Disclosures | ||
1 | The views expressed in this report are those of the portfolio manager(s) and are current only through the date stated on the cover. These views are subject to change at any time based upon market or other conditions, and Calvert and the Fund(s) disclaim any responsibility to update such views. These views may not be relied upon as investment advice and, because investment decisions are based on many factors, may not be relied upon as an indication of trading intent on behalf of any Calvert fund. This commentary may contain statements that are not historical facts, referred to as “forward looking statements.” The Fund’s actual future results may differ significantly from those stated in any forward looking statement, depending on factors such as changes in securities or financial markets or general economic conditions, the volume of sales and purchases of Fund shares, the continuation of investment advisory, administrative and service contracts, and other risks discussed from time to time in the Fund’s filings with the Securities and Exchange Commission. |
2 | S&P/LSTA Leveraged Loan Index is an unmanaged index of the institutional leveraged loan market. S&P/LSTA Leveraged Loan indices are a product of S&P Dow Jones Indices LLC (“S&P DJI”) and have been licensed for use. S&P® is a registered trademark of S&P DJI; Dow Jones® is a registered trademark of Dow Jones Trademark Holdings LLC (“Dow Jones”); LSTA is a trademark of Loan Syndications and Trading Association, Inc. S&P DJI, Dow Jones and their respective affiliates do not sponsor, endorse, sell or promote the Fund, will not have any liability with respect thereto and do not have any liability for any errors, omissions, or interruptions of the S&P Dow Jones Indices. Unless otherwise stated, index returns do not reflect the effect of any applicable sales charges, commissions, expenses, taxes or leverage, as applicable. It is not possible to invest directly in an index. |
3 | Total Returns at NAV do not include applicable sales charges. If sales charges were deducted, the returns would be lower. Total Returns shown with maximum sales charge reflect the stated maximum sales charge. Unless otherwise stated, performance does not reflect the deduction of taxes on Fund distributions or redemptions of Fund shares. Performance since inception for an index, if presented, is the performance since the Fund’s or oldest share class’ inception, as applicable. |
4 Net expense ratio reflects a contractual expense reimbursement that continues through 1/31/20. Without the reimbursement, performance would have been lower. The expense ratios for the current reporting period can be found in the Financial Highlights section of this report.
5 | Total leverage is shown as a percentage of the Fund’s aggregate net assets plus borrowings outstanding. The Fund employs leverage through borrowings. Use of leverage creates an opportunity for income, but creates risks including greater volatility of NAV. The cost of borrowings rises and falls with changes in short-term interest rates. The Fund may be required to maintain prescribed asset coverage for its borrowings and may be required to reduce its borrowings at an inopportune time. |
6 | Does not include Short Term Investment of Cash Collateral for Securities Loaned. |
7 | Excludes cash and cash equivalents. |
8 | Credit ratings are categorized using S&P Global Ratings (“S&P”). Ratings, which are subject to change, apply to the creditworthiness of the issuers of the underlying securities and not to the Fund or its shares. Credit ratings measure the quality of a bond based on the issuer’s creditworthiness, with ratings ranging from AAA, being the highest, to D, being the lowest based on S&P’s measures. Ratings of BBB or higher by S&P are considered to be investment-grade quality. Credit ratings are based largely on the ratings agency’s analysis at the time of rating. The rating assigned to any particular security is not necessarily a reflection of the issuer’s current financial condition and does not necessarily reflect its assessment of the volatility of a security’s market value or of the liquidity of an investment in the security. Holdings designated as Not Rated (if any) are not rated by S&P. |
Fund profile subject to change due to active management.
Important Notice to Shareholders
Effective November 1, 2019, the Fund is managed by Craig P. Russ and Catherine C. McDermott.
www.calvert.com CALVERT FLOATING-RATE ADVANTAGE FUND ANNUAL REPORT (Unaudited) 5
FUND EXPENSES
Example
As a Fund shareholder, you incur two types of costs: (1) transaction costs, including sales charges (loads) on purchases and redemption fees (if applicable); and (2) ongoing costs, including management fees; distribution and/or service fees; and other Fund expenses. This Example is intended to help you understand your ongoing costs (in dollars) of Fund investing and to compare these costs with the ongoing costs of investing in other mutual funds. The Example is based on an investment of $1,000 invested at the beginning of the period and held for the entire period (April 1, 2019 to September 30, 2019).
Actual Expenses
The first section of the table below provides information about actual account values and actual expenses. You may use the information in this section, together with the amount you invested, to estimate the expenses that you paid over the period. Simply divide your account value by $1,000 (for example, an $8,600 account value divided by $1,000 = 8.6), then multiply the result by the number in the first section under the heading entitled “Expenses Paid During Period” to estimate the expenses you paid on your account during this period.
Hypothetical Example for Comparison Purposes
The second section of the table below provides information about hypothetical account values and hypothetical expenses based on the actual Fund expense ratio and an assumed rate of return of 5% per year (before expenses), which is not the actual Fund return. The hypothetical account values and expenses may not be used to estimate the actual ending account balance or expenses you paid for the period. You may use this information to compare the ongoing costs of investing in the Fund and other funds. To do so, compare this 5% hypothetical example with the 5% hypothetical examples that appear in the shareholder reports of the other funds.
Please note that the expenses shown in the table are meant to highlight your ongoing costs only and do not reflect any transactional costs, such as sales charges (loads) or redemption fees (if applicable). Therefore, the second section of the table is useful in comparing ongoing costs only, and will not help you determine the relative total costs of owning different funds. In addition, if these transactional costs were included, your costs would be higher.
BEGINNING ACCOUNT VALUE (4/1/19) | ENDING ACCOUNT VALUE (9/30/19) | EXPENSES PAID DURING PERIOD* (4/1/19 - 9/30/19) | ANNUALIZED EXPENSE RATIO | |
Actual | ||||
Class A | $1,000.00 | $1,026.20 | $9.45** | 1.86% |
Class I | $1,000.00 | $1,026.40 | $8.18** | 1.61% |
Class R6 | $1,000.00 | $1,026.50 | $8.18** | 1.61% |
Hypothetical | ||||
(5% return per year before expenses) | ||||
Class A | $1,000.00 | $1,015.74 | $9.40** | 1.86% |
Class I | $1,000.00 | $1,017.00 | $8.14** | 1.61% |
Class R6 | $1,000.00 | $1,017.00 | $8.14** | 1.61% |
* Expenses are equal to the Fund’s annualized expense ratio for the indicated Class, multiplied by the average account value over the period, multiplied by 183/365 (to reflect the one-half year period). The Example assumes that the $1,000 was invested at the net asset value per share determined at the close of business on March 31, 2019. | ||||
** Absent a waiver and/or reimbursement of expenses by an affiliate, expenses would be higher. | ||||
6 www.calvert.com CALVERT FLOATING-RATE ADVANTAGE FUND ANNUAL REPORT (Unaudited)
CALVERT FLOATING-RATE ADVANTAGE FUND
SCHEDULE OF INVESTMENTS
SEPTEMBER 30, 2019
PRINCIPAL AMOUNT ($) | VALUE ($) | |
SENIOR FLOATING RATE LOANS (1)- 117.4% | ||
Aerospace and Defense - 0.6% | ||
WP CPP Holdings, LLC, Term Loan, 6.01%, (3 mo. USD LIBOR + 3.75%), 4/30/25 | 297,374 | 298,210 |
Automotive - 2.8% | ||
Adient US, LLC, Term Loan, 6.781%, (3 mo. USD LIBOR + 4.25%), 5/6/24 | 249,375 | 246,154 |
Bright Bidco B.V., Term Loan, 5.58%, (USD LIBOR + 3.50%), 6/30/24 (2) | 293,991 | 141,116 |
Panther BF Aggregator 2 LP, Term Loan, 5.544%, (1 mo. USD LIBOR + 3.50%), 4/30/26 | 500,000 | 497,292 |
Thor Industries, Inc., Term Loan, 5.875%, (1 mo. USD LIBOR + 3.75%), 2/1/26 | 116,494 | 113,872 |
TI Group Automotive Systems, LLC, Term Loan, 4.544%, (1 mo. USD LIBOR + 2.50%), 6/30/22 | 381,229 | 379,499 |
1,377,933 | ||
Building and Development - 4.1% | ||
American Builders & Contractors Supply Co., Inc., Term Loan, 4.044%, (1 mo. USD LIBOR + 2.00%), 10/31/23 | 884,131 | 884,738 |
Brookfield Property REIT, Inc., Term Loan, 4.544%, (1 mo. USD LIBOR + 2.50%), 8/27/25 | 247,500 | 244,230 |
DTZ U.S. Borrower, LLC, Term Loan, 5.294%, (1 mo. USD LIBOR + 3.25%), 8/21/25 | 321,130 | 322,533 |
Henry Company, LLC, Term Loan, 6.044%, (1 mo. USD LIBOR + 4.00%), 10/5/23 | 270,139 | 270,702 |
Realogy Group, LLC, Term Loan, 4.296%, (1 mo. USD LIBOR + 2.25%), 2/8/25 | 163,222 | 155,621 |
Werner FinCo L.P., Term Loan, 6.044%, (1 mo. USD LIBOR + 4.00%), 7/24/24 | 196,491 | 192,070 |
2,069,894 | ||
Business Equipment and Services - 15.2% | ||
Allied Universal Holdco, LLC: | ||
Term Loan, 2.125%, 7/10/26 (3) | 33,784 | 33,875 |
Term Loan, 6.507%, (6 mo. USD LIBOR + 4.25%), 7/10/26 | 341,216 | 342,140 |
AppLovin Corporation, Term Loan, 5.794%, (1 mo. USD LIBOR + 3.75%), 8/15/25 | 397,124 | 397,455 |
Brand Energy & Infrastructure Services, Inc., Term Loan, 6.514%, (USD LIBOR + 4.25%), 6/21/24 (2) | 195,990 | 191,825 |
Camelot UK Holdco Limited, Term Loan, 5.294%, (1 mo. USD LIBOR + 3.25%), 10/3/23 | 407,095 | 410,085 |
Ceridian HCM Holding, Inc., Term Loan, 5.046%, (1 mo. USD LIBOR + 3.00%), 4/30/25 | 495,000 | 496,933 |
Change Healthcare Holdings, LLC, Term Loan, 4.544%, (1 mo. USD LIBOR + 2.50%), 3/1/24 | 670,081 | 667,725 |
Cypress Intermediate Holdings III, Inc., Term Loan, 4.80%, (1 mo. USD LIBOR + 2.75%), 4/26/24 | 368,780 | 367,858 |
EIG Investors Corp., Term Loan, 5.882%, (3 mo. USD LIBOR + 3.75%), 2/9/23 | 280,651 | 275,476 |
IG Investment Holdings, LLC, Term Loan, 6.044%, (1 mo. USD LIBOR + 4.00%), 5/23/25 | 299,242 | 298,370 |
IRI Holdings, Inc., Term Loan, 6.624%, (3 mo. USD LIBOR + 4.50%), 12/1/25 | 422,684 | 407,186 |
J.D. Power and Associates, Term Loan, 5.794%, (1 mo. USD LIBOR + 3.75%), 9/7/23 | 293,943 | 294,677 |
KAR Auction Services, Inc., Term Loan, 4.313%, (1 mo. USD LIBOR + 2.25%), 9/19/26 | 50,000 | 50,391 |
Kronos Incorporated, Term Loan, 5.253%, (3 mo. USD LIBOR + 3.00%), 11/1/23 | 981,207 | 984,197 |
KUEHG Corp., Term Loan, 5.854%, (3 mo. USD LIBOR + 3.75%), 2/21/25 | 267,572 | 267,639 |
Prime Security Services Borrower, LLC, Term Loan, 5.21%, (1 week USD LIBOR + 3.25%), 9/23/26 | 397,314 | 393,270 |
ServiceMaster Company, Term Loan, 4.544%, (1 mo. USD LIBOR + 2.50%), 11/8/23 | 67,972 | 68,482 |
SMG US Midco 2, Inc., Term Loan, 5.044%, (1 mo. USD LIBOR + 3.00%), 1/23/25 | 246,250 | 245,480 |
Solera, LLC, Term Loan, 4.794%, (1 mo. USD LIBOR + 2.75%), 3/3/23 | 498,708 | 496,993 |
www.calvert.com CALVERT FLOATING-RATE ADVANTAGE FUND ANNUAL REPORT 7
PRINCIPAL AMOUNT ($) | VALUE ($) | |
SENIOR FLOATING RATE LOANS (1) - CONT’D | ||
Spin Holdco, Inc., Term Loan, 5.572%, (3 mo. USD LIBOR + 3.25%), 11/14/22 | 497,455 | 489,139 |
WASH Multifamily Laundry Systems, LLC, Term Loan, 5.294%, (1 mo. USD LIBOR + 3.25%), 5/14/22 | 215,336 | 212,779 |
West Corporation, Term Loan, 6.044%, (1 mo. USD LIBOR + 4.00%), 10/10/24 | 246,241 | 219,975 |
7,611,950 | ||
Cable and Satellite Television - 2.4% | ||
Telenet Financing USD, LLC, Term Loan, 4.278%, (1 mo. USD LIBOR + 2.25%), 8/15/26 | 275,000 | 275,573 |
Ziggo Secured Finance Partnership, Term Loan, 4.528%, (1 mo. USD LIBOR + 2.50%), 4/15/25 | 905,000 | 904,434 |
1,180,007 | ||
Chemicals and Plastics - 3.5% | ||
Alpha 3 B.V., Term Loan, 5.104%, (3 mo. USD LIBOR + 3.00%), 1/31/24 | 307,759 | 304,373 |
Minerals Technologies, Inc., Term Loan, 4.31%, (USD LIBOR + 2.25%), 2/14/24 (2) | 604,096 | 606,613 |
Momentive Performance Materials, Inc., Term Loan, 5.30%, (1 mo. USD LIBOR + 3.25%), 5/15/24 | 349,125 | 347,271 |
PMHC II, Inc., Term Loan, 5.604%, (3 mo. USD LIBOR + 3.50%), 3/31/25 | 246,867 | 199,962 |
Polar US Borrower, LLC, Term Loan, 7.058%, (3 mo. USD LIBOR + 4.75%), 10/15/25 | 247,876 | 241,363 |
Pregis TopCo Corporation, Term Loan, 6.253%, (3 mo. USD LIBOR + 4.00%), 7/31/26 | 50,000 | 49,938 |
1,749,520 | ||
Containers and Glass Products - 2.1% | ||
Berlin Packaging, LLC, Term Loan, 5.101%, (USD LIBOR + 3.00%), 11/7/25 (2) | 246,875 | 242,973 |
Berry Global, Inc., Term Loan, 4.549%, (1 mo. USD LIBOR + 2.50%), 7/1/26 | 74,813 | 75,259 |
Flex Acquisition Company, Inc., Term Loan, 5.319%, (3 mo. USD LIBOR + 3.00%), 12/29/23 | 480,207 | 462,713 |
Libbey Glass, Inc., Term Loan, 5.042%, (1 mo. USD LIBOR + 3.00%), 4/9/21 | 244,995 | 190,483 |
Pelican Products, Inc., Term Loan, 5.539%, (1 mo. USD LIBOR + 3.50%), 5/1/25 | 74,063 | 71,193 |
1,042,621 | ||
Cosmetics/Toiletries - 1.0% | ||
KIK Custom Products, Inc., Term Loan, 6.256%, (3 mo. USD LIBOR + 4.00%), 5/15/23 | 550,000 | 522,672 |
Drugs - 1.2% | ||
Albany Molecular Research, Inc., Term Loan, 5.294%, (1 mo. USD LIBOR + 3.25%), 8/30/24 | 196,000 | 193,060 |
Amneal Pharmaceuticals, LLC, Term Loan, 5.563%, (1 mo. USD LIBOR + 3.50%), 5/4/25 | 269,675 | 231,696 |
Arbor Pharmaceuticals, Inc., Term Loan, 7.104%, (3 mo. USD LIBOR + 5.00%), 7/5/23 | 180,923 | 166,901 |
591,657 | ||
Ecological Services and Equipment - 1.0% | ||
GFL Environmental, Inc., Term Loan, 5.044%, (1 mo. USD LIBOR + 3.00%), 5/30/25 | 520,378 | 516,475 |
Electronics/Electrical - 20.2% | ||
Almonde, Inc., Term Loan, 5.696%, (6 mo. USD LIBOR + 3.50%), 6/13/24 | 271,824 | 264,979 |
Applied Systems, Inc., Term Loan, 5.104%, (3 mo. USD LIBOR + 3.00%), 9/19/24 | 818,734 | 818,661 |
Avast Software B.V., Term Loan, 4.354%, (3 mo. USD LIBOR + 2.25%), 9/30/23 | 190,793 | 192,120 |
Banff Merger Sub, Inc., Term Loan, 6.294%, (1 mo. USD LIBOR + 4.25%), 10/2/25 | 347,002 | 334,721 |
Carbonite, Inc., Term Loan, 6.006%, (3 mo. USD LIBOR + 3.75%), 3/26/26 | 220,455 | 220,960 |
CommScope, Inc., Term Loan, 5.294%, (1 mo. USD LIBOR + 3.25%), 4/6/26 | 450,000 | 449,246 |
8 www.calvert.com CALVERT FLOATING-RATE ADVANTAGE FUND ANNUAL REPORT
PRINCIPAL AMOUNT ($) | VALUE ($) | |
SENIOR FLOATING RATE LOANS (1) - CONT’D | ||
CPI International, Inc., Term Loan, 5.554%, (1 mo. USD LIBOR + 3.50%), 7/26/24 | 296,970 | 292,268 |
Epicor Software Corporation, Term Loan, 5.30%, (1 mo. USD LIBOR + 3.25%), 6/1/22 | 589,133 | 589,930 |
Exact Merger Sub, LLC, Term Loan, 6.354%, (3 mo. USD LIBOR + 4.25%), 9/27/24 | 198,481 | 198,171 |
EXC Holdings III Corp., Term Loan, 5.604%, (3 mo. USD LIBOR + 3.50%), 12/2/24 | 196,500 | 197,232 |
Financial & Risk US Holdings, Inc., Term Loan, 5.794%, (1 mo. USD LIBOR + 3.75%), 10/1/25 | 124,063 | 124,886 |
Hyland Software, Inc., Term Loan, 5.294%, (1 mo. USD LIBOR + 3.25%), 7/1/24 | 1,061,455 | 1,062,687 |
Infoblox, Inc., Term Loan, 6.544%, (1 mo. USD LIBOR + 4.50%), 11/7/23 | 245,625 | 247,007 |
Infor (US), Inc., Term Loan, 4.854%, (3 mo. USD LIBOR + 2.75%), 2/1/22 | 979,591 | 981,918 |
Informatica, LLC, Term Loan, 5.294%, (1 mo. USD LIBOR + 3.25%), 8/5/22 | 742,347 | 746,290 |
NCR Corporation: | ||
Term Loan, 0.50%, 8/8/26 (3) | 40,000 | 40,100 |
Term Loan, 4.55%, (1 mo. USD LIBOR + 2.50%), 8/8/26 | 35,000 | 35,087 |
SGS Cayman L.P., Term Loan, 7.479%, (3 mo. USD LIBOR + 5.38%), 4/23/21 | 65,061 | 64,546 |
SkillSoft Corporation, Term Loan, 6.946%, (6 mo. USD LIBOR + 4.75%), 4/28/21 | 342,876 | 277,444 |
SolarWinds Holdings, Inc., Term Loan, 4.794%, (1 mo. USD LIBOR + 2.75%), 2/5/24 | 962,015 | 964,287 |
Sutherland Global Services, Inc., Term Loan, 7.479%, (3 mo. USD LIBOR + 5.38%), 4/23/21 | 279,499 | 277,286 |
Tibco Software, Inc., Term Loan, 6.07%, (1 mo. USD LIBOR + 4.00%), 6/30/26 | 294,710 | 295,537 |
Uber Technologies, Term Loan, 6.028%, (1 mo. USD LIBOR + 4.00%), 4/4/25 | 497,481 | 495,771 |
Ultimate Software Group, Inc. (The), Term Loan, 5.794%, (1 mo. USD LIBOR + 3.75%), 5/4/26 | 125,000 | 125,797 |
Ultra Clean Holdings, Inc, Term Loan, 6.544%, (1 mo. USD LIBOR + 4.50%), 8/27/25 | 90,357 | 88,550 |
Veritas Bermuda, Ltd., Term Loan, 6.554%, (USD LIBOR + 4.50%), 1/27/23 (2) | 146,365 | 138,620 |
Vero Parent, Inc., Term Loan, 6.544%, (1 mo. USD LIBOR + 4.50%), 8/16/24 | 247,500 | 246,572 |
Wall Street Systems Delaware, Inc., Term Loan, 5.044%, (1 mo. USD LIBOR + 3.00%), 11/21/24 | 317,593 | 316,799 |
10,087,472 | ||
Financial Intermediaries - 3.2% | ||
Apollo Commercial Real Estate Finance, Inc, Term Loan, 4.778%, (1 mo. USD LIBOR + 2.75%), 5/15/26 | 448,875 | 448,303 |
Aretec Group, Inc., Term Loan, 6.294%, (1 mo. USD LIBOR + 4.25%), 10/1/25 | 298,185 | 288,494 |
Focus Financial Partners, LLC, Term Loan, 4.544%, (1 mo. USD LIBOR + 2.50%), 7/3/24 | 74,811 | 75,239 |
Harbourvest Partners, LLC, Term Loan, 4.278%, (1 mo. USD LIBOR + 2.25%), 3/1/25 | 44,451 | 44,645 |
Victory Capital Holdings, Inc., Term Loan, 5.569%, (3 mo. USD LIBOR + 3.25%), 7/1/26 | 117,841 | 118,522 |
Virtus Investment Partners, Inc., Term Loan, 4.339%, (1 mo. USD LIBOR + 2.25%), 6/1/24 | 622,384 | 624,977 |
1,600,180 | ||
Food Products - 1.7% | ||
Del Monte Foods, Inc., Term Loan, 5.399%, (3 mo. USD LIBOR + 3.25%), 2/18/21 | 346,335 | 261,483 |
Post Holdings, Inc., Term Loan, 4.04%, (1 mo. USD LIBOR + 2.00%), 5/24/24 | 597,244 | 599,623 |
861,106 | ||
Food Service - 2.3% | ||
1011778 B.C. Unlimited Liability Company, Term Loan, 4.294%, (1 mo. USD LIBOR + 2.25%), 2/16/24 | 432,123 | 434,057 |
IRB Holding Corp., Term Loan, 5.55%, (3 mo. USD LIBOR + 3.25%), 2/5/25 | 318,881 | 317,818 |
Restaurant Technologies, Inc., Term Loan, 5.294%, (1 mo. USD LIBOR + 3.25%), 10/1/25 | 248,125 | 248,591 |
US Foods, Inc., Term Loan, 4.05%, (1 mo. USD LIBOR + 2.00%), 9/13/26 | 150,000 | 150,785 |
1,151,251 | ||
www.calvert.com CALVERT FLOATING-RATE ADVANTAGE FUND ANNUAL REPORT 9
PRINCIPAL AMOUNT ($) | VALUE ($) | |
SENIOR FLOATING RATE LOANS (1) - CONT’D | ||
Food/Drug Retailers - 0.3% | ||
Albertsons, LLC, Term Loan, 4.794%, (1 mo. USD LIBOR + 2.75%), 8/17/26 | 173,320 | 174,587 |
Health Care - 10.7% | ||
Accelerated Health Systems, LLC, Term Loan, 5.542%, (1 mo. USD LIBOR + 3.50%), 10/31/25 | 49,625 | 49,749 |
Alliance Healthcare Services, Inc., Term Loan, 6.544%, (1 mo. USD LIBOR + 4.50%), 10/24/23 | 191,250 | 181,688 |
athenahealth, Inc., Term Loan, 6.681%, (3 mo. USD LIBOR + 4.50%), 2/11/26 | 149,250 | 148,659 |
Avantor, Inc., Term Loan, 5.044%, (1 mo. USD LIBOR + 3.00%), 11/21/24 | 320,992 | 323,600 |
BioClinica, Inc., Term Loan, 6.438%, (2 mo. USD LIBOR + 4.25%), 10/20/23 | 195,970 | 188,866 |
CHG Healthcare Services, Inc., Term Loan, 5.044%, (1 mo. USD LIBOR + 3.00%), 6/7/23 | 350,000 | 349,956 |
CPI Holdco, LLC, Term Loan, 5.535%, (6 mo. USD LIBOR + 3.50%), 3/21/24 | 298,469 | 298,469 |
DaVita, Inc., Term Loan, 4.294%, (1 mo. USD LIBOR + 2.25%), 8/12/26 | 75,000 | 75,505 |
Ensemble RCM, LLC, Term Loan, 6.003%, (3 mo. USD LIBOR + 3.75%), 8/3/26 | 50,000 | 50,125 |
Envision Healthcare Corporation, Term Loan, 5.794%, (1 mo. USD LIBOR + 3.75%), 10/10/25 | 496,250 | 406,098 |
Greatbatch Ltd., Term Loan, 5.05%, (1 mo. USD LIBOR + 3.00%), 10/27/22 | 322,509 | 324,458 |
Hanger, Inc., Term Loan, 5.544%, (1 mo. USD LIBOR + 3.50%), 3/6/25 | 98,500 | 98,900 |
Kinetic Concepts, Inc., Term Loan, 7.25%, (USD Prime + 2.25%), 2/2/24 | 496,193 | 497,976 |
MPH Acquisition Holdings, LLC, Term Loan, 4.854%, (3 mo. USD LIBOR + 2.75%), 6/7/23 | 361,745 | 345,316 |
National Mentor Holdings, Inc., Term Loan, 6.30%, (1 mo. USD LIBOR + 4.25%), 3/9/26 | 248,823 | 249,652 |
One Call Corporation, Term Loan, 7.408%, (3 mo. USD LIBOR + 5.25%), 11/25/22 | 169,687 | 137,447 |
Ortho-Clinical Diagnostics S.A., Term Loan, 5.563%, (3 mo. USD LIBOR + 3.25%), 6/30/25 | 427,369 | 414,548 |
RadNet, Inc., Term Loan, 5.83%, (3 mo. USD LIBOR + 3.50%), 6/30/23 | 446,090 | 441,629 |
Select Medical Corporation, Term Loan, 4.58%, (USD LIBOR + 2.50%), 3/6/25 (2) | 322,883 | 323,387 |
Sotera Health Holdings, LLC, Term Loan, 5.044%, (1 mo. USD LIBOR + 3.00%), 5/15/22 | 223,093 | 220,792 |
Verscend Holding Corp., Term Loan, 6.544%, (1 mo. USD LIBOR + 4.50%), 8/27/25 | 246,880 | 248,063 |
5,374,883 | ||
Home Furnishings - 0.8% | ||
Serta Simmons Bedding, LLC, Term Loan, 5.543%, (1 mo. USD LIBOR + 3.50%), 11/8/23 | 689,657 | 427,013 |
Industrial Equipment - 10.0% | ||
Altra Industrial Motion Corp., Term Loan, 4.044%, (1 mo. USD LIBOR + 2.00%), 10/1/25 | 68,843 | 68,886 |
Apex Tool Group, LLC, Term Loan, 7.544%, (1 mo. USD LIBOR + 5.50%), 8/1/24 | 161,945 | 157,694 |
Carlisle Foodservice Products, Inc., Term Loan, 5.044%, (1 mo. USD LIBOR + 3.00%), 3/20/25 | 146,300 | 139,900 |
Clark Equipment Company, Term Loan, 4.104%, (3 mo. USD LIBOR + 2.00%), 5/18/24 | 655,496 | 657,750 |
CPM Holdings, Inc., Term Loan, 5.794%, (1 mo. USD LIBOR + 3.75%), 11/15/25 | 323,309 | 318,661 |
DexKo Global, Inc., Term Loan, 5.544%, (1 mo. USD LIBOR + 3.50%), 7/24/24 | 245,423 | 242,969 |
EWT Holdings III Corp., Term Loan, 5.044%, (1 mo. USD LIBOR + 3.00%), 12/20/24 | 588,246 | 591,187 |
Filtration Group Corporation, Term Loan, 5.044%, (1 mo. USD LIBOR + 3.00%), 3/29/25 | 497,594 | 499,408 |
Gates Global, LLC, Term Loan, 4.794%, (1 mo. USD LIBOR + 2.75%), 4/1/24 | 833,491 | 823,072 |
Robertshaw US Holding Corp., Term Loan, 5.313%, (1 mo. USD LIBOR + 3.25%), 2/28/25 | 418,625 | 384,088 |
Terex Corporation, Term Loan, 4.794%, (1 mo. USD LIBOR + 2.75%), 1/31/24 | 820,875 | 824,209 |
Titan Acquisition Limited, Term Loan, 5.044%, (1 mo. USD LIBOR + 3.00%), 3/28/25 | 295,500 | 283,680 |
4,991,504 | ||
10 www.calvert.com CALVERT FLOATING-RATE ADVANTAGE FUND ANNUAL REPORT
PRINCIPAL AMOUNT ($) | VALUE ($) | |
SENIOR FLOATING RATE LOANS (1) - CONT’D | ||
Insurance - 5.5% | ||
Alliant Holdings Intermediate, LLC, Term Loan, 5.289%, (1 mo. USD LIBOR + 3.25%), 5/9/25 | 249,375 | 247,894 |
AmWINS Group, Inc., Term Loan, 4.796%, (1 mo. USD LIBOR + 2.75%), 1/25/24 | 539,794 | 540,694 |
Asurion, LLC: | ||
Term Loan, 5.044%, (1 mo. USD LIBOR + 3.00%), 8/4/22 | 761,302 | 764,347 |
Term Loan - Second Lien, 8.544%, (1 mo. USD LIBOR + 6.50%), 8/4/25 | 100,000 | 101,708 |
Hub International Limited, Term Loan, 5.267%, (3 mo. USD LIBOR + 3.00%), 4/25/25 | 518,438 | 513,415 |
NFP Corp., Term Loan, 5.044%, (1 mo. USD LIBOR + 3.00%), 1/8/24 | 299,231 | 294,481 |
USI, Inc., Term Loan, 5.104%, (3 mo. USD LIBOR + 3.00%), 5/16/24 | 294,000 | 289,345 |
2,751,884 | ||
Leisure Goods/Activities/Movies - 6.0% | ||
AMC Entertainment Holdings, Inc., Term Loan, 5.23%, (6 mo. USD LIBOR + 3.00%), 4/22/26 | 646,750 | 650,388 |
Bombardier Recreational Products, Inc., Term Loan, 4.044%, (1 mo. USD LIBOR + 2.00%), 5/23/25 | 640,254 | 640,121 |
Crown Finance US, Inc., Term Loan, 4.294%, (1 mo. USD LIBOR + 2.25%), 2/28/25 | 390,326 | 388,325 |
Emerald Expositions Holding, Inc., Term Loan, 4.794%, (1 mo. USD LIBOR + 2.75%), 5/22/24 | 284,051 | 276,950 |
Match Group, Inc., Term Loan, 4.659%, (2 mo. USD LIBOR + 2.50%), 11/16/22 | 650,000 | 653,250 |
Travel Leaders Group, LLC, Term Loan, 6.046%, (1 mo. USD LIBOR + 4.00%), 1/25/24 | 397,992 | 398,490 |
3,007,524 | ||
Lodging and Casinos - 2.5% | ||
ESH Hospitality, Inc., Term Loan, 4.044%, (1 mo. USD LIBOR + 2.00%), 9/18/26 | 380,618 | 382,838 |
Playa Resorts Holding B.V., Term Loan, 4.79%, (1 mo. USD LIBOR + 2.75%), 4/29/24 | 220,618 | 215,103 |
RHP Hotel Properties L.P., Term Loan, 4.33%, (3 mo. USD LIBOR + 2.00%), 5/11/24 | 636,935 | 638,826 |
1,236,767 | ||
Publishing - 2.3% | ||
Getty Images, Inc., Term Loan, 6.563%, (1 mo. USD LIBOR + 4.50%), 2/19/26 | 272,938 | 272,084 |
Harland Clarke Holdings Corp., Term Loan, 6.854%, (3 mo. USD LIBOR + 4.75%), 11/3/23 | 178,536 | 140,916 |
LSC Communications, Inc., Term Loan, 7.445%, (1 week USD LIBOR + 5.50%), 9/30/22 | 148,800 | 125,364 |
ProQuest, LLC, Term Loan, 5.294%, (1 mo. USD LIBOR + 3.25%), 10/24/21 | 588,968 | 590,073 |
1,128,437 | ||
Radio and Television - 2.0% | ||
Diamond Sports Group, LLC, Term Loan, 5.30%, (1 mo. USD LIBOR + 3.25%), 8/24/26 | 250,000 | 251,680 |
iHeartCommunications, Inc., Term Loan, 6.10%, (1 mo. USD LIBOR + 4.00%), 5/1/26 | 532,203 | 536,360 |
Mission Broadcasting, Inc., Term Loan, 4.35%, (1 mo. USD LIBOR + 2.25%), 1/17/24 | 37,640 | 37,715 |
Nexstar Broadcasting, Inc., Term Loan, 4.294%, (1 mo. USD LIBOR + 2.25%), 1/17/24 | 188,949 | 189,323 |
1,015,078 | ||
Retailers (Except Food and Drug) - 2.8% | ||
Bass Pro Group, LLC, Term Loan, 7.044%, (1 mo. USD LIBOR + 5.00%), 9/25/24 | 245,614 | 237,056 |
BJ’s Wholesale Club, Inc., Term Loan, 4.786%, (1 mo. USD LIBOR + 2.75%), 2/3/24 | 498,741 | 500,753 |
Coinamatic Canada, Inc., Term Loan, 5.294%, (1 mo. USD LIBOR + 3.25%), 5/14/22 | 33,365 | 32,969 |
www.calvert.com CALVERT FLOATING-RATE ADVANTAGE FUND ANNUAL REPORT 11
PRINCIPAL AMOUNT ($) | VALUE ($) | |
SENIOR FLOATING RATE LOANS (1) - CONT’D | ||
Hoya Midco, LLC, Term Loan, 5.544%, (1 mo. USD LIBOR + 3.50%), 6/30/24 | 195,286 | 192,967 |
LSF9 Atlantis Holdings, LLC, Term Loan, 8.042%, (1 mo. USD LIBOR + 6.00%), 5/1/23 | 141,848 | 132,628 |
PetSmart, Inc., Term Loan, 6.04%, (1 mo. USD LIBOR + 4.00%), 3/11/22 | 300,000 | 293,000 |
1,389,373 | ||
Steel - 2.2% | ||
Phoenix Services International, LLC, Term Loan, 5.778%, (1 mo. USD LIBOR + 3.75%), 3/1/25 | 246,250 | 239,478 |
Zekelman Industries, Inc., Term Loan, 4.304%, (1 mo. USD LIBOR + 2.25%), 6/14/21 | 876,316 | 877,412 |
1,116,890 | ||
Surface Transport - 0.6% | ||
Agro Merchants NAI Holdings, LLC, Term Loan, 5.854%, (3 mo. USD LIBOR + 3.75%), 12/6/24 | 298,524 | 300,016 |
Telecommunications - 9.7% | ||
CenturyLink, Inc., Term Loan, 4.794%, (1 mo. USD LIBOR + 2.75%), 1/31/25 | 836,853 | 832,233 |
Colorado Buyer, Inc., Term Loan, 5.04%, (1 mo. USD LIBOR + 3.00%), 5/1/24 | 394,328 | 357,113 |
Digicel International Finance Limited, Term Loan, 5.34%, (6 mo. USD LIBOR + 3.25%), 5/28/24 | 245,371 | 213,473 |
Intelsat Jackson Holdings S.A., Term Loan, 5.804%, (1 mo. USD LIBOR + 3.75%), 11/27/23 | 574,000 | 575,722 |
Level 3 Financing, Inc., Term Loan, 4.294%, (1 mo. USD LIBOR + 2.25%), 2/22/24 | 650,000 | 651,896 |
Plantronics, Inc., Term Loan, 4.544%, (1 mo. USD LIBOR + 2.50%), 7/2/25 | 391,466 | 391,344 |
SBA Senior Finance II, LLC, Term Loan, 4.05%, (1 mo. USD LIBOR + 2.00%), 4/11/25 | 686,444 | 687,678 |
Sprint Communications, Inc., Term Loan, 5.063%, (1 mo. USD LIBOR + 3.00%), 2/2/24 | 893,250 | 892,685 |
Syniverse Holdings, Inc., Term Loan, 7.028%, (1 mo. USD LIBOR + 5.00%), 3/9/23 | 246,250 | 232,167 |
4,834,311 | ||
Utilities - 0.7% | ||
Granite Acquisition, Inc., Term Loan, 5.604%, (3 mo. USD LIBOR + 3.50%), 12/19/21 | 293,538 | 294,718 |
Pike Corporation, Term Loan, 5.30%, (1 mo. USD LIBOR + 3.25%), 7/19/26 | 48,873 | 49,117 |
343,835 | ||
Total Senior Floating Rate Loans (Cost $59,975,840) | 58,753,050 | |
SHARES | VALUE ($) | |
EXCHANGE-TRADED FUNDS - 1.7% | ||
Invesco Senior Loan ETF (4) | 16,100 | 363,699 |
SPDR Blackstone / GSO Senior Loan ETF (4) | 10,750 | 497,940 |
Total Exchange-Traded Funds (Cost $866,581) | 861,639 | |
12 www.calvert.com CALVERT FLOATING-RATE ADVANTAGE FUND ANNUAL REPORT
PRINCIPAL AMOUNT ($) | VALUE ($) | |
CORPORATE BONDS - 4.3% | ||
Automotive - 0.1% | ||
Panther BF Aggregator 2 LP / Panther Finance Co., Inc., 6.25%, 5/15/26 (5) | 25,000 | 26,375 |
Business Equipment and Services - 0.2% | ||
Allied Universal Holdco LLC, 6.625%, 7/15/26 (5) | 25,000 | 26,469 |
Prime Security Services Borrower, LLC / Prime Finance, Inc., 5.75%, 4/15/26 (5) | 75,000 | 78,285 |
104,754 | ||
Containers and Glass Products - 1.5% | ||
Reynolds Group Issuer, Inc. / Reynolds Group Issuer LLC / Reynolds Group Issuer Lu, 5.125%, 7/15/23 (5) | 750,000 | 769,687 |
Health Care - 2.3% | ||
Avantor, Inc., 6.00%, 10/1/24 (5) | 300,000 | 322,209 |
HCA, Inc., 5.25%, 4/15/25 | 750,000 | 835,287 |
1,157,496 | ||
Radio and Television - 0.2% | ||
Diamond Sports Group LLC / Diamond Sports Finance Co., 5.375%, 8/15/26 (5) | 50,000 | 52,000 |
iHeartCommunications, Inc., 5.25%, 8/15/27 (5) | 25,000 | 26,063 |
78,063 | ||
Total Corporate Bonds (Cost $2,052,855) | 2,136,375 | |
SHARES | VALUE ($) | |
SHORT TERM INVESTMENT OF CASH COLLATERAL FOR SECURITIES LOANED - 1.6% | ||
State Street Navigator Securities Lending Government Money Market Portfolio, 2.07% | 804,759 | 804,759 |
Total Short Term Investment of Cash Collateral for Securities Loaned (Cost $804,759) | 804,759 | |
TOTAL INVESTMENTS (Cost $63,700,035) - 125.0% | 62,555,823 | |
Less Unfunded Loan Commitments - (0.1%) | (73,784) | |
NET INVESTMENTS (Cost $63,626,251) - 124.9% | 62,482,039 | |
Note Payable - (34.0%) | (17,000,000) | |
Other assets and liabilities, net - 9.1% | 4,564,428 | |
NET ASSETS - 100.0% | 50,046,467 | |
www.calvert.com CALVERT FLOATING-RATE ADVANTAGE FUND ANNUAL REPORT 13
NOTES TO SCHEDULE OF INVESTMENTS | |
(1) Remaining maturities of senior floating rate loans may be less than the stated maturities shown as a result of contractual or optional prepayments by the borrower. Such prepayments cannot be predicted with certainty. Senior floating rate loans generally pay interest at rates which are periodically re-determined at a spread above the London Interbank Offered Rate (“LIBOR”) or other short-term rates. The rate shown is the rate in effect at September 30, 2019. Senior floating rate loans are generally considered restrictive in that the Fund is ordinarily contractually obligated to receive consent from the Agent Bank and/or borrower prior to disposition of a senior floating rate loan. | |
(2) The stated interest rate represents the weighted average interest rate at September 30, 2019 of contracts within the loan facility. Interest rates on contracts are primarily redetermined either weekly, monthly or quarterly by reference to the indicated base lending rate and spread and the reset period. | |
(3) Unfunded or partially unfunded loan commitments. The stated interest rate reflects the weighted average of the reference rate and spread for the funded portion, if any, and the commitment fees on the portion of the loan that is unfunded. See Note 1E for description. At September 30, 2019, the total value of unfunded loan commitments is $73,975. | |
(4) All or a portion of this security was on loan at September 30, 2019. The aggregate market value of securities on loan at September 30, 2019 was $852,999. | |
(5) Security is exempt from registration under Rule 144A of the Securities Act of 1933. These securities may be sold in transactions exempt from registration, normally to qualified institutional buyers. Total market value of Rule 144A securities amounts to $1,301,088, which represents 2.6% of the net assets of the Fund as of September 30, 2019. | |
Abbreviations: | |
LIBOR: | London Interbank Offered Rate |
USD: | United States Dollar |
See notes to financial statements. | |
14 www.calvert.com CALVERT FLOATING-RATE ADVANTAGE FUND ANNUAL REPORT
CALVERT FLOATING-RATE ADVANTAGE FUND
STATEMENT OF ASSETS AND LIABILITIES
SEPTEMBER 30, 2019
ASSETS | |||
Investments in securities of unaffiliated issuers, at value (identified cost $63,626,251) - including $852,999 of securities on loan | $62,482,039 | ||
Cash | 3,154,310 | ||
Receivable for investments sold | 2,321,707 | ||
Receivable for capital shares sold | 25,063 | ||
Interest receivable | 197,246 | ||
Securities lending income receivable | 414 | ||
Receivable from affiliate | 12,812 | ||
Trustees’ deferred compensation plan | 597 | ||
Prepaid upfront fees on note payable | 14,081 | ||
Prepaid expenses | 1,530 | ||
Other assets | 3,091 | ||
Total assets | 68,212,890 | ||
LIABILITIES | |||
Payable for investments purchased | 49,875 | ||
Payable for capital shares redeemed | 147,517 | ||
Distributions payable | 7,552 | ||
Deposits for securities loaned | 804,759 | ||
Payable to affiliates: | |||
Investment advisory fee | 29,050 | ||
Administrative fee | 5,425 | ||
Distribution and service fees | 675 | ||
Sub-transfer agency fee | 290 | ||
Trustees’ deferred compensation plan | 597 | ||
Accrued expenses | 120,683 | ||
Note payable | 17,000,000 | ||
Total liabilities | 18,166,423 | ||
NET ASSETS | $50,046,467 | ||
NET ASSETS CONSIST OF: | |||
Paid-in capital applicable to shares of beneficial interest | |||
(unlimited number of no par value shares authorized) | $52,830,659 | ||
Accumulated loss | (2,784,192) | ||
Total | $50,046,467 | ||
NET ASSET VALUE PER SHARE | |||
Class A (based on net assets of $3,286,437 and 337,770 shares outstanding) | $9.73 | ||
Class I (based on net assets of $14,748,991 and 1,516,472 shares outstanding) | $9.73 | ||
Class R6 (based on net assets of $32,011,039 and 3,292,894 shares outstanding) | $9.72 | ||
OFFERING PRICE PER SHARE* | |||
Class A (100/96.25 of net asset value per share) | $10.11 | ||
* On sales of $50,000 or more, the offering price of Class A shares is reduced. | |||
See notes to financial statements. | |||
www.calvert.com CALVERT FLOATING-RATE ADVANTAGE FUND ANNUAL REPORT 15
CALVERT FLOATING-RATE ADVANTAGE FUND
STATEMENT OF OPERATIONS
YEAR ENDED SEPTEMBER 30, 2019
INVESTMENT INCOME | |||
Dividend income | $22,786 | ||
Interest income | 4,362,121 | ||
Securities lending income, net | 2,848 | ||
Total investment income | 4,387,755 | ||
EXPENSES | |||
Investment advisory fee | 385,849 | ||
Administrative fee | 77,780 | ||
Distribution and service fees: | |||
Class A | 8,387 | ||
Trustees’ fees and expenses | 4,670 | ||
Custodian fees | 25,789 | ||
Transfer agency fees and expenses | 29,584 | ||
Accounting fees | 15,080 | ||
Professional fees | 55,356 | ||
Registration fees | 60,470 | ||
Reports to shareholders | 11,414 | ||
Interest expense and fees and other borrowing costs | 612,260 | ||
Miscellaneous | 15,439 | ||
Total expenses | 1,302,078 | ||
Waiver and/or reimbursement of expenses by affiliate | (183,596) | ||
Reimbursement of expenses-other | (1,810) | ||
Net expenses | 1,116,672 | ||
Net investment income | 3,271,083 | ||
REALIZED AND UNREALIZED GAIN (LOSS) | |||
Net realized loss on investment securities | (1,550,361) | ||
Net change in unrealized appreciation (depreciation) on investment securities | (1,054,707) | ||
Net realized and unrealized loss | (2,605,068) | ||
Net increase in net assets resulting from operations | $666,015 | ||
See notes to financial statements. | |||
16 www.calvert.com CALVERT FLOATING-RATE ADVANTAGE FUND ANNUAL REPORT
CALVERT FLOATING-RATE ADVANTAGE FUND
STATEMENTS OF CHANGES IN NET ASSETS
INCREASE (DECREASE) IN NET ASSETS | Year Ended September 30, 2019 | Period Ended September 30, 2018(1) | |||||
Operations: | |||||||
Net investment income | $3,271,083 | $2,552,868 | |||||
Net realized loss | (1,550,361 | ) | (146,700 | ) | |||
Net change in unrealized appreciation (depreciation) | (1,054,707 | ) | (89,505 | ) | |||
Net increase in net assets resulting from operations | 666,015 | 2,316,663 | |||||
Distributions to shareholders: | |||||||
Class A shares | (162,102 | ) | (41,317 | ) | |||
Class I shares | (1,282,602 | ) | (553,234 | ) | |||
Class R6 shares | (1,822,024 | ) | (1,961,208 | ) | |||
Total distributions to shareholders | (3,266,728 | ) | (2,555,759 | ) | |||
Capital share transactions: | |||||||
Class A shares | 281,569 | 3,090,163 | |||||
Class I shares | (10,310,001 | ) | 26,491,733 | ||||
Class R6 shares | (19,458,423 | ) | 52,791,235 | ||||
Net increase (decrease) in net assets from capital share transactions | (29,486,855 | ) | 82,373,131 | ||||
TOTAL INCREASE (DECREASE) IN NET ASSETS | (32,087,568 | ) | 82,134,035 | ||||
NET ASSETS | |||||||
Beginning of period | 82,134,035 | — | |||||
End of period | $50,046,467 | $82,134,035 | |||||
(1) For the period from the start of business, October 10, 2017, to September 30, 2018. | |||||||
See notes to financial statements. | |||||||
www.calvert.com CALVERT FLOATING-RATE ADVANTAGE FUND ANNUAL REPORT 17
CALVERT FLOATING-RATE ADVANTAGE FUND
STATEMENT OF CASH FLOWS
CASH FLOWS FROM OPERATING ACTIVITIES | Year Ended September 30, 2019 | ||
Net increase in net assets from operations | $666,015 | ||
Adjustments to reconcile net increase in net assets from operations to net cash provided by operating activities: | |||
Investments purchased | (41,613,840 | ) | |
Investments sold and principal repayments | 66,122,158 | ||
Increase in short-term investments, net | (804,759 | ) | |
Net amortization/accretion of premium (discount) | 6,325 | ||
Amortization of prepaid upfront fees on note payable | 17,544 | ||
Increase in interest receivable | (30,819 | ) | |
Increase in securities lending income receivable | (414 | ) | |
Decrease in receivable from affiliate | 9,464 | ||
Decrease in prepaid expenses | 12,853 | ||
Increase in trustees’ deferred compensation plan | (517 | ) | |
Increase in other assets | (1,810 | ) | |
Increase in deposits for securities loaned | 804,759 | ||
Decrease in payable to affiliate for investment advisory fee | (9,370 | ) | |
Decrease in payable to affiliate for administrative fee | (2,148 | ) | |
Increase in payable to affiliate for sub-transfer agency fee | 195 | ||
Increase in payable to affiliate for distribution and service fees | 109 | ||
Increase in payable to affiliate for trustees’ deferred compensation plan | 517 | ||
Decrease in accrued expenses | (364 | ) | |
Decrease in unfunded loan commitments | (11,817 | ) | |
Net change in unrealized (appreciation) depreciation from investments | 1,054,707 | ||
Net realized loss from investments | 1,550,361 | ||
Net cash provided by operating activities | $27,769,149 | ||
CASH FLOWS FROM FINANCING ACTIVITIES | |||
Cash distributions paid to shareholders | ($371,836 | ) | |
Proceeds from capital shares sold | 32,723,046 | ||
Capital shares redeemed | (64,454,168 | ) | |
Prepaid upfront fees on note payable | (31,625 | ) | |
Proceeds from note payable | 37,500,000 | ||
Repayments of note payable | (39,500,000 | ) | |
Net cash used in financing activities | ($34,134,583 | ) | |
Net decrease in cash | ($6,365,434 | ) | |
Cash at beginning of year | $9,519,744 | ||
Cash at end of year | $3,154,310 | ||
SUPPLEMENTAL DISCLOSURE OF CASH FLOW INFORMATION: | |||
Non cash financing activities included herein consist of: Reinvestment of dividends and distributions | $2,887,340 | ||
Cash paid for interest and fees on borrowings | $631,354 | ||
See notes to financial statements. | |||
18 www.calvert.com CALVERT FLOATING-RATE ADVANTAGE FUND ANNUAL REPORT
CALVERT FLOATING-RATE ADVANTAGE FUND
FINANCIAL HIGHLIGHTS
Year Ended September 30, 2019 | Period Ended September 30, 2018 (1) | |||||
CLASS A SHARES | ||||||
Net asset value, beginning | $9.97 | $10.00 | ||||
Income from investment operations: | ||||||
Net investment income (2) | 0.47 | 0.38 | ||||
Net realized and unrealized loss | (0.24) | (0.06) | ||||
Total from investment operations | 0.23 | 0.32 | ||||
Distributions from: | ||||||
Net investment income | (0.47) | (0.35) | ||||
Total distributions | (0.47) | (0.35) | ||||
Total decrease in net asset value | (0.24) | (0.03) | ||||
Net asset value, ending | $9.73 | $9.97 | ||||
Total return (3) | 2.42 | % | 3.25 | % | (4) | |
Ratios to average net assets: (5) | ||||||
Total expenses (7) | 2.29 | % | 2.48 | % | (6) | |
Net expenses (7) | 1.98 | % | 2.13 | % | (6) | |
Net investment income | 4.86 | % | 3.93 | % | (6) | |
Portfolio turnover | 44 | % | 35 | % | (4) | |
Net assets, ending (in thousands) | $3,286 | $3,090 | ||||
(1) For the period from the start of business, October 10, 2017, to September 30, 2018. | ||||||
(2) Computed using average shares outstanding. | ||||||
(3) Returns are historical and are calculated by determining the percentage change in net asset value with all distributions reinvested and do not reflect the effect of sales charges, if any. | ||||||
(4) Not annualized. | ||||||
(5) Total expenses do not reflect amounts reimbursed and/or waived by the adviser and certain of its affiliates, if applicable. Net expenses are net of all reductions and represent the net expenses paid by the Fund. | ||||||
(6) Annualized. | ||||||
(7) Includes interest expense and fees and other borrowing costs of 0.96% and 1.07% for the year ended September 30, 2019 and the period ended September 30, 2018, respectively. | ||||||
See notes to financial statements. | ||||||
www.calvert.com CALVERT FLOATING-RATE ADVANTAGE FUND ANNUAL REPORT 19
CALVERT FLOATING-RATE ADVANTAGE FUND
FINANCIAL HIGHLIGHTS
Year Ended September 30, 2019 | Period Ended September 30, 2018 (1) | |||||
CLASS I SHARES | ||||||
Net asset value, beginning | $9.97 | $10.00 | ||||
Income from investment operations: | ||||||
Net investment income (2) | 0.49 | 0.40 | ||||
Net realized and unrealized loss | (0.23) | (0.06) | ||||
Total from investment operations | 0.26 | 0.34 | ||||
Distributions from: | ||||||
Net investment income | (0.50) | (0.37) | ||||
Total distributions | (0.50) | (0.37) | ||||
Total decrease in net asset value | (0.24) | (0.03) | ||||
Net asset value, ending | $9.73 | $9.97 | ||||
Total return (3) | 2.57 | % | 3.48 | % | (4) | |
Ratios to average net assets: (5) | ||||||
Total expenses (7) | 2.02 | % | 2.06 | % | (6) | |
Net expenses (7) | 1.70 | % | 1.67 | % | (6) | |
Net investment income | 5.05 | % | 4.10 | % | (6) | |
Portfolio turnover | 44 | % | 35 | % | (4) | |
Net assets, ending (in thousands) | $14,749 | $26,452 | ||||
(1) For the period from the start of business, October 10, 2017, to September 30, 2018. | ||||||
(2) Computed using average shares outstanding. | ||||||
(3) Returns are historical and are calculated by determining the percentage change in net asset value with all distributions reinvested and do not reflect the effect of sales charges, if any. | ||||||
(4) Not annualized. | ||||||
(5) Total expenses do not reflect amounts reimbursed and/or waived by the adviser and certain of its affiliates, if applicable. Net expenses are net of all reductions and represent the net expenses paid by the Fund. | ||||||
(6) Annualized. | ||||||
(7) Includes interest expense and fees and other borrowing costs of 0.93% and 0.91% for the year ended September 30, 2019 and the period ended September 30, 2018, respectively. | ||||||
See notes to financial statements. | ||||||
20 www.calvert.com CALVERT FLOATING-RATE ADVANTAGE FUND ANNUAL REPORT
CALVERT FLOATING-RATE ADVANTAGE FUND
FINANCIAL HIGHLIGHTS
Year Ended September 30, 2019 | Period Ended September 30, 2018 (1) | |||||
CLASS R6 SHARES | ||||||
Net asset value, beginning | $9.96 | $10.00 | ||||
Income from investment operations: | ||||||
Net investment income (2) | 0.50 | 0.37 | ||||
Net realized and unrealized loss | (0.24) | (0.04) | ||||
Total from investment operations | 0.26 | 0.33 | ||||
Distributions from: | ||||||
Net investment income | (0.50) | (0.37) | ||||
Total distributions | (0.50) | (0.37) | ||||
Total decrease in net asset value | (0.24) | (0.04) | ||||
Net asset value, ending | $9.72 | $9.96 | ||||
Total return (3) | 2.67 | % | 3.35 | % | (4) | |
Ratios to average net assets: (5) | ||||||
Total expenses(7) | 1.99 | % | 1.74 | % | (6) | |
Net expenses(7) | 1.72 | % | 1.44 | % | (6) | |
Net investment income | 5.08 | % | 3.81 | % | (6) | |
Portfolio turnover | 44 | % | 35 | % | (4) | |
Net assets, ending (in thousands) | $32,011 | $52,592 | ||||
(1) For the period from the start of business, October 10, 2017, to September 30, 2018. | ||||||
(2) Computed using average shares outstanding. | ||||||
(3) Returns are historical and are calculated by determining the percentage change in net asset value with all distributions reinvested and do not reflect the effect of sales charges, if any. | ||||||
(4) Not annualized. | ||||||
(5) Total expenses do not reflect amounts reimbursed and/or waived by the adviser and certain of its affiliates, if applicable. Net expenses are net of all reductions and represent the net expenses paid by the Fund. | ||||||
(6) Annualized. | ||||||
(7) Includes interest expense and fees and other borrowing costs of 0.95% and 0.69% for the year ended September 30, 2019 and the period ended September 30, 2018, respectively. | ||||||
See notes to financial statements. | ||||||
www.calvert.com CALVERT FLOATING-RATE ADVANTAGE FUND ANNUAL REPORT 21
NOTES TO FINANCIAL STATEMENTS
NOTE 1 — SIGNIFICANT ACCOUNTING POLICIES
Calvert Floating-Rate Advantage Fund (the Fund) is a diversified series of Calvert Management Series (the Trust). The Trust is a Massachusetts business trust registered under the Investment Company Act of 1940, as amended (the 1940 Act), as an open-end management investment company. The investment objective of the Fund is to provide a high level of current income. The Fund commenced operations on October 10, 2017. The Fund invests primarily in senior floating-rate loans of domestic and foreign borrowers.
The Fund offers three classes of shares. Class A shares are generally sold subject to a sales charge imposed at time of purchase. A contingent deferred sales charge of 0.80% may apply to certain redemptions of Class A shares for accounts for which no sales charge was paid, if redeemed within 12 months of purchase. Class I and Class R6 shares are sold at net asset value, are not subject to a sales charge and are sold only to certain eligible investors. Each class represents a pro rata interest in the Fund, but votes separately on class-specific matters and is subject to different expenses.
The Fund applies the accounting and reporting guidance in the Financial Accounting Standards Board (FASB) Accounting Standards Codification Topic 946, Financial Services – Investment Companies (ASC 946). Subsequent events, if any, through the date that the financial statements were issued have been evaluated in the preparation of the financial statements.
A. Investment Valuation: Net asset value per share is determined every business day as of the close of the regular session of the New York Stock Exchange (generally 4:00 p.m. Eastern time). The Fund uses independent pricing services approved by the Board of Trustees (the Board) to value its investments wherever possible. Investments for which market quotations are not available or deemed not reliable are fair valued in good faith under the direction of the Board.
U.S. generally accepted accounting principles (U.S. GAAP) establishes a disclosure hierarchy that categorizes the inputs to valuation techniques used to value assets and liabilities at measurement date. These inputs are summarized in the three broad levels listed below:
Level 1 - quoted prices in active markets for identical securities
Level 2 - other significant observable inputs (including quoted prices for similar securities, interest rates, prepayment speeds, credit risk, etc.)
Level 3 - significant unobservable inputs (including the Fund’s own assumptions in determining the fair value of investments)
The inputs or methodologies used for valuing securities are not necessarily an indication of the risk associated with investing in those securities.
Valuation techniques used to value the Fund’s investments by major category are as follows:
Debt Securities. Debt securities are generally valued on the basis of valuations provided by third party pricing services, as derived from such services’ pricing models. Inputs to the models may include, but are not limited to, reported trades, executable bid and ask prices, broker/dealer quotations, prices or yields of securities with similar characteristics, interest rates, anticipated prepayments, benchmark curves or information pertaining to the issuer, as well as industry and economic events. Accordingly, debt securities are generally categorized as Level 2 in the hierarchy. Short-term debt securities of sufficient credit quality purchased with remaining maturities of sixty days or less for which a valuation from a third party pricing service is not readily available may be valued at amortized cost, which approximates fair value, and are categorized as Level 2 in the hierarchy.
Senior Floating Rate Loans. Interests in senior floating rate loans for which reliable market quotations are readily available are valued generally at the average mean of bid and ask quotations obtained from a third party pricing service, and are categorized as Level 2 in the hierarchy.
Other Securities. Exchange-traded funds are valued at the official closing price as reported by an independent pricing service on the primary market or exchange on which they are traded and are categorized as Level 1 in the hierarchy. Investments in registered investment companies (including money market funds) that do not trade on an exchange are valued at the net asset value per share on the valuation day and are categorized as Level 1 in the hierarchy.
Fair Valuation. If a market value cannot be determined for a security using the methodologies described above, or if, in the good faith opinion of the Fund’s adviser, the market value does not constitute a readily available market quotation, or if a significant event has occurred that would materially affect the value of the security, the security will be fair valued as determined in good faith by or at the direction of the Board in a manner that most fairly reflects the security’s “fair value”, which is the amount that the Fund might reasonably expect to receive for the security upon its current sale in the ordinary course. Each such determination is based on a consideration of relevant factors, which are likely to vary from one pricing context to another. These factors may include, but are not limited to, the type of security, the existence of any contractual restrictions on the security’s disposition, the
22 www.calvert.com CALVERT FLOATING-RATE ADVANTAGE FUND ANNUAL REPORT
price and extent of public trading in similar securities of the issuer or of comparable companies or entities, quotations or relevant information obtained from broker/dealers or other market participants, information obtained from the issuer, analysts, and/or the appropriate stock exchange (for exchange-traded securities), an analysis of the company’s or entity’s financial statements, and an evaluation of the forces that influence the issuer and the market(s) in which the security is purchased and sold.
The values assigned to fair value investments are based on available information and do not necessarily represent amounts that might ultimately be realized. Further, due to the inherent uncertainty of valuations of such investments, the fair values may differ significantly from the values that would have been used had an active market existed, and the differences could be material.
The following table summarizes the market value of the Fund’s holdings as of September 30, 2019, based on the inputs used to value them:
Assets | Level 1 | Level 2 | Level 3 | Total | ||||||||
Senior Floating Rate Loans (Less Unfunded Loan Commitments) | $ | — | $ | 58,679,266 | $ | — | $ | 58,679,266 | ||||
Exchange-Traded Funds | 861,639 | — | — | 861,639 | ||||||||
Corporate Bonds | — | 2,136,375 | — | 2,136,375 | ||||||||
Short Term Investment of Cash Collateral for Securities Loaned | 804,759 | — | — | 804,759 | ||||||||
Total Investments | $ | 1,666,398 | $ | 60,815,641 | $ | — | $ | 62,482,039 | ||||
B. Investment Transactions and Income: Investment transactions for financial statement purposes are accounted for on trade date. Realized gains and losses are recorded on an identified cost basis and may include proceeds from litigation. Dividend income is recorded on the ex-dividend date for dividends received in cash and/or securities. Non-cash dividends are recorded at the fair value of the securities received. Distributions received that represent a return of capital are recorded as a reduction of cost of investments. Distributions received that represent a capital gain are recorded as a realized gain. Interest income, which includes amortization of premium and accretion of discount on debt securities, is accrued as earned. The Fund earns certain fees in connection with its investments in senior floating rate loans. These fees are in addition to interest payments earned and may include amendment fees, consent fees and prepayment fees, which are recorded to income as earned.
C. Share Class Accounting: Realized and unrealized gains and losses are allocated daily to each class of shares based upon the relative net assets of each class to the total net assets of the Fund. Net investment income, other than class-specific expenses, is allocated daily to each class of shares based upon the ratio of the value of each class’s paid shares to the total value of all paid shares. Expenses arising in connection with a specific class are charged directly to that class. Sub-accounting, recordkeeping and similar administrative fees payable to financial intermediaries, which are a component of transfer agency fees and expenses on the Statement of Operations, are not allocated to Class R6 shares.
D. Senior Floating Rate Loans: The Fund may invest in direct debt instruments, which are interests in amounts owed to lenders or lending syndicates by corporate, governmental, or other borrowers. The Fund’s investment in loans may be in the form of participations in loans or assignments of all or a portion of loans from third parties. A loan is often administered by a bank or other financial institution (the lender) that acts as agent for all holders. The agent administers the terms of the loan, as specified in the loan agreement. The Fund may invest in multiple series or tranches of a loan, which may have varying terms and carry different associated risks. When the Fund purchases assignments from lenders, it acquires direct rights against the borrower of the loan. When investing in a loan participation, the Fund has the right to receive payments of principal, interest and any fees to which it is entitled only from the lender selling the loan agreement and only upon receipt of such payments by the lender from the borrower. The Fund generally has no right to enforce compliance by the borrower with the terms of the loan agreement. As a result, the Fund may be subject to the credit risk of both the borrower and the lender that is issuing the participation interest.
E. Unfunded Loan Commitments: The Fund may enter into certain loan agreements all or a portion of which may be unfunded. The Fund is obligated to fund these commitments at the borrower’s discretion. The commitments, if any, are disclosed in the accompanying Schedule of Investments. At September 30, 2019, the Fund had sufficient cash and/or securities to cover these commitments.
F. Distributions to Shareholders: Distributions to shareholders are recorded by the Fund on ex-dividend date. The Fund declares income distributions daily to shareholders of record at the time of declaration and generally pays them monthly. Distributions of realized capital gains are made at least annually. Distributions are determined in accordance with income tax regulations which may differ from U.S. GAAP; accordingly, periodic reclassifications are made within the Fund’s capital accounts to reflect income and gains available for distribution under income tax regulations.
www.calvert.com CALVERT FLOATING-RATE ADVANTAGE FUND ANNUAL REPORT 23
G. Estimates: The preparation of financial statements in conformity with U.S. GAAP requires management to make estimates and assumptions that affect the reported amounts of assets and liabilities and disclosure of contingent assets and liabilities at the date of the financial statements and the reported amounts of increases and decreases in net assets from operations during the reporting period. Actual results could differ from those estimates.
H. Indemnifications: Under the Trust’s organizational document, its officers and Trustees may be indemnified against certain liabilities and expenses arising out of the performance of their duties to the Fund. Under Massachusetts law, if certain conditions prevail, shareholders of a Massachusetts business trust (such as the Trust) could be deemed to have personal liability for the obligations of the Trust. However, the Trust’s Declaration of Trust contains an express disclaimer of liability on the part of Fund shareholders and provides that the Trust shall assume, upon request by the shareholder, the defense on behalf of any Fund shareholders or former shareholders. Additionally, in the normal course of business, the Fund enters into agreements with service providers that may contain indemnification clauses. The Fund’s maximum exposure under these arrangements is unknown as this would involve future claims that may be made against the Fund that have not yet occurred.
I. Federal Income Taxes: No provision for federal income or excise tax is required since the Fund intends to continue to qualify as a regulated investment company under the Internal Revenue Code and to distribute substantially all of its taxable earnings.
Management has analyzed the Fund’s tax positions taken for all open federal income tax years and has concluded that no provision for federal income tax is required in the Fund’s financial statements. A Fund’s federal tax return is subject to examination by the Internal Revenue Service for a period of three years from the date of filing.
NOTE 2 — RELATED PARTY TRANSACTIONS
The investment advisory fee is earned by Calvert Research and Management (CRM), a subsidiary of Eaton Vance Management (EVM), as compensation for investment advisory services rendered to the Fund. Pursuant to the investment advisory agreement, CRM receives a fee, payable monthly, at the following annual rates of the Fund’s average daily gross assets: 0.48% up to and including $1 billion and 0.43% on the excess of $1 billion. Gross assets of the Fund are calculated by deducting all liabilities of the Fund except the principal amount of any indebtedness for money borrowed, including debt securities issued by the Fund. For the year ended September 30, 2019, the investment advisory fee amounted to $385,849 or 0.60% of the Fund’s average daily net assets.
CRM has agreed to reimburse certain of the Fund’s operating expenses (excluding investment advisory, administrative and distribution and service fees) in excess of 0.06% annually for each of Class A, Class I and Class R6 of such class’ average daily net assets. The expense reimbursement relates to ordinary operating expenses only and does not include expenses such as: brokerage commissions, acquired fund fees and expenses of unaffiliated funds, interest expense and other borrowing costs, taxes or litigation expenses. The expense reimbursement agreement with CRM may be changed or terminated after January 31, 2020. For the year ended September 30, 2019, CRM waived or reimbursed expenses of $183,596.
The administrative fee is earned by CRM as compensation for administrative services rendered to the Fund. The fee is computed at an annual rate of 0.12% of the Fund’s average daily net assets attributable to Class A, Class I and Class R6 and is payable monthly. For the year ended September 30, 2019, CRM was paid administrative fees of $77,780.
The Fund has in effect a distribution plan for Class A shares (Class A Plan) pursuant to Rule 12b-1 under the 1940 Act. Pursuant to the Class A Plan, the Fund pays Eaton Vance Distributors, Inc. (EVD), an affiliate of CRM and the Fund’s principal underwriter, a distribution and service fee of 0.25% per annum of its average daily net assets attributable to Class A shares for distribution services and facilities provided to the Fund by EVD, as well as for personal services and/or the maintenance of shareholder accounts. Distribution and service fees paid or accrued for the year ended September 30, 2019 amounted to $8,387 for Class A shares.
The Fund was informed that EVD received $1,744 as its portion of the sales charge on sales of Class A shares and $34 of contingent deferred sales charges paid by Fund shareholders for the year ended September 30, 2019.
EVM provides sub-transfer agency and related services to the Fund pursuant to a Sub-Transfer Agency Support Services Agreement. For the year ended September 30, 2019, sub-transfer agency fees and expenses incurred to EVM amounted to $1,060 and are included in transfer agency fees and expenses on the Statement of Operations.
Each Trustee of the Fund who is not an employee of CRM or its affiliates receives a fee of $3,000 for each Board meeting attended in person and $2,000 for each Board meeting attended by phone plus an annual fee of $117,000, and $1,500 for each Committee meeting attended in person and $1,000 for each Committee meeting attended by phone plus an annual Committee fee of $2,500. The Board chair receives an additional $15,000 annual retainer and Committee chairs receive an additional $6,000 annual retainer. Eligible Trustees may participate in a Deferred Compensation Plan (the Plan). Amounts deferred under the Plan are treated as though equal dollar amounts had been invested in shares of the Fund or other Calvert funds selected by the Trustees. The Fund purchases shares of the funds selected equal to the dollar amounts deferred under the Plan, resulting in an asset equal to
24 www.calvert.com CALVERT FLOATING-RATE ADVANTAGE FUND ANNUAL REPORT
the deferred compensation liability. Obligations of the Plan are paid solely from the Fund’s assets. Trustees’ fees are allocated to each of the Calvert funds served. Salaries and fees of officers and Trustees of the Fund who are employees of CRM or its affiliates are paid by CRM. In addition, an advisory council was established to aid the Board and CRM in advancing the cause of responsible investing through original scholarship and thought leadership. The advisory council consists of CRM’s Chief Executive Officer and four additional members. Each member (other than CRM’s Chief Executive Officer) receives annual compensation of $75,000, which is being reimbursed by Calvert Investment Management, Inc. (CIM), the Calvert funds’ former investment adviser and Ameritas Holding Company, CIM’s parent company, through the end of 2019. For the year ended September 30, 2019, the Fund’s allocated portion of such expense and reimbursement was $1,810, which are included in miscellaneous expense and reimbursement of expenses-other, respectively, on the Statement of Operations.
NOTE 3 — INVESTMENT ACTIVITY
During the year ended September 30, 2019, the cost of purchases and proceeds from sales of investments, other than short-term securities and including paydowns and principal repayments on senior floating rate loans, were $34,294,246 and $68,437,464, respectively.
NOTE 4 — DISTRIBUTIONS TO SHAREHOLDERS AND INCOME TAX INFORMATION
The tax character of distributions declared for the year ended September 30, 2019 and for the period ended September 30, 2018 was as follows:
Year Ended September 30, | Period Ended September | ||||||
2019 | 2018 | ||||||
Ordinary income | $3,266,728 | $2,555,759 | |||||
As of September 30, 2019, the components of distributable earnings (accumulated loss) on a tax basis were as follows:
Undistributed ordinary income | $64,633 | ||
Deferred capital losses | ($1,670,552 | ) | |
Net unrealized appreciation (depreciation) | ($1,170,721 | ) | |
Distributions payable | ($7,552 | ) | |
At September 30, 2019, the Fund, for federal income tax purposes, had deferred capital losses of $1,670,552 which would reduce the Fund’s taxable income arising from future net realized gains on investment transactions, if any, to the extent permitted by the Internal Revenue Code, and thus would reduce the amount of distributions to shareholders, which would otherwise be necessary to relieve the Fund of any liability for federal income or excise tax. The deferred capital losses are treated as arising on the first day of the Fund’s next taxable year, can be carried forward for an unlimited period, and retain the same short-term or long-term character as when originally deferred. Of the deferred capital losses at September 30, 2019, $904,574 are short-term and $765,978 are long-term.
The cost and unrealized appreciation (depreciation) of investments of the Fund at September 30, 2019, as determined on a federal income tax basis, were as follows:
Aggregate cost | $63,652,760 | ||
Gross unrealized appreciation | $204,903 | ||
Gross unrealized depreciation | (1,375,624) | ||
Net unrealized appreciation (depreciation) | ($1,170,721 | ) | |
NOTE 5 — SECURITIES LENDING
To generate additional income, the Fund may lend its securities pursuant to a securities lending agency agreement with State Street Bank and Trust Company (SSBT), the securities lending agent. Security loans are subject to termination by the Fund at any time and, therefore, are not considered illiquid investments. The Fund requires that the loan be continuously collateralized by either cash or securities as collateral equal at all times to at least 102% of the market value of the domestic securities loaned and 105% of the market value of the international securities loaned (if applicable). The market value of securities loaned is determined daily and any additional required collateral is delivered to the Fund on the next business day. Cash collateral is generally invested in a money market fund registered under the 1940 Act that is managed by an affiliate of SSBT. Any gain or loss in the market price of the loaned securities that might occur and any interest earned or dividends declared during the term of the loan would
www.calvert.com CALVERT FLOATING-RATE ADVANTAGE FUND ANNUAL REPORT 25
accrue to the account of the Fund. Income earned on the investment of collateral, net of broker rebates and other expenses incurred by the securities lending agent, is split between the Fund and the securities lending agent on the basis of agreed upon contractual terms. Non-cash collateral, if any, is held by the lending agent on behalf of the Fund and cannot be sold or re-pledged by the Fund; accordingly, such collateral is not reflected in the Statement of Assets and Liabilities.
The risks associated with lending portfolio securities include, but are not limited to, possible delays in receiving additional collateral or in the recovery of the loaned securities, possible loss of rights to the collateral should the borrower fail financially, as well as risk of loss in the value of the collateral or the value of the investments made with the collateral. The securities lending agent shall indemnify the Fund in the case of default of any securities borrower.
At September 30, 2019, the total value of securities on loan was $852,999 and the total value of collateral received was $873,416, comprised of cash of $804,759 and U.S. government and/or agencies securities of $68,657.
The following table provides a breakdown of securities lending transactions accounted for as secured borrowings, the obligations by class of collateral pledged, and the remaining contractual maturity of those transactions as of September 30, 2019.
Remaining Contractual Maturity of the Transactions | |||||||||||||||
Overnight and Continuous | <30 days | 30 to 90 days | >90 days | Total | |||||||||||
Securities Lending Transactions | |||||||||||||||
Exchange Traded Funds | $873,416 | $— | $— | $— | $873,416 | ||||||||||
The carrying amount of the liability for deposits for securities loaned at September 30, 2019 approximated its fair value. If measured at fair value, such liability would have been considered as Level 2 in the fair value hierarchy (see Note 1A) at September 30, 2019.
NOTE 6 — CREDIT AGREEMENT
The Fund has entered into a committed, senior secured 364-day revolving line of credit, as amended (the Agreement) with a bank to borrow up to a limit of $45 million. Borrowings under the Agreement are secured by the assets of the Fund. The Fund is required to maintain a certain borrowing base while borrowings are outstanding. Borrowings may be made for the purchase of investment securities and temporary or emergency purposes. The Fund may elect for its borrowings to bear interest at the higher of the (i) bank’s prime rate and (ii) Federal Funds rate plus 0.85%; or the one week, one, two, three or six month London Interbank Offered Rate plus 0.85%. Under the terms of the Agreement, in effect through March 17, 2020, the Fund pays a facility fee of 0.15% per annum on the commitment amount. In connection with the extension of the term of the Agreement on October 24, 2018 and subsequent renewal on March 19, 2019, the Fund paid upfront fees of $9,125 and $22,500, respectively, which were/are being amortized to interest expense through March 19, 2019 and March 17, 2020, respectively. The unamortized balance at September 30, 2019 is approximately $14,000 and is included in prepaid upfront fees on note payable on the Statement of Assets and Liabilities. At September 30, 2019, the Fund had borrowings outstanding under the Agreement of $17,000,000 at an interest rate of 2.87%. Based on the short-term nature of the borrowings under the Agreement and the variable interest rate, the carrying amount of the borrowings at September 30, 2019 approximated its fair value. If measured at fair value, borrowings under the Agreement would have been considered as Level 2 in the fair value hierarchy (see Note 1A) at September 30, 2019. For the year ended September 30, 2019, the average borrowings under the Agreement and the average interest rate (excluding fees) were $15,539,726 and 3.22%, respectively.
26 www.calvert.com CALVERT FLOATING-RATE ADVANTAGE FUND ANNUAL REPORT
NOTE 7 – CAPITAL SHARES
Transactions in capital shares for the year ended September 30, 2019 and for the period ended September 30, 2018 were as follows:
Year Ended September 30, 2019 | Period Ended September 30, 2018 (1) | ||||||||||
Shares | Amount | Shares | Amount | ||||||||
Class A | |||||||||||
Shares sold | 195,738 | $1,914,479 | 322,089 | $3,210,796 | |||||||
Reinvestment of distributions | 15,456 | 150,430 | 4,105 | 40,844 | |||||||
Shares redeemed | (183,374 | ) | (1,783,340 | ) | (16,244 | ) | (161,477 | ) | |||
Net increase | 27,820 | $281,569 | 309,950 | $3,090,163 | |||||||
Class I | |||||||||||
Shares sold | 2,630,684 | $25,817,573 | 4,708,181 | $47,007,516 | |||||||
Reinvestment of distributions | 125,395 | 1,219,564 | 31,113 | 309,507 | |||||||
Shares redeemed | (3,893,622 | ) | (37,347,138 | ) | (2,085,279 | ) | (20,825,290 | ) | |||
Net increase (decrease) | (1,137,543 | ) | ($10,310,001 | ) | 2,654,015 | $26,491,733 | |||||
Class R6 | |||||||||||
Shares sold | 459,476 | $4,476,567 | 5,432,328 | $54,310,393 | |||||||
Reinvestment of distributions | 155,916 | 1,517,346 | 197,468 | 1,967,481 | |||||||
Shares redeemed | (2,601,279 | ) | (25,452,336 | ) | (351,015 | ) | (3,486,639 | ) | |||
Net increase (decrease) | (1,985,887 | ) | ($19,458,423 | ) | 5,278,781 | $52,791,235 | |||||
(1) For the period from the start of business, October 10, 2017, to September 30, 2018. | |||||||||||
NOTE 8 – CREDIT RISK
The Fund invests primarily in below investment grade senior floating-rate loans, which have speculative characteristics because of the credit risk associated with their issuers. Changes in economic conditions or other circumstances are more likely to reduce the capacity of issuers of these securities to make principal and interest payments. Such companies are more likely to default on their payments of interest and principal owed than issuers of investment grade bonds. An economic downturn generally leads to a higher non-payment rate, and a loan or other debt obligation may lose significant value before a default occurs. Lower rated investments also may be subject to greater price volatility than higher rated investments. Moreover, the specific collateral used to secure a loan may decline in value or become illiquid, which would adversely affect the loan’s value.
www.calvert.com CALVERT FLOATING-RATE ADVANTAGE FUND ANNUAL REPORT 27
REPORT OF INDEPENDENT REGISTERED PUBLIC ACCOUNTING FIRM
To the Shareholders and Board of Trustees
Calvert Management Series:
Opinion on the Financial Statements
We have audited the accompanying statement of assets and liabilities of Calvert Floating-Rate Advantage Fund (the Fund), a series of Calvert Management Series, including the schedule of investments, as of September 30, 2019, the related statements of operations and cash flows for the year then ended, the statements of changes in net assets for the year ended September 30, 2019 and the period from October 10, 2017 (commencement of operations) to September 30, 2018, and the related notes (collectively, the financial statements) and the financial highlights for the year or period indicated therein. In our opinion, the financial statements and financial highlights present fairly, in all material respects, the financial position of the Fund as of September 30, 2019, the results of its operations and its cash flows for the year then ended, the changes in its nets assets for the year ended September 30, 2019 and the period from October 10, 2017 (commencement of operations) to September 30, 2018, and the financial highlights for the year or period indicated therein, in conformity with U.S. generally accepted accounting principles.
Basis for Opinion
These financial statements and financial highlights are the responsibility of the Fund’s management. Our responsibility is to express an opinion on these financial statements and financial highlights based on our audits. We are a public accounting firm registered with the Public Company Accounting Oversight Board (United States) (PCAOB) and are required to be independent with respect to the Fund in accordance with the U.S. federal securities laws and the applicable rules and regulations of the Securities and Exchange Commission and the PCAOB.
We conducted our audits in accordance with the standards of the PCAOB. Those standards require that we plan and perform the audit to obtain reasonable assurance about whether the financial statements and financial highlights are free of material misstatement, whether due to error or fraud. Our audits included performing procedures to assess the risks of material misstatement of the financial statements and financial highlights, whether due to error or fraud, and performing procedures that respond to those risks. Such procedures included examining, on a test basis, evidence regarding the amounts and disclosures in the financial statements and financial highlights. Such procedures also included confirmation of securities owned as of September 30, 2019, by correspondence with the custodian, brokers and agent banks. Our audits also included evaluating the accounting principles used and significant estimates made by management, as well as evaluating the overall presentation of the financial statements and financial highlights. We believe that our audits provide a reasonable basis for our opinion.

We have served as the auditor of one or more of the Calvert Funds since 2002.
Philadelphia, Pennsylvania
November 20, 2019
28 www.calvert.com CALVERT FLOATING-RATE ADVANTAGE FUND ANNUAL REPORT
FEDERAL TAX INFORMATION
The Form 1099-DIV you receive in February 2020 will show the tax status of all distributions paid to your account in calendar year 2019. Shareholders are advised to consult their own tax adviser with respect to the tax consequences of their investment in the Fund.
www.calvert.com CALVERT FLOATING-RATE ADVANTAGE FUND ANNUAL REPORT (Unaudited) 29
MANAGEMENT AND ORGANIZATION
Fund Management. The Trustees of Calvert Management Series (the Trust) are responsible for the overall management and supervision of the Trust’s affairs. The Trustees and officers of the Trust are listed below. Except as indicated, each individual has held the office shown or other offices in the same company for the last five years. Trustees and officers of the Trust hold indefinite terms of office. The “Independent Trustees” consist of those Trustees who are not “interested persons” of the Trust, as that term is defined under the 1940 Act. The business address of each Trustee and officer, with the exception of Ms. Gemma and Mr. Kirchner, is 1825 Connecticut Avenue NW, Suite 400, Washington, DC 20009. As used below, “CRM” refers to Calvert Research and Management. Each Trustee oversees 39 funds in the Calvert fund complex. Each officer serves as an officer of certain other Calvert funds.
Name and Year of Birth | Trust Position(s) | Position Start Date | Principal Occupation(s) and Other Directorships During Past Five Years and Other Relevant Experience |
Interested Trustee | |||
John H. Streur(1) 1960 | Trustee & President | 2015 | President and Chief Executive Officer of Calvert Research and Management (since December 31, 2016). President and Chief Executive Officer of Calvert Investments, Inc. (January 2015 - December 2016); Chief Executive Officer of Calvert Investment Distributors, Inc. (August 2015 - December 2016); Chief Compliance Officer of Calvert Investment Management, Inc. (August 2015 - April 2016); President and Director, Portfolio 21 Investments, Inc. (through October 2014); President, Chief Executive Officer and Director, Managers Investment Group LLC (through January 2012); President and Director, The Managers Funds and Managers AMG Funds (through January 2012). Other Directorships in the Last Five Years. Portfolio 21 Investments, Inc. (asset management) (through October 2014); Managers Investment Group LLC (asset management) (through January 2012); The Managers Funds (asset management) (through January 2012); Managers AMG Funds (asset management) (through January 2012); Calvert Impact Capital, Inc. |
Independent Trustees | |||
Richard L. Baird, Jr. 1948 | Trustee | 1980 | Regional Disaster Recovery Lead, American Red Cross of Greater Pennsylvania (since 2017). Volunteer, American Red Cross (since 2015). Former President and CEO of Adagio Health Inc. (retired in 2014) in Pittsburgh, PA. Other Directorships in the Last Five Years. None. |
Alice Gresham Bullock 1950 | Chair & Trustee | 2016 | Professor Emerita at Howard University School of Law. Dean Emerita of Howard University School of Law and Deputy Director of the Association of American Law Schools (1992-1994). Other Directorships in the Last Five Years. None. |
Cari M. Dominguez 1949 | Trustee | 2016 | Former Chair of the U.S. Equal Employment Opportunity Commission. Other Directorships in the Last Five Years. Manpower, Inc. (employment agency); Triple S Management Corporation (managed care); National Association of Corporate Directors. |
John G. Guffey, Jr.(2) 1948 | Trustee | 1982 | President of Aurora Press Inc., a privately held publisher of trade paperbacks (since January 1997). Other Directorships in the Last Five Years. Calvert Impact Capital, Inc. (through December 31, 2018); Calvert Ventures, LLC. |
Miles D. Harper, III 1962 | Trustee | 2016 | Partner, Carr Riggs & Ingram (public accounting firm) since October 2014. Partner, Gainer Donnelly & Desroches (public accounting firm) (now Carr Riggs & Ingram), November 1999 - September 2014). Other Directorships in the Last Five Years. Bridgeway Funds (9) (asset management). |
Joy V. Jones 1950 | Trustee | 2016 | Attorney. Other Directorships in the Last Five Years. Conduit Street Restaurants SUD 2 Limited; Palm Management Restaurant Corporation. |
Anthony A. Williams 1951 | Trustee | 2010 | CEO and Executive Director of the Federal City Council (July 2012 to present); Senior Adviser and Independent Consultant for McKenna Long & Aldridge LLP (September 2011 to present); Executive Director of Global Government Practice at the Corporate Executive Board (January 2010 to January 2012). Other Directorships in the Last Five Years. Freddie Mac; Evoq Properties/ Meruelo Maddux Properties, Inc. (real estate management); Weston Solutions, Inc. (environmental services); Bipartisan Policy Center’s Debt Reduction Task Force; Chesapeake Bay Foundation; Catholic University of America; Urban Institute (research organization). |
30 www.calvert.com CALVERT FLOATING-RATE ADVANTAGE FUND ANNUAL REPORT (Unaudited)
Principal Officers who are not Trustees | |||
Name and Year of Birth | Trust Position(s) | Position Start Date | Principal Occupation(s) During Past Five Years |
Hope L. Brown 1973 | Chief Compliance Officer | 2014 | Chief Compliance Officer of 39 registered investment companies advised by CRM (since 2014). Vice President and Chief Compliance Officer, Wilmington Funds (2012-2014). |
Maureen A. Gemma(3) 1960 | Secretary, Vice President and Chief Legal Officer | 2016 | Vice President of CRM and officer of 39 registered investment companies advised by CRM (since 2016). Also Vice President of Eaton Vance and certain of its affiliates and officer of 162 registered investment companies advised or administered by Eaton Vance. |
James F. Kirchner(3) 1967 | Treasurer | 2016 | Vice President of CRM and officer of 39 registered investment companies advised by CRM (since 2016). Also Vice President of Eaton Vance and certain of its affiliates and officer of 162 registered investment companies advised or administered by Eaton Vance. |
(1) | Mr. Streur is an interested person of the Fund because of his positions with the Fund’s adviser and certain affiliates. |
(2) | Mr. Guffey is currently married to Rebecca L. Adamson, who serves as a member of the Advisory Council. |
(3) | The business address for Ms. Gemma and Mr. Kirchner is Two International Place, Boston, MA 02110. |
The SAI for the Fund includes additional information about the Trustees and officers of the Fund and can be obtained without charge on Calvert’s website at www.calvert.com or by calling 1-800-368-2745.
www.calvert.com CALVERT FLOATING-RATE ADVANTAGE FUND ANNUAL REPORT (Unaudited) 31
IMPORTANT NOTICES
Privacy. The Calvert Funds and Calvert Research and Management are committed to ensuring your financial privacy. Each of the financial institutions identified below has in effect the following policy (“Privacy Policy”) with respect to nonpublic personal information about its customers:
• | Only such information received from you, through application forms or otherwise, and information about your Calvert fund transactions will be collected. This may include information such as name, address, social security number, tax status, account balances and transactions. |
• | None of such information about you (or former customers) will be disclosed to anyone, except as permitted by law (which includes disclosure to employees necessary to service your account). In the normal course of servicing a customer’s account, Calvert Research and Management may share information with unaffiliated third parties that perform various required services such as transfer agents, custodians and broker-dealers. |
• | Policies and procedures (including physical, electronic and procedural safeguards) are in place that are designed to protect the confidentiality of such information. |
• | The Funds reserve the right to change this Privacy Policy at any time upon proper notification to you. Customers may want to review the Funds’ Privacy Policy periodically for changes by accessing the link on our homepage: www.calvert.com. |
Our pledge of privacy applies to the following entities: the Calvert Family of Funds, Calvert Research and Management and their affiliated service providers, Eaton Vance Management and Eaton Vance Distributors, Inc. In addition, our Privacy Policy applies only to those Calvert customers who are individuals and who have a direct relationship with us. If a customer’s account (i.e., fund shares) is held in the name of a third-party financial advisor/broker-dealer, it is likely that only such advisor’s privacy policies apply to the customer. This notice supersedes all previously issued privacy disclosures. For more information about Calvert’s Privacy Policy, please call 1-800-368-2745.
Delivery of Shareholder Documents. The Securities and Exchange Commission (SEC) permits funds to deliver only one copy of shareholder documents, including prospectuses, proxy statements and shareholder reports, to fund investors with multiple accounts at the same residential or post office box address. This practice is often called “householding” and it helps eliminate duplicate mailings to shareholders. Calvert funds, or your financial intermediary, may household the mailing of your documents indefinitely unless you instruct Calvert funds, or your financial intermediary, otherwise. If you would prefer that your Calvert fund documents not be householded, please contact Calvert funds at 1-800-368-2745, or contact your financial intermediary. Your instructions that householding not apply to delivery of your Calvert fund documents will typically be effective within 30 days of receipt by Calvert funds or your financial intermediary. Separate statements will be generated for each separate account and will be householded as described above.
Portfolio Holdings. Each Calvert fund files a schedule of portfolio holdings on Part F to Form N-PORT with the SEC for the first and third quarters of each fiscal year. The Form N-PORT will be available on the Calvert funds’ website at www.calvert.com, by calling Calvert funds at 1-800-368-2745 or in the EDGAR database on the SEC’s website at www.sec.gov.
Proxy Voting. The Proxy Voting Guidelines that each Calvert fund uses to determine how to vote proxies relating to portfolio securities is provided as an Appendix to the fund’s Statement of Additional Information. The Statement of Additional Information can be obtained free of charge by calling the Calvert funds at 1-800-368-2745, by visiting the Calvert funds’ website at www.calvert.com or visiting the SEC’s website at www.sec.gov. Information regarding how a Calvert fund voted proxies relating to portfolio securities during the most recent 12-month period ended June 30 is available by calling Calvert funds, by visiting the Calvert funds’ website at www.calvert.com or by visiting the SEC’s website at www.sec.gov.
32 www.calvert.com CALVERT FLOATING-RATE ADVANTAGE FUND ANNUAL REPORT (Unaudited)
CALVERT FLOATING-RATE ADVANTAGE FUND | |
Investment Adviser and Administrator Calvert Research and Management 1825 Connecticut Avenue NW, Suite 400 Washington, DC 20009 | Transfer Agent DST Asset Manager Solutions, Inc. 2000 Crown Colony Drive Quincy, MA 02169 |
Principal Underwriter* Eaton Vance Distributors, Inc. Two International Place Boston, MA 02110 (617) 482-8260 | Independent Registered Public Accounting Firm KPMG LLP 1601 Market Street Philadelphia, PA 19103-2499 |
Custodian State Street Bank and Trust Company State Street Financial Center, One Lincoln Street Boston, MA 02111 | Fund Offices 1825 Connecticut Avenue NW, Suite 400 Washington, DC 20009 |
* FINRA BrokerCheck. Investors may check the background of their Investment Professional by contacting the Financial Industry Regulatory Authority (FINRA). FINRA BrokerCheck is a free tool to help investors check the professional background of current and former FINRA-registered securities firms and brokers. FINRA BrokerCheck is available by calling 1-800-289-9999 and at www.FINRA.org. The FINRA BrokerCheck brochure describing this program is available to investors at www.FINRA.org.
Printed on recycled paper. | |
29940 9.30.19 |  |
Item 2. Code of Ethics.
The registrant has adopted a code of ethics applicable to its Principal Executive Officer, Principal Financial Officer and Principal Accounting Officer. The registrant undertakes to provide a copy of such code of ethics to any person upon request, without charge, by calling 1-800-368-2745. The registrant has not amended the code of ethics as described in Form N-CSR during the period covered by this report. The registrant has not granted any waiver, including an implicit waiver, from a provision of the code of ethics as described in Form N-CSR during the period covered by this report.
Item 3. Audit Committee Financial Expert.
The registrant's Board of Trustees has determined that Miles D. Harper III, an “independent” Trustee serving on the registrant’s audit committee, is an “audit committee financial expert,” as defined in Item 3 of Form N-CSR. Under applicable securities laws, a person who is determined to be an audit committee financial expert will not be deemed an "expert" for any purpose, including without limitation for the purposes of Section 11 of the Securities Act of 1933, as a result of being designated or identified as an audit committee financial expert. The designation or identification of a person as an audit committee financial expert does not impose on such person any duties, obligations, or liabilities that are greater than the duties, obligations, and liabilities imposed on such person as a member of the audit committee and Board of Trustees in the absence of such designation or identification.
Item 4. Principal Accountant Fees and Services.
(a) -(d)
The various Series comprising the Trust have differing fiscal year ends (September 30 and December 31). The following table presents the aggregate audit, audit-related, tax, and other fees billed to all of the Series in the Trust by KPMG for the last two fiscal years of each Series.
Fiscal Years Ended | 12/31/17 | %* | 9/30/18* | %* | 12/31/18 | %* | 9/30/19 | %* |
Audit Fees | $44,959 | 0% | $53,500 | 0% | $48,616 | 0% | $56,591 | 0% |
Audit-Related Fees(1) | $0 | 0% | $0 | 0% | $0 | 0% | $0 | 0% |
Tax Fees(2) | $11,000 | 0% | $11,700 | 0% | $11,700 | 0% | $12,600 | 0% |
All Other Fees(3) | $0 | 0% | $0 | 0% | $0 | 0% | $0 | 0% |
Total | $55,959 | 0% | $65,200 | 0% | $60,316 | 0% | $69,191 | 0% |
*Percentage of fees approved by the Audit Committee pursuant to (c)(7)(i)(C) of Rule 2-01 of Reg. S-X (statutory de minimus waiver of Committee’s requirement to pre-approve).
(1) | Audit-related fees consist of the aggregate fees billed for assurance and related services that are reasonably related to the performance of the audit of the registrant’s financial statements and are not reported under the category of audit fees. |
(2) | Tax fees consist of the aggregate fees billed for professional services rendered by the principal accountant relating to tax compliance, tax advice, and tax planning and specifically include fees for tax return preparation and other related tax compliance/planning matters. |
(3) | All other fees consist of the aggregate fees billed for products and services provided by the principal accountant other than audit, audit-related, and tax services. |
(e) | The Audit Committee is required to pre-approve all audit and non-audit services provided to the registrant by the auditors, and to the registrant’s investment adviser, and any entity controlling, controlled by, or under common control with the adviser that provides ongoing services to the registrant. In determining whether to pre-approve non-audit services, the Audit Committee considers whether the services are consistent with maintaining the independence of the auditors. The Committee may delegate its authority to pre-approve certain matters to one or more of its members. In this regard, the Committee has delegated authority jointly to the Audit Committee Chair together with another Committee member with respect to non-audit services not exceeding $25,000 in each instance. In addition, the Committee has pre-approved the retention of the auditors to provide tax-related services |
related to the tax treatment and tax accounting of newly acquired securities, upon request by the investment adviser in each instance.
(f) | Not applicable. |
(g) | Aggregate non-audit fees billed by the registrant’s accountant for services rendered to the registrant, and rendered to the registrant’s investment adviser, and any entity controlling, controlled by, or under common control with the adviser that provides ongoing services to the registrant for each of the last two fiscal years of each Series. |
Fiscal Year ended 12/31/17 | Fiscal Year ended 9/30/18 | Fiscal Year ended 12/31/18 | Fiscal Year ended 9/30/19 | ||||
$ | %* | $ | %* | $ | %* | $ | %* |
$0 | 0% | $11,700 | 0% | $0 | 0% | $12,600 | 0% |
*Percentage of fees approved by the Audit Committee pursuant to (c)(7)(i)(C) of Rule 2-01 of Reg. S-X (statutory de minimus waiver of Committee’s requirement to pre-approve).
(h) | The registrant’s audit committee has considered whether the provision by the registrant’s principal accountant of non-audit services to the registrant’s investment adviser and any entity controlling, controlled by, or under common control with the adviser that provides ongoing services to the registrant that were not pre-approved pursuant to Rule 2-01(c)(7)(ii) of Regulation S-X is compatible with maintaining the principal accountant’s independence. |
Item 5. Audit Committee of Listed Registrants.
Not applicable.
Item 6. Schedule of Investments.
Please see schedule of investments contained in the Report to Shareholders included under Item 1 of this Form N-CSR.
Item 7. Disclosure of Proxy Voting Policies and Procedures for Closed-End Management Investment Companies.
Not applicable.
Item 8. Portfolio Managers of Closed-End Management Investment Companies.
Not applicable.
Item 9. Purchases of Equity Securities by Closed-End Management Investment Company and Affiliated Purchasers.
Not applicable.
Item 10. Submission of Matters to a Vote of Security Holders.
No material changes.
Item 11. Controls and Procedures.
(a)The registrant’s principal executive and principal financial officers have concluded that the registrant's disclosure controls and procedures (as defined in Rule 30a-3(c) under the Investment Company Act of 1940 Act, as amended (the “1940 Act”) are effective, based on the evaluation of these controls and procedures required by Rule 30a-3(b) under the 1940 Act and Rules 13a-15(b) or 15d-15(b) under the Securities Exchange Act of 1934 (“Exchange Act”), as of a date within 90 days of the filing date of this report.
(b)There was no change in the registrant's internal control over financial reporting (as defined in Rule 30a-3(d) under the 1940 Act) that occurred during the second fiscal quarter of the period covered by this report that has materially affected, or is reasonably likely to materially affect, the registrant's internal control over financial reporting.
Item 12. Disclosure of Securities Lending Activities for Closed-End Management Investment Companies
Not applicable.
Item 13. Exhibits.
(a)(1) Registrant’s Code of Ethics- Not applicable (please see Item 2)
(a)(2)(i) Treasurer’s Section 302 certification.
(a)(2)(ii) President’s Section 302 certification.
(b) Combined Section 906 certification.
Signatures
Pursuant to the requirements of the Securities Exchange Act of 1934 and the Investment Company Act of 1940, the registrant has duly caused this report to be signed on its behalf by the undersigned, thereunto duly authorized.
CALVERT MANAGEMENT SERIES
By: /s/ John H. Streur
John H. Streur
President
Date: November 21, 2019
Pursuant to the requirements of the Securities Exchange Act of 1934 and the Investment Company Act of 1940, this report has been signed below by the following persons on behalf of the registrant and in the capacities and on the dates indicated.
By: /s/ James F. Kirchner
James F. Kirchner
Treasurer
Date: November 21, 2019
By: /s/ John H. Streur
John H. Streur
President
Date: November 21, 2019