Exhibit (c)(1)

Goldman Sachs
Presentation to Special Committee of Francis
Goldman, Sachs & Co.
12-Aug-2008

Goldman Sachs
Table of Contents
I. Situational Summary
II. Overview of Francis
III. Overview of James
IV. Financial Analysis
V. Transaction Analysis
VI. Key Considerations and Next Steps
Appendix A: Weighted Average Cost of Capital Analysis
Appendix B: Outlook for CHF / USD
Appendix C: Precedent Case Studies

Goldman Sachs
I. Situational Summary
Situational Summary 1
Goldman Sachs
Summary of the James Proposal
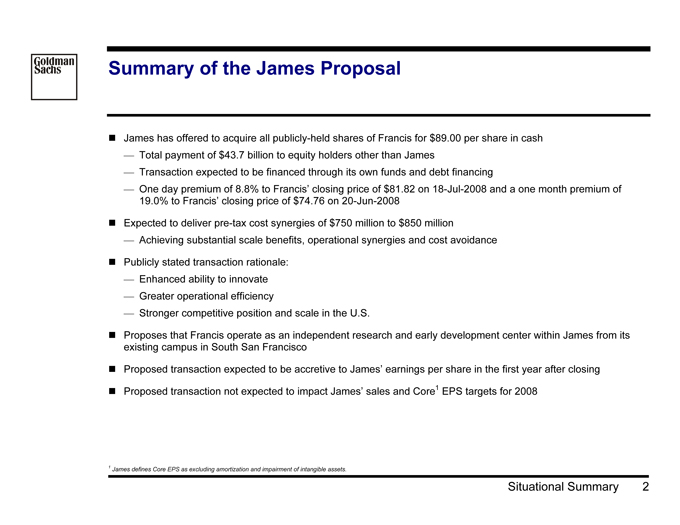
? James has offered to acquire all publicly -held shares of Francis for $89.00 per share in cash
— Total payment of $43.7 billion to equity holders other than James
— Transaction expected to be financed through its own funds and debt financing
— One day premium of 8.8% to Francis’ closing price of $81.82 on 18-Jul-2008 and a one month premium of 19.0% to Francis’ closing price of $74.76 on 20-Jun-2008
? Expected to deliver pre-tax cost synergies of $750 million to $850 million
— Achieving substantial scale benefits, operational synergies and cost avoidance
? Publicly stated transaction rationale:
— Enhanced ability to innovate
— Greater operational efficiency
— Stronger competitive position and scale in the U.S.
? Proposes that Francis operate as an independent research and early development center within James from its existing campus in South San Francisco
? Proposed transaction expected to be accretive to James’ earnings per share in the first year after closing
? Proposed transaction not expected to impact James’ sales and Core1 EPS targets for 2008
1 James defines Core EPS as excluding amortization and impairment of intangible assets.
Situational Summary 2
Goldman Sachs
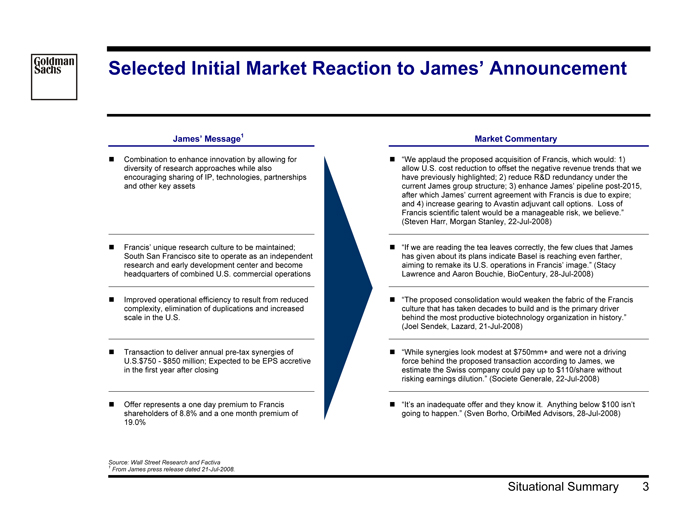
Selected Initial Market Reaction to James’ Announcement
James’ Message 1
? Combination to enhance innovation by allowing for diversity of research approaches while also encouraging sharing of IP, technologies, partnerships and other key assets
? Francis’ unique research culture to be maintained; South San Francisco site to operate as an independent research and early development center and become headquarters of combined U.S. commercial operations
? Improved operational efficiency to result from reduced complexity, elimination of duplications and increased scale in the U.S.
? Transaction to deliver annual pre-tax synergies of U.S.$750—$850 million; Expected to be EPS accretive in the first year after closing
? Offer represents a one day premium to Francis shareholders of 8.8% and a one month premium of 19.0%
Market Commentary
? “We applaud the proposed acquisition of Francis, which would: 1) allow U.S. cost reduction to offset the negative revenue trends that we have previously highlighted; 2) reduce R&D redundancy under the current James group structure; 3) enhance James’ pipeline post-2015, after which James’ current agreement with Francis is due to expire; and 4) increase gearing to Avastin adjuvant call options. Loss of
Francis scientific talent would be a manageable risk, we believe. “ (Steven Harr, Morgan Stanley, 22-Jul-2008)
? “If we are reading the tea leaves correctly, the few clues that James has given about its plans indicate Basel is reaching even farther, aiming to remake its U.S. operations in Francis’ image.” (Stacy Lawrence and Aaron Bouchie, BioCentury, 28-Jul-2008)
? “The proposed consolidation would weaken the fabric of the Francis culture that has taken decades to build and is the primary driver behind the most productive biotechnology organization in history. “
(Joel Sendek, Lazard, 21-Jul-2008)
? “While synergies look modest at $750mm+ and were not a driving force behind the proposed transaction according to James, we estimate the Swiss company could pay up to $110/share without risking earnings dilution. “ (Societe Generale, 22-Jul-2008)
? “It’s an inadequate offer and they know it. Anything below $100 isn’t going to happen. “ (Sven Borho, OrbiMed Advisors, 28-Jul-2008)
Source: 1 Wall Street Research and Factiva From James press release dated 21-Jul-2008.
Situational Summary 3

Goldman Sachs
The Market Does Not Expect a Transaction at $89/Share
Market Tracker Since Announcement
Change Since
8-Aug-2008 18-Jul-2008 1 Week 1 Month 3 Month YTD Francis $96.95 $0.06 0.1 % 18.5 % 1.7 % 24.4 % 41.9 % 43.8 % BTK 857.86 23.11 2.8 7.8 1.0 11.2 14.7 8.9 S&P 500 1,296.32 30.25 2.4 2.8 2.9 1.8 (7.3) (10.4) AMEX Pharmaceutical Index 317.76 6.03 1.9 3.7 4.9 4.0 5.9 (5.6)
James CHF189.60 CHF3.20 1.7 % 5.6 % (2.4)% 4.9 % 12.3 % (1.3)% Swiss Exchange 7,262.10 80.03 1.1 6.4 1.7 7.0 (4.3) (12.7) FTSE 350 Pharma & Biotech 8,204.40 102.40 1.3 8.3 6.9 5.5 14.2 3.3 James (ADR) $87.50 $0.20 0.2 (0.7) (4.4) 0.2 9.4 1.3
Currency Exchange Rate (CHF / $) 1.0823 0.0198 1.86 % 5.82 % 3.12 % 4.70 % 2.97 % (3.32)%
James announced bid to James Francis
125% acquire Francis for $89 Offer Price Francis Trading Volume 50 120% 18.5%
40 (mm)
115%
Francis announced that it has formed a Special $89/share 30
Price 110% Volume
Committee to evaluate 5.6% James’ offer
105%
Indexed 20 100% Trading
3 Month Avg Vol: 4.7mm 10
95% Daily
90% 0 18-Jul-2008 23-Jul-2008 28-Jul-2008 31-Jul-2008 5-Aug-2008 8-Aug-2008
Source: FactSet as of 08-Aug-2008
Situational Summary 4
Goldman Sachs
II. Overview of Francis
Overview of Francis 5

Goldman Sachs
Stock Price Performance History
Francis
Last Five Years
300%
157.2%
250%
200%
Price
Indexed 81.7%
150%
32.6% 27.4%
100%
50%
Aug-2003 Aug-2004 Aug-2005 Aug-2006 Aug-2007 Aug-2008
Daily from 8-Aug-2003 to 8-Aug-2008
Francis Large Cap Biotech Selected Pharma S&P 500
Source: FactSet as of 08-Aug-2008
Note: Large Cap Biotech includes Amgen, Biogen Idec, Celgene, Genzyme and Gilead. Selected Pharma includes Bristol-Myers Squibb, Merck KGaA, Novartis, Novo Nordisk, Schering -Plough
Overview of Francis 6
Goldman Sachs
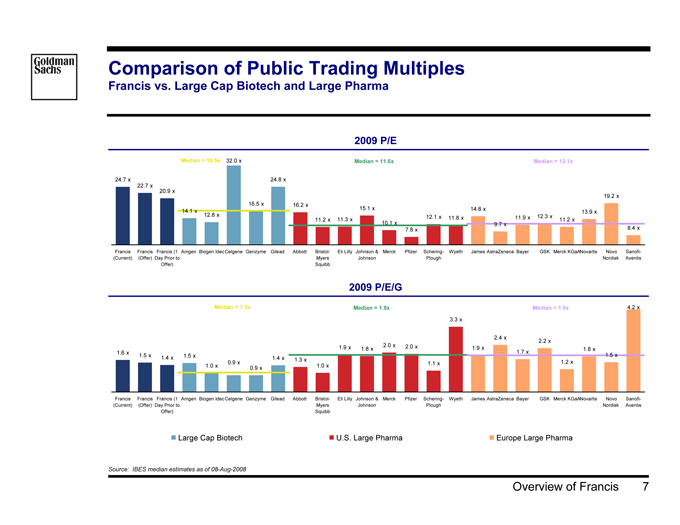
Comparison of Public Trading Multiples
Francis vs. Large Cap Biotech and Large Pharma
2009 P/E
Median = 16.5x 32.0 xMedian = 11.6xMedian = 12.1x
24.7 x24.8 x
22.7 x
20.9 x
19.2 x
16.5 x16.2 x15.1 x14.8 x
14.1 x13.9 x
12.8 x11.2 x11.3 x12.1 x11.8 x11.9 x12.3 x 11.2 x
10.1 x9.7 x
7.8 x8.4 x
FrancisFrancis Francis (1 Amgen Biogen IdecCelgene GenzymeGileadAbbottBristol-Eli Lilly Johnson &MerckPfizerSchering-WyethJames AstraZeneca BayerGSK Merck KGaANovartisNovoSanofi-
(Current)(Offer) Day Prior toMyersJohnsonPloughNordiskAventis
Offer)Squibb
2009 P/E/G
Median = 1.0xMedian = 1.9xMedian = 1.9x4.2 x
3.3 x
2.4 x2.2 x
1.9 x 1.8 x2.0 x2.0 x1.9 x1.8 x
1.6 x1.7 x
1.5 x 1.4 x 1.5 x1.4 x1.3 x1.5 x
1.0 x 0.9 x1.0 x1.1 x1.2 x
0.9 x
FrancisFrancis Francis (1 Amgen Biogen IdecCelgene GenzymeGileadAbbottBristol-Eli Lilly Johnson &MerckPfizerSchering-WyethJames AstraZeneca BayerGSK Merck KGaANovartisNovoSanofi-
(Current)(Offer) Day Prior toMyersJohnsonPloughNordiskAventis
Offer)Squibb
Large Cap BiotechU.S. Large PharmaEurope Large Pharma
Source: IBES median estimates as of 08-Aug-2008
Overview of Francis 7

Goldman Sachs
Evolution of Analyst Estimates
Francis
Last Five Years
$7.00 $110
$100 $6.00 $96.95
$5.43 2012E $90
$5.00 $4.96
2011E $4.45
$80
USD) 2010E
(USD) (in $4.00 $3.92 2009E
$3.46 $70 Price
Estimate $3.00 2008E $2.94 $60 Closing
EPS 2007A $2.23
$2.00 2006A $50
$1.28 2005A
$1.00
$0.83 $40 2004A $0.60 2003A
$0.00 $30 Aug-2003 Aug-2004 Aug-2005 Aug-2006 Aug-2007 Aug-2008
Monthly from Aug-2003 to Aug-2008
2003 2004 2005 2006 2007 2008 2009 2010 2011 2012 Francis
Source: FactSet and IBES median estimates as of 08-Aug-2008.
Note: IBES median estimates exclude stock based compensation expense
Overview of Francis 8

Goldman Sachs
Next Twelve Months P/E Multiples
Francis vs. Selected Comparables Last Five Years
120x Average Multiple As of 2009 P/E 5-Year¹ 3-Year¹ 1-Year¹ 18-Jul-2008 Current Current Francis 41.5x 32.4x 21.3x 21.9x 26.2x 24.7x Amgen 18.5 15.6 11.2 12.1 14.7 14.1 100x Biogen Idec 24.4 20.0 19.3 17.6 13.5 12.8 Celgene 55.9 49.8 36.9 35.9 40.8 32.0 Genzyme 23.2 20.7 17.5 17.7 27.0 16.5 Gilead 28.6 25.8 24.4 23.1 18.6 24.8 80x
Multiples 60x PE NTM
40x 40.8x 27.0x 26.2x 20x 18.6x 14.7x 13.5x
0x
Aug-2003 Feb-2004 Aug-2004 Feb-2005 Aug-2005 Feb-2006 Aug-2006 Feb-2007 Aug-2007 Feb-2008 Aug-2008
Daily from 08-Aug-2003 to 08-Aug-2008
Francis Amgen Biogen Idec Celgene Gilead Genzyme
Source: 1 FactSet as of 08-Aug-2008
Average multiple excludes period after undisturbed date of 18-Jul-2008.
Overview of Francis 9

Goldman Sachs
Next Twelve Months P/E Multiples
Francis vs. Selected Comparables 08-Aug-2006 to Present
60x Average Multiple As of 2009 P/E 2-Year¹ 1-Year¹ 18-Jul-2008 Current Current Francis 25.2x 21.3x 21.9x 26.2x 24.7x Amgen 13.1 11.2 12.1 14.7 14.1 Biogen Idec 19.1 19.3 17.6 13.5 12.8 50x Celgene 42.5 36.9 35.9 40.8 32.0 Genzyme 25.1 17.5 17.7 27.0 16.5 Gilead 18.7 24.4 23.1 18.6 24.8
40.8x 40x
Multiples 30x
PE 27.0x NTM 26.2x 20x 18.6x 14.7x 10x 13.5x
0x
Aug-2006 Nov-2006 Feb-2007 May-2007 Aug-2007 Nov-2007 Feb-2008 May-2008 Aug-2008
Daily from 08-Aug-2006 to 08-Aug-2008
Francis Amgen Biogen Idec Celgene Gilead Genzyme
1 Source: FactSet as of 08-Aug-2008
Average multiple excludes period after undisturbed date of 18-Jul-2008.
Overview of Francis 10
Goldman Sachs
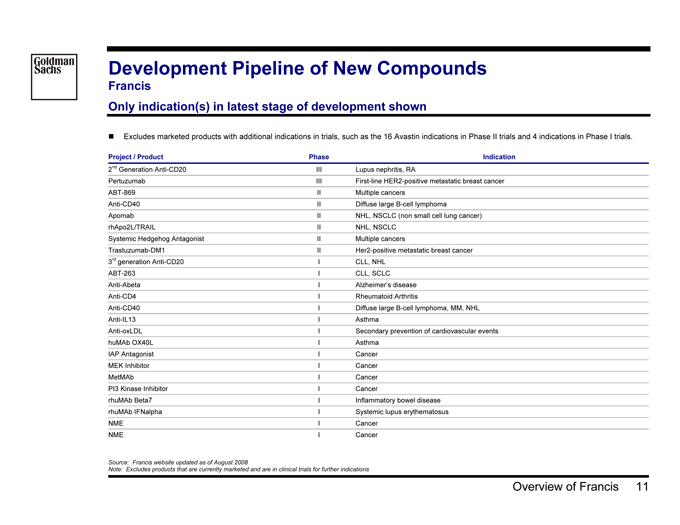
Development Pipeline of New Compounds
Francis
Only indication(s) in latest stage of development shown
? Excludes marketed products with additional indications in trials, such as the 16 Avastin indications in Phase II trials and 4 indications in Phase I trials.
Project / Product Phase
2nd Generation Anti-CD20 III Pertuzumab III ABT-869 II Anti-CD40 II Apomab II rhApo2L/TRAIL II Systemic Hedgehog Antagonist II Trastuzumab -DM1 II 3rd generation Anti-CD20 I ABT-263 I Anti-Abeta I Anti-CD4 I Anti-CD40 I Anti-IL13 I Anti-oxLDL I huMAb OX40L I IAP Antagonist I MEK Inhibitor I MetMAb I PI3 Kinase Inhibitor I rhuMAb Beta7 I rhuMAb IFNalpha I NME I NME I
Indication
Lupus nephritis, RA
First-line HER2-positive metastatic breast cancer Multiple cancers Diffuse large B-cell lymphoma NHL, NSCLC (non small cell lung cancer) NHL, NSCLC
Multiple cancers
Her2-positive metastatic breast cancer CLL, NHL
CLL, SCLC
Alzheimer’s disease Rheumatoid Arthritis
Diffuse large B-cell lymphoma, MM, NHL Asthma Secondary prevention of cardiovascular events Asthma Cancer Cancer Cancer Cancer Inflammatory bowel disease Systemic lupus erythematosus Cancer Cancer
Source: Francis website updated as of August 2008
Note: Excludes products that are currently marketed and are in clinical trials for further indications
Overview of Francis 11

Goldman Sachs
Shares Traded at Various Prices
Francis
As of 08-Aug-2008
1 Month
140,000 100%
100% 90% 120,000
74% 80% 100,000 70% (000) 80,000 60%
Cumulative
50% 60,000 40%
Volume 26% 26% 26% 30% 40,000 19%Shares
20,000 20% (%) 19% 7%
10%
0 0% 75.39 79.70 84.01 88.33 92.64 to to to to to 79.69 84.00 88.32 92.63 96.95
Daily from 08-Jul-2008 to 08-Aug-2008
WASP: $90.62
Shares Traded as % of Outstanding: 16.11%
6 Months
260,000 100%
100%
90% 210,000 36% 80%
62% 78% 78% 70%
(000) 160,000 26% 60%
50% Cumulative 22%
110,000 40%
Volume 16% Shares 30% (%)
60,000 26% 20% 10% 10,000 0% 67.24 73.18 79.12 85.07 91.01 to to to to to 73.17 79.11 85.06 91.00 96.95
Daily from 11-Feb-2008 to 08-Aug-2008
WASP: $79.36
Shares Traded as % of Outstanding: 54.76%
1 Year
470,000 100%
40% 100%
420,000 90% 370,000 88% 88% 80%
33% 70% 320,000 73% (000) 60% Cumulative
270,000 50% Volume 220,000 40%
33% 30% Shares 15%
170,000 12% 20% (%)
120,000 10% 70,000 0% 66.27 72.41 78.54 84.68 90.81 to to to to to 72.40 78.53 84.67 90.80 96.95
Daily from 20-Jul-2007 to 18-Jul-2008
WASP: $76.27
Shares Traded as % of Outstanding: 100.12%
3 Years
1,070,000 100% 970,000 100% 90%
34%
32% 91%
870,000 80% 770,000 80% 70% (000) 670,000 60%
Cumulative
570,000 50% 470,000 46% 40%
Volume 370,000 14% 30% Shares 11%
270,000 9% 20% (%) 170,000 14% 10% 70,000 0% 66.27 72.95 79.63 86.30 92.98 to to to to to 72.94 79.62 86.29 92.97 99.66
Daily from 09-Aug-2005 to 08-Aug-2008
WASP: $80.61
Shares Traded as % of Outstanding: 259.89%
Source: FactSet as of 08-Aug-2008
Overview of Francis 12

Goldman Sachs
Recent Shareholder Momentum Analysis
Top 25 Francis Shareholders As of 07-Aug-2008
Position Position % Non-James
# Institution Name 18-Jul-2008 05-Aug-2008 Change % O/S Holdings Avg Cost
1 Fidelity Mgmt. & Research 44,589,431 44,589,431—4.22% 9.52% $60.02
2 Marsico Capital 28,248,512 28,248,512—2.68 6.03 41.00
3 Capital Guardian Trust 21,263,293 20,563,293 (700,000) 1.95 4.39 78.24
4 T. Rowe Price 17,784,494 17,784,494—1.68 3.8 74.79
5 Capital Research & Mgmt. 17,500,000 17,500,000—1.66 3.74 65.05
6 AllianceBerstein 16,030,000 16,030,000—1.52 3.42 68.21
7 Wellington Mgmt. 15,892,746 15,892,746—1.51 3.39 63.32
8 Barclays Global 15,306,210 15,306,210—1.45 3.27 54.51
9 Jennison Associates 10,821,503 10,821,503—1.03 2.31 66.39
10 ClearBridge Advisors 9,981,191 9,981,191—0.95 2.13 33.14
11 Vanguard Group 9,056,406 9,056,406—0.86 1.93 59.11
12 Delaware Inv. Advisors 9,147,746 8,647,746 (500,000) 0.82 1.85 78.18
13 TIAA-CREF Asset Mgmt. 7,342,446 7,342,446—0.70 1.57 65.24
14 Sands Capital Mgmt. 7,071,391 7,071,391—0.67 1.51 51.55
15 Janus Capital Mgmt. 6,755,964 6,755,964—0.64 1.44 44.95
16 State Street Global Advisors 6,431,203 6,431,203—0.61 1.37 45.43
17 TCW Asset Mgmt. 5,343,048 5,343,048—0.51 1.14 39.65
18 Goldman Sachs Asset Mgmt. 7,844,682 4,844,682 (3,000,000) 0.46 1.03 73.67
19 Victory Capital Mgmt. 5,350,299 4,350,299 (1,000,000) 0.41 0.93 74.77
20 CalPERS 4,116,863 4,116,863—0.39 0.88 48.53
21 Credit Suisse Asset Mgmt. 4,095,333 4,095,333—0.39 0.87 79.32
22 Walter Scott & Partners 3,951,407 3,951,407—0.37 0.84 69.62
23 GE Asset Management 3,788,047 3,788,047—0.36 0.81 76.17
24 Thornburg Investment Mgmt. 6,447,184 3,447,184 (3,000,000) 0.33 0.74 73.43
25 Bellevue Asset Mgmt. 3,192,536 3,192,536—0.30 0.68 81.66 Total 287,351,935 279,151,935 (8,200,000) 26.47% 59.59%
Source: Francis investor relations as of 07-Aug-2008
Overview of Francis 13

Goldman Sachs
Francis Research Analyst Price Targets
Before and After James Proposal
Price Target Before
Date Updated Bank Analyst Announcement Current Price Target Deal Price Speculation
15-Jul-2008 Goldman Sachs Ho $88 N/A N/A 15-Jul-2008 JP Morgan Meacham 100 N/A $100+ 15-Jul-2008 Merrill Lynch Berena 84 No Opinion No Opinion 15-Jul-2008 Morgan Stanley Harr 94 N/A N/A 15-Jul-2008 Thomas Weisel Partners Somaiya 81 N/A N/A 21-Jul-2008 Baird Raymond 87 95 95 21-Jul-2008 BMO Capital Zhang 82 104 104 21-Jul-2008 Bank of America Kim 95 100 100 21-Jul-2008 Credit Suisse Aberman 82 98 98 21-Jul-2008 Jefferies Walsh 78 95 95 21-Jul-2008 Lazard Sendek 90 97 95-100 21-Jul-2008 Lehman Birchenough 75 105 105 21-Jul-2008 Natixis To 76 95 95 21-Jul-2008 Oppenheimer1 Holley 88 88 102-110 21-Jul-2008 Rodman & Renshaw King 90 N/A 95-113 22-Jul-2008 Piper Jaffray Wei 94 96 96 22-Jul-2008 RBC Capital Kantor 84 95 95-100 08-Aug-2008 UBS Shenouda / Amusa 92 105 115-135 11-Aug-2008 Bernstein Research Porges 86 101 105-130
High $100 $105 $135 Mean 87 98 103 Median 87 97 100 Low 75 88 95
Source 1 Latest available Wall Street research
Oppenheimer has not updated its target price to reflect the offer by James to buy remaining the outstanding shares in Francis. Not included in summary statistics.
Overview of Francis 14

Goldman Sachs
Research Price Targets and Key Themes
Francis Research Analysts’ Views Prior To Announcement
Broker Date Price Target 1 Key Themes
Jefferies & Co. 15-Jul-2008 $78.00 ? We continue to harbor concerns regarding long-term EPS growth potential for Francis, and a successful NSABP -C08 trial (Avastin for adjuvant CRC) outcome is key to changing our view. We believe this trial’s outcome remains pivotal to accelerating EPS growth beyond our 5-year 13% CAGR estimate. The next interim analysis will occur in 4Q08 and then every 6 months thereafter. We are less optimistic than the Street that the recently approved Avastin metastatic breast cancer (mBC) indication can re-accelerate the Avastin franchise in a meaningful way, leading to sustained EPS outperformance.
Rodman & Renshaw 15-Jul-2008 $90.00 ? Francis has multiple value drivers in 2008. In our view, the most important driver is the uptake of Avastin use in the mBC and NSCLC settings. Based on today’s results, we are maintaining our Q08 growth estimates for Avastin in mBC and raising our Q08 Rituxan numbers in RA and NHL by 1-2%. Additionally, we are marginally raising the growth of the legacy products, Lucentis and Xolair. Finally, we are raising Rituxan numbers FY08 and beyond. We see a sustained upside going into 2009 for Francis in mBC with the expected data release of the RIBBON -I trial during 2H08. Furthermore, in the lung cancer setting the SATURN and the BETA Lung trials may potentially further define Tarceva and Avastin’s role in first line maintenance and second line setting in NSCLC respectively, consequently promoting market share gains for both products during 2H08 and beyond Deutsche Bank 14-Jul-2008 $85.00 ? We believe investors would be willing to assign a premium PE to Francis shares ahead of the Phase 3 data on Avastin in the adjuvant colon cancer setting. If the trial is successful, we believe the upside could be significant (40%+) . If negative, we see the downside risk as 10%-15%. We do not include any Avastin adjuvant sales in our forecasts. Our one year price target of $85 is derived by applying a 22x PE to our 2009 estimate (in line with the biotech group 20-22x current year P/E). Thus, our price target likely understates the true potential upside should the trial succeed.
Credit Suisse 14-Jul-2008 $82.00 ? Expectations had risen following strong IMS data, but Francis delivered with Avastin and Rituxan sales that were higher than consensus. Although EPS was slightly light, if one were to remove non-recurring items such as (1) a failed manufacturing run and (2) a tax bill from 2007, pro-forma EPS was actually ahead of The Street. Further, Francis was able to increase its full year guidance. Given the difficult economic environment investors are currently facing, we think these results can support further rotation into the large cap biotech space as a defensive position. That said, our prior survey work suggests that Avastin expectations may be high for the second half and we expect Rituxan sales growth to taper off in 2H08. As such, we are again reminded that Francis long term performance is highly dependent on the results of the adjuvant data, which we do not expect until 2009.
Source: 1 Wall Street Research Price target reflects estimates that are not based on transaction in context of James offer.
Overview of Francis 15

Goldman Sachs
Research Price Targets and Key Themes
Francis Research Analysts’ Views Following Announcement
Broker Date Price Target 1 Key Themes
Bernstein Research 11-Aug-2008 $101.00 ? Sum of the parts analysis estimating total value of $124 per share (when additional pipeline opportunities and label expansion programs are included) comprised of:
— Approved products and indications (worth $55-$60/share)
— The potential of Francis’ late stage label expansion programs for currently approved products (worth $25-$30/share)
— Phase II oncology pipeline – assumes 50% probability of success (worth $17/share)
— Early stage R&D assets and capabilities (worth $5/share)
— Option value of access to the companies future innovations beyond 2015 (currently outside James’ rights) (estimated at $8 per share)
— Value of the $750-850mm in cost saving synergies James has identified (worth $9/share) UBS 08-Aug-2008 $105.00 ? Sum of the parts analysis estimating total value of up to $129 per share
— Evaluates per share standalone value plus cost synergies ($84 per share plus $12 per share in synergies)
— Considers additional long-term benefits from tax benefits ($14 per share); elimination of the opt-in ($9 per share)
— Considers Avastin adjuvant value greater than $20 per share, assuming 50% probability Piper Jaffray 22-Jul-2008 $96.00 ? Discounted cash flow analysis with cost synergies
— Free cash flow estimates through 2012
— Terminal growth in free cash flow generation from the base business of 4%-5% per year
— $850mm in cost synergies ($4/share)
— 80% probability of significant erosion of Lucentis franchise (negative $2/share)
— 65% probability of positive data for Avastin in adjuvant colon, lung and breast studies ($19/share)
— 64% return on future R&D spending, consistent with 10 year historical return ($23/share)
Bank of America 21-Jul-2008 $100.00 ? Applies a 1.2 PEG multiple to the 5 year estimated CAGR of 20% and 2009 EPS estimate of 3.92, to which a buyout premium of $5/share is added.
Lazard 21-Jul-2008 $97.00 ? New target on historical trading range and average trailing PE ratio over past 2 years
— Applies historic average multiple to LTM EPS of $3.08/share
? Notes “no possibility for competing outside buyers to potentially drive the price higher”
Source: 1 Wall Street Research Price target reflects estimates based on transaction in context of James offer.
Overview of Francis 16

Goldman Sachs
Research Price Targets and Key Themes
Francis Research Analysts’ Views Following Announcement
Broker Date Price Target 1 Key Themes
Rodman & Renshaw 21-Jul-2008 $95.00—$113.00 ? 2 step analysis to determine range of $95.00—$113.00 sum of the parts analysis and deal comparison
? Sum of the parts analysis: $95.00 ($91.00 without adjusting for current cash and debt)
— Sales estimates for each marketed product through 2015 and subsequent growth rate of 3%-5%
— Flat sales after patent expiration
— 9.6% discount rate
? Comparable Transaction Analysis: $113.00
— Applies historical average and median acquisition premiums from large cap biotech/pharma deals
— Sensitivity analysis by assuming different acquisition premiums ranging from 20%-50% Bernstein Research 21-Jul-2008 $101.00 ? Discounted cash flow valuation of $107.00 per share (including synergies)
? Discounted cash flow valuation of $95.00 (stand-alone basis) and $107.00 with $750-850mm in synergies
— Excludes most of the value of incremental opportunities from Avastin
— Excludes upside of earlier phase III programs including Herceptin
— Excludes upside from emerging phase II programs, including trastuzumab DM1, pretuzumab, Hedgehog antagonist, 2nd and 3rd generation versions of Rituxan, rhApo2L/Trail, Apomab and ABT-869
? Price target of $101.00 based on 80% probability of a deal with transaction value of $105.00 and 20% probability of no transaction occurring with stock price returning to $86.00
Source: 1 Wall Street Research Price target reflects estimates based on transaction in context of James offer.
Overview of Francis 17

Goldman Sachs
III. Overview of James
Goldman Sachs
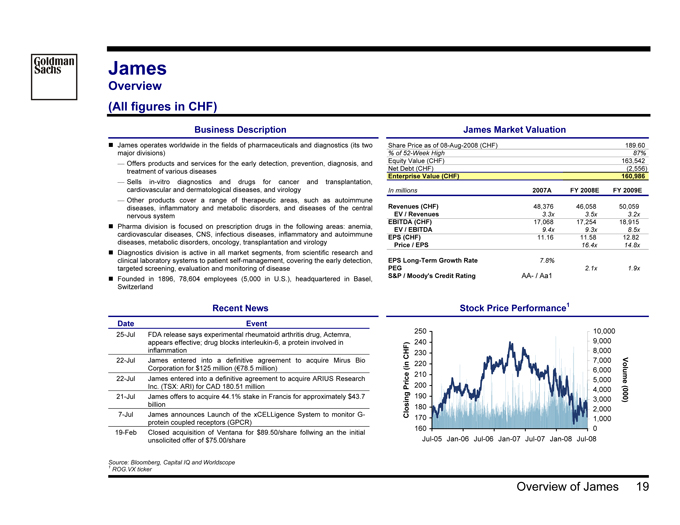
James
Overview
(All figures in CHF)
Business Description
? James operates worldwide in the fields of pharmaceuticals and diagnostics (its two major divisions)
— Offers products and services for the early detection, prevention, diagnosis, and treatment of various diseases
— Sells in-vitro diagnostics and drugs for cancer and transplantation, cardiovascular and dermatological diseases, and virology
— Other products cover a range of therapeutic areas, such as autoimmune diseases, inflammatory and metabolic disorders, and diseases of the central nervous system
? Pharma division is focused on prescription drugs in the following areas: anemia, cardiovascular diseases, CNS, infectious diseases, inflammatory and autoimmune diseases, metabolic disorders, oncology, transplantation and virology
? Diagnostics division is active in all market segments, from scientific research and clinical laboratory systems to patient self-management, covering the early detection, targeted screening, evaluation and monitoring of disease
? Founded in 1896, 78,604 employees (5,000 in U.S.), headquartered in Basel, Switzerland
Recent News Date Event
25-Jul FDA release says experimental rheumatoid arthritis drug, Actemra, appears effective; drug blocks interleukin -6, a protein involved in inflammation 22-Jul James entered into a definitive agreement to acquire Mirus Bio Corporation for $125 million (€78.5 million) 22-Jul James entered into a definitive agreement to acquire ARIUS Research Inc. (TSX: ARI) for CAD 180.51 million 21-Jul James offers to acquire 44.1% stake in Francis for approximately $43.7 billion 7-Jul James announces Launch of the xCELLigence System to monitor G-protein coupled receptors (GPCR) 19-Feb Closed acquisition of Ventana for $89.50/share follwing an the initial unsolicited offer of $75.00/share
James Market Valuation
Share Price as of 08-Aug-2008 (CHF) 189.60
% of 52-Week High 87%
Equity Value (CHF) 163,542 Net Debt (CHF) (2,556)
Enterprise Value (CHF) 160,986
In millions 2007A FY 2008E FY 2009E
Revenues (CHF) 48,376 46,058 50,059
EV / Revenues 3.3 x 3.5x 3.2x
EBITDA (CHF) 17,068 17,254 18,915
EV / EBITDA 9.4x 9.3x 8.5x
EPS (CHF) 11.16 11.58 12.82
Price / EPS 16.4 x 14.8x
EPS Long-Term Growth Rate 7.8%
PEG 2.1 x 1.9x
S&P / Moody’s Credit Rating AA- / Aa1
Stock Price Performance 1
250 10,000 240 9,000 CHF) 230 8,000 (in 220 7,000 210 6,000 5,000 Volume Price 200 190 4,000 3,000 (000) Closing 180 2,000 170 1,000 160 0 Jul-05 Jan-06 Jul-06 Jan-07 Jul-07 Jan-08 Jul-08
1 Source: Bloomberg, Capital IQ and Worldscope ROG.VX ticker
Overview of James 19
Goldman Sachs
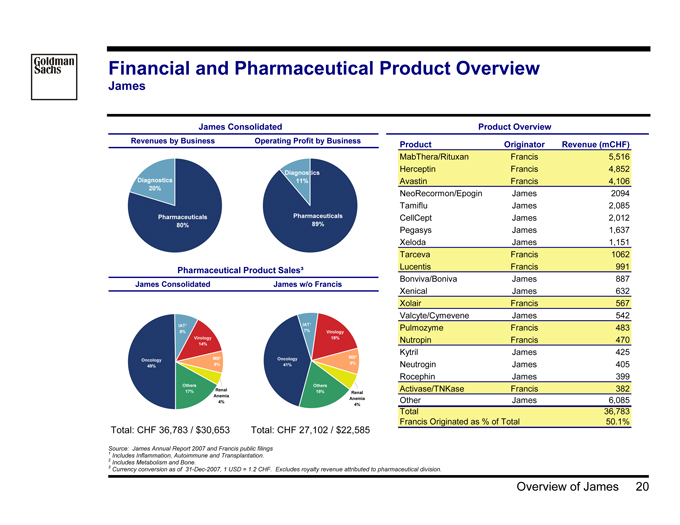
Financial and Pharmaceutical Product Overview
James
James Consolidated Revenues by Business Operating Profit by Business
Diagnostics Diagnostics 11% 20%
Pharmaceuticals Pharmaceuticals
80% 89%
Pharmaceutical Product Sales³ James Consolidated James w/o Francis
IAT¹ IAT¹
8% 7% Virology Virology 18% 14%
MB² Oncology MB² Oncology
8% 41% 9% 49%
Others Others 17% Renal 19%
Renal Anemia Anemia 4% 4%
Total: CHF 36,783 / $30,653 Total: CHF 27,102 / $22,585
Product Overview
Product Originator Revenue (mCHF)
MabThera/Rituxan Francis 5,516 Herceptin Francis 4,852 Avastin Francis 4,106 NeoRecormon/Epogin James 2094 Tamiflu James 2,085 CellCept James 2,012 Pegasys James 1,637 Xeloda James 1,151 Tarceva Francis 1062 Lucentis Francis 991 Bonviva/Boniva James 887 Xenical James 632 Xolair Francis 567 Valcyte/Cymevene James 542 Pulmozyme Francis 483 Nutropin Francis 470 Kytril James 425 Neutrogin James 405 Rocephin James 399 Activase/TNKase Francis 382 Other James 6,085 Total 36,783 Francis Originated as % of Total 50.1%
Source: James Annual Report 2007 and Francis public filings 1 Includes Inflammation, Autoimmune and Transplantation. 2 Includes Metabolism and Bone.
3 Currency conversion as of 31-Dec-2007, 1 USD = 1.2 CHF. Excludes royalty revenue attributed to pharmaceutical division.
Overview of James 20
Goldman Sachs
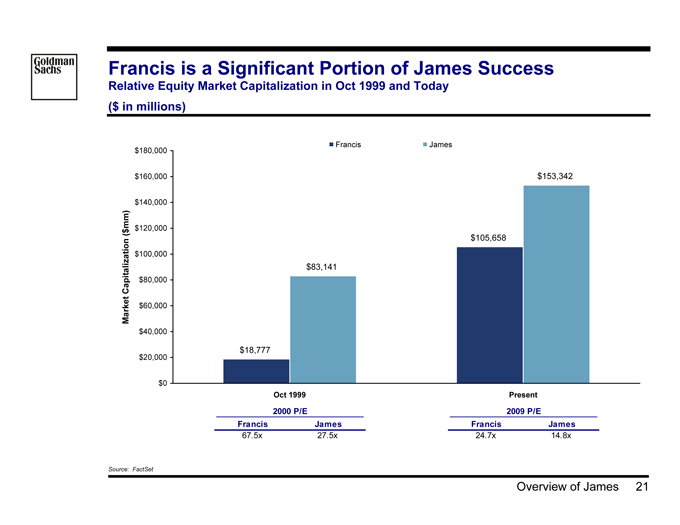
Francis is a Significant Portion of James Success
Relative Equity Market Capitalization in Oct 1999 and Today ($ in millions)
Francis James
$180,000 $160,000 $153,342
$140,000 $ mm) $120,000
( $105,658 $100,000
$83,141
Capitalization $80,000
Market $60,000 $40,000
$20,000 $18,777
$0
Oct 1999 Present
2000 P/E Francis James
67.5x 27.5x
2009 P/E Francis James
24.7x 14.8x
Source: FactSet
Overview of James 21

Goldman Sachs
Francis Compounds Comprise a Large Portion of James Compounds in Development
NME’s Only
40
36
35
James With Other Partners
9
30 James Originated
25 Francis Originated
NMEs 20 17 18
15 6
10
6
4
5 10
6 2
0 2
Phase I Phase II Phase III
Source: Francis website. Includes opt-in opportunities as displayed on Francis website.
Overview of James 22
Goldman Sachs
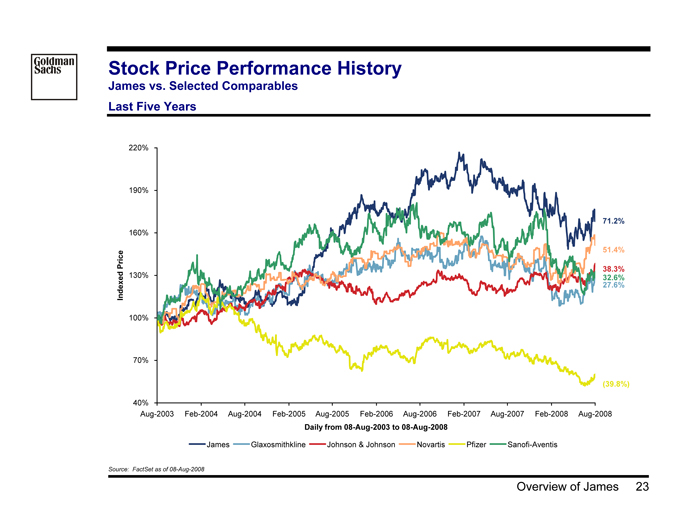
Stock Price Performance History
James vs. Selected Comparables Last Five Years
220%
190%
71.2%
160%
51.4% Price 38.3% 130% 32.6% Indexed 27.6%
100%
70%
(39.8%)
40%
Aug-2003 Feb-2004 Aug-2004 Feb-2005 Aug-2005 Feb-2006 Aug-2006 Feb-2007 Aug-2007 Feb-2008 Aug-2008
Daily from 08-Aug-2003 to 08-Aug-2008
James Glaxosmithkline Johnson & Johnson Novartis Pfizer Sanofi-Aventis
Source: FactSet as of 08-Aug-2008
Overview of James 23
Goldman Sachs
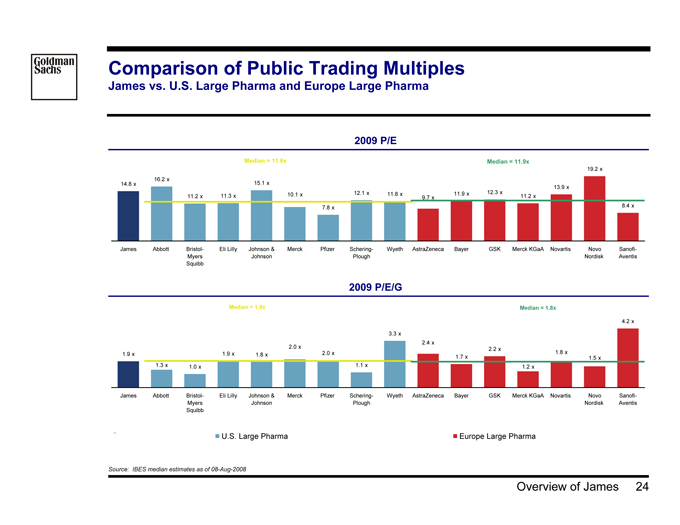
Comparison of Public Trading Multiples
James vs. U.S. Large Pharma and Europe Large Pharma
2009 P/E
Median = 11.6x Median = 11.9x
19.2 x 16.2 x 14.8 x 15.1 x 12.3 x 13.9 x 10.1 x 12.1 x 11.8 x 11.9 x 11.2 x 11.3 x 9.7 x 11.2 x
7.8 x 8.4 x
James Abbott Bristol- Eli Lilly Johnson & Merck Pfizer Schering—Wyeth AstraZeneca Bayer GSK Merck KGaA Novartis Novo Sanofi-Myers Johnson Plough Nordisk Aventis Squibb
2009 P/E/G
Median = 1.9x Median = 1.8x
4.2 x
3.3 x
2.4 x
2.0 x 2.2 x 1.8 x 1.9 x 1.9 x 1.8 x 2.0 x
1.7 x 1.5 x 1.3 x 1.0 x 1.1 x 1.2 x
James Abbott Bristol- Eli Lilly Johnson & Merck Pfizer Schering—Wyeth AstraZeneca Bayer GSK Merck KGaA Novartis Novo Sanofi-Myers Johnson Plough Nordisk Aventis Squibb
U.S. Large Pharma Europe Large Pharma
Source: IBES median estimates as of 08-Aug-2008
Overview of James 24

Goldman Sachs
Evolution of Analyst Estimates
James
Last Five Years
22.00
240 20.00
220 18.00 16.84
2012E 15.87
16.00 2011E 200
CHF) CHF189.60
14.65
(in 14.00 2010E 180
12.82
2009E(CHF) Estimate 12.00 11.58
2008E 160 Price EPS 11.36
10.00 2007A
9.22
2006A 140 Closing
8.00
6.86
120
6.00 2005A 5.396 3.68 2004A
4.00 2003A 100
Aug-2003 Aug-2004 Aug-2005 Aug-2006 Aug-2007 Aug-2008
Monthly from Aug-2003 to Aug-2008
2003 2004 2005 2006 2007 2008 2009 2010 2011 2012 James
Overview of James 25

Goldman Sachs
Next Twelve Months P/E Multiples
James vs. Selected Comparables Last Five Years
Average Multiple As of 2009 P/E 31x 5-Year¹ 3-Year¹ 1-Year¹ 18-Jul-2008 Current Current James 21.2x 19.9x 15.6x 14.4x 15.4x 14.8x GlaxoSmithKline 14.1 13.6 11.5 11.5 12.1 12.3 Johnson & Johnson 16.8 15.8 14.9 14.9 15.7 15.1 28x Novartis 17.1 16.2 14.2 14.1 14.9 13.9 Pfizer 12.7 11.3 9.4 7.5 8.1 7.8 Sanofi -Aventis 13.9 12.4 10.0 8.4 8.9 8.4 25x
Multiples 22x
19x
PE
15.7x NTM 16x 15.4x 14.9x
13x
12.1x
10x
8.9x
8.1x
7x
Aug-2003 Apr-2004 Jan-2005 Sep-2005 Jun-2006 Mar-2007 Nov-2007 Aug-2008
Daily from 8-Aug-2003 to 8-Aug-2008
James GlaxoSmithKline Johnson & Johnson Novartis Pfizer Sanofi -Aventis
Source: FactSet as of 08-Aug-2008
Overview of James 26

Goldman Sachs
Shares Traded at Various Prices
James
As of 08-Aug-2008
1 Month
25,000 100% 100%
84% 90% 20,000 29% 80%
31% 70%
(000) 15,000 53% 60%
Cumulative
50% Volume 10,000 16% 16% 40%
37% 30% Shares
8%
5,000 20% (%) 10%
0 8% 0% 171.00 175.90 180.80 185.70 190.60 to to to to to 175.89 180.79 185.69 190.59 195.50
Daily from 09-Jul-2008 to 08-Aug-2008
WASP: 184.02 CHF
Shares Traded as % of Outstanding: 9.37%
1 Year
250,000 100%
30% 100%
230,000 80% 90% 210,000 80% 70% 190,000 60% (000) 60% 170,000 21% 50% Cumulative
150,000 20% 17% 40%
Volume 130,000
30% Shares
110,000 13% 30% 20% (%) 90,000 10%
13%
70,000 0% 164.60 175.34 186.08 196.82 207.56 to to to to to 175.33 186.07 196.81 207.55 218.30
Daily from 09-Aug-2007 to 08-Aug-2008
WASP: 193.25 CHF
Shares Traded as % of Outstanding: 109.10%
6 Months
135,000 100%
100%
81% 90% 115,000 31% 95% 80% 70% 95,000
28%
(000) 60% 75,000 22% 50% Cumulative 53%
40%
Volume 55,000 14%
30% Shares
20% 35,000 22% (%) 10% 15,000 5% 0% 164.60 173.40 182.20 191.00 199.80 to to to to to 173.39 182.19 190.99 199.79 208.60
Daily from 11-Feb-2008 to 08-Aug-2008
WASP: 182.46 CHF
Shares Traded as % of Outstanding: 52.09%
3 Years
550,000 28%
28% 100% 95% 500,000 25% 92% 85% 450,000
64% 75% 400,000
(000) 65% 350,000 55% Cumulative
300,000 45% Volume 250,000 35%
11% 39% Shares
200,000
8% 25% (%)
150,000 11% 15% 100,000 5% 164.60 179.70 194.80 209.90 225.00 to to to to to 179.69 194.79 209.89 224.99 240.10
Daily from 09-Aug-2005 to 08-Aug-2008
WASP: 201.46 CHF
Shares Traded as % of Outstanding: 264.75%
Source: FactSet as of 08-Aug-2008
Overview of James 27

Goldman Sachs
Overview of James Ownership Structure
Economic Ownership
Bearer Shares
Novartis 6.2%
Families 9.3%
Other 3.1%
NES Total 81.4%
Bearer Total 18.6%
James
862.7mm Shares Outstanding
Bearer Shares
160,000,000 Shares
Ticker: RO.SW
Non-voting Equity Shares
(Genussschein)
702,562,700 Shares
Ticker:ROG.VX
Novartis
53,332,863 Shares
(33.3%)
Families
80,020,000 Shares
(50.0%)
Other
26,647137 Shares
(16.7%)
ADRs
US$
(2 ADRs:1 NES)
Ticker:RHHBY
Comments
? James has two forms of shares
— 160,000,000 Bearer shares with full voting rights
The families, through shares held within the “Other” category, own a majority of the bearer shares
— 702,562,700 Non-voting Equity Securities not part of the share capital and confer no voting rights, but have the same rights to participate in available earnings and proceeds from liquidation as Bearer shares
? James’ ADR (American Depositary Receipt) is traded in U.S. Dollars with two James ADRs representing one underlying non-voting equity security
— The James ADR program was initiated in 1992, obtained securities manual listing by Standard & Poor’s Standard Corporation Records in 2006 and was upgraded to OTCQX International PremierQX in 2007
Source: James public filings and website
Overview of James 28

Goldman Sachs
James Trading Activity (NES Shares / Genussschein)
As of 08-Aug-2008
Ordinary Shares Tickers Exchange Day’s Volume Currency
ROG VX SWX Europe 2,586,987 CHF ROG XB OTC Composite 69,872 CHF ROCG IX Chi-X Alt TS 39,852 CHF RH05 GR Germany 12,419 EUR RH05 GY Germany 10,827 EUR RH05 GF Germany 1,392 EUR RH05 GB Germany EUR RH05 GD Germany EUR RH05 GH Germany EUR RH05 GM Germany EUR RH05 GS Germany EUR RHHVF US U.S. 115 USD RHHVF UV U.S. 115 USD
Bearer Shares
RO.SW SWX 7,001 CHF
ADR Tickers (2:1)
RHHBY US U.S. 273,127 USD RHHBY UV U.S. 273,127 USD RHHBY PQ U.S.—USD RHHBYN MM Mexico—MXN RH06 GR Germany—EUR RH06 GF Germany—EUR RH06 GY Germany—EUR
Note: Highlighted shares represent tickers with the greatest volume of shares traded.
Overview of James 29

Goldman Sachs
James Ownership
Top 25 Institutional Investors – ROG.VX Shares
Rank Investor Name Position % O/S % O/S of Francis
1 Capital Research Global Investors 39,455,934 5.62 1.66
2 Capital World Investors 35,448,720 5.05 0.71
3 UBS Global Asset Management 10,081,923 1.44 -
4 Fidelity Management & Research 9,875,416 1.41 4.22
5 Fidelity International Limited 7,619,891 1.08 -
6 MFS Investment Management 6,317,050 0.90 -
7 Norges Bank 6,063,122 0.86 -
8 Wellington Management Company, LLP 5,618,392 0.80 1.51
9 Janus Capital Management LLC 5,606,545 0.80 0.64
10 Thornburg Investment Management, Inc. 4,557,902 0.65 0.33
11 PRIMECAP Management Company 4,286,500 0.61 0.14
12 Credit Suisse Asset Management 4,143,527 0.59 0.39
13 OppenheimerFunds, Inc. 4,103,719 0.58 -
14 Allianz Global Investors 3,681,678 0.52 -
15 Barclays Global Investors, N.A. 3,340,461 0.48 1.45
16 Schroder Investment Management Ltd. 3,260,764 0.46 -
17 Vanguard Group, Inc. 2,988,639 0.43 0.86
18 Pictet Asset Management Ltd. 2,937,432 0.42 -
19 Pioneer Investment Management Ltd. 2,900,784 0.41 -
20 Artisan Partners Limited Partnership 2,709,550 0.39 -
21 T. Rowe Price Associates, Inc. 2,566,268 0.37 1.68
22 Swisscanto Asset Management AG 2,357,348 0.34 -
23 AllianceBernstein L.P. 2,251,869 0.32 1.52
24 William Blair & Company, L.L.C. 2,108,543 0.30 0.17
25 Northern Cross Investments Limited 2,080,510 0.30 -
Top 25 Shareholders 176,362,487 25.13 15.28
Source: Thomson Research as of 08-Aug-2008
Overview of James 30

Goldman Sachs
James Research Analyst Price Targets
CHF 189.60 per share as of 08-Aug-2008
Date Updated Bank Analyst Current Price Target Speculated Deal Price
21-Jul-2008 Goldman Sachs Murphy CHF 220 NA 21-Jul-2008 Lehman Brothers Walton 218 <= $105 21-Jul-2008 Natixis Lanone 220 NA 21-Jul-2008 Societe Generale Miemietz 208 <= 110 22-Jul-2008 Deutsche Bank Leuchten 209 92—102 22-Jul-2008 HSBC Scotcher 220 NA 22-Jul-2008 JPMorgan Hauber 230 NA 22-Jul-2008 Merrill Lynch Jain 210 <= 100 22-Jul-2008 Morgan Stanley Baum 228 NA 22-Jul-2008 Vontobel Weiss N/A NA 24-Jul-2008 Credit Suisse Holford 212 NA 08-Aug-2008 UBS Shenouda / Amusa 200 115—135
High CHF 230 Mean 216 Median 218 Low 200
Source: Latest available Wall Street research
Overview of James 31
Goldman Sachs
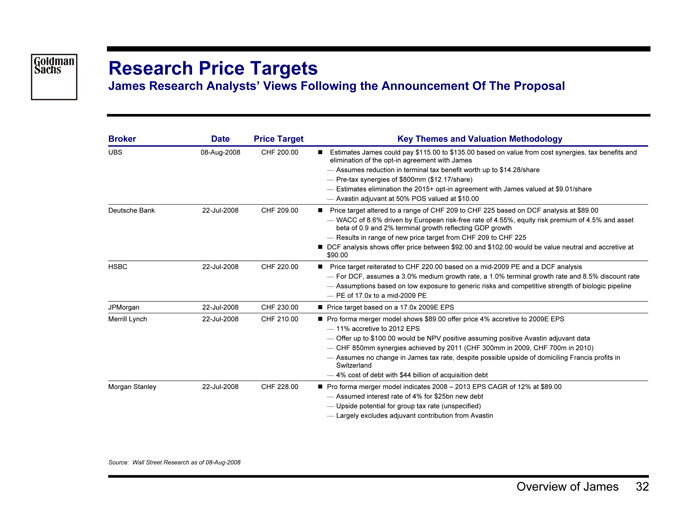
Research Price Targets
James Research Analysts’ Views Following the Announcement Of The Proposal
Broker Date Price Target 1 Key Themes and Valuation Methodology
UBS 08-Aug-2008 CHF 200.00 ? Estimates James could pay $115.00 to $135.00 based on value from cost synergies, tax benefits and elimination of the opt-in agreement with James
— Assumes reduction in terminal tax benefit worth up to $14.28/share
— Pre-tax synergies of $800mm ($12.17/share)
— Estimates elimination the 2015+ opt-in agreement with James valued at $9.01/share
— Avastin adjuvant at 50% POS valued at $10.00
Deutsche Bank 22-Jul-2008 CHF 209.00 ? Price target altered to a range of CHF 209 to CHF 225 based on DCF analysis at $89.00
— WACC of 8.6% driven by European risk-free rate of 4.55%, equity risk premium of 4.5% and asset beta of 0.9 and 2% terminal growth reflecting GDP growth
— Results in range of new price target from CHF 209 to CHF 225
? DCF analysis shows offer price between $92.00 and $102.00 would be value neutral and accretive at $90.00 HSBC 22-Jul-2008 CHF 220.00 ? Price target reiterated to CHF 220.00 based on a mid-2009 PE and a DCF analysis
— For DCF, assumes a 3.0% medium growth rate, a 1.0% terminal growth rate and 8.5% discount rate
— Assumptions based on low exposure to generic risks and competitive strength of biologic pipeline
— PE of 17.0x to a mid-2009 PE
JPMorgan 22-Jul-2008 CHF 230.00 ? Price target based on a 17.0x 2009E EPS
Merrill Lynch 22-Jul-2008 CHF 210.00 ? Pro forma merger model shows $89.00 offer price 4% accretive to 2009E EPS
— 11% accretive to 2012 EPS
— Offer up to $100.00 would be NPV positive assuming positive Avastin adjuvant data
— CHF 850mm synergies achieved by 2011 (CHF 300mm in 2009, CHF 700m in 2010)
— Assumes no change in James tax rate, despite possible upside of domiciling Francis profits in Switzerland
— 4% cost of debt with $44 billion of acquisition debt
Morgan Stanley 22-Jul-2008 CHF 228.00 ? Pro forma merger model indicates 2008 – 2013 EPS CAGR of 12% at $89.00
— Assumed interest rate of 4% for $25bn new debt
— Upside potential for group tax rate (unspecified)
— Largely excludes adjuvant contribution from Avastin
Source: 1 Wall Street Research as of 08-Aug-2008 Price target reflects estimates based on change of control
Overview of James 32

Goldman Sachs
Analyst Commentary
James
Before Transaction Announcement
? “Both Rituxan and Avastin franchises are equally important value drivers for James non-U.S. business. In James forthcoming press release, we will be focusing on continued growth on James’ monoclonal antibody franchise. Given Francis’ robust product revenue growth and its strong royalty stream, we reiterate our Buy recommendation and PT of CHF 233 ahead of the publication of 1H08 results. “ (Vontobel, 16-Jul- 2008)
? “We value James using DCF valuation (WACC 8.4% driven by a European risk-free rate of 4.3%, an equity risk premium of 4.5%, an asset beta of 0.9 and a 2% terminal growth reflecting real GDP growth) . We believe this most appropriately captures the company’s growth prospects as
General well as its differentiation from European pharma peers. This yields our price target of CHF225. Downside risks include long-term threats to the Avastin, Rituxan and Herceptin franchises, the potential introduction of biologic follow-on compounds, pricing, development and political risks.” (Deutsche Bank, 9-Jul-2008)
? “After a deluge of new clinical data from the new drug pipeline, we believe only Avastin in its adjuvant colorectal setting is near enough or big enough to move the needle and enhance James’s premium valuation vs. its peers.” (HSBC, 17-Jun-2008)
After Transaction Announcement
? “We believe this will help secure James future beyond 2015 removing the need for renegotiation of opt-in rights for Francis pipeline, will help remove operational complexity and offers upside potential from Avastin adjuvant. “ (JPMorgan, 21-Jul-2008)
? “We view this as a sensible proposed use of cash (in particular at current FX rates) . . . and see major long-term EPS benefits from the deal.
This deal proposal gives James the perfect opportunity to address its U.S. infrastructure (e.g.; no longer run duplicate U.S. businesses), including closing the Palo Alto site and restructuring the Nutley site, essentially leaving Francis to drive the R&D function. “ (GS, 21-Jul-2008)
Transaction ? “We applaud the proposed acquisition of Francis , which would: 1) allow U.S. cost reduction to offset the negative revenue trends that we a have previously highlighted; 2) reduce R&D redundancy under the current James group structure; 3) enhance James’ pipeline post-2015, after to which James current agreement with Francis is due to expire; and 4) increase gearing to Avastin adjuvant call options. Loss of Francis scientific talent would be a manageable risk, we believe. “ (Morgan Stanley, 22-Jul-2008)
? “Francis is, by general consensus, the premier R&D organization in the entire pharmaceutical industry. Beyond the phase II pipeline, we believe a very important part of Francis’ value is in soft assets – the world leading scientists, the business processes and management
Benefits judgment, the culture, the single site, the values and history. James is also buying the option on the future potential of Francis R&D organization .” (Bernstein Research, 11-Aug-2008)
Source: Wall Street research as of 8-Aug-2008
Overview of James 33

Goldman Sachs
Analyst Commentary (cont’d)
James After Announcement
? “While at face value, the Francis deal appears to offer value to James shareholders through enhanced synergies and an attractive acquisition price, we believe that key concerns will be retaining senior talent at Francis and the final acquisition price payable …James has often cited this one
(potential loss of senior talent) as one of the reasons not to acquire the company. “ (Merrill Lynch, 21-Jul-2008)
? “If the acquisition occurs, James plans to operate Francis as an independent research and early development centre. James has always allowed Francis to operate at arm’s length and this has been a key part of Francis’ success story in our view. Though James purports to be doing exactly this in term of R&D going forward, it is possible that the new structure may not suit all key R&D employees of Francis. In the near term,
Concerns James may be able to provide financial incentives to retain Francis personnel, but the long-term impact is unclear. “ (Goldman Sachs, 21-Jul-2008) ? “We expect the market to have a mixed reaction .as there are a number of uncertainties. First retaining top talent at Francis will be crucial. Key James has often cited this as one of the reasons not to acquire the company. Second is whether they can actually get Francis at this price
($89/share) . The price is only a 19% premium to the 1-month average price, which Francis shareholders may view inadequately compensates for the multiple pipeline opportunities that exist (e.g., Avastin adjuvant CRC). However, our first pass estimate is that the deal would become NPV dilutive, on our existing pipeline assumptions (e.g., no Avastin adjuvant), at an acquisition price above ~$95/share. “ (Merrill Lynch, 21-Jul-2008)
? “We anticipate that a $95.81 valuation for Francis, which incorporates only the value of $12.17ps in cost synergies could go up to $129.10 (roughly $135 in 6 months) if James is willing to value 1) Avastin adjuvant with some probability (James management already communicated the view of >50% probability of success for Avastin adjuvant), 2) potential long-term tax benefits, as well as 3) the value of the elimination of the opt-in beyond 2015. Because James would want to capture some of the value of synergies, we see a $115-$135 bid range (6 month prices) as reasonable.
Another benefit from an acquisition is the elimination of the need to pay royalties and other costs to minority shareholders in Francis. We believe that the expiry of the current opt-in agreement could lead to higher royalties than the 15% James often pays currently. We believe the rate could go as high as 25% in less well-negotiated scenarios. Assuming that new opt-in products start to launch in 2023, we see the value on eliminating the opt-in royalties, assuming they would have persisted durably, would be worth $9.01. Note that we allocate all per share value to minorities since the minorities are the shares that James has to “convince” in order to access the $5.7bn in aggregate cost synergies value. Because James is not currently able to rationalize Francis’s cost base, despite its majority share control, we believe it appropriate that James pay for certain synergies, i.e. pay for a form of control. “ (UBS, 8-Aug-2008)
Commentary ? “The true potential of the realizable synergies, should this transaction be successful, is impossible to second -guess at this point but it is safe to assume that the true synergy potential is significantly above the suggested amount no matter how much James stresses that the proposed transaction is not a cost-cutting story.” (Deutsche, 22-Jul-2008) Price ? “We question whether Francis can be bought for $89 as the value of Avastin adjuvant alone could be worth $20 per share.” (UBS, 21-Jul-2008)
? “The lengthy relationship and the absence of a white knight for Francis make the ultimate acquisition plausible, in our view. At $89 per share, we calculate that the transaction could be 8-10% EPS accretive by 2010.” (Morgan Stanley, 22-Jul-2008)
? “On our estimates, if we assume positive Avastin adjuvant data, Francis valuation could increase $11 to $100 per share. A valuation assuming 50% probability of success would therefore yield $95. Although this suggests Francis minority shareholders could demand a higher price than the initial $89 per share, the current share price more than factors this in.” (Merrill Lynch, 22-Jul-2008)
Source: Wall Street research as of 8-Aug-2008
Overview of James 34
Goldman Sachs
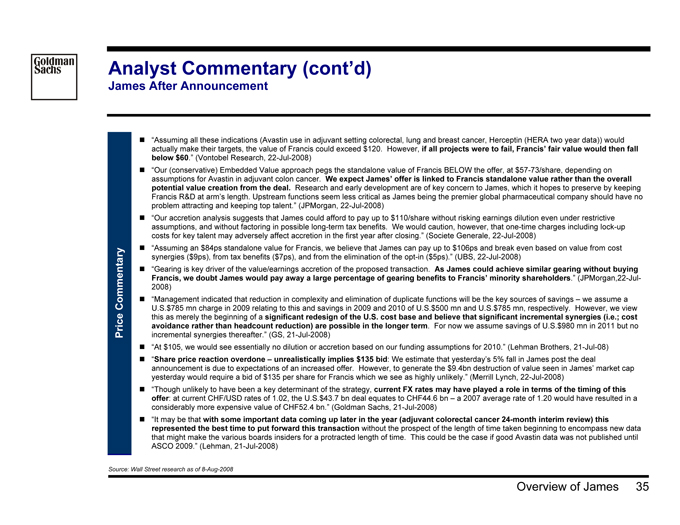
Analyst Commentary (cont’d)
James After Announcement
? “Assuming all these indications (Avastin use in adjuvant setting colorectal, lung and breast cancer, Herceptin (HERA two year data)) would actually make their targets, the value of Francis could exceed $120. However, if all projects were to fail, Francis’ fair value would then fall below $60.” (Vontobel Research, 22-Jul-2008)
? “Our (conservative) Embedded Value approach pegs the standalone value of Francis BELOW the offer, at $57-73/share, depending on assumptions for Avastin in adjuvant colon cancer. We expect James’ offer is linked to Francis standalone value rather than the overall potential value creation from the deal. Research and early development are of key concern to James, which it hopes to preserve by keeping Francis R&D at arm’s length. Upstream functions seem less critical as James being the premier global pharmaceutical company should have no problem attracting and keeping top talent.” (JPMorgan, 22-Jul-2008)
? “Our accretion analysis suggests that James could afford to pay up to $110/share without risking earnings dilution even under restrictive assumptions, and without factoring in possible long-term tax benefits. We would caution, however, that one-time charges including lock-up costs for key talent may adversely affect accretion in the first year after closing. “ (Societe Generale, 22-Jul-2008) ? “Assuming an $84ps standalone value for Francis, we believe that James can pay up to $106ps and break even based on value from cost synergies ($9ps), from tax benefits ($7ps), and from the elimination of the opt-in ($5ps).” (UBS, 22-Jul-2008)
? “Gearing is key driver of the value/earnings accretion of the proposed transaction. As James could achieve similar gearing without buying Francis, we doubt James would pay away a large percentage of gearing benefits to Francis’ minority shareholders .” (JPMorgan,22 -Jul-2008) Commentary ? “Management indicated that reduction in complexity and elimination of duplicate functions will be the key sources of savings – we assume a U.S.$785 mn charge in 2009 relating to this and savings in 2009 and 2010 of U.S.$500 mn and U.S.$785 mn, respectively. However, we view this as merely the beginning of a significant redesign of the U.S. cost base and believe that significant incremental synergies (i.e.; cost avoidance rather than headcount reduction) are possible in the longer term. For now we assume savings of U.S.$980 mn in 2011 but no
Price incremental synergies thereafter. “ (GS, 21-Jul-2008)
? “At $105, we would see essentially no dilution or accretion based on our funding assumptions for 2010.” (Lehman Brothers, 21-Jul-08)
? “Share price reaction overdone – unrealistically implies $135 bid: We estimate that yesterday’s 5% fall in James post the deal announcement is due to expectations of an increased offer. However, to generate the $9.4bn destruction of value seen in James’ market cap yesterday would require a bid of $135 per share for Francis which we see as highly unlikely. “ (Merrill Lynch, 22-Jul-2008)
? “Though unlikely to have been a key determinant of the strategy, current FX rates may have played a role in terms of the timing of this offer: at current CHF/USD rates of 1.02, the U.S.$43.7 bn deal equates to CHF44.6 bn – a 2007 average rate of 1.20 would have resulted in a considerably more expensive value of CHF52.4 bn.” (Goldman Sachs, 21-Jul-2008)
? “It may be that with some important data coming up later in the year (adjuvant colorectal cancer 24-month interim review) this represented the best time to put forward this transaction without the prospect of the length of time taken beginning to encompass new data that might make the various boards insiders for a protracted length of time. This could be the case if good Avastin data was not published until ASCO 2009.” (Lehman, 21-Jul-2008)
Source: Wall Street research as of 8-Aug-2008
Overview of James 35
Goldman Sachs
Credit Analyst Commentary After $89 Per Share Offer
James
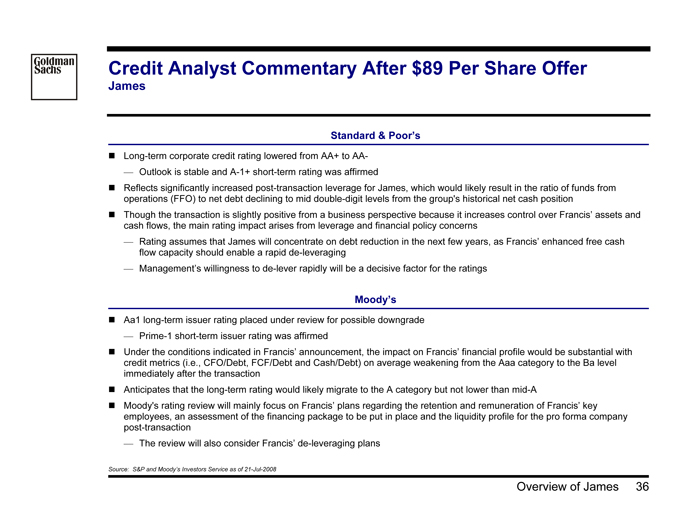
Standard & Poor’s
? Long-term corporate credit rating lowered from AA+ to AA-
— Outlook is stable and A-1+ short-term rating was affirmed
? Reflects significantly increased post-transaction leverage for James, which would likely result in the ratio of funds from operations (FFO) to net debt declining to mid double-digit levels from the group’s historical net cash position
? Though the transaction is slightly positive from a business perspective because it increases control over Francis’ assets and cash flows, the main rating impact arises from leverage and financial policy concerns
— Rating assumes that James will concentrate on debt reduction in the next few years, as Francis’ enhanced free cash flow capacity should enable a rapid de-leveraging
— Management’s willingness to de-lever rapidly will be a decisive factor for the ratings
Moody’s
? Aa1 long-term issuer rating placed under review for possible downgrade
— Prime-1 short-term issuer rating was affirmed
? Under the conditions indicated in Francis’ announcement, the impact on Francis’ financial profile would be substantial with credit metrics (i.e., CFO/Debt, FCF/Debt and Cash/Debt) on average weakening from the Aaa category to the Ba level immediately after the transaction
? Anticipates that the long-term rating would likely migrate to the A category but not lower than mid-A
? Moody’s rating review will mainly focus on Francis’ plans regarding the retention and remuneration of Francis’ key employees, an assessment of the financing package to be put in place and the liquidity profile for the pro forma company post-transaction
— The review will also consider Francis’ de-leveraging plans
Source: S&P and Moody’s Investors Service as of 21-Jul-2008
Overview of James 36

Goldman Sachs
IV. Financial Analysis
Financial Analysis 37

Goldman Sachs
Key Assumptions to Francis Management Projections
Near-term
? Avastin adjuvant CRC trial (C-08)
— Base case 65% PTS in Q2 2009
— Upside case Q4 ‘08 interim look is positive with positive PTS adjustments to other adjuvant trials
— Downside case Q2 ‘09 trial end is negative with negative PTS adjustments to other adjuvant trials
? Price / reimbursement impacts
— Base case assume 3% annual price increases
? 2015 James commercial agreement expiration
— Assumes status quo type of terms
— Management expects more favorable market terms than current (modeled separately)
? Tax rate assumptions
— Base case assumes off-shore manufacturing tax benefits trend tax-rate to approximately 30%
? FOB Assumptions
— Assumptions assume number of entrants, physician acceptance and price discounts by product
? Unnamed product PTS and market opportunity
— Assumes large and small molecule NMEs
— Launch to Filing PTS of 23% and 11% respectively
— Market opportunity of $1bn per NME indication plus two line extensions Upside case of $2.3bn total market opportunity Long-term Downside case of $500mm total market opportunity
Source: Francis management
Financial Analysis 38

Goldman Sachs
Comparison of Management Projections to Wall Street Estimates
($ in billions)
Revenue
$18.0 $17.4 $17.0 $15.7 $15.8 $16.0 $16.0 $16.0 $14.2 $14.6 $15.3 $15.2 $15.0 $15.0 $14.2 $13.8 $14.3 $14.2 $14.0 $13.4 $13.6 $13.0 $12.0 $11.0 $10.0
2009E 2010E 2011E
Operating Income
$9.0 $8.4 $8.0 $7.3 $7.2 $6.6 $6.1 $6.6 $7.0 $7.0 $7.1 $5.8 $6.1 $6.3 $6.3 $6.7 $6.0 $6.2 $6.4 $6.0 $5.0
$4.0
$3.0
2009E 2010E 2011E
LRP 2007 April Update Management Case IBES High IBES Mean IBES Low
Source: Financial projections per Francis management and Wall Street estimates as of 05-Aug-2008 Note: 2011E IBES mean based on selected composite from Wall Street research
Financial Analysis 39

Goldman Sachs
Comparison of Management Projections to Wall Street Estimates (cont’d)
($ in billions, except per share data)
Net Income
$7.0 $6.5 $6.1 $6.0 $5.2 $5.2 $4.4 $5.0 $4.2 $5.0 $4.8 $5.0 $4.2 $4.8 $4.2 $4.5 $3.8 $4.0 $4.6 $4.0 $4.1 $4.1 $3.7 $3.0
$2.0
$1.0
2009E 2010E 2011E
Cash EPS
$6.50 $6.20 $5.97 $5.50 $5.22 $4.39 $4.91 $4.79 $4.76 $4.15 $4.76 $4.94 $4.50 $3.87 $4.01 $3.94 $4.23 $4.44 $3.66 $3.95 $3.92 $3.50 $3.69
$2.50
$1.50
2009E 2010E 2011E
LRP 2007 April Update Management Case ¹ Management Case (No Share Repurchase) ² IBES High IBES Mean IBES Low
Source: Financial projections per Francis management and Wall Street estimates as of 05-Aug-2008. Cash EPS due to exclusion of stock based compensation Note: 1 2011E IBES mean based on selected composite from Wall Street research 2 Includes after-tax interest income of $200mm ($0.19 per share), $304mm ($0.30 per share) and $369mm ($0.38 per share) in 2009E, 2010E and 2011E, respectively. Includes interest income of $0.19, $0.44 and $0.76 per share in 2009E, 2010E and 2011E, respectively.
Financial Analysis 40

Goldman Sachs
Review of Francis Annual Long Range Plan Estimates
($ in millions)
$30,000 $26,992 2006 LRP $25,210 2005 LRP
$25,000 $24,630 Mgmt Plan $22,240 2004 LRP
$20,000 millions) $20,666 2007 LRP in $ ( $16,530
$15,000 2003 LRP
Estimate $14,467
Sales 2002 LRP . $10,000 . S $10,743
U
2001 LRP
$7,666 2000 LRP $5,000
$0
2002 2003 2004 2005 2006 2007 2008 2009 2010 2011 2012 2013 2014 2015 2016 2017 2018 2019 2020
2000 LRP 2001 LRP 2002 LRP 2003 LRP 2004 LRP 2005 LRP 2006 LRP 2007 LRP Management Case Actual
Source: Francis management
Financial Analysis 41

Goldman Sachs
Francis Forecasted Product Sales Breakdown
($ in millions)
Avastin Rituxan Herceptin Lucentis Other Marketed Named Product Pipeline Unnamed Non-Product
$35,000 $33,244
$31,055
$28,356
$26,025
$25,185
$30,000
$24,955
$24,194
$21,404
$25,000 $19,441
$18,427
$17,533 20,080 4,155 17,152
$16,223 6,397
14,169
$14,923 8,790
$20,000 2,283 11,411
$13,989 587 1,150 2,825 275 2,184
$12,645 102 1,029 1,563
16 547 3,483
$11,325 85 208
$15,000 25 3,812 3,707
4,136 3,943 3,780 3,990
17 4,139 2,814
4,071 1,558 1,638 4,198
3,796 1,230 1,339 1,456 4,485
- 1,115 1,325 4,554
3,250 1,752 1,867 1,945 2,696 4,548 1,110 1,735 1,804
$10,000 2,762 1,728 1,852
1,290 1,132 967 917 2,599 1,156 1,753 1,977 1,488 881
964 2,369 1,558 2,529 2,476
1,787 2,498 1,999 1,778 735 1,603 2,489 811 1,343 683 663 1,254 646 2,426 1,201 1,156 $5,000 2,608 759 2,584 9,008 725 699 677 7,849 8,249 8,619 8,257 6,484 7,290 6,482 4,665 5,420 5,040 4,574 3,852 4,371 4,205 3,413
$0 (15) (21) (51) (48) (50) (49) (51) (51) (53) (58) (60) (62) (60) (67) 2009E 2010E 2011E 2012E 2013E 2014E 2015E 2016E 2017E 2018E 2019E 2020E 2021E 2022E 2023E 2024E
($5,000)
Source: Francis management projections
Financial Analysis 42

Goldman Sachs
Growth Trends in Management Projections
Francis
16.0%
Net Income
Earnings Before Interest After Tax 14.0% 14.1% 13.1% Rate 12.0% 11.6%
Growth 10.8%
10.0%
9.1% 9.2%
Annual 8.7% 8.6% 8.0% 7.4%
7.4% 7.4% 7.2%
6.5%
6.6%
Compounded 6.0% 6.1% 6.8%
5.7% 4.4%
3.9% 4.3% 4.0% 3.7% 3.1%
2.0%
2009E 2010E 2011E 2012E 2013E 2014E 2015E 2016E 2017E 2018E 2019E
5yr Forward CAGR Yearly From 2009—2019
Source: Francis Management Projections
Financial Analysis 43

Goldman Sachs
Discounted Cash Flow Analysis of Francis
Key Assumptions
? Projections from 2009 to 2024 provided by Francis Management as of 01-Aug-2008
— Projections by product were provided for Avastin, Rituxan, Herceptin, Lucentis as well as for the pipeline
? Assumes 1,056mm basic shares outstanding, as of 07-Aug-2008
— Current options outstanding included in share count by the treasury stock method
— Options schedule provided by Francis management as of 07-Aug-2008
? Financial Sensitivity Analysis:
— Discount rates evaluated using a range of 8.0%—10.0% based on WACC analysis
— Terminal value evaluated using perpetuity growth rate method using a range of 2.0%—4.0%
Implied P/E terminal multiple also evaluated
? Total debt of $2,475mm, total cash and investments of $6,337mm as of 30-Jun-2008 per latest public filings
? Assumes capital expenditures of $818mm and depreciation and amortization of $867mm in 2024 terminal year, per Company management
? Assumes tax rate trends from 36% in 2009 to 31% in 2024 terminal year per management forecast
? Assumes cash flows discounted back to 01-Jan-2009
? Analysis includes impact of:
— Future employee stock options expense
Assumes $328mm in after-tax ESO expense in 2009 with a six percent annual growth rate
— Changes to James / Francis marketing agreement post 2015 per management guidance on expected market rate terms
“Marked to market” 2015 opt-in value derived from discounting projected product royalties from large and small molecules in the unnamed pipeline beginning in 2016, with a three percent perpetuity growth rate
Financial Analysis 44

Goldman Sachs
Summary Management Forecast
2009E – 2015E
($ in millions, except per share data)\
2009E—2014E 2009E—2015E 2009E 2010E 2011E 2012E 2013E 2014E 2015E CAGR CAGR
Revenues:
Avastin $3,413 $3,852 $4,665 $5,420 $6,484 $7,290 $7,849 16.4% 14.9% Rituxan 2,584 2,608 2,426 2,489 2,498 2,369 1,977 (1.7)% (4.4)% Herceptin 1,603 1,778 1,787 1,753 1,728 1,735 1,752 1.6% 1.5% Lucentis 964 1,156 1,290 1,110 1,115 1,230 1,339 5.0% 5.6% Other Named Products 2,762 3,266 3,821 4,156 4,347 4,683 4,972 11.1% 10.3% Unnamed—— 16 102 275 587 Non-Product (0) (15) 0 (21) (51) (48) (50) Product Sales $11,325 $12,645 $13,989 $14,923 $16,223 $17,533 $18,427 Royalties 2,563 2,653 2,811 2,873 2,966 3,136 2,976 Contract & Other 351 410 638 767 838 879 850
Total Revenue $14,239 $15,708 $17,439 $18,562 $20,026 $21,549 $22,253 8.6% 7.7% Cost and Expenses:
Cost of Sales $1,547 $1,693 $1,656 $1,696 $1,816 $1,885 $1,804 R&D 2,848 3,142 3,488 3,712 4,005 4,310 4,451 MSG&A 2,167 2,177 2,279 2,429 2,490 2,721 2,925 Profit Sharing 1,352 1,496 1,657 1,695 1,548 1,594 1,513
Total Cost & Exp. $7,914 $8,508 $9,080 $9,532 $9,858 $10,510 $10,692
Operating Income $6,326 $7,201 $8,359 $9,030 $10,168 $11,038 $11,560 11.8% 10.6% EBITDA $6,996 $7,884 $9,083 $9,771 $10,924 $11,817 $12,347 11.1% 9.9% Other Income, Net 281 403 494 524 590 618 796
Earnings (Pre-Tax) $6,607 $7,604 $8,853 $9,554 $10,757 $11,656 $12,357 12.0% 11.0% Taxes 2,380 2,585 2,773 2,892 3,214 3,472 3,672
Net Income $4,227 $5,019 $6,080 $6,662 $7,543 $8,185 $8,684 14.1% 12.7% WASO 1,053 1,022 981 941 898 864 851
EPS $4.01 $4.91 $6.20 $7.08 $8.40 $9.47 $10.21 18.7% 16.8% Growth and Margins Analysis
Revenue Growth—10.3 % 11.0 % 6.4 % 7.9 % 7.6 % 3.3 % R&D as % of Revenue 20.0 20.0 20.0 20.0 20.0 20.0 20.0 MSG&A as % of Revenue 15.2 13.9 13.1 13.1 12.4 12.6 13.1 EBIT Margin 44.4 45.8 47.9 48.6 50.8 51.2 52.0 EBITDA Margin 49.1 50.2 52.1 52.6 54.6 54.8 55.5 EPS Growth—22.4 26.1 14.3 18.5 12.8 7.7
Selected Balance Sheet Metrics
Cash & Equivalents ¹ $6,237 $6,444 $6,932 $7,534 $8,082 $11,473 $18,299 Total Debt 2,345 1,656 1,640 1,623 1,603 1,581 556
Selected Cash Flow Metrics
Depreciation & Amortization $670 $683 $724 $740 $757 $779 $786 Capital Expenditures (739) (812) (791) (615) (605) (626) (648) (Increase) / Decrease in Working Capital (66) (221) (161) (155) (252) (163) (106)
Source: 1 Company management projections as of 01-Aug-2008 Includes short-term investments
Financial Analysis 45
Goldman Sachs
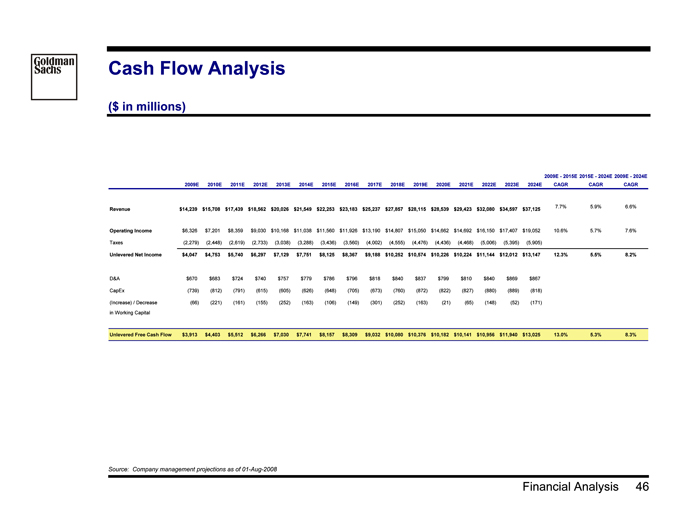
Cash Flow Analysis
($ in millions)
2009E—2015E 2015E—2024E 2009E—2024E 2009E 2010E 2011E 2012E 2013E 2014E 2015E 2016E 2017E 2018E 2019E 2020E 2021E 2022E 2023E 2024E CAGR CAGR CAGR
7.7% 5.9% 6.6%
Revenue $14,239 $15,708 $17,439 $18,562 $20,026 $21,549 $22,253 $23,183 $25,237 $27,857 $28,115 $28,539 $29,423 $32,080 $34,597 $37,125
Operating Income $6,326 $7,201 $8,359 $9,030 $10,168 $11,038 $11,560 $11,926 $13,190 $14,807 $15,050 $14,662 $14,692 $16,150 $17,407 $19,052 10.6% 5.7% 7.6%
Taxes (2,279) (2,448) (2,619) (2,733) (3,038) (3,288) (3,436) (3,560) (4,002) (4,555) (4,476) (4,436) (4,468) (5,006) (5,395) (5,905)
Unlevered Net Income $4,047 $4,753 $5,740 $6,297 $7,129 $7,751 $8,125 $8,367 $9,188 $10,252 $10,574 $10,226 $10,224 $11,144 $12,012 $13,147 12.3% 5.5% 8.2%
D&A $670 $683 $724 $740 $757 $779 $786 $796 $818 $840 $837 $799 $810 $840 $869 $867
CapEx (739) (812) (791) (615) (605) (626) (648) (705) (673) (760) (872) (822) (827) (880) (889) (818)
(Increase) / Decrease (66) (221) (161) (155) (252) (163) (106) (149) (301) (252) (163) (21) (65) (148) (52) (171) in Working Capital
Unlevered Free Cash Flow $3,913 $4,403 $5,512 $6,266 $7,030 $7,741 $8,157 $8,309 $9,032 $10,080 $10,376 $10,182 $10,141 $10,956 $11,940 $13,025 13.0% 5.3% 8.3%
Source: Company management projections as of 01-Aug-2008
Financial Analysis 46

Goldman Sachs
Discounted Cash Flow Analysis of Francis
Financial Sensitivities 2024 Terminal Year
Enterprise Value
Perpetuity Growth Rate
# ##### 2.0 % 2.5 % 3.0 % 3.5 % 4.0 %
10.0 % $88,539 $91,137 $94,107 $97,533 $101,531 Rate 9.5 % 95,338 98,518 102,186 106,467 111,525 Discount 9.0 % 102,993 106,923 111,507 116,925 123,427 8.5 % 111,571 116,483 122,288 129,253 137,767
8.0 % 121,004 127,225 134,691 143,815 155,221
% of Enterprise Value in Terminal Value
Perpetuity Growth Rate $ 50.5 2.0 % 2.5 % 3.0 % 3.5 % 4.0 %
10.0 % 40.8 % 42.5 % 44.3 % 46.3 % 48.4 % Rate 9.5 % 43.5 45.3 47.3 49.4 51.7 Discount 9.0 % 46.4 48.4 50.5 52.8 55.3 8.5 % 49.7 51.8 54.1 56.6 59.2
8.0 % 53.4 55.7 58.1 60.8 63.7
Equity Value Per Share
Perpetuity Growth Rate
$ 105.8 2.0 % 2.5 % 3.0 % 3.5 % 4.0 %
10.0 % $85.66 $87.95 $90.56 $93.57 $97.08 Rate 9.5 % 91.64 94.43 97.66 101.42 105.86 Discount 9.0 % 98.37 101.82 105.85 110.61 116.33 8.5 % 105.91 110.22 115.33 121.45 128.94
8.0 % 114.20 119.67 126.24 134.26 144.30
Implied 2024 P/E1
Perpetuity Growth Rate
$ 13.1 2.0 % 2.5 % 3.0 % 3.5 % 4.0 %
10.0 % 9.7 x 10.4 x 11.2 x 12.2 x 13.2 x Rate 9.5 % 10.4 11.2 12.1 13.2 14.4 Discount 9.0 % 11.1 12.0 13.1 14.4 15.9 8.5 % 12.0 13.1 14.3 15.8 17.7
8.0 % 13.0 14.2 15.7 17.6 19.9
Source: Financial projections and scenarios per Francis management as of 01-Aug-2008
Note: Includes capitalized ESO expense and “marked to market” 2015 opt-in value. Assumes 1,056mm basic shares outstanding, as of 07-Aug-2008, and net cash of $3,862 million, as of 30-Jun-2008.
1 Assumes cash flows discounted to 01-Jan-2009 P/E as implied by Earnings Before Interest, After-tax
Financial Analysis
47
Goldman Sachs
Avastin C-08 Assumptions
Base Case, C-08 Upside Case and C-08 Downside Case ($ in millions)
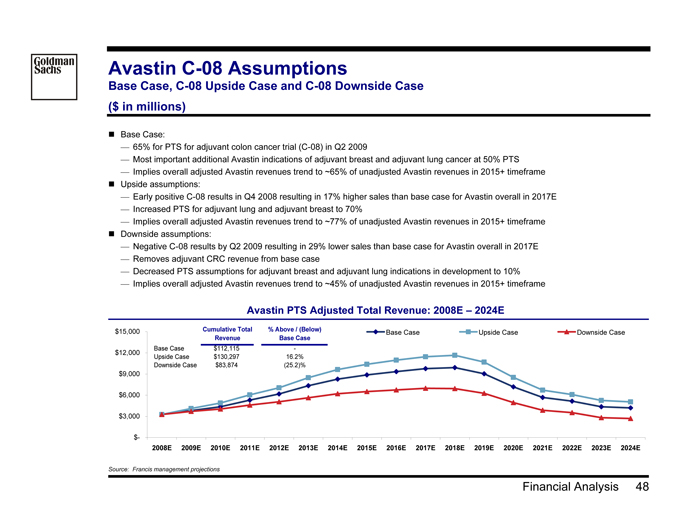
? Base Case:
— 65% for PTS for adjuvant colon cancer trial (C-08) in Q2 2009
— Most important additional Avastin indications of adjuvant breast and adjuvant lung cancer at 50% PTS
— Implies overall adjusted Avastin revenues trend to ~65% of unadjusted Avastin revenues in 2015+ timeframe
? Upside assumptions:
— Early positive C-08 results in Q4 2008 resulting in 17% higher sales than base case for Avastin overall in 2017E
— Increased PTS for adjuvant lung and adjuvant breast to 70%
— Implies overall adjusted Avastin revenues trend to ~77% of unadjusted Avastin revenues in 2015+ timeframe
? Downside assumptions:
— Negative C-08 results by Q2 2009 resulting in 29% lower sales than base case for Avastin overall in 2017E
— Removes adjuvant CRC revenue from base case
— Decreased PTS assumptions for adjuvant breast and adjuvant lung indications in development to 10%
— Implies overall adjusted Avastin revenues trend to ~45% of unadjusted Avastin revenues in 2015+ timeframe
Source: Francis management projections
Financial Analysis 48
Avastin PTS Adjusted Total Revenue: 2008E – 2024E
$15,000 Cumulative Total % Above / (Below) Base Case Upside Case Downside Case
Revenue Base Case
Base Case $112,115 -$12,000 Upside Case $130,297 16.2% Downside Case $83,874 (25.2)% $9,000
$6,000
$3,000
$-
2008E 2009E 2010E 2011E 2012E 2013E 2014E 2015E 2016E 2017E 2018E 2019E 2020E 2021E 2022E 2023E 2024E

Goldman Sachs
Avastin Case Discounted Cash Flow Analysis
Base Case, C-08 Upside Case and C-08 Downside Case 2024 Terminal Year
Avastin Impact on Whole -Co. – Equity Value Per Share
C-08 Downside Case Base Case C-08 Upside Case
Perpetuity Growth Rate Perpetuity Growth Rate Perpetuity Growth Rate $ 95.2 2.0 % 2.5 % 3.0 % 3.5 % 4.0 % $ 105.8 2.0 % 2.5 % 3.0 % 3.5 % 4.0 % $ 112.4 2.0 % 2.5 % 3.0 % 3.5 % 4.0 %
10.0 % $76.68 $78.86 $81.31 $84.14 $87.39 10.0 % $85.66 $87.95 $90.56 $93.57 $97.08 10.0 % $91.17 $93.55 $96.27 $99.41 $103.07 Rate 9.5 % 82.16 84.78 87.76 91.25 95.36 Rate 9.5 % 91.64 94.43 97.66 101.42 105.86 Rate 9.5 % 97.50 100.41 103.77 107.69 112.32 Discount 9.0 % 88.23 91.43 95.16 99.57 104.86 Discount 9.0 % 98.37 101.82 105.85 110.61 116.33 Discount 9.0 % 104.62 108.22 112.42 117.38 123.34 8.5 % 94.99 98.98 103.71 109.38 116.31 8.5 % 105.91 110.22 115.33 121.45 128.94 8.5 % 112.61 117.11 122.43 128.81 136.61
8.0 % 102.37 107.44 113.52 120.95 130.24 8.0 % 114.20 119.67 126.24 134.26 144.30 8.0 % 121.43 127.12 133.96 142.33 152.78
Incremental Impact on Whole-Co. – Equity Value Per Share
C-08 Downside Case C-08 Upside Case
Perpetuity Growth Rate $ 95.2 2.0 % 2.5 % 3.0 % 3.5 % 4.0 %
10.0 % ($8.98) ($9.08) ($9.24) ($9.43) ($9.69) Rate 9.5 % (9.48) (9.66) (9.89) (10.17) (10.50) Discount 9.0 % (10.13) (10.39) (10.69) (11.04) (11.47) 8.5 % (10.92) (11.24) (11.62) (12.08) (12.63)
8.0 % (11.83) (12.23) (12.72) (13.32) (14.06)
Perpetuity Growth Rate
$ 112.4 2.0 % 2.5 % 3.0 % 3.5 % 4.0 %
10.0 % $5.51 $5.61 $5.72 $5.84 $5.99 Rate 9.5 % 5.86 5.98 6.11 6.27 6.45 Discount 9.0 % 6.26 6.40 6.57 6.77 7.01 8.5 % 6.71 6.89 7.10 7.36 7.67
8.0 % 7.23 7.45 7.73 8.06 8.48
Source: Francis management projections
Financial Analysis 49
Goldman Sachs
Unnamed Pipeline Assumptions
Base Case, Upside Case and Downside Case ($ in millions)
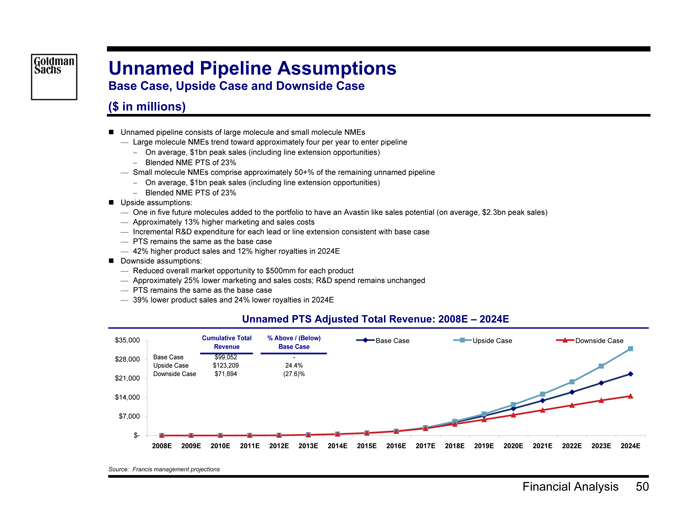
? Unnamed pipeline consists of large molecule and small molecule NMEs
— Large molecule NMEs trend toward approximately four per year to enter pipeline
On average, $1bn peak sales (including line extension opportunities)
Blended NME PTS of 23%
— Small molecule NMEs comprise approximately 50+% of the remaining unnamed pipeline
On average, $1bn peak sales (including line extension opportunities)
Blended NME PTS of 23%
? Upside assumptions:
— One in five future molecules added to the portfolio to have an Avastin like sales potential (on average, $2.3bn peak sales)
— Approximately 13% higher marketing and sales costs
— Incremental R&D expenditure for each lead or line extension consistent with base case
— PTS remains the same as the base case
— 42% higher product sales and 12% higher royalties in 2024E
? Downside assumptions:
— Reduced overall market opportunity to $500mm for each product
— Approximately 25% lower marketing and sales costs; R&D spend remains unchanged
— PTS remains the same as the base case
— 39% lower product sales and 24% lower royalties in 2024E
Unnamed PTS Adjusted Total Revenue: 2008E – 2024E
$35,000 Cumulative Total % Above / (Below) Base Case Upside Case Downside Case
Revenue Base Case $28,000 Base Case $99,052 -Upside Case $123,209 24.4% Downside Case $71,694 (27.6)% $21,000
$14,000
$7,000
$-
2008E 2009E 2010E 2011E 2012E 2013E 2014E 2015E 2016E 2017E 2018E 2019E 2020E 2021E 2022E 2023E 2024E
Source: Francis management projections
Financial Analysis 50

Goldman Sachs
Unnamed Products Case Discounted Cash Flow Analysis
Base Case, Upside Case and Downside Case 2024 Terminal Year
Unnamed Product Impact on Whole-Co. – Equity Value Per Share
Downside Case Base Case Upside Case
Perpetuity Growth Rate Perpetuity Growth Rate Perpetuity Growth Rate $ 87.1 2.0 % 2.5 % 3.0 % 3.5 % 4.0 % $ 105.8 2.0 % 2.5 % 3.0 % 3.5 % 4.0 % $ 117.3 2.0 % 2.5 % 3.0 % 3.5 % 4.0 %
10.0 % $72.62 $74.25 $76.12 $78.26 $80.70 10.0 % $85.66 $87.95 $90.56 $93.57 $97.08 10.0 % $93.17 $95.94 $99.12 $102.78 $107.05 Rate 9.5 % 77.12 79.09 81.33 83.93 86.98 Rate 9.5 % 91.64 94.43 97.66 101.42 105.86 Rate 9.5 % 100.21 103.61 107.53 112.11 117.52 Discount 9.0 % 81.99 84.38 87.14 90.40 94.31 Discount 9.0 % 98.37 101.82 105.85 110.61 116.33 Discount 9.0 % 108.20 112.40 117.31 123.10 130.06 8.5 % 87.23 90.19 93.68 97.87 102.99 8.5 % 105.91 110.22 115.33 121.45 128.94 8.5 % 117.26 122.51 128.72 136.17 145.28
8.0 % 92.73 96.48 100.97 106.46 113.33 8.0 % 114.20 119.67 126.24 134.26 144.30 8.0 % 127.38 134.03 142.02 151.78 163.99
Incremental Impact on Whole-Co. – Equity Value Per Share
Downside Case Upside Case
Perpetuity Growth Rate $ 87.1 2.0 % 2.5 % 3.0 % 3.5 % 4.0 %
10.0 % ($13.04) ($13.69) ($14.44) ($15.31) ($16.38) Rate 9.5 % (14.52) (15.34) (16.33) (17.48) (18.88) Discount 9.0 % (16.38) (17.44) (18.71) (20.22) (22.02) 8.5 % (18.67) (20.04) (21.65) (23.59) (25.95)
8.0 % (21.46) (23.19) (25.27) (27.80) (30.97)
Perpetuity Growth Rate
$ 117.3 2.0 % 2.5 % 3.0 % 3.5 % 4.0 %
10.0 % $7.51 $8.00 $8.56 $9.21 $9.97 Rate 9.5 % 8.57 9.18 9.87 10.69 11.65 Discount 9.0 % 9.84 10.59 11.46 12.49 13.73 8.5 % 11.35 12.29 13.39 14.72 16.34
8.0 % 13.18 14.36 15.78 17.52 19.69
Source: Francis management projections
Financial Analysis 51
Goldman Sachs
Discounted Cash Flow Analysis of Francis
Revenue Impact and Pricing Considerations 2024 Terminal Year
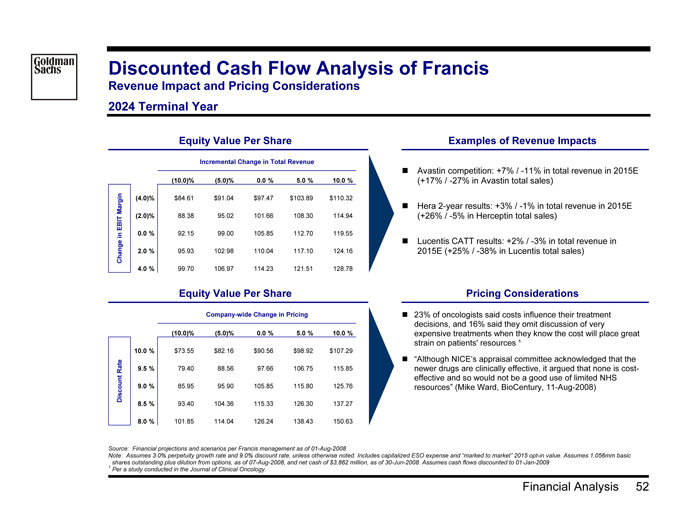
Equity Value Per Share
Incremental Change in Total Revenue
(10.0)% (5.0)% 0.0 % 5.0 % 10.0 %
Margin (4.0)% $84.61 $91.04 $97.47 $103.89 $110.32 EBIT (2.0)% 88.38 95.02 101.66 108.30 114.94 in 0.0 % 92.15 99.00 105.85 112.70 119.55 Change 2.0 % 95.93 102.98 110.04 117.10 124.16 4.0 % 99.70 106.97 114.23 121.51 128.78
Equity Value Per Share
Company -wide Change in Pricing
(10.0)% (5.0)% 0.0 % 5.0 % 10.0 %
10.0 % $73.55 $82.16 $90.56 $98.92 $107.29 Rate 9.5 % 79.40 88.56 97.66 106.75 115.85 Discount 9.0 % 85.95 95.90 105.85 115.80 125.76 8.5 % 93.40 104.36 115.33 126.30 137.27
8.0 % 101.85 114.04 126.24 138.43 150.63
Examples of Revenue Impacts
? Avastin competition: +7% / -11% in total revenue in 2015E (+17% / -27% in Avastin total sales)
? Hera 2-year results: +3% / -1% in total revenue in 2015E (+26% / -5% in Herceptin total sales)
? Lucentis CATT results: +2% / -3% in total revenue in 2015E (+25% / -38% in Lucentis total sales)
Pricing Considerations
? 23% of oncologists said costs influence their treatment decisions, and 16% said they omit discussion of very expensive treatments when they know the cost will place great strain on patients’ resources ¹
? “Although NICE’s appraisal committee acknowledged that the newer drugs are clinically effective, it argued that none is cost-effective and so would not be a good use of limited NHS resources” (Mike Ward, BioCentury, 11-Aug-2008)
Source: Financial projections and scenarios per Francis management as of 01-Aug-2008
Note: Assumes 3.0% perpetuity growth rate and 9.0% discount rate, unless otherwise noted. Includes capitalized ESO expense and “marked to market” 2015 opt-in value. Assumes 1,056mm basic 1 shares outstanding plus dilution from options, as of 07-Aug-2008, and net cash of $3,862 million, as of 30-Jun-2008. Assumes cash flows discounted to 01-Jan-2009 Per a study conducted in the Journal of Clinical Oncology.
Financial Analysis 52

Goldman Sachs
Discounted Cash Flow Analysis of Francis
Tax and Follow -on Biologic Considerations 2024 Terminal Year
Equity Value Per Share
Terminal Year Tax Rate
36.0 % 33.5 % 31.0 % 28.5 % 26.0 %
10.0 % $87.69 $89.12 $90.56 $91.99 $93.42 Rate 9.5 % 94.35 96.01 97.66 99.31 100.96 Discount 9.0 % 102.02 103.93 105.85 107.77 109.68 8.5 % 110.85 113.09 115.33 117.57 119.81
8.0 % 120.95 123.60 126.24 128.88 131.52
Equity Value Per Share
Incremental Follow -on Biologic Erosion for Top 4 Products ¹
(20.0)% (10.0)% 0.0 % 10.0 % 20.0 %
10.0 % $87.63 $89.09 $90.56 $92.02 $93.48 Rate 9.5 % 94.33 95.99 97.66 99.32 100.98 Discount 9.0 % 102.05 103.95 105.85 107.75 109.65 8.5 % 110.95 113.14 115.33 117.52 119.71
8.0 % 121.15 123.69 126.24 128.78 131.32
Tax Considerations
? U.S. tax system may eventually shift to tax worldwide income, thus reducing offshore tax benefits
? Potential may exist to shift some offshore income out of the U.S. over time
? Future tax environment is very difficult to predict
? Strategies to shift tax burden over time may have an upfront cost that should be considered (e.g., building new manufacturing facilities)
Follow -on Biologic Considerations
? Generic impact for small molecule products can vary widely
? Due to limited entry, generic biologics will be relatively close in price to branded biologics
— Less entry in biologics compared to pharmaceuticals due to greater variable costs and lower contribution margin
? On average, generic pharma price is approximately 54% of branded price within 12 months after first generic launch ²
? To date biosimilars for erythropoetin and hGH have had limited impact on the branded competitors
Source: Financial projections and scenarios per Francis management as of 01-Aug-2008
Note: Assumes 3.0% perpetuity growth rate. Includes capitalized ESO expense and “marked to market” 2015 opt-in value. Assumes 1,056mm basic shares outstanding plus dilution from options, as of
1 07-Aug-2008, and net cash of $3,862 million, as of 30-Jun-2008. Assumes cash flows discounted to 01-Jan-2009 2 Base case assumption of an impact of approximately 40% of peak sales. Per a study of 40 generic pharma products from the Duke Clinical Research Institute. Study hypothesizes that generic pharma data provides some insight for generic biologics.
Financial Analysis 53

Goldman Sachs
Additional Financial Analysis Included in the DCF
Future Employee Stock Options Expense and 2015 Opt-In Value ($ in millions)
Employee Stock Options Expense
Discount Rate
###
10.0 % 9.5 % 9.0 % 8.5 % 8.0 %
($8,470) ($9,665) ($11,259) ($13,491) ($16,837)
? Assumes Black Scholes based estimate of 2007 stock option grant expense (tax affected) per Francis 10-K filing
? Net present value of annual projected ESO expenses
? Assumes 6% annual growth rate of ESO issuance value, comprised of 3% growth in the number of employees and 3% of inflation
2015 Commercial Agreement Opt-In Value
Discount Rate
###
10.0 % 9.5 % 9.0 % 8.5 % 8.0 %
$2,340 $2,827 $3,439 $4,215 $5,213
? Evaluates royalty revenue derived from the unnamed pipeline following the expiration of the James opt-in rights in 2015
? Assumes large and small molecule projections per Francis management, including revenue profile and number of large and small molecules
? Assumes current commercial agreement royalties are approximately 50% of “market rate” (30% royalty vs. current 15% royalty)
? 3% perpetuity growth rate
Source: Financial projections and scenarios per Francis management as of 01-Aug-2008
Note: Assumes 1,056mm basic shares outstanding, as of 07-Aug-2008, and net cash of $3,862 million, as of 30-Jun-2008. Assumes cash flows discounted to 01-Jan-2009
Financial Analysis 54

Goldman Sachs
Sum of the Parts Analysis
Key Assumptions
? Anaysis for Francis separated into seven components:
— Avastin, Rituxan, Herceptin, Lucentis, Other Named Products and Pipeline, Unnamed and Non-Product
? Includes the net present value of capitalized employee stock options expense, “marked to market” 2015 opt-in value and net cash
? Total debt of $2,475mm, total cash and investments of $6,337mm as of 30-Jun-2008 per latest public filings
? By component, depreciation and amortization, capital expenditures and changes in working capital allocated as a percentage of total revenue contribution
? Analysis of terminal value derived using perpetuity growth rates
— Terminal growth rate for Unnamed products implied from terminal ranges on other components and total Company terminal ranges
? Assumes tax rate per Francis management for each component
Financial Analysis 55

Goldman Sachs
Sum of the Parts Analysis
2024 Terminal Year
Value Range Terminal Value Methodology
Avastin $32.39 $40.97 (4.0)% to 0.0% Rituxan 6.25 7.17 (4.0)% to 0.0% Herceptin 11.24 13.50 (4.0)% to 0.0% Lucentis 6.02 7.36 (4.0)% to 0.0% Other Named Products and Pipeline 18.34 27.16 (1.0)% to 1.0% Unnamed 29.92 83.29 4.0% to 5.2% Non-Product (16.39) (28.11) 2.0% to 4.0%
Capitalized ESO Expense (7.85) (15.27) “Marked to Market” 2015 Opt-In Value 2.17 4.73 Net Cash 3.58 3.50
Total $85.66 $144.30
Whole-Co DCF Value $85.66 $144.30 2.0% to 4.0%
Current Price (as of 08-Aug-2008) $96.95
Source: Francis financials per Francis management
Note: Assumes discount rates of 8.0%—10.0% and 1,056mm basic shares outstanding plus dilution from options as of 07-Aug-2008, per Francis management. Assumes total debt of $2,475mm, total cash and investments of $6,337mm as of 30-Jun-2008 per latest public filings. Terminal growth rate for Unnamed products implied from terminal ranges on other components and total Company terminal ranges
Financial Analysis 56
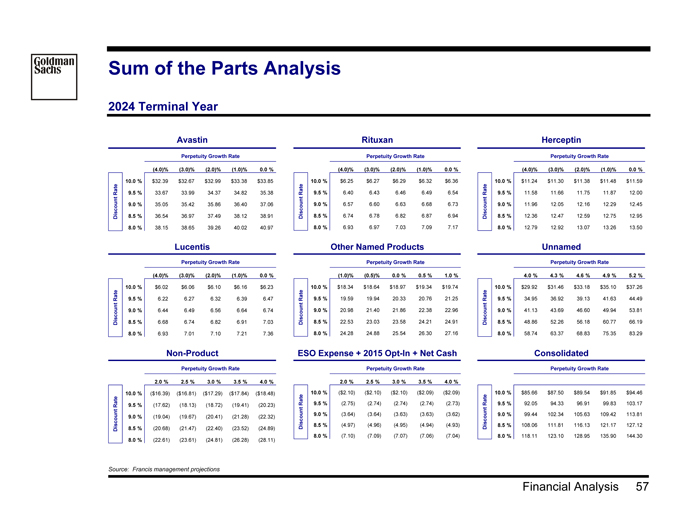
Goldman Sachs
Sum of the Parts Analysis
2024 Terminal Year
Avastin
Perpetuity Growth Rate
# ##### (4.0)% (3.0)% (2.0)% (1.0)% 0.0 %
10.0 % $32.39 $32.67 $32.99 $33.38 $33.85 Rate 9.5 % 33.67 33.99 34.37 34.82 35.38 9.0 % 35.05 35.42 35.86 36.40 37.06 Discount 8.5 % 36.54 36.97 37.49 38.12 38.91 8.0 % 38.15 38.65 39.26 40.02 40.97
Rituxan
Perpetuity Growth Rate
# ##### (4.0)% (3.0)% (2.0)% (1.0)% 0.0 %
10.0 % $6.25 $6.27 $6.29 $6.32 $6.36 Rate 9.5 % 6.40 6.43 6.46 6.49 6.54 9.0 % 6.57 6.60 6.63 6.68 6.73 Discount 8.5 % 6.74 6.78 6.82 6.87 6.94 8.0 % 6.93 6.97 7.03 7.09 7.17
Herceptin
Perpetuity Growth Rate
# ##### (4.0)% (3.0)% (2.0)% (1.0)% 0.0 %
10.0 % $11.24 $11.30 $11.38 $11.48 $11.59 Rate 9.5 % 11.58 11.66 11.75 11.87 12.00 9.0 % 11.96 12.05 12.16 12.29 12.45 Discount 8.5 % 12.36 12.47 12.59 12.75 12.95 8.0 % 12.79 12.92 13.07 13.26 13.50
Lucentis
Perpetuity Growth Rate
# ##### (4.0)% (3.0)% (2.0)% (1.0)% 0.0 %
10.0 % $6.02 $6.06 $6.10 $6.16 $6.23 Rate 9.5 % 6.22 6.27 6.32 6.39 6.47 9.0 % 6.44 6.49 6.56 6.64 6.74 Discount 8.5 % 6.68 6.74 6.82 6.91 7.03 8.0 % 6.93 7.01 7.10 7.21 7.36
Other Named Products
Perpetuity Growth Rate
# ##### (1.0)% (0.5)% 0.0 % 0.5 % 1.0 %
10.0 % $18.34 $18.64 $18.97 $19.34 $19.74 Rate 9.5 % 19.59 19.94 20.33 20.76 21.25 9.0 % 20.98 21.40 21.86 22.38 22.96 Discount 8.5 % 22.53 23.03 23.58 24.21 24.91 8.0 % 24.28 24.88 25.54 26.30 27.16
Unnamed
Perpetuity Growth Rate
# ##### 4.0 % 4.3 % 4.6 % 4.9 % 5.2 %
10.0 % $29.92 $31.46 $33.18 $35.10 $37.26 Rate 9.5 % 34.95 36.92 39.13 41.63 44.49 9.0 % 41.13 43.69 46.60 49.94 53.81 Discount 8.5 % 48.86 52.26 56.18 60.77 66.19 8.0 % 58.74 63.37 68.83 75.35 83.29
Non -Product
Perpetuity Growth Rate
# ##### 2.0 % 2.5 % 3.0 % 3.5 % 4.0 %
10.0 % ($16.39) ($16.81) ($17.29) ($17.84) ($18.48) Rate 9.5 % (17.62) (18.13) (18.72) (19.41) (20.23) 9.0 % (19.04) (19.67) (20.41) (21.28) (22.32) Discount 8.5 % (20.68) (21.47) (22.40) (23.52) (24.89) 8.0 % (22.61) (23.61) (24.81) (26.28) (28.11)
ESO Expense + 2015 Opt-In + Net Cash
Perpetuity Growth Rate
# ##### 2.0 % 2.5 % 3.0 % 3.5 % 4.0 %
10.0 % ($2.10) ($2.10) ($2.10) ($2.09) ($2.09) Rate 9.5 % (2.75) (2.74) (2.74) (2.74) (2.73) 9.0 % (3.64) (3.64) (3.63) (3.63) (3.62) Discount 8.5 % (4.97) (4.96) (4.95) (4.94) (4.93) 8.0 % (7.10) (7.09) (7.07) (7.06) (7.04)
Consolidated
Perpetuity Growth Rate
# #####
10.0 % $85.66 $87.50 $89.54 $91.85 $94.46 Rate 9.5 % 92.05 94.33 96.91 99.83 103.17 9.0 % 99.44 102.34 105.63 109.42 113.81 Discount 8.5 % 108.06 111.81 116.13 121.17 127.12 8.0 % 118.11 123.10 128.95 135.90 144.30
Financial Analysis 57

Goldman Sachs
Comparison of Selected Comparable Companies
Selected Biotech
($ in millions, except per share data)
Price as of 52-Week Diluted Diluted Long-Term EV / LTM P/E P/E to Growth 8-Aug-2008 High Market Cap Enterprise Value EPS Growth Sales 2008E 2009E 2008E 2009E
Francis $96.95 100.0 % $105,658 $101,660 15.0 % 8.5 x 28.0 x 24.7 x 1.9 x 1.6 x 1—Month Average 89.04 91.8 96,580 92,582 15.0 7.8 25.7 22.7 1.7 1.5 3—Month Average 78.53 81.0 84,680 80,682 15.0 6.8 22.7 20.0 1.5 1.3
Selected Biotech¹
Amgen $63.80 100.0 % $67,629 $70,159 9.5 % 4.8 x 14.6 x 14.1 x 1.5 x 1.5 x Biogen Idec 49.90 60.5 14,484 14,037 13.0 3.2 14.1 12.8 1.1 1.0 Celgene 75.15 98.2 38,208 35,978 36.7 22.8 48.8 32.0 1.3 0.9 Genzyme 78.82 97.2 22,733 21,403 19.0 5.3 19.9 16.5 1.0 0.9 Gilead 56.77 100.0 57,026 54,557 18.0 12.2 28.7 24.8 1.6 1.4
High 100.0 % $67,629 $70,159 36.7 % 22.8 x 48.8 x 32.0 x 1.6 x 1.5 x Mean 91.2 40,016 39,227 19.2 9.7 25.2 20.1 1.3 1.1 Median 98.2 38,208 35,978 18.0 5.3 19.9 16.5 1.3 1.0 Low 60.5 14,484 14,037 9.5 3.2 14.1 12.8 1.0 0.9
Source: 1 Latest publicly available financial statements, IBES median estimates and Wall Street research as of 08-Aug-2008 Selected Biotech includes profitable companies with Market Cap >$15bn.
Financial Analysis 58

Goldman Sachs
Comparison of Selected Comparable Companies
Large Pharma
($ in millions, except per share data)
Price as of 52-Week Diluted Diluted Long-Term EV / LTM P/E P/E to Growth 8-Aug-2008 High Market Cap Enterprise Value EPS Growth Sales 2008E 2009E 2008E 2009E
Francis $96.95 100.0 % $105,658 $101,660 15.0 % 8.5 x 28.0 x 24.7 x 1.9 x 1.6 x 1—Month Average 89.04 91.8 96,580 92,582 15.0 7.8 25.7 22.7 1.7 1.5 3—Month Average 78.53 81.0 84,680 80,682 15.0 6.8 22.7 20.0 1.5 1.3
Large Pharma
James $175.37 86.9 % $153,342 $148,029 7.8 % 3.0 x 16.4 x 14.8 x 2.1 x 1.9 x Abbott 59.03 97.6 92,522 141,735 12.5 5.3 18.0 16.2 1.4 1.3 AstraZeneca 49.68 100.0 72,306 123,832 4.0 4.1 10.2 9.7 2.5 2.4 Bayer 82.21 83.7 62,839 140,379 7.1 2.9 13.3 11.9 1.9 1.7 Bristol-Myers Squibb 22.31 74.1 44,183 87,614 11.3 4.3 13.5 11.2 1.2 1.0 Eli Lilly 48.51 81.6 55,153 94,067 5.9 4.9 12.3 11.3 2.1 1.9 GSK 24.14 91.0 124,531 136,690 5.5 3.2 12.6 12.3 2.3 2.2 Johnson & Johnson 71.55 100.0 203,628 203,722 8.2 3.3 15.9 15.1 2.0 1.8 Merck 35.95 59.2 77,022 74,682 5.0 3.1 10.9 10.1 2.2 2.0 Merck KGaA 117.19 79.8 25,476 86,418 9.5 8.0 12.6 11.2 1.3 1.2 Novartis 57.48 93.1 130,244 175,894 7.6 4.3 15.6 13.9 2.1 1.8 Novo Nordisk 62.28 87.8 38,932 45,741 12.5 5.3 21.2 19.2 1.7 1.5 Pfizer 19.84 77.6 133,741 162,216 4.0 3.4 8.4 7.8 2.1 2.0 Sanofi-Aventis 72.86 72.8 95,204 101,806 2.0 2.3 9.1 8.4 4.5 4.2 Schering -Plough 20.63 62.6 33,614 83,116 11.0 5.8 12.9 12.1 1.2 1.1 Wyeth 43.75 86.5 58,416 96,960 3.6 4.3 12.4 11.8 3.5 3.3
High 100.0 % $203,628 $203,722 12.5 % 8.0 x 21.2 x 19.2 x 4.5 x 4.2 x Mean 83.4 87,572 118,931 7.3 4.2 13.5 12.3 2.1 2.0 Median 85.1 74,664 112,819 7.3 4.2 12.8 11.9 2.1 1.9 Low 59.2 25,476 45,741 2.0 2.3 8.4 7.8 1.2 1.0
Source: Latest publicly available financial statements, IBES median estimates and Wall Street research as of 08-Aug-2008
Financial Analysis 59

Goldman Sachs
Present Value of Future Stock Price Analysis
Management Case, Adjusted for Share Repurchases at One Year Forward at 21.0x P/E1
Future Stock Price (Undiscounted)
$150 $125 $100 $75 $50
18.0x 21.0x 24.0x
$96.13
$84.11
$72.09
$87.56
$102.15
$145.50
$127.31
$109.13
$116.75
2009E 2010E 2011E
$150 $125 $100 $75 $50
2009E 2010E 2011E
$96.13
$84.11
$72.09
$107.11 $93.72
$80.33
$122.47
$107.16 $91.85
18.0 x
21.0 x
24.0 x
2009E 2010E 2011E EPS (Calculated) $ 4.01 $ 4.86 $ 6.06
IBES $ 3.95 $ 4.44 $ 4.94²
Source: Francis management projections and IBES
1 Assumes cash of $3.9bn, $5.0b, $6.7bn for 2009-11, respectively, used to repurchase shares based on management projections. Price of share repurchase assumed to be 21.0x one year forward EPS 2 per Management Case ($103.15, $130.10, $148.76 for 2009-11, respectively) . 2011E IBES mean based on selected composite from Wall Street research
Financial Analysis 60
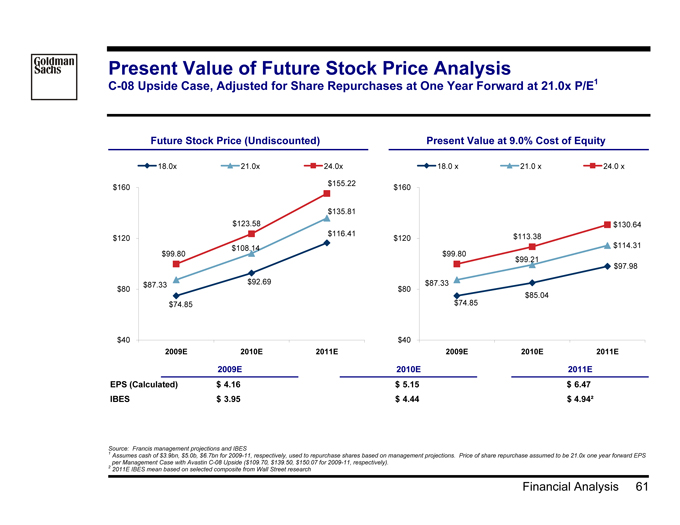
Goldman Sachs
Present Value of Future Stock Price Analysis
C-08 Upside Case, Adjusted for Share Repurchases at One Year Forward at 21.0x P/E1
Future Stock Price (Undiscounted)
$99.80
$87.33
$74.85
$160 $120 $80 $40
2009E 2010E 2011E
$123.58
$108.14
$92.69
24.0x
$155.22
$135.81
$116.41
21.0x
18.0x
Present Value at 9.0% Cost of Equity
$160
$120
$80
$40
2009E 2010E 2011E
18.0 x
21.0 x
24.0 x
$99.80
$87.33
$74.85
$113.38 $99.21
$85.04
$130.64
$114.31 $97.98
2009E 2010E 2011E EPS (Calculated) $ 4.16 $ 5.15 $ 6.47
IBES $ 3.95 $ 4.44 $ 4.94²
Source: Francis management projections and IBES
1 Assumes cash of $3.9bn, $5.0b, $6.7bn for 2009-11, respectively, used to repurchase shares based on management projections. Price of share repurchase assumed to be 21.0x one year forward EPS 2 per Management Case with Avastin C-08 Upside ($109.70, $139.50, $150.07 for 2009-11, respectively) . 2011E IBES mean based on selected composite from Wall Street research
Financial Analysis 61

Goldman Sachs
Present Value of Future Stock Price Analysis
C-08 Downside Case, Adjusted for Share Repurchases at One Year Forward at 21.0x P/E1
Future Stock Price (Undiscounted)
18.0x
21.0x
24.0x
$150 $125 $100 $75 $50
$94.73
$82.89
$71.05
$112.80 $98.70
$84.60
$136.11
$119.10
$102.08
2009E 2010E 2011E
Present Value at 9.0% Cost of Equity
18.0 x
21.0 x
24.0 x
$150 $125 $100 $75 $50
$94.73
$82.89
$71.05
$103.49 $90.55
$77.62
$114.56
$100.24 $85.92
2009E 2010E 2011E
2009E 2010E 2011E EPS (Calculated) $ 3.95 $ 4.70 $ 5.67
IBES $ 3.95 $ 4.44 $ 4.94²
Source: Francis management projections and IBES
1 Assumes cash of $3.9bn, $5.0b, $6.7bn for 2009-11, respectively, used to repurchase shares based on management projections. Price of share repurchase assumed to be 21.0x one year forward EPS 2 per Management Case with Avastin C-08 Downside ($99.23, $120.50, $132.85 for 2009-11, respectively) . 2011E IBES mean based on selected composite from Wall Street research
Financial Analysis 62
Goldman Sachs
V. Transaction Analysis
Transaction Analysis 63

Goldman Sachs
Transaction Analysis Assumptions
? James projections based on Wall Street research dated 28-Jul-08
? Francis projections per Company management as of 01-Aug-2008
? Assumes 100% cash transaction financed with $10 billion in existing cash and the remainder in new debt
— Cost of debt assumed to range from 4.3% to 5.0% depending on the size of the transaction and resulting debt rating
? Achieves pre-tax synergies of $400 million in 2009E and $800 million in 2010E and 2011E
— Excludes potential costs to achieve synergies
? 3.0% opportunity cost of cash
? CHF10 billion minimum cash balance for pro forma company
— Excess free cash flow used to service debt
? Assumes no amortization of excess purchase price due to ability of James to account for it on the balance sheet directly as a reduction in equity (Francis already consolidated)
? Assumes transaction closes 31-Dec-2008
Transaction Analysis 64

Goldman Sachs
Sources and Uses for James Acquisition of the Minority
At $89 Per Share (Figures in millions)
Sources
USD CHF
Francis Cash Used $6,337 CHF 6,859 James Existing Cash Used 3,663 3,964 Total Cash Used $10,000 CHF 10,823
Debt Issuance:
Commercial Paper @ 2.54% $15,000 CHF 16,235 Bonds ($) @ 6.00% 10,000 10,823 Bonds (EUR) @ 6.25% 5,000 5,412 Term Loan @ 4.29% 4,328 4,684 Total Debt Issuance $34,328 CHF 37,153
Total Sources $44,328 CHF 47,976
Uses
USD CHF
Transaction Size at $89.00 Per Share $43,828 CHF 47,435
Financing / Transaction Fees $500 CHF 541
Total Uses $44,328 CHF 47,976
Note: Assumes $89.00 per share acquisition price
Transaction Analysis 65
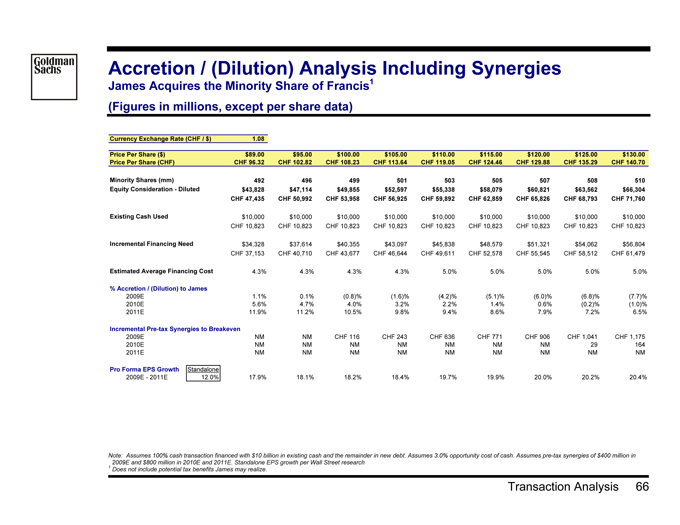
Goldman Sachs
Accretion / (Dilution) Analysis Including Synergies
James Acquires the Minority Share of Francis 1 (Figures in millions, except per share data)
Currency Exchange Rate (CHF / $) 1.08
Price Per Share ($) $89.00 $95.00 $100.00 $105.00 $110.00 $115.00 $120.00 $125.00 $130.00 Price Per Share (CHF) CHF 96.32 CHF 102.82 CHF 108.23 CHF 113.64 CHF 119.05 CHF 124.46 CHF 129.88 CHF 135.29 CHF 140.70
Minority Shares (mm) 492 496 499 501 503 505 507 508 510 Equity Consideration—Diluted $43,828 $47,114 $49,855 $52,597 $55,338 $58,079 $60,821 $63,562 $66,304 CHF 47,435 CHF 50,992 CHF 53,958 CHF 56,925 CHF 59,892 CHF 62,859 CHF 65,826 CHF 68,793 CHF 71,760
Existing Cash Used $10,000 $10,000 $10,000 $10,000 $10,000 $10,000 $10,000 $10,000 $10,000 CHF 10,823 CHF 10,823 CHF 10,823 CHF 10,823 CHF 10,823 CHF 10,823 CHF 10,823 CHF 10,823 CHF 10,823
Incremental Financing Need $34,328 $37,614 $40,355 $43,097 $45,838 $48,579 $51,321 $54,062 $56,804 CHF 37,153 CHF 40,710 CHF 43,677 CHF 46,644 CHF 49,611 CHF 52,578 CHF 55,545 CHF 58,512 CHF 61,479
Estimated Average Financing Cost 4.3% 4.3% 4.3% 4.3% 5.0% 5.0% 5.0% 5.0% 5.0%
% Accretion / (Dilution) to James
2009E 1.1% 0.1% (0.8)% (1.6)% (4.2)% (5.1)% (6.0)% (6.8)% (7.7)% 2010E 5.6% 4.7% 4.0% 3.2% 2.2% 1.4% 0.6% (0.2)% (1.0)% 2011E 11.9% 11.2% 10.5% 9.8% 9.4% 8.6% 7.9% 7.2% 6.5%
Incremental Pre-tax Synergies to Breakeven
2009E NM NM CHF 116 CHF 243 CHF 636 CHF 771 CHF 906 CHF 1,041 CHF 1,175 2010E NM NM NM NM NM NM NM 29 164 2011E NM NM NM NM NM NM NM NM NM
Pro Forma EPS Growth Standalone
2009E—2011E 12.0% 17.9% 18.1% 18.2% 18.4% 19.7% 19.9% 20.0% 20.2% 20.4%
Note: Assumes 100% cash transaction financed with $10 billion in existing cash and the remainder in new debt. Assumes 3.0% opportunity cost of cash. Assumes pre-tax synergies of $400 million in
1 2009E and $800 million in 2010E and 2011E. Standalone EPS growth per Wall Street research Does not include potential tax benefits James may realize.
Transaction Analysis 66

Goldman Sachs
Leverage Analysis for James
Pro Forma for the Acquisition of Francis (Figures in millions, except per share data)
Currency Exchange Rate (CHF / $) 1.08
Price Per Share ($) $89.00 $95.00 $100.00 $105.00 $110.00 $115.00 $120.00 $125.00 $130.00 Price Per Share (CHF) CHF 96.32 CHF 102.82 CHF 108.23 CHF 113.64 CHF 119.05 CHF 124.46 CHF 129.88 CHF 135.29 CHF 140.70 Minority Shares (mm) 492 496 499 501 503 505 507 508 510 Equity Consideration—Diluted $43,828 $47,114 $49,855 $52,597 $55,338 $58,079 $60,821 $63,562 $66,304 CHF 47,435 CHF 50,992 CHF 53,958 CHF 56,925 CHF 59,892 CHF 62,859 CHF 65,826 CHF 68,793 CHF 71,760 Existing Cash Used $10,000 $10,000 $10,000 $10,000 $10,000 $10,000 $10,000 $10,000 $10,000 CHF 10,823 CHF 10,823 CHF 10,823 CHF 10,823 CHF 10,823 CHF 10,823 CHF 10,823 CHF 10,823 CHF 10,823 Incremental Financing Need $34,328 $37,614 $40,355 $43,097 $45,838 $48,579 $51,321 $54,062 $56,804 CHF 37,153 CHF 40,710 CHF 43,677 CHF 46,644 CHF 49,611 CHF 52,578 CHF 55,545 CHF 58,512 CHF 61,479
2008E Pro Forma Credit Profile (CHF mn)
EBITDA CHF 17,254 CHF 17,254 CHF 17,254 CHF 17,254 CHF 17,254 CHF 17,254 CHF 17,254 CHF 17,254 CHF 17,254 CapEx 3,300 3,300 3,300 3,300 3,300 3,300 3,300 3,300 3,300 Total Debt 41,779 45,336 48,303 51,270 54,237 57,204 60,171 63,138 66,105 Total Debt / EBITDA 2.4 x 2.6 x 2.8 x 3.0 x 3.1 x 3.3 x 3.5 x 3.7 x 3.8 x Total Debt / (EBITDA—CapEx) 3.0 3.2 3.5 3.7 3.9 4.1 4.3 4.5 4.7 Net Debt 30,532 34,090 37,056 40,023 42,990 45,957 48,924 51,891 54,858 Net Debt / EBITDA 1.8 x 2.0 x 2.1 x 2.3 x 2.5 x 2.7 x 2.8 x 3.0 x 3.2 x Net Debt / (EBITDA—CapEx) 2.2 2.4 2.7 2.9 3.1 3.3 3.5 3.7 3.9 Total Cash 11,246 11,246 11,246 11,246 11,246 11,246 11,246 11,246 11,246
2009E Pro Forma Credit Profile (CHF mn)
EBITDA CHF 19,871 CHF 19,871 CHF 19,871 CHF 19,871 CHF 19,871 CHF 19,871 CHF 19,871 CHF 19,871 CHF 19,871 CapEx 2,493 2,493 2,493 2,493 2,493 2,493 2,493 2,493 2,493 Total Debt 28,050 31,607 34,573 37,540 40,507 43,474 46,441 49,408 52,375 Total Debt / EBITDA 1.4 x 1.6 x 1.7 x 1.9 x 2.0 x 2.2 x 2.3 x 2.5 x 2.6 x Total Debt / (EBITDA—CapEx) 1.6 1.8 2.0 2.2 2.3 2.5 2.7 2.8 3.0 Net Debt 18,050 21,607 24,573 27,540 30,507 33,474 36,441 39,408 42,375 Net Debt / EBITDA 0.9 x 1.1 x 1.2 x 1.4 x 1.5 x 1.7 x 1.8 x 2.0 x 2.1 x Net Debt / (EBITDA—CapEx) 1.0 1.2 1.4 1.6 1.8 1.9 2.1 2.3 2.4 Total Cash 10,000 10,000 10,000 10,000 10,000 10,000 10,000 10,000 10,000 Preliminary Long-term Credit Rating AA- / A1 AA- / A1 AA-,A+ / A1,A2 A+ / A2 A / A3 upside potential A / A3 A- / Baa1 A- / Baa1 Potential Notch Downgrade ¹ 0 / 3 0 / 3 1 / 4 1 / 4 2 / 5 2 / 5 3 / 6 3 / 6 Preliminary Short-term Credit Rating A-1+ / P-1 A-1+ / P-1 A-1+,A-1 / P-1 A-1 / P-1 <--— A-1 stable / P-1 at risk --—> A-2 / P-2 A-2 / P-2 A-2 / P-2 Estimated Minimum Bank Loan Capacity $15,672 $12,386 $9,645 $6,903 $4,162 $1,421——Estimated Average Financing Cost 4.3% 4.3% 4.3% 4.3% 5.0% 5.0% 5.0% 5.0% 5.0%
Source: Francis management projections
1 Note: Assumes debt paydown beginning in 2009 with a minimum CHF10,000 mn cash balance 2 Assumes current Moody’s long-term rating of Aa1, which is under review for possible downgrade.
Incremental financing capacity assumes maximum of $50 billion in bank financing available. A-1 / P-1 short-term credit rating decline limits access to CP market.
Transaction Analysis 67
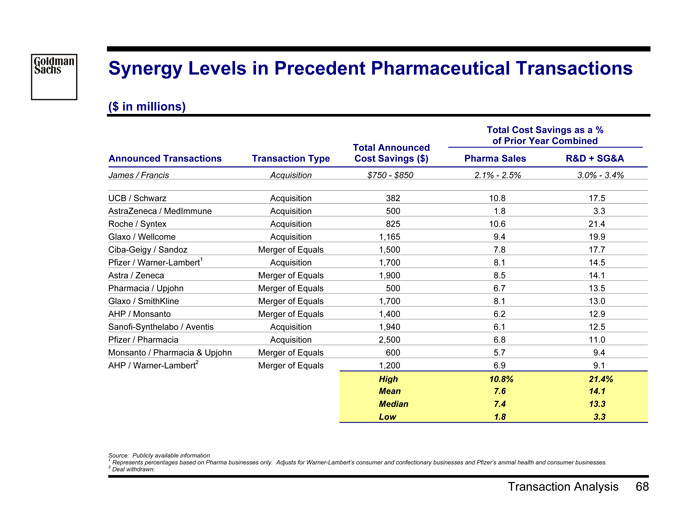
Goldman Sachs
Synergy Levels in Precedent Pharmaceutical Transactions
($ in millions)
Total Cost Savings as a % of Prior Year Combined Total Announced Announced Transactions Transaction Type Cost Savings ($) Pharma Sales R&D + SG&A
James / Francis Acquisition $750—$850 2.1%—2.5% 3.0%—3.4%
UCB / Schwarz Acquisition 382 10.8 17.5 AstraZeneca / MedImmune Acquisition 500 1.8 3.3 Roche / Syntex Acquisition 825 10.6 21.4 Glaxo / Wellcome Acquisition 1,165 9.4 19.9 Ciba-Geigy / Sandoz Merger of Equals 1,500 7.8 17.7 Pfizer / Warner -Lambert 1 Acquisition 1,700 8.1 14.5 Astra / Zeneca Merger of Equals 1,900 8.5 14.1 Pharmacia / Upjohn Merger of Equals 500 6.7 13.5 Glaxo / SmithKline Merger of Equals 1,700 8.1 13.0 AHP / Monsanto Merger of Equals 1,400 6.2 12.9 Sanofi-Synthelabo / Aventis Acquisition 1,940 6.1 12.5 Pfizer / Pharmacia Acquisition 2,500 6.8 11.0 Monsanto / Pharmacia & Upjohn Merger of Equals 600 5.7 9.4 AHP / Warner -Lambert 2 Merger of Equals 1,200 6.9 9.1 High 10.8% 21.4% Mean 7.6 14.1 Median 7.4 13.3 Low 1.8 3.3
1 Source: Publicly available information
2 Represents percentages based on Pharma businesses only. Adjusts for Warner-Lambert’s consumer and confectionary businesses and Pfizer’s animal health and consumer businesses. Deal withdrawn.
Transaction Analysis 68
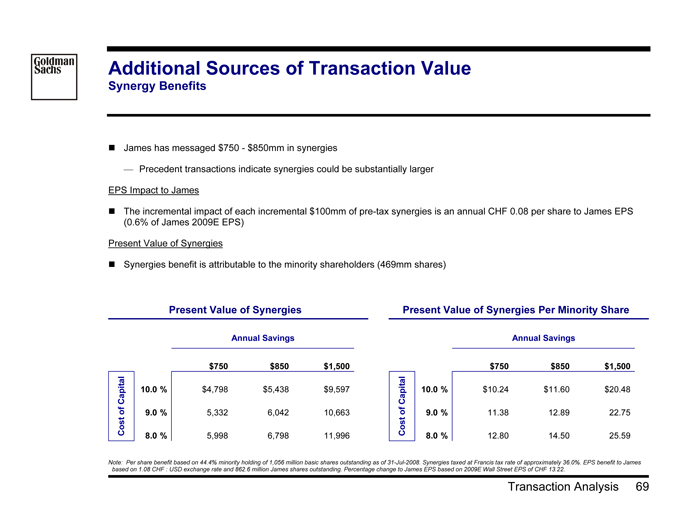
Goldman Sachs
Additional Sources of Transaction Value
Synergy Benefits
? James has messaged $750—$850mm in synergies
— Precedent transactions indicate synergies could be substantially larger EPS Impact to James
? The incremental impact of each incremental $100mm of pre-tax synergies is an annual CHF 0.08 per share to James EPS (0.6% of James 2009E EPS)
Present Value of Synergies
? Synergies benefit is attributable to the minority shareholders (469mm shares)
Present Value of Synergies
Annual Savings
4798.41 $750 $850 $1,500 Capital 10.0 % $4,798 $5,438 $9,597 of 9.0 % 5,332 6,042 10,663
Cost
8.0 % 5,998 6,798 11,996
Present Value of Synergies Per Minority Share
Annual Savings
10.2375 $750 $850 $1,500 Capital 10.0 % $10.24 $11.60 $20.48 of 9.0 % 11.38 12.89 22.75
Cost
8.0 % 12.80 14.50 25.59
Note: Per share benefit based on 44.4% minority holding of 1,056 million basic shares outstanding as of 31-Jul-2008. Synergies taxed at Francis tax rate of approximately 36.0% . EPS benefit to James based on 1.08 CHF : USD exchange rate and 862.6 million James shares outstanding. Percentage change to James EPS based on 2009E Wall Street EPS of CHF 13.22.
Transaction Analysis 69

Goldman Sachs
Potential Tax Synergies Associated with Buyout
Overview
? There are several possible tax synergies that James could achieve following an acquisition for the Francis minority
— While it’s difficult to evaluate the feasibility of various scenarios and even more difficult to quantify the value of such synergies, they should nevertheless be considered
— More due diligence into the current and future tax position of James and Francis would be required to estimate these synergies
? Some potential tax strategies that could be considered in connection with buyout include:
— Financing acquisition with loan from James (Swiss parent) to its U.S. holding company to create interest deductions in the U.S.
— Marginal benefits of achieving tax consolidation between James’ U.S. holding company and Francis
— Ability to migrate some of Francis’ future intellectual property development outside the U.S. into a lower taxed jurisdiction
— Migrating some manufacturing operations outside of the U.S. to lower taxed jurisdictions
— Other global tax planning strategies to reduce income allocated to other high-taxed jurisdictions
? Potential synergies exist because some of these strategies cannot be achieved with public minority
— As wholly-owned subsidiary of James, Francis has more flexibility to pursue internal restructuring transactions with less concern about such transactions meeting arm’s-length standard from standpoint of public minority
Transaction Analysis 70
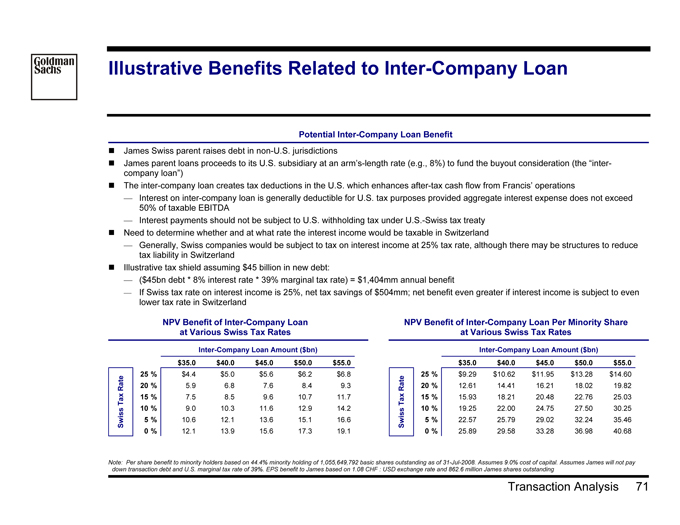
Goldman Sachs
Illustrative Benefits Related to Inter -Company Loan
Potential Inter-Company Loan Benefit
? James Swiss parent raises debt in non-U.S. jurisdictions
? James parent loans proceeds to its U.S. subsidiary at an arm’s-length rate (e.g., 8%) to fund the buyout consideration (the “inter-company loan”)
? The inter-company loan creates tax deductions in the U.S. which enhances after-tax cash flow from Francis’ operations
— Interest on inter-company loan is generally deductible for U.S. tax purposes provided aggregate interest expense does not exceed 50% of taxable EBITDA
— Interest payments should not be subject to U.S. withholding tax under U.S.-Swiss tax treaty
? Need to determine whether and at what rate the interest income would be taxable in Switzerland
— Generally, Swiss companies would be subject to tax on interest income at 25% tax rate, although there may be structures to reduce tax liability in Switzerland
? Illustrative tax shield assuming $45 billion in new debt:
— ($45bn debt * 8% interest rate * 39% marginal tax rate) = $1,404mm annual benefit
— If Swiss tax rate on interest income is 25%, net tax savings of $504mm; net benefit even greater if interest income is subject to even lower tax rate in Switzerland
NPV Benefit of Inter-Company Loan at Various Swiss Tax Rates
Inter-Company Loan Amount ($bn) $ 15.6 $35.0 $40.0 $45.0 $50.0 $55.0 25 % $4.4 $5.0 $5.6 $6.2 $6.8 Rate 20 % 5.9 6.8 7.6 8.4 9.3 Tax 15 % 7.5 8.5 9.6 10.7 11.7 10 % 9.0 10.3 11.6 12.9 14.2 Swiss 5 % 10.6 12.1 13.6 15.1 16.6 0 % 12.1 13.9 15.6 17.3 19.1
NPV Benefit of Inter-Company Loan Per Minority Share at Various Swiss Tax Rates
Inter-Company Loan Amount ($bn) $ 33.3 $35.0 $40.0 $45.0 $50.0 $55.0
25 % $9.29 $10.62 $11.95 $13.28 $14.60 Rate 20 % 12.61 14.41 16.21 18.02 19.82 Tax 15 % 15.93 18.21 20.48 22.76 25.03 10 % 19.25 22.00 24.75 27.50 30.25 Swiss 5 % 22.57 25.79 29.02 32.24 35.46
0 % 25.89 29.58 33.28 36.98 40.68
Note: Per share benefit to minority holders based on 44.4% minority holding of 1,055,649,792 basic shares outstanding as of 31-Jul-2008. Assumes 9.0% cost of capital. Assumes James will not pay down transaction debt and U.S. marginal tax rate of 39%. EPS benefit to James based on 1.08 CHF : USD exchange rate and 862.6 million James shares outstanding
Transaction Analysis 71

Goldman Sachs
Additional Sources of Transaction Value
Potential Tax Benefits Related to Longer -Term Tax Offshoring
? Over time James may be able to offshore Francis IP to achieve a lower overall tax rate
— Immediate movement of IP offshore would generate a large one-time tax bill
? In addition, due to global operations, James may be able to accelerate and/or maintain offshore manufacturing tax benefits for a longer period
? The long term benefit of a tax rate that approximates James’ current tax rate could contribute significant long-term value
? The table below shows the net value that could be created by trending to a 26% terminal year tax rate vs. a 31% tax rate
Present Value of Longer -term Tax Offshoring Per Minority Share
Perpetuity Growth Rate
$ 15.9 2.0% 2.5% 3.0% 3.5% 4.0% 10.0 % $4.83 $5.23 $5.69 $6.23 $6.85 Capital 9.5 % 5.71 6.21 6.78 7.44 8.23 of 9.0 % 6.76 7.37 8.09 8.93 9.94 Cost 8.5 % 8.01 8.78 9.68 10.77 12.09 8.0 % 9.53 10.50 11.66 13.08 14.86
Note: Per share benefit to minority holders based on 44.4% minority holding of 1,055,649,792 basic shares outstanding as of 31-Jul-2008. Assumes James will not pay down transaction debt. Potential tax withholding related to interest income to parent entity is not included in analysis.
Transaction Analysis 72

Goldman Sachs
Analysis at Various Prices
($ in millions, except per share data)
Price Per Share $89.00 $95.00 $100.00 $105.00 $110.00 $115.00 $120.00 $125.00 $130.00 Total Equity Consideration—Diluted $96,088 $102,897 $108,574 $114,252 $119,929 $125,606 $131,284 $136,961 $142,638 Net Debt (as of 30-Jun-2008) (3,862) (3,862) (3,862) (3,862) (3,862) (3,862) (3,862) (3,862) (3,862) Enterprise Value $92,226 $99,035 $104,712 $110,390 $116,067 $121,744 $127,422 $133,099 $138,776
Premium / (Discount) to Stock Price
Current (as of 08-Aug-2008) $96.95 (8.2)% (2.0)% 3.1 % 8.3 % 13.5 % 18.6 % 23.8 % 28.9 % 34.1 % 18-Jul-2008 Close Price 81.82 8.8 16.1 22.2 28.3 34.4 40.6 46.7 52.8 58.9 1 Day Prior 81.16 9.7 17.1 23.2 29.4 35.5 41.7 47.9 54.0 60.2 30-Day Average 75.96 17.2 25.1 31.7 38.2 44.8 51.4 58.0 64.6 71.2 6-Month Average 74.05 20.2 28.3 35.0 41.8 48.5 55.3 62.0 68.8 75.6
Revenue
LTM $12,176 7.6 x 8.1 x 8.6 x 9.1 x 9.5 x 10.0 x 10.5 x 10.9 x 11.4 x 2008E 13,276 6.9 7.5 7.9 8.3 8.7 9.2 9.6 10.0 10.5 2009E 14,239 6.5 7.0 7.4 7.8 8.2 8.5 8.9 9.3 9.7 2010E 15,708 5.9 6.3 6.7 7.0 7.4 7.8 8.1 8.5 8.8 2011E 17,439 5.3 5.7 6.0 6.3 6.7 7.0 7.3 7.6 8.0
EBITDA
LTM $5,580 16.5 x 17.7 x 18.8 x 19.8 x 20.8 x 21.8 x 22.8 x 23.9 x 24.9 x 2008E 6,156 15.0 16.1 17.0 17.9 18.9 19.8 20.7 21.6 22.5 2009E 6,996 13.2 14.2 15.0 15.8 16.6 17.4 18.2 19.0 19.8 2010E 7,884 11.7 12.6 13.3 14.0 14.7 15.4 16.2 16.9 17.6 2011E 9,083 10.2 10.9 11.5 12.2 12.8 13.4 14.0 14.7 15.3
EPS
LTM $2.99 29.8 x 31.8 x 33.5 x 35.2 x 36.8 x 38.5 x 40.2 x 41.9 x 43.5 x 2008E 3.43 25.9 27.7 29.2 30.6 32.1 33.5 35.0 36.4 37.9 2009E 4.01 22.2 23.7 24.9 26.2 27.4 28.7 29.9 31.1 32.4 2010E 4.91 18.1 19.3 20.4 21.4 22.4 23.4 24.4 25.4 26.5 2011E 6.20 14.4 15.3 16.1 16.9 17.8 18.6 19.4 20.2 21.0
Source: Francis management projections and public company filings
Transaction Analysis 73

Goldman Sachs
Comparison of Selected Transactions
($ in millions)
Equity Enterprise LTM Premium to Premium to Date Consideration Consideration Sales 1 Day prior 1 Month prior Announced Acquiror Target ($ mm) (a) ($ mm) (a) Multiple Price (%) Price (%) (b)
31-Jul-2008 Bristol-Myers Squibb Imclone Systems $ 5,192 $ 4,857 7.7x 29.2 % 49.7 % 10-Apr-2008 Takeda Millennium 8,831 7,936 15.0 52.9 93.1 29-Nov-2007 Eisai MGI Pharma 3,898 3,734 10.1 38.7 25.8 18-Nov-2007 Celgene Pharmion 2,839 2,590 9.7 46.1 53.5 23-Apr-2007 AstraZeneca MedImmune 15,560 15,219 11.9 20.8 70.0 20-Feb-2007 Shire New River 2,660 2,498 NM 9.7 15.4 30-Oct-2006 Merck Sirna Therapeutics 1,132 1,090 NM 100.2 135.5 17-Oct-2006 Eli Lilly ICOS 2,140 2,303 NM 18.0 25.4 02-Oct-2006 Gilead Myogen 2,473 2,315 NM 49.7 50.0 21-Sep-2006 Merck KGaA Serono 13,504 12,316 5.8 20.2 30.5 15-May-2006 AstraZeneca Technology 1,364 1,070 2.7 66.9 71.4 14-Dec-2005 Amgen Abgenix 2,660 2,580 NM 53.6 67.7 01-Sep-2005 Novartis (c) Chiron 5,085 5,162 2.9 23.5 23.3 07-Sep-2005 GlaxoSmithKline ID Biomedical 1,447 1,504 NM 13.5 46.6 16-Jun-2005 Pfizer Vicuron 1,916 1,789 NM 84.2 67.3 21-Apr-2005 Shire Transkaryotic Therapies 1,575 1,445 18.7 21.6 58.5 18-May-2004 UCB Celltech 2,708 2,445 4.2 28.0 19.0 29-Mar-2004 Amgen (d) Tularik 1,450 1,291 NM 47.1 33.0 26-Feb-2004 Genzyme ILEX Oncology 1,048 947 27.2 25.0 10.5 21-Jul-1999 Johnson & Johnson Centocor 4,861 5,349 13.1 23.2 24.8
High $ 15,560 $ 15,219 27.2 x 100.2 % 135.5 % Mean 4,117 3,922 10.8 38.6 48.6 Median 2,660 2,471 9.9 28.6 48.2 Low 1,048 947 2.7 9.7 10.5
Source: FactSet, public filings and press releases
Note: Highlighted deals denote pre-existing ownership and/or major product collaboration between target and acquiror prior to acquisition. (a) Foreign company valuations converted to $US using the applicable exchange rate on date of announcement.
(b) Based on closing price twenty trading days prior to announcement.
(c) Novartis acquired the remaining 113mm shares which it did not already own in Chiron for $45 in cash per share. Premiums based on unaffected stock prices. (d) Amgen acquired the remaining 78.7% interest or 52.7mm shares which it did not already own in Tularik for $25 in common stock per share.
Transaction Analysis 74

Goldman Sachs
Comparison of Selected Minority Buyout Transactions
($ in millions)
Stock Price 1 Day Initial Final Premium Majority of
Date % Owned Prior Date Value Prior to Bid per No of Final Bid Initial Premium Over Market % Increase Minority Tender Offer Effective Target Name Acquiror Name to Transaction Announced ($MM) Announcement Share bumps per Share Over Market Price Price in Offer Clause? vs. Merger
Greater Than 50% Owned Prior to Transaction
Pending Alfa Corp Investor Group 52.7 17-Jul-2007 2,065 15.20 17.60 1 22.00 15.8 % 44.7 % 25.0 % N M Pending Nationwide Finl Svcs Inc Nationwide Mutual Insurance C 64.3 10-Mar-2008 8,376 37.93 47.20 0 47.20 24.4 24.4 0.0 N/A N/A Dec-07 Tribune Co Sam Zell 52.5 02-Apr-2007 13,117 32.11 34.00 0 34.00 5.9 5.9 0.0 N M Sep-07 Great American Finl Res American Financial Group 75.7 22-Feb-2007 1,199 21.64 23.50 1 24.50 8.6 13.2 4.3 N M Apr-07 TD Banknorth Inc. Toronto -Dominion Bank 54.8 20-Nov-2006 3,232 30.25 32.33 0 32.33 6.9 6.5 0.0 N M Nov-05 7-Eleven Inc IYG Holding Co 69.7 01-Sep-2005 1,301 28.34 32.50 1 37.50 14.7 32.3 15.4 Y T Jun-05 UGC Holdings Liberty Media 52.2 18-Jan-2005 11,499 9.64 9.58 0 9.58 (0.6) (0.6) 0.0 Y M Mar-05 Fox Entertainment News Corp Inc 76.6 10-Jan-2005 7,183 31.22 33.54 1 35.31 7.4 13.1 5.3 Y T Dec-04 Cox Communications Cox Enterprises Inc 61.4 02-Aug-2004 8,389 27.58 32.00 1 34.75 16.0 26.0 8.6 Y T Jun-03 Hotels. com USA Interactive 62.3 10-Apr-2003 1,237 53.30 60.24 0 60.24 13.0 13.0 0.0 N T Jan-03 Ticketmaster USA Interactive 63.2 31-May-2002 2,027 21.50 22.99 1 15.85 6.9 (26.3) (31.1) N T Mar-02 Intimate Brands Inc Limited Inc 81.8 04-Feb-2002 1,644 17.90 19.30 1 19.72 7.8 10.2 2.2 N T Sep-01 Westfield America Inc Westfield America Trust 55.9 15-Feb-2001 1,050 14.45 16.25 0 16.25 12.5 12.5 0.0 N M Jul-01 BHC Communications News Corp Inc 76.1 14-Aug-2000 2,403 141.75 165.00 0 165.00 16.4 16.4 0.0 N M Feb-01 Infinity Broadcasting Viacom Inc 62.4 15-Aug-2000 13,649 35.25 40.04 1 32.89 13.6 (6.7) (17.9) Y M Jan-01 AXA Financial Inc AXA Group 54.7 30-Aug-2000 11,189 52.25 53.50 1 54.63 2.4 4.6 2.1 N T Sep-00 Vastar Resources Inc BP Amoco PLC 80.1 17-Mar-2000 1,575 71.44 71.00 1 83.00 (0.6) 16.2 16.9 Y T Sep-00 CareInsite Inc Healtheon/WebMD Inc 64.9 14-Feb-2000 1,883 67.88 71.50 0 71.50 5.3 5.3 0.0 N M Jun-00 Hartford Life Hartford Fin Svcs Group 80.4 27-Mar-2000 1,324 42.56 44.00 1 50.50 3.4 18.6 14.8 N T Jun-00 IXnet Inc Global Crossing 72.4 22-Feb-2000 3,193 52.50 62.01 0 62.01 18.1 18.1 0.0 N M Apr-00 Travelers Property Casualty Citigroup 85.0 21-Mar-2000 17,940 33.69 41.50 1 41.95 23.2 24.5 1.1 N T
High 24.4 % 44.7 % 25.0 % Mean 10.5 13.0 2.2 Median 8.6 13.1 0.0 Low (0.6) (26.3) (31.1)
Less Than 50% Owned Prior to Transaction
Jul-06 William Lyon Homes General William Lyon 46.7 17-Mar-2006 1,221 75.70 93.00 2 109.00 22.9 % 44.0 % 17.2 % Y T May-06 Lafarge North America Lafarge SA 48.9 06-Feb-2006 3,227 64.25 75.00 2 85.50 16.7 33.1 14.0 Y T Apr-06 Chiron Corp Novartis AG 42.5 01-Sep-2005 6,625 36.44 40.00 2 48.00 9.8 31.7 20.0 Y M Aug-03 Expedia USA Interactive 46.5 31-May-2002 6,745 37.83 38.43 1 51.36 1.6 35.8 33.6 N M Dec-01 BancWest Corp. BNP Paribas 43.5 07-May-2001 19,380 24.98 35.00 0 35.00 40.1 40.1 0.0 N M Jun-01 Sodexho Marriott Services Sodexho Alliance SA 42.9 25-Jan-2001 2,996 24.88 27.00 1 32.00 8.5 28.6 18.5 N T Apr-01 Delhaize America Etablissements Delhaize Freres 41.3 07-Sep-2000 6,873 15.94 18.71 1 18.42 17.4 15.6 (1.5) N T
High 40.1 % 44.0 % 33.6 % Mean 16.7 32.7 14.5 Median 16.7 33.1 17.2
Low 1.6 15.6 (1.5)
Source: SDC, company filings and other publicly available information
Transaction Analysis 75

Goldman Sachs
Cross Ownership
Francis and James
Francis
Rank Investor Name Position % O/S
1 Fidelity Mgmt. & Research 44,589,431 4.22
2 Marsico Capital 28,248,512 2.68
3 Capital Guardian Trust 20,563,293 1.95
4 T. Rowe Price 17,784,494 1.68
5 Capital Research & Mgmt. 17,500,000 1.66
6 AllianceBerstein 16,030,000 1.52
7 Wellington Mgmt. 15,892,746 1.51
8 Barclays Global 15,306,210 1.45
9 Jennison Associates 10,821,503 1.03
10 ClearBridge Advisors 9,981,191 0.95
11 Vanguard Group 9,056,406 0.86
12 Delaware Inv. Advisors 8,647,746 0.82
13 TIAA-CREF Asset Mgmt. 7,342,446 0.70
14 Sands Capital Mgmt. 7,071,391 0.67
15 Janus Capital Mgmt. 6,755,964 0.64
16 State Street Global Advisors 6,431,203 0.61
17 TCW Asset Mgmt. 5,343,048 0.51
18 Goldman Sachs Asset Mgmt. 4,844,682 0.46
19 Victory Capital Mgmt. 4,350,299 0.41
20 CalPERS 4,116,863 0.39
21 Credit Suisse Asset Mgmt. 4,095,333 0.39
22 Walter Scott & Partners 3,951,407 0.37
23 GE Asset Management 3,788,047 0.36
24 Thornburg Investment Mgmt. 3,447,184 0.33
25 Bellevue Asset Mgmt. 3,192,536 0.30 Top 25 Shareholders 279,151,935 26.47 % James Owned by Francis Shareholders 15.93
James
Rank Investor Name Position % O/S
1 Capital Research Global Investors 39,455,934 5.62
2 Capital World Investors 35,448,720 5.05
3 UBS Global Asset Management 10,081,923 1.44
4 Fidelity Management & Research 9,875,416 1.41
5 Fidelity International Limited 7,619,891 1.08
6 MFS Investment Management 6,317,050 0.90
7 Norges Bank 6,063,122 0.86
8 Wellington Management Company, LLP 5,618,392 0.80
9 Janus Capital Management LLC 5,606,545 0.80
10 Thornburg Investment Management, Inc. 4,557,902 0.65
11 PRIMECAP Management Company 4,286,500 0.61
12 Credit Suisse Asset Management 4,143,527 0.59
13 OppenheimerFunds, Inc. 4,103,719 0.58
14 Allianz Global Investors 3,681,678 0.52
15 Barclays Global Investors, N.A. 3,340,461 0.48
16 Schroder Investment Management Ltd. 3,260,764 0.46
17 Vanguard Group, Inc. 2,988,639 0.43
18 Pictet Asset Management Ltd. 2,937,432 0.42
19 Pioneer Investment Management Ltd. 2,900,784 0.41
20 Artisan Partners Limited Partnership 2,709,550 0.39
21 T. Rowe Price Associates, Inc. 2,566,268 0.37
22 Swisscanto Asset Management AG 2,357,348 0.34
23 AllianceBernstein L.P. 2,251,869 0.32
24 William Blair & Company, L.L.C. 2,108,543 0.30
25 Northern Cross Investments Limited 2,080,510 0.30 Top 25 Shareholders 176,362,487 25.13
% Francis owned by James Shareholders 13.87
Source: Thomson Research as of latest filings (James data) and Management as of 07-Aug-2008 (Francis data)
Transaction Analysis 76

Goldman Sachs
VI. Key Considerations and Next Steps
Key Considerations and Next Steps 77

Goldman Sachs
Discussion Topics for Tactics and Next Steps
? Response to the Proposal
? Timing considerations
? Communication themes
? Interaction with investors
? Other tactics
? Drafting of the Press Release
Key Considerations and Next Steps 78
Goldman Sachs
Appendix A: Weighted Average Cost of Capital Analysis
Weighted Average Cost of Capital Analysis 79
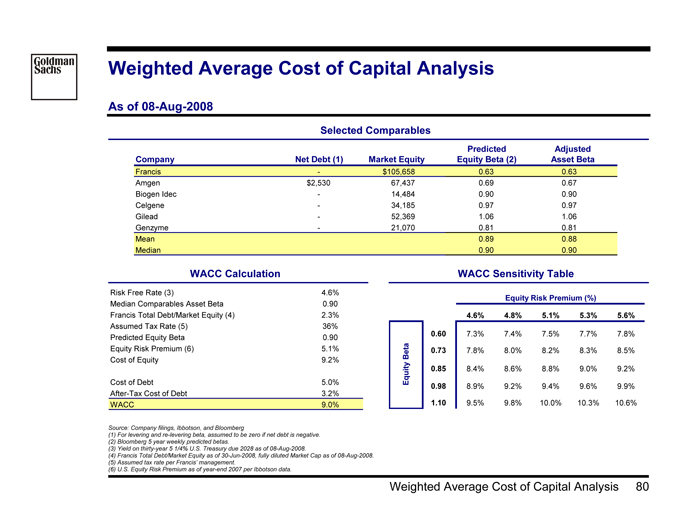
Goldman Sachs
Weighted Average Cost of Capital Analysis
As of 08-Aug -2008
Selected Comparables
Predicted Adjusted Company Net Debt (1) Market Equity Equity Beta (2) Asset Beta
Francis—$105,658 0.63 0.63 Amgen $2,530 67,437 0.69 0.67 Biogen Idec—14,484 0.90 0.90 Celgene—34,185 0.97 0.97 Gilead—52,369 1.06 1.06 Genzyme—21,070 0.81 0.81 Mean 0.89 0.88
Median 0.90 0.90
WACC Calculation WACC Sensitivity Table
Risk Free Rate (3) 4.6%
Equity Risk Premium (%)
Median Comparables Asset Beta 0.90
Francis Total Debt/Market Equity (4) 2.3% 4.58% 4.6% 4.8% 5.1% 5.3% 5.6% Assumed Tax Rate (5) 36% 0.60 7.3% 7.4% 7.5% 7.7% 7.8% Predicted Equity Beta 0.90 Equity Risk Premium (6) 5.1% Beta 0.73 7.8% 8.0% 8.2% 8.3% 8.5% Cost of Equity 9.2% 0.85 8.4% 8.6% 8.8% 9.0% 9.2% Cost of Debt 5.0% Equity After-Tax Cost of Debt 3.2% 0.98 8.9% 9.2% 9.4% 9.6% 9.9% WACC 9.0% 1.10 9.5% 9.8% 10.0% 10.3% 10.6%
Source: Company filings, Ibbotson, and Bloomberg
(1) For levering and re-levering beta, assumed to be zero if net debt is negative. (2) Bloomberg 5 year weekly predicted betas. (3) Yield on thirty-year 5 1/4% U.S. Treasury due 2028 as of 08-Aug-2008.
(4) Francis Total Debt/Market Equity as of 30-Jun-2008, fully diluted Market Cap as of 08-Aug-2008. (5) Assumed tax rate per Francis’ management.
(6) U.S. Equity Risk Premium as of year-end 2007 per Ibbotson data.
Weighted Average Cost of Capital Analysis 80

Goldman Sachs
Bloomberg Adjusted Betas
Five Year Weekly
1.30 1.20 1.10
Betas 1.00 Adjusted 0.90 0.80
Bloomberg 0.70 0.60
0.50
0.40
+ 0.15 0.63—0.15
+ 0.12
0.69
+ 0.12
+ 0.20
0.90
- 0.20
+ 0.17
0.97
- 0.17
+ 0.14
1.06
- 0.14
+ 0.12
0.81
- 0.12
Francis Amgen Biogen Idec Celgene Gilead Genzyme
Five Year Weekly as of 05-Aug-2008
Source: Bloomberg as of 05-Aug-2008
Weighted Average Cost of Capital Analysis 81

Goldman Sachs
Appendix B: Outlook for CHF / USD

Goldman Sachs
Swiss Exchange Rate
CHF / USD Last Two Years
1.35 1.30 1.25 1.20 1.15 1.10 1.05 1.00 0.95
Aug-2006 Nov-2006 Feb-2007 Jun-2007 Sep-2007 Dec-2007 Apr-2008 Jul-2008
Daily from 08-Aug-2006 to 08-Aug-2008
Metric CHF/USD
Units CHF Spot 1.08 High 1.28 Low 0.99 Vol (%) 9.38
1.08
(CHF) Price
CHF/USD
Source: FactSet as of 08-Aug-2008
Outlook for CHF / USD 83
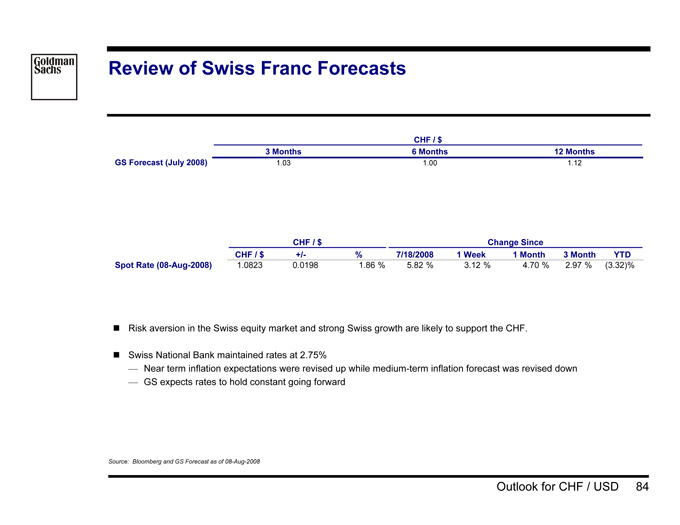
Goldman Sachs
Review of Swiss Franc Forecasts
CHF / $
3 Months 6 Months 12 Months GS Forecast (July 2008) 1.03 1.00 1.12
CHF / $ Change Since
CHF / $ +/- % 7/18/2008 1 Week 1 Month 3 Month YTD Spot Rate (08-Aug-2008) 1.0823 0.0198 1.86 % 5.82 % 3.12 % 4.70 % 2.97 % (3.32)%
? Risk aversion in the Swiss equity market and strong Swiss growth are likely to support the CHF.
? Swiss National Bank maintained rates at 2.75%
— Near term inflation expectations were revised up while medium -term inflation forecast was revised down
— GS expects rates to hold constant going forward
Source: Bloomberg and GS Forecast as of 08-Aug-2008
Outlook for CHF / USD 84
Goldman Sachs
Appendix C: Precedent Case Studies

Goldman Sachs
APP Pharmaceuticals’ Sale to Fresenius
Goldman Sachs Acted as Financial Advisor to APP Pharmaceuticals Announced on 07-Jul-2008
Transaction Highlights
? On 07-Jul-2008, APP Pharmaceuticals and Fresenius announced a definitive agreement for Fresenius to acquire APP
? Fresenius will acquire the outstanding common stock of APP in a transaction valued at up to $5.6bn, consisting of:
— $23.00 in cash per share
— Up to $6.00 per share in Contingent Value Rights (CVR) if the Company meets certain EBITDA targets over 2008-2010
— Assumption of approximately $1.0bn in outstanding debt
? Fresenius plans to maintain APP as its North American headquarters for its infusion therapies and nutrition business
? Dr. Patrick Soon-Shiong, current APP Chairman and majority owner, will join the Board of the new subsidiary
? Goldman Sachs and Lazard Frères advised APP; Deutsche Bank advised Fresenius
Transaction Statistics
Upfront Cash Including CVR¹ Equity Value per Share $ 23.00 $ 29.00
% Premium to 03-Jul ($17.82) 29.1% 62.7%
% Premium to 1 Month Avg ($14.20) 61.9% 104.2%
Equity Value $ 3,723 $ 3,723
Net Debt 938 938 Max. CVR Payout—971
Enterprise Value 4,661 5,633
LTM Revenue (31-Mar)
7.1 x 8.6 x Multiple LTM EBITDA (31-Mar) 18.2 22.0
Overview of APP Pharmaceuticals
? APP is the largest North American pure-play
2007A Revenue hospital -based generic injectables company Oncology — Products across the following four therapeutic
8%
Anesthetic & categories Analgesic
Heparin — Received over 80 cumulative ANDA approvals
30%
7%
— Numerous product candidates under development
? Maintains strong relationships with the largest GPOs in the US
? APP has become a critical worldwide supplier of Anti-Infective heparin, a blood thinner necessary in many Critical Care, surgeries, blood transfusions and dialysis
30% ex. Heparin
procedures, following a Q1 2008 recall by the
25%
major supplier due to contamination
? Based in Schaumburg, IL with ~1,400 employees
Strategic Rationale
? Strengthens Fresenius’ intravenous drug business
— Broadens Fresenius’ injectible portfolio into complimentary therapeutic areas
— Enhances Fresenius’ vertical integration in the generic injectible market
? Provides entry and platform to Fresenius in the strategically important US market
? Utilizes Fresenius’ international sales and marketing organization to commercialize APP’s products outside the US
1 Source: Public filings, press release The CVR payment is expected to occur on 30-Jun-2011 and will be freely tradeable on an established exchange in the intervening period.
PRIVATE AND CONFIDENTIAL . This document is being sent to you for your information only as an investment banking client of Goldman Sachs and should not be forwarded outside of your organization and should not be used as a basis for trading in the securities described. This document does not constitute an offer to sell the securities described or a solicitation of proxies or votes
Precedent Case Studies 86
Goldman Sachs
Novartis Acquires 77% Stake in Alcon from Nestlé
Goldman Sachs Acted As Exclusive Financial Advisor to Novartis
Transaction Overview
? On 07-Apr-2008, Novartis and Nestlé announced a two-step agreement regarding Nestlé’s 77% stake in Alcon, the world’s largest eye care company
? Step 1: Novartis acquires a 25% stake in Alcon from Nestlé for $143.18 per share (3 months volume weighted average price), or c. $11bn in total
? Optional Step 2:
— Novartis has the right to call Nestlé’s remaining 52% stake in Alcon for a fixed price of $181 per share, or c. $28bn in total
— Nestlé has the right to put its remaining 52% stake in Alcon to Novartis at a premium of 20.5% to Alcon’s share price at the time of exercise, but not higher than $181 per share
— Either option can be exercised between 1-Jan-2010 and 31-Jul-2011
? Following completion of Step 1, Novartis will have a representative on Alcon’s Board of Directors
? Alcon and Novartis will remain separate and independent companies
? No obligation of Novartis to buy out Alcon’s free float shareholders
Overview of Alcon
? Alcon is the world’s largest eye care company
? It operates through three product categories: Surgical (medical devices and products for ophthalmic surgery); Pharmaceuticals (medicines for eye diseases and conditions); and Consumer (contact lens care, OTC dry eye drops, ocular vitamins)
? Broad geographical presence, with more than 52% of 2007 sales generated outside the U.S. and strong emerging markets growth
? Revenues totalled $5.6bn in 2007 and translated into $1.9bn operating income (33.6% margin)
— Since its IPO in 2002, Alcon has increased revenues by 13% p.a. and operating income by 22% p.a.
? Alcon was acquired by Nestlé in 1978; a minority position was listed on the NYSE in 2002, Nestlé keeping a 77% majority stake to date
1 Based on IBES EPS forecast for Alcon of $6.29 for 2008 and $8.01 for 2010.
2 Premium calculated based on closing price of $148.44 as of 04-Apr-2008 (Source: Bloomberg) Source: Company Filings, Press Release, Bloomberg
Transaction Rationale
? Unique opportunity to acquire world leader in a rapidly growing market segment
— Clear No. 1 in eye care
— Eye care one of the fastest growing specialty therapeutic segments
— Growth drivers: Aging population, emerging markets and innovation
? Novartis and Alcon: Complementary eye care businesses
— Geographic strengths
— Portfolios for front-of-the-eye and back-of-the-eye diseases
— Manufacturing and distribution skills
— Potential for eventual cost synergies
Deal Statistics
Price / Share Value P/E1 Premium 2 Step 1 $143.18 $11bn 22.8x (‘08) (3.5)% Step 2 Up to $181 Up to $28bn Up to 22.6x (‘10) NA
Alcon Share Price Development from IPO to Announcement
$160 Performance until 4-Apr-08 (%) $140 Since IPO 349.8% $148.44 Last 2 Years 41.5% (USD) $120 Last 1 Year 11.3% Last 3 Months 5.8% $100 IPO on 20-Mar-2002 Offer Price Price: $33.00 $80 $60
Closing $40 $20
Mar-2002 Jun-2003 Aug-2004 Nov-2005 Jan-2007 Apr-2008
Precedent Case Studies 87

Goldman Sachs
Ventana’s Sale to James
Goldman Sachs Acted as Advisor to Ventana 21-Jan-2008
Situation Overview
1 25-Jun-2007 James announces a hostile bid at $75 per share
2 26-Jun-2007 James commences tender offer; Ventana Board recommends shareholders defer action on tender offer
3 20-Jul-2007 Ventana announces 2Q earnings and provides initial guidance for 2008 and 2009. The Company also provides a detailed strategic plan indicating a strong case for higher value, raising 2008 EPS guidance by 29%
4 17-Aug-2007 Ventana resolves Danaher and Cytologix litigation
5 05-Sep-2007 Ventana announces its acquisition of Spring Bioscience and raises guidance by $0.05 and $0.09 for 2008 and 2009, respectively
6 13-Nov-2007 Ventana enters into confidentiality agreement with James to allow due diligence
7 05-Dec-2007 James announces its intention to seek election of directors to Ventana’s Board of Directors and to make certain other proposals at the 2008 annual meeting of stockholders
8 21-Jan-2008 Ventana and James reach definitive agreement in which James will pay $89.50 per share in cash for all the outstanding shares of Ventana for a total transaction value of $3.4 billion.
$100
Final $89.50 per Share Offer $90
5
7
8 $80 3 6
2 4 (USD) Initial $75.00 per Price $70 Share Offer Closing $60 $50
1
$40
$30
Mar-2007 May-2007 Jun-2007 Aug-2007 Oct-2007 Nov-2007 Jan-2008
1 Premiums calculated with reference to undisturbed stock price as of 25-Jun-2007 ($51.74) . 2 Multiples based on Management projections of EBITDA and GAAP EPS.
Strategic Rationale
? Enhances James’ position as the world’s leading, fully-integrated, personalized healthcare company
— Ventana broadens James’ diagnostic offerings and enhances James’ world leadership in in vitro diagnostic systems and oncology medicine
— James’ strong oncology drug portfolio, combined with full diagnostics capabilities uniquely positions James to lead in personalized medicine
? Unique strategic fit with James Diagnostic provides significant opportunities for further value creation
— Ventana’s tissue-based diagnostic technologies complement James’ serum-based screening tools, creating a continuum of care in the diagnostic process
— Histopathology market is ~$1bn, growing to an estimated $1.6bn market in 2011
— Need for test automation and increasing demand for cancer therapies requiring companion diagnostics
Overview of Ventana
? Ventana develops instrument/reagent systems that automate slide preparation and staining in clinical histology and drug discovery laboratories
— Tissue processing, primary staining, Advanced staining, and automated image analysis
— Products used to accelerate the discovery of new drug targets and evaluate the safety of new drug compounds.
? Leader in tissue-based diagnostics, with a large installed base in pathology labs and strong U.S. presence
Transaction Statistics
Price Per Share: $89.50 Equity Consideration: $3.4bn Premium to Initial Offer: 19%
Final Offer ($89.50) Initial Offer ($75.00) 1 Premium to:
Day (25-Jun-2007) 73.0 % 45.0 % Month Avg. 71.5 43.7 Year Avg. 102.3 69.5
2 Multiple to:
2008 EBITDA 25.6 x 21.3 x 2009 EBITDA 18.7 15.5 2008 EPS 45.8 38.4
2009 EPS 32.3 27.0
Precedent Case Studies 88

Goldman Sachs
Novartis Acquires Chiron for $5.3bn
Goldman Sachs Acted As Exclusive Financial Advisor to Novartis 03-Apr-2006
Business Description
? Diverse biotechnology company with three key businesses
— Vaccines (2005A Sales: $602)
— Blood Testing (2005A Sales: $556)
— Biopharmaceuticals (2005A Sales: $629)
? Founded in 1981, Chiron was one of the first companies to sequence HIV and HCV
— Technology led to development of its blood screening business and subsequent work on HBV led to development of vaccines businesses
? Entered drug discovery business in 1991 with acquisition of Cetus and subsequent acquisitions of Pathogenesis (2000) and Matrix (2002)
? Expanded vaccines business via 2003 acquisition of PowderJect
? Headquartered in Emeryville, CA; 5,762 employees
Chiron’s Share Price Reaction
$50 35,000
Final Offer Accepted by Shareholders = $48 $48 30,000
(USD) $46 Initial Offer Accepted by Chiron Board = $45 25,000 $44 Price 20,000 $42 Volume Market Initial Offer = $40 15,000 $40 (000) Closing $38 10,000 $36 5,000
$34 0 Aug-2005 Sep-2005 Nov-2005 Jan-2006 Mar-2006
Daily from 1-Aug-2005 to 19-Apr-2006
Volume Chiron
Transaction Rationale
? Acquisition provides Novartis with attractive growth platforms in the dynamic vaccines market and in a rapidly growing molecular diagnostic business
? Biopharmaceutical activities to be integrated into the Novartis Pharma drugs business
? Annual cost synergies of $200 million within three years
? “Our plan is to turn around the Chiron vaccines business, which will require investments in R&D and manufacturing to increase quality and capacity, so that we can better meet customer demand and address public health needs. Together with the dynamically growing diagnostics business, vaccines will form a new division, while biopharmaceuticals will be integrated into the existing pharmaceuticals business of Novartis,” Dr. Daniel Vasella, Chairman and CEO, Novartis AG
Transaction Highlights
? In 1994, Novartis purchased 49.9% of Chiron for $1.7 billion
? On 01-Sep-2005, Novartis proposed a purchase of the remaining stake for $40 per share in cash or a 9.8% premium to the previous day’s close
? On 31-Oct-2005, Novartis increased its offer to $45 per share or approximately $5.1 billion in cash
— Represented a 23% premium over the unaffected price of $36.44, Chiron’s share price on the last trading day (31-Aug-2005) before Novartis made its initial offer
? Between Dec-2005 and Jan-2006 Chiron’s largest shareholders (excluding Novartis) CAM North America and ValueAct announced they would vote against the transaction
? On 29-Mar-2006, ISS recommended to vote against the merger
? On 03-Apr-2006, Novartis increased its offer to $48 per share and was subsequently approved by shareholders on 19-Apr-2006 Offer Price $48.00 Premium to Unaffected Close ($36.44 on 31-Aug-2005) 31.7% Consideration ($bn) $5.3 LTM Revenue Multiple 2.9x
Precedent Case Studies 89

Goldman Sachs
Shire Pharmaceuticals Acquires TKT for $1.6bn
Goldman Sachs Served as Exclusive Financial Advisor to Shire
21-April-2005
Transkaryotic Therapies Business Overview
? TKT, based in Cambridge, MA, is a biopharmaceutical company focused on the development of pharmaceutical products for the treatment of rare diseases, particularly focused on enzyme replacement therapies
? Two approved products:
— Replagal (fabry disease) – Marketed in 34 countries ex-U.S.
— Dynepo (kidney disease associated anemia) – European launch 1H 2006
? Two late-stage clinical product candidates:
— I2S (hunter disease) – Phase III, data expected June 2005
— GA-GCB (gaucher disease) – Phase I/II, data expected 2H 2005
? Other expected near term milestones:
— Dynepo Phase III Oncology data – 1H 2005
— Replagal approval in Japan – End 2005
Transkaryotic Therapies’ Key Products
? Replagal : An enzyme replacement therapy product currently approved and marketed to treat patients with Fabry disease in 34 countries outside the U.S., of which the majority are in Europe. Sales of REPLAGAL reached $77 million in 2004. Current market is estimated to be $190 million in Western Europe
? Dynepo : An erythropoietin used for the treatment of kidney disease -related anemia. Shire will gain the European rights and is well placed to leverage its existing Fosrenol® sales force in Europe to help Dynepo gain market share following its expected launch in Europe in 2006
? I2S: An enzyme replacement therapy currently in Phase III of development for the treatment of Hunter Syndrome. The product has gained fast track status in the U.S. Assuming the results of the Phase III trial are positive, I2S is expected to launch in 2006. Shire estimates the market is approximately $300 million worldwide, of which U.S. and EU are of equal size at approximately 40% each
? GA-GCB: A glucocerebrosidase currently in Phase I/II of development for the treatment of Gaucher disease, which is anticipated to be introduced in 2008. The total worldwide estimated market at December 2004 was approximately $840
Transaction Rationale
? Strong strategic and business fit
— Focus on specialist physicians
— Leverages Shire’s European and U.S. commercial infrastructure
— Leverages Shire’s experience in renal and hematology
— Relatively low risk development pipeline: enzyme -related drugs have a high success rate in reaching the market
? Adds two approved products, REPLAGAL and DYNEPO, and two late- stage clinical development products, Iduronate 2 sulfatase (I2S) and GA-GCB
? Attractive market dynamics
— Enzyme replacement therapy (ERT) market—orphan drug status available
— Areas of high unmet medical need and limited number of competitors
? Expected to significantly enhance Shire’s medium and long-term product sales and earnings per share (EPS) growth
? TKT’s capabilities and skill-sets expected to bring significant value to the combined organization Transaction Highlights
? On 21-April-2005, Shire signed a definitive agreement to acquire TKT in an all cash transaction valued at $37 per share or approximately $1.6bn
? Closing of the transaction is subject to Hart-Scott-Rodino clearance, approval of TKT’s and Shire’s shareholders and other customary conditions
? Warburg Pincus & Co. and certain of its affiliates, which together beneficially own approximately 14% of the outstanding shares of the common stock of TKT, have agreed, pursuant to a voting agreement with Shire, that they will vote all their shares in favor of the acquisition agreement 0ffer Price $37.00 Premium to Previous Close ($30.44) 21.6% Premium to 1-Month Average Price ($25.77) 43.6% Equity Consideration ($bn) $1.6bn Levered Consideration ($bn) $1.4bn
Precedent Case Studies 90