Exhibit (c)(5)

Confidential
Goldman Sachs
Discussion Materials for Francis Special Committee
Goldman, Sachs & Co.
10-Dec-2008

Confidential
Goldman Sachs
Table of Contents
I. Summary Overview II. Updated Financial Analysis A. Public Markets Perspective
B. Present Value of Future Stock Price Analysis C. Discounted Cash Flow Analysis D. Transaction-Related Financial Analysis III. Credit Market Considerations and Transaction Analysis A. Credit Market Considerations B. Transaction Analysis IV. Anticipating Next Steps Appendix A: Supplementary Materials

Confidential
Goldman Sachs
I. Summary Overview
Summary Overview 1

Confidential
Goldman Sachs
Discussion Topics
Factors to consider in assessing an appropriate response during the next interaction with Greenhill
— Fundamental value
— Stock price trading levels
— Alternative courses of action
— Investor perspectives
Impact of the current market environment on our discussion
— Credit markets and financing capabilities
Communication strategy for 12-Dec meeting
Anticipation of next steps and reaction from James
Summary Overview 2

Confidential
Goldman Sachs
Project Nobel Market Tracker
Change From 1 Day Prior Change Since
05-Dec-2008 18-Jul-2008 1 Week 1 Month 3 Month YTD
Francis $74.38 $0.73 1.0 % (9.1)% (2.9)% (11.4)% (23.0)% 10.4 % BTK 606.71 31.57 5.5 (23.7) 1.8 (8.3) (24.4) (23.0) S&P 500 876.07 30.85 3.6 (30.5) (2.3) (8.1) (29.5) (39.5) AMEX Pharmaceutical Index 257.29 7.65 3.1 (16.0) 0.9 (2.0) (14.6) (23.6)
James CHF164.70 (CHF1.20) (0.7)% (8.3)% (3.1)% (1.8)% (10.2)% (14.2)% Swiss Exchange 5,530.84 (118.30) (2.1) (19.0) (4.9) (10.5) (20.7) (33.5) FTSE 350 Pharma & Biotech 7,910.66 74.73 1.0 4.4 5.8 (0.3) (4.4) 0.6 James (ADR) $68.15 $0.24 0.4 (22.6) (2.2) (3.2) (17.1) (21.1)
Currency Exchange Rate (CHF / $) 1.2203 0.0249 2.08 % 19.31 % 0.55 % 5.38 % 9.07 % 9.00 %
James announced bid to James Francis
125% acquire Francis for $89 Offer Price Francis Trading Volume 50 120% Francis announced 115% Francis announced Phase III study RIBBON 1 study met its 40 of Avastin C-08 trial will continue primary endpoint (mm) 110% Francis announced that it $89/share has formed a Special 30 Price Francis announced the appointment 105% Committee to evaluate Francis announced that James' of Morgan Sheng, M.D., Ph.D., to Volume James' offer $89 proposal substantially 100% Vice President, Neuroscience Indexed undervalues the company 20 95% Trading
3 Month Avg Vol: 5.8mm (8.3)%
90% 10 Daily (9.1)%
85%
80% 0
18-Jul-2008 31-Jul-2008 13-Aug-2008 26-Aug-2008 9-Sep-2008 22-Sep-2008 3-Oct-2008 16-Oct-2008 29-Oct-2008 11-Nov-2008 24-Nov-2008
Source: FactSet as of 05-Dec-2008
Summary Overview 3
Confidential
Goldman Sachs
II. Updated Financial Analysis
Updated Financial Analysis 4

Confidential
Goldman Sachs
Financial Analysis Framework
Price Per Share Range
Standalone $ / Share Transaction-related $ / Share
DCF Present Value
Multiples
+2015 of Future Stock Synergies Tax Benefits Analysis -ESO Price
Long-term Precedent James Inter- Long-term Long-term Discount +2015 Short-term Forward P/E Comparable Growth Transaction Estimated Company IP Projections Rate -ESO Projections Multiples Companies Rate Synergies Synergies Loan Offshoring
Discount Rate Implied
Upsides / Loan
WACC Exit Tax-Rate Downsides Amount Multiples
Investor Perspectives
Sellside Analyst Perspectives
Updated Financial Analysis 5
Confidential
Goldman Sachs
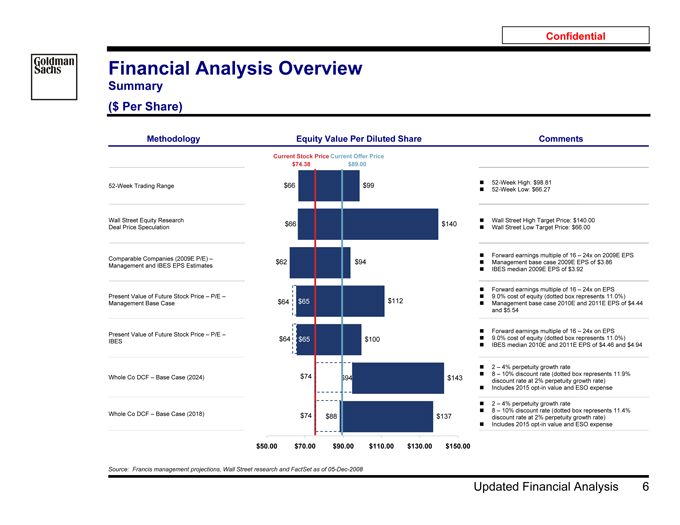
Financial Analysis Overview
Summary
($ Per Share)
Methodology Equity Value Per Diluted Share Comments
Current Stock Price Current Offer Price $74.38 $89.00
$66 $99 52-Week High: $98.81
52-Week Trading Range
52-Week Low: $66.27
Wall Street Equity Research ? Wall Street High Target Price: $140.00
$66 $140
Deal Price Speculation Wall Street Low Target Price: $66.00
Forward earnings multiple of 16 – 24x on 2009E EPS
Comparable Companies (2009E P/E) –
$62 $94 Management base case 2009E EPS of $3.86 Management and IBES EPS Estimates
IBES median 2009E EPS of $3.92
? Forward earnings multiple of 16 – 24x on EPS
Present Value of Future Stock Price – P/E – ? 9.0% cost of equity (dotted box represents 11.0%) Management Base Case $64 $65 $112 ? Management base case 2010E and 2011E EPS of $4.44 and $5.54
? Forward earnings multiple of 16 – 24x on EPS
Present Value of Future Stock Price – P/E –
$64 $65 $100 ? 9.0% cost of equity (dotted box represents 11.0%) IBES
? IBES median 2010E and 2011E EPS of $4.46 and $4.94
? 2 – 4% perpetuity growth rate
$74 ? 8 – 10% discount rate (dotted box represents 11.9% Whole Co DCF – Base Case (2024) $94 $143 discount rate at 2% perpetuity growth rate)
? Includes 2015 opt-in value and ESO expense
? 2 – 4% perpetuity growth rate
? 8 – 10% discount rate (dotted box represents 11.4% Whole Co DCF – Base Case (2018) $74 $88 $137 discount rate at 2% perpetuity growth rate)
? Includes 2015 opt-in value and ESO expense $50.00 $70.00 $90.00 $110.00 $130.00 $150.00
Source: Francis management projections, Wall Street research and FactSet as of 05-Dec-2008
Updated Financial Analysis 6

Confidential
Goldman Sachs
A. Public Markets Perspective
Public Markets Perspective 7

Confidential
Goldman Sachs
Relative Stock Price Performance History
Francis vs Large Cap Biotech, Large Pharma and S&P 500 Index
5 Years 1 Year
310% 160% 280% 140% 250%
131.2% 120% Price 220% Price
12.2%
190% 100%
Indexed 160% 73.3% Indexed 80% (11.1%) 130% (24.9%)
60% 100% 4.7%
(41.0%) 70% (17.5%) 40% Dec- Aug- May- Jan- Oct- Jun- Mar- Nov- Dec- Jan- Mar- May- Jun- Aug- Oct- Dec-2003 2004 2005 2006 2006 2007 2008 2008 2007 2008 2008 2008 2008 2008 2008 2008
Daily from 05-Dec-2003 to 05-Dec-2008 Daily from 05-Dec-2007 to 05-Dec-2008
6 Months Since Offer
140% 130% 120% 120% 110%
1.7% 100% Price 100%Price
(8.1%) 90% (9.1%) 80% (13.1%) (12.2%) 80% Indexed Indexed 70% (13.3%) 60% 60% (30.5%) (37.6%)
40% 50%
5-Jun- 1-Jul- 27-Jul- 22-Aug- 17-Sep- 13-Oct- 8-Nov- 4-Dec- 18-Jul- 7-Aug- 27-Aug- 16-Sep- 6-Oct- 26-Oct- 15-Nov- 5-Dec-2008 2008 2008 2008 2008 2008 2008 2008 2008 2008 2008 2008 2008 2008 2008 2008
Daily from 05-Jun-2008 to 05-Dec-2008 Daily from 18-Jul-2008 to 05-Dec-2008
Francis Large Cap Biotech ¹ Large Pharma ² S&P 500 Index
1 Source: FactSet as of 05-Dec-2008
2 Large Cap Biotech Composite includes: Amgen, Biogen Idec, Celgene, Genzyme and Gilead.
Large Pharma Composite includes: Abbott, AstraZeneca, Bayer, Bristol-Myers Squibb, Eli Lilly, GSK, JNJ, Merck, Novartis, Novo Nordisk, Pfizer, Sanofi-Aventis, Schering-Plough and Wyeth.
Public Markets Perspective 8

Confidential
Goldman Sachs
Comparison of Public Trading Multiples
Francis vs. Large Cap Biotech and Large Pharma
2009 P/E (Current)
22.7 x Median = 13.8x 23.5 x Median = 9.5x Median = 10.2x
20.9 x
20.0 x
19.0 x
17.6 x
13.8 x 14.3 x
12.5 x 12.7 x
12.2 x 11.2 x 11.3 x 11.1 x
10.6 x
9.6 x 9.3 x 9.3 x 9.2 x
8.1 x 7.6 x 7.5 x
6.6 x 7.1 x
Francis Francis Francis (1 Amgen Biogen IdecCelgene Genzyme Gilead Abbott Bristol- Eli Lilly Johnson & Merck Pfizer Schering- Wyeth James AstraZeneca Bayer GSK Merck KGaANovartis Novo Sanofi-(Current) (Offer) Day Prior to Myers Johnson Plough Nordisk Aventis Offer) Squibb
2009 P/E (As of 18-Jul-2008)
Median = 16.7x Median = 11.9x Median = 11.7x
30.5 x
22.7 x
20.9 x 21.5 x
16.7 x 18.1 x
16.4 x 15.8 x
14.3 x
12.8 x 13.5 x 13.4 x
12.4 x 11.9 x
11.4 x 11.2 x 11.5 x 11.5 x
11.8 x
10.4 x 9.3 x
7.2 x 7.9 x
Francis Francis (1 Amgen Biogen IdecCelgene Genzyme Gilead Abbott Bristol- Eli Lilly Johnson & Merck Pfizer Schering- Wyeth James AstraZeneca Bayer GSK Merck KGaANovartis Novo Sanofi-(Offer) Day Prior to Myers Johnson Plough Nordisk Aventis Offer) Squibb
Large Cap Biotech U.S. Large Pharma Europe Large Pharma
Source: IBES median estimates as of 05-Dec-2008 and 18-Jul-2008
Public Markets Perspective 9

Confidential
Goldman Sachs
Evolution of Analyst Estimates
Francis Last Five Years
Dec-2003 Dec-2004 Dec-2005 Dec-2006 Dec-2007
$7.00 $110
$74.38
$6.00
$5.49 2012E
$90
$5.00 $5.00
2011E $4.46 USD) 2010E
$4.00 $3.92 (USD)
(in 2009E
$70 Price
$3.43
Estimate $3.00 2008E $2.94 Closing
EPS 2007A
$2.00 $2.23
2006A $50
$1.28
$1.00 2005A
$0.83 $0.60 2004A 2003A
$0.00 $30 Dec-2003 Dec-2004 Dec-2005 Dec-2006 Dec-2007
Monthly from 31-Dec-2003 to 05-Dec-2008
2003 2004 2005 2006 2007 2008 2009 2010 2011 2012 Francis
Source: FactSet and IBES median estimates as of 05-Dec-2008
Note: IBES median estimates exclude stock based compensation expense
Public Markets Perspective 10
Confidential
Goldman Sachs
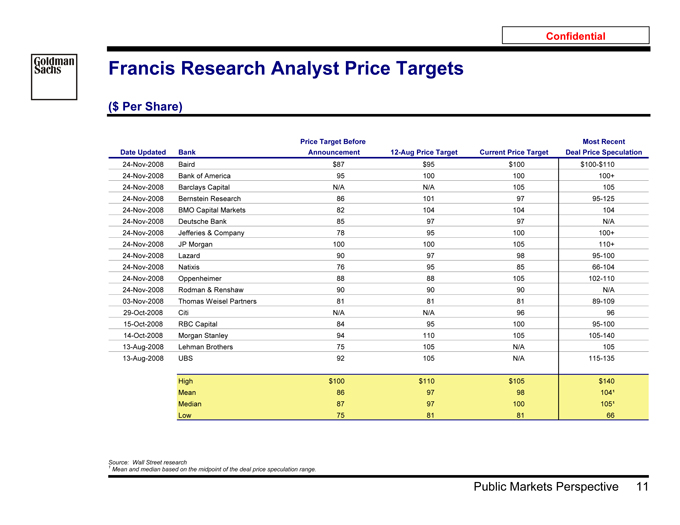
Francis Research Analyst Price Targets
($ Per Share)
Price Target Before Most Recent Date Updated Bank Announcement 12-Aug Price Target Current Price Target Deal Price Speculation
24-Nov-2008 Baird $87 $95 $100 $100-$110
24-Nov-2008 Bank of America 95 100 100 100+
24-Nov-2008 Barclays Capital N/A N/A 105 105
24-Nov-2008 Bernstein Research 86 101 97 95-125
24-Nov-2008 BMO Capital Markets 82 104 104 104
24-Nov-2008 Deutsche Bank 85 97 97 N/A
24-Nov-2008 Jefferies & Company 78 95 100 100+
24-Nov-2008 JP Morgan 100 100 105 110+
24-Nov-2008 Lazard 90 97 98 95-100
24-Nov-2008 Natixis 76 95 85 66-104
24-Nov-2008 Oppenheimer 88 88 105 102-110
24-Nov-2008 Rodman & Renshaw 90 90 90 N/A
03-Nov-2008 Thomas Weisel Partners 81 81 81 89-109
29-Oct-2008 Citi N/A N/A 96 96
15-Oct-2008 RBC Capital 84 95 100 95-100
14-Oct-2008 Morgan Stanley 94 110 105 105-140
13-Aug-2008 Lehman Brothers 75 105 N/A 105
13-Aug-2008 UBS 92 105 N/A 115-135
High $100 $110 $105 $140 Mean 86 97 98 104¹ Median 87 97 100 105¹ Low 75 81 81 66
Source: 1 Wall Street research
Mean and median based on the midpoint of the deal price speculation range.
Public Markets Perspective 11

Confidential
Goldman Sachs
Analysis at Various Prices
($ in millions, except per share data)
Price Per Share $89.00 $95.00 $100.00 $105.00 $110.00 $115.00 $120.00 $125.00 $130.00 Total Equity Consideration—Diluted $95,657 $102,431 $108,079 $113,727 $119,376 $125,024 $130,673 $136,321 $141,970 Net Debt (2008E) (6,000) (6,000) (6,000) (6,000) (6,000) (6,000) (6,000) (6,000) (6,000) Enterprise Value $89,657 $96,431 $102,079 $107,727 $113,376 $119,024 $124,673 $130,321 $135,970
Premium / (Discount) to Stock Price
Current (as of 05-Dec-2008) $74.38 19.7 % 27.7 % 34.4 % 41.2 % 47.9 % 54.6 % 61.3 % 68.1 % 74.8 %
18-Jul-2008 Close Price 81.82 8.8 16.1 22.2 28.3 34.4 40.6 46.7 52.8 58.9
1 Day Prior 81.16 9.7 17.1 23.2 29.4 35.5 41.7 47.9 54.0 60.2
30-Day Average 75.96 17.2 25.1 31.7 38.2 44.8 51.4 58.0 64.6 71.2
6-Month Average 74.05 20.2 28.3 35.0 41.8 48.5 55.3 62.0 68.8 75.6
Revenue
LTM $12,680 7.1 x 7.6 x 8.1 x 8.5 x 8.9 x 9.4 x 9.8 x 10.3 x 10.7 x 2008E 13,403 6.7 7.2 7.6 8.0 8.5 8.9 9.3 9.7 10.1 2009E 14,118 6.4 6.8 7.2 7.6 8.0 8.4 8.8 9.2 9.6 2010E 15,099 5.9 6.4 6.8 7.1 7.5 7.9 8.3 8.6 9.0 2011E 16,648 5.4 5.8 6.1 6.5 6.8 7.1 7.5 7.8 8.2
EBITDA
LTM $5,283 17.0 x 18.3 x 19.3 x 20.4 x 21.5 x 22.5 x 23.6 x 24.7 x 25.7 x 2008E 6,251 14.3 15.4 16.3 17.2 18.1 19.0 19.9 20.8 21.8 2009E 6,676 13.4 14.4 15.3 16.1 17.0 17.8 18.7 19.5 20.4 2010E 7,144 12.5 13.5 14.3 15.1 15.9 16.7 17.5 18.2 19.0 2011E 8,021 11.2 12.0 12.7 13.4 14.1 14.8 15.5 16.2 17.0
EPS
LTM $2.86 31.1 x 33.2 x 35.0 x 36.7 x 38.5 x 40.2 x 42.0 x 43.7 x 45.5 x 2008E 3.43 26.0 27.7 29.2 30.6 32.1 33.6 35.0 36.5 37.9 2009E 3.85 23.1 24.7 26.0 27.3 28.6 29.9 31.2 32.5 33.8 2010E 4.43 20.1 21.4 22.6 23.7 24.8 26.0 27.1 28.2 29.3 2011E 5.56 16.0 17.1 18.0 18.9 19.8 20.7 21.6 22.5 23.4
Source: Francis management projections and public company filings
Public Markets Perspective 12

Confidential
Goldman Sachs
Francis Top Institutional Shareholders Composition
As of 31-Oct-2008 % O/S As of 28-Nov-2008 % O/S of Minority
James Holdings 587,189,380 55.81% Hedge Fund / Arb 10.60% Non-James Holding 464,844,149 44.19% Non-Hedge Fund / Arb 89.40% Shares Outstanding 1,052,033,529
Top Shareholders (Sorted by "Current Position")
Position 18-Jul-2008 Current Current Current (Based on 30-Jun-2008 Position Position Change vs. Change vs. %O/S of %O/S of Rank Institution Name 13F Filings) 07-Nov-2008 14-Nov-2008 07-Nov-2008 18-Jul-2008 Avg. Cost Total Minority
1 Fidelity Mgmt. & Research 41,806,660 50,865,067 50,865,067 0 9,058,407 $65.50 4.83% 10.94%
2 Marsico Capital 27,214,792 25,632,703 25,632,703 0 (1,582,089) 42.37 2.44 5.51
3 AllianceBerstein (AXA) 17,112,145 20,383,000 20,583,000 200,000 3,470,855 74.12 1.96 4.43
4 T. Rowe Price 17,256,456 16,932,149 16,932,149 0 (324,307) 75.79 1.61 3.64
5 Capital Guardian Trust 19,376,837 15,024,240 14,524,240 (500,000) (4,852,597) 78.21 1.38 3.12
6 Barclays Global 15,306,210 14,219,787 14,219,787 0 (1,086,423) 54.51 1.35 3.06
7 Jennison Associates 10,779,817 12,179,817 12,179,817 0 1,400,000 68.79 1.16 2.62
8 Vanguard Group 9,056,406 9,109,061 9,109,061 0 52,655 59.28 0.87 1.96
9 Capital Research & Mgmt. 15,350,000 8,021,900 8,021,900 0 (7,328,100) 65.05 0.76 1.73
10 Goldman Sachs Asset Mgmt. 7,215,425 7,685,325 7,685,325 0 469,900 77.89 0.73 1.65
11 Delaware Inv. Advisors 9,135,610 7,319,756 7,319,756 0 (1,815,854) 78.18 0.70 1.57
12 Waddell & Reed 2,382,370 7,211,504 7,211,504 0 4,829,134 85.76 0.69 1.55
13 State Street Global Advisors 6,597,198 7,196,948 7,196,948 0 599,750 49.72 0.68 1.55
14 ClearBridge Advisors 9,712,089 7,120,773 7,120,773 0 (2,591,316) 33.14 0.68 1.53
15 TIAA-CREF Asset Mgmt. 7,281,457 5,465,793 5,465,793 0 (1,815,664) 65.24 0.52 1.18
16 Wellington Mgmt. 15,892,746 4,236,952 4,236,952 0 (11,655,794) 67.45 0.40 0.91
17 TCW Asset Mgmt. 4,703,902 4,001,837 4,001,837 0 (702,065) 39.65 0.38 0.86
18 CalPERS 4,116,863 3,750,023 3,750,023 0 (366,840) 48.53 0.36 0.81
19 Walter Scott & Partners 4,070,591 3,689,052 3,689,052 0 (381,539) 69.76 0.35 0.79
20 GE Asset Management 3,788,047 3,548,906 3,548,906 0 (239,141) 76.95 0.34 0.76
21 Paulson & Co. 0 3,424,400 3,424,400 0 3,424,400 88.93 0.33 0.74
22 Orbimed Advisors 2,716,480 3,280,680 3,280,680 0 564,200 53.54 0.31 0.71
23 RCM Capital Mgmt. 3,060,596 3,260,596 3,260,596 0 200,000 68.72 0.31 0.70
24 Janus Capital Mgmt. 7,796,255 3,239,280 3,239,280 0 (4,556,975) 48.86 0.31 0.70
25 Citigroup Global Markets (US) 1,806,259 3,145,282 3,145,282 0 1,339,023 89.38 0.30 0.68 Top 25 Institutional Shareholders 263,535,211 249,944,831 249,644,831 (300,000) (13,890,380) $65.01 23.73% 53.71%
Source: Bloom Partners
Note: Capital Research Global and Capital World Investors have been combined. Walter Scott & Partners is Scotland-based investment firm.
Public Markets Perspective 13

Confidential
Goldman Sachs
B. Present Value of Future Stock Price Analysis
Present Value of Future Stock Price Analysis 14

Confidential
Goldman Sachs
Present Value of Future Stock Price Analysis
Management Case, Adjusted for Share Repurchases at One Year Forward at 20.0x P/E1
($ Per Share)
Future Stock Price (Undiscounted) Present Value at 9.0% Cost of Equity
16.0x 20.0x 24.0x 16.0x 20.0x 24.0x $140 $132.92 $140
$120 $120 $111.88 $106.55 $110.77 $100 $100 $97.76 $93.23 $92.65 $88.80 $88.61 $92.65 $81.46
$80 $80 $74.59 $77.21 $77.21 $71.04
$60 $60 $65.17 $61.77 $61.77
$40 $40
2009E 2010E 2011E 2009E 2010E 2011E
2009E 2010E 2011E 2008E—2011E CAGR ³ EPS (Mgmt Forecast)¹ $ 3.86 $ 4.44 $ 5.54 17.0% IBES $ 3.92 $ 4.46 $ 4.94² 12.6%
1 Source: Francis management projections and IBES
Assumes cash of $3.6bn, $7.2bn and $5.5bn for 2009E-2011E, respectively, used to repurchase shares based on management projections. Price of share repurchase assumed to be 20.0x one year 2 forward EPS per Management Case ($88.80, $110.77 and $133.43 for 2009E-2011E, respectively).
3 2011E IBES mean based on selected composite from Wall Street research. 2008E EPS per Francis management.
Present Value of Future Stock Price Analysis 15

Confidential
Goldman Sachs
C. Discounted Cash Flow Analysis
Discounted Cash Flow Analysis 16
Confidential
Goldman Sachs
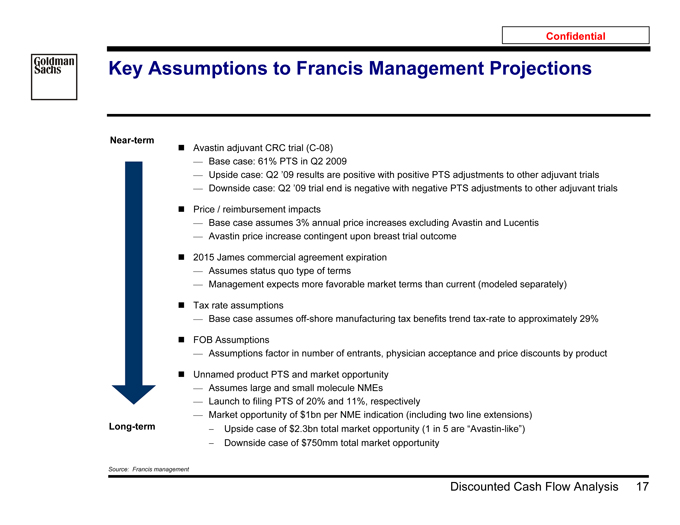
Key Assumptions to Francis Management Projections
Near-term
Avastin adjuvant CRC trial (C-08)
— Base case: 61% PTS in Q2 2009
— Upside case: Q2 ’09 results are positive with positive PTS adjustments to other adjuvant trials
— Downside case: Q2 ’09 trial end is negative with negative PTS adjustments to other adjuvant trials
Price / reimbursement impacts
— Base case assumes 3% annual price increases excluding Avastin and Lucentis
— Avastin price increase contingent upon breast trial outcome
2015 James commercial agreement expiration
— Assumes status quo type of terms
— Management expects more favorable market terms than current (modeled separately)
Tax rate assumptions
— Base case assumes off-shore manufacturing tax benefits trend tax-rate to approximately 29%
FOB Assumptions
— Assumptions factor in number of entrants, physician acceptance and price discounts by product
Unnamed product PTS and market opportunity
— Assumes large and small molecule NMEs
— Launch to filing PTS of 20% and 11%, respectively
— Market opportunity of $1bn per NME indication (including two line extensions) Long-term Upside case of $2.3bn total market opportunity (1 in 5 are “Avastin-like”)
Downside case of $750mm total market opportunity
Source: Francis management
Discounted Cash Flow Analysis 17

Confidential
Goldman Sachs
Francis Forecasted Product Sales Breakdown
($ in millions)
Avastin Base Case Rituxan Herceptin Lucentis Other Marketed Named Product Pipeline Unnamed Base Case Non-Product
$40,000
$33,803 $31,551 $35,000 $28,732 $26,230 262 $24,995 313 $24,279 $30,000 $23,408 365 mm) $20,764
( $ $19,004
393 $18,061 $25,000 433 Sales $17,349 436 $16,083 429 16,656 19,968 $14,860 2,702 13,477 418 4,956 7,624 10,479 Product $20,000 $13,690 395 1,246 $12,345 260 126 357 566 3,548 Total 27 331 2,575 $11,244 25 128 973 1,678 449 4,337 157 56 224 $15,000 3,974
22 3,932 3,869 3,865 4,015 4,877 3,852
3 3,131 5,083
85 3,780
5,296 5,343 3,581 1,594 1,741 1,880 2,005 2,112
- 1,438 5,314 3,146 1,702 3,057 $10,000 2,782 1,370 1,748 1,740 1,796 1,311 1,755 1,867 1,948 1,849 3,019 1,126 1,711 1,162 966 1,663 2,649 2,242 1,722 1,337 1,176 3,004 2,979 1,585 2,759 1,085 1,556 2,261 1,470 2,725 932 1,024 872 849 2,635 1,343 831 $5,000 2,575 2,664 1,240 1,184 970 1,139 7,302 7,519 923 895 872 6,521 6,880 7,103 6,783 5,036 5,900 5,262 3,736 4,303 4,011 3,556 3,378 3,332 3,156 $0
2009E 2010E 2011E 2012E 2013E 2014E 2015E 2016E 2017E 2018E 2019E 2020E 2021E 2022E 2023E 2024E
Source: Francis management projections
Discounted Cash Flow Analysis 18

Confidential
Goldman Sachs
Discounted Cash Flow Analysis of Francis
Key Assumptions
Discounted Cash Flow analysis provides a framework to evaluate the ongoing performance of the business, but should be considered in a broader context of approaches (e.g., comparable transaction and trading multiples)
Projections from 2009 to 2024 provided by Francis Management as of 16-Nov-2008 and provided to James and Greenhill
— Projections by product were provided for Avastin, Rituxan, Herceptin, Lucentis as well as for the unnamed pipeline
Assumes 1,052mm basic shares outstanding, as of 31-Oct-2008
— Current options outstanding included in share count by the treasury stock method
— Options schedule provided by Francis management as of 14-Nov-2008
Financial Sensitivity Analysis:
— Discount rates evaluated using a range of 8.0%—10.0% based on WACC analysis
— Terminal value evaluated using perpetuity growth rate method using a range of 2.0%—4.0%
Implied P/E terminal multiple also evaluated
Assumes 2008E net cash of $6 billion
Assumes capital expenditures of $820mm and depreciation of $661mm in 2024 terminal year, per Company management (assumes normalization in the terminal year)
Assumes an adjusted tax rate applied to operating income that trends from 36% in 2009 to 29% in 2024 terminal year per management forecast
Assumes cash flows discounted back to 01-Jan-2009 using mid-year convention
Analysis includes impact of:
— Future employee stock options expense: Assumes $328mm in after-tax ESO expense in 2009 with a 3.0% inflation rate and a range of 2.0%—4.0% of growth in headcount into perpetuity
— Changes to James / Francis marketing agreement post 2015 per management guidance on expected market rate terms: “Marked to market” 2015 opt-in value derived from discounting projected product royalties from large and small molecules in the unnamed pipeline beginning in 2016, with a range of 2.0%—4.0% perpetuity growth rate
Discounted Cash Flow Analysis 19
Confidential
Goldman Sachs
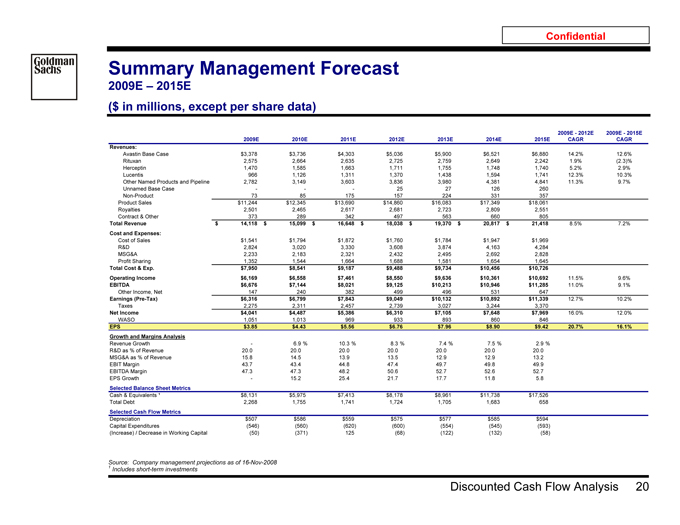
Summary Management Forecast
2009E – 2015E
($ in millions, except per share data)
2009E—2012E 2009E—2015E 2009E 2010E 2011E 2012E 2013E 2014E 2015E CAGR CAGR
Revenues:
Avastin Base Case $3,378 $3,736 $4,303 $5,036 $5,900 $6,521 $6,880 14.2% 12.6% Rituxan 2,575 2,664 2,635 2,725 2,759 2,649 2,242 1.9% (2.3)% Herceptin 1,470 1,585 1,663 1,711 1,755 1,748 1,740 5.2% 2.9% Lucentis 966 1,126 1,311 1,370 1,438 1,594 1,741 12.3% 10.3% Other Named Products and Pipeline 2,782 3,149 3,603 3,836 3,980 4,381 4,841 11.3% 9.7% Unnamed Base Case — — — 25 27 126 260 Non-Product 73 85 175 157 224 331 357 Product Sales $11,244 $12,345 $13,690 $14,860 $16,083 $17,349 $18,061 Royalties 2,501 2,465 2,617 2,681 2,723 2,809 2,551 Contract & Other 373 289 342 497 563 660 805
Total Revenue $ 14,118 $ 15,099 $ 16,648 $ 18,038 $ 19,370 $ 20,817 $ 21,418 8.5% 7.2% Cost and Expenses:
Cost of Sales $1,541 $1,794 $1,872 $1,760 $1,784 $1,947 $1,969 R&D 2,824 3,020 3,330 3,608 3,874 4,163 4,284 MSG&A 2,233 2,183 2,321 2,432 2,495 2,692 2,828 Profit Sharing 1,352 1,544 1,664 1,688 1,581 1,654 1,645
Total Cost & Exp. $7,950 $8,541 $9,187 $9,488 $9,734 $10,456 $10,726
Operating Income $6,169 $6,558 $7,461 $8,550 $9,636 $10,361 $10,692 11.5% 9.6% EBITDA $6,676 $7,144 $8,021 $9,125 $10,213 $10,946 $11,285 11.0% 9.1% Other Income, Net 147 240 382 499 496 531 647
Earnings (Pre-Tax) $6,316 $6,799 $7,843 $9,049 $10,132 $10,892 $11,339 12.7% 10.2% Taxes 2,275 2,311 2,457 2,739 3,027 3,244 3,370
Net Income $4,041 $4,487 $5,386 $6,310 $7,105 $7,648 $7,969 16.0% 12.0% WASO 1,051 1,013 969 933 893 860 846
EPS $3.85 $4.43 $5.56 $6.76 $7.96 $8.90 $9.42 20.7% 16.1% Growth and Margins Analysis
Revenue Growth—6.9 % 10.3 % 8.3 % 7.4 % 7.5 % 2.9 % R&D as % of Revenue 20.0 20.0 20.0 20.0 20.0 20.0 20.0 MSG&A as % of Revenue 15.8 14.5 13.9 13.5 12.9 12.9 13.2 EBIT Margin 43.7 43.4 44.8 47.4 49.7 49.8 49.9 EBITDA Margin 47.3 47.3 48.2 50.6 52.7 52.6 52.7 EPS Growth—15.2 25.4 21.7 17.7 11.8 5.8
Selected Balance Sheet Metrics
Cash & Equivalents ¹ $8,131 $5,975 $7,413 $8,178 $8,961 $11,738 $17,526 Total Debt 2,268 1,755 1,741 1,724 1,705 1,683 658
Selected Cash Flow Metrics
Depreciation $507 $586 $559 $575 $577 $585 $594 Capital Expenditures (546) (560) (620) (600) (554) (545) (593) (Increase) / Decrease in Working Capital (50) (371) 125 (68) (122) (132) (58)
1 Source: Company management projections as of 16-Nov-2008 Includes short-term investments
Discounted Cash Flow Analysis 20
Confidential
Goldman Sachs
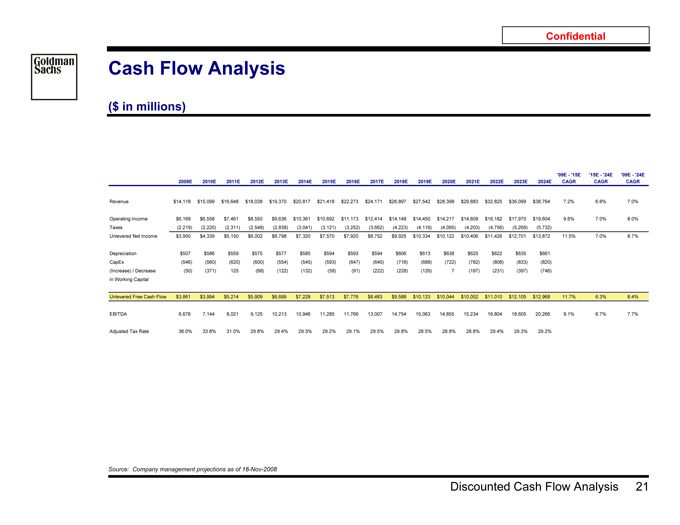
Cash Flow Analysis
($ in millions)
'09E—'15E '15E—'24E '09E—'24E 2009E 2010E 2011E 2012E 2013E 2014E 2015E 2016E 2017E 2018E 2019E 2020E 2021E 2022E 2023E 2024E CAGR CAGR CAGR
Revenue $14,118 $15,099 $16,648 $18,038 $19,370 $20,817 $21,418 $22,273 $24,171 $26,897 $27,542 $28,398 $29,883 $32,825 $36,099 $38,764 7.2% 6.8% 7.0%
Operating Income $6,169 $6,558 $7,461 $8,550 $9,636 $10,361 $10,692 $11,173 $12,414 $14,148 $14,450 $14,217 $14,609 $16,182 $17,970 $19,604 9.6% 7.0% 8.0% Taxes (2,219) (2,220) (2,311) (2,548) (2,838) (3,041) (3,121) (3,252) (3,662) (4,223) (4,116) (4,095) (4,203) (4,756) (5,269) (5,732) Unlevered Net Income $3,950 $4,339 $5,150 $6,002 $6,798 $7,320 $7,570 $7,920 $8,752 $9,925 $10,334 $10,122 $10,406 $11,426 $12,701 $13,872 11.5% 7.0% 8.7%
Depreciation $507 $586 $559 $575 $577 $585 $594 $593 $594 $606 $613 $638 $625 $622 $635 $661 CapEx (546) (560) (620) (600) (554) (545) (593) (647) (640) (716) (688) (722) (782) (808) (833) (820) (Increase) / Decrease (50) (371) 125 (68) (122) (132) (58) (91) (222) (228) (126) 7 (197) (231) (397) (746) in Working Capital
Unlevered Free Cash Flow $3,861 $3,994 $5,214 $5,909 $6,699 $7,228 $7,513 $7,776 $8,483 $9,588 $10,133 $10,044 $10,052 $11,010 $12,105 $12,968 11.7% 6.3% 8.4% EBITDA 6,676 7,144 8,021 9,125 10,213 10,946 11,285 11,766 13,007 14,754 15,063 14,855 15,234 16,804 18,605 20,266 9.1% 6.7% 7.7% Adjusted Tax Rate 36.0% 33.8% 31.0% 29.8% 29.4% 29.3% 29.2% 29.1% 29.5% 29.8% 28.5% 28.8% 28.8% 29.4% 29.3% 29.2%
Source: Company management projections as of 16-Nov-2008
Discounted Cash Flow Analysis 21

Confidential
Goldman Sachs
Illustrative Components of Discounted Cash Flow Analysis
Base Case: Assumes 3.0% Perpetuity Growth Rate and 9.0% Discount Rate
($ Per Share)
$140
$118.03 ($10.36) $120 $7.53 $115.20
$100
Share $80 Per Value $60 $40
$20
$0
Base Case DCF Capitalized ESO Expense 2015 Opt-In Value Total Value
Source: Financial projections and scenarios per Francis management as of 16-Nov-2008
Note: Assumes 1,052mm basic shares outstanding, as of 31-Oct-2008. Fully diluted shares outstanding calculated using treasury stock method based on options schedule provided by Francis management. Assumes net cash of $6 billion and cash flows discounted to 01-Jan-2009
Discounted Cash Flow Analysis 22
Confidential
Goldman Sachs
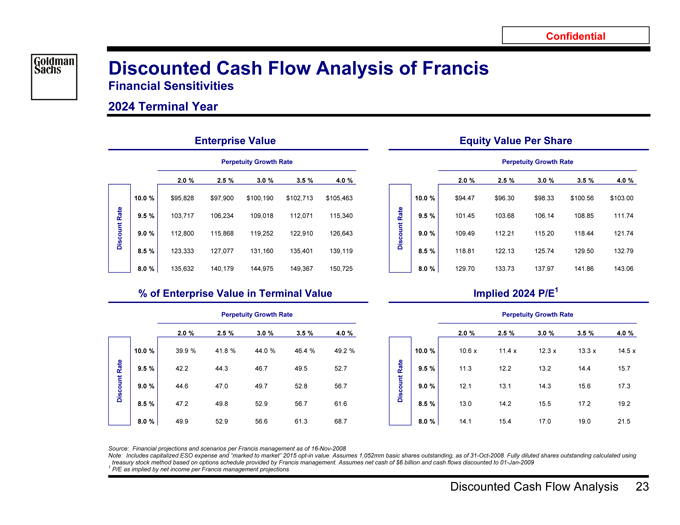
Discounted Cash Flow Analysis of Francis
Financial Sensitivities 2024 Terminal Year
Enterprise Value Equity Value Per Share
Perpetuity Growth Rate Perpetuity Growth Rate
2.0 % 2.5 % 3.0 % 3.5 % 4.0 % $ 115.2 2.0 % 2.5 % 3.0 % 3.5 % 4.0 %
10.0 % $95,828 $97,900 $100,190 $102,713 $105,463 10.0 % $94.47 $96.30 $98.33 $100.56 $103.00 Rate 9.5 % 103,717 106,234 109,018 112,071 115,340 Rate 9.5 % 101.45 103.68 106.14 108.85 111.74 Discount 9.0 % 112,800 115,868 119,252 122,910 126,643 Discount 9.0 % 109.49 112.21 115.20 118.44 121.74 8.5 % 123,333 127,077 131,160 135,401 139,119 8.5 % 118.81 122.13 125.74 129.50 132.79
8.0 % 135,632 140,179 144,975 149,367 150,725 8.0 % 129.70 133.73 137.97 141.86 143.06
% of Enterprise Value in Terminal Value Implied 2024 P/E1
Perpetuity Growth Rate Perpetuity Growth Rate $ 49.7 2.0 % 2.5 % 3.0 % 3.5 % 4.0 % $ 14.3 2.0 % 2.5 % 3.0 % 3.5 % 4.0 %
10.0 % 39.9 % 41.8 % 44.0 % 46.4 % 49.2 % 10.0 % 10.6 x 11.4 x 12.3 x 13.3 x 14.5 x Rate 9.5 % 42.2 44.3 46.7 49.5 52.7 Rate 9.5 % 11.3 12.2 13.2 14.4 15.7 Discount 9.0 % 44.6 47.0 49.7 52.8 56.7 Discount 9.0 % 12.1 13.1 14.3 15.6 17.3 8.5 % 47.2 49.8 52.9 56.7 61.6 8.5 % 13.0 14.2 15.5 17.2 19.2
8.0 % 49.9 52.9 56.6 61.3 68.7 8.0 % 14.1 15.4 17.0 19.0 21.5
Source: Financial projections and scenarios per Francis management as of 16-Nov-2008
Note: Includes capitalized ESO expense and “marked to market” 2015 opt-in value. Assumes 1,052mm basic shares outstanding, as of 31-Oct-2008. Fully diluted shares outstanding calculated using 1 treasury stock method based on options schedule provided by Francis management. Assumes net cash of $6 billion and cash flows discounted to 01-Jan-2009 P/E as implied by net income per Francis management projections
Discounted Cash Flow Analysis 23

Confidential
Goldman Sachs
Discounted Cash Flow Analysis of Francis
Financial Sensitivities 2018 Terminal Year
Enterprise Value Equity Value Per Share
Perpetuity Growth Rate Perpetuity Growth Rate
2.0 % 2.5 % 3.0 % 3.5 % 4.0 % $ 108.6 2.0 % 2.5 % 3.0 % 3.5 % 4.0 %
10.0 % $88,445 $91,365 $94,624 $98,265 $102,319 10.0 % $87.93 $90.51 $93.40 $96.62 $100.21 Rate 9.5 % 95,338 98,772 102,614 106,902 111,629 Rate 9.5 % 94.03 97.07 100.47 104.27 108.45 Discount 9.0 % 103,246 107,302 111,839 116,859 122,226 Discount 9.0 % 101.03 104.62 108.64 113.08 117.83 8.5 % 112,379 117,182 122,516 128,257 133,809 8.5 % 109.12 113.37 118.09 123.17 128.09
8.0 % 122,995 128,665 134,808 140,846 144,262 8.0 % 118.51 123.53 128.97 134.32 137.34
% of Enterprise Value in Terminal Value Implied 2024 P/E1
Perpetuity Growth Rate Perpetuity Growth Rate $ 65.6 2.0 % 2.5 % 3.0 % 3.5 % 4.0 % $ 16.0 2.0 % 2.5 % 3.0 % 3.5 % 4.0 %
10.0 % 56.5 % 58.7 % 61.0 % 63.5 % 66.4 % 10.0 % 11.9 x 12.8 x 13.8 x 14.9 x 16.2 x Rate 9.5 % 58.4 60.7 63.2 66.1 69.4 Rate 9.5 % 12.7 13.7 14.8 16.1 17.6 Discount 9.0 % 60.4 62.8 65.6 68.9 72.8 Discount 9.0 % 13.6 14.7 16.0 17.5 19.3 8.5 % 62.4 65.1 68.3 72.1 77.2 8.5 % 14.6 15.9 17.4 19.2 21.4
8.0 % 64.5 67.6 71.3 76.2 84.1 8.0 % 15.7 17.3 19.1 21.3 24.1
Source: Financial projections and scenarios per Francis management as of 16-Nov-2008
Note: Includes capitalized ESO expense and “marked to market” 2015 opt-in value. Assumes 1,052mm basic shares outstanding, as of 31-Oct-2008. Fully diluted shares outstanding calculated using 1 treasury stock method based on options schedule provided by Francis management. Assumes net cash of $6 billion and cash flows discounted to 01-Jan-2009 P/E as implied by net income per Francis management projections
Discounted Cash Flow Analysis 24

Confidential
Goldman Sachs
2015 Opt-In Valuation Assumptions
Key Assumptions
? Management forecast assumes current James / Francis royalty arrangement remains in place post 2015 with ~15% royalty rate
? Incremental value assumes a market royalty rate of 20% to 30% less the existing 15% royalty rate assumed in the management forecast
? $500M peak for lead indication and $250M peak sales for each line extension
— Ex-U.S. sales equal to 100% of U.S. sales
? 35% marginal tax rate applied to post-2015 royalty revenues
? NMEs per year from 2015-2025 consistent with the management base case
? NMEs post 2025 held constant at 13 NMEs per year
— Sensitivity analysis varies the 13 base case NMEs per year +/- 2 NMEs per year
? Revenues projected to 2060 (beginning in 2022) and discounted to 01-Jan-2009 using mid-year convention
— Discount rate of 8.0 to 10.0%
Incremental Value Per Share Incremental Value Per Share
Royalty Rate Incremental Slots
20% 23% 25% 28% 30% (2.0) (1.0) 0.0 1.0 2.0
10.0 % $2.67 $4.01 $5.35 $6.69 $8.02 10.0 % $3.19 $4.26 $5.35 $7.24 $9.14 Rate 9.5 % 3.16 4.74 6.33 7.91 9.49 Rate 9.5 % 3.78 5.04 6.33 8.48 10.63 Discount 9.0 % 3.77 5.65 7.53 9.42 11.30 Discount 9.0 % 4.51 6.01 7.53 9.99 12.45 8.5 % 4.52 6.78 9.04 11.30 13.56 8.5 % 5.42 7.22 9.04 11.87 14.70
8.0 % 5.48 8.22 10.95 13.69 16.43 8.0 % 6.58 8.75 10.95 14.24 17.52
Source: Company management
Note: Assumes 1,052mm basic shares outstanding, as of 31-Oct-2008. Fully diluted shares outstanding calculated using treasury stock method based on options schedule provided by Francis management.
Discounted Cash Flow Analysis 25
Confidential
Goldman Sachs
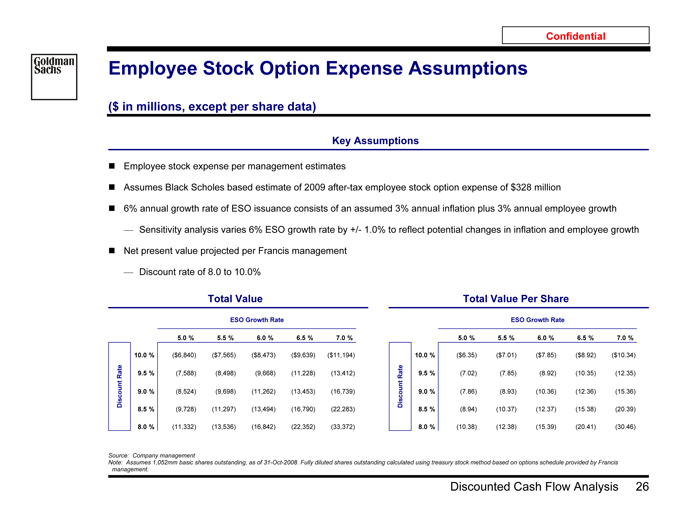
Employee Stock Option Expense Assumptions
($ in millions, except per share data)
Key Assumptions
? Employee stock expense per management estimates
? Assumes Black Scholes based estimate of 2009 after-tax employee stock option expense of $328 million
? 6% annual growth rate of ESO issuance consists of an assumed 3% annual inflation plus 3% annual employee growth
— Sensitivity analysis varies 6% ESO growth rate by +/- 1.0% to reflect potential changes in inflation and employee growth
? Net present value projected per Francis management
— Discount rate of 8.0 to 10.0%
Total Value Total Value Per Share
ESO Growth Rate ESO Growth Rate
####### 5.0 % 5.5 % 6.0 % 6.5 % 7.0 % $ 7.5 5.0 % 5.5 % 6.0 % 6.5 % 7.0 %
10.0 % ($6,840) ($7,565) ($8,473) ($9,639) ($11,194) 10.0 % ($6.35) ($7.01) ($7.85) ($8.92) ($10.34)
Rate 9.5 % (7,588) (8,498) (9,668) (11,228) (13,412) Rate 9.5 % (7.02) (7.85) (8.92) (10.35) (12.35) Discount 9.0 % (8,524) (9,698) (11,262) (13,453) (16,739) Discount 9.0 % (7.86) (8.93) (10.36) (12.36) (15.36) 8.5 % (9,728) (11,297) (13,494) (16,790) (22,283) 8.5 % (8.94) (10.37) (12.37) (15.38) (20.39)
8.0 % (11,332) (13,536) (16,842) (22,352) (33,372) 8.0 % (10.38) (12.38) (15.39) (20.41) (30.46)
Source: Company management
Note: Assumes 1,052mm basic shares outstanding, as of 31-Oct-2008. Fully diluted shares outstanding calculated using treasury stock method based on options schedule provided by Francis management.
Discounted Cash Flow Analysis 26

Confidential
Goldman Sachs
Illustrative Review of Financial Analysis
Sensitivity Analysis
($ Per Share)
Item Methodology Equity Value Per Diluted Share $115 Range of 8% to 10% discount rate and 2% to 4% perpetuity Base Case growth rate ($21) +$28
Scenarios¹
70% PTS for adjuvant lung and breast indications; early
Adjuvant Upside +$6 positive C-08 results in Q2 2009
10% PTS for adjuvant lung and breast indications; negative Adjuvant Downside
C-08 results by Q2 2009 ($11)
Greater market opportunity – one in five future molecules Unnamed Pipeline added to portfolio have an Avastin like sales potential (~$2.3 +$15 Upside billion peak sales)
Unnamed Pipeline Reduced overall market opportunity to $750 million for each
($4) Downside product
-10% to +10% incremental change in volume / total revenue
Volume ($15) +$15 (constant margins)
-10% to +10% incremental change in pricing
Pricing ($22) +$22 (no change in costs)
Follow-on Biologic -20% to +20% incremental follow-on biologic erosion for top ($4) +$4 4 products (constant margins)
$75 $85 $95 $105 $115 $125 $135 $145 $155
1 Source: Francis management projections
Assumes 3.0% perpetuity growth rate and 9.0% discount rate
Discounted Cash Flow Analysis 27
Confidential
Goldman Sachs
D. Transaction-Related Financial Analysis
Transaction-Related Financial Analysis 28

Confidential
Goldman Sachs
Transaction-Related Source of Value
Synergies to James
— James publicly acknowledges $750 to $850 million in synergy opportunity
Precedent transactions show this estimate to be conservative when measured as a percentage of sales and operating expenses
Tax Benefits
— Inter-company loan: James acknowledges using inter-company tax strategies in recent acquisitions to reduce tax leakage
— Long-term tax strategies: Under James’ ownership, Francis can gradually lower the tax rate by moving existing IP and housing new IP in foreign jurisdictions as well as expanding Francis’ current plan to offshore manufacturing activities
The Intangibles – Control versus Ownership
— “Be very careful — we control, but we don't own. And there is, as Bill or Severin pointed out, there is no free exchange of information, of know-how, of intellectual property; all that is today not possible. We are running two parallel organizations. We are running programs that are parallel and perhaps should not be parallel. We are developing the same drugs on the one hand in the United States through an organization; on the other hand, outside of the States through an organization. More and more large company overlaps are being created.” -— Franz Humer, Investor Conference, 22-Jul-2008
Transaction-Related Financial Analysis 29

Confidential
Goldman Sachs
Illustrative Benefits Related to Inter-Company Loan
($ in billions, except per share data)
Potential Inter-Company Loan Benefit
James Swiss parent raises debt in non-U.S. jurisdictions
James parent loans proceeds to its U.S. subsidiary at an arm’s-length rate (e.g., 8%) to fund the buyout consideration (the “inter-company loan”)
The inter-company loan creates tax deductions in the U.S. which enhances after-tax cash flow from Francis’ operations
— Interest on inter-company loan is generally deductible for U.S. tax purposes provided aggregate interest expense does not exceed 50% of taxable EBITDA
— Interest payments should not be subject to U.S. withholding tax under U.S.-Swiss tax treaty
Need to determine whether and at what rate the interest income would be taxable in Switzerland
— Generally, Swiss companies would be subject to tax on interest income at 25% tax rate, although there may be structures to reduce tax liability in Switzerland
Illustrative tax shield assuming $30 billion in new debt:
— ($30bn debt * 8% interest rate * 39% marginal tax rate) = $936mm annual benefit
— If Swiss tax rate on interest income is 25%, net tax savings of $336mm; net benefit even greater if interest income is subject to even lower tax rate in Switzerland or the Netherlands
NPV Benefit of Inter-Company Loan at Various Swiss Tax Rates
Per Total Share Per Minority Share
Inter-Company Loan Amount ($bn) Inter-Company Loan Amount ($bn) $ 9.6 $10.0 $20.0 $30.0 $40.0 $50.0 $ 20.8 $10.0 $20.0 $30.0 $40.0 $50.0
25 % $1.14 $2.29 $3.43 $4.58 $5.72 25 % $2.49 $4.98 $7.47 $9.95 $12.44 Rate 20 % 1.55 3.11 4.66 6.21 7.77 Rate 20 % 3.38 6.75 10.13 13.51 16.89 Tax 15 % 1.96 3.92 5.89 7.85 9.81 Tax 15 % 4.27 8.53 12.80 17.06 21.33
10 % 2.37 4.74 7.11 9.48 11.85 10 % 5.16 10.31 15.47 20.62 25.78 Swiss 5 % 2.78 5.56 8.34 11.12 13.90 Swiss 5 % 6.04 12.09 18.13 24.18 30.22
0 % 3.19 6.38 9.57 12.75 15.94 0 % 6.93 13.87 20.80 27.73 34.66
Note: Assumes 1,087 mm diluted shares outstanding. Assumes James owns 587mm shares and the remainder held by minority shareholders. Assumes 9.0% cost of capital. Assumes James will not pay down transaction debt and U.S. marginal tax rate of 39%.
Transaction-Related Financial Analysis 30
Confidential
Goldman Sachs
Illustrative Benefits Related to Long-Term Tax Strategies
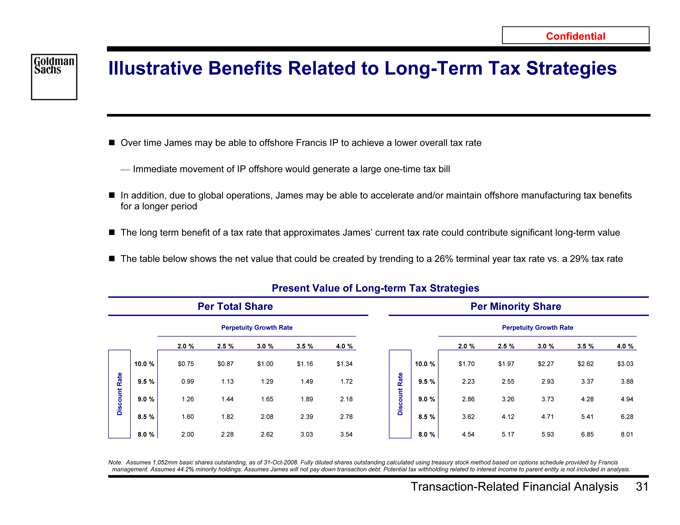
Over time James may be able to offshore Francis IP to achieve a lower overall tax rate
— Immediate movement of IP offshore would generate a large one-time tax bill
In addition, due to global operations, James may be able to accelerate and/or maintain offshore manufacturing tax benefits for a longer period
The long term benefit of a tax rate that approximates James’ current tax rate could contribute significant long-term value
The table below shows the net value that could be created by trending to a 26% terminal year tax rate vs. a 29% tax rate
Present Value of Long-term Tax Strategies
Per Total Share Per Minority Share
Perpetuity Growth Rate Perpetuity Growth Rate
# ##### 2.0 % 2.5 % 3.0 % 3.5 % 4.0 % $ 116.8 2.0 % 2.5 % 3.0 % 3.5 % 4.0 %
10.0 % $0.75 $0.87 $1.00 $1.16 $1.34 10.0 % $1.70 $1.97 $2.27 $2.62 $3.03 Rate 9.5 % 0.99 1.13 1.29 1.49 1.72 Rate 9.5 % 2.23 2.55 2.93 3.37 3.88 Discount 9.0 % 1.26 1.44 1.65 1.89 2.18 Discount 9.0 % 2.86 3.26 3.73 4.28 4.94 8.5 % 1.60 1.82 2.08 2.39 2.78 8.5 % 3.62 4.12 4.71 5.41 6.28
8.0 % 2.00 2.28 2.62 3.03 3.54 8.0 % 4.54 5.17 5.93 6.85 8.01
Note: Assumes 1,052mm basic shares outstanding, as of 31-Oct-2008. Fully diluted shares outstanding calculated using treasury stock method based on options schedule provided by Francis management. Assumes 44.2% minority holdings. Assumes James will not pay down transaction debt. Potential tax withholding related to interest income to parent entity is not included in analysis.
Transaction-Related Financial Analysis 31

Confidential
Goldman Sachs
Synergy Levels in Precedent Pharmaceutical Transactions
($ in millions)
Total Cost Savings as a % of Prior Year Combined Total Announced Announced Transactions Cost Savings ($mm) Pharma Sales R&D + SG&A
James / Francis $750—$850 2.5%—2.8% 4.4%—5.0%
UCB / Schwarz 382 10.8 17.5 AstraZeneca / MedImmune 500 1.8 3.3 Roche / Syntex 825 10.6 21.4 Glaxo / Wellcome 1,165 9.4 19.9 Ciba-Geigy / Sandoz 1,500 7.8 17.7 Pfizer / Warner-Lambert ¹ 1,700 8.1 14.5 Astra / Zeneca 1,900 8.5 14.1 Pharmacia / Upjohn 500 6.7 13.5 Glaxo / SmithKline 1,700 8.1 13.0 AHP / Monsanto ² 1,400 6.2 12.9 Sanofi-Synthelabo / Aventis 1,940 6.1 12.5 Pfizer / Pharmacia 2,500 6.8 11.0 Monsanto / Pharmacia & Upjohn 600 5.7 9.4 AHP / Warner-Lambert ² 1,200 6.9 9.1 High 10.8% 21.4% Mean 7.4 13.6 Median 7.4 13.3 Low 1.8 3.3
1 Source: Publicly available information
2 Represents percentages based on Pharma businesses only. Adjusts for Warner-Lambert’s consumer and confectionary businesses and Pfizer’s animal health and consumer businesses. Deal withdrawn.
Transaction-Related Financial Analysis 32

Confidential
Goldman Sachs
Illustrative Benefits Related to Incremental Synergy Benefits
James has messaged $750—$850mm in synergies
— Precedent transactions indicate synergies could be substantially larger EPS Impact to James
The incremental impact of $100mm of pre-tax synergies is an annual CHF 0.11 per share to James EPS (0.8% of James 2009E EPS)
Present Value of Synergies
Discounted by 8.0%—10.0%, assuming no growth rate
Present Value of Synergies
Per Total Share Per Minority Share
Annual Savings Annual Savings
4.903757 $750 $850 $1,500 $2,250 10.66202 $750 $850 $1,500 $2,250 Capital 10.0 % $4.41 $5.00 $8.83 $13.24 Capital 10.0 % $9.60 $10.88 $19.19 $28.79 of of 9.0 % 4.90 5.56 9.81 14.71 9.0 % 10.66 12.08 21.32 31.99
Cost Cost
8.0 % 5.52 6.25 11.03 16.55 8.0 % 11.99 13.59 23.99 35.98
Note: Assumes 1,087 mm diluted shares outstanding. Assumes James owns 587mm shares and the remainder held by minority shareholders. Synergies taxed at Francis tax rate of approximately 36.0%. EPS benefit to James based on 1.22 CHF : USD exchange rate and 862.6 million James shares outstanding. Percentage change to James EPS based on 2009E Wall Street EPS of CHF 13.23.
Transaction-Related Financial Analysis 33

Confidential
Goldman Sachs
III. Credit Market Considerations and Transaction Analysis
Credit Market Considerations and Transaction Analysis 34

Confidential
Goldman Sachs
A. Credit Market Considerations
Credit Market Considerations 35

Confidential
Goldman Sachs
Current Credit Market Considerations
Financing markets are weak and continue to deteriorate as the financial system and the economy deleverages
— Even investment grade companies face challenges raising capital in this environment
— New issuance of investment grade debt down considerably compared to recent years
Reduced bank capacity creates size constraints for completing large transactions
— Decreased willingness by banks to provide large bridge facilities
— Recent news articles cast doubt on James’ ability to secure a bridge facility
“The sheer size of the jumbo deal would eclipse today's shrinking loan market – a fact which senior banking sources say is putting pressure on James to consider alternative funding options. These could be a combination of loans, bonds, equity and cash.” Reuters, Prospects of $45bn loan for James receding, 30-Nov-2008
However, James and Francis are considered stable, creditworthy companies, which makes it difficult to completely dismiss the ability to finance a deal
— Generate significant cash flow
— Low existing leverage levels
— Healthcare considered a relatively stable sector during economic downturns
Credit Market Considerations 36

Confidential
Goldman Sachs
New Investment Grade Bridge Market Dynamics
Issues for Consideration
Given substantial market dislocation in the bank market, bridge terms for Investment Grade companies have evolved over recent months
In light of bank concerns related to holding large funded bridges on balance sheet for extended periods of time, provisions almost never seen in Investment Grade bridges have become common in “today’s market.” Items include:
— Funding fees to incent borrowers to pre-fund acquisitions in the capital markets
— Duration fees and coupon step-ups to incent borrowers to reduce commitments post funding
— Flex provisions to ensure a successful syndication
Interest rate and structural flex
Coupon of bridge loan representative of actual credit risk, not necessarily existing credit lines
Bridge Facility Fee Components
Type Stage Payable
Commitment Fee ? At time of commitment
Closing / Funding Fee ? At closing and generally on amount funded at Close
Duration Fees ? Paid at the end of each 3 month interval
Can be considered as part of the overall bridge compensation to lenders
Credit Market Considerations 37

Confidential
Goldman Sachs
Investment Grade Bank Market
How Pricing and Terms Have Evolved
Where Are We Where We Were Where We Are Going?
Description: — Bank balance sheets had massive amounts of — Bank balance sheets very constrained — Bank balance sheets begin to repair themselves liquidity with limited balance sheet constraints — Investment grade lending very challenging and — Government equity investments help strengthen
— Investment grade lending commoditized in some cases, not available Tier 1 capital and ultimately will be taken out
— Very aggressive lending competition — Decreased number of market participants entirely coupled with very limited liquidity — Liquidity comes back to Investment grade lending
Bank Lending — Opportunity for banks to develop a relationship — Lend only to close relationship clients with — Continued relationship lending but with focus on Rationale: and cross-sell ancillary businesses justified “off- demonstrated ancillary business and future lender cost of capital market” loans revenue streams — Pricing based on credit risk Pricing / Fees: — Below market drawn spreads which did not — Increased use of market based drawn spreads — RVP pricing and market based drawn spreads reflect borrowers’ true cost of capital including, CDS/CDX based pricing, know as — Upfront fees which reflect cost of capital
— Limited to no upfront fees Relative Value Pricing (“RVP”), which reflects allocation cost of buying protection against the borrower
— Below lenders’ own cost of capital — Upfront fees reflect capital allocation cost — Continuation of lender based drawn spreads to account for high cost of obtaining capital
— Pricing above lenders’ cost of capital and emergence of lender based drawn spreads
Market Disruption — None, besides standard Affected Lender — Emergence of TED spread premiums and other — Structures will include lender cost of capital Clauses: language lender cost of capital adjustments to help adjust adjustment spreads related to dislocation of for dislocation of bank market bank market and funding Tenor: — Revolver: 3 – 5 yr — Revolver: 364-Day — Revolver: 364-Day
— Bridge: 1 – 3 Years — Bridge: 364-Day — Bridge: 364-Day
Terms — Unsecured — Unsecured; case specific flex to security for — Unsecured; case specific flex to security for
— Single covenant bridges bridges
— Ex: Total Debt / Total Cap — One to two covenants — One to two covenants
— Ex: Leverage and / or Coverage Test Ex: Leverage and / or Coverage Test
Credit Market Considerations 38

Confidential
Goldman Sachs
Credit Spreads Remain Elevated and Investment Grade Supply is Down 30% Year-over-Year
New Issuance Volume and Spreads Since September 2008
60 Max Min Avg Curr Systemic Concerns Record Issuance Financial and Economic Distress 625
HVOL 600 84 272 600 Early 2008 saw further Fed intervention with Bear Concerns about the health of financials Index widening as financials Stearns helped restore and the severity of an economic
55 sought liquidity in confidence. New issuance slowdown push spreads wider 575 CDX IG 283 34 113 277 increasingly bearish hit record highs
Index markets
50 525
Initial Crisis Investment Bank
Initial credit crunch- Writedowns
45 precipitated by subprime rumors Second bout of widening- 475 and rating downgrades- full caused by investment bank extent not yet known writedowns and losses 5 .
43 40 425 . 4 40 . 6
1 39 . 35 . 9 38 375 37 0 . 4 1 . .
35 34 34 bn) $ 30 7 . 3 325
( . . 5 3
30 30 31 31 . Spread 7 .
. 8 7 7 27
25 6 . . 275 (bps)
. 2
26 26 26 26 .
. 5 25
24 . 5 0
. 2
20 22 23 . 0 . 225 . 9 22 7
21 22 20 .
. 8
15 9 17 . 8 175 7 . . 16 5
16 . 1 4 . 15 . 2 1 15
. 8 . 0 . . 6
1 14 . 14
. 14 1 2 13 14 14 1 13
. . 13 . . 8 1 . 2
10 12 12 . 8 . 12 7 6 125
11 11 11 . .
0 10 10 10
0 . 6 . 3 . 9 0 . 3 .
9 9 0 0 7 . 8 5 . 2 8
. . 8 . 7 .
8 7 7 . 8 . 8 3 5 . 3
5 . . 9 6 75
6 6 6
2 8 5 . 0 5 . 8 0 4 . 5
. 1 .
. 7 1 . 7 4 3
9 4 8 . . 0 .
3 0 0 . 0 3 3 4
. . . 0 . .
0 3 0 0 2 1 1 25 Jun Jul Aug Sep Oct Nov Dec Jan Feb Mar Apr May Jun Jul Aug Sep Oct Nov Dec 2007 2007 2007 2007 2007 2007 2007 2008 2008 2008 2008 2008 2008 2008 2008 2008 2008 2008 2008 Weekly New Issue Volume HVOL Index CDX Index
Sources: Internal GS; PlotTool
Credit Market Considerations 39

Confidential
Goldman Sachs
B. Transaction Analysis
Transaction Analysis 40

Confidential
Goldman Sachs
Transaction Analysis Assumptions
? Projections based on Wall Street research dated 04-Dec-2008 for James, 16-Oct-2008 for Francis and Francis management projections as of 16-Nov-2008
? Achieves pre-tax synergies of $400 million in 2009E and $800 million in 2010E and 2011E
— Excludes potential costs to achieve synergies
? Three acquisition scenarios shown at various prices: 1) 100% cash transaction; 2) first $40 billion paid with cash
($10 billion in existing cash and $30 billion in incremental debt), with remainder in James stock; and 3) 50% cash and 50% stock mix
— In all scenarios, cash consideration consists of $10 billion in existing cash
— Size of transaction and debt ratings are significant considerations in evaluating cost and capacity for debt
— James shares issued at CHF 164.70 (USD $134.94), closing price as of 05-Dec-2008
? 3.0% opportunity cost of cash
? CHF10 billion minimum cash balance for pro forma company and James projected dividend payments per Wall Street research
— Excess free cash flow used to service debt
? Assumes no amortization of excess purchase price due to ability of James to account for it on the balance sheet directly as a reduction in equity (Francis already consolidated)
? Assumes transaction closes 31-Dec-2008
Transaction Analysis 41

Confidential
Goldman Sachs
Leverage Analysis for James
Pro Forma for the Acquisition of Francis (Figures in millions, except per share data)
Currency Exchange Rate (CHF / $) 1.22
Price Per Share ($) $89.00 $95.00 $100.00 $105.00 $110.00 $115.00 $120.00 $125.00 $130.00 Price Per Share (CHF) CHF 108.62 CHF 115.95 CHF 122.05 CHF 128.15 CHF 134.26 CHF 140.36 CHF 146.46 CHF 152.56 CHF 158.67 Minority Shares (mm) 488 491 494 496 498 500 502 503 505 Equity Consideration—Diluted $43,397 $46,648 $49,360 $52,072 $54,785 $57,497 $60,210 $62,923 $65,635 CHF 52,966 CHF 56,934 CHF 60,244 CHF 63,554 CHF 66,865 CHF 70,176 CHF 73,486 CHF 76,797 CHF 80,108 Existing Cash Used $10,000 $10,000 $10,000 $10,000 $10,000 $10,000 $10,000 $10,000 $10,000 CHF 12,205 CHF 12,205 CHF 12,205 CHF 12,205 CHF 12,205 CHF 12,205 CHF 12,205 CHF 12,205 CHF 12,205 Incremental Financing Need $33,897 $37,148 $39,860 $42,572 $45,285 $47,997 $50,710 $53,423 $56,135 CHF 41,371 CHF 45,339 CHF 48,649 CHF 51,960 CHF 55,270 CHF 58,581 CHF 61,892 CHF 65,202 CHF 68,513
Estimated Average Financing Cost 4.1% 4.2% 5.2% 5.3% 5.7% 7.1% 7.1% 7.1% 7.1%
2008E Pro Forma Credit Profile (CHF mn)
EBITDA CHF 17,162 CHF 17,162 CHF 17,162 CHF 17,162 CHF 17,162 CHF 17,162 CHF 17,162 CHF 17,162 CHF 17,162 CapEx 3,300 3,300 3,300 3,300 3,300 3,300 3,300 3,300 3,300 Total Debt 45,997 49,965 53,275 56,586 59,896 63,207 66,518 69,828 73,139 Total Debt / EBITDA 2.7 x 2.9 x 3.1 x 3.3 x 3.5 x 3.7 x 3.9 x 4.1 x 4.3 x Total Debt / (EBITDA—CapEx) 3.3 3.6 3.8 4.1 4.3 4.6 4.8 5.0 5.3 Net Debt 35,194 39,162 42,472 45,782 49,093 52,404 55,714 59,025 62,336 Net Debt / EBITDA 2.1 x 2.3 x 2.5 x 2.7 x 2.9 x 3.1 x 3.2 x 3.4 x 3.6 x Net Debt / (EBITDA—CapEx) 2.5 2.8 3.1 3.3 3.5 3.8 4.0 4.3 4.5 Total Cash 10,803 10,803 10,803 10,803 10,803 10,803 10,803 10,803 10,803
2009E Pro Forma Credit Profile (CHF mn)
EBITDA CHF 19,505 CHF 19,505 CHF 19,505 CHF 19,505 CHF 19,505 CHF 19,505 CHF 19,505 CHF 19,505 CHF 19,505 CapEx 2,888 2,888 2,888 2,888 2,888 2,888 2,888 2,888 2,888 Total Debt 38,307 42,275 45,585 48,895 52,206 55,517 58,827 62,138 65,449 Total Debt / EBITDA 2.0 x 2.2 x 2.3 x 2.5 x 2.7 x 2.8 x 3.0 x 3.2 x 3.4 x Total Debt / (EBITDA—CapEx) 2.3 2.5 2.7 2.9 3.1 3.3 3.5 3.7 3.9 Net Debt 28,307 32,275 35,585 38,895 42,206 45,517 48,827 52,138 55,449 Net Debt / EBITDA 1.5 x 1.7 x 1.8 x 2.0 x 2.2 x 2.3 x 2.5 x 2.7 x 2.8 x Net Debt / (EBITDA—CapEx) 1.7 1.9 2.1 2.3 2.5 2.7 2.9 3.1 3.3 Total Cash 10,000 10,000 10,000 10,000 10,000 10,000 10,000 10,000 10,000 Preliminary Long-term Credit Rating AA- / A1 AA-,A+ / A1,A2 A+ / A2 A / A3 upside potential A / A3 A- / Baa1 A- / Baa1 BBB+ / Baa2 Potential Notch Downgrade ¹ 0 / 3 1 / 4 1 / 4 2 / 5 2 / 5 3 / 6 3 / 6 4 / 7 Preliminary Short-term Credit Rating A-1+ / P-1 A-1+,A-1 / P-1 A-1 / P-1 <--— A-1 stable / P-1 at risk --—> A-2 / P-2 A-2 / P-2 A-2 / P-2 A-2 / P-2
Source: Francis management projections
1 Note: Assumes debt paydown beginning in 2009 with a minimum CHF10,000 mn cash balance Assumes current Moody’s long-term rating of Aa1, which is under review for possible downgrade.
Transaction Analysis 42

Confidential
Goldman Sachs
Comparison of Illustrative Financing Sources
100% Cash at $89 Per Share (Figures in millions)
Current As of 12-Aug-2008
? Near-term availability of bridge commitment to fund
? Banks willing and able to provide large bridge an all-cash deal is unlikely given continued commitments (InBev, BHP) deterioration of credit markets
Sources Sources
USD CHF USD CHF
Stock Consideration $0 CHF 0 Stock Consideration $0 CHF 0
Francis Cash Used $6,337 CHF 7,734 Francis Cash Used $6,337 CHF 6,859 James Existing Cash Used 3,663 4,471 James Existing Cash Used 3,663 3,964 Total Cash Used $10,000 CHF 12,205 Total Cash Used $10,000 CHF 10,823
Debt Issuance: Debt Issuance:
Commercial Paper @ 1.64% $15,000 CHF 18,308 Commercial Paper @ 2.54% $15,000 CHF 16,235 Bonds ($) @ 6.00% 10,000 12,205 Bonds ($) @ 6.00% 10,000 10,823 Bonds (EUR) @ 6.00% 8,897 10,858 Bonds (EUR) @ 6.25% 5,000 5,412 Term Loan @ 5.17% 0 0 Term Loan @ 4.29% 4,328 4,684 Total Debt Issuance $33,897 CHF 41,371 Total Debt Issuance $34,328 CHF 37,153
Total Sources $43,897 CHF 53,576 Total Sources $44,328 CHF 47,976
Average Financing Cost @ $89 Per Share 4.1% Average Financing Cost @ $89 Per Share 4.3% Average Financing Cost @ $110 Per Share 5.7% Average Financing Cost @ $110 Per Share 5.0%
Note: Assumes $89.00 per share acquisition price. Assumes exchange rate today of 1.22 CHF / 1 USD and exchange rate on 12-Aug of 1.08 CHF / 1 USD
Transaction Analysis 43
Confidential
Goldman Sachs
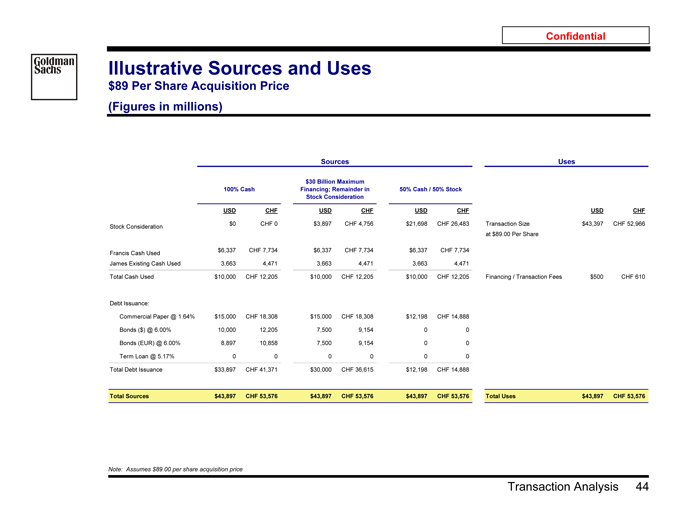
Illustrative Sources and Uses
$89 Per Share Acquisition Price (Figures in millions)
Sources Uses
$30 Billion Maximum
100% Cash Financing; Remainder in 50% Cash / 50% Stock Stock Consideration
USD CHF USD CHF USD CHF USD CHF
$0 CHF 0 $3,897 CHF 4,756 $21,698 CHF 26,483 Transaction Size $43,397 CHF 52,966 Stock Consideration at $89.00 Per Share
$6,337 CHF 7,734 $6,337 CHF 7,734 $6,337 CHF 7,734 Francis Cash Used James Existing Cash Used 3,663 4,471 3,663 4,471 3,663 4,471
Total Cash Used $10,000 CHF 12,205 $10,000 CHF 12,205 $10,000 CHF 12,205 Financing / Transaction Fees $500 CHF 610
Debt Issuance:
Commercial Paper @ 1.64% $15,000 CHF 18,308 $15,000 CHF 18,308 $12,198 CHF 14,888 Bonds ($) @ 6.00% 10,000 12,205 7,500 9,154 0 0 Bonds (EUR) @ 6.00% 8,897 10,858 7,500 9,154 0 0 Term Loan @ 5.17% 0 0 0 0 0 0 Total Debt Issuance $33,897 CHF 41,371 $30,000 CHF 36,615 $12,198 CHF 14,888
Total Sources $43,897 CHF 53,576 $43,897 CHF 53,576 $43,897 CHF 53,576 Total Uses $43,897 CHF 53,576
Note: Assumes $89.00 per share acquisition price
Transaction Analysis 44

Confidential
Goldman Sachs
Illustrative Accretion / (Dilution) Analysis
100% Cash
(Figures in millions, except per share data)
Currency Exchange Rate (CHF / $) 1.22
Price Per Share ($) $89.00 $95.00 $100.00 $105.00 $110.00 $115.00 $120.00 $125.00 $130.00 Price Per Share (CHF) CHF 108.62 CHF 115.95 CHF 122.05 CHF 128.15 CHF 134.26 CHF 140.36 CHF 146.46 CHF 152.56 CHF 158.67 Minority Shares (mm) 488 491 494 496 498 500 502 503 505 Equity Consideration—Diluted $43,397 $46,648 $49,360 $52,072 $54,785 $57,497 $60,210 $62,923 $65,635 CHF 52,966 CHF 56,934 CHF 60,244 CHF 63,554 CHF 66,865 CHF 70,176 CHF 73,486 CHF 76,797 CHF 80,108
Existing Cash Used $10,000 $10,000 $10,000 $10,000 $10,000 $10,000 $10,000 $10,000 $10,000 CHF 12,205 CHF 12,205 CHF 12,205 CHF 12,205 CHF 12,205 CHF 12,205 CHF 12,205 CHF 12,205 CHF 12,205
Incremental Financing Need $33,897 $37,148 $39,860 $42,572 $45,285 $47,997 $50,710 $53,423 $56,135 CHF 41,371 CHF 45,339 CHF 48,649 CHF 51,960 CHF 55,270 CHF 58,581 CHF 61,892 CHF 65,202 CHF 68,513
Estimated Average Financing Cost 4.1% 4.2% 5.2% 5.3% 5.7% 7.1% 7.1% 7.1% 7.1%
% Accretion / (Dilution) to James
2009E (1.8)% (3.9)% (6.9)% (8.4)% (10.7)% (17.3)% (18.3)% (19.8)% (21.4)% 2010E (2.4)% (4.3)% (5.4)% (6.3)% (8.0)% (13.8)% (14.8)% (16.2)% (17.6)% 2011E 1.7% 0.3% (0.8)% (1.2)% (2.0)% (6.5)% (7.3)% (8.6)% (9.8)%
Incremental Pre-tax Synergies to Breakeven
2009E CHF 276 CHF 594 CHF 1,046 CHF 1,272 CHF 1,628 CHF 2,625 CHF 2,777 CHF 3,015 CHF 3,252 2010E 416 723 918 1,072 1,355 2,352 2,513 2,750 2,987 2011E NM NM 151 228 381 1,234 1,395 1,632 1,870
Pro Forma EPS Growth Standalone
2008E—2012E 12.6% 14.6% 14.3% 13.9% 13.7% 13.6% 12.8% 12.6% 12.3% 12.0%
Pro Forma P/E to Breakeven
2009E 12.5x 12.7x 13.0x 13.4x 13.6x 13.9x 15.0x 15.2x 15.5x 15.8x 2010E 11.1x 11.4x 11.6x 11.8x 11.9x 12.1x 12.9x 13.1x 13.3x 13.5x
Implied Pro Forma PEG
2009E 1.0x 0.9x 0.9x 1.0x 1.0x 1.0x 1.2x 1.2x 1.3x 1.3x 2010E 0.9x 0.8x 0.8x 0.8x 0.9x 0.9x 1.0x 1.0x 1.1x 1.1x
Note: Assumes cash consideration financed with $10 billion in existing cash and the remainder in new debt. Assumes $500mm in transaction fees paid with cash. Assumes 3.0% opportunity cost of cash. Assumes pre-tax synergies of $400 million in 2009E and $800 million in 2010E and 2011E. Standalone EPS growth per Wall Street research. Analysis does not include potential tax benefits James may realize.
Transaction Analysis 45

Confidential
Goldman Sachs
Illustrative Accretion / (Dilution) Analysis
$30 Billion Maximum Financing; Remainder in Stock Consideration (Figures in millions, except per share data)
Currency Exchange Rate (CHF / $) 1.22
Price Per Share ($) $89.00 $95.00 $100.00 $105.00 $110.00 $115.00 $120.00 $125.00 $130.00 Price Per Share (CHF) CHF 108.62 CHF 115.95 CHF 122.05 CHF 128.15 CHF 134.26 CHF 140.36 CHF 146.46 CHF 152.56 CHF 158.67 Minority Shares (mm) 488 491 494 496 498 500 502 503 505 Equity Consideration—Diluted $43,397 $46,648 $49,360 $52,072 $54,785 $57,497 $60,210 $62,923 $65,635 CHF 52,966 CHF 56,934 CHF 60,244 CHF 63,554 CHF 66,865 CHF 70,176 CHF 73,486 CHF 76,797 CHF 80,108 Existing Cash Used $10,000 $10,000 $10,000 $10,000 $10,000 $10,000 $10,000 $10,000 $10,000 CHF 12,205 CHF 12,205 CHF 12,205 CHF 12,205 CHF 12,205 CHF 12,205 CHF 12,205 CHF 12,205 CHF 12,205 Incremental Financing Need $30,000 $30,000 $30,000 $30,000 $30,000 $30,000 $30,000 $30,000 $30,000 CHF 36,615 CHF 36,615 CHF 36,615 CHF 36,615 CHF 36,615 CHF 36,615 CHF 36,615 CHF 36,615 CHF 36,615 Stock Consideration $3,897 $7,148 $9,860 $12,572 $15,285 $17,997 $20,710 $23,423 $26,135 CHF 4,756 CHF 8,724 CHF 12,034 CHF 15,345 CHF 18,655 CHF 21,966 CHF 25,277 CHF 28,587 CHF 31,898 Estimated Average Financing Cost 3.8% 3.8% 3.8% 3.8% 3.8% 3.8% 3.8% 3.8% 3.8%
% Accretion / (Dilution) to James
2009E (3.2)% (5.7)% (7.8)% (9.7)% (11.6)% (13.3)% (15.1)% (16.7)% (18.3)% 2010E (4.0)% (6.5)% (8.5)% (10.4)% (12.3)% (14.1)% (15.8)% (17.4)% (19.0)% 2011E (0.1)% (2.7)% (4.8)% (6.8)% (8.7)% (10.6)% (12.3)% (14.0)% (15.7)%
Incremental Pre-tax Synergies to Breakeven
2009E CHF 483 CHF 871 CHF 1,179 CHF 1,474 CHF 1,757 CHF 2,029 CHF 2,290 CHF 2,540 CHF 2,781 2010E 678 1,107 1,449 1,776 2,089 2,390 2,679 2,957 3,225 2011E 18 519 916 1,297 1,663 2,013 2,350 2,674 2,985
Pro Forma EPS Growth Standalone
2008E—2012E 12.6% 14.0% 13.3% 12.7% 12.1% 11.5% 10.9% 10.4% 9.8% 9.3%
Pro Forma P/E to Breakeven
2009E 12.5x 12.9x 13.2x 13.5x 13.8x 14.1x 14.4x 14.7x 14.9x 15.2x 2010E 11.1x 11.6x 11.9x 12.2x 12.4x 12.7x 13.0x 13.2x 13.5x 13.7x
Implied Pro Forma PEG
2009E 1.0x 0.9x 1.0x 1.1x 1.1x 1.2x 1.3x 1.4x 1.5x 1.6x 2010E 0.9x 0.8x 0.9x 1.0x 1.0x 1.1x 1.2x 1.3x 1.4x 1.5x
Note: Assumes cash consideration financed with $10 billion in existing cash, up to $30 billion in incremental debt and the remainder in stock. Assumes $500mm in transaction fees paid with cash. Assumes James stock price of CHF 164.70, as of 05-Dec-2008. Assumes 3.0% opportunity cost of cash. Assumes pre-tax synergies of $400 million in 2009E and $800 million in 2010E and 2011E.
Standalone EPS growth per Wall Street research. Analysis does not include potential tax benefits James may realize.
Transaction Analysis 46

Confidential
Goldman Sachs
Illustrative Accretion / (Dilution) Analysis
50% Cash / 50% Stock
(Figures in millions, except per share data)
Currency Exchange Rate (CHF / $) 1.22
Price Per Share ($) $89.00 $95.00 $100.00 $105.00 $110.00 $115.00 $120.00 $125.00 $130.00 Price Per Share (CHF) CHF 108.62 CHF 115.95 CHF 122.05 CHF 128.15 CHF 134.26 CHF 140.36 CHF 146.46 CHF 152.56 CHF 158.67 Minority Shares (mm) 488 491 494 496 498 500 502 503 505 Equity Consideration—Diluted $43,397 $46,648 $49,360 $52,072 $54,785 $57,497 $60,210 $62,923 $65,635 CHF 52,966 CHF 56,934 CHF 60,244 CHF 63,554 CHF 66,865 CHF 70,176 CHF 73,486 CHF 76,797 CHF 80,108 Existing Cash Used $10,000 $10,000 $10,000 $10,000 $10,000 $10,000 $10,000 $10,000 $10,000 CHF 12,205 CHF 12,205 CHF 12,205 CHF 12,205 CHF 12,205 CHF 12,205 CHF 12,205 CHF 12,205 CHF 12,205 Incremental Financing Need $12,198 $13,824 $15,180 $16,536 $17,892 $19,249 $20,605 $21,961 $23,318 CHF 14,888 CHF 16,872 CHF 18,527 CHF 20,182 CHF 21,838 CHF 23,493 CHF 25,148 CHF 26,804 CHF 28,459 Stock Consideration $21,698 $23,324 $24,680 $26,036 $27,392 $28,749 $30,105 $31,461 $32,818 CHF 26,483 CHF 28,467 CHF 30,122 CHF 31,777 CHF 33,432 CHF 35,088 CHF 36,743 CHF 38,399 CHF 40,054 Estimated Average Financing Cost 1.6% 1.6% 3.5% 3.7% 3.9% 7.0% 7.0% 6.9% 6.9%
% Accretion / (Dilution) to James
2009E (9.3)% (11.0)% (13.7)% (15.1)% (16.5)% (20.5)% (21.6)% (22.9)% (24.1)% 2010E (10.6)% (12.2)% (14.4)% (15.7)% (17.0)% (19.2)% (20.5)% (21.8)% (23.0)% 2011E (7.9)% (9.3)% (10.7)% (11.9)% (13.2)% (14.6)% (15.9)% (17.1)% (18.3)%
Incremental Pre-tax Synergies to Breakeven
2009E CHF 1,409 CHF 1,667 CHF 2,091 CHF 2,304 CHF 2,513 CHF 3,124 CHF 3,289 CHF 3,487 CHF 3,666 2010E 1,809 2,077 2,447 2,674 2,896 3,270 3,487 3,699 3,904 2011E 1,501 1,775 2,045 2,271 2,516 2,780 3,020 3,256 3,489
Pro Forma EPS Growth Standalone
2008E—2012E 12.6% 11.3% 10.9% 10.6% 10.3% 9.9% 9.6% 9.2% 8.9% 8.5%
Pro Forma P/E to Breakeven
2009E 12.5x 13.7x 14.0x 14.4x 14.7x 14.9x 15.7x 15.9x 16.2x 16.4x 2010E 11.1x 12.5x 12.7x 13.0x 13.2x 13.4x 13.8x 14.0x 14.2x 14.5x
Implied Pro Forma PEG
2009E 1.0x 1.2x 1.3x 1.4x 1.4x 1.5x 1.6x 1.7x 1.8x 1.9x 2010E 0.9x 1.1x 1.2x 1.2x 1.3x 1.4x 1.4x 1.5x 1.6x 1.7x
Note: Assumes cash consideration financed with 50% cash and 50% stock. Assumes $500mm in transaction fees paid with cash. Assumes James stock price of CHF 164.70, as of 05-Dec-2008. Assumes 3.0% opportunity cost of cash, and pre-tax synergies of $400 million in 2009E and $800 million in 2010E and 2011E. Standalone EPS growth per Wall Street research. Analysis does not include potential tax benefits James may realize.
Transaction Analysis 47
Confidential
Goldman Sachs
IV. Anticipating Next Steps
Anticipating Next Steps 48

Confidential
Goldman Sachs
Anticipating Next Steps
12-Dec communication to Greenhill
Preparing for a potential tender offer
Investor communication
Monitoring the credit markets
Anticipating Next Steps 49
Confidential
Goldman Sachs
Appendix A: Supplementary Materials
Supplementary Materials 50

Confidential
Goldman Sachs
Research Price Targets and Key Themes
Francis
Broker Date Price Target Price and Valuation Commentary
Baird 24-Nov-2008 $100.00¹ ? “Coupling our belief that the James deal ultimately gets done at a higher price than the initial $89/share offer, with continued strong fundamentals, we continue to recommend purchase”
“We place an Outperform rating on Francis shares. Large-cap biotech multiples have compressed in the last few quarters from a traditional range of
30-40X current-year EPS expectations. In that we acknowledge the compressing multiples in the biotech industry (the group currently trades between 20-30X), we apply a 27X multiple to our 2009 EPS estimate of $3.92, discounted back by 15% per year, to derive our 12-month price target of $100” Barclays Capital 24-Nov-2008 $105.00 ? “We arrive at our $105 price target by applying a 50% acquisition premium to our PharmaPipelines NPV estimate of $70”
Bernstein Research 24-Nov-2008 $97.00 ? “We see $95 as a minimum price for a transaction, and believe that the advisers to Francis' independent directors could come up with a materially higher price in the range of ~$125 once all aspects of the company's value are considered”
“Our $97 target price for Francis is based on the high likelihood we place on a deal between James and Francis being completed ($97 is the probability weighted average of our acquisition scenarios)” Bank of America 24-Nov-2008 $100.00 ? “We continue to believe that James will make a higher offer (at least $100/share). With an estimated $20B+ in cash (including Francis’) by YE08, James will need to raise ~$30B (assuming a $100/share takeout price) to buy the ~44% of Francis shares it does not own. Despite the challenging credit market, we continue to believe that this deal is a high-quality transaction, which should be completed (most likely in the 1H09 timeframe)”
“Our $100 TP is based on applying a 1.3PEG multiple to our 5-year est. CAGR of 19% and 2009 EPS est. of $3.85, to which we add a buyout premium of $5/share”
Source: 1 Wall Street research
Represents price target for standalone Francis.
Supplementary Materials 51

Confidential
Goldman Sachs
Research Price Targets and Key Themes
Francis
Broker Date Price Target Price and Valuation Commentary
Jefferies & Co. 24-Nov-2008 $100.00 ? “We maintain our $100 PT, as we believe it represents the minimum acceptable value to Francis’ independent directors and shareholders” Lazard 24-Nov-2008 $98.00¹ ? “Our $98 price target is derived from a 31x multiple applied to our trailing
12-month EPS estimate of $3.16, excluding stock option expense”
Natixis 24-Nov-2008 $85.00 “If the trial fails, our current 2010 EPS estimate of $4.29 will remain (2-year CAGR of 12.3%). Applying a 12x multiple leads to $51/share. Giving a 30% takeover premium leads to a potential buyout price of $66 per share”
“However, if the Avastin trial succeeds, we anticipate off-label use beginning in mid-2009. After factoring in the increased Avastin sales, our 2010 EPS estimate would be $4.55. Applying a 20x multiple leads to a valuation of $90 per share. Then adding a 15% premium gives a potential buyout price of $104 per share” Oppenheimer 24-Nov-2008 $105.00 ? “The resulting average P/E ratio for large-cap biotechs is 15.4x. We believe a premium 18.5x P/E multiple is appropriate for Francis given the growth prospects for Avastin and our estimate of a 13% 2009-2011E EPS CAGR for Francis' current base business. By applying this multiple to our 2009 diluted EPS estimate of $3.94, we arrive at an $88 valuation for Francis, not factoring in any takeover premium for the company…Based on historical premiums of
25-30% for comparable transactions, we believe fair takeover value for Francis is in the $102 to $110 per share range. Taking near the midpoint of this range, we arrive at our $105 price target for Francis” Rodman & Renshaw 24-Nov-2008 $90.00¹ ? “We reach our target price using a Discounted Cash Flow (DCF) valuation. We forecast sales and individual expenses until 2015 to calculate the free cash flow in each year. Assuming a conservative terminal growth rate of 3% to calculate the terminal value, we discount the numbers to 2008 by using the Weighted Average Cost of Capital (WACC) of 9.36% to achieve the value of the firm…Dividing by the outstanding shares, we reach our target price of approximately $90”
Source: 1 Wall Street research
Represents price target for standalone Francis.
Supplementary Materials 52

Confidential
Goldman Sachs
Research Price Targets and Key Themes
Francis
Broker Date Price Target Price and Valuation Commentary
Citi 29-Oct-2008 $96.00 ? “Our $96 target price is based on the average of four valuation techniques:
— Historical premiums paid to large-cap biotech: Our historical analysis suggests large-cap biotech companies get taken over at a 21% premium. In Francis' case there is no change of control, so we believe a premium would only have to be paid for the 44% stake James does not own. Relative to the close on 7/18/08, the adjusted premium leads to a target price of $89
— Synergy Valuation: We estimate that ~$800M synergies will be realized by James from a potential acquisition. We tax effect the synergy and apply an '09 P/E multiple of 20x (the multiple we would value Francis as a standalone company). To buy this synergy benefit we believe James would have to pay for the synergy on top of our baseline valuation of $75/share. This leads to an implied target price of $86
— Upside Valuation: Based on our estimates, the probability-adjusted, discounted value of the upside from major trials is $0.79/share. We assume these trials have a 75% chance of success and we discount the non-GAAP EPS by 30% to 2009. Adding this to our baseline '09 estimate of $3.77, yields in an implied EPS of $4.56. Using a forward '09 P/E multiple of 23x, which in our view would be appropriate if these trials are successful, leads to a target price of $105
— DCF analysis: Our discounted cash flow leads to $102/share. We utilize an 8.8% WACC (based on a cost of equity of 8.9% and cost of debt of 5%), a terminal growth value of 2%”
RBC Capital Markets 15-Oct-2008 $100.00 ? “Our price target is $100, which is 24.1x our 2009E EPS. We believe a $95-100 range is reasonable given it is a 7-12% premium to the $89 of James’ original offer, and a 1-7% premium to the current market price…The downside is the original $89 offer price or lower if the deal falls through” JP Morgan 14-Oct-2008 $105.00¹ ? “Our target is based on a 25x multiple on our 2009 EPS estimate of $4.11, which we feel is justified given the numerous upside drivers that should play out near-term”
1 Source: Wall Street research
Represents price target for standalone Francis.
Supplementary Materials 53
Confidential
Goldman Sachs
Research Price Targets and Key Themes
Francis
Broker Date Price Target Price and Valuation Commentary
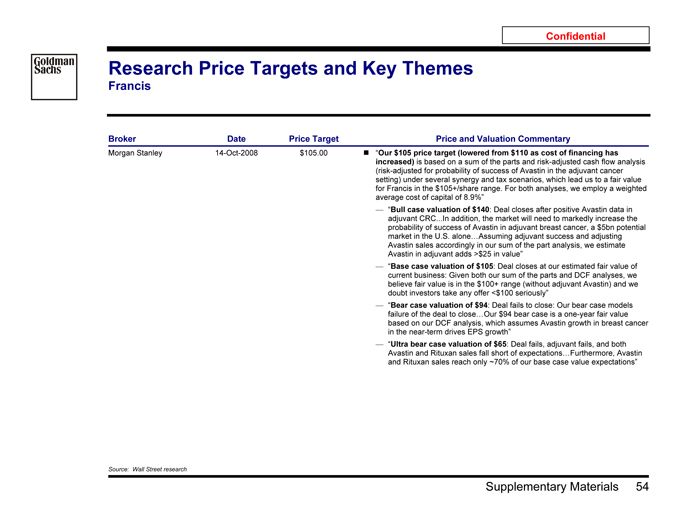
Morgan Stanley 14-Oct-2008 $105.00 ? “Our $105 price target (lowered from $110 as cost of financing has increased) is based on a sum of the parts and risk-adjusted cash flow analysis (risk-adjusted for probability of success of Avastin in the adjuvant cancer setting) under several synergy and tax scenarios, which lead us to a fair value for Francis in the $105+/share range. For both analyses, we employ a weighted average cost of capital of 8.9%”
— “Bull case valuation of $140: Deal closes after positive Avastin data in adjuvant CRC. In addition, the market will need to markedly increase the probability of success of Avastin in adjuvant breast cancer, a $5bn potential market in the U.S. alone Assuming adjuvant success and adjusting Avastin sales accordingly in our sum of the part analysis, we estimate Avastin in adjuvant adds >$25 in value”
— “Base case valuation of $105: Deal closes at our estimated fair value of current business: Given both our sum of the parts and DCF analyses, we believe fair value is in the $100+ range (without adjuvant Avastin) and we doubt investors take any offer <$100 seriously”
— “Bear case valuation of $94: Deal fails to close: Our bear case models failure of the deal to close…Our $94 bear case is a one-year fair value based on our DCF analysis, which assumes Avastin growth in breast cancer in the near-term drives EPS growth”
— “Ultra bear case valuation of $65: Deal fails, adjuvant fails, and both Avastin and Rituxan sales fall short of expectations Furthermore, Avastin and Rituxan sales reach only ~70% of our base case value expectations”
Source: Wall Street research
Supplementary Materials 54
Confidential
Goldman Sachs
Base Case NME Detailed Assumptions
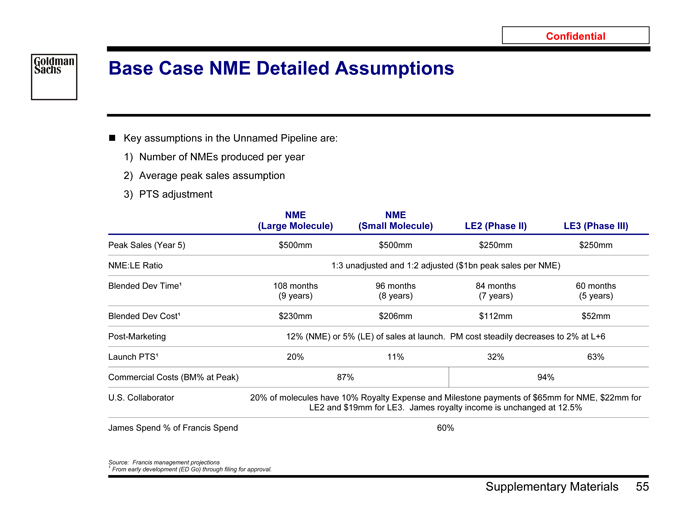
Key assumptions in the Unnamed Pipeline are:
1) Number of NMEs produced per year
2) Average peak sales assumption
3) PTS adjustment
NME NME
(Large Molecule) (Small Molecule) LE2 (Phase II) LE3 (Phase III)
Peak Sales (Year 5) $500mm $500mm $250mm $250mm
NME:LE Ratio 1:3 unadjusted and 1:2 adjusted ($1bn peak sales per NME)
Blended Dev Time¹ 108 months 96 months 84 months 60 months (9 years) (8 years) (7 years) (5 years)
Blended Dev Cost¹ $230mm $206mm $112mm $52mm Post-Marketing 12% (NME) or 5% (LE) of sales at launch. PM cost steadily decreases to 2% at L+6 Launch PTS¹ 20% 11% 32% 63% Commercial Costs (BM% at Peak) 87% 94%
U.S. Collaborator 20% of molecules have 10% Royalty Expense and Milestone payments of $65mm for NME, $22mm for LE2 and $19mm for LE3. James royalty income is unchanged at 12.5%
James Spend % of Francis Spend 60%
Source: 1 Francis management projections
From early development (ED Go) through filing for approval.
Supplementary Materials 55

Confidential
Goldman Sachs
Unnamed Pipeline Assumptions
Base Case, Upside Case and Downside Case ($ in millions)
Unnamed pipeline consists of large molecule and small molecule NMEs
— Large molecule NMEs trend toward approximately four per year to enter pipeline
On average, $1bn peak sales (including line extension opportunities)
PTS of 20% from early development to launch for the initial indication
— Small molecule NMEs comprise approximately 50+% of the remaining unnamed pipeline
On average, $1bn peak sales (including line extension opportunities)
PTS of 11% from early development to launch for the initial indication
Upside assumptions:
— One in five future molecules added to the portfolio to have an Avastin like sales potential (on average, $2.3bn peak sales)
— Approximately 21% higher marketing and sales costs
— Incremental R&D expenditure for each lead or line extension consistent with base case
— PTS remains the same as the base case
— Approximately 46% higher product sales and 17% higher royalties in 2024E
Downside assumptions:
— Reduced overall market opportunity to $750mm for each product
— Approximately 25% lower marketing and sales costs; R&D spend remains unchanged
— PTS remains the same as the base case
— Approximately 15% lower product sales and 9% lower royalties in 2024E
Unnamed Pipeline PTS Adjusted Total Revenue: 2009E – 2024E
Cumulative Total % Above / (Below) Base Base Case Upside Case Downside Case Revenue Case $35,000 Base Case $96,271—$28,000 Upside Case $121,498 26.2% Downside Case $85,400 (11.3)% $21,000
$14,000
$7,000
$0
2009E 2010E 2011E 2012E 2013E 2014E 2015E 2016E 2017E 2018E 2019E 2020E 2021E 2022E 2023E 2024E
Source: Francis management projections
Supplementary Materials 56

Confidential
Goldman Sachs
Unnamed Products Case Discounted Cash Flow Analysis
Base Case, Upside Case and Downside Case 2024 Terminal Year
Unnamed Product Impact on Whole-Co. – Equity Value Per Share
Downside Case Base Case Upside Case
Perpetuity Growth Rate Perpetuity Growth Rate Perpetuity Growth Rate $ 111.2 2.0 % 2.5 % 3.0 % 3.5 % 4.0 % $ 115.2 2.0 % 2.5 % 3.0 % 3.5 % 4.0 % $ 129.9 2.0 % 2.5 % 3.0 % 3.5 % 4.0 %
10.0 % $91.87 $93.53 $95.36 $97.37 $99.54 10.0 % $94.47 $96.30 $98.33 $100.56 $103.00 10.0 % $104.19 $106.66 $109.41 $112.48 $115.89 Rate 9.5 % 98.49 100.51 102.73 105.15 107.71 Rate 9.5 % 101.45 103.68 106.14 108.85 111.74 Rate 9.5 % 112.52 115.53 118.89 122.63 126.76 Discount 9.0 % 106.09 108.55 111.25 114.13 117.01 Discount 9.0 % 109.49 112.21 115.20 118.44 121.74 Discount 9.0 % 122.16 125.83 129.95 134.50 139.39 8.5 % 114.90 117.90 121.13 124.43 127.17 8.5 % 118.81 122.13 125.74 129.50 132.79 8.5 % 133.39 137.90 142.92 148.37 153.73
8.0 % 125.17 128.79 132.55 135.84 136.30 8.0 % 129.70 133.73 137.97 141.86 143.06 8.0 % 146.57 152.11 158.16 164.26 168.23
Incremental Impact on Whole-Co. – Equity Value Per Share
Downside Case Upside Case
Perpetuity Growth Rate Perpetuity Growth Rate
2.0 % 2.5 % 3.0 % 3.5 % 4.0 % 2.0 % 2.5 % 3.0 % 3.5 % 4.0 %
10.0 % ($2.60) ($2.77) ($2.96) ($3.19) ($3.45) 10.0 % $9.72 $10.36 $11.08 $11.92 $12.90 Rate 9.5 % (2.96) (3.17) (3.41) (3.69) (4.02) Rate 9.5 % 11.07 11.85 12.74 13.79 15.02 Discount 9.0 % (3.40) (3.65) (3.95) (4.31) (4.73) Discount 9.0 % 12.67 13.63 14.74 16.06 17.65 8.5 % (3.91) (4.23) (4.61) (5.07) (5.62) 8.5 % 14.58 15.77 17.18 18.87 20.94
8.0 % (4.53) (4.94) (5.42) (6.02) (6.76) 8.0 % 16.87 18.38 20.19 22.40 25.17
Source: Financial projections and scenarios per Francis management as of 16-Nov-2008
Note: Includes capitalized ESO expense and “marked to market” 2015 opt-in value. Assumes 1,052mm basic shares outstanding, as of 31-Oct-2008. Fully diluted shares outstanding calculated using treasury stock method based on options schedule provided by Francis management. Assumes net cash of $6 billion and cash flows discounted to 01-Jan-2009
Supplementary Materials 57

Confidential
Goldman Sachs
Avastin C-08 Assumptions
Base Case, C-08 Upside Case and C-08 Downside Case ($ in millions)
Base Case:
— 61% for PTS for adjuvant colon cancer trial (C-08) in Q2 2009
— Most important additional Avastin indications of adjuvant breast (50% PTS) and adjuvant lung cancer (55% PTS)
— Implies overall adjusted Avastin revenues trend to ~65% of unadjusted Avastin revenues in 2015+ timeframe
— 3.0% annual price increase beginning in 2016, contingent upon breast trial outcome
C-08 Upside Case:
— Positive C-08 results by Q2 2009 resulting in ~18% higher revenue than base case for Avastin overall in 2017E
— Increased PTS assumptions for adjuvant breast and adjuvant lung indications in development to 70%
C-08 Downside Case:
— Negative C-08 results by Q2 2009 resulting in ~33% lower revenue than base case for Avastin overall in 2017E
— Removes adjuvant CRC revenue from base case
— Decreased PTS assumptions for adjuvant breast and adjuvant lung indications in development to 10%
Avastin PTS Adjusted Total Revenue: 2009E – 2024E
Cumulative Total % Above / (Below) Base Base Case Upside Case Downside Case Revenue Case $15,000 Base Case $95,813—Upside Case $110,444 15.3% $12,000 Downside Case $67,911 (29.1)%
$9,000 $6,000 $3,000
$0
2009E 2010E 2011E 2012E 2013E 2014E 2015E 2016E 2017E 2018E 2019E 2020E 2021E 2022E 2023E 2024E
Source: Francis management projections
Supplementary Materials 58

Confidential
Goldman Sachs
Avastin Case Discounted Cash Flow Analysis
Base Case, C-08 Upside Case and C-08 Downside Case 2024 Terminal Year
Avastin Impact on Whole-Co. – Equity Value Per Share
C-08 Downside Case Base Case C-08 Upside Case
Perpetuity Growth Rate Perpetuity Growth Rate Perpetuity Growth Rate $ 104.3 2.0 % 2.5 % 3.0 % 3.5 % 4.0 % $ 115.2 2.0 % 2.5 % 3.0 % 3.5 % 4.0 % $ 120.8 2.0 % 2.5 % 3.0 % 3.5 % 4.0 %
10.0 % $85.23 $86.92 $88.79 $90.83 $93.04 10.0 % $94.47 $96.30 $98.33 $100.56 $103.00 10.0 % $99.24 $101.14 $103.24 $105.56 $108.10 Rate 9.5 % 91.67 93.72 95.98 98.44 101.05 Rate 9.5 % 101.45 103.68 106.14 108.85 111.74 Rate 9.5 % 106.49 108.80 111.36 114.17 117.19 Discount 9.0 % 99.09 101.59 104.33 107.26 110.20 Discount 9.0 % 109.49 112.21 115.20 118.44 121.74 Discount 9.0 % 114.83 117.65 120.76 124.13 127.60 8.5 % 107.71 110.75 114.04 117.41 120.22 8.5 % 118.81 122.13 125.74 129.50 132.79 8.5 % 124.49 127.93 131.69 135.62 139.13
8.0 % 117.79 121.47 125.30 128.68 129.25 8.0 % 129.70 133.73 137.97 141.86 143.06 8.0 % 135.77 139.95 144.38 148.50 149.99
Incremental Impact on Whole-Co. – Equity Value Per Share
C-08 Downside Case C-08 Upside Case
Perpetuity Growth Rate Perpetuity Growth Rate
# ##### 2.0 % 2.5 % 3.0 % 3.5 % 4.0 % # ##### 2.0 % 2.5 % 3.0 % 3.5 % 4.0 %
10.0 % ($9.24) ($9.38) ($9.54) ($9.73) ($9.95) 10.0 % $4.77 $4.84 $4.91 $5.00 $5.10 Rate 9.5 % (9.78) (9.96) (10.16) (10.40) (10.68) Rate 9.5 % 5.04 5.12 5.21 5.32 5.45 Discount 9.0 % (10.40) (10.62) (10.88) (11.18) (11.54) Discount 9.0 % 5.34 5.44 5.56 5.69 5.86 8.5 % (11.11) (11.38) (11.70) (12.09) (12.56) 8.5 % 5.68 5.80 5.95 6.13 6.34
8.0 % (11.91) (12.26) (12.67) (13.18) (13.81) 8.0 % 6.06 6.22 6.41 6.64 6.92
Source: Financial projections and scenarios per Francis management as of 16-Nov-2008
Note: Includes capitalized ESO expense and “marked to market” 2015 opt-in value. Assumes 1,052mm basic shares outstanding, as of 31-Oct-2008. Fully diluted shares outstanding calculated using treasury stock method based on options schedule provided by Francis management. Assumes net cash of $6 billion and cash flows discounted to 01-Jan-2009
Supplementary Materials 59

Confidential
Goldman Sachs
Weighted Average Cost of Capital Analysis
As of 05-Dec-2008
Selected Comparables WACC Calculation
Predicted Adjusted Risk Free Rate (2) 3.5%
Company Market Equity Equity Beta (1) Asset Beta Median Comparables Asset Beta 0.80 Francis $79,487 0.73 0.73 Francis Total Debt/Market Equity (3) 3.2% Amgen 60,817 0.66 0.64 Assumed Tax Rate (4) 36% Biogen Idec 12,910 0.80 0.80 Predicted Equity Beta 0.80 Celgene 24,733 0.90 0.90 Equity Risk Premium (5) 5.1% Genzyme 17,727 0.69 0.69 Cost of Equity 7.5% Gilead 43,149 0.97 0.97 Cost of Debt 5.0% Mean 0.80 0.80 After-Tax Cost of Debt 3.2% Median 0.80 0.80 WACC 7.4%
WACC Sensitivity Table WACC Sensitivity Table
Risk Free Rate (%) Equity Beta
0.10% 3.5% 4.0% 4.5% 5.0% 5.5% 3.44% 0.75 0.80 0.85 0.90 0.95 Premium 4.1% 6.6% 7.1% 7.6% 8.1% 8.5% Premium 4.1% 6.4% 6.6% 6.8% 7.0% 7.2% Risk 5.1% 7.4% 7.9% 8.4% 8.8% 9.3% Risk 5.1% 7.1% 7.4% 7.6% 7.9% 8.1% Equity 6.1% 8.2% 8.6% 9.1% 9.6% 10.1% Equity 6.1% 7.9% 8.2% 8.4% 8.7% 9.0% 7.1% 8.9% 9.4% 9.9% 10.4% 10.9% 7.1% 8.6% 8.9% 9.3% 9.6% 10.0%
Source: Company filings, Ibbotson and Bloomberg (1) Bloomberg 5 year weekly predicted betas.
(2) Yield on 30-year 5 1/4% U.S. Treasury due 2028 as of 05-Dec-2008.
(3) Francis total debt/market equity as of 30-Sep-2008, fully diluted market cap as of 05-Dec-2008. (4) Assumed tax rate per Francis management.
(5) U.S. Equity Risk Premium as of year-end 2007 per Ibbotson data.
Supplementary Materials 60
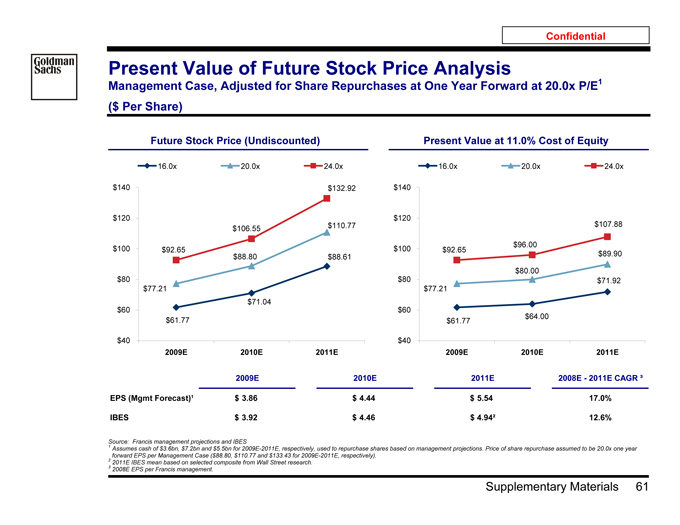
Confidential
Goldman Sachs
Present Value of Future Stock Price Analysis
Management Case, Adjusted for Share Repurchases at One Year Forward at 20.0x P/E1
($ Per Share)
Future Stock Price (Undiscounted) Present Value at 11.0% Cost of Equity
16.0x 20.0x 24.0x 16.0x 20.0x 24.0x $140 $132.92 $140
$120 $120 $110.77 $107.88 $106.55
$96.00 $100 $92.65 $100 $92.65 $88.80 $88.61 $89.90 $80.00
$80 $80 $71.92 $77.21 $77.21 $71.04
$60 $60 $64.00 $61.77 $61.77
$40 $40
2009E 2010E 2011E 2009E 2010E 2011E
2009E 2010E 2011E 2008E—2011E CAGR ³ EPS (Mgmt Forecast)¹ $ 3.86 $ 4.44 $ 5.54 17.0% IBES $ 3.92 $ 4.46 $ 4.94² 12.6%
1 Source: Francis management projections and IBES
Assumes cash of $3.6bn, $7.2bn and $5.5bn for 2009E-2011E, respectively, used to repurchase shares based on management projections. Price of share repurchase assumed to be 20.0x one year 2 forward EPS per Management Case ($88.80, $110.77 and $133.43 for 2009E-2011E, respectively).
3 2011E IBES mean based on selected composite from Wall Street research. 2008E EPS per Francis management.
Supplementary Materials 61

Confidential
Goldman Sachs
Discounted Cash Flow Sensitivity Analysis
2024 Terminal Year
($ Per Share)
Perpetuity Growth Rate $ 151.8 2.0 % 2.5 % 3.0 % 3.5 % 4.0 % 11.0 % $82.94 $84.22 $85.62 $87.15 $88.82
10.5 % 88.36 89.87 91.55 93.39 95.41 Rate 10.0 % 94.47 96.30 98.33 100.56 103.00 Discount 9.5 % 101.45 103.68 106.14 108.85 111.74 9.0 % 109.49 112.21 115.20 118.44 121.74
8.5 % 118.81 122.13 125.74 129.50 132.79
8.0 % 129.70 133.73 137.97 141.86 143.06
Source: Financial projections and scenarios per Francis management as of 16-Nov-2008
Note: Includes capitalized ESO expense and “marked to market” 2015 opt-in value. Assumes 1,052mm basic shares outstanding, as of 31-Oct-2008. Fully diluted shares outstanding calculated using treasury stock method based on options schedule provided by Francis management. Assumes net cash of $6 billion and cash flows discounted to 01-Jan-2009
Supplementary Materials 62

Confidential
Goldman Sachs
Markets are Increasingly Focused on the Economy
Size of Anticipated Economic Stimulus Package is a Wild Card to the Outlook
U.S. Economy Faces Headwinds Through 2009 Increase in Unemployment May Continue Into 2010
6.0 3.0 10.0% Unemployment Rate 2.5 GS Forecast 4.0 YoY
Annualized
2.0 2.0 8.0% QoQChange 0.0 1.5 % -2.0 Real GDP 1.0CPI
Change 6.0%
% GS Forecast
Core -4.0 0.5 GDP Core CPI
GS Forecast
Real -6.0 0.0 4.0%
Q1 Q2 Q3 Q4 Q1 Q2 Q3 Q4 Q1 Q2 Q3 Q4 Q1 Q2 Q3 Q4 Q1 Q2 Q3 Q4 Q1 Q2 Q3 Q4 2007 2008 2009 2007 2008 2009
Economic Weakness Will Pressure Fed to Act Flight to Quality Will Offset Larger Supply of UST
6.0% Fed Funds 3 Mo. LIBOR 6.00 5yr UST 10yr UST 30yr UST 5yr Forecast 10yr Forecast 30yr Forecast GS Forecast GS Forecast 5.0% 5.50
4.0% 5.00 4.50 3.0%
(%) 4.00 2.0% Yield
3.50 1.0% 0.0% 3.00 Q1 Q2 Q3 Q4 Q1 Q2 Q3 Q4 Q1 Q2 Q3 Q4 2.50 2007 2008 2009 2.00
Jan-06 Jul-06 Jan-07 Jul-07 Jan-08 Jul-08 Jan-09 Jul-09
Supplementary Materials 63

Confidential
Goldman Sachs
Global Economy Will Slow in Concert with US
GDP Recovery Outside the US Muted Through 2009 GS Forecast : FX
Advanced Economies GS Forecast 10.0% Emerging Markets GS Forecast World GS Forecast
Current 3-Month 6 Month 12 Month
YoY) 8.0%
EUR/USD 1.27 1.20 1.30 1.30
(Change 6.0%
GBP/USD 1.48 1.48 1.60 1.67
GDP 4.0%
USD/JPY 93.3 90.0 100.0 105.0
Real 2.0%
USD/CAD 1.26 1.22 1.15 1.15
0.0%
Q1 Q2 Q3 Q4 Q1 Q2 Q3 Q4 Q1 Q2 Q3 Q4
USD/CHF 1.22 1.20 1.14 1.17
2007 2008 2009
GS Forecast : 3 Month Interest Rates GS Forecast : 10 Year Interest Rates
5.0% 4.5%
Canada 3M UK 3M Euroland 3M Japan 3M Canada 10Y UK 10Y Euroland 10Y Japan 10Y
4.0%
Rate Rate 3.0% Interest 3.0% Interest 2.0% Year 1.5% Month
3 1.0% 10
0.0% 0.0%
Current* 3-Month Horizon 6-Month Horizon 12-Month Horizon Current* 3-Month Horizon 6-Month Horizon 12-Month Horizon (GS Forecast) (GS Forecast) (GS Forecast) (GS Forecast) (GS Forecast) (GS Forecast)
* Close 03 December 08, mid-rates for major markets Source: GS Economics Research Team
Supplementary Materials 64

Confidential
Goldman Sachs
Recent Structural Changes in the IG Market Will Have Competing Impact on Supply
Credit Spreads Likely to Remain Wide Through 1H 2009
Although Short-Term Pressure Should Continue to Ease… Reduced Capacity in CP Markets Due to Decline in Prime Money Market Funds Will Entice Issuers to Term Out CP
7% Goldman Sachs Composite Measure of Money Market Stress 3,200
Total Money Funds Outstanding
6%
Money market stress peaked in mid October but 2,800 5% has broadly declined since then as government 4% actions moderate pressures 2,400
Prime Funds Money Mkt Funds
25% drop in prime fund assets 3% bn $ 2,000 2% 1,600 1% 1,200 Government Money Mkt Funds
0% Historically, a stress level of 0.5 is typical during a recession, close to the level in early September
-1% 800
Nov-07 Jan-08 Mar-08 May-08 Jul-08 Sep-08 Nov-08 Jul-08 Jul-08 Aug-08 Sep-08 Oct-08
Government Protection of Financial Issuance May Divert But Structural Shifts in the Credit Markets, Such as the Supply to Agency Investors, Moderating IG Overhang… Reduction in CDS Outstanding, May Reduce Total Capacity
60 57.9
Financial New Issue Volume Non-Financial New Issue Volume Sharp reduction in CDS outstandings has already
100% unwound 2 years of expansion trn) 50 $148bn $236bn $ 42.6 44.0 Supply $301bn( 80% 40
Grade $300bn 34.4 34.8 60% Notional 30 26.0
20 17.1 40% $526bn $701bn $677bn 12.4 Investment 8.4 $321bn 10 5.4 Outstanding 2.7 3.8 20% 0.9 1.6 2.2 Total 0.6 of 0
% 0% 1H 2H 1H 2H 1H 2H 1H 2H 1H 2H 1H 2H 1H 2H Apr Oct 2005 2006 2007 2008 2001 2002 2003 2004 2005 2006 2007 2008
Supplementary Materials 65

Confidential
Goldman Sachs
InBev’s Acquisition Financing Plan
“Consummation of the Merger is not conditioned on the funding of InBev’s financing”1 InBev / Anheuser-Busch Financing Case Study; Announced 14-Jul-08 ($ in millions)
Transaction Structure Financing Structure Rating Considerations
Note that the rating judgments in this case Standalone EBITDA $ 7,004 Debt Tranches were significantly complicated by: Acquired EBITDA 3,916 12+12 Term A to Bonds $ 12,000 (a) A-B’s stake in Modelo ($10-$12bn) Pro Forma EBITDA $ 10,920 Term B to Divestitures 7,000 which was not captured in EBITDA Term C 3-year Bullet 13,000 (b) InBev’s full consolidation of Ambev EBITDA, despite 60% economic Debt at announcement $ 9,800 Term D 5-year Bullet 13,000 Acquired Debt 8,483 Bridge to Equity 9,800 ownership and the cash flows’ structural separation from InBev due Transaction Debt 54,800 Note: Term D includes $1bn revolver; pricing at to Ambev’s existing debt
~L+150
Less Debt Refinanced (1,250) However, the Modelo and Ambev stakes provide significant asset value Debt at Closing $ 71,833 Syndicate Lead Banks ? Upon announcement, InBev and A-B Less Equity Offering (9,800) were both rated BBB+ Tokyo-Mitsubishi ING
Less Divestitures (7,000) — InBev NR prior, A-B rated A Barclays JP Morgan* Pro Forma Total Debt $ 55,033 — Subsequently rated Baa2 by BNP Paribas* Mizuho
Note: InBev is rumored to be focused on divesting Moody’s A-B’s Entertainment Segment, for $2 to $6 Deutsch Bank* RBS
? InBev expected to reduce share
billion in pre-tax proceeds. Other assets to be Fortis Santander
divested have not been announced buybacks and cut its dividends for the
“*” Indicates Rights Offering bookrunners next 2 to 3 years
Senior Banks ? Key to the rating are the equity raise Initial PF Leverage 6.6 x Bank of America Rabobank and divestitures PF Adj for Equity 5.7 BayernLB Scotia Capital ? Leverage expected be to reduce to 3x Pro Forma Rating BBB+ / Baa2 by the end of 2010 Dresdner Societe Generale Intesa Sanpaolo Toronto-Dominion KBC Bank
Source: Wall Street research, public filings, and press reports
1 Note: Currency translated at exchange rates as of time of announcement
As per A-B initial proxy; merger agreement provides for no “financing out” for InBev, either from lack of financing or lack of funding.
Supplementary Materials 66

Confidential
Goldman Sachs
Altria Group’s Acquisition of UST Inc.
Announced September 8, 2008
Transaction and Business Overview Summary Terms
Altria announced it will acquire all outstanding shares of UST for $69.50 ? Borrower: Altria Group, Inc. per share in cash (29% premium to three-month average share price) ? Guarantor: Philip Morris USA Inc.
— Transaction price values UST at $11.7 billion (12.1x LTM EBITDA)1,
Type of Facility: 364-day Bridge Loan Facility including the assumption of $1.3 billion in UST debt
Size: $5,080 million
— Altria will finance the transaction with a combination of cash, existing credit facilities and a new committed $7.0 billion revolver ? Tenor: 364 days from Close
UST manufactures and markets smokeless tobacco products and ? Drawn Spread: L+225 with 25 bps quarterly step ups (subject to pricing grid) premium wines primarily in the United States ? Duration Fees: 75bps, 100bps and 300bps paid on amount outstanding as of
— UST is the largest player in the U.S. smokeless tobacco category with 90, 180 and 270 days from Close, respectively key brands including Copenhagen, Skoal, Red Seal and Husky. UST ? Mandatory Prepayments: 100% of all Capital Markets Proceeds and Asset had approximately 60.6% MST market share in 2007 Sales
— Ste. Michelle Wine Estates produces and markets premium wines ? Transaction Close: No earlier than January 2009 under 20 different labels including Chateau Ste. Michelle
Goldman Sachs & Co. acted as lead financial adviser to Altria and provided committed financing to support the transaction
Altria Pro Forma for Acquisition of UST Capital Structure
PF 2007 Revenues PF 2007 Operating Profit Amount 2 3 1.9% Maturity Interest ($mm) Leverage Bid Yield 1.0% 1.0% 0.3% 3.5% 0.4% Cash $1,066 8.9% $3.5bn Revolver 2010 L+50 $0 0.0x 14.4% New Bridge Loan 2009 L+225 5,080 0.8x Senior Unsecured Notes 2013 8.50% 1,399 1.0x 101.5 T+585 Senior Unsecured Notes 2018 9.70% 3,098 1.5x 100.5 T+603 87.9% 80.7% Senior Unsecured Notes 2038 9.95% 1,466 1.8x 100.0 T+573 Other Debt4 1,525 2.0 Total Corporate Debt $12,568 2.0x $17,094 $5,984
Financial Services Debt 500 2.1x Tobacco Smokeless Financial Services Wine Other Total Debt $13,068 2.1x
1 Source: Companies’ press release, Company filings, Bloomberg
LTM EBITDA calculated using adjusted non-GAAP operating income per UST’s press release.
2 Based on estimated annualized Sep-08 YTD PF EBITDA of $6.3bn.
3 Spread over 5-year Treasury, 10-year Treasury and 30-year Treasury.
4 Includes $1.1bn of UST rollover debt and Other Altria Debt.
Supplementary Materials 67
Confidential
Goldman Sachs
Novartis Acquires 77% Stake in Alcon from Nestlé
Goldman Sachs Acted As Exclusive Financial Advisor to Novartis
Transaction Overview Transaction Rationale
On 07-Apr-2008, Novartis and Nestlé announced a two-step agreement Unique opportunity to acquire world leader in a rapidly growing market regarding Nestlé’s 77% stake in Alcon, the world’s largest eye care segment company — Clear No. 1 in eye care
Step 1: Novartis acquires a 25% stake in Alcon from Nestlé for $143.18 — Eye care one of the fastest growing specialty therapeutic segments per share (3 months volume weighted average price),
— Growth drivers: Aging population, emerging markets and innovation or c. $11bn in total
Novartis and Alcon: Complementary eye care businesses
Optional Step 2:
— Geographic strengths
— Novartis has the right to call Nestlé’s remaining 52% stake in Alcon for a fixed price of $181 per share, or c. $28bn in total — Portfolios for front-of-the-eye and back-of-the-eye diseases
— Nestlé has the right to put its remaining 52% stake in Alcon to Novartis — Manufacturing and distribution skills at a premium of 20.5% to Alcon’s share price at the time of exercise, — Potential for eventual cost synergies but not higher than $181 per share
— Either option can be exercised between 1-Jan-2010 and Deal Statistics
31-Jul-2011 1 2 Price / Share Value P/E Premium
Following completion of Step 1, Novartis will have a representative on
Alcon’s Board of Directors Step 1 $143.18 $11bn 22.8x (‘08) (3.5)%
Alcon and Novartis will remain separate and independent companies Step 2 Up to $181 Up to $28bn Up to 22.6x (‘10) NA
No obligation of Novartis to buy out Alcon’s free float shareholders
Overview of Alcon Alcon Share Price Development from IPO to Announcement
Alcon is the world’s largest eye care company Performance until 4-Apr-08 (%) $160
It operates through three product categories: Surgical (medical devices
Since IPO 349.8% $148.44
and products for ophthalmic surgery); Pharmaceuticals (medicines for eye $140
Last 2 Years 41.5%
diseases and conditions); and Consumer (contact lens care, OTC dry eye
$120 Last 1 Year 11.3%
drops, ocular vitamins) (USD)
Last 3 Months 5.8%
Broad geographical presence, with more than 52% of 2007 sales $100
IPO on 20-Mar-2002 Offer
generated outside the U.S. and strong emerging markets growth Price Price: $33.00 $80
Revenues totalled $5.6bn in 2007 and translated into $1.9bn operating income (33.6% margin) $60
— Since its IPO in 2002, Alcon has increased revenues by 13% p.a. and Closing $40 operating income by 22% p.a. $20
Alcon was acquired by Nestlé in 1978; a minority position was listed on the
NYSE in 2002, Nestlé keeping a 77% majority stake to date Mar-2002 Jun-2003 Aug-2004 Nov-2005 Jan-2007 Apr-2008
1 Based on IBES EPS forecast for Alcon of $6.29 for 2008 and $8.01 for 2010.
2 Premium calculated based on closing price of $148.44 as of 04-Apr-2008 (Source: Bloomberg) Source: Company Filings, Press Release, Bloomberg
Supplementary Materials 68