PGIM Jennison Small Company Fund

PROSPECTUS — November 29, 2022
INVESTMENT OBJECTIVE
Capital growth
|
PGIM JENNISON SMALL COMPANY FUND | ||||||
|
A: PGOAX |
C: PSCCX |
R: JSCRX |
Z: PSCZX |
R2: PSCHX |
R4: PSCJX |
R6: PJSQX |
|
The Securities and Exchange Commission
(“SEC”) has not approved or disapproved the
Fund's shares, nor has the SEC determined
that this prospectus is complete or accurate.
It is a criminal offense to state otherwise. Mutual funds are distributed by Prudential
Investment Management Services LLC,
member SIPC. Jennison Associates LLC is a
registered investment adviser. Both are
Prudential Financial companies. © 2022
Prudential Financial, Inc. and its related
entities. Jennison Associates, Jennison, the
Prudential logo, and the Rock symbol are
service marks of Prudential Financial, Inc.
and its related entities, registered in many
jurisdictions worldwide. |
 |
To enroll in e-delivery, go to pgim.com/investments/resource/edelivery
|
|
Class A |
Class C |
Class R |
Class Z |
Class R2 |
Class R4 |
Class R6 |
|
Maximum sales charge (load) imposed on purchases (as a percentage of offering
price) |
|
|
|
|
|
|
|
|
Maximum deferred sales charge (load) (as a percentage of the lower of the original
purchase price or the net asset value at redemption) |
|
|
|
|
|
|
|
|
Maximum sales charge (load) imposed on reinvested dividends and other distributions |
|
|
|
|
|
|
|
|
Redemption fee |
|
|
|
|
|
|
|
|
Exchange fee |
|
|
|
|
|
|
|
|
Maximum account fee (accounts under $10,000) |
$ |
$ |
|
|
|
|
|
*Investors who purchase $1 million or more of Class A shares and sell these shares within 12 months of purchase are also subject to a contingent deferred sales charge (“CDSC”) of 1.00%, although they are not subject to an initial sales charge. The CDSC is waived for certain retirement and/or benefit plans.
**Class C shares are sold with a CDSC of 1.00% on sales made within 12 months of purchase.
***Direct Transfer Agent Accounts holding under $10,000 of Class Z shares are subject to the $15 fee.
|
|
Class A |
Class C |
Class R |
Class Z |
Class R2 |
Class R4 |
Class R6 |
|
Management fee |
|
|
|
|
|
|
|
|
Distribution or distribution and service (12b-1) fees |
|
|
|
|
|
|
|
|
Other expenses: |
|
|
|
|
|
|
|
|
Shareholder service fee |
|
|
|
|
|
|
|
|
Remainder of other expenses |
|
|
|
|
|
|
|
|
Acquired Fund fees and expenses |
|
|
|
|
|
|
|
|
Total annual Fund operating expenses |
|
|
|
|
|
|
|
|
Fee waiver and/or expense reimbursement |
|
|
( |
|
( |
( |
|
|
Total annual Fund operating expenses after fee waiver and/or expense
reimbursement(2,3) |
|
|
|
|
|
|
|
(1) “Shareholder service fee” reflects maximum allowable fees under a shareholder services plan.
(2) PGIM Investments LLC (“PGIM Investments”) has contractually agreed, through January 31, 2024 , to limit transfer agency, shareholder servicing, sub-transfer agency, and blue sky fees, as applicable, to the extent that such fees cause the Total Annual Fund Operating Expenses to exceed 1.18% of average daily net assets for Class R2 shares or 0.93% of average daily net assets for Class R4 shares. This contractual expense limitation excludes interest, brokerage, taxes (such as income and foreign withholding taxes, stamp duty and deferred tax expenses), acquired fund fees and expenses, extraordinary expenses, and certain other Fund expenses such as dividend and interest expense and broker charges on short sales. Where applicable, PGIM Investments agrees to waive management fees or shared operating expenses on any share class to the same extent that it waives such expenses on any other share class. In addition, Total Annual Fund Operating Expenses for Class R6 shares will not exceed Total Annual Fund Operating Expenses for Class Z shares. Fees and/or expenses waived and/or reimbursed by PGIM Investments for the purpose of preventing the expenses from exceeding a certain expense ratio limit may be recouped by PGIM Investments within the same fiscal year during which such waiver and/or reimbursement is made if such recoupment can be realized without exceeding the expense limit in effect at the time of the recoupment for that fiscal year. This expense limitation may not be terminated prior to January 31, 2024 without the prior approval of the Fund’s Board of Directors.
Visit our website at www.pgim.com/investments
3
(3) The distributor of the Fund has contractually agreed through January 31, 2024 to reduce its distribution and service (12b-1) fees applicable to Class R shares to 0.50% of the average daily net assets of Class R shares. This waiver may not be terminated prior to January 31, 2024 without the prior approval of the Fund’s Board of Directors.
|
Share Class |
1 Year |
3 Years |
5 Years |
10 Years |
|
Class A |
$ |
$ |
$ |
$ |
|
Class C |
$ |
$ |
$ |
$ |
|
Class R |
$ |
$ |
$ |
$ |
|
Class Z |
$ |
$ |
$ |
$ |
|
Class R2 |
$ |
$ |
$ |
$ |
|
Class R4 |
$ |
$ |
$ |
$ |
|
Class R6 |
$ |
$ |
$ |
$ |
|
Share Class |
1 Year |
3 Years |
5 Years |
10 Years |
|
Class A |
$ |
$ |
$ |
$ |
|
Class C |
$ |
$ |
$ |
$ |
|
Class R |
$ |
$ |
$ |
$ |
|
Class Z |
$ |
$ |
$ |
$ |
|
Class R2 |
$ |
$ |
$ |
$ |
|
Class R4 |
$ |
$ |
$ |
$ |
|
Class R6 |
$ |
$ |
$ |
$ |
4
PGIM Jennison Small Company Fund
Visit our website at www.pgim.com/investments
5
 |
|
|
| ||
|
|
|
|
|
6
PGIM Jennison Small Company Fund
|
|
|
|
|
|
Return Before Taxes |
One Year |
Five Years |
Ten Years |
Since
Inception |
Inception
Date |
|
Class A shares |
|
|
|
- |
|
|
Class C shares |
|
|
|
- |
|
|
Class R shares |
|
|
|
- |
|
|
Class R2 shares |
|
|
|
|
|
|
Class R4 shares |
|
|
|
|
|
|
Class R6 shares |
|
|
|
- |
|
|
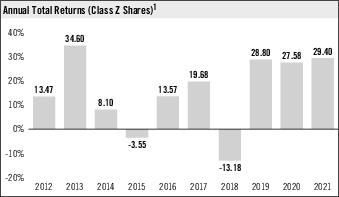
Class Z Shares % (as of 12-31-21) | |||||
|
Return Before Taxes |
|
|
|
- |
|
|
Return After Taxes on Distributions |
|
|
|
- |
|
|
Return After Taxes on Distributions and Sale of Fund Shares |
|
|
|
- |
|
|
Index % (reflects no deduction for fees, expenses or taxes) (as of 12-31-21) | |||||
|
Russell 2500 Index |
|
|
|
- |
|
|
S&P SmallCap 600 Index |
|
|
|
- |
|
MANAGEMENT OF THE FUND
The following individuals are jointly and primarily responsible for the day-to-day management of the Fund.
|
Investment Manager |
Subadviser |
Portfolio Managers |
Title |
Service Date |
|
PGIM Investments LLC |
Jennison Associates LLC |
Jonathan M. Shapiro |
Managing Director |
July 2018 |
|
|
|
Jason M. Swiatek, CFA |
Managing Director |
November 2013 |
BUYING AND SELLING FUND SHARES
|
|
Class A* |
Class C* |
Class R* |
Class Z* |
Class R2 |
Class R4 |
Class R6 |
|
Minimum initial investment |
$1,000 |
$1,000 |
None |
None |
None |
None |
None |
|
Minimum subsequent investment |
$100 |
$100 |
None |
None |
None |
None |
None |
* Certain share classes are generally closed to investments by new group retirement plans. Please see “How to Buy, Sell and Exchange Fund Shares—Closure of Certain Share Classes to New Group Retirement Plans” in the Prospectus for more information.
For Class A and Class C shares, the minimum initial and subsequent investment for Automatic Investment Plan purchases is $50. Class R, Class R2, Class R4 and Class R6 shares are generally not available for purchase by individuals. Class Z shares may be purchased by certain individuals, subject to certain requirements. Please see “How to Buy, Sell and Exchange Fund Shares—How to Buy Shares—Qualifying for Class R Shares,” “—Qualifying for Class Z Shares,” “—Qualifying for Class R2 and Class R4 Shares,” and “—Qualifying for Class R6 Shares” in the Prospectus for purchase eligibility requirements.
Your financial intermediary may impose different investment minimums. You can purchase or redeem shares on any business day that the Fund is open through the Fund's transfer agent or through servicing agents, including brokers, dealers and other financial intermediaries appointed by the distributor to receive purchase and redemption orders. Current shareholders may also purchase or redeem shares through the Fund's website or by calling (800) 225-1852.
Visit our website at www.pgim.com/investments
7
TAX INFORMATION
Dividends, Capital Gains and Taxes. The Fund's dividends and distributions are taxable and will be taxed as ordinary income or capital gains, unless you are investing through a tax-deferred arrangement, such as a 401(k) plan or an individual retirement account. Such tax-deferred arrangements may be taxed later upon withdrawal of monies from those arrangements.
PAYMENTS TO FINANCIAL INTERMEDIaries
If you purchase Fund shares through a financial intermediary such as a broker-dealer, bank, retirement recordkeeper or other financial services firm, the Fund or its affiliates may pay the financial intermediary for the sale of Fund shares and/or for services to shareholders. This may create a conflict of interest by influencing the financial intermediary or its representatives to recommend the Fund over another investment. Ask your financial intermediary or representative or visit your financial intermediary’s website for more information.
8
PGIM Jennison Small Company Fund
MORE ABOUT THE FUND'S PRINCIPAL AND NON-PRINCIPAL INVESTMENT STRATEGIES, INVESTMENTS AND RISKS
INVESTMENT STRATEGIES AND INVESTMENTS
The Fund's investment objective is capital growth. This means the subadviser seeks investments whose prices will increase over time.
The Fund normally invests at least 80% of its investable assets in equity and equity-related securities of small, less well-known companies that the subadviser believes are relatively undervalued. “Investable assets” consist of the Fund’s net assets plus any borrowings for investment purposes. The Fund’s investable assets will be less than its total assets to the extent that it has borrowed money for non-investment purposes, such as to meet anticipated redemptions.
The subadviser currently considers small companies to be those with market capitalizations less than the largest market capitalization of the Russell 2500 Index. Market capitalization is measured at the time of initial purchase so that a company whose capitalization no longer meets this definition after purchase of its securities by the Fund continues to be considered small for purposes of complying with the Fund's 80% policy. The subadviser may change the kind of companies it considers small to reflect industry norms. The market capitalization within the Russell 2500 Index will vary, but as of September 30, 2022, the median market capitalization was approximately $1.3 billion and the largest company by market capitalization was approximately $18.2 billion. The Fund’s portfolio is diversified and typically will include stocks representing all of the sectors in the Russell 2500 Index.
In deciding which stocks to buy, the subadviser uses a blend of both value and growth styles. The subadviser looks for stocks in a variety of different industries and sectors that it believes have attractive valuations, and should experience superior earnings growth on an intermediate term basis. The subadviser generally bases its belief on its proprietary forecasts of each company’s potential earnings growth for periods greater than one year. The subadviser builds its portfolio on a company-by-company basis using in-depth fundamental analysis, while considering industry and sector weightings of the benchmark. From time to time the subadviser may supplement its fundamental investment process with quantitative analytics designed to evaluate the Fund’s holdings in order to optimize portfolio construction, and to create an enhanced liquidity profile for the Fund while maintaining investment strategy integrity. Generally, the subadviser considers selling a security for any of the following reasons: (1) if the underlying trends in the company's industry or business change; (2) if the company experiences a deterioration of its fundamentals and earnings prospects; or (3) if the company's valuation, in the subadviser’s opinion, is too high relative to its risks.
In addition to common stocks, the Fund may invest in other equity-related securities, including nonconvertible preferred stocks, structured notes, and convertible securities—like bonds, corporate notes and preferred stocks—that it can convert to a company's common stock, the cash value of common stock, or some other equity security. The Fund may participate in the initial public offering (“IPO”) market.
The Fund's investment objective is a fundamental policy that cannot be changed without shareholder approval. The Board of Directors of the Fund (the “Board”) can change investment policies that are not fundamental. The Fund will provide 60 days’ prior written notice to shareholders of a change in its non-fundamental policy of investing over 80% of its investable assets in equity and equity-related securities of small, less well-known companies that the subadviser believes are relatively undervalued.
Real Estate Investment Trusts
The Fund may invest in the equity securities of real estate investment trusts known as REITs. REITs are like corporations, except that they do not pay income taxes if they meet certain Internal Revenue Code of 1986, as amended (the “Code”) requirements. However, while REITs themselves do not pay income taxes, the distributions they make to investors are taxable. REITs invest primarily in real estate and distribute almost all of their income—most of which comes from rents, mortgages and gains on sales of property—to shareholders.
Visit our website at www.pgim.com/investments
9
Money Market Instruments
The Fund may hold cash and/or invest in money market instruments, including commercial paper of a U.S. or non-U.S. company, non-U.S. government securities, certificates of deposit, bankers' acceptances, time deposits of domestic and non-U.S. banks, and obligations issued or guaranteed by the U.S. Government or its agencies or instrumentalities. These obligations may be U.S. dollar-denominated or denominated in a non-U.S. currency. Money market instruments typically have a maturity of one year or less as measured from the date of purchase.
Investment Grade Investments
The Fund may invest in fixed income instruments that are rated investment grade (Baa3 or higher by Moody's, BBB- or higher by S&P or Fitch, or comparably rated by another NRSRO) or, if unrated, are considered by the subadviser to be of comparable quality.
Foreign Securities
The Fund may invest in securities of non-U.S. issuers, or foreign securities, including stocks and other equity-related securities, money market instruments and other fixed income securities of foreign issuers. Foreign securities may include securities from emerging market issuers.
Securities Lending
Consistent with applicable regulatory requirements, the Fund may lend portfolio securities with a value up to 33 1∕3% of its total assets to brokers, dealers and other financial organizations to earn additional income. Loans of portfolio securities will be collateralized by cash. Cash collateral will be invested in an affiliated prime money market fund.
Short Sales
The Fund may make short sales of a security. This means that the Fund may sell a security that it does not own, which it may do, for example, when the subadviser thinks the value of the security will decline. The Fund generally borrows the security to deliver to the buyers in a short sale. The Fund must then replace the borrowed security by purchasing it at the market price at the time of replacement. The Fund may make short sales “against the box.” In a short sale against the box, at the time of sale, the Fund owns or has the right to acquire the identical security at no additional cost through conversion or exchange of other securities it owns.
Investments in Affiliated and Unaffiliated Funds
The Fund may invest its assets in affiliated or unaffiliated funds, including exchange-traded funds. The Fund can invest its free cash balances in short-term bond funds and/or money market funds to obtain income on short-term cash balances while awaiting attractive investment opportunities, to provide liquidity in preparation for anticipated redemptions or for defensive purposes. Such an investment could also allow the Fund to obtain the benefits of a more diversified portfolio available in the funds than might otherwise be available through direct investments in those asset classes, and will subject the Fund to the risks associated with the particular asset class. The investment results of the portions of the Fund’s assets invested in the other funds will be based in the investment results of the other funds. As a shareholder in other funds, the Fund will pay its proportional share of the expenses of the other funds.
The affiliated short-term bond funds and certain affiliated money market funds do not pay a management fee to the investment manager, since the investment manager only receives reimbursement for its expenses. Thus, shareholders of the Fund are not paying management fees for both the Fund and the affiliated short-term bond funds and money market funds.
To the extent the Fund serves as an underlying investment for other registered funds, the Fund may be prohibited from investing in certain registered funds and private funds.
Temporary Defensive Investments
In response to adverse market, economic or political conditions, the Fund may take a temporary defensive position and invest up to 100% of its investable assets in money market instruments, including short-term obligations of, or securities guaranteed by, the U.S. Government, its agencies or instrumentalities, or in high-quality obligations of U.S. or non-U.S. banks and corporations, and may hold up to 100% of its investable assets in cash or cash equivalents.
10
PGIM Jennison Small Company Fund
Although the subadviser has the ability to take defensive positions, it may choose not to do so for a variety of reasons, even during volatile market conditions. Investing heavily in these securities is inconsistent with and limits the Fund's ability to achieve its investment objective, but may help to preserve the Fund's assets.
Other Investments
In addition to the strategies and securities discussed above, the Fund may use other strategies or invest in other types of securities as described in the Statement of Additional Information (“SAI”). The Fund might not use all of the strategies or invest in all of the types of securities as described in the Prospectus or in the SAI.
The table below summarizes the investment limits applicable to the Fund’s principal investment strategies and certain non-principal investment strategies.
|
Principal Strategies: Investment Limits |
|
◾Equity and equity-related securities of small companies: At least 80% of investable assets |
|
Certain Non-Principal Strategies: Investment Limits |
|
◾Common stocks of larger companies: Up to 20% of investable assets ◾Securities of REITs: Percentage varies ◾Foreign securities: Up to 35% of investable assets ◾Short Sales: Up to 25% of net assets (short sales “against the box” are not subject to this limit) ◾Illiquid Investments: Up to 15% of net assets ◾Money market instruments: Up to 100% of investable assets on temporary basis |
RISKS OF INVESTING IN THE FUND
The order of the below risk factors does not indicate the significance of any particular risk factor.
Blend Style Risk. The Fund's blend investment style may subject the Fund to risks of both value and growth investing. The portion of the Fund's portfolio that makes investments pursuant to a growth strategy may be subject to above-average fluctuations as a result of seeking higher than average capital growth. The portion of the Fund's portfolio that makes investments pursuant to a value strategy may be subject to the risk that the market may not recognize a security's intrinsic value for long periods of time or at all, or that a stock judged to be undervalued may actually be appropriately priced or overvalued. Issuers of value stocks may have experienced adverse business developments or may be subject to special risks that have caused the stock to be out of favor. If the Fund’s assessment of market conditions or a company’s value is inaccurate, the Fund could suffer losses or produce poor performance relative to other funds. Historically, growth stocks have performed best during later stages of economic expansion and value stocks have performed best during periods of economic recovery. Therefore, both styles may over time go in and out of favor with the markets. At times when a style is out of favor, that portion of the portfolio may lag the other portion of the portfolio, which may cause the Fund to underperform the market in general, its benchmark and other mutual funds. Growth and value stocks have historically produced similar long-term results, though each category has periods when it outperforms the other.
Credit Risk. This is the risk that the issuer, the guarantor or the insurer of a fixed income security, or the counterparty to a contract, may be unable or unwilling to make timely principal and interest payments, or to otherwise honor its obligations. Additionally, fixed income securities could lose value due to a loss of confidence in the ability of the issuer, guarantor, insurer or counterparty to pay back debt. The lower the credit quality of a bond, the more sensitive it is to credit risk.
Cyber Security Risk. Failures or breaches of the electronic systems of the Fund, the Fund's manager, subadviser, distributor, and other service providers, or the issuers of securities in which the Fund invests have the ability to cause disruptions and negatively impact the Fund's business operations, potentially resulting in financial losses to the Fund and its shareholders. While the Fund has established business continuity plans and risk management systems seeking to address system breaches or failures, there are inherent limitations in such plans and systems. Furthermore, the Fund cannot control the cyber security plans and systems of the Fund's service providers or issuers of securities in which the Fund invests.
Visit our website at www.pgim.com/investments
11
Debt Obligations Risk. Debt obligations are subject to credit risk, market risk and interest rate risk. The Fund's holdings, share price, yield and total return may also fluctuate in response to bond market movements. The value of bonds may decline for issuer-related reasons, including management performance, financial leverage and reduced demand for the issuer’s goods and services. Certain types of fixed income obligations also may be subject to “call and redemption risk,” which is the risk that the issuer may call a bond held by the Fund for redemption before it matures and the Fund may not be able to reinvest at the same rate of interest and therefore would earn less income.
Economic and Market Events Risk. Events in the U.S. and global financial markets, including actions taken by the U.S. Federal Reserve or foreign central banks to stimulate or stabilize economic growth or the functioning of the securities markets, may at times result in unusually high market volatility, which could negatively impact performance. Relatively reduced liquidity in credit and fixed income markets could adversely affect issuers worldwide.
Equity and Equity-Related Securities Risk. Equity and equity-related securities may be subject to changes in value, and their values may be more volatile than those of other asset classes. In addition to an individual security losing value, the value of the equity markets or a sector in which the Fund invests could go down. Different parts of a market can react differently to adverse issuer, market, regulatory, political and economic developments.
Exchange-Traded Funds (“ETFs”) Risk. Investing in securities issued by ETFs involves risks similar to those of investing directly in the securities and other assets held by the ETF. Unlike shares of typical mutual funds, shares of ETFs are generally traded on an exchange throughout a trading day and bought and sold based on market values and not at net asset value. For this reason, shares could trade at either a premium or discount to net asset value, which may be substantial during periods of market stress. The trading price of an index-based ETF is expected to (but may not) closely track the net asset value of the ETF, and the Fund will generally gain or lose value consistent with the performance of the ETF’s portfolio securities. The Fund will pay brokerage commissions in connection with the purchase and sale of shares of ETFs. In addition, the Fund will indirectly bear its pro rata share of the fees and expenses incurred by an ETF (including ETFs managed by the Manager or the subadviser(s)) in which it invests, including advisory fees (to the extent not offset by the Manager through waivers). These expenses are in addition to the advisory and other expenses that the Fund bears directly in connection with its own operations. An index-based ETF may not replicate exactly the performance of the benchmark index it seeks to track for a number of reasons, including transaction costs incurred by the ETF, the temporary unavailability of certain index securities in the secondary market or discrepancies between the ETF and the index with respect to the weighting of securities or the number of securities held. Investments in ETFs are subject to the risk that the listing exchange may halt trading of an ETF’s shares, in which case the Fund would be unable to sell its ETF shares unless and until trading is resumed.
Foreign Securities Risk. Investments in securities of non-U.S. issuers (including those denominated in U.S. dollars) may involve more risk than investing in securities of U.S. issuers. Foreign political, economic and legal systems, especially those in developing and emerging market countries, may be less stable and more volatile than in the United States. Foreign legal systems generally have fewer regulatory requirements than the U.S. legal system, particularly those of emerging markets. In general, less information is publicly available with respect to non-U.S. companies than U.S. companies. Non-U.S. companies generally are not subject to the same accounting, auditing, and financial reporting standards as are U.S. companies. Additionally, the changing value of foreign currencies and changes in exchange rates could also affect the value of the assets the Fund holds and the Fund's performance. Certain foreign countries may impose restrictions on the ability of issuers of foreign securities to make payment of principal and interest or dividends to investors located outside the country, due to blockage of foreign currency exchanges or otherwise. Investments in emerging markets are subject to greater volatility and price declines.
In addition, the Fund's investments in non-U.S. securities may be subject to the risks of nationalization or expropriation of assets, imposition of currency exchange controls or restrictions on the repatriation of non-U.S. currency, confiscatory taxation and adverse diplomatic developments. Special U.S. tax considerations may apply.
12
PGIM Jennison Small Company Fund
Increase in Expenses Risk. Your actual cost of investing in the Fund may be higher than the expenses shown in the expense table for a variety of reasons. For example, expense ratios may be higher than those shown if average net assets decrease. Net assets are more likely to decrease and Fund expense ratios are more likely to increase when markets are volatile. Active and frequent trading of Fund securities can increase expenses.
Initial Public Offerings Risk. The volume of IPOs and the levels at which the newly issued stocks trade in the secondary market are affected by the performance of the stock market overall. If IPOs are brought to the market, availability may be limited and if the Fund desires to acquire shares in such an offering, it may not be able to buy any shares at the offering price, or if it is able to buy shares, it may not be able to buy as many shares at the offering price as it would like. The prices of securities involved in IPOs are often subject to greater and more unpredictable price changes than more established stocks. Such unpredictability can have a dramatic impact on the Fund's performance (higher or lower) and any assumptions by investors based on the affected performance may be unwarranted. In addition, as Fund assets grow, the impact of IPO investments on performance will decline, which could reduce total returns.
Interest Rate Risk. The value of your investment may go down when interest rates rise. A rise in rates tends to have a greater impact on the prices of longer term or duration debt securities. Similarly, a rise in interest rates may also have a greater negative impact on the value of equity securities whose issuers expect earnings further out in the future. For example, a fixed income security with a duration of three years is expected to decrease in value by approximately 3% if interest rates increase by 1%. This is referred to as “duration risk.” When interest rates fall, the issuers of debt obligations may prepay principal more quickly than expected, and the Fund may be required to reinvest the proceeds at a lower interest rate. This is referred to as “prepayment risk.” When interest rates rise, debt obligations may be repaid more slowly than expected, and the value of the Fund's holdings may fall sharply. This is referred to as “extension risk.” The Fund may lose money if short-term or long-term interest rates rise sharply or in a manner not anticipated by the subadviser.
Large Shareholder and Large Scale Redemption Risk. Certain individuals, accounts, funds (including funds affiliated with the Manager) or institutions, including the Manager and its affiliates, may from time to time own or control a substantial amount of the Fund’s shares. There is no requirement that these entities maintain their investment in the Fund. Certain of these entities may use predetermined, nondiscretionary mathematical formulas in their investment process that may result in large-scale asset flows into and out of the Fund. These shareholders may also pledge or loan Fund shares (to secure financing or otherwise), which may result in the shares becoming concentrated in another party. There is a risk that such large shareholders or that the Fund’s shareholders generally may redeem all or a substantial portion of their investments in the Fund in a short period of time, which could have a significant negative impact on the Fund’s NAV, liquidity, and brokerage costs. Such redemptions may cause the Fund to have to sell securities at inopportune times or prices. These transactions may adversely affect the Fund’s performance and increase transaction costs. In addition, large redemption requests may exceed the cash balance of the Fund and result in credit line borrowing fees and/or overdraft charges to the Fund until the sales of portfolio securities necessary to cover the redemption request settle. To the extent a large shareholder in the Fund is an entity subject to domestic and/or international regulations governing banking, insurance, or other financial institutions, changes in those regulations (e.g., capital requirements) or in the shareholder’s financial status may cause or require the shareholder to redeem its investment in the Fund when it otherwise would not choose to redeem that investment. It is also possible that a significant redemption could result in an increase in Fund expenses on account of being spread over a smaller asset base, and therefore make it more difficult for the Fund to implement its investment strategy. Large redemptions could also result in tax consequences to shareholders. The Fund’s ability to pursue its investment objective after one or more large scale redemptions may be impaired and, as a result, the Fund may invest a larger portion of its assets in cash or cash equivalents.
Management Risk. The value of your investment may decrease if judgments by the subadviser about the attractiveness, value or market trends affecting a particular security, industry or sector or about market movements are incorrect.
Visit our website at www.pgim.com/investments
13
Market Disruption and Geopolitical Risks. Market disruption can be caused by economic, financial or political events and factors, including but not limited to, international wars or conflicts (including Russia’s military invasion of Ukraine), geopolitical developments (including trading and tariff arrangements, sanctions and cybersecurity attacks), instability in regions such as Asia, Eastern Europe and the Middle East, terrorism, natural disasters and public health epidemics (including the outbreak of COVID-19 globally).
The extent and duration of such events and resulting market disruptions cannot be predicted, but could be substantial and could magnify the impact of other risks to the Fund. These and other similar events could adversely affect the U.S. and foreign financial markets and lead to increased market volatility, reduced liquidity in the securities markets, significant negative impacts on issuers and the markets for certain securities and commodities and/or government intervention. They may also cause short- or long-term economic uncertainties in the United States and worldwide. As a result, whether or not the Fund invests in securities of issuers located in or with significant exposure to the countries directly affected, the value and liquidity of the Fund’s investments may be negatively impacted. Further, due to closures of certain markets and restrictions on trading certain securities, the value of certain securities held by the Fund could be significantly impacted, which could lead to such securities being valued at zero.
COVID-19 and the related governmental and public responses have had and may continue to have an impact on the Fund’s investments and net asset value and have led and may continue to lead to increased market volatility and the potential for illiquidity in certain classes of securities and sectors of the market. They have also had and may continue to result in periods of business disruption, business closures, inability to obtain raw materials, supplies and component parts, and reduced or disrupted operations for the issuers in which the Fund invests. The occurrence, reoccurrence and pendency of public health epidemics could adversely affect the economies and financial markets either in specific countries or worldwide.
Market Risk. Securities markets may be volatile and the market prices of the Fund’s securities may decline. Securities fluctuate in price based on changes in an issuer’s financial condition and overall market and economic conditions. If the market prices of the securities owned by the Fund fall, the value of your investment in the Fund will decline.
Money Market Instruments Risk. The value of money market instruments may be affected by changing interest rates and by changes in the credit ratings of those instruments. If a significant amount of the Fund's assets are invested in money market instruments, it will be more difficult for the Fund to achieve its investment objective.
Real Estate Investment Trust (“REIT”) Risk. Investing in REITs involves certain unique risks in addition to those risks associated with investing in the real estate industry in general. REITs may be affected by changes in the value of the underlying property owned by the REITs, while mortgage REITs may be affected by the quality of any credit extended. REITs are dependent upon management skills, may not be diversified geographically or by property/mortgage asset type, and are subject to heavy cash flow dependency, default by borrowers and self-liquidation. REITs may be more volatile and/or more illiquid than other types of equity securities. REITs (especially mortgage REITs) are subject to interest rate risks. REITs may incur significant amounts of leverage. The Fund will indirectly bear a portion of the expenses, including management fees, paid by each REIT in which it invests, in addition to the expenses of the Fund.
REITs must also meet certain requirements under the Internal Revenue Code of 1986, as amended (the “Code”) to avoid entity level tax and be eligible to pass-through certain tax attributes of their income to shareholders. REITs are consequently subject to the risk of failing to meet these requirements for favorable tax treatment and of failing to maintain their exemptions from registration under the Investment Company Act of 1940. REITs are subject to the risks of changes in the Code affecting their tax status.
Securities Lending Risk. Securities lending involves the risk that the borrower may fail to return the securities in a timely manner or at all. As a result, the Fund may lose money and there may be a delay in recovering the loaned securities. Additionally, losses could result from the reinvestment of collateral received on loaned securities in investments that decline in value, default, or do not perform as well as expected. The affiliated prime money market fund in which cash collateral generally is invested may impose liquidity fees or temporary gates on redemptions if its weekly liquid assets fall below a designated threshold. If this were to occur, the Fund may lose money on its investment of cash collateral in
14
PGIM Jennison Small Company Fund
the affiliated prime money market fund, or the Fund may not be able to redeem its investment of cash collateral in the affiliated prime money market fund, which might cause the Fund to liquidate other holdings in order to return the cash collateral to the borrower upon termination of a securities loan. These events could trigger adverse tax consequences for the Fund.
Short Sales Risk. Short sales involve costs and risks. The Fund must pay the lender interest on the security it borrows, and the Fund will lose money to the extent that the price of the security increases between the time of the short sale and the date when the Fund replaces the borrowed security. Although the Fund’s gain is limited to the price at which it sold the securities short, its potential loss is limited only by the maximum attainable price of the securities, less the price at which the security was sold and may, theoretically, be unlimited. The Fund may also make short sales “against the box.” When selling short against the box, the Fund gives up the opportunity for capital appreciation in the security.
Small Company Risk. Small company stocks present above-average risks in comparison to larger companies. Small companies usually offer a smaller range of products and services than larger companies. Smaller companies may also have limited financial resources and may lack management expertise. As a result, stocks issued by smaller companies may be comparatively less liquid and fluctuate in value more than the stocks of larger, more established companies. In addition, it is more difficult to get information on smaller companies, which tend to be less well known, have shorter operating histories, do not have significant ownership by large investors and are followed by relatively few securities analysts.
Please note that, in addition to the risks discussed above, there are many other factors that may impact the Fund’s ability to achieve its investment objective and which could result in a loss of all or a part of your investment.
More information about the Fund’s investment strategies and risks appears in the SAI.
Visit our website at www.pgim.com/investments
15
HOW THE FUND IS MANAGED
BOARD OF DIRECTORS
The Fund is overseen by a Board of Directors (hereafter referred to as “Directors” or the “Board”). The Board oversees the actions of the Manager, subadviser and distributor and decides on general policies. The Board also oversees the Fund's officers, who conduct and supervise the daily business operations of the Fund.
MANAGER
PGIM Investments LLC (“PGIM Investments”)
655 Broad Street
Newark, NJ 07102-4410
655 Broad Street
Newark, NJ 07102-4410
Under a management agreement with the Fund, PGIM Investments manages the Fund's investment operations and administers its business affairs and is responsible for supervising the Fund's subadviser. For the fiscal year ended September 30, 2022, the Fund paid PGIM Investments management fees (net of waivers, as applicable) at the effective rate of 67% of the Fund's average daily net assets for all share classes.
PGIM Investments and its predecessors have served as a manager or administrator to investment companies since 1987. As of October 31, 2022 PGIM Investments, a wholly-owned subsidiary of Prudential, served as the investment manager to all of the Prudential U.S. and offshore open-end investment companies, and as the manager or administrator to closed-end investment companies, with aggregate assets of approximately $283.2 billion.
Subject to the supervision of the Board, PGIM Investments is responsible for conducting the initial review of prospective subadvisers for the Fund. In evaluating a prospective subadviser, PGIM Investments considers many factors, including the firm's experience, investment philosophy and historical performance. Subject to the Board’s oversight, PGIM Investments is also responsible for monitoring the performance of the Fund's subadviser and recommending its termination and replacement when deemed appropriate. PGIM Investments may provide a subadviser with additional investment guidelines consistent with the Fund's investment objective and restrictions.
PGIM Investments and the Fund operate under an exemptive order (the “Order”) from the SEC that generally permits PGIM Investments to enter into or amend agreements with unaffiliated subadvisers without obtaining shareholder approval. This authority is subject to certain conditions, including the requirement that the Board must approve any new or amended agreements with a subadviser. Shareholders of the Fund still have the right to terminate these agreements at any time by a vote of the majority of the outstanding shares of the Fund. The Fund will notify shareholders of any new subadvisers engaged or material amendments to subadvisory agreements made pursuant to the Order. Any new subadvisory agreement or amendment to the Fund’s management agreement or current subadvisory agreement that directly or indirectly results in an increase in the aggregate management fee rate payable by the Fund will be submitted to the Fund’s shareholders for their approval. PGIM Investments does not currently intend to retain unaffiliated subadvisers.
A discussion of the basis for the Board's approvals of the management and subadvisory agreements is available in the Fund's Annual Report to shareholders dated September 30.
SUBADVISER
Jennison Associates LLC (“Jennison”) is a wholly-owned subsidiary of PGIM, Inc., which is an indirect wholly-owned subsidiary of Prudential Financial, Inc. Its address is 466 Lexington Avenue, New York, New York 10017. PGIM Investments has responsibility for all investment advisory services, supervises Jennison and pays Jennison for its services. As of October 31, 2022, Jennison managed in excess of $167.3 billion in assets. Jennison (including its predecessor, Jennison Associates Capital Corp.) is a registered investment adviser founded in 1969.
PORTFOLIO MANAGERS
Jonathan M. Shapiro and Jason M. Swiatek, CFA, are the portfolio managers of the Fund and are jointly and primarily responsible for the day-to-day management of the Fund.
16
PGIM Jennison Small Company Fund
Jonathan M. Shapiro is a Managing Director, a financial services, smid cap core and small cap core equity portfolio manager, and research analyst. He joined Jennison in June 2006. Prior to joining Jennison, Mr. Shapiro was a vice president and head of the small companies/special situations research group at Goldman Sachs. Prior to Goldman Sachs, Mr. Shapiro worked at KPMG Consulting and Jones Lang Wootton Realty Advisors. Mr. Shapiro earned a BA, magna cum laude, with high honors in history from Dartmouth College and an MBA from The Wharton School at the University of Pennsylvania.
Jason M. Swiatek, CFA, is a Managing Director, the Head of Small and MidCap equity, and a small and smid cap equity portfolio manager. He joined Jennison in August 2000 when Prudential's (now PGIM) public equity asset management capabilities were transferred to Jennison. Mr. Swiatek joined Prudential in 1995 as a financial reviewer for the asset management group, and moved to Prudential's global growth equities team in 1996 before joining the small cap equity team in 1999. Prior to Prudential, he worked at Munistat/PFA, Inc. and the Center for Entrepreneurship. Mr. Swiatek earned a BS, summa cum laude, in finance from Canisius College and he holds the Chartered Financial Analyst (CFA) designation.
The portfolio managers for the Fund are supported by other Jennison portfolio managers, research analysts and investment professionals. Team members conduct research, make securities recommendations and support the portfolio managers in all activities. Members of the team may change from time to time.
Additional information about portfolio manager compensation, other accounts managed, and portfolio manager ownership of Fund securities may be found in the SAI.
DISTRIBUTOR
Prudential Investment Management Services LLC (“PIMS” or the “Distributor”) distributes each class of the Fund's shares under a Distribution Agreement with the Fund. The Fund has Distribution and Service Plans (the “Plans”) pursuant to Rule 12b-1 under the 1940 Act, applicable to certain of the Fund's shares. Under the Plans and the Distribution Agreement, the Distributor pays the expenses of distributing the shares of all share classes of the Fund. The Distributor also provides certain shareholder support services. Under the Plans, certain classes of the Fund pay distribution and other fees to the Distributor as compensation for its services. These fees—known as 12b-1 fees—are set forth in the “Fund Fees and Expenses” tables.
Because these fees are paid from the Fund's assets on an ongoing basis, over time these fees will increase the cost of your investment and may cost you more than paying other types of sales charges.
DISCLOSURE OF PORTFOLIO HOLDINGS
The Fund's policies and procedures with respect to the disclosure of the Fund's portfolio securities are described in the Fund's SAI and on the Fund's website at www.pgim.com/investments.
Visit our website at www.pgim.com/investments
17
FUND DISTRIBUTIONS AND TAX ISSUES
DISTRIBUTIONS
The Fund distributes dividends to shareholders out of any net investment income. For example, if the Fund owns ACME Corp. stock and the stock pays a dividend, the Fund will pay out a portion of this dividend to its shareholders, assuming the Fund's income is more than its costs and expenses. The dividends you receive from the Fund will be subject to taxation whether or not they are reinvested in the Fund, unless your shares are held in a qualified or tax-deferred plan or account.
The Fund also distributes any net realized capital gains to shareholders. Capital gains are generated when the Fund sells its assets for a profit. For example, if the Fund bought 100 shares of ACME Corp. stock for a total of $1,000 and more than one year later sold the shares for a total of $1,500, the Fund has net long-term capital gains of $500, which it will pass on to shareholders (assuming the Fund's remaining total gains are greater than any losses it may have).
For your convenience, the Fund's distributions of dividends and net capital gains are automatically reinvested in the Fund without any sales charge. If you ask us to pay the distributions in cash, we will send you a check if your account is with Prudential Mutual Fund Services LLC (“PMFS” or the “Transfer Agent”). Otherwise, if your account is with a broker, you will receive a credit to your account. Either way, the distributions may be subject to income taxes unless your shares are held in a qualified or tax-deferred plan or account. If your distribution check(s) remains uncashed for more than six months, your check(s) may be invested in additional shares of the Fund at the next net asset value (“NAV”) calculated on the day of the investment. For more information about automatic reinvestment and other shareholder services, see “Additional Shareholder Services” in the next section.
The chart below sets forth the expected frequency of dividend and capital gains distributions to shareholders. Various factors may impact the frequency of dividend distributions to shareholders, including but not limited to adverse market conditions or portfolio holding-specific events.
|
Expected Distribution Schedule* |
|
|
Net Investment Income |
Annually |
|
Short-Term Capital Gains |
Annually |
|
Long-Term Capital Gains |
Annually |
*Under certain circumstances, the Fund may make more than one distribution of short-term and/or long-term capital gains during a fiscal year.
TAX ISSUES
Investors who buy Fund shares should be aware of some important tax issues. For example, the Fund distributes dividends of net investment income and realized net capital gains, if any, to shareholders. Fund distributions and gain from the sale of Fund shares are subject to federal income taxes, unless you hold your shares in a 401(k) plan, an Individual Retirement Account (“IRA”) or some other qualified or tax-deferred plan or account. Dividends and distributions from the Fund also may be subject to state and local income tax in the state where you live.
The following briefly discusses some of the important income tax issues you should be aware of, but is not meant to be tax advice. For tax advice, please speak with your tax adviser.
Fund Distributions
Fund distributions of net capital gains are taxed differently depending on how long the Fund holds the security. If the Fund holds a security for more than one year before selling it, any gain is treated as long-term capital gain which is generally taxed at rates of up to 15% or 20% for non-corporate U.S. shareholders, depending on whether their incomes exceed certain threshold amounts, which are adjusted annually for inflation. If the Fund holds the security for one year or less, any gain is treated as short-term capital gain, which is taxed at rates applicable to ordinary income, subject to a maximum tax rate of 37%. Different rates apply to corporate shareholders.
18
PGIM Jennison Small Company Fund
Dividends from net investment income paid to a non-corporate U.S. shareholder that are reported as qualified dividend income will generally be taxable to such shareholder at the long-term capital gain tax rate. Dividends of net investment income that are not reported as qualified dividend income will be taxable to shareholders at ordinary income rates. Also, a portion of the dividends paid to corporate shareholders of the Fund will be eligible for the dividends received deduction to the extent the Fund’s income is derived from certain dividends received from U.S. corporations. Between 2018 and 2025, the Fund may report dividends eligible for a 20% “qualified business income” deduction for non-corporate U.S. shareholders to the extent the Fund’s income is derived from ordinary REIT dividends, reduced by allocable Fund expenses.
A U.S. shareholder that is an individual, estate or certain type of trust is subject to a 3.8% Medicare contribution tax on the lesser of (1) the U.S. shareholder’s “net investment income,” including Fund distributions and net gains from the disposition of Fund shares, and (2) the excess of the U.S. shareholder’s modified adjusted gross income for the taxable year over $200,000 (or $250,000 for married couples filing jointly). For this purpose, net investment income includes interest, dividends, annuities, royalties, capital gain and income from a passive activity business or a business of trading in financial instruments or commodities.
Form 1099
For every year the Fund declares a dividend, you will receive a Form 1099, which reports the amount of ordinary income distributions and long-term capital gains we distributed to you during the prior year unless you own shares of the Fund as part of a qualified or tax-deferred plan or account. If you do own shares of the Fund as part of a qualified or tax-deferred plan or account, your taxes are deferred, so you will not receive a Form 1099 annually, but instead you will receive a Form 1099 when you take any distribution from your qualified or tax-deferred plan or account.
Fund distributions are generally taxable to you in the calendar year in which they are received, except when we declare certain dividends and distributions in the fourth quarter, with a record date in such quarter, and actually pay them in January of the following year. In such cases, the dividends and distributions are treated as if they were paid on December 31st of the prior year.
Cost Basis Reporting
Mutual funds must report cost basis information to you and the IRS when you sell or exchange shares acquired on or after January 1, 2012 in your non-retirement accounts. The cost basis regulations do not affect retirement accounts, money market funds, and shares acquired before January 1, 2012. The cost basis regulations also require mutual funds to report whether a gain or loss is short-term (shares held one year or less) or long-term (shares held more than one year) for all shares acquired on or after January 1, 2012 that are subsequently sold or exchanged. The Transfer Agent is not required to report cost basis information on shares acquired before January 1, 2012. However, in most cases the Transfer Agent will provide this information to you as a service.
Withholding Taxes
If federal tax law requires you to provide the Fund with your taxpayer identification number and certifications as to your tax status and you fail to do this, or if you are otherwise subject to backup withholding, we will withhold and pay to the U.S. Treasury a portion of your distributions and sale proceeds, based on the backup withholding rate.
Taxation of Non-U.S. Shareholders
For a discussion regarding the taxation of non-U.S. shareholders, please see the SAI and contact your tax adviser.
If You Purchase on or Before a Record Date
If you buy shares of the Fund on or before the record date for a distribution (the date that determines who receives the distribution), we will pay that distribution to you. As explained above, the distribution may be subject to taxes. You may think you've done well since you bought shares one day and soon thereafter received a distribution. That is not so, because when dividends are paid out, the value of each share of the Fund decreases by the amount of the dividend to reflect the payout, although this may not be apparent because the value of each share of the Fund also will be affected by market changes, if any. However, the timing of your purchase does mean that part of your investment may have come back to you as taxable income.
Visit our website at www.pgim.com/investments
19
Qualified and Tax-Deferred Retirement Plans
Retirement plans and accounts allow you to defer paying taxes on investment income and capital gains. Contributions to these plans may also be tax-deductible, although distributions from these plans generally are taxable. In the case of Roth IRA accounts, contributions are not tax-deductible, but distributions from the plan may be tax-free. Please contact your financial adviser for information on a variety of PGIM Funds that are suitable for retirement plans offered by Prudential.
20
PGIM Jennison Small Company Fund
IF YOU SELL OR EXCHANGE YOUR SHARES
If you sell any shares of the Fund for a profit, you have realized a capital gain, which is subject to tax unless the shares are held in a qualified or tax-deferred plan or account. As mentioned above, the maximum capital gains tax rate is up to 15% or 20% for individuals, depending on whether their incomes exceed certain threshold amounts, which are adjusted annually for inflation.
If you sell shares of the Fund at a loss, you may have a capital loss, which you may use to offset capital gains you have, plus, in the case of non-corporate taxpayers, ordinary income of up to $3,000. If you sell shares and realize a loss, you will not be permitted to use the loss to the extent you replace the shares (including pursuant to the reinvestment of a dividend) within a 61-day period (beginning 30 days before and ending 30 days after the sale of the shares). Under certain circumstances, if you acquire shares of the Fund and sell or exchange your shares within 90 days, you may not be allowed to include certain charges incurred in acquiring the shares for purposes of calculating gain or loss realized upon the sale or exchange of the shares.
If you exchange your Fund shares for shares of another class of the Fund, this is generally not a taxable event and should not result in realization of a capital gain or loss by you. If you exchange your shares of the Fund for shares of another PGIM Fund, this is considered a sale for tax purposes. In other words, it's a taxable event. Therefore, if the shares you exchanged have increased in value since you purchased them, you have capital gains, which are subject to the taxes described above. Unless you hold your shares in a qualified or tax-deferred plan or account, you or your financial adviser should keep track of the dates on which you buy and sell—or exchange—Fund shares, as well as the amount of any gain or loss on each transaction. For tax advice, please see your tax adviser.
Automatic Conversion of Class C Shares
The conversion of Class C shares into Class A shares—which happens automatically approximately 8 years after purchase—is not a taxable event for federal income tax purposes. For more information about the automatic conversion of Class C shares, see Class C Shares Automatically Convert to Class A Shares in How to Buy, Sell and Exchange Fund Shares.
Visit our website at www.pgim.com/investments
21
HOW TO BUY, SELL AND EXCHANGE FUND SHARES
HOW TO BUY SHARES
In order to buy Fund shares, simply follow the steps described below.
Opening an Account
Shares may be purchased through an account with the Transfer Agent, or through an account with a financial intermediary that has an agreement with the Distributor to sell Fund shares. In order to open an account with the Transfer Agent contact PMFS at (800) 225-1852 or write to:
Prudential Mutual Fund Services LLC (“PMFS”)
P.O. Box 9658
Providence, RI 02940
P.O. Box 9658
Providence, RI 02940
PMFS will accept purchases of shares by check or wire. We do not accept cash, money orders, non-U.S. checks, credit card checks, payable through checks or travelers checks. To purchase by wire, call the number above to obtain an application. After PMFS receives your completed application, you will receive an account number. For additional information, see the back cover page of this Prospectus. Your purchase order must be in good order to be accepted and processed, which means that all necessary processing requirements have been satisfied. We have the right to reject any purchase order (including an exchange into the Fund) or suspend or modify the Fund's sales of its shares under certain circumstances. These circumstances include, but are not limited to, failure by you to provide additional information requested, such as information required to verify the source of funds used to purchase shares, your identity or the identity of any underlying beneficial owners of your shares. Furthermore, we are required by law to close your account if you do not provide the required identifying information. This would result in the redemption of shares at the then-current NAV and the proceeds would be remitted to you via check. We will attempt to verify your identity within a reasonable time frame (e.g., 60 days), which may change from time to time. For further information, please contact PMFS (for shares purchased through the Transfer Agent) or your financial professional (for shares purchased through a financial intermediary).
With certain limited exceptions, Fund shares are only available to be sold in the United States, U.S. Virgin Islands, Puerto Rico and Guam.
Choosing a Share Class
The Fund offers the following share classes. Certain classes of shares may have additional specific eligibility or qualification requirements, which are explained below.
|
Share Class |
Eligibility |
|
Class A* |
Retail investors |
|
Class C* |
Retail investors |
|
Class R* |
Certain group retirement plans |
|
Class Z* |
Certain group retirement plans, institutional investors and certain other investors |
|
Class R2 |
Certain group retirement plans and certain other investors |
|
Class R4 |
Certain group retirement plans and certain other investors |
|
Class R6 |
Certain group retirement plans, institutional investors and certain other investors |
*The Fund’s Class A, Class C and Class Z shares are generally closed to investments by new group retirement plans. The Fund’s Class R shares are generally closed to new investors. Please see “Closure of Certain Share Classes to New Group Retirement Plans” in this section of the Prospectus for more information.
Multiple share classes let you choose a cost structure that meets your needs:
◾
Class A shares purchased in amounts of less than $1 million require you to pay a sales charge at the time of purchase, but the operating expenses of Class A shares are lower than the operating expenses of Class C shares.
22
PGIM Jennison Small Company Fund
Investors who purchase $1 million or more of Class A shares and sell these shares within 12 months of purchase are also subject to a contingent deferred sales charge (“CDSC”) of 1.00%, although they are not subject to an initial sales charge. The CDSC is waived for certain retirement and/or benefit plans.
◾
Class C shares do not require you to pay a sales charge at the time of purchase, but do require you to pay a CDSC of 1.00% if you sell your shares within 12 months of purchase. The operating expenses of Class C shares are higher than the operating expenses of Class A shares.
When choosing a share class, you should consider the following factors:
◾
The amount of your investment and any previous or planned future investments, which may qualify you for reduced sales charges for Class A shares under Rights of Accumulation or a Letter of Intent.
◾
The length of time you expect to hold the shares and the impact of varying distribution fees. Over time, these fees will increase the cost of your investment and may cost you more than paying other types of sales charges. For this reason, Class C shares are generally appropriate only for investors who plan to hold their shares for no more than 3 years.
◾
The different sales charges that apply to each share class—Class A's front-end sales charge (and, in certain instances, CDSC) vs. Class C's CDSC.
◾
Class C shares purchased in single amounts greater than $1 million are generally less advantageous than purchasing Class A shares. Purchase orders for Class C shares above this amount generally will not be accepted.
◾
If you purchase Class Z shares through a broker acting solely as an agent on behalf of its customers pursuant to an agreement with PIMS, the broker may charge you a commission in an amount determined and separately disclosed to you by the broker.
◾
Because Class Z and Class R6 shares have lower operating expenses than Class A or Class C shares, as applicable, you should consider whether you are eligible to purchase such share classes.
See “How to Sell Your Shares” for a description of the impact of CDSCs.
If your shares are held through a financial intermediary, you should discuss with your intermediary which share classes of the Fund are available to you and which share class may best meet your needs. Certain financial intermediaries through which you may purchase shares of the Fund may impose their own investment minimums, fees, policies and procedures for purchasing, exchanging and selling Fund shares, which are not described in this Prospectus or the SAI, and which will depend on the policies, procedures and trading platforms of the financial intermediary. Consult your financial intermediary about share class availability and the intermediary’s policies, procedures and other information. The availability of certain sales charge waivers and discounts will depend on whether you purchase your shares directly from the Fund or through a financial intermediary. See “Appendix A: Waivers and Discounts Available From Certain Financial Intermediaries” for additional information. The Fund has advised financial intermediaries of the share class features and guidelines, per the Prospectus, and it is their responsibility to monitor and enforce these guidelines with respect to shareholders purchasing shares through financial intermediaries.
Share Class Comparison. Use the following chart to help you compare the different share classes. The discussion following this chart will tell you whether you are entitled to a reduction or waiver of any sales charges.
|
|
Class A* |
Class C* |
Class R* |
Class Z* |
Class R2 |
Class R4 |
Class R6 |
|
Minimum purchase amount |
$1,000 |
$1,000 |
None |
None |
None |
None |
None |
|
Minimum amount for
subsequent purchases |
$100 |
$100 |
None |
None |
None |
None |
None |
|
Maximum initial sales charge |
5.50% of the
public offering
price |
None |
None |
None |
None |
None |
None |
|
Contingent Deferred Sales
Charge (“CDSC”) (as a
percentage of the lower of the
original purchase price or the
net asset value at redemption) |
1.00% on sales
of $1 million or
more made
within 12
months of
purchase |
1.00% on sales
made within 12
months of
purchase |
None |
None |
None |
None |
None |
Visit our website at www.pgim.com/investments
23
|
|
Class A* |
Class C* |
Class R* |
Class Z* |
Class R2 |
Class R4 |
Class R6 |
|
Annual distribution or
distribution and service (12b-1)
fees (shown as a percentage of
average daily net assets) |
0.30% |
1.00% |
0.75% (0.50%
currently) |
None |
0.25% |
None |
None |
|
Shareholder service fees |
None |
None |
None |
None |
0.10% |
0.10% |
None |
Notes to Share Class Comparison Table:
° The minimum initial and subsequent investment requirements do not apply to employee savings plan accounts, payroll deduction accounts, or when exchanging all shares of an account to an existing account with the same registration. The minimum initial and subsequent investment requirements for AIP accounts is $50 monthly (if your shares are held through a broker or other financial intermediary, the broker or intermediary is responsible for determining the minimum initial and subsequent investment for AIP accounts). In addition, the minimum initial and subsequent investment requirements do not apply with respect to Class A and Class C shares when offered at NAV on fee-based programs, mutual fund “wrap” or asset allocation programs, mutual fund “supermarket” programs, and group retirement plans.
° If the value of your Class A, Class C or Class Z account with PMFS is less than $10,000, the Fund will deduct a $15 annual account maintenance fee from your account. The $15 annual account maintenance fee will be assessed during the 4th calendar quarter of each year. Any applicable CDSC on the shares redeemed to pay the $15 account maintenance fee will be waived. The $15 account maintenance fee will not be charged on: (i) accounts during the first six months from inception of the account, (ii) accounts which are authorized for electronic delivery of account statements, transaction confirmations, prospectuses and fund shareholder reports, (iii) omnibus accounts or accounts for which a broker or other financial intermediary is responsible for recordkeeping, (iv) institutional accounts, (v) group retirement plans, (vi) AIP accounts or employee savings plan accounts, (vii) accounts with the same registration associated with multiple share classes within the Fund, provided that the aggregate value of share classes with the same registration within the Fund is $10,000 or more, or (viii) clients with assets of $50,000 or more across the PGIM family of mutual funds. For more information, see “Purchase, Redemption and Pricing of Fund Shares—Account Maintenance Fee” in the SAI.
° For more information about the CDSC and how it is calculated, see “How to Sell Your Shares—Contingent Deferred Sales Charge (“CDSC”).”
° Investors who purchase $1 million or more of Class A shares and sell these shares within 12 months of purchase are subject to a 1.00% CDSC, although they are not subject to an initial sales charge. The CDSC is waived for certain retirement and/or benefit plans.
° Distribution and service (12b-1) fees are paid from the Fund's assets on a continuous basis. Over time, the fees will increase the cost of your investment and may cost you more than paying other types of sales charges. The service fee for Class A, Class C and Class R shares is 0.25%. The distribution fee is limited to 0.30% (including the 0.25% service fee) for Class A shares, 0.75% for Class C shares (in addition to the 0.25% service fee), 0.75% (including the 0.25% service fee) for Class R shares, and 0.25% for Class R2 shares.
° The Distributor has contractually agreed until January 31, 2024, to reduce its distribution and service (12b-1) fee applicable to Class R shares to 0.50% of the average daily net assets of Class R shares.
* The Fund’s Class A, Class C and Class Z shares are generally closed to investments by new group retirement plans. The Fund’s Class R shares are generally closed to new investors. Please see “Closure of Certain Share Classes to New Group Retirement Plans” in this section of the Prospectus for more information.
Closure of Certain Share Classes to New Group Retirement Plans
Effective June 1, 2018 (the “Effective Date”), the Fund’s Class A, Class C, Class R and Class Z shares, as applicable, were closed to investments by new group retirement plans, except as discussed below. Existing group retirement plans as of the Effective Date may keep their investments in their current share class and may continue to make additional purchases or exchanges in the Fund. As of the Effective Date, all new group retirement plans wishing to add the Fund as a new addition to the plan generally will be into one of the available Class R6 shares, Class R4 shares, or Class R2 shares of the Fund, as applicable. A short-term investment in a PGIM affiliated money market fund shall not be deemed a new group retirement plan investment for purposes of this policy.
In addition, on the Effective Date, the Class R shares of any fund were closed to all new investors, except as discussed below. Due to the closing of the Class R shares to new investors, effective on the Effective Date new IRA investors may only purchase Class A, Class C, Class Z or Class R6 shares of the Fund, as applicable, subject to share class eligibility. Following the Effective Date, no Class R shares may be purchased or acquired by any new Class R shareholder, except as discussed below.
|
|
Class A |
Class C |
Class Z |
Class R |
|
Existing Investors (Group Retirement Plans,
IRAs, and all other investors) |
No Change |
No Change |
No Change |
No Change |
|
New Group Retirement Plans |
Closed to group retirement plans wishing to add the share classes as new additions to plan menus on June 1, 2018,
subject to certain exceptions below | |||
|
New IRAs |
No Change |
No Change |
No Change |
Closed to all new
investors on June 1, 2018,
subject to certain
exceptions below |
|
All Other New Investors |
No Change |
No Change |
No Change | |
However, the following new investors may continue to purchase Class A, Class C, Class R and Class Z shares of the Fund, as applicable:
24
PGIM Jennison Small Company Fund
◾
Eligible group retirement plans that are exercising their one-time 90-day repurchase privilege in the Fund will be permitted to purchase such share classes.
◾
Plan participants in a group retirement plan that offers Class A, Class C, Class R or Class Z shares of the Fund, as applicable, as of the Effective Date will be permitted to purchase such share classes of the Fund, even if the plan participant did not own shares of that class of the Fund as of the Effective Date.
◾
Certain new group retirement plans will be permitted to offer such share classes of the Fund after the Effective Date, provided that the plan or its financial intermediary or other agent has or is actively negotiating a contractual agreement with the Fund’s distributor or service provider to offer such share classes of the Fund prior to or on the Effective Date.
◾
New group retirement plans that combine with, replace or are otherwise affiliated with a current plan that invests in such share classes prior to or on the Effective Date will be permitted to purchase such share classes.
◾
The Fund also reserves the right to refuse any purchase order that might disrupt management of the Fund or to otherwise modify the closure policy at any time on a case-by-case basis.
◾
Shareholders owning Class C shares may continue to hold their Class C shares until the shares automatically convert to Class A shares under the conversion schedule, or until the shareholder redeems their Class C shares.
Reducing or Waiving Class A's and Class C’s Sales Charges
The following describes the different ways investors can reduce or avoid paying Class A's sales charge.
Increase the Amount of Your Investment. You can reduce Class A's sales charge by increasing the amount of your investment. The table below shows how the sales charge decreases as the amount of your investment increases:
|
Amount of Purchase |
Sales Charge as a % of
Offering Price* |
Sales Charge as a % of
Amount Invested* |
Dealer Reallowance*** |
|
Less than $25,000 |
5.50% |
5.82% |
5.00% |
|
$25,000 to $49,999 |
5.00% |
5.26% |
4.50% |
|
$50,000 to $99,999 |
4.50% |
4.71% |
4.00% |
|
$100,000 to $249,999 |
3.75% |
3.90% |
3.25% |
|
$250,000 to $499,999 |
2.75% |
2.83% |
2.50% |
|
$500,000 to $999,999 |
2.00% |
2.04% |
1.75% |
|
$1 million to $4,999,999** |
None |
None |
1.00% |
|
$5 million to $9,999,999** |
None |
None |
0.50% |
|
$10 million and over** |
None |
None |
0.25% |
* Due to rounding in the calculation of the offering price and the number of shares purchased, the actual sales charge you pay may be more or less than the percentages shown above.
** If you invest $1 million or more, you can buy only Class A shares, unless you qualify to buy other share classes. If you purchase $1 million or more of Class A shares and sell these shares within 12 months of purchase, you will be subject to a CDSC of 1.00%, although you will not be subject to an initial sales charge. The CDSC is waived for certain retirement and/or benefit plans.
*** The Dealer Reallowance is the amount that is paid by the Fund’s distributor to the financial intermediary responsible for the sale of the Fund’s shares. For more information, please see “How Financial Intermediaries are Compensated for Selling Fund Shares” in this section of the Prospectus.
*** The Dealer Reallowance is the amount that is paid by the Fund’s distributor to the financial intermediary responsible for the sale of the Fund’s shares. For more information, please see “How Financial Intermediaries are Compensated for Selling Fund Shares” in this section of the Prospectus.
To satisfy the purchase amounts above, you can:
◾
Use your Rights of Accumulation, which allow you or an eligible group of related investors to combine the value of a new purchase of Class A shares of any PGIM Fund with (1) the current value of Class A and Class C, and any other PGIM Fund share class (when used in retail brokerage or advisory programs) you or the eligible group of related investors already own, (2) the value of money market shares (other than Direct Purchase money market shares) you or an eligible group of related investors have received for shares of other PGIM Funds in an exchange transaction, and (3) the value of the shares you or an eligible group of related investors are purchasing; or
◾
Sign a Letter of Intent, stating in writing that you or an eligible group of related investors will purchase a certain amount of shares in the Fund and other PGIM Funds within 13 months.
◾
Purchases made prior to the effective date of the Letter of Intent will be applied toward the satisfaction of the Letter of Intent to determine the level of sales charge that will be paid pursuant to the Letter of Intent, but will not result in any reduction in the amount of any previously paid sales charge.
An “eligible group of related investors” includes any combination of the following:
Visit our website at www.pgim.com/investments
25
◾
All accounts held in your name (alone or with other account holders) and taxpayer identification number (“TIN”);
◾
Accounts held in your spouse's name (alone or with other account holders) and TIN (see definition of spouse below);
◾
Accounts for your children or your spouse's children, including children for whom you and/or your spouse are legal guardian(s) (e.g., UGMAs and UTMAs);
◾
Accounts in the name and TINs of your parents;
◾
Trusts with you, your spouse, your children, your spouse's children and/or your parents as the beneficiaries;
◾
With limited exclusions, accounts with the same address (exclusions include, but are not limited to, addresses for brokerage firms and other intermediaries and Post Office boxes); and
◾
Accounts held in the name of a company controlled by you (a person, entity or group that holds 25% or more of the outstanding voting securities of a company will be deemed to control the company, and a partnership will be deemed to be controlled by each of its general partners), including employee benefit plans of the company where the accounts are held in the plan's TIN.
A “spouse” is defined in this Prospectus as follows:
◾
The person to whom you are legally married. We also consider your spouse to include the following:
◾
An individual of the same gender with whom you have been joined in a civil union, or legal contract similar to marriage;
◾
A domestic partner, who is an individual (including one of the same gender) with whom you have shared a primary residence for at least six months, in a relationship as a couple where you, your domestic partner or both provide for the personal or financial welfare of the other without a fee, to whom you are not related by blood; or
◾
An individual with whom you have a common law marriage, which is a marriage in a state where such marriages are recognized between a man and a woman arising from the fact that the two live together and hold themselves out as being married.
The value of shares held by you or an eligible group of related investors will be determined as follows:
◾
for Class A shares and any other share class for which a sales charge is paid, the value of existing shares is determined by the maximum offering price (NAV plus maximum sales charge); and
◾
for all other share classes, the value of existing shares is determined by the NAV.
If your shares are held directly by the Transfer Agent, and you believe you qualify for a reduction or waiver of Class A’s or Class C's sales charges, you must notify the Transfer Agent at the time of the qualifying share purchase in order to receive the applicable reduction or waiver. If your shares are held through a broker or other financial intermediary, and you believe you qualify for a reduction or waiver of Class A’s or Class C's sales charges, you must notify your broker or intermediary at the time of the qualifying purchase in order to receive the applicable reduction or waiver. Shares held through a broker or other financial intermediary will not be systematically aggregated with shares held directly by the Transfer Agent for purposes of receiving a reduction or waiver of Class A’s or Class C's sales charges. The reduced or waived sales charge will be granted subject to confirmation of account holdings.
If your shares are held directly by the Transfer Agent, you must identify the eligible group of related investors. Although the Transfer Agent does not require any specific form of documentation in order to establish your eligibility to receive a waiver or reduction of Class A’s or Class C's sales charges, you may be required to provide appropriate documentation if the Transfer Agent is unable to establish your eligibility.
If your shares are held through a financial intermediary, the financial intermediary is responsible for determining the specific documentation, if any, that you may need in order to establish your eligibility to receive a waiver or reduction of Class A’s or Class C's sales charges. Your financial intermediary is also responsible for notifying the Transfer Agent if your share purchase qualifies for a reduction or waiver of Class A’s or Class C's sales charges.
Purchases of $1 million or more. If you purchase $1 million or more of Class A shares, you will not be subject to an initial sales charge, although a CDSC may apply, as previously noted.
26
PGIM Jennison Small Company Fund
Mutual Fund Programs. The initial sales charge on Class A shares will be waived for participants in any fee-based program or trust program sponsored by Prudential or an affiliate that includes the Fund as an available option. The initial sales charge will also be waived for clients of financial intermediaries in programs that are sponsored by or available through financial intermediaries that offer Class A shares without an initial sales charge, relating to:
◾
Mutual fund “wrap” or asset allocation programs, where the sponsor places fund trades, links its clients' accounts to a master account in the sponsor's name and charges its clients a management, consulting or other fee for its services; or
◾
Mutual fund “supermarket” programs, where the sponsor links its clients' accounts to a master account in the sponsor's name and the sponsor charges a fee for its services.
Financial intermediaries sponsoring these mutual fund programs may offer their clients more than one class of shares in the Fund in connection with different pricing options for their programs. Investors should consider carefully any separate transaction and other fees charged by these programs in connection with investing in each available share class before selecting a share class.
Group Retirement Plans. Class A’s and Class C’s sales charges will be waived for group retirement plans (including defined contribution plans, defined benefit plans and deferred compensation plans) available through a retirement plan recordkeeper or third party administrator. Investors in group retirement plans should contact their financial intermediary with any questions regarding availability of Class A and Class C shares at net asset value.
Other Types of Investors. Certain other types of investors may purchase Class A shares without paying the initial sales charge, including:
◾
Certain directors or trustees, officers, current employees (including their spouses, children and parents) and former employees (including their spouses, children and parents) of Prudential and its affiliates, the PGIM Funds, and the subadvisers of the PGIM Funds; former employees must have an existing investment in the Fund;
◾
Persons who have retired directly from active service with Prudential or one of its subsidiaries;
◾
Registered representatives and employees of broker-dealers (including their spouses, children and parents) that offer Class A shares; and
◾
Clients of financial intermediaries, who (i) offer Class A shares through a no-load network or platform, (ii) charge clients an ongoing fee for advisory, investment, consulting or similar services, or (iii) offer self-directed brokerage accounts or other similar types of accounts that may or may not charge transaction fees to customers.
To qualify for a waiver of the Class A or Class C sales charges at the time of purchase (including exchange of share classes within the Fund), you must notify the Transfer Agent, or the Distributor must be notified by the financial intermediary facilitating the purchase, that the transaction qualifies for a waiver of the Class A or Class C sales charges. The waiver will be granted subject to confirmation of your account holdings.
Additional Information About Reducing or Waiving Class A’s and Class C's Sales Charges. The Fund also makes available free of charge, on the Fund's website, in a clear and prominent format, information relating to the Fund's Class A and Class C sales charges, and the different ways that investors can reduce or avoid paying the initial sales charge. The Fund's website includes hyperlinks that facilitate access to this information.
You may need to provide your financial intermediary through which you hold Fund shares with the information necessary to take full advantage of reduced or waived Class A or Class C sales charges.
The Distributor may reallow the Class A sales charge to dealers.
Class C Shares Automatically Convert to Class A Shares
Class C shares will be eligible for automatic conversion into Class A shares on a monthly basis approximately eight years after the original date of purchase. Conversion will take place based on the relative NAV of the two classes, without the imposition of any sales load, fee or other charge. All such automatic conversions of Class C shares will
Visit our website at www.pgim.com/investments
27
constitute tax-free exchanges for federal income tax purposes. See the table titled “Annual Fund Operating Expenses” in the section of the Fund’s Prospectus titled “Fund Summary – Fund Fees and Expenses” for the annual fund operating expenses for Class A and Class C shares.
For shareholders investing in Class C shares through retirement plans or omnibus accounts, and in certain other instances, the Fund and its agents may not have transparency into how long a shareholder has held Class C shares for purposes of determining whether such Class C shares are eligible for automatic conversion to Class A shares, and the relevant financial intermediary may not have the ability to track purchases in order to credit individual shareholders’ holding periods. In these circumstances, the Fund will not be able to automatically convert Class C shares to Class A shares as described above. In order to determine eligibility for conversion in these circumstances, it is the responsibility of the financial intermediary to notify the Fund that the shareholder is eligible for the conversion of Class C shares to Class A shares, and the financial intermediary may be required to maintain and provide the Fund with records that substantiate the holding period of Class C shares. It is the financial intermediary’s (and not the Fund’s) responsibility to keep records of transactions made in accounts it holds and to ensure that the shareholder is credited with the proper holding period based on such records or those provided to the financial intermediary by the shareholder. Please consult with your financial intermediary for the applicability of this conversion feature to your shares.
A financial intermediary may sponsor and/or control accounts, programs or platforms that impose a different conversion schedule or different eligibility requirements for the exchange of Class C shares for Class A shares (see Appendix A: Waivers and Discounts Available From Certain Financial Intermediaries of the Prospectus). Please consult with your financial intermediary if you have any questions regarding your shares’ conversion from Class C shares to Class A shares.
Qualifying for Class R Shares
Group Retirement Plans. Class R shares are offered for sale to (i) certain group retirement plans (including defined contribution plans, defined benefit plans and deferred compensation plans) available through a retirement plan recordkeeper or third party administrator, and (ii) IRAs that are held on the books of the Fund through omnibus level accounts, including The SmartSolution IRA offered by Prudential Retirement. If Prudential Retirement Services is the recordkeeper for your group retirement plan, you may call Prudential at (800) 353-2847 with any questions. Investors in SmartSolution IRA accounts through Prudential’s Personal Retirement Services unit can call (888) 244-6237 with any questions regarding how to purchase shares. Otherwise, investors in group retirement plans should contact their financial intermediary with any questions regarding availability of Class R shares.
Qualifying for Class Z Shares
Institutional Investors. Various institutional investors may purchase Class Z shares, including corporations, banks, governmental entities, municipalities, hospitals, insurance companies and IRS Section 501 entities, such as foundations and endowments. Institutional investors are responsible for indicating their eligibility to purchase Class Z shares at the time of purchase. Certain financial intermediaries may require that investments by their institutional investor clients in Class Z shares be placed directly with the Fund's Transfer Agent. Please contact the Transfer Agent at (800) 225-1852 for further details.
Mutual Fund Programs. Class Z shares can be purchased by participants in any fee-based program or trust program sponsored by Prudential or an affiliate that includes the Fund as an available option. Class Z shares also can be purchased by investors in certain programs sponsored by financial intermediaries who offer Class Z shares of the Fund, or whose programs are available through financial intermediaries that offer Class Z shares of the Fund, for:
◾
Mutual fund “wrap” or asset allocation programs where the sponsor places fund trades, links its clients' accounts to a master account in the sponsor's name and charges its clients a management, consulting or other fee for its services;
◾
Mutual fund “supermarket” programs where the sponsor links its clients' accounts to a master account in the sponsor's name and the sponsor charges a fee for its services; or
◾
Fee- or commission-based retail brokerage programs of certain financial intermediaries that offer Class Z shares through such programs and that have agreements with PIMS to offer such shares when acting solely on an agency basis for their customers for the purchase or sale of such shares. If you transact in Class Z shares of the Fund
28
PGIM Jennison Small Company Fund
through one of these programs, you may be required to pay a commission and/or other forms of compensation to the broker or financial intermediary for effecting such transaction. Because the Fund is not a party to any commission arrangement between you and your broker, any transactions in Class Z shares will be made by the Fund at net asset value (before imposition of the commission). Any such fee is paid by you, not by the Fund, and the imposition of any such fee or commission by your broker or financial intermediary does not impact the net asset value for such Fund shares. Shares of the Fund are available in other share classes that have different fees and expenses.
Financial intermediaries sponsoring these mutual fund programs may offer their clients more than one class of shares in the Fund in connection with different pricing options for their programs. Investors should consider carefully any separate transaction and other fees charged by these programs in connection with investing in a share class offered by the program before selecting a share class.
Other Types of Investors. Class Z shares also can be purchased by any of the following:
◾
Certain participants in the MEDLEY Program (group variable annuity contracts) sponsored by Prudential for whom Class Z shares of the PGIM Funds are an available option;
◾
Current and former Directors/Trustees of mutual funds, closed-end funds and ETFs managed by PGIM Investments or any other affiliate of Prudential;
◾
Current and former employees (including their spouses, children and parents) of Prudential and its affiliates; former employees must have an existing investment in the Fund;
◾
Prudential (including any program or account sponsored by Prudential or an affiliate that includes the Fund as an available option);
◾
PGIM Funds, including PGIM funds-of-funds;
◾
Qualified state tuition programs (529 plans); and
◾
Investors working with fee-based consultants for investment selection and allocations.
Qualifying for Class R2 and Class R4 Shares
Group Retirement Plans. Class R2 and Class R4 shares are offered for sale to group retirement plans (including defined contribution plans, defined benefit plans and deferred compensation plans) available through a retirement plan recordkeeper or third party administrator. Class R2 and Class R4 shares are also offered to retirement plans, both where Prudential serves as the retirement plan administrator and where a third party serves as the retirement plan administrator. If Prudential Retirement Services is the recordkeeper for your group retirement plan, you may call Prudential at (800) 353-2847 with any questions. Otherwise, investors in group retirement plans should contact their financial intermediary with any questions regarding availability of Class R2 and Class R4 shares.
Qualifying for Class R6 Shares
Group Retirement Plans. Group retirement plans (including defined contribution plans, defined benefit plans and deferred compensation plans) available through a retirement plan recordkeeper or third party administrator may purchase Class R6 shares. Investors in group retirement plans should contact their financial intermediary with any questions regarding availability of Class R6 shares.
Institutional Investors. Various institutional investors may purchase Class R6 shares, including, but not limited to, corporations, governmental entities, municipalities, hospitals, insurance companies and IRS Section 501 entities, such as foundations and endowments and other institutional investors. Institutional investors are responsible for indicating their eligibility to purchase Class R6 shares at the time of purchase.
Other Types of Investors. Class R6 shares may also be purchased by Prudential, certain programs or accounts sponsored by Prudential, and PGIM Funds, including PGIM funds-of-funds.
Class R6 shares may only be purchased from financial intermediaries who offer such shares.
Class R6 shares are offered to eligible investors as described in this Prospectus. Neither the Fund nor its affiliates shall make or pay fees associated with or similar to sub-accounting, networking, revenue sharing, or certain administrative fees with respect to Class R6 shares.
Visit our website at www.pgim.com/investments
29
How Financial Intermediaries are Compensated for Selling Fund Shares
The PGIM Funds are distributed by Prudential Investment Management Services LLC (the “Distributor”), a broker-dealer that is licensed to sell securities. The Distributor generally does not sell shares of the PGIM Funds directly to the public, but instead markets and sells the PGIM Funds through other broker-dealers, 401(k) providers, retirement plan administrators, and other financial intermediaries. Each PGIM Fund is managed by the Manager.
Only persons licensed with the Financial Industry Regulatory Authority, Inc. (“FINRA”), as a registered representative (often referred to as a broker or financial adviser) and associated with a specific financial services firm may sell shares of a mutual fund to you, or to a retirement plan in which you participate.
Rule 12b-1 Fees & Sales Charges. The Distributor has agreements in place with financial intermediaries defining how much each firm will be paid for the sale of a particular mutual fund from front-end sales charges, if any, paid by Fund shareholders and from fees paid to the Distributor by the Fund pursuant to Rule 12b-1 under the 1940 Act (“Rule 12b-1”). These financial intermediaries then pay their registered representatives who sold you the Fund some or all of what they received from the Distributor. The registered representatives may receive a payment when the sale is made and can, in some cases, continue to receive ongoing payments while you are invested in the Fund. The Distributor may change at any time, without prior notice, the amount of Rule 12b-1 fees that it pays (when the sale is made and/or any ongoing payments) to financial intermediaries and registered representatives so that the Distributor may retain all or a portion of such fees.
“Revenue Sharing” Payments. In addition to the compensation received by financial intermediaries as described above, the Manager or certain of its affiliates (but not the Distributor) may make additional payments (which are often referred to as “revenue sharing” payments) to the financial intermediaries from the Manager's or certain affiliates' own resources, including from the profits derived from management fees or other fees received from the Fund, without additional direct or indirect cost to the Fund or its shareholders, provided that no such additional payments to financial intermediaries are made with respect to the Fund’s Class R6 shares. Revenue sharing payments are in addition to the front-end sales charges paid by Fund shareholders or fees paid pursuant to plans adopted in accordance with Rule 12b-1. The Manager or certain of its affiliates may revise the terms of any existing revenue sharing arrangement, and may enter into additional revenue sharing arrangements with other financial intermediaries in the future.
Revenue sharing arrangements are intended to foster the sale of Fund shares and/or to compensate financial intermediaries for assisting in marketing or promotional activities in connection with the sale of Fund shares. In exchange for revenue sharing payments, the Fund generally expects to receive the opportunity for the Fund to be sold through the financial intermediaries' sales force or access to third-party platforms or other marketing programs, including but not limited to mutual fund “supermarket” platforms or other sales programs. To the extent that financial intermediaries receiving revenue sharing payments sell more shares of the Fund, the Manager and Distributor benefit from the increase in Fund assets as a result of the management and distribution fees they receive from the Fund, respectively. Increased sales of Fund shares also may benefit shareholders, since an increase in Fund assets may allow the Fund to expand its investment opportunities, and increased Fund assets may result in reduced Fund operating expenses.
From time to time the Manager or an affiliate of the Fund (and not the Fund itself) may pay certain administrative fees in order to make the Fund available to shareholders. Such fees are not included in, and are paid separate and apart from, any revenue sharing payments.
Revenue sharing payments, as well as the other types of payments described above, may provide an incentive for financial intermediaries and their registered representatives to recommend or sell shares of the Fund to you and in doing so may create conflicts of interest between the firms' financial interests and their duties to customers.
If your Fund shares are purchased through a retirement plan, the Manager or certain of its affiliates (but not the Distributor) may also make revenue sharing payments to the plan's recordkeeper or an affiliate, which generally is not a registered broker-dealer.
30
PGIM Jennison Small Company Fund
It is likely that financial intermediaries that execute portfolio transactions for the Fund will include those firms with which the Manager and/or certain of its affiliates have entered into revenue sharing arrangements. Neither the Manager nor any subadviser may consider sales of Fund shares as a factor in the selection of broker-dealers to execute portfolio transactions for the Fund. The Manager and certain of its affiliates will not use Fund brokerage as any part of revenue sharing payments to financial intermediaries.
Revenue sharing payments are usually calculated based on a percentage of Fund sales and/or Fund assets attributable to a particular financial services firm. Payments may also be based on other criteria or factors, for example, a fee per each transaction. Specific payment formulas are negotiated based on a number of factors, including, but not limited to, reputation in the industry, ability to attract and retain assets, target markets, customer relationships and scope and quality of services provided. The Manager and/or certain of its affiliates make such payments to financial intermediaries in amounts that generally range from 0.02% up to 0.20% of Fund assets serviced and maintained by the financial intermediaries or from 0.10% to 0.25% of sales of Fund shares attributable to the firm. In addition, the Manager and/or certain of its affiliates may pay flat fees on a one-time or irregular basis for the initial set-up of the Fund on a financial services intermediary’s systems, participation or attendance at a financial services firm's meeting, or for other reasons. These amounts are subject to change. In addition, the costs associated with visiting the financial intermediaries to make presentations, and/or train and educate the personnel of the financial intermediaries, may be paid by the Manager and/or certain of its affiliates, subject to applicable FINRA regulations.
Please contact the registered representative (or his or her firm) who sold shares of the Fund to you for details about any payments the financial intermediary may receive from the Manager and/or certain of its affiliates. You should review your financial intermediary’s disclosure and/or talk to your financial intermediary to obtain more information on how this compensation may have influenced your financial intermediary’s recommendation of the Fund. Additional information regarding these revenue sharing payments is included in the SAI which is available to you at no additional charge.
Other Payments Received by Financial Intermediaries
Administrative, Sub-Accounting and Networking Fees. In addition to, rather than in lieu of, the fees that the Fund may pay to financial intermediaries as described above, and the fees the Fund pays to the Transfer Agent, the Transfer Agent or its affiliates may enter into additional agreements on behalf of the Fund with financial intermediaries pursuant to which the Fund will pay financial intermediaries for certain administrative, sub-accounting and networking services, provided that no such additional payments to financial intermediaries are made with respect to the Fund’s Class R6 shares. These services include maintenance of shareholder accounts by the firms, such as recordkeeping and other activities that otherwise would be performed by the Transfer Agent. Sub-accounting services encompass activities that reduce the burden of recordkeeping to the Fund. Administrative fees are paid to a firm that undertakes, for example, shareholder communications on behalf of the Fund. Networking services are services undertaken to support the electronic transmission of shareholder purchase and redemption orders through the National Securities Clearing Corporation (“NSCC”).
These payments, as discussed above, are paid out of Fund assets and generally based on either (1) a percentage of the average daily net assets of Fund shareholders serviced by a financial intermediary or (2) a fixed dollar amount for each account serviced by a financial services firm. From time to time, the Manager or certain of its affiliates (but not the Distributor) also may pay a portion of the fees for the services to the financial intermediaries at their own expense and out of their own resources.
In addition, the Fund reimburses the Distributor for NSCC fees that are invoiced to the Distributor as the party to the Agreement with NSCC for the administrative services provided by NSCC to the Fund and its shareholders. These administrative services provided by NSCC to the Fund and its shareholders include transaction processing and settlement through Fund/SERV, electronic networking services to support the transmission of shareholder purchase and redemption orders to and from financial intermediaries, and related recordkeeping provided by NSCC to the Fund and its shareholders. These payments are generally based on a transaction fee rate for certain administrative services plus a fee for other administrative services.
Visit our website at www.pgim.com/investments
31
Shareholder Services Fee. The Fund has adopted a Shareholder Services Plan with respect to Class R2 and Class R4 shares. Under the terms of the Shareholder Services Plan, the Fund's Class R2 and Class R4 shares are authorized to pay to PMFS, its affiliates or third-party service providers, as compensation for services rendered to the shareholders of such Class R2 or Class R4 shares, a shareholder service fee at an annual rate of 0.10% of the Fund’s average daily net assets attributable to Class R2 or Class R4 shares of the Fund, as applicable.
Pursuant to the Shareholder Services Plan, the Fund's Class R2 or Class R4 shares may pay for shareholder services and/or account maintenance services and other similar personal services and/or services related to the maintenance of shareholder accounts as contemplated by FINRA Rule 2341 or any successor thereto. Because service fees are ongoing, over time they will increase the cost of an investment in the Fund. With respect to the Class R2 shares, these services are in addition to those services that may be provided under the distribution plan for Class R2 shares.
Anti-Money Laundering
In accordance with federal law, the Fund has adopted policies designed to deter money laundering. Under the policies, the Fund will not knowingly engage in financial transactions that involve proceeds from unlawful activity or support terrorist activities, and shall file government reports, including those concerning suspicious activities, as required by applicable law. The Fund will seek to confirm the identity of potential shareholders to include both individuals and entities through documentary and non-documentary methods. Non-documentary methods may include verification of name, address, date of birth and tax identification number with selected credit bureaus. The Fund's Anti-Money Laundering Compliance Officer oversees the Fund's anti-money laundering policies.
Understanding the Price You'll Pay
The price you pay for each share of the Fund is based on the share value. The share value of a mutual fund—known as the net asset value or NAV—is determined by a simple calculation: it's the total value of the Fund (assets minus liabilities) divided by the total number of shares outstanding. For example, if the value of the investments held by Fund XYZ (minus its liabilities) is $1,000 and there are 100 shares of Fund XYZ owned by shareholders, the value of one share of the Fund—or the NAV—is $10 ($1,000 divided by 100).
Mutual Fund Shares
The NAV of mutual fund shares changes every day because the value of a fund's portfolio changes constantly. For example, if Fund XYZ holds ACME Corp. bonds in its portfolio and the price of ACME bonds goes up, while the value of the Fund's other holdings remains the same and expenses don't change, the NAV of Fund XYZ will increase.
The Fund's NAV will be determined every day on which the Fund is open as of the close of regular trading on the New York Stock Exchange (“NYSE”) (generally, 4:00 p.m. Eastern Time). The Fund's portfolio securities are valued based upon market quotations or, if market quotations are not readily available, at fair value as determined in good faith by the Manager, as the Board's valuation designee. In this capacity, the Manager has adopted pricing methodologies for determining the fair value of certain types of securities and other assets held by the Fund that do not have quoted market prices, including the use of other pricing sources, such as bid prices supplied by a principal market maker and evaluated prices supplied by pricing vendors that employ analytic methodologies that take into account the prices of similar securities and other market factors.
If the Fund determines that a market quotation for a security is not reliable based on, among other things, events or market conditions that occur with respect to one or more securities held by the Fund or the market as a whole, after the quotation is derived or after the closing of the primary market on which the security is traded, but before the time that the Fund's NAV is determined, the Fund may use “fair value pricing,” which is implemented by a valuation committee (“Valuation Committee”) consisting of representatives of the Manager. The subadviser often provides
32
PGIM Jennison Small Company Fund
relevant information for the Valuation Committee meeting. Non-U.S. securities markets are open for trading on weekends and other days when the Fund does not price shares. Therefore, the value of the Fund’s shares may change on days when you will not be able to purchase or redeem the Fund’s shares.
Investments in open-end non-exchange-traded mutual funds will be valued at their NAV as determined as of the close of the NYSE on the date of valuation, which will reflect the mutual fund’s fair valuation procedures.
Different valuation methods may result in differing values for the same security. The fair value of a portfolio security that the Fund uses to determine its NAV may differ from the security's quoted or published price. If the Fund needs to implement fair value pricing after the NAV publishing deadline but before shares of the Fund are processed, the NAV you receive or pay may differ from the published NAV price. The prospectuses of any other mutual funds in which the Fund invests will explain each fund’s procedures and policies with respect to the use of fair value pricing.
Fair value pricing procedures are designed to result in prices for the Fund's securities and its NAV that are reasonable in light of the circumstances which make or have made market quotations unavailable or unreliable, and may have the effect of reducing arbitrage opportunities available to short-term traders. There is no assurance, however, that fair value pricing will accurately reflect the market value of a security or that it will prevent dilution of the Fund's NAV by short-term traders.
What Price Will You Pay for Shares of the Fund? For Class A shares, you'll pay the public offering price, which is the NAV next determined after we receive your order to purchase, plus an initial sales charge (unless you're entitled to a waiver). For all other share classes, you will pay the NAV next determined after we receive your order to purchase (remember, there are no up-front sales charges for these share classes). Your broker may charge you a separate or additional fee for purchases of shares. Unless regular trading on the NYSE closes before 4:00 p.m. Eastern Time, or later than 4:00 p.m. Eastern Time, your order to purchase must be received by 4:00 p.m. Eastern Time in order to receive that day's NAV. In the event that regular trading on the NYSE closes before 4:00 p.m. Eastern Time, you will receive the following day's NAV if your order to purchase is received after the close of regular trading on the NYSE. The Fund will not treat an intraday unscheduled disruption in NYSE trading as a closure of the NYSE and will price its shares as of 4:00 p.m. Eastern Time, if the particular disruption directly affects only the NYSE. We deem an order received when it is received by the Transfer Agent at its processing center. If you submit your order through a broker or other financial intermediary, it may be deemed received when received by the broker or financial intermediary.
Each business day, the Fund's current NAV per share is made available at www.pgim.com/investments/mutual-funds/prices.
Additional Shareholder Services
As a Fund shareholder, you can take advantage of the following services and privileges:
Automatic Reinvestment. As we explained in the “Fund Distributions and Tax Issues” section, the Fund pays out—or distributes—its net investment income and net capital gains to all shareholders. For your convenience, we will automatically reinvest your distributions in the Fund at NAV, without any sales charge. If you want your distributions paid in cash, you can indicate this preference on your application, or by notifying your broker or the Transfer Agent in writing (at the address below) at least five business days before the date we determine who receives dividends. For accounts held at the Transfer Agent (“PMFS”), distributions of $10.00 or less on non-retirement accounts will not be paid out in cash, but will be automatically reinvested into your account.
Prudential Mutual Fund Services LLC
P.O. Box 9658
Providence, RI 02940
P.O. Box 9658
Providence, RI 02940
Automatic Investment Plan (“AIP”). You can make regular purchases of the Fund by having a fixed amount of money automatically withdrawn from your bank or brokerage account at specified intervals. The minimum for subsequent investments through newly-established AIP accounts must be at least $50 monthly.
Visit our website at www.pgim.com/investments
33
Retirement Plan Services. Prudential offers a wide variety of retirement plans for individuals and institutions, including large and small businesses. For information on IRAs, including Roth IRAs or SEP-IRAs for a one-person business, please contact your financial adviser. If you are interested in opening a 401(k) or other company-sponsored retirement plan (SIMPLE IRAs, SEP plans, Keoghs, 403(b)(7) plans, pension and profit-sharing plans), your financial adviser will help you determine which retirement plan best meets your needs. Complete instructions about how to establish and maintain your plan and how to open accounts for you and your employees will be included in the retirement plan kit you receive in the mail.
Systematic Withdrawal Plan. A Systematic Withdrawal Plan is available that will provide you with monthly, quarterly, semi-annual or annual redemption checks. The Systematic Withdrawal Plan is not available to participants in certain retirement plans. Please contact PMFS at (800) 225-1852 for more details.
Reports to Shareholders. Every year we will send you an updated summary prospectus. We will also send or make available to you pursuant to Rule 30e-3 under the 1940 Act, an annual report and a semi-annual report, which contain important financial information about the Fund. To reduce Fund expenses, we may send or make available one annual shareholder report, one semi-annual shareholder report and one summary prospectus per household, unless you instruct us or your financial intermediary otherwise. If each Fund shareholder in your household would like to receive a copy of the Fund's summary prospectus and shareholder reports, please call us toll free at (800) 225-1852. We will begin sending additional copies of these documents within 30 days of receipt of your request.
HOW TO SELL YOUR SHARES
You can sell your Fund shares for cash at any time, subject to certain restrictions. For more information about these restrictions, see “Restrictions on Sales” below.
When you sell shares of the Fund—also known as redeeming your shares—the price you will receive will be the NAV next determined after the Transfer Agent or your financial intermediary receives your order to sell (less any applicable CDSC).
Shares Held by Financial Intermediaries. If your financial intermediary holds your shares, your financial intermediary must receive your order to sell no later than the time regular trading on the NYSE closes—which is usually 4:00 p.m. Eastern Time—to process the sale on that day. In the event that regular trading on the NYSE closes before 4:00 p.m. Eastern Time, you will receive the following day's NAV if your order to sell is received after the close of regular trading on the NYSE.
Shares Held by the Transfer Agent. If the Transfer Agent holds your shares, PMFS must receive your order to sell no later than the time regular trading on the NYSE closes—which is usually 4:00 p.m. Eastern Time—to process the sale on that day. In the event that regular trading on the NYSE closes before 4:00 p.m. Eastern Time, you will receive the following day's NAV if your order to sell is received after the close of regular trading on the NYSE. You may contact the Transfer Agent at:
Prudential Mutual Fund Services LLC
P.O. Box 9658
Providence, RI 02940
P.O. Box 9658
Providence, RI 02940
Payment for Shares You Have Sold
Shares Held by Financial Intermediaries. Typically, if your order to sell shares is received in good order, payment will be credited to your account within 1 to 3 business days after the order is received, but in any event within seven days. Your broker may charge you a separate or additional fee for sales of shares.
Shares Held by the Transfer Agent. Typically, if your order to sell shares is received in good order, we will send payment on the next business day, but in any event within seven days, regardless of the method of payment (e.g., payment by check, wire or electronic transfer (“ACH”)).
34
PGIM Jennison Small Company Fund
Restrictions on Sales
If you are selling shares you recently purchased with a check, we may delay sending you the proceeds until your check clears, which can take up to seven days from the purchase date.
As a result of restrictions on withdrawals and transfers imposed by Section 403(b) of the Internal Revenue Code of 1986, as amended, we may consider a redemption request to not be in good order until we obtain information from your employer that is reasonably necessary to ensure that the payment is in compliance with such restrictions, if applicable. In such an event, the redemption request will not be in good order and we will not process it until we obtain information from your employer.
In addition, there are certain times when you may not be able to sell shares of the Fund or when we may delay paying you the proceeds from a sale. As permitted by the SEC, the former may happen only during unusual market conditions or emergencies when the Fund is unable to determine the value of its assets or sell its holdings. For more information, see the SAI.
If you hold your shares directly with the Transfer Agent, you will need to have the signature on your sell order Medallion signature guaranteed if:
◾
You are selling more than $100,000 of shares;
◾
You want the redemption proceeds made payable to someone that is not in the Transfer Agent’s records;
◾
You want the redemption proceeds sent to an address that is not in the Transfer Agent’s records;
◾
You are a business or a trust; or
◾
You are redeeming due to the death of the shareholder or on behalf of the shareholder.
The Medallion signature guarantee may be obtained from an authorized officer from a bank, broker, dealer, securities exchange or association, clearing agency, savings association, or credit union that is participating in one of the recognized Medallion guarantee programs (STAMP, SEMP, or NYSE MSP), but not from a notary public. The Medallion signature guarantee must be appropriate for the dollar amount of the transaction. The Transfer Agent reserves the right to reject sale transactions where the value of the transaction exceeds the value of the surety coverage indicated on the Medallion imprint. The Fund may change the signature guarantee requirements from time to time without prior notice to shareholders. For more information, see the SAI.
How the Fund Pays for Shares You Have Sold
Under normal market conditions, the Fund expects to pay for shares that you have sold primarily by using cash or cash equivalents in its portfolio or selling portfolio assets to generate cash. Supplementally, the Fund may also raise cash to pay for sold shares by short-term borrowing in the form of overdrafts permitted by the Fund’s custodian bank and/or by short-term borrowing from a group of banks through an unsecured credit facility, which is intended to provide the Fund with a temporary additional source of liquidity. In certain circumstances the Fund reserves the right to pay for sold shares by giving you securities from the Fund’s portfolio. If you receive securities, you would incur transaction costs in converting the securities to cash, and you may receive less for the securities than the price at which they were valued for redemption purposes.
During stressed market conditions, it may be impractical or impossible to raise sufficient cash to pay for sold shares through the primary methods described above. In these circumstances, the Fund would be more likely to rely more heavily on the credit facility as a source of liquidity, as described above.
Contingent Deferred Sales Charge (“CDSC”)
If you sell Class C shares within 12 months of purchase, you will have to pay a CDSC of 1.00%. In addition, if you purchase $1 million or more of Class A shares, although you are not subject to an initial sales charge, you are subject to a CDSC of 1.00% for shares redeemed within 12 months of purchase. The CDSC is waived for certain retirement and/or benefit plans. To keep the CDSC as low as possible, we will sell amounts representing shares in the following order:
◾
Amounts representing shares you purchased with reinvested dividends and distributions,
Visit our website at www.pgim.com/investments
35
◾
Amounts representing the increase in NAV above the total amount of payments for shares made during the past 12 months for Class A shares (in certain cases) and 12 months for Class C shares, and
◾
Amounts representing the cost of shares held beyond the CDSC period (12 months for Class A shares (in certain cases) and 12 months for Class C shares).
Since shares that fall into any of the categories listed above are not subject to the CDSC, selling them first helps you to avoid—or at least minimize—the CDSC.
Having sold the exempt shares first, if there are any remaining shares that are subject to the CDSC, we will apply the CDSC to amounts representing the cost of shares held for the longest period of time within the applicable CDSC period.
The CDSC is calculated based on the lesser of the original purchase price or the net asset value at redemption. The rate decreases on the anniversary date of your purchase.
The holding period for purposes of determining the applicable CDSC will be calculated from the anniversary date of the purchase, excluding any time Class C shares were held in a money market fund.
Waiver of the CDSC—Class A Shares and Class C Shares
The CDSC will be waived if the Class A shares and Class C shares are sold:
◾
After a shareholder is deceased or permanently disabled (or, in the case of a trust account, after the death or permanent disability of the grantor). This waiver applies to individual shareholders, as well as shares held in joint tenancy, provided the shares were purchased before the death or permanent disability;
◾
To provide for certain distributions—made without IRS penalty—from a qualified or tax-deferred retirement plan, benefit plan, IRA or Section 403(b) custodial account; and
◾
To withdraw excess contributions from a qualified or tax-deferred retirement plan, IRA or Section 403(b) custodial account.
For more information, see the SAI.
Involuntary Redemption of Small Accounts Held by the Transfer Agent
If the value of your account with PMFS is less than $500 for any reason, we may sell your shares (without charging any CDSC) and close your account. We would do this to minimize the Fund's expenses paid by other shareholders. The involuntary sale provisions do not apply to Automatic Investment Plan (“AIP”) accounts, employee savings plan accounts, payroll deduction plan accounts, retirement accounts (such as a 401(k) plan, an IRA or other qualified or tax-deferred plan or account), omnibus accounts, and accounts for which a broker or other financial intermediary is responsible for recordkeeping. Prior thereto, if you make a sale that reduces your account value to less than the threshold, we may sell the rest of your shares (without charging any CDSC) and close your account; this involuntary sale does not apply to shareholders who own their shares as part of a retirement account. For more information, see “Purchase, Redemption and Pricing of Fund Shares—Involuntary Redemption” in the SAI.
Account Maintenance Fee for Accounts Held by the Transfer Agent
If the value of your Class A, Class C, or Class Z account with PMFS is less than $10,000, with certain exclusions, a $15 annual account maintenance fee will be deducted from your account during the 4th calendar quarter of each year. Any applicable CDSC on the shares redeemed to pay the account maintenance fee will be waived. For more information, see “Purchase, Redemption and Pricing of Fund Shares—Account Maintenance Fee” in the SAI.
90-Day Repurchase Privilege
After you redeem your shares, you have a 90-day period during which you may reinvest back into your account any of the redemption proceeds in shares of the same Fund without paying an initial sales charge. In order to take advantage of this privilege, you must notify the Transfer Agent or your broker at the time of the repurchase. This privilege can only be used once in a 12-month period. For more information, see the SAI.
36
PGIM Jennison Small Company Fund
The terms of this privilege may vary by financial intermediary. For more information, see “Appendix A: Waivers and Discounts Available From Certain Financial Intermediaries.”
Retirement Plans
To sell shares and receive a distribution from your retirement account, call your broker or the Transfer Agent for a distribution request form. There are special distribution and income tax withholding requirements for distributions from retirement plans and you must submit a withholding form with your request to avoid delay. If your retirement plan account is held for you by your employer or plan trustee, you must arrange for the distribution request to be signed and sent by the plan administrator or trustee. For additional information, see the SAI.
HOW TO EXCHANGE YOUR SHARES
You can generally exchange your shares of the Fund for shares of the same class in certain other PGIM Funds—including PGIM Government Money Market Fund—if you satisfy the minimum investment requirements. For example, you can exchange Class A shares of the Fund for Class A shares of other funds in the PGIM Funds mutual fund family, but you can’t exchange Class A shares for a different share class of another PGIM Fund. However, Class R2 and Class R4 shares may not be exchanged for shares of the same class in the Prudential Day One Funds. In addition, Class R6 shares may not be exchanged for Class R6 shares of the Prudential Day One Funds or the PGIM 60/40 Allocation Fund.
After an exchange, at redemption, any CDSC will be calculated from the date of the initial purchase, excluding any time that Class C shares were held in PGIM Government Money Market Fund. We may change the terms of any exchange privilege after giving you 60 days' notice.
There is no sales charge for exchanges. However, if you exchange—and then sell—shares within the applicable CDSC period, you must still pay the applicable CDSC. At the time of exchange, CDSC liable shares and free shares move proportionally according to the percentage of total shares you are exchanging. If you have exchanged Class C shares into PGIM Government Money Market Fund, the time you hold the Class C shares in the money market fund will not be counted in calculating the required holding period for CDSC liability.
For investors in certain programs sponsored by financial intermediaries that offer shares of the Fund, or whose programs are available through financial intermediaries that offer shares of the Fund for mutual fund “wrap” or asset allocation programs or mutual fund “supermarket” programs, an exchange may be made from Class A to Class Z shares of the Fund in certain limited circumstances. Contact your program sponsor or financial intermediary with any questions.
Exchanging Shares Held by a Financial Intermediary. If you hold shares through a financial intermediary, you must exchange shares through your financial intermediary.
Exchanging Shares Held by the Transfer Agent. If you hold shares through the Transfer Agent, contact your financial advisor or PMFS at (800) 225-1852 or write to PMFS at:
Prudential Mutual Fund Services LLC
P.O. Box 9658
Providence, RI 02940
P.O. Box 9658
Providence, RI 02940
If you participate in any fee-based program where the Fund is an available investment option, you may arrange with the Transfer Agent or your recordkeeper to exchange your Class A shares, if any, for Class Z shares when you elect to participate in the fee-based program. When you no longer participate in the program, you may arrange with the Transfer Agent or your recordkeeper to exchange all of your Class Z shares, including shares purchased while you were in the program, for Class A shares.
Visit our website at www.pgim.com/investments
37
Remember, as we explained in the section entitled “Fund Distributions and Tax Issues—If You Sell or Exchange Your Shares,” exchanging shares is considered a sale for tax purposes. Therefore, if the shares you exchange are worth more than the amount that you paid for them, you may have to pay capital gains tax. For additional information about exchanging shares, see the SAI.
Frequent Purchases and Redemptions of Fund Shares
The Fund seeks to prevent patterns of frequent purchases and redemptions of Fund shares by its shareholders. Frequent purchases and sales of shares of the Fund may adversely affect Fund performance and the interests of long-term investors. When a shareholder engages in frequent or short-term trading, the Fund may have to sell portfolio securities to have the cash necessary to redeem the shareholder's shares. This can happen when it is not advantageous to sell any securities, so the Fund's performance may be hurt. When large dollar amounts are involved, frequent trading can also make it difficult to use long-term investment strategies because the Fund cannot predict how much cash it will have to invest. In addition, if the Fund is forced to liquidate investments due to short-term trading activity, it may incur increased brokerage and tax costs. Similarly, the Fund may bear increased administrative costs as a result of the asset level and investment volatility that accompanies patterns of short-term trading. Moreover, frequent or short-term trading by certain shareholders may cause dilution in the value of Fund shares held by other shareholders. Funds that invest in non-U.S. securities may be particularly susceptible to frequent trading because time zone differences among international stock markets can allow a shareholder engaging in frequent trading to exploit fund share prices that may be based on closing prices of non-U.S. securities established some time before the Fund calculates its own share price. Funds that invest in certain fixed income securities, such as high-yield bonds or certain asset-backed securities, may also constitute an effective vehicle for a shareholder's frequent trading strategy.
The Fund does not knowingly accommodate or permit frequent trading, and the Board has adopted policies and procedures designed to discourage or prevent frequent trading activities by Fund shareholders. In an effort to prevent such practices, the Fund's Transfer Agent monitors trading activity on a daily basis. The Fund has implemented a trading policy that limits the number of times a shareholder may purchase Fund shares or exchange into the Fund and then sell those shares within a specified period of time (a “round-trip transaction”) as established by the Fund's Chief Compliance Officer (“CCO”). The CCO is authorized to set and modify the parameters of the trading policy at any time as required to prevent the adverse impact of frequent trading on Fund shareholders.
The CCO has defined frequent trading as one or more round-trip transactions in shares of the Fund within a 30-day period. If this occurs, the shareholder’s account will be subject to a 60-day warning period. If a second round-trip occurs before the conclusion of the 60-day warning period, a trading suspension will be placed on the account by the Fund’s Transfer Agent that will remain in effect for 90 days. The trading suspension will relate to purchases and exchange purchases (but not redemptions) in the Fund in which the frequent trading occurred. Exceptions to the trading policy will not normally be granted.
Transactions in the PGIM money market funds, exchange-traded funds and PGIM Short-Term Corporate Bond Fund are excluded from this trading policy. In addition, transactions by affiliated PGIM Funds or certain unaffiliated funds, which are structured as “funds-of-funds,” and invest primarily in other mutual funds within the PGIM Fund family, are not subject to the limitations of the trading policy and are not considered frequent or short-term trading.
This trading policy does not apply to systematic purchases and redemptions (e.g., payroll purchases, systematic withdrawals and rebalancing transactions or other similar transactions not initiated by a shareholder or financial professional on the transaction date). Generally, purchases and redemptions will not be considered “systematic” unless the transaction is pre-established or scheduled for a specific date.
The Fund reserves the right to reject or cancel, without prior notice, all additional purchases or exchanges into the Fund by a shareholder. Moreover, the Fund may direct a broker-dealer or other intermediary to block a shareholder account from future trading in the Fund. The Transfer Agent will monitor daily trading activity above a certain threshold, which may be changed from time to time, over a rolling 90-day period. If a purchase into the Fund is rejected or canceled, the shareholder will receive a return of the purchase amount.
38
PGIM Jennison Small Company Fund
If the Fund is offered to qualified plans on an omnibus basis or if Fund shares may be purchased through other omnibus arrangements, such as through a financial intermediary such as a broker-dealer, a bank, an insurance company separate account, an investment adviser, or an administrator or trustee of a retirement plan (“Intermediaries”) that holds your shares in an account under its name, Intermediaries maintain the individual beneficial owner records and submit to the Fund only aggregate orders combining the transactions of many beneficial owners. The Fund itself generally cannot monitor trading by particular beneficial owners. The Fund has notified Intermediaries in writing that it expects the Intermediaries to impose restrictions on transfers by beneficial owners. Intermediaries may impose different or stricter restrictions on transfers by beneficial owners.
The Transfer Agent also reviews aggregate omnibus net flows above a certain threshold. In cases where the activity is considered unusual, the Intermediary may be contacted by the Transfer Agent to obtain additional information. The Transfer Agent has the authority to cancel all or a portion of the trade if the information reveals that the activity relates to potential offenders. Where appropriate, the Transfer Agent may request that the Intermediary block a financial adviser or client from accessing the Fund. If necessary, the Fund may be removed from a particular Intermediary’s platform.
Shareholders seeking to engage in frequent trading activities may use a variety of strategies to avoid detection and, despite the efforts of the Fund to prevent such trading, there is no guarantee that the Fund, the Transfer Agent or Intermediaries will be able to identify these shareholders or curtail their trading practices. The Fund does not have any arrangements intended to permit trading of its shares in contravention of the policies described above.
Telephone Redemptions or Exchanges
You may redeem your shares of the Fund if the proceeds of the redemption do not exceed $250,000 or exchange your shares in any amount by calling the Fund at (800) 225-1852 and communicating your instructions in good order to a customer service representative before 4:00 p.m. Eastern Time. You will receive a redemption or exchange amount based on that day's NAV. Certain restrictions apply; please see the section entitled “How to Sell Your Shares—Restrictions on Sales” above for additional information. In the event that regular trading on the NYSE closes before 4:00 p.m. Eastern Time, you will receive the following day's NAV if your order to sell or exchange is received after the close of regular trading on the NYSE.
The Transfer Agent will record your telephone instructions and request specific account information before redeeming or exchanging shares. The Fund will not be liable for losses due to unauthorized or fraudulent telephone instructions if it follows instructions that it reasonably believes are made by the shareholder. If the Fund does not follow reasonable procedures, it may be liable.
In the event of drastic economic or market changes, you may have difficulty in redeeming or exchanging your shares by telephone. If this occurs, you should consider redeeming or exchanging your shares by mail or through your broker.
The telephone redemption and exchange procedures may be modified or terminated at any time. If this occurs, you will receive a written notice from the Fund.
Expedited Redemption Privilege
If you have selected the Expedited Redemption Privilege, you may have your redemption proceeds sent directly to your bank account. Expedited redemption requests may be made by telephone or letter, must be received by the Transfer Agent prior to 4:00 p.m. Eastern Time to receive a redemption amount based on that day's NAV and are subject to the terms and conditions regarding the redemption of shares. In the event that regular trading on the NYSE closes before 4:00 p.m. Eastern Time, you will receive the following day's NAV if your order to sell is received after the close of regular trading on the NYSE. For more information, see the SAI. The Expedited Redemption Privilege may be modified or terminated at any time without notice.
Visit our website at www.pgim.com/investments
39
FINANCIAL HIGHLIGHTS
Introduction
The financial highlights will help you evaluate the Fund's financial performance for the past five fiscal years or periods (as applicable). Certain information reflects financial results for a single fund class share. The total return in each chart represents the rate that a shareholder would have earned (or lost) on an investment in the Fund, assuming investment at the start of the period and reinvestment of all dividends and other distributions. The information is for the periods indicated.
These financial highlights for the fiscal years ended September 30, 2020 and after were derived from the financial statements audited by PricewaterhouseCoopers LLP, an independent registered public accounting firm, whose report on those financial statements was unqualified. The information for the fiscal years or periods (as applicable) prior to the fiscal year ended September 30, 2020 was audited by another independent registered public accounting firm.
A copy of the Fund's annual report, including the Fund's audited financial statements and report of independent registered public accounting firm, is available upon request, at no charge, as described on the back cover of this Prospectus.
|
Class A Shares | |||||
|
|
Year Ended September 30, | ||||
|
|
2022 |
2021 |
2020 |
2019 |
2018 |
|
Per Share Operating Performance(a): | |||||
|
Net Asset Value, Beginning of Year |
$28.33 |
$20.68 |
$21.08 |
$26.83 |
$25.80 |
|
Income (loss) from investment operations: | |||||
|
Net investment income (loss) |
0.01 |
(0.10) |
(0.04)(b) |
(0.06) |
(0.04) |
|
Net realized and unrealized gain (loss) on investment and foreign currency
transactions |
(3.78) |
11.23 |
1.55 |
(1.94) |
3.14 |
|
Total from investment operations |
(3.77) |
11.13 |
1.51 |
(2.00) |
3.10 |
|
Less Dividends and Distributions: | |||||
|
Dividends from net investment income |
(0.08) |
- |
- |
(0.05) |
(0.02) |
|
Distributions from net realized gains |
(8.10) |
(3.48) |
(1.91) |
(3.70) |
(2.05) |
|
Total dividends and distributions |
(8.18) |
(3.48) |
(1.91) |
(3.75) |
(2.07) |
|
Net asset value, end of Year |
$16.38 |
$28.33 |
$20.68 |
$21.08 |
$26.83 |
|
Total Return(c): |
(20.52)% |
58.28% |
7.29% |
(5.91)% |
12.77% |
|
| |||||
|
Ratios/Supplemental Data: | |||||
|
Net assets, end of Year (000) |
$438,659 |
$616,160 |
$447,491 |
$520,351 |
$719,750 |
|
Average net assets (000) |
$553,509 |
$575,482 |
$449,980 |
$577,174 |
$777,206 |
|
Ratios to average net assets(d): | |||||
|
Expenses after waivers and/or expense reimbursement |
1.14% |
1.13% |
1.18% |
1.17% |
1.13% |
|
Expenses before waivers and/or expense reimbursement |
1.14% |
1.13% |
1.18% |
1.17% |
1.13% |
|
Net investment income (loss) |
0.07% |
(0.38)% |
(0.21)% |
(0.27)% |
(0.15)% |
|
Portfolio turnover rate(e) |
53% |
64% |
58% |
30% |
43% |
|
(a) |
Calculated based on average shares outstanding during the year. |
|
(b) |
The per share amount of net investment income (loss) does not directly correlate to the amounts reported in the Statement of Operations due to class specific expenses. |
|
(c) |
Total return does not consider the effects of sales loads. Total return is calculated assuming a purchase of a share on the first day and a sale on the last day of each year
reported and includes reinvestment of dividends and distributions, if any. Total returns may reflect adjustments to conform to GAAP. |
|
(d) |
Does not include expenses of the underlying funds in which the Fund invests. |
|
(e) |
The Fund's portfolio turnover rate is calculated in accordance with regulatory requirements, without regard to transactions involving short-term investments, certain derivatives
and in-kind transactions (if any). If such transactions were included, the Fund's portfolio turnover rate may be higher. |
40
PGIM Jennison Small Company Fund
|
Class C Shares | |||||
|
|
Year Ended September 30, | ||||
|
|
2022(a) |
2021(a) |
2020(a) |
2019(a) |
2018(a) |
|
Per Share Operating Performance(b): | |||||
|
Net Asset Value, Beginning of Year |
$35.44 |
$33.72 |
$38.88 |
$59.08 |
$60.76 |
|
Income (loss) from investment operations: | |||||
|
Net investment income (loss) |
(0.20)(c) |
(0.36) |
(0.28)(c) |
(0.44) |
(0.48) |
|
Net realized and unrealized gain (loss) on investment and foreign currency
transactions |
(5.20) |
16.00 |
2.76 |
(4.92) |
7.00 |
|
Total from investment operations |
(5.40) |
15.64 |
2.48 |
(5.36) |
6.52 |
|
Less Dividends and Distributions: | |||||
|
Dividends from net investment income |
(0.08) |
- |
- |
(0.04) |
- |
|
Distributions from net realized gains |
(8.10) |
(13.92) |
(7.64) |
(14.80) |
(8.20) |
|
Total dividends and distributions |
(8.18) |
(13.92) |
(7.64) |
(14.84) |
(8.20) |
|
Net asset value, end of Year |
$21.86 |
$35.44 |
$33.72 |
$38.88 |
$59.08 |
|
Total Return(d): |
(21.10)% |
57.01% |
6.54% |
(6.32)% |
11.98% |
|
| |||||
|
Ratios/Supplemental Data: | |||||
|
Net assets, end of Year (000) |
$13,646 |
$21,421 |
$21,468 |
$34,527 |
$76,121 |
|
Average net assets (000) |
$18,021 |
$23,032 |
$26,313 |
$51,231 |
$80,999 |
|
Ratios to average net assets(e): | |||||
|
Expenses after waivers and/or expense reimbursement |
1.91% |
1.88% |
1.89% |
1.86% |
1.81% |
|
Expenses before waivers and/or expense reimbursement |
1.91% |
1.88% |
1.89% |
1.86% |
1.81% |
|
Net investment income (loss) |
(0.72)% |
(1.11)% |
(0.89)% |
(1.03)% |
(0.82)% |
|
Portfolio turnover rate(f) |
53% |
64% |
58% |
30% |
43% |
|
(a) |
The Fund had a 4 to 1 reverse stock split effective December 27, 2021. Prior year net asset values and per share amounts have been restated to reflect the impact of the reverse
stock split (see Note 7 in the Notes to Financial Statements). The net asset value reported at the original dates prior to the reverse stock split were $8.86, $8.43, $9.72 and
$14.77 for the years ended September 30, 2021, 2020, 2019 and 2018, respectively. |
|
(b) |
Calculated based on average shares outstanding during the year. |
|
(c) |
The per share amount of net investment income (loss) does not directly correlate to the amounts reported in the Statement of Operations due to class specific expenses. |
|
(d) |
Total return does not consider the effects of sales loads. Total return is calculated assuming a purchase of a share on the first day and a sale on the last day of each year
reported and includes reinvestment of dividends and distributions, if any. Total returns may reflect adjustments to conform to GAAP. |
|
(e) |
Does not include expenses of the underlying funds in which the Fund invests. |
|
(f) |
The Fund's portfolio turnover rate is calculated in accordance with regulatory requirements, without regard to transactions involving short-term investments, certain derivatives
and in-kind transactions (if any). If such transactions were included, the Fund's portfolio turnover rate may be higher. |
Visit our website at www.pgim.com/investments
41
|
Class R Shares | |||||
|
|
Year Ended September 30, | ||||
|
|
2022 |
2021 |
2020 |
2019 |
2018 |
|
Per Share Operating Performance(a): | |||||
|
Net Asset Value, Beginning of Year |
$27.07 |
$19.92 |
$20.40 |
$26.10 |
$25.19 |
|
Income (loss) from investment operations: | |||||
|
Net investment income (loss) |
(0.03)(b) |
(0.14) |
(0.08)(b) |
(0.09) |
(0.09) |
|
Net realized and unrealized gain (loss) on investment and foreign currency
transactions |
(3.51) |
10.77 |
1.51 |
(1.90) |
3.05 |
|
Total from investment operations |
(3.54) |
10.63 |
1.43 |
(1.99) |
2.96 |
|
Less Dividends and Distributions: | |||||
|
Dividends from net investment income |
(0.08) |
- |
- |
(0.01) |
- |
|
Distributions from net realized gains |
(8.10) |
(3.48) |
(1.91) |
(3.70) |
(2.05) |
|
Total dividends and distributions |
(8.18) |
(3.48) |
(1.91) |
(3.71) |
(2.05) |
|
Net asset value, end of Year |
$15.35 |
$27.07 |
$19.92 |
$20.40 |
$26.10 |
|
Total Return(c): |
(20.65)% |
57.95% |
7.12% |
(6.07)% |
12.54% |
|
| |||||
|
Ratios/Supplemental Data: | |||||
|
Net assets, end of Year (000) |
$111,936 |
$161,790 |
$135,920 |
$138,754 |
$172,033 |
|
Average net assets (000) |
$142,659 |
$164,085 |
$133,107 |
$149,385 |
$178,093 |
|
Ratios to average net assets(d): | |||||
|
Expenses after waivers and/or expense reimbursement |
1.33% |
1.33% |
1.35% |
1.34% |
1.33% |
|
Expenses before waivers and/or expense reimbursement |
1.58% |
1.58% |
1.60% |
1.59% |
1.58% |
|
Net investment income (loss) |
(0.13)% |
(0.58)% |
(0.43)% |
(0.46)% |
(0.34)% |
|
Portfolio turnover rate(e) |
53% |
64% |
58% |
30% |
43% |
|
(a) |
Calculated based on average shares outstanding during the year. |
|
(b) |
The per share amount of net investment income (loss) does not directly correlate to the amounts reported in the Statement of Operations due to class specific expenses. |
|
(c) |
Total return is calculated assuming a purchase of a share on the first day and a sale on the last day of each year reported and includes reinvestment of dividends and
distributions, if any. Total returns may reflect adjustments to conform to GAAP. |
|
(d) |
Does not include expenses of the underlying funds in which the Fund invests. |
|
(e) |
The Fund's portfolio turnover rate is calculated in accordance with regulatory requirements, without regard to transactions involving short-term investments, certain derivatives
and in-kind transactions (if any). If such transactions were included, the Fund's portfolio turnover rate may be higher. |
42
PGIM Jennison Small Company Fund
|
Class Z Shares | |||||
|
|
Year Ended September 30, | ||||
|
|
2022 |
2021 |
2020 |
2019 |
2018 |
|
Per Share Operating Performance(a): | |||||
|
Net Asset Value, Beginning of Year |
$31.93 |
$22.88 |
$23.05 |
$28.94 |
$27.67 |
|
Income (loss) from investment operations: | |||||
|
Net investment income (loss) |
0.10 |
(0.01) |
0.04 |
-(b) |
0.05 |
|
Net realized and unrealized gain (loss) on investment and foreign currency
transactions |
(4.54) |
12.54 |
1.70 |
(2.06) |
3.36 |
|
Total from investment operations |
(4.44) |
12.53 |
1.74 |
(2.06) |
3.41 |
|
Less Dividends and Distributions: | |||||
|
Dividends from net investment income |
(0.08) |
- |
- |
(0.13) |
(0.09) |
|
Distributions from net realized gains |
(8.10) |
(3.48) |
(1.91) |
(3.70) |
(2.05) |
|
Total dividends and distributions |
(8.18) |
(3.48) |
(1.91) |
(3.83) |
(2.14) |
|
Net asset value, end of Year |
$19.31 |
$31.93 |
$22.88 |
$23.05 |
$28.94 |
|
Total Return(c): |
(20.23)% |
58.79% |
7.69% |
(5.58)% |
13.09% |
|
| |||||
|
Ratios/Supplemental Data: | |||||
|
Net assets, end of Year (000) |
$371,658 |
$480,732 |
$493,395 |
$775,200 |
$1,539,410 |
|
Average net assets (000) |
$450,927 |
$527,437 |
$589,620 |
$1,156,293 |
$1,581,249 |
|
Ratios to average net assets(d): | |||||
|
Expenses after waivers and/or expense reimbursement |
0.81% |
0.81% |
0.82% |
0.82% |
0.81% |
|
Expenses before waivers and/or expense reimbursement |
0.81% |
0.81% |
0.82% |
0.82% |
0.81% |
|
Net investment income (loss) |
0.41% |
(0.05)% |
0.18% |
0.02% |
0.18% |
|
Portfolio turnover rate(e) |
53% |
64% |
58% |
30% |
43% |
|
(a) |
Calculated based on average shares outstanding during the year. |
|
(b) |
Amount rounds to zero. |
|
(c) |
Total return is calculated assuming a purchase of a share on the first day and a sale on the last day of each year reported and includes reinvestment of dividends and
distributions, if any. Total returns may reflect adjustments to conform to GAAP. |
|
(d) |
Does not include expenses of the underlying funds in which the Fund invests. |
|
(e) |
The Fund's portfolio turnover rate is calculated in accordance with regulatory requirements, without regard to transactions involving short-term investments, certain derivatives
and in-kind transactions (if any). If such transactions were included, the Fund's portfolio turnover rate may be higher. |
Visit our website at www.pgim.com/investments
43
|
Class R2 Shares | |||||
|
|
Year Ended September 30, |
November 28,
2017(a)
through
September 30, 2018 | |||
|
|
2022 |
2021 |
2020 |
2019 | |
|
Per Share Operating Performance(b): | |||||
|
Net Asset Value, Beginning of Period |
$30.70 |
$22.18 |
$22.48 |
$28.24 |
$28.00 |
|
Income (loss) from investment operations: | |||||
|
Net investment income (loss) |
0.01 |
(0.12) |
(0.03)(c) |
(0.06) |
0.04 |
|
Net realized and unrealized gain (loss) on investment and foreign currency
transactions |
(4.27) |
12.12 |
1.64 |
(1.97) |
2.26 |
|
Total from investment operations |
(4.26) |
12.00 |
1.61 |
(2.03) |
2.30 |
|
Less Dividends and Distributions: | |||||
|
Dividends from net investment income |
(0.08) |
- |
- |
(0.03) |
(0.01) |
|
Distributions from net realized gains |
(8.10) |
(3.48) |
(1.91) |
(3.70) |
(2.05) |
|
Total dividends and distributions |
(8.18) |
(3.48) |
(1.91) |
(3.73) |
(2.06) |
|
Net asset value, end of Period |
$18.26 |
$30.70 |
$22.18 |
$22.48 |
$28.24 |
|
Total Return(d): |
(20.53)% |
58.24% |
7.28% |
(5.65)% |
8.89% |
|
| |||||
|
Ratios/Supplemental Data: | |||||
|
Net assets, end of Period (000) |
$4,889 |
$5,582 |
$6,179 |
$8,925 |
$10,262 |
|
Average net assets (000) |
$4,980 |
$6,623 |
$7,364 |
$8,935 |
$2,060 |
|
Ratios to average net assets(e): | |||||
|
Expenses after waivers and/or expense reimbursement |
1.18% |
1.18% |
1.18% |
1.18% |
1.18%(f) |
|
Expenses before waivers and/or expense reimbursement |
1.35% |
1.28% |
1.39% |
1.42% |
2.00%(f) |
|
Net investment income (loss) |
0.02% |
(0.42)% |
(0.14)% |
(0.26)% |
0.18%(f) |
|
Portfolio turnover rate(g) |
53% |
64% |
58% |
30% |
43% |
|
(a) |
Commencement of offering. |
|
(b) |
Calculated based on average shares outstanding during the period. |
|
(c) |
The per share amount of net investment income (loss) does not directly correlate to the amounts reported in the Statement of Operations due to class specific expenses. |
|
(d) |
Total return is calculated assuming a purchase of a share on the first day and a sale on the last day of each period reported and includes reinvestment of dividends and
distributions, if any. Total returns may reflect adjustments to conform to GAAP. Total returns for periods less than one full year are not annualized. |
|
(e) |
Does not include expenses of the underlying funds in which the Fund invests. |
|
(f) |
Annualized. |
|
(g) |
The Fund's portfolio turnover rate is calculated in accordance with regulatory requirements, without regard to transactions involving short-term investments, certain derivatives
and in-kind transactions (if any). If such transactions were included, the Fund's portfolio turnover rate may be higher. |
44
PGIM Jennison Small Company Fund
|
Class R4 Shares | |||||
|
|
Year Ended September 30, |
November 28,
2017(a)
through
September 30, 2018 | |||
|
|
2022 |
2021 |
2020 |
2019 | |
|
Per Share Operating Performance(b): | |||||
|
Net Asset Value, Beginning of Period |
$31.00 |
$22.32 |
$22.55 |
$28.41 |
$28.00 |
|
Income (loss) from investment operations: | |||||
|
Net investment income (loss) |
0.08 |
(0.04) |
0.04 |
(0.01) |
0.07 |
|
Net realized and unrealized gain (loss) on investment and foreign currency
transactions |
(4.36) |
12.20 |
1.64 |
(2.05) |
2.41 |
|
Total from investment operations |
(4.28) |
12.16 |
1.68 |
(2.06) |
2.48 |
|
Less Dividends and Distributions: | |||||
|
Dividends from net investment income |
(0.08) |
- |
- |
(0.10) |
(0.02) |
|
Distributions from net realized gains |
(8.10) |
(3.48) |
(1.91) |
(3.70) |
(2.05) |
|
Total dividends and distributions |
(8.18) |
(3.48) |
(1.91) |
(3.80) |
(2.07) |
|
Net asset value, end of Period |
$18.54 |
$31.00 |
$22.32 |
$22.55 |
$28.41 |
|
Total Return(c): |
(20.34)% |
58.59% |
7.58% |
(5.71)% |
9.57% |
|
| |||||
|
Ratios/Supplemental Data: | |||||
|
Net assets, end of Period (000) |
$724 |
$680 |
$1,655 |
$4,107 |
$1,495 |
|
Average net assets (000) |
$751 |
$1,569 |
$2,153 |
$3,334 |
$453 |
|
Ratios to average net assets(d): | |||||
|
Expenses after waivers and/or expense reimbursement |
0.93% |
0.93% |
0.93% |
0.93% |
0.93%(e) |
|
Expenses before waivers and/or expense reimbursement |
1.81% |
1.37% |
1.61% |
1.49% |
5.19%(e) |
|
Net investment income (loss) |
0.34% |
(0.16)% |
0.19% |
(0.05)% |
0.30%(e) |
|
Portfolio turnover rate(f) |
53% |
64% |
58% |
30% |
43% |
|
(a) |
Commencement of offering. |
|
(b) |
Calculated based on average shares outstanding during the period. |
|
(c) |
Total return is calculated assuming a purchase of a share on the first day and a sale on the last day of each period reported and includes reinvestment of dividends and
distributions, if any. Total returns may reflect adjustments to conform to GAAP. Total returns for periods less than one full year are not annualized. |
|
(d) |
Does not include expenses of the underlying funds in which the Fund invests. |
|
(e) |
Annualized. |
|
(f) |
The Fund's portfolio turnover rate is calculated in accordance with regulatory requirements, without regard to transactions involving short-term investments, certain derivatives
and in-kind transactions (if any). If such transactions were included, the Fund's portfolio turnover rate may be higher. |
Visit our website at www.pgim.com/investments
45
|
Class R6 Shares | |||||
|
|
Year Ended September 30, | ||||
|
|
2022 |
2021 |
2020 |
2019 |
2018 |
|
Per Share Operating Performance(a): | |||||
|
Net Asset Value, Beginning of Year |
$31.30 |
$22.46 |
$22.64 |
$28.51 |
$27.27 |
|
Income (loss) from investment operations: | |||||
|
Net investment income (loss) |
0.12 |
0.01(b) |
0.05 |
0.04 |
0.09 |
|
Net realized and unrealized gain (loss) on investment and foreign currency
transactions |
(4.41) |
12.31 |
1.68 |
(2.05) |
3.33 |
|
Total from investment operations |
(4.29) |
12.32 |
1.73 |
(2.01) |
3.42 |
|
Less Dividends and Distributions: | |||||
|
Dividends from net investment income |
(0.08) |
- |
- |
(0.16) |
(0.13) |
|
Distributions from net realized gains |
(8.10) |
(3.48) |
(1.91) |
(3.70) |
(2.05) |
|
Total dividends and distributions |
(8.18) |
(3.48) |
(1.91) |
(3.86) |
(2.18) |
|
Net asset value, end of Year |
$18.83 |
$31.30 |
$22.46 |
$22.64 |
$28.51 |
|
Total Return(c): |
(20.17)% |
59.03% |
7.78% |
(5.44)% |
13.33% |
|
| |||||
|
Ratios/Supplemental Data: | |||||
|
Net assets, end of Year (000) |
$1,645,815 |
$914,526 |
$580,309 |
$761,160 |
$1,253,235 |
|
Average net assets (000) |
$950,556 |
$758,747 |
$613,233 |
$1,011,193 |
$1,169,480 |
|
Ratios to average net assets(d): | |||||
|
Expenses after waivers and/or expense reimbursement |
0.70% |
0.69% |
0.70% |
0.69% |
0.68% |
|
Expenses before waivers and/or expense reimbursement |
0.70% |
0.69% |
0.70% |
0.69% |
0.68% |
|
Net investment income (loss) |
0.49% |
0.05% |
0.26% |
0.18% |
0.32% |
|
Portfolio turnover rate(e) |
53% |
64% |
58% |
30% |
43% |
|
(a) |
Calculated based on average shares outstanding during the year. |
|
(b) |
The per share amount of net investment income (loss) does not directly correlate to the amounts reported in the Statement of Operations due to class specific expenses. |
|
(c) |
Total return is calculated assuming a purchase of a share on the first day and a sale on the last day of each year reported and includes reinvestment of dividends and
distributions, if any. Total returns may reflect adjustments to conform to GAAP. |
|
(d) |
Does not include expenses of the underlying funds in which the Fund invests. |
|
(e) |
The Fund's portfolio turnover rate is calculated in accordance with regulatory requirements, without regard to transactions involving short-term investments, certain derivatives
and in-kind transactions (if any). If such transactions were included, the Fund's portfolio turnover rate may be higher. |
46
PGIM Jennison Small Company Fund
GLOSSARY
FUND Indices
Russell 2500 Index. The Russell 2500 Index is an unmanaged index that measures the performance of the 2,500 smallest companies in the Russell 3000 Index, which represents approximately 20% of the total market capitalization of the Russell 3000 Index. These returns do not include the effect of any sales charges or operating expenses of a mutual fund or taxes. These returns would be lower if they included the effect of these expenses.
S&P SmallCap 600 Index. The S&P SmallCap 600 Index is an unmanaged capital-weighted index of 600 smaller company U.S. common stocks that cover all industry sectors. It gives a broad look at how U.S. small-cap stock prices have performed. These returns do not include the effect of any sales charges and operating expenses of a mutual fund or taxes. These returns would be lower if they included the effect of these expenses.
The S&P SmallCap 600 Index (“Index”) is a product of S&P Dow Jones Indices LLC and/or its affiliates and has been licensed for use by PGIM, Inc. and/or its affiliates. Copyright © 2022 S&P Dow Jones Indices LLC, a division of S&P Global, Inc., and/or its affiliates. All rights reserved. Redistribution or reproduction in whole or in part are prohibited without written permission of S&P Dow Jones Indices LLC. For more information on any of S&P Dow Jones Indices LLC’s indices please visit www.spdji.com. S&P® is a registered trademark of S&P Global and Dow Jones® is a registered trademark of Dow Jones Trademark Holdings LLC.
Visit our website at www.pgim.com/investments
47
APPENDIX A: WAIVERS AND DISCOUNTS AVAILABLE FROM CERTAIN FINANCIAL INTERMEDIARIES
The availability of certain sales charge waivers and discounts will depend on whether you purchase your shares directly from the Fund or through a financial intermediary. Intermediaries may have different policies and procedures regarding the availability of front-end sales load waivers or contingent deferred sales charge (“CDSC”) waivers (i.e., back-end), which are discussed below. In all instances, it is the purchaser's responsibility to notify the Fund or the purchaser's financial intermediary at the time of purchase of any relationship or other facts qualifying the purchaser for sales charge waivers or discounts. For waivers and discounts not available through a particular intermediary, shareholders will have to purchase Fund shares through the applicable intermediary to receive these waivers or discounts.
Merrill Lynch
Shareholders purchasing Fund shares through a Merrill Lynch platform or account are eligible only for the following load waivers (front-end sales charge waivers and contingent deferred, or back-end, sales charge waivers) and discounts, as applicable, which may differ from those disclosed elsewhere in this Fund's Prospectus or SAI.
Front-end Sales Load Waivers on Class A Shares available at Merrill Lynch
◾
Employer-sponsored retirement, deferred compensation and employee benefit plans (including health savings accounts) and trusts used to fund those plans, provided that the shares are not held in a commission-based brokerage account and shares are held for the benefit of the plan
◾
Shares purchased by a 529 Plan (does not include 529 Plan units or 529-specific share classes or equivalents)
◾
Shares purchased through a Merrill Lynch affiliated investment advisory program
◾
Shares exchanged due to the holdings moving from a Merrill Lynch affiliated investment advisory program to a Merrill Lynch brokerage (non-advisory) account pursuant to Merrill Lynch’s policies relating to sales load discounts and waivers
◾
Shares purchased by third party investment advisors on behalf of their advisory clients through Merrill Lynch’s platform
◾
Shares of funds purchased through the Merrill Edge Self-Directed platform
◾
Shares purchased through reinvestment of capital gains distributions and dividend reinvestment when purchasing shares of the same fund (but not any other fund within the fund family)
◾
Shares exchanged from Class C (i.e. level-load) shares of the same fund pursuant to Merrill Lynch’s policies relating to sales load discounts and waivers
◾
Employees and registered representatives of Merrill Lynch or its affiliates and their family members
◾
Directors or Trustees of the Fund, and employees of the Fund’s investment adviser or any of its affiliates, as described in this Prospectus
◾
Eligible shares purchased from the proceeds of redemptions within the same fund family, provided (1) the repurchase occurs within 90 days following the redemption, (2) the redemption and purchase occur in the same account, and (3) redeemed shares were subject to a front-end or deferred sales load (known as Rights of Reinstatement). Automated transactions (i.e. systematic purchases and withdrawals) and purchases made after shares are automatically sold to pay Merrill Lynch’s account maintenance fees are not eligible for reinstatement
CDSC Waivers on Class A and C Shares available at Merrill Lynch
◾
Death or disability of the shareholder
◾
Shares sold as part of a systematic withdrawal plan as described in this Prospectus
◾
Return of excess contributions from an IRA Account
◾
Shares sold as part of a required minimum distribution for IRA and retirement accounts pursuant to the Internal Revenue Code
◾
Shares sold to pay Merrill Lynch fees but only if the transaction is initiated by Merrill Lynch
◾
Shares acquired through a Right of Reinstatement
◾
Shares held in retirement brokerage accounts, that are exchanged for a lower cost share class due to transfer to certain fee based accounts or platforms
48
◾
Shares received through an exchange due to the holdings moving from a Merrill Lynch affiliated investment advisory program to a Merrill Lynch brokerage (non-advisory) account pursuant to Merrill Lynch’s policies relating to sales load discounts and waivers
Front-end load Discounts Available at Merrill Lynch: Breakpoints, Rights of Accumulation & Letters of Intent
◾
Breakpoints as described in this Prospectus
◾
Rights of Accumulation (“ROA”) which entitle shareholders to breakpoint discounts as described in the Fund’s Prospectus will be automatically calculated based on the aggregated holding of fund family assets held by accounts (including 529 program holdings, where applicable) within the purchaser’s household at Merrill Lynch. Eligible fund family assets not held at Merrill Lynch may be included in the ROA calculation only if the shareholder notifies his or her financial advisor about such assets
◾
Letters of Intent (“LOI”) which allow for breakpoint discounts based on anticipated purchases within a fund family, through Merrill Lynch, over a 13-month period of time
Morgan Stanley Wealth Management
Shareholders purchasing Fund shares through a Morgan Stanley Wealth Management transactional brokerage account are eligible only for the following front-end sales charge waivers with respect to Class A shares, which may differ from and be more limited than those disclosed elsewhere in this Fund's Prospectus or SAI.
Front-End Sales Charge Waivers on Class A Shares Available at Morgan Stanley Wealth Management
◾
Employer-sponsored retirement plans (e.g., 401(k) plans, 457 plans, employer-sponsored 403(b) plans, profit sharing and money purchase pension plans and defined benefit plans). For purposes of this provision, employer-sponsored retirement plans do not include SEP IRAs, Simple IRAs, SAR-SEPs or Keogh plans
◾
Morgan Stanley employee and employee-related accounts according to Morgan Stanley’s account linking rules
◾
Shares purchased through reinvestment of dividends and capital gains distributions when purchasing shares of the same fund
◾
Shares purchased through a Morgan Stanley self-directed brokerage account
◾
Class C (i.e., level-load) shares that are no longer subject to a contingent deferred sales charge and are converted to Class A shares of the same fund pursuant to Morgan Stanley Wealth Management’s share class conversion program
◾
Shares purchased from the proceeds of redemptions within the same fund family, provided (i) the repurchase occurs within 90 days following the redemption, (ii) the redemption and purchase occur in the same account, and (iii) redeemed shares were subject to a front-end or deferred sales charge
Ameriprise Financial
Class A Shares Front-End Sales Charge Waivers Available at Ameriprise Financial
The following information applies to Class A shares purchases if you have an account with or otherwise purchase Fund shares through Ameriprise Financial.
Shareholders purchasing Fund shares through an Ameriprise Financial brokerage account are eligible for the following front-end sales charge waivers and discounts, which may differ from those disclosed elsewhere in this Fund's Prospectus or SAI.
◾
Employer-sponsored retirement plans (e.g., 401(k) plans, 457 plans, employer-sponsored 403(b) plans, profit sharing and money purchase pension plans and defined benefit plans). For purposes of this provision, employer-sponsored retirement plans do not include SEP IRAs, Simple IRAs or SAR-SEPs.
◾
Shares purchased through reinvestment of capital gains distributions and dividend reinvestment when purchasing shares of the same fund (but not any other fund within the fund family).
◾
Shares exchanged from Class C shares of the same fund in the month of or following the 7-year anniversary of the purchase date. To the extent that this Prospectus elsewhere provides for a waiver with respect to exchanges of Class C shares or conversion of Class C shares following a shorter holding period, that waiver will apply.
49
◾
Employees and registered representatives of Ameriprise Financial or its affiliates and their immediate family members.
◾
Shares purchased by or through qualified accounts (including IRAs, Coverdell Education Savings Accounts, 401(k)s, 403(b) TSCAs subject to ERISA and defined benefit plans) that are held by a covered family member, defined as an Ameriprise financial advisor and/or the advisor’s spouse, advisor’s lineal ascendant (mother, father, grandmother, grandfather, great grandmother, great grandfather), advisor’s lineal descendant (son, step-son, daughter, step-daughter, grandson, granddaughter, great grandson, great granddaughter) or any spouse of a covered family member who is a lineal descendant.
◾
Shares purchased from the proceeds of redemptions within the same fund family, provided (1) the repurchase occurs within 90 days following the redemption, (2) the redemption and purchase occur in the same account, and (3) redeemed shares were subject to a front-end or deferred sales load (i.e. Rights of Reinstatement).
Raymond James & Associates, Inc., Raymond James Financial Services and each entity’s affiliates (“Raymond James”)
Shareholders purchasing fund shares through a Raymond James platform or account, or through an introducing broker-dealer or independent registered investment adviser for which Raymond James provides trade execution, clearance, and/or custody services, will be eligible only for the following load waivers (front-end sales charge waivers and contingent deferred, or back-end, sales charge waivers) and discounts, which may differ from those disclosed elsewhere in this Fund’s Prospectus or SAI.
Front-end sales load waivers on Class A shares available at Raymond James
◾
Shares purchased in an investment advisory program.
◾
Shares purchased within the same fund family through a systematic reinvestment of capital gains and dividend distributions.
◾
Employees and registered representatives of Raymond James or its affiliates and their family members as designated by Raymond James.
◾
Shares purchased from the proceeds of redemptions within the same fund family, provided (1) the repurchase occurs within 90 days following the redemption, (2) the redemption and purchase occur in the same account, and (3) redeemed shares were subject to a front-end or deferred sales load (known as Rights of Reinstatement).
◾
A shareholder in the Fund’s Class C shares will have their shares converted at net asset value to Class A shares (or the appropriate share class) of the Fund if the shares are no longer subject to a CDSC and the conversion is in line with the policies and procedures of Raymond James.
CDSC Waivers on Classes A and C shares available at Raymond James
◾
Death or disability of the shareholder.
◾
Shares sold as part of a systematic withdrawal plan as described in the Fund’s Prospectus.
◾
Return of excess contributions from an IRA Account.
◾
Shares sold as part of a required minimum distribution for IRA and retirement accounts due to the shareholder reaching the qualified age based on applicable IRS regulations as described in the Fund’s Prospectus.
◾
Shares sold to pay Raymond James fees but only if the transaction is initiated by Raymond James.
◾
Shares acquired through a right of reinstatement.
Front-end load discounts available at Raymond James: breakpoints, and/or rights of accumulation, and/or letters of intent
◾
Breakpoints as described in this Prospectus.
◾
Rights of accumulation which entitle shareholders to breakpoint discounts will be automatically calculated based on the aggregated holding of fund family assets held by accounts within the purchaser’s household at Raymond James. Eligible fund family assets not held at Raymond James may be included in the calculation of rights of accumulation only if the shareholder notifies his or her financial advisor about such assets.
◾
Letters of intent which allow for breakpoint discounts based on anticipated purchases within a fund family, over a 13-month time period. Eligible fund family assets not held at Raymond James may be included in the calculation of letters of intent only if the shareholder notifies his or her financial advisor about such assets.
Edward D. Jones & Co., L.P. (“Edward Jones”)
Policies Regarding Transactions Through Edward Jones
Policies Regarding Transactions Through Edward Jones
50
◾
Clients of Edward Jones (also referred to as “shareholders”) purchasing fund shares on the Edward Jones commission and fee-based platforms are eligible only for the following sales charge discounts (also referred to as “breakpoints”) and waivers, which can differ from discounts and waivers described elsewhere in this Fund’s Prospectus or statement of additional information (“SAI”) or through another broker-dealer. In all instances, it is the shareholder's responsibility to inform Edward Jones at the time of purchase of any relationship, holdings of the Fund or other facts qualifying the purchaser for breakpoints, discounts or waivers. Edward Jones can ask for documentation of such circumstance. Shareholders should contact Edward Jones if they have questions regarding their eligibility for these discounts and waivers.
Breakpoints
◾
Breakpoint pricing, otherwise known as volume pricing, at dollar thresholds as described in this Fund’s Prospectus.
Rights of Accumulation (“ROA”)
◾
The applicable sales charge on a purchase of Class A shares is determined by taking into account all share classes (except certain money market funds and any assets held in group retirement plans) of PGIM Funds held by the shareholder or in an account grouped by Edward Jones with certain other related accounts for the purpose of providing certain pricing considerations (“pricing groups”). If grouping assets as a shareholder, this includes all share classes held on the Edward Jones platform and/or held on another platform. The inclusion of eligible fund family assets in the ROA calculation is dependent on the shareholder notifying Edward Jones of such assets at the time of calculation. Money market funds are included only if such shares were sold with a sales charge at the time of purchase or acquired in exchange for shares purchased with a sales charge.
◾
The employer maintaining a SEP IRA plan and/or SIMPLE IRA plan may elect to establish or change ROA for the IRA accounts associated with the plan to a plan-level grouping as opposed to including all share classes at a shareholder or pricing group level.
◾
ROA is determined by calculating the higher of cost minus redemptions or market value (current shares x NAV).
Letter of Intent (“LOI”)
◾
Through a LOI, shareholders can receive the sales charge and breakpoint discounts for purchases shareholders intend to make over a 13-month period from the date Edward Jones receives the LOI. The LOI is determined by calculating the higher of cost or market value of qualifying holdings at LOI initiation in combination with the value that the shareholder intends to buy over a 13-month period to calculate the front-end sales charge and any breakpoint discounts. Each purchase the shareholder makes during that 13-month period will receive the sales charge and breakpoint discount that applies to the total amount. The inclusion of eligible fund family assets in the LOI calculation is dependent on the shareholder notifying Edward Jones of such assets at the time of calculation. Purchases made before the LOI is received by Edward Jones are not adjusted under the LOI and will not reduce the sales charge previously paid. Sales charges will be adjusted if LOI is not met.
◾
If the employer maintaining a SEP IRA plan and/or SIMPLE IRA plan has elected to establish or change ROA for the IRA accounts associated with the plan to a plan-level grouping. LOIs will also be at the plan-level and may only be established by the employer.
Sales Charge Waivers
Sales charges are waived for the following shareholders and in the following situations:
◾
Associates of Edward Jones and its affiliates and their family members who are in the same pricing group (as determined by Edward Jones under its policies and procedures) as the associate. This waiver will continue for the remainder of the associate's life if the associate retires from Edward Jones in good-standing and remains in good-standing pursuant to Edward Jones’ policies and procedures.
◾
Shares purchased in an Edward Jones fee-based program.
◾
Shares purchased through reinvestment of capital gains distributions and dividend reinvestment.
◾
Shares purchased from the proceeds of redeemed shares of the same fund family so long as the following conditions are met: (1) the proceeds are from the sale of shares within 60 days of the purchase, and (2) the sale and purchase are made in the same share class and the same account or the purchase is made in an individual retirement account with proceeds from liquidations in a non-retirement account.
51
◾
Shares exchanged into Class A shares from another share class so long as the exchange is into the same fund and was initiated at the discretion of Edward Jones. Edward Jones is responsible for any remaining CDSC due to the fund company, if applicable. Any future purchases are subject to the applicable sales charge as disclosed in the Prospectus.
◾
Exchanges from Class C shares to Class A shares of the same fund, generally, in the 84th month following the anniversary of the purchase date or earlier at the discretion of Edward Jones.
Contingent Deferred Sales Charge (“CDSC”) Waivers
If the shareholder purchases shares that are subject to a CDSC and those shares are redeemed before the CDSC is expired, the shareholder is responsible to pay the CDSC except in the following conditions:
◾
The death or disability of the shareholder
◾
Systematic withdrawals with up to 10% per year of the account value
◾
Return of excess contributions from an Individual Retirement Account (“IRA”)
◾
Shares sold as part of a required minimum distribution for IRA and retirement accounts if the redemption is taken in or after the year the shareholder reaches qualified age based on applicable IRS regulations
◾
Shares sold to pay Edward Jones fees or costs in such cases where the transaction is initiated by Edward Jones
◾
Shares exchanged in an Edward Jones fee-based program
◾
Shares acquired through NAV reinstatement
◾
Shares redeemed at the discretion of Edward Jones for Minimum Balances, as described below.
Other Important Information Regarding Transactions Through Edward Jones
Minimum Purchase Amounts (Class A and Class C shares)
◾
Initial purchase minimum: $250
◾
Subsequent purchase minimum: none
Minimum Balances
◾
Edward Jones has the right to redeem at its discretion fund holdings with a balance of $250 or less. The following are examples of accounts that are not included in this policy:
◾
A fee-based account held on an Edward Jones platform
◾
A 529 account held on an Edward Jones platform
◾
An account with an active systematic investment plan or LOI
Exchanging Share Classes
◾
Edward Jones has the authority to exchange at NAV a shareholder's holdings in a fund to Class A shares or such other share class based on Edward Jones’ policy.
Janney Montgomery Scott LLC (“Janney”)
Shareholders purchasing Fund shares through a Janney account are eligible only for the following load waivers (front-end sales charge waivers and contingent deferred, or back-end, sales charge waivers) and discounts, which may differ from those disclosed elsewhere in this Fund's Prospectus or SAI.
Front-end sales charge waivers on Class A shares available at Janney
◾
Shares purchased through reinvestment of capital gains distributions and dividend reinvestment when purchasing shares of the same fund (but not any other fund within the fund family).
◾
Shares purchased by employees and registered representatives of Janney or its affiliates and their family members as designated by Janney.
◾
Shares purchased from the proceeds of redemptions within the same fund family, provided (1) the repurchase occurs within ninety (90) days following the redemption, (2) the redemption and purchase occur in the same account, and (3) redeemed shares were subject to a front-end or deferred sales load (i.e., right of reinstatement).
◾
Class C shares that are no longer subject to a contingent deferred sales charge and are converted to Class A shares of the same fund pursuant to Janney’s policies and procedures.
52
Sales charge waivers on Class A and C shares available at Janney
◾
Shares sold upon the death or disability of the shareholder.
◾
Shares sold as part of a systematic withdrawal plan as described in the Fund’s Prospectus.
◾
Shares purchased in connection with a return of excess contributions from an IRA account.
◾
Shares sold as part of a required minimum distribution for IRA and other retirement accounts due to the shareholder reaching the qualified age based on applicable IRS regulations as described in the Fund’s Prospectus.
◾
Shares sold to pay Janney fees but only if the transaction is initiated by Janney.
◾
Shares acquired through a right of reinstatement.
Front-end load discounts available at Janney: breakpoints, and/or rights of accumulation
◾
Breakpoints as described in the Fund’s Prospectus.
◾
Rights of accumulation (“ROA”), which entitle shareholders to breakpoint discounts, will be automatically calculated based on the aggregated holding of Fund family assets held by accounts within the purchaser’s household at Janney. Eligible fund family assets not held at Janney may be included in the ROA calculation only if the shareholder notifies his or her financial advisor about such assets.
Oppenheimer & Co. Inc. (“OPCO”)
Shareholders purchasing Fund shares through an OPCO platform or account will only be eligible for the following sales charge waivers (front-end sales charge waivers and contingent deferred sales charge (“CDSC”) waivers (i.e., back-end)) and discounts, which may differ from those disclosed elsewhere in this Prospectus or the SAI.
Front-End Sales Charge Waivers on Class A share available at OPCO
◾
Employer-sponsored retirement, deferred compensation and employee benefit plans (including health savings accounts) and trusts used to fund those plans, provided that the shares are not held in a commission-based brokerage account and shares are held for the benefit of the plan
◾
Shares purchased by or through a 529 Plan
◾
Shares purchased through an OPCO affiliated investment advisory program
◾
Shares purchased through reinvestment of capital gains distributions and dividend reinvestment when purchasing shares of the same fund (but not any other fund within the PGIM fund family)
◾
Shares purchased from the proceeds of redemptions within the same fund family, provided (1) the repurchase occurs within 90 days following the redemption, (2) the redemption and purchase occur in the same account, and (3) redeemed shares were subject to a front-end or deferred sales load (known as Rights of Reinstatement)
◾
A shareholder in the Fund’s Class C shares will have their shares converted at net asset value to Class A shares (or the appropriate share class) of the Fund if the shares are no longer subject to a CDSC and the conversion is in line with the policies and procedures of OPCO
◾
Employees and registered representatives of OPCO or its affiliates and their family members
◾
Directors or Trustees of the Fund, and employees of the Fund’s investment adviser or any of its affiliates, as described in this Prospectus
Contingent Deferred Sales Charge (“CDSC”) Waivers available at OPCO
◾
The death or disability of the shareholder
◾
Shares sold as part of a systematic withdrawal plan as described in this Prospectus
◾
Return of excess contributions from an Individual Retirement Account (“IRA”)
◾
Shares sold as part of a required minimum distribution for IRA and retirement accounts due to the shareholder reaching the qualified age based on applicable IRS regulations
◾
Shares sold to pay OPCO fees but only if the transaction is initiated by OPCO
◾
Shares acquired through a Right of Reinstatement
Front-end load discounts available at OPCO: breakpoints and/or rights of accumulation
◾
Breakpoints as described in this Prospectus
53
◾
Rights of accumulation (“ROA”), which entitle shareholders to breakpoint discounts, will be automatically calculated based on the aggregated holding of Fund family assets held by accounts within the purchaser’s household at OPCO. Eligible Fund family assets not held at OPCO may be included in the ROA calculation only if the shareholder notifies his or her financial advisor about such assets.
RW Baird (“Baird”)
Shareholders purchasing Fund shares through a Baird platform or account will only be eligible for the following sales charge waivers (front-end sales charge waivers and CDSC waivers) and discounts, which may differ from those disclosed elsewhere in this Prospectus or the SAI.
Front-end sales charge waivers on Class A shares available at Baird
◾
Shares purchased through reinvestment of capital gains distributions and dividend reinvestment when purchasing shares of the same fund
◾
Shares purchased by employees and registered representatives of Baird or its affiliates and their family members as designated by Baird
◾
Shares purchased from the proceeds of redemptions from another PGIM Fund, provided (1) the repurchase occurs within ninety (90) days following the redemption, (2) the redemption and purchase occur in the same account, and (3) redeemed shares were subject to a front-end or deferred sales charge (known as Rights of Reinstatement)
◾
A shareholder in the Fund's Class C Shares will have their shares converted at net asset value to Class A shares of the Fund if the shares are no longer subject to CDSC and the conversion is in line with the policies and procedures of Baird
◾
Employer-sponsored retirement plans or charitable accounts in a transactional brokerage account at Baird, including 401(k) plans, 457 plans, employer-sponsored 403(b) plans, profit sharing and money purchase pension plans and defined benefit plans. For purposes of this provision, employer-sponsored retirement plans do not include SEP IRAs, Simple IRAs or SAR-SEPs
Contingent Deferred Sales Charge (“CDSC”) waivers on Class A and C shares available at Baird
◾
Shares sold upon the death or disability of the shareholder
◾
Shares sold as part of a systematic withdrawal plan as described in this Prospectus
◾
Shares purchased in connection with a return of excess contributions from an IRA account
◾
Shares sold as part of a required minimum distribution for IRA and other retirement accounts due to the shareholder reaching the qualified age based on applicable IRS regulations
◾
Shares sold to pay Baird fees but only if the transaction is initiated by Baird
◾
Shares acquired through a Right of Reinstatement
Front-end Sales Charge Discounts available at Baird: Breakpoints and/or Rights of Accumulation
◾
Breakpoints as described in this Prospectus
◾
Rights of accumulation (“ROA”), which entitle shareholders to breakpoint discounts, will be automatically calculated based on the aggregated holding of PGIM Fund assets held by accounts within the purchaser’s household at Baird. Eligible PGIM Fund assets not held at Baird may be included in the ROA calculation only if the shareholder notifies his or her financial advisor about such assets
◾
Letters of Intent (“LOI”) which allow for breakpoint discounts based on anticipated purchases of PGIM Funds through Baird, over a 13-month period of time
STIFEL, NICOLAUS & COMPANY, INCORPORATED (“STIFEL”)
Shareholders purchasing Fund shares through a Stifel platform or account, or who own shares for which Stifel or an affiliate is the broker-dealer of record, are eligible for the following front-end sales charge waivers with respect to Class A shares, which may differ from and be more limited than those disclosed elsewhere in this Fund's Prospectus or SAI. All other waivers in the Fund’s Prospectus or SAI apply as described.
Front-End Sales Charge Waivers on Class A Shares
54
◾
Class C (i.e., level-load) shares that are no longer subject to a contingent deferred sales charge and are converted to Class A shares of the same Fund (at net asset value per share) pursuant to policies and procedures of Stifel.
55
|
FOR MORE INFORMATION
Please read this Prospectus before you invest in the Fund and keep it for future reference.
For information or shareholder questions contact: | |
|
◾MAIL
Prudential Mutual Fund Services LLC
PO Box 9658
Providence, RI 02940 ◾WEBSITE
www.pgim.com/investments |
◾TELEPHONE
(800) 225-1852
(973) 367-3529
(from outside the U.S.) |
|
◾E-DELIVERY
To receive your mutual fund documents on-line, go to pgim.com/investments/resource/edelivery and enroll.
Instead of receiving printed documents by mail, you will receive notification via email when new materials are
available. You can cancel your enrollment or change your email address at any time by visiting the website address
above. |
|
The Annual and Semi-Annual Reports and the SAI contain additional information about the Fund. Shareholders may
obtain free copies of the SAI, Annual Report and Semi-Annual Report as well as other information about the Fund
and may make other shareholder inquiries through the telephone number, address and website listed above. | |
|
◾STATEMENT OF ADDITIONAL INFORMATION (“SAI”)
(incorporated by reference into this Prospectus) ◾SEMI-ANNUAL REPORT |
◾ANNUAL REPORT
(contains a discussion of the market conditions and
investment strategies that significantly affected the
Fund's performance during the last fiscal year) |
|
You can also obtain copies of Fund documents, including the SAI, from the SEC as follows (the SEC charges a fee to
copy documents): | |
|
◾ELECTRONIC REQUEST
publicinfo@sec.gov |
◾VIA THE INTERNET
on the EDGAR Database at www.sec.gov |
|
PGIM Jennison Small Company Fund | |||||||
|
Share Class |
A |
C |
R |
Z |
R2 |
R4 |
R6 |
|
NASDAQ |
PGOAX |
PSCCX |
JSCRX |
PSCZX |
PSCHX |
PSCJX |
PJSQX |
|
CUSIP |
74441N101 |
74441N309 |
74441N507 |
74441N408 |
74441N861 |
74441N853 |
74441N887 |
MF109STAT The Fund's Investment Company Act File No. 811-03084