UNITED STATES
SECURITIES AND EXCHANGE COMMISSION
Washington, D.C. 20549
FORM N-CSR
CERTIFIED SHAREHOLDER REPORT OF
REGISTERED MANAGEMENT INVESTMENT COMPANY
811-03074
(Investment Company Act file number)
Northeast Investors Growth Fund
(Exact name of registrant as specified in charter)
100 High Street
Boston, MA 02110
(Address of principal executive offices) (Zip code)
(617) 523-3588
(Registrant’s telephone number, including area code)
Robert Kane
100 High Street
Boston, MA 02110
(Name and address of agent for service)
December 31
Date of fiscal year end
June 30, 2013
Date of reporting period
Form N-CSR is to be used by management investment companies to file reports with the Commission not later than 10 days after the transmission to stockholders of any report that is required to be transmitted to stockholders under Rule 30e-1 under the Investment Company Act of 1940 (17 CFR 270.30e-1). The Commission may use the information provided on Form N-CSR in its regulatory, disclosure review, inspection, and policymaking roles.
A registrant is required to disclose the information specified by Form N-CSR, and the Commission will make this information public. A registrant is not required to respond to the collection of information contained in Form N-CSR unless the Form displays a currently valid Office of Management and Budget (“OMB”) control number. Please direct comments concerning the accuracy of the information collection burden estimate and any suggestions for reducing the burden to Secretary, Securities and Exchange Commission, 450 Fifth Street, NW, Washington, DC 20549-0609. The OMB has reviewed this collection of information under the clearance requirements of 44 U.S.C. § 3507.
Item 1. Reports to Stockholders.
The Report to Shareholders is attached herewith.
|
TABLE OF CONTENTS
|
| Northeast Investors Growth Fund | Shareholder Letter |
Dear Fellow Shareholders:
The first six months of 2013 saw equity markets resume their upward march of the past few years. Our Northeast Investors Growth Fund recorded an advance of 7.0% through June, though this disappointingly trailed the 13.8% advance of our benchmark S&P 500. Roughly two-thirds of this deficit occurred in the first quarter of the year due to our initial sector positioning and some security selection. While we are dissatisfied with this performance we remain optimistic in our current holdings for the latter part of the year.
If nothing else, January 1st brought with it some much needed clarity on domestic fiscal matters. The United States averted the worst of the “fiscal cliff” as tax increases were approved on only the highest earners, but the “sequester” and the elimination of the payroll tax holiday still took effect. No longer waiting on Congress to act, equity markets refocused on improving fundamentals at home and rallied more than 10% in the first quarter. However, this was a unique “risk-off” rally as the most commonly defensive sectors such as Health Care, Consumer Staples and Utilities vastly outperformed the rest of the market. Part of the reason for their performance may be attributed to investors beginning to regard these sectors as bond-like substitutes (with low volatility and high yields) because of their dissatisfaction with the paltry income being offered by bonds.
U.S. markets advanced in a similar fashion in April before displaying signs of a cyclical rotation in May when the Financial, Industrial and Energy sectors enjoyed a strong rally. The second quarter closed amidst a backdrop of fear that the Federal Reserve would step off the pedal of quantitative easing. The mere chatter alone that the Fed would begin tapering their purchases saw the 10-year bond jump a whopping 100 basis points in six weeks to close the quarter at 2.6%. Here the U.S. equity markets saw their first correction of the year – nearly 6% – before recovering in the final week to close the quarter up almost 3%.
The U.S. markets as a whole were the place to be during the first half of the year. Much of Europe saw only single-digit advances as many economies there remain mired in recession but are beginning to show signs of slow improvement. Weakening commodity demand in China and Brazil led to collapses in materials prices and further dragged down the Emerging Markets indices to returns of -10%. Japan’s Nikkei was the best performing market advancing some 32% on the back of its own aggressive stimulus program.
As to the Fund, our beginning sector positioning hurt us, in particular, our heavy overweight in Information Technology. This sector alone was responsible for more than half of our negative attribution through June and was the second weakest performer in the S&P 500, returning only 5.5%. In a sudden reach for battered-down income plays, the names that shined the most and which we did not own were largely the darlings of yesteryear –Hewlett-Packard (+76%), Dell (+33%), Microsoft (+31%) and Intel (+20%). Our top Information Technology holdings of Apple, Oracle, EMC and Qualcomm all saw sustained weakness on the back of margin erosion fears from fierce competition and ongoing weakness in enterprise spending.
Our two recently converted REIT names hampered the performance of the Financials sector. American Tower and Weyerhaeuser, which maintain heavily debt-laden capital structures, began to sell off as interest rates spiked in late May. The latter also succumbed to both a sharp drop in lumber prices and investor disapproval that a strategic acquisition would be financed in part with equity.
| Semi-Annual Report | June 30, 2013 |
1 |
| Northeast Investors Growth Fund | Shareholder Letter |
Lastly, the Fund was hurt by the weak performance of our biggest individual positions. A handful of our star performers from 2012 sharply hit the brakes this year. Apple, American Tower, Oracle and Diageo comprised 18% of the Fund in January after having advanced more than 30% last year. Each was negative for this period, led by Apple’s 25% fall.
There were, however, some bright spots in the Fund. The Consumer Discretionary sector continued its strong performance, led by VF Corp (+29%), Disney (+27%), and Williams-Sonoma (+24% since purchased in March). VF Corp has begun to successfully integrate the acquisition of Timberland into its already formidable retail portfolio which includes North Face, Wrangler, Vans, and JanSport among others. Disney continues to benefit from the recovery of its parks division as well as overall strength across its content segments (Disney, ABC and particularly ESPN). New to the Fund in March, Williams-Sonoma has performed well, benefitting from the second leg of the housing recovery. As consumers begin to either furnish their new homes or refurnish their existing homes, Williams-Sonoma has profited through its portfolio of specialty home furnishings brands – Williams-Sonoma, Pottery Barn, West Elm, and Rejuvenation.
Strength was also seen in two of our top Industrial positions –Honeywell (+26%) and Union Pacific (+24%). Honeywell continues to gain favor in the markets as a near pure play on the theme of increasing global energy efficiency. Driving this movement is its energy and security building management solutions as well as its automobile turbochargers which provide similar power and performance but with far less emissions. As the economy has gained steam, Union Pacific has seen a nice rise in the number and size of carloads. Our nation’s largest railroad company benefits from its proximity to the West Coast and Mexico due to increased imports from those regions. In addition, its proximity to the oil fields of North Dakota and Texas has proven advantageous to the company as rails are becoming the preferred mode of oil transportation in order to deal with widespread pipeline congestion.
At the time of this writing, equity markets are at new record highs. We continue to see room to run since the most common alternatives in the fixed income area remain overpriced and vulnerable to additional interest rate increases. Abroad, we have begun to see some improving data points in both Europe and China which should serve to boost many of our multinational business holdings. Though we acknowledge that our own country has a full plate of issues to be addressed, the key metrics driving the markets continue to be on a strong and gradual uptrend. Housing continues to put up double-digit year-over-year advances – though still far off the highs of 2005 and 2006. Unemployment and initial jobless claims continue to trend lower while jobs are slowly but steadily being added. Our budget deficit as a percent of GDP is projected to experience its fastest improvement since the period immediately following World War II and consumer confidence has once again edged higher to pre-recession levels.
We welcome and encourage you to contact us with any questions, concerns or comments. Please call us directly at 617-523-3588 or visit our website, www.northeastinvest.com/growthfund, where you can view the Fund’s closing price, composition, and historical performance. If you follow your investments online, the ticker symbol for the Fund is NTHFX. Our lines of communication are always open to our most important partners, you our fellow shareholders. We continue to appreciate your support.
William A. Oates, Jr.
August, 2013
| 2 | www.northeastinvest.com |
| Northeast Investors Growth Fund | Portfolio Update | |
| June 30, 2013 (Unaudited) |
Average Annual Total Return (For the Period Ended June 30, 2013)
| 1 Year | 5 Year | 10 Year | Since Inception* |
Expense Ratio |
||||||||||||||||
| Northeast Investors Growth Fund |
11.45% | 1.52% | 5.47% | 9.28% | 1.38% | |||||||||||||||
| S&P 500® Total Return Index |
20.60% | 7.01% | 7.30% | 8.52% | ||||||||||||||||
| * | Fund Inception: October 27, 1980. |
Performance Graph
The following graph compares the cumulative total shareholder return on the Northeast Investors Growth Fund shares to the cumulative total return on the Standard & Poor’s 500® Index, assuming an investment of $10,000 in both at their closing prices on December 31, 2002 and reinvestment of dividends and capital gains. The graph does not reflect the deduction of taxes that a shareholder would pay on Fund distributions or the redemption of Fund shares. Keep in mind that past performance does not guarantee future returns, and an investment in the Fund is not guaranteed. For management’s discussion of the Fund’s performance for the six months ended June 30, 2013, including strategies and market conditions which influenced such performance, see the Shareholder Letter.
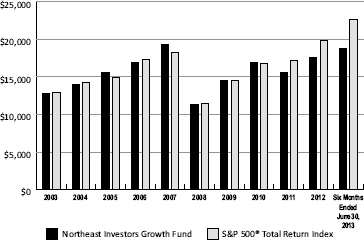
| 2003 | 2004 | 2005 | 2006 | 2007 | 2008 | 2009 | 2010 | 2011 | 2012 | Six Months Ended June 30, 2013 | ||||||||||||
| Northeast Investors Growth Fund | $12,839 | $13,938 | $15,525 | $16,959 | $19,316 | $11,279 | $14,555 | $16,939 | $15,610 | $17,549 | $18,770 | |||||||||||
| S&P 500® Total Return Index | $12,868 | $14,269 | $14,970 | $17,334 | $18,286 | $11,521 | $14,570 | $16,764 | $17,118 | $19,858 | $22,603 |
| Semi-Annual Report | June 30, 2013 |
3 |
| Northeast Investors Growth Fund | Portfolio Update | |
| June 30, 2013 (Unaudited) |
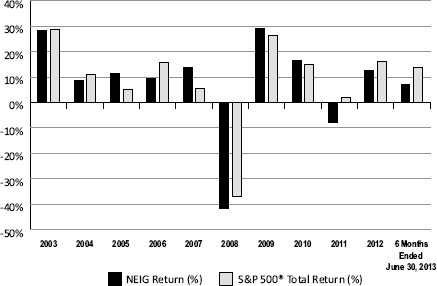
Returns and Per Share Data
| 2003 | 2004 | 2005 | 2006 | 2007 | 2008 | 2009 | 2010 | 2011 | 2012 | Six Months Ended June 30, 2013 | ||||||||||||
| Net Asset Value | 15.26 | 16.52 | 18.40 | 20.10 | 20.19 | 11.74 | 15.15 | 17.60 | 16.22 | 16.67 | 17.83 | |||||||||||
| Dividend Dist. | 0.03 | 0.05 | 0.00 | 0.00 | 0.04 | 0.05 | 0.00 | 0.03 | 0.00 | 0.10 | 0.00 | |||||||||||
| Capital Gains Dist. | 0.00 | 0.00 | 0.00 | 0.00 | 2.60 | 0.00 | 0.00 | 0.00 | 0.00 | 1.47 | 0.00 | |||||||||||
| NEIG Return (%) | 28.39% | 8.56% | 11.38% | 9.24% | 13.90% | -41.61% | 29.05% | 16.38% | -7.84% | 12.42% | 6.96% | |||||||||||
| S&P 500® Return (%) | 28.68% | 10.88% | 4.91% | 15.79% | 5.49% | -37.00% | 26.46% | 15.06% | 2.11% | 16.00% | 13.82% |
| 4 | www.northeastinvest.com |
| Northeast Investors Growth Fund | Portfolio Update | |
| June 30, 2013 (Unaudited) |
Ten Largest Investment Holdings
| Market Value | Percent of Net Assets | |||||||
| Visa, Inc., Class A |
$ | 3,033,650 | 4.20% | |||||
| CVS Caremark Corp. |
2,544,510 | 3.53% | ||||||
| Union Pacific Corp. |
2,514,764 | 3.48% | ||||||
| Perrigo Co. |
2,395,800 | 3.32% | ||||||
| Walt Disney Co. |
2,369,704 | 3.28% | ||||||
| Schlumberger Ltd. |
2,092,472 | 2.90% | ||||||
| Mondelez International, Inc., Class A |
2,086,970 | 2.89% | ||||||
| Honeywell International, Inc. |
2,062,840 | 2.86% | ||||||
| Akamai Technologies, Inc. |
2,061,547 | 2.86% | ||||||
| Apple, Inc. |
2,033,871 | 2.82% | ||||||
Summary of Sector Weightings as a Percentage of Net Assets
| Percent of Net Assets | ||||
| Financial |
20.04% | |||
| Consumer, Cyclical |
15.50% | |||
| Industrial |
11.68% | |||
| Technology |
11.42% | |||
| Consumer, Non-Cyclical |
20.33% | |||
| Energy |
11.28% | |||
| Communications |
8.94% | |||
| Cash, Cash Equivalents, & Other Net Assets |
0.81% | |||
| Total |
100.00% | |||
| Semi-Annual Report | June 30, 2013 |
5 |
| Northeast Investors Growth Fund | Portfolio Update | |
| June 30, 2013 (Unaudited) |
Summary of Net Assets by Industry
| Market Value | % of Net Assets | |||||||||
| Common Stocks |
||||||||||
| Retail |
$ | 9,361,261 | 12.97% | |||||||
| Oil & Gas Equipment |
8,144,647 | 11.28% | ||||||||
| Banks |
6,825,006 | 9.46% | ||||||||
| Pharmaceuticals |
5,896,448 | 8.17% | ||||||||
| Diversified Financial Services |
4,522,253 | 6.26% | ||||||||
| Internet |
4,087,080 | 5.66% | ||||||||
| Software |
4,058,347 | 5.63% | ||||||||
| Food |
3,826,851 | 5.30% | ||||||||
| Real Estate Investment Trusts |
3,112,138 | 4.32% | ||||||||
| Computers |
3,094,409 | 4.29% | ||||||||
| Transportation |
2,514,764 | 3.48% | ||||||||
| Media |
2,369,704 | 3.28% | ||||||||
| Electronics |
2,062,840 | 2.86% | ||||||||
| Apparel |
1,824,417 | 2.53% | ||||||||
| Healthcare Products |
1,684,112 | 2.33% | ||||||||
| Miscellaneous Manufacturing |
1,676,637 | 2.32% | ||||||||
| Beverages |
1,649,533 | 2.29% | ||||||||
| Biotechnology |
1,618,236 | 2.24% | ||||||||
| Machinery-Diversified |
1,271,562 | 1.76% | ||||||||
| Semiconductors |
1,085,647 | 1.50% | ||||||||
| Machinery-Construction & Mining |
907,390 | 1.26% | ||||||||
| Total Common Stocks |
71,593,282 | 99.19% | ||||||||
| Total Cash Equivalents |
816,334 | 1.13% | ||||||||
| Total Investment Portfolio |
72,409,616 | 100.32% | ||||||||
| Net Other Assets and Liabilities |
(230,330 | ) | -0.32% | |||||||
| Total Net Assets |
72,179,286 | 100.00% | ||||||||
| 6 | www.northeastinvest.com |
| Northeast Investors Growth Fund | Portfolio Update | |
| June 30, 2013 (Unaudited) |
Quarterly Portfolio Holdings
Each fiscal quarter-end the Fund is required to file a complete schedule of investments with the Securities and Exchange Commission. The schedules of portfolio holdings for the second and fourth quarters appear in the semi-annual and annual reports to shareholders. For the first and third quarters, the Fund files the schedules of portfolio holdings with the SEC on Form N-Q. The Fund makes the information on Form N-Q available on its website at www.northeastinvest.com or upon request.
Shareholders may also access and review information and reports of the Fund, including Form N-Q, at the SEC’s Public Reference Room in Washington, D.C. You can call the SEC at 1-202-942-8090 for information about the operation of the Public Reference Room. Reports and other information about the Fund are available on the SEC’s internet site at http://www.sec.gov and copies may be obtained for a duplicating fee by electronic request at the following e-mail address: publicinfo@sec.gov or by writing the Public Reference Center of the Securities and Exchange Commission, Washington, D.C. 20549-0102. The Fund’s reference number as a registrant under the Investment Company Act of 1940 is 811-3074.
| Semi-Annual Report | June 30, 2013 |
7 |
| Northeast Investors Growth Fund | Disclosure of Fund Expenses | |
| June 30, 2013 (Unaudited) |
As a shareholder of the Northeast Investors Growth Fund (the “Fund”), you will incur ongoing costs, including management fees and other Fund expenses. The following examples are intended to help you understand your ongoing costs (in dollars) of investing in the Fund and to compare these costs with the ongoing costs of investing in other mutual funds. The examples are based on an investment of $1,000 invested on January 1, 2013 and held until June 30, 2013.
Actual Expenses. The first line of each table below provides information about actual account values and actual expenses. You may use the information in this line, together with the amount you invested, to estimate the expenses that you paid over the period. Simply divide your account value by $1,000 (for example, an $8,600 account value divided by $1,000 = 8.6), then multiply the result by the number in the first line under the heading “Expenses Paid During Period” to estimate the expenses you paid on your account during this period.
Hypothetical Example for Comparison Purposes. The second line of the table below provides information about hypothetical account values and hypothetical expenses based on the Fund’s actual expense ratio and an assumed rate of return of 5% per year before expenses, which is not the Fund’s actual return. The hypothetical account values and expenses may not be used to estimate the actual ending account balance or expenses you paid for the period. You may use this information to compare the ongoing costs of investing in the Fund and other mutual funds. To do so, compare this 5% hypothetical example with the 5% hypothetical examples that appear in the shareholder reports of the other funds. The expenses shown in the table are meant to highlight ongoing Fund costs. Therefore, the second line of each table below is useful in comparing ongoing costs only, and may not help you determine the relative total costs of owning different funds. In addition, if these transactional costs were included, your costs would have been higher.
| Net Expense Ratios |
Beginning Account Value January 1, 2013 |
Ending Account Value June 30, 2013 |
Expenses Paid During Period(a) | |||||||||||||||||
| Northeast Investors Growth Fund |
||||||||||||||||||||
| Actual Return |
1.22% | $ | 1,000.00 | $ | 1,069.60 | $ | 6.26 | |||||||||||||
| Hypothetical Return (5% return before expenses) |
1.22% | $ | 1,000.00 | $ | 1,018.74 | $ | 6.11 | |||||||||||||
| (a) | Expenses are equal to the Fund’s annualized expense ratio multiplied by the average account value over the period, multiplied by the number of days in the most recent fiscal half year (181), divided by 365. |
| 8 | www.northeastinvest.com |
| Northeast Investors Growth Fund | Schedule of Investments | |
| June 30, 2013 (Unaudited) |
| Description | Shares | Value $ | ||||||
| COMMON STOCKS - 99.19% |
||||||||
| Communications - 8.94% |
||||||||
| Internet - 5.66% |
||||||||
| Amazon.com, Inc.(a) |
4,700 | $1,305,143 | ||||||
| Facebook, Inc., Class A(a) |
49,400 | 1,228,084 | ||||||
| Google, Inc., Class A(a) |
1,765 | 1,553,853 | ||||||
|
|
|
|||||||
| 4,087,080 | ||||||||
|
|
|
|||||||
| Media - 3.28% |
||||||||
| Walt Disney Co. |
37,525 | 2,369,704 | ||||||
|
|
|
|||||||
| Total Communications |
6,456,784 | |||||||
|
|
|
|||||||
| Consumer, Cyclical - 15.50% |
||||||||
| Apparel - 2.53% |
||||||||
| VF Corp. |
9,450 | 1,824,417 | ||||||
|
|
|
|||||||
| Retail - 12.97% |
||||||||
| CVS Caremark Corp. |
44,500 | 2,544,510 | ||||||
| Lowe’s Cos, Inc. |
40,100 | 1,640,090 | ||||||
| McDonald’s Corp. |
18,550 | 1,836,450 | ||||||
| Target Corp. |
25,700 | 1,769,702 | ||||||
| Williams-Sonoma, Inc.(b) |
28,100 | 1,570,509 | ||||||
|
|
|
|||||||
| 9,361,261 | ||||||||
|
|
|
|||||||
| Total Consumer, Cyclical |
11,185,678 | |||||||
|
|
|
|||||||
| Consumer, Non-Cyclical - 20.33% |
||||||||
| Beverages - 2.29% |
||||||||
| Diageo PLC, ADR |
14,350 | 1,649,533 | ||||||
|
|
|
|||||||
| Biotechnology - 2.24% |
||||||||
| Gilead Sciences, Inc.(a) |
31,600 | 1,618,236 | ||||||
|
|
|
|||||||
| Food - 5.30% |
||||||||
| Mondelez International, Inc., Class A |
73,150 | 2,086,970 | ||||||
| Nestle SA, ADR |
26,450 | 1,739,881 | ||||||
|
|
|
|||||||
| 3,826,851 | ||||||||
|
|
|
|||||||
| Healthcare-Products - 2.33% |
||||||||
| Covidien PLC |
26,800 | 1,684,112 | ||||||
|
|
|
|||||||
See accompanying notes which are an integral part of these financial statements.
| Semi-Annual Report | June 30, 2013 |
9 |
| Northeast Investors Growth Fund | Schedule of Investments | |
| June 30, 2013 (Unaudited) |
| Description | Shares | Value $ | ||||||
| Consumer, Non-Cyclical - 20.33% (continued) |
||||||||
| Pharmaceuticals - 8.17% |
||||||||
| Abbott Laboratories |
43,600 | $1,520,768 | ||||||
| Novartis AG, ADR |
28,000 | 1,979,880 | ||||||
| Perrigo Co. |
19,800 | 2,395,800 | ||||||
|
|
|
|||||||
| 5,896,448 | ||||||||
|
|
|
|||||||
| Total Consumer, Non-Cyclical |
14,675,180 | |||||||
|
|
|
|||||||
| Energy - 11.28% |
||||||||
| Oil & Gas - 5.57% |
||||||||
| Chevron Corp. |
13,500 | 1,597,590 | ||||||
| Exxon Mobil Corp. |
18,232 | 1,647,261 | ||||||
| Noble Corp. |
20,800 | 781,664 | ||||||
|
|
|
|||||||
| 4,026,515 | ||||||||
|
|
|
|||||||
| Oil & Gas Services - 5.71% |
||||||||
| National Oilwell Varco, Inc. |
29,400 | 2,025,660 | ||||||
| Schlumberger Ltd. |
29,200 | 2,092,472 | ||||||
|
|
|
|||||||
| 4,118,132 | ||||||||
|
|
|
|||||||
| Total Energy |
8,144,647 | |||||||
|
|
|
|||||||
| Financial - 20.04% |
||||||||
| Banks - 9.46% |
||||||||
| Citigroup, Inc. |
35,400 | 1,698,138 | ||||||
| Goldman Sachs Group, Inc. |
11,400 | 1,724,250 | ||||||
| JPMorgan Chase & Co. |
35,100 | 1,852,929 | ||||||
| Wells Fargo & Co. |
37,550 | 1,549,689 | ||||||
|
|
|
|||||||
| 6,825,006 | ||||||||
|
|
|
|||||||
| Diversified Financial Services - 6.26% |
||||||||
| T. Rowe Price Group, Inc. |
20,350 | 1,488,603 | ||||||
| Visa, Inc., Class A |
16,600 | 3,033,650 | ||||||
|
|
|
|||||||
| 4,522,253 | ||||||||
|
|
|
|||||||
| Real Estate Investment Trusts - 4.32% |
||||||||
| American Tower Corp., Class A |
22,831 | 1,670,544 | ||||||
| Weyerhaeuser Co. |
50,600 | 1,441,594 | ||||||
|
|
|
|||||||
| 3,112,138 | ||||||||
|
|
|
|||||||
| Total Financial |
14,459,397 | |||||||
|
|
|
|||||||
| Industrial - 11.68% |
||||||||
| Electronics - 2.86% |
||||||||
| Honeywell International, Inc. |
26,000 | 2,062,840 | ||||||
|
|
|
|||||||
See accompanying notes which are an integral part of these financial statements.
| 10 | www.northeastinvest.com |
| Northeast Investors Growth Fund | Schedule of Investments | |
| June 30, 2013 (Unaudited) |
| Description | Shares | Value $ | ||||||
| Industrial - 11.68% (continued) |
||||||||
| Machinery-Construction & Mining - 1.26% |
||||||||
| Caterpillar, Inc. |
11,000 | $907,390 | ||||||
|
|
|
|||||||
| Machinery-Diversified - 1.76% |
||||||||
| Deere & Co. |
15,650 | 1,271,562 | ||||||
|
|
|
|||||||
| Miscellaneous Manufacturing - 2.32% |
||||||||
| General Electric Co. |
72,300 | 1,676,637 | ||||||
|
|
|
|||||||
| Transportation - 3.48% |
||||||||
| Union Pacific Corp. |
16,300 | 2,514,764 | ||||||
|
|
|
|||||||
| Total Industrial |
8,433,193 | |||||||
|
|
|
|||||||
| Technology - 11.42% |
||||||||
| Computers - 4.29% |
||||||||
| Apple, Inc. |
5,135 | 2,033,871 | ||||||
| EMC Corp. |
44,900 | 1,060,538 | ||||||
|
|
|
|||||||
| 3,094,409 | ||||||||
|
|
|
|||||||
| Semiconductors - 1.50% |
||||||||
| ASML Holding N.V. |
13,725 | 1,085,647 | ||||||
|
|
|
|||||||
| Software - 5.63% |
||||||||
| Akamai Technologies, Inc.(a) |
48,450 | 2,061,547 | ||||||
| Oracle Corp. |
65,000 | 1,996,800 | ||||||
|
|
|
|||||||
| 4,058,347 | ||||||||
|
|
|
|||||||
| Total Technology |
8,238,403 | |||||||
|
|
|
|||||||
| Total Common Stocks (Cost $55,605,782) |
71,593,282 | |||||||
|
|
|
|||||||
| Description | Shares | Value $ | ||||||
| REPURCHASE AGREEMENT - 1.13% |
||||||||
| Repurchase agreement with State Street Bank & Trust Co., dated 06/28/13 due 07/01/13 at 0.01%. Collateralized by U.S. Treasury Securities with various maturity dates, with a Collateral value of $836,461 (Repurchase proceeds of $816,334) |
816,334 | 816,334 | ||||||
|
|
|
|||||||
| Total Repurchase Agreement (Cost $816,334) |
816,334 | |||||||
|
|
|
|||||||
See accompanying notes which are an integral part of these financial statements.
| Semi-Annual Report | June 30, 2013 |
11 |
| Northeast Investors Growth Fund | Schedule of Investments | |
| June 30, 2013 (Unaudited) |
| Description | 7 Day Yield | Shares | Value $ | |||||||||
| INVESTMENTS PURCHASED WITH CASH COLLATERAL FROM SECURITIES LOANED - 0.63% |
| |||||||||||
| State Street Navigator Securities Lending Prime Portfolio(c) |
0.17% | 455,882 | $455,882 | |||||||||
|
|
|
|||||||||||
| Total Investments Purchased with Cash Collateral From Securities Loaned (Cost $455,882) |
455,882 | |||||||||||
|
|
|
|||||||||||
| Total Investments - 100.95% (Cost $56,877,998) |
72,865,498 | |||||||||||
| Other Liabilities in Excess of Assets - (0.95)% |
(686,212) | |||||||||||
|
|
|
|||||||||||
| Total Net Assets - 100.00% |
$72,179,286 | |||||||||||
|
|
|
|||||||||||
| (a) | Non-income producing security. Includes securities which did not pay at least one dividend in the year preceding the date of this statement. |
| (b) | All or a portion of the security is on loan as of June 30, 2013. |
| (c) | The security has been segregated to satisfy the commitment to return the cash collateral received in securities lending transactions upon the borrower’s return of the securities loaned. (Note K) |
See accompanying notes which are an integral part of these financial statements.
| 12 | www.northeastinvest.com |
| Northeast Investors Growth Fund | Statement of Assets and Liabilities | |
| June 30, 2013 (Unaudited) |
| ASSETS: |
||||
| Investments*, at market value (Cost $56,874,016) |
$ | 72,865,498 | ||
| Dividends receivable |
64,523 | |||
| Receivable for shares sold |
535 | |||
| Other receivables |
16,063 | |||
| Total Assets |
72,946,619 | |||
| LIABILITIES: |
||||
| Collateral on securities loaned, at value (Note J) |
455,882 | |||
| Payable for shares redeemed |
173,756 | |||
| Accrued investment advisory fee |
38,416 | |||
| Accrued insurance |
30,764 | |||
| Accrued audit expense |
25,537 | |||
| Accrued printing fees |
12,598 | |||
| Accrued administration fees |
7,973 | |||
| Accrued legal fees |
6,776 | |||
| Accrued commitment fees |
4,873 | |||
| Accrued other expenses |
10,758 | |||
| Total Liabilities |
767,333 | |||
| NET ASSETS |
$ | 72,179,286 | ||
| NET ASSETS CONSISTS OF: |
||||
| Paid-in capital |
$ | 49,680,342 | ||
| Undistributed net investment income |
257,071 | |||
| Accumulated net realized gain |
6,254,373 | |||
| Net unrealized appreciation on investments |
15,987,500 | |||
| NET ASSETS |
$ | 72,179,286 | ||
| Shares of beneficial interest outstanding (unlimited number of shares, no par value common stock authorized) |
4,048,648 | |||
| Net Asset Value, offering and redemption price per share |
$ | 17.83 | ||
| *At June 30, 2013, securities with a market value of $445,052, were on loan to qualified institutions. |
||||
| See accompanying notes which are an integral part of these financial statements. | ||||
| Semi-Annual Report | June 30, 2013 |
13 |
| Northeast Investors Growth Fund | Statement of Operations | |
| For the Six Months Ended June 30, 2013 (Unaudited) |
| INVESTMENT INCOME: |
||||
| Dividends, (net of foreign withholding taxes of $22,337) |
$ | 658,754 | ||
| Securities lending income |
2,215 | |||
| Total Investment Income |
660,969 | |||
| EXPENSES: |
||||
| Investment advisory fee (Note D) |
234,901 | |||
| Administrative fees (Note C) |
48,101 | |||
| Transfer agent fees (Note C) |
42,802 | |||
| Audit fees |
22,437 | |||
| Legal fees |
21,097 | |||
| Trustee fees |
15,550 | |||
| Printing fees |
13,765 | |||
| Insurance |
13,182 | |||
| Custodian fees |
10,384 | |||
| Registration and filing fees |
8,722 | |||
| Commitment fees |
5,919 | |||
| Interest expense |
4,164 | |||
| Retirement |
2,664 | |||
| Miscellaneous fees |
7,929 | |||
| Total Expenses |
451,617 | |||
| Net Investment Income |
209,352 | |||
| REALIZED AND UNREALIZED GAIN ON INVESTMENTS: |
||||
| Net realized gain on investment transactions |
6,254,373 | |||
| Net change in unrealized depreciation on investments |
(1,392,678 | ) | ||
| Net Gain on Investments |
4,861,695 | |||
| NET INCREASE IN NET ASSETS RESULTING FROM OPERATIONS |
$ | 5,071,047 | ||
| See accompanying notes which are an integral part of these financial statements. | ||
| 14 | www.northeastinvest.com | |
| Northeast Investors Growth Fund | Statements of Changes in Net Assets | |
|
|
Six Months Ended June 30, 2013 (Unaudited) |
|
|
Year Ended December 31, 2012 |
| |||
| INCREASE (DECREASE) IN NET ASSETS FROM OPERATIONS: |
||||||||
| Net investment income |
$ | 209,352 | $ | 338,155 | ||||
| Net realized gain on investment transactions |
6,254,373 | 6,455,280 | ||||||
| Net change in unrealized appreciation (depreciation) on investments |
(1,392,678) | 2,432,183 | ||||||
| Net Increase in Net Assets Resulting from Operations |
5,071,047 | 9,225,618 | ||||||
| DISTRIBUTIONS TO SHAREHOLDERS: |
||||||||
| From net investment income |
– | (408,312) | ||||||
| From net realized gains on investments |
– | (6,012,636) | ||||||
| Net Decrease in Net Assets from Distributions |
– | (6,420,948) | ||||||
| FUND SHARE TRANSACTIONS: |
||||||||
| Proceeds from sale of shares |
594,649 | 1,261,243 | ||||||
| Reinvestment of distributions |
– | 5,731,017 | ||||||
| Cost of shares redeemed |
(6,502,009) | (12,972,016) | ||||||
| Net Decrease in Net Assets from Fund Share Transactions |
(5,907,360) | (5,979,756) | ||||||
| Net Decrease in Net Assets |
(836,313) | (3,175,086) | ||||||
| NET ASSETS: |
||||||||
| Beginning of period |
73,015,599 | 76,190,685 | ||||||
|
|
|
|||||||
| End of period* |
$ | 72,179,286 | $ | 73,015,599 | ||||
|
|
|
|||||||
| *Includes accumulated undistributed net investment income: |
$ | 257,071 | $ | 47,719 | ||||
| See accompanying notes which are an integral part of these financial statements. | ||||
| Semi-Annual Report | June 30, 2013 |
15 |
| Northeast Investors Growth Fund | ||
| NET ASSET VALUE, BEGINNING OF PERIOD |
| INVESTMENT OPERATIONS: |
| Net investment income(a) |
| Net realized and unrealized gain/(loss) on investments |
| Total from Investment Operations |
| LESS DISTRIBUTIONS TO SHAREHOLDERS |
| From net investment income |
| From net realized gains |
| Total Distributions |
| NET ASSET VALUE, END OF PERIOD |
| TOTAL RETURN(b) |
| RATIOS AND SUPPLEMENTAL DATA: |
| Net assets, end of period (in 000s) |
| Ratio to average daily net assets: |
| Expenses |
| Net investment income |
| PORTFOLIO TURNOVER RATE |
| (a) | Average share method used to calculate per share data. |
| (b) | Total return represents the rate that the investor would have earned or lost on an investment in the Fund, assuming reinvestment of dividends. |
| (c) | Annualized. |
| See accompanying notes which are an integral part of these financial statements. | ||
| 16 | www.northeastinvest.com | |
| Financial Highlights | ||
| For a share outstanding through the periods presented |
| Six Months Ended June 30, 2013 (Unaudited) |
|
Year Ended December 31, 2012 |
|
|
Year Ended December 31, 2011 |
|
|
Year Ended December 31, 2010 |
|
|
Year Ended December 31, 2009 |
|
|
Year Ended December 31, 2008 |
| |||||
| $16.67 |
$16.22 | $17.60 | $15.15 | $11.74 | $20.19 | |||||||||||||||
|
|
||||||||||||||||||||
| 0.05 |
0.08 | 0.02 | 0.01 | 0.02 | 0.05 | |||||||||||||||
| 1.11 |
1.94 | (1.40) | 2.47 | 3.39 | (8.45) | |||||||||||||||
| 1.16 |
2.02 | (1.38) | 2.48 | 3.41 | (8.40) | |||||||||||||||
|
|
||||||||||||||||||||
| – |
(0.10) | – | (0.03) | – | (0.05) | |||||||||||||||
| – |
(1.47) | – | – | – | – | |||||||||||||||
| – |
(1.57) | – | (0.03) | – | (0.05) | |||||||||||||||
| $17.83 |
$16.67 | $16.22 | $17.60 | $15.15 | $11.74 | |||||||||||||||
| 6.96% |
12.42% | (7.84)% | 16.38% | 29.05% | (41.61)% | |||||||||||||||
|
|
||||||||||||||||||||
| $72,179 |
$73,016 | $76,191 | $93,264 | $92,364 | $78,453 | |||||||||||||||
| 1.22%(c) |
1.38% | 1.40% | 1.39% | 1.60% | 1.27% | |||||||||||||||
| 0.56%(c) |
0.44% | 0.14% | 0.03% | 0.16% | 0.29% | |||||||||||||||
| 20% |
36% | 49% | 15% | 36% | 45% | |||||||||||||||
| Semi-Annual Report | June 30, 2013 |
17 |
| Northeast Investors Growth Fund | Notes to Financial Statements | |
| June 30, 2013 (Unaudited) |
NOTE A–ORGANIZATION
Northeast Investors Growth Fund (the “Fund”) is a diversified, no-load, open-end, series-type management investment company registered under the Investment Company Act of 1940, as amended. The Fund presently consists of one portfolio and is organized as a Massachusetts business trust.
The Fund’s objective is to produce long-term capital appreciation for its shareholders. The Fund maintains a flexible investment policy which primarily targets common stocks of large domestic companies. The Fund emphasizes well-known companies which it believes to have strong management, solid financial fundamentals and which are established leaders in their industries. The Fund generally invests in companies with market capitalizations in excess of $10 billion.
NOTE B–SIGNIFICANT ACCOUNTING POLICIES
Significant accounting policies of the Fund, which are in conformity with accounting principles generally accepted in the United States of America (“U.S. GAAP”) are as follows:
Use of Estimates: The preparation of financial statements in conformity with U.S. GAAP requires management to make estimates and assumptions that affect the reported amounts of assets and liabilities and disclosure of contingent assets and liabilities at the date of the financial statements and the reported amounts of revenues and expenses during the reporting period. Actual results could differ from those estimates.
Valuation of Investments: Investments in securities traded on national securities exchanges are valued based upon closing prices on the exchanges or last sales price. Securities traded in the over-the-counter market and listed securities with no sales on the date of valuation are valued at closing bid prices. Repurchase agreements are valued at cost, which approximates market value with earned interest included in interest receivable. Other short-term investments, when held by the Fund, are valued at cost plus earned discount or interest which approximates market value.
Securities and other assets for which market quotations are not readily available or are deemed unreliable (including restricted securities, if any) are valued at their fair value as determined in good faith under consistently applied procedures approved by the Board of Trustees. Methodologies and factors used to determine fair value of securities may include, but are not limited to, contractual restrictions, information of any recent sales, the analysis of the company’s financial statements, quotations or evaluated prices from broker-dealers and/or pricing services and information obtained from analysts. The Fund may use fair value pricing for foreign securities if a material event occurs that may effect the price of a security after the close of the foreign market or exchange (or on days the foreign market is closed) but before the Fund prices its portfolio, generally at 4:00 p.m. EST. Fair value pricing may also be used for securities acquired as a result of corporate restructurings or reorganizations as reliable market quotations for such issues may not be readily available. At June 30, 2013 there were no securities priced at fair value as determined in good faith.
Investment Transactions: Investment transactions are accounted for as of trade date. Realized gains and losses on investments sold are determined on the basis of identified cost.
| 18 | www.northeastinvest.com |
| Northeast Investors Growth Fund | Notes to Financial Statements | |
| June 30, 2013 (Unaudited) |
Investment Income: Interest income, which consists of interest from repurchase agreements is accrued and recorded on a daily basis including amortization of premiums, accretion of discounts and income earned from money market funds. Interest is not accrued on securities that are in default. Dividend income is recorded on the ex-dividend date, net of applicable withholding taxes.
Federal Income Taxes: No provision for federal income taxes is necessary since the Fund has elected to qualify under subchapter M of the Internal Revenue Code of 1986, as amended, and its policy is to distribute substantially all of its taxable income, including net realized capital gains, within the prescribed time periods.
As of and during the six months ended June 30, 2013, the Fund did not have a liability for any unrecognized tax benefits. The Fund recognized interest and penalties, if any, related to unrecognized tax benefits as income tax expense in the Statement of Operations. During the six months ended, the Fund did not incur any interest or penalties. The Fund is subject to examination by U.S. federal tax authorities for tax years 2009 through 2012.
State Income Taxes: Because the Fund has been organized by an Agreement and Declaration of Trust executed under the laws of the Commonwealth of Massachusetts, it is not subject to state income or excise taxes.
Dividends and Distributions to Shareholders: Income and capital gain distributions are determined in accordance with income tax regulations which may differ from U.S. GAAP. Permanent book and tax differences relating to shareholder distributions will result in reclassifications to paid-in capital. The Fund’s distributions and dividend income are recorded on the ex-dividend date.
Indemnification: In the normal course of business, the Fund may enter into contracts that contain general indemnification clauses. The Fund’s maximum exposure under these arrangements in unknown, as this would involve future claims against the Fund that have not yet occurred. Based on experience, the Fund expects the risk of loss to be remote.
Net Asset Value: In determining the net asset value per share, rounding adjustments are made for fractions of a cent to the next higher cent.
Subsequent Events: In accordance with U.S. GAAP, management has evaluated subsequent events through the date these financial statements were issued. All subsequent events determined to be relevant and material to these financial statements as a whole have been accordingly disclosed.
NOTE C–FUND ADMINISTRATION, ACCOUNTING, TRANSFER AGENCY AND SHAREHOLDER SERVICING
ALPS Fund Services, Inc. (“ALPS”) serves as Fund administrator for which it is compensated by the Fund. ALPS also serves as fund accountant, transfer agent and shareholder servicing agent. ALPS carries out all functions related to the maintenance of shareholder accounts, acquisition and redemption of shares and mailings to shareholders. ALPS also determines the Fund’s Net Asset Value.
| Semi-Annual Report | June 30, 2013 |
19 |
| Northeast Investors Growth Fund | Notes to Financial Statements | |
| June 30, 2013 (Unaudited) |
Northeast Management & Research Company, Inc. (“NMR”) provides the Fund with the services of a Chief Compliance Officer and anti-money laundering officer.
NOTE D–INVESTMENT ADVISORY AND SERVICE CONTRACT
The Fund has an investment advisory and service contract with NMR (the “Advisor”). Under the contract, the Fund pays the Advisor an annual fee at a maximum rate of 1.00% of the first $10,000,000 of the Fund’s average daily net assets, 3/4 of 1.00% of the next $20,000,000 and 1/2 of 1.00% of the average daily net assets in excess of $30,000,000, in monthly installments on the basis of the average daily net assets during the month preceding payment.
Under the Fund’s Investment Advisory Agreement (the “Agreement”), personnel of the Advisor provide the Fund with advice and assistance in the choice of investments and the execution of securities transactions, and otherwise maintain the Fund’s organization. Compensation to officers of the Fund or Advisor for services rendered to the Fund or to the Advisor are paid by the Advisor. Messrs. John C. Emery, Michael Baldwin, and F. Washington Jarvis, the Fund’s disinterested Trustees, are not officers or directors of the Advisor. The compensation of all disinterested Trustees of the Fund is borne by the Fund.
NOTE E–PURCHASES AND SALES OF INVESTMENTS
The cost of purchases and proceeds from sales of investments, other than short-term securities, aggregated $15,124,147 and $20,337,852, respectively, for the six months ended June 30, 2013.
NOTE F–FUND SHARE TRANSACTIONS
At June 30, 2013, there was an unlimited number of fund share transactions authorized with no par value. Transactions in shares of beneficial interest were as follows:
| 6/30/2013 (Unaudited) |
12/31/2012 | |||||||
| Shares sold |
33,722 | 70,793 | ||||||
| Shares reinvested |
– | 341,946 | ||||||
| Shares redeemed |
(365,532) | (730,484) | ||||||
|
|
|
|||||||
| Net decrease in shares outstanding |
(331,810) | (317,745) | ||||||
|
|
|
|||||||
NOTE G–LINE OF CREDIT
Short-term bank borrowings, which do not require maintenance of compensating balances, are generally on a demand basis and are at rates equal to adjusted money market interest rates in effect during the period in which such loans are outstanding. At June 30, 2013, the Fund had an unused line of credit amounting to $10,000,000. In addition the Fund pays a commitment fee of 0.125% per annum, payable at the end of each quarter based on the unused portion of the line of credit. The committed line of credit may be terminated at the bank’s option at the annual renewal date.
The following information relates to aggregate short-term borrowings during the six months ended June 30, 2013:
| Average amount outstanding (total of daily outstanding principal balances divided by number of days with debt outstanding during the period) |
$ | 959,464 | ||
| Weighted average interest rate |
1.41% |
| 20 | www.northeastinvest.com |
| Northeast Investors Growth Fund | Notes to Financial Statements | |
| June 30, 2013 (Unaudited) |
NOTE H–TAX BASIS INFORMATION
The tax character of distributions paid for the year ended December 31, 2012 were as follows:
| Distributions Paid From: | 2012 | ||||
| Ordinary Income |
$ | 408,312 | |||
| Long Term Capital Gains |
6,012,636 | ||||
|
|
|
||||
| Total |
$ | 6,420,948 | |||
|
|
|
||||
|
At June 30, 2013 the Fund’s aggregate security unrealized gains and losses based on cost for U.S. federal income tax purposes was as follows:
|
| ||||
| Cost of Investments for income tax purposes |
$ | 56,874,016 | |||
|
|
|
||||
| Aggregate Gross appreciation |
$ | 16,600,405 | |||
| Aggregate Gross depreciation |
(612,905 | ) | |||
|
|
|
||||
| Net unrealized appreciation |
$ | 15,987,500 | |||
|
|
|
||||
NOTE I–REPURCHASE AGREEMENT
On a daily basis, the Fund invests any cash balances into repurchase agreements hypothecated by U.S. Government obligations. Securities pledged as collateral for repurchase agreements are held by the Fund’s custodian bank until maturity of the repurchase agreement. Provisions of the agreement ensure that the market value of the collateral is sufficient in the event of default. However, in the event of default or bankruptcy by the other party to the agreement, realization and/or retention of the collateral may be subject to legal proceedings.
NOTE J–SECURITIES LENDING
The Fund may seek additional income by lending portfolio securities to qualified institutions. The Fund will receive cash as collateral in an amount equal to at least 102% of the current market value of any loaned securities plus accrued interest. By reinvesting any cash collateral it receives in these transactions, the Fund could realize additional gains and losses. If the borrower fails to return the securities and the value of the collateral has declined during the term of the loan, the Fund will bear the loss. At June 30, 2013, the value of securities loaned and the value of collateral was $445,052 and $455,882, respectively. During the six months ended June 30, 2013, income from securities lending amounted to $2,215.
NOTE K–OFFSETTING ARRANGEMENTS
The Fund manages counterparty risk by entering into enforceable collateral arrangements with counterparties to repurchase agreements and securities lending agreements. These agreements mitigate counterparty credit risk by providing for a single net settlement with a counterparty of all financial transactions covered by the agreement in an event of default as defined under such agreement. The following table presents repurchase agreement instruments and securities lending agreements that are subject to collateral arrangements as of June 30, 2013.
| Semi-Annual Report | June 30, 2013 |
21 |
| Northeast Investors Growth Fund | Notes to Financial Statements | |
| June 30, 2013 (Unaudited) |
| Gross Amounts Not Offset in the Statement of Financial Position |
||||||||||||||||||||||||
| Description | Gross Amounts of Recognized Assets |
Gross Amounts Offset in the Statement of Assets and Liabilities |
Net Amounts Presented in the Statement of Assets and Liabilities |
Financial Instruments* |
Cash Collateral Pledged |
Net Amount | ||||||||||||||||||
| Repurchase Agreement |
$ | 816,334 | $ | – | $ | 816,334 | $ | (816,334 | ) | $ | – | $ | – | |||||||||||
| Total |
$ | 816,334 | $ | – | $ | 816,334 | $ | (816,334 | ) | $ | – | $ | – | |||||||||||
| Gross Amounts Not Offset in the Statement of Financial Position |
||||||||||||||||||||||||
| Description | Gross Amounts of Recognized Liabilities |
Gross Amounts Offset in the Statement of Assets and Liabilities |
Net Amounts Presented in the Statement of Assets and Liabilities |
Financial Instruments* |
Cash Collateral Pledged |
Net Amount | ||||||||||||||||||
| Securities Lending Collateral |
$ | 455,882 | $ | – | $ | 455,882 | $ | (455,882 | ) | $ | – | $ | – | |||||||||||
| Total |
$ | 455,882 | $ | – | $ | 455,882 | $ | (455,882 | ) | $ | – | $ | – | |||||||||||
| * | These amounts do not include the excess of collateral received/pledged. |
NOTE L–FAIR VALUE MEASUREMENTS
Accounting Standards Codification ASC 820, “Fair Value Measurements and Disclosures” (ASC 820) established a fair value hierarchy that distinguishes between market data obtained from independent sources (observable inputs) and the Fund’s own market assumptions (unobservable inputs). The inputs or methodologies used for valuing securities are not necessarily an indication of the risk associated with investing in those securities. The various inputs that may be used to determine the value of the Fund’s investments are summarized in the following fair value hierarchy:
| Level 1 |
- |
Unadjusted quoted prices in active markets for identical, unrestricted assets or liabilities that the Fund has the ability to access at the measurement date; | ||
| Level 2 |
- |
Quoted prices which are not active, quoted prices for similar assets or liabilities in active markets or input other than quoted prices that are observable (either directly or indirectly) for substantially the full term of the asset or liability; and | ||
| Level 3 |
- |
Significant unobservable prices or inputs (including a Fund’s own assumptions in determining the fair value of investments) where there is little or no market activity for the asset or liability at the measurement date. |
The availability of observable inputs can vary from security to security and is affected by a wide variety of factors, including, for example, the type of security, whether the security is new and not yet established in the marketplace, the liquidity of markets, and other characteristics particular to the security. To the extent that valuation is based on models or inputs that are less observable or unobservable in the
| 22 | www.northeastinvest.com |
| Northeast Investors Growth Fund | Notes to Financial Statements | |
| June 30, 2013 (Unaudited) |
market, the determination of fair value requires more judgment. Accordingly, the degree of judgment exercised in determining fair value is greatest for instruments categorized in Level 3.
An investment level within the fair value hierarchy is based on the lowest level input, individually or in the aggregate, that is significant to fair value measurement. The valuation techniques used by the Fund to measure fair value during the six months ended June 30, 2013 maximized the use of observable inputs and minimized the use of unobservable inputs.
The following table summarizes the Fund’s investments as of June 30, 2013, based on the inputs used to value them.
| Level 1 | Level 2 | Level 3 | Total | |||||||||||||
| Common Stocks |
$ | 71,593,282 | $ | – | $ | – | $ | 71,593,282 | ||||||||
| Repurchase Agreement |
– | 816,334 | – | 816,334 | ||||||||||||
| Investments Purchased with Cash Collateral From Securities Loaned |
455,882 | – | – | 455,882 | ||||||||||||
| TOTAL |
$ | 72,049,164 | $ | 816,334 | $ | – | $ | 72,865,498 | ||||||||
For the six months ended June 30, 2013, there have been no significant changes to the Fund’s fair value methodologies. Additionally, there were no transfers into or out of Levels 1 and 2 during the six months ended. It is the Fund’s policy to recognize transfers at the end of the reporting period.
For the six months ended June 30, 2013, the Fund did not have significant unobservable inputs (Level 3) used in determining fair value.
| Semi-Annual Report | June 30, 2013 |
23 |
| Northeast Investors Growth Fund | Additional Information | |
| June 30, 2013 (Unaudited) |
1. PROXY VOTING POLICIES AND VOTING RECORD
A description of the policies and procedures that the Fund uses to vote proxies relating to portfolio securities is available without charge upon request by calling toll-free 1-855-755-6344, or on the Securities and Exchange Commission’s (“SEC”) website at http://www.sec.gov. Information regarding how the Funds voted proxies relating to portfolio securities during the most recent 12 month period ended June 30th is available without charge upon request by calling toll-free 1-855-755-6344, or on the SEC’s website at http://www.sec.gov.
2. QUARTERLY PORTFOLIO HOLDINGS
The Fund files a complete listing of portfolio holdings with the SEC as of the first and third quarters of each fiscal year on Form N-Q. The filings are available upon request by calling 1-855-755-6344. Furthermore, you may obtain a copy of the filing on the SEC’s website at http://www.sec.gov. The Fund’s Form N-Q may also be reviewed and copied at the SEC’s Public Reference Room in Washington, D.C., and information on the operation of the Public Reference Room may be obtained by calling 1-800-SEC-0330.
| 24 | www.northeastinvest.com |
| Northeast Investors Growth Fund | Board Approval of Investment Advisory Contract | |
| June 30, 2013 (Unaudited) |
At its meeting held on May 17, 2013, the Board of Trustees of the Fund, including the Independent Trustees voting separately, voted to approve a one year renewal of the Fund’s investment management agreement with Northeast Management & Research Company, Inc. (the “Investment Adviser”).
In reaching its decision, the Board considered information furnished to the Board at prior Board meetings, as well as information prepared specifically in connection with the annual contract review process. The Board also observed that there is a range of investment options available to shareholders of the Fund, including other mutual funds, and that the Fund’s shareholders have chosen to invest in the Fund. The Trustees reviewed and evaluated all information and factors they believed, in light of legal advice furnished to them by independent legal counsel and through the exercise of their own business judgment, to be relevant and appropriate. The Board’s decision to approve the renewal was not based on any single factor. Each Trustee may have weighed certain factors differently.
The Investment Adviser presented detailed information to Board. Such information included (i) information confirming the financing condition of the Investment Adviser and the Investment Adviser’s profitability derived from its relationship with the Fund; (ii) a description of the personnel and services provided by the Investment Adviser; (iii) comparative information on investment performance fees and expenses; and (iv) information regarding brokerage and portfolio transactions.
The Board reviewed and considered the nature, extent and quality of services rendered to the Fund by the Investment Adviser. The Board took into account information furnished at meetings throughout the year as well as the materials furnished specifically in connection with the annual review process. The Board considered the background and experience of the Investment Adviser’s management team, and steps taken during the prior year to strengthen the investment process, enhance compliance and improve the shareholder service experience. The Board also reviewed and considered the qualifications of the current and anticipated portfolio managers to manage the portfolio of the Fund, including their history managing investments generally and growth oriented investments in particular, as well as the background and expertise of the key personnel and amount of time they would be able to devote to the affairs of the Fund. The Board concluded, in light of the particular requirements of the Fund, it was satisfied with the professional qualifications and overall commitment to the Fund of the anticipated portfolio management team and overall, was generally satisfied with the nature, extent and quality of investment advisory services provided to the Fund by the Investment Adviser.
The Board reviewed and considered the historical investment performance for the year-to-date, 1-year, 3-year, 5-year and 10-year periods, including comparative information against indexes and peer funds as determined by a third party, which reflected that the Fund’s performance was at or near the bottom of the peer group for those periods. The Board concluded that while the performance was disappointing relative to the index and peer measures, the differences were explainable based on the Investment Adviser’s investment approach and the Fund’s investment strategy. The Board determined that in light of the information taken as a whole and the nature of the investment program of the Fund, the investment performance was reasonable.
| Semi-Annual Report | June 30, 2013 |
25 |
| Northeast Investors Growth Fund | Board Approval of Investment Advisory Contract | |
| June 30, 2013 (Unaudited) |
The Board reviewed and considered information provided by the Investment Adviser about fees, income and expenses, and the Investment Adviser’s profitability derived from its relationship with the Fund. The Board determined that the Investment Adviser is solvent and in a position to perform the ongoing responsibilities to the Fund, and that the profitability to the Investment Adviser under the agreement was not unreasonable.
The Board reviewed and considered the total advisory fees and the effective investment advisory fee rate paid by the Fund in the context of potential economies of scale that might be realized by the Fund and noted the current advisory fee schedule contains breakpoints.
The Board reviewed and considered the investment advisory fees or other payments received by the Investment Adviser from the Fund and the Fund’s expense ratio. The Board reviewed and considered the aggregate fees paid during the prior year by the Fund to the Investment Adviser, as well as comparative fee information for other funds in its peer group, as determined by a third party. The Board concluded that while the Fund’s net expense ratio for the most recently completed fiscal year was above the group’s median and higher than 7 out of 11 funds in the selected peer group, most of those funds were larger and thus able to spread costs over a larger asset base. After carefully considering the information provided and the factors noted above, the Board concluded that, in light of the services provided, the Fund’s fees paid to the Investment Adviser were fair.
| 26 | www.northeastinvest.com |
Intentionally Left Blank
Intentionally Left Blank

|
TRUSTEES William A. Oates, Jr. Michael Baldwin John C. Emery F. Washington Jarvis
OFFICERS William A. Oates, Jr., President Robert B. Minturn, Vice President, Clerk & Chief Legal Officer John F. Francini, Jr., Vice President & Chief Financial Officer Richard G. Manoogian, Vice President & Chief Compliance Officer Nancy M. Mulligan, Vice President Robert M. Kane, Vice President
INVESTMENT ADVISOR Northeast Management & Research Company, Inc. 100 High Street Boston, Massachusetts 02110
CUSTODIAN State Street Bank & Trust Company 200 Clarendon Street Boston, Massachusetts 02116
LEGAL COUNSEL Wilmer Cutler Pickering Hale and Dorr LLP 60 State Street Boston, Massachusetts 02109
TRANSFER AGENT ALPS Fund Services, Inc. 1290 Broadway Suite 1100 Denver, Colorado 80203
INDEPENDENT REGISTERED PUBLIC ACCOUNTING FIRM Grant Thornton LLP 226 Causeway Street Boston, Massachusetts 02114 |
This report and the financial statements contained herein are submitted for the general information of the shareholders of the Fund. This report is not authorized for distribution to prospective investors in the Fund unless preceded or accompanied by an effective prospectus. Past performance is not predictive of future results. You may lose money by investing in the Fund. The information in this report should not be construed as a recommendation to purchase or sell a particular security, and there is no assurance the securities described remain part of the Fund’s portfolio today.
For a free copy of the Fund’s proxy voting guidelines and proxy voting record visit www.northeastinvest.com/growthfund/proxypolicy.shtml, call 855-755-NEIG (6344) or visit the Securities and Exchange Commission (SEC)’s website at www.sec.gov.
Shares of the Fund are sold to investors at net asset value by
| Northeast Investors Growth Fund |

| |
| 100 High Street |
||
| Boston, Massachusetts 02110 |
||
| 855-755-NEIG (6344) |
||
| www.northeastinvest.com |
||
|
Must be preceded or accompanied by a prospectus. |
Item 2. Code of Ethics.
Not applicable to semi-annual report.
Item 3. Audit Committee Financial Expert.
Not applicable to semi-annual report.
Item 4. Principal Accountant Fees and Services.
Not applicable to semi-annual report.
Item 5. Audit Committee of Listed Registrants.
Not applicable.
Item 6. Investments.
| (a) | Schedule of Investments in securities of unaffiliated issuers as of the close of the reporting period is included as part of the Reports to Stockholders filed under Item 1 of Form N-CSR. |
| (b) | Not applicable. |
Item 7. Disclosure of Proxy Voting Policies and Procedures for Closed-End Management Investment Companies.
Not applicable.
Item 8. Portfolio Managers of Closed-End Management Investment Companies.
Not applicable.
Item 9. Purchases of Equity Securities by Closed-End Management Investment Company and Affiliated Purchasers.
Not applicable.
Item 10. Submission of Matters to a Vote of Security Holders.
There have been no material changes to the procedures by which the shareholders may recommend nominees to the registrant’s board of directors, where those changes were implemented after the registrant last provided disclosure in response to the requirements of Item 407(c)(2)(iv) of Regulation S-K (17 CFR 229.407) (as required by Item 22(b)(15) of Schedule 14A (17 CFR 240.14a-101)), or this Item.
Item 11. Controls and Procedures.
| (a) | The registrant’s principal executive and principal financial officers, or persons performing similar functions, have concluded that the registrant’s disclosure controls and procedures (as defined in Rule 30a-3(c) under the Act (17 CFR 270.30a-3(c))) are effective, as of a date within 90 days of the filing date of the report that includes the disclosure required by this paragraph, based on their evaluation of these controls and procedures required by Rule 30a-3(b) under the Act (17 CFR 270.30a-3(b)) and Rules 13a-15(b) or 15d-15(b) under the Securities Exchange Act of 1934, as amended (17 CFR 240.13a-15(b) or 240.15d-15(b)). |
| (b) | No changes in the registrant’s internal control over financial reporting (as defined in Rule 30a-3(d) under the Act (17 CFR 270.30a-3(d)) occurred during the registrant’s second fiscal quarter of the period covered by this report that have materially affected, or are reasonably likely to materially affect, the registrant’s internal control over financial reporting. |
Item 12. Exhibits.
| (a)(1) | Not applicable to semi-annual report. | |||
| (a)(2) | Certifications pursuant to Rule 30a-2(a) under the Act (17 CFR 30a-2(a)) are attached hereto as Exhibit 99.Cert. | |||
| (a)(3) | Not applicable. | |||
| (b) | Certifications pursuant to Rule 30a-2(b) under the Act (17 CFR 30a-2(b)) and Section 1350 of Chapter 63 of Title 18 of the United States Code (18 U.S.C. 1350) are attached hereto. | |||
SIGNATURES
Pursuant to the requirements of the Securities Exchange Act of 1934 and the Investment Company Act of 1940, the Registrant has duly caused this report to be signed on its behalf by the undersigned, thereunto duly authorized.
| Northeast Investors Growth Fund | ||
| By: | /s/ William A. Oates, Jr. | |
| William A. Oates, Jr., President | ||
| (principal executive officer) | ||
| Date: | September 5, 2013 | |
Pursuant to the requirements of the Securities Exchange Act of 1934 and the Investment Company Act of 1940, this report has been signed below by the following persons on behalf of the registrant and in the capacities and on the dates indicated.
| By: | /s/ William A. Oates, Jr. | |
| William A. Oates, Jr., President | ||
| (principal executive officer) | ||
| Date: | September 5, 2013 | |
| By: | /s/ John F. Francini, Jr. | |
| John F. Francini, Jr., Chief Financial Officer | ||
| (principal financial officer) | ||
| Date: | September 5, 2013 | |