| Label |
Element |
Value |
| Absolute Credit Opportunities Fund |
|
|
| Risk/Return: |
rr_RiskReturnAbstract |
|
| Risk/Return [Heading] |
rr_RiskReturnHeading |
Absolute Credit Opportunities Fund
|
| Bar Chart and Performance Table [Heading] |
rr_BarChartAndPerformanceTableHeading |
Performance Information
|
| Performance Narrative [Text Block] |
rr_PerformanceNarrativeTextBlock |
The bar chart and table that follow provide some indication of the risks of investing in the Fund. The bar chart shows the performance of the Fund from year to year. The chart and table show how the Fund's average annual returns for one year, five years and since inception compare to certain broad-based indices. Updated performance information is available by calling (888) 99-ABSOLUTE or (888) 992-2765 (toll free).
Performance information represents only past performance, before and after taxes, and does not necessarily indicate future results. In addition, the Fund changed its investment strategies on October 1, 2014. Performance prior to October 1, 2014 does not reflect the current investment strategies of the Fund.
|
| Performance Information Illustrates Variability of Returns [Text] |
rr_PerformanceInformationIllustratesVariabilityOfReturns |
The bar chart and table that follow provide some indication of the risks of investing in the Fund.
|
| Performance Availability Phone [Text] |
rr_PerformanceAvailabilityPhone |
(888) 992-2765
|
| Performance Past Does Not Indicate Future [Text] |
rr_PerformancePastDoesNotIndicateFuture |
Performance information represents only past performance, before and after taxes, and does not necessarily indicate future results.
|
| Bar Chart [Heading] |
rr_BarChartHeading |
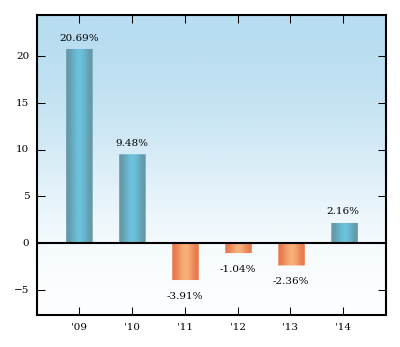
Annual Returns as of December 31
|
| Bar Chart Closing [Text Block] |
rr_BarChartClosingTextBlock |
The calendar year-to-date total return as of June 30, 2015 was 1.04%.
During the period shown, the highest return for a quarter was 10.50% for the quarter ended June 30, 2009, and the lowest return was -2.73% for the quarter ended September 30, 2011.
|
| Year to Date Return, Label |
rr_YearToDateReturnLabel |
year-to-date total return
|
| Bar Chart, Year to Date Return, Date |
rr_BarChartYearToDateReturnDate |
Jun. 30, 2015
|
| Bar Chart, Year to Date Return |
rr_BarChartYearToDateReturn |
1.04%
|
| Highest Quarterly Return, Label |
rr_HighestQuarterlyReturnLabel |
the highest return
|
| Highest Quarterly Return, Date |
rr_BarChartHighestQuarterlyReturnDate |
Jun. 30, 2009
|
| Highest Quarterly Return |
rr_BarChartHighestQuarterlyReturn |
10.50%
|
| Lowest Quarterly Return, Label |
rr_LowestQuarterlyReturnLabel |
the lowest return
|
| Lowest Quarterly Return, Date |
rr_BarChartLowestQuarterlyReturnDate |
Sep. 30, 2011
|
| Lowest Quarterly Return |
rr_BarChartLowestQuarterlyReturn |
(2.73%)
|
| Performance Table Heading |
rr_PerformanceTableHeading |
Average Annual Total Returns (For the periods ended December 31, 2015)
|
| Index No Deduction for Fees, Expenses, Taxes [Text] |
rr_IndexNoDeductionForFeesExpensesTaxes |
(reflects no deduction for fees, expenses or taxes)
|
| Performance Table Uses Highest Federal Rate |
rr_PerformanceTableUsesHighestFederalRate |
After-tax returns are calculated using the historical highest individual federal marginal income tax rates and do not reflect the impact of state and local taxes.
|
| Performance Table Not Relevant to Tax Deferred |
rr_PerformanceTableNotRelevantToTaxDeferred |
After-tax returns shown are not relevant to investors who hold their Fund shares through tax-deferred arrangements, such as 401(k) plans or individual retirement accounts.
|
| Performance Table Explanation after Tax Higher |
rr_PerformanceTableExplanationAfterTaxHigher |
The return after taxes on distributions and sale of Fund shares may exceed the return before taxes due to an assumed tax benefit from any losses on a sale of Fund shares at the end of the measurement period.
|
| Performance Table Closing [Text Block] |
rr_PerformanceTableClosingTextBlock |
HFRX Fixed Income Credit Index includes strategies with exposure to credit across a broad continuum of credit sub-strategies, including Corporate, Sovereign, Distressed, Convertible, Asset Backed, Capital Structure Arbitrage, Multi-Strategy and other Relative Value and Event Driven sub-strategies. Investment thesis across all strategies is predicated on realization of a valuation discrepancy between the related credit instruments. Strategies may also include and utilize equity securities, credit derivatives, government fixed income, commodities, currencies or other hybrid securities.
HFRX Global Hedge Fund Index is designed to be representative of the overall composition of the hedge fund universe. It is comprised of all eligible hedge fund strategies, including but not limited to convertible arbitrage, distressed securities, equity hedge, equity market neutral, event driven, macro, merger arbitrage, and relative value arbitrage.
S&P 500® Index is an unmanaged index, with no defined investment objective, of common stocks designed to measure performance of the broad domestic economy through changes in the aggregate market value of 500 stocks representing all major industries. The index includes the reinvestment of dividends.
After-tax returns are calculated using the historical highest individual federal marginal income tax rates and do not reflect the impact of state and local taxes. Actual after-tax returns depend on an investor's tax situation and may differ from those shown. After-tax returns shown are not relevant to investors who hold their Fund shares through tax-deferred arrangements, such as 401(k) plans or individual retirement accounts.
The return after taxes on distributions and sale of Fund shares may exceed the return before taxes due to an assumed tax benefit from any losses on a sale of Fund shares at the end of the measurement period.
|
| Absolute Credit Opportunities Fund | HFRX Fixed Income Credit Index |
|
|
| Risk/Return: |
rr_RiskReturnAbstract |
|
| 1 Year |
rr_AverageAnnualReturnYear01 |
(4.38%)
|
| 5 Years |
rr_AverageAnnualReturnYear05 |
0.82%
|
| Since Inception |
rr_AverageAnnualReturnSinceInception |
6.08%
|
| Absolute Credit Opportunities Fund | HFRX Global Hedge Fund Index |
|
|
| Risk/Return: |
rr_RiskReturnAbstract |
|
| 1 Year |
rr_AverageAnnualReturnYear01 |
(3.64%)
|
| 5 Years |
rr_AverageAnnualReturnYear05 |
(0.72%)
|
| Since Inception |
rr_AverageAnnualReturnSinceInception |
0.96%
|
| Absolute Credit Opportunities Fund | S&P 500® Index |
|
|
| Risk/Return: |
rr_RiskReturnAbstract |
|
| 1 Year |
rr_AverageAnnualReturnYear01 |
1.38%
|
| 5 Years |
rr_AverageAnnualReturnYear05 |
12.57%
|
| Since Inception |
rr_AverageAnnualReturnSinceInception |
13.61%
|
| Absolute Credit Opportunities Fund | Institutional Shares |
|
|
| Risk/Return: |
rr_RiskReturnAbstract |
|
| Annual Return 2009 |
rr_AnnualReturn2009 |
20.69%
|
| Annual Return 2010 |
rr_AnnualReturn2010 |
9.48%
|
| Annual Return 2011 |
rr_AnnualReturn2011 |
(3.91%)
|
| Annual Return 2012 |
rr_AnnualReturn2012 |
(1.04%)
|
| Annual Return 2013 |
rr_AnnualReturn2013 |
(2.36%)
|
| Annual Return 2014 |
rr_AnnualReturn2014 |
2.16%
|
| 1 Year |
rr_AverageAnnualReturnYear01 |
(1.09%)
|
| 5 Years |
rr_AverageAnnualReturnYear05 |
(1.27%)
|
| Since Inception |
rr_AverageAnnualReturnSinceInception |
3.35%
|
| Absolute Credit Opportunities Fund | Institutional Shares | After Taxes on Distributions |
|
|
| Risk/Return: |
rr_RiskReturnAbstract |
|
| 1 Year |
rr_AverageAnnualReturnYear01 |
(1.15%)
|
| 5 Years |
rr_AverageAnnualReturnYear05 |
(2.02%)
|
| Since Inception |
rr_AverageAnnualReturnSinceInception |
2.43%
|
| Absolute Credit Opportunities Fund | Institutional Shares | After Taxes on Distributions and Sales |
|
|
| Risk/Return: |
rr_RiskReturnAbstract |
|
| 1 Year |
rr_AverageAnnualReturnYear01 |
(0.62%)
|
| 5 Years |
rr_AverageAnnualReturnYear05 |
(0.90%)
|
| Since Inception |
rr_AverageAnnualReturnSinceInception |
2.56%
|