UNITED STATES
SECURITIES AND EXCHANGE COMMISSION
Washington, D.C. 20549
FORM N-CSR
CERTIFIED SHAREHOLDER REPORT OF REGISTERED
MANAGEMENT INVESTMENT COMPANIES
Investment Company Act file number 811-03015
Ohio National Fund, Inc.
(Exact name of registrant as specified in charter)
| One Financial Way, Cincinnati, Ohio |
45242
| |
|
(Address of principal executive offices) |
(Zip code) |
CT Corporation 300 E. Lombard St. Suite 1400 Baltimore, MD 21202
(Name and address of agent for service)
Registrant’s telephone number, including area code: 513-794-6971
Date of fiscal year end: December 31
Date of reporting period: June 30, 2015
Form N-CSR is to be used by management investment companies to file reports with the Commission not later than 10 days after the transmission to stockholders of any report that is required to be transmitted to stockholders under Rule 30e-1 under the Investment Company Act of 1940 (17 CFR 270.30e-1). The Commission may use the information provided on Form N-CSR in its regulatory, disclosure review, inspection, and policymaking roles.
A registrant is required to disclose the information specified by Form N-CSR, and the Commission will make this information public. A registrant is not required to respond to the collection of information contained in Form N-CSR unless the Form displays a currently valid Office of Management and Budget (“OMB”) control number. Please direct comments concerning the accuracy of the information collection burden estimate and any suggestions for reducing the burden to Secretary, Securities and Exchange Commission, 450 Fifth Street, NW, Washington, DC 20549-0609. The OMB has reviewed this collection of information under the clearance requirements of 44 U.S.C. § 3507.
| Item 1. | Reports To Stockholders. |

OHIO NATIONAL FUND, INC.
| 1 | ||||
| 2 | ||||
| 3 | ||||
| 8 | ||||
| 10 | ||||
| 15 | ||||
| 21 | ||||
| 27 | ||||
| 31 | ||||
| 37 | ||||
| 40 | ||||
| 45 | ||||
| 49 | ||||
| 56 | ||||
| 60 | ||||
| 70 | ||||
| 74 | ||||
| 78 | ||||
| 81 | ||||
| 84 | ||||
| 91 | ||||
| 95 | ||||
| 98 | ||||
| 109 | ||||
| 112 | ||||
| 115 | ||||
| 121 | ||||
| 132 | ||||
| 157 | ||||
| 159 | ||||
| Message |

|
Dear Investor:
| 1 |

Directors and Officers of Ohio National Fund, Inc.
The Statement of Additional Information of Ohio National Fund, Inc. (the “Fund”) includes additional information about the Fund’s Board of Directors (the “Board”) and is available at http://www.ohionationalfund.com or upon request, without charge, by calling 877-781-6392 (toll-free).
A description of the policies and procedures that the Fund uses in voting proxies relating to Fund securities, as well as information regarding how the Fund voted proxies during the most recent twelve-month period ended June 30, is available without charge, upon request, by calling 877-781-6392 (toll-free) and on the Securities and Exchange Commission (the “Commission”) website at http://www.sec.gov.
The Fund has filed its Schedules of Investments as of March 31 and September 30 with the Commission, as required, on Form N-Q. Form N-Q is required to be filed with the Commission for the first and third quarters of each fiscal year within sixty days after the end of each period and is available on the Commission website upon acceptance of each submission. The Fund’s Forms N-Q may be reviewed and copied at the Commission’s Public Reference Room in Washington, DC. Information about the Public Reference Room is available by calling 1-800-SEC-0330 (toll-free).
This report and the financial statements contained herein are submitted for the general information of the shareholders of the Fund. This report is not authorized for distribution to prospective investors in the Fund unless preceded or accompanied by an effective prospectus of Ohio National Fund, Inc. For a prospectus containing more complete information, including charges and expenses, please contact Ohio National Investments, Inc., One Financial Way, Cincinnati, OH 45242, telephone 877-781-6392 (toll-free).
| 2 |
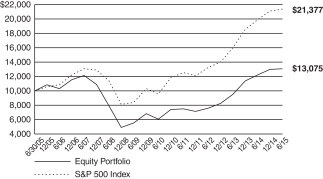
| Ohio National Fund, Inc. | Equity Portfolio |
| 3 | (continued) |
| Ohio National Fund, Inc. | Equity Portfolio (Continued) |
| 4 | (continued) |
| Ohio National Fund, Inc. | Equity Portfolio (Continued) |
| 5 | (continued) |
| Ohio National Fund, Inc. | Equity Portfolio (Continued) |
| (1) | Composition of Portfolio subject to change. |
| (2) | Short-term investments have been excluded from the list of Top 10 Portfolio Holdings. |
| (3) | Sectors (combined): |
| % of Net Assets | ||||
| Financials |
24.0 | |||
| Health Care |
16.7 | |||
| Information Technology |
16.1 | |||
| Consumer Discretionary |
13.1 | |||
| Energy |
8.3 | |||
| Industrials |
7.1 | |||
| Materials |
5.2 | |||
| Utilities |
4.9 | |||
| Consumer Staples |
3.6 | |||
|
|
|
|||
| 99.0 | ||||
|
|
|
| 6 |
| Ohio National Fund, Inc. | Equity Portfolio |
| Schedule of Investments |
June 30, 2015 (Unaudited) |
Percentages are stated as a percent of net assets.
Footnotes:
| (a) | Non-income producing security. |
| (b) | Represents cost for financial reporting purposes, which may differ from cost basis for federal income tax purposes. See also Note 7 of the Notes to Financial Statements. |
The accompanying notes are an integral part of these financial statements.
| 7 |
| Ohio National Fund, Inc. | Money Market Portfolio |
| (1) | Composition of Portfolio subject to change. |
| (2) | Sectors: |
| % of Net Assets | ||||
| Financials |
22.3 | |||
| Consumer Staples |
9.1 | |||
| Information Technology |
8.6 | |||
| Energy |
5.3 | |||
| Health Care |
4.6 | |||
| Consumer Discretionary |
4.1 | |||
|
|
|
|||
| 54.0 | ||||
|
|
|
| 8 |
| Ohio National Fund, Inc. | Money Market Portfolio |
| Schedule of Investments |
June 30, 2015 (Unaudited) |
| Commercial Paper – 54.0% | (b) Rate | Maturity | Face Amount | Amortized Cost | ||||||||||||
| CONSUMER DISCRETIONARY – 4.1% |
||||||||||||||||
| Walt Disney Co. / The (Media) |
(a) | 0.070% | 07/01/2015 | $ | 8,000,000 | $ | 8,000,000 | |||||||||
|
|
|
|||||||||||||||
| CONSUMER STAPLES – 9.1% |
||||||||||||||||
| Wal-Mart Stores, Inc. (Food & Staples Retailing) |
(a) | 0.050% | 07/06/2015 | 9,000,000 | 8,999,938 | |||||||||||
| Nestle Capital Corp. (Food Products) |
(a) | 0.060% | 07/20/2015 | 9,000,000 | 8,999,715 | |||||||||||
|
|
|
|||||||||||||||
| 17,999,653 | ||||||||||||||||
|
|
|
|||||||||||||||
| ENERGY – 5.3% |
||||||||||||||||
| Chevron Corp. (Oil, Gas & Consumable Fuels) |
(a) | 0.080% | 07/16/2015 | 1,500,000 | 1,499,950 | |||||||||||
| Exxon Mobil Corp. (Oil, Gas & Consumable Fuels) |
0.080% | 07/06/2015 | 9,000,000 | 8,999,900 | ||||||||||||
|
|
|
|||||||||||||||
| 10,499,850 | ||||||||||||||||
|
|
|
|||||||||||||||
| FINANCIALS – 22.3% |
||||||||||||||||
| U.S. Bank (Commercial Banks) |
0.050% | 07/01/2015 | 9,000,000 | 9,000,000 | ||||||||||||
| American Honda Finance Corp. (Consumer Finance) |
0.110% | 07/23/2015 | 9,000,000 | 8,999,395 | ||||||||||||
| John Deere Capital Corp. (Consumer Finance) |
(a) | 0.120% | 07/21/2015 | 8,000,000 | 7,999,466 | |||||||||||
| Toyota Motor Credit Corp. (Consumer Finance) |
0.100% | 07/13/2015 | 9,000,000 | 8,999,700 | ||||||||||||
| Prudential Funding LLC (Insurance) |
0.030% | 07/01/2015 | 9,000,000 | 9,000,000 | ||||||||||||
|
|
|
|||||||||||||||
| 43,998,561 | ||||||||||||||||
|
|
|
|||||||||||||||
| HEALTH CARE – 4.6% |
||||||||||||||||
| Johnson & Johnson (Pharmaceuticals) |
(a) | 0.050% | 07/24/2015 | 9,000,000 | 8,999,713 | |||||||||||
|
|
|
|||||||||||||||
| INFORMATION TECHNOLOGY – 8.6% |
||||||||||||||||
| International Business Machines Corp. (IT Services) |
(a) | 0.090% | 07/27/2015 | 9,000,000 | 8,999,415 | |||||||||||
| Microsoft Corp. (Software) |
(a) | 0.070% | 07/22/2015 | 8,000,000 | 7,999,673 | |||||||||||
|
|
|
|||||||||||||||
| 16,999,088 | ||||||||||||||||
|
|
|
|||||||||||||||
| Total Commercial Paper (Cost $106,496,865) |
$ | 106,496,865 | ||||||||||||||
|
|
|
|||||||||||||||
| U.S. Government Agency Issues – 4.1% | Rate | Maturity | Face Amount | Amortized Cost | ||||||||||||
| Federal Home Loan Bank |
0.030% | 07/15/2015 | $ | 8,000,000 | $ | 7,999,907 | ||||||||||
|
|
|
|||||||||||||||
| Total U.S. Government Agency Issues (Cost $7,999,907) |
$ | 7,999,907 | ||||||||||||||
|
|
|
|||||||||||||||
| Money Market Funds – 13.7% | Shares | Value | ||||||||||||||
| Federated Prime Cash Obligations Fund – Institutional Class |
0.070% | 07/01/2015 | 9,000,000 | $ | 9,000,000 | |||||||||||
| Fidelity Institutional Money Market Funds Money Market Portfolio – Class I |
0.100% | 07/01/2015 | 9,000,000 | 9,000,000 | ||||||||||||
| First American Prime Obligations Fund – Class Z |
0.030% | 07/01/2015 | 9,000,000 | 9,000,000 | ||||||||||||
|
|
|
|||||||||||||||
| Total Money Market Funds (Cost $27,000,000) |
$ | 27,000,000 | ||||||||||||||
|
|
|
|||||||||||||||
| Total Investments – 71.8% (Cost $141,496,772) |
(c) | $ | 141,496,772 | |||||||||||||
| Other Assets in Excess of Liabilities – 28.2% |
55,694,038 | |||||||||||||||
|
|
|
|||||||||||||||
| Net Assets – 100.0% |
$ | 197,190,810 | ||||||||||||||
|
|
|
|||||||||||||||
Percentages are stated as a percent of net assets.
Footnotes:
| (a) | Security exempt from registration under Section 4 (2) of the Securities Act of 1933. These securities may be resold in transactions exempt from registration, normally to qualified buyers under Rule 144A. At June 30, 2015, the value of these securities totaled $61,497,870, or 31.2% of the Portfolio’s net assets. These securities were deemed liquid pursuant to procedures approved by the Board of Directors. |
| (b) | Rate presented is the effective yield at the time of purchase. |
| (c) | Represents cost for federal income tax and financial reporting purposes. See also Note 2 regarding the use of amortized cost for valuation of instruments in this Portfolio. |
The accompanying notes are an integral part of these financial statements.
| 9 |
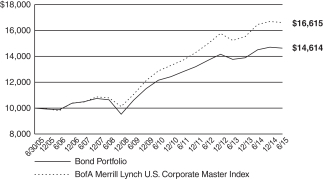
| Ohio National Fund, Inc. | Bond Portfolio |
| 10 | (continued) |
| Ohio National Fund, Inc. | Bond Portfolio (Continued) |
| (1) | Composition of Portfolio subject to change. |
| (2) | Short-term investments have been excluded from the list of Top 10 Portfolio Holdings. |
| (3) | Sectors (combined): |
| % of Net Assets | ||||
| Financials |
26.4 | |||
| Energy |
16.8 | |||
| Utilities |
12.0 | |||
| Industrials |
10.6 | |||
| Consumer Discretionary |
9.0 | |||
| Health Care |
6.1 | |||
| Information Technology |
5.7 | |||
| Materials |
5.1 | |||
| Consumer Staples |
4.1 | |||
| Telecommunication Services |
2.0 | |||
|
|
|
|||
| 97.8 | ||||
|
|
|
| 11 | (continued) |
| Ohio National Fund, Inc. | Bond Portfolio |
| Schedule of Investments |
June 30, 2015 (Unaudited) |
| Corporate Bonds – 97.2% | Rate | Maturity | Face Amount | Value | ||||||||||||
| CONSUMER DISCRETIONARY – 9.0% |
| |||||||||||||||
| Magna International, Inc. (Auto Components) |
3.625% | 06/15/2024 | $ | 1,000,000 | $ | 983,441 | ||||||||||
| General Motors Co. (Automobiles) |
5.000% | 04/01/2035 | 900,000 | 883,669 | ||||||||||||
| Darden Restaurants, Inc. (Hotels, Restaurants & Leisure) |
3.350% | 11/01/2022 | 206,000 | 193,130 | ||||||||||||
| Newell Rubbermaid, Inc. (Household Durables) |
6.250% | 04/15/2018 | 500,000 | 553,919 | ||||||||||||
| Mattel, Inc. (Leisure Products) |
2.350% | 05/06/2019 | 1,000,000 | 997,568 | ||||||||||||
| Mattel, Inc. (Leisure Products) |
3.150% | 03/15/2023 | 625,000 | 604,379 | ||||||||||||
| 21st Century Fox America, Inc. (Media) |
4.500% | 02/15/2021 | 1,250,000 | 1,351,708 | ||||||||||||
| Comcast Corp. (Media) |
4.250% | 01/15/2033 | 750,000 | 731,260 | ||||||||||||
| Discovery Communications, LLC (Media) |
4.375% | 06/15/2021 | 1,000,000 | 1,050,889 | ||||||||||||
| Discovery Communications, LLC (Media) |
3.300% | 05/15/2022 | 275,000 | 270,081 | ||||||||||||
| Time Warner Cable, Inc. (Media) |
4.500% | 09/15/2042 | 425,000 | 348,240 | ||||||||||||
| Time Warner, Inc. (Media) |
2.100% | 06/01/2019 | 1,400,000 | 1,389,786 | ||||||||||||
| Viacom, Inc. (Media) |
4.850% | 12/15/2034 | 1,500,000 | 1,383,257 | ||||||||||||
| Walt Disney Co. / The (Media) |
3.700% | 12/01/2042 | 925,000 | 846,322 | ||||||||||||
| Kohl’s Corp. (Multiline Retail) |
4.000% | 11/01/2021 | 925,000 | 978,808 | ||||||||||||
| AutoZone, Inc. (Specialty Retail) |
3.125% | 07/15/2023 | 925,000 | 895,838 | ||||||||||||
| Bed Bath & Beyond, Inc. (Specialty Retail) |
5.165% | 08/01/2044 | 900,000 | 890,363 | ||||||||||||
|
|
|
|||||||||||||||
| 14,352,658 | ||||||||||||||||
|
|
|
|||||||||||||||
| CONSUMER STAPLES – 4.1% |
| |||||||||||||||
| Anheuser-Busch Cos., LLC (Beverages) |
5.500% | 01/15/2018 | 750,000 | 824,456 | ||||||||||||
| Anheuser-Busch InBev Finance, Inc. (Beverages) |
4.000% | 01/17/2043 | 750,000 | 685,949 | ||||||||||||
| CVS Health Corp. (Food & Staples Retailing) |
5.750% | 06/01/2017 | 301,000 | 325,243 | ||||||||||||
| Kroger Co. / The (Food & Staples Retailing) |
2.950% | 11/01/2021 | 900,000 | 895,544 | ||||||||||||
| Sysco Corp. (Food & Staples Retailing) |
4.350% | 10/02/2034 | 900,000 | 909,000 | ||||||||||||
| Bunge NA Finance LP (Food Products) |
5.900% | 04/01/2017 | 1,500,000 | 1,602,162 | ||||||||||||
| Philip Morris International, Inc. (Tobacco) |
4.125% | 05/17/2021 | 1,250,000 | 1,347,329 | ||||||||||||
|
|
|
|||||||||||||||
| 6,589,683 | ||||||||||||||||
|
|
|
|||||||||||||||
| ENERGY – 16.8% |
||||||||||||||||
| Ensco PLC (Energy Equip. & Svs.) |
5.200% | 03/15/2025 | 900,000 | 889,791 | ||||||||||||
| Noble Holding International Ltd. (Energy Equip. & Svs.) |
4.000% | 03/16/2018 | 900,000 | 920,993 | ||||||||||||
| Noble Holding International Ltd. (Energy Equip. & Svs.) |
5.950% | 04/01/2025 | 1,000,000 | 984,619 | ||||||||||||
| Weatherford International Ltd. (Energy Equip. & Svs.) |
6.000% | 03/15/2018 | 1,500,000 | 1,596,049 | ||||||||||||
| Anadarko Petroleum Corp. (Oil, Gas & Consumable Fuels) |
5.950% | 09/15/2016 | 1,000,000 | 1,054,080 | ||||||||||||
| Buckeye Partners LP (Oil, Gas & Consumable Fuels) |
4.875% | 02/01/2021 | 1,000,000 | 1,041,702 | ||||||||||||
| Chesapeake Energy Corp. (Oil, Gas & Consumable Fuels) |
4.875% | 04/15/2022 | 1,000,000 | 870,000 | ||||||||||||
| Columbia Pipeline Group, Inc. (Oil, Gas & Consumable Fuels) |
(a) | 4.500% | 06/01/2025 | 900,000 | 886,496 | |||||||||||
| ConocoPhillips Co. (Oil, Gas & Consumable Fuels) |
3.350% | 05/15/2025 | 1,350,000 | 1,332,054 | ||||||||||||
| Devon Energy Corp. (Oil, Gas & Consumable Fuels) |
3.250% | 05/15/2022 | 900,000 | 888,502 | ||||||||||||
| Energy Transfer Partners LP (Oil, Gas & Consumable Fuels) |
4.750% | 01/15/2026 | 400,000 | 394,269 | ||||||||||||
| Enterprise Products Operating LLC (Oil, Gas & Consumable Fuels) |
3.900% | 02/15/2024 | 1,000,000 | 1,002,810 | ||||||||||||
| Kinder Morgan Energy Partners LP (Oil, Gas & Consumable Fuels) |
4.150% | 03/01/2022 | 1,000,000 | 1,000,510 | ||||||||||||
| Kinder Morgan, Inc. (Oil, Gas & Consumable Fuels) |
5.300% | 12/01/2034 | 1,000,000 | 921,737 | ||||||||||||
| Magellan Midstream Partners LP (Oil, Gas & Consumable Fuels) |
4.250% | 02/01/2021 | 1,000,000 | 1,062,923 | ||||||||||||
| Marathon Oil Corp. (Oil, Gas & Consumable Fuels) |
3.850% | 06/01/2025 | 850,000 | 831,792 | ||||||||||||
| Marathon Petroleum Corp. (Oil, Gas & Consumable Fuels) |
4.750% | 09/15/2044 | 1,000,000 | 909,481 | ||||||||||||
| MarkWest Energy Partners LP / MarkWest Energy Finance Corp. (Oil, Gas & Consumable Fuels) |
4.875% | 12/01/2024 | 1,000,000 | 977,500 | ||||||||||||
| Murphy Oil Corp. (Oil, Gas & Consumable Fuels) |
3.700% | 12/01/2022 | 1,400,000 | 1,279,509 | ||||||||||||
| Occidental Petroleum Corp. (Oil, Gas & Consumable Fuels) |
3.125% | 02/15/2022 | 1,000,000 | 1,001,416 | ||||||||||||
| Phillips 66 (Oil, Gas & Consumable Fuels) |
4.300% | 04/01/2022 | 1,300,000 | 1,363,059 | ||||||||||||
| Plains All American Pipeline LP / PAA Finance Corp. (Oil, Gas & Consumable Fuels) |
2.850% | 01/31/2023 | 1,000,000 | 937,367 | ||||||||||||
| Shell International Finance BV (Oil, Gas & Consumable Fuels) |
4.375% | 03/25/2020 | 1,250,000 | 1,367,314 | ||||||||||||
| Southwestern Energy Co. (Oil, Gas & Consumable Fuels) |
4.050% | 01/23/2020 | 900,000 | 924,186 | ||||||||||||
| TransCanada PipeLines Ltd. (Oil, Gas & Consumable Fuels) |
2.500% | 08/01/2022 | 1,425,000 | 1,350,129 | ||||||||||||
| Williams Cos., Inc. / The (Oil, Gas & Consumable Fuels) |
5.750% | 06/24/2044 | 1,000,000 | 925,047 | ||||||||||||
|
|
|
|||||||||||||||
| 26,713,335 | ||||||||||||||||
|
|
|
|||||||||||||||
| FINANCIALS – 26.4% |
| |||||||||||||||
| Bank of America Corp. (Banks) |
5.650% | 05/01/2018 | 1,000,000 | 1,097,966 | ||||||||||||
| Bank of America Corp. (Banks) |
4.200% | 08/26/2024 | 500,000 | 498,087 | ||||||||||||
| Citigroup, Inc. (Banks) |
4.400% | 06/10/2025 | 900,000 | 895,296 | ||||||||||||
| Comerica Bank (Banks) |
5.750% | 11/21/2016 | 1,500,000 | 1,598,994 | ||||||||||||
| Fifth Third Bancorp (Banks) |
4.500% | 06/01/2018 | 1,750,000 | 1,852,685 | ||||||||||||
| KeyCorp (Banks) |
5.100% | 03/24/2021 | 500,000 | 554,194 | ||||||||||||
| PNC Bank NA (Banks) |
3.250% | 06/01/2025 | 850,000 | 828,821 | ||||||||||||
| SunTrust Banks, Inc. (Banks) |
2.500% | 05/01/2019 | 1,400,000 | 1,406,898 | ||||||||||||
| Wells Fargo & Co. (Banks) |
4.650% | 11/04/2044 | 1,000,000 | 954,987 | ||||||||||||
| Goldman Sachs Group, Inc. / The (Capital Markets) |
3.750% | 05/22/2025 | 1,400,000 | 1,379,445 | ||||||||||||
| Janus Capital Group, Inc. (Capital Markets) |
(b) | 6.700% | 06/15/2017 | 1,500,000 | 1,632,186 | |||||||||||
| 12 | (continued) |
| Ohio National Fund, Inc. | Bond Portfolio (Continued) |
| Schedule of Investments |
June 30, 2015 (Unaudited) |
| Corporate Bonds (Continued) | Rate | Maturity | Face Amount | Value | ||||||||||||
| FINANCIALS (continued) |
||||||||||||||||
| Morgan Stanley (Capital Markets) |
3.750% | 02/25/2023 | $ | 1,250,000 | $ | 1,265,268 | ||||||||||
| Morgan Stanley (Capital Markets) |
3.950% | 04/23/2027 | 1,000,000 | 941,241 | ||||||||||||
| Northern Trust Corp. (Capital Markets) |
3.450% | 11/04/2020 | 1,000,000 | 1,057,036 | ||||||||||||
| State Street Corp. (Capital Markets) |
4.375% | 03/07/2021 | 1,250,000 | 1,375,481 | ||||||||||||
| Ally Financial, Inc. (Consumer Finance) |
5.125% | 09/30/2024 | 1,000,000 | 1,002,500 | ||||||||||||
| Capital One Financial Corp. (Consumer Finance) |
2.450% | 04/24/2019 | 925,000 | 924,441 | ||||||||||||
| Discover Financial Services (Consumer Finance) |
6.450% | 06/12/2017 | 750,000 | 814,441 | ||||||||||||
| Synchrony Financial (Consumer Finance) |
4.250% | 08/15/2024 | 900,000 | 902,614 | ||||||||||||
| General Electric Capital Corp. (Diversified Financial Svs.) |
5.625% | 05/01/2018 | 1,000,000 | 1,106,276 | ||||||||||||
| Moody’s Corp. (Diversified Financial Svs.) |
5.250% | 07/15/2044 | 1,000,000 | 1,024,593 | ||||||||||||
| Aflac, Inc. (Insurance) |
3.625% | 06/15/2023 | 1,425,000 | 1,438,184 | ||||||||||||
| Allstate Corp. / The (Insurance) |
5.200% | 01/15/2042 | 500,000 | 526,195 | ||||||||||||
| American International Group, Inc. (Insurance) |
3.875% | 01/15/2035 | 1,400,000 | 1,264,785 | ||||||||||||
| Hartford Financial Services Group, Inc. / The (Insurance) |
5.375% | 03/15/2017 | 1,500,000 | 1,593,770 | ||||||||||||
| Liberty Mutual Group, Inc. (Insurance) |
(a) | 4.850% | 08/01/2044 | 1,500,000 | 1,444,116 | |||||||||||
| Marsh & McLennan Cos., Inc. (Insurance) |
3.500% | 06/03/2024 | 1,400,000 | 1,393,564 | ||||||||||||
| Metropolitan Life Global Funding I (Insurance) |
(a) | 2.300% | 04/10/2019 | 1,500,000 | 1,508,269 | |||||||||||
| New York Life Global Funding (Insurance) |
(a) | 2.150% | 06/18/2019 | 1,000,000 | 1,001,832 | |||||||||||
| Prudential Financial, Inc. (Insurance) |
6.100% | 06/15/2017 | 1,500,000 | 1,629,681 | ||||||||||||
| Boston Properties LP (Real Estate Investment Trusts) |
3.125% | 09/01/2023 | 925,000 | 897,970 | ||||||||||||
| Camden Property Trust (Real Estate Investment Trusts) |
4.250% | 01/15/2024 | 500,000 | 513,701 | ||||||||||||
| Equity One, Inc. (Real Estate Investment Trusts) |
6.250% | 01/15/2017 | 1,250,000 | 1,332,269 | ||||||||||||
| Federal Realty Investment Trust (Real Estate Investment Trusts) |
3.000% | 08/01/2022 | 1,425,000 | 1,402,180 | ||||||||||||
| HCP, Inc. (Real Estate Investment Trusts) |
4.000% | 06/01/2025 | 1,500,000 | 1,466,262 | ||||||||||||
| Simon Property Group LP (Real Estate Investment Trusts) |
3.750% | 02/01/2024 | 1,475,000 | 1,508,888 | ||||||||||||
|
|
|
|||||||||||||||
| 42,035,116 | ||||||||||||||||
|
|
|
|||||||||||||||
| HEALTH CARE – 6.1% |
||||||||||||||||
| Amgen, Inc. (Biotechnology) |
4.100% | 06/15/2021 | 1,000,000 | 1,064,141 | ||||||||||||
| Baxalta, Inc. (Biotechnology) |
(a) | 4.000% | 06/23/2025 | 1,400,000 | 1,390,844 | |||||||||||
| Gilead Sciences, Inc. (Biotechnology) |
4.500% | 02/01/2045 | 900,000 | 893,127 | ||||||||||||
| Becton Dickinson and Co. (Health Care Equip. & Supplies) |
5.000% | 05/15/2019 | 500,000 | 546,273 | ||||||||||||
| AmerisourceBergen Corp. (Health Care Providers & Svs.) |
4.875% | 11/15/2019 | 500,000 | 550,907 | ||||||||||||
| Express Scripts Holding Co. (Health Care Providers & Svs.) |
2.250% | 06/15/2019 | 1,400,000 | 1,387,644 | ||||||||||||
| Laboratory Corp. of America Holdings (Health Care Providers & Svs.) |
3.750% | 08/23/2022 | 425,000 | 429,362 | ||||||||||||
| Quest Diagnostics, Inc. (Health Care Providers & Svs.) |
2.700% | 04/01/2019 | 1,000,000 | 1,007,561 | ||||||||||||
| AbbVie, Inc. (Pharmaceuticals) |
2.900% | 11/06/2022 | 1,425,000 | 1,378,575 | ||||||||||||
| Merck Sharp & Dohme Corp. (Pharmaceuticals) |
5.000% | 06/30/2019 | 1,000,000 | 1,112,711 | ||||||||||||
|
|
|
|||||||||||||||
| 9,761,145 | ||||||||||||||||
|
|
|
|||||||||||||||
| INDUSTRIALS – 10.0% |
||||||||||||||||
| BAE Systems Holdings, Inc. (Aerospace & Defense) |
(a) | 6.375% | 06/01/2019 | 750,000 | 854,739 | |||||||||||
| Lockheed Martin Corp. (Aerospace & Defense) |
3.350% | 09/15/2021 | 1,000,000 | 1,028,106 | ||||||||||||
| Lockheed Martin Corp. (Aerospace & Defense) |
3.600% | 03/01/2035 | 1,000,000 | 920,609 | ||||||||||||
| Raytheon Co. (Aerospace & Defense) |
4.400% | 02/15/2020 | 1,250,000 | 1,367,560 | ||||||||||||
| FedEx Corp. (Air Freight & Logistics) |
4.900% | 01/15/2034 | 1,425,000 | 1,473,055 | ||||||||||||
| American Airlines Group, Inc. (Airlines) |
(a) | 4.625% | 03/01/2020 | 1,000,000 | 967,500 | |||||||||||
| Waste Management, Inc. (Commercial Svs. & Supplies) |
6.100% | 03/15/2018 | 500,000 | 557,927 | ||||||||||||
| Deere & Co. (Machinery) |
4.375% | 10/16/2019 | 1,250,000 | 1,369,761 | ||||||||||||
| Illinois Tool Works, Inc. (Machinery) |
3.375% | 09/15/2021 | 500,000 | 521,785 | ||||||||||||
| Parker-Hannifin Corp. (Machinery) |
4.200% | 11/21/2034 | 1,400,000 | 1,391,340 | ||||||||||||
| Burlington Northern Santa Fe, LLC (Road & Rail) |
4.550% | 09/01/2044 | 900,000 | 887,522 | ||||||||||||
| CSX Corp. (Road & Rail) |
5.600% | 05/01/2017 | 1,500,000 | 1,616,664 | ||||||||||||
| Norfolk Southern Corp. (Road & Rail) |
3.000% | 04/01/2022 | 600,000 | 596,167 | ||||||||||||
| Union Pacific Corp. (Road & Rail) |
4.000% | 02/01/2021 | 1,250,000 | 1,348,208 | ||||||||||||
| Union Pacific Corp. (Road & Rail) |
3.250% | 08/15/2025 | 1,000,000 | 988,005 | ||||||||||||
|
|
|
|||||||||||||||
| 15,888,948 | ||||||||||||||||
|
|
|
|||||||||||||||
| INFORMATION TECHNOLOGY – 5.7% |
||||||||||||||||
| Harris Corp. (Communications Equip.) |
2.700% | 04/27/2020 | 900,000 | 887,724 | ||||||||||||
| QUALCOMM, Inc. (Communications Equip.) |
3.450% | 05/20/2025 | 1,000,000 | 972,959 | ||||||||||||
| Denali Borrower LLC / Denali Finance Corp. (Computers & Peripherals) |
(a) | 5.625% | 10/15/2020 | 900,000 | 946,125 | |||||||||||
| Computer Sciences Corp. (IT Svs.) |
6.500% | 03/15/2018 | 1,000,000 | 1,104,148 | ||||||||||||
| Intel Corp. (Semiconductors & Equip.) |
4.000% | 12/15/2032 | 1,500,000 | 1,433,273 | ||||||||||||
| KLA-Tencor Corp. (Semiconductors & Equip.) |
3.375% | 11/01/2019 | 900,000 | 923,756 | ||||||||||||
| Microsoft Corp. (Software) |
3.500% | 02/12/2035 | 400,000 | 364,499 | ||||||||||||
| Oracle Corp. (Software) |
4.300% | 07/08/2034 | 1,500,000 | 1,474,769 | ||||||||||||
| Apple, Inc. (Tech. Hardware, Storage & Periph.) |
2.500% | 02/09/2025 | 1,000,000 | 936,210 | ||||||||||||
|
|
|
|||||||||||||||
| 9,043,463 | ||||||||||||||||
|
|
|
|||||||||||||||
| 13 | (continued) |
| Ohio National Fund, Inc. | Bond Portfolio (Continued) |
| Schedule of Investments |
June 30, 2015 (Unaudited) |
| Corporate Bonds (Continued) | Rate | Maturity | Face Amount | Value | ||||||||||||
| MATERIALS – 5.1% |
||||||||||||||||
| Dow Chemical Co. / The (Chemicals) |
4.250% | 10/01/2034 | $ | 1,400,000 | $ | 1,311,128 | ||||||||||
| Eastman Chemical Co. (Chemicals) |
3.600% | 08/15/2022 | 1,000,000 | 1,009,683 | ||||||||||||
| FMC Corp. (Chemicals) |
3.950% | 02/01/2022 | 1,000,000 | 1,013,966 | ||||||||||||
| Praxair, Inc. (Chemicals) |
2.650% | 02/05/2025 | 1,000,000 | 954,084 | ||||||||||||
| Packaging Corp. of America (Containers & Packaging) |
4.500% | 11/01/2023 | 675,000 | 695,238 | ||||||||||||
| Freeport-McMoRan, Inc. (Metals & Mining) |
3.550% | 03/01/2022 | 925,000 | 855,266 | ||||||||||||
| Newmont Mining Corp. (Metals & Mining) |
3.500% | 03/15/2022 | 1,425,000 | 1,358,425 | ||||||||||||
| Teck Resources Ltd. (Metals & Mining) |
3.750% | 02/01/2023 | 1,000,000 | 859,159 | ||||||||||||
|
|
|
|||||||||||||||
| 8,056,949 | ||||||||||||||||
|
|
|
|||||||||||||||
| TELECOMMUNICATION SERVICES – 2.0% |
||||||||||||||||
| AT&T, Inc. (Diversified Telecom. Svs.) |
3.400% | 05/15/2025 | 900,000 | 854,528 | ||||||||||||
| Verizon Communications, Inc. (Diversified Telecom. Svs.) |
4.600% | 04/01/2021 | 1,250,000 | 1,341,921 | ||||||||||||
| Verizon Communications, Inc. (Diversified Telecom. Svs.) |
3.850% | 11/01/2042 | 425,000 | 350,014 | ||||||||||||
| Rogers Communications, Inc. (Wireless Telecom. Svs.) |
3.000% | 03/15/2023 | 700,000 | 671,505 | ||||||||||||
|
|
|
|||||||||||||||
| 3,217,968 | ||||||||||||||||
|
|
|
|||||||||||||||
| UTILITIES – 12.0% |
||||||||||||||||
| Appalachian Power Co. (Electric Utilities) |
4.600% | 03/30/2021 | 1,000,000 | 1,086,105 | ||||||||||||
| Commonwealth Edison Co. (Electric Utilities) |
5.950% | 08/15/2016 | 1,500,000 | 1,581,858 | ||||||||||||
| DTE Electric Co. (Electric Utilities) |
3.375% | 03/01/2025 | 1,000,000 | 1,010,833 | ||||||||||||
| Duke Energy Florida, Inc. (Electric Utilities) |
4.550% | 04/01/2020 | 500,000 | 549,053 | ||||||||||||
| ITC Holdings Corp. (Electric Utilities) |
3.650% | 06/15/2024 | 500,000 | 494,337 | ||||||||||||
| Kansas City Power & Light Co. (Electric Utilities) |
5.850% | 06/15/2017 | 1,500,000 | 1,624,940 | ||||||||||||
| South Carolina Electric & Gas Co. (Electric Utilities) |
4.350% | 02/01/2042 | 1,000,000 | 954,938 | ||||||||||||
| Tenaska Georgia Partners LP (Electric Utilities) |
9.500% | 02/01/2030 | 439,987 | 547,328 | ||||||||||||
| Union Electric Co. (Electric Utilities) |
6.400% | 06/15/2017 | 1,500,000 | 1,643,427 | ||||||||||||
| Westar Energy, Inc. (Electric Utilities) |
4.125% | 03/01/2042 | 500,000 | 482,569 | ||||||||||||
| Xcel Energy, Inc. (Electric Utilities) |
4.700% | 05/15/2020 | 1,000,000 | 1,089,847 | ||||||||||||
| AGL Capital Corp. (Gas Utilities) |
5.250% | 08/15/2019 | 1,000,000 | 1,104,664 | ||||||||||||
| Southwest Gas Corp. (Gas Utilities) |
3.875% | 04/01/2022 | 1,250,000 | 1,308,328 | ||||||||||||
| Spectra Energy Capital LLC (Gas Utilities) |
3.300% | 03/15/2023 | 1,425,000 | 1,305,162 | ||||||||||||
| Avista Corp. (Multi-Utilities) |
5.950% | 06/01/2018 | 1,000,000 | 1,120,865 | ||||||||||||
| LG&E and KU Energy LLC (Multi-Utilities) |
4.375% | 10/01/2021 | 1,000,000 | 1,083,465 | ||||||||||||
| Public Service Electric & Gas Co. (Multi-Utilities) |
3.950% | 05/01/2042 | 750,000 | 708,781 | ||||||||||||
| American Water Capital Corp. (Water Utilities) |
4.300% | 12/01/2042 | 1,400,000 | 1,374,097 | ||||||||||||
|
|
|
|||||||||||||||
| 19,070,597 | ||||||||||||||||
|
|
|
|||||||||||||||
| Total Corporate Bonds (Cost $152,543,352) |
$ | 154,729,862 | ||||||||||||||
|
|
|
|||||||||||||||
| Asset-Backed Securities – 0.6% | Rate | Maturity | Face Amount | Value | ||||||||||||
| INDUSTRIALS – 0.6% |
||||||||||||||||
| American Airlines 2015-1 Class B Pass Through Trust (Airlines) |
3.700% | 05/01/2023 | $ | 900,000 | $ | 882,000 | ||||||||||
|
|
|
|||||||||||||||
| Total Asset-Backed Securities (Cost $900,000) |
$ | 882,000 | ||||||||||||||
|
|
|
|||||||||||||||
| Money Market Funds – 0.7% | Shares | Value | ||||||||||||||
| Fidelity Institutional Money Market Funds |
1,186,000 | $ | 1,186,000 | |||||||||||||
|
|
|
|||||||||||||||
| Total Money Market Funds (Cost $1,186,000) |
$ | 1,186,000 | ||||||||||||||
|
|
|
|||||||||||||||
| Total Investments – 98.5% (Cost $154,629,352) |
(c) | $ | 156,797,862 | |||||||||||||
| Other Assets in Excess of Liabilities – 1.5% |
2,432,853 | |||||||||||||||
|
|
|
|||||||||||||||
| Net Assets – 100.0% |
$ | 159,230,715 | ||||||||||||||
|
|
|
|||||||||||||||
Percentages are stated as a percent of net assets.
Footnotes:
| (a) | Security exempt from registration under Regulation D of the Securities Act of 1933. These securities may be resold in transactions exempt from registration, normally to qualified buyers under Rule 144A. At June 30, 2015, the value of these securities totaled $8,999,921, or 5.7% of the Portfolio’s net assets. These securities were deemed liquid pursuant to procedures approved by the Board of Directors. |
| (b) | Represents bonds that are credit sensitive. The coupon rates for these bonds are subject to adjustment based on changes in national credit rating agency ratings. |
| (c) | Represents cost for financial reporting purposes, which may differ from cost basis for federal income tax purposes. See also Note 7 of the Notes to Financial Statements. |
The accompanying notes are an integral part of these financial statements.
| 14 |
| Ohio National Fund, Inc. | Omni Portfolio |
| 15 | (continued) |
| Ohio National Fund, Inc. | Omni Portfolio (Continued) |

| (1) | Composition of Portfolio subject to change. |
| (2) | Short-term investments have been excluded from the list of Top 10 Portfolio Holdings. |
| (3) | Sectors (combined): |
| % of Net Assets | ||||
| Information Technology |
18.7 | |||
| Financials |
17.5 | |||
| Health Care |
17.2 | |||
| Consumer Discretionary |
16.2 | |||
| Industrials |
8.4 | |||
| Energy |
7.2 | |||
| Consumer Staples |
4.4 | |||
| Materials |
4.4 | |||
| Utilities |
1.9 | |||
| Telecommunication Services |
0.4 | |||
|
|
|
|||
| 96.3 | ||||
|
|
|
| 16 |
| Ohio National Fund, Inc. | Omni Portfolio |
| Schedule of Investments |
June 30, 2015 (Unaudited) |
| Common Stocks – 75.7% | Shares | Value | ||||||||
| CONSUMER DISCRETIONARY – 14.2% |
||||||||||
| Johnson Controls, Inc. (Auto Components) |
14,249 | $ | 705,753 | |||||||
| Jarden Corp. (Household Durables) |
(a) | 13,350 | 690,862 | |||||||
| Amazon.com, Inc. (Internet & Catalog Retail) |
(a) | 1,792 | 777,889 | |||||||
| CBS Corp. Class B (Media) |
13,728 | 761,904 | ||||||||
| Time Warner, Inc. (Media) |
8,501 | 743,072 | ||||||||
| Viacom, Inc. Class B (Media) |
11,531 | 745,364 | ||||||||
| Walt Disney Co. / The (Media) |
6,860 | 783,000 | ||||||||
| Lowe’s Cos., Inc. (Specialty Retail) |
11,138 | 745,912 | ||||||||
| Tiffany & Co. (Specialty Retail) |
4,844 | 444,679 | ||||||||
| PVH Corp. (Textiles, Apparel & Luxury Goods) |
6,740 | 776,448 | ||||||||
|
|
|
|||||||||
| 7,174,883 | ||||||||||
|
|
|
|||||||||
| CONSUMER STAPLES – 3.1% |
||||||||||
| Mondelez International, Inc. Class A (Food Products) |
19,005 | 781,866 | ||||||||
| Tyson Foods, Inc. Class A (Food Products) |
17,925 | 764,143 | ||||||||
|
|
|
|||||||||
| 1,546,009 | ||||||||||
|
|
|
|||||||||
| ENERGY – 3.1% |
||||||||||
| Anadarko Petroleum Corp. (Oil, Gas & Consumable Fuels) |
8,827 | 689,036 | ||||||||
| Devon Energy Corp. (Oil, Gas & Consumable Fuels) |
12,398 | 737,557 | ||||||||
| Newfield Exploration Co. (Oil, Gas & Consumable Fuels) |
(a) | 3,895 | 140,687 | |||||||
|
|
|
|||||||||
| 1,567,280 | ||||||||||
|
|
|
|||||||||
| FINANCIALS – 12.9% |
||||||||||
| Bank of America Corp. (Banks) |
45,511 | 774,597 | ||||||||
| BankUnited, Inc. (Banks) |
10,505 | 377,445 | ||||||||
| Citigroup, Inc. (Banks) |
17,200 | 950,128 | ||||||||
| JPMorgan Chase & Co. (Banks) |
12,118 | 821,116 | ||||||||
| Capital One Financial Corp. (Consumer Finance) |
8,767 | 771,233 | ||||||||
| Hartford Financial Services Group, Inc. / The (Insurance) |
17,637 | 733,170 | ||||||||
| Lincoln National Corp. (Insurance) |
5,986 | 354,491 | ||||||||
| MetLife, Inc. (Insurance) |
14,742 | 825,405 | ||||||||
| Prudential Financial, Inc. (Insurance) |
10,813 | 946,354 | ||||||||
|
|
|
|||||||||
| 6,553,939 | ||||||||||
|
|
|
|||||||||
| HEALTH CARE – 15.8% |
||||||||||
| Amgen, Inc. (Biotechnology) |
4,601 | 706,345 | ||||||||
| Celgene Corp. (Biotechnology) |
(a) | 4,022 | 465,486 | |||||||
| Receptos, Inc. (Biotechnology) |
(a) | 3,320 | 630,966 | |||||||
| St. Jude Medical, Inc. (Health Care Equip. & Supplies) |
10,094 | 737,569 | ||||||||
| Aetna, Inc. (Health Care Providers & Svs.) |
4,456 | 567,962 | ||||||||
| HCA Holdings, Inc. (Health Care Providers & Svs.) |
(a) | 8,157 | 740,003 | |||||||
| Thermo Fisher Scientific, Inc. (Life Sciences Tools & Svs.) |
6,936 | 900,015 | ||||||||
| Allergan PLC (Pharmaceuticals) |
(a) | 3,167 | 961,058 | |||||||
| Mylan NV (Pharmaceuticals) |
(a) | 13,485 | 915,092 | |||||||
| Pfizer, Inc. (Pharmaceuticals) |
18,856 | 632,242 | ||||||||
| Valeant Pharmaceuticals International, Inc. (Pharmaceuticals) |
(a) | 3,260 | 724,209 | |||||||
|
|
|
|||||||||
| 7,980,947 | ||||||||||
|
|
|
|||||||||
| INDUSTRIALS – 6.5% |
||||||||||
| Honeywell International, Inc. (Aerospace & Defense) |
7,074 | 721,336 | ||||||||
| Lockheed Martin Corp. (Aerospace & Defense) |
4,071 | 756,799 | ||||||||
| FedEx Corp. (Air Freight & Logistics) |
4,255 | 725,052 | ||||||||
| General Electric Co. (Industrial Conglomerates) |
13,160 | 349,661 | ||||||||
| Xylem, Inc. (Machinery) |
20,574 | 762,678 | ||||||||
|
|
|
|||||||||
| 3,315,526 | ||||||||||
|
|
|
|||||||||
| INFORMATION TECHNOLOGY – 16.6% |
||||||||||
| Cisco Systems, Inc. (Communications Equip.) |
26,636 | 731,424 | ||||||||
| Facebook, Inc. Class A (Internet Software & Svs.) |
(a) | 8,873 | 760,993 | |||||||
| Google, Inc. Class A (Internet Software & Svs.) |
(a) | 631 | 340,765 | |||||||
| Google, Inc. Class C (Internet Software & Svs.) |
(a) | 570 | 296,691 | |||||||
| MasterCard, Inc. Class A (IT Svs.) |
8,250 | 771,210 | ||||||||
| Avago Technologies Ltd. (Semiconductors & Equip.) |
5,737 | 762,619 | ||||||||
| Intel Corp. (Semiconductors & Equip.) |
24,452 | 743,707 | ||||||||
| Microsoft Corp. (Software) |
21,985 | 970,638 | ||||||||
| Oracle Corp. (Software) |
17,086 | 688,566 | ||||||||
| Apple, Inc. (Tech. Hardware, Storage & Periph.) |
11,822 | 1,482,774 | ||||||||
| Hewlett-Packard Co. (Tech. Hardware, Storage & Periph.) |
28,384 | 851,804 | ||||||||
|
|
|
|||||||||
| 8,401,191 | ||||||||||
|
|
|
|||||||||
| 17 | (continued) |
| Ohio National Fund, Inc. | Omni Portfolio (Continued) |
| Schedule of Investments |
June 30, 2015 (Unaudited) |
| Common Stocks (Continued) | Shares | Value | ||||||||
| MATERIALS – 3.5% |
||||||||||
| Dow Chemical Co. / The (Chemicals) |
14,553 | $ | 744,677 | |||||||
| Huntsman Corp. (Chemicals) |
30,250 | 667,618 | ||||||||
| Monsanto Co. (Chemicals) |
3,247 | 346,098 | ||||||||
|
|
|
|||||||||
| 1,758,393 | ||||||||||
|
|
|
|||||||||
| Total Common Stocks (Cost $36,832,497) |
$ | 38,298,168 | ||||||||
|
|
|
|||||||||
| Corporate Bonds – 20.4% | Rate | Maturity | Face Amount | Value | ||||||||||||
| CONSUMER DISCRETIONARY – 2.0% |
||||||||||||||||
| General Motors Co. (Automobiles) |
5.000% | 04/01/2035 | $ | 100,000 | $ | 98,185 | ||||||||||
| Darden Restaurants, Inc. (Hotels, Restaurants & Leisure) |
3.350% | 11/01/2022 | 11,000 | 10,313 | ||||||||||||
| Mattel, Inc. (Leisure Products) |
3.150% | 03/15/2023 | 75,000 | 72,525 | ||||||||||||
| 21st Century Fox America, Inc. (Media) |
4.500% | 02/15/2021 | 100,000 | 108,137 | ||||||||||||
| Comcast Corp. (Media) |
5.875% | 02/15/2018 | 75,000 | 83,189 | ||||||||||||
| Discovery Communications, LLC (Media) |
3.300% | 05/15/2022 | 75,000 | 73,659 | ||||||||||||
| Time Warner Cable, Inc. (Media) |
4.500% | 09/15/2042 | 75,000 | 61,454 | ||||||||||||
| Time Warner, Inc. (Media) |
2.100% | 06/01/2019 | 100,000 | 99,270 | ||||||||||||
| Viacom, Inc. (Media) |
4.250% | 09/01/2023 | 75,000 | 75,499 | ||||||||||||
| Walt Disney Co. / The (Media) |
3.700% | 12/01/2042 | 75,000 | 68,621 | ||||||||||||
| Kohl’s Corp. (Multiline Retail) |
4.000% | 11/01/2021 | 75,000 | 79,363 | ||||||||||||
| AutoZone, Inc. (Specialty Retail) |
3.125% | 07/15/2023 | 75,000 | 72,636 | ||||||||||||
| Bed Bath & Beyond, Inc. (Specialty Retail) |
5.165% | 08/01/2044 | 100,000 | 98,929 | ||||||||||||
|
|
|
|||||||||||||||
| 1,001,780 | ||||||||||||||||
|
|
|
|||||||||||||||
| CONSUMER STAPLES – 1.3% |
||||||||||||||||
| Anheuser-Busch Cos., LLC (Beverages) |
5.500% | 01/15/2018 | 150,000 | 164,891 | ||||||||||||
| CVS Health Corp. (Food & Staples Retailing) |
5.750% | 06/01/2017 | 45,000 | 48,624 | ||||||||||||
| Kroger Co. / The (Food & Staples Retailing) |
2.950% | 11/01/2021 | 100,000 | 99,505 | ||||||||||||
| Sysco Corp. (Food & Staples Retailing) |
4.350% | 10/02/2034 | 100,000 | 101,000 | ||||||||||||
| Bunge NA Finance LP (Food Products) |
5.900% | 04/01/2017 | 150,000 | 160,216 | ||||||||||||
| Procter & Gamble Co. / The (Household Products) |
4.700% | 02/15/2019 | 100,000 | 110,155 | ||||||||||||
|
|
|
|||||||||||||||
| 684,391 | ||||||||||||||||
|
|
|
|||||||||||||||
| ENERGY – 4.1% |
||||||||||||||||
| Ensco PLC (Energy Equip. & Svs.) |
5.200% | 03/15/2025 | 100,000 | 98,866 | ||||||||||||
| Noble Holding International Ltd. (Energy Equip. & Svs.) |
4.000% | 03/16/2018 | 100,000 | 102,332 | ||||||||||||
| Weatherford International Ltd. (Energy Equip. & Svs.) |
6.000% | 03/15/2018 | 150,000 | 159,605 | ||||||||||||
| Anadarko Petroleum Corp. (Oil, Gas & Consumable Fuels) |
5.950% | 09/15/2016 | 100,000 | 105,408 | ||||||||||||
| Boardwalk Pipelines LP (Oil, Gas & Consumable Fuels) |
5.500% | 02/01/2017 | 100,000 | 103,674 | ||||||||||||
| Columbia Pipeline Group, Inc. (Oil, Gas & Consumable Fuels) |
(b) | 4.500% | 06/01/2025 | 100,000 | 98,500 | |||||||||||
| ConocoPhillips Co. (Oil, Gas & Consumable Fuels) |
3.350% | 05/15/2025 | 150,000 | 148,006 | ||||||||||||
| Devon Energy Corp. (Oil, Gas & Consumable Fuels) |
3.250% | 05/15/2022 | 100,000 | 98,722 | ||||||||||||
| Energy Transfer Partners LP (Oil, Gas & Consumable Fuels) |
4.750% | 01/15/2026 | 100,000 | 98,567 | ||||||||||||
| Enterprise Products Operating LLC (Oil, Gas & Consumable Fuels) |
3.900% | 02/15/2024 | 100,000 | 100,281 | ||||||||||||
| EOG Resources, Inc. (Oil, Gas & Consumable Fuels) |
3.150% | 04/01/2025 | 100,000 | 97,408 | ||||||||||||
| Kinder Morgan Energy Partners LP (Oil, Gas & Consumable Fuels) |
4.150% | 03/01/2022 | 75,000 | 75,038 | ||||||||||||
| Magellan Midstream Partners LP (Oil, Gas & Consumable Fuels) |
6.400% | 07/15/2018 | 150,000 | 167,027 | ||||||||||||
| Marathon Oil Corp. (Oil, Gas & Consumable Fuels) |
3.850% | 06/01/2025 | 150,000 | 146,787 | ||||||||||||
| Murphy Oil Corp. (Oil, Gas & Consumable Fuels) |
3.700% | 12/01/2022 | 100,000 | 91,393 | ||||||||||||
| Phillips 66 (Oil, Gas & Consumable Fuels) |
4.300% | 04/01/2022 | 100,000 | 104,851 | ||||||||||||
| Shell International Finance BV (Oil, Gas & Consumable Fuels) |
3.250% | 05/11/2025 | 100,000 | 98,871 | ||||||||||||
| Southwestern Energy Co. (Oil, Gas & Consumable Fuels) |
4.050% | 01/23/2020 | 100,000 | 102,687 | ||||||||||||
| TransCanada PipeLines Ltd. (Oil, Gas & Consumable Fuels) |
2.500% | 08/01/2022 | 75,000 | 71,059 | ||||||||||||
|
|
|
|||||||||||||||
| 2,069,082 | ||||||||||||||||
|
|
|
|||||||||||||||
| FINANCIALS – 4.6% |
||||||||||||||||
| Bank of America Corp. (Banks) |
5.750% | 08/15/2016 | 75,000 | 78,530 | ||||||||||||
| Citigroup, Inc. (Banks) |
5.850% | 08/02/2016 | 75,000 | 78,690 | ||||||||||||
| Citigroup, Inc. (Banks) |
4.400% | 06/10/2025 | 100,000 | 99,477 | ||||||||||||
| Comerica, Inc. (Banks) |
3.800% | 07/22/2026 | 100,000 | 96,998 | ||||||||||||
| JPMorgan Chase & Co. (Banks) |
3.250% | 09/23/2022 | 100,000 | 99,231 | ||||||||||||
| KeyBank NA (Banks) |
5.700% | 11/01/2017 | 150,000 | 162,964 | ||||||||||||
| PNC Bank NA (Banks) |
3.250% | 06/01/2025 | 150,000 | 146,262 | ||||||||||||
| SunTrust Banks, Inc. (Banks) |
2.500% | 05/01/2019 | 100,000 | 100,493 | ||||||||||||
| Wells Fargo & Co. (Banks) |
3.500% | 03/08/2022 | 75,000 | 77,028 | ||||||||||||
| Goldman Sachs Group, Inc. / The (Capital Markets) |
3.750% | 05/22/2025 | 100,000 | 98,532 | ||||||||||||
| Mellon Funding Corp. (Capital Markets) |
5.500% | 11/15/2018 | 100,000 | 110,966 | ||||||||||||
| Morgan Stanley (Capital Markets) |
3.750% | 02/25/2023 | 75,000 | 75,916 | ||||||||||||
| Northern Trust Corp. (Capital Markets) |
3.950% | 10/30/2025 | 75,000 | 77,371 | ||||||||||||
| Capital One Financial Corp. (Consumer Finance) |
2.450% | 04/24/2019 | 75,000 | 74,955 | ||||||||||||
| 18 | (continued) |
| Ohio National Fund, Inc. | Omni Portfolio (Continued) |
| Schedule of Investments |
June 30, 2015 (Unaudited) |
| Corporate Bonds (Continued) | Rate | Maturity | Face Amount | Value | ||||||||||||
| FINANCIALS (continued) |
||||||||||||||||
| Discover Financial Services (Consumer Finance) |
6.450% | 06/12/2017 | $ | 150,000 | $ | 162,888 | ||||||||||
| Synchrony Financial (Consumer Finance) |
4.250% | 08/15/2024 | 100,000 | 100,291 | ||||||||||||
| Aflac, Inc. (Insurance) |
3.625% | 06/15/2023 | 75,000 | 75,694 | ||||||||||||
| Allstate Corp. / The (Insurance) |
3.150% | 06/15/2023 | 75,000 | 74,997 | ||||||||||||
| American International Group, Inc. (Insurance) |
3.875% | 01/15/2035 | 100,000 | 90,342 | ||||||||||||
| Marsh & McLennan Cos., Inc. (Insurance) |
3.500% | 06/03/2024 | 100,000 | 99,540 | ||||||||||||
| Boston Properties LP (Real Estate Investment Trusts) |
3.125% | 09/01/2023 | 75,000 | 72,808 | ||||||||||||
| Camden Property Trust (Real Estate Investment Trusts) |
3.500% | 09/15/2024 | 100,000 | 97,305 | ||||||||||||
| Federal Realty Investment Trust (Real Estate Investment Trusts) |
3.000% | 08/01/2022 | 75,000 | 73,799 | ||||||||||||
| Simon Property Group LP (Real Estate Investment Trusts) |
3.750% | 02/01/2024 | 75,000 | 76,723 | ||||||||||||
|
|
|
|||||||||||||||
| 2,301,800 | ||||||||||||||||
|
|
|
|||||||||||||||
| HEALTH CARE – 1.4% |
||||||||||||||||
| Baxalta, Inc. (Biotechnology) |
(b) | 4.000% | 06/23/2025 | 100,000 | 99,346 | |||||||||||
| Gilead Sciences, Inc. (Biotechnology) |
4.500% | 02/01/2045 | 100,000 | 99,236 | ||||||||||||
| Anthem, Inc. (Health Care Providers & Svs.) |
5.875% | 06/15/2017 | 150,000 | 162,865 | ||||||||||||
| Express Scripts Holding Co. (Health Care Providers & Svs.) |
2.250% | 06/15/2019 | 100,000 | 99,117 | ||||||||||||
| Laboratory Corp. of America Holdings (Health Care Providers & Svs.) |
3.750% | 08/23/2022 | 75,000 | 75,770 | ||||||||||||
| AbbVie, Inc. (Pharmaceuticals) |
2.900% | 11/06/2022 | 75,000 | 72,557 | ||||||||||||
| Hospira, Inc. (Pharmaceuticals) |
6.050% | 03/30/2017 | 75,000 | 80,686 | ||||||||||||
|
|
|
|||||||||||||||
| 689,577 | ||||||||||||||||
|
|
|
|||||||||||||||
| INDUSTRIALS – 1.7% |
||||||||||||||||
| Lockheed Martin Corp. (Aerospace & Defense) |
3.600% | 03/01/2035 | 100,000 | 92,061 | ||||||||||||
| FedEx Corp. (Air Freight & Logistics) |
4.900% | 01/15/2034 | 75,000 | 77,529 | ||||||||||||
| Waste Management, Inc. (Commercial Svs. & Supplies) |
6.100% | 03/15/2018 | 75,000 | 83,689 | ||||||||||||
| Parker-Hannifin Corp. (Machinery) |
4.200% | 11/21/2034 | 100,000 | 99,381 | ||||||||||||
| Burlington Northern Santa Fe, LLC (Road & Rail) |
4.550% | 09/01/2044 | 100,000 | 98,614 | ||||||||||||
| ERAC U.S.A. Finance LLC (Road & Rail) |
(b)(c) | 6.375% | 10/15/2017 | 150,000 | 164,862 | |||||||||||
| Norfolk Southern Corp. (Road & Rail) |
3.000% | 04/01/2022 | 75,000 | 74,521 | ||||||||||||
| Ryder System, Inc. (Road & Rail) |
2.650% | 03/02/2020 | 100,000 | 99,753 | ||||||||||||
| Union Pacific Corp. (Road & Rail) |
3.250% | 08/15/2025 | 100,000 | 98,801 | ||||||||||||
|
|
|
|||||||||||||||
| 889,211 | ||||||||||||||||
|
|
|
|||||||||||||||
| INFORMATION TECHNOLOGY – 2.1% |
||||||||||||||||
| Harris Corp. (Communications Equip.) |
2.700% | 04/27/2020 | 100,000 | 98,636 | ||||||||||||
| QUALCOMM, Inc. (Communications Equip.) |
3.450% | 05/20/2025 | 100,000 | 97,296 | ||||||||||||
| Denali Borrower LLC / Denali Finance Corp. (Computers & Peripherals) |
(b) | 5.625% | 10/15/2020 | 100,000 | 105,125 | |||||||||||
| Amphenol Corp. (Electronic Equip., Instr. & Comp.) |
3.125% | 09/15/2021 | 100,000 | 99,962 | ||||||||||||
| Computer Sciences Corp. (IT Svs.) |
6.500% | 03/15/2018 | 150,000 | 165,622 | ||||||||||||
| Intel Corp. (Semiconductors & Equip.) |
4.000% | 12/15/2032 | 100,000 | 95,552 | ||||||||||||
| KLA-Tencor Corp. (Semiconductors & Equip.) |
3.375% | 11/01/2019 | 100,000 | 102,640 | ||||||||||||
| Microsoft Corp. (Software) |
3.500% | 02/12/2035 | 100,000 | 91,125 | ||||||||||||
| Oracle Corp. (Software) |
4.300% | 07/08/2034 | 100,000 | 98,318 | ||||||||||||
| Apple, Inc. (Tech. Hardware, Storage & Periph.) |
2.500% | 02/09/2025 | 100,000 | 93,621 | ||||||||||||
|
|
|
|||||||||||||||
| 1,047,897 | ||||||||||||||||
|
|
|
|||||||||||||||
| MATERIALS – 0.9% |
||||||||||||||||
| CF Industries, Inc. (Chemicals) |
3.450% | 06/01/2023 | 75,000 | 72,521 | ||||||||||||
| Dow Chemical Co. / The (Chemicals) |
4.250% | 10/01/2034 | 100,000 | 93,652 | ||||||||||||
| Packaging Corp. of America (Containers & Packaging) |
4.500% | 11/01/2023 | 75,000 | 77,249 | ||||||||||||
| Freeport-McMoRan, Inc. (Metals & Mining) |
3.550% | 03/01/2022 | 75,000 | 69,346 | ||||||||||||
| Newmont Mining Corp. (Metals & Mining) |
3.500% | 03/15/2022 | 75,000 | 71,496 | ||||||||||||
| Teck Resources Ltd. (Metals & Mining) |
3.750% | 02/01/2023 | 75,000 | 64,437 | ||||||||||||
|
|
|
|||||||||||||||
| 448,701 | ||||||||||||||||
|
|
|
|||||||||||||||
| TELECOMMUNICATION SERVICES – 0.4% |
||||||||||||||||
| AT&T, Inc. (Diversified Telecom. Svs.) |
3.400% | 05/15/2025 | 100,000 | 94,948 | ||||||||||||
| Verizon Communications, Inc. (Diversified Telecom. Svs.) |
3.850% | 11/01/2042 | 75,000 | 61,767 | ||||||||||||
| Rogers Communications, Inc. (Wireless Telecom. Svs.) |
3.000% | 03/15/2023 | 75,000 | 71,947 | ||||||||||||
|
|
|
|||||||||||||||
| 228,662 | ||||||||||||||||
|
|
|
|||||||||||||||
| UTILITIES – 1.9% |
||||||||||||||||
| Commonwealth Edison Co. (Electric Utilities) |
5.950% | 08/15/2016 | 75,000 | 79,093 | ||||||||||||
| Kansas City Power & Light Co. (Electric Utilities) |
5.850% | 06/15/2017 | 150,000 | 162,494 | ||||||||||||
| Pennsylvania Electric Co. (Electric Utilities) |
6.050% | 09/01/2017 | 150,000 | 163,697 | ||||||||||||
| South Carolina Electric & Gas Co. (Electric Utilities) |
4.350% | 02/01/2042 | 75,000 | 71,620 | ||||||||||||
| Union Electric Co. (Electric Utilities) |
6.400% | 06/15/2017 | 150,000 | 164,343 | ||||||||||||
| Westar Energy, Inc. (Electric Utilities) |
4.125% | 03/01/2042 | 75,000 | 72,385 | ||||||||||||
| Southwest Gas Corp. (Gas Utilities) |
3.875% | 04/01/2022 | 75,000 | 78,500 | ||||||||||||
| 19 | (continued) |
| Ohio National Fund, Inc. | Omni Portfolio (Continued) |
| Schedule of Investments |
June 30, 2015 (Unaudited) |
| Corporate Bonds (Continued) | Rate | Maturity | Face Amount | Value | ||||||||||||
| UTILITIES (continued) |
||||||||||||||||
| Spectra Energy Capital LLC (Gas Utilities) |
3.300% | 03/15/2023 | $ | 75,000 | $ | 68,693 | ||||||||||
| American Water Capital Corp. (Water Utilities) |
4.300% | 12/01/2042 | 100,000 | 98,150 | ||||||||||||
|
|
|
|||||||||||||||
| 958,975 | ||||||||||||||||
|
|
|
|||||||||||||||
| Total Corporate Bonds (Cost $10,239,962) |
$ | 10,320,076 | ||||||||||||||
|
|
|
|||||||||||||||
| Asset-Backed Securities – 0.2% | Rate | Maturity | Face Amount | Value | ||||||||||||
| INDUSTRIALS – 0.2% |
||||||||||||||||
| American Airlines 2015-1 Class B Pass Through Trust (Airlines) |
3.700% | 05/01/2023 | $ | 100,000 | $ | 98,000 | ||||||||||
|
|
|
|||||||||||||||
| Total Asset-Backed Securities (Cost $100,000) |
$ | 98,000 | ||||||||||||||
|
|
|
|||||||||||||||
| U.S. Treasury Obligations – 2.4% | Rate | Maturity | Face Amount | Value | ||||||||||||
| United States Treasury Note |
1.125% | 04/30/2020 | $ | 400,000 | $ | 390,438 | ||||||||||
| United States Treasury Note |
2.125% | 06/30/2021 | 200,000 | 202,297 | ||||||||||||
| United States Treasury Note |
2.000% | 02/15/2025 | 400,000 | 388,062 | ||||||||||||
| United States Treasury Note |
2.500% | 02/15/2045 | 300,000 | 262,781 | ||||||||||||
|
|
|
|||||||||||||||
| Total U.S. Treasury Obligations (Cost $1,253,410) |
$ | 1,243,578 | ||||||||||||||
|
|
|
|||||||||||||||
| Money Market Funds – 1.1% | Shares | Value | ||||||||||||||
| Fidelity Institutional Money Market Funds |
540,000 | $ | 540,000 | |||||||||||||
|
|
|
|||||||||||||||
| Total Money Market Funds (Cost $540,000) |
$ | 540,000 | ||||||||||||||
|
|
|
|||||||||||||||
| Total Investments – 99.8% (Cost $48,965,869) |
(d) | $ | 50,499,822 | |||||||||||||
| Other Assets in Excess of Liabilities – 0.2% |
92,516 | |||||||||||||||
|
|
|
|||||||||||||||
| Net Assets – 100.0% |
$ | 50,592,338 | ||||||||||||||
|
|
|
|||||||||||||||
Percentages are stated as a percent of net assets.
Footnotes:
| (a) | Non-income producing security. |
| (b) | Security exempt from registration under Regulation D of the Securities Act of 1933. These securities may be resold in transactions exempt from registration, normally to qualified buyers under Rule 144A. At June 30, 2015, the value of these securities totaled $467,833, or 0.9% of the Portfolio’s net assets. These securities were deemed liquid pursuant to procedures approved by the Board of Directors. |
| (c) | Represents bonds that are credit sensitive. The coupon rates for these bonds are subject to adjustment based on changes in national credit rating agency ratings. |
| (d) | Represents cost for financial reporting purposes, which may differ from cost basis for federal income tax purposes. See also Note 7 of the Notes to Financial Statements. |
The accompanying notes are an integral part of these financial statements.
| 20 |
| Ohio National Fund, Inc. | International Portfolio |
| 21 | (continued) |
| Ohio National Fund, Inc. | International Portfolio (Continued) |
| 22 | (continued) |
| Ohio National Fund, Inc. | International Portfolio (Continued) |

| (1) | Composition of Portfolio subject to change. |
| (2) | Short-term investments have been excluded from the list of Top 10 Portfolio Holdings. |
| (3) | Top 10 Country Weightings (combined): |
| % of Net Assets | ||||
| Japan |
28.8 | |||
| Germany |
12.2 | |||
| Sweden |
10.7 | |||
| Denmark |
9.5 | |||
| Spain |
7.4 | |||
| Taiwan |
4.8 | |||
| Ireland |
4.6 | |||
| Norway |
3.6 | |||
| Italy |
1.9 | |||
| United States |
1.3 |
| 23 |
| Ohio National Fund, Inc. | International Portfolio |
| Schedule of Investments |
June 30, 2015 (Unaudited) |
| 24 | (continued) |
| Ohio National Fund, Inc. | International Portfolio (Continued) |
| Schedule of Investments |
June 30, 2015 (Unaudited) |
Percentages are stated as a percent of net assets.
Abbreviations:
ADR: American Depositary Receipts
Footnotes:
| (a) | Non-income producing security. |
| (b) | Security exempt from registration under Regulation D of the Securities Act of 1933. These securities may be resold in transactions exempt from registration, normally to qualified buyers under Rule 144A. At June 30, 2015, the value of these securities totaled $1,756,354, or 1.0% of the Portfolio’s net assets. These securities were deemed liquid pursuant to procedures approved by the Board of Directors. |
| (c) | Security traded on a foreign exchange has been valued at an estimate of fair value that is different than the local market close price. These fair value estimates are determined by an independent fair valuation service that has been approved by the Board. These securities represent $139,262,011, or 78.9% of the Portfolio’s net assets. |
| (d) | As discussed in Note 2 of the Notes to Financial Statements, not all investments that are traded on a foreign exchange are valued at an estimate that is different from the local close price. In some instances, the independent fair valuation service uses a stock’s local close price because the service’s measure of predictability related to their valuation model of a stock is below a chosen threshold. These securities represent $2,749,451, or 1.6% of the Portfolio’s net assets. |
| Other Portfolio securities are not subjected to fair valuation procedures because they are traded on domestic or foreign exchanges that have close times that are consistent with the U.S. market close, normally 4:00 pm Eastern Time. |
| (e) | Represents cost for financial reporting purposes, which may differ from cost basis for federal income tax purposes. See also Note 7 of the Notes to Financial Statements. |
| (f) | Includes $2,172,003 of cash pledged as collateral for the following futures contracts outstanding at June 30, 2015: |
| Type |
Description |
Expiration |
Number of Contracts |
Contract |
Initial Contract Amount |
Unrealized Appreciation (Depreciation) |
Variation Margin Receivable (Payable) |
|||||||||||||||
| Long |
JPX Nikkei Index 400 Future |
September 10, 2015 | 211 | $ 2,536,965 | $ | 2,602,430 | $ | (65,465 | ) | $ | 13,718 | |||||||||||
| Long |
DAX Index Future |
September 18, 2015 | 17 | $ 5,212,632 | $ | 5,354,349 | $ | (141,717 | ) | $ | (44,905 | ) | ||||||||||
| Long |
Hang Seng China Enterprises (HSCE) Index Future |
July 30, 2015 | 112 | $ 9,337,487 | $ | 9,821,230 | $ | (483,743 | ) | $ | 196,411 | |||||||||||
| Long |
OMX Stockholm 30 Index Future |
July 17, 2015 | 100 | $ 1,859,804 | $ | 1,891,228 | $ | (31,424 | ) | $ | (21,019 | ) | ||||||||||
|
|
|
|
|
|
|
|
||||||||||||||||
| $18,946,890 | $ | 19,669,239 | $ | (722,349 | ) | $ | 144,205 | |||||||||||||||
|
|
|
|
|
|
|
|
||||||||||||||||
| Details of the foreign currency contracts outstanding in the International Portfolio at June 30, 2015 are as follows: |
Contracts to buy foreign currency:
| Date of contract |
Exchange date |
Counterparty |
Currency to receive |
Currency to deliver |
Contract at value |
Unrealized Appreciation (Depreciation) |
||||||||||||||
| April 9, 2015 |
July 10, 2015 |
JPM | 98,905,000 RUB | $ | 1,835,654 | $ | 1,787,095 | $ | (48,559 | ) | ||||||||||
| April 21, 2015 |
July 27, 2015 |
MSCS | 8,739,810 CHF | $ | 9,153,550 | $ | 9,356,621 | $ | 203,071 | |||||||||||
|
|
|
|
|
|
|
|||||||||||||||
| $ | 10,989,204 | $ | 11,143,716 | $ | 154,512 | |||||||||||||||
|
|
|
|
|
|
|
|||||||||||||||
Contracts to sell foreign currency:
| Date of contract |
Exchange date |
Counterparty |
Currency to receive |
Currency to deliver | Contract at value |
Unrealized Appreciation (Depreciation) |
||||||||||||||
| April 21, 2015 |
July 27, 2015 |
MSCS | $ | 9,153,550 | 8,550,000 EUR | $ | 9,535,059 | $ | (381,509 | ) | ||||||||||
| June 12, 2015 |
September 15, 2015 |
CITI | $ | 19,473,299 | 17,325,000 EUR | $ | 19,334,979 | $ | 138,320 | |||||||||||
| June 12, 2015 |
September 15, 2015 |
HSBC | $ | 26,422,451 | 3,253,000,000 JPY | $ | 26,605,579 | $ | (183,128 | ) | ||||||||||
|
|
|
|
|
|
|
|||||||||||||||
| $ | 55,049,300 | $ | 55,475,617 | $ | (426,317 | ) | ||||||||||||||
|
|
|
|
|
|
|
|||||||||||||||
| Counterparties |
Currencies | |
| JPM –J.P. Morgan Chase Bank, N.A. |
RUB – Russian Ruble | |
| MSCS – Morgan Stanley Capital Services, Inc. |
CHF – Swiss Franc | |
| CITI – Citigroup Global Markets, Inc. |
EUR – Euro | |
| HSBC – HSBC Bank USA, N.A. |
JPY – Japanese Yen |
| 25 | (continued) |
| Ohio National Fund, Inc. | International Portfolio (Continued) |
| Schedule of Investments |
June 30, 2015 (Unaudited) |
Sector Classifications (Common Stocks & Preferred Stocks): (Percent of net assets)
| Consumer Discretionary |
19.9% | |||
| Financials |
18.9% | |||
| Industrials |
12.7% | |||
| Information Technology |
11.3% | |||
| Materials |
8.0% | |||
| Health Care |
7.1% | |||
| Utilities |
2.5% | |||
| Consumer Staples |
1.8% | |||
| Telecommunication Services |
1.7% | |||
| Energy |
1.4% | |||
|
|
|
|||
| 85.3% | ||||
|
|
|
The accompanying notes are an integral part of these financial statements.
| 26 |
| Ohio National Fund, Inc. | Capital Appreciation Portfolio |
| 27 | (continued) |
| Ohio National Fund, Inc. | Capital Appreciation Portfolio (Continued) |

| (1) | Composition of Portfolio subject to change. |
| (2) | Short-term investments have been excluded from the list of Top 10 Portfolio Holdings. |
| (3) | Sectors: |
| % of Net Assets | ||||
| Information Technology |
20.8 | |||
| Consumer Discretionary |
19.4 | |||
| Financials |
15.1 | |||
| Health Care |
12.2 | |||
| Industrials |
9.2 | |||
| Energy |
7.2 | |||
| Utilities |
4.9 | |||
| Materials |
4.2 | |||
| Consumer Staples |
4.1 | |||
| Telecommunication Services |
1.0 | |||
|
|
|
|||
| 98.1 | ||||
|
|
|
| 28 |
| Ohio National Fund, Inc. | Capital Appreciation Portfolio |
| Schedule of Investments |
June 30, 2015 (Unaudited) |
| 29 | (continued) |
| Ohio National Fund, Inc. | Capital Appreciation Portfolio (Continued) |
| Schedule of Investments |
June 30, 2015 (Unaudited) |
Percentages are stated as a percent of net assets.
Abbreviations:
ADR: American Depositary Receipts
Footnotes:
| (a) | Non-income producing security. |
| (b) | Security exempt from registration under Regulation D of the Securities Act of 1933. These securities may be resold in transactions exempt from registration, normally to qualified buyers under Rule 144A. At June 30, 2015, the value of these securities totaled $489,429, or 0.1% of the Portfolio’s net assets. These securities were deemed liquid pursuant to procedures approved by the Board of Directors. |
| (c) | Security traded on a foreign exchange has been valued at an estimate of fair value that is different than the local market close price. These fair value estimates are determined by an independent fair valuation service that has been approved by the Board. These securities represent $7,256,421, or 1.6% of the Portfolio’s net assets. |
Other Portfolio securities are not subjected to fair value procedures because they are traded on domestic or foreign exchanges that have close times that are consistent with the U.S. market close, normally 4:00 pm Eastern Time.
| (d) | Represents cost for financial reporting purposes, which may differ from cost basis for federal income tax purposes. See also Note 7 of the Notes to Financial Statements. |
The accompanying notes are an integral part of these financial statements.
| 30 |
| Ohio National Fund, Inc. | International Small-Mid Company Portfolio |
| 31 | (continued) |
| Ohio National Fund, Inc. | International Small-Mid Company Portfolio (Continued) |

| 32 | (continued) |
| Ohio National Fund, Inc. | International Small-Mid Company Portfolio (Continued) |
| (1) | Composition of Portfolio subject to change. |
| (2) | Short-term investments have been excluded from the list of Top 10 Portfolio Holdings. |
| (3) | Top 10 Country Weightings: |
| % of Net Assets | ||||
| United Kingdom |
19.2 | |||
| Japan |
14.1 | |||
| France |
10.5 | |||
| Germany |
10.4 | |||
| Italy |
7.6 | |||
| Hong Kong |
7.4 | |||
| Canada |
4.2 | |||
| China |
3.4 | |||
| United States |
3.2 | |||
| Ireland |
2.7 |
| 33 |
| Ohio National Fund, Inc. | International Small-Mid Company Portfolio |
| Schedule of Investments |
June 30, 2015 (Unaudited) |
| 34 | (continued) |
| Ohio National Fund, Inc. | International Small-Mid Company Portfolio (Continued) |
| Schedule of Investments |
June 30, 2015 (Unaudited) |
Percentages are stated as a percent of net assets.
Abbreviations:
ADR: American Depositary Receipts
Footnotes:
| (a) | Non-income producing security. |
| (b) | Security exempt from registration under Regulation D of the Securities Act of 1933. These securities may be resold in transactions exempt from registration, normally to qualified buyers under Rule 144A. At June 30, 2015, the value of these securities totaled $7,330,074, or 8.5% of the Portfolio’s net assets. These securities were deemed liquid pursuant to procedures approved by the Board of Directors. |
| (c) | A market quotation for this investment was not readily available at June 30, 2015. As discussed in Note 2 of the Notes to Financial Statements, the price for this issue was derived from an estimate of fair market value using methods determined in good faith by the Fund’s Pricing Committee under supervision of the Board. This security represents $299,028, or 0.3% of the Portfolio’s net assets. |
| (d) | A market quotation for this investment was not readily available at June 30, 2015. As discussed in Note 2 of the Notes to Financial Statements, the price for this issue was derived from an estimate of fair market value using methods determined in good faith by the Fund’s pricing policy approved by the Board. This security represents $9, or 0.0% of the Portfolio’s net assets. |
| (e) | Security traded on a foreign exchange has been valued at an estimate of fair value that is different than the local market close price. These fair value estimates are determined by an independent fair valuation service that has been approved by the Board. These securities represent $68,764,289, or 79.3% of the Portfolio’s net assets. |
| (f) | As discussed in Note 2 of the Notes to Financial Statements, not all investments that are traded on a foreign exchange are valued at an estimate that is different from the local close price. In some instances, the independent fair valuation service uses a stock’s local close price because the service’s measure of predictability related to their valuation model of a stock is below a chosen threshold. These securities represent $4,724,408, or 5.4% of the Portfolio’s net assets. |
| (g) | Represents a security deemed to be illiquid. At June 30, 2015, the value of illiquid securities in the Portfolio totaled $299,028, or 0.3% of the Portfolio’s net assets. |
| (h) | Represents cost for financial reporting purposes, which may differ from cost basis for federal income tax purposes. See also Note 7 of the Notes to Financial Statements. |
| Details of the foreign currency contracts outstanding in the International Small-Mid Company Portfolio at June 30, 2015 are as follows: |
Contracts to sell foreign currency:
| Date of contract |
Exchange date |
Counterparty |
Currency to receive |
Currency to deliver |
Contract at value |
Unrealized Depreciation |
||||||||||||||
| April 21, 2015 |
July 27, 2015 |
MSCS | $ | 8,217,845 | 7,670,000 EUR | $ | 8,553,673 | $ | (335,828 | ) | ||||||||||
|
|
|
|
|
|
|
|||||||||||||||
| Counterparties |
Currencies | |
| MSCS - Morgan Stanley Capital Services, Inc. |
EUR – Euro |
| 35 | (continued) |
| Ohio National Fund, Inc. | International Small-Mid Company Portfolio (Continued) |
| Schedule of Investments |
June 30, 2015 (Unaudited) |
Sector Classifications (Common stocks and Rights): (Percent of net assets)
| Consumer Discretionary |
23.4% | |||
| Industrials |
22.6% | |||
| Information Technology |
15.5% | |||
| Financials |
14.0% | |||
| Health Care |
8.4% | |||
| Materials |
5.7% | |||
| Utilities |
2.9% | |||
| Energy |
1.8% | |||
| Telecommunication Services |
1.8% | |||
| Consumer Staples |
1.7% | |||
|
|
|
|||
| 97.8% | ||||
|
|
|
The accompanying notes are an integral part of these financial statements.
| 36 |
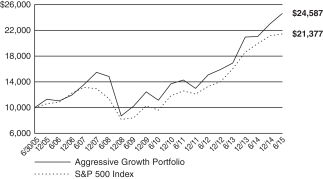
| Ohio National Fund, Inc. | Aggressive Growth Portfolio |
| 37 | (continued) |
| Ohio National Fund, Inc. | Aggressive Growth Portfolio (Continued) |
| (1) | Composition of Portfolio subject to change. |
| (2) | Short-term investments have been excluded from the list of Top 10 Portfolio Holdings. |
| (3) | Sectors: |
| % of Net Assets | ||||
| Consumer Discretionary |
28.9 | |||
| Information Technology |
23.8 | |||
| Health Care |
14.8 | |||
| Financials |
14.7 | |||
| Industrials |
10.9 | |||
| Materials |
2.2 | |||
| Energy |
1.2 | |||
|
|
|
|||
| 96.5 | ||||
|
|
|
| 38 |
| Ohio National Fund, Inc. | Aggressive Growth Portfolio |
| Schedule of Investments |
June 30, 2015 (Unaudited) |
Percentages are stated as a percent of net assets.
Abbreviations:
ADR: American Depositary Receipts
Footnotes:
| (a) | Non-income producing security. |
| (b) | Represents cost for financial reporting purposes, which may differ from cost basis for federal income tax purposes. See also Note 7 of the Notes to Financial Statements. |
The accompanying notes are an integral part of these financial statements.
| 39 |
| Ohio National Fund, Inc. | Small Cap Growth Portfolio |
| 40 | (continued) |
| Ohio National Fund, Inc. | Small Cap Growth Portfolio (Continued) |

| 41 | (continued) |
| Ohio National Fund, Inc. | Small Cap Growth Portfolio (Continued) |
| (1) | Composition of Portfolio subject to change. |
| (2) | Short-term investments have been excluded from the list of Top 10 Portfolio Holdings. |
| (3) | Sectors (combined): |
| % of Net Assets | ||||
| Information Technology |
33.4 | |||
| Health Care |
21.5 | |||
| Industrials |
18.3 | |||
| Consumer Discretionary |
12.7 | |||
| Financials |
8.7 | |||
| Materials |
2.0 | |||
| Consumer Staples |
2.0 | |||
| Energy |
1.3 | |||
|
|
|
|||
| 99.9 | ||||
|
|
|
| 42 |
| Ohio National Fund, Inc. | Small Cap Growth Portfolio |
| Schedule of Investments |
June 30, 2015 (Unaudited) |
| 43 | (continued) |
| Ohio National Fund, Inc. | Small Cap Growth Portfolio (Continued) |
| Schedule of Investments |
June 30, 2015 (Unaudited) |
Percentages are stated as a percent of net assets.
Abbreviations:
ADR: American Depositary Receipts
Footnotes:
| (a) | Non-income producing security. |
| (b) | Security traded on a foreign exchange has been valued at an estimate of fair value that is different than the local market close price. These fair value estimates are determined by an independent fair valuation service that has been approved by the Board. These securities represent $4,011,857, or 1.8% of the Portfolio’s net assets. |
Other Portfolio securities are not subjected to fair value procedures because they are traded on domestic or foreign exchanges that have close times that are consistent with the U.S. market close, normally 4:00 pm Eastern Time.
| (c) | Represents cost for financial reporting purposes, which may differ from cost basis for federal income tax purposes. See also Note 7 of the Notes to Financial Statements. |
The accompanying notes are an integral part of these financial statements.
| 44 |
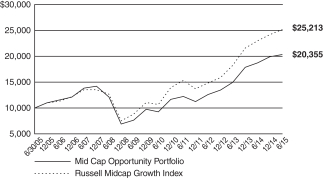
| Ohio National Fund, Inc. | Mid Cap Opportunity Portfolio |
| 45 | (continued) |
| Ohio National Fund, Inc. | Mid Cap Opportunity Portfolio (Continued) |
| (1) | Composition of Portfolio subject to change. |
| (2) | Short-term investments have been excluded from the list of Top 10 Portfolio Holdings. |
| (3) | Sectors: |
| % of Net Assets | ||||
| Consumer Discretionary |
25.2 | |||
| Information Technology |
17.5 | |||
| Health Care |
15.6 | |||
| Industrials |
14.2 | |||
| Financials |
10.5 | |||
| Consumer Staples |
7.4 | |||
| Materials |
4.0 | |||
| Telecommunication Services |
2.9 | |||
| Energy |
2.0 | |||
|
|
|
|||
| 99.3 | ||||
|
|
|
| 46 |
| Ohio National Fund, Inc. | Mid Cap Opportunity Portfolio |
| Schedule of Investments |
June 30, 2015 (Unaudited) |
| 47 | (continued) |
| Ohio National Fund, Inc. | Mid Cap Opportunity Portfolio (Continued) |
| Schedule of Investments |
June 30, 2015 (Unaudited) |
Percentages are stated as a percent of net assets.
Footnotes:
| (a) | Non-income producing security. |
| (b) | Represents cost for financial reporting purposes, which may differ from cost basis for federal income tax purposes. See also Note 7 of the Notes to Financial Statements. |
The accompanying notes are an integral part of these financial statements.
| 48 |
| Ohio National Fund, Inc. | S&P 500® Index Portfolio |

| 49 | (continued) |
| Ohio National Fund, Inc. | S&P 500® Index Portfolio (Continued) |
| (1) | Composition of Portfolio subject to change. |
| (2) | Short-term investments have been excluded from the list of Top 10 Portfolio Holdings. |
| (3) | Sectors: |
| % of Net Assets | ||||
| Information Technology |
18.8 | |||
| Financials |
15.8 | |||
| Health Care |
14.8 | |||
| Consumer Discretionary |
12.2 | |||
| Industrials |
9.7 | |||
| Consumer Staples |
9.0 | |||
| Energy |
7.5 | |||
| Materials |
3.0 | |||
| Utilities |
2.7 | |||
| Telecommunication Services |
2.1 | |||
|
|
|
|||
| 95.6 | ||||
|
|
|
| 50 |
| Ohio National Fund, Inc. | S&P 500® Index Portfolio |
| Schedule of Investments |
June 30, 2015 (Unaudited) |
| 51 | (continued) |
| Ohio National Fund, Inc. | S&P 500® Index Portfolio (Continued) |
| Schedule of Investments |
June 30, 2015 (Unaudited) |
| 52 | (continued) |
| Ohio National Fund, Inc. | S&P 500® Index Portfolio (Continued) |
| Schedule of Investments |
June 30, 2015 (Unaudited) |
| 53 | (continued) |
| Ohio National Fund, Inc. | S&P 500® Index Portfolio (Continued) |
| Schedule of Investments |
June 30, 2015 (Unaudited) |
| 54 | (continued) |
| Ohio National Fund, Inc. | S&P 500® Index Portfolio (Continued) |
| Schedule of Investments |
June 30, 2015 (Unaudited) |
Percentages are stated as a percent of net assets.
Footnotes:
| (a) | Non-income producing security. |
| (b) | Represents cost for financial reporting purposes, which may differ from cost basis for federal income tax purposes. See also Note 7 of the Notes to Financial Statements. |
The accompanying notes are an integral part of these financial statements.
| 55 |
| Ohio National Fund, Inc. | Strategic Value Portfolio |
| 56 | (continued) |
| Ohio National Fund, Inc. | Strategic Value Portfolio (Continued) |
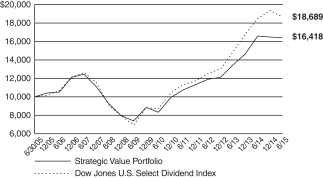
| 57 | (continued) |
| Ohio National Fund, Inc. | Strategic Value Portfolio (Continued) |
| (1) | Composition of Portfolio subject to change. |
| (2) | Short-term investments have been excluded from the list of Top 10 Portfolio Holdings. |
| (3) | Sectors: |
| % of Net Assets | ||||
| Consumer Staples |
32.7 | |||
| Telecommunication Services |
14.8 | |||
| Utilities |
14.5 | |||
| Energy |
13.3 | |||
| Health Care |
9.1 | |||
| Financials |
8.9 | |||
| Consumer Discretionary |
4.3 | |||
|
|
|
|||
| 97.6 | ||||
|
|
|
| 58 |
| Ohio National Fund, Inc. | Strategic Value Portfolio |
| Schedule of Investments |
June 30, 2015 (Unaudited) |
Percentages are stated as a percent of net assets.
Abbreviations:
ADR: American Depositary Receipts
Footnotes:
| (a) | Security traded on a foreign exchange has been valued at an estimate of fair value that is different than the local market close price. These fair value estimates are determined by an independent fair valuation service that has been approved by the Board. These securities represent $68,015,961, or 20.6% of the Portfolio’s net assets. Other Portfolio securities are not subjected to fair value procedures because they are traded on domestic or foreign exchanges that have close times that are consistent with the U.S. market close, normally 4:00 pm Eastern Time. |
| (b) | Represents cost for financial reporting purposes, which may differ from cost basis for federal income tax purposes. See also Note 7 of the Notes to Financial Statements. |
The accompanying notes are an integral part of these financial statements.
| 59 |
| Ohio National Fund, Inc. | High Income Bond Portfolio |
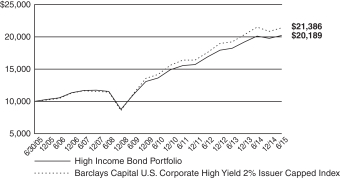
| 60 | (continued) |
| Ohio National Fund, Inc. | High Income Bond Portfolio (Continued) |
| (1) | Composition of Portfolio subject to change. |
| (2) | Short-term investments have been excluded from the list of Top 10 Portfolio Holdings. |
| (3) | Sectors: |
| % of Net Assets | ||||
| Consumer Discretionary |
29.9 | |||
| Health Care |
12.1 | |||
| Industrials |
11.7 | |||
| Energy |
11.2 | |||
| Information Technology |
10.4 | |||
| Materials |
9.1 | |||
| Telecommunication Services |
4.0 | |||
| Consumer Staples |
3.9 | |||
| Financials |
3.2 | |||
| Utilities |
2.2 | |||
|
|
|
|||
| 97.7 | ||||
|
|
|
| 61 |
| Ohio National Fund, Inc. | High Income Bond Portfolio |
| Schedule of Investments |
June 30, 2015 (Unaudited) |
| Corporate Bonds – 97.7% | Rate | Maturity | Face Amount | Value | ||||||||||||
| CONSUMER DISCRETIONARY – 29.9% |
||||||||||||||||
| American Axle & Manufacturing, Inc. (Auto Components) |
6.625% | 10/15/2022 | $ | 625,000 | $ | 656,250 | ||||||||||
| American Axle & Manufacturing, Inc. (Auto Components) |
6.250% | 03/15/2021 | 400,000 | 420,000 | ||||||||||||
| Gates Global LLC / Gates Global Co. (Auto Components) |
(b) | 6.000% | 07/15/2022 | 900,000 | 814,500 | |||||||||||
| International Automotive Components Group SL (Auto Components) |
(b) | 9.125% | 06/01/2018 | 850,000 | 867,000 | |||||||||||
| J.B. Poindexter & Co., Inc. (Auto Components) |
(b) | 9.000% | 04/01/2022 | 725,000 | 775,750 | |||||||||||
| Lear Corp. (Auto Components) |
5.375% | 03/15/2024 | 225,000 | 228,375 | ||||||||||||
| Lear Corp. (Auto Components) |
4.750% | 01/15/2023 | 625,000 | 615,625 | ||||||||||||
| Lear Corp. (Auto Components) |
5.250% | 01/15/2025 | 100,000 | 98,250 | ||||||||||||
| MPG Holdco I, Inc. (Auto Components) |
7.375% | 10/15/2022 | 700,000 | 745,500 | ||||||||||||
| Omega U.S. Sub, LLC (Auto Components) |
(b) | 8.750% | 07/15/2023 | 300,000 | 299,250 | |||||||||||
| Stackpole International Intermediate / Stackpole International Powder (Auto Components) |
(b) | 7.750% | 10/15/2021 | 625,000 | 615,625 | |||||||||||
| Tenneco, Inc. (Auto Components) |
5.375% | 12/15/2024 | 225,000 | 231,187 | ||||||||||||
| UCI International, Inc. (Auto Components) |
8.625% | 02/15/2019 | 825,000 | 734,250 | ||||||||||||
| ZF North America Capital, Inc. (Auto Components) |
(b) | 4.750% | 04/29/2025 | 325,000 | 315,250 | |||||||||||
| General Motors Co. (Automobiles) |
4.000% | 04/01/2025 | 500,000 | 491,643 | ||||||||||||
| General Motors Financial Co., Inc. (Automobiles) |
4.250% | 05/15/2023 | 325,000 | 328,442 | ||||||||||||
| General Motors Financial Co., Inc. (Automobiles) |
4.000% | 01/15/2025 | 150,000 | 147,775 | ||||||||||||
| Affinia Group, Inc. (Distributors) |
7.750% | 05/01/2021 | 1,125,000 | 1,175,625 | ||||||||||||
| ServiceMaster Co. LLC / The (Diversified Consumer Svs.) |
7.100% | 03/01/2018 | 450,000 | 472,500 | ||||||||||||
| ServiceMaster Co. LLC / The (Diversified Consumer Svs.) |
7.450% | 08/15/2027 | 300,000 | 303,000 | ||||||||||||
| ServiceMaster Co. LLC / The (Diversified Consumer Svs.) |
7.000% | 08/15/2020 | 649,000 | 685,506 | ||||||||||||
| 1011778 B.C. ULC / New Red Finance, Inc. (Hotels, Restaurants & Leisure) |
(b) | 6.000% | 04/01/2022 | 1,175,000 | 1,207,312 | |||||||||||
| 1011778 B.C. ULC / New Red Finance, Inc. (Hotels, Restaurants & Leisure) |
(b) | 4.625% | 01/15/2022 | 375,000 | 369,375 | |||||||||||
| Affinity Gaming LLC / Affinity Gaming Finance Corp. (Hotels, Restaurants & Leisure) |
9.000% | 05/15/2018 | 250,000 | 248,750 | ||||||||||||
| Boyd Gaming Corp. (Hotels, Restaurants & Leisure) |
6.875% | 05/15/2023 | 375,000 | 384,375 | ||||||||||||
| Cedar Fair LP / Canada’s Wonderland Co. / Magnum Management Corp. (Hotels, Restaurants & Leisure) |
5.250% | 03/15/2021 | 125,000 | 128,437 | ||||||||||||
| Cedar Fair LP / Canada’s Wonderland Co. / Magnum Management Corp. (Hotels, Restaurants & Leisure) |
5.375% | 06/01/2024 | 375,000 | 379,200 | ||||||||||||
| Chester Downs & Marina LLC (Hotels, Restaurants & Leisure) |
(b) | 9.250% | 02/01/2020 | 450,000 | 351,000 | |||||||||||
| Churchill Downs, Inc. (Hotels, Restaurants & Leisure) |
5.375% | 12/15/2021 | 225,000 | 230,625 | ||||||||||||
| ESH Hospitality, Inc. (Hotels, Restaurants & Leisure) |
(b) | 5.250% | 05/01/2025 | 225,000 | 218,812 | |||||||||||
| GLP Capital LP / GLP Financing II, Inc. (Hotels, Restaurants & Leisure) |
5.375% | 11/01/2023 | 375,000 | 385,312 | ||||||||||||
| GLP Capital LP / GLP Financing II, Inc. (Hotels, Restaurants & Leisure) |
4.875% | 11/01/2020 | 625,000 | 635,937 | ||||||||||||
| Hilton Worldwide Finance LLC / Hilton Worldwide Finance Corp. (Hotels, Restaurants & Leisure) |
5.625% | 10/15/2021 | 300,000 | 311,610 | ||||||||||||
| MGM Resorts International (Hotels, Restaurants & Leisure) |
7.750% | 03/15/2022 | 1,125,000 | 1,237,500 | ||||||||||||
| MGM Resorts International (Hotels, Restaurants & Leisure) |
6.750% | 10/01/2020 | 425,000 | 449,352 | ||||||||||||
| Mohegan Tribal Gaming Authority (Hotels, Restaurants & Leisure) |
9.750% | 09/01/2021 | 450,000 | 471,375 | ||||||||||||
| NPC International, Inc. / NPC Operating Co. A, Inc. / NPC Operating Co. B, Inc. (Hotels, Restaurants & Leisure) |
10.500% | 01/15/2020 | 900,000 | 942,750 | ||||||||||||
| Penn National Gaming, Inc. (Hotels, Restaurants & Leisure) |
5.875% | 11/01/2021 | 1,075,000 | 1,083,062 | ||||||||||||
| Pinnacle Entertainment, Inc. (Hotels, Restaurants & Leisure) |
7.500% | 04/15/2021 | 225,000 | 238,219 | ||||||||||||
| Pinnacle Entertainment, Inc. (Hotels, Restaurants & Leisure) |
6.375% | 08/01/2021 | 650,000 | 689,812 | ||||||||||||
| Rivers Pittsburgh Borrower LP / Rivers Pittsburgh Finance Corp. (Hotels, Restaurants & Leisure) |
(b) | 9.500% | 06/15/2019 | 577,000 | 606,571 | |||||||||||
| Seminole Hard Rock Entertainment, Inc. / Seminole Hard Rock International LLC (Hotels, Restaurants & Leisure) |
(b) | 5.875% | 05/15/2021 | 1,225,000 | 1,237,250 | |||||||||||
| Seminole Indian Tribe of Florida (Hotels, Restaurants & Leisure) |
(b) | 7.804% | 10/01/2020 | 745,000 | 795,287 | |||||||||||
| Six Flags Entertainment Corp. (Hotels, Restaurants & Leisure) |
(b) | 5.250% | 01/15/2021 | 800,000 | 816,000 | |||||||||||
| Station Casinos LLC (Hotels, Restaurants & Leisure) |
7.500% | 03/01/2021 | 800,000 | 856,000 | ||||||||||||
| RSI Home Products, Inc. (Household Durables) |
(b) | 6.500% | 03/15/2023 | 550,000 | 554,125 | |||||||||||
| Serta Simmons Holdings LLC (Household Durables) |
(b) | 8.125% | 10/01/2020 | 1,275,000 | 1,345,125 | |||||||||||
| CDW LLC / CDW Finance Corp. (Internet & Catalog Retail) |
6.000% | 08/15/2022 | 100,000 | 103,250 | ||||||||||||
| CDW LLC / CDW Finance Corp. (Internet & Catalog Retail) |
5.500% | 12/01/2024 | 525,000 | 519,750 | ||||||||||||
| CDW LLC / CDW Finance Corp. (Internet & Catalog Retail) |
5.000% | 09/01/2023 | 550,000 | 540,375 | ||||||||||||
| FGI Operating Co. LLC / FGI Finance, Inc. (Leisure Equip. & Products) |
7.875% | 05/01/2020 | 800,000 | 612,000 | ||||||||||||
| Altice SA (Media) |
(b) | 7.750% | 05/15/2022 | 875,000 | 846,562 | |||||||||||
| Altice SA (Media) |
(b) | 7.625% | 02/15/2025 | 250,000 | 235,000 | |||||||||||
| Altice U.S. Finance I Corp. (Media) |
(b) | 5.375% | 07/15/2023 | 375,000 | 364,687 | |||||||||||
| Altice U.S. Finance II Corp. (Media) |
(b) | 7.750% | 07/15/2025 | 200,000 | 194,000 | |||||||||||
| AMC Networks, Inc. (Media) |
7.750% | 07/15/2021 | 475,000 | 513,000 | ||||||||||||
| AMC Networks, Inc. (Media) |
4.750% | 12/15/2022 | 350,000 | 350,000 | ||||||||||||
| CCO Holdings LLC / CCO Holdings Capital Corp. (Media) |
6.625% | 01/31/2022 | 400,000 | 417,000 | ||||||||||||
| CCO Holdings LLC / CCO Holdings Capital Corp. (Media) |
5.125% | 02/15/2023 | 150,000 | 146,250 | ||||||||||||
| CCO Holdings LLC / CCO Holdings Capital Corp. (Media) |
5.750% | 01/15/2024 | 1,275,000 | 1,284,562 | ||||||||||||
| CCO Holdings LLC / CCO Holdings Capital Corp. (Media) |
5.750% | 09/01/2023 | 325,000 | 325,609 | ||||||||||||
| CCO Holdings LLC / CCO Holdings Capital Corp. (Media) |
(b) | 5.375% | 05/01/2025 | 175,000 | 170,406 | |||||||||||
| CCO Holdings LLC / CCO Holdings Capital Corp. (Media) |
(b) | 5.875% | 05/01/2027 | 150,000 | 146,437 | |||||||||||
| Cequel Communications Holdings I LLC / Cequel Capital Corp. (Media) |
(b) | 6.375% | 09/15/2020 | 350,000 | 347,637 | |||||||||||
| Cequel Communications Holdings I LLC / Cequel Capital Corp. (Media) |
(b) | 5.125% | 12/15/2021 | 750,000 | 681,094 | |||||||||||
| 62 | (continued) |
| Ohio National Fund, Inc. | High Income Bond Portfolio (Continued) |
| Schedule of Investments |
June 30, 2015 (Unaudited) |
| Corporate Bonds (Continued) | Rate | Maturity | Face Amount | Value | ||||||||||||
| CONSUMER DISCRETIONARY (continued) |
||||||||||||||||
| Cequel Communications Holdings I LLC / Cequel Capital Corp. (Media) |
(b) | 5.125% | 12/15/2021 | $ | 100,000 | $ | 90,812 | |||||||||
| Clear Channel Worldwide Holdings, Inc. (Media) |
6.500% | 11/15/2022 | 275,000 | 281,531 | ||||||||||||
| Clear Channel Worldwide Holdings, Inc. (Media) |
6.500% | 11/15/2022 | 1,125,000 | 1,171,406 | ||||||||||||
| Crown Media Holdings, Inc. (Media) |
10.500% | 07/15/2019 | 700,000 | 739,375 | ||||||||||||
| Cumulus Media Holdings, Inc. (Media) |
7.750% | 05/01/2019 | 350,000 | 321,125 | ||||||||||||
| DISH DBS Corp. (Media) |
5.875% | 07/15/2022 | 1,600,000 | 1,568,000 | ||||||||||||
| Entercom Radio LLC (Media) |
10.500% | 12/01/2019 | 500,000 | 536,250 | ||||||||||||
| Expo Event Transco, Inc. (Media) |
(b) | 9.000% | 06/15/2021 | 800,000 | 828,000 | |||||||||||
| Gray Television, Inc. (Media) |
7.500% | 10/01/2020 | 700,000 | 742,000 | ||||||||||||
| Igloo Holdings Corp. (Media) |
(b)(d) | 8.250% | 12/15/2017 | 875,000 | 885,937 | |||||||||||
| iHeartCommunications, Inc. (Media) |
9.000% | 03/01/2021 | 700,000 | 637,875 | ||||||||||||
| Intelsat Jackson Holdings SA (Media) |
6.625% | 12/15/2022 | 825,000 | 755,906 | ||||||||||||
| Intelsat Jackson Holdings SA (Media) |
5.500% | 08/01/2023 | 550,000 | 486,750 | ||||||||||||
| Intelsat Luxembourg SA (Media) |
7.750% | 06/01/2021 | 325,000 | 271,375 | ||||||||||||
| Intelsat Luxembourg SA (Media) |
8.125% | 06/01/2023 | 750,000 | 615,000 | ||||||||||||
| Lamar Media Corp. (Media) |
5.875% | 02/01/2022 | 250,000 | 258,750 | ||||||||||||
| Lamar Media Corp. (Media) |
5.000% | 05/01/2023 | 725,000 | 717,750 | ||||||||||||
| LIN Television Corp. (Media) |
(b) | 5.875% | 11/15/2022 | 150,000 | 151,875 | |||||||||||
| Nexstar Broadcasting, Inc. (Media) |
(b) | 6.125% | 02/15/2022 | 475,000 | 482,125 | |||||||||||
| Nielsen Co. Luxembourg SARL / The (Media) |
(b) | 5.500% | 10/01/2021 | 175,000 | 176,750 | |||||||||||
| Nielsen Finance LLC / Nielsen Finance Co. (Media) |
4.500% | 10/01/2020 | 450,000 | 447,750 | ||||||||||||
| Nielsen Finance LLC / Nielsen Finance Co. (Media) |
(b) | 5.000% | 04/15/2022 | 1,025,000 | 1,007,062 | |||||||||||
| Numericable Group SA (Media) |
(b) | 6.000% | 05/15/2022 | 575,000 | 566,734 | |||||||||||
| Numericable Group SA (Media) |
(b) | 6.250% | 05/15/2024 | 400,000 | 393,500 | |||||||||||
| Outfront Media Capital LLC / Outfront Media Capital Corp. (Media) |
5.625% | 02/15/2024 | 75,000 | 76,687 | ||||||||||||
| Outfront Media Capital LLC / Outfront Media Capital Corp. (Media) |
5.250% | 02/15/2022 | 100,000 | 101,250 | ||||||||||||
| Radio One, Inc. (Media) |
(b) | 9.250% | 02/15/2020 | 650,000 | 591,500 | |||||||||||
| Radio One, Inc. (Media) |
(b) | 7.375% | 04/15/2022 | 475,000 | 465,500 | |||||||||||
| Regal Entertainment Group (Media) |
5.750% | 02/01/2025 | 550,000 | 536,937 | ||||||||||||
| Regal Entertainment Group (Media) |
5.750% | 03/15/2022 | 100,000 | 101,120 | ||||||||||||
| Sinclair Television Group, Inc. (Media) |
(b) | 5.625% | 08/01/2024 | 875,000 | 855,312 | |||||||||||
| Sirius XM Radio, Inc. (Media) |
(b) | 4.250% | 05/15/2020 | 150,000 | 149,250 | |||||||||||
| Sirius XM Radio, Inc. (Media) |
(b) | 4.625% | 05/15/2023 | 1,400,000 | 1,314,250 | |||||||||||
| Sirius XM Radio, Inc. (Media) |
(b) | 6.000% | 07/15/2024 | 275,000 | 277,750 | |||||||||||
| Sirius XM Radio, Inc. (Media) |
(b) | 5.375% | 04/15/2025 | 150,000 | 145,125 | |||||||||||
| Gannett Co., Inc. (Media) |
(b) | 5.500% | 09/15/2024 | 75,000 | 74,250 | |||||||||||
| Gannett Co., Inc. (Media) |
(b) | 4.875% | 09/15/2021 | 75,000 | 74,437 | |||||||||||
| TEGNA, Inc. (Media) |
6.375% | 10/15/2023 | 775,000 | 806,969 | ||||||||||||
| Time, Inc. (Media) |
(b) | 5.750% | 04/15/2022 | 475,000 | 459,562 | |||||||||||
| Townsquare Media, Inc. (Media) |
(b) | 6.500% | 04/01/2023 | 500,000 | 495,000 | |||||||||||
| Tribune Media Co. (Media) |
(b) | 5.875% | 07/15/2022 | 600,000 | 604,500 | |||||||||||
| Unitymedia KabelBW GmbH (Media) |
(b) | 6.125% | 01/15/2025 | 425,000 | 444,125 | |||||||||||
| Unitymedia Hessen GmbH & Co. KG / Unitymedia NRW GmbH (Media) |
(b) | 5.500% | 01/15/2023 | 475,000 | 484,203 | |||||||||||
| Lynx II Corp. (Media) |
(b) | 6.375% | 04/15/2023 | 475,000 | 491,031 | |||||||||||
| Virgin Media Finance PLC (Media) |
(b) | 5.750% | 01/15/2025 | 200,000 | 200,000 | |||||||||||
| Virgin Media Secured Finance PLC (Media) |
(b) | 5.250% | 01/15/2026 | 425,000 | 410,656 | |||||||||||
| Family Tree Escrow, LLC (Multiline Retail) |
(b) | 5.250% | 03/01/2020 | 75,000 | 78,469 | |||||||||||
| Family Tree Escrow, LLC (Multiline Retail) |
(b) | 5.750% | 03/01/2023 | 325,000 | 339,625 | |||||||||||
| Academy Ltd. / Academy Finance Corp. (Specialty Retail) |
(b) | 9.250% | 08/01/2019 | 800,000 | 840,560 | |||||||||||
| Argos Merger Sub, Inc. (Specialty Retail) |
(b) | 7.125% | 03/15/2023 | 925,000 | 968,937 | |||||||||||
| Jo-Ann Stores Holdings, Inc. (Specialty Retail) |
(b)(d) | 9.750% | 10/15/2019 | 375,000 | 335,625 | |||||||||||
| Jo-Ann Stores, Inc. (Specialty Retail) |
(b) | 8.125% | 03/15/2019 | 250,000 | 235,312 | |||||||||||
| L Brands, Inc. (Specialty Retail) |
5.625% | 02/15/2022 | 725,000 | 763,062 | ||||||||||||
| Michaels Stores, Inc. (Specialty Retail) |
(b) | 5.875% | 12/15/2020 | 925,000 | 966,625 | |||||||||||
| Neiman Marcus Group LTD, Inc. (Specialty Retail) |
(b)(d) | 8.750% | 10/15/2021 | 750,000 | 805,312 | |||||||||||
| New Academy Finance Co. LLC / New Academy Finance Corp. (Specialty Retail) |
(b)(d) | 8.000% | 06/15/2018 | 750,000 | 757,500 | |||||||||||
| Party City Holdings, Inc. (Specialty Retail) |
8.875% | 08/01/2020 | 550,000 | 587,125 | ||||||||||||
| Petco Animal Supplies, Inc. (Specialty Retail) |
(b) | 9.250% | 12/01/2018 | 525,000 | 548,625 | |||||||||||
| Petco Holdings, Inc. (Specialty Retail) |
(b)(d) | 8.500% | 10/15/2017 | 750,000 | 770,625 | |||||||||||
| PVH Corp. (Textiles, Apparel & Luxury Goods) |
4.500% | 12/15/2022 | 275,000 | 272,250 | ||||||||||||
| Springs Industries, Inc. (Textiles, Apparel & Luxury Goods) |
6.250% | 06/01/2021 | 625,000 | 610,937 | ||||||||||||
|
|
|
|||||||||||||||
| 67,165,736 | ||||||||||||||||
|
|
|
|||||||||||||||
| CONSUMER STAPLES – 3.9% |
||||||||||||||||
| Rite Aid Corp. (Food & Staples Retailing) |
(b) | 6.125% | 04/01/2023 | 475,000 | 489,250 | |||||||||||
| B&G Foods, Inc. (Food Products) |
4.625% | 06/01/2021 | 250,000 | 246,250 | ||||||||||||
| Dean Foods Co. (Food Products) |
(b) | 6.500% | 03/15/2023 | 475,000 | 484,500 | |||||||||||
| Hearthside Group Holdings LLC / Hearthside Finance Co. (Food Products) |
(b) | 6.500% | 05/01/2022 | 1,100,000 | 1,050,500 | |||||||||||
| Kraft Heinz Foods Co. (Food Products) |
4.250% | 10/15/2020 | 1,100,000 | 1,123,375 | ||||||||||||
| 63 | (continued) |
| Ohio National Fund, Inc. | High Income Bond Portfolio (Continued) |
| Schedule of Investments |
June 30, 2015 (Unaudited) |
| Corporate Bonds (Continued) | Rate | Maturity | Face Amount | Value | ||||||||||||
| CONSUMER STAPLES (continued) |
||||||||||||||||
| H.J. Heinz Co. (Food Products) |
(b) | 4.875% | 02/15/2025 | $ | 275,000 | $ | 299,406 | |||||||||
| Pinnacle Foods Finance LLC / Pinnacle Foods Finance Corp. (Food Products) |
4.875% | 05/01/2021 | 1,175,000 | 1,157,375 | ||||||||||||
| Smithfield Foods, Inc. (Food Products) |
6.625% | 08/15/2022 | 1,050,000 | 1,120,875 | ||||||||||||
| Sun Merger Sub., Inc. (Food Products) |
(b) | 5.875% | 08/01/2021 | 100,000 | 103,250 | |||||||||||
| TreeHouse Foods, Inc. (Food Products) |
4.875% | 03/15/2022 | 75,000 | 75,562 | ||||||||||||
| Spectrum Brands, Inc. (Household Products) |
6.750% | 03/15/2020 | 650,000 | 684,450 | ||||||||||||
| Spectrum Brands, Inc. (Household Products) |
(b) | 6.125% | 12/15/2024 | 175,000 | 181,562 | |||||||||||
| Spectrum Brands, Inc. (Household Products) |
(b) | 5.750% | 07/15/2025 | 200,000 | 203,000 | |||||||||||
| First Quality Finance Co., Inc. (Personal Products) |
(b) | 4.625% | 05/15/2021 | 675,000 | 631,125 | |||||||||||
| Prestige Brands, Inc. (Personal Products) |
8.125% | 02/01/2020 | 175,000 | 186,812 | ||||||||||||
| Prestige Brands, Inc. (Personal Products) |
(b) | 5.375% | 12/15/2021 | 625,000 | 625,000 | |||||||||||
|
|
|
|||||||||||||||
| 8,662,292 | ||||||||||||||||
|
|
|
|||||||||||||||
| ENERGY – 11.2% |
||||||||||||||||
| CGG SA (Energy Equip. & Svs.) |
6.875% | 01/15/2022 | 400,000 | 332,000 | ||||||||||||
| Chaparral Energy, Inc. (Energy Equip. & Svs.) |
7.625% | 11/15/2022 | 200,000 | 144,000 | ||||||||||||
| FTS International, Inc. (Energy Equip. & Svs.) |
6.250% | 05/01/2022 | 375,000 | 275,625 | ||||||||||||
| Antero Resources Corp. (Oil, Gas & Consumable Fuels) |
6.000% | 12/01/2020 | 775,000 | 782,750 | ||||||||||||
| Antero Resources Corp. (Oil, Gas & Consumable Fuels) |
5.125% | 12/01/2022 | 200,000 | 189,000 | ||||||||||||
| Antero Resources Corp. (Oil, Gas & Consumable Fuels) |
(b) | 5.625% | 06/01/2023 | 125,000 | 120,781 | |||||||||||
| Approach Resources, Inc. (Oil, Gas & Consumable Fuels) |
7.000% | 06/15/2021 | 650,000 | 585,000 | ||||||||||||
| Blue Racer Midstream LLC / Blue Racer Finance Corp. (Oil, Gas & Consumable Fuels) |
(b) | 6.125% | 11/15/2022 | 325,000 | 334,750 | |||||||||||
| BreitBurn Energy Partners LP / BreitBurn Finance Corp. (Oil, Gas & Consumable Fuels) |
7.875% | 04/15/2022 | 225,000 | 187,875 | ||||||||||||
| California Resources Corp. (Oil, Gas & Consumable Fuels) |
6.000% | 11/15/2024 | 725,000 | 622,594 | ||||||||||||
| California Resources Corp. (Oil, Gas & Consumable Fuels) |
5.500% | 09/15/2021 | 150,000 | 129,937 | ||||||||||||
| Carrizo Oil & Gas, Inc. (Oil, Gas & Consumable Fuels) |
7.500% | 09/15/2020 | 575,000 | 605,187 | ||||||||||||
| Carrizo Oil & Gas, Inc. (Oil, Gas & Consumable Fuels) |
6.250% | 04/15/2023 | 100,000 | 100,250 | ||||||||||||
| Chesapeake Energy Corp. (Oil, Gas & Consumable Fuels) |
6.875% | 11/15/2020 | 675,000 | 658,125 | ||||||||||||
| Chesapeake Energy Corp. (Oil, Gas & Consumable Fuels) |
5.375% | 06/15/2021 | 525,000 | 475,125 | ||||||||||||
| Crestwood Midstream Partners LP / Crestwood Midstream Finance Corp. (Oil, Gas & Consumable Fuels) |
(b) | 6.250% | 04/01/2023 | 450,000 | 466,875 | |||||||||||
| CrownRock LP / CrownRock Finance, Inc. (Oil, Gas & Consumable Fuels) |
(b) | 7.750% | 02/15/2023 | 175,000 | 186,375 | |||||||||||
| CVR Refining LLC / Coffeyville Finance, Inc. (Oil, Gas & Consumable Fuels) |
6.500% | 11/01/2022 | 325,000 | 325,000 | ||||||||||||
| Energy Transfer Equity LP (Oil, Gas & Consumable Fuels) |
5.875% | 01/15/2024 | 1,725,000 | 1,788,825 | ||||||||||||
| Energy XXI Gulf Coast, Inc. (Oil, Gas & Consumable Fuels) |
7.500% | 12/15/2021 | 350,000 | 113,750 | ||||||||||||
| Energy XXI Gulf Coast, Inc. (Oil, Gas & Consumable Fuels) |
6.875% | 03/15/2024 | 125,000 | 40,625 | ||||||||||||
| EP Energy LLC / Everest Acquisition Finance, Inc. (Oil, Gas & Consumable Fuels) |
9.375% | 05/01/2020 | 350,000 | 374,937 | ||||||||||||
| EP Energy LLC / Everest Acquisition Finance, Inc. (Oil, Gas & Consumable Fuels) |
7.750% | 09/01/2022 | 100,000 | 105,000 | ||||||||||||
| EP Energy LLC / Everest Acquisition Finance, Inc. (Oil, Gas & Consumable Fuels) |
(b) | 6.375% | 06/15/2023 | 200,000 | 200,500 | |||||||||||
| Gulfport Energy Corp. (Oil, Gas & Consumable Fuels) |
7.750% | 11/01/2020 | 350,000 | 366,625 | ||||||||||||
| Gulfport Energy Corp. (Oil, Gas & Consumable Fuels) |
(b) | 6.625% | 05/01/2023 | 225,000 | 227,812 | |||||||||||
| Halcon Resources Corp. (Oil, Gas & Consumable Fuels) |
(b) | 8.625% | 02/01/2020 | 200,000 | 197,500 | |||||||||||
| Hiland Partners LP / Hiland Partners Finance Corp. (Oil, Gas & Consumable Fuels) |
(b) | 5.500% | 05/15/2022 | 250,000 | 260,000 | |||||||||||
| Holly Energy Partners LP / Holly Energy Finance Corp. (Oil, Gas & Consumable Fuels) |
6.500% | 03/01/2020 | 475,000 | 473,813 | ||||||||||||
| Kinder Morgan, Inc. (Oil, Gas & Consumable Fuels) |
(b) | 5.625% | 11/15/2023 | 550,000 | 584,335 | |||||||||||
| Laredo Petroleum, Inc. (Oil, Gas & Consumable Fuels) |
5.625% | 01/15/2022 | 225,000 | 222,750 | ||||||||||||
| Laredo Petroleum, Inc. (Oil, Gas & Consumable Fuels) |
7.375% | 05/01/2022 | 100,000 | 105,250 | ||||||||||||
| Laredo Petroleum, Inc. (Oil, Gas & Consumable Fuels) |
6.250% | 03/15/2023 | 125,000 | 127,187 | ||||||||||||
| Legacy Reserves LP / Legacy Reserves Finance Corp. (Oil, Gas & Consumable Fuels) |
6.625% | 12/01/2021 | 850,000 | 688,500 | ||||||||||||
| Linn Energy LLC / Linn Energy Finance Corp. (Oil, Gas & Consumable Fuels) |
8.625% | 04/15/2020 | 350,000 | 287,073 | ||||||||||||
| Linn Energy LLC / Linn Energy Finance Corp. (Oil, Gas & Consumable Fuels) |
7.750% | 02/01/2021 | 300,000 | 233,250 | ||||||||||||
| Linn Energy LLC / Linn Energy Finance Corp. (Oil, Gas & Consumable Fuels) |
6.500% | 09/15/2021 | 125,000 | 93,125 | ||||||||||||
| MarkWest Energy Partners LP / MarkWest Energy Finance Corp. (Oil, Gas & Consumable Fuels) |
5.500% | 02/15/2023 | 600,000 | 618,000 | ||||||||||||
| MarkWest Energy Partners LP / MarkWest Energy Finance Corp. (Oil, Gas & Consumable Fuels) |
4.500% | 07/15/2023 | 325,000 | 318,500 | ||||||||||||
| MarkWest Energy Partners LP / MarkWest Energy Finance Corp. (Oil, Gas & Consumable Fuels) |
4.875% | 12/01/2024 | 75,000 | 73,312 | ||||||||||||
| Northern Oil and Gas, Inc. (Oil, Gas & Consumable Fuels) |
8.000% | 06/01/2020 | 850,000 | 765,000 | ||||||||||||
| Oasis Petroleum, Inc. (Oil, Gas & Consumable Fuels) |
6.875% | 03/15/2022 | 625,000 | 634,375 | ||||||||||||
| Range Resources Corp. (Oil, Gas & Consumable Fuels) |
(b) | 4.875% | 05/15/2025 | 622,000 | 604,211 | |||||||||||
| Regency Energy Partners LP / Regency Energy Finance Corp. (Oil, Gas & Consumable Fuels) |
5.500% | 04/15/2023 | 175,000 | 178,115 | ||||||||||||
| Regency Energy Partners LP / Regency Energy Finance Corp. (Oil, Gas & Consumable Fuels) |
4.500% | 11/01/2023 | 225,000 | 217,125 | ||||||||||||
| Regency Energy Partners LP / Regency Energy Finance Corp. (Oil, Gas & Consumable Fuels) |
5.875% | 03/01/2022 | 150,000 | 159,516 | ||||||||||||
| Regency Energy Partners LP / Regency Energy Finance Corp. (Oil, Gas & Consumable Fuels) |
5.000% | 10/01/2022 | 200,000 | 202,935 | ||||||||||||
| Rice Energy, Inc. (Oil, Gas & Consumable Fuels) |
6.250% | 05/01/2022 | 500,000 | 496,250 | ||||||||||||
| Rice Energy, Inc. (Oil, Gas & Consumable Fuels) |
(b) | 7.250% | 05/01/2023 | 75,000 | 76,875 | |||||||||||
| Rose Rock Midstream LP / Rose Rock Finance Corp. (Oil, Gas & Consumable Fuels) |
5.625% | 07/15/2022 | 600,000 | 586,500 | ||||||||||||
| Rose Rock Midstream LP / Rose Rock Finance Corp. (Oil, Gas & Consumable Fuels) |
(b) | 5.625% | 11/15/2023 | 225,000 | 217,687 | |||||||||||
| RSP Permian, Inc. (Oil, Gas & Consumable Fuels) |
(b) | 6.625% | 10/01/2022 | 275,000 | 281,187 | |||||||||||
| Sabine Pass Liquefaction, LLC (Oil, Gas & Consumable Fuels) |
5.625% | 02/01/2021 | 950,000 | 969,000 | ||||||||||||
| Sabine Pass Liquefaction, LLC (Oil, Gas & Consumable Fuels) |
5.625% | 04/15/2023 | 225,000 | 224,226 | ||||||||||||
| Sabine Pass Liquefaction, LLC (Oil, Gas & Consumable Fuels) |
6.250% | 03/15/2022 | 300,000 | 310,500 | ||||||||||||
| 64 | (continued) |
| Ohio National Fund, Inc. | High Income Bond Portfolio (Continued) |
| Schedule of Investments |
June 30, 2015 (Unaudited) |
| Corporate Bonds (Continued) | Rate | Maturity | Face Amount | Value | ||||||||||||
| ENERGY (continued) |
||||||||||||||||
| Sabine Pass Liquefaction, LLC (Oil, Gas & Consumable Fuels) |
(b) | 5.625% | 03/01/2025 | $ | 375,000 | $ | 371,250 | |||||||||
| SandRidge Energy, Inc. (Oil, Gas & Consumable Fuels) |
7.500% | 03/15/2021 | 50,000 | 22,000 | ||||||||||||
| SandRidge Energy, Inc. (Oil, Gas & Consumable Fuels) |
8.125% | 10/15/2022 | 500,000 | 213,750 | ||||||||||||
| SandRidge Energy, Inc. (Oil, Gas & Consumable Fuels) |
7.500% | 02/15/2023 | 200,000 | 84,540 | ||||||||||||
| SM Energy Co. (Oil, Gas & Consumable Fuels) |
5.000% | 01/15/2024 | 275,000 | 260,562 | ||||||||||||
| SM Energy Co. (Oil, Gas & Consumable Fuels) |
5.625% | 06/01/2025 | 150,000 | 148,470 | ||||||||||||
| Summit Midstream Holdings LLC / Summit Midstream Finance Corp. (Oil, Gas & Consumable Fuels) |
5.500% | 08/15/2022 | 650,000 | 620,750 | ||||||||||||
| Targa Resources Partners LP / Targa Resources Partners Finance Corp. (Oil, Gas & Consumable Fuels) |
5.250% | 05/01/2023 | 350,000 | 346,500 | ||||||||||||
| Targa Resources Partners LP / Targa Resources Partners Finance Corp. (Oil, Gas & Consumable Fuels) |
(b) | 5.000% | 01/15/2018 | 200,000 | 204,500 | |||||||||||
| Tesoro Corp. (Oil, Gas & Consumable Fuels) |
5.125% | 04/01/2024 | 425,000 | 427,125 | ||||||||||||
| Tesoro Logistics LP / Tesoro Logistics Finance Corp. (Oil, Gas & Consumable Fuels) |
6.125% | 10/15/2021 | 325,000 | 338,812 | ||||||||||||
| Tesoro Logistics LP / Tesoro Logistics Finance Corp. (Oil, Gas & Consumable Fuels) |
5.875% | 10/01/2020 | 547,000 | 562,042 | ||||||||||||
| Tesoro Logistics LP / Tesoro Logistics Finance Corp. (Oil, Gas & Consumable Fuels) |
(b) | 6.250% | 10/15/2022 | 75,000 | 77,625 | |||||||||||
| Tesoro Logistics LP / Tesoro Logistics Finance Corp. (Oil, Gas & Consumable Fuels) |
(b) | 5.500% | 10/15/2019 | 50,000 | 51,875 | |||||||||||
| W&T Offshore, Inc. (Oil, Gas & Consumable Fuels) |
8.500% | 06/15/2019 | 775,000 | 545,135 | ||||||||||||
| Western Refining Logistics LP / WNRL Finance Corp. (Oil, Gas & Consumable Fuels) |
(b) | 7.500% | 02/15/2023 | 300,000 | 309,000 | |||||||||||
| Whiting Petroleum Corp. (Oil, Gas & Consumable Fuels) |
(b) | 6.250% | 04/01/2023 | 425,000 | 421,812 | |||||||||||
| Williams Partners LP / ACMP Finance Corp. (Oil, Gas & Consumable Fuels) |
6.125% | 07/15/2022 | 225,000 | 237,937 | ||||||||||||
|
|
|
|||||||||||||||
| 25,189,105 | ||||||||||||||||
|
|
|
|||||||||||||||
| FINANCIALS – 3.2% |
||||||||||||||||
| CIT Group, Inc. (Banks) |
5.250% | 03/15/2018 | 675,000 | 697,781 | ||||||||||||
| CIT Group, Inc. (Banks) |
5.375% | 05/15/2020 | 225,000 | 234,562 | ||||||||||||
| CIT Group, Inc. (Banks) |
5.000% | 08/01/2023 | 475,000 | 467,875 | ||||||||||||
| Ally Financial, Inc. (Consumer Finance) |
4.750% | 09/10/2018 | 300,000 | 309,375 | ||||||||||||
| Ally Financial, Inc. (Consumer Finance) |
4.125% | 02/13/2022 | 475,000 | 456,000 | ||||||||||||
| Ally Financial, Inc. (Consumer Finance) |
4.125% | 03/30/2020 | 125,000 | 124,765 | ||||||||||||
| Ally Financial, Inc. (Consumer Finance) |
4.625% | 03/30/2025 | 400,000 | 382,200 | ||||||||||||
| Ally Financial, Inc. (Consumer Finance) |
4.625% | 05/19/2022 | 250,000 | 246,875 | ||||||||||||
| Interactive Data Corp. (Diversified Financial Svs.) |
(b) | 5.875% | 04/15/2019 | 700,000 | 703,500 | |||||||||||
| MSCI, Inc. (Diversified Financial Svs.) |
(b) | 5.250% | 11/15/2024 | 150,000 | 151,875 | |||||||||||
| Hockey Merger Sub 2, Inc. (Insurance) |
(b) | 7.875% | 10/01/2021 | 800,000 | 816,000 | |||||||||||
| Onex York Acquisition Corp. (Insurance) |
(b) | 8.500% | 10/01/2022 | 325,000 | 286,406 | |||||||||||
| Iron Mountain, Inc. (Real Estate Investment Trusts) |
7.750% | 10/01/2019 | 525,000 | 548,625 | ||||||||||||
| Outfront Media Capital LLC / Outfront Media Capital Corp. (Real Estate Investment Trusts) |
(b) | 5.625% | 02/15/2024 | 225,000 | 230,062 | |||||||||||
| RHP Hotel Properties LP / RHP Finance Corp. (Real Estate Investment Trusts) |
(b) | 5.000% | 04/15/2023 | 100,000 | 98,000 | |||||||||||
| Hub Holdings, LLC / Hub Holdings Finance, Inc. (Real Estate Mgmt. & Development) |
(b)(d) | 8.125% | 07/15/2019 | 600,000 | 597,000 | |||||||||||
| Quicken Loans, Inc. (Thrifts & Mortgage Finance) |
(b) | 5.750% | 05/01/2025 | 775,000 | 742,063 | |||||||||||
|
|
|
|||||||||||||||
| 7,092,964 | ||||||||||||||||
|
|
|
|||||||||||||||
| HEALTH CARE – 12.1% |
||||||||||||||||
| Grifols Worldwide Operations Ltd. (Biotechnology) |
5.250% | 04/01/2022 | 675,000 | 676,688 | ||||||||||||
| Crimson Merger Sub., Inc. (Health Care Equip. & Supplies) |
(b) | 6.625% | 05/15/2022 | 1,775,000 | 1,566,438 | |||||||||||
| Hologic, Inc. (Health Care Equip. & Supplies) |
6.250% | 08/01/2020 | 525,000 | 543,060 | ||||||||||||
| Hologic, Inc. (Health Care Equip. & Supplies) |
(b) | 5.250% | 07/15/2022 | 300,000 | 306,375 | |||||||||||
| Sterigenics-Nordion Holdings LLC (Health Care Equip. & Supplies) |
(b) | 6.500% | 05/15/2023 | 625,000 | 628,125 | |||||||||||
| Teleflex, Inc. (Health Care Equip. & Supplies) |
5.250% | 06/15/2024 | 275,000 | 278,493 | ||||||||||||
| VWR Funding, Inc. (Health Care Equip. & Supplies) |
7.250% | 09/15/2017 | 850,000 | 878,688 | ||||||||||||
| Air Medical Merger Sub Corp. (Health Care Providers & Svs.) |
(b) | 6.375% | 05/15/2023 | 575,000 | 540,500 | |||||||||||
| Amsurg Corp. (Health Care Providers & Svs.) |
5.625% | 07/15/2022 | 675,000 | 680,906 | ||||||||||||
| CHS / Community Health Systems, Inc. (Health Care Providers & Svs.) |
6.875% | 02/01/2022 | 1,175,000 | 1,241,094 | ||||||||||||
| CHS / Community Health Systems, Inc. (Health Care Providers & Svs.) |
5.125% | 08/01/2021 | 300,000 | 305,625 | ||||||||||||
| DaVita HealthCare Partners, Inc. (Health Care Providers & Svs.) |
5.750% | 08/15/2022 | 350,000 | 371,000 | ||||||||||||
| DaVita HealthCare Partners, Inc. (Health Care Providers & Svs.) |
5.125% | 07/15/2024 | 450,000 | 442,406 | ||||||||||||
| Envision Healthcare Corp. (Health Care Providers & Svs.) |
(b) | 5.125% | 07/01/2022 | 875,000 | 881,563 | |||||||||||
| HCA, Inc. (Health Care Providers & Svs.) |
6.500% | 02/15/2020 | 275,000 | 307,313 | ||||||||||||
| HCA, Inc. (Health Care Providers & Svs.) |
5.875% | 05/01/2023 | 275,000 | 292,188 | ||||||||||||
| HCA, Inc. (Health Care Providers & Svs.) |
5.000% | 03/15/2024 | 2,175,000 | 2,213,063 | ||||||||||||
| HCA, Inc. (Health Care Providers & Svs.) |
5.250% | 04/15/2025 | 450,000 | 466,031 | ||||||||||||
| HCA, Inc. (Health Care Providers & Svs.) |
5.375% | 02/01/2025 | 1,200,000 | 1,212,000 | ||||||||||||
| Jaguar Holding Co. I (Health Care Providers & Svs.) |
(b)(d) | 9.375% | 10/15/2017 | 725,000 | 740,406 | |||||||||||
| Jaguar Holding Co. II / Jaguar Merger Sub, Inc. (Health Care Providers & Svs.) |
(b) | 9.500% | 12/01/2019 | 800,000 | 852,000 | |||||||||||
| LifePoint Hospitals, Inc. (Health Care Providers & Svs.) |
5.500% | 12/01/2021 | 750,000 | 774,375 | ||||||||||||
| MPH Acquisition Holdings LLC (Health Care Providers & Svs.) |
(b) | 6.625% | 04/01/2022 | 1,300,000 | 1,327,625 | |||||||||||
| Omnicare, Inc. (Health Care Providers & Svs.) |
4.750% | 12/01/2022 | 100,000 | 106,000 | ||||||||||||
| Omnicare, Inc. (Health Care Providers & Svs.) |
5.000% | 12/01/2024 | 50,000 | 53,750 | ||||||||||||
| Surgical Care Affiliates, Inc. (Health Care Providers & Svs.) |
(b) | 6.000% | 04/01/2023 | 475,000 | 475,000 | |||||||||||
| Tenet Healthcare Corp. (Health Care Providers & Svs.) |
4.500% | 04/01/2021 | 350,000 | 346,500 | ||||||||||||
| 65 | (continued) |
| Ohio National Fund, Inc. | High Income Bond Portfolio (Continued) |
| Schedule of Investments |
June 30, 2015 (Unaudited) |
| Corporate Bonds (Continued) | Rate | Maturity | Face Amount | Value | ||||||||||||
| HEALTH CARE (continued) |
||||||||||||||||
| Tenet Healthcare Corp. (Health Care Providers & Svs.) |
8.125% | 04/01/2022 | $ | 900,000 | $ | 985,500 | ||||||||||
| Tenet Healthcare Corp. (Health Care Providers & Svs.) |
4.375% | 10/01/2021 | 850,000 | 830,875 | ||||||||||||
| Tenet Healthcare Corp. (Health Care Providers & Svs.) |
(b) | 6.750% | 06/15/2023 | 300,000 | 306,188 | |||||||||||
| United Surgical Partners International, Inc. (Health Care Providers & Svs.) |
9.000% | 04/01/2020 | 850,000 | 907,375 | ||||||||||||
| Emdeon, Inc. (Health Care Technology) |
11.000% | 12/31/2019 | 400,000 | 434,000 | ||||||||||||
| Truven Health Analytics, Inc. (Health Care Technology) |
10.625% | 06/01/2020 | 600,000 | 628,500 | ||||||||||||
| Quintiles Transnational Corp. (Life Sciences Tools & Svs.) |
(b) | 4.875% | 05/15/2023 | 250,000 | 251,250 | |||||||||||
| Endo Finance LLC / Endo Ltd. / Endo Finco, Inc. (Pharmaceuticals) |
(b) | 6.000% | 02/01/2025 | 625,000 | 635,156 | |||||||||||
| Endo Finance LLC / Endo Ltd. / Endo Finco, Inc. (Pharmaceuticals) |
(b) | 6.000% | 07/15/2023 | 250,000 | 255,938 | |||||||||||
| Mallinckrodt International Finance SA (Pharmaceuticals) |
4.750% | 04/15/2023 | 175,000 | 163,297 | ||||||||||||
| Mallinckrodt International Finance SA / Mallinckrodt CB LLC (Pharmaceuticals) |
(b) | 4.875% | 04/15/2020 | 100,000 | 101,755 | |||||||||||
| Mallinckrodt International Finance SA / Mallinckrodt CB LLC (Pharmaceuticals) |
(b) | 5.500% | 04/15/2025 | 200,000 | 194,000 | |||||||||||
| VPII Escrow Corp. (Pharmaceuticals) |
(b) | 7.500% | 07/15/2021 | 1,150,000 | 1,243,438 | |||||||||||
| Valeant Pharmaceuticals International, Inc. (Pharmaceuticals) |
(b) | 5.500% | 03/01/2023 | 175,000 | 176,750 | |||||||||||
| VRX Escrow Corp. (Pharmaceuticals) |
(b) | 6.125% | 04/15/2025 | 725,000 | 746,750 | |||||||||||
| VRX Escrow Corp. (Pharmaceuticals) |
(b) | 5.875% | 05/15/2023 | 825,000 | 844,594 | |||||||||||
| VRX Escrow Corp. (Pharmaceuticals) |
(b) | 5.375% | 03/15/2020 | 50,000 | 51,625 | |||||||||||
|
|
|
|||||||||||||||
| 27,264,203 | ||||||||||||||||
|
|
|
|||||||||||||||
| INDUSTRIALS – 11.7% |
||||||||||||||||
| Silver II Borrower / Silver II U.S. Holdings LLC (Aerospace & Defense) |
(b) | 7.750% | 12/15/2020 | 600,000 | 555,000 | |||||||||||
| KLX, Inc. (Aerospace & Defense) |
(b) | 5.875% | 12/01/2022 | 425,000 | 429,203 | |||||||||||
| TransDigm, Inc. (Aerospace & Defense) |
5.500% | 10/15/2020 | 275,000 | 273,281 | ||||||||||||
| TransDigm, Inc. (Aerospace & Defense) |
7.500% | 07/15/2021 | 300,000 | 322,500 | ||||||||||||
| TransDigm, Inc. (Aerospace & Defense) |
6.500% | 07/15/2024 | 475,000 | 469,063 | ||||||||||||
| TransDigm, Inc. (Aerospace & Defense) |
6.000% | 07/15/2022 | 550,000 | 543,125 | ||||||||||||
| TransDigm, Inc. (Aerospace & Defense) |
(b) | 6.500% | 05/15/2025 | 50,000 | 49,500 | |||||||||||
| Allegion U.S. Holding Co., Inc. (Building Products) |
5.750% | 10/01/2021 | 325,000 | 335,563 | ||||||||||||
| CPG Merger Sub. LLC (Building Products) |
(b) | 8.000% | 10/01/2021 | 475,000 | 490,913 | |||||||||||
| Hillman Group, Inc. / The (Building Products) |
(b) | 6.375% | 07/15/2022 | 625,000 | 590,625 | |||||||||||
| Masonite International Corp. (Building Products) |
(b) | 5.625% | 03/15/2023 | 150,000 | 152,438 | |||||||||||
| NCI Building Systems, Inc. (Building Products) |
(b) | 8.250% | 01/15/2023 | 425,000 | 452,625 | |||||||||||
| Nortek, Inc. (Building Products) |
8.500% | 04/15/2021 | 550,000 | 587,125 | ||||||||||||
| USG Corp. (Building Products) |
(b) | 5.875% | 11/01/2021 | 175,000 | 182,875 | |||||||||||
| USG Corp. (Building Products) |
(b) | 5.500% | 03/01/2025 | 50,000 | 49,813 | |||||||||||
| Unifrax I LLC / Unifrax Holding Co. (Building Products) |
(b) | 7.500% | 02/15/2019 | 625,000 | 628,125 | |||||||||||
| Unifrax I LLC / Unifrax Holding Co. (Building Products) |
(b) | 7.500% | 02/15/2019 | 150,000 | 150,750 | |||||||||||
| Aramark Services, Inc. (Commercial Svs. & Supplies) |
5.750% | 03/15/2020 | 1,350,000 | 1,409,400 | ||||||||||||
| Garda World Security Corp. (Commercial Svs. & Supplies) |
(b) | 7.250% | 11/15/2021 | 600,000 | 576,000 | |||||||||||
| Garda World Security Corp. (Commercial Svs. & Supplies) |
(b) | 7.250% | 11/15/2021 | 650,000 | 624,000 | |||||||||||
| Jurassic Holdings III, Inc. (Commercial Svs. & Supplies) |
(b) | 6.875% | 02/15/2021 | 775,000 | 601,594 | |||||||||||
| Multi-Color Corp. (Commercial Svs. & Supplies) |
(b) | 6.125% | 12/01/2022 | 650,000 | 664,625 | |||||||||||
| Southern Graphics, Inc. (Commercial Svs. & Supplies) |
(b) | 8.375% | 10/15/2020 | 1,200,000 | 1,230,000 | |||||||||||
| United Rentals North America, Inc. (Commercial Svs. & Supplies) |
6.125% | 06/15/2023 | 100,000 | 102,125 | ||||||||||||
| United Rentals North America, Inc. (Commercial Svs. & Supplies) |
7.375% | 05/15/2020 | 100,000 | 106,699 | ||||||||||||
| United Rentals North America, Inc. (Commercial Svs. & Supplies) |
5.750% | 11/15/2024 | 100,000 | 98,500 | ||||||||||||
| United Rentals North America, Inc. (Commercial Svs. & Supplies) |
4.625% | 07/15/2023 | 225,000 | 220,635 | ||||||||||||
| United Rentals North America, Inc. (Commercial Svs. & Supplies) |
5.500% | 07/15/2025 | 750,000 | 724,688 | ||||||||||||
| EnerSys (Electrical Equip.) |
(b) | 5.000% | 04/30/2023 | 225,000 | 222,539 | |||||||||||
| Sensata Technologies BV (Electrical Equip.) |
(b) | 5.625% | 11/01/2024 | 225,000 | 231,750 | |||||||||||
| Sensata Technologies BV (Electrical Equip.) |
(b) | 5.000% | 10/01/2025 | 300,000 | 292,125 | |||||||||||
| ATS Automation Tooling Systems, Inc. (Machinery) |
(b) | 6.500% | 06/15/2023 | 300,000 | 306,375 | |||||||||||
| Dematic SA / DH Services Luxembourg Sarl (Machinery) |
(b) | 7.750% | 12/15/2020 | 1,100,000 | 1,141,250 | |||||||||||
| Gardner Denver, Inc. (Machinery) |
(b) | 6.875% | 08/15/2021 | 800,000 | 729,000 | |||||||||||
| Milacron LLC / Mcron Finance Corp. (Machinery) |
(b) | 7.750% | 02/15/2021 | 225,000 | 231,750 | |||||||||||
| Schaeffler Finance BV (Machinery) |
(b) | 4.750% | 05/15/2021 | 375,000 | 376,875 | |||||||||||
| Schaeffler Finance BV (Machinery) |
(b) | 4.250% | 05/15/2021 | 250,000 | 243,750 | |||||||||||
| Schaeffler Finance BV (Machinery) |
(b) | 4.750% | 05/15/2023 | 200,000 | 195,000 | |||||||||||
| Schaeffler Holding Finance BV (Machinery) |
(b)(d) | 6.875% | 08/15/2018 | 475,000 | 491,625 | |||||||||||
| Schaeffler Holding Finance BV (Machinery) |
(b)(d) | 6.750% | 11/15/2022 | 400,000 | 431,500 | |||||||||||
| Anna Merger Sub., Inc. (Professional Svs.) |
(b) | 7.750% | 10/01/2022 | 1,325,000 | 1,334,938 | |||||||||||
| IHS, Inc. (Professional Svs.) |
(b) | 5.000% | 11/01/2022 | 175,000 | 173,906 | |||||||||||
| TransUnion (Professional Svs.) |
(d) | 9.625% | 06/15/2018 | 1,125,000 | 1,128,150 | |||||||||||
| TransUnion (Professional Svs.) |
8.125% | 06/15/2018 | 525,000 | 536,550 | ||||||||||||
| Hertz Corp. / The (Road & Rail) |
6.750% | 04/15/2019 | 625,000 | 644,938 | ||||||||||||
| Hertz Corp. / The (Road & Rail) |
6.250% | 10/15/2022 | 375,000 | 380,625 | ||||||||||||
| AerCap Ireland Capital Ltd. / AerCap Global Aviation Trust (Trading Companies & Distributors) |
4.625% | 07/01/2022 | 150,000 | 150,188 | ||||||||||||
| American Builders & Contractors Supply Co., Inc. (Trading Companies & Distributors) |
(b) | 5.625% | 04/15/2021 | 625,000 | 635,938 | |||||||||||
| HD Supply, Inc. (Trading Companies & Distributors) |
7.500% | 07/15/2020 | 50,000 | 52,875 | ||||||||||||
| 66 | (continued) |
| Ohio National Fund, Inc. | High Income Bond Portfolio (Continued) |
| Schedule of Investments |
June 30, 2015 (Unaudited) |
| Corporate Bonds (Continued) | Rate | Maturity | Face Amount | Value | ||||||||||||
| INDUSTRIALS (continued) |
||||||||||||||||
| HD Supply, Inc. (Trading Companies & Distributors) |
(b) | 5.250% | 12/15/2021 | $ | 75,000 | $ | 76,031 | |||||||||
| Interline Brands, Inc. (Trading Companies & Distributors) |
(d) | 10.000% | 11/15/2018 | 605,000 | 632,225 | |||||||||||
| International Lease Finance Corp. (Trading Companies & Distributors) |
5.875% | 08/15/2022 | 1,075,000 | 1,162,344 | ||||||||||||
| International Lease Finance Corp. (Trading Companies & Distributors) |
4.625% | 04/15/2021 | 1,150,000 | 1,161,500 | ||||||||||||
| Rexel SA (Trading Companies & Distributors) |
(b) | 5.250% | 06/15/2020 | 450,000 | 468,000 | |||||||||||
| WESCO Distribution, Inc. (Trading Companies & Distributors) |
5.375% | 12/15/2021 | 225,000 | 227,250 | ||||||||||||
|
|
|
|||||||||||||||
| 26,279,787 | ||||||||||||||||
|
|
|
|||||||||||||||
| INFORMATION TECHNOLOGY – 10.4% |
||||||||||||||||
| CommScope Holding Co., Inc. (Communications Equip.) |
(b)(d) | 6.625% | 06/01/2020 | 1,025,000 | 1,063,438 | |||||||||||
| CommScope, Inc. (Communications Equip.) |
(b) | 5.500% | 06/15/2024 | 525,000 | 510,563 | |||||||||||
| Anixter, Inc. (Electronic Equip., Instr. & Comp.) |
5.625% | 05/01/2019 | 300,000 | 318,750 | ||||||||||||
| Belden, Inc. (Electronic Equip., Instr. & Comp.) |
(b) | 5.500% | 09/01/2022 | 725,000 | 719,563 | |||||||||||
| Belden, Inc. (Electronic Equip., Instr. & Comp.) |
(b) | 5.250% | 07/15/2024 | 375,000 | 363,750 | |||||||||||
| Cleaver-Brooks, Inc. (Electronic Equip., Instr. & Comp.) |
(b) | 8.750% | 12/15/2019 | 575,000 | 566,375 | |||||||||||
| Zebra Technologies Corp. (Electronic Equip., Instr. & Comp.) |
(b) | 7.250% | 10/15/2022 | 500,000 | 541,250 | |||||||||||
| Blackboard, Inc. (Internet Software & Svs.) |
(b) | 7.750% | 11/15/2019 | 400,000 | 376,000 | |||||||||||
| IAC / InterActiveCorp (Internet Software & Svs.) |
4.750% | 12/15/2022 | 1,100,000 | 1,078,000 | ||||||||||||
| VeriSign, Inc. (Internet Software & Svs.) |
4.625% | 05/01/2023 | 300,000 | 287,250 | ||||||||||||
| VeriSign, Inc. (Internet Software & Svs.) |
(b) | 5.250% | 04/01/2025 | 125,000 | 124,688 | |||||||||||
| Compiler Finance Sub, Inc. (Acquired 05/02/2013 through 02/25/2014, Cost $749,813)(IT Svs.) |
(b)(f) | 7.000% | 05/01/2021 | 750,000 | 570,000 | |||||||||||
| CoreLogic, Inc. (IT Svs.) |
7.250% | 06/01/2021 | 850,000 | 898,875 | ||||||||||||
| First Data Corp. (IT Svs.) |
(b) | 8.750% | 01/15/2022 | 2,825,000 | 3,003,328 | |||||||||||
| Sabre GLBL, Inc. (IT Svs.) |
(b) | 5.375% | 04/15/2023 | 350,000 | 344,750 | |||||||||||
| SunGard Data Systems, Inc. (IT Svs.) |
7.625% | 11/15/2020 | 200,000 | 209,000 | ||||||||||||
| SunGard Data Systems, Inc. (IT Svs.) |
6.625% | 11/01/2019 | 875,000 | 903,438 | ||||||||||||
| Advanced Micro Devices, Inc. (Semiconductors & Equip.) |
7.500% | 08/15/2022 | 250,000 | 220,625 | ||||||||||||
| Advanced Micro Devices, Inc. (Semiconductors & Equip.) |
7.000% | 07/01/2024 | 550,000 | 464,750 | ||||||||||||
| Entegris, Inc. (Semiconductors & Equip.) |
(b) | 6.000% | 04/01/2022 | 925,000 | 950,438 | |||||||||||
| Magnachip Semiconductor Corp. (Semiconductors & Equip.) |
6.625% | 07/15/2021 | 175,000 | 138,250 | ||||||||||||
| Micron Technology, Inc. (Semiconductors & Equip.) |
(b) | 5.250% | 08/01/2023 | 400,000 | 383,500 | |||||||||||
| Micron Technology, Inc. (Semiconductors & Equip.) |
(b) | 5.250% | 01/15/2024 | 175,000 | 165,266 | |||||||||||
| NXP BV / NXP Funding LLC (Semiconductors & Equip.) |
(b) | 5.750% | 02/15/2021 | 200,000 | 208,000 | |||||||||||
| NXP BV / NXP Funding LLC (Semiconductors & Equip.) |
(b) | 5.750% | 03/15/2023 | 200,000 | 208,000 | |||||||||||
| Audatex North America, Inc. (Software) |
(b) | 6.000% | 06/15/2021 | 825,000 | 847,688 | |||||||||||
| Audatex North America, Inc. (Software) |
(b) | 6.125% | 11/01/2023 | 100,000 | 102,750 | |||||||||||
| Blue Coat Holdings, Inc. (Software) |
(b) | 8.375% | 06/01/2023 | 550,000 | 559,625 | |||||||||||
| BMC Software Finance, Inc. (Software) |
(b) | 8.125% | 07/15/2021 | 600,000 | 486,000 | |||||||||||
| Boxer Parent Co., Inc. (Software) |
(b)(d) | 9.000% | 10/15/2019 | 775,000 | 550,250 | |||||||||||
| Infor Software Parent LLC / Infor Software Parent, Inc. (Software) |
(b)(d) | 7.125% | 05/01/2021 | 1,725,000 | 1,731,469 | |||||||||||
| Infor U.S., Inc. (Software) |
(b) | 6.500% | 05/15/2022 | 775,000 | 790,500 | |||||||||||
| Italics Merger Sub, Inc. (Software) |
(b) | 7.125% | 07/15/2023 | 575,000 | 567,813 | |||||||||||
| Nuance Communications, Inc. (Software) |
(b) | 5.375% | 08/15/2020 | 1,050,000 | 1,055,250 | |||||||||||
| Open Text Corp. (Software) |
(b) | 5.625% | 01/15/2023 | 475,000 | 470,250 | |||||||||||
| Sophia Holding Finance LP / Sophia Holding Finance, Inc. (Software) |
(b)(d) | 9.625% | 12/01/2018 | 200,000 | 202,500 | |||||||||||
| SS&C Technologies Holdings, Inc. (Software) |
(b) | 5.875% | 07/15/2023 | 250,000 | 252,500 | |||||||||||
| NCR Corp. (Tech. Hardware, Storage & Periph.) |
5.000% | 07/15/2022 | 450,000 | 456,188 | ||||||||||||
| NCR Corp. (Tech. Hardware, Storage & Periph.) |
4.625% | 02/15/2021 | 475,000 | 476,188 | ||||||||||||
| NCR Corp. (Tech. Hardware, Storage & Periph.) |
6.375% | 12/15/2023 | 225,000 | 238,500 | ||||||||||||
|
|
|
|||||||||||||||
| 23,405,318 | ||||||||||||||||
|
|
|
|||||||||||||||
| MATERIALS – 9.1% |
||||||||||||||||
| Ashland, Inc. (Chemicals) |
4.750% | 08/15/2022 | 600,000 | 588,750 | ||||||||||||
| U.S. Coatings Acquisition, Inc. / Flash Dutch 2 BV (Chemicals) |
(b) | 7.375% | 05/01/2021 | 825,000 | 883,781 | |||||||||||
| Axiall Corp. (Chemicals) |
4.875% | 05/15/2023 | 100,000 | 96,500 | ||||||||||||
| Celanese U.S. Holdings LLC (Chemicals) |
4.625% | 11/15/2022 | 325,000 | 321,750 | ||||||||||||
| Eagle Spinco, Inc. (Chemicals) |
4.625% | 02/15/2021 | 250,000 | 242,500 | ||||||||||||
| Eco Services Operations LLC / Eco Finance Corp. (Chemicals) |
(b) | 8.500% | 11/01/2022 | 300,000 | 301,500 | |||||||||||
| Hexion, Inc. (Chemicals) |
8.875% | 02/01/2018 | 800,000 | 722,000 | ||||||||||||
| Hexion, Inc. (Chemicals) |
6.625% | 04/15/2020 | 425,000 | 389,938 | ||||||||||||
| Huntsman International LLC (Chemicals) |
4.875% | 11/15/2020 | 250,000 | 249,375 | ||||||||||||
| Huntsman International LLC (Chemicals) |
(b) | 5.125% | 11/15/2022 | 200,000 | 197,000 | |||||||||||
| Platform Specialty Products Corp. (Chemicals) |
(b) | 6.500% | 02/01/2022 | 650,000 | 671,125 | |||||||||||
| W.R. Grace & Co. (Chemicals) |
(b) | 5.625% | 10/01/2024 | 150,000 | 151,875 | |||||||||||
| W.R. Grace & Co. (Chemicals) |
(b) | 5.125% | 10/01/2021 | 150,000 | 151,125 | |||||||||||
| Ardagh Packaging Finance PLC (Containers & Packaging) |
(b) | 9.125% | 10/15/2020 | 675,000 | 712,125 | |||||||||||
| Ardagh Packaging Finance PLC / Ardagh MP Holdings U.S.A., Inc. (Containers & Packaging) |
(b) | 9.125% | 10/15/2020 | 425,000 | 446,250 | |||||||||||
| Ardagh Packaging Finance PLC / Ardagh MP Holdings U.S.A., Inc. (Containers & Packaging) |
(b) | 7.000% | 11/15/2020 | 48,529 | 49,500 | |||||||||||
| Ardagh Packaging Finance PLC / Ardagh Holdings U.S.A., Inc. (Containers & Packaging) |
(b) | 6.750% | 01/31/2021 | 200,000 | 204,500 | |||||||||||
| Ardagh Packaging Finance PLC / Ardagh Holdings U.S.A., Inc. (Containers & Packaging) |
(b)(e) | 3.286% | 12/15/2019 | 200,000 | 194,500 | |||||||||||
| 67 | (continued) |
| Ohio National Fund, Inc. | High Income Bond Portfolio (Continued) |
| Schedule of Investments |
June 30, 2015 (Unaudited) |
| Corporate Bonds (Continued) | Rate | Maturity | Face Amount | Value | ||||||||||||
| MATERIALS (continued) |
||||||||||||||||
| Ardagh Packaging Finance PLC / Ardagh Holdings U.S.A., Inc. (Containers & Packaging) |
(b) | 6.000% | 06/30/2021 | $ | 200,000 | $ | 200,500 | |||||||||
| Ball Corp. (Containers & Packaging) |
4.000% | 11/15/2023 | 875,000 | 811,563 | ||||||||||||
| Ball Corp. (Containers & Packaging) |
5.250% | 07/01/2025 | 225,000 | 223,313 | ||||||||||||
| Berry Plastics Corp. (Containers & Packaging) |
5.500% | 05/15/2022 | 1,425,000 | 1,428,563 | ||||||||||||
| Berry Plastics Corp. (Containers & Packaging) |
5.125% | 07/15/2023 | 250,000 | 243,750 | ||||||||||||
| BWAY Holding Co. (Containers & Packaging) |
(b) | 9.125% | 08/15/2021 | 1,150,000 | 1,184,500 | |||||||||||
| Crown Americas LLC / Crown Americas Capital Corp. IV (Containers & Packaging) |
4.500% | 01/15/2023 | 725,000 | 684,676 | ||||||||||||
| Graphic Packaging International, Inc. (Containers & Packaging) |
4.875% | 11/15/2022 | 350,000 | 351,750 | ||||||||||||
| Greif, Inc. (Containers & Packaging) |
7.750% | 08/01/2019 | 475,000 | 528,438 | ||||||||||||
| Mustang Merger Corp. (Commercial Svs. & Supplies) |
(b) | 8.500% | 08/15/2021 | 775,000 | 786,625 | |||||||||||
| Owens-Brockway Glass Container, Inc. (Containers & Packaging) |
(b) | 5.000% | 01/15/2022 | 100,000 | 98,750 | |||||||||||
| Owens-Brockway Glass Container, Inc. (Containers & Packaging) |
(b) | 5.375% | 01/15/2025 | 200,000 | 195,500 | |||||||||||
| Pactiv LLC (Containers & Packaging) |
7.950% | 12/15/2025 | 225,000 | 222,750 | ||||||||||||
| Reynolds Group Issuer, Inc. / Reynolds Group Issuer LLC (Containers & Packaging) |
8.250% | 02/15/2021 | 975,000 | 1,011,563 | ||||||||||||
| Reynolds Group Issuer, Inc. / Reynolds Group Issuer LLC (Containers & Packaging) |
5.750% | 10/15/2020 | 1,025,000 | 1,050,625 | ||||||||||||
| Sealed Air Corp. (Containers & Packaging) |
(b) | 6.500% | 12/01/2020 | 125,000 | 137,813 | |||||||||||
| Sealed Air Corp. (Containers & Packaging) |
(b) | 4.875% | 12/01/2022 | 300,000 | 295,500 | |||||||||||
| Sealed Air Corp. (Containers & Packaging) |
(b) | 5.125% | 12/01/2024 | 300,000 | 295,875 | |||||||||||
| Sealed Air Corp. (Containers & Packaging) |
(b) | 5.500% | 09/15/2025 | 300,000 | 302,250 | |||||||||||
| Signode Industrial Group Lux SA / Signode Industrial Group U.S., Inc. (Containers & Packaging) |
(b) | 6.375% | 05/01/2022 | 1,450,000 | 1,406,500 | |||||||||||
| ArcelorMittal (Metals & Mining) |
6.125% | 06/01/2025 | 300,000 | 299,063 | ||||||||||||
| Steel Dynamics, Inc. (Metals & Mining) |
5.250% | 04/15/2023 | 125,000 | 124,063 | ||||||||||||
| Steel Dynamics, Inc. (Metals & Mining) |
5.125% | 10/01/2021 | 200,000 | 200,400 | ||||||||||||
| Steel Dynamics, Inc. (Metals & Mining) |
5.500% | 10/01/2024 | 350,000 | 350,000 | ||||||||||||
| Wise Metals Intermediate Holdings LLC / Wise Holdings Finance Corp. (Metals & Mining) |
(b) | 9.750% | 06/15/2019 | 325,000 | 346,125 | |||||||||||
| Clearwater Paper Corp. (Paper & Forest Products) |
4.500% | 02/01/2023 | 750,000 | 710,625 | ||||||||||||
| Clearwater Paper Corp. (Paper & Forest Products) |
(b) | 5.375% | 02/01/2025 | 500,000 | 490,000 | |||||||||||
|
|
|
|||||||||||||||
| 20,555,174 | ||||||||||||||||
|
|
|
|||||||||||||||
| TELECOMMUNICATION SERVICES – 4.0% |
||||||||||||||||
| Level 3 Communications, Inc. (Diversified Telecom. Svs.) |
5.750% | 12/01/2022 | 375,000 | 372,188 | ||||||||||||
| Level 3 Financing, Inc. (Diversified Telecom. Svs.) |
(b) | 5.375% | 05/01/2025 | 600,000 | 578,250 | |||||||||||
| Altice Financing SA (Wireless Telecom. Svs.) |
(b) | 6.625% | 02/15/2023 | 200,000 | 198,560 | |||||||||||
| Digicel Group Ltd. (Wireless Telecom. Svs.) |
(b) | 8.250% | 09/30/2020 | 1,075,000 | 1,075,000 | |||||||||||
| Sprint Capital Corp. (Wireless Telecom. Svs.) |
6.875% | 11/15/2028 | 925,000 | 793,188 | ||||||||||||
| Sprint Capital Corp. (Wireless Telecom. Svs.) |
6.900% | 05/01/2019 | 525,000 | 535,500 | ||||||||||||
| Sprint Nextel Corp. (Wireless Telecom. Svs.) |
(b) | 7.000% | 03/01/2020 | 350,000 | 380,695 | |||||||||||
| Sprint Communications, Inc. (Wireless Telecom. Svs.) |
6.000% | 11/15/2022 | 875,000 | 799,531 | ||||||||||||
| Sprint Corp. (Wireless Telecom. Svs.) |
7.875% | 09/15/2023 | 675,000 | 658,125 | ||||||||||||
| Sprint Corp. (Wireless Telecom. Svs.) |
7.125% | 06/15/2024 | 275,000 | 255,090 | ||||||||||||
| Syniverse Holdings, Inc. (Wireless Telecom. Svs.) |
9.125% | 01/15/2019 | 750,000 | 660,000 | ||||||||||||
| T-Mobile U.S.A., Inc. (Wireless Telecom. Svs.) |
6.625% | 11/15/2020 | 875,000 | 910,000 | ||||||||||||
| T-Mobile U.S.A., Inc. (Wireless Telecom. Svs.) |
6.731% | 04/28/2022 | 75,000 | 78,188 | ||||||||||||
| T-Mobile U.S.A., Inc. (Wireless Telecom. Svs.) |
6.500% | 01/15/2024 | 625,000 | 645,313 | ||||||||||||
| T-Mobile U.S.A., Inc. (Wireless Telecom. Svs.) |
6.125% | 01/15/2022 | 200,000 | 206,500 | ||||||||||||
| T-Mobile U.S.A., Inc. (Wireless Telecom. Svs.) |
6.625% | 04/01/2023 | 450,000 | 467,438 | ||||||||||||
| T-Mobile U.S.A., Inc. (Wireless Telecom. Svs.) |
6.375% | 03/01/2025 | 225,000 | 230,906 | ||||||||||||
| T-Mobile U.S.A., Inc. (Wireless Telecom. Svs.) |
6.000% | 03/01/2023 | 150,000 | 153,563 | ||||||||||||
|
|
|
|||||||||||||||
| 8,998,035 | ||||||||||||||||
|
|
|
|||||||||||||||
| UTILITIES – 2.2% |
||||||||||||||||
| Ferrellgas LP / Ferrellgas Finance Corp. (Gas Utilities) |
6.500% | 05/01/2021 | 450,000 | 448,875 | ||||||||||||
| Ferrellgas LP / Ferrellgas Finance Corp. (Gas Utilities) |
6.750% | 01/15/2022 | 500,000 | 501,250 | ||||||||||||
| Ferrellgas LP / Ferrellgas Finance Corp. (Gas Utilities) |
(b) | 6.750% | 06/15/2023 | 200,000 | 201,000 | |||||||||||
| Suburban Propane Partners LP / Suburban Energy Finance Corp. (Gas Utilities) |
7.375% | 08/01/2021 | 372,000 | 397,110 | ||||||||||||
| Suburban Propane Partners LP / Suburban Energy Finance Corp. (Gas Utilities) |
5.500% | 06/01/2024 | 825,000 | 829,125 | ||||||||||||
| Calpine Corp. (Ind. Power Prod. & Energy Traders) |
(b) | 6.000% | 01/15/2022 | 175,000 | 185,063 | |||||||||||
| Calpine Corp. (Ind. Power & Renewable Elec.) |
5.750% | 01/15/2025 | 1,275,000 | 1,239,938 | ||||||||||||
| NRG Energy, Inc. (Ind. Power & Renewable Elec.) |
6.250% | 05/01/2024 | 725,000 | 719,563 | ||||||||||||
| TerraForm Power Operating LLC (Ind. Power & Renewable Elec.) |
(b) | 5.875% | 02/01/2023 | 375,000 | 380,625 | |||||||||||
| FPL Energy National Wind Portfolio LLC (Acquired 05/27/2009, Cost $13,126)(Multi-Utilities) |
(b)(f) | 6.125% | 03/25/2019 | 14,374 | 14,374 | |||||||||||
|
|
|
|||||||||||||||
| 4,916,923 | ||||||||||||||||
|
|
|
|||||||||||||||
| Total Corporate Bonds (Cost $221,966,488) |
$ | 219,529,537 | ||||||||||||||
|
|
|
|||||||||||||||
| Common Stocks – 0.0% | Shares | Value | ||||||||||||||
| ENERGY – 0.0% |
||||||||||||||||
| Lone Pine Resources Canada Ltd. (Acquired 07/10/2012, Cost $48,614)(Oil, Gas & Consumable Fuels) |
(a)(c)(f) | 6,236 | $ | 11,350 | ||||||||||||
|
|
|
|||||||||||||||
| Total Common Stocks (Cost $48,613) |
$ | 11,350 | ||||||||||||||
|
|
|
|||||||||||||||
| 68 | (continued) |
| Ohio National Fund, Inc. | High Income Bond Portfolio (Continued) |
| Schedule of Investments |
June 30, 2015 (Unaudited) |
| Money Market Funds – 1.5% | Shares | Value | ||||||||||||
| Fidelity Institutional Money Market Funds |
3,317,000 | $ | 3,317,000 | |||||||||||
|
|
|
|||||||||||||
| Total Money Market Funds (Cost $3,317,000) |
$ | 3,317,000 | ||||||||||||
|
|
|
|||||||||||||
| Total Investments – 99.2% (Cost $225,332,101) |
(g) | $ | 222,857,887 | |||||||||||
| Other Assets in Excess of Liabilities – 0.8% |
1,903,366 | |||||||||||||
|
|
|
|||||||||||||
| Net Assets – 100.0% |
$ | 224,761,253 | ||||||||||||
|
|
|
|||||||||||||
Percentages are stated as a percent of net assets.
Footnotes:
| (a) | Non-income producing security. |
| (b) | Security exempt from registration under Regulation D of the Securities Act of 1933. These securities may be resold in transactions exempt from registration, normally to qualified buyers under Rule 144A. At June 30, 2015, the value of these securities totaled $103,396,169, or 46.0% of the Portfolio’s net assets. Unless also noted with (f), as defined below, these securities were deemed liquid pursuant to procedures approved by the Board of Directors. |
| (c) | A market quotation for this investment was not readily available at June 30, 2015. As discussed in Note 2 of the Notes to Financial Statements, the price for this issue was derived from an estimate of fair market value using methods determined in good faith by the Fund’s Pricing Committee under supervision of the Board. This security represents $11,350 or 0.0% of the Portfolio’s net assets. |
| (d) | Issuer of the security has the option to make coupon payments in cash or in additional par value of this bond. Rate presented is the coupon rate for the cash option. |
| (e) | Security is a variable rate instrument in which the coupon rate is adjusted quarterly in concert with U.S. LIBOR. Interest rates stated are those in effect at June 30, 2015. |
| (f) | Represents a security deemed to be illiquid. At June 30, 2015, the value of illiquid securities in the Portfolio totaled $595,724, or 0.3% of the Portfolio’s net assets. |
| (g) | Represents cost for financial reporting purposes, which may differ from cost basis for federal income tax purposes. See also Note 7 of the Notes to Financial Statements. |
The accompanying notes are an integral part of these financial statements.
| 69 |
| Ohio National Fund, Inc. | Capital Growth Portfolio |
| 70 | (continued) |
| Ohio National Fund, Inc. | Capital Growth Portfolio (Continued) |
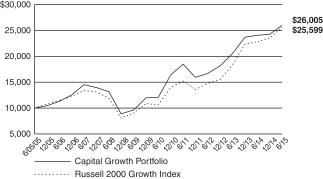
| (1) | Composition of Portfolio subject to change. |
| (2) | Short-term investments have been excluded from the list of Top 10 Portfolio Holdings. |
| (3) | Sectors (combined): |
| % of Net Assets | ||||
| Information Technology |
26.8 | |||
| Health Care |
25.6 | |||
| Consumer Discretionary |
14.7 | |||
| Industrials |
14.6 | |||
| Financials |
6.9 | |||
| Materials |
4.0 | |||
| Consumer Staples |
3.7 | |||
| Energy |
3.4 | |||
|
|
|
|||
| 99.7 | ||||
|
|
|
| 71 |
| Ohio National Fund, Inc. | Capital Growth Portfolio |
| Schedule of Investments |
June 30, 2015 (Unaudited) |
| 72 | (continued) |
| Ohio National Fund, Inc. | Capital Growth Portfolio (Continued) |
| Schedule of Investments |
June 30, 2015 (Unaudited) |
Percentages are stated as a percent of net assets.
Footnotes:
| (a) | Non-income producing security. |
| (b) | Represents cost for financial reporting purposes, which may differ from cost basis for federal income tax purposes. See also Note 7 of the Notes to Financial Statements. |
The accompanying notes are an integral part of these financial statements.
| 73 |
| Ohio National Fund, Inc. | Nasdaq-100® Index Portfolio |
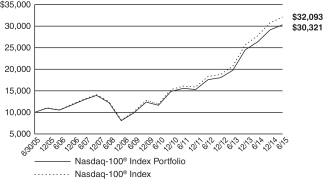
| 74 | (continued) |
| Ohio National Fund, Inc. | Nasdaq-100® Index Portfolio (Continued) |
| (1) | Composition of Portfolio subject to change. |
| (2) | Short-term investments have been excluded from the list of Top 10 Portfolio Holdings. |
| (3) | Sectors: |
| % of Net Assets | ||||
| Information Technology |
53.5 | |||
| Consumer Discretionary |
19.2 | |||
| Health Care |
15.2 | |||
| Consumer Staples |
6.1 | |||
| Industrials |
2.0 | |||
| Telecommunication Services |
0.8 | |||
| Materials |
0.3 | |||
|
|
|
|||
| 97.1 | ||||
|
|
|
| 75 |
| Ohio National Fund, Inc. | Nasdaq-100® Index Portfolio |
| Schedule of Investments |
June 30, 2015 (Unaudited) |
| 76 | (continued) |
| Ohio National Fund, Inc. | Nasdaq-100® Index Portfolio (Continued) |
| Schedule of Investments |
June 30, 2015 (Unaudited) |
Percentages are stated as a percent of net assets.
Abbreviations:
ADR: American Depositary Receipts
Footnotes:
| (a) | Non-income producing security. |
| (b) | Represents cost for financial reporting purposes, which may differ from cost basis for federal income tax purposes. See also Note 7 of the Notes to Financial Statements. |
The accompanying notes are an integral part of these financial statements.
| 77 |
| Ohio National Fund, Inc. | Bristol Portfolio |

| 78 | (continued) |
| Ohio National Fund, Inc. | Bristol Portfolio (Continued) |
| (1) | Composition of Portfolio subject to change. |
| (2) | Short-term investments have been excluded from the list of Top 10 Portfolio Holdings. |
| (3) | Sectors: |
| % of Net Assets | ||||
| Information Technology |
21.6 | |||
| Health Care |
19.4 | |||
| Consumer Discretionary |
19.1 | |||
| Financials |
17.5 | |||
| Industrials |
8.6 | |||
| Materials |
4.7 | |||
| Energy |
4.3 | |||
| Consumer Staples |
4.0 | |||
|
|
|
|||
| 99.2 | ||||
|
|
|
| 79 |
| Ohio National Fund, Inc. | Bristol Portfolio |
| Schedule of Investments |
June 30, 2015 (Unaudited) |
Percentages are stated as a percent of net assets.
Footnotes:
| (a) | Non-income producing security. |
| (b) | Represents cost for financial reporting purposes, which may differ from cost basis for federal income tax purposes. See also Note 7 of the Notes to Financial Statements. |
The accompanying notes are an integral part of these financial statements.
| 80 |
| Ohio National Fund, Inc. | Bryton Growth Portfolio |
| 81 | (continued) |
| Ohio National Fund, Inc. | Bryton Growth Portfolio (Continued) |
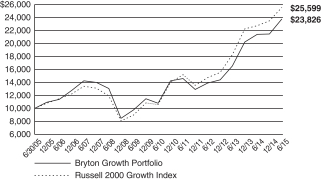
| (1) | Composition of Portfolio subject to change. |
| (2) | Short-term investments have been excluded from the list of Top 10 Portfolio Holdings. |
| (3) | Sectors: |
| % of Net Assets | ||||
| Information Technology |
28.6 | |||
| Health Care |
28.4 | |||
| Industrials |
14.1 | |||
| Consumer Discretionary |
9.6 | |||
| Energy |
6.3 | |||
| Financials |
5.0 | |||
| Consumer Staples |
3.3 | |||
| Materials |
2.9 | |||
|
|
|
|||
| 98.2 | ||||
|
|
|
| 82 |
| Ohio National Fund, Inc. | Bryton Growth Portfolio |
| Schedule of Investments |
June 30, 2015 (Unaudited) |
Percentages are stated as a percent of net assets.
Abbreviations:
ADR: American Depositary Receipts
Footnotes:
| (a) | Non-income producing security. |
| (b) | Represents cost for financial reporting purposes, which may differ from cost basis for federal income tax purposes. See also Note 7 of the Notes to Financial Statements. |
The accompanying notes are an integral part of these financial statements.
| 83 |
| Ohio National Fund, Inc. | Balanced Portfolio |
| 84 | (continued) |
| Ohio National Fund, Inc. | Balanced Portfolio (Continued) |

| (1) | Composition of Portfolio subject to change. |
| (2) | Short-term investments have been excluded from the list of Top 10 Portfolio Holdings. |
| (3) | Sectors (combined): |
| % of Net Assets | ||||
| Financials |
27.3 | |||
| Health Care |
11.7 | |||
| Information Technology |
11.5 | |||
| Industrials |
10.3 | |||
| Consumer Discretionary |
9.2 | |||
| Consumer Staples |
3.5 | |||
| Materials |
3.3 | |||
| Utilities |
3.3 | |||
| Energy |
2.3 | |||
| Telecommunication Services |
1.7 | |||
|
|
|
|||
| 84.1 | ||||
|
|
|
| 85 |
| Ohio National Fund, Inc. | Balanced Portfolio |
| Schedule of Investments |
June 30, 2015 (Unaudited) |
| 86 | (continued) |
| Ohio National Fund, Inc. | Balanced Portfolio (Continued) |
| Schedule of Investments |
June 30, 2015 (Unaudited) |
| Corporate Bonds – 22.3% | Rate | Maturity | Face Amount | Value | ||||||||||||
| CONSUMER DISCRETIONARY – 1.1% |
||||||||||||||||
| Darden Restaurants, Inc. (Hotels, Restaurants & Leisure) |
(i) | 7.050% | 10/15/2037 | $ | 3,500,000 | $ | 4,241,720 | |||||||||
| Eldorado Resorts LLC / Eldorado Capital Corp. (Hotels, Restaurants & Leisure) |
(b) | 8.625% | 06/15/2019 | 1,875,000 | 1,954,688 | |||||||||||
| Marina District Finance Co., Inc. (Hotels, Restaurants & Leisure) |
9.875% | 08/15/2018 | 1,710,000 | 1,757,025 | ||||||||||||
| Pinnacle Entertainment, Inc. (Hotels, Restaurants & Leisure) |
7.500% | 04/15/2021 | 475,000 | 502,906 | ||||||||||||
| Intelsat Jackson Holdings SA (Media) |
7.250% | 04/01/2019 | 1,482,000 | 1,504,230 | ||||||||||||
|
|
|
|||||||||||||||
| 9,960,569 | ||||||||||||||||
|
|
|
|||||||||||||||
| CONSUMER STAPLES – 1.9% |
||||||||||||||||
| Kraft Heinz Foods Co. (Food Products) |
(b) | 4.875% | 02/15/2025 | 6,100,000 | 6,641,375 | |||||||||||
| Altria Group, Inc. (Tobacco) |
9.250% | 08/06/2019 | 7,967,000 | 10,004,417 | ||||||||||||
|
|
|
|||||||||||||||
| 16,645,792 | ||||||||||||||||
|
|
|
|||||||||||||||
| ENERGY – 0.9% |
||||||||||||||||
| Alliance Pipeline LP / United States (Oil, Gas & Consumable Fuels) |
(b) | 7.877% | 12/31/2025 | 2,000,000 | 2,437,328 | |||||||||||
| BG Energy Capital PLC (Oil, Gas & Consumable Fuels) |
(b) | 4.000% | 10/15/2021 | 3,090,000 | 3,274,476 | |||||||||||
| United Refining Co. (Oil, Gas & Consumable Fuels) |
10.500% | 02/28/2018 | 1,812,000 | 1,902,600 | ||||||||||||
|
|
|
|||||||||||||||
| 7,614,404 | ||||||||||||||||
|
|
|
|||||||||||||||
| FINANCIALS – 7.2% |
||||||||||||||||
| City National Corp. (Banks) |
5.250% | 09/15/2020 | 1,500,000 | 1,695,711 | ||||||||||||
| Hancock Holding Co. (Banks) |
5.875% | 04/01/2017 | 2,950,000 | 3,091,765 | ||||||||||||
| E*TRADE Financial Corp. (Capital Markets) |
5.375% | 11/15/2022 | 3,040,000 | 3,116,000 | ||||||||||||
| Neuberger Berman Group LLC / Neuberger Berman Finance Corp. (Capital Markets) |
(b) | 5.875% | 03/15/2022 | 5,800,000 | 6,198,750 | |||||||||||
| Ally Financial, Inc. (Consumer Finance) |
8.000% | 03/15/2020 | 1,950,000 | 2,296,125 | ||||||||||||
| General Electric Capital Corp. / LJ VP Holdings LLC (Diversified Financial Svs.) |
(b) | 3.800% | 06/18/2019 | 2,750,000 | 2,905,911 | |||||||||||
| Alleghany Corp. (Insurance) |
5.625% | 09/15/2020 | 1,000,000 | 1,118,768 | ||||||||||||
| Glen Meadow Pass-Through Trust (Insurance) |
(b)(f) | 6.505% | 02/12/2067 | 395,000 | 367,350 | |||||||||||
| MBIA, Inc. (Insurance) |
6.625% | 10/01/2028 | 2,810,000 | 2,585,200 | ||||||||||||
| Old Republic International Corp. (Insurance) |
4.875% | 10/01/2024 | 5,000,000 | 5,165,585 | ||||||||||||
| ProAssurance Corp. (Insurance) |
5.300% | 11/15/2023 | 5,063,000 | 5,394,976 | ||||||||||||
| Protective Life Corp. (Insurance) |
6.250% | 05/15/2042 | 32,350 | 829,454 | ||||||||||||
| Prudential Financial, Inc. (Insurance) |
(f) | 8.875% | 06/15/2068 | 8,635,000 | 10,102,950 | |||||||||||
| Prudential Insurance Co. of America / The (Insurance) |
(b) | 8.300% | 07/01/2025 | 2,500,000 | 3,324,095 | |||||||||||
| Reinsurance Group of America, Inc. (Insurance) |
6.450% | 11/15/2019 | 1,000,000 | 1,151,204 | ||||||||||||
| SAFG Retirement Services, Inc. (Insurance) |
8.125% | 04/28/2023 | 500,000 | 626,067 | ||||||||||||
| StanCorp Financial Group, Inc. (Insurance) |
(f) | 6.900% | 06/01/2067 | 4,500,000 | 4,185,000 | |||||||||||
| Travelers Property Casualty Corp. (Insurance) |
7.750% | 04/15/2026 | 5,400,000 | 7,102,150 | ||||||||||||
| Hunt Cos., Inc. (Real Estate Mgmt. & Development) |
(b) | 9.625% | 03/01/2021 | 2,100,000 | 2,163,000 | |||||||||||
|
|
|
|||||||||||||||
| 63,420,061 | ||||||||||||||||
|
|
|
|||||||||||||||
| HEALTH CARE – 3.9% |
||||||||||||||||
| Highmark, Inc. (Health Care Providers & Svs.) |
(b) | 4.750% | 05/15/2021 | 3,500,000 | 3,582,526 | |||||||||||
| Highmark, Inc. (Health Care Providers & Svs.) |
(b) | 6.125% | 05/15/2041 | 2,100,000 | 2,058,594 | |||||||||||
| inVentiv Health, Inc. (Health Care Providers & Svs.) |
(b) | 9.000% | 01/15/2018 | 3,405,000 | 3,549,713 | |||||||||||
| Omnicare, Inc. (Health Care Providers & Svs.) |
4.750% | 12/01/2022 | 10,726,000 | 11,369,560 | ||||||||||||
| Prospect Medical Holdings, Inc. (Health Care Providers & Svs.) |
(b) | 8.375% | 05/01/2019 | 5,035,000 | 5,353,716 | |||||||||||
| Hospira, Inc. (Pharmaceuticals) |
5.800% | 08/12/2023 | 7,490,000 | 8,706,885 | ||||||||||||
|
|
|
|||||||||||||||
| 34,620,994 | ||||||||||||||||
|
|
|
|||||||||||||||
| INDUSTRIALS – 3.4% |
||||||||||||||||
| Air Canada (Airlines) |
(b) | 8.750% | 04/01/2020 | 1,460,000 | 1,613,300 | |||||||||||
| Goodman Networks, Inc. (Building Products) |
12.125% | 07/01/2018 | 2,570,000 | 2,133,100 | ||||||||||||
| Masco Corp. (Building Products) |
(i) | 6.125% | 10/03/2016 | 5,000,000 | 5,262,500 | |||||||||||
| Masco Corp. (Building Products) |
5.950% | 03/15/2022 | 4,934,000 | 5,538,415 | ||||||||||||
| USG Corp. (Building Products) |
(b) | 7.875% | 03/30/2020 | 4,000,000 | 4,280,000 | |||||||||||
| Siemens Financieringsmaatschappij NV (Industrial Conglomerates) |
(b) | 6.125% | 08/17/2026 | 3,000,000 | 3,639,420 | |||||||||||
| Case New Holland Industrial, Inc. (Machinery) |
7.875% | 12/01/2017 | 980,000 | 1,073,100 | ||||||||||||
| Ingersoll-Rand Co. (Machinery) |
6.391% | 11/15/2027 | 2,215,000 | 2,613,126 | ||||||||||||
| Ingersoll-Rand Co. (Machinery) |
6.443% | 11/15/2027 | 1,800,000 | 2,151,299 | ||||||||||||
| Brightstar Corp. (Trading Companies & Distributors) |
(b) | 7.250% | 08/01/2018 | 1,832,000 | 1,937,340 | |||||||||||
|
|
|
|||||||||||||||
| 30,241,600 | ||||||||||||||||
|
|
|
|||||||||||||||
| INFORMATION TECHNOLOGY – 1.8% |
||||||||||||||||
| Corning, Inc. (Electronic Equip., Instr. & Comp.) |
7.250% | 08/15/2036 | 2,180,000 | 2,743,813 | ||||||||||||
| EarthLink Holdings Corp. (Internet Software & Svs.) |
7.375% | 06/01/2020 | 2,400,000 | 2,496,000 | ||||||||||||
| First Data Corp. (IT Svs.) |
12.625% | 01/15/2021 | 3,584,000 | 4,139,520 | ||||||||||||
| Lender Processing Services, Inc. / Black Knight Lending Solutions, Inc. (IT Svs.) |
5.750% | 04/15/2023 | 6,275,000 | 6,604,437 | ||||||||||||
|
|
|
|||||||||||||||
| 15,983,770 | ||||||||||||||||
|
|
|
|||||||||||||||
| MATERIALS – 0.2% |
||||||||||||||||
| Vulcan Materials Co. (Construction Materials) |
4.500% | 04/01/2025 | 1,250,000 | 1,246,875 | ||||||||||||
|
|
|
|||||||||||||||
| 87 | (continued) |
| Ohio National Fund, Inc. | Balanced Portfolio (Continued) |
| Schedule of Investments |
June 30, 2015 (Unaudited) |
| Corporate Bonds (Continued) | Rate | Maturity | Face Amount | Value | ||||||||||||
| TELECOMMUNICATION SERVICES – 1.7% |
||||||||||||||||
| Cincinnati Bell, Inc. (Diversified Telecom. Svs.) |
8.375% | 10/15/2020 | $ | 3,950,000 | $ | 4,152,438 | ||||||||||
| Level 3 Financing, Inc. (Diversified Telecom. Svs.) |
7.000% | 06/01/2020 | 2,000,000 | 2,122,500 | ||||||||||||
| Clearwire Communications LLC / Clearwire Finance, Inc. (Wireless Telecom. Svs.) |
(b) | 14.750% | 12/01/2016 | 4,506,000 | 5,215,695 | |||||||||||
| Sprint Communications, Inc. (Wireless Telecom. Svs.) |
6.000% | 11/15/2022 | 1,755,000 | 1,603,631 | ||||||||||||
| Vodafone Group PLC (Wireless Telecom. Svs.) |
6.250% | 11/30/2032 | 1,683,000 | 1,838,612 | ||||||||||||
|
|
|
|||||||||||||||
| 14,932,876 | ||||||||||||||||
|
|
|
|||||||||||||||
| UTILITIES – 0.2% |
||||||||||||||||
| Tenaska Georgia Partners LP (Electric Utilities) |
9.500% | 02/01/2030 | 1,319,962 | 1,641,984 | ||||||||||||
|
|
|
|||||||||||||||
| Total Corporate Bonds (Cost $199,791,915) |
$ | 196,308,925 | ||||||||||||||
|
|
|
|||||||||||||||
| Municipal Bonds – 0.4% | Rate | Maturity | Face Amount | Value | ||||||||||||
| City of Cape Coral, FL Gas Tax Revenue |
7.147% | 10/01/2030 | $ | 3,000,000 | $ | 3,558,720 | ||||||||||
|
|
|
|||||||||||||||
| Total Municipal Bonds (Cost $3,563,851) |
$ | 3,558,720 | ||||||||||||||
|
|
|
|||||||||||||||
| Preferred Stocks – 1.5% | Rate | Quantity | Value | |||||||||||||
| FINANCIALS – 1.5% |
||||||||||||||||
| Charles Schwab Corp. Series A / The (Capital Markets) |
(h) | 7.000% | 4,000,000 | $ | 4,643,880 | |||||||||||
| Oxford Lane Capital Corp. (Capital Markets) |
8.500% | 2,000 | 50,220 | |||||||||||||
| General Electric Capital Corp. (Diversified Financial Svs.) |
(h) | 7.125% | 2,500,000 | 2,884,375 | ||||||||||||
| Digital Realty Trust, Inc. (Real Estate Investment Trusts) |
7.000% | 22,420 | 573,055 | |||||||||||||
| Equity Commonwealth (Real Estate Investment Trusts) |
7.250% | 92,011 | 2,347,201 | |||||||||||||
| Gramercy Property Trust, Inc. (Acquired 08/26/2014 through 06/10/2015, Cost $2,380,961)(Real Estate Investment Trusts) |
(j) | 7.125% | 102,979 | 2,728,943 | ||||||||||||
|
|
|
|||||||||||||||
| Total Preferred Stocks (Cost $13,170,621) |
$ | 13,227,674 | ||||||||||||||
|
|
|
|||||||||||||||
| Trust Preferred Securities – 3.9% | Rate | Quantity | Value | |||||||||||||
| FINANCIALS – 3.3% |
||||||||||||||||
| PNC Preferred Funding Trust II (Banks) |
(b)(h) | 1.508% | 4,000,000 | $ | 3,600,000 | |||||||||||
| RBS Capital Funding Trust V (Banks) |
5.900% | 246,303 | 5,967,922 | |||||||||||||
| USB Capital IX (Banks) |
(h) | 3.500% | 1,500,000 | 1,238,250 | ||||||||||||
| USB Realty Corp. (Banks) |
(b)(h) | 1.422% | 5,000,000 | 4,568,750 | ||||||||||||
| NTC Capital I (Capital Markets) |
(e) | 0.795% | 3,300,000 | 2,862,750 | ||||||||||||
| State Street Capital Trust I (Capital Markets) |
(g) | 0.834% | 5,123,000 | 4,444,203 | ||||||||||||
| GMAC Capital Trust I (Consumer Finance) |
8.125% | 143,287 | 3,722,596 | |||||||||||||
| ILFC E-Capital Trust II (Diversified Financial Svs.) |
(b)(f) | 6.250% | 2,900,000 | 2,842,000 | ||||||||||||
|
|
|
|||||||||||||||
| 29,246,471 | ||||||||||||||||
|
|
|
|||||||||||||||
| UTILITIES – 0.6% |
||||||||||||||||
| PECO Energy Capital Trust IV (Electric Utilities) |
5.750% | 5,000,000 | 4,843,925 | |||||||||||||
|
|
|
|||||||||||||||
| Total Trust Preferred Securities (Cost $34,777,379) |
$ | 34,090,396 | ||||||||||||||
|
|
|
|||||||||||||||
| Asset-Backed / Mortgage-Backed Securities – 2.3% | Rate | Maturity | Face Amount | Value | ||||||||||||
| FINANCIALS – 2.3% |
||||||||||||||||
| Citigroup Mortgage Loan Trust 2013-J1 Class B2 (Acquired 05/21/2015, Cost $1,996,379) |
(b)(j) | 3.567% | 10/25/2043 | $ | 2,001,383 | $ | 1,995,769 | |||||||||
| Citigroup Mortgage Loan Trust, Inc. 2004-NCM2 Class 2CB1 |
5.500% | 08/25/2034 | 1,404,546 | 1,513,946 | ||||||||||||
| Fannie Mae Trust 2003-W2 Class 1A4 |
2.986% | 07/25/2042 | 1,631,971 | 1,719,350 | ||||||||||||
| MASTR Seasoned Securitization Trust 2005-1 Class 1A1 |
6.617% | 09/25/2032 | 2,336,014 | 2,556,048 | ||||||||||||
| Sequoia Mortgage Trust 2013-1 Class B2 (Acquired 04/15/2015, Cost $4,917,160) |
(j) | 3.645% | 02/25/2043 | 4,870,385 | 4,690,434 | |||||||||||
| Sequoia Mortgage Trust 2013-10 Class B2 (Acquired 02/17/2015, Cost $4,306,412) |
(b)(j) | 3.586% | 08/25/2043 | 4,416,833 | 4,149,818 | |||||||||||
| Sequoia Mortgage Trust 2014-4 Class B2 (Acquired 03/11/2015, Cost $3,503,715) |
(b)(j) | 3.905% | 11/25/2044 | 3,521,322 | 3,496,285 | |||||||||||
|
|
|
|||||||||||||||
| Total Asset-Backed / Mortgage-Backed Securities (Cost $20,508,285) |
$ | 20,121,650 | ||||||||||||||
|
|
|
|||||||||||||||
| U.S. Treasury Obligations – 9.6% | Rate | Maturity | Face Amount | Value | ||||||||||||
| U.S. Treasury Inflation Indexed Bonds |
0.125% | 04/15/2019 | $ | 10,097,300 | $ | 10,216,418 | ||||||||||
| U.S. Treasury Inflation Indexed Bonds |
0.125% | 07/15/2024 | 9,964,300 | 9,692,613 | ||||||||||||
| U.S. Treasury Note |
0.500% | 09/30/2016 | 20,000,000 | 20,018,760 | ||||||||||||
| U.S. Treasury Note |
1.000% | 09/15/2017 | 20,000,000 | 20,110,940 | ||||||||||||
| U.S. Treasury Note |
1.875% | 05/31/2022 | 10,000,000 | 9,878,910 | ||||||||||||
| U.S. Treasury Note |
2.250% | 11/15/2024 | 15,000,000 | 14,882,820 | ||||||||||||
|
|
|
|||||||||||||||
| Total U.S. Treasury Obligations (Cost $83,637,946) |
$ | 84,800,461 | ||||||||||||||
|
|
|
|||||||||||||||
| 88 | (continued) |
| Ohio National Fund, Inc. | Balanced Portfolio (Continued) |
| Schedule of Investments |
June 30, 2015 (Unaudited) |
| Closed-End Mutual Funds – 3.0% | Shares | Value | ||||||||||||
| Alliance New York Municipal Income Fund, Inc. |
135,448 | $ | 1,904,399 | |||||||||||
| BlackRock Enhanced Government Fund, Inc. |
77,605 | 1,049,996 | ||||||||||||
| Delaware Investments Dividend & Income Fund, Inc. |
61,025 | 604,148 | ||||||||||||
| Deutsche Global High Income Fund, Inc. |
177,040 | 1,441,106 | ||||||||||||
| Diversified Real Asset Income Fund |
149,548 | 2,623,072 | ||||||||||||
| Federated Enhanced Treasury Income Fund |
246,001 | 3,249,673 | ||||||||||||
| Firsthand Technology Value Fund, Inc. |
70,965 | 912,610 | ||||||||||||
| Fort Dearborn Income Securities, Inc. |
107,539 | 1,484,038 | ||||||||||||
| LMP Real Estate Income Fund, Inc. |
299,923 | 3,509,099 | ||||||||||||
| MFS InterMarket Income Trust I |
212,181 | 1,788,686 | ||||||||||||
| Montgomery Street Income Securities, Inc. |
113,373 | 1,858,183 | ||||||||||||
| Nuveen Mortgage Opportunity Term Fund |
90,658 | 2,057,030 | ||||||||||||
| Western Asset/Claymore Inflation-Linked Opportunities & Income Fund |
92,202 | 1,031,740 | ||||||||||||
| Western Asset/Claymore Inflation-Linked Securities & Income Fund |
234,910 | 2,647,436 | ||||||||||||
|
|
|
|||||||||||||
| Total Closed-End Mutual Funds (Cost $27,611,924) |
$ | 26,161,216 | ||||||||||||
|
|
|
|||||||||||||
| Exchange Traded Funds – 0.9% | Shares | Value | ||||||||||||
| SPDR S&P 500 ETF Trust |
40,000 | $ | 8,234,000 | |||||||||||
|
|
|
|||||||||||||
| Total Exchange Traded Funds (Cost $8,503,704) |
$ | 8,234,000 | ||||||||||||
|
|
|
|||||||||||||
| Purchased Options – 0.6% | Contracts (c) | Value | ||||||||||||
| S&P 500 Index Put Option |
1,000 | $ | 4,240,000 | |||||||||||
| S&P 500 Index Put Option |
500 | 1,565,000 | ||||||||||||
|
|
|
|||||||||||||
| Total Purchased Options (Cost $4,575,913) |
$ | 5,805,000 | ||||||||||||
|
|
|
|||||||||||||
| Money Market Funds – 2.3% | Shares | Value | ||||||||||||
| Fidelity Institutional Money Market Funds |
20,264,000 | $ | 20,264,000 | |||||||||||
|
|
|
|||||||||||||
| Total Money Market Funds (Cost $20,264,000) |
$ | 20,264,000 | ||||||||||||
|
|
|
|||||||||||||
| Total Investments – 100.9% (Cost $855,662,291) |
(k) | $ | 889,226,145 | |||||||||||
| Total Written Options Outstanding – (0.0)% (see following schedule) |
(115,150) | |||||||||||||
| Liabilities in Excess of Other Assets – (0.9)% |
(d) | (7,719,820) | ||||||||||||
|
|
|
|||||||||||||
| Net Assets – 100.0% |
$ | 881,391,175 | ||||||||||||
|
|
|
|||||||||||||
Percentages are stated as a percent of net assets.
Footnotes:
| (a) | Non-income producing security. |
| (b) | Security exempt from registration under Regulation D of the Securities Act of 1933. These securities may be resold in transactions exempt from registration, normally to qualified buyers under Rule 144A. At June 30, 2015, the value of these securities totaled $81,149,899, or 9.2% of the Portfolio’s net assets. These securities were deemed liquid pursuant to procedures approved by the Board of Directors. |
| (c) | 100 shares per contract. |
| (d) | Security is fully or partially pledged as collateral for written call options outstanding. Collateral also includes a portion of the Portfolio’s cash holdings. Outstanding written call options are presented in the following schedule. |
| (e) | Security is a variable rate instrument in which the coupon rate is adjusted quarterly in concert with U.S. LIBOR. Interest rates stated are those in effect at June 30, 2015. |
| (f) | Security is a variable rate instrument in which the coupon rate is fixed until a later specified date, then is adjusted quarterly in concert with U.S. LIBOR, 10 Year Constant Maturity Treasury Rate, or 30 Year Constant Maturity Treasury Rate. Interest rates stated are those in effect at June 30, 2015. |
| (g) | Security is a variable rate trust preferred security in which the dividend rate is adjusted quarterly in concert with U.S. LIBOR. Dividend rates stated are those in effect at June 30, 2015. |
| (h) | Security is a variable rate preferred stock or trust preferred security in which the dividend rate is fixed until a later specified date, then is adjusted quarterly in concert with U.S. LIBOR. Dividend rates stated are those in effect at June 30, 2015. |
| (i) | Represents bonds that are credit sensitive. The coupon rates for these bonds are subject to adjustment based on changes in national credit rating agency ratings. |
| (j) | Represents a security deemed to be illiquid. At June 30, 2015, the value of illiquid securities in the Portfolio totaled $17,061,249, or 1.9% of the Portfolio’s net assets. |
| (k) | Represents cost for financial reporting purposes, which may differ from cost basis for federal income tax purposes. See also Note 7 of the Notes to Financial Statements. |
The accompanying notes are an integral part of these financial statements.
| 89 | (continued) |
| Ohio National Fund, Inc. | Balanced Portfolio (Continued) |
| Schedule of Written Options Outstanding |
June 30, 2015 (Unaudited) |
| Contracts* | Value | |||||
| S&P 500 Index Call Option |
||||||
| Expiration: August 2015, Exercise Price: $2,175.00 |
350 | $ | 115,150 | |||
|
|
|
|
||||
| Total Written Options Outstanding (Premiums received $419,531) |
350 | $ | 115,150 | |||
|
|
|
|
||||
| * | 100 shares per contract. |
The accompanying notes are an integral part of these financial statements.
| 90 |
| Ohio National Fund, Inc. | Target VIP Portfolio |

| 91 | (continued) |
| Ohio National Fund, Inc. | Target VIP Portfolio (Continued) |
| (1) | Composition of Portfolio subject to change. |
| (2) | Short-term investments have been excluded from the list of Top 10 Portfolio Holdings. |
| (3) | Sectors: |
| % of Net Assets | ||||
| Information Technology |
20.0 | |||
| Consumer Discretionary |
18.0 | |||
| Health Care |
15.2 | |||
| Industrials |
12.8 | |||
| Telecommunication Services |
6.6 | |||
| Financials |
6.6 | |||
| Energy |
6.3 | |||
| Consumer Staples |
5.6 | |||
| Utilities |
4.2 | |||
| Materials |
3.7 | |||
|
|
|
|||
| 99.0 | ||||
|
|
|
| 92 |
| Ohio National Fund, Inc. | Target VIP Portfolio |
| Schedule of Investments |
June 30, 2015 (Unaudited) |
| 93 | (continued) |
| Ohio National Fund, Inc. | Target VIP Portfolio (Continued) |
| Schedule of Investments |
June 30, 2015 (Unaudited) |
Percentages are stated as a percent of net assets.
Abbreviations:
ADR: American Depositary Receipts
Footnotes:
| (a) | Non-income producing security. |
| (b) | Represents cost for financial reporting purposes, which may differ from cost basis for federal income tax purposes. See also Note 7 of the Notes to Financial Statements. |
The accompanying notes are an integral part of these financial statements.
| 94 |
| Ohio National Fund, Inc. | Bristol Growth Portfolio |
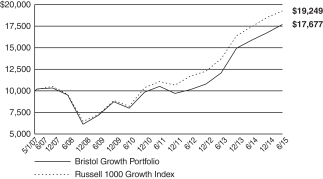
| 95 | (continued) |
| Ohio National Fund, Inc. | Bristol Growth Portfolio (Continued) |
| (1) | Composition of Portfolio subject to change. |
| (2) | Short-term investments have been excluded from the list of Top 10 Portfolio Holdings. |
| (3) | Sectors: |
| % of Net Assets | ||||
| Information Technology |
25.5 | |||
| Consumer Discretionary |
20.2 | |||
| Health Care |
17.8 | |||
| Industrials |
11.6 | |||
| Consumer Staples |
7.6 | |||
| Financials |
6.5 | |||
| Materials |
4.6 | |||
| Energy |
4.1 | |||
| Telecommunication Services |
1.1 | |||
|
|
|
|||
| 99.0 | ||||
|
|
|
| 96 |
| Ohio National Fund, Inc. | Bristol Growth Portfolio |
| Schedule of Investments |
June 30, 2015 (Unaudited) |
Percentages are stated as a percent of net assets.
Footnotes:
| (a) | Non-income producing security. |
| (b) | Represents cost for financial reporting purposes, which may differ from cost basis for federal income tax purposes. See also Note 7 of the Notes to Financial Statements. |
The accompanying notes are an integral part of these financial statements.
| 97 |
| Ohio National Fund, Inc. | Risk Managed Balanced Portfolio |
| 98 | (continued) |
| Ohio National Fund, Inc. | Risk Managed Balanced Portfolio (Continued) |
| 99 | (continued) |
| Ohio National Fund, Inc. | Risk Managed Balanced Portfolio (Continued) |
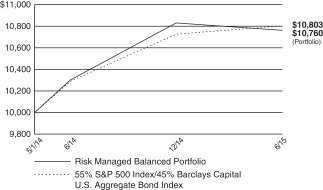
| (1) | Composition of Portfolio subject to change. |
| (2) | Short-term investments have been excluded from the list of Top 10 Portfolio Holdings. |
| (3) | Sectors (combined): |
| % of Net Assets | ||||
| Financials |
12.8 | |||
| Information Technology |
10.9 | |||
| Health Care |
10.8 | |||
| Consumer Discretionary |
8.5 | |||
| Industrials |
6.4 | |||
| Energy |
3.8 | |||
| Materials |
3.7 | |||
| Consumer Staples |
2.4 | |||
| Telecommunication Services |
0.3 | |||
| Utilities |
0.1 | |||
|
|
|
|||
| 59.7 | ||||
|
|
|
| 100 |
| Ohio National Fund, Inc. | Risk Managed Balanced Portfolio |
| Schedule of Investments |
June 30, 2015 (Unaudited) |
| Common Stocks – 42.6% | Shares | Value | ||||||||||||
| CONSUMER DISCRETIONARY – 6.7% |
| |||||||||||||
| General Motors Co. (Automobiles) |
18,551 | $ | 618,305 | |||||||||||
| Las Vegas Sands Corp. (Hotels, Restaurants & Leisure) |
13,570 | 713,375 | ||||||||||||
| Six Flags Entertainment Corp. (Hotels, Restaurants & Leisure) |
4,507 | 202,139 | ||||||||||||
| Starwood Hotels & Resorts Worldwide, Inc. (Hotels, Restaurants & Leisure) |
4,989 | 404,558 | ||||||||||||
| Priceline Group, Inc. / The (Internet & Catalog Retail) |
(a) | 560 | 644,767 | |||||||||||
| Mattel, Inc. (Leisure Products) |
10,134 | 260,342 | ||||||||||||
| Home Depot, Inc. / The (Specialty Retail) |
8,767 | 974,277 | ||||||||||||
| NIKE, Inc. Class B (Textiles, Apparel & Luxury Goods) |
10,727 | 1,158,731 | ||||||||||||
|
|
|
|||||||||||||
| 4,976,494 | ||||||||||||||
|
|
|
|||||||||||||
| CONSUMER STAPLES – 2.1% |
||||||||||||||
| Diageo PLC (Beverages) |
(c) | 5,954 | 172,426 | |||||||||||
| Hershey Co. / The (Food Products) |
4,165 | 369,977 | ||||||||||||
| Altria Group, Inc. (Tobacco) |
11,310 | 553,172 | ||||||||||||
| Philip Morris International, Inc. (Tobacco) |
6,090 | 488,235 | ||||||||||||
|
|
|
|||||||||||||
| 1,583,810 | ||||||||||||||
|
|
|
|||||||||||||
| ENERGY – 1.1% |
||||||||||||||
| Chevron Corp. (Oil, Gas & Consumable Fuels) |
5,714 | 551,230 | ||||||||||||
| Marathon Oil Corp. (Oil, Gas & Consumable Fuels) |
11,233 | 298,124 | ||||||||||||
|
|
|
|||||||||||||
| 849,354 | ||||||||||||||
|
|
|
|||||||||||||
| FINANCIALS – 4.6% |
||||||||||||||
| JPMorgan Chase & Co. (Banks) |
8,840 | 598,998 | ||||||||||||
| U.S. Bancorp (Banks) |
20,167 | 875,248 | ||||||||||||
| TD Ameritrade Holding Corp. (Capital Markets) |
10,044 | 369,820 | ||||||||||||
| American Express Co. (Consumer Finance) |
6,821 | 530,128 | ||||||||||||
| CME Group, Inc. (Diversified Financial Svs.) |
4,144 | 385,641 | ||||||||||||
| Prudential PLC (Insurance) |
(c) | 21,558 | 519,535 | |||||||||||
| Outfront Media, Inc. (Real Estate Investment Trusts) |
5,966 | 150,582 | ||||||||||||
|
|
|
|||||||||||||
| 3,429,952 | ||||||||||||||
|
|
|
|||||||||||||
| HEALTH CARE – 9.7% |
||||||||||||||
| Amgen, Inc. (Biotechnology) |
5,954 | 914,058 | ||||||||||||
| Regeneron Pharmaceuticals, Inc. (Biotechnology) |
(a) | 908 | 463,198 | |||||||||||
| Aetna, Inc. (Health Care Providers & Svs.) |
5,052 | 643,928 | ||||||||||||
| AbbVie, Inc. (Pharmaceuticals) |
17,614 | 1,183,485 | ||||||||||||
| Allergan PLC (Pharmaceuticals) |
(a) | 3,216 | 975,927 | |||||||||||
| Bristol-Myers Squibb Co. (Pharmaceuticals) |
16,131 | 1,073,357 | ||||||||||||
| Eli Lilly & Co. (Pharmaceuticals) |
8,145 | 680,026 | ||||||||||||
| Endo International PLC (Pharmaceuticals) |
(a) | 9,214 | 733,895 | |||||||||||
| Merck & Co., Inc. (Pharmaceuticals) |
10,319 | 587,461 | ||||||||||||
|
|
|
|||||||||||||
| 7,255,335 | ||||||||||||||
|
|
|
|||||||||||||
| INDUSTRIALS – 5.5% |
||||||||||||||
| Boeing Co. / The (Aerospace & Defense) |
6,971 | 967,017 | ||||||||||||
| Honeywell International, Inc. (Aerospace & Defense) |
7,207 | 734,898 | ||||||||||||
| United Continental Holdings, Inc. (Airlines) |
(a) | 10,448 | 553,848 | |||||||||||
| 3M Co. (Industrial Conglomerates) |
2,762 | 426,177 | ||||||||||||
| Dover Corp. (Machinery) |
4,214 | 295,739 | ||||||||||||
| Towers Watson & Co. Class A (Professional Svs.) |
1,681 | 211,470 | ||||||||||||
| Union Pacific Corp. (Road & Rail) |
9,490 | 905,061 | ||||||||||||
|
|
|
|||||||||||||
| 4,094,210 | ||||||||||||||
|
|
|
|||||||||||||
| INFORMATION TECHNOLOGY – 10.0% |
||||||||||||||
| TE Connectivity Ltd. (Electronic Equip., Instr. & Comp.) |
9,490 | 610,207 | ||||||||||||
| Google, Inc. Class C (Internet Software & Svs.) |
(a) | 1,755 | 913,495 | |||||||||||
| Yahoo!, Inc. (Internet Software & Svs.) |
(a) | 10,865 | 426,886 | |||||||||||
| Automatic Data Processing, Inc. (IT Svs.) |
3,202 | 256,896 | ||||||||||||
| MasterCard, Inc. Class A (IT Svs.) |
17,361 | 1,622,906 | ||||||||||||
| NXP Semiconductors NV (Semiconductors & Equip.) |
(a) | 3,517 | 345,369 | |||||||||||
| Microsoft Corp. (Software) |
25,035 | 1,105,295 | ||||||||||||
| Apple, Inc. (Tech. Hardware, Storage & Periph.) |
15,098 | 1,893,667 | ||||||||||||
| Seagate Technology PLC (Tech. Hardware, Storage & Periph.) |
6,645 | 315,638 | ||||||||||||
|
|
|
|||||||||||||
| 7,490,359 | ||||||||||||||
|
|
|
|||||||||||||
| MATERIALS – 2.7% |
||||||||||||||
| E.I. du Pont de Nemours & Co. (Chemicals) |
16,241 | 1,038,612 | ||||||||||||
| LyondellBasell Industries NV Class A (Chemicals) |
9,692 | 1,003,316 | ||||||||||||
|
|
|
|||||||||||||
| 2,041,928 | ||||||||||||||
|
|
|
|||||||||||||
| 101 | (continued) |
| Ohio National Fund, Inc. | Risk Managed Balanced Portfolio (Continued) |
| Schedule of Investments |
June 30, 2015 (Unaudited) |
| Common Stocks (Continued) | Shares | Value | ||||||||||||
| TELECOMMUNICATION SERVICES – 0.2% |
||||||||||||||
| Verizon Communications, Inc. (Diversified Telecom. Svs.) |
2,271 | $ | 105,851 | |||||||||||
|
|
|
|||||||||||||
| Total Common Stocks (Cost $31,602,964) |
$ | 31,827,293 | ||||||||||||
|
|
|
|||||||||||||
| Corporate Bonds – 11.5% | Rate | Maturity | Face Amount | Value | ||||||||||
| CONSUMER DISCRETIONARY – 1.0% |
||||||||||||||
| ZF North America Capital, Inc. (Auto Components) |
(b) | 4.750% | 04/29/2025 | $ | 150,000 | $ | 145,500 | |||||||
| General Motors Co. (Automobiles) |
6.250% | 10/02/2043 | 9,000 | 10,021 | ||||||||||
| General Motors Co. (Automobiles) |
4.875% | 10/02/2023 | 183,000 | 192,685 | ||||||||||
| General Motors Co. (Automobiles) |
3.500% | 10/02/2018 | 42,000 | 43,365 | ||||||||||
| 1011778 BC ULC / New Red Finance, Inc. (Hotels, Restaurants & Leisure) |
(b) | 4.625% | 01/15/2022 | 61,000 | 60,085 | |||||||||
| Brinker International, Inc. (Hotels, Restaurants & Leisure) |
3.875% | 05/15/2023 | 71,000 | 69,140 | ||||||||||
| PPL WEM Holdings Ltd. (Hotels, Restaurants & Leisure) |
(b) | 5.375% | 05/01/2021 | 43,000 | 47,518 | |||||||||
| PPL WEM Holdings Ltd. (Hotels, Restaurants & Leisure) |
(b) | 3.900% | 05/01/2016 | 33,000 | 33,658 | |||||||||
| Wynn Las Vegas LLC / Wynn Las Vegas Capital Corp. (Hotels, Restaurants & Leisure) |
(b) | 4.250% | 05/30/2023 | 16,000 | 14,720 | |||||||||
| D.R. Horton, Inc. (Household Durables) |
4.750% | 05/15/2017 | 27,000 | 28,012 | ||||||||||
| MDC Holdings, Inc. (Household Durables) |
5.500% | 01/15/2024 | 38,000 | 37,335 | ||||||||||
| Toll Brothers Finance Corp. (Household Durables) |
5.875% | 02/15/2022 | 25,000 | 26,812 | ||||||||||
| UBM PLC (Media) |
(b) | 5.750% | 11/03/2020 | 31,000 | 33,422 | |||||||||
| Macy’s Retail Holdings, Inc. (Multiline Retail) |
5.900% | 12/01/2016 | 25,000 | 26,633 | ||||||||||
|
|
|
|||||||||||||
| 768,906 | ||||||||||||||
|
|
|
|||||||||||||
| CONSUMER STAPLES – 0.3% |
||||||||||||||
| Kraft Heinz Foods Co. (Food Products) |
(b) | 3.500% | 07/15/2022 | 30,000 | 30,109 | |||||||||
| Kraft Heinz Foods Co. (Food Products) |
(b) | 2.800% | 07/02/2020 | 35,000 | 34,995 | |||||||||
| Wm. Wrigley Jr. Co. (Food Products) |
(b) | 3.375% | 10/21/2020 | 49,000 | 50,445 | |||||||||
| Wm. Wrigley Jr. Co. (Food Products) |
(b) | 2.400% | 10/21/2018 | 116,000 | 117,580 | |||||||||
|
|
|
|||||||||||||
| 233,129 | ||||||||||||||
|
|
|
|||||||||||||
| ENERGY – 1.7% |
||||||||||||||
| Forum Energy Technologies, Inc. (Energy Equip. & Svs.) |
6.250% | 10/01/2021 | 24,000 | 23,760 | ||||||||||
| Helmerich & Payne International Drilling Co. (Energy Equip. & Svs.) |
(b) | 4.650% | 03/15/2025 | 52,000 | 53,602 | |||||||||
| Oceaneering International, Inc. (Energy Equip. & Svs.) |
4.650% | 11/15/2024 | 90,000 | 89,790 | ||||||||||
| Chesapeake Energy Corp. (Oil, Gas & Consumable Fuels) |
5.375% | 06/15/2021 | 37,000 | 33,485 | ||||||||||
| Chesapeake Energy Corp. (Oil, Gas & Consumable Fuels) |
4.875% | 04/15/2022 | 61,000 | 53,070 | ||||||||||
| Chevron Corp. (Oil, Gas & Consumable Fuels) |
1.345% | 11/15/2017 | 27,000 | 27,105 | ||||||||||
| Cimarex Energy Co. (Oil, Gas & Consumable Fuels) |
5.875% | 05/01/2022 | 140,000 | 149,800 | ||||||||||
| Cimarex Energy Co. (Oil, Gas & Consumable Fuels) |
4.375% | 06/01/2024 | 80,000 | 79,357 | ||||||||||
| DCP Midstream Operating LP (Oil, Gas & Consumable Fuels) |
5.600% | 04/01/2044 | 11,000 | 9,780 | ||||||||||
| DCP Midstream Operating LP (Oil, Gas & Consumable Fuels) |
3.875% | 03/15/2023 | 46,000 | 42,448 | ||||||||||
| DCP Midstream Operating LP (Oil, Gas & Consumable Fuels) |
4.950% | 04/01/2022 | 75,000 | 73,898 | ||||||||||
| Devon Energy Corp. (Oil, Gas & Consumable Fuels) |
2.250% | 12/15/2018 | 46,000 | 46,097 | ||||||||||
| Energy Transfer Partners LP (Oil, Gas & Consumable Fuels) |
4.150% | 10/01/2020 | 31,000 | 31,832 | ||||||||||
| EnLink Midstream Partners LP (Oil, Gas & Consumable Fuels) |
4.400% | 04/01/2024 | 48,000 | 48,065 | ||||||||||
| EnLink Midstream Partners LP (Oil, Gas & Consumable Fuels) |
5.600% | 04/01/2044 | 35,000 | 33,895 | ||||||||||
| Kinder Morgan Energy Partners LP (Oil, Gas & Consumable Fuels) |
5.000% | 10/01/2021 | 58,000 | 61,310 | ||||||||||
| Kinder Morgan Energy Partners LP (Oil, Gas & Consumable Fuels) |
4.300% | 05/01/2024 | 33,000 | 32,521 | ||||||||||
| Kinder Morgan, Inc. (Oil, Gas & Consumable Fuels) |
7.750% | 01/15/2032 | 24,000 | 27,442 | ||||||||||
| Motiva Enterprises LLC (Oil, Gas & Consumable Fuels) |
(b) | 5.750% | 01/15/2020 | 26,000 | 28,565 | |||||||||
| NGL Energy Partners LP / NGL Energy Finance Corp. (Oil, Gas & Consumable Fuels) |
5.125% | 07/15/2019 | 35,000 | 34,912 | ||||||||||
| Phillips 66 Partners LP (Oil, Gas & Consumable Fuels) |
3.605% | 02/15/2025 | 16,000 | 15,035 | ||||||||||
| Plains All American Pipeline LP / PAA Finance Corp. (Oil, Gas & Consumable Fuels) |
3.950% | 09/15/2015 | 71,000 | 71,402 | ||||||||||
| Spectra Energy Partners LP (Oil, Gas & Consumable Fuels) |
4.750% | 03/15/2024 | 53,000 | 56,173 | ||||||||||
| Targa Resources Partners LP / Targa Resources Partners Finance Corp. (Oil, Gas & Consumable Fuels) |
(b) | 4.125% | 11/15/2019 | 35,000 | 34,650 | |||||||||
| Western Gas Partners LP (Oil, Gas & Consumable Fuels) |
5.375% | 06/01/2021 | 93,000 | 100,288 | ||||||||||
|
|
|
|||||||||||||
| 1,258,282 | ||||||||||||||
|
|
|
|||||||||||||
| FINANCIALS – 4.4% |
||||||||||||||
| CIT Group, Inc. (Banks) |
(b) | 5.500% | 02/15/2019 | 99,000 | 103,207 | |||||||||
| CIT Group, Inc. (Banks) |
4.250% | 08/15/2017 | 102,000 | 103,530 | ||||||||||
| Royal Bank of Scotland Group PLC (Banks) |
6.100% | 06/10/2023 | 76,000 | 80,710 | ||||||||||
| Royal Bank of Scotland Group PLC (Banks) |
6.000% | 12/19/2023 | 117,000 | 123,740 | ||||||||||
| Royal Bank of Scotland Group PLC (Banks) |
5.125% | 05/28/2024 | 129,000 | 128,671 | ||||||||||
| Royal Bank of Scotland Group PLC (Banks) |
2.550% | 09/18/2015 | 107,000 | 107,299 | ||||||||||
| Santander UK PLC (Banks) |
(b) | 5.000% | 11/07/2023 | 256,000 | 261,625 | |||||||||
| SVB Financial Group (Banks) |
5.375% | 09/15/2020 | 33,000 | 36,740 | ||||||||||
| Ameriprise Financial, Inc. (Capital Markets) |
(d) | 7.518% | 06/01/2066 | 122,000 | 122,000 | |||||||||
| Carlyle Holdings Finance LLC (Capital Markets) |
(b) | 3.875% | 02/01/2023 | 25,000 | 25,236 | |||||||||
| Charles Schwab Corp. / The (Capital Markets) |
3.000% | 03/10/2025 | 28,000 | 27,421 | ||||||||||
| E*TRADE Financial Corp. (Capital Markets) |
5.375% | 11/15/2022 | 66,000 | 67,650 | ||||||||||
| 102 | (continued) |
| Ohio National Fund, Inc. | Risk Managed Balanced Portfolio (Continued) |
| Schedule of Investments |
June 30, 2015 (Unaudited) |
| Corporate Bonds (Continued) | Rate | Maturity | Face Amount | Value | ||||||||||
| FINANCIALS (continued) |
||||||||||||||
| E*TRADE Financial Corp. (Capital Markets) |
4.625% | 09/15/2023 | $ | 89,000 | $ | 87,442 | ||||||||
| Goldman Sachs Group, Inc. / The (Capital Markets) |
5.625% | 01/15/2017 | 31,000 | 32,823 | ||||||||||
| Lazard Group LLC (Capital Markets) |
4.250% | 11/14/2020 | 72,000 | 75,634 | ||||||||||
| Neuberger Berman Group LLC / Neuberger Berman Finance Corp. (Capital Markets) |
(b) | 5.875% | 03/15/2022 | 137,000 | 146,419 | |||||||||
| Neuberger Berman Group LLC / Neuberger Berman Finance Corp. (Capital Markets) |
(b) | 4.875% | 04/15/2045 | 57,000 | 51,503 | |||||||||
| Raymond James Financial, Inc. (Capital Markets) |
5.625% | 04/01/2024 | 127,000 | 141,089 | ||||||||||
| Raymond James Financial, Inc. (Capital Markets) |
4.250% | 04/15/2016 | 77,000 | 78,920 | ||||||||||
| Stifel Financial Corp. (Capital Markets) |
4.250% | 07/18/2024 | 40,000 | 39,467 | ||||||||||
| TD Ameritrade Holding Corp. (Capital Markets) |
3.625% | 04/01/2025 | 116,000 | 117,626 | ||||||||||
| TD Ameritrade Holding Corp. (Capital Markets) |
2.950% | 04/01/2022 | 40,000 | 39,623 | ||||||||||
| Ally Financial, Inc. (Consumer Finance) |
8.000% | 12/31/2018 | 13,000 | 14,511 | ||||||||||
| Ally Financial, Inc. (Consumer Finance) |
4.125% | 03/30/2020 | 51,000 | 50,904 | ||||||||||
| Ally Financial, Inc. (Consumer Finance) |
4.625% | 05/19/2022 | 43,000 | 42,462 | ||||||||||
| American Express Co. (Consumer Finance) |
(d) | 6.800% | 09/01/2066 | 65,000 | 66,878 | |||||||||
| Discover Financial Services (Consumer Finance) |
3.950% | 11/06/2024 | 12,000 | 11,643 | ||||||||||
| Discover Financial Services (Consumer Finance) |
3.750% | 03/04/2025 | 60,000 | 57,203 | ||||||||||
| Synchrony Financial (Consumer Finance) |
3.000% | 08/15/2019 | 59,000 | 59,376 | ||||||||||
| GE Capital Trust I (Diversified Financial Svs.) |
(d) | 6.375% | 11/15/2067 | 133,000 | 142,044 | |||||||||
| General Electric Capital Corp. (Diversified Financial Svs.) |
(d) | 6.375% | 11/15/2067 | 57,000 | 61,275 | |||||||||
| LeasePlan Corp. NV (Diversified Financial Svs.) |
(b) | 2.500% | 05/16/2018 | 241,000 | 241,230 | |||||||||
| Voya Financial, Inc. (Diversified Financial Svs.) |
(d) | 5.650% | 05/15/2053 | 24,000 | 24,480 | |||||||||
| CNO Financial Group, Inc. (Insurance) |
4.500% | 05/30/2020 | 12,000 | 12,180 | ||||||||||
| CNO Financial Group, Inc. (Insurance) |
5.250% | 05/30/2025 | 33,000 | 33,535 | ||||||||||
| Primerica, Inc. (Insurance) |
4.750% | 07/15/2022 | 66,000 | 70,335 | ||||||||||
| Alexandria Real Estate Equities, Inc. (Real Estate Investment Trusts) |
4.600% | 04/01/2022 | 63,000 | 66,308 | ||||||||||
| Alexandria Real Estate Equities, Inc. (Real Estate Investment Trusts) |
2.750% | 01/15/2020 | 51,000 | 50,408 | ||||||||||
| Alexandria Real Estate Equities, Inc. (Real Estate Investment Trusts) |
4.500% | 07/30/2029 | 49,000 | 48,997 | ||||||||||
| Retail Opportunity Investments Partnership LP (Real Estate Investment Trusts) |
4.000% | 12/15/2024 | 10,000 | 9,880 | ||||||||||
| Retail Opportunity Investments Partnership LP (Real Estate Investment Trusts) |
5.000% | 12/15/2023 | 22,000 | 23,054 | ||||||||||
| Senior Housing Properties Trust (Real Estate Investment Trusts) |
6.750% | 12/15/2021 | 29,000 | 32,985 | ||||||||||
| SL Green Realty Corp. (Real Estate Investment Trusts) |
7.750% | 03/15/2020 | 35,000 | 41,667 | ||||||||||
| SL Green Realty Corp. (Real Estate Investment Trusts) |
5.000% | 08/15/2018 | 55,000 | 58,856 | ||||||||||
| Jones Lang LaSalle, Inc. (Real Estate Mgmt. & Development) |
4.400% | 11/15/2022 | 30,000 | 30,735 | ||||||||||
| Kennedy-Wilson, Inc. (Real Estate Mgmt. & Development) |
5.875% | 04/01/2024 | 60,000 | 59,700 | ||||||||||
|
|
|
|||||||||||||
| 3,309,021 | ||||||||||||||
|
|
|
|||||||||||||
| HEALTH CARE – 1.1% |
||||||||||||||
| Becton Dickinson and Co. (Health Care Equip. & Supplies) |
1.800% | 12/15/2017 | 31,000 | 30,998 | ||||||||||
| Zimmer Biomet Holdings, Inc. (Health Care Equip. & Supplies) |
2.700% | 04/01/2020 | 47,000 | 46,717 | ||||||||||
| Zimmer Biomet Holdings, Inc. (Health Care Equip. & Supplies) |
3.550% | 04/01/2025 | 88,000 | 85,170 | ||||||||||
| Zimmer Biomet Holdings, Inc. (Health Care Equip. & Supplies) |
3.150% | 04/01/2022 | 55,000 | 54,050 | ||||||||||
| Fresenius Medical Care U.S. Finance II, Inc. (Health Care Providers & Svs.) |
(b) | 5.875% | 01/31/2022 | 49,000 | 52,185 | |||||||||
| HCA, Inc. (Health Care Providers & Svs.) |
3.750% | 03/15/2019 | 25,000 | 25,187 | ||||||||||
| Laboratory Corp. of America Holdings (Health Care Providers & Svs.) |
3.200% | 02/01/2022 | 57,000 | 56,134 | ||||||||||
| Laboratory Corp. of America Holdings (Health Care Providers & Svs.) |
3.600% | 02/01/2025 | 57,000 | 54,325 | ||||||||||
| Omnicare, Inc. (Health Care Providers & Svs.) |
4.750% | 12/01/2022 | 23,000 | 24,380 | ||||||||||
| Omnicare, Inc. (Health Care Providers & Svs.) |
5.000% | 12/01/2024 | 19,000 | 20,425 | ||||||||||
| Life Technologies Corp. (Life Sciences Tools & Svs.) |
6.000% | 03/01/2020 | 34,000 | 38,214 | ||||||||||
| Thermo Fisher Scientific, Inc. (Life Sciences Tools & Svs.) |
3.300% | 02/15/2022 | 19,000 | 18,755 | ||||||||||
| Actavis Funding SCS (Pharmaceuticals) |
4.850% | 06/15/2044 | 16,000 | 15,382 | ||||||||||
| Actavis Funding SCS (Pharmaceuticals) |
3.850% | 06/15/2024 | 14,000 | 13,812 | ||||||||||
| Actavis Funding SCS (Pharmaceuticals) |
2.450% | 06/15/2019 | 5,000 | 4,976 | ||||||||||
| Actavis Funding SCS (Pharmaceuticals) |
4.750% | 03/15/2045 | 25,000 | 23,697 | ||||||||||
| Actavis Funding SCS (Pharmaceuticals) |
4.550% | 03/15/2035 | 37,000 | 35,074 | ||||||||||
| Actavis Funding SCS (Pharmaceuticals) |
3.000% | 03/12/2020 | 85,000 | 85,231 | ||||||||||
| Actavis Funding SCS (Pharmaceuticals) |
3.800% | 03/15/2025 | 88,000 | 86,313 | ||||||||||
| VRX Escrow Corp. (Pharmaceuticals) |
(b) | 6.125% | 04/15/2025 | 21,000 | 21,630 | |||||||||
| VRX Escrow Corp. (Pharmaceuticals) |
(b) | 5.875% | 05/15/2023 | 21,000 | 21,499 | |||||||||
|
|
|
|||||||||||||
| 814,154 | ||||||||||||||
|
|
|
|||||||||||||
| INDUSTRIALS – 0.9% |
||||||||||||||
| Exelis, Inc. (Aerospace & Defense) |
5.550% | 10/01/2021 | 18,000 | 19,785 | ||||||||||
| Exelis, Inc. (Aerospace & Defense) |
4.250% | 10/01/2016 | 15,000 | 15,479 | ||||||||||
| Southwest Airlines Co. (Airlines) |
5.125% | 03/01/2017 | 36,000 | 38,194 | ||||||||||
| Owens Corning (Building Products) |
4.200% | 12/01/2024 | 22,000 | 21,563 | ||||||||||
| CNH Industrial Capital LLC (Machinery) |
3.625% | 04/15/2018 | 25,000 | 25,000 | ||||||||||
| Verisk Analytics, Inc. (Professional Svs.) |
5.800% | 05/01/2021 | 170,000 | 191,079 | ||||||||||
| Verisk Analytics, Inc. (Professional Svs.) |
4.125% | 09/12/2022 | 24,000 | 24,409 | ||||||||||
| Verisk Analytics, Inc. (Professional Svs.) |
4.875% | 01/15/2019 | 22,000 | 23,503 | ||||||||||
| 103 | (continued) |
| Ohio National Fund, Inc. | Risk Managed Balanced Portfolio (Continued) |
| Schedule of Investments |
June 30, 2015 (Unaudited) |
| Corporate Bonds (Continued) | Rate | Maturity | Face Amount | Value | ||||||||||
| INDUSTRIALS (continued) |
||||||||||||||
| Verisk Analytics, Inc. (Professional Svs.) |
4.000% | 06/15/2025 | $ | 104,000 | $ | 101,733 | ||||||||
| Verisk Analytics, Inc. (Professional Svs.) |
5.500% | 06/15/2045 | 57,000 | 55,870 | ||||||||||
| J.B. Hunt Transport Services, Inc. (Road & Rail) |
3.375% | 09/15/2015 | 42,000 | 42,211 | ||||||||||
| Penske Truck Leasing Co. LP / PTL Finance Corp. (Road & Rail) |
(b) | 3.375% | 03/15/2018 | 37,000 | 38,115 | |||||||||
| Penske Truck Leasing Co. LP / PTL Finance Corp. (Road & Rail) |
(b) | 4.250% | 01/17/2023 | 63,000 | 63,768 | |||||||||
| Penske Truck Leasing Co. LP / PTL Finance Corp. (Road & Rail) |
(b) | 2.500% | 06/15/2019 | 27,000 | 26,723 | |||||||||
|
|
|
|||||||||||||
| 687,432 | ||||||||||||||
|
|
|
|||||||||||||
| INFORMATION TECHNOLOGY – 0.9% |
||||||||||||||
| Harris Corp. (Communications Equip.) |
3.832% | 04/27/2025 | 20,000 | 19,412 | ||||||||||
| Harris Corp. (Communications Equip.) |
5.054% | 04/27/2045 | 26,000 | 24,684 | ||||||||||
| Seagate HDD Cayman (Computers & Peripherals) |
(b) | 4.750% | 01/01/2025 | 196,000 | 194,737 | |||||||||
| Seagate HDD Cayman (Computers & Peripherals) |
4.750% | 06/01/2023 | 28,000 | 28,497 | ||||||||||
| Seagate HDD Cayman (Computers & Peripherals) |
(b) | 5.750% | 12/01/2034 | 55,000 | 54,008 | |||||||||
| Seagate HDD Cayman (Computers & Peripherals) |
(b) | 4.875% | 06/01/2027 | 51,000 | 49,492 | |||||||||
| FLIR Systems, Inc. (Electronic Equip., Instr. & Comp.) |
3.750% | 09/01/2016 | 24,000 | 24,600 | ||||||||||
| Molex Electronic Technologies, LLC (Electronic Equip., Instr. & Comp.) |
(b) | 2.878% | 04/15/2020 | 22,000 | 21,644 | |||||||||
| Molex Electronic Technologies, LLC (Electronic Equip., Instr. & Comp.) |
(b) | 3.900% | 04/15/2025 | 72,000 | 69,659 | |||||||||
| Trimble Navigation Ltd. (Electronic Equip., Instr. & Comp.) |
4.750% | 12/01/2024 | 42,000 | 41,997 | ||||||||||
| Fidelity National Information Services, Inc. (IT Svs.) |
5.000% | 03/15/2022 | 9,000 | 9,498 | ||||||||||
| Fiserv, Inc. (IT Svs.) |
3.125% | 10/01/2015 | 32,000 | 32,170 | ||||||||||
| Autodesk, Inc. (Software) |
3.600% | 12/15/2022 | 33,000 | 32,786 | ||||||||||
| Cadence Design Systems, Inc. (Software) |
4.375% | 10/15/2024 | 76,000 | 76,137 | ||||||||||
|
|
|
|||||||||||||
| 679,321 | ||||||||||||||
|
|
|
|||||||||||||
| MATERIALS – 1.0% |
||||||||||||||
| Albemarle Corp. (Chemicals) |
5.450% | 12/01/2044 | 52,000 | 51,870 | ||||||||||
| Albemarle Corp. (Chemicals) |
4.150% | 12/01/2024 | 63,000 | 62,705 | ||||||||||
| Ashland, Inc. (Chemicals) |
3.875% | 04/15/2018 | 28,000 | 28,770 | ||||||||||
| Ashland, Inc. (Chemicals) |
6.875% | 05/15/2043 | 45,000 | 45,675 | ||||||||||
| LyondellBasell Industries NV (Chemicals) |
4.625% | 02/26/2055 | 78,000 | 68,420 | ||||||||||
| Rockwood Specialties Group, Inc. (Chemicals) |
4.625% | 10/15/2020 | 87,000 | 90,589 | ||||||||||
| Hanson Ltd. (Construction Materials) |
6.125% | 08/15/2016 | 34,000 | 35,411 | ||||||||||
| Martin Marietta Materials, Inc. (Construction Materials) |
4.250% | 07/02/2024 | 27,000 | 27,295 | ||||||||||
| Vulcan Materials Co. (Construction Materials) |
7.000% | 06/15/2018 | 40,000 | 45,200 | ||||||||||
| Vulcan Materials Co. (Construction Materials) |
7.500% | 06/15/2021 | 18,000 | 20,700 | ||||||||||
| Vulcan Materials Co. (Construction Materials) |
4.500% | 04/01/2025 | 89,000 | 88,777 | ||||||||||
| Reliance Steel & Aluminum Co. (Metals & Mining) |
4.500% | 04/15/2023 | 60,000 | 58,953 | ||||||||||
| Georgia-Pacific LLC (Paper & Forest Products) |
(b) | 3.163% | 11/15/2021 | 54,000 | 54,597 | |||||||||
| Georgia-Pacific LLC (Paper & Forest Products) |
(b) | 3.600% | 03/01/2025 | 83,000 | 82,060 | |||||||||
|
|
|
|||||||||||||
| 761,022 | ||||||||||||||
|
|
|
|||||||||||||
| TELECOMMUNICATION SERVICES – 0.1% |
||||||||||||||
| Sprint Corp. (Wireless Telecom. Svs.) |
7.250% | 09/15/2021 | 59,000 | 58,078 | ||||||||||
|
|
|
|||||||||||||
| UTILITIES – 0.1% |
||||||||||||||
| IPALCO Enterprises, Inc. (Electric Utilities) |
5.000% | 05/01/2018 | 34,000 | 35,870 | ||||||||||
|
|
|
|||||||||||||
| Total Corporate Bonds (Cost $8,789,806) |
$ | 8,605,215 | ||||||||||||
|
|
|
|||||||||||||
| Preferred Stocks – 0.5% | Rate | Quantity | Value | |||||||||||
| FINANCIALS – 0.5% |
||||||||||||||
| Zions Bancorporation (Banks) |
(e) | 5.800% | 38,000 | $ | 36,148 | |||||||||
| Charles Schwab Corp. Series A / The (Capital Markets) |
(e) | 7.000% | 59,000 | 68,497 | ||||||||||
| Ally Financial, Inc. (Consumer Finance) |
(b) | 7.000% | 45 | 45,696 | ||||||||||
| General Electric Capital Corp. (Diversified Financial Svs.) |
(e) | 7.125% | 100,000 | 115,375 | ||||||||||
| General Electric Capital Corp. (Diversified Financial Svs.) |
(e) | 6.250% | 100,000 | 109,375 | ||||||||||
| General Electric Capital Corp. (Diversified Financial Svs.) |
4.700% | 239 | 5,808 | |||||||||||
|
|
|
|||||||||||||
| 380,899 | ||||||||||||||
|
|
|
|||||||||||||
| HEALTH CARE – 0.0% |
||||||||||||||
| Allergan PLC (Pharmaceuticals) |
5.500% | 11 | 11,468 | |||||||||||
|
|
|
|||||||||||||
| Total Preferred Stocks (Cost $393,649) |
$ | 392,367 | ||||||||||||
|
|
|
|||||||||||||
| 104 | (continued) |
| Ohio National Fund, Inc. | Risk Managed Balanced Portfolio (Continued) |
| Schedule of Investments |
June 30, 2015 (Unaudited) |
| Trust Preferred Securities – 0.2% | Rate | Quantity | Value | |||||||||||
| FINANCIALS – 0.2% |
||||||||||||||
| Citigroup Capital XIII (Banks) |
(e) | 7.875% | 1,600 | $ | 41,536 | |||||||||
| Goldman Sachs Capital I (Capital Markets) |
6.345% | 99,000 | 114,516 | |||||||||||
| Morgan Stanley Capital Trust III (Capital Markets) |
6.250% | 323 | 8,246 | |||||||||||
| Morgan Stanley Capital Trust IV (Capital Markets) |
6.250% | 73 | 1,857 | |||||||||||
| Morgan Stanley Capital Trust V (Capital Markets) |
5.750% | 23 | 581 | |||||||||||
| Morgan Stanley Capital Trust VIII (Capital Markets) |
6.450% | 13 | 330 | |||||||||||
|
|
|
|||||||||||||
| Total Trust Preferred Securities (Cost $170,357) |
$ | 167,066 | ||||||||||||
|
|
|
|||||||||||||
| Preferred Stock Depository Receipts – 0.5% | Rate | Shares | Value | |||||||||||
| FINANCIALS – 0.5% |
||||||||||||||
| Bank of America Corp. (Banks) |
(f) | 8.000% | 59,000 | $ | 62,245 | |||||||||
| Citigroup, Inc. (Banks) |
(f) | 5.800% | 22,000 | 22,055 | ||||||||||
| Wells Fargo & Co. (Banks) |
(h) | 6.625% | 2,500 | 69,000 | ||||||||||
| Morgan Stanley (Capital Markets) |
(f) | 5.550% | 45,000 | 44,674 | ||||||||||
| Morgan Stanley (Capital Markets) |
(h) | 7.125% | 1,650 | 46,117 | ||||||||||
| Morgan Stanley (Capital Markets) |
(h) | 6.875% | 1,200 | 32,016 | ||||||||||
| Discover Financial Services (Consumer Finance) |
(g) | 6.500% | 2,625 | 66,859 | ||||||||||
|
|
|
|||||||||||||
| Total Preferred Stock Depository Receipts (Cost $346,884) |
$ | 342,966 | ||||||||||||
|
|
|
|||||||||||||
| Master Limited Partnerships – 2.8% | Shares | Value | ||||||||||||
| ENERGY – 1.0% |
||||||||||||||
| Enterprise Products Partners LP (Oil, Gas & Consumable Fuels) |
25,188 | $ | 752,869 | |||||||||||
|
|
|
|||||||||||||
| FINANCIALS – 1.8% |
||||||||||||||
| Blackstone Group LP / The (Capital Markets) |
32,995 | 1,348,506 | ||||||||||||
|
|
|
|||||||||||||
| Total Master Limited Partnerships (Cost $2,020,401) |
$ | 2,101,375 | ||||||||||||
|
|
|
|||||||||||||
| Asset-Backed / Mortgage-Backed Securities – 1.6% | Rate | Maturity | Face Amount | Value | ||||||||||
| CONSUMER DISCRETIONARY – 0.8% |
||||||||||||||
| Applebee’s Funding LLC / IHOP Funding LLC 2014-1 A2 |
(b) | 4.277% | 09/05/2044 | $ | 7,000 | $ | 7,089 | |||||||
| CKE Restaurant Holdings, Inc. 2013-1A A2 |
(b) | 4.474% | 03/20/2043 | 48,313 | 49,021 | |||||||||
| DB Master Finance LLC 2015-1A A2I |
(b) | 3.262% | 02/20/2045 | 49,875 | 50,034 | |||||||||
| Hilton U.S.A. Trust 2013-HLT EFX |
(b) | 5.609% | 11/05/2030 | 150,000 | 151,949 | |||||||||
| Hilton U.S.A. Trust 2013-HLT DFX |
(b) | 4.407% | 11/05/2030 | 250,000 | 252,036 | |||||||||
| Wendys Funding LLC 2015-1A A2I |
(b) | 3.371% | 06/15/2045 | 85,000 | 84,793 | |||||||||
|
|
|
|||||||||||||
| 594,922 | ||||||||||||||
|
|
|
|||||||||||||
| FINANCIALS – 0.8% |
||||||||||||||
| AmeriCredit Automobile Receivables Trust 2012-4 D |
2.680% | 10/09/2018 | 100,000 | 101,850 | ||||||||||
| AmeriCredit Automobile Receivables Trust 2012-4 E |
(b) | 3.820% | 02/10/2020 | 145,000 | 148,646 | |||||||||
| AmeriCredit Automobile Receivables Trust 2015-2 D |
3.000% | 06/08/2021 | 20,000 | 20,020 | ||||||||||
| Banc of America Commercial Mortgage Trust 2006-6 AJ |
5.421% | 10/10/2045 | 120,000 | 123,630 | ||||||||||
| COMM 2007-C9 Mortgage Trust AJ |
5.650% | 12/10/2049 | 10,000 | 10,447 | ||||||||||
| GCCFC Commercial Mortgage Trust 2007-GG11 AM |
5.867% | 12/10/2049 | 50,000 | 53,624 | ||||||||||
| GAHR Commericial Mortgage Trust 2015-NRF DFX |
(b) | 3.495% | 12/15/2019 | 10,000 | 9,789 | |||||||||
| LB-UBS Commercial Mortgage Trust 2007-C2 AM |
5.493% | 02/15/2040 | 10,000 | 10,488 | ||||||||||
| Santander Drive Auto Receivables Trust 2015-1 D |
3.240% | 04/15/2021 | 16,000 | 16,080 | ||||||||||
| Wachovia Bank Commercial Mortgage Trust Series 2007-C30 AM |
5.383% | 12/15/2043 | 57,681 | 60,607 | ||||||||||
| Wachovia Bank Commercial Mortgage Trust Series 2007-C31 AJ |
5.660% | 04/15/2047 | 40,000 | 41,022 | ||||||||||
| Wachovia Bank Commercial Mortgage Trust Series 2007-C33 AJ |
6.150% | 02/15/2051 | 25,621 | 26,484 | ||||||||||
|
|
|
|||||||||||||
| 622,687 | ||||||||||||||
|
|
|
|||||||||||||
| Total Asset-Backed / Mortgage-Backed Securities (Cost $1,227,895) |
$ | 1,217,609 | ||||||||||||
|
|
|
|||||||||||||
| U.S. Treasury Obligations – 15.5% | Rate | Maturity | Face Amount | Value | ||||||||||
| U.S. Treasury Note |
0.375% | 05/31/2016 | $ | 118,000 | $ | 118,074 | ||||||||
| U.S. Treasury Note |
0.500% | 06/30/2016 | 861,000 | 862,278 | ||||||||||
| U.S. Treasury Note |
0.625% | 07/15/2016 | 1,066,000 | 1,068,748 | ||||||||||
| U.S. Treasury Note |
0.625% | 12/31/2016 | 772,000 | 773,327 | ||||||||||
| U.S. Treasury Note |
0.500% | 01/31/2017 | 845,000 | 844,406 | ||||||||||
| U.S. Treasury Note |
0.875% | 02/28/2017 | 4,000 | 4,020 | ||||||||||
| U.S. Treasury Note |
0.500% | 04/30/2017 | 350,000 | 349,289 | ||||||||||
| U.S. Treasury Note |
0.625% | 05/31/2017 | 59,000 | 58,968 | ||||||||||
| U.S. Treasury Note |
0.875% | 07/15/2017 | 8,000 | 8,031 | ||||||||||
| U.S. Treasury Note |
1.000% | 09/15/2017 | 1,000 | 1,006 | ||||||||||
| U.S. Treasury Note |
0.875% | 10/15/2017 | 2,000 | 2,004 | ||||||||||
| 105 | (continued) |
| Ohio National Fund, Inc. | Risk Managed Balanced Portfolio (Continued) |
| Schedule of Investments |
June 30, 2015 (Unaudited) |
| U.S. Treasury Obligations (Continued) | Rate | Maturity | Face Amount | Value | ||||||||||
| U.S. Treasury Note |
1.000% | 12/15/2017 | $ | 354,000 | $ | 355,327 | ||||||||
| U.S. Treasury Note |
0.875% | 01/31/2018 | 6,000 | 5,999 | ||||||||||
| U.S. Treasury Note |
1.375% | 07/31/2018 | 316,000 | 318,962 | ||||||||||
| U.S. Treasury Note |
1.500% | 08/31/2018 | 374,000 | 378,617 | ||||||||||
| U.S. Treasury Note |
1.375% | 09/30/2018 | 1,247,000 | 1,256,450 | ||||||||||
| U.S. Treasury Note |
1.250% | 10/31/2018 | 246,000 | 246,673 | ||||||||||
| U.S. Treasury Note |
1.625% | 07/31/2019 | 213,000 | 214,697 | ||||||||||
| U.S. Treasury Note |
1.750% | 09/30/2019 | 190,000 | 192,123 | ||||||||||
| U.S. Treasury Note |
1.500% | 10/31/2019 | 282,000 | 281,912 | ||||||||||
| U.S. Treasury Note |
1.500% | 11/30/2019 | 344,000 | 343,785 | ||||||||||
| U.S. Treasury Note |
1.625% | 12/31/2019 | 292,000 | 292,935 | ||||||||||
| U.S. Treasury Note |
1.375% | 03/31/2020 | 8,000 | 7,915 | ||||||||||
| U.S. Treasury Note |
2.125% | 09/30/2021 | 153,000 | 154,386 | ||||||||||
| U.S. Treasury Note |
2.125% | 12/31/2021 | 215,000 | 216,478 | ||||||||||
| U.S. Treasury Note |
1.750% | 05/15/2023 | 65,000 | 62,806 | ||||||||||
| U.S. Treasury Note |
2.500% | 08/15/2023 | 242,000 | 246,935 | ||||||||||
| U.S. Treasury Note |
2.750% | 11/15/2023 | 336,000 | 348,889 | ||||||||||
| U.S. Treasury Note |
2.500% | 05/15/2024 | 174,000 | 176,746 | ||||||||||
| U.S. Treasury Note |
2.375% | 08/15/2024 | 44,000 | 44,172 | ||||||||||
| U.S. Treasury Note |
(j) | 2.250% | 11/15/2024 | 1,425,000 | 1,413,868 | |||||||||
| U.S. Treasury Note |
2.000% | 02/15/2025 | 31,000 | 30,075 | ||||||||||
| U.S. Treasury Note |
2.125% | 05/15/2025 | 361,000 | 353,864 | ||||||||||
| U.S. Treasury Note |
3.750% | 11/15/2043 | 225,000 | 251,894 | ||||||||||
| U.S. Treasury Note |
3.625% | 02/15/2044 | 50,000 | 54,727 | ||||||||||
| U.S. Treasury Note |
3.375% | 05/15/2044 | 43,000 | 44,952 | ||||||||||
| U.S. Treasury Note |
3.000% | 05/15/2045 | 184,000 | 179,457 | ||||||||||
|
|
|
|||||||||||||
| Total U.S. Treasury Obligations (Cost $11,602,741) |
$ | 11,564,795 | ||||||||||||
|
|
|
|||||||||||||
| U.S. Government Agency Mortgage-Backed Securities – 6.2% | Rate | Maturity | Face Amount | Value | ||||||||||
| Fannie Mae Pool |
4.000% | 06/01/2029 | $ | 7,463 | $ | 8,024 | ||||||||
| Fannie Mae Pool |
4.000% | 09/01/2029 | 253,778 | 272,844 | ||||||||||
| Fannie Mae Pool |
3.500% | 10/01/2029 | 29,326 | 30,884 | ||||||||||
| Fannie Mae Pool |
4.000% | 04/01/2034 | 23,428 | 25,250 | ||||||||||
| Fannie Mae Pool |
5.500% | 04/01/2040 | 335,893 | 378,725 | ||||||||||
| Fannie Mae Pool |
5.500% | 05/01/2041 | 8,425 | 9,455 | ||||||||||
| Fannie Mae Pool |
5.500% | 07/01/2041 | 46,221 | 51,903 | ||||||||||
| Fannie Mae Pool |
4.000% | 06/01/2042 | 16,664 | 17,759 | ||||||||||
| Fannie Mae Pool |
3.500% | 07/01/2042 | 39,729 | 41,047 | ||||||||||
| Fannie Mae Pool |
4.000% | 07/01/2042 | 127,995 | 136,393 | ||||||||||
| Fannie Mae Pool |
4.000% | 08/01/2042 | 7,613 | 8,113 | ||||||||||
| Fannie Mae Pool |
4.000% | 09/01/2042 | 9,348 | 9,965 | ||||||||||
| Fannie Mae Pool |
4.000% | 12/01/2042 | 6,485 | 6,926 | ||||||||||
| Fannie Mae Pool |
3.500% | 01/01/2043 | 44,074 | 45,404 | ||||||||||
| Fannie Mae Pool |
3.500% | 02/01/2043 | 68,506 | 70,576 | ||||||||||
| Fannie Mae Pool |
3.500% | 02/01/2043 | 43,575 | 44,889 | ||||||||||
| Fannie Mae Pool |
4.500% | 03/01/2043 | 214,154 | 235,300 | ||||||||||
| Fannie Mae Pool |
4.000% | 08/01/2043 | 23,423 | 24,969 | ||||||||||
| Fannie Mae Pool |
3.500% | 04/01/2044 | 7,320 | 7,562 | ||||||||||
| Fannie Mae Pool |
3.500% | 05/01/2044 | 52,501 | 54,342 | ||||||||||
| Fannie Mae Pool |
4.500% | 05/01/2044 | 331,415 | 365,107 | ||||||||||
| Fannie Mae Pool |
4.000% | 06/01/2044 | 179,767 | 191,610 | ||||||||||
| Fannie Mae Pool |
4.000% | 07/01/2044 | 53,003 | 56,739 | ||||||||||
| Fannie Mae Pool |
5.000% | 07/01/2044 | 258,560 | 291,893 | ||||||||||
| Fannie Mae Pool |
4.000% | 08/01/2044 | 33,425 | 35,782 | ||||||||||
| Fannie Mae Pool |
4.500% | 08/01/2044 | 77,994 | 85,933 | ||||||||||
| Fannie Mae Pool |
4.500% | 10/01/2044 | 49,446 | 54,392 | ||||||||||
| Fannie Mae Pool |
4.500% | 10/01/2044 | 58,986 | 64,995 | ||||||||||
| Fannie Mae Pool |
3.500% | 02/01/2045 | 54,570 | 56,212 | ||||||||||
| Fannie Mae Pool |
4.500% | 03/01/2045 | 90,706 | 99,778 | ||||||||||
| Fannie Mae Pool |
4.500% | 05/01/2045 | 170,841 | 188,957 | ||||||||||
| Freddie Mac Gold Pool |
3.500% | 07/01/2029 | 89,187 | 93,965 | ||||||||||
| Freddie Mac Gold Pool |
3.500% | 09/01/2029 | 382,337 | 402,882 | ||||||||||
| Freddie Mac Gold Pool |
5.500% | 08/01/2041 | 153,311 | 176,032 | ||||||||||
| Freddie Mac Gold Pool |
3.500% | 02/01/2044 | 19,965 | 20,567 | ||||||||||
| Freddie Mac Gold Pool |
4.000% | 08/01/2044 | 92,678 | 98,861 | ||||||||||
| Ginnie Mae I Pool |
5.000% | 01/15/2040 | 294,428 | 326,840 | ||||||||||
| Ginnie Mae I Pool |
5.000% | 05/15/2040 | 130,453 | 146,982 | ||||||||||
| Ginnie Mae I Pool |
5.000% | 06/15/2044 | 44,540 | 50,477 | ||||||||||
| 106 | (continued) |
| Ohio National Fund, Inc. | Risk Managed Balanced Portfolio (Continued) |
| Schedule of Investments |
June 30, 2015 (Unaudited) |
| U.S. Government Agency Mortgage-Backed Securities (Continued) | Rate | Maturity | Face Amount | Value | ||||||||||
| Ginnie Mae I Pool |
5.000% | 06/15/2044 | $ | 89,879 | $ | 101,763 | ||||||||
| Ginnie Mae I Pool |
4.000% | 04/15/2045 | 162,496 | 175,621 | ||||||||||
| Ginnie Mae II Pool |
5.500% | 11/20/2037 | 6,451 | 7,220 | ||||||||||
| Ginnie Mae II Pool |
5.500% | 05/20/2042 | 9,399 | 10,700 | ||||||||||
|
|
|
|||||||||||||
| Total U.S. Government Agency Mortgage-Backed Securities (Cost $4,584,651) |
$ | 4,583,638 | ||||||||||||
|
|
|
|||||||||||||
| Purchased Options – 5.6% | Contracts (i) | Value | ||||||||||||
| SPDR S&P 500 ETF Trust Put Option |
99 | $ | 139,986 | |||||||||||
| SPDR S&P 500 ETF Trust Put Option |
152 | 242,972 | ||||||||||||
| SPDR S&P 500 ETF Trust Put Option |
116 | 207,988 | ||||||||||||
| SPDR S&P 500 ETF Trust Put Option |
140 | 285,530 | ||||||||||||
| SPDR S&P 500 ETF Trust Put Option |
155 | 349,370 | ||||||||||||
| SPDR S&P 500 ETF Trust Put Option |
134 | 328,702 | ||||||||||||
| SPDR S&P 500 ETF Trust Put Option |
190 | 509,010 | ||||||||||||
| SPDR S&P 500 ETF Trust Put Option |
40 | 117,380 | ||||||||||||
| SPDR S&P 500 ETF Trust Put Option |
20 | 62,820 | ||||||||||||
| SPDR S&P 500 ETF Trust Call Option |
51 | 130,050 | ||||||||||||
| SPDR S&P 500 ETF Trust Call Option |
94 | 208,022 | ||||||||||||
| SPDR S&P 500 ETF Trust Call Option |
152 | 288,648 | ||||||||||||
| SPDR S&P 500 ETF Trust Call Option |
116 | 185,716 | ||||||||||||
| SPDR S&P 500 ETF Trust Call Option |
140 | 185,500 | ||||||||||||
| SPDR S&P 500 ETF Trust Call Option |
155 | 166,005 | ||||||||||||
| SPDR S&P 500 ETF Trust Call Option |
134 | 294,398 | ||||||||||||
| SPDR S&P 500 ETF Trust Call Option |
190 | 368,600 | ||||||||||||
| SPDR S&P 500 ETF Trust Call Option |
40 | 67,820 | ||||||||||||
| SPDR S&P 500 ETF Trust Call Option |
40 | 58,800 | ||||||||||||
|
|
|
|||||||||||||
| Total Purchased Options (Cost $4,634,119) |
$ | 4,197,317 | ||||||||||||
|
|
|
|||||||||||||
| Money Market Funds – 14.6% | Shares | Value | ||||||||||||
| Fidelity Institutional Money Market Funds Money Market Portfolio – Class I |
6,000,000 | $ | 6,000,000 | |||||||||||
| Short-Term Investments Trust – STIC Prime Portfolio |
4,879,000 | 4,879,000 | ||||||||||||
|
|
|
|||||||||||||
| Total Money Market Funds (Cost $10,879,000) |
$ | 10,879,000 | ||||||||||||
|
|
|
|||||||||||||
| Total Investments – 101.6% (Cost $76,252,467) |
(k) | $ | 75,878,641 | |||||||||||
| Liabilities in Excess of Other Assets – (1.6)% |
(l) | (1,204,405) | ||||||||||||
|
|
|
|||||||||||||
| Net Assets – 100.0% |
$ | 74,674,236 | ||||||||||||
|
|
|
|||||||||||||
Percentages are stated as a percent of net assets.
Footnotes:
| (a) | Non-income producing security. |
| (b) | Security exempt from registration under Regulation D of the Securities Act of 1933. These securities may be resold in transactions exempt from registration, normally to qualified buyers under Rule 144A. At June 30, 2015, the value of these securities totaled $3,063,239, or 4.1% of the Portfolio’s net assets. These securities were deemed liquid pursuant to procedures approved by the Board of Directors. |
| (c) | Security traded on a foreign exchange has been valued at an estimate of fair value that is different than the local market close price. These fair value estimates are determined by an independent fair valuation service that has been approved by the Board. These securities represent $691,961, or 0.9% of the Portfolio’s net |
| 107 | (continued) |
| Ohio National Fund, Inc. | Risk Managed Balanced Portfolio (Continued) |
| Schedule of Investments |
June 30, 2015 (Unaudited) |
| assets. Other Portfolio securities are not subjected to fair value procedures because they are traded on domestic or foreign exchanges that have close times that are consistent with the U.S. market close, normally 4:00 pm Eastern Time. |
| (d) | Security is a variable rate instrument in which the coupon rate is fixed until a later specified date, then is adjusted quarterly in concert with U.S. LIBOR. Interest rates stated are those in effect at June 30, 2015. |
| (e) | Security is a variable rate preferred stock or trust preferred security in which the dividend rate is fixed until a later specified date, then is adjusted quarterly in concert with U.S. LIBOR. Dividend rates stated are those in effect at June 30, 2015. |
| (f) | Security is a depository receipt in which each share represents a 1/25th interest in a share of the corresponding perpetual non-cumulative variable rate preferred stock. The dividend rate is fixed until a later specified date, then is adjusted quarterly in concert with U.S. LIBOR. Dividend rates stated are those in effect at June 30, 2015. |
| (g) | Security is a depository receipt in which each share represents a 1/40th interest in a share of the corresponding perpetual non-cumulative fixed rate preferred stock. |
| (h) | Security is a depository receipt in which each share represents a 1/1,000th interest in a share of the corresponding perpetual non-cumulative variable rate preferred stock. The dividend rate is fixed until a later specified date, then is adjusted quarterly in concert with U.S. LIBOR. Dividend rates stated are those in effect at June 30, 2015. |
| (i) | 100 shares per contract. |
| (j) | Security is fully or partially pledged as collateral for futures contracts outstanding at June 30, 2015. |
| (k) | Represents cost for financial reporting purposes, which may differ from cost basis for federal income tax purposes. See also Note 7 of the Notes to Financial Statements. |
| (l) | Includes $196,095 of cash pledged as collateral for the following futures contracts outstanding at June 30, 2015: |
| Type |
Description |
Expiration |
Number of Contracts |
Contract at Value |
Initial Contract Amount |
Unrealized Appreciation (Depreciation) |
Variation Margin Receivable (Payable) |
|||||||||||||||
| Long |
S&P 500 E-mini |
September 18, 2015 | 113 | $11,607,360 | $ | 11,783,380 | $ | (176,020 | ) | $ | — | |||||||||||
| Long |
10-Year U.S. Treasury Note |
September 21, 2015 | 313 | $39,491,797 | $ | 39,738,083 | $ | (246,286 | ) | $ | — | |||||||||||
|
|
|
|
|
|||||||||||||||||||
| $ | (422,306 | ) | $ | — | ||||||||||||||||||
|
|
|
|
|
|||||||||||||||||||
The accompanying notes are an integral part of these financial statements.
| 108 |
| Ohio National Fund, Inc. |
| June 30, 2015 (Unaudited) |
| Equity Portfolio |
Money Market Portfolio |
Bond Portfolio |
Omni Portfolio |
International Portfolio |
Capital Appreciation Portfolio |
International Small-Mid Company Portfolio |
Aggressive Growth |
|||||||||||||||||||||||||
| Assets: |
||||||||||||||||||||||||||||||||
| Investments in securities, at value* |
$ | 520,127,213 | $ | 141,496,772 | $ | 156,797,862 | $ | 50,499,822 | $ | 173,980,700 | $ | 447,830,388 | $ | 87,393,899 | $ | 46,511,773 | ||||||||||||||||
| Cash |
955 | 55,946,701 | 277 | 2,424 | 1,541,689 | 23 | — | 253 | ||||||||||||||||||||||||
| Foreign currencies, at value** |
— | — | — | — | 1,343 | — | 281 | — | ||||||||||||||||||||||||
| Receivable for securities sold |
1,645,657 | — | — | 456,775 | 633,363 | 6,681,686 | 334,688 | 133,504 | ||||||||||||||||||||||||
| Due from adviser |
— | 29,024 | — | — | — | — | — | — | ||||||||||||||||||||||||
| Receivable for fund shares sold |
93,497 | 994,787 | 1,124,954 | 45,431 | 685,830 | 425,173 | 175,247 | 63,736 | ||||||||||||||||||||||||
| Dividends and accrued interest receivable |
487,687 | 1,552 | 1,542,536 | 160,039 | 132,721 | 323,910 | 92,021 | 13,942 | ||||||||||||||||||||||||
| Foreign tax reclaim receivable |
13,620 | — | — | — | 176,556 | 26,908 | 25,940 | 4,102 | ||||||||||||||||||||||||
| Variation margin receivable on futures contracts |
— | — | — | — | 144,205 | — | — | — | ||||||||||||||||||||||||
| Prepaid expenses and other assets |
4,621 | 1,451 | 1,193 | 302 | 1,280 | 4,710 | 525 | 298 | ||||||||||||||||||||||||
|
|
|
|
|
|
|
|
|
|
|
|
|
|
|
|
|
|||||||||||||||||
| Total assets |
522,373,250 | 198,470,287 | 159,466,822 | 51,164,793 | 177,297,687 | 455,292,798 | 88,022,601 | 46,727,608 | ||||||||||||||||||||||||
|
|
|
|
|
|
|
|
|
|
|
|
|
|
|
|
|
|||||||||||||||||
| Liabilities: |
||||||||||||||||||||||||||||||||
| Payable for securities purchased |
5,479,112 | — | — | 461,274 | 326,305 | 10,806,565 | 852,349 | — | ||||||||||||||||||||||||
| Payable for fund shares redeemed |
1,954,157 | 1,216,712 | 141,084 | 71,851 | 35,562 | 753,296 | 24,952 | 40,589 | ||||||||||||||||||||||||
| Payable for investment management services |
329,908 | 40,249 | 73,580 | 25,283 | 122,481 | 280,440 | 71,459 | 30,884 | ||||||||||||||||||||||||
| Accrued custody expense |
3,336 | 1,702 | 1,136 | 1,317 | 40,511 | 3,596 | 26,844 | 849 | ||||||||||||||||||||||||
| Accrued professional fees |
6,441 | 7,849 | 6,960 | 6,554 | 7,212 | 6,440 | 6,737 | 6,573 | ||||||||||||||||||||||||
| Accrued accounting fees |
15,790 | 6,725 | 8,702 | 4,659 | 15,293 | 13,911 | 8,079 | 2,279 | ||||||||||||||||||||||||
| Accrued printing and filing fees |
14,612 | 6,240 | 4,645 | 1,517 | 5,441 | 12,112 | 2,541 | 1,574 | ||||||||||||||||||||||||
| Withholding tax payable |
— | — | — | — | 44,063 | — | 5,969 | 314 | ||||||||||||||||||||||||
| Unrealized depreciation on foreign currency contracts |
— | — | — | — | 271,805 | — | 335,828 | — | ||||||||||||||||||||||||
|
|
|
|
|
|
|
|
|
|
|
|
|
|
|
|
|
|||||||||||||||||
| Total liabilities |
7,803,356 | 1,279,477 | 236,107 | 572,455 | 868,673 | 11,876,360 | 1,334,758 | 83,062 | ||||||||||||||||||||||||
|
|
|
|
|
|
|
|
|
|
|
|
|
|
|
|
|
|||||||||||||||||
| Net assets |
$ | 514,569,894 | $ | 197,190,810 | $ | 159,230,715 | $ | 50,592,338 | $ | 176,429,014 | $ | 443,416,438 | $ | 86,687,843 | $ | 46,644,546 | ||||||||||||||||
|
|
|
|
|
|
|
|
|
|
|
|
|
|
|
|
|
|||||||||||||||||
| Net assets consist of: |
||||||||||||||||||||||||||||||||
| Par value, $1 per share |
$ | 15,273,671 | $ | 19,719,094 | $ | 10,235,537 | $ | 2,003,329 | $ | 13,299,206 | $ | 12,601,440 | $ | 2,773,922 | $ | 3,173,759 | ||||||||||||||||
| Paid-in capital in excess of par value |
477,408,609 | 177,471,716 | 147,824,994 | 37,866,369 | 209,716,356 | 355,805,519 | 61,819,956 | 25,020,384 | ||||||||||||||||||||||||
| Accumulated net realized gain (loss) on investments |
(21,852,110 | ) | — | (8,856,516 | ) | 8,865,605 | (67,520,598 | ) | 45,458,526 | 4,416,617 | 11,488,957 | |||||||||||||||||||||
| Net unrealized appreciation (depreciation) on: |
||||||||||||||||||||||||||||||||
| Investments |
41,695,212 | — | 2,168,510 | 1,533,953 | 15,763,192 | 27,433,382 | 17,564,195 | 6,974,784 | ||||||||||||||||||||||||
| Foreign currency contracts |
— | — | — | — | (271,805 | ) | — | (335,828 | ) | — | ||||||||||||||||||||||
| Futures contracts |
— | — | — | — | (722,349 | ) | — | — | — | |||||||||||||||||||||||
| Other foreign currency related transactions |
— | — | — | — | (9,005 | ) | (2,160 | ) | (4,560 | ) | (55 | ) | ||||||||||||||||||||
| Undistributed net investment income (loss) |
2,044,512 | — | 7,858,190 | 323,082 | 6,174,017 | 2,119,731 | 453,541 | (13,283 | ) | |||||||||||||||||||||||
|
|
|
|
|
|
|
|
|
|
|
|
|
|
|
|
|
|||||||||||||||||
| Net assets |
$ | 514,569,894 | $ | 197,190,810 | $ | 159,230,715 | $ | 50,592,338 | $ | 176,429,014 | $ | 443,416,438 | $ | 86,687,843 | $ | 46,644,546 | ||||||||||||||||
|
|
|
|
|
|
|
|
|
|
|
|
|
|
|
|
|
|||||||||||||||||
| * Investments in securities, at cost |
$ | 478,432,001 | $ | 141,496,772 | $ | 154,629,352 | $ | 48,965,869 | $ | 158,217,508 | $ | 420,397,006 | $ | 69,829,704 | $ | 39,536,989 | ||||||||||||||||
|
|
|
|
|
|
|
|
|
|
|
|
|
|
|
|
|
|||||||||||||||||
| ** Foreign currencies, at cost |
$ | — | $ | — | $ | — | $ | — | $ | 983 | $ | — | $ | 390 | $ | — | ||||||||||||||||
|
|
|
|
|
|
|
|
|
|
|
|
|
|
|
|
|
|||||||||||||||||
| Shares outstanding |
15,273,671 | 19,719,094 | 10,235,537 | 2,003,329 | 13,299,206 | 12,601,440 | 2,773,922 | 3,173,759 | ||||||||||||||||||||||||
|
|
|
|
|
|
|
|
|
|
|
|
|
|
|
|
|
|||||||||||||||||
| Authorized Fund shares allocated to Portfolio |
25,000,000 | 55,000,000 | 30,000,000 | 10,000,000 | 30,000,000 | 25,000,000 | 7,000,000 | 7,000,000 | ||||||||||||||||||||||||
|
|
|
|
|
|
|
|
|
|
|
|
|
|
|
|
|
|||||||||||||||||
| Net asset value per share |
$ | 33.69 | $ | 10.00 | $ | 15.56 | $ | 25.25 | $ | 13.27 | $ | 35.19 | $ | 31.25 | $ | 14.70 | ||||||||||||||||
|
|
|
|
|
|
|
|
|
|
|
|
|
|
|
|
|
|||||||||||||||||
The accompanying notes are an integral part of these financial statements.
| 109 |
| Ohio National Fund, Inc. |
| Statements of Assets and Liabilities |
June 30, 2015 (Unaudited) |
| Small Cap Growth Portfolio |
Mid Cap Opportunity Portfolio |
S&P
500® Index Portfolio |
Strategic Value Portfolio |
High Income Bond Portfolio |
Capital Growth Portfolio |
Nasdaq-100® Portfolio |
Bristol Portfolio |
|||||||||||||||||||||||||
| Assets: |
||||||||||||||||||||||||||||||||
| Investments in securities, at value* |
$ | 226,897,571 | $ | 89,614,852 | $ | 408,241,148 | $ | 328,266,868 | $ | 222,857,887 | $ | 75,892,389 | $ | 129,508,627 | $ | 231,404,890 | ||||||||||||||||
| Cash |
10,287 | 408 | 1,666,703 | 576 | 164 | 824 | 776,480 | 14,716 | ||||||||||||||||||||||||
| Receivable for securities sold |
575,213 | 772,665 | 64,749 | — | 75,540 | 617,970 | — | 8,609,342 | ||||||||||||||||||||||||
| Receivable for fund shares sold |
61,301 | 8,724 | 195,331 | 2,352,421 | 44,167 | 32,872 | 29,556 | 28,509 | ||||||||||||||||||||||||
| Dividends and accrued interest receivable |
43,426 | 29,802 | 527,659 | 1,976,162 | 3,664,638 | 14,292 | 59,261 | 262,336 | ||||||||||||||||||||||||
| Foreign tax reclaim receivable |
2,081 | — | 3,263 | 66,468 | — | — | — | — | ||||||||||||||||||||||||
| Prepaid expenses and other assets |
1,913 | 621 | 2,862 | 2,391 | 1,716 | 540 | 912 | 1,702 | ||||||||||||||||||||||||
|
|
|
|
|
|
|
|
|
|
|
|
|
|
|
|
|
|||||||||||||||||
| Total assets |
227,591,792 | 90,427,072 | 410,701,715 | 332,664,886 | 226,644,112 | 76,558,887 | 130,374,836 | 240,321,495 | ||||||||||||||||||||||||
|
|
|
|
|
|
|
|
|
|
|
|
|
|
|
|
|
|||||||||||||||||
| Liabilities: |
||||||||||||||||||||||||||||||||
| Payable for securities purchased |
1,361,932 | 1,514,295 | 675,139 | 2,693,912 | 919,502 | 392,770 | 453,990 | 2,437,161 | ||||||||||||||||||||||||
| Payable for fund shares redeemed |
2,604,015 | 30,052 | 133,455 | 64,509 | 790,770 | 47,007 | 368,103 | 5,266,730 | ||||||||||||||||||||||||
| Payable for investment management services |
146,439 | 63,149 | 121,078 | 195,468 | 131,009 | 56,943 | 42,006 | 147,537 | ||||||||||||||||||||||||
| Accrued custody expense |
3,107 | 1,428 | 5,660 | 3,655 | 1,909 | 930 | 1,331 | 2,337 | ||||||||||||||||||||||||
| Accrued professional fees |
6,440 | 6,760 | 7,468 | 10,652 | 8,379 | 10,793 | 6,686 | 7,444 | ||||||||||||||||||||||||
| Accrued accounting fees |
7,864 | 3,843 | 16,573 | 10,815 | 22,636 | 3,721 | 5,245 | 7,682 | ||||||||||||||||||||||||
| Accrued printing and filing fees |
6,681 | 2,811 | 10,927 | 11,004 | 8,654 | 2,540 | 3,849 | 8,007 | ||||||||||||||||||||||||
| Withholding tax payable |
— | — | 704 | 76,399 | — | — | — | — | ||||||||||||||||||||||||
|
|
|
|
|
|
|
|
|
|
|
|
|
|
|
|
|
|||||||||||||||||
| Total liabilities |
4,136,478 | 1,622,338 | 971,004 | 3,066,414 | 1,882,859 | 514,704 | 881,210 | 7,876,898 | ||||||||||||||||||||||||
|
|
|
|
|
|
|
|
|
|
|
|
|
|
|
|
|
|||||||||||||||||
| Net assets |
$ | 223,455,314 | $ | 88,804,734 | $ | 409,730,711 | $ | 329,598,472 | $ | 224,761,253 | $ | 76,044,183 | $ | 129,493,626 | $ | 232,444,597 | ||||||||||||||||
|
|
|
|
|
|
|
|
|
|
|
|
|
|
|
|
|
|||||||||||||||||
| Net assets consist of: |
||||||||||||||||||||||||||||||||
| Par value, $1 per share |
$ | 8,260,901 | $ | 2,766,694 | $ | 18,493,864 | $ | 23,770,147 | $ | 13,462,036 | $ | 1,728,144 | $ | 11,430,365 | $ | 10,508,369 | ||||||||||||||||
| Paid-in capital in excess of par value |
161,697,280 | 69,005,121 | 243,129,488 | 237,496,728 | 183,286,058 | 45,670,289 | 60,978,140 | 141,736,001 | ||||||||||||||||||||||||
| Accumulated net realized gain on investments |
22,164,846 | 3,415,302 | 5,999,777 | 43,080,112 | 7,268,678 | 10,789,322 | 5,725,153 | 68,187,657 | ||||||||||||||||||||||||
| Net unrealized appreciation (depreciation) on: |
|
|||||||||||||||||||||||||||||||
| Investments |
31,526,265 | 13,744,454 | 137,852,186 | 16,479,087 | (2,474,214 | ) | 18,104,103 | 50,683,763 | 11,209,150 | |||||||||||||||||||||||
| Foreign currency related transactions |
42 | — | — | (3,794 | ) | — | — | — | — | |||||||||||||||||||||||
| Undistributed net investment income (loss) |
(194,020 | ) | (126,837 | ) | 4,255,396 | 8,776,192 | 23,218,695 | (247,675 | ) | 676,205 | 803,420 | |||||||||||||||||||||
|
|
|
|
|
|
|
|
|
|
|
|
|
|
|
|
|
|||||||||||||||||
| Net assets |
$ | 223,455,314 | $ | 88,804,734 | $ | 409,730,711 | $ | 329,598,472 | $ | 224,761,253 | $ | 76,044,183 | $ | 129,493,626 | $ | 232,444,597 | ||||||||||||||||
|
|
|
|
|
|
|
|
|
|
|
|
|
|
|
|
|
|||||||||||||||||
| * Investments in securities, at cost |
$ | 195,371,306 | $ | 75,870,398 | $ | 270,388,962 | $ | 311,787,781 | $ | 225,332,101 | $ | 57,788,286 | $ | 78,824,864 | $ | 220,195,740 | ||||||||||||||||
|
|
|
|
|
|
|
|
|
|
|
|
|
|
|
|
|
|||||||||||||||||
| Shares outstanding |
8,260,901 | 2,766,694 | 18,493,864 | 23,770,147 | 13,462,036 | 1,728,144 | 11,430,365 | 10,508,369 | ||||||||||||||||||||||||
|
|
|
|
|
|
|
|
|
|
|
|
|
|
|
|
|
|||||||||||||||||
| Authorized Fund shares allocated to Portfolio |
15,000,000 | 6,000,000 | 35,000,000 | 65,000,000 | 35,000,000 | 5,000,000 | 25,000,000 | 40,000,000 | ||||||||||||||||||||||||
|
|
|
|
|
|
|
|
|
|
|
|
|
|
|
|
|
|||||||||||||||||
| Net asset value per share |
$ | 27.05 | $ | 32.10 | $ | 22.15 | $ | 13.87 | $ | 16.70 | $ | 44.00 | $ | 11.33 | $ | 22.12 | ||||||||||||||||
|
|
|
|
|
|
|
|
|
|
|
|
|
|
|
|
|
|||||||||||||||||
The accompanying notes are an integral part of these financial statements.
| 110 |
| Ohio National Fund, Inc. |
| Statements of Assets and Liabilities |
June 30, 2015 (Unaudited) |
| Bryton Growth Portfolio |
Balanced Portfolio |
Target VIP Portfolio |
Bristol Growth Portfolio |
Risk Managed Balanced Portfolio |
||||||||||||||||
| Assets: |
||||||||||||||||||||
| Investments in securities, at value* |
$ | 182,211,960 | $ | 889,226,145 | $ | 52,626,583 | $ | 123,656,472 | $ | 75,878,641 | ||||||||||
| Cash |
391 | 382,029 | 72 | 7,627 | 282,020 | |||||||||||||||
| Receivable for securities sold |
6,189,058 | 10,398,676 | — | 2,814,843 | 133,926 | |||||||||||||||
| Receivable for fund shares sold |
45,761 | 527,020 | 36,165 | 5,144 | 359,716 | |||||||||||||||
| Dividends and accrued interest receivable |
42,432 | 3,669,707 | 133,581 | 120,910 | 170,081 | |||||||||||||||
| Foreign tax reclaim receivable |
— | — | 4,284 | — | — | |||||||||||||||
| Prepaid expenses and other assets |
1,345 | 8,729 | 396 | 910 | 332 | |||||||||||||||
|
|
|
|
|
|
|
|
|
|
|
|||||||||||
| Total assets |
188,490,947 | 904,212,306 | 52,801,081 | 126,605,906 | 76,824,716 | |||||||||||||||
|
|
|
|
|
|
|
|
|
|
|
|||||||||||
| Liabilities: |
||||||||||||||||||||
| Options written, at value** |
— | 115,150 | — | — | — | |||||||||||||||
| Payable for securities purchased |
4,869,337 | 19,700,211 | — | 955,481 | 2,050,688 | |||||||||||||||
| Payable for fund shares redeemed |
2,933,494 | 2,514,286 | 49,537 | 1,303,081 | 10,737 | |||||||||||||||
| Payable for investment management services |
122,271 | 429,356 | 26,596 | 81,949 | 52,604 | |||||||||||||||
| Accrued custody expense |
3,561 | 5,689 | 2,775 | 1,523 | 6,203 | |||||||||||||||
| Accrued professional fees |
7,207 | 6,441 | 8,595 | 6,966 | 13,929 | |||||||||||||||
| Accrued accounting fees |
6,091 | 27,363 | 3,352 | 4,640 | 13,725 | |||||||||||||||
| Accrued printing and filing fees |
6,663 | 22,635 | 1,822 | 5,001 | 2,594 | |||||||||||||||
| Withholding tax payable |
— | — | 14,813 | — | — | |||||||||||||||
|
|
|
|
|
|
|
|
|
|
|
|||||||||||
| Total liabilities |
7,948,624 | 22,821,131 | 107,490 | 2,358,641 | 2,150,480 | |||||||||||||||
|
|
|
|
|
|
|
|
|
|
|
|||||||||||
| Net assets |
$ | 180,542,323 | $ | 881,391,175 | $ | 52,693,591 | $ | 124,247,265 | $ | 74,674,236 | ||||||||||
|
|
|
|
|
|
|
|
|
|
|
|||||||||||
| Net assets consist of: |
||||||||||||||||||||
| Par value, $1 per share |
$ | 7,963,790 | $ | 45,176,209 | $ | 3,562,918 | $ | 7,147,373 | $ | 6,938,332 | ||||||||||
| Paid-in capital in excess of par value |
122,559,958 | 769,898,750 | 49,513,494 | 77,081,014 | 66,677,792 | |||||||||||||||
| Accumulated net realized gain (loss) on investments |
39,618,481 | 25,281,829 | (3,795,660 | ) | 30,661,622 | 1,608,992 | ||||||||||||||
| Net unrealized appreciation (depreciation) on: |
||||||||||||||||||||
| Investments |
10,887,272 | 33,563,854 | 2,835,590 | 9,005,646 | (373,826 | ) | ||||||||||||||
| Futures contracts |
— | — | — | — | (422,306 | ) | ||||||||||||||
| Written options |
— | 304,381 | — | — | — | |||||||||||||||
| Undistributed net investment income (loss) |
(487,178 | ) | 7,166,152 | 577,249 | 351,610 | 245,252 | ||||||||||||||
|
|
|
|
|
|
|
|
|
|
|
|||||||||||
| Net assets |
$ | 180,542,323 | $ | 881,391,175 | $ | 52,693,591 | $ | 124,247,265 | $ | 74,674,236 | ||||||||||
|
|
|
|
|
|
|
|
|
|
|
|||||||||||
| * Investments in securities, at cost |
$ | 171,324,688 | $ | 855,662,291 | $ | 49,790,993 | $ | 114,650,826 | $ | 76,252,467 | ||||||||||
|
|
|
|
|
|
|
|
|
|
|
|||||||||||
| ** Premiums received on options written |
$ | — | $ | 419,531 | $ | — | $ | — | $ | — | ||||||||||
|
|
|
|
|
|
|
|
|
|
|
|||||||||||
| Shares outstanding |
7,963,790 | 45,176,209 | 3,562,918 | 7,147,373 | 6,938,332 | |||||||||||||||
|
|
|
|
|
|
|
|
|
|
|
|||||||||||
| Authorized Fund shares allocated to Portfolio |
30,000,000 | 55,000,000 | 10,000,000 | 25,000,000 | 15,000,000 | |||||||||||||||
|
|
|
|
|
|
|
|
|
|
|
|||||||||||
| Net asset value per share |
$ | 22.67 | $ | 19.51 | $ | 14.79 | $ | 17.38 | $ | 10.76 | ||||||||||
|
|
|
|
|
|
|
|
|
|
|
|||||||||||
The accompanying notes are an integral part of these financial statements.
| 111 |
| Ohio National Fund, Inc. |
| For the Six-Month Period Ended June 30, 2015 (Unaudited) |
| Equity Portfolio |
Money Market Portfolio |
Bond Portfolio |
Omni Portfolio |
International Portfolio |
Capital Appreciation Portfolio |
International Small-Mid Company Portfolio |
Aggressive Growth Portfolio |
|||||||||||||||||||||||||
| Investment income: |
||||||||||||||||||||||||||||||||
| Interest |
$ | — | $ | 45,496 | $ | 3,315,244 | $ | 195,119 | $ | — | $ | — | $ | — | $ | 190 | ||||||||||||||||
| Dividends, net of taxes withheld* |
3,742,303 | 7,407 | 951 | 237,039 | 2,807,093 | 3,870,026 | 727,603 | 181,897 | ||||||||||||||||||||||||
|
|
|
|
|
|
|
|
|
|
|
|
|
|
|
|
|
|||||||||||||||||
| Total investment income |
3,742,303 | 52,903 | 3,316,195 | 432,158 | 2,807,093 | 3,870,026 | 727,603 | 182,087 | ||||||||||||||||||||||||
|
|
|
|
|
|
|
|
|
|
|
|
|
|
|
|
|
|||||||||||||||||
| Expenses: |
||||||||||||||||||||||||||||||||
| Management fees |
1,969,233 | 270,420 | 456,811 | 129,113 | 739,600 | 1,686,218 | 384,900 | 169,210 | ||||||||||||||||||||||||
| Custodian fees |
9,991 | 5,113 | 3,323 | 3,973 | 82,829 | 10,802 | 49,841 | 3,147 | ||||||||||||||||||||||||
| Directors’ fees |
27,200 | 10,238 | 8,507 | 2,421 | 9,540 | 23,681 | 4,172 | 2,274 | ||||||||||||||||||||||||
| Professional fees |
10,669 | 10,091 | 8,856 | 7,218 | 9,281 | 9,481 | 7,745 | 7,232 | ||||||||||||||||||||||||
| Accounting fees |
43,663 | 22,244 | 27,191 | 13,889 | 31,880 | 38,280 | 15,733 | 7,020 | ||||||||||||||||||||||||
| Printing and filing fees |
14,953 | 7,371 | 4,937 | 1,744 | 5,609 | 12,184 | 2,804 | 1,601 | ||||||||||||||||||||||||
| Compliance expense |
4,381 | 4,381 | 4,381 | 4,381 | 4,381 | 4,381 | 4,381 | 4,381 | ||||||||||||||||||||||||
| Other |
3,734 | 1,602 | 1,140 | 500 | 3,972 | 2,733 | 983 | 505 | ||||||||||||||||||||||||
|
|
|
|
|
|
|
|
|
|
|
|
|
|
|
|
|
|||||||||||||||||
| Total expenses |
2,083,824 | 331,460 | 515,146 | 163,239 | 887,092 | 1,787,760 | 470,559 | 195,370 | ||||||||||||||||||||||||
|
|
|
|
|
|
|
|
|
|
|
|
|
|
|
|
|
|||||||||||||||||
| Less expenses reduced or reimbursed by adviser |
— | (278,557 | ) | — | — | — | — | — | — | |||||||||||||||||||||||
|
|
|
|
|
|
|
|
|
|
|
|
|
|
|
|
|
|||||||||||||||||
| Net expenses |
2,083,824 | 52,903 | 515,146 | 163,239 | 887,092 | 1,787,760 | 470,559 | 195,370 | ||||||||||||||||||||||||
|
|
|
|
|
|
|
|
|
|
|
|
|
|
|
|
|
|||||||||||||||||
| Net investment income (loss) |
1,658,479 | — | 2,801,049 | 268,919 | 1,920,001 | 2,082,266 | 257,044 | (13,283 | ) | |||||||||||||||||||||||
|
|
|
|
|
|
|
|
|
|
|
|
|
|
|
|
|
|||||||||||||||||
| Realized/unrealized gain (loss) on investments, futures contracts, foreign currency contracts, and other foreign currency related transactions: |
||||||||||||||||||||||||||||||||
| Net realized gain (loss) on: |
||||||||||||||||||||||||||||||||
| Investments |
26,293,793 | — | 1,201,148 | 2,822,628 | (5,960,930 | ) | 25,605,992 | 3,233,983 | 3,385,831 | |||||||||||||||||||||||
| Futures contracts |
— | — | — | — | 809,872 | — | — | — | ||||||||||||||||||||||||
| Foreign currency contracts |
— | — | — | — | 3,738,359 | — | 584,647 | — | ||||||||||||||||||||||||
| Other foreign currency related transactions |
— | — | — | — | 136,523 | (13,967 | ) | (59,906 | ) | 130 | ||||||||||||||||||||||
| Change in unrealized appreciation/depreciation on: |
||||||||||||||||||||||||||||||||
| Investments |
(23,903,318 | ) | — | (4,994,203 | ) | (1,443,481 | ) | 11,344,109 | (9,479,167 | ) | 5,996,437 | (599,867 | ) | |||||||||||||||||||
| Futures contracts |
— | — | — | — | (677,047 | ) | — | — | — | |||||||||||||||||||||||
| Foreign currency contracts |
— | — | — | — | (1,496,303 | ) | — | (335,973 | ) | — | ||||||||||||||||||||||
| Other foreign currency related transactions |
— | — | — | — | 38,182 | (1,023 | ) | (788 | ) | 177 | ||||||||||||||||||||||
|
|
|
|
|
|
|
|
|
|
|
|
|
|
|
|
|
|||||||||||||||||
| Net realized/unrealized gain (loss) on investments, futures contracts, foreign currency contracts, and other foreign currency related transactions |
2,390,475 | — | (3,793,055 | ) | 1,379,147 | 7,932,765 | 16,111,835 | 9,418,400 | 2,786,271 | |||||||||||||||||||||||
|
|
|
|
|
|
|
|
|
|
|
|
|
|
|
|
|
|||||||||||||||||
| Change in net assets from operations |
$ | 4,048,954 | $ | — | $ | (992,006 | ) | $ | 1,648,066 | $ | 9,852,766 | $ | 18,194,101 | $ | 9,675,444 | $ | 2,772,988 | |||||||||||||||
|
|
|
|
|
|
|
|
|
|
|
|
|
|
|
|
|
|||||||||||||||||
| * Taxes withheld |
$ | — | $ | — | $ | — | $ | — | $ | 469,067 | $ | 164,918 | $ | 66,671 | $ | 3,407 | ||||||||||||||||
|
|
|
|
|
|
|
|
|
|
|
|
|
|
|
|
|
|||||||||||||||||
The accompanying notes are an integral part of these financial statements.
| 112 |
| Ohio National Fund, Inc. |
| Statements of Operations |
For the Six-Month Period Ended June 30, 2015 (Unaudited) |
| Small Cap Growth Portfolio |
Mid Cap Opportunity Portfolio |
S&P
500® Index Portfolio |
Strategic Value Portfolio |
High Income Bond Portfolio |
Capital Growth Portfolio |
Nasdaq-100®
Index Portfolio |
Bristol Portfolio |
|||||||||||||||||||||||||
| Investment income: |
||||||||||||||||||||||||||||||||
| Interest |
$ | 446 | $ | — | $ | — | $ | — | $ | 7,366,814 | $ | — | $ | — | $ | — | ||||||||||||||||
| Dividends, net of taxes withheld* |
759,109 | 283,208 | 4,208,189 | 7,239,485 | 2,828 | 123,406 | 813,628 | 1,649,395 | ||||||||||||||||||||||||
|
|
|
|
|
|
|
|
|
|
|
|
|
|
|
|
|
|||||||||||||||||
| Total investment income |
759,555 | 283,208 | 4,208,189 | 7,239,485 | 7,369,642 | 123,406 | 813,628 | 1,649,395 | ||||||||||||||||||||||||
|
|
|
|
|
|
|
|
|
|
|
|
|
|
|
|
|
|||||||||||||||||
| Expenses: |
||||||||||||||||||||||||||||||||
| Management fees |
851,592 | 372,686 | 718,015 | 1,199,047 | 795,897 | 338,273 | 248,145 | 875,733 | ||||||||||||||||||||||||
| Custodian fees |
10,320 | 4,484 | 16,864 | 14,790 | 5,690 | 2,651 | 4,527 | 7,114 | ||||||||||||||||||||||||
| Directors’ fees |
11,511 | 4,625 | 21,457 | 17,344 | 11,934 | 3,972 | 6,784 | 12,515 | ||||||||||||||||||||||||
| Professional fees |
8,425 | 7,884 | 11,677 | 13,129 | 10,955 | 11,792 | 8,214 | 10,073 | ||||||||||||||||||||||||
| Accounting fees |
22,883 | 11,839 | 50,340 | 35,329 | 70,031 | 11,857 | 15,850 | 24,478 | ||||||||||||||||||||||||
| Printing and filing fees |
6,987 | 3,030 | 11,126 | 11,025 | 8,724 | 2,548 | 3,906 | 8,197 | ||||||||||||||||||||||||
| Compliance expense |
4,381 | 4,381 | 4,381 | 4,381 | 4,381 | 4,381 | 4,381 | 4,381 | ||||||||||||||||||||||||
| Other |
1,656 | 1,116 | 4,612 | 5,169 | 2,036 | 997 | 1,429 | 3,077 | ||||||||||||||||||||||||
|
|
|
|
|
|
|
|
|
|
|
|
|
|
|
|
|
|||||||||||||||||
| Total expenses |
917,755 | 410,045 | 838,472 | 1,300,214 | 909,648 | 376,471 | 293,236 | 945,568 | ||||||||||||||||||||||||
|
|
|
|
|
|
|
|
|
|
|
|
|
|
|
|
|
|||||||||||||||||
| Net investment income (loss) |
(158,200 | ) | (126,837 | ) | 3,369,717 | 5,939,271 | 6,459,994 | (253,065 | ) | 520,392 | 703,827 | |||||||||||||||||||||
|
|
|
|
|
|
|
|
|
|
|
|
|
|
|
|
|
|||||||||||||||||
| Realized/unrealized gain (loss) on investments and foreign currency related transactions: |
||||||||||||||||||||||||||||||||
| Net realized gain (loss) on: |
||||||||||||||||||||||||||||||||
| Investments |
7,305,396 | 4,417,400 | 4,389,702 | 5,883,740 | (956,361 | ) | 2,303,808 | 2,043,729 | 24,592,630 | |||||||||||||||||||||||
| Foreign currency related transactions |
(84 | ) | — | — | (54,130 | ) | — | — | — | — | ||||||||||||||||||||||
| Change in unrealized appreciation/depreciation on: |
||||||||||||||||||||||||||||||||
| Investments |
9,384,962 | (2,637,709 | ) | (3,569,532 | ) | (12,856,890 | ) | (288,789 | ) | 3,328,376 | 2,551,923 | (10,210,247 | ) | |||||||||||||||||||
| Foreign currency related transactions |
42 | — | — | 10,558 | — | — | — | — | ||||||||||||||||||||||||
|
|
|
|
|
|
|
|
|
|
|
|
|
|
|
|
|
|||||||||||||||||
| Net realized/unrealized gain (loss) on investments and foreign currency related transactions |
16,690,316 | 1,779,691 | 820,170 | (7,016,722 | ) | (1,245,150 | ) | 5,632,184 | 4,595,652 | 14,382,383 | ||||||||||||||||||||||
|
|
|
|
|
|
|
|
|
|
|
|
|
|
|
|
|
|||||||||||||||||
| Change in net assets from operations |
$ | 16,532,116 | $ | 1,652,854 | $ | 4,189,887 | $ | (1,077,451 | ) | $ | 5,214,844 | $ | 5,379,119 | $ | 5,116,044 | $ | 15,086,210 | |||||||||||||||
|
|
|
|
|
|
|
|
|
|
|
|
|
|
|
|
|
|||||||||||||||||
| * Taxes withheld |
$ | 7,800 | $ | — | $ | 318 | $ | 229,152 | $ | — | $ | — | $ | — | $ | — | ||||||||||||||||
|
|
|
|
|
|
|
|
|
|
|
|
|
|
|
|
|
|||||||||||||||||
The accompanying notes are an integral part of these financial statements.
| 113 |
| Ohio National Fund, Inc. |
| Statements of Operations |
For the Six-Month Period Ended June 30, 2015 (Unaudited) |
| Bryton Growth Portfolio |
Balanced Portfolio |
Target VIP Portfolio |
Bristol Growth Portfolio |
Risk Managed Balanced Portfolio |
||||||||||||||||
| Investment income: |
||||||||||||||||||||
| Interest |
$ | — | $ | 4,426,925 | $ | — | $ | — | $ | 229,942 | ||||||||||
| Dividends, net of taxes withheld** |
304,690 | 4,041,726 | 690,067 | 833,374 | 258,749 | |||||||||||||||
|
|
|
|
|
|
|
|
|
|
|
|||||||||||
| Total investment income |
304,690 | 8,468,651 | 690,067 | 833,374 | 488,691 | |||||||||||||||
|
|
|
|
|
|
|
|
|
|
|
|||||||||||
| Expenses: |
||||||||||||||||||||
| Management fees |
730,063 | 2,530,707 | 164,536 | 491,308 | 239,727 | |||||||||||||||
| Custodian fees |
9,823 | 17,047 | 16,964 | 4,621 | 21,756 | |||||||||||||||
| Directors’ fees |
9,649 | 45,191 | 2,871 | 6,682 | 2,992 | |||||||||||||||
| Professional fees |
9,313 | 12,207 | 11,226 | 8,486 | 14,695 | |||||||||||||||
| Accounting fees |
19,777 | 74,815 | 10,432 | 14,688 | 37,969 | |||||||||||||||
| Printing and filing fees |
6,697 | 22,960 | 1,821 | 4,991 | 2,903 | |||||||||||||||
| Compliance expense |
4,381 | 4,381 | 4,381 | 4,381 | 4,380 | |||||||||||||||
| Other |
2,165 | 5,546 | 715 | 1,641 | 437 | |||||||||||||||
|
|
|
|
|
|
|
|
|
|
|
|||||||||||
| Total expenses |
791,868 | 2,712,854 | 212,946 | 536,798 | 324,859 | |||||||||||||||
|
|
|
|
|
|
|
|
|
|
|
|||||||||||
| Less expenses reduced or reimbursed by adviser |
— | — | — | — | — | |||||||||||||||
|
|
|
|
|
|
|
|
|
|
|
|||||||||||
| Net expenses |
791,868 | 2,712,854 | 212,946 | 536,798 | 324,859 | |||||||||||||||
|
|
|
|
|
|
|
|
|
|
|
|||||||||||
| Net investment income (loss) |
(487,178 | ) | 5,755,797 | 477,121 | 296,576 | 163,832 | ||||||||||||||
|
|
|
|
|
|
|
|
|
|
|
|||||||||||
| Realized/unrealized gain (loss) on investments, foreign currency related transactions, and written options: |
||||||||||||||||||||
| Net realized gain (loss) on: |
||||||||||||||||||||
| Investments |
19,511,620 | 9,731,129 | 2,655,266 | 10,927,788 | (22,137 | ) | ||||||||||||||
| Futures contracts |
— | — | — | — | 463,685 | |||||||||||||||
| Foreign currency related transactions |
— | — | — | — | 125 | |||||||||||||||
| Written options |
— | 2,781,568 | — | — | — | |||||||||||||||
| Change in unrealized appreciation/depreciation on: |
||||||||||||||||||||
| Investments |
(124,617 | ) | 5,916,741 | (1,921,742 | ) | (4,184,925 | ) | (1,170,465 | ) | |||||||||||
| Futures contracts |
— | — | — | — | (565,292 | ) | ||||||||||||||
| Foreign currency related transactions |
— | — | — | — | — | |||||||||||||||
| Written options |
— | (104,907 | ) | — | — | — | ||||||||||||||
|
|
|
|
|
|
|
|
|
|
|
|||||||||||
| Net realized/unrealized gain (loss) on investments, foreign currency related transactions, and written options |
19,387,003 | 18,324,531 | 733,524 | 6,742,863 | (1,294,084 | ) | ||||||||||||||
|
|
|
|
|
|
|
|
|
|
|
|||||||||||
| Change in net assets from operations |
$ | 18,899,825 | $ | 24,080,328 | $ | 1,210,645 | $ | 7,039,439 | $ | (1,130,252 | ) | |||||||||
|
|
|
|
|
|
|
|
|
|
|
|||||||||||
| * Taxes withheld |
$ | — | $ | 12,902 | $ | 39,734 | $ | — | $ | 868 | ||||||||||
|
|
|
|
|
|
|
|
|
|
|
|||||||||||
The accompanying notes are an integral part of these financial statements.
| 114 |
| Ohio National Fund, Inc. |
| Equity Portfolio |
Money Market Portfolio |
Bond Portfolio |
Omni Portfolio |
|||||||||||||||||||||||||||||
| Six-Month Period Ended June 30, 2015 (Unaudited) |
Year Ended December 31, 2014 |
Six-Month Period Ended June 30, 2015 (Unaudited) |
Year Ended December 31, 2014 |
Six-Month Period Ended June 30, 2015 (Unaudited) |
Year Ended December 31, 2014 |
Six-Month Period Ended June 30, 2015 (Unaudited) |
Year Ended December 31, 2014 |
|||||||||||||||||||||||||
| Increase (Decrease) in net assets: |
||||||||||||||||||||||||||||||||
| Operations: |
||||||||||||||||||||||||||||||||
| Net investment income |
$ | 1,658,479 | $ | 2,046,357 | $ | — | $ | — | $ | 2,801,049 | $ | 5,057,141 | $ | 268,919 | $ | 395,534 | ||||||||||||||||
| Net realized gain on investments and foreign currency related transactions |
26,293,793 | 33,346,801 | — | — | 1,201,148 | 1,319,586 | 2,822,628 | 6,306,647 | ||||||||||||||||||||||||
| Change in unrealized appreciation/depreciation on investments |
(23,903,318 | ) | 6,063,115 | — | — | (4,994,203 | ) | 2,254,423 | (1,443,481 | ) | (2,442,237 | ) | ||||||||||||||||||||
|
|
|
|
|
|
|
|
|
|
|
|
|
|
|
|
|
|||||||||||||||||
| Change in net assets from operations |
4,048,954 | 41,456,273 | — | — | (992,006 | ) | 8,631,150 | 1,648,066 | 4,259,944 | |||||||||||||||||||||||
|
|
|
|
|
|
|
|
|
|
|
|
|
|
|
|
|
|||||||||||||||||
| Distributions to shareholders: |
||||||||||||||||||||||||||||||||
| Distributions from net investment income |
— | (1,660,324 | ) | — | — | — | — | — | (341,371 | ) | ||||||||||||||||||||||
|
|
|
|
|
|
|
|
|
|
|
|
|
|
|
|
|
|||||||||||||||||
| Capital transactions: |
||||||||||||||||||||||||||||||||
| Received from shares sold |
33,562,867 | 315,246,386 | 64,944,891 | 192,184,015 | 22,549,121 | 46,735,844 | 16,846,602 | 2,915,916 | ||||||||||||||||||||||||
| Received from dividends reinvested |
— | 1,660,324 | — | — | — | — | — | 341,371 | ||||||||||||||||||||||||
| Paid for shares redeemed |
(41,777,343 | ) | (59,401,285 | ) | (69,766,768 | ) | (251,269,999 | ) | (20,990,226 | ) | (48,280,931 | ) | (5,098,912 | ) | (7,867,809 | ) | ||||||||||||||||
|
|
|
|
|
|
|
|
|
|
|
|
|
|
|
|
|
|||||||||||||||||
| Change in net assets from capital transactions |
(8,214,476 | ) | 257,505,425 | (4,821,877 | ) | (59,085,984 | ) | 1,558,895 | (1,545,087 | ) | 11,747,690 | (4,610,522 | ) | |||||||||||||||||||
|
|
|
|
|
|
|
|
|
|
|
|
|
|
|
|
|
|||||||||||||||||
| Change in net assets |
(4,165,522 | ) | 297,301,374 | (4,821,877 | ) | (59,085,984 | ) | 566,889 | 7,086,063 | 13,395,756 | (691,949 | ) | ||||||||||||||||||||
| Net assets: |
||||||||||||||||||||||||||||||||
| Beginning of period |
518,735,416 | 221,434,042 | 202,012,687 | 261,098,671 | 158,663,826 | 151,577,763 | 37,196,582 | 37,888,531 | ||||||||||||||||||||||||
|
|
|
|
|
|
|
|
|
|
|
|
|
|
|
|
|
|||||||||||||||||
| End of period |
$ | 514,569,894 | $ | 518,735,416 | $ | 197,190,810 | $ | 202,012,687 | $ | 159,230,715 | $ | 158,663,826 | $ | 50,592,338 | $ | 37,196,582 | ||||||||||||||||
|
|
|
|
|
|
|
|
|
|
|
|
|
|
|
|
|
|||||||||||||||||
| Undistributed net investment income |
$ | 2,044,512 | $ | 386,033 | $ | — | $ | — | $ | 7,858,190 | $ | 5,057,141 | $ | 323,082 | $ | 54,163 | ||||||||||||||||
|
|
|
|
|
|
|
|
|
|
|
|
|
|
|
|
|
|||||||||||||||||
The accompanying notes are an integral part of these financial statements.
| 115 |
| Ohio National Fund, Inc. |
| Statements of Changes in Net Assets |
| International Portfolio |
Capital Appreciation Portfolio |
International Small-Mid Company Portfolio |
Aggressive Growth Portfolio |
|||||||||||||||||||||||||||||
| Six-Month Period Ended June 30, 2015 (Unaudited) |
Year Ended December 31, 2014 |
Six-Month Period Ended June 30, 2015 (Unaudited) |
Year Ended December 31, 2014 |
Six-Month Period Ended June 30, 2015 (Unaudited) |
Year Ended December 31, 2014 |
Six-Month Period Ended June 30, 2015 (Unaudited) |
Year Ended December 31, 2014 |
|||||||||||||||||||||||||
| Increase (Decrease) in net assets: |
||||||||||||||||||||||||||||||||
| Operations: |
||||||||||||||||||||||||||||||||
| Net investment income (loss) |
$ | 1,920,001 | $ | 2,572,757 | $ | 2,082,266 | $ | 1,213,441 | $ | 257,044 | $ | 277,179 | $ | (13,283 | ) | $ | (87,987 | ) | ||||||||||||||
| Net realized gain (loss) on investments, futures contracts, foreign currency contracts, and other foreign currency related transactions |
(1,276,176 | ) | 19,582,968 | 25,592,025 | 20,173,243 | 3,758,724 | 5,598,075 | 3,385,961 | 8,194,676 | |||||||||||||||||||||||
| Change in unrealized appreciation/depreciation on investments, futures contracts, foreign currency contracts, and other foreign currency related transactions |
9,208,941 | (39,577,450 | ) | (9,480,190 | ) | (1,239,649 | ) | 5,659,676 | (12,565,288 | ) | (599,690 | ) | (4,579,372 | ) | ||||||||||||||||||
|
|
|
|
|
|
|
|
|
|
|
|
|
|
|
|
|
|||||||||||||||||
| Change in net assets from operations |
9,852,766 | (17,421,725 | ) | 18,194,101 | 20,147,035 | 9,675,444 | (6,690,034 | ) | 2,772,988 | 3,527,317 | ||||||||||||||||||||||
|
|
|
|
|
|
|
|
|
|
|
|
|
|
|
|
|
|||||||||||||||||
| Distributions to shareholders: |
||||||||||||||||||||||||||||||||
| Distributions from net investment income |
— | — | — | (1,165,844 | ) | — | — | — | — | |||||||||||||||||||||||
|
|
|
|
|
|
|
|
|
|
|
|
|
|
|
|
|
|||||||||||||||||
| Capital transactions: |
||||||||||||||||||||||||||||||||
| Received from shares sold |
10,621,673 | 30,187,407 | 13,387,515 | 331,391,049 | 18,998,869 | 13,115,148 | 9,514,968 | 7,560,703 | ||||||||||||||||||||||||
| Received from dividends reinvested |
— | — | — | 1,165,844 | — | — | — | — | ||||||||||||||||||||||||
| Paid for shares redeemed |
(18,415,817 | ) | (27,822,330 | ) | (37,579,225 | ) | (40,131,679 | ) | (9,540,836 | ) | (15,853,656 | ) | (5,568,679 | ) | (10,565,748 | ) | ||||||||||||||||
|
|
|
|
|
|
|
|
|
|
|
|
|
|
|
|
|
|||||||||||||||||
| Change in net assets from capital transactions |
(7,794,144 | ) | 2,365,077 | (24,191,710 | ) | 292,425,214 | 9,458,033 | (2,738,508 | ) | 3,946,289 | (3,005,045 | ) | ||||||||||||||||||||
|
|
|
|
|
|
|
|
|
|
|
|
|
|
|
|
|
|||||||||||||||||
| Change in net assets |
2,058,622 | (15,056,648 | ) | (5,997,609 | ) | 311,406,405 | 19,133,477 | (9,428,542 | ) | 6,719,277 | 522,272 | |||||||||||||||||||||
| Net assets: |
||||||||||||||||||||||||||||||||
| Beginning of period |
174,370,392 | 189,427,040 | 449,414,047 | 138,007,642 | 67,554,366 | 76,982,908 | 39,925,269 | 39,402,997 | ||||||||||||||||||||||||
|
|
|
|
|
|
|
|
|
|
|
|
|
|
|
|
|
|||||||||||||||||
| End of period |
$ | 176,429,014 | $ | 174,370,392 | $ | 443,416,438 | $ | 449,414,047 | $ | 86,687,843 | $ | 67,554,366 | $ | 46,644,546 | $ | 39,925,269 | ||||||||||||||||
|
|
|
|
|
|
|
|
|
|
|
|
|
|
|
|
|
|||||||||||||||||
| Undistributed net investment income (loss) |
$ | 6,174,017 | $ | 4,254,016 | $ | 2,119,731 | $ | 37,465 | $ | 453,541 | $ | 196,497 | $ | (13,283 | ) | $ | — | |||||||||||||||
|
|
|
|
|
|
|
|
|
|
|
|
|
|
|
|
|
|||||||||||||||||
The accompanying notes are an integral part of these financial statements.
| 116 |
| Ohio National Fund, Inc. |
| Statements of Changes in Net Assets |
| Small Cap Growth Portfolio |
Mid Cap Opportunity Portfolio |
S&P 500® Index Portfolio |
Strategic Value Portfolio |
|||||||||||||||||||||||||||||
| Six-Month Period Ended June 30, 2015 (Unaudited) |
Year Ended December 31, 2014 |
Six-Month Period Ended June 30, 2015 (Unaudited) |
Year Ended December 31, 2014 |
Six-Month Period Ended June 30, 2015 (Unaudited) |
Year Ended December 31, 2014 |
Six-Month Period Ended June 30, 2015 (Unaudited) |
Year Ended December 31, 2014 |
|||||||||||||||||||||||||
| Increase (Decrease) in net assets: |
||||||||||||||||||||||||||||||||
| Operations: |
||||||||||||||||||||||||||||||||
| Net investment income (loss) |
$ | (158,200 | ) | $ | (394,361 | ) | $ | (126,837 | ) | $ | (151,221 | ) | $ | 3,369,717 | $ | 5,637,059 | $ | 5,939,271 | $ | 20,943,847 | ||||||||||||
| Net realized gain on investments and foreign currency related transactions |
7,305,312 | 15,523,432 | 4,417,400 | 15,149,638 | 4,389,702 | 3,675,264 | 5,829,610 | 36,941,062 | ||||||||||||||||||||||||
| Change in unrealized appreciation/depreciation on investments and foreign currency related transactions |
9,385,004 | 7,521,125 | (2,637,709 | ) | (5,886,389 | ) | (3,569,532 | ) | 33,949,693 | (12,846,332 | ) | (11,438,100 | ) | |||||||||||||||||||
|
|
|
|
|
|
|
|
|
|
|
|
|
|
|
|
|
|||||||||||||||||
| Change in net assets from operations |
16,532,116 | 22,650,196 | 1,652,854 | 9,112,028 | 4,189,887 | 43,262,016 | (1,077,451 | ) | 46,446,809 | |||||||||||||||||||||||
|
|
|
|
|
|
|
|
|
|
|
|
|
|
|
|
|
|||||||||||||||||
| Distributions to shareholders: |
||||||||||||||||||||||||||||||||
| Distributions from net investment income |
— | — | — | — | — | (4,671,250 | ) | — | (17,815,244 | ) | ||||||||||||||||||||||
|
|
|
|
|
|
|
|
|
|
|
|
|
|
|
|
|
|||||||||||||||||
| Capital transactions: |
||||||||||||||||||||||||||||||||
| Received from shares sold |
21,794,079 | 130,344,816 | 8,819,561 | 14,483,197 | 55,751,183 | 111,526,771 | 24,255,128 | 42,389,840 | ||||||||||||||||||||||||
| Received from dividends reinvested |
— | — | — | — | — | 4,671,250 | — | 17,815,244 | ||||||||||||||||||||||||
| Paid for shares redeemed |
(27,014,801 | ) | (50,387,901 | ) | (8,339,685 | ) | (19,935,180 | ) | (38,414,496 | ) | (81,517,679 | ) | (26,190,110 | ) | (153,890,559 | ) | ||||||||||||||||
|
|
|
|
|
|
|
|
|
|
|
|
|
|
|
|
|
|||||||||||||||||
| Change in net assets from capital transactions |
(5,220,722 | ) | 79,956,915 | 479,876 | (5,451,983 | ) | 17,336,687 | 34,680,342 | (1,934,982 | ) | (93,685,475 | ) | ||||||||||||||||||||
|
|
|
|
|
|
|
|
|
|
|
|
|
|
|
|
|
|||||||||||||||||
| Change in net assets |
11,311,394 | 102,607,111 | 2,132,730 | 3,660,045 | 21,526,574 | 73,271,108 | (3,012,433 | ) | (65,053,910 | ) | ||||||||||||||||||||||
| Net assets: |
||||||||||||||||||||||||||||||||
| Beginning of period |
212,143,920 | 109,536,809 | 86,672,004 | 83,011,959 | 388,204,137 | 314,933,029 | 332,610,905 | 397,664,815 | ||||||||||||||||||||||||
|
|
|
|
|
|
|
|
|
|
|
|
|
|
|
|
|
|||||||||||||||||
| End of period |
$ | 223,455,314 | $ | 212,143,920 | $ | 88,804,734 | $ | 86,672,004 | $ | 409,730,711 | $ | 388,204,137 | $ | 329,598,472 | $ | 332,610,905 | ||||||||||||||||
|
|
|
|
|
|
|
|
|
|
|
|
|
|
|
|
|
|||||||||||||||||
| Undistributed net investment income (loss) |
$ | (194,020 | ) | $ | (35,820 | ) | $ | (126,837 | ) | $ | — | $ | 4,255,396 | $ | 885,679 | $ | 8,776,192 | $ | 2,817,246 | |||||||||||||
|
|
|
|
|
|
|
|
|
|
|
|
|
|
|
|
|
|||||||||||||||||
The accompanying notes are an integral part of these financial statements.
| 117 |
| Ohio National Fund, Inc. |
| Statements of Changes in Net Assets |
| High Income Bond Portfolio |
Capital Growth Portfolio |
Nasdaq-100® Index Portfolio |
Bristol Portfolio |
|||||||||||||||||||||||||||||
| Six-Month Period Ended June 30, 2015 (Unaudited) |
Year Ended December 31, 2014 |
Six-Month Period Ended June 30, 2015 (Unaudited) |
Year Ended December 31, 2014 |
Six-Month Period Ended June 30, 2015 (Unaudited) |
Year Ended December 31, 2014 |
Six-Month Period Ended June 30, 2015 (Unaudited) |
Year Ended December 31, 2014 |
|||||||||||||||||||||||||
| Increase (Decrease) in net assets: |
||||||||||||||||||||||||||||||||
| Operations: |
||||||||||||||||||||||||||||||||
| Net investment income (loss) |
$ | 6,459,994 | $ | 16,751,342 | $ | (253,065 | ) | $ | (349,357 | ) | $ | 520,392 | $ | 1,307,307 | $ | 703,827 | $ | 994,675 | ||||||||||||||
| Net realized gain (loss) on investments and foreign currency related transactions |
(956,361 | ) | 8,225,039 | 2,303,808 | 8,907,401 | 2,043,729 | 4,311,375 | 24,592,630 | 45,974,586 | |||||||||||||||||||||||
| Change in unrealized appreciation/depreciation on investments and foreign currency related transactions |
(288,789 | ) | (16,353,341 | ) | 3,328,376 | (6,915,894 | ) | 2,551,923 | 12,616,165 | (10,210,247 | ) | (16,492,459 | ) | |||||||||||||||||||
|
|
|
|
|
|
|
|
|
|
|
|
|
|
|
|
|
|||||||||||||||||
| Change in net assets from operations |
5,214,844 | 8,623,040 | 5,379,119 | 1,642,150 | 5,116,044 | 18,234,847 | 15,086,210 | 30,476,802 | ||||||||||||||||||||||||
|
|
|
|
|
|
|
|
|
|
|
|
|
|
|
|
|
|||||||||||||||||
| Distributions to shareholders: |
||||||||||||||||||||||||||||||||
| Distributions from net investment income |
— | — | — | — | — | (1,151,494 | ) | — | (895,082 | ) | ||||||||||||||||||||||
|
|
|
|
|
|
|
|
|
|
|
|
|
|
|
|
|
|||||||||||||||||
| Capital transactions: |
||||||||||||||||||||||||||||||||
| Received from shares sold |
13,131,374 | 45,515,603 | 5,637,870 | 16,459,619 | 24,833,045 | 43,549,332 | 10,088,080 | 17,018,019 | ||||||||||||||||||||||||
| Received from dividends reinvested |
— | — | — | — | — | 1,151,494 | — | 895,082 | ||||||||||||||||||||||||
| Paid for shares redeemed |
(23,685,416 | ) | (131,923,035 | ) | (10,463,951 | ) | (23,042,984 | ) | (22,141,532 | ) | (35,945,696 | ) | (24,746,275 | ) | (47,019,709 | ) | ||||||||||||||||
|
|
|
|
|
|
|
|
|
|
|
|
|
|
|
|
|
|||||||||||||||||
| Change in net assets from capital transactions |
(10,554,042 | ) | (86,407,432 | ) | (4,826,081 | ) | (6,583,365 | ) | 2,691,513 | 8,755,130 | (14,658,195 | ) | (29,106,608 | ) | ||||||||||||||||||
|
|
|
|
|
|
|
|
|
|
|
|
|
|
|
|
|
|||||||||||||||||
| Change in net assets |
(5,339,198 | ) | (77,784,392 | ) | 553,038 | (4,941,215 | ) | 7,807,557 | 25,838,483 | 428,015 | 475,112 | |||||||||||||||||||||
| Net assets: |
||||||||||||||||||||||||||||||||
| Beginning of period |
230,100,451 | 307,884,843 | 75,491,145 | 80,432,360 | 121,686,069 | 95,847,586 | 232,016,582 | 231,541,470 | ||||||||||||||||||||||||
|
|
|
|
|
|
|
|
|
|
|
|
|
|
|
|
|
|||||||||||||||||
| End of period |
$ | 224,761,253 | $ | 230,100,451 | $ | 76,044,183 | $ | 75,491,145 | $ | 129,493,626 | $ | 121,686,069 | $ | 232,444,597 | $ | 232,016,582 | ||||||||||||||||
|
|
|
|
|
|
|
|
|
|
|
|
|
|
|
|
|
|||||||||||||||||
| Undistributed net investment income (loss) |
$ | 23,218,695 | $ | 16,758,701 | $ | (247,675 | ) | $ | 5,390 | $ | 676,205 | $ | 155,813 | $ | 803,420 | $ | 99,593 | |||||||||||||||
|
|
|
|
|
|
|
|
|
|
|
|
|
|
|
|
|
|||||||||||||||||
The accompanying notes are an integral part of these financial statements.
| 118 |
| Ohio National Fund, Inc. |
| Statements of Changes in Net Assets |
| Bryton Growth Portfolio |
Balanced Portfolio |
Target VIP Portfolio |
Bristol Growth Portfolio |
|||||||||||||||||||||||||||||
| Six-Month Period Ended June 30, 2015 (Unaudited) |
Year Ended December 31, 2014 |
Six-Month Period Ended June 30, 2015 (Unaudited) |
Year Ended December 31, 2014 |
Six-Month Period Ended June 30, 2015 (Unaudited) |
Year Ended December 31, 2014 |
Six-Month Period Ended June 30, 2015 (Unaudited) |
Year Ended December 31, 2014 |
|||||||||||||||||||||||||
| Increase (Decrease) in net assets: |
||||||||||||||||||||||||||||||||
| Operations: |
||||||||||||||||||||||||||||||||
| Net investment income (loss) |
$ | (487,178 | ) | $ | (818,246 | ) | $ | 5,755,797 | $ | 7,584,554 | $ | 477,121 | $ | 954,277 | $ | 296,576 | $ | 425,637 | ||||||||||||||
| Net realized gain on investments, foreign currency related transactions, and written options |
19,511,620 | 22,063,567 | 12,512,697 | 15,476,691 | 2,655,266 | 6,802,148 | 10,927,788 | 20,039,564 | ||||||||||||||||||||||||
| Change in unrealized appreciation/depreciation on investments, foreign currency related transactions, and written options |
(124,617 | ) | (9,867,313 | ) | 5,811,834 | 8,993,866 | (1,921,742 | ) | (3,839,788 | ) | (4,184,925 | ) | (6,250,848 | ) | ||||||||||||||||||
|
|
|
|
|
|
|
|
|
|
|
|
|
|
|
|
|
|||||||||||||||||
| Change in net assets from operations |
18,899,825 | 11,378,008 | 24,080,328 | 32,055,111 | 1,210,645 | 3,916,637 | 7,039,439 | 14,214,353 | ||||||||||||||||||||||||
|
|
|
|
|
|
|
|
|
|
|
|
|
|
|
|
|
|||||||||||||||||
| Distributions to shareholders: |
||||||||||||||||||||||||||||||||
| Distributions from net investment income |
— | — | — | (6,075,617 | ) | — | (854,149 | ) | — | (370,603 | ) | |||||||||||||||||||||
|
|
|
|
|
|
|
|
|
|
|
|
|
|
|
|
|
|||||||||||||||||
| Capital transactions: |
||||||||||||||||||||||||||||||||
| Received from shares sold |
7,500,740 | 30,786,203 | 79,904,371 | 624,661,369 | 2,121,420 | 6,144,750 | 4,709,837 | 10,802,580 | ||||||||||||||||||||||||
| Received from dividends reinvested |
— | — | — | 6,075,617 | — | 854,149 | — | 370,603 | ||||||||||||||||||||||||
| Paid for shares redeemed |
(24,944,178 | ) | (43,857,130 | ) | (55,727,163 | ) | (72,643,183 | ) | (5,780,383 | ) | (8,637,548 | ) | (11,555,318 | ) | (23,225,588 | ) | ||||||||||||||||
|
|
|
|
|
|
|
|
|
|
|
|
|
|
|
|
|
|||||||||||||||||
| Change in net assets from capital transactions |
(17,443,438 | ) | (13,070,927 | ) | 24,177,208 | 558,093,803 | (3,658,963 | ) | (1,638,649 | ) | (6,845,481 | ) | (12,052,405 | ) | ||||||||||||||||||
|
|
|
|
|
|
|
|
|
|
|
|
|
|
|
|
|
|||||||||||||||||
| Change in net assets |
1,456,387 | (1,692,919 | ) | 48,257,536 | 584,073,297 | (2,448,318 | ) | 1,423,839 | 193,958 | 1,791,345 | ||||||||||||||||||||||
| Net assets: |
||||||||||||||||||||||||||||||||
| Beginning of period |
179,085,936 | 180,778,855 | 833,133,639 | 249,060,342 | 55,141,909 | 53,718,070 | 124,053,307 | 122,261,962 | ||||||||||||||||||||||||
|
|
|
|
|
|
|
|
|
|
|
|
|
|
|
|
|
|||||||||||||||||
| End of period |
$ | 180,542,323 | $ | 179,085,936 | $ | 881,391,175 | $ | 833,133,639 | $ | 52,693,591 | $ | 55,141,909 | $ | 124,247,265 | $ | 124,053,307 | ||||||||||||||||
|
|
|
|
|
|
|
|
|
|
|
|
|
|
|
|
|
|||||||||||||||||
| Undistributed net investment income (loss) |
$ | (487,178 | ) | $ | — | $ | 7,166,152 | $ | 1,410,355 | $ | 577,249 | $ | 100,128 | $ | 351,610 | $ | 55,034 | |||||||||||||||
|
|
|
|
|
|
|
|
|
|
|
|
|
|
|
|
|
|||||||||||||||||
The accompanying notes are an integral part of these financial statements.
| 119 |
| Ohio National Fund, Inc. |
| Statements of Changes in Net Assets |
| Risk Managed Balanced Portfolio |
||||||||
| Six-Month Period Ended June 30, 2015 (Unaudited) |
Period from May 1, 2014* to December 31, 2014 |
|||||||
| Increase (Decrease) in net assets: |
||||||||
| Operations: |
||||||||
| Net investment income |
$ | 163,832 | $ | 81,427 | ||||
| Net realized gain on investments, futures contracts, and foreign currency related transactions |
441,673 | 1,167,312 | ||||||
| Change in unrealized appreciation/depreciation on investments, futures contracts, and foreign currency related transactions |
(1,735,757 | ) | 939,625 | |||||
|
|
|
|
|
|||||
| Change in net assets from operations |
(1,130,252 | ) | 2,188,364 | |||||
|
|
|
|
|
|||||
| Capital transactions: |
||||||||
| Received from shares sold |
48,604,016 | 54,419,880 | ||||||
| Paid for shares redeemed |
(6,606,221 | ) | (22,801,551 | ) | ||||
|
|
|
|
|
|||||
| Change in net assets from capital transactions |
41,997,795 | 31,618,329 | ||||||
|
|
|
|
|
|||||
| Change in net assets |
40,867,543 | 33,806,693 | ||||||
| Net assets: |
||||||||
| Beginning of period |
33,806,693 | — | ||||||
|
|
|
|
|
|||||
| End of period |
$ | 74,674,236 | $ | 33,806,693 | ||||
|
|
|
|
|
|||||
| Undistributed net investment income |
$ | 245,252 | $ | 81,420 | ||||
|
|
|
|
|
|||||
| * | Represents date of inception and commencement of operations. |
The accompanying notes are an integral part of these financial statements.
| 120 |
| Ohio National Fund, Inc. |
| Equity Portfolio | Money Market Portfolio | |||||||||||||||||||||||||||||||||||||||
| Six-Month Period Ended June 30, 2015 (Unaudited) |
Years Ended December 31, | Six-Month Period Ended June 30, 2015 (Unaudited) |
Years Ended December 31, | |||||||||||||||||||||||||||||||||||||
| 2014 | 2013 | 2012 | 2011 | 2014 | 2013 | 2012 | 2011 | |||||||||||||||||||||||||||||||||
| Selected per-share data: |
||||||||||||||||||||||||||||||||||||||||
| Net asset value, beginning of period |
$ | 33.44 | $ | 29.41 | $ | 21.54 | $ | 18.88 | $ | 19.72 | $ | 10.00 | $ | 10.00 | $ | 10.00 | $ | 10.00 | $ | 10.00 | ||||||||||||||||||||
| Operations: |
||||||||||||||||||||||||||||||||||||||||
| Net investment income |
0.11 | 0.12 | 0.27 | 0.35 | 0.21 | — | — | — | — | — | ||||||||||||||||||||||||||||||
| Net realized and unrealized gain (loss) on investments and foreign currency related transactions |
0.14 | 4.02 | 7.84 | 2.61 | (0.88 | ) | — | — | — | — | — | |||||||||||||||||||||||||||||
|
|
|
|
|
|
|
|
|
|
|
|
|
|
|
|
|
|
|
|
|
|||||||||||||||||||||
| Total from operations |
0.25 | 4.14 | 8.11 | 2.96 | (0.67 | ) | — | — | — | — | — | |||||||||||||||||||||||||||||
|
|
|
|
|
|
|
|
|
|
|
|
|
|
|
|
|
|
|
|
|
|||||||||||||||||||||
| Distributions: |
||||||||||||||||||||||||||||||||||||||||
| Distributions from net investment income |
— | (0.11 | ) | (0.24 | ) | (0.30 | ) | (0.17 | ) | — | — | — | — | — | ||||||||||||||||||||||||||
|
|
|
|
|
|
|
|
|
|
|
|
|
|
|
|
|
|
|
|
|
|||||||||||||||||||||
| Net asset value, end of period |
$ | 33.69 | $ | 33.44 | $ | 29.41 | $ | 21.54 | $ | 18.88 | $ | 10.00 | $ | 10.00 | $ | 10.00 | $ | 10.00 | $ | 10.00 | ||||||||||||||||||||
|
|
|
|
|
|
|
|
|
|
|
|
|
|
|
|
|
|
|
|
|
|||||||||||||||||||||
| Total return |
0.75 | % (b) | 14.07 | % | 37.69 | % | 15.69 | % | –3.38 | % | 0.00 | % (b) | 0.00 | % | 0.00 | % | 0.00 | % | 0.00 | % | ||||||||||||||||||||
| Ratios and supplemental data: |
||||||||||||||||||||||||||||||||||||||||
| Net assets at end of period (in millions) |
$ | 514.6 | $ | 518.7 | $ | 221.4 | $ | 186.5 | $ | 187.9 | $ | 197.2 | $ | 202.0 | $ | 261.1 | $ | 258.6 | $ | 286.2 | ||||||||||||||||||||
| Ratios to average net assets: |
||||||||||||||||||||||||||||||||||||||||
| Ratios net of expenses reduced or reimbursed by adviser: |
||||||||||||||||||||||||||||||||||||||||
| Expenses |
0.80 | % (a) | 0.83 | % | 0.87 | % | 0.89 | % | 0.87 | % | 0.05 | % (a) | 0.04 | % | 0.06 | % | 0.09 | % | 0.11 | % | ||||||||||||||||||||
| Net investment income |
0.64 | % (a) | 0.69 | % | 0.98 | % | 1.55 | % | 1.00 | % | 0.00 | % (a) | 0.00 | % | 0.00 | % | 0.00 | % | 0.00 | % | ||||||||||||||||||||
| Ratios assuming no expenses reduced or reimbursed by adviser: |
||||||||||||||||||||||||||||||||||||||||
| Expenses |
0.80 | % (a) | 0.83 | % | 0.87 | % | 0.89 | % | 0.87 | % | 0.34 | % (a) | 0.33 | % | 0.34 | % | 0.35 | % | 0.34 | % | ||||||||||||||||||||
| Net investment income (loss) |
0.64 | % (a) | 0.69 | % | 0.98 | % | 1.55 | % | 1.00 | % | –0.29 | % (a) | –0.29 | % | –0.28 | % | –0.26 | % | –0.23 | % | ||||||||||||||||||||
| Portfolio turnover rate |
22 | % | 46 | % | 43 | % | 48 | % | 54 | % | 0 | % | 0 | % | 0 | % | 0 | % | 0 | % | ||||||||||||||||||||
| (a) | Annualized. |
| (b) | Not annualized. |
The accompanying notes are an integral part of these financial statements.
| 121 |
| Ohio National Fund, Inc. |
| Financial Highlights |
| Bond Portfolio | Omni Portfolio | |||||||||||||||||||||||||||||||||||||||
| Six-Month Period Ended June 30, 2015 (Unaudited) |
Years Ended December 31, | Six-Month Period Ended June 30, 2015 (Unaudited) |
Years Ended December 31, | |||||||||||||||||||||||||||||||||||||
| 2014 | 2013 | 2012 | 2011 | 2014 | 2013 | 2012 | 2011 | |||||||||||||||||||||||||||||||||
| Selected per-share data: |
||||||||||||||||||||||||||||||||||||||||
| Net asset value, beginning of period |
$ | 15.65 | $ | 14.78 | $ | 15.07 | $ | 14.05 | $ | 13.21 | $ | 24.15 | $ | 21.74 | $ | 16.82 | $ | 15.21 | $ | 16.08 | ||||||||||||||||||||
| Operations: |
||||||||||||||||||||||||||||||||||||||||
| Net investment income |
0.27 | 0.50 | 0.56 | 0.51 | 0.48 | 0.13 | 0.26 | 0.24 | 0.26 | 0.25 | ||||||||||||||||||||||||||||||
| Net realized and unrealized gain (loss) on investments and foreign currency related transactions |
(0.36 | ) | 0.37 | (0.85 | ) | 0.51 | 0.36 | 0.97 | 2.37 | 4.89 | 1.57 | (0.91 | ) | |||||||||||||||||||||||||||
|
|
|
|
|
|
|
|
|
|
|
|
|
|
|
|
|
|
|
|
|
|||||||||||||||||||||
| Total from operations |
(0.09 | ) | 0.87 | (0.29 | ) | 1.02 | 0.84 | 1.10 | 2.63 | 5.13 | 1.83 | (0.66 | ) | |||||||||||||||||||||||||||
|
|
|
|
|
|
|
|
|
|
|
|
|
|
|
|
|
|
|
|
|
|||||||||||||||||||||
| Distributions: |
||||||||||||||||||||||||||||||||||||||||
| Distributions from net investment income |
— | — | — | — | — | — | (0.22 | ) | (0.21 | ) | (0.22 | ) | (0.21 | ) | ||||||||||||||||||||||||||
|
|
|
|
|
|
|
|
|
|
|
|
|
|
|
|
|
|
|
|
|
|||||||||||||||||||||
| Net asset value, end of period |
$ | 15.56 | $ | 15.65 | $ | 14.78 | $ | 15.07 | $ | 14.05 | $ | 25.25 | $ | 24.15 | $ | 21.74 | $ | 16.82 | $ | 15.21 | ||||||||||||||||||||
|
|
|
|
|
|
|
|
|
|
|
|
|
|
|
|
|
|
|
|
|
|||||||||||||||||||||
| Total return |
–0.58 | % (b) | 5.89 | % | –1.92 | % | 7.26 | % | 6.36 | % | 4.55 | % (b) | 12.12 | % | 30.53 | % | 12.04 | % | –4.12 | % | ||||||||||||||||||||
| Ratios and supplemental data: |
||||||||||||||||||||||||||||||||||||||||
| Net assets at end of period (in millions) |
$ | 159.2 | $ | 158.7 | $ | 151.6 | $ | 172.2 | $ | 162.0 | $ | 50.6 | $ | 37.2 | $ | 37.9 | $ | 33.2 | $ | 34.7 | ||||||||||||||||||||
| Ratios to average net assets: |
||||||||||||||||||||||||||||||||||||||||
| Expenses |
0.63 | % (a) | 0.64 | % | 0.66 | % | 0.66 | % | 0.66 | % | 0.76 | % (a) | 0.77 | % | 0.79 | % | 0.81 | % | 0.77 | % | ||||||||||||||||||||
| Net investment income |
3.44 | % (a) | 3.34 | % | 3.34 | % | 3.41 | % | 3.70 | % | 1.25 | % (a) | 1.06 | % | 1.17 | % | 1.49 | % | 1.40 | % | ||||||||||||||||||||
| Portfolio turnover rate |
44 | % | 35 | % | 15 | % | 18 | % | 15 | % | 100 | % | 198 | % | 210 | % | 179 | % | 147 | % | ||||||||||||||||||||
| (a) | Annualized. |
| (b) | Not annualized. |
The accompanying notes are an integral part of these financial statements.
| 122 |
| Ohio National Fund, Inc. |
| Financial Highlights |
| International Portfolio | Capital Appreciation Portfolio | |||||||||||||||||||||||||||||||||||||||
| Six-Month Period Ended June 30, 2015 (Unaudited) |
Years Ended December 31, | Six-Month Period Ended June 30, 2015 (Unaudited) |
Years Ended December 31, | |||||||||||||||||||||||||||||||||||||
| 2014 | 2013 | 2012 | 2011 | 2014 | 2013 | 2012 | 2011 | |||||||||||||||||||||||||||||||||
| Selected per-share data: |
||||||||||||||||||||||||||||||||||||||||
| Net asset value, beginning of period |
$ | 12.55 | $ | 13.85 | $ | 12.41 | $ | 10.32 | $ | 12.20 | $ | 33.82 | $ | 31.24 | $ | 23.32 | $ | 19.95 | $ | 20.37 | ||||||||||||||||||||
| Operations: |
||||||||||||||||||||||||||||||||||||||||
| Net investment income |
0.16 | 0.18 | 0.23 | 0.20 | 0.17 | 0.17 | 0.08 | 0.13 | 0.15 | 0.09 | ||||||||||||||||||||||||||||||
| Net realized and unrealized gain (loss) on investments, futures contracts, foreign currency contracts, and other foreign currency related transactions |
0.56 | (1.48 | ) | 1.21 | 1.89 | (2.05 | ) | 1.20 | 2.59 | 7.91 | 3.36 | (0.43 | ) | |||||||||||||||||||||||||||
|
|
|
|
|
|
|
|
|
|
|
|
|
|
|
|
|
|
|
|
|
|||||||||||||||||||||
| Total from operations |
0.72 | (1.30 | ) | 1.44 | 2.09 | (1.88 | ) | 1.37 | 2.67 | 8.04 | 3.51 | (0.34 | ) | |||||||||||||||||||||||||||
|
|
|
|
|
|
|
|
|
|
|
|
|
|
|
|
|
|
|
|
|
|||||||||||||||||||||
| Distributions: |
||||||||||||||||||||||||||||||||||||||||
| Distributions from net investment income |
— | — | — | — | — | — | (0.09 | ) | (0.12 | ) | (0.14 | ) | (0.08 | ) | ||||||||||||||||||||||||||
|
|
|
|
|
|
|
|
|
|
|
|
|
|
|
|
|
|
|
|
|
|||||||||||||||||||||
| Net asset value, end of period |
$ | 13.27 | $ | 12.55 | $ | 13.85 | $ | 12.41 | $ | 10.32 | $ | 35.19 | $ | 33.82 | $ | 31.24 | $ | 23.32 | $ | 19.95 | ||||||||||||||||||||
|
|
|
|
|
|
|
|
|
|
|
|
|
|
|
|
|
|
|
|
|
|||||||||||||||||||||
| Total return |
5.74 | % (b) | –9.39 | % | 11.60 | % | 20.25 | % | –15.41 | % | 4.05 | % (b) | 8.54 | % | 34.51 | % | 17.59 | % | –1.65 | % | ||||||||||||||||||||
| Ratios and supplemental data: |
||||||||||||||||||||||||||||||||||||||||
| Net assets at end of period (in millions) |
$ | 176.4 | $ | 174.4 | $ | 189.4 | $ | 180.3 | $ | 172.8 | $ | 443.4 | $ | 449.4 | $ | 138.0 | $ | 115.7 | $ | 114.7 | ||||||||||||||||||||
| Ratios to average net assets: |
||||||||||||||||||||||||||||||||||||||||
| Ratios net of expenses reduced or reimbursed by adviser: |
||||||||||||||||||||||||||||||||||||||||
| Expenses |
0.99 | % (a) | 0.84 | % | 0.75 | % | 1.02 | % | 1.02 | % | 0.79 | % (a) | 0.83 | % | 0.88 | % | 0.90 | % | 0.88 | % | ||||||||||||||||||||
| Net investment income |
2.15 | % (a) | 1.43 | % | 1.52 | % | 1.65 | % | 1.41 | % | 0.93 | % (a) | 0.56 | % | 0.45 | % | 0.66 | % | 0.41 | % | ||||||||||||||||||||
| Ratios assuming no expenses reduced or reimbursed by adviser: |
||||||||||||||||||||||||||||||||||||||||
| Expenses |
0.99 | % (a) | 1.00 | % | 1.01 | % | 1.02 | % | 1.02 | % | 0.79 | % (a) | 0.83 | % | 0.88 | % | 0.90 | % | 0.88 | % | ||||||||||||||||||||
| Net investment income |
2.15 | % (a) | 1.27 | % | 1.26 | % | 1.65 | % | 1.41 | % | 0.93 | % (a) | 0.56 | % | 0.45 | % | 0.66 | % | 0.41 | % | ||||||||||||||||||||
| Portfolio turnover rate |
45 | % | 95 | % | 53 | % | 61 | % | 58 | % | 31 | % | 67 | % | 49 | % | 39 | % | 61 | % | ||||||||||||||||||||
| (a) | Annualized. |
| (b) | Not annualized. |
The accompanying notes are an integral part of these financial statements.
| 123 |
| Ohio National Fund, Inc. |
| Financial Highlights |
| International Small-Mid Company Portfolio | Aggressive Growth Portfolio | |||||||||||||||||||||||||||||||||||||||
| Six-Month Period Ended June 30, 2015 (Unaudited) |
Years Ended December 31, | Six-Month Period Ended June 30, 2015 (Unaudited) |
Years Ended December 31, | |||||||||||||||||||||||||||||||||||||
| 2014 | 2013 | 2012 | 2011 | 2014 | 2013 | 2012 | 2011 | |||||||||||||||||||||||||||||||||
| Selected per-share data: |
||||||||||||||||||||||||||||||||||||||||
| Net asset value, beginning of period |
$ | 27.39 | $ | 30.03 | $ | 23.52 | $ | 19.17 | $ | 23.24 | $ | 13.70 | $ | 12.50 | $ | 9.51 | $ | 7.74 | $ | 8.17 | ||||||||||||||||||||
| Operations: |
||||||||||||||||||||||||||||||||||||||||
| Net investment income (loss) |
0.08 | 0.12 | 0.12 | 0.17 | 0.26 | — | (0.03 | ) | (0.02 | ) | 0.03 | — | ||||||||||||||||||||||||||||
| Net realized and unrealized gain (loss) on investments and foreign currency related transactions |
3.78 | (2.76 | ) | 6.39 | 4.18 | (4.33 | ) | 1.00 | 1.23 | 3.01 | 1.74 | (0.43 | ) | |||||||||||||||||||||||||||
|
|
|
|
|
|
|
|
|
|
|
|
|
|
|
|
|
|
|
|
|
|||||||||||||||||||||
| Total from operations |
3.86 | (2.64 | ) | 6.51 | 4.35 | (4.07 | ) | 1.00 | 1.20 | 2.99 | 1.77 | (0.43 | ) | |||||||||||||||||||||||||||
|
|
|
|
|
|
|
|
|
|
|
|
|
|
|
|
|
|
|
|
|
|||||||||||||||||||||
| Net asset value, end of period |
$ | 31.25 | $ | 27.39 | $ | 30.03 | $ | 23.52 | $ | 19.17 | $ | 14.70 | $ | 13.70 | $ | 12.50 | $ | 9.51 | $ | 7.74 | ||||||||||||||||||||
|
|
|
|
|
|
|
|
|
|
|
|
|
|
|
|
|
|
|
|
|
|||||||||||||||||||||
| Total return |
14.09 | % (b) | –8.79 | % | 27.68 | % | 22.69 | % | –17.51 | % | 7.30 | % (b) | 9.60 | % | 31.44 | % | 22.87 | % | –5.26 | % | ||||||||||||||||||||
| Ratios and supplemental data: |
||||||||||||||||||||||||||||||||||||||||
| Net assets at end of period (in millions) |
$ | 86.7 | $ | 67.6 | $ | 77.0 | $ | 64.5 | $ | 57.5 | $ | 46.6 | $ | 39.9 | $ | 39.4 | $ | 33.1 | $ | 25.8 | ||||||||||||||||||||
| Ratios to average net assets: |
||||||||||||||||||||||||||||||||||||||||
| Expenses |
1.22 | % (a) | 1.18 | % | 1.19 | % | 1.21 | % | 1.20 | % | 0.92 | % (a) | 0.94 | % | 0.97 | % | 0.99 | % | 1.04 | % | ||||||||||||||||||||
| Net investment income (loss) |
0.67 | % (a) | 0.38 | % | 0.40 | % | 0.64 | % | 1.07 | % | –0.06 | % (a) | –0.23 | % | –0.25 | % | 0.34 | % | 0.02 | % | ||||||||||||||||||||
| Portfolio turnover rate |
25 | % | 65 | % | 51 | % | 55 | % | 67 | % | 31 | % | 55 | % | 60 | % | 17 | % | 47 | % | ||||||||||||||||||||
| (a) | Annualized. |
| (b) | Not annualized. |
The accompanying notes are an integral part of these financial statements.
| 124 |
| Ohio National Fund, Inc. |
| Financial Highlights |
| Small Cap Growth Portfolio | Mid Cap Opportunity Portfolio | |||||||||||||||||||||||||||||||||||||||
| Six-Month Period Ended June 30, 2015 (Unaudited) |
Years Ended December 31, | Six-Month Period Ended June 30, 2015 (Unaudited) |
Years Ended December 31, | |||||||||||||||||||||||||||||||||||||
| 2014 | 2013 | 2012 | 2011 | 2014 | 2013 | 2012 | 2011 | |||||||||||||||||||||||||||||||||
| Selected per-share data: |
||||||||||||||||||||||||||||||||||||||||
| Net asset value, beginning of period |
$ | 25.07 | $ | 22.65 | $ | 15.59 | $ | 13.21 | $ | 12.86 | $ | 31.49 | $ | 28.24 | $ | 21.32 | $ | 17.81 | $ | 18.43 | ||||||||||||||||||||
| Operations: |
||||||||||||||||||||||||||||||||||||||||
| Net investment income (loss) |
(0.02 | ) | (0.05 | ) | (0.03 | ) | (0.03 | ) | (0.08 | ) | (0.05 | ) | (0.05 | ) | (0.07 | ) | (0.02 | ) | (0.06 | ) | ||||||||||||||||||||
| Net realized and unrealized gain (loss) on investments and foreign currency related transactions |
2.00 | 2.47 | 7.09 | 2.41 | 0.43 | 0.66 | 3.30 | 6.99 | 3.53 | (0.56 | ) | |||||||||||||||||||||||||||||
|
|
|
|
|
|
|
|
|
|
|
|
|
|
|
|
|
|
|
|
|
|||||||||||||||||||||
| Total from operations |
1.98 | 2.42 | 7.06 | 2.38 | 0.35 | 0.61 | 3.25 | 6.92 | 3.51 | (0.62 | ) | |||||||||||||||||||||||||||||
|
|
|
|
|
|
|
|
|
|
|
|
|
|
|
|
|
|
|
|
|
|||||||||||||||||||||
| Distributions: |
||||||||||||||||||||||||||||||||||||||||
| Distributions from net investment income |
— | — | — | — | — | — | — | — | — | — | ||||||||||||||||||||||||||||||
|
|
|
|
|
|
|
|
|
|
|
|
|
|
|
|
|
|
|
|
|
|||||||||||||||||||||
| Net asset value, end of period |
$ | 27.05 | $ | 25.07 | $ | 22.65 | $ | 15.59 | $ | 13.21 | $ | 32.10 | $ | 31.49 | $ | 28.24 | $ | 21.32 | $ | 17.81 | ||||||||||||||||||||
|
|
|
|
|
|
|
|
|
|
|
|
|
|
|
|
|
|
|
|
|
|||||||||||||||||||||
| Total return |
7.90 | % (b) | 10.68 | % | 45.29 | % | 18.02 | % | 2.72 | % | 1.94 | % (b) | 11.51 | % | 32.46 | % | 19.71 | % | –3.36 | % | ||||||||||||||||||||
| Ratios and supplemental data: |
||||||||||||||||||||||||||||||||||||||||
| Net assets at end of period (in millions) |
$ | 223.5 | $ | 212.1 | $ | 109.5 | $ | 35.0 | $ | 31.5 | $ | 88.8 | $ | 86.7 | $ | 83.0 | $ | 67.1 | $ | 61.1 | ||||||||||||||||||||
| Ratios to average net assets: |
||||||||||||||||||||||||||||||||||||||||
| Expenses |
0.85 | % (a) | 0.89 | % | 1.04 | % | 1.10 | % | 1.08 | % | 0.94 | % (a) | 0.94 | % | 0.96 | % | 0.98 | % | 0.96 | % | ||||||||||||||||||||
| Net investment income (loss) |
–0.15 | % (a) | –0.31 | % | –0.29 | % | –0.20 | % | –0.60 | % | –0.29 | % (a) | –0.18 | % | –0.28 | % | –0.09 | % | –0.29 | % | ||||||||||||||||||||
| Portfolio turnover rate |
16 | % | 58% | 69 | % (c) | 65 | % | 58 | % | 31 | % | 61 | % | 44 | % | 45 | % | 51 | % | |||||||||||||||||||||
| (a) | Annualized. |
| (b) | Not annualized. |
| (c) | The cost of purchases and proceeds from sales of securities that were incurred to realign the Portfolio’s holdings subsequent to the December 20, 2013 reorganization are excluded from the 2013 portfolio turnover rate calculation. If such amounts had not been excluded, the portfolio turnover rate would have been 146%. |
The accompanying notes are an integral part of these financial statements.
| 125 |
| Ohio National Fund, Inc. |
| Financial Highlights |
| S&P 500® Index Portfolio | Strategic Value Portfolio | |||||||||||||||||||||||||||||||||||||||
| Six-Month Period Ended June 30, 2015 (Unaudited) |
Years Ended December 31, | Six-Month Period Ended June 30, 2015 (Unaudited) |
Years Ended December 31, | |||||||||||||||||||||||||||||||||||||
| 2014 | 2013 | 2012 | 2011 | 2014 | 2013 | 2012 | 2011 | |||||||||||||||||||||||||||||||||
| Selected per-share data: |
||||||||||||||||||||||||||||||||||||||||
| Net asset value, beginning of period |
$ | 21.93 | $ | 19.63 | $ | 15.08 | $ | 13.25 | $ | 13.21 | $ | 13.92 | $ | 13.09 | $ | 11.09 | $ | 10.50 | $ | 9.36 | ||||||||||||||||||||
| Operations: |
||||||||||||||||||||||||||||||||||||||||
| Net investment income |
0.18 | 0.32 | 0.26 | 0.26 | 0.22 | 0.25 | 0.93 | 0.35 | 0.13 | 0.33 | ||||||||||||||||||||||||||||||
| Net realized and unrealized gain (loss) on investments and foreign currency related transactions |
0.04 | 2.25 | 4.52 | 1.78 | 0.01 | (0.30 | ) | 0.68 | 1.97 | 0.63 | 0.98 | |||||||||||||||||||||||||||||
|
|
|
|
|
|
|
|
|
|
|
|
|
|
|
|
|
|
|
|
|
|||||||||||||||||||||
| Total from operations |
0.22 | 2.57 | 4.78 | 2.04 | 0.23 | (0.05 | ) | 1.61 | 2.32 | 0.76 | 1.31 | |||||||||||||||||||||||||||||
|
|
|
|
|
|
|
|
|
|
|
|
|
|
|
|
|
|
|
|
|
|||||||||||||||||||||
| Distributions: |
||||||||||||||||||||||||||||||||||||||||
| Distributions from net investment income |
— | (0.27 | ) | (0.23 | ) | (0.21 | ) | (0.19 | ) | — | (0.78 | ) | (0.32 | ) | (0.17 | ) | (0.17 | ) | ||||||||||||||||||||||
|
|
|
|
|
|
|
|
|
|
|
|
|
|
|
|
|
|
|
|
|
|||||||||||||||||||||
| Net asset value, end of period |
$ | 22.15 | $ | 21.93 | $ | 19.63 | $ | 15.08 | $ | 13.25 | $ | 13.87 | $ | 13.92 | $ | 13.09 | $ | 11.09 | $ | 10.50 | ||||||||||||||||||||
|
|
|
|
|
|
|
|
|
|
|
|
|
|
|
|
|
|
|
|
|
|||||||||||||||||||||
| Total return |
1.00 | % (b) | 13.11 | % | 31.74 | % | 15.40 | % | 1.77 | % | –0.36 | % (b) | 12.41 | % | 21.00 | % | 7.21 | % | 14.03 | % | ||||||||||||||||||||
| Ratios and supplemental data: |
||||||||||||||||||||||||||||||||||||||||
| Net assets at end of period (in millions) |
$ | 409.7 | $ | 388.2 | $ | 314.9 | $ | 207.8 | $ | 170.7 | $ | 329.6 | $ | 332.6 | $ | 397.7 | $ | 268.2 | $ | 42.0 | ||||||||||||||||||||
| Ratios to average net assets: |
||||||||||||||||||||||||||||||||||||||||
| Expenses |
0.41 | % (a) | 0.43 | % | 0.45 | % | 0.48 | % | 0.47 | % | 0.78 | % (a) | 0.78 | % | 0.79 | % | 0.82 | % | 0.96 | % | ||||||||||||||||||||
| Net investment income |
1.66 | % (a) | 1.64 | % | 1.68 | % | 1.87 | % | 1.62 | % | 3.54 | % (a) | 5.37 | % | 3.58 | % | 3.84 | % | 4.07 | % | ||||||||||||||||||||
| Portfolio turnover rate |
7 | % | 11 | % | 15 | % | 7 | % | 9 | % | 8 | % | 22 | % | 22 | % | 30 | % | 19 | % | ||||||||||||||||||||
| (a) | Annualized. |
| (b) | Not annualized. |
The accompanying notes are an integral part of these financial statements.
| 126 |
| Ohio National Fund, Inc. |
| Financial Highlights |
| High Income Bond Portfolio | Capital Growth Portfolio | |||||||||||||||||||||||||||||||||||||||
| Six-Month Period Ended June 30, 2015 (Unaudited) |
Years Ended December 31, | Six-Month Period Ended June 30, 2015 (Unaudited) |
Years Ended December 31, | |||||||||||||||||||||||||||||||||||||
| 2014 | 2013 | 2012 | 2011 | 2014 | 2013 | 2012 | 2011 | |||||||||||||||||||||||||||||||||
| Selected per-share data: |
||||||||||||||||||||||||||||||||||||||||
| Net asset value, beginning of period |
$ | 16.32 | $ | 15.88 | $ | 14.83 | $ | 12.97 | $ | 12.31 | $ | 41.01 | $ | 40.03 | $ | 30.73 | $ | 27.00 | $ | 27.68 | ||||||||||||||||||||
| Operations: |
||||||||||||||||||||||||||||||||||||||||
| Net investment income (loss) |
0.54 | 1.57 | 1.10 | 0.99 | 1.08 | (0.15 | ) | (0.19 | ) | (0.15 | ) | (0.03 | ) | (0.19 | ) | |||||||||||||||||||||||||
| Net realized and unrealized gain (loss) on investments and foreign currency related transactions |
(0.16 | ) | (1.13 | ) | (0.05 | ) | 0.87 | (0.42 | ) | 3.14 | 1.17 | 9.45 | 3.76 | (0.49 | ) | |||||||||||||||||||||||||
|
|
|
|
|
|
|
|
|
|
|
|
|
|
|
|
|
|
|
|
|
|||||||||||||||||||||
| Total from operations |
0.38 | 0.44 | 1.05 | 1.86 | 0.66 | 2.99 | 0.98 | 9.30 | 3.73 | (0.68 | ) | |||||||||||||||||||||||||||||
|
|
|
|
|
|
|
|
|
|
|
|
|
|
|
|
|
|
|
|
|
|||||||||||||||||||||
| Net asset value, end of period |
$ | 16.70 | $ | 16.32 | $ | 15.88 | $ | 14.83 | $ | 12.97 | $ | 44.00 | $ | 41.01 | $ | 40.03 | $ | 30.73 | $ | 27.00 | ||||||||||||||||||||
|
|
|
|
|
|
|
|
|
|
|
|
|
|
|
|
|
|
|
|
|
|||||||||||||||||||||
| Total return |
2.33 | % (b) | 2.77 | % | 7.08 | % | 14.34 | % | 5.36 | % | 7.29 | % (b) | 2.45 | % | 30.26 | % | 13.81 | % | –2.46 | % | ||||||||||||||||||||
| Ratios and supplemental data: |
||||||||||||||||||||||||||||||||||||||||
| Net assets at end of period (in millions) |
$ | 224.8 | $ | 230.1 | $ | 307.9 | $ | 311.9 | $ | 267.5 | $ | 76.0 | $ | 75.5 | $ | 80.4 | $ | 55.1 | $ | 51.1 | ||||||||||||||||||||
| Ratios to average net assets: |
||||||||||||||||||||||||||||||||||||||||
| Expenses |
0.80 | % (a) | 0.77 | % | 0.77 | % | 0.79 | % | 0.78 | % | 1.00 | % (a) | 1.00 | % | 1.01 | % | 1.04 | % | 1.02 | % | ||||||||||||||||||||
| Net investment income (loss) |
5.66 | % (a) | 5.73 | % | 6.36 | % | 7.17 | % | 7.69 | % | –0.67 | % (a) | –0.45 | % | –0.44 | % | –0.10 | % | –0.64 | % | ||||||||||||||||||||
| Portfolio turnover rate |
16 | % | 33 | % | 29 | % | 35 | % | 35 | % | 17 | % | 44 | % | 42 | % | 42 | % | 44 | % | ||||||||||||||||||||
| (a) | Annualized. |
| (b) | Not annualized. |
The accompanying notes are an integral part of these financial statements.
| 127 |
| Ohio National Fund, Inc. |
| Financial Highlights |
| Nasdaq-100® Index Portfolio | Bristol Portfolio | |||||||||||||||||||||||||||||||||||||||
| Six-Month Period Ended June 30, 2015 (Unaudited) |
Years Ended December 31, | Six-Month Period Ended June 30, 2015 (Unaudited) |
Years Ended December 31, | |||||||||||||||||||||||||||||||||||||
| 2014 | 2013 | 2012 | 2011 | 2014 | 2013 | 2012 | 2011 | |||||||||||||||||||||||||||||||||
| Selected per-share data: |
||||||||||||||||||||||||||||||||||||||||
| Net asset value, beginning of period |
$ | 10.88 | $ | 9.25 | $ | 6.85 | $ | 5.85 | $ | 5.69 | $ | 20.75 | $ | 18.29 | $ | 13.01 | $ | 11.56 | $ | 12.51 | ||||||||||||||||||||
| Operations: |
||||||||||||||||||||||||||||||||||||||||
| Net investment income |
0.05 | 0.12 | 0.07 | 0.06 | 0.02 | 0.07 | 0.09 | 0.09 | 0.09 | 0.06 | ||||||||||||||||||||||||||||||
| Net realized and unrealized gain (loss) on investments |
0.40 | 1.62 | 2.39 | 0.99 | 0.16 | 1.30 | 2.45 | 5.27 | 1.43 | (0.95 | ) | |||||||||||||||||||||||||||||
|
|
|
|
|
|
|
|
|
|
|
|
|
|
|
|
|
|
|
|
|
|||||||||||||||||||||
| Total from operations |
0.45 | 1.74 | 2.46 | 1.05 | 0.18 | 1.37 | 2.54 | 5.36 | 1.52 | (0.89 | ) | |||||||||||||||||||||||||||||
|
|
|
|
|
|
|
|
|
|
|
|
|
|
|
|
|
|
|
|
|
|||||||||||||||||||||
| Distributions: |
||||||||||||||||||||||||||||||||||||||||
| Distributions from net investment income |
— | (0.11 | ) | (0.06 | ) | (0.05 | ) | (0.02 | ) | — | (0.08 | ) | (0.08 | ) | (0.07 | ) | (0.06 | ) | ||||||||||||||||||||||
|
|
|
|
|
|
|
|
|
|
|
|
|
|
|
|
|
|
|
|
|
|||||||||||||||||||||
| Net asset value, end of period |
$ | 11.33 | $ | 10.88 | $ | 9.25 | $ | 6.85 | $ | 5.85 | $ | 22.12 | $ | 20.75 | $ | 18.29 | $ | 13.01 | $ | 11.56 | ||||||||||||||||||||
|
|
|
|
|
|
|
|
|
|
|
|
|
|
|
|
|
|
|
|
|
|||||||||||||||||||||
| Total return |
4.14 | % (b) | 18.77 | % | 35.98 | % | 17.88 | % | 3.19 | % | 6.60 | % (b) | 13.88 | % | 41.21 | % | 13.19 | % | –7.16 | % | ||||||||||||||||||||
| Ratios and supplemental data: |
||||||||||||||||||||||||||||||||||||||||
| Net assets at end of period (in millions) |
$ | 129.5 | $ | 121.7 | $ | 95.8 | $ | 68.5 | $ | 55.5 | $ | 232.4 | $ | 232.0 | $ | 231.5 | $ | 204.9 | $ | 192.7 | ||||||||||||||||||||
| Ratios to average net assets: |
||||||||||||||||||||||||||||||||||||||||
| Expenses |
0.46 | % (a) | 0.48 | % | 0.51 | % | 0.53 | % | 0.52 | % | 0.80 | % (a) | 0.81 | % | 0.82 | % | 0.85 | % | 0.84 | % | ||||||||||||||||||||
| Net investment income |
0.82 | % (a) | 1.23 | % | 0.94 | % | 0.98 | % | 0.41 | % | 0.60 | % (a) | 0.42 | % | 0.51 | % | 0.68 | % | 0.52 | % | ||||||||||||||||||||
| Portfolio turnover rate |
9 | % | 23 | % | 43 | % | 25 | % | 44 | % | 123 | % | 239 | % | 269 | % | 244 | % | 198 | % | ||||||||||||||||||||
| (a) | Annualized. |
| (b) | Not annualized. |
The accompanying notes are an integral part of these financial statements.
| 128 |
| Ohio National Fund, Inc. |
| Financial Highlights |
| Bryton Growth Portfolio | Balanced Portfolio | |||||||||||||||||||||||||||||||||||||||
| Six-Month Period Ended June 30, 2015 (Unaudited) |
Years Ended December 31, | Six-Month Period Ended June 30, 2015 (Unaudited) |
Years Ended December 31, | |||||||||||||||||||||||||||||||||||||
| 2014 | 2013 | 2012 | 2011 | 2014 | 2013 | 2012 | 2011 | |||||||||||||||||||||||||||||||||
| Selected per-share data: |
||||||||||||||||||||||||||||||||||||||||
| Net asset value, beginning of period |
$ | 20.47 | $ | 19.28 | $ | 13.70 | $ | 12.31 | $ | 13.57 | $ | 18.96 | $ | 18.02 | $ | 15.76 | $ | 13.91 | $ | 13.87 | ||||||||||||||||||||
| Operations: |
||||||||||||||||||||||||||||||||||||||||
| Net investment income (loss) |
(0.06 | ) | (0.09 | ) | (0.11 | ) | (0.07 | ) | (0.08 | ) | 0.13 | 0.16 | 0.08 | 0.10 | 0.31 | |||||||||||||||||||||||||
| Net realized and unrealized gain (loss) on investments, foreign currency related transactions, and written options |
2.26 | 1.28 | 5.69 | 1.46 | (1.18 | ) | 0.42 | 0.92 | 2.32 | 1.75 | (0.00 | ) | ||||||||||||||||||||||||||||
|
|
|
|
|
|
|
|
|
|
|
|
|
|
|
|
|
|
|
|
|
|||||||||||||||||||||
| Total from operations |
2.20 | 1.19 | 5.58 | 1.39 | (1.26 | ) | 0.55 | 1.08 | 2.40 | 1.85 | 0.31 | |||||||||||||||||||||||||||||
|
|
|
|
|
|
|
|
|
|
|
|
|
|
|
|
|
|
|
|
|
|||||||||||||||||||||
| Distributions: |
||||||||||||||||||||||||||||||||||||||||
| Distributions from net investment income |
— | — | — | — | — | — | (0.14 | ) | (0.14 | ) | — | (0.27 | ) | |||||||||||||||||||||||||||
|
|
|
|
|
|
|
|
|
|
|
|
|
|
|
|
|
|
|
|
|
|||||||||||||||||||||
| Net asset value, end of period |
$ | 22.67 | $ | 20.47 | $ | 19.28 | $ | 13.70 | $ | 12.31 | $ | 19.51 | $ | 18.96 | $ | 18.02 | $ | 15.76 | $ | 13.91 | ||||||||||||||||||||
|
|
|
|
|
|
|
|
|
|
|
|
|
|
|
|
|
|
|
|
|
|||||||||||||||||||||
| Total return |
10.75 | % (b) | 6.17 | % | 40.73 | % | 11.29 | % | –9.29 | % | 2.90 | % (b) | 5.99 | % | 15.26 | % | 13.30 | % | 2.29 | % | ||||||||||||||||||||
| Ratios and supplemental data: |
||||||||||||||||||||||||||||||||||||||||
| Net assets at end of period (in millions) |
$ | 180.5 | $ | 179.1 | $ | 180.8 | $ | 157.7 | $ | 155.4 | $ | 881.4 | $ | 833.1 | $ | 249.1 | $ | 77.1 | $ | 17.1 | ||||||||||||||||||||
| Ratios to average net assets: |
||||||||||||||||||||||||||||||||||||||||
| Ratios net of expenses reduced or reimbursed by adviser: |
||||||||||||||||||||||||||||||||||||||||
| Expenses |
0.87 | % (a) | 0.88 | % | 0.89 | % | 0.93 | % | 0.91 | % | 0.63 | % (a) | 0.64 | % | 0.75 | % | 0.86 | % | 0.94 | % | ||||||||||||||||||||
| Net investment income (loss) |
–0.54 | % (a) | –0.45 | % | –0.59 | % | –0.57 | % | –0.67 | % | 1.34 | % (a) | 1.80 | % | 1.45 | % | 1.90 | % | 2.33 | % | ||||||||||||||||||||
| Ratios assuming no expenses reduced or reimbursed by adviser: |
||||||||||||||||||||||||||||||||||||||||
| Expenses |
0.87 | % (a) | 0.88 | % | 0.89 | % | 0.93 | % | 0.91 | % | 0.63 | % (a) | 0.68 | % | 0.75 | % | 0.86 | % | 0.94 | % | ||||||||||||||||||||
| Net investment income (loss) |
–0.54 | % (a) | –0.45 | % | –0.59 | % | –0.57 | % | –0.67 | % | 1.34 | % (a) | 1.76 | % | 1.45 | % | 1.90 | % | 2.33 | % | ||||||||||||||||||||
| Portfolio turnover rate |
82 | % | 178 | % | 185 | % | 152 | % | 156 | % | 45 | % | 94 | % | 82 | % (c) | 60 | % | 47 | % | ||||||||||||||||||||
| (a) | Annualized. |
| (b) | Not annualized. |
| (c) | The cost of purchases and proceeds from sales of securities that were incurred to realign the Portfolio’s holdings subsequent to the December 20, 2013 reorganization are excluded from the 2013 portfolio turnover rate calculation. If such amounts had not been excluded, the portfolio turnover rate would have been 89%. |
The accompanying notes are an integral part of these financial statements.
| 129 |
| Ohio National Fund, Inc. |
| Financial Highlights |
| Target VIP Portfolio | Bristol Growth Portfolio | |||||||||||||||||||||||||||||||||||||||
| Six-Month Period Ended June 30, 2015 (Unaudited) |
Years Ended December 31, | Six-Month Period Ended June 30, 2015 (Unaudited) |
Years Ended December 31, | |||||||||||||||||||||||||||||||||||||
| 2014 | 2013 | 2012 | 2011 | 2014 | 2013 | 2012 | 2011 | |||||||||||||||||||||||||||||||||
| Selected per-share data: |
||||||||||||||||||||||||||||||||||||||||
| Net asset value, beginning of period |
$ | 14.49 | $ | 13.70 | $ | 10.10 | $ | 8.89 | $ | 9.11 | $ | 16.44 | $ | 14.72 | $ | 10.66 | $ | 9.63 | $ | 9.84 | ||||||||||||||||||||
| Operations: |
||||||||||||||||||||||||||||||||||||||||
| Net investment income |
0.14 | 0.25 | 0.09 | 0.18 | 0.10 | 0.04 | 0.06 | 0.06 | 0.06 | 0.04 | ||||||||||||||||||||||||||||||
| Net realized and unrealized gain (loss) on investments and foreign currency related transactions |
0.16 | 0.77 | 3.61 | 1.17 | (0.23 | ) | 0.90 | 1.71 | 4.05 | 1.02 | (0.21 | ) | ||||||||||||||||||||||||||||
|
|
|
|
|
|
|
|
|
|
|
|
|
|
|
|
|
|
|
|
|
|||||||||||||||||||||
| Total from operations |
0.30 | 1.02 | 3.70 | 1.35 | (0.13 | ) | 0.94 | 1.77 | 4.11 | 1.08 | (0.17 | ) | ||||||||||||||||||||||||||||
|
|
|
|
|
|
|
|
|
|
|
|
|
|
|
|
|
|
|
|
|
|||||||||||||||||||||
| Distributions: |
||||||||||||||||||||||||||||||||||||||||
| Distributions from net investment income |
— | (0.23 | ) | (0.10 | ) | (0.14 | ) | (0.09 | ) | — | (0.05 | ) | (0.05 | ) | (0.05 | ) | (0.04 | ) | ||||||||||||||||||||||
|
|
|
|
|
|
|
|
|
|
|
|
|
|
|
|
|
|
|
|
|
|||||||||||||||||||||
| Net asset value, end of period |
$ | 14.79 | $ | 14.49 | $ | 13.70 | $ | 10.10 | $ | 8.89 | $ | 17.38 | $ | 16.44 | $ | 14.72 | $ | 10.66 | $ | 9.63 | ||||||||||||||||||||
|
|
|
|
|
|
|
|
|
|
|
|
|
|
|
|
|
|
|
|
|
|||||||||||||||||||||
| Total return |
2.07 | % (b) | 7.44 | % | 36.71 | % | 15.24 | % | –1.41 | % | 5.72 | % (b) | 12.01 | % | 38.62 | % | 11.20 | % | –1.77 | % | ||||||||||||||||||||
| Ratios and supplemental data: |
||||||||||||||||||||||||||||||||||||||||
| Net assets at end of period (in millions) |
$ | 52.7 | $ | 55.1 | $ | 53.7 | $ | 21.2 | $ | 20.5 | $ | 124.2 | $ | 124.1 | $ | 122.3 | $ | 108.0 | $ | 99.9 | ||||||||||||||||||||
| Ratios to average net assets: |
||||||||||||||||||||||||||||||||||||||||
| Expenses |
0.78 | % (a) | 0.77 | % | 0.82 | % | 0.87 | % | 0.84 | % | 0.85 | % (a) | 0.86 | % | 0.88 | % | 0.92 | % | 0.90 | % | ||||||||||||||||||||
| Net investment income |
1.74 | % (a) | 1.77 | % | 0.92 | % | 1.73 | % | 1.07 | % | 0.47 | % (a) | 0.34 | % | 0.42 | % | 0.57 | % | 0.41 | % | ||||||||||||||||||||
| Portfolio turnover rate |
68 | % | 79 | % | 57 | % (c) | 70 | % | 79 | % | 95 | % | 192 | % | 237 | % | 229 | % | 187 | % | ||||||||||||||||||||
| (a) | Annualized. |
| (b) | Not annualized. |
| (c) | The cost of purchases and proceeds from sales of securities that were incurred to realign the Portfolio’s holdings subsequent to the December 20, 2013 reorganization are excluded from the 2013 portfolio turnover rate calculation. If such amounts had not been excluded, the portfolio turnover rate would have been 138%. |
The accompanying notes are an integral part of these financial statements.
| 130 |
| Ohio National Fund, Inc. |
| Financial Highlights |
| Risk Managed Balanced Portfolio | ||||||||
| Six-Month Period Ended June 30, 2015 (Unaudited) |
Period from May 1, 2014* to December 31, 2014 |
|||||||
| Selected per-share data: |
||||||||
| Net asset value, beginning of period |
$ | 10.83 | $ | 10.00 | ||||
| Operations: |
||||||||
| Net investment income |
0.01 | 0.03 | ||||||
| Net realized and unrealized gain (loss) on investments, futures contracts, and foreign currency related transactions |
(0.08 | ) | 0.80 | |||||
|
|
|
|
|
|||||
| Total from operations |
(0.07 | ) | 0.83 | |||||
|
|
|
|
|
|||||
| Net asset value, end of period |
$ | 10.76 | $ | 10.83 | ||||
|
|
|
|
|
|||||
| Total return |
–0.65 | % (b) | 8.30 | % (b) | ||||
| Ratios and supplemental data: |
||||||||
| Net assets at end of period (in millions) |
$ | 74.7 | $ | 33.8 | ||||
| Ratios to average net assets: |
||||||||
| Expenses |
1.22 | % (a) | 1.43 | % (a) | ||||
| Net investment income |
0.61 | % (a) | 0.43 | % (a) | ||||
| Portfolio turnover rate |
35 | % | 94 | % | ||||
| (a) | Annualized. |
| (b) | Not annualized. |
| * | Represents date of inception and commencement of operations. |
The accompanying notes are an integral part of these financial statements.
| 131 |
| Ohio National Fund, Inc. |
| June 30, 2015 (Unaudited) |
| (1) | Organization |
Ohio National Fund, Inc. (the “Fund”) is a Maryland corporation registered under the Investment Company Act of 1940, as amended (the “40 Act”). The fund is an open-end investment company and follows accounting and reporting guidance under Financial Accounting Standards Board (“FASB”) Accounting Standards Codification (“ASC”) Topic 946, “Financial Services-Investment Companies”. The Fund consists of twenty-one separate investment portfolios (the “Portfolios”) that seek the following objectives and strategies:
| ¢ | Equity Portfolio — Long-term growth of capital by investing at least 80% of its assets in equity securities. |
| ¢ | Money Market Portfolio — Maximum current income consistent with preservation of principal and liquidity by investing in high quality money market instruments. |
| ¢ | Bond Portfolio — High level of income and opportunity for capital appreciation consistent with preservation of capital by investing primarily in intermediate-term and long-term fixed income securities. |
| ¢ | Omni Portfolio — High level of long-term total return consistent with preservation of capital by investing in stocks, bonds, and money market instruments. |
| ¢ | International Portfolio — Long term growth of capital by investing at least 80% of its assets in securities of foreign companies. |
| ¢ | Capital Appreciation Portfolio — Long-term capital growth by investing primarily in equity and equity related securities of established companies with either current or emerging earnings growth not fully appreciated or recognized by the market. |
| ¢ | International Small-Mid Company Portfolio — Long-term growth of capital by investing at least 80% of its assets in equity securities of foreign small and mid-cap companies. |
| ¢ | Aggressive Growth Portfolio — Long-term capital growth by investing primarily in domestic and foreign equity securities selected for growth potential. |
| ¢ | Small Cap Growth Portfolio — Long-term capital appreciation by investing at least 80% of its net assets in stocks of small companies. |
| ¢ | Mid Cap Opportunity Portfolio — Long-term total return by investing at least 80% of its net assets in equity securities of mid-cap companies, primarily those that are strategically positioned for long-term growth. |
| ¢ | S&P 500® Index Portfolio — Total return that approximates the total return of the Standard & Poor’s 500® Index, at a risk level consistent with that of the Standard & Poor’s 500® Index. |
| ¢ | Strategic Value Portfolio — Growth of capital and income by investing primarily in high dividend yielding common stocks with dividend growth potential. |
| ¢ | High Income Bond Portfolio — High current income by investing at least 80% of its net assets in lower rated corporate debt obligations commonly referred to as “junk bonds”. The Portfolio’s investments are generally rated Ba or lower by Moody’s, or BB or lower by Standard & Poor’s or Fitch. |
| ¢ | Capital Growth Portfolio — Long-term capital appreciation by investing primarily in an actively managed portfolio of equity securities of small cap growth companies. |
| ¢ |
Nasdaq-100® Index Portfolio — Long-term growth of capital by investing primarily in stocks that are included in the Nasdaq-100® Index. Unlike the other Portfolios of the Fund, the Nasdaq-100® Index Portfolio is a non-diversified portfolio for purposes of Section 5(b) of the 40 Act. |
| ¢ | Bristol Portfolio — Long-term growth of capital by investing primarily in common stocks of the 1,000 largest publicly traded U.S. companies in terms of market capitalization. |
| ¢ | Bryton Growth Portfolio — Long-term growth of capital by investing primarily in common stocks of growth-oriented U.S. companies smaller than the 500 largest publicly traded U.S. companies in terms of market capitalization. |
| ¢ | Balanced Portfolio — Capital appreciation and income by investing normally up to 75% of its assets in equity securities of domestic and foreign securities of any market capitalization while maintaining a minimum of 25% of its assets in fixed income securities. |
| 132 | (continued) |
| Ohio National Fund, Inc. |
| Notes to Financial Statements (Continued) |
June 30, 2015 (Unaudited) |
| ¢ | Target VIP Portfolio — Above average total return by investing in the common stocks of companies which are identified by a model that applies separate uniquely specialized strategies. |
| ¢ | Bristol Growth Portfolio — Long-term growth of capital by investing primarily in common stocks of the 1,000 largest publicly traded U.S. companies in terms of market capitalization. |
| ¢ | Risk Managed Balanced Portfolio — Long-term capital growth, consistent with preservation of capital and balanced by current income. The Portfolio invests in a balanced portfolio of equity and fixed-income securities and a risk management portfolio intended to enhance the risk adjusted return of the Portfolio. |
Additional detail regarding portfolio-specific objectives, policies, and investment strategies is provided in the prospectus and Statement of Additional Information of Ohio National Fund, Inc. There are no assurances that these objectives will be met. Each Portfolio, except the Nasdaq-100® Index Portfolio, is classified as diversified for purposes of Section 5(b) of the 40 Act.
At present, the Fund sells its shares only to separate accounts of The Ohio National Life Insurance Company (“ONLIC”), Ohio National Life Assurance Corporation (“ONLAC”), and National Security Life and Annuity Company (“NSLA”) to support certain benefits under variable contracts issued by those entities. In the future, Fund shares may be used for other purposes but, unless there is a change in applicable law, they will not be sold directly to the public.
Interest in each Portfolio is represented by a separate class of the Fund’s capital stock, par value $1. Each share of a Portfolio participates equally in the Portfolio’s dividends, distributions, net assets, and voting matters.
The Fund is authorized to issue 550 million of its capital shares. These authorized shares have been allocated to specific Portfolios of the Fund as follows:
The Fund’s Board of Directors (the “Board”) periodically reallocates authorized shares among the Portfolios of the Fund and may authorize additional shares as deemed necessary.
Under the Fund’s organizational documents, its Officers and Directors are indemnified against certain liabilities arising out of the performance of their duties to the Fund. In addition, in the normal course of business, the Fund enters into contracts with its vendors and others that provide for general indemnifications. The Fund’s maximum exposure under these arrangements is unknown as this would involve future claims that may be made against the Fund. However, based on experience, the risk of loss to the Fund is expected to be remote.
| (2) | Significant Accounting Policies |
The following is a summary of significant accounting policies followed by the Fund in preparation of its Schedules of Investments:
Use of Estimates
The preparation of Schedules of Investments in conformity with U.S. generally accepted accounting principles (“U.S. GAAP”) requires management to make estimates and assumptions that affect the reported amounts of assets and liabilities and disclosure of contingent assets and liabilities at the date of the financial statements and the reported amounts of increases and decreases in net assets from operations during the reporting period. Actual results could differ from those estimates.
| 133 | (continued) |
| Ohio National Fund, Inc. |
| Notes to Financial Statements (Continued) |
June 30, 2015 (Unaudited) |
Security Valuation
Investments are valued using pricing procedures approved by the Board.
Various investments in the Money Market Portfolio are valued at amortized cost in accordance with Rule 2a-7 of the 40 Act. In all Portfolios of the Fund, fixed income instruments that mature in sixty days or less, and of sufficient credit quality, are valued at amortized cost. Amortized cost valuation involves valuing a security at its cost initially and thereafter amortizing to maturity any discounts or premiums on the level-yield method, regardless of the impact of fluctuating market interest rates on the value of the security. In these instances, amortized cost approximates fair value.
Investments, other than those securities aforementioned, are valued as follows:
Domestic equity securities that are traded on U.S. exchanges, other than Nasdaq Stock Market, are valued at the last trade price reported by the primary exchange of each security (4:00 pm Eastern Time for normal trading sessions). Domestic equity securities that are listed on the Nasdaq Stock Market are valued at the Nasdaq Official Closing Price (“NOCP”). Over-the-counter domestic equity securities are valued at the last trade price reported daily as of 4:00 pm Eastern Time (normal trading sessions). Over-the-counter traded ADRs may also be valued at an evaluated price based on the value of the underlying securities. If a domestic equity security is not traded on a particular day, the mean between the bid and ask prices reported at 4:00 pm Eastern Time (normal trading sessions) by the primary exchange will generally be used for valuation purposes. The principal sources for market quotations are independent pricing services that have been approved by the Board.
Fixed income securities that have a remaining maturity exceeding sixty days are generally valued at the bid price reported at 4:00 pm Eastern Time (normal trading sessions), as provided by independent pricing services approved by the Board.
Shares of open-end mutual funds are valued at each fund’s last calculated net asset value per share.
Restricted securities, illiquid securities, or other investments for which market quotations or other observable market inputs are not readily available are valued at an estimate of value using methods determined in good faith by the Fund’s Pricing Committee under the supervision of the Board.
Foreign equity securities are initially priced at the reported close price of the exchange on which a security is primarily traded. Securities not traded on a particular day are valued at the mean between the last reported bid and ask quotes at daily close, or the last sale price when appropriate. The principal sources for market quotations are independent pricing services that have been approved by the Board.
Equity securities that are primarily traded on foreign exchanges, other than those with close times that are consistent with the normal 4:00 pm Eastern Time close of U.S. equity markets, are further subjected to fair valuation pricing procedures provided by an independent fair valuation service. The service provides data that can be used to estimate the price of a foreign issue that would prevail in a liquid market given market information available daily at 4:00 pm Eastern Time (normal trading sessions). Multiple factors may be considered in performing this valuation, including an issue’s local close price, relevant general and sector indices, currency fluctuations, and pricing of related depository receipts, exchange traded funds, and futures. The pricing procedures are performed for each individual security for which there is a fairly large degree of certainty that the local close price is not the liquid market price at the time of U.S. market close. The procedures are performed each day there is a change in a consistently used market index from the time of local close to the U.S. market close. Backtesting analysis is performed on a quarterly basis to monitor the effectiveness of these procedures. The testing is reviewed by management of the Fund as well as the Fund’s Board. Prior results have indicated that these procedures have been effective in reaching valuation objectives.
The differences between the aggregate cost and values of investments are reflected as unrealized appreciation or unrealized depreciation.
Pricing inputs used in the Fund’s determination of its investment values are categorized according to a three-tier hierarchy framework. The hierarchy is summarized in three broad levels:
| Level 1: | Quoted prices in active markets for identical securities. |
| Level 2: | Other significant observable inputs, including quoted prices for similar securities, interest rates, prepayment speeds, credit risk, etc. |
| Level 3: | Significant unobservable inputs, including the Fund’s own assumptions used to determine the value of securities. |
| 134 | (continued) |
| Ohio National Fund, Inc. |
| Notes to Financial Statements (Continued) |
June 30, 2015 (Unaudited) |
The following is a summary of the inputs used in valuing each of the Portfolio’s assets (liabilities) at value as of June 30, 2015:
| Portfolio |
Financial Instrument Type |
Level 1 | Level 2 | Level 3 | ||||||||||
| Equity |
Common Stocks** | $ | 501,425,847 | $ | — | $ | — | |||||||
| Master Limited Partnerships** | 7,879,366 | — | — | |||||||||||
| Money Market Funds | 10,822,000 | — | — | |||||||||||
|
|
|
|
|
|
|
|||||||||
| $ | 520,127,213 | $ | — | $ | — | |||||||||
|
|
|
|
|
|
|
|||||||||
| Money Market* |
Commercial Paper** | $ | — | $ | 106,496,865 | $ | — | |||||||
| U.S. Government Agency Issues | — | 7,999,907 | — | |||||||||||
| Money Market Funds | 27,000,000 | — | — | |||||||||||
|
|
|
|
|
|
|
|||||||||
| $ | 27,000,000 | $ | 114,496,772 | $ | — | |||||||||
|
|
|
|
|
|
|
|||||||||
| Bond |
Corporate Bonds** | $ | — | $ | 154,729,862 | $ | — | |||||||
| Asset-Backed Securities** | — | 882,000 | — | |||||||||||
| Money Market Funds | 1,186,000 | — | — | |||||||||||
|
|
|
|
|
|
|
|||||||||
| $ | 1,186,000 | $ | 155,611,862 | $ | — | |||||||||
|
|
|
|
|
|
|
|||||||||
| Omni |
Common Stocks** | $ | 38,298,168 | $ | — | $ | — | |||||||
| Corporate Bonds** | — | 10,320,076 | — | |||||||||||
| Asset-Backed Securities** | — | 98,000 | — | |||||||||||
| U.S. Treasury Obligations | — | 1,243,578 | — | |||||||||||
| Money Market Funds | 540,000 | — | — | |||||||||||
|
|
|
|
|
|
|
|||||||||
| $ | 38,838,168 | $ | 11,661,654 | $ | — | |||||||||
|
|
|
|
|
|
|
|||||||||
| International |
Common Stocks** | $ | 10,175,903 | $ | 139,262,011 | $ | — | |||||||
| Preferred Stocks** | — | 1,032,387 | — | |||||||||||
| Money Market Funds | 23,510,399 | — | — | |||||||||||
|
|
|
|
|
|
|
|||||||||
| $ | 33,686,302 | $ | 140,294,398 | $ | — | |||||||||
|
|
|
|
|
|
|
|||||||||
| Foreign currency contracts | $ | (271,805 | ) | $ | — | $ | — | |||||||
|
|
|
|
|
|
|
|||||||||
| Futures contracts | $ | (722,349 | ) | $ | — | $ | — | |||||||
|
|
|
|
|
|
|
|||||||||
| Capital Appreciation |
Common Stocks** | $ | 427,755,967 | $ | 7,256,421 | $ | — | |||||||
| Money Market Funds | 12,818,000 | — | — | |||||||||||
|
|
|
|
|
|
|
|||||||||
| $ | 440,573,967 | $ | 7,256,421 | $ | — | |||||||||
|
|
|
|
|
|
|
|||||||||
| International Small-Mid Company |
Common Stocks** | $ | 15,706,154 | $ | 69,063,317 | $ | — | |||||||
| Exchange Traded Funds | 403,609 | — | — | |||||||||||
| Rights** | — | 9 | — | |||||||||||
| Money Market Funds | 2,220,810 | — | — | |||||||||||
|
|
|
|
|
|
|
|||||||||
| $ | 18,330,573 | $ | 69,063,326 | $ | — | |||||||||
|
|
|
|
|
|
|
|||||||||
| Foreign currency contracts | $ | (335,828 | ) | $ | — | $ | — | |||||||
|
|
|
|
|
|
|
|||||||||
| Aggressive Growth |
Common Stocks** | $ | 45,037,773 | $ | — | $ | — | |||||||
| Money Market Funds | 1,474,000 | — | — | |||||||||||
|
|
|
|
|
|
|
|||||||||
| $ | 46,511,773 | $ | — | $ | — | |||||||||
|
|
|
|
|
|
|
|||||||||
| Small Cap Growth |
Common Stocks** | $ | 217,688,332 | $ | 4,011,857 | $ | — | |||||||
| Master Limited Partnerships** | 1,693,382 | — | — | |||||||||||
| Money Market Funds | 3,504,000 | — | — | |||||||||||
|
|
|
|
|
|
|
|||||||||
| $ | 222,885,714 | $ | 4,011,857 | $ | — | |||||||||
|
|
|
|
|
|
|
|||||||||
| Mid Cap Opportunity |
Common Stocks** | $ | 88,184,852 | $ | — | $ | — | |||||||
| Money Market Funds | 1,430,000 | — | — | |||||||||||
|
|
|
|
|
|
|
|||||||||
| $ | 89,614,852 | $ | — | $ | — | |||||||||
|
|
|
|
|
|
|
|||||||||
| 135 | (continued) |
| Ohio National Fund, Inc. |
| Notes to Financial Statements (Continued) |
June 30, 2015 (Unaudited) |
| Portfolio |
Financial Instrument Type |
Level 1 | Level 2 | Level 3 | ||||||||||
| S&P 500® Index |
Common Stocks** | $ | 391,747,417 | $ | — | $ | — | |||||||
| Exchange Traded Funds | 16,493,731 | — | — | |||||||||||
|
|
|
|
|
|
|
|||||||||
| $ | 408,241,148 | $ | — | $ | — | |||||||||
|
|
|
|
|
|
|
|||||||||
| Strategic Value |
Common Stocks** | $ | 253,610,907 | $ | 68,015,961 | $ | — | |||||||
| Money Market Funds | 6,640,000 | — | — | |||||||||||
|
|
|
|
|
|
|
|||||||||
| $ | 260,250,907 | $ | 68,015,961 | $ | — | |||||||||
|
|
|
|
|
|
|
|||||||||
| High Income Bond |
Corporate Bonds** | $ | — | $ | 219,529,537 | $ | — | |||||||
| Common Stocks** | — | — | 11,350 | |||||||||||
| Money Market Funds | 3,317,000 | — | — | |||||||||||
|
|
|
|
|
|
|
|||||||||
| $ | 3,317,000 | $ | 219,529,537 | $ | 11,350 | |||||||||
|
|
|
|
|
|
|
|||||||||
| Capital Growth |
Common Stocks** | $ | 75,332,695 | $ | — | $ | — | |||||||
| Master Limited Partnerships** | 441,694 | — | — | |||||||||||
| Money Market Funds | 118,000 | — | — | |||||||||||
|
|
|
|
|
|
|
|||||||||
| $ | 75,892,389 | $ | — | $ | — | |||||||||
|
|
|
|
|
|
|
|||||||||
| Nasdaq-100® Index |
Common Stocks** | $ | 125,721,026 | $ | — | $ | — | |||||||
| Exchange Traded Funds | 3,787,601 | — | — | |||||||||||
|
|
|
|
|
|
|
|||||||||
| $ | 129,508,627 | $ | — | $ | — | |||||||||
|
|
|
|
|
|
|
|||||||||
| Bristol |
Common Stocks** | $ | 230,698,890 | $ | — | $ | — | |||||||
| Money Market Funds | 706,000 | — | — | |||||||||||
|
|
|
|
|
|
|
|||||||||
| $ | 231,404,890 | $ | — | $ | — | |||||||||
|
|
|
|
|
|
|
|||||||||
| Bryton Growth |
Common Stocks** | $ | 177,306,960 | $ | — | $ | — | |||||||
| Money Market Funds | 4,905,000 | — | — | |||||||||||
|
|
|
|
|
|
|
|||||||||
| $ | 182,211,960 | $ | — | $ | — | |||||||||
|
|
|
|
|
|
|
|||||||||
| Balanced |
Common Stocks** | $ | 476,654,103 | $ | — | $ | — | |||||||
| Corporate Bonds** | — | 196,308,925 | — | |||||||||||
| Municipal Bonds | — | 3,558,720 | — | |||||||||||
| Preferred Stocks** | 5,699,419 | 7,528,255 | — | |||||||||||
| Trust Preferred Securities** | 9,690,518 | 24,399,878 | — | |||||||||||
| Asset-Backed / Mortgage-Backed Securities** | — | 20,121,650 | — | |||||||||||
| U.S. Treasury Obligations | — | 84,800,461 | — | |||||||||||
| Closed-End Mutual Funds | 26,161,216 | — | — | |||||||||||
| Exchange Traded Funds | 8,234,000 | — | — | |||||||||||
| Purchased Options | 5,805,000 | — | — | |||||||||||
| Money Market Funds | 20,264,000 | — | — | |||||||||||
|
|
|
|
|
|
|
|||||||||
| $ | 552,508,256 | $ | 336,717,889 | $ | — | |||||||||
|
|
|
|
|
|
|
|||||||||
| Written Options | $ | (115,150 | ) | $ | — | $ | — | |||||||
|
|
|
|
|
|
|
|||||||||
| Target VIP |
Common Stocks** | $ | 52,159,583 | $ | — | $ | — | |||||||
| Money Market Funds | 467,000 | — | — | |||||||||||
|
|
|
|
|
|
|
|||||||||
| $ | 52,626,583 | $ | — | $ | — | |||||||||
|
|
|
|
|
|
|
|||||||||
| Bristol Growth |
Common Stocks** | $ | 123,007,472 | $ | — | $ | — | |||||||
| Money Market Funds | 649,000 | — | — | |||||||||||
|
|
|
|
|
|
|
|||||||||
| $ | 123,656,472 | $ | — | $ | — | |||||||||
|
|
|
|
|
|
|
|||||||||
| 136 | (continued) |
| Ohio National Fund, Inc. |
| Notes to Financial Statements (Continued) |
June 30, 2015 (Unaudited) |
| Portfolio |
Financial Instrument Type |
Level 1 | Level 2 | Level 3 | ||||||||||
| Risk Managed Balanced |
Common Stocks** | $ | 31,135,332 | $ | 691,961 | $ | — | |||||||
| Corporate Bonds** | — | 8,605,215 | — | |||||||||||
| Preferred Stocks** | 17,276 | 375,091 | — | |||||||||||
| Trust Preferred Securities** | 52,550 | 114,516 | — | |||||||||||
| Preferred Stock Depository Receipts** | 213,992 | 128,974 | — | |||||||||||
| Master Limited Partnerships** | 2,101,375 | — | — | |||||||||||
| Asset-Backed / Mortgage-Backed Securities** | — | 1,217,609 | — | |||||||||||
| U.S. Treasury Obligations | — | 11,564,795 | — | |||||||||||
| U.S. Government Agency Mortgage-Backed Securities | — | 4,583,638 | — | |||||||||||
| Purchased Options | 2,619,909 | 1,577,408 | — | |||||||||||
| Money Market Funds | 10,879,000 | — | — | |||||||||||
|
|
|
|
|
|
|
|||||||||
| $ | 47,019,434 | $ | 28,859,207 | $ | — | |||||||||
|
|
|
|
|
|
|
|||||||||
| Futures contracts | $ | (422,306 | ) | $ | — | $ | — | |||||||
|
|
|
|
|
|
|
|||||||||
| * | At June 30, 2015, the Money Market Portfolio’s investments, with the exception of money market funds, were valued using amortized cost, in accordance with rules under the 40 Act. Amortized cost approximates the current fair value of a security, but since the value is not obtained from a quoted price in an active market, such securities are considered to be valued using Level 2 inputs. |
| ** | For detailed industry descriptions, see the accompanying Schedules of Investments. |
As stated above, the value assigned to the Fund’s foreign securities will, in most cases, not be the quoted or published prices of the investments on their respective primary markets or exchanges. Securities that are priced using fair value estimates are categorized as Level 2 in the fair value hierarchy, whereas securities that do not meet the established criteria are categorized as Level 1. The valuation of a foreign security from one valuation period to the next may result in a transfer between Levels 1 and 2 if the degree of certainty that the local close price is not the liquid market price at the time of U.S. market close is not similar for both periods. The Fund’s policy is to recognize transfers between fair value hierarchy levels at the reporting period end.
In the International Portfolio, there was a transfer of a security from Level 2 pricing at December 31, 2014, to Level 1 at June 30, 2015. This security was that Portfolio’s holding of Cerved Information Solutions SpA common stock. The fair valuation service provider reported that this security did not meet the minimum predictability threshold to be fair valued at June 30, 2015 and was not fair valued in the current period, whereas in the prior period, the security met the threshold to be fair valued. The value of this holding was $933,097 and $533,906 at June 30, 2015 and December 31, 2014, respectively.
In the International Small-Mid Company Portfolio, there was a transfer of a security from Level 2 pricing at December 31, 2014, to Level 1 at June 30, 2015. This security was that Portfolio’s holding of MorphoSys AG common stock. The fair valuation service provider reported that this security did not meet the minimum predictability threshold to be fair valued at June 30, 2015 and was not fair valued in the current period, whereas in the prior period, the security met the threshold to be fair valued. The value of this holding was $115,628 and $475,286 at June 30, 2015 and December 31, 2014, respectively.
| 137 | (continued) |
| Ohio National Fund, Inc. |
| Notes to Financial Statements (Continued) |
June 30, 2015 (Unaudited) |
Below is a reconciliation that details the activity of securities in Level 3 during the six-month period ended June 30, 2015:
| High Income Bond | ||||
| Beginning Balance – January 1, 2015 |
$ | 5,799 | ||
| Total gains or losses (realized/unrealized): |
||||
| Included in earnings (or changes in net assets) |
5,551 | |||
| Issuances |
— | |||
| Settlements |
— | |||
| Transfers out of Level 3 (due to availability of acitve market quotations or significant observable market inputs) |
— | |||
| Transfers into Level 3 (due to lack of active market quotations or significant observable inputs) |
— | |||
|
|
|
|||
| Ending Balance – June 30, 2015 |
$ | 11,350 | ||
|
|
|
|||
| The amount of total gains or losses for the period included in earnings (or changes in net assets) |
$ | 5,551 | ||
|
|
|
|||
The following table present additional information about valuation techniques and inputs used for investments that are measured at fair value and categorized within Level 3 at June 30, 2015:
| Instrument |
Valuation Technique Used |
Unobservable inputs |
Input Values | |||||
| Lone Pine Common Stock |
Value of claim on the enterprise value of underlying company | Net enterprise value (in thousands) |
$ | 181,770 | ||||
| Share class claim on value |
25 | % | ||||||
| # of share class total shares (in thousands) | 24,990 | |||||||
Foreign Securities and Currency
The books and records of all the Portfolios are maintained in U.S. dollars. All investments and cash quoted in foreign currencies are valued daily in U.S. dollars on the basis of the foreign currency exchange rates provided by an independent source. These exchange rates are currently determined daily, at 4:00 pm Eastern Time for normal trading sessions. Purchases and sales of foreign-denominated investments are recorded at rates of exchange prevailing on the respective dates of such transactions.
The Fund may not fully isolate that portion of the results of operations resulting from changes in foreign exchange rates from fluctuations arising from changes in market prices on foreign currency-denominated investments. For the portion that is isolated, amounts are reflected in the Statements of Operations as other foreign currency related transactions. However, for tax purposes, the Fund does fully isolate the effect of fluctuations in foreign exchange rates when determining the gain or loss upon sale or maturity of such investments to the extent required by federal income tax regulations.
All Portfolios of the Fund may invest in securities of foreign issuers. Securities of foreign issuers that are purchased by the Money Market Portfolio are limited to 50% of that Portfolio’s assets and must be denominated in U.S. dollars and held in custody in the United States of America. The International and International Small-Mid Company Portfolios may be invested entirely in foreign securities. Investments in securities of foreign issuers, including investments in foreign companies through the use of depositary receipts, carry certain risks not ordinarily associated with investments in securities of domestic issuers. Such risks include future political and economic developments, and the possible imposition of exchange controls or other foreign governmental laws and restrictions. In addition, with respect to certain countries, there is the possibility of expropriation of assets, confiscatory taxation, political or social instability, or diplomatic developments that could adversely affect capital investment within those countries.
Restricted and Illiquid Securities
Restricted securities are those securities purchased through a private offering and cannot be resold to the general public without prior registration under the Securities Act of 1933 (“the 1933 Act”) or pursuant to the resale limitations provided by Rule 144A under the 1933 Act, or an exemption from the registration requirements of the 1933 Act. 144A securities are issued by corporations without registration in reliance on 1933 Act provisions allowing for the private resale of unregistered securities to qualified institutional buyers. Section 4(a)(2) commercial paper is issued pursuant to Section 4(a)(2) of the 1933 Act which exempts an issue from registration. This paper may be used to finance non-current transactions, such as acquisitions, stock
| 138 | (continued) |
| Ohio National Fund, Inc. |
| Notes to Financial Statements (Continued) |
June 30, 2015 (Unaudited) |
repurchase programs, and other long-term assets. Investments by a portfolio in Rule 144A and Section 4(a)(2) securities could have the effect of decreasing the liquidity of a Portfolio during any period in which qualified institutional investors were no longer interested in purchasing these securities.
Typically, the restricted securities noted above are not considered illiquid. The criteria used to determine if a restricted security is illiquid includes frequency of trades and quotes, available dealers willing to make transactions, availability of market makers in the security, and the nature of the security and its trades. The Money Market, Bond, and Omni Portfolios may invest up to 10% of their respective assets in illiquid securities. Each of the other Portfolios of the Fund may invest up to 15% of its net assets in illiquid securities.
Investment Transactions and Related Income
For financial reporting purposes, investment transactions are accounted for on a trade date basis. For purposes of executing separate account shareholder transactions in the normal course of business, however, the Fund’s investment transactions are recorded no later than the first calculation on the first business day following the trade date in accordance with Rule 2a-4 of the 40 Act. Accordingly, differences between the net asset values for financial reporting and for executing separate account shareholder transactions may arise.
Dividend income is recognized on the ex-dividend date, except in the case of those Portfolios holding foreign securities, in which dividends are recorded as soon after the ex-dividend date as the Fund’s information agents become aware of such dividends. Interest income is accrued daily as earned and includes the amortization of premium and accretion of discount. Net realized gain or loss on investments and foreign exchange transactions are determined using the specific identification method.
Distributions to Shareholders and Federal Taxes
Net investment income of the Money Market Portfolio is declared and paid daily as a dividend to shareholders immediately before the computation of the net asset value of Money Market Portfolio shares. Dividends are automatically reinvested in additional Money Market Portfolio shares at the net asset value immediately following such computation. Distributions arising from net investment income and net capital gains from the remaining Portfolios are declared and paid to shareholders periodically as required for each of the Portfolios to continue to qualify as a regulated investment company pursuant to Subchapter M of the Internal Revenue Code. The Fund, excluding the Money Market Portfolio, may also fully or partially satisfy its distribution requirements by using consent dividends rather than cash dividends if consent dividends are authorized, these amounts will become taxable to the shareholders as if they were paid in cash. The Fund has the intent to continue to comply with tax provisions pertaining to regulated investment companies and make distributions of taxable income, whether by cash or consent dividends, sufficient to relieve it from substantially all federal income and excise taxes. As such, no provisions for federal income or excise taxes have been recorded.
The character of income and realized capital gains distributions are determined in accordance with federal income tax regulations and may differ from net investment income and realized gains for financial reporting purposes. These “book/tax” differences are either considered temporary or permanent in nature. To the extent these differences are permanent in nature they are reclassified within the composition of net assets; temporary differences do not require such reclassification. Distributions to shareholders that exceed taxable income and net taxable realized gains are reported as return of capital distributions.
The Fund’s management and its tax agent, U.S. Bancorp Fund Services, LLC, perform an affirmative evaluation of tax positions taken or expected to be taken in the course of preparing the Fund’s tax returns to determine whether it is more-likely-than-not (i.e. greater than 50-percent) that each tax position will be sustained upon examination by a taxing authority based on the technical merits of the position. A tax position that meets the more-likely-than-not recognition threshold is measured to determine the amount of benefit to recognize in the Schedules of Investments. Differences between tax positions taken in a tax return and amounts recognized in the Schedules of Investments will generally result in an increase in a liability for taxes payable (or a reduction of a tax refund receivable), including the recognition of any related interest and penalties as an operating expense. Implementation of the evaluation included a review of tax positions taken in tax years that remain subject to examination by all major tax jurisdictions, including federal tax and the state of Maryland (i.e., the last four tax year ends and the interim tax period since then). The determination has been made that there are no uncertain tax positions that would require the Portfolios to record a tax liability and, therefore, there is no impact to the Portfolios’ Schedules of Investments.
| 139 | (continued) |
| Ohio National Fund, Inc. |
| Notes to Financial Statements (Continued) |
June 30, 2015 (Unaudited) |
Expense Allocation
Expenses directly attributable to a Portfolio are charged to that Portfolio. Expenses that cannot be directly attributed to a Portfolio are allocated among all the benefited Portfolios on a basis of relative net assets or other appropriate method.
Foreign Withholding Taxes
Certain Portfolios in the Fund may be subject to taxes imposed by countries in which they invest with respect to their investments in issuers existing or operating in such countries. Such taxes are generally withheld based on income earned. These Portfolios accrue such taxes as the related income is earned.
Subsequent Events
In its meeting on May 21, 2015, the Board determined, due to the continued poor performance of the Capital Growth Portfolio, to replace Eagle Asset Management, Inc. (“Eagle”) as the sub-adviser for the Portfolio. Accordingly, the Board approved the continuance of the sub-advisory agreement with Eagle only until such time as a replacement sub-adviser could take over management of the Portfolio. In its meeting on August 13, 2015, the Board, including a majority of the Directors who are not “interested persons” of the Fund, approved a sub-advisory agreement with ClearBridge, LLC to become the sub-adviser of the Portfolio. It is anticipated that the change in sub-adviser will be effective on September 25, 2015. Upon the change in sub-adviser, the name of the Portfolio will become “ClearBridge Small Cap Portfolio” and the new sub-adviser will begin managing the Portfolio using a different investment strategy that will be described in a revised prospectus for the Portfolio.
Management has evaluated events and transactions through the date the financial statements were issued, for purposes of recognition or disclosure in these financial statements, and there are no other subsequent events to report.
| (3) | Related Party and Other Transactions |
The Fund has an Investment Advisory Agreement with Ohio National Investments, Inc. (“ONI”), a wholly-owned subsidiary of ONLIC. Under the terms of this agreement, ONI provides portfolio management and investment advice to the Fund and administers its operations, subject to the supervision of the Fund’s Board. This agreement is renewed annually upon the approval by the Board. As compensation for its services, ONI receives advisory fees from the Fund calculated on the basis of each Portfolio’s average daily net assets and the following current schedule of Board-approved annualized fee breakpoints.
| 140 | (continued) |
| Ohio National Fund, Inc. |
| Notes to Financial Statements (Continued) |
June 30, 2015 (Unaudited) |
| 1 | For the six-month period ended June 30, 2015, ONI waived advisory fees in excess of an annualized rate of 0.25% of the first $100 million of average daily net assets in the Money Market Portfolio. Waivers related to the Money Market Portfolio are voluntary and are not subject to recoupment in subsequent periods. The amount of the waiver for the six-month period ended June 30, 2015 was $25,000. If ONI did not agree to waive these fees, the total expenses incurred by the Money Market Portfolio for the six-month period ended June 30, 2015 would have been higher than the net expenses reflected in the Statements of Operations. |
Under the Investment Advisory Agreement, the Fund authorizes ONI to retain sub-advisers (“the Sub-Advisers”) for the Equity, Omni, International, Capital Appreciation, International Small-Mid Company, Aggressive Growth, Small Cap Growth, Mid Cap Opportunity, Strategic Value, High Income Bond, Capital Growth, Bristol, Bryton Growth, Balanced, Target VIP, Bristol Growth, and Risk Managed Balanced Portfolios subject to the approval of the Board. ONI has entered into sub-advisory agreements with ClearBridge, LLC (formerly Legg Mason Capital Management, Inc.) (“ClearBridge”), Suffolk Capital Management, LLC (“Suffolk”), Federated Global Investment Management Corp. (“Federated Global”), Jennison Associates LLC (“Jennison”), Janus Capital Management LLC (“Janus”), Goldman Sachs Asset Management, L.P. (“Goldman Sachs”), Federated Equity Management Company of Pennsylvania (“Federated Equity”), Federated Investment Management Company (“Federated Investment”), Eagle Asset Management, Inc. (“Eagle”), ICON Advisers, Inc. (“ICON”), First Trust Advisors L.P. (“First Trust”), and AnchorPath Financial, LLC (“AnchorPath”), to manage the investment of those Portfolios’ assets, subject to the supervision of ONI. As compensation for their services, the Sub-Advisers receive from ONI a sub-advisory fee calculated on the basis of each of the aforementioned Portfolio’s average daily net assets and the following current Board-approved schedule of annualized fee breakpoints.
| 141 | (continued) |
| Ohio National Fund, Inc. |
| Notes to Financial Statements (Continued) |
June 30, 2015 (Unaudited) |
Suffolk, the sub-adviser for the Omni, Bristol, Bryton Growth, and Bristol Growth Portfolios has an affiliation with ONI. Ohio National Financial Services, Inc. (ONFS) owns 100% of ONLIC, the parent company of ONI, and also owns 84.7% of the voting securities of Suffolk. There were no Fund liabilities payable to Suffolk at June 30, 2015 and fees paid to Suffolk are an expense of ONI, not of the Fund.
Pursuant to a service agreement among ONI, ONLIC, and the Fund, ONLIC has agreed to provide personnel and facilities to ONI on a cost-reimbursement basis. These personnel members include officers of the Fund. ONLIC also provides clerical and administrative services and such supplies and equipment as may be reasonably required in order for ONI to properly perform its advisory function pursuant to the Investment Advisory Agreement. ONLIC further performs duties to fulfill the transfer agent function on behalf of the Fund. Performance of these duties by ONLIC and availability of facilities, personnel, supplies, and equipment does not represent an expense to the Fund in excess of the advisory fees paid to ONI.
Pursuant to the Investment Advisory Agreement between ONI and the Fund, if the total expenses applicable to any Portfolio during any calendar quarter (excluding taxes, brokerage commissions, interest expense and management fees) exceed 1%, on an annualized basis, evaluated quarterly, of such Portfolio’s average daily net asset value, ONI will reimburse the Portfolio for such excess expenses. There were no expense reimbursements associated with this agreement during the six-month period ended June 30, 2015.
During the six-month period ended June 30, 2015, ONI voluntarily reimbursed the amount of daily gross expenses of the Money Market Portfolio in excess of daily income earned by the Portfolio. The amount reimbursed to the Portfolio for the six-month period ended June 30, 2015 was $ 253,557, of which $29,024 was receivable from ONI at June 30, 2015. This reimbursement is not subject to recoupment in subsequent periods. The total amount noted as “Less expenses reduced or reimbursed by adviser” for this Portfolio on the Statements of Operations also includes a waiver of advisory fees. For the six-month period ended June 30, 2015, ONI waived advisory fees in excess of an annualized rate of 0.25% of the first $100 million of average daily net assets in the Money Market Portfolio. Waivers related to the Money Market Portfolio are voluntary and are not subject to recoupment in subsequent periods. The amount of the waiver for the six-month period ended June 30, 2015 was $25,000. If ONI did not agree to
| 142 | (continued) |
| Ohio National Fund, Inc. |
| Notes to Financial Statements (Continued) |
June 30, 2015 (Unaudited) |
waive these fees, the total expenses incurred by the Money Market Portfolio for the six-month period ended June 30, 2015 would have been higher than the net expenses reflected in the Statements of Operations.
The Investment Advisory Agreement allows for a portion of the expenses related to the Fund’s Chief Compliance Officer and staff to be incurred by the Fund and paid from the Fund to the Fund’s adviser, ONI. Pursuant to the service agreement among ONI, ONLIC, and the Fund, ONLIC has provided the personnel, services, and equipment necessary for the execution of the Fund’s regulation-mandated compliance function and ONI has reimbursed ONLIC for costs allocated to the Fund. For the six-month period ended June 30, 2015, the Fund incurred compliance expenses totaling $92,000, which is allocated to the Portfolios by equal dollar amounts. Expenses incurred by the Portfolios are reflected on the Statements of Operations as “Compliance expense”.
Each director of the Board is compensated based on an annual retainer fee of $90,000, paid quarterly. The Board chair receives an additional quarterly retainer fee of $3,750, the lead independent director of the Board receives an additional quarterly retainer fee of $3,125, and the Audit Committee chair receives an additional quarterly retainer fee of $1,250; each paid quarterly. For the six-month period ended June 30, 2015, directors’ compensation and reimbursement of director expenses by the Portfolios of the Fund totaled $245,560.
U.S. Bancorp Fund Services, LLC, 615 East Michigan Street, Milwaukee, Wisconsin, serves as the accounting agent for all but the International and International Small-Mid Company Portfolios. U.S. Bank Institutional Trust & Custody, 425 Walnut Street, Cincinnati, Ohio serves as the custodian for all but the International and International Small-Mid Company Portfolios. The accounting agent and custodian for the International and International Small-Mid Company Portfolios is State Street Bank-Kansas City, 801 Pennsylvania Ave., Kansas City, Missouri. For assets held outside the United States, U.S. Bank and State Street Bank-Kansas City enter into sub-custodial agreements, subject to approval by the Board.
| (4) | Capital Share Transactions |
Capital share transactions for the six-month period ended June 30, 2015, and the year ended December 31, 2014, respectively, were as follows:
| Equity | Money Market | Bond | ||||||||||||||||||||||
| Six-Month Period ended 6/30/2015 |
Year Ended 12/31/2014 |
Six-Month Period ended 6/30/2015 |
Year Ended 12/31/2014 |
Six-Month Period ended 6/30/2015 |
Year Ended 12/31/2014 |
|||||||||||||||||||
| Capital shares issued on sales |
994,813 | 9,807,995 | 6,494,490 | 19,218,401 | 1,420,290 | 3,030,585 | ||||||||||||||||||
| Capital shares issued on reinvested dividends |
— | 50,620 | — | — | — | — | ||||||||||||||||||
| Capital shares redeemed |
(1,235,086 | ) | (1,872,987 | ) | (6,976,677 | ) | (25,127,000 | ) | (1,324,526 | ) | (3,149,736 | ) | ||||||||||||
|
|
|
|
|
|
|
|
|
|
|
|
|
|||||||||||||
| Net increase/(decrease) |
(240,273 | ) | 7,985,628 | (482,187 | ) | (5,908,599 | ) | 95,764 | (119,151 | ) | ||||||||||||||
|
|
|
|
|
|
|
|
|
|
|
|
|
|||||||||||||
| Omni | International | Capital Appreciation | ||||||||||||||||||||||
| Six-Month Period ended 6/30/2015 |
Year Ended 12/31/2014 |
Six-Month Period ended 6/30/2015 |
Year Ended 12/31/2014 |
Six-Month Period ended 6/30/2015 |
Year Ended 12/31/2014 |
|||||||||||||||||||
| Capital shares issued on sales |
668,319 | 127,023 | 793,660 | 2,302,342 | 382,464 | 10,054,175 | ||||||||||||||||||
| Capital shares issued on reinvested dividends |
— | 14,307 | — | — | — | 35,371 | ||||||||||||||||||
| Capital shares redeemed |
(204,913 | ) | (344,229 | ) | (1,384,358 | ) | (2,089,021 | ) | (1,070,797 | ) | (1,217,063 | ) | ||||||||||||
|
|
|
|
|
|
|
|
|
|
|
|
|
|||||||||||||
| Net increase/(decrease) |
463,406 | (202,899 | ) | (590,698 | ) | 213,321 | (688,333 | ) | 8,872,483 | |||||||||||||||
|
|
|
|
|
|
|
|
|
|
|
|
|
|||||||||||||
| International Small-Mid Company |
Aggressive Growth | Small Cap Growth | ||||||||||||||||||||||
| Six-Month Period ended 6/30/2015 |
Year Ended 12/31/2014 |
Six-Month Period ended 6/30/2015 |
Year Ended 12/31/2014 |
Six-Month Period ended 6/30/2015 |
Year Ended 12/31/2014 |
|||||||||||||||||||
| Capital shares issued on sales |
625,125 | 451,579 | 648,169 | 596,695 | 836,003 | 5,798,430 | ||||||||||||||||||
| Capital shares issued on reinvested dividends |
— | — | — | — | — | — | ||||||||||||||||||
| Capital shares redeemed |
(317,156 | ) | (549,074 | ) | (388,149 | ) | (835,040 | ) | (1,036,873 | ) | (2,173,789 | ) | ||||||||||||
|
|
|
|
|
|
|
|
|
|
|
|
|
|||||||||||||
| Net increase/(decrease) |
307,969 | (97,495 | ) | 260,020 | (238,345 | ) | (200,870 | ) | 3,624,641 | |||||||||||||||
|
|
|
|
|
|
|
|
|
|
|
|
|
|||||||||||||
| 143 | (continued) |
| Ohio National Fund, Inc. |
| Notes to Financial Statements (Continued) |
June 30, 2015 (Unaudited) |
| Mid Cap Opportunity | S&P 500® Index | Strategic Value | ||||||||||||||||||||||
| Six-Month Period ended 6/30/2015 |
Year Ended 12/31/2014 |
Six-Month Period ended 6/30/2015 |
Year Ended 12/31/2014 |
Six-Month Period ended 6/30/2015 |
Year Ended 12/31/2014 |
|||||||||||||||||||
| Capital shares issued on sales |
275,669 | 492,242 | 2,517,349 | 5,393,429 | 1,722,706 | 2,994,850 | ||||||||||||||||||
| Capital shares issued on reinvested dividends |
— | — | — | 216,562 | — | 1,295,654 | ||||||||||||||||||
| Capital shares redeemed |
(261,697 | ) | (679,451 | ) | (1,723,482 | ) | (3,957,420 | ) | (1,846,578 | ) | (10,775,289 | ) | ||||||||||||
|
|
|
|
|
|
|
|
|
|
|
|
|
|||||||||||||
| Net increase/(decrease) |
13,972 | (187,209 | ) | 793,867 | 1,652,571 | (123,872 | ) | (6,484,785 | ) | |||||||||||||||
|
|
|
|
|
|
|
|
|
|
|
|
|
|||||||||||||
| High Income Bond | Capital Growth | Nasdaq-100® Index | ||||||||||||||||||||||
| Six-Month Period ended 6/30/2015 |
Year Ended 12/31/2014 |
Six-Month Period ended 6/30/2015 |
Year Ended 12/31/2014 |
Six-Month Period ended 6/30/2015 |
Year Ended 12/31/2014 |
|||||||||||||||||||
| Capital shares issued on sales |
786,385 | 2,776,857 | 134,219 | 416,020 | 2,209,299 | 4,349,282 | ||||||||||||||||||
| Capital shares issued on reinvested dividends |
— | — | — | — | — | 106,128 | ||||||||||||||||||
| Capital shares redeemed |
(1,420,492 | ) | (8,064,822 | ) | (246,826 | ) | (584,328 | ) | (1,967,686 | ) | (3,627,481 | ) | ||||||||||||
|
|
|
|
|
|
|
|
|
|
|
|
|
|||||||||||||
| Net increase/(decrease) |
(634,107 | ) | (5,287,965 | ) | (112,607 | ) | (168,308 | ) | 241,613 | 827,929 | ||||||||||||||
|
|
|
|
|
|
|
|
|
|
|
|
|
|||||||||||||
| Bristol | Bryton Growth | Balanced | ||||||||||||||||||||||
| Six-Month Period ended 6/30/2015 |
Year Ended 12/31/2014 |
Six-Month Period ended 6/30/2015 |
Year Ended 12/31/2014 |
Six-Month Period ended 6/30/2015 |
Year Ended 12/31/2014 |
|||||||||||||||||||
| Capital shares issued on sales |
464,799 | 885,795 | 348,044 | 1,556,041 | 4,105,838 | 33,697,189 | ||||||||||||||||||
| Capital shares issued on reinvested dividends |
— | 43,834 | — | — | — | 325,770 | ||||||||||||||||||
| Capital shares redeemed |
(1,136,866 | ) | (2,406,623 | ) | (1,132,343 | ) | (2,185,467 | ) | (2,865,306 | ) | (3,910,873 | ) | ||||||||||||
|
|
|
|
|
|
|
|
|
|
|
|
|
|||||||||||||
| Net increase/(decrease) |
(672,067 | ) | (1,476,994 | ) | (784,299 | ) | (629,426 | ) | 1,240,532 | 30,112,086 | ||||||||||||||
|
|
|
|
|
|
|
|
|
|
|
|
|
|||||||||||||
| Target VIP | Bristol Growth | Risk Managed Balanced | ||||||||||||||||||||||
| Six-Month Period ended 6/30/2015 |
Year Ended 12/31/2014 |
Six-Month Period ended 6/30/2015 |
Year Ended 12/31/2014 |
Six-Month Period ended 6/30/2015 |
Period from 5/1/2014* to 12/31/2014 |
|||||||||||||||||||
| Capital shares issued on sales |
142,875 | 435,011 | 272,149 | 703,568 | 4,419,358 | 5,294,469 | ||||||||||||||||||
| Capital shares issued on reinvested dividends |
— | 59,398 | — | 22,849 | — | — | ||||||||||||||||||
| Capital shares redeemed |
(386,366 | ) | (609,589 | ) | (670,702 | ) | (1,488,214 | ) | (601,759 | ) | (2,173,736 | ) | ||||||||||||
|
|
|
|
|
|
|
|
|
|
|
|
|
|||||||||||||
| Net increase/(decrease) |
(243,491 | ) | (115,180 | ) | (398,553 | ) | (761,797 | ) | 3,817,599 | 3,120,733 | ||||||||||||||
|
|
|
|
|
|
|
|
|
|
|
|
|
|||||||||||||
| * | Date of commencement of operations |
| (5) | Investment Transactions |
Cost of purchases and proceeds from sales of investments (excluding short-term and government securities) for the six-month period ended June 30, 2015 were as follows:
| Equity | Bond | Omni | International | Capital Appreciation | ||||||||||||||||
| Cost of purchases |
$ | 112,725,460 | $ | 57,443,914 | $ | 51,978,151 | $ | 63,314,085 | $ | 134,955,265 | ||||||||||
| Proceeds from sales |
$ | 117,376,737 | $ | 50,804,710 | $ | 40,834,200 | $ | 72,624,834 | $ | 154,770,738 | ||||||||||
| International Small-Mid Company |
Aggressive Growth | Small Cap Growth | Mid Cap Opportunity | S&P 500® Index | ||||||||||||||||
| Cost of purchases |
$ | 31,429,775 | $ | 16,314,573 | $ | 35,096,199 | $ | 27,836,676 | $ | 48,331,501 | ||||||||||
| Proceeds from sales |
$ | 18,719,983 | $ | 12,731,606 | $ | 38,198,884 | $ | 26,559,067 | $ | 27,611,311 | ||||||||||
| Strategic Value | High Income Bond | Capital Growth | Nasdaq-100® Index | Bristol | ||||||||||||||||
| Cost of purchases |
$ | 30,653,145 | $ | 36,428,964 | $ | 12,384,983 | $ | 14,987,575 | $ | 288,307,669 | ||||||||||
| Proceeds from sales |
$ | 26,202,287 | $ | 38,071,953 | $ | 17,380,054 | $ | 11,815,555 | $ | 301,791,938 | ||||||||||
| 144 | (continued) |
| Ohio National Fund, Inc. |
| Notes to Financial Statements (Continued) |
June 30, 2015 (Unaudited) |
| Bryton Growth | Balanced | Target VIP | Bristol Growth | Risk Managed Balanced |
||||||||||||||||
| Cost of purchases |
$ | 145,180,272 | $ | 363,416,688 | $ | 36,501,013 | $ | 118,049,139 | $ | 35,969,182 | ||||||||||
| Proceeds from sales |
$ | 164,703,496 | $ | 348,044,202 | $ | 39,328,839 | $ | 124,229,615 | $ | 6,291,612 | ||||||||||
Cost of purchases and proceeds from sales of government securities for the six-month period ended June 30, 2015 were as follows:
| Bond | Omni | Balanced | Risk Managed Balanced |
|||||||||||||
| Cost of purchases |
$ | 20,346,882 | $ | 2,841,695 | $ | 41,831,298 | $ | 17,692,850 | ||||||||
| Proceeds from sales |
$ | 20,266,298 | $ | 1,984,746 | $ | 20,777,618 | $ | 9,652,079 | ||||||||
| (6) | Financial Instruments |
The Fund’s Portfolios, other than the Money Market Portfolio, may trade in financial instruments with off-balance sheet risk for hedging purposes or, otherwise, in accordance with stated investing objectives. These financial instruments may include options, futures, and foreign currency contracts that may involve, to a varying degree, elements of risk in excess of the amounts recognized on financial statements.
Options
A Portfolio may buy and write (i.e., sell) call and put options. In writing call options, the Portfolio gives the purchaser of the call option the right to purchase the underlying securities from the Portfolio at a specified “exercise” price at any time prior to the expiration of the option, normally within nine months. A Portfolio writes a covered call option when it owns the underlying securities and an uncovered call option when it does not. In purchasing put options, a Portfolio pays the seller of the put option a premium for the right of the Portfolio to sell the underlying securities to the seller at a specified exercise price prior to the expiration of the option. When a Portfolio sells a put option, it has the obligation to buy, and the purchaser of the put the right to sell, the underlying security at the exercise price during the option period. Whenever a Portfolio has a written covered call option outstanding, the underlying securities will be segregated by the Custodian and held in an escrow account to assure that such securities will be delivered to the option holder if the option is exercised. While the underlying securities are subject to the option, the Portfolio remains the record owner of the securities, entitling it to receive dividends and to exercise any voting rights. Whenever a Portfolio has a written uncovered call option outstanding, it will segregate with the Custodian cash or liquid assets that, when added to the amounts deposited with the broker as margin, equal to the market value of the securities underlying the call option (but not less than the exercise price of the call option). To cover a written put option, the Portfolio writing the option deposits cash or liquid securities in a segregated account at the Custodian. In order to terminate its position as the writer or the purchaser of an option, the Portfolio may enter into a “closing” transaction, which is the purchase (if the Portfolio has written the option) or sale (if the Portfolio is the purchaser of the option) of an option on the same underlying securities and having the same exercise price and expiration date as the option previously written or purchased by the Portfolio.
When a Portfolio writes a put or call option, an amount equal to the premium received is included on the Statement of Assets and Liabilities as a liability. The amount of the liability is subsequently marked-to-market to reflect the current market value of the option. Such liability is subject to off balance sheet risks to the extent of any future increases in market value of the written options. If an option expires on its stipulated expiration date or if the Portfolio enters into a closing purchase transaction, a gain or loss is realized. If a written call option on an individual security is exercised, a gain or loss is realized for the sale of the underlying security, and the proceeds from the sale are increased by the premium originally received. If a written call option on a securities index is exercised, a gain or loss is realized as determined by the premium originally received, the exercise price and the market value of the index. If a written put option on an individual security is exercised, the cost of the security acquired is decreased by the premium originally received. When a Portfolio purchases a put or call option, an amount equal to the premium paid is included on the Portfolio’s Statement of Assets and Liabilities as an investment, and is subsequently marked-to-market to reflect the current market value of the option. If an option expires on the stipulated expiration date or if the Portfolio enters into a closing sale transaction, a gain or loss is realized. If a Portfolio exercises a call option on an individual security, the cost of the security acquired is increased by the premium paid for the call. If the Portfolio exercises a put option on an individual security, a gain or loss is realized from the sale of the underlying security, and the proceeds from such a sale are decreased by the premium originally paid. If the Portfolio exercises a put option on a security index, a gain or loss is realized as determined by the premium originally paid, the exercise price and the market value of the index.
| 145 | (continued) |
| Ohio National Fund, Inc. |
| Notes to Financial Statements (Continued) |
June 30, 2015 (Unaudited) |
The Balanced Portfolio wrote call options and purchased put options associated with the S&P 500 Index during the six-month period ended June 30, 2015 . These instruments were used by the Portfolio to provide a hedge against equity price risk. During a period in which the prices of the Portfolio’s common stocks may decline, these instruments are designed to increase in value, thus providing price accumulation gains that partially offset the price accumulation losses of the common stocks in the Portfolio.
The Balanced Portfolio’s written call options are collateralized by cash and/or securities held with the Portfolio’s prime broker and in segregated accounts at the Portfolio’s custodian. Such collateral holdings are restricted from use. The cash collateral or borrowings from the prime broker, if necessary, are included on the Statement of Assets and Liabilities. The securities pledged as collateral are noted as such on the Portfolio’s Schedules of Investments. Written and purchased options are non-income producing securities.
The number of option contracts written and the premiums received by the Balanced Portfolio for the six-month period ended June 30, 2015 as follows:
| Number of Contracts |
Premiums Received |
|||||||
| Options outstanding, beginning of period |
800 | $ | 1,432,788 | |||||
| Options written |
3,400 | 3,602,894 | ||||||
| Options exercised |
— | — | ||||||
| Options expired |
— | — | ||||||
| Options closed |
(3,850 | ) | (4,616,151 | ) | ||||
|
|
|
|
|
|||||
| Options outstanding, end of period |
350 | $ | 419,531 | |||||
|
|
|
|
|
|||||
Transactions involving purchased options by the Balanced Portfolio for the six-month period ended June 30, 2015 were: Cost of purchases: $11.1 million, Proceeds from sales: $2.9 million, Expirations: $4.9 million.
The Risk Managed Balanced Portfolio also purchased call and put options associated with the S&P 500 Index during the six-month period ended June 30, 2015. These instruments were used by the Portfolio to provide for the Portfolio’s stated risk management strategy. Transactions involving purchased options by the Risk Managed Balanced Portfolio for the six-month period ended June 30, 2105 were: Cost of purchases: $2.8 million, Proceeds from sales: $0.5 million.
Futures Contracts
A Portfolio may buy or sell two kinds of financial futures contracts: stock index futures contracts and interest rate futures contracts. Stock index futures contracts are contracts developed by and traded on national commodity exchanges whereby the buyer will, on a specified future date, pay or receive a final cash payment equal to the difference between the actual value of the stock index on the last day of the contract and the value of the stock index established by the contract multiplied by the specific dollar amount set by the exchange. Futures contracts may be based on broad-based stock indexes such as the S&P 500 Index or on narrow-based stock indexes. A particular index will be selected according to the Adviser’s investment strategy for the particular Portfolio. An interest rate futures contract is an agreement whereby one party agrees to sell and another party agrees to purchase a specified amount of a specified financial instrument (debt security) at a specified price at a specified date, time and place. Although interest rate futures contracts typically require actual future delivery of and payment for financial instruments, the contracts are usually closed out before the delivery date. A public market exists in interest rate futures contracts covering primarily the following financial instruments: U.S. Treasury bonds; U.S. Treasury notes; Government National Mortgage Association (GNMA) modified pass-through mortgage-backed securities; three-month U.S. Treasury bills; 90-day commercial paper; bank certificates of deposit; and Eurodollar certificates of deposit. U.S. futures contracts are traded on exchanges which have been designated “contract markets” by the Commodities Futures Trading Commission (“CFTC”) and must be executed through a futures commission merchant (“FCM”), or brokerage firm, which is a member of the relevant contract market. It is expected that futures contracts trading in additional financial instruments will be authorized.
The Fund, on behalf of each Portfolio, has filed with the National Futures Association, a notice claiming an exclusion from the definition of the term “commodity pool operator” under the Commodity Exchange Act, as amended, and the rules of the CFTC promulgated thereunder, with respect to each Portfolio’s operation. Accordingly, the Portfolios are not subject to registration or regulation as a commodity pool operator.
| 146 | (continued) |
| Ohio National Fund, Inc. |
| Notes to Financial Statements (Continued) |
June 30, 2015 (Unaudited) |
The buyer or seller of a futures contract is not required to deliver or pay for the underlying instrument unless the contract is held until the delivery date. However, both the buyer and seller are required to deposit “initial margin” for the benefit of the broker when the contract is entered into. Initial margin deposits are equal to a percentage of the contract’s value, as set by the exchange on which the contract is traded, and are similar to good faith deposits or performance bonds.
Unlike margin extended by a securities broker, initial margin payments do not constitute purchasing securities on margin for purposes of a Portfolio’s investment limitations. A Portfolio, its futures commission merchant and the Custodian retain control of the initial margin until the contract is liquidated. If the value of either party’s position declines, that party will be required to make additional “variation margin” payments to settle the change in value on a daily basis. The party that has a gain may be entitled to receive all or a portion of this amount. In the event of the bankruptcy of the FCM that holds margin on behalf of a Portfolio, the Portfolio may be entitled to return of margin owed to the Portfolio only in proportion to the amount received by the FCM’s other customers. ONI and the Sub-Advisers will attempt to minimize this risk by carefully monitoring the creditworthiness of the FCMs with which the Portfolios do business. In addition to the margin restrictions discussed above, transactions in futures contracts and options on futures contracts may involve the segregation of funds pursuant to requirements imposed by the SEC. Under those requirements, where a Portfolio has a long position in a futures contract or sells a put option, it will be required to establish a segregated account (not with an FCM or broker) containing cash or certain liquid assets equal to the purchase price of the contract or the exercise price of the option (less any margin on deposit). For a short position in futures contacts held by a Portfolio or call options sold by a Portfolio, those requirements mandate the establishment of a segregated account (not with a futures commission merchant or broker) containing cash or certain liquid assets that, when added to the amounts deposited as margin, equal the market value of the instruments underlying the futures contracts or call options. However, segregation of assets is not required if a Portfolio “covers” its position.
At June 30, 2015, there were outstanding futures contracts in the International Portfolio. Details of these contracts are as follows:
| Type |
Description |
Expiration |
Number of Contracts |
Contract at |
Initial Contract Amount |
Unrealized Appreciation (Depreciation) |
Variation Margin Receivable (Payable) |
|||||||||||||||
| Long |
JPX Nikkei Index 400 Future | September 10, 2015 | 211 | $ 2,536,965 | $ | 2,602,430 | $ | (65,465 | ) | $ | 13,718 | |||||||||||
| Long |
DAX Index Future | September 18, 2015 | 17 | 5,212,632 | 5,354,349 | (141,717 | ) | (44,905 | ) | |||||||||||||
| Long |
Hang Seng China Enterprises (HSCE) Index Future | July 30, 2015 | 112 | 9,337,487 | 9,821,230 | (483,743 | ) | 196,411 | ||||||||||||||
| Long |
OMX Stockholm 30 Index Future | July 17, 2015 | 100 | 1,859,804 | 1,891,228 | (31,424 | ) | (21,019 | ) | |||||||||||||
|
|
|
|
|
|
|
|
||||||||||||||||
| $18,946,890 | $ | 19,669,239 | $ | (722,349 | ) | $ | 144,205 | |||||||||||||||
|
|
|
|
|
|
|
|
||||||||||||||||
A portion of the International Portfolio’s securities and cash holdings, as noted on the Portfolio’s Schedule of Investments, were pledged at June 30, 2015 as collateral for these contracts.
These futures contracts were executed for the purpose of increasing exposure to an attractive equities market, beyond that evidenced by the Portfolio’s investment in common stocks, while maintaining a significant cash balance that could be used for potentially higher-than-average shareholder transactions. There were other index futures contracts that were executed and closed in the International Portfolio during the six-month period ended June 30, 2015. Those contracts were executed for similar purposes as the contracts outstanding at June 30, 2015. For the six-month period ended June 30, 2015, the notional values of futures contracts opened and closed prior to contract settlement date by the International Portfolio were $67.8 million and $56.2 million, respectively.
| 147 | (continued) |
| Ohio National Fund, Inc. |
| Notes to Financial Statements (Continued) |
June 30, 2015 (Unaudited) |
At June 30, 2015, there were also outstanding futures contracts in the Risk Managed Balanced Portfolio. Details of these contracts are as follows:
| Type |
Description |
Expiration |
Number of Contracts |
Contract at |
Initial Contract Amount |
Unrealized Appreciation (Depreciation) |
Variation Margin Receivable (Payable) |
|||||||||||||||
| Long |
S&P 500 E-mini Future | September 18, 2015 | 113 | $11,607,360 | $ | 11,783,380 | $ | (176,020 | ) | $ | — | |||||||||||
| Long |
10-Year U.S. Treasury Note Future | September 21, 2015 | 313 | $39,491,797 | $ | 39,738,083 | $ | (246,286 | ) | $ | — | |||||||||||
|
|
|
|
|
|
|
|
||||||||||||||||
| $51,099,157 | $ | 51,521,463 | $ | (422,306 | ) | $ | — | |||||||||||||||
|
|
|
|
|
|
|
|
||||||||||||||||
A portion of Risk Managed Balanced Portfolio’s securities and cash holdings, as noted on the Portfolio’s Schedule of Investments, was pledged at June 30, 2015 as collateral for these contracts. These futures contracts were used by the Portfolio to provide for the Portfolio’s stated risk management strategy. There were other index futures contracts that were executed and closed in the Risk Managed Balanced Portfolio during the six-month period ended June 30, 2015. Those contracts were executed for similar purposes as the contracts outstanding at June 30, 2015. For the six-month period ended June 30, 2015, the notional values of futures contracts opened and closed prior to contract settlement date by the Risk Managed Balanced Portfolio were $104.9 million and $76.1 million, respectively.
Foreign Currency Contracts
In order to hedge against changes in the exchange rates of foreign currencies in relation to the U.S. dollar, each Portfolio, other than the Money Market Portfolio, may engage in forward foreign currency contracts, foreign currency options and foreign currency futures contracts in connection with the purchase, sale or ownership of a specific security. The International Portfolio, International Small-Mid Company Portfolio, Strategic Value Portfolio and High Income Bond Portfolio may engage in non-hedging related transactions to implement their investment strategies.
The Portfolios generally conduct their foreign currency exchange transactions on a spot (i.e., cash) basis at the spot rate prevailing in the foreign exchange currency market. When a Portfolio purchases or sells a security denominated in or exposed to a foreign currency, it may enter into a forward foreign currency contract (“forward contract”) for the purchase or sale, for a fixed amount of dollars, of the amount of currency involved in the underlying security transaction. A forward contract involves an obligation to purchase or sell a specific currency at a future date, which may be any fixed number of days from the date of the contract agreed upon by the parties, at a price set at the time of the contract. In this manner, a Portfolio may obtain protection against a possible loss resulting from an adverse change in the relationship between the U.S. dollar and the foreign currency during the period between the date the security is purchased or sold and the date upon which payment is made or received. Although such contracts tend to minimize the risk of loss due to the decline in the value of the hedged currency, at the same time they tend to limit any potential gain which might result should the value of such currency increase.
Forward contracts are traded in the interbank market conducted directly between currency traders (usually large commercial banks) and their customers. Generally a forward contract has no deposit requirement, and no commissions are charged. Although foreign exchange dealers do not charge a fee for conversion, they do realize a profit based on the difference between the prices at which they buy and sell various currencies. When the Portfolio manager believes that the currency of a particular foreign country may suffer a substantial decline against the U.S. dollar, a Portfolio may enter into a forward contract to sell, for a fixed amount of dollars, the amount of foreign currency approximating the value of some or all of that Portfolio’s securities denominated in or exposed to such foreign currency. No Portfolio will enter into such forward contracts or maintain a net exposure to such contracts where the consummation of the contracts would obligate the Portfolio to deliver an amount of foreign currency in excess of the value of its assets denominated in or exposed to that currency. At the consummation of a forward contract for delivery by a Portfolio of a foreign currency, the Portfolio may either make delivery of the foreign currency or terminate its contractual obligation to deliver the foreign currency by purchasing an offsetting contract obligating it to purchase, at the same maturity date, the same amount of the foreign currency. If the Portfolio chooses to make delivery of the foreign currency, it may be required to obtain such currency through the sale of its securities denominated in such currency or through conversion of other Portfolio assets into such currency. It is impossible to forecast the market value of Portfolio securities at the expiration of the forward contract. Accordingly, it may be necessary for the Portfolio to purchase additional foreign currency on
| 148 | (continued) |
| Ohio National Fund, Inc. |
| Notes to Financial Statements (Continued) |
June 30, 2015 (Unaudited) |
the spot market (and bear the expense of such purchase) if the market value of the security is less than the amount of foreign currency the Portfolio is obligated to deliver, and if a decision is made to sell the security and make delivery of the foreign currency. Conversely, it may be necessary for the Portfolio to sell on the spot market some of the foreign currency received on the sale of its hedged security if the security’s market value exceeds the amount of foreign currency the Portfolio is obligated to deliver.
If the Portfolio retains the hedged security and engages in an offsetting transaction, it will incur a gain or loss to the extent that there has been movement in spot or forward contract prices. If a Portfolio engages in an offsetting transaction, it may subsequently enter into a new forward contract to sell the foreign currency. Should forward prices decline during the period between the Portfolio’s entering into a forward contract for the sale of a foreign currency and the date it enters into an offsetting contract for the purchase of the foreign currency, the Portfolio will realize a gain to the extent the price of the currency it has agreed to sell exceeds the price of the currency it has agreed to purchase. Should forward prices increase, the Portfolio will suffer a loss to the extent the price of the currency it has agreed to purchase exceeds the price of the currency it has agreed to sell.
Buyers and sellers of foreign currency options and futures contracts are subject to the same risks previously described with respect to options and futures generally. In addition, settlement of currency options and futures contracts with respect to most currencies must occur at a bank located in the issuing nation. The ability to establish and close out positions on such options is subject to the maintenance of a liquid market that may not always be available. Currency rates may fluctuate based on political considerations and governmental actions as opposed to purely economic factors.
Predicting the movements of foreign currency in relation to the U.S. dollar is difficult and requires different skills than those necessary to predict movements in the securities market. There is no assurance that the use of foreign currency hedging transactions can successfully protect a Portfolio against loss resulting from the movements of foreign currency in relation to the U.S. dollar. In addition, it must be remembered that these methods of protecting the value of a Portfolio’s securities against a decline in the value of a currency does not eliminate fluctuations in the underlying prices of the securities. It simply establishes a rate of exchange which can be achieved at some future point in time. Additionally, although such contracts tend to minimize the risk of loss due to the decline in the value of the hedged currency, at the same time they tend to limit any potential gain which might result should the value of such currency increase.
Foreign currency contracts were executed in the International and International Small-Mid Company Portfolios in order to mitigate the effect that exchange rate volatility had on the valuation of the Portfolios’ investments that were either significantly under-weighted or over-weighted in relation to the Portfolios’ respective benchmark indices. The International Portfolio was under-weighted in equity investments within Russia and Switzerland and, therefore, executed contracts to buy the Russian Ruble and Swiss Franc in order to mitigate the effect that volatility in those exchange rates (in relation to the U.S. dollar) might otherwise have on relative performance. Likewise, the International Portfolio was over-weighted in equity investments within Japan and member states of the European Union and, therefore, executed contracts to sell the Japanese Yen and the Euro in order to mitigate the effect that volatility in those exchange rates might otherwise have on relative performance. The International Small-Mid Company Portfolio was also over-weighted in equity investments within the member states of the European Union and, therefore, executed contracts to sell the Euro in order to mitigate the effect that volatility in that exchange rate might otherwise have on relative performance.
The Portfolios entered into other foreign currency contracts during the period for similar benchmark performance hedging purposes. The Portfolios also entered into contracts that were the inverse of previously executed contracts to effectively exit prior contracts earlier than stated contract delivery dates, as investment over-weights or under-weights were reduced, or as previously executed contracts resulted in an attractive return to the Portfolios. For the six-month period ended June 30, 2015, the notional value of foreign currency contracts executed by the International Portfolio were approximately $113.5 million for currencies bought and approximately $117.5 million for currencies sold. For the six-month period ended June 30, 2015, the notional value of foreign currency contracts executed by the International Small-Mid Company Portfolio were approximately $9.4 million for currencies bought and approximately $10.0 million for currencies sold.
| 149 | (continued) |
| Ohio National Fund, Inc. |
| Notes to Financial Statements (Continued) |
June 30, 2015 (Unaudited) |
The values and financial statement effects of derivative instruments that were not accounted for as hedging instruments as of, and for the six-month period ended June 30, 2015, were as follows:
| Portfolio |
Instrument |
Primary Risk Type |
Value- Asset Derivatives |
Value- Liability Derivatives |
Location on Statements of Assets and Liabilities |
|||||||||||
| International |
Contracts to buy foreign currencies |
Currency exchange rate |
$ | 11,143,716 | $ | (10,989,204 | ) | (1 | ) | |||||||
|
|
|
|
|
|||||||||||||
| Contracts to sell foreign currencies |
Currency exchange rate |
$ | 55,049,300 | $ | (55,475,617 | ) | (1 | ) | ||||||||
|
|
|
|
|
|||||||||||||
| Futures contracts |
Equity price |
$ | 18,946,890 | $ | (19,669,239 | ) | (2 | ) | ||||||||
|
|
|
|
|
|||||||||||||
| International Small-Mid Company |
Contracts to sell foreign currencies |
Currency exchange rate |
$ | 8,217,845 | $ | (8,553,673 | ) | (1 | ) | |||||||
|
|
|
|
|
|||||||||||||
| Balanced |
Purchased options |
Equity price |
$ | 5,805,000 | $ | — | (3 | ) | ||||||||
|
|
|
|
|
|||||||||||||
| Written options |
Equity price |
$ | — | $ | (115,150 | ) | (4 | ) | ||||||||
|
|
|
|
|
|||||||||||||
| Risk Managed Balanced |
Purchased options |
Equity price |
$ | 4,197,317 | $ | — | (3 | ) | ||||||||
|
|
|
|
|
|||||||||||||
| Futures contracts |
Equity price |
$ | 51,099,157 | $ | (51,521,463 | ) | (2 | ) | ||||||||
|
|
|
|
|
|||||||||||||
| (1) | Net unrealized appreciation(depreciation) on foreign currency contacts |
| (2) | Net unrealized appreciation(depreciation) on futures contracts |
| (3) | Investments in securities, at value |
| (4) | Options written, at value |
| Portfolio |
Instrument |
Risk Type |
Realized Gain (Loss) on Derivatives Recognized in Income |
Change in Unrealized Appreciation/ Depreciation on Derivatives Recognized in Income |
Location on Statements of Operations |
|||||||||||
| International |
Foreign currency contracts |
Currency exchange rate |
$ | 3,738,359 | $ | (1,496,303 | ) | (1 | ), (2) | |||||||
|
|
|
|
|
|||||||||||||
| Futures contracts |
Equity price |
$ | 809,872 | $ | (677,047 | ) | (3 | ), (4) | ||||||||
|
|
|
|
|
|||||||||||||
| International Small-Mid Company |
Foreign currency contracts |
Currency exchange rate |
$ | 584,647 | $ | (335,973 | ) | (1 | ), (2) | |||||||
|
|
|
|
|
|||||||||||||
| Balanced |
Purchased options |
Equity price |
$ | (6,019,568 | ) | $ | 1,278,138 | (5 | ), (6) | |||||||
|
|
|
|
|
|||||||||||||
| Written options |
Equity price |
$ | 2,781,568 | $ | (104,907 | ) | (7 | ), (8) | ||||||||
|
|
|
|
|
|||||||||||||
| Risk Managed Balanced |
Futures contracts |
Equity price |
$ | 463,685 | $ | (422,306 | ) | (3 | ), (4) | |||||||
|
|
|
|
|
|||||||||||||
| Purchased options |
Equity price |
$ | (13,466 | ) | $ | (630,778 | ) | (5 | ), (6) | |||||||
|
|
|
|
|
|||||||||||||
| (1) | Net realized gain (loss) on foreign currency contracts |
| (2) | Change in unrealized appreciation/depreciation on foreign currency contracts |
| (3) | Net realized gain (loss) on futures contracts |
| (4) | Change in unrealized appreciation/depreciation on futures contracts |
| (5) | Net realized gain (loss) on investments |
| (6) | Change in unrealized appreciation/depreciation on investments |
| (7) | Net realized gain (loss) on written options |
| (8) | Change in unrealized appreciation/depreciation on written options |
| 150 | (continued) |
| Ohio National Fund, Inc. |
| Notes to Financial Statements (Continued) |
June 30, 2015 (Unaudited) |
The Portfolios may enter into International Swaps and Derivatives Association, Inc. Master Agreements (“ISDA Master Agreement”) or similar agreements with their derivative contract counterparties whereby the Portfolios may, under certain circumstances, offset with the counterparty certain derivative financial instruments’ payables and/or receivables and create one single net payment. Under certain of the ISDA Master Agreements in place at June 30, 2015, the Portfolios are subject to master netting agreements (“MNA”) that allows for amounts owed between each Portfolio and the counterparty to their transactions to be netted. The party that has the larger payable pays the excess of the larger amount over the smaller amount to the other party. The MNAs do not apply to amounts owed to or from different counterparties; further, certain of the MNAs limit offsetting for forward foreign currency contracts to amounts owed in the same currency and on the same exchange date.
For financial reporting purposes, the Portfolios offset derivative assets and liabilities that are subject to netting arrangements in the Statement of Assets and Liabilities. At June 30, 2015, there were no outstanding derivative transactions that were subject to netting arrangements.
| (7) | Federal Income Tax Information |
At December 31, 2014, the components of accumulated earnings (deficit) on a tax basis were as follows:
| Portfolio |
Undistributed Ordinary Income |
Undistributed Long-Term Capital Gains (Losses) |
Accumulated Earnings |
Accumulated Capital and Other Losses |
Unrealized Appreciation (Depreciation)(1) |
Total Accumulated Earnings (Deficit) |
||||||||||||||||||
| Equity |
$ | 386,033 | $ | — | $ | 386,033 | $ | (47,738,305 | ) | $ | 65,190,932 | $ | 17,838,660 | |||||||||||
| Money Market |
— | — | — | — | — | — | ||||||||||||||||||
| Bond |
5,057,141 | — | 5,057,141 | (10,057,664 | ) | 7,162,713 | 2,162,190 | |||||||||||||||||
| Omni |
3,414,759 | 2,836,013 | 6,250,772 | — | 2,823,802 | 9,074,574 | ||||||||||||||||||
| International |
5,661,713 | — | 5,661,713 | (66,063,445 | ) | 3,962,418 | (56,439,314 | ) | ||||||||||||||||
| Capital Appreciation |
37,465 | 21,377,238 | 21,414,703 | — | 35,400,675 | 56,815,378 | ||||||||||||||||||
| International Small-Mid Company |
196,497 | 663,392 | 859,889 | — | 11,558,632 | 12,418,521 | ||||||||||||||||||
| Aggressive Growth |
757,233 | 7,625,484 | 8,382,717 | — | 7,294,698 | 15,677,415 | ||||||||||||||||||
| Small Cap Growth |
6,796,985 | 8,271,301 | 15,068,286 | — | 21,896,731 | 36,965,017 | ||||||||||||||||||
| Mid Cap Opportunity |
— | — | — | (908,099 | ) | 16,288,164 | 15,380,065 | |||||||||||||||||
| S&P 500® Index |
2,502,607 | 2,916,947 | 5,419,554 | — | 138,497,918 | 143,917,472 | ||||||||||||||||||
| Strategic Value |
9,115,067 | 31,089,467 | 40,204,534 | — | 29,204,514 | 69,409,048 | ||||||||||||||||||
| High Income Bond |
16,913,403 | 8,062,933 | 24,976,336 | — | (2,178,021 | ) | 22,798,315 | |||||||||||||||||
| Capital Growth |
64,168 | 8,492,117 | 8,556,285 | — | 14,710,346 | 23,266,631 | ||||||||||||||||||
| Nasdaq-100® Index |
642,404 | 3,719,174 | 4,361,578 | — | 47,607,499 | 51,969,077 | ||||||||||||||||||
| Bristol |
25,104,654 | 19,779,477 | 44,884,131 | — | 20,229,886 | 65,114,017 | ||||||||||||||||||
| Bryton Growth |
13,803,912 | 7,047,022 | 20,850,934 | — | 10,267,816 | 31,118,750 | ||||||||||||||||||
| Balanced |
7,409,393 | 7,100,698 | 14,510,091 | — | 27,725,797 | 42,235,888 | ||||||||||||||||||
| Target VIP |
100,128 | — | 100,128 | (6,201,457 | ) | 4,507,863 | (1,593,466 | ) | ||||||||||||||||
| Bristol Growth |
9,673,590 | 10,640,279 | 20,313,869 | — | 12,665,570 | 32,979,439 | ||||||||||||||||||
| Risk Managed Balanced |
1,039,871 | 527,944 | 1,567,815 | — | 620,549 | 2,188,364 | ||||||||||||||||||
| (1) | The differences between book-basis and tax-basis unrealized appreciation/(depreciation) are attributed primarliy to tax deferral of losses on wash sales and the realization for tax purposes of unrealized gains/(losses) on certain instruments. |
| 151 | (continued) |
| Ohio National Fund, Inc. |
| Notes to Financial Statements (Continued) |
June 30, 2015 (Unaudited) |
For Federal income tax purposes, the following Portfolios had capital loss carryforwards as of December 31, 2014 that are available to offset future realized gains, if any:
| Total Loss Carryforward |
Expiration | |||||||||||||||||||||||
| Portfolio |
2016 | 2017 | 2018 | No Expiration Short Term |
No Expiration Long Term |
|||||||||||||||||||
| Equity |
$ | 47,738,305 | $ | — | $ | 44,720,565 | $ | 3,017,740 | $ | — | $ | — | ||||||||||||
| Bond |
10,057,664 | 534,910 | 9,522,754 | — | — | — | ||||||||||||||||||
| International |
66,063,445 | 271,315 | 65,792,130 | — | — | — | ||||||||||||||||||
| Mid Cap Opportunity |
908,099 | — | 908,099 | — | — | — | ||||||||||||||||||
| Target VIP |
6,201,457 | 6,201,457 | — | — | — | — | ||||||||||||||||||
The tax characteristics of distributions paid to shareholders for the year ended December 31, 2014 were as follows:
| Portfolio |
Ordinary Income |
Net Long-Term Capital Gains |
Total Distribution Paid |
|||||||||
| Equity |
$ | 1,660,324 | $ |
— |
|
$ | 1,660,324 | |||||
| Omni |
341,371 | |
— |
|
341,371 | |||||||
| Capital Appreciation |
1,165,844 | |
— |
|
1,165,844 | |||||||
| S&P 500® Index |
4,671,250 | — | 4,671,250 | |||||||||
| Strategic Value |
17,815,244 | |
— |
|
17,815,244 | |||||||
| Nasdaq-100® Index |
1,151,494 | |
— |
|
1,151,494 | |||||||
| Bristol |
895,082 | |
— |
|
895,082 | |||||||
| Balanced |
6,075,617 | — | 6,075,617 | |||||||||
| Target VIP |
854,149 | |
— |
|
854,149 | |||||||
| Bristol Growth |
370,603 | |
— |
|
370,603 | |||||||
There were no distributions paid to shareholders during the six-month period ended June 30, 2015.
| 152 | (continued) |
Ohio National Fund, Inc.
| Notes to Financial Statements (Continued) |
June 30, 2015 (Unaudited) |
During the year ended December 31, 2014, the Fund recorded classifications within the composition of net assets for permanent book/tax differences. These classifications were as follows:
| Equity | Money Market |
Bond | Omni | International | Capital Appreciation |
International Small-Mid Company |
Aggressive Growth |
Small Cap Growth |
Mid Cap Opportunity |
|||||||||||||||||||||||||||||||
| Consent distributions |
||||||||||||||||||||||||||||||||||||||||
| Paid in capital in excess of par value |
$ | 195,315 | $ | — | $ | 5,136,321 | $ | 1,439,909 | $ | 4,327,327 | $ | 2,511,660 | $ | 196,447 | $ | 4,354,957 | $ | 14,770,686 | $ | — | ||||||||||||||||||||
| Undistributed net investment income |
(195,315 | ) | — | (5,136,321 | ) | (47,856 | ) | (4,327,327 | ) | (38,483 | ) | (196,447 | ) | — | — | — | ||||||||||||||||||||||||
| Accumulated net realized gain (loss) on investments |
— | — | — | (1,392,053 | ) | — | (2,473,177 | ) | — | (4,354,957 | ) | (14,770,686 | ) | — | ||||||||||||||||||||||||||
| Undistributed net investment losses |
||||||||||||||||||||||||||||||||||||||||
| Paid in capital in excess of par value |
— | — | — | — | — | — | — | — | — | (151,406 | ) | |||||||||||||||||||||||||||||
| Undistributed net investment income |
— | — | — | — | — | — | — | 88,136 | 408,849 | 151,200 | ||||||||||||||||||||||||||||||
| Accumulated net realized gain (loss) on investments |
— | — | — | — | — | — | — | (88,136 | ) | (408,849 | ) | 206 | ||||||||||||||||||||||||||||
| Foreign currency related reclassifications |
||||||||||||||||||||||||||||||||||||||||
| Undistributed net investment income |
— | — | — | — | 2,945,364 | (10,132 | ) | (80,682 | ) | (149 | ) | (1,029 | ) | 21 | ||||||||||||||||||||||||||
| Accumulated net realized gain (loss) on investments |
— | — | — | — | (2,945,364 | ) | 10,132 | 80,682 | 149 | 1,029 | (21 | ) | ||||||||||||||||||||||||||||
| Reclassifications for partnership sales/basis |
||||||||||||||||||||||||||||||||||||||||
| Undistributed net investment income |
— | — | — | — | — | — | — | — | (32,200 | ) | — | |||||||||||||||||||||||||||||
| Accumulated net realized gain (loss) on investments |
— | — | — | — | — | — | — | — | 32,200 | — | ||||||||||||||||||||||||||||||
| Other permanent differences |
||||||||||||||||||||||||||||||||||||||||
| Paid in capital in excess of par value |
— | — | — | — | — | — | — | — | (52 | ) | — | |||||||||||||||||||||||||||||
| Undistributed net investment income |
— | — | — | — | — | — | — | — | 51 | — | ||||||||||||||||||||||||||||||
| Accumulated net realized gain (loss) on investments |
— | — | — | — | — | — | — | — | 1 | — | ||||||||||||||||||||||||||||||
| 153 | (continued) |
Ohio National Fund, Inc.
| Notes to Financial Statements (Continued) |
June 30, 2015 (Unaudited) |
| S&P 500® Index |
Strategic Value |
High Income Bond |
Capital Growth |
Nasdaq-100®
Index |
Bristol | Bryton Growth |
Balanced | Target VIP |
Bristol Growth |
Risk Managed Balanced |
||||||||||||||||||||||||||||||||||
| Consent distributions |
||||||||||||||||||||||||||||||||||||||||||||
| Paid in capital in excess of par value |
$ | 3,436,824 | $ | 5,416,348 | $ | 23,033,792 | $ | 5,342,907 | $ | 5,443,659 | $ | 49,458,063 | $ | 38,069,479 | $ | 5,188,610 | $ | 67,221 | $ | 23,554,720 | $ | — | ||||||||||||||||||||||
| Undistributed net investment income |
(584,268 | ) | (1,480,210 | ) | (19,555,535 | ) | — | (93,015 | ) | (89,796 | ) | — | (320,182 | ) | (25,680 | ) | (21,733 | ) | — | |||||||||||||||||||||||||
| Accumulated net realized gain (loss) on investments |
(2,852,556 | ) | (3,936,138 | ) | (3,478,257 | ) | (5,342,907 | ) | (5,350,644 | ) | (49,368,267 | ) | (38,069,479 | ) | (4,868,428 | ) | (41,541 | ) | (23,532,987 | ) | — | |||||||||||||||||||||||
| Undistributed net investment losses |
||||||||||||||||||||||||||||||||||||||||||||
| Paid in capital in excess of par value |
— | — | — | 51,425 | — | — | — | — | — | — | — | |||||||||||||||||||||||||||||||||
| Undistributed net investment income |
— | — | — | 286,348 | — | — | 818,246 | — | — | — | — | |||||||||||||||||||||||||||||||||
| Accumulated net realized gain (loss) on investments |
— | — | — | (337,773 | ) | — | — | (818,246 | ) | — | — | — | — | |||||||||||||||||||||||||||||||
| Foreign currency related reclassifications |
||||||||||||||||||||||||||||||||||||||||||||
| Paid in capital in excess of par value |
— | — | — | — | — | — | — | — | — | — | — | |||||||||||||||||||||||||||||||||
| Undistributed net investment income |
— | (169,864 | ) | — | — | — | — | — | (655 | ) | — | — | (48 | ) | ||||||||||||||||||||||||||||||
| Accumulated net realized gain (loss) on investments |
— | 169,864 | — | — | — | — | — | 655 | — | — | 48 | |||||||||||||||||||||||||||||||||
| Real estate investment trust (REIT) reclassifications |
||||||||||||||||||||||||||||||||||||||||||||
| Undistributed net investment income |
(93,694 | ) | (229,774 | ) | — | (3,826 | ) | — | — | — | (97,927 | ) | — | — | 41 | |||||||||||||||||||||||||||||
| Accumulated net realized gain (loss) on investments |
93,694 | 229,774 | — | 3,826 | — | — | — | 97,927 | — | — | (41 | ) | ||||||||||||||||||||||||||||||||
| Passive Foreign Investment Company (PFIC) reclassifications |
||||||||||||||||||||||||||||||||||||||||||||
| Undistributed net investment income |
— | — | — | 22,081 | — | — | — | — | — | — | — | |||||||||||||||||||||||||||||||||
| Accumulated net realized gain (loss) on investments |
— | — | — | (22,081 | ) | — | — | — | — | — | — | — | ||||||||||||||||||||||||||||||||
| Reclassifications for partnership sales/basis |
||||||||||||||||||||||||||||||||||||||||||||
| Undistributed net investment income |
— | — | — | 50,144 | — | — | — | 35,123 | — | — | — | |||||||||||||||||||||||||||||||||
| Accumulated net realized gain (loss) on investments |
— | — | — | (50,144 | ) | — | — | — | (35,123 | ) | — | — | — | |||||||||||||||||||||||||||||||
| Other permanent differences |
||||||||||||||||||||||||||||||||||||||||||||
| Paid in capital in excess of par value |
— | — | — | — | — | — | — | (14 | ) | — | — | — | ||||||||||||||||||||||||||||||||
| Undistributed net investment income |
(47 | ) | — | — | — | — | — | — | (1 | ) | — | — | — | |||||||||||||||||||||||||||||||
| Accumulated net realized gain (loss) on investments |
47 | — | — | — | — | — | — | 15 | — | — | — | |||||||||||||||||||||||||||||||||
| 154 | (continued) |
| Ohio National Fund, Inc. |
| Notes to Financial Statements (Continued) |
June 30, 2015 (Unaudited) |
The cost basis for Federal income tax purposes may differ from the cost basis for financial reporting purposes. The table below details the unrealized appreciation (depreciation) and aggregate cost of securities at June 30, 2015 for Federal income tax purposes.
| Equity | Bond | Omni | International | Capital Appreciation |
International Small-Mid Company |
|||||||||||||||||||
| Gross unrealized: |
||||||||||||||||||||||||
| Appreciation |
$ | 68,949,096 | $ | 4,908,054 | $ | 2,576,398 | $ | 20,880,293 | $ | 45,606,754 | $ | 20,115,112 | ||||||||||||
| Depreciation |
(27,709,594 | ) | (2,739,544 | ) | (1,196,077 | ) | (5,388,788 | ) | (19,663,298 | ) | (2,552,789 | ) | ||||||||||||
|
|
|
|
|
|
|
|
|
|
|
|
|
|||||||||||||
| Net unrealized appreciation (depreciation) |
$ | 41,239,502 | $ | 2,168,510 | $ | 1,380,321 | $ | 15,491,505 | $ | 25,943,456 | $ | 17,562,323 | ||||||||||||
|
|
|
|
|
|
|
|
|
|
|
|
|
|||||||||||||
| Aggregate cost of securities: |
$ | 478,887,711 | $ | 154,629,352 | $ | 49,119,502 | $ | 158,489,195 | $ | 421,886,931 | $ | 69,831,576 | ||||||||||||
|
|
|
|
|
|
|
|
|
|
|
|
|
|||||||||||||
| Aggressive Growth |
Small Cap Growth |
Mid Cap Opportunity |
S&P 500® Index |
Strategic Value |
High Income Bond |
|||||||||||||||||||
| Gross unrealized: |
||||||||||||||||||||||||
| Appreciation |
$ | 7,487,835 | $ | 40,959,783 | $ | 16,071,373 | $ | 143,362,723 | $ | 31,581,670 | $ | 3,828,744 | ||||||||||||
| Depreciation |
(527,025 | ) | (9,678,090 | ) | (2,420,918 | ) | (8,441,572 | ) | (15,180,129 | ) | (6,295,554 | ) | ||||||||||||
|
|
|
|
|
|
|
|
|
|
|
|
|
|||||||||||||
| Net unrealized appreciation (depreciation) |
$ | 6,960,810 | $ | 31,281,693 | $ | 13,650,455 | $ | 134,921,151 | $ | 16,401,541 | $ | (2,466,810 | ) | |||||||||||
|
|
|
|
|
|
|
|
|
|
|
|
|
|||||||||||||
| Aggregate cost of securities: |
$ | 39,550,964 | $ | 195,503,380 | $ | 75,964,396 | $ | 273,319,996 | $ | 311,865,327 | $ | 225,324,698 | ||||||||||||
|
|
|
|
|
|
|
|
|
|
|
|
|
|||||||||||||
| Capital Growth | Nasdaq-100® Index |
Bristol | Bryton Growth | Balanced | Target VIP | |||||||||||||||||||
| Gross unrealized: |
||||||||||||||||||||||||
| Appreciation |
$ | 21,070,960 | $ | 51,778,883 | $ | 16,140,252 | $ | 20,115,317 | $ | 54,050,331 | $ | 6,003,751 | ||||||||||||
| Depreciation |
(3,032,238 | ) | (1,619,461 | ) | (6,120,613 | ) | (9,972,118 | ) | (20,501,172 | ) | (3,498,765 | ) | ||||||||||||
|
|
|
|
|
|
|
|
|
|
|
|
|
|||||||||||||
| Net unrealized appreciation (depreciation) |
$ | 18,038,722 | $ | 50,159,422 | $ | 10,019,639 | $ | 10,143,199 | $ | 33,549,159 | $ | 2,504,986 | ||||||||||||
|
|
|
|
|
|
|
|
|
|
|
|
|
|||||||||||||
| Aggregate cost of securities: |
$ | 57,853,667 | $ | 79,349,205 | $ | 221,385,251 | $ | 172,068,761 | $ | 855,676,987 | $ | 50,121,597 | ||||||||||||
|
|
|
|
|
|
|
|
|
|
|
|
|
|||||||||||||
| Bristol Growth | Risk Managed Balanced |
|||||||||||||||||||||||
| Gross unrealized: |
||||||||||||||||||||||||
| Appreciation |
$ | 11,599,320 | $ | 1,553,867 | ||||||||||||||||||||
| Depreciation |
(2,843,143 | ) | (2,452,694 | ) | ||||||||||||||||||||
|
|
|
|
|
|||||||||||||||||||||
| Net unrealized appreciation (depreciation) |
$ | 8,756,177 | $ | (898,827 | ) | |||||||||||||||||||
|
|
|
|
|
|||||||||||||||||||||
| Aggregate cost of securities: |
$ | 114,900,295 | $ | 76,777,468 | ||||||||||||||||||||
|
|
|
|
|
|||||||||||||||||||||
| (8) | Legal Matters |
Effective December 20, 2013, the assets and liabilities of the Target Equity/Income Portfolio were acquired and assumed by the Target VIP Portfolio in exchange for shares of the Target VIP Portfolio (“the reorganization”).
In December 2007, prior to the reorganization, the Target Equity/Income Portfolio, as a shareholder of Lyondell Chemical Company (“Lyondell”), participated in a cash out merger of Lyondell in which it received $48 per share of consideration (the “Merger”). Lyondell later filed for bankruptcy and two entities created by the Lyondell bankruptcy plan of reorganization have initiated lawsuits seeking to recover, or clawback, proceeds received by shareholders in the December 2007 merger based on fraudulent transfer claims.
The first action, Edward S. Weisfelner, as Trustee of the LB Creditor Trust v. Morgan Stanley & Co., Inc., et. al., was initiated on October 22, 2010 (the “Creditor Trust Action”), in the Supreme Court of the State of New York in the County of New York but has
| 155 | (continued) |
| Ohio National Fund, Inc. |
| Notes to Financial Statements (Continued) |
June 30, 2015 (Unaudited) |
subsequently been removed to the U.S. Bankruptcy Court for the Southern District of New York. The second action, Edward S. Weisfelner, as Trustee of the LB Litigation Trust v. Holmes TTEE, et. al., was initiated on December 23, 2010 (the “Litigation Trust Action”), in the U.S. Bankruptcy Court for the Southern District of New York. Both actions attempt to recover the proceeds paid out to the holders of Lyondell shares at the time of the 2007 merger. The value of the proceeds to the fund totaled $1,772,400.
On January 4, 2012, the Fund was named in a second amended complaint in the Creditor Trust Action. On April 9, 2014, plaintiffs filed a third amended complaint. In response, on July 30, 2014, the defendant group, including the Fund, filed an omnibus motion to dismiss. The outcome of these proceedings on the Portfolio cannot be predicted.
As a result of the aforementioned reorganization involving the Target Equity/Income Portfolio, any future claims that may result from these complaints will be assumed by the Target VIP Portfolio as the Survivor Portfolio. Management of the Fund continues to assess the cases and has not yet determined the potential effect, if any, on the net asset value of the Target VIP Portfolio.
Also, in December 2007, the S&P 500® Index and Strategic Value Portfolios, shareholders of the Tribune Company, participated in a similar cash out merger in which shareholders received $34 per share of consideration. The value of the proceeds received by the S&P 500® Index and Strategic Value Portfolios, was $37,910 and $384,200, respectively. The company subsequently filed for bankruptcy and several legal complaints have been initiated by groups of Tribune Company creditors seeking to recover, or clawback, proceeds received by shareholders based on fraudulent transfer claims (the “Tribune Bankruptcy”).
The first action, Official Committee of Unsecured Creditors of Tribune Company v. FitzSimons, et. al. (“FitzSimons”) was initiated on November 1, 2010 in the U.S. Bankruptcy Court for the District of Delaware. As a result of these proceedings, the Court agreed to allow individual creditors to file similar complaints in U.S. state courts. The Fund is specifically named in a complaint in the U.S. District Court, Southern District of Ohio, Western Division, Deutsche Bank Trust Company Americas, et. al. v. American Electric Power, et. al., that was initiated in June of 2011. The Fund, along with the Strategic Value Portfolio, is also named in a similar complaint in the U.S. District Court, Eastern District of Pennsylvania, Deutsche Bank Trust Company Americas, et. al. v. Ametek Inc. Employees Master Retirement Trust, et. al. These Tribune litigation actions have been consolidated into a single Multidistrict Litigation (“MDL”) in the U.S. District Court, Southern District of New York. Pursuant to a Court order dated September 7, 2012, certain defendants in the MDL, including the Fund, filed a motion to dismiss on November 6, 2012. The Court granted the motion to dismiss on September 23, 2013. Pending an appeal, only the actual fraudulent transfer claims as alleged in FitzSimons remain. The outcome of these proceedings on the two Portfolios of the Fund cannot be predicted. Management of the Fund continues to assess litigation matters and any offers of settlement.
| 156 |
| Ohio National Fund, Inc. |
| June 30, 2015 (Unaudited) |
| (1) | Expense Disclosure |
An individual may not buy or own membership interests of the Fund directly. An individual acquires an indirect interest in the Fund by purchasing a variable annuity contract or variable insurance policy and allocating premiums or purchase payments to Fund Portfolios available through the separate accounts of ONLIC, ONLAC, and NSLA. Separate accounts of these entities are the shareholders of the Fund.
As a shareholder of the Fund, a separate account incurs ongoing costs, including management fees and other Fund expenses. This example is intended to help a policy/contract owner understand ongoing costs (in dollars) associated with the underlying investment in the Fund’s Portfolios by the separate account shareholder and to compare these costs with the ongoing costs associated with investing in other mutual funds.
The example is based on an investment of $1,000 invested at July 1, 2014 and held through December 31, 2014.
Actual Expenses
The table below provides information about investment values and actual expenses associated with each Portfolio of the Fund. The information below, together with the amount of an underlying investment, can be used to estimate expenses paid over the period. An estimate can be obtained by simply dividing an underlying investment value by $1,000 (for example, an $8,600 investment value divided by $1,000 = 8.6), then multiplying the result by the number in the table under the heading entitled “Expenses Paid During Period”.
| Portfolio |
Beginning Investment Value 1/1/2015 |
Ending Investment Value 6/30/2015 |
Expense Paid During Period* 1/1/2015 – 6/30/2015 |
Expense Ratio During Period 1/1/2015 – 6/30/2015 (Annualized) |
||||||||||||
| Equity |
$ | 1,000.00 | $ | 1,007.50 | $ | 3.98 | 0.80 | % | ||||||||
| Money Market |
1,000.00 | 1,000.00 | 0.25 | 0.05 | % | |||||||||||
| Bond |
1,000.00 | 994.20 | 3.12 | 0.63 | % | |||||||||||
| Omni |
1,000.00 | 1,045.50 | 3.85 | 0.76 | % | |||||||||||
| International |
1,000.00 | 1,057.40 | 5.05 | 0.99 | % | |||||||||||
| Capital Appreciation |
1,000.00 | 1,040.50 | 4.00 | 0.79 | % | |||||||||||
| International Small-Mid Company |
1,000.00 | 1,140.90 | 6.48 | 1.22 | % | |||||||||||
| Aggressive Growth |
1,000.00 | 1,073.00 | 4.73 | 0.92 | % | |||||||||||
| Small Cap Growth |
1,000.00 | 1,079.00 | 4.38 | 0.85 | % | |||||||||||
| Mid Cap Opportunity |
1,000.00 | 1,019.40 | 4.71 | 0.94 | % | |||||||||||
| S&P 500® Index |
1,000.00 | 1,010.00 | 2.04 | 0.41 | % | |||||||||||
| Strategic Value |
1,000.00 | 996.40 | 3.86 | 0.78 | % | |||||||||||
| High Income Bond |
1,000.00 | 1,023.30 | 4.01 | 0.80 | % | |||||||||||
| Capital Growth |
1,000.00 | 1,072.90 | 5.14 | 1.00 | % | |||||||||||
| Nasdaq-100® Index |
1,000.00 | 1,041.40 | 2.33 | 0.46 | % | |||||||||||
| Bristol |
1,000.00 | 1,066.00 | 4.10 | 0.80 | % | |||||||||||
| Bryton Growth |
1,000.00 | 1,107.50 | 4.55 | 0.87 | % | |||||||||||
| Balanced |
1,000.00 | 1,029.00 | 3.17 | 0.63 | % | |||||||||||
| Target VIP |
1,000.00 | 1,020.70 | 3.91 | 0.78 | % | |||||||||||
| Bristol Growth |
1,000.00 | 1,057.20 | 4.34 | 0.85 | % | |||||||||||
| Risk Managed Balanced |
1,000.00 | 993.50 | 6.03 | 1.22 | % | |||||||||||
| 157 | (continued) |
| Ohio National Fund, Inc. |
| Additional Information (Continued) |
June 30, 2015 (Unaudited) |
Hypothetical Example for Comparison Purposes
The table below provides information about hypothetical investment values and hypothetical expenses based on each respective Portfolio’s actual expense ratio and an assumed rate of return of 5% per year before expenses, which is not an actual return. The hypothetical investment values and expenses may not be used to estimate the actual ending investment balance or expenses actually paid for the period by the shareholders. A policy/contract holder may use this information to compare this 5% hypothetical example with the 5% hypothetical examples that appear in the shareholder reports of other funds.
| Portfolio |
Beginning Investment Value 1/1/2015 |
Ending Investment Value 6/30/2015 |
Expense Paid During Period* 1/1/2015 – 6/30/2015 |
Expense Ratio During Period 1/1/2015 – 6/30/2015 (Annualized) |
||||||||||||
| Equity |
$ | 1,000.00 | $ | 1,020.83 | $ | 4.01 | 0.80 | % | ||||||||
| Money Market |
1,000.00 | 1,024.55 | 0.25 | 0.05 | % | |||||||||||
| Bond |
1,000.00 | 1,021.67 | 3.16 | 0.63 | % | |||||||||||
| Omni |
1,000.00 | 1,021.03 | 3.81 | 0.76 | % | |||||||||||
| International |
1,000.00 | 1,019.89 | 4.96 | 0.99 | % | |||||||||||
| Capital Appreciation |
1,000.00 | 1,020.88 | 3.96 | 0.79 | % | |||||||||||
| International Small-Mid Company |
1,000.00 | 1,018.74 | 6.11 | 1.22 | % | |||||||||||
| Aggressive Growth |
1,000.00 | 1,020.23 | 4.61 | 0.92 | % | |||||||||||
| Small Cap Growth |
1,000.00 | 1,020.58 | 4.26 | 0.85 | % | |||||||||||
| Mid Cap Opportunity |
1,000.00 | 1,020.13 | 4.71 | 0.94 | % | |||||||||||
| S&P 500® Index |
1,000.00 | 1,022.76 | 2.06 | 0.41 | % | |||||||||||
| Strategic Value |
1,000.00 | 1,020.93 | 3.91 | 0.78 | % | |||||||||||
| High Income Bond |
1,000.00 | 1,020.83 | 4.01 | 0.80 | % | |||||||||||
| Capital Growth |
1,000.00 | 1,019.84 | 5.01 | 1.00 | % | |||||||||||
| Nasdaq-100® Index |
1,000.00 | 1,022.51 | 2.31 | 0.46 | % | |||||||||||
| Bristol |
1,000.00 | 1,020.83 | 4.01 | 0.80 | % | |||||||||||
| Bryton Growth |
1,000.00 | 1,020.48 | 4.36 | 0.87 | % | |||||||||||
| Balanced |
1,000.00 | 1,021.67 | 3.16 | 0.63 | % | |||||||||||
| Target VIP |
1,000.00 | 1,020.93 | 3.91 | 0.78 | % | |||||||||||
| Bristol Growth |
1,000.00 | 1,020.58 | 4.26 | 0.85 | % | |||||||||||
| Risk Managed Balanced |
1,000.00 | 1,018.74 | 6.11 | 1.22 | % | |||||||||||
| * | Expenses are equal to the average account value times the Fund’s annualized expense ratio multiplied by the number of days in the most recent fiscal half-year (181 days) divided by the number of days in the fiscal year (365 days). Please note that the expenses shown in these tables are meant to highlight ongoing Fund costs only and do not reflect any contract-level expenses or Fund transactional costs, such as sales charges (loads) or exchange fees (if any). Therefore, these tables are useful in comparing ongoing fund costs only, and will not fully assist a policy/contract owner in determining the relative total expenses of different funds. In addition, if transactional costs were included, costs may have been higher for these Portfolios as well as for a fund being compared. |
| 158 |
| Ohio National Fund, Inc. |
| June 30, 2015 (Unaudited) |
| Name and Address |
Age | Position(s) with the Fund |
Term of Office |
Number of Portfolios Served as Director |
Principal Occupation(s) and Other Directorships During Past Five Years | |||||||
| Independent Directors |
||||||||||||
| George M. Vredeveld One Financial Way Cincinnati, Ohio |
72 | Lead Independent Director, Member of Audit and Independent Directors Committees | Indefinite; Since March 1996 |
21 | Professor Emeritus, Finance: University of Cincinnati (January 2014 to present); Research Fellow and Member of Academic Council: Varna Free University, Varna, Bulgaria (2012 to present); Alpaugh Professor of Economics: Lindner College of Business, University of Cincinnati (2004-2013); Founder/President: Economics Center at the University of Cincinnati (1977-2012). | |||||||
| John I. Von Lehman One Financial Way Cincinnati, Ohio |
62 | Director, Chairman of Audit Committee and Member of Independent Directors Committee | Indefinite; Since August 2007 | 21 | Executive Vice President, CFO, Secretary, and Director: The Midland Company (1988-2007); Director, Audit Committee and Corporate Governance Committee Member: American Financial Group, Inc.; Finance Committee: Life Enriching Communities; Investment Committee: Xavier University Foundation. | |||||||
| Madeleine W. Ludlow One Financial Way Cincinnati, Ohio |
60 | Director, Member of Audit and Independent Directors Committees | Indefinite; Since April 2012 |
21 | Founder/Managing Director: West Capital Partners LLC (2010-present), Ludlow Ward Capital Advisors LLC (2005-2009); Director, ALLETE, Inc. (2004-present). | |||||||
| Geoffrey Keenan One Financial Way Cincinnati, Ohio |
56 | Director, Member of Audit and Independent Directors Committees | Indefinite; Since January 2015 | 21 | Executive Vice President and Chief Operating Officer of Gateway Investments Advisers, LLC (1995-2013) | |||||||
| Interested Director |
||||||||||||
| John J. Palmer One Financial Way Cincinnati, Ohio |
75 | Chairman and Director | Indefinite; Since July 1997 |
21 | Insurance industry consultant (April 2010 to present), Director: NSLA; President: Ohio National Fund, Inc. (1997-2010); Director and Vice Chairman: ONLIC (1997-2010); President and CEO: NSLA (2002-2010), Director: ONI and various affiliated companies (1997-2010), Tucson Symphony Orchestra, and Pima Canyon Estates Homeowners’ Association. | |||||||
| Officers |
||||||||||||
| Christopher A. Carlson One Financial Way Cincinnati, Ohio |
56 | President | Indefinite; Since March 2000 |
Vice Chairman and Chief Investment Officer: ONLIC; President and Director: ONI; Chief Investment Officer: NSLA; Officer and Director of various other Ohio National-affiliated companies. | ||||||||
| Thomas A. Barefield One Financial Way Cincinnati, Ohio |
62 | Vice President | Indefinite; Since February 1998 | Vice Chairman and Chief Distribution Officer: ONLIC; Director and Vice President — Marketing: NSLA; Director: ONI; Senior Vice President: Ohio National Equities, Inc.; Recent graduate of class XXIX of Leadership Cincinnati. | ||||||||
| R. Todd Brockman One Financial Way Cincinnati, Ohio |
46 | Treasurer | Indefinite; Since August 2004 | Vice President, Mutual Funds: ONLIC and NSLA; Treasurer: ONI. | ||||||||
| Kimberly A. Plante One Financial Way Cincinnati, Ohio |
41 | Secretary | Indefinite; Since March 2005 |
Senior Associate Counsel: ONLIC; Secretary: ONI; Officer of various other Ohio National-affiliated companies. | ||||||||
| Julie T. Thomas One Financial Way Cincinnati, Ohio |
52 | Chief Compliance Officer | Indefinite; Since June 2013 |
Vice President: ONLIC; Chief Compliance Officer: ONI, Suffolk, and other Ohio National-affiliated companies. | ||||||||
| 159 | (continued) |
| Ohio National Fund, Inc. |
| Information about Directors and Officers (Continued) |
June 30, 2015 (Unaudited) |
| Name and Address |
Age | Position(s) with the Fund |
Term of Office |
Number of Portfolios Served as Director |
Principal Occupation(s) and Other Directorships During Past Five Years | |||||||
| Catherine E. Gehr One Financial Way Cincinnati, Ohio |
43 | Assistant Treasurer | Indefinite; Since March 2005 |
Manager, Mutual Fund Operations: ONLIC; Assistant Treasurer: ONI. | ||||||||
| Emily Bae One Financial Way Cincinnati, Ohio |
30 | Assistant Secretary | Indefinite; Since May 2013 |
Assistant Secretary: ONI; Assistant Counsel: ONLIC. Prior to May 2013, was Counsel with Goodyear Tire & Rubber Company. | ||||||||
| 160 |

Item 2. Code Of Ethics.
As of the end of the period covered by this report, Ohio National Fund, Inc. (the “Fund”) has adopted a code of ethics that applies to the Fund’s principal executive officer and principal financial officer. There were no substantive amendments or waivers to the Code of Ethics during the period covered by this report.
A copy of this Code of Ethics is filed as Exhibit EX-99.CODE to this Form N-CSR and is also available, without charge, upon request, by calling 877-781-6392 toll free.
Item 3. Audit Committee Financial Expert.
The Fund’s Board of Directors has determined that the Fund has an audit committee financial expert serving on its Audit Committee. The Audit Committee financial expert is Mr. John I. VonLehman. Mr. VonLehman is independent for purposes of Item 3 of Form N-CSR.
Item 4. Principal Accountant Fees And Services.
The aggregate fees for each of the last two fiscal years for professional services rendered by the principal accountant for the audit of the Fund’s annual financial statements or services that are normally provided by the accountant in connection with statutory and regulatory filings or engagements for those fiscal years are listed below.
(a) Audit Fees.
Audits of the Portfolios for the year ended.
Fiscal year ended December 31, 2014: $267,750
Fiscal year ended December 31, 2013: $248,333
Consent on N-1A Annual Registration Statement filed with the SEC.
Fiscal year ended December 31, 2014: $5,000
Fiscal year ended December 31, 2013: $5,000
Merger related audit testwork.
Fiscal year ended December 31, 2013: $5,000
(b) Audit-Related Fees.
Consent on N-14 Filing filed with the SEC.
Fiscal year ended December 31, 2013: $6,000
Professional services rendered in connection with the consent on the Fund’s N-14 merger filing (paid by the Fund’s adviser (ONI)
(c) Tax Fees. None.
(d) All Other Fees. None.
(e)(1) Audit Committee Pre-Approval Policies and Procedures:
The Fund’s Audit Committee has adopted an Audit Committee Charter that requires that the Audit Committee oversee the quality and appropriateness of the accounting methods used in the preparation of the Fund’s financial statements, and the independent audit thereof; approve the selection and compensation of the independent auditors; and pre-approve the performance, by the independent auditors, of non-audit services for the Fund, its investment adviser, or any affiliated entity controlling, controlled by or under common control with the investment adviser that provides ongoing services to the Fund.
| (e)(2) | Services Approved Pursuant to Paragraph (c)(7)(i)(C) of Rule 2-01 of Regulation S-X: |
During the fiscal years ended December 31, 2014 and 2013, there were no non-audit services provided by the Fund’s principal accountant that would have required pre-approval by the Fund’s Audit Committee. The audit related fees aforementioned were pre-approved by the Fund’s Audit Committee, although not required by paragraph (c) (7) (ii) of Regulation S-X as the audit-related fees were less than five percent of the total amount of revenues paid to the Fund’s principal accountant.
| (f) | Not applicable. |
| (g) | There were no non-audit services provided by the Fund’s principal accountant, other than items disclosed in item (b) above, in which a fee was billed to the Fund, the Fund’s adviser, and any entity controlling, controlled by, or under common control with the adviser that provides ongoing services to the registrant for the last two fiscal years. |
| (h) | Not applicable, as there were no non-audit services performed by the Fund’s principal accountant that were rendered to the Fund, the Fund’s adviser, or any entity controlling, controlled by, or under common control with the adviser that provided ongoing services to the registrant that were not pre-approved for the last two fiscal years. |
Item 5. Audit Committee Of Listed Registrants.
Not applicable.
Item 6. Schedule of Investments.
Not applicable.
Item 7. Disclosure Of Proxy Voting Policies And Procedures For Closed-End Management Investment Companies.
Not Applicable.
Item 8. Portfolio Managers of Closed-End Management Investment Companies.
Not Applicable.
Item 9. Purchases of Equity Securities by Closed-End Management Investment Company and Affiliated Purchasers.
Not Applicable.
Item 10. Submission of Matters to a Vote of Security Holders.
There were no material changes to the procedures by which shareholders may recommend nominees to the Fund’s Board of Directors.
Item 11. Controls and Procedures.
| (a) | The Fund’s principal executive officer and principal financial officer have concluded, based on their evaluation conducted as of a date within 90 days of the filing of this report, that the Fund’s disclosure controls and procedures are adequately designed and are operating effectively to ensure (i) that material information relating to the Fund, including its consolidated subsidiaries, is made known to them by others within those entities, particularly during the period in which this report is being prepared; and (ii) that information required to be disclosed by the Fund on Form N-CSR is recorded, processed, summarized and reported within the time periods specified in the Securities and Exchange Commission’s rules and forms. |
| (b) | There were no changes in the Fund’s internal control over financial reporting that occurred during the second fiscal quarter of the period covered by this report that have materially affected, or are reasonably likely to materially affect, the Fund’s internal control over financial reporting. |
Item 12. Exhibits.
| (a)(1) | The Fund’s Code of Ethics pursuant to Item 2 of Form N-CSR is filed and attached hereto as EX-99.CODE. |
| (a)(2) | A separate certification for each principal executive officer and principal financial officer of the Fund as required by Rule 30a-2(a) under the
Investment Company Act of 1940 (17 CFR 270.30a-2(a)) is attached hereto as |
The certifications required by Section 906 of the Sarbanes-Oxley Act of 2002 are attached hereto as EX-99.906CERT.
SIGNATURES
Pursuant to the requirements of the Securities Exchange Act of 1934 and the Investment Company Act of 1940, the registrant has duly caused this report to be signed on its behalf by the undersigned, thereunto duly authorized.
Ohio National Fund, Inc.
| By: | /s/ Christopher A. Carlson | |
| Christopher A. Carlson | ||
| President | ||
| (Principal Executive Officer) | ||
| September 8, 2015 |
Pursuant to the requirements of the Securities Exchange Act of 1934 and the Investment Company Act of 1940, this report has been signed below by the following persons on behalf of the registrant and in the capacities and on the dates indicated.
Ohio National Fund, Inc.
| By: | /s/ Christopher A. Carlson | |
| Christopher A. Carlson | ||
| President | ||
| (Principal Executive Officer) | ||
| September 8, 2015 | ||
| By: | /s/ R. Todd Brockman | |
| R. Todd Brockman | ||
| Treasurer | ||
| (Principal Financial Officer) | ||
| September 8, 2015 | ||