UNITED STATES
SECURITIES AND EXCHANGE COMMISSION
Washington, D.C. 20549
FORM N-CSR
CERTIFIED SHAREHOLDER REPORT OF REGISTERED
MANAGEMENT INVESTMENT COMPANIES
Investment Company Act file number 811-03015
Ohio National Fund, Inc.
(Exact name of registrant as specified in charter)
| One Financial Way, Cincinnati, Ohio | 45242 | |
| (Address of principal executive offices) | (Zip code) |
CT Corporation 300 E. Lombard St. Suite 1400 Baltimore, MD 21202
(Name and address of agent for service)
Registrant’s telephone number, including area code: 513-794-6971
Date of fiscal year end: December 31
Date of reporting period: December 31, 2012
Form N-CSR is to be used by management investment companies to file reports with the Commission not later than 10 days after the transmission to stockholders of any report that is required to be transmitted to stockholders under Rule 30e-1 under the Investment Company Act of 1940 (17 CFR 270.30e-1). The Commission may use the information provided on Form N-CSR in its regulatory, disclosure review, inspection, and policymaking roles.
A registrant is required to disclose the information specified by Form N-CSR, and the Commission will make this information public. A registrant is not required to respond to the collection of information contained in Form N-CSR unless the Form displays a currently valid Office of Management and Budget (“OMB”) control number. Please direct comments concerning the accuracy of the information collection burden estimate and any suggestions for reducing the burden to Secretary, Securities and Exchange Commission, 450 Fifth Street, NW, Washington, DC 20549-0609. The OMB has reviewed this collection of information under the clearance requirements of 44 U.S.C. § 3507.
| Item 1. | Reports To Stockholders. |
WEALTH BUILDING OPPORTUNITY
Ohio National Fund, Inc.
Annual Report
December 31, 2012
Ohio National Fund, Inc.
OHIO NATIONAL FUND, INC.
| 1 | ||||
| 3 | ||||
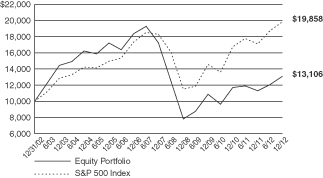
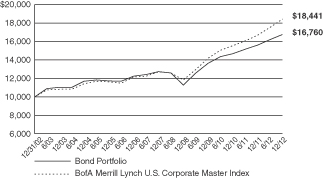
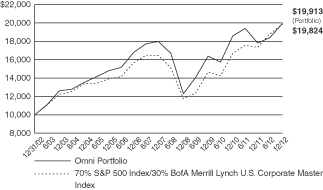
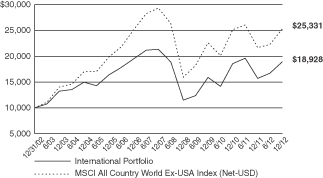
| The following pages contain Performance, Management’s Comments, Change in Value of $10,000 Investment, Portfolio Composition, Top Holdings, and Schedule of Investments for each of the Fund’s Portfolios: |
||||
| 4 | ||||
| 8 | ||||
| 11 | ||||
| 16 | ||||
| 21 | ||||
| 26 | ||||
| 31 | ||||
| 34 | ||||
| 38 | ||||
| 41 | ||||
| 44 | ||||
| 48 | ||||
| 55 | ||||
| 58 | ||||
| 68 | ||||
| 72 | ||||
| 76 | ||||
| 79 | ||||
| 82 | ||||
| 85 | ||||
| 91 | ||||
| 94 | ||||
| 98 | ||||
| 101 | ||||
| 104 | ||||
| 107 | ||||
| 110 | ||||
| 116 | ||||
| 128 | ||||
| 153 | ||||
| 154 | ||||
| 162 | ||||
| Message |

|
Dear Investor:
| 1 |

| 2 |
Directors and Officers of Ohio National Fund, Inc.
The Statement of Additional Information of Ohio National Fund, Inc. (the “Fund”) includes additional information about the Fund’s Board of Directors (the “Board”) and is available at http://www.ohionationalfund.com or upon request, without charge, by calling 877-781-6392 (toll-free).
A description of the policies and procedures that the Fund uses in voting proxies relating to Fund securities, as well as information regarding how the Fund voted proxies during the most recent twelve-month period ended June 30, is available without charge, upon request, by calling 877-781-6392 (toll-free) and on the Securities and Exchange Commission (the “Commission”) website at http://www.sec.gov.
The Fund has filed its Schedules of Investments as of March 31 and September 30 with the Commission, as required, on Form N-Q. Form N-Q is required to be filed with the Commission for the first and third quarters of each fiscal year within sixty days after the end of each period and is available on the Commission website upon acceptance of each submission. The Fund’s Forms N-Q may be reviewed and copied at the Commission’s Public Reference Room in Washington, DC. Information about the Public Reference Room is available by calling 1-800-SEC-0330 (toll-free).
This report and the financial statements contained herein are submitted for the general information of the shareholders of the Fund. This report is not authorized for distribution to prospective investors in the Fund unless preceded or accompanied by an effective prospectus of Ohio National Fund, Inc. For a prospectus containing more complete information, including charges and expenses, please contact Ohio National Investments, Inc., One Financial Way, Cincinnati, OH 45242, telephone 513-794-6100.
| 3 |
| Ohio National Fund, Inc. | Equity Portfolio |
| 4 | (continued) |
| Ohio National Fund, Inc. | Equity Portfolio (Continued) |
| 5 | (continued) |
| Ohio National Fund, Inc. | Equity Portfolio (Continued) |
| (1) | Composition of Portfolio subject to change. |
| (2) | Short-term investments have been excluded from the list of Top 10 Portfolio Holdings. |
| (3) | Sectors (combined): |
| % of Net Assets | ||||
| Financials |
21.1 | |||
| Information Technology |
20.7 | |||
| Consumer Discretionary |
15.8 | |||
| Industrials |
14.7 | |||
| Health Care |
14.1 | |||
| Energy |
8.2 | |||
| Consumer Staples |
2.1 | |||
| Materials |
2.0 | |||
|
|
|
|||
| 98.7 | ||||
|
|
|
| 6 |
| Ohio National Fund, Inc. | Equity Portfolio |
| Schedule of Investments |
December 31, 2012 |
Percentages are stated as a percent of net assets.
Abbreviations:
ADR: American Depositary Receipts
Footnotes:
| (a) | Non-income producing security. |
| (b) | This preferred stock is convertible at a 20% conversion premium until 12/01/2013. There is a mandatory conversion at 12/01/2013, at which time the conversion proceeds will be determined by the General Motors, Inc. common share price on that date. |
| (c) | Represents cost for financial reporting purposes, which may differ from cost basis for federal income tax purposes. See also Note 7 of the Notes to Financial Statements. |
The accompanying notes are an integral part of these financial statements.
| 7 |
| Ohio National Fund, Inc. | Money Market Portfolio |
| (1) | Composition of Portfolio subject to change. |
| (2) | Sectors (combined): |
| % of Net Assets | ||||
| Financials |
22.1 | |||
| Consumer Staples |
12.0 | |||
| Health Care |
11.6 | |||
| Energy |
8.5 | |||
| Consumer Discretionary |
4.6 | |||
| Information Technology |
3.9 | |||
|
|
|
|||
| 62.7 | ||||
|
|
|
| 8 |
| Ohio National Fund, Inc. | Money Market Portfolio |
| Schedule of Investments |
December 31, 2012 |
| Commercial Paper – 62.2% | (b) Rate | Maturity | Face Amount | Amortized Cost | ||||||||||||
| CONSUMER DISCRETIONARY – 4.6% |
||||||||||||||||
| Walt Disney Co. / The (Media) |
(a) | 0.120% | 03/22/2013 | $ | 2,000,000 | $ | 1,999,467 | |||||||||
| Walt Disney Co. / The (Media) |
(a) | 0.110% | 01/18/2013 | 10,000,000 | 9,999,481 | |||||||||||
|
|
|
|||||||||||||||
| 11,998,948 | ||||||||||||||||
|
|
|
|||||||||||||||
| CONSUMER STAPLES – 12.0% |
||||||||||||||||
| Coca-Cola Co. / The (Beverages) |
(a) | 0.170% | 02/08/2013 | 2,000,000 | 1,999,641 | |||||||||||
| Coca-Cola Co. / The (Beverages) |
(a) | 0.110% | 01/16/2013 | 8,000,000 | 7,999,633 | |||||||||||
| Wal-Mart Stores, Inc. (Food & Staples Retailing) |
(a) | 0.100% | 01/22/2013 | 5,000,000 | 4,999,708 | |||||||||||
| Wal-Mart Stores, Inc. (Food & Staples Retailing) |
(a) | 0.090% | 01/03/2013 | 6,000,000 | 5,999,970 | |||||||||||
| Procter & Gamble Co. / The (Household Products) |
(a) | 0.140% | 03/04/2013 | 5,000,000 | 4,998,794 | |||||||||||
| Procter & Gamble Co. / The (Household Products) |
(a) | 0.160% | 03/01/2013 | 3,000,000 | 2,999,213 | |||||||||||
| Procter & Gamble Co. / The (Household Products) |
(a) | 0.150% | 02/06/2013 | 2,000,000 | 1,999,700 | |||||||||||
|
|
|
|||||||||||||||
| 30,996,659 | ||||||||||||||||
|
|
|
|||||||||||||||
| ENERGY – 8.5% |
||||||||||||||||
| Chevron Corp. (Oil, Gas & Consumable Fuels) |
(a) | 0.100% | 01/09/2013 | 10,000,000 | 9,999,778 | |||||||||||
| Exxon Mobil Corp. (Oil, Gas & Consumable Fuels) |
0.040% | 01/17/2013 | 10,000,000 | 9,999,822 | ||||||||||||
| Exxon Mobil Corp. (Oil, Gas & Consumable Fuels) |
0.020% | 01/03/2013 | 2,000,000 | 1,999,998 | ||||||||||||
|
|
|
|||||||||||||||
| 21,999,598 | ||||||||||||||||
|
|
|
|||||||||||||||
| FINANCIALS – 21.6% |
||||||||||||||||
| U.S. Bank (Commercial Banks) |
0.050% | 01/02/2013 | 12,000,000 | 11,999,983 | ||||||||||||
| American Honda Finance Corp. (Consumer Finance) |
0.150% | 02/05/2013 | 2,000,000 | 1,999,708 | ||||||||||||
| American Honda Finance Corp. (Consumer Finance) |
0.130% | 01/09/2013 | 2,000,000 | 1,999,942 | ||||||||||||
| American Honda Finance Corp. (Consumer Finance) |
0.150% | 01/04/2013 | 6,000,000 | 5,999,925 | ||||||||||||
| Toyota Motor Credit Corp. (Consumer Finance) |
0.090% | 01/08/2013 | 10,000,000 | 9,999,825 | ||||||||||||
| General Electric Capital Corp. (Diversified Financial Services) |
0.040% | 01/14/2013 | 12,000,000 | 11,999,827 | ||||||||||||
| Prudential Funding LLC (Insurance) |
0.050% | 01/02/2013 | 12,000,000 | 11,999,983 | ||||||||||||
|
|
|
|||||||||||||||
| 55,999,193 | ||||||||||||||||
|
|
|
|||||||||||||||
| HEALTH CARE – 11.6% |
||||||||||||||||
| Merck & Co., Inc. (Pharmaceuticals) |
(a) | 0.130% | 01/07/2013 | 10,000,000 | 9,999,783 | |||||||||||
| Pfizer, Inc. (Pharmaceuticals) |
(a) | 0.060% | 01/15/2013 | 10,000,000 | 9,999,767 | |||||||||||
| Johnson & Johnson (Pharmaceuticals) |
(a) | 0.080% | 02/25/2013 | 10,000,000 | 9,998,778 | |||||||||||
|
|
|
|||||||||||||||
| 29,998,328 | ||||||||||||||||
|
|
|
|||||||||||||||
| INFORMATION TECHNOLOGY – 3.9% |
||||||||||||||||
| International Business Machines Corp. |
(a) | 0.070% | 01/04/2013 | 10,000,000 | 9,999,942 | |||||||||||
|
|
|
|||||||||||||||
| Total Commercial Paper (Cost $160,992,668) |
$ | 160,992,668 | ||||||||||||||
|
|
|
|||||||||||||||
| Asset-Backed Securities – 0.5% | Rate | Maturity | Face Amount | Amortized Cost | ||||||||||||
| FINANCIALS – 0.5% |
||||||||||||||||
| CNH Equipment Trust 2012-B, Class A1 (Consumer Finance) |
0.383% | 07/12/2013 | $ | 478,368 | $ | 478,368 | ||||||||||
| Ford Credit Auto Owner Trust 2012-C, Class A1 (Consumer Finance) |
0.272% | 08/15/2013 | 87,943 | 87,943 | ||||||||||||
| Hyundai Auto Receivables Trust 2012-C, Class A1 (Consumer Finance) |
0.230% | 10/15/2013 | 671,602 | 671,602 | ||||||||||||
|
|
|
|||||||||||||||
| Total Asset-Backed Securities (Cost $1,237,913) |
$ | 1,237,913 | ||||||||||||||
|
|
|
|||||||||||||||
| U.S. Government Agency Issues – 4.6% | Rate | Maturity | Face Amount | Amortized Cost | ||||||||||||
| Federal Home Loan Bank |
0.131% | 02/15/2013 | $ | 12,000,000 | $ | 11,998,035 | ||||||||||
|
|
|
|||||||||||||||
| Total U.S. Government Agency Issues (Cost $11,998,035) |
$ | 11,998,035 | ||||||||||||||
|
|
|
|||||||||||||||
| U.S. Treasury Obligations – 3.9% | Rate | Maturity | Face Amount | Amortized Cost | ||||||||||||
| U.S. Treasury Bill |
0.040% | 03/07/2013 | $ | 10,000,000 | $ | 9,999,278 | ||||||||||
|
|
|
|||||||||||||||
| Total U.S. Treasury Obligations (Cost $9,999,278) |
$ | 9,999,278 | ||||||||||||||
|
|
|
|||||||||||||||
| Money Market Funds – 11.6% | Shares | Value | ||||||||||||||
| Federated Prime Cash Obligations Fund – Institutional Class |
10,000,000 | $ | 10,000,000 | |||||||||||||
| Fidelity Institutional Money Market Funds Money Market Portfolio – Class I |
10,000,000 | 10,000,000 | ||||||||||||||
| First American Prime Obligations Fund – Class Z |
10,000,000 | 10,000,000 | ||||||||||||||
|
|
|
|||||||||||||||
| Total Money Market Funds (Cost $30,000,000) |
$ | 30,000,000 | ||||||||||||||
|
|
|
|||||||||||||||
| Total Investments – 82.8% (Cost $214,227,894) |
(c) |
$ | 214,227,894 | |||||||||||||
| Other Assets in Excess of Liabilities – 17.2% |
44,378,318 | |||||||||||||||
|
|
|
|||||||||||||||
| Net Assets – 100.0% |
$ | 258,606,212 | ||||||||||||||
|
|
|
|||||||||||||||
Percentages are stated as a percent of net assets.
| 9 | (continued) |
| Ohio National Fund, Inc. | Money Market Portfolio (Continued) |
| Schedule of Investments |
December 31, 2012 |
Footnotes:
| (a) | Security exempt from registration under Section 4 (2) of the Securities Act of 1933. These securities may be resold in transactions exempt from registration, normally to qualified buyers under Rule 144A. At December 31, 2012, the value of these securities totaled $92,993,655, or 36.0% of the Portfolio’s net assets. These securities were deemed liquid pursuant to procedures approved by the Board of Directors. |
| (b) | Rate presented is the effective yield at the time of purchase. |
| (c) | Represents cost for federal income tax and financial reporting purposes. See also Note 2 regarding the use of amortized cost for valuation of instruments in this Portfolio. |
The accompanying notes are an integral part of these financial statements.
| 10 |
| Ohio National Fund, Inc. | Bond Portfolio |
| 11 | (continued) |
| Ohio National Fund, Inc. | Bond Portfolio (Continued) |
| (1) | Composition of Portfolio subject to change. |
| (2) | Short-term investments have been excluded from the list of Top 10 Portfolio Holdings. |
| (3) | Sectors: |
| % of Net Assets | ||||
| Financials |
26.0 | |||
| Utilities |
14.9 | |||
| Energy |
10.9 | |||
| Consumer Discretionary |
8.8 | |||
| Industrials |
8.4 | |||
| Consumer Staples |
7.5 | |||
| Health Care |
6.3 | |||
| Materials |
4.0 | |||
| Telecommunication Services |
3.8 | |||
| Information Technology |
1.2 | |||
|
|
|
|||
| 91.8 | ||||
|
|
|
| 12 |
| Ohio National Fund, Inc. | Bond Portfolio |
| Schedule of Investments |
December 31, 2012 |
| Corporate Bonds – 91.8% | Rate | Maturity | Face Amount | Value | ||||||||||||
| CONSUMER DISCRETIONARY – 8.8% |
| |||||||||||||||
| Darden Restaurants, Inc. (Hotels, Restaurants & Leisure) |
3.350% | 11/01/2022 | $ | 1,425,000 | $ | 1,380,122 | ||||||||||
| Newell Rubbermaid, Inc. (Household Durables) |
6.250% | 04/15/2018 | 500,000 | 582,836 | ||||||||||||
| Comcast Corp. (Media) |
5.875% | 02/15/2018 | 750,000 | 904,483 | ||||||||||||
| Discovery Communications LLC (Media) |
4.375% | 06/15/2021 | 1,000,000 | 1,117,373 | ||||||||||||
| Discovery Communications LLC (Media) |
3.300% | 05/15/2022 | 275,000 | 282,707 | ||||||||||||
| News America, Inc. (Media) |
4.500% | 02/15/2021 | 1,250,000 | 1,429,140 | ||||||||||||
| Time Warner Cable, Inc. (Media) |
5.850% | 05/01/2017 | 1,000,000 | 1,182,102 | ||||||||||||
| Time Warner Cable, Inc. (Media) |
4.500% | 09/15/2042 | 425,000 | 414,881 | ||||||||||||
| Time Warner, Inc. (Media) |
3.150% | 07/15/2015 | 1,250,000 | 1,322,581 | ||||||||||||
| Viacom, Inc. (Media) |
4.375% | 09/15/2014 | 1,000,000 | 1,059,953 | ||||||||||||
| Walt Disney Co. / The (Media) |
3.700% | 12/01/2042 | 925,000 | 926,977 | ||||||||||||
| Kohl’s Corp. (Multiline Retail) |
4.000% | 11/01/2021 | 1,250,000 | 1,323,045 | ||||||||||||
| Macy’s Retail Holdings, Inc. (Multiline Retail) |
5.900% | 12/01/2016 | 425,000 | 499,683 | ||||||||||||
| Target Corp. (Multiline Retail) |
2.900% | 01/15/2022 | 1,500,000 | 1,591,278 | ||||||||||||
| Lowe’s Cos., Inc. (Specialty Retail) |
3.800% | 11/15/2021 | 1,000,000 | 1,105,523 | ||||||||||||
|
|
|
|||||||||||||||
| 15,122,684 | ||||||||||||||||
|
|
|
|||||||||||||||
| CONSUMER STAPLES – 7.5% |
| |||||||||||||||
| Anheuser-Busch Cos., Inc. (Beverages) |
5.500% | 01/15/2018 | 750,000 | 899,789 | ||||||||||||
| CVS Caremark Corp. (Food & Staples Retailing) |
5.750% | 06/01/2017 | 487,000 | 582,637 | ||||||||||||
| Kroger Co. / The (Food & Staples Retailing) |
2.200% | 01/15/2017 | 1,500,000 | 1,551,139 | ||||||||||||
| Wal-Mart Stores, Inc. (Food & Staples Retailing) |
1.500% | 10/25/2015 | 1,250,000 | 1,287,365 | ||||||||||||
| Bunge NA Finance LP (Food Products) |
5.900% | 04/01/2017 | 1,500,000 | 1,704,166 | ||||||||||||
| Hillshire Brands Co. (Food Products) |
2.750% | 09/15/2015 | 1,250,000 | 1,288,526 | ||||||||||||
| Mead Johnson Nutrition Co. (Food Products) |
3.500% | 11/01/2014 | 800,000 | 836,483 | ||||||||||||
| Mondelez International, Inc. (Food Products) |
6.125% | 02/01/2018 | 1,500,000 | 1,826,545 | ||||||||||||
| Tyson Foods, Inc. (Food Products) |
(b) | 6.600% | 04/01/2016 | 1,000,000 | 1,150,674 | |||||||||||
| Procter & Gamble Co. / The (Household Products) |
4.700% | 02/15/2019 | 250,000 | 295,543 | ||||||||||||
| Philip Morris International, Inc. (Tobacco) |
4.125% | 05/17/2021 | 1,250,000 | 1,414,156 | ||||||||||||
|
|
|
|||||||||||||||
| 12,837,023 | ||||||||||||||||
|
|
|
|||||||||||||||
| ENERGY – 10.9% |
| |||||||||||||||
| Weatherford International Ltd. (Energy Equip. & Svs.) |
6.000% | 03/15/2018 | 1,500,000 | 1,715,170 | ||||||||||||
| Anadarko Petroleum Corp. (Oil, Gas & Consumable Fuels) |
5.950% | 09/15/2016 | 1,000,000 | 1,151,791 | ||||||||||||
| Apache Corp. (Oil, Gas & Consumable Fuels) |
2.625% | 01/15/2023 | 1,000,000 | 999,087 | ||||||||||||
| Buckeye Partners LP (Oil, Gas & Consumable Fuels) |
4.875% | 02/01/2021 | 1,000,000 | 1,036,438 | ||||||||||||
| Cenovus Energy, Inc. (Oil, Gas & Consumable Fuels) |
5.700% | 10/15/2019 | 1,000,000 | 1,213,426 | ||||||||||||
| Devon Energy Corp. (Oil, Gas & Consumable Fuels) |
3.250% | 05/15/2022 | 500,000 | 522,298 | ||||||||||||
| EOG Resources, Inc. (Oil, Gas & Consumable Fuels) |
2.950% | 06/01/2015 | 1,250,000 | 1,314,691 | ||||||||||||
| Kinder Morgan Energy Partners LP (Oil, Gas & Consumable Fuels) |
4.150% | 03/01/2022 | 1,000,000 | 1,084,394 | ||||||||||||
| Magellan Midstream Partners LP (Oil, Gas & Consumable Fuels) |
4.250% | 02/01/2021 | 1,000,000 | 1,105,301 | ||||||||||||
| Murphy Oil Corp. (Oil, Gas & Consumable Fuels) |
4.000% | 06/01/2022 | 1,250,000 | 1,260,999 | ||||||||||||
| Occidental Petroleum Corp. (Oil, Gas & Consumable Fuels) |
3.125% | 02/15/2022 | 1,000,000 | 1,064,595 | ||||||||||||
| ONEOK Partners LP (Oil, Gas & Consumable Fuels) |
3.250% | 02/01/2016 | 1,000,000 | 1,055,563 | ||||||||||||
| Phillips 66 (Oil, Gas & Consumable Fuels) |
(a) | 4.300% | 04/01/2022 | 1,300,000 | 1,453,878 | |||||||||||
| Plains All American Pipeline LP / PAA Finance Corp. (Oil, Gas & Consumable Fuels) |
2.850% | 01/31/2023 | 1,000,000 | 991,719 | ||||||||||||
| Shell International Finance BV (Oil, Gas & Consumable Fuels) |
4.375% | 03/25/2020 | 1,250,000 | 1,450,941 | ||||||||||||
| TransCanada PipeLines Ltd. (Oil, Gas & Consumable Fuels) |
2.500% | 08/01/2022 | 1,425,000 | 1,429,218 | ||||||||||||
|
|
|
|||||||||||||||
| 18,849,509 | ||||||||||||||||
|
|
|
|||||||||||||||
| FINANCIALS – 26.0% |
| |||||||||||||||
| Credit Suisse (Capital Markets) |
3.500% | 03/23/2015 | 1,250,000 | 1,318,807 | ||||||||||||
| Franklin Resources, Inc. (Capital Markets) |
3.125% | 05/20/2015 | 1,000,000 | 1,052,791 | ||||||||||||
| Goldman Sachs Group, Inc. / The (Capital Markets) |
6.150% | 04/01/2018 | 1,250,000 | 1,469,601 | ||||||||||||
| Janus Capital Group, Inc. (Capital Markets) |
(b) | 6.700% | 06/15/2017 | 1,500,000 | 1,715,511 | |||||||||||
| Jefferies Group, Inc. (Capital Markets) |
5.875% | 06/08/2014 | 1,000,000 | 1,057,500 | ||||||||||||
| Morgan Stanley (Capital Markets) |
4.750% | 04/01/2014 | 1,250,000 | 1,294,736 | ||||||||||||
| Northern Trust Corp. (Capital Markets) |
3.450% | 11/04/2020 | 1,000,000 | 1,079,401 | ||||||||||||
| State Street Corp. (Capital Markets) |
4.375% | 03/07/2021 | 1,250,000 | 1,453,956 | ||||||||||||
| TD Ameritrade Holding Corp. (Capital Markets) |
4.150% | 12/01/2014 | 1,000,000 | 1,066,245 | ||||||||||||
| BB&T Corp. (Commercial Banks) |
5.200% | 12/23/2015 | 1,000,000 | 1,115,545 | ||||||||||||
| Comerica Bank (Commercial Banks) |
5.750% | 11/21/2016 | 1,500,000 | 1,736,575 | ||||||||||||
| Deutsche Bank Capital Funding Trust VII (Commercial Banks) |
(a)(c) | 5.628% | Perpetual | 1,500,000 | 1,440,000 | |||||||||||
| Fifth Third Bancorp (Commercial Banks) |
4.500% | 06/01/2018 | 1,750,000 | 1,944,897 | ||||||||||||
| KeyCorp (Commercial Banks) |
5.100% | 03/24/2021 | 500,000 | 582,943 | ||||||||||||
| PNC Funding Corp. (Commercial Banks) |
5.250% | 11/15/2015 | 1,500,000 | 1,677,024 | ||||||||||||
| SunTrust Bank (Commercial Banks) |
5.000% | 09/01/2015 | 229,000 | 250,337 | ||||||||||||
| Wells Fargo & Co. (Commercial Banks) |
4.600% | 04/01/2021 | 1,250,000 | 1,438,904 | ||||||||||||
| Capital One Bank U.S.A. NA (Consumer Finance) |
5.125% | 02/15/2014 | 750,000 | 787,052 | ||||||||||||
| Discover Financial Services (Consumer Finance) |
6.450% | 06/12/2017 | 750,000 | 877,616 | ||||||||||||
| 13 | (continued) |
| Ohio National Fund, Inc. | Bond Portfolio (Continued) |
| Schedule of Investments |
December 31, 2012 |
| Corporate Bonds (Continued) | Rate | Maturity | Face Amount | Value | ||||||||||||
| FINANCIALS (continued) |
| |||||||||||||||
| Bank of America Corp. (Diversified Financial Svs.) |
5.650% | 05/01/2018 | $ | 1,000,000 | $ | 1,164,368 | ||||||||||
| Citigroup, Inc. (Diversified Financial Svs.) |
6.125% | 05/15/2018 | 1,250,000 | 1,499,206 | ||||||||||||
| General Electric Capital Corp. (Diversified Financial Svs.) |
5.625% | 05/01/2018 | 1,000,000 | 1,188,483 | ||||||||||||
| JPMorgan Chase & Co. (Diversified Financial Svs.) |
5.150% | 10/01/2015 | 1,500,000 | 1,649,658 | ||||||||||||
| National Rural Utilities Cooperative Finance Corp. (Diversified Financial Svs.) |
1.900% | 11/01/2015 | 1,000,000 | 1,032,142 | ||||||||||||
| Allstate Corp. / The (Insurance) |
5.200% | 01/15/2042 | 500,000 | 593,995 | ||||||||||||
| Assurant, Inc. (Insurance) |
5.625% | 02/15/2014 | 1,500,000 | 1,565,432 | ||||||||||||
| Axis Capital Holdings Ltd. (Insurance) |
5.750% | 12/01/2014 | 1,000,000 | 1,072,959 | ||||||||||||
| Berkshire Hathaway, Inc. (Insurance) |
3.200% | 02/11/2015 | 1,250,000 | 1,316,571 | ||||||||||||
| Hartford Financial Services Group, Inc. (Insurance) |
5.375% | 03/15/2017 | 1,500,000 | 1,695,872 | ||||||||||||
| Liberty Mutual Group, Inc. (Insurance) |
(a) | 5.750% | 03/15/2014 | 1,000,000 | 1,047,559 | |||||||||||
| Loews Corp. (Insurance) |
5.250% | 03/15/2016 | 750,000 | 836,315 | ||||||||||||
| Prudential Financial, Inc. (Insurance) |
6.100% | 06/15/2017 | 1,500,000 | 1,770,471 | ||||||||||||
| Equity One, Inc. (Real Estate Investment Trusts) |
6.250% | 01/15/2017 | 1,250,000 | 1,427,911 | ||||||||||||
| Federal Realty Investment Trust (Real Estate Investment Trusts) |
3.000% | 08/01/2022 | 1,425,000 | 1,411,847 | ||||||||||||
| HCP, Inc. (Real Estate Investment Trusts) |
5.375% | 02/01/2021 | 1,000,000 | 1,139,590 | ||||||||||||
| Mack-Cali Realty LP (Real Estate Investment Trusts) |
4.600% | 06/15/2013 | 1,000,000 | 1,015,284 | ||||||||||||
|
|
|
|||||||||||||||
| 44,787,104 | ||||||||||||||||
|
|
|
|||||||||||||||
| HEALTH CARE – 6.3% |
| |||||||||||||||
| Amgen, Inc. (Biotechnology) |
4.100% | 06/15/2021 | 1,000,000 | 1,108,721 | ||||||||||||
| Celgene Corp. (Biotechnology) |
2.450% | 10/15/2015 | 1,250,000 | 1,297,905 | ||||||||||||
| Baxter International, Inc. (Health Care Equip. & Supplies) |
1.800% | 03/15/2013 | 250,000 | 250,706 | ||||||||||||
| Becton Dickinson and Co. (Health Care Equip. & Supplies) |
5.000% | 05/15/2019 | 500,000 | 593,018 | ||||||||||||
| Covidien International Finance SA (Health Care Equip. & Supplies) |
2.800% | 06/15/2015 | 1,250,000 | 1,308,073 | ||||||||||||
| AmerisourceBergen Corp. (Health Care Providers & Svs.) |
4.875% | 11/15/2019 | 500,000 | 580,131 | ||||||||||||
| Laboratory Corp of America Holdings (Health Care Providers & Svs.) |
3.750% | 08/23/2022 | 425,000 | 451,092 | ||||||||||||
| UnitedHealth Group, Inc. (Health Care Providers & Svs.) |
6.000% | 02/15/2018 | 1,500,000 | 1,827,180 | ||||||||||||
| Thermo Fisher Scientific, Inc. (Life Sciences Tools & Svs.) |
3.250% | 11/20/2014 | 300,000 | 313,828 | ||||||||||||
| AbbVie, Inc. (Pharmaceuticals) |
(a) | 2.900% | 11/06/2022 | 1,425,000 | 1,452,554 | |||||||||||
| Merck & Co., Inc. (Pharmaceuticals) |
5.000% | 06/30/2019 | 1,000,000 | 1,204,401 | ||||||||||||
| Teva Pharmaceutical Finance II BV / Teva Pharmaceutical Finance III LLC (Pharmaceuticals) |
3.000% | 06/15/2015 | 500,000 | 525,958 | ||||||||||||
|
|
|
|||||||||||||||
| 10,913,567 | ||||||||||||||||
|
|
|
|||||||||||||||
| INDUSTRIALS – 8.4% |
| |||||||||||||||
| BAE Systems Holdings, Inc. (Aerospace & Defense) |
(a) | 6.375% | 06/01/2019 | 750,000 | 895,884 | |||||||||||
| Lockheed Martin Corp. (Aerospace & Defense) |
3.350% | 09/15/2021 | 1,000,000 | 1,057,635 | ||||||||||||
| Raytheon Co. (Aerospace & Defense) |
4.400% | 02/15/2020 | 1,250,000 | 1,431,545 | ||||||||||||
| Republic Services, Inc. (Commercial Svs. & Supplies) |
3.800% | 05/15/2018 | 1,000,000 | 1,100,299 | ||||||||||||
| Waste Management, Inc. (Commercial Svs. & Supplies) |
6.100% | 03/15/2018 | 500,000 | 603,798 | ||||||||||||
| Emerson Electric Co. (Electrical Equip.) |
4.250% | 11/15/2020 | 1,250,000 | 1,443,425 | ||||||||||||
| Caterpillar, Inc. (Machinery) |
5.700% | 08/15/2016 | 1,000,000 | 1,160,755 | ||||||||||||
| Deere & Co. (Machinery) |
4.375% | 10/16/2019 | 1,250,000 | 1,448,228 | ||||||||||||
| Illinois Tool Works, Inc. (Machinery) |
3.375% | 09/15/2021 | 500,000 | 544,416 | ||||||||||||
| CSX Corp. (Road & Rail) |
5.600% | 05/01/2017 | 1,500,000 | 1,753,373 | ||||||||||||
| Norfolk Southern Corp. (Road & Rail) |
3.000% | 04/01/2022 | 600,000 | 615,978 | ||||||||||||
| Ryder System, Inc. (Road & Rail) |
3.600% | 03/01/2016 | 1,000,000 | 1,050,358 | ||||||||||||
| Union Pacific Corp. (Road & Rail) |
4.000% | 02/01/2021 | 1,250,000 | 1,402,390 | ||||||||||||
|
|
|
|||||||||||||||
| 14,508,084 | ||||||||||||||||
|
|
|
|||||||||||||||
| INFORMATION TECHNOLOGY – 1.2% |
| |||||||||||||||
| Cisco Systems, Inc. (Communications Equip.) |
2.900% | 11/17/2014 | 300,000 | 313,250 | ||||||||||||
| Computer Sciences Corp. (IT Svs.) |
6.500% | 03/15/2018 | 1,500,000 | 1,751,028 | ||||||||||||
|
|
|
|||||||||||||||
| 2,064,278 | ||||||||||||||||
|
|
|
|||||||||||||||
| MATERIALS – 4.0% |
| |||||||||||||||
| Eastman Chemical Co. (Chemicals) |
3.600% | 08/15/2022 | 1,000,000 | 1,048,239 | ||||||||||||
| FMC Corp. (Chemicals) |
3.950% | 02/01/2022 | 1,000,000 | 1,062,434 | ||||||||||||
| Freeport-McMoRan Copper & Gold, Inc. (Metals & Mining) |
3.550% | 03/01/2022 | 1,250,000 | 1,240,778 | ||||||||||||
| Newmont Mining Corp. (Metals & Mining) |
3.500% | 03/15/2022 | 1,425,000 | 1,470,933 | ||||||||||||
| Rio Tinto Finance U.S.A. Ltd. (Metals & Mining) |
1.875% | 11/02/2015 | 1,000,000 | 1,026,929 | ||||||||||||
| Teck Resources Ltd. (Metals & Mining) |
3.750% | 02/01/2023 | 1,000,000 | 1,026,623 | ||||||||||||
|
|
|
|||||||||||||||
| 6,875,936 | ||||||||||||||||
|
|
|
|||||||||||||||
| TELECOMMUNICATION SERVICES – 3.8% |
| |||||||||||||||
| AT&T, Inc. (Diversified Telecom. Svs.) |
3.875% | 08/15/2021 | 1,000,000 | 1,115,416 | ||||||||||||
| AT&T, Inc. (Diversified Telecom. Svs.) |
3.000% | 02/15/2022 | 500,000 | 520,468 | ||||||||||||
| Telecom Italia Capital SA (Diversified Telecom. Svs.) |
5.250% | 10/01/2015 | 750,000 | 799,875 | ||||||||||||
| Verizon Communications, Inc. (Diversified Telecom. Svs.) |
4.600% | 04/01/2021 | 1,250,000 | 1,460,150 | ||||||||||||
| Verizon Communications, Inc. (Diversified Telecom. Svs.) |
3.850% | 11/01/2042 | 425,000 | 418,456 | ||||||||||||
| 14 | (continued) |
| Ohio National Fund, Inc. | Bond Portfolio (Continued) |
| Schedule of Investments |
December 31, 2012 |
| Corporate Bonds (Continued) | Rate | Maturity | Face Amount | Value | ||||||||||||
| TELECOMMUNICATION SERVICES (continued) |
| |||||||||||||||
| America Movil SAB de CV (Wireless Telecom. Svs.) |
5.750% | 01/15/2015 | $ | 1,000,000 | $ | 1,102,413 | ||||||||||
| Rogers Communications, Inc. (Wireless Telecom. Svs.) |
5.500% | 03/15/2014 | 1,000,000 | 1,058,168 | ||||||||||||
|
|
|
|||||||||||||||
| 6,474,946 | ||||||||||||||||
|
|
|
|||||||||||||||
| UTILITIES – 14.9% |
| |||||||||||||||
| Appalachian Power Co. (Electric Utilities) |
4.600% | 03/30/2021 | 1,000,000 | 1,152,683 | ||||||||||||
| Commonwealth Edison Co. (Electric Utilities) |
5.950% | 08/15/2016 | 1,500,000 | 1,749,152 | ||||||||||||
| Duke Energy Corp. (Electric Utilities) |
3.350% | 04/01/2015 | 1,250,000 | 1,321,356 | ||||||||||||
| Florida Power Corp. (Electric Utilities) |
4.550% | 04/01/2020 | 500,000 | 575,202 | ||||||||||||
| Kansas City Power & Light Co. (Electric Utilities) |
5.850% | 06/15/2017 | 1,500,000 | 1,748,244 | ||||||||||||
| Metropolitan Edison Co. (Electric Utilities) |
4.875% | 04/01/2014 | 750,000 | 786,072 | ||||||||||||
| Pepco Holdings, Inc. (Electric Utilities) |
2.700% | 10/01/2015 | 750,000 | 776,789 | ||||||||||||
| South Carolina Electric & Gas Co. (Electric Utilities) |
4.350% | 02/01/2042 | 1,000,000 | 1,056,613 | ||||||||||||
| Tenaska Georgia Partners LP (Electric Utilities) |
9.500% | 02/01/2030 | 471,240 | 562,233 | ||||||||||||
| Union Electric Co. (Electric Utilities) |
6.400% | 06/15/2017 | 1,500,000 | 1,833,425 | ||||||||||||
| Virginia Electric and Power Co. (Electric Utilities) |
5.400% | 01/15/2016 | 1,500,000 | 1,703,994 | ||||||||||||
| Westar Energy, Inc. (Electric Utilities) |
4.125% | 03/01/2042 | 500,000 | 522,330 | ||||||||||||
| Xcel Energy, Inc. (Electric Utilities) |
4.700% | 05/15/2020 | 1,000,000 | 1,170,249 | ||||||||||||
| AGL Capital Corp. (Gas Utilities) |
5.250% | 08/15/2019 | 1,000,000 | 1,192,600 | ||||||||||||
| CenterPoint Energy Resources Corp. (Gas Utilities) |
5.950% | 01/15/2014 | 500,000 | 524,979 | ||||||||||||
| Southwest Gas Corp. (Gas Utilities) |
3.875% | 04/01/2022 | 1,250,000 | 1,380,776 | ||||||||||||
| Spectra Energy Capital LLC (Gas Utilities) |
5.500% | 03/01/2014 | 750,000 | 789,158 | ||||||||||||
| Energy Future Competitive Holdings Co. (Ind. Power Prod. & Energy Traders) |
7.480% | 01/01/2017 | 393,963 | 361,924 | ||||||||||||
| Alliant Energy Corp. (Multi-Utilities) |
4.000% | 10/15/2014 | 1,000,000 | 1,054,234 | ||||||||||||
| Avista Corp. (Multi-Utilities) |
5.950% | 06/01/2018 | 1,000,000 | 1,210,227 | ||||||||||||
| Consumers Energy Co. (Multi-Utilities) |
6.000% | 02/15/2014 | 1,000,000 | 1,059,119 | ||||||||||||
| LG&E and KU Energy LLC (Multi-Utilities) |
4.375% | 10/01/2021 | 1,000,000 | 1,098,169 | ||||||||||||
| NextEra Energy Capital Holdings, Inc. (Multi-Utilities) |
2.600% | 09/01/2015 | 1,250,000 | 1,303,088 | ||||||||||||
| Public Service Electric & Gas Co. (Multi-Utilities) |
3.950% | 05/01/2042 | 750,000 | 771,373 | ||||||||||||
|
|
|
|||||||||||||||
| 25,703,989 | ||||||||||||||||
|
|
|
|||||||||||||||
| Total Corporate Bonds (Cost $143,475,815) |
$ | 158,137,120 | ||||||||||||||
|
|
|
|||||||||||||||
| U.S. Treasury Obligations – 4.7% | Rate | Maturity | Face Amount | Value | ||||||||||||
| United States Treasury Note |
2.000% | 11/15/2021 | $ | 4,000,000 | $ | 4,147,812 | ||||||||||
| United States Treasury Note |
1.625% | 08/15/2022 | 4,000,000 | 3,970,000 | ||||||||||||
|
|
|
|||||||||||||||
| Total U.S. Treasury Obligations (Cost $7,994,136) |
$ | 8,117,812 | ||||||||||||||
|
|
|
|||||||||||||||
| Money Market Funds – 2.3% | Shares | Value | ||||||||||||||
| Fidelity Institutional Money Market Funds |
3,883,000 | $ | 3,883,000 | |||||||||||||
|
|
|
|||||||||||||||
| Total Money Market Funds (Cost $3,883,000) |
$ | 3,883,000 | ||||||||||||||
|
|
|
|||||||||||||||
| Total Investments – 98.8% (Cost $155,352,951) |
(d) | $ | 170,137,932 | |||||||||||||
| Other Assets in Excess of Liabilities – 1.2% |
2,046,518 | |||||||||||||||
|
|
|
|||||||||||||||
| Net Assets – 100.0% |
$ | 172,184,450 | ||||||||||||||
|
|
|
|||||||||||||||
Percentages are stated as a percent of net assets.
Footnotes:
| (a) | Security exempt from registration under Regulation D of the Securities Act of 1933. These securities may be resold in transactions exempt from registration, normally to qualified buyers under Rule 144A. At December 31, 2012, the value of these securities totaled $6,289,875, or 3.7% of the Portfolio’s net assets. These securities were deemed liquid pursuant to procedures approved by the Board of Directors. |
| (b) | These securities are credit sensitive bonds. The coupon rates are variable rates subject to adjustment based on changes in national credit rating agency ratings. |
| (c) | Fixed-to-floating rate, callable, perpetual life trust preferred security. Interest rates stated are those in effect at December 31, 2012. |
| (d) | Represents cost for financial reporting purposes, which may differ from cost basis for federal income tax purposes. See also Note 7 of the Notes to Financial Statements. |
The accompanying notes are an integral part of these financial statements.
| 15 |
| Ohio National Fund, Inc. | Omni Portfolio |
| 16 | (continued) |
| Ohio National Fund, Inc. | Omni Portfolio (Continued) |
| (1) | Composition of Portfolio subject to change. |
| (2) | Short-term investments have been excluded from the list of Top 10 Portfolio Holdings. |
| (3) | Sectors (combined): |
| % of Net Assets | ||||
| Industrials |
18.3 | |||
| Information Technology |
17.9 | |||
| Financials |
17.4 | |||
| Consumer Discretionary |
12.6 | |||
| Energy |
8.4 | |||
| Health Care |
6.9 | |||
| Materials |
4.3 | |||
| Utilities |
4.1 | |||
| Consumer Staples |
3.1 | |||
| Telecommunication Services |
1.6 | |||
|
|
|
|||
| 94.6 | ||||
|
|
|
| 17 |
| Ohio National Fund, Inc. | Omni Portfolio |
| Schedule of Investments |
December 31, 2012 |
| Common Stocks – 72.5% | Shares | Value | ||||||||||||
| CONSUMER DISCRETIONARY – 10.8% |
| |||||||||||||
| CBS Corp. Class B (Media) |
7,500 | $ | 285,375 | |||||||||||
| Time Warner, Inc. (Media) |
10,400 | 497,432 | ||||||||||||
| Walt Disney Co. / The (Media) |
9,900 | 492,921 | ||||||||||||
| Macy’s, Inc. (Multiline Retail) |
4,300 | 167,786 | ||||||||||||
| Target Corp. (Multiline Retail) |
7,400 | 437,858 | ||||||||||||
| AutoZone, Inc. (Specialty Retail) |
(a) | 900 | 318,987 | |||||||||||
| Lowe’s Cos., Inc. (Specialty Retail) |
10,200 | 362,304 | ||||||||||||
| Hanesbrands, Inc. (Textiles, Apparel & Luxury Goods) |
(a) | 14,800 | 530,136 | |||||||||||
| Michael Kors Holdings Ltd. (Textiles, Apparel & Luxury Goods) |
(a) | 4,700 | 239,841 | |||||||||||
| Wolverine World Wide, Inc. (Textiles, Apparel & Luxury Goods) |
6,400 | 262,272 | ||||||||||||
|
|
|
|||||||||||||
| 3,594,912 | ||||||||||||||
|
|
|
|||||||||||||
| CONSUMER STAPLES – 1.4% |
| |||||||||||||
| Constellation Brands, Inc. Class A (Beverages) |
(a) | 13,500 | 477,765 | |||||||||||
|
|
|
|||||||||||||
| ENERGY – 5.7% |
| |||||||||||||
| Schlumberger Ltd. (Energy Equip. & Svs.) |
6,700 | 464,243 | ||||||||||||
| ConocoPhillips (Oil, Gas & Consumable Fuels) |
8,800 | 510,312 | ||||||||||||
| Marathon Oil Corp. (Oil, Gas & Consumable Fuels) |
16,700 | 512,022 | ||||||||||||
| Whiting Petroleum Corp. (Oil, Gas & Consumable Fuels) |
(a) | 9,700 | 420,689 | |||||||||||
|
|
|
|||||||||||||
| 1,907,266 | ||||||||||||||
|
|
|
|||||||||||||
| FINANCIALS – 11.5% |
| |||||||||||||
| PNC Financial Services Group, Inc. (Commercial Banks) |
8,400 | 489,804 | ||||||||||||
| Wells Fargo & Co. (Commercial Banks) |
13,000 | 444,340 | ||||||||||||
| Citigroup, Inc. (Diversified Financial Svs.) |
10,700 | 423,292 | ||||||||||||
| JPMorgan Chase & Co. (Diversified Financial Svs.) |
11,400 | 501,258 | ||||||||||||
| Hartford Financial Services Group, Inc. (Insurance) |
22,500 | 504,900 | ||||||||||||
| Lincoln National Corp. (Insurance) |
20,100 | 520,590 | ||||||||||||
| MetLife, Inc. (Insurance) |
14,000 | 461,160 | ||||||||||||
| Prudential Financial, Inc. (Insurance) |
8,800 | 469,304 | ||||||||||||
|
|
|
|||||||||||||
| 3,814,648 | ||||||||||||||
|
|
|
|||||||||||||
| HEALTH CARE – 5.4% |
| |||||||||||||
| Amarin Corp PLC – ADR (Biotechnology) |
(a) | 36,100 | 292,049 | |||||||||||
| Ariad Pharmaceuticals, Inc. (Biotechnology) |
(a) | 13,600 | 260,848 | |||||||||||
| Vertex Pharmaceuticals, Inc. (Biotechnology) |
(a) | 8,400 | 352,296 | |||||||||||
| UnitedHealth Group, Inc. (Health Care Providers & Svs.) |
7,400 | 401,376 | ||||||||||||
| Pfizer, Inc. (Pharmaceuticals) |
19,300 | 484,044 | ||||||||||||
|
|
|
|||||||||||||
| 1,790,613 | ||||||||||||||
|
|
|
|||||||||||||
| INDUSTRIALS – 16.7% |
| |||||||||||||
| Honeywell International, Inc. (Aerospace & Defense) |
8,400 | 533,148 | ||||||||||||
| United Technologies Corp. (Aerospace & Defense) |
5,900 | 483,859 | ||||||||||||
| FedEx Corp. (Air Freight & Logistics) |
5,500 | 504,460 | ||||||||||||
| Delta Air Lines, Inc. (Airlines) |
(a) | 41,600 | 493,792 | |||||||||||
| Quanta Services, Inc. (Construction & Engineering) |
(a) | 9,200 | 251,068 | |||||||||||
| Eaton Corp. PLC (Electrical Equip.) |
9,500 | 514,900 | ||||||||||||
| General Electric Co. (Industrial Conglomerates) |
11,200 | 235,088 | ||||||||||||
| Deere & Co. (Machinery) |
3,421 | 295,643 | ||||||||||||
| Pentair Ltd. (Machinery) |
10,000 | 491,500 | ||||||||||||
| Snap-On, Inc. (Machinery) |
6,700 | 529,233 | ||||||||||||
| Stanley Black & Decker, Inc. (Machinery) |
1,400 | 103,558 | ||||||||||||
| Xylem, Inc. (Machinery) |
19,200 | 520,320 | ||||||||||||
| Hertz Global Holdings, Inc. (Road & Rail) |
(a) | 35,200 | 572,704 | |||||||||||
|
|
|
|||||||||||||
| 5,529,273 | ||||||||||||||
|
|
|
|||||||||||||
| INFORMATION TECHNOLOGY – 17.4% |
| |||||||||||||
| QUALCOMM, Inc. (Communications Equip.) |
8,000 | 496,160 | ||||||||||||
| Apple, Inc. (Computers & Peripherals) |
1,150 | 612,984 | ||||||||||||
| EMC Corp. (Computers & Peripherals) |
(a) | 17,500 | 442,750 | |||||||||||
| eBay, Inc. (Internet Software & Svs.) |
(a) | 7,500 | 382,650 | |||||||||||
| Facebook, Inc. Class A (Internet Software & Svs.) |
(a) | 17,000 | 452,710 | |||||||||||
| Google, Inc. Class A (Internet Software & Svs.) |
(a) | 700 | 496,559 | |||||||||||
| Altera Corp. (Semiconductors & Equip.) |
14,000 | 482,160 | ||||||||||||
| Avago Technologies Ltd. (Semiconductors & Equip.) |
14,300 | 452,738 | ||||||||||||
| Xilinx, Inc. (Semiconductors & Equip.) |
13,700 | 491,830 | ||||||||||||
| Citrix Systems, Inc. (Software) |
(a) | 7,400 | 486,550 | |||||||||||
| Oracle Corp. (Software) |
14,400 | 479,808 | ||||||||||||
| TIBCO Software, Inc. (Software) |
(a) | 23,500 | 517,235 | |||||||||||
|
|
|
|||||||||||||
| 5,794,134 | ||||||||||||||
|
|
|
|||||||||||||
| 18 | (continued) |
| Ohio National Fund, Inc. | Omni Portfolio (Continued) |
| Schedule of Investments |
December 31, 2012 |
| Common Stocks (Continued) | Shares | Value | ||||||||||||||||
| MATERIALS – 3.6% |
| |||||||||||||||||
| Air Products & Chemicals, Inc. (Chemicals) |
5,700 | $ | 478,914 | |||||||||||||||
| E.I. du Pont de Nemours & Co. (Chemicals) |
5,800 | 260,826 | ||||||||||||||||
| Monsanto Co. (Chemicals) |
2,400 | 227,160 | ||||||||||||||||
| Freeport–McMoRan Copper & Gold, Inc. (Metals & Mining) |
6,200 | 212,040 | ||||||||||||||||
|
|
|
|||||||||||||||||
| 1,178,940 | ||||||||||||||||||
|
|
|
|||||||||||||||||
| Total Common Stocks (Cost $22,894,005) |
$ | 24,087,551 | ||||||||||||||||
|
|
|
|||||||||||||||||
| Corporate Bonds – 22.1% | Rate | Maturity | Face Amount | Value | ||||||||||||||
| CONSUMER DISCRETIONARY – 1.8% |
||||||||||||||||||
| Darden Restaurants, Inc. (Hotels, Restaurants & Leisure) |
3.350% | 11/01/2022 | $ | 75,000 | $ | 72,638 | ||||||||||||
| Comcast Corp. (Media) |
5.875% | 02/15/2018 | 150,000 | 180,897 | ||||||||||||||
| Discovery Communications LLC (Media) |
3.300% | 05/15/2022 | 75,000 | 77,102 | ||||||||||||||
| Time Warner Cable, Inc. (Media) |
4.500% | 09/15/2042 | 75,000 | 73,214 | ||||||||||||||
| Walt Disney Co. / The (Media) |
3.700% | 12/01/2042 | 75,000 | 75,160 | ||||||||||||||
| Kohl’s Corp. (Multiline Retail) |
4.000% | 11/01/2021 | 75,000 | 79,383 | ||||||||||||||
| Macy’s Retail Holdings, Inc. (Multiline Retail) |
5.900% | 12/01/2016 | 42,000 | 49,380 | ||||||||||||||
|
|
|
|||||||||||||||||
| 607,774 | ||||||||||||||||||
|
|
|
|||||||||||||||||
| CONSUMER STAPLES – 1.7% |
||||||||||||||||||
| Anheuser-Busch Cos., Inc. (Beverages) |
5.500% | 01/15/2018 | 150,000 | 179,958 | ||||||||||||||
| CVS Caremark Corp. (Food & Staples Retailing) |
5.750% | 06/01/2017 | 73,000 | 87,336 | ||||||||||||||
| Bunge NA Finance LP (Food Products) |
5.900% | 04/01/2017 | 150,000 | 170,417 | ||||||||||||||
| Procter & Gamble Co. / The (Household Products) |
4.700% | 02/15/2019 | 100,000 | 118,217 | ||||||||||||||
|
|
|
|||||||||||||||||
| 555,928 | ||||||||||||||||||
|
|
|
|||||||||||||||||
| ENERGY – 2.7% |
||||||||||||||||||
| Weatherford International Ltd. (Energy Equip. & Svs.) |
6.000% | 03/15/2018 | 150,000 | 171,517 | ||||||||||||||
| Anadarko Petroleum Corp. (Oil, Gas & Consumable Fuels) |
5.950% | 09/15/2016 | 100,000 | 115,179 | ||||||||||||||
| Boardwalk Pipelines LP (Oil, Gas & Consumable Fuels) |
5.500% | 02/01/2017 | 100,000 | 110,541 | ||||||||||||||
| Enterprise Products Operating LLC (Oil, Gas & Consumable Fuels) |
5.000% | 03/01/2015 | 75,000 | 81,180 | ||||||||||||||
| Kinder Morgan Energy Partners LP (Oil, Gas & Consumable Fuels) |
4.150% | 03/01/2022 | 75,000 | 81,330 | ||||||||||||||
| Magellan Midstream Partners LP (Oil, Gas & Consumable Fuels) |
6.400% | 07/15/2018 | 150,000 | 183,712 | ||||||||||||||
| Murphy Oil Corp. (Oil, Gas & Consumable Fuels) |
4.000% | 06/01/2022 | 75,000 | 75,660 | ||||||||||||||
| TransCanada PipeLines Ltd. (Oil, Gas & Consumable Fuels) |
2.500% | 08/01/2022 | 75,000 | 75,222 | ||||||||||||||
|
|
|
|||||||||||||||||
| 894,341 | ||||||||||||||||||
|
|
|
|||||||||||||||||
| FINANCIALS – 5.9% |
||||||||||||||||||
| Jefferies Group, Inc. (Capital Markets) |
5.875% | 06/08/2014 | 75,000 | 79,312 | ||||||||||||||
| Mellon Funding Corp. (Capital Markets) |
5.500% | 11/15/2018 | 100,000 | 117,531 | ||||||||||||||
| Morgan Stanley (Capital Markets) |
4.750% | 04/01/2014 | 100,000 | 103,579 | ||||||||||||||
| BB&T Corp. (Commercial Banks) |
5.200% | 12/23/2015 | 100,000 | 111,554 | ||||||||||||||
| Deutsche Bank Capital Funding Trust VII (Commercial Banks) |
(b)(c) | 5.628% | Perpetual | 100,000 | 96,000 | |||||||||||||
| KeyBank NA (Commercial Banks) |
5.700% | 11/01/2017 | 150,000 | 169,517 | ||||||||||||||
| PNC Funding Corp. (Commercial Banks) |
5.250% | 11/15/2015 | 75,000 | 83,851 | ||||||||||||||
| Wells Fargo & Co. (Commercial Banks) |
3.500% | 03/08/2022 | 75,000 | 80,068 | ||||||||||||||
| Capital One Bank U.S.A. NA (Consumer Finance) |
5.125% | 02/15/2014 | 100,000 | 104,940 | ||||||||||||||
| Discover Financial Services (Consumer Finance) |
6.450% | 06/12/2017 | 150,000 | 175,523 | ||||||||||||||
| Bank of America Corp. (Diversified Financial Svs.) |
5.750% | 08/15/2016 | 75,000 | 82,061 | ||||||||||||||
| Citigroup, Inc. (Diversified Financial Svs.) |
5.850% | 08/02/2016 | 75,000 | 85,769 | ||||||||||||||
| General Electric Capital Corp. (Diversified Financial Svs.) |
5.000% | 01/08/2016 | 100,000 | 111,155 | ||||||||||||||
| JPMorgan Chase & Co. (Diversified Financial Svs.) |
5.150% | 10/01/2015 | 100,000 | 109,977 | ||||||||||||||
| Assurant, Inc. (Insurance) |
5.625% | 02/15/2014 | 100,000 | 104,362 | ||||||||||||||
| Liberty Mutual Group, Inc. (Insurance) |
(b) | 5.750% | 03/15/2014 | 100,000 | 104,756 | |||||||||||||
| Federal Realty Investment Trust (Real Estate Investment Trusts) |
3.000% | 08/01/2022 | 75,000 | 74,308 | ||||||||||||||
| HCP, Inc. (Real Estate Investment Trusts) |
6.000% | 01/30/2017 | 150,000 | 172,420 | ||||||||||||||
|
|
|
|||||||||||||||||
| 1,966,683 | ||||||||||||||||||
|
|
|
|||||||||||||||||
| HEALTH CARE – 1.5% |
||||||||||||||||||
| Laboratory Corp. of America Holdings (Health Care Providers & Svs.) |
3.750% | 08/23/2022 | 75,000 | 79,604 | ||||||||||||||
| WellPoint, Inc. (Health Care Providers & Svs.) |
5.875% | 06/15/2017 | 150,000 | 178,154 | ||||||||||||||
| AbbVie, Inc. (Pharmaceuticals) |
(b) | 2.900% | 11/06/2022 | 75,000 | 76,450 | |||||||||||||
| Hospira, Inc. (Pharmaceuticals) |
6.050% | 03/30/2017 | 150,000 | 174,257 | ||||||||||||||
|
|
|
|||||||||||||||||
| 508,465 | ||||||||||||||||||
|
|
|
|||||||||||||||||
| INDUSTRIALS – 1.6% |
||||||||||||||||||
| Waste Management, Inc. (Commercial Svs. & Supplies) |
6.100% | 03/15/2018 | 75,000 | 90,570 | ||||||||||||||
| CSX Corp. (Road & Rail) |
5.600% | 05/01/2017 | 150,000 | 175,337 | ||||||||||||||
| ERAC U.S.A. Finance LLC (Road & Rail) |
(b) | 6.375% | 10/15/2017 | 150,000 | 181,550 | |||||||||||||
| 19 | (continued) |
| Ohio National Fund, Inc. | Omni Portfolio (Continued) |
| Schedule of Investments |
December 31, 2012 |
| Corporate Bonds (Continued) | Rate | Maturity | Face Amount | Value | ||||||||||||||
| INDUSTRIALS (continued) |
||||||||||||||||||
| Norfolk Southern Corp. (Road & Rail) |
3.000% | 04/01/2022 | $ | 75,000 | $ | 76,997 | ||||||||||||
|
|
|
|||||||||||||||||
| 524,454 | ||||||||||||||||||
|
|
|
|||||||||||||||||
| INFORMATION TECHNOLOGY – 0.5% |
||||||||||||||||||
| Computer Sciences Corp. (IT Svs.) |
6.500% | 03/15/2018 | 150,000 | 175,103 | ||||||||||||||
|
|
|
|||||||||||||||||
| MATERIALS – 0.7% |
||||||||||||||||||
| Freeport-McMoRan Copper & Gold, Inc. (Metals & Mining) |
3.550% | 03/01/2022 | 75,000 | 74,447 | ||||||||||||||
| Newmont Mining Corp. (Metals & Mining) |
3.500% | 03/15/2022 | 75,000 | 77,418 | ||||||||||||||
| Teck Resources Ltd. (Metals & Mining) |
3.750% | 02/01/2023 | 75,000 | 76,997 | ||||||||||||||
|
|
|
|||||||||||||||||
| 228,862 | ||||||||||||||||||
|
|
|
|||||||||||||||||
| TELECOMMUNICATION SERVICES – 1.6% |
||||||||||||||||||
| AT&T, Inc. (Diversified Telecom. Svs.) |
3.000% | 02/15/2022 | 75,000 | 78,070 | ||||||||||||||
| Telecom Italia Capital SA (Diversified Telecom. Svs.) |
5.250% | 10/01/2015 | 100,000 | 106,650 | ||||||||||||||
| Verizon Communications, Inc. (Diversified Telecom. Svs.) |
3.850% | 11/01/2042 | 75,000 | 73,845 | ||||||||||||||
| America Movil SAB de CV (Wireless Telecom. Svs.) |
5.750% | 01/15/2015 | 100,000 | 110,241 | ||||||||||||||
| Rogers Communications, Inc. (Wireless Telecom. Svs.) |
5.500% | 03/15/2014 | 150,000 | 158,725 | ||||||||||||||
|
|
|
|||||||||||||||||
| 527,531 | ||||||||||||||||||
|
|
|
|||||||||||||||||
| UTILITIES – 4.1% |
||||||||||||||||||
| Commonwealth Edison Co. (Electric Utilities) |
5.950% | 08/15/2016 | 75,000 | 87,458 | ||||||||||||||
| Kansas City Power & Light Co. (Electric Utilities) |
5.850% | 06/15/2017 | 150,000 | 174,824 | ||||||||||||||
| Nevada Power Co. (Electric Utilities) |
5.950% | 03/15/2016 | 75,000 | 86,025 | ||||||||||||||
| Pennsylvania Electric Co. (Electric Utilities) |
6.050% | 09/01/2017 | 150,000 | 175,816 | ||||||||||||||
| South Carolina Electric & Gas Co. (Electric Utilities) |
4.350% | 02/01/2042 | 75,000 | 79,246 | ||||||||||||||
| Union Electric Co. (Electric Utilities) |
6.400% | 06/15/2017 | 150,000 | 183,342 | ||||||||||||||
| Westar Energy, Inc. (Electric Utilities) |
4.125% | 03/01/2042 | 75,000 | 78,349 | ||||||||||||||
| Southwest Gas Corp. (Gas Utilities) |
3.875% | 04/01/2022 | 75,000 | 82,847 | ||||||||||||||
| Spectra Energy Capital LLC (Gas Utilities) |
5.500% | 03/01/2014 | 100,000 | 105,221 | ||||||||||||||
| Southern Power Co. (Ind. Power Prod. & Energy Traders) |
4.875% | 07/15/2015 | 100,000 | 109,593 | ||||||||||||||
| American Water Capital Corp. (Water Utilities) |
6.085% | 10/15/2017 | 150,000 | 179,411 | ||||||||||||||
|
|
|
|||||||||||||||||
| 1,342,132 | ||||||||||||||||||
|
|
|
|||||||||||||||||
| Total Corporate Bonds (Cost $6,577,552) |
$ | 7,331,273 | ||||||||||||||||
|
|
|
|||||||||||||||||
| U.S. Treasury Obligations – 1.3% | Rate | Maturity | Face Amount | Value | ||||||||||||||
| United States Treasury Note |
3.375% | 11/15/2019 | $ | 300,000 | $ | 344,602 | ||||||||||||
| United States Treasury Note |
1.625% | 08/15/2022 | 100,000 | 99,250 | ||||||||||||||
|
|
|
|||||||||||||||||
| Total U.S. Treasury Obligations (Cost $409,565) |
$ | 443,852 | ||||||||||||||||
|
|
|
|||||||||||||||||
| Money Market Funds – 3.4% | Shares | Value | ||||||||||||||||
| Fidelity Institutional Money Market Funds |
1,118,000 | $ | 1,118,000 | |||||||||||||||
|
|
|
|||||||||||||||||
| Total Money Market Funds (Cost $1,118,000) |
$ | 1,118,000 | ||||||||||||||||
|
|
|
|||||||||||||||||
| Total Investments – 99.3% (Cost $30,999,122) |
(d) | $ | 32,980,676 | |||||||||||||||
| Other Assets in Excess of Liabilities – 0.7% |
224,013 | |||||||||||||||||
|
|
|
|||||||||||||||||
| Net Assets – 100.0% |
$ | 33,204,689 | ||||||||||||||||
|
|
|
|||||||||||||||||
Percentages are stated as a percent of net assets.
Abbreviations:
ADR: American Depositary Receipts
Footnotes:
| (a) | Non-income producing security. |
| (b) | Security exempt from registration under Regulation D of the Securities Act of 1933. These securities may be resold in transactions exempt from registration, normally to qualified buyers under Rule 144A. At December 31, 2012, the value of these securities totaled $458,756, or 1.4% of the Portfolio’s net assets. These securities were deemed liquid pursuant to procedures approved by the Board of Directors. |
| (c) | Fixed-to-floating rate, callable, perpetual life trust preferred security. Interest rates stated are those in effect at December 31, 2012. |
| (d) | Represents cost for financial reporting purposes, which may differ from cost basis for federal income tax purposes. See also Note 7 of the Notes to Financial Statements. |
The accompanying notes are an integral part of these financial statements.
| 20 |
| Ohio National Fund, Inc. | International Portfolio |
| 21 | (continued) |
| Ohio National Fund, Inc. | International Portfolio (Continued) |
| 22 | (continued) |
| Ohio National Fund, Inc. | International Portfolio (Continued) |
| (1) | Composition of Portfolio subject to change. |
| (2) | Short-term investments have been excluded from the list of Top 10 Portfolio Holdings. |
| (3) | Top 10 Country Weightings (combined): |
| % of Net Assets | ||||
| Germany |
20.7 | |||
| Japan |
12.0 | |||
| South Korea |
11.4 | |||
| Norway |
11.2 | |||
| Mexico |
10.5 | |||
| Brazil |
9.2 | |||
| Denmark |
7.3 | |||
| China |
6.0 | |||
| United Kingdom |
3.9 | |||
| Hong Kong |
2.9 |
| 23 |
| Ohio National Fund, Inc. | International Portfolio |
| Schedule of Investments |
December 31, 2012 |
| 24 | (continued) |
| Ohio National Fund, Inc. | International Portfolio (Continued) |
| Schedule of Investments |
December 31, 2012 |
Percentages are stated as a percent of net assets.
Abbreviations:
ADR: American Depositary Receipts
Footnotes:
| (a) | Non-Income producing security. |
| (b) | Security traded on a foreign exchange has been valued at an estimate of fair value that is different than the local market close price. These fair value estimates are determined by an independent fair valuation service that has been approved by the Board. These securities represent $127,832,331, or 70.9% of the Portfolio’s net assets. |
| (c) | As discussed in Note 2 of the Notes to Financial Statements, not all investments that are traded on a foreign exchange are valued at an estimate that is different from the local close price. In some instances, the independent fair valuation service uses a stock’s local close price because the service’s measure of predictability related to their valuation model of a stock is below a chosen threshold. These securities represent $715,630, or 0.4% of the Portfolio’s net assets. |
Other Portfolio securities are not subjected to fair valuation procedures because they are traded on domestic or foreign exchanges that have close times that are consistent with the U.S. market close, normally 4:00 pm Eastern Time.
| (d) | Security is fully or partially pledged as collateral for the Portfolio’s futures contracts outstanding at December 31, 2012. See also Note 6 of the Notes to Financial Statements. |
| (e) | Represents cost for financial reporting purposes, which may differ from cost basis for federal income tax purposes. See also Note 7 of the Notes to Financial Statements. |
Sector Classifications (Common and preferred stocks): (Percent of net assets)
| Financials |
17.0 | % | ||
| Consumer Discretionary |
15.1 | % | ||
| Materials |
13.0 | % | ||
| Industrials |
11.4 | % | ||
| Energy |
10.3 | % | ||
| Information Technology |
8.4 | % | ||
| Consumer Staples |
8.1 | % | ||
| Health Care |
7.4 | % | ||
| Telecommunication Services |
4.1 | % | ||
| Utilities |
1.9 | % | ||
|
|
|
|||
| 96.7 | % | |||
|
|
|
The accompanying notes are an integral part of these financial statements.
| 25 |
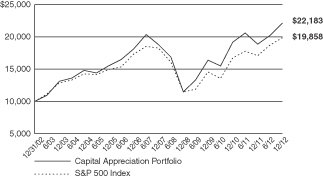
| Ohio National Fund, Inc. | Capital Appreciation Portfolio |
| 26 | (continued) |
| Ohio National Fund, Inc. | Capital Appreciation Portfolio (Continued) |
| 27 | (continued) |
| Ohio National Fund, Inc. | Capital Appreciation Portfolio (Continued) |
| (1) | Composition of Portfolio subject to change. |
| (2) | Short-term investments have been excluded from the list of Top 10 Portfolio Holdings. |
| (3) | Sectors: |
| % of Net Assets | ||||
| Consumer Discretionary |
20.2 | |||
| Information Technology |
14.5 | |||
| Energy |
11.9 | |||
| Financials |
11.3 | |||
| Industrials |
11.0 | |||
| Health Care |
10.8 | |||
| Consumer Staples |
7.7 | |||
| Materials |
4.9 | |||
| Utilities |
1.8 | |||
| Telecommunication Services |
1.7 | |||
|
|
|
|||
| 95.8 | ||||
|
|
|
| 28 |
| Ohio National Fund, Inc. | Capital Appreciation Portfolio |
| Schedule of Investments |
December 31, 2012 |
| 29 | (continued) |
| Ohio National Fund, Inc. | Capital Appreciation Portfolio (Continued) |
| Schedule of Investments |
December 31, 2012 |
Percentages are stated as a percent of net assets.
Abbreviations:
ADR: American Depositary Receipts
Footnotes:
| (a) | Non-income producing security. |
| (b) | Security traded on a foreign exchange has been valued at an estimate of fair value that is different than the local market close price. These fair value estimates are determined by an independent fair valuation service that has been approved by the Board. These securities represent $3,476,725, or 3.0% of the Portfolio’s net assets. Other Portfolio securities are not subjected to fair valuation procedures because they are traded on domestic or foreign exchanges that have close times that are consistent with the U.S. market close, normally 4:00 pm Eastern Time. |
| (c) | Represents cost for financial reporting purposes, which may differ from cost basis for federal income tax purposes. See also Note 7 of the Notes to Financial Statements. |
The accompanying notes are an integral part of these financial statements.
| 30 |
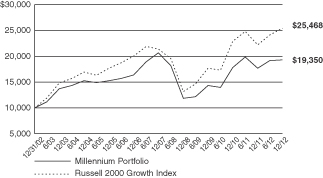
| Ohio National Fund, Inc. | Millennium Portfolio |
| 31 | (continued) |
| Ohio National Fund, Inc. | Millennium Portfolio (Continued) |
| (1) | Composition of Portfolio subject to change. |
| (2) | Short-term investments have been excluded from the list of Top 10 Portfolio Holdings. |
| (3) | Sectors: |
| % of Net Assets | ||||
| Information Technology |
25.5 | |||
| Health Care |
19.0 | |||
| Consumer Discretionary |
18.5 | |||
| Industrials |
15.8 | |||
| Financials |
6.9 | |||
| Energy |
5.3 | |||
| Consumer Staples |
4.2 | |||
| Materials |
3.6 | |||
|
|
|
|||
| 98.8 | ||||
|
|
|
| 32 |
| Ohio National Fund, Inc. | Millennium Portfolio |
| Schedule of Investments |
December 31, 2012 |
Percentages are stated as a percent of net assets.
Footnotes:
| (a) | Non-income producing security. |
| (b) | Represents cost for financial reporting purposes, which may differ from cost basis for federal income tax purposes. See also Note 7 of the Notes to Financial Statements. |
The accompanying notes are an integral part of these financial statements.
| 33 |
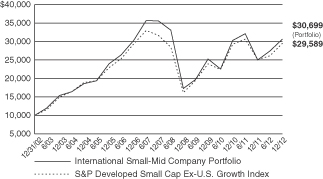
| Ohio National Fund, Inc. | International Small-Mid Company Portfolio |
| 34 | (continued) |
| Ohio National Fund, Inc. | International Small-Mid Company Portfolio (Continued) |
| (1) | Composition of Portfolio subject to change. |
| (2) | Short-term investments have been excluded from the list of Top 10 Portfolio Holdings. |
| (3) | Top 10 Country Weightings: |
| % of Net Assets | ||||
| United Kingdom |
19.3 | |||
| France |
9.3 | |||
| Japan |
9.1 | |||
| Canada |
7.1 | |||
| Germany |
7.0 | |||
| Singapore |
5.1 | |||
| Mexico |
4.1 | |||
| Sweden |
3.7 | |||
| United States |
3.0 | |||
| China |
2.5 |
| 35 |
| Ohio National Fund, Inc. | International Small-Mid Company Portfolio |
| Schedule of Investments |
December 31, 2012 |
| 36 | (continued) |
| Ohio National Fund, Inc. | International Small-Mid Company Portfolio (Continued) |
| Schedule of Investments |
December 31, 2012 |
Percentages are stated as a percent of net assets.
Abbreviations:
ADR: American Depositary Receipts
Footnotes:
| (a) | Non-Income producing security. |
| (b) | Security traded on a foreign exchange has been valued at an estimate of fair value that is different than the local market close price. These fair value estimates are determined by an independent fair valuation service that has been approved by the Board. These securities represent $46,204,976, or 71.7% of the Portfolio’s net assets. |
| (c) | As discussed in Note 2 of the Notes to Financial Statements, not all investments that are traded on a foreign exchange are valued at an estimate that is different from the local close price. In some instances, the independent fair valuation service uses a stock’s local close price because the service’s measure of predictability related to their valuation model of a stock is below a chosen threshold. These securities represent $296,368, or 0.5% of the Portfolio’s net assets. |
Other Portfolio securities are not subjected to fair valuation procedures because they are traded on domestic or foreign exchanges that have close times that are consistent with the U.S. market close, normally 4:00 pm Eastern Time.
| (d) | Represents cost for financial reporting purposes, which may differ from cost basis for federal income tax purposes. See also Note 7 of the Notes to Financial Statements. |
Sector Classifications (Common stocks): (Percent of net assets)
| Consumer Discretionary |
26.9% | |||
| Industrials |
22.9% | |||
| Materials |
12.2% | |||
| Energy |
9.9% | |||
| Financials |
7.5% | |||
| Health Care |
7.2% | |||
| Information Technology |
5.4% | |||
| Consumer Staples |
2.9% | |||
|
|
|
|||
| 94.9% | ||||
|
|
|
The accompanying notes are an integral part of these financial statements.
| 37 |
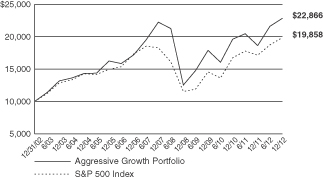
| Ohio National Fund, Inc. | Aggressive Growth Portfolio |
| 38 | (continued) |
| Ohio National Fund, Inc. | Aggressive Growth Portfolio (Continued) |
| 39 |
| Ohio National Fund, Inc. | Aggressive Growth Portfolio |
| Schedule of Investments |
December 31, 2012 |
Percentages are stated as a percent of net assets.
Footnotes:
| (a) | Non-income producing security. |
| (b) | Security traded on a foreign exchange has been valued at an estimate of fair value that is different than the local market close price. These fair value estimates are determined by an independent fair valuation service that has been approved by the Board. These securities represent $4,995,733, or 15.1% of the Portfolio’s net assets. |
| (c) | As discussed in Note 2 of the Notes to Financial Statements, not all investments that are traded on a foreign exchange are valued at an estimate that is different from the local close price. In some instances, the independent fair valuation service uses a stock’s local close price because the service’s measure of predictability related to the valuation model of a stock is below a chosen threshold. These securities represent $158,321, or 0.5% of the Portfolio’s net assets. |
Other Portfolio securities are not subjected to fair value procedures because they are traded on domestic or foreign exchanges that have close times that are consistent with the U.S. market close, normally 4:00 pm Eastern Time.
| (d) | A VVPR Strip is a coupon attached to specific ordinary common shares that offers tax advantages. The coupon entitles a holder to reduced withholding tax rates on the dividends generated from the related common shares. |
| (e) | Represents cost for financial reporting purposes, which may differ from cost basis for federal income tax purposes. See also Note 7 of the Notes to Financial Statements. |
The accompanying notes are an integral part of these financial statements.
| 40 |
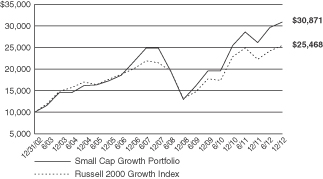
| Ohio National Fund, Inc. | Small Cap Growth Portfolio |
| 41 | (continued) |
| Ohio National Fund, Inc. | Small Cap Growth Portfolio (Continued) |
| 42 |
| Ohio National Fund, Inc. | Small Cap Growth Portfolio |
| Schedule of Investments |
December 31, 2012 |
Percentages are stated as a percent of net assets.
Footnotes:
| (a) | Non-income producing security. |
| (b) | Represents cost for financial reporting purposes, which may differ from cost basis for federal income tax purposes. See also Note 7 of the Notes to Financial Statements. |
| 43 |
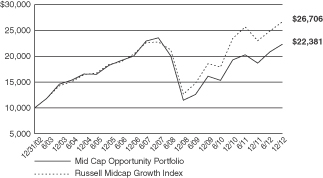
| Ohio National Fund, Inc. | Mid Cap Opportunity Portfolio |
| 44 | (continued) |
| Ohio National Fund, Inc. | Mid Cap Opportunity Portfolio (Continued) |
| (1) | Composition of Portfolio subject to change. |
| (2) | Short-term investments have been excluded from the list of Top 10 Portfolio Holdings. |
| (3) | Sectors: |
| % of Net Assets | ||||
| Information Technology |
22.6 | |||
| Consumer Discretionary |
21.5 | |||
| Health Care |
12.8 | |||
| Financials |
12.6 | |||
| Industrials |
8.1 | |||
| Telecommunication Services |
6.9 | |||
| Consumer Staples |
5.6 | |||
| Materials |
4.8 | |||
| Energy |
4.6 | |||
|
|
|
|||
| 99.5 | ||||
|
|
|
| 45 |
| Ohio National Fund, Inc. | Mid Cap Opportunity Portfolio |
| Schedule of Investments |
December 31, 2012 |
| 46 | (continued) |
| Ohio National Fund, Inc. | Mid Cap Opportunity Portfolio (Continued) |
| Schedule of Investments |
December 31, 2012 |
Percentages are stated as a percent of net assets.
Abbreviations:
ADR: American Depositary Receipts
Footnotes:
| (a) | Non-income producing security. |
| (b) | Represents cost for financial reporting purposes, which may differ from cost basis for federal income tax purposes. See also Note 7 of the Notes to Financial Statements. |
The accompanying notes are an integral part of these financial statements.
| 47 |
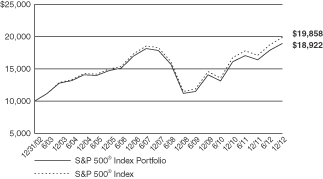
| Ohio National Fund, Inc. | S&P 500® Index Portfolio |
| 48 | (continued) |
| Ohio National Fund, Inc. | S&P 500® Index Portfolio (Continued) |
| (1) | Composition of Portfolio subject to change. |
| (2) | Short-term investments have been excluded from the list of Top 10 Portfolio Holdings. |
| (3) | Sectors: |
| % of Net Assets | ||||
| Information Technology |
18.3 | |||
| Financials |
15.0 | |||
| Health Care |
11.6 | |||
| Consumer Discretionary |
11.1 | |||
| Energy |
10.6 | |||
| Consumer Staples |
10.2 | |||
| Industrials |
9.7 | |||
| Materials |
3.5 | |||
| Utilities |
3.3 | |||
| Telecommunication Services |
2.9 | |||
|
|
|
|||
| 96.2 | ||||
|
|
|
| 49 |
| Ohio National Fund, Inc. | S&P 500® Index Portfolio |
| Schedule of Investments |
December 31, 2012 |
| 50 | (continued) |
| Ohio National Fund, Inc. | S&P 500® Index Portfolio (Continued) |
| Schedule of Investments |
December 31, 2012 |
| 51 | (continued) |
| Ohio National Fund, Inc. | S&P 500® Index Portfolio (Continued) |
| Schedule of Investments |
December 31, 2012 |
| 52 | (continued) |
| Ohio National Fund, Inc. | S&P 500® Index Portfolio (Continued) |
| Schedule of Investments |
December 31, 2012 |
| 53 | (continued) |
| Ohio National Fund, Inc. | S&P 500® Index Portfolio (Continued) |
| Schedule of Investments |
December 31, 2012 |
Percentages are stated as a percent of net assets.
Footnotes:
| (a) | Non-income producing security. |
| (b) | Represents cost for financial reporting purposes, which may differ from cost basis for federal income tax purposes. See also Note 7 of the Notes to Financial Statements. |
The accompanying notes are an integral part of these financial statements.
| 54 |
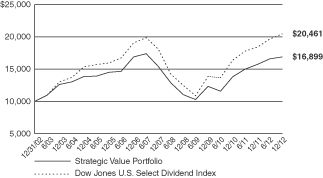
| Ohio National Fund, Inc. | Strategic Value Portfolio |
| 55 | (continued) |
| Ohio National Fund, Inc. | Strategic Value Portfolio (Continued) |
| (1) | Composition of Portfolio subject to change. |
| (2) | Short-term investments have been excluded from the list of Top 10 Portfolio Holdings. |
| (3) | Sectors: |
| % of Net Assets | ||||
| Consumer Staples |
26.0 | |||
| Health Care |
19.4 | |||
| Utilities |
19.3 | |||
| Telecommunication Services |
16.9 | |||
| Energy |
12.5 | |||
| Consumer Discretionary |
2.3 | |||
|
|
|
|||
| 96.4 | ||||
|
|
|
| 56 |
| Ohio National Fund, Inc. | Strategic Value Portfolio |
| Schedule of Investments |
December 31, 2012 |
Percentages are stated as a percent of net assets.
Abbreviations:
ADR: American Depositary Receipts
Footnotes:
| (a) | Security traded on a foreign exchange has been valued at an estimate of fair value that is different than the local market close price. These fair value estimates are determined by an independent fair valuation service that has been approved by the Board. These securities represent $64,896,335, or 24.2% of the Portfolio’s net assets. |
Other Portfolio securities are not subjected to fair value procedures because they are traded on domestic or foreign exchanges that have close times that are consistent with the U.S. market close, normally 4:00 pm Eastern Time.
| (b) | Represents cost for financial reporting purposes, which may differ from cost basis for federal income tax purposes. See also Note 7 of the Notes to Financial Statements. |
The accompanying notes are an integral part of these financial statements.
| 57 |
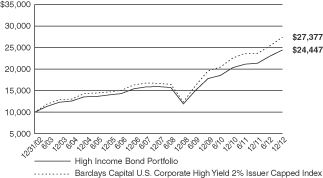
| Ohio National Fund, Inc. | High Income Bond Portfolio |
| 58 | (continued) |
| Ohio National Fund, Inc. | High Income Bond Portfolio (Continued) |
| (1) | Composition of Portfolio subject to change. |
| (2) | Short-term investments have been excluded from the list of Top 10 Portfolio Holdings. |
| (3) | Sectors (combined): |
| % of Net Assets | ||||
| Consumer Discretionary |
28.2 | |||
| Industrials |
12.1 | |||
| Energy |
11.8 | |||
| Information Technology |
10.6 | |||
| Health Care |
10.6 | |||
| Materials |
7.6 | |||
| Financials |
5.2 | |||
| Telecommunication Services |
5.2 | |||
| Consumer Staples |
5.2 | |||
| Utilities |
1.8 | |||
|
|
|
|||
| 98.3 | ||||
|
|
|
| 59 |
| Ohio National Fund, Inc. | High Income Bond Portfolio |
| Schedule of Investments |
December 31, 2012 |
| Corporate Bonds – 98.2% | Rate | Maturity | Face Amount | Value | ||||||||||||
| CONSUMER DISCRETIONARY – 28.2% |
||||||||||||||||
| Allison Transmission, Inc. (Auto Components) |
(b) | 7.125% | 05/15/2019 | $ | 600,000 | $ | 643,500 | |||||||||
| American Axle & Manufacturing, Inc. (Auto Components) |
7.750% | 11/15/2019 | 625,000 | 681,250 | ||||||||||||
| American Axle & Manufacturing, Inc. (Auto Components) |
6.625% | 10/15/2022 | 700,000 | 714,000 | ||||||||||||
| American Tire Distributors, Inc. (Auto Components) |
9.750% | 06/01/2017 | 175,000 | 186,375 | ||||||||||||
| Cooper-Standard Automotive, Inc. (Auto Components) |
8.500% | 05/01/2018 | 775,000 | 837,000 | ||||||||||||
| Exide Technologies (Auto Components) |
8.625% | 02/01/2018 | 1,400,000 | 1,193,500 | ||||||||||||
| IDQ Holdings, Inc. (Auto Components) |
(b) | 11.500% | 04/01/2017 | 600,000 | 649,500 | |||||||||||
| International Automotive Components Group SL (Auto Components) |
(b) | 9.125% | 06/01/2018 | 1,200,000 | 1,119,000 | |||||||||||
| J.B. Poindexter & Co., Inc. (Auto Components) |
(b) | 9.000% | 04/01/2022 | 825,000 | 856,969 | |||||||||||
| Pittsburgh Glass Works LLC (Auto Components) |
(b) | 8.500% | 04/15/2016 | 1,100,000 | 1,017,500 | |||||||||||
| Stoneridge, Inc. (Auto Components) |
(b) | 9.500% | 10/15/2017 | 725,000 | 775,750 | |||||||||||
| Tenneco, Inc. (Auto Components) |
7.750% | 08/15/2018 | 325,000 | 354,250 | ||||||||||||
| Tenneco, Inc. (Auto Components) |
6.875% | 12/15/2020 | 450,000 | 492,187 | ||||||||||||
| Tomkins LLC (Auto Components) |
9.000% | 10/01/2018 | 576,000 | 648,000 | ||||||||||||
| Tower Automotive Holdings U.S.A. LLC / T.A. Holdings Finance, Inc. (Auto Components) |
(b) | 10.625% | 09/01/2017 | 700,000 | 770,000 | |||||||||||
| UCI International, Inc. (Auto Components) |
8.625% | 02/15/2019 | 1,675,000 | 1,668,719 | ||||||||||||
| Chrysler Group LLC / CG Co-Issuer, Inc. (Automobiles) |
8.250% | 06/15/2021 | 850,000 | 939,250 | ||||||||||||
| Jaguar Land Rover PLC (Automobiles) |
(b) | 8.125% | 05/15/2021 | 1,150,000 | 1,270,750 | |||||||||||
| Affinia Group, Inc. (Distributors) |
(b) | 10.750% | 08/15/2016 | 245,000 | 266,131 | |||||||||||
| Affinia Group, Inc. (Distributors) |
9.000% | 11/30/2014 | 875,000 | 877,187 | ||||||||||||
| Knowledge Learning Corp. (Diversified Consumer Svs.) |
(b) | 7.750% | 02/01/2015 | 550,000 | 514,250 | |||||||||||
| Monitronics International, Inc. (Diversified Consumer Svs.) |
9.125% | 04/01/2020 | 650,000 | 672,750 | ||||||||||||
| ServiceMaster Co. (Diversified Consumer Svs.) |
7.100% | 03/01/2018 | 450,000 | 429,750 | ||||||||||||
| ServiceMaster Co. (Diversified Consumer Svs.) |
7.450% | 08/15/2027 | 175,000 | 142,625 | ||||||||||||
| ServiceMaster Co. (Diversified Consumer Svs.) |
8.000% | 02/15/2020 | 675,000 | 707,062 | ||||||||||||
| ServiceMaster Co. (Diversified Consumer Svs.) |
(b) | 7.000% | 08/15/2020 | 1,000,000 | 1,007,500 | |||||||||||
| Affinity Gaming LLC / Affinity Gaming Finance Corp. (Hotels, Restaurants & Leisure) |
(b) | 9.000% | 05/15/2018 | 975,000 | 1,023,750 | |||||||||||
| American Casino & Entertainment Properties LLC Corp. (Hotels, Restaurants & Leisure) |
11.000% | 06/15/2014 | 900,000 | 929,250 | ||||||||||||
| Ameristar Casinos, Inc. (Hotels, Restaurants & Leisure) |
7.500% | 04/15/2021 | 550,000 | 598,812 | ||||||||||||
| Caesars Entertainment Operating Co., Inc. (Hotels, Restaurants & Leisure) |
11.250% | 06/01/2017 | 1,575,000 | 1,695,094 | ||||||||||||
| Caesars Entertainment Operating Co., Inc. (Hotels, Restaurants & Leisure) |
8.500% | 02/15/2020 | 150,000 | 149,344 | ||||||||||||
| Carlson Wagonlit BV (Hotels, Restaurants & Leisure) |
(b) | 6.875% | 06/15/2019 | 875,000 | 927,500 | |||||||||||
| Cedar Fair LP / Canada’s Wonderland Co. / Magnum Management Corp. (Hotels, Restaurants & Leisure) |
9.125% | 08/01/2018 | 775,000 | 875,750 | ||||||||||||
| Chester Downs & Marina LLC (Hotels, Restaurants & Leisure) |
(b) | 9.250% | 02/01/2020 | 550,000 | 543,125 | |||||||||||
| Choice Hotels International, Inc. (Hotels, Restaurants & Leisure) |
5.750% | 07/01/2022 | 275,000 | 305,937 | ||||||||||||
| DineEquity, Inc. (Hotels, Restaurants & Leisure) |
9.500% | 10/30/2018 | 1,575,000 | 1,797,469 | ||||||||||||
| MGM Resorts International (Hotels, Restaurants & Leisure) |
7.500% | 06/01/2016 | 900,000 | 969,750 | ||||||||||||
| MGM Resorts International (Hotels, Restaurants & Leisure) |
(b) | 8.625% | 02/01/2019 | 600,000 | 672,000 | |||||||||||
| MGM Resorts International (Hotels, Restaurants & Leisure) |
7.750% | 03/15/2022 | 525,000 | 564,375 | ||||||||||||
| MGM Resorts International (Hotels, Restaurants & Leisure) |
(b) | 6.750% | 10/01/2020 | 250,000 | 255,937 | |||||||||||
| NPC International, Inc. / NPC Operating Co. A, Inc. / NPC Operating Co. B, Inc. (Hotels, Restaurants & Leisure) |
10.500% | 01/15/2020 | 1,200,000 | 1,398,000 | ||||||||||||
| Rivers Pittsburgh Borrower LP / Rivers Pittsburgh Finance Corp. (Hotels, Restaurants & Leisure) |
(b) | 9.500% | 06/15/2019 | 700,000 | 763,000 | |||||||||||
| Royal Caribbean Cruises Ltd. (Hotels, Restaurants & Leisure) |
5.250% | 11/15/2022 | 325,000 | 345,312 | ||||||||||||
| Seminole Hard Rock Entertainment, Inc. (Hotels, Restaurants & Leisure) |
(b)(d) | 2.808% | 03/15/2014 | 1,075,000 | 1,072,312 | |||||||||||
| Seminole Indian Tribe of Florida (Hotels, Restaurants & Leisure) |
(b) | 7.804% | 10/01/2020 | 950,000 | 976,980 | |||||||||||
| Seminole Indian Tribe of Florida (Hotels, Restaurants & Leisure) |
(b) | 7.750% | 10/01/2017 | 150,000 | 162,937 | |||||||||||
| Six Flags Entertainment Corp. (Hotels, Restaurants & Leisure) |
(b) | 5.250% | 01/15/2021 | 800,000 | 802,000 | |||||||||||
| Sugarhouse HSP Gaming Prop. Mezz. LP / Sugarhouse HSP Gaming Finance Corp. (Hotels, Restaurants & Leisure) |
(b) | 8.625% | 04/15/2016 | 575,000 | 619,562 | |||||||||||
| Hillman Group, Inc. (Household Durables) |
10.875% | 06/01/2018 | 975,000 | 1,053,000 | ||||||||||||
| Hillman Group, Inc. (Household Durables) |
(b) | 10.875% | 05/31/2018 | 250,000 | 270,000 | |||||||||||
| Jarden Corp. (Household Durables) |
7.500% | 05/01/2017 | 750,000 | 848,437 | ||||||||||||
| Libbey Glass, Inc. (Household Durables) |
6.875% | 05/15/2020 | 900,000 | 972,000 | ||||||||||||
| Norcraft Cos. LP / Norcraft Finance Corp. (Household Durables) |
10.500% | 12/15/2015 | 1,275,000 | 1,290,937 | ||||||||||||
| Sealy Mattress Co. (Household Durables) |
8.250% | 06/15/2014 | 1,200,000 | 1,204,512 | ||||||||||||
| Sealy Mattress Co. (Household Durables) |
(b) | 10.875% | 04/15/2016 | 277,000 | 294,312 | |||||||||||
| Serta Simmons Holdings LLC (Household Durables) |
(b) | 8.125% | 10/01/2020 | 900,000 | 904,500 | |||||||||||
| Yankee Candle Co., Inc. (Household Durables) |
9.750% | 02/15/2017 | 1,725,000 | 1,800,486 | ||||||||||||
| YCC Holdings LLC / Yankee Finance, Inc. (Household Durables) |
(c) | 10.250% | 02/15/2016 | 700,000 | 726,320 | |||||||||||
| CDW LLC / CDW Finance Corp. (Internet & Catalog Retail) |
12.535% | 10/12/2017 | 345,000 | 370,444 | ||||||||||||
| CDW LLC / CDW Finance Corp. (Internet & Catalog Retail) |
8.500% | 04/01/2019 | 1,850,000 | 2,011,875 | ||||||||||||
| FGI Operating Co. LLC / FGI Finance, Inc. (Leisure Equip. & Products) |
(b) | 7.875% | 05/01/2020 | 1,000,000 | 1,035,000 | |||||||||||
| AMC Networks, Inc. (Media) |
7.750% | 07/15/2021 | 575,000 | 661,250 | ||||||||||||
| AMC Networks, Inc. (Media) |
4.750% | 12/15/2022 | 350,000 | 353,500 | ||||||||||||
| CCO Holdings LLC / CCO Holdings Capital Corp. (Media) |
8.125% | 04/30/2020 | 75,000 | 84,375 | ||||||||||||
| CCO Holdings LLC / CCO Holdings Capital Corp. (Media) |
7.875% | 04/30/2018 | 1,025,000 | 1,108,281 | ||||||||||||
| CCO Holdings LLC / CCO Holdings Capital Corp. (Media) |
7.000% | 01/15/2019 | 425,000 | 460,594 | ||||||||||||
| 60 | (continued) |
| Ohio National Fund, Inc. | High Income Bond Portfolio (Continued) |
| Schedule of Investments |
December 31, 2012 |
| Corporate Bonds (Continued) | Rate | Maturity | Face Amount | Value | ||||||||||||
| CONSUMER DISCRETIONARY (continued) |
||||||||||||||||
| CCO Holdings LLC / CCO Holdings Capital Corp. (Media) |
6.625% | 01/31/2022 | $ | 500,000 | $ | 548,750 | ||||||||||
| CCO Holdings LLC / CCO Holdings Capital Corp. (Media) |
5.125% | 02/15/2023 | 150,000 | 150,375 | ||||||||||||
| Cequel Communications Holdings I LLC / Cequel Capital Corp. (Media) |
(b) | 6.375% | 09/15/2020 | 350,000 | 366,187 | |||||||||||
| Cinemark U.S.A., Inc. (Media) |
8.625% | 06/15/2019 | 950,000 | 1,056,875 | ||||||||||||
| Cinemark U.S.A., Inc. (Media) |
7.375% | 06/15/2021 | 500,000 | 555,000 | ||||||||||||
| Clear Channel Communications, Inc. (Media) |
9.000% | 03/01/2021 | 1,550,000 | 1,391,125 | ||||||||||||
| Clear Channel Worldwide Holdings, Inc. (Media) |
7.625% | 03/15/2020 | 175,000 | 175,437 | ||||||||||||
| Clear Channel Worldwide Holdings, Inc. (Media) |
7.625% | 03/15/2020 | 1,200,000 | 1,215,000 | ||||||||||||
| Clear Channel Worldwide Holdings, Inc. (Media) |
(b) | 6.500% | 11/15/2022 | 275,000 | 283,937 | |||||||||||
| Clear Channel Worldwide Holdings, Inc. (Media) |
(b) | 6.500% | 11/15/2022 | 750,000 | 781,875 | |||||||||||
| Crown Media Holdings, Inc. (Media) |
10.500% | 07/15/2019 | 1,500,000 | 1,696,875 | ||||||||||||
| Cumulus Media Holdings, Inc. (Media) |
7.750% | 05/01/2019 | 1,025,000 | 1,012,187 | ||||||||||||
| DISH DBS Corp. (Media) |
5.875% | 07/15/2022 | 1,250,000 | 1,350,000 | ||||||||||||
| DISH DBS Corp. (Media) |
4.625% | 07/15/2017 | 200,000 | 209,500 | ||||||||||||
| Entercom Radio LLC (Media) |
10.500% | 12/01/2019 | 925,000 | 1,022,125 | ||||||||||||
| Entravision Communications Corp. (Media) |
8.750% | 08/01/2017 | 717,000 | 781,530 | ||||||||||||
| Igloo Holdings Corp. (Media) |
(b)(c) | 8.250% | 12/15/2017 | 800,000 | 794,000 | |||||||||||
| Intelsat Jackson Holdings, S.A. (Media) |
8.500% | 11/01/2019 | 675,000 | 757,687 | ||||||||||||
| Intelsat Jackson Holdings, S.A. (Media) |
7.500% | 04/01/2021 | 450,000 | 498,375 | ||||||||||||
| Intelsat Jackson Holdings, S.A. (Media) |
7.250% | 04/01/2019 | 550,000 | 594,000 | ||||||||||||
| Intelsat Jackson Holdings, S.A. (Media) |
(b) | 7.250% | 10/15/2020 | 150,000 | 163,500 | |||||||||||
| Intelsat Jackson Holdings, S.A. (Media) |
(b) | 6.625% | 12/15/2022 | 175,000 | 181,344 | |||||||||||
| Lamar Media Corp. (Media) |
5.875% | 02/01/2022 | 250,000 | 272,500 | ||||||||||||
| Lamar Media Corp. (Media) |
(b) | 5.000% | 05/01/2023 | 725,000 | 748,562 | |||||||||||
| Nexstar Broadcasting, Inc. / Mission Broadcasting, Inc. (Media) |
8.875% | 04/15/2017 | 550,000 | 606,375 | ||||||||||||
| Nielsen Finance LLC / Nielsen Finance Co. (Media) |
7.750% | 10/15/2018 | 550,000 | 617,375 | ||||||||||||
| Nielsen Finance LLC / Nielsen Finance Co. (Media) |
(b) | 4.500% | 10/01/2020 | 450,000 | 450,000 | |||||||||||
| Sirius XM Radio, Inc. (Media) |
(b) | 5.250% | 08/15/2022 | 1,025,000 | 1,040,375 | |||||||||||
| Sitel LLC / Sitel Finance Corp. (Media) |
11.500% | 04/01/2018 | 625,000 | 443,750 | ||||||||||||
| Townsquare Radio LLC / Townsquare Radio, Inc. (Media) |
(b) | 9.000% | 04/01/2019 | 725,000 | 799,312 | |||||||||||
| Virgin Media Finance PLC (Media) |
4.875% | 02/15/2022 | 575,000 | 590,812 | ||||||||||||
| Visant Corp. (Media) |
10.000% | 10/01/2017 | 1,775,000 | 1,601,937 | ||||||||||||
| XM Satellite Radio, Inc. (Media) |
(b) | 7.625% | 11/01/2018 | 475,000 | 532,000 | |||||||||||
| Academy Ltd. / Academy Finance Corp. (Specialty Retail) |
(b) | 9.250% | 08/01/2019 | 1,025,000 | 1,142,875 | |||||||||||
| Gymboree Corp. (Specialty Retail) |
9.125% | 12/01/2018 | 1,025,000 | 917,375 | ||||||||||||
| Jo-Ann Stores Holdings, Inc. (Specialty Retail) |
(b)(c) | 9.750% | 10/15/2019 | 850,000 | 861,687 | |||||||||||
| Jo-Ann Stores, Inc. (Specialty Retail) |
(b) | 8.125% | 03/15/2019 | 1,775,000 | 1,814,937 | |||||||||||
| Limited Brands, Inc. (Specialty Retail) |
5.625% | 02/15/2022 | 725,000 | 792,062 | ||||||||||||
| Michaels Stores, Inc. (Specialty Retail) |
7.750% | 11/01/2018 | 1,125,000 | 1,240,312 | ||||||||||||
| Michaels Stores, Inc. (Specialty Retail) |
(b) | 7.750% | 11/01/2018 | 150,000 | 165,375 | |||||||||||
| New Academy Finance Co. LLC / New Academy Finance Corp. (Specialty Retail) |
(b)(c) | 8.000% | 06/15/2018 | 450,000 | 457,875 | |||||||||||
| Party City Holdings, Inc. (Specialty Retail) |
(b) | 8.875% | 08/01/2020 | 375,000 | 404,062 | |||||||||||
| Penske Automotive Group, Inc. (Specialty Retail) |
(b) | 5.750% | 10/01/2022 | 300,000 | 310,500 | |||||||||||
| Petco Animal Supplies, Inc. (Specialty Retail) |
(b) | 9.250% | 12/01/2018 | 1,350,000 | 1,505,250 | |||||||||||
| Petco Holdings, Inc. (Specialty Retail) |
(b)(c) | 8.500% | 10/15/2017 | 1,225,000 | 1,264,812 | |||||||||||
| Sally Holdings LLC , Inc. (Specialty Retail) |
5.750% | 06/01/2022 | 125,000 | 136,250 | ||||||||||||
| Sally Holdings LLC , Inc. (Specialty Retail) |
6.875% | 11/15/2019 | 700,000 | 777,000 | ||||||||||||
| PVH Corp. (Textiles, Apparel & Luxury Goods) |
4.500% | 12/15/2022 | 200,000 | 203,000 | ||||||||||||
| Wolverine World Wide, Inc. (Textiles, Apparel & Luxury Goods) |
(b) | 6.125% | 10/15/2020 | 250,000 | 263,750 | |||||||||||
|
|
|
|||||||||||||||
| 87,878,578 | ||||||||||||||||
|
|
|
|||||||||||||||
| CONSUMER STAPLES – 5.2% |
||||||||||||||||
| Constellation Brands, Inc. (Beverages) |
6.000% | 05/01/2022 | 725,000 | 833,750 | ||||||||||||
| U.S. Foodservice (Food & Staples Retailing) |
(b) | 8.500% | 06/30/2019 | 2,450,000 | 2,511,250 | |||||||||||
| Darling International, Inc. (Food Products) |
8.500% | 12/15/2018 | 125,000 | 144,219 | ||||||||||||
| Dean Foods Co. (Food Products) |
7.000% | 06/01/2016 | 1,200,000 | 1,323,000 | ||||||||||||
| Dean Foods Co. (Food Products) |
9.750% | 12/15/2018 | 825,000 | 952,875 | ||||||||||||
| Del Monte Corp. (Food Products) |
7.625% | 02/15/2019 | 1,700,000 | 1,780,750 | ||||||||||||
| Michael Foods Group, Inc. (Food Products) |
9.750% | 07/15/2018 | 1,975,000 | 2,192,250 | ||||||||||||
| Michael Foods Holding, Inc. (Food Products) |
(b)(c) | 8.500% | 07/15/2018 | 650,000 | 664,625 | |||||||||||
| Pinnacle Foods Finance LLC / Pinnacle Foods Finance Corp. (Food Products) |
9.250% | 04/01/2015 | 662,000 | 675,240 | ||||||||||||
| Pinnacle Foods Finance LLC / Pinnacle Foods Finance Corp. (Food Products) |
8.250% | 09/01/2017 | 500,000 | 535,000 | ||||||||||||
| Shearer’s Foods LLC / Chip Finance Corp. (Food Products) |
(b) | 9.000% | 11/01/2019 | 550,000 | 578,875 | |||||||||||
| Smithfield Foods, Inc. (Food Products) |
6.625% | 08/15/2022 | 1,325,000 | 1,467,437 | ||||||||||||
| Spectrum Brands, Inc. (Household Products) |
9.500% | 06/15/2018 | 150,000 | 171,000 | ||||||||||||
| Spectrum Brands, Inc. (Household Products) |
(b) | 6.750% | 03/15/2020 | 1,150,000 | 1,236,250 | |||||||||||
| Prestige Brands, Inc. (Personal Products) |
8.250% | 04/01/2018 | 750,000 | 835,312 | ||||||||||||
| Prestige Brands, Inc. (Personal Products) |
8.125% | 02/01/2020 | 175,000 | 195,562 | ||||||||||||
|
|
|
|||||||||||||||
| 16,097,395 | ||||||||||||||||
|
|
|
|||||||||||||||
| 61 | (continued) |
| Ohio National Fund, Inc. | High Income Bond Portfolio (Continued) |
| Schedule of Investments |
December 31, 2012 |
| Corporate Bonds (Continued) | Rate | Maturity | Face Amount | Value | ||||||||||||
| ENERGY – 11.8% |
||||||||||||||||
| Basic Energy Services, Inc. (Energy Equip. & Svs.) |
7.750% | 02/15/2019 | $ | 425,000 | $ | 425,000 | ||||||||||
| Basic Energy Services, Inc. (Energy Equip. & Svs.) |
(b) | 7.750% | 10/15/2022 | 300,000 | 294,000 | |||||||||||
| Chaparral Energy, Inc. (Energy Equip. & Svs.) |
9.875% | 10/01/2020 | 1,075,000 | 1,228,187 | ||||||||||||
| Chaparral Energy, Inc. (Energy Equip. & Svs.) |
7.625% | 11/15/2022 | 125,000 | 131,875 | ||||||||||||
| Cie Generale de Geophysique – Veritas (Energy Equip. & Svs.) |
7.750% | 05/15/2017 | 1,100,000 | 1,149,500 | ||||||||||||
| Cie Generale de Geophysique – Veritas (Energy Equip. & Svs.) |
9.500% | 05/15/2016 | 400,000 | 431,000 | ||||||||||||
| Crosstex Energy LP / Crosstex Energy Finance Corp. (Energy Equip. & Svs.) |
8.875% | 02/15/2018 | 975,000 | 1,057,875 | ||||||||||||
| Drill Rigs Holdings, Inc. (Energy Equip. & Svs.) |
(b) | 6.500% | 10/01/2017 | 350,000 | 350,000 | |||||||||||
| Forbes Energy Services Ltd. (Energy Equip. & Svs.) |
9.000% | 06/15/2019 | 900,000 | 805,500 | ||||||||||||
| PHI, Inc. (Energy Equip. & Svs.) |
8.625% | 10/15/2018 | 850,000 | 913,750 | ||||||||||||
| SESI LLC (Energy Equip. & Svs.) |
6.375% | 05/01/2019 | 275,000 | 295,625 | ||||||||||||
| SESI LLC (Energy Equip. & Svs.) |
7.125% | 12/15/2021 | 250,000 | 279,375 | ||||||||||||
| Access Midstream Partners LP / ACMP Finance Corp. (Oil, Gas & Consumable Fuels) |
6.125% | 07/15/2022 | 525,000 | 568,312 | ||||||||||||
| Access Midstream Partners LP / ACMP Finance Corp. (Oil, Gas & Consumable Fuels) |
4.875% | 05/15/2023 | 900,000 | 914,625 | ||||||||||||
| Antero Resources Finance Corp. (Oil, Gas & Consumable Fuels) |
(b) | 6.000% | 12/01/2020 | 825,000 | 839,437 | |||||||||||
| ATP Oil & Gas Corp. (Acquired 04/19/2010 through 02/11/2011, Cost $727,229)(Oil, Gas & Consumable Fuels) |
(e) | 11.875% | 05/01/2015 | 775,000 | 89,125 | |||||||||||
| Berry Petroleum Co. (Oil, Gas & Consumable Fuels) |
6.750% | 11/01/2020 | 150,000 | 162,000 | ||||||||||||
| Berry Petroleum Co. (Oil, Gas & Consumable Fuels) |
6.375% | 09/15/2022 | 275,000 | 287,375 | ||||||||||||
| Chesapeake Energy Corp. (Oil, Gas & Consumable Fuels) |
6.875% | 11/15/2020 | 550,000 | 598,812 | ||||||||||||
| Chesapeake Energy Corp. (Oil, Gas & Consumable Fuels) |
6.875% | 08/15/2018 | 325,000 | 344,500 | ||||||||||||
| Chesapeake Energy Corp. (Oil, Gas & Consumable Fuels) |
6.775% | 03/15/2019 | 1,225,000 | 1,228,062 | ||||||||||||
| Chesapeake Oilfield Operating LLC / Chesapeake Oilfield Finance, Inc. (Oil, Gas & Consumable Fuels) |
(b) | 6.625% | 11/15/2019 | 700,000 | 663,250 | |||||||||||
| Coffeyville Resources LLC / Coffeyville Finance, Inc. (Oil, Gas & Consumable Fuels) |
(b) | 10.875% | 04/01/2017 | 375,000 | 414,375 | |||||||||||
| Comstock Resources, Inc. (Oil, Gas & Consumable Fuels) |
7.750% | 04/01/2019 | 300,000 | 306,000 | ||||||||||||
| Comstock Resources, Inc. (Oil, Gas & Consumable Fuels) |
9.500% | 06/15/2020 | 375,000 | 405,000 | ||||||||||||
| Concho Resources, Inc. (Oil, Gas & Consumable Fuels) |
7.000% | 01/15/2021 | 525,000 | 588,000 | ||||||||||||
| Concho Resources, Inc. (Oil, Gas & Consumable Fuels) |
5.500% | 04/01/2023 | 300,000 | 315,750 | ||||||||||||
| Copano Energy LLC / Copano Energy Finance Corp. (Oil, Gas & Consumable Fuels) |
7.125% | 04/01/2021 | 725,000 | 782,094 | ||||||||||||
| Denbury Resources, Inc. (Oil, Gas & Consumable Fuels) |
8.250% | 02/15/2020 | 273,000 | 308,490 | ||||||||||||
| El Paso LLC (Oil, Gas & Consumable Fuels) |
7.250% | 06/01/2018 | 225,000 | 261,094 | ||||||||||||
| El Paso LLC (Oil, Gas & Consumable Fuels) |
6.500% | 09/15/2020 | 775,000 | 878,201 | ||||||||||||
| Energy Transfer Equity LP (Oil, Gas & Consumable Fuels) |
7.500% | 10/15/2020 | 1,750,000 | 2,030,000 | ||||||||||||
| Energy XXI Gulf Coast, Inc. (Oil, Gas & Consumable Fuels) |
9.250% | 12/15/2017 | 725,000 | 831,937 | ||||||||||||
| Energy XXI Gulf Coast, Inc. (Oil, Gas & Consumable Fuels) |
7.750% | 06/15/2019 | 200,000 | 219,500 | ||||||||||||
| EP Energy LLC / EP Energy Finance, Inc. (Oil, Gas & Consumable Fuels) |
9.375% | 05/01/2020 | 1,150,000 | 1,302,375 | ||||||||||||
| EP Energy LLC / Everest Acquisition Finance, Inc. (Oil, Gas & Consumable Fuels) |
6.875% | 05/01/2019 | 250,000 | 272,500 | ||||||||||||
| EPE Holdings LLC / EP Energy Bond Co., Inc. (Oil, Gas & Consumable Fuels) |
(b)(c) | 8.125% | 12/15/2017 | 400,000 | 397,500 | |||||||||||
| Forest Oil Corp. (Oil, Gas & Consumable Fuels) |
7.250% | 06/15/2019 | 975,000 | 984,750 | ||||||||||||
| Forest Oil Corp. (Oil, Gas & Consumable Fuels) |
(b) | 7.500% | 09/15/2020 | 400,000 | 422,000 | |||||||||||
| Halcon Resources Corp. (Oil, Gas & Consumable Fuels) |
(b) | 9.750% | 07/15/2020 | 900,000 | 976,500 | |||||||||||
| Halcon Resources Corp. (Oil, Gas & Consumable Fuels) |
(b) | 8.875% | 05/15/2021 | 525,000 | 559,125 | |||||||||||
| Holly Energy Partners LP / Holly Energy Finance Corp. (Oil, Gas & Consumable Fuels) |
(b) | 6.500% | 03/01/2020 | 475,000 | 510,625 | |||||||||||
| Inergy Midstream LP / NRGM Finance Corp. (Oil, Gas & Consumable Fuels) |
(b) | 6.000% | 12/15/2020 | 400,000 | 414,000 | |||||||||||
| Linn Energy LLC / Linn Energy Finance Corp. (Oil, Gas & Consumable Fuels) |
8.625% | 04/15/2020 | 750,000 | 821,250 | ||||||||||||
| Linn Energy LLC / Linn Energy Finance Corp. (Oil, Gas & Consumable Fuels) |
7.750% | 02/01/2021 | 650,000 | 695,500 | ||||||||||||
| Linn Energy LLC / Linn Energy Finance Corp. (Oil, Gas & Consumable Fuels) |
6.500% | 05/15/2019 | 50,000 | 50,750 | ||||||||||||
| Lone Pine Resources Canada Ltd. (Oil, Gas & Consumable Fuels) |
10.375% | 02/15/2017 | 425,000 | 403,750 | ||||||||||||
| MarkWest Energy Partners LP / MarkWest Energy Finance Corp. (Oil, Gas & Consumable Fuels) |
5.500% | 02/15/2023 | 600,000 | 654,000 | ||||||||||||
| Newfield Exploration Co. (Oil, Gas & Consumable Fuels) |
5.625% | 07/01/2024 | 725,000 | 784,812 | ||||||||||||
| Oasis Petroleum, Inc. (Oil, Gas & Consumable Fuels) |
6.500% | 11/01/2021 | 750,000 | 800,625 | ||||||||||||
| Oasis Petroleum, Inc. (Oil, Gas & Consumable Fuels) |
6.875% | 01/15/2023 | 300,000 | 323,250 | ||||||||||||
| Penn Virginia Resource Partners LP / Penn Virginia Resource Finance Corp. II (Oil, Gas & Consumable Fuels) |
(b) | 8.375% | 06/01/2020 | 375,000 | 405,937 | |||||||||||
| Penn Virginia Resource Partners LP / Penn Virginia Resource Finance Corp. (Oil, Gas & Consumable Fuels) |
8.250% | 04/15/2018 | 300,000 | 319,500 | ||||||||||||
| Plains Exploration & Production Co. (Oil, Gas & Consumable Fuels) |
6.750% | 02/01/2022 | 275,000 | 310,062 | ||||||||||||
| Plains Exploration & Production Co. (Oil, Gas & Consumable Fuels) |
6.125% | 06/15/2019 | 300,000 | 328,500 | ||||||||||||
| Regency Energy Partners LP / Regency Energy Finance Corp. (Oil, Gas & Consumable Fuels) |
6.875% | 12/01/2018 | 275,000 | 301,125 | ||||||||||||
| Regency Energy Partners LP / Regency Energy Finance Corp. (Oil, Gas & Consumable Fuels) |
9.375% | 06/01/2016 | 389,000 | 419,147 | ||||||||||||
| Regency Energy Partners LP / Regency Energy Finance Corp. (Oil, Gas & Consumable Fuels) |
5.500% | 04/15/2023 | 175,000 | 187,687 | ||||||||||||
| SandRidge Energy, Inc. (Oil, Gas & Consumable Fuels) |
7.500% | 03/15/2021 | 325,000 | 349,375 | ||||||||||||
| SandRidge Energy, Inc. (Oil, Gas & Consumable Fuels) |
8.125% | 10/15/2022 | 775,000 | 852,500 | ||||||||||||
| SandRidge Energy, Inc. (Oil, Gas & Consumable Fuels) |
7.500% | 02/15/2023 | 200,000 | 215,000 | ||||||||||||
| Southern Star Central Corp. (Oil, Gas & Consumable Fuels) |
6.750% | 03/01/2016 | 225,000 | 229,500 | ||||||||||||
| Targa Resources Partners LP / Targa Resources Partners Finance Corp. (Oil, Gas & Consumable Fuels) |
(b) | 6.375% | 08/01/2022 | 250,000 | 273,750 | |||||||||||
| Targa Resources Partners LP / Targa Resources Partners Finance Corp. (Oil, Gas & Consumable Fuels) |
6.875% | 02/01/2021 | 200,000 | 220,000 | ||||||||||||
| Tesoro Logistics LP / Tesoro Logistics Finance Corp. (Oil, Gas & Consumable Fuels) |
(b) | 5.875% | 10/01/2020 | 225,000 | 234,562 | |||||||||||
| W&T Offshore, Inc. (Oil, Gas & Consumable Fuels) |
8.500% | 06/15/2019 | 950,000 | 1,026,000 | ||||||||||||
| W&T Offshore, Inc. (Oil, Gas & Consumable Fuels) |
(b) | 8.500% | 06/15/2019 | 425,000 | 459,000 | |||||||||||
|
|
|
|||||||||||||||
| 36,902,583 | ||||||||||||||||
|
|
|
|||||||||||||||
| 62 | (continued) |
| Ohio National Fund, Inc. | High Income Bond Portfolio (Continued) |
| Schedule of Investments |
December 31, 2012 |
| Corporate Bonds (Continued) | Rate | Maturity | Face Amount | Value | ||||||||||||
| FINANCIALS – 5.1% |
||||||||||||||||
| Neuberger Berman Group LLC / Neuberger Berman Finance Corp. (Capital Markets) |
(b) | 5.875% | 03/15/2022 | $ | 650,000 | $ | 692,250 | |||||||||
| Neuberger Berman Group LLC / Neuberger Berman Finance Corp. (Capital Markets) |
(b) | 5.625% | 03/15/2020 | 250,000 | 263,125 | |||||||||||
| Nuveen Investments, Inc. (Capital Markets) |
(b) | 9.500% | 10/15/2020 | 1,375,000 | 1,375,000 | |||||||||||
| CIT Group, Inc. (Commercial Banks) |
(b) | 6.625% | 04/01/2018 | 700,000 | 794,500 | |||||||||||
| CIT Group, Inc. (Commercial Banks) |
5.250% | 03/15/2018 | 675,000 | 725,625 | ||||||||||||
| CIT Group, Inc. (Commercial Banks) |
5.375% | 05/15/2020 | 225,000 | 246,937 | ||||||||||||
| CIT Group, Inc. (Commercial Banks) |
5.000% | 05/15/2017 | 575,000 | 612,375 | ||||||||||||
| CIT Group, Inc. (Commercial Banks) |
4.250% | 08/15/2017 | 600,000 | 620,450 | ||||||||||||
| Ally Financial, Inc. (Consumer Finance) |
8.000% | 11/01/2031 | 225,000 | 286,031 | ||||||||||||
| Ally Financial, Inc. (Consumer Finance) |
8.300% | 02/12/2015 | 2,425,000 | 2,706,906 | ||||||||||||
| Ally Financial, Inc. (Consumer Finance) |
8.000% | 03/15/2020 | 375,000 | 461,250 | ||||||||||||
| Ally Financial, Inc. (Consumer Finance) |
7.500% | 09/15/2020 | 775,000 | 938,719 | ||||||||||||
| Ally Financial, Inc. (Consumer Finance) |
6.250% | 12/01/2017 | 300,000 | 333,177 | ||||||||||||
| Ally Financial, Inc. (Consumer Finance) |
5.500% | 02/15/2017 | 250,000 | 268,594 | ||||||||||||
| Ford Motor Credit Co. LLC (Consumer Finance) |
8.000% | 12/15/2016 | 625,000 | 756,021 | ||||||||||||
| Ford Motor Credit Co. LLC (Consumer Finance) |
5.000% | 05/15/2018 | 325,000 | 359,293 | ||||||||||||
| Ford Motor Credit Co. LLC (Consumer Finance) |
4.250% | 02/03/2017 | 550,000 | 589,587 | ||||||||||||
| Express LLC / Express Finance Corp. (Diversified Financial Svs.) |
8.750% | 03/01/2018 | 250,000 | 271,875 | ||||||||||||
| Interactive Data Corp. (Diversified Financial Svs.) |
10.250% | 08/01/2018 | 1,150,000 | 1,299,500 | ||||||||||||
| TransUnion Holding Co., Inc. (Diversified Financial Svs.) |
9.625% | 06/15/2018 | 1,125,000 | 1,195,312 | ||||||||||||
| TransUnion Holding Co., Inc. (Diversified Financial Svs.) |
(b)(c) | 8.125% | 06/15/2018 | 525,000 | 544,687 | |||||||||||
| Reliance Intermediate Holdings LP (Insurance) |
(b) | 9.500% | 12/15/2019 | 550,000 | 627,000 | |||||||||||
| Host Hotels & Resorts LP (Real Estate Investment Trusts) |
6.750% | 06/01/2016 | 69,000 | 70,898 | ||||||||||||
|
|
|
|||||||||||||||
| 16,039,112 | ||||||||||||||||
|
|
|
|||||||||||||||
| HEALTH CARE – 10.6% |
||||||||||||||||
| Grifols, Inc. (Biotechnology) |
8.250% | 02/01/2018 | 1,050,000 | 1,161,563 | ||||||||||||
| Biomet, Inc. (Health Care Equip. & Supplies) |
(b) | 6.500% | 08/01/2020 | 1,175,000 | 1,252,844 | |||||||||||
| Biomet, Inc. (Health Care Equip. & Supplies) |
(b) | 6.500% | 10/01/2020 | 1,075,000 | 1,073,656 | |||||||||||
| DJO Finance LLC / DJO Finance Corp. (Health Care Equip. & Supplies) |
9.750% | 10/15/2017 | 250,000 | 223,750 | ||||||||||||
| DJO Finance LLC / DJO Finance Corp. (Health Care Equip. & Supplies) |
7.750% | 04/15/2018 | 1,425,000 | 1,378,688 | ||||||||||||
| DJO Finance LLC / DJO Finance Corp. (Health Care Equip. & Supplies) |
(b) | 8.750% | 03/15/2018 | 75,000 | 82,313 | |||||||||||
| DJO Finance LLC / DJO Finance Corp. (Health Care Equip. & Supplies) |
(b) | 9.875% | 04/15/2018 | 625,000 | 648,438 | |||||||||||
| Hologic, Inc. (Health Care Equip. & Supplies) |
(b) | 6.250% | 08/01/2020 | 525,000 | 568,313 | |||||||||||
| VWR Funding, Inc. (Health Care Equip. & Supplies) |
(b) | 7.250% | 09/15/2017 | 1,600,000 | 1,688,000 | |||||||||||
| CDRT Holding Corp. (Health Care Providers & Svs.) |
(b)(c) | 9.250% | 10/01/2017 | 1,050,000 | 1,076,250 | |||||||||||
| CRC Health Corp. (Acquired 01/25/2006 through 04/30/2012, Cost $595,611)(Health Care Providers & Svs.) |
(f) | 10.750% | 02/01/2016 | 650,000 | 637,000 | |||||||||||
| DaVita HealthCare Partners, Inc. (Health Care Providers & Svs.) |
5.750% | 08/15/2022 | 450,000 | 476,438 | ||||||||||||
| Emergency Medical Services Corp. (Health Care Providers & Svs.) |
8.125% | 06/01/2019 | 1,600,000 | 1,765,000 | ||||||||||||
| HCA Holdings, Inc. (Health Care Providers & Svs.) |
7.750% | 05/15/2021 | 1,725,000 | 1,880,250 | ||||||||||||
| HCA Holdings, Inc. (Health Care Providers & Svs.) |
6.250% | 02/15/2021 | 225,000 | 231,188 | ||||||||||||
| HCA, Inc. (Health Care Providers & Svs.) |
7.500% | 11/06/2033 | 225,000 | 227,250 | ||||||||||||
| HCA, Inc. (Health Care Providers & Svs.) |
7.875% | 02/15/2020 | 275,000 | 307,313 | ||||||||||||
| HCA, Inc. (Health Care Providers & Svs.) |
9.875% | 02/15/2017 | 145,000 | 153,881 | ||||||||||||
| HCA, Inc. (Health Care Providers & Svs.) |
7.500% | 02/15/2022 | 2,725,000 | 3,133,750 | ||||||||||||
| HCA, Inc. (Health Care Providers & Svs.) |
6.500% | 02/15/2020 | 550,000 | 620,125 | ||||||||||||
| HCA, Inc. (Health Care Providers & Svs.) |
5.875% | 05/01/2023 | 950,000 | 985,625 | ||||||||||||
| IASIS Healthcare LLC / IASIS Capital Corp. (Health Care Providers & Svs.) |
8.375% | 05/15/2019 | 1,450,000 | 1,377,500 | ||||||||||||
| Jaguar Holding Co. I (Health Care Providers & Svs.) |
(b)(c) | 9.375% | 10/15/2017 | 575,000 | 606,625 | |||||||||||
| Jaguar Holding Co. II / Jaguar Merger Sub, Inc. (Health Care Providers & Svs.) |
(b) | 9.500% | 12/01/2019 | 1,050,000 | 1,197,000 | |||||||||||
| Multiplan, Inc. (Health Care Providers & Svs.) |
(b) | 9.875% | 09/01/2018 | 1,700,000 | 1,904,000 | |||||||||||
| Omnicare, Inc. (Health Care Providers & Svs.) |
7.750% | 06/01/2020 | 850,000 | 947,750 | ||||||||||||
| Physiotherapy Associates Holdings, Inc. (Health Care Providers & Svs.) |
(b) | 11.875% | 05/01/2019 | 725,000 | 652,500 | |||||||||||
| PSS World Medical, Inc. (Health Care Providers & Svs.) |
6.375% | 03/01/2022 | 875,000 | 1,036,875 | ||||||||||||
| Truven Health Analytics, Inc. (Health Care Providers & Svs.) |
(b) | 10.625% | 06/01/2020 | 700,000 | 749,000 | |||||||||||
| United Surgical Partners International, Inc. (Health Care Providers & Svs.) |
9.000% | 04/01/2020 | 850,000 | 947,750 | ||||||||||||
| Universal Hospital Services, Inc. (Health Care Providers & Svs.) |
(d) | 3.902% | 06/01/2015 | 150,000 | 150,094 | |||||||||||
| Universal Hospital Services, Inc. (Health Care Providers & Svs.) |
(b) | 7.625% | 08/15/2020 | 750,000 | 792,188 | |||||||||||
| Vanguard Health Holding Co. II LLC / Vanguard Holding Co. II, Inc. (Health Care Providers & Svs.) |
8.000% | 02/01/2018 | 1,500,000 | 1,560,000 | ||||||||||||
| Emdeon, Inc. (Health Care Technology) |
11.000% | 12/31/2019 | 800,000 | 928,000 | ||||||||||||
| Legend Acquisition Sub, Inc. (Health Care Technology) |
(b) | 10.750% | 08/15/2020 | 725,000 | 663,375 | |||||||||||
|
|
|
|||||||||||||||
| 33,084,292 | ||||||||||||||||
|
|
|
|||||||||||||||
| INDUSTRIALS – 12.1% |
||||||||||||||||
| B/E Aerospace, Inc. (Aerospace & Defense) |
5.250% | 04/01/2022 | 750,000 | 798,750 | ||||||||||||
| Silver II Borrower / Silver II U.S. Holdings LLC (Aerospace & Defense) |
(b) | 7.750% | 12/15/2020 | 150,000 | 156,000 | |||||||||||
| TransDigm, Inc. (Aerospace & Defense) |
7.750% | 12/15/2018 | 1,200,000 | 1,333,500 | ||||||||||||
| TransDigm, Inc. (Aerospace & Defense) |
(b) | 5.500% | 10/15/2020 | 275,000 | 287,375 | |||||||||||
| 63 | (continued) |
| Ohio National Fund, Inc. | High Income Bond Portfolio (Continued) |
| Schedule of Investments |
December 31, 2012 |
| Corporate Bonds (Continued) | Rate | Maturity | Face Amount | Value | ||||||||||||
| INDUSTRIALS (continued) |
||||||||||||||||
| Building Materials Corp. of America (Building Products) |
(b) | 7.500% | 03/15/2020 | $ | 225,000 | $ | 248,625 | |||||||||
| Building Materials Corp. of America (Building Products) |
(b) | 6.750% | 05/01/2021 | 375,000 | 415,313 | |||||||||||
| Masonite International Corp. (Building Products) |
(b) | 8.250% | 04/15/2021 | 1,000,000 | 1,075,000 | |||||||||||
| Nortek, Inc. (Building Products) |
10.000% | 12/01/2018 | 600,000 | 670,500 | ||||||||||||
| Nortek, Inc. (Building Products) |
8.500% | 04/15/2021 | 1,025,000 | 1,142,875 | ||||||||||||
| Nortek, Inc. (Building Products) |
(b) | 8.500% | 04/15/2021 | 225,000 | 250,313 | |||||||||||
| Ply Gem Industries, Inc. (Building Products) |
8.250% | 02/15/2018 | 1,125,000 | 1,220,625 | ||||||||||||
| Ply Gem Industries, Inc. (Building Products) |
(b) | 9.375% | 04/15/2017 | 300,000 | 320,250 | |||||||||||
| RBS Global, Inc. / Rexnord LLC (Building Products) |
8.500% | 05/01/2018 | 1,075,000 | 1,170,406 | ||||||||||||
| Roofing Supply Group LLC / Roofing Supply Finance, Inc. (Building Products) |
(b) | 10.000% | 06/01/2020 | 700,000 | 787,500 | |||||||||||
| Thermon Industries, Inc. (Building Products) |
9.500% | 05/01/2017 | 334,000 | 372,410 | ||||||||||||
| ADS Waste Holdings, Inc. (Commercial Svs. & Supplies) |
(b) | 8.250% | 10/01/2020 | 700,000 | 738,500 | |||||||||||
| Altegrity, Inc. (Acquired 06/10/2009 through 02/08/2011, Cost $437,533)(Commercial Svs. & Supplies) |
(b)(f) | 11.750% | 05/01/2016 | 450,000 | 339,750 | |||||||||||
| ARAMARK Corp. (Commercial Svs. & Supplies) |
8.500% | 02/01/2015 | 950,000 | 955,947 | ||||||||||||
| ARAMARK Corp. (Commercial Svs. & Supplies) |
(d) | 3.813% | 02/01/2015 | 150,000 | 150,188 | |||||||||||
| ARAMARK Holdings Corp. (Commercial Svs. & Supplies) |
(b)(c) | 8.625% | 05/01/2016 | 1,125,000 | 1,154,543 | |||||||||||
| Garda World Security Corp. (Commercial Svs. & Supplies) |
(b) | 9.750% | 03/15/2017 | 1,200,000 | 1,269,000 | |||||||||||
| Iron Mountain, Inc. (Commercial Svs. & Supplies) |
7.750% | 10/01/2019 | 525,000 | 594,563 | ||||||||||||
| Iron Mountain, Inc. (Commercial Svs. & Supplies) |
5.750% | 08/15/2024 | 200,000 | 203,500 | ||||||||||||
| Logo Merger Sub Corp. (Commercial Svs. & Supplies) |
(b) | 8.375% | 10/15/2020 | 1,075,000 | 1,085,750 | |||||||||||
| Maxim Crane Works LP / Maxim Finance Corp. (Commercial Svs. & Supplies) |
(b) | 12.250% | 04/15/2015 | 625,000 | 643,750 | |||||||||||
| United Rentals North America, Inc. (Commercial Svs. & Supplies) |
10.250% | 11/15/2019 | 625,000 | 728,125 | ||||||||||||
| United Rentals North America, Inc. (Commercial Svs. & Supplies) |
8.375% | 09/15/2020 | 1,325,000 | 1,474,063 | ||||||||||||
| United Rentals North America, Inc. (Commercial Svs. & Supplies) |
8.250% | 02/01/2021 | 200,000 | 226,500 | ||||||||||||
| U.R. Financing Escrow Corp. (Commercial Svs. & Supplies) |
(b) | 7.375% | 05/15/2020 | 100,000 | 110,250 | |||||||||||
| West Corp. (Commercial Svs. & Supplies) |
7.875% | 01/15/2019 | 275,000 | 286,000 | ||||||||||||
| Belden, Inc. (Electrical Equip.) |
(b) | 5.500% | 09/01/2022 | 925,000 | 955,063 | |||||||||||
| CommScope, Inc. (Electrical Equip.) |
(b) | 8.250% | 01/15/2019 | 1,425,000 | 1,567,500 | |||||||||||
| General Cable Corp. (Electrical Equip.) |
(b) | 5.750% | 10/01/2022 | 750,000 | 780,000 | |||||||||||
| Viasystems, Inc. (Electrical Equip.) |
(b) | 7.875% | 05/01/2019 | 725,000 | 714,125 | |||||||||||
| Amsted Industries, Inc. (Machinery) |
(b) | 8.125% | 03/15/2018 | 200,000 | 215,000 | |||||||||||
| Dematic SA / DH Services Luxembourg Sarl (Machinery) |
(b) | 7.750% | 12/15/2020 | 475,000 | 477,375 | |||||||||||
| Dynacast International LLC / Dynacast Finance, Inc. (Machinery) |
9.250% | 07/15/2019 | 825,000 | 886,875 | ||||||||||||
| Mcron Finance Sub. LLC / Mcron Finance Corp. (Machinery) |
(b) | 8.375% | 05/15/2019 | 425,000 | 437,750 | |||||||||||
| Mueller Water Products, Inc. (Machinery) |
7.375% | 06/01/2017 | 675,000 | 700,313 | ||||||||||||
| Mueller Water Products, Inc. (Machinery) |
8.750% | 09/01/2020 | 540,000 | 618,300 | ||||||||||||
| Schaeffler Finance BV (Machinery) |
(b) | 8.500% | 02/15/2019 | 875,000 | 993,125 | |||||||||||
| Schaeffler Finance BV (Machinery) |
(b) | 7.750% | 02/15/2017 | 475,000 | 529,625 | |||||||||||
| Stena AB (Marine) |
7.000% | 12/01/2016 | 175,000 | 175,438 | ||||||||||||
| Hertz Corp. / The (Road & Rail) |
7.500% | 10/15/2018 | 100,000 | 111,000 | ||||||||||||
| Hertz Corp. / The (Road & Rail) |
6.750% | 04/15/2019 | 1,025,000 | 1,123,656 | ||||||||||||
| Interline Brands, Inc. (Trading Companies & Distributors) |
7.500% | 11/15/2018 | 700,000 | 759,500 | ||||||||||||
| Isabelle Acquisition Sub, Inc. (Trading Companies & Distributors) |
(b)(c) | 10.000% | 11/15/2018 | 1,025,000 | 1,117,250 | |||||||||||
| International Lease Finance Corp. (Trading Companies & Distributors) |
8.250% | 12/15/2020 | 275,000 | 328,625 | ||||||||||||
| International Lease Finance Corp. (Trading Companies & Distributors) |
8.625% | 09/15/2015 | 450,000 | 507,375 | ||||||||||||
| International Lease Finance Corp. (Trading Companies & Distributors) |
8.750% | 03/15/2017 | 2,075,000 | 2,407,000 | ||||||||||||
| International Lease Finance Corp. (Trading Companies & Distributors) |
5.750% | 05/15/2016 | 250,000 | 264,708 | ||||||||||||
| International Lease Finance Corp. (Trading Companies & Distributors) |
5.875% | 08/15/2022 | 700,000 | 742,050 | ||||||||||||
| Rexel SA (Trading Companies & Distributors) |
(b) | 6.125% | 12/15/2019 | 1,000,000 | 1,055,000 | |||||||||||
|
|
|
|||||||||||||||
| 37,676,524 | ||||||||||||||||
|
|
|
|||||||||||||||
| INFORMATION TECHNOLOGY – 10.6% |
||||||||||||||||
| MMI International Ltd. (Computers & Peripherals) |
(b) | 8.000% | 03/01/2017 | 250,000 | 266,250 | |||||||||||
| NCR Corp. (Computers & Peripherals) |
(b) | 5.000% | 07/15/2022 | 450,000 | 459,563 | |||||||||||
| NCR Corp. (Computers & Peripherals) |
(b) | 4.625% | 02/15/2021 | 475,000 | 477,375 | |||||||||||
| Seagate HDD Cayman (Computers & Peripherals) |
6.875% | 05/01/2020 | 375,000 | 400,781 | ||||||||||||
| Seagate HDD Cayman (Computers & Peripherals) |
7.750% | 12/15/2018 | 400,000 | 441,500 | ||||||||||||
| Seagate HDD Cayman (Computers & Peripherals) |
7.000% | 11/01/2021 | 300,000 | 323,250 | ||||||||||||
| Seagate Technology HDD Holdings (Computers & Peripherals) |
6.800% | 10/01/2016 | 575,000 | 646,875 | ||||||||||||
| Anixter, Inc. (Electronic Equip., Instr. & Comp.) |
5.625% | 05/01/2019 | 300,000 | 317,250 | ||||||||||||
| Cleaver-Brooks, Inc. (Electronic Equip., Instr. & Comp.) |
(b) | 8.750% | 12/15/2019 | 375,000 | 388,125 | |||||||||||
| Kemet Corp. (Electronic Equip., Instr. & Comp.) |
10.500% | 05/01/2018 | 1,250,000 | 1,239,063 | ||||||||||||
| IAC/InterActiveCorp (Internet Software & Svs.) |
(b) | 4.750% | 12/15/2022 | 375,000 | 375,000 | |||||||||||
| CoreLogic, Inc. (IT Svs.) |
7.250% | 06/01/2021 | 1,125,000 | 1,229,063 | ||||||||||||
| Fidelity National Information Services, Inc. (IT Svs.) |
7.875% | 07/15/2020 | 125,000 | 142,031 | ||||||||||||
| Fidelity National Information Services, Inc. (IT Svs.) |
7.625% | 07/15/2017 | 1,025,000 | 1,119,813 | ||||||||||||
| First Data Corp. (IT Svs.) |
(b)(c) | 8.750% | 01/15/2022 | 2,825,000 | 2,902,688 | |||||||||||
| First Data Corp. (IT Svs.) |
(b) | 8.250% | 01/15/2021 | 475,000 | 477,375 | |||||||||||
| iGATE Corp. (IT Svs.) |
9.000% | 05/01/2016 | 1,050,000 | 1,143,188 | ||||||||||||
| 64 | (continued) |
| Ohio National Fund, Inc. | High Income Bond Portfolio (Continued) |
| Schedule of Investments |
December 31, 2012 |
| Corporate Bonds (Continued) | Rate | Maturity | Face Amount | Value | ||||||||||||
| INFORMATION TECHNOLOGY (continued) |
||||||||||||||||
| Lender Processing Services, Inc. (IT Svs.) |
5.750% | 04/15/2023 | $ | 1,325,000 | $ | 1,381,313 | ||||||||||
| Mantech International Corp. (IT Svs.) |
7.250% | 04/15/2018 | 200,000 | 213,500 | ||||||||||||
| Stream Global Services, Inc. (IT Svs.) |
11.250% | 10/01/2014 | 525,000 | 551,250 | ||||||||||||
| SunGard Data Systems, Inc. (IT Svs.) |
7.625% | 11/15/2020 | 200,000 | 219,500 | ||||||||||||
| SunGard Data Systems, Inc. (IT Svs.) |
7.375% | 11/15/2018 | 175,000 | 188,344 | ||||||||||||
| SunGard Data Systems, Inc. (IT Svs.) |
(b) | 6.625% | 11/01/2019 | 625,000 | 642,188 | |||||||||||
| Advanced Micro Devices, Inc. (Semiconductors & Equip.) |
8.125% | 12/15/2017 | 725,000 | 665,188 | ||||||||||||
| Advanced Micro Devices, Inc. (Semiconductors & Equip.) |
7.750% | 08/01/2020 | 675,000 | 568,688 | ||||||||||||
| Freescale Semiconductor, Inc. (Semiconductors & Equip.) |
(b) | 9.250% | 04/15/2018 | 725,000 | 795,688 | |||||||||||
| Freescale Semiconductor, Inc. (Semiconductors & Equip.) |
10.750% | 08/01/2020 | 825,000 | 888,938 | ||||||||||||
| MagnaChip Semiconductor SA / MagnaChip Semiconductor Finance Co. (Semiconductors & Equip.) |
10.500% | 04/15/2018 | 925,000 | 1,040,625 | ||||||||||||
| Spansion LLC (Semiconductors & Equip.) |
7.875% | 11/15/2017 | 1,200,000 | 1,236,000 | ||||||||||||
| Allen Systems Group, Inc. (Acquired 11/18/2010 through 02/28/2012, Cost $743,364)(Software) |
(b)(f) | 10.500% | 11/15/2016 | 750,000 | 562,500 | |||||||||||
| Aspect Software, Inc. (Software) |
10.625% | 05/15/2017 | 975,000 | 892,125 | ||||||||||||
| Audatex North America, Inc. (Software) |
(b) | 6.750% | 06/15/2018 | 1,275,000 | 1,370,625 | |||||||||||
| Epicor Software Corp. (Software) |
8.625% | 05/01/2019 | 1,625,000 | 1,714,375 | ||||||||||||
| Infor U.S., Inc. (Software) |
9.375% | 04/01/2019 | 1,150,000 | 1,296,625 | ||||||||||||
| Infor U.S., Inc. (Software) |
11.500% | 07/15/2018 | 1,575,000 | 1,850,625 | ||||||||||||
| Nuance Communications, Inc. (Software) |
(b) | 5.375% | 08/15/2020 | 900,000 | 945,000 | |||||||||||
| Serena Software, Inc. (Software) |
10.375% | 03/15/2016 | 550,000 | 566,500 | ||||||||||||
| Sophia LP / Sophia Finance, Inc. (Software) |
(b) | 9.750% | 01/15/2019 | 1,575,000 | 1,704,938 | |||||||||||
| SSI Investments II Ltd. / SSI Co-Issuer LLC (Software) |
11.125% | 06/01/2018 | 1,250,000 | 1,389,063 | ||||||||||||
|
|
|
|||||||||||||||
| 33,032,788 | ||||||||||||||||
|
|
|
|||||||||||||||
| MATERIALS – 7.6% |
||||||||||||||||
| Ferro Corp. (Chemicals) |
7.875% | 08/15/2018 | 1,150,000 | 1,043,625 | ||||||||||||
| Hexion U.S. Finance Corp / Hexion Nova Scotia Finance ULC (Chemicals) |
8.875% | 02/01/2018 | 900,000 | 929,250 | ||||||||||||
| Hexion U.S. Finance Corp / Hexion Nova Scotia Finance ULC (Chemicals) |
9.000% | 11/15/2020 | 650,000 | 596,375 | ||||||||||||
| Huntsman International LLC (Chemicals) |
5.500% | 06/30/2016 | 241,000 | 241,603 | ||||||||||||
| Huntsman International LLC (Chemicals) |
8.625% | 03/15/2020 | 325,000 | 369,688 | ||||||||||||
| Koppers, Inc. (Chemicals) |
7.875% | 12/01/2019 | 575,000 | 635,375 | ||||||||||||
| Momentive Performance Materials, Inc. (Chemicals) |
9.000% | 01/15/2021 | 275,000 | 202,125 | ||||||||||||
| Momentive Performance Materials, Inc. (Chemicals) |
(b) | 10.000% | 10/15/2020 | 600,000 | 594,000 | |||||||||||
| OMNOVA Solutions, Inc. (Chemicals) |
7.875% | 11/01/2018 | 1,050,000 | 1,088,063 | ||||||||||||
| OXEA Finance & Cy SCA (Chemicals) |
(b) | 9.500% | 07/15/2017 | 727,000 | 799,700 | |||||||||||
| Rockwood Specialties Group, Inc. (Chemicals) |
4.625% | 10/15/2020 | 400,000 | 415,500 | ||||||||||||
| Scotts Miracle-Gro Co. / The (Chemicals) |
6.625% | 12/15/2020 | 550,000 | 606,375 | ||||||||||||
| Union Carbide Corp. (Chemicals) |
7.875% | 04/01/2023 | 100,000 | 126,645 | ||||||||||||
| Ardagh Packaging Finance Plc (Containers & Packaging) |
(b) | 9.125% | 10/15/2020 | 1,325,000 | 1,450,875 | |||||||||||
| Ardagh Packaging Finance Plc / Ardagh MP Holdings U.S.A., Inc. (Containers & Packaging) |
(b) | 9.125% | 10/15/2020 | 425,000 | 463,250 | |||||||||||
| Berry Plastics Corp. (Containers & Packaging) |
9.500% | 05/15/2018 | 550,000 | 607,750 | ||||||||||||
| BOE Merger Corp. (Containers & Packaging) |
(b)(c) | 9.500% | 11/01/2017 | 775,000 | 778,875 | |||||||||||
| BWAY Holding Co. (Containers & Packaging) |
10.000% | 06/15/2018 | 900,000 | 1,003,500 | ||||||||||||
| Crown Americas LLC / Crown Americas Capital Corp. II (Containers & Packaging) |
7.625% | 05/15/2017 | 75,000 | 79,594 | ||||||||||||
| Graphic Packaging International, Inc. (Containers & Packaging) |
9.500% | 06/15/2017 | 950,000 | 1,030,750 | ||||||||||||
| Greif, Inc. (Containers & Packaging) |
7.750% | 08/01/2019 | 475,000 | 551,000 | ||||||||||||
| Packaging Dynamics Corp. (Containers & Packaging) |
(b) | 8.750% | 02/01/2016 | 875,000 | 918,750 | |||||||||||
| Pactiv LLC (Containers & Packaging) |
7.950% | 12/15/2025 | 225,000 | 186,750 | ||||||||||||
| Reynolds Group Issuer, Inc. / Reynolds Group Issuer LLC (Containers & Packaging) |
8.500% | 05/15/2018 | 775,000 | 798,250 | ||||||||||||
| Reynolds Group Issuer, Inc. / Reynolds Group Issuer LLC (Containers & Packaging) |
9.000% | 04/15/2019 | 675,000 | 705,375 | ||||||||||||
| Reynolds Group Issuer, Inc. / Reynolds Group Issuer LLC (Containers & Packaging) |
8.250% | 02/15/2021 | 1,750,000 | 1,785,000 | ||||||||||||
| Reynolds Group Issuer, Inc. / Reynolds Group Issuer LLC (Containers & Packaging) |
9.875% | 08/15/2019 | 1,275,000 | 1,370,625 | ||||||||||||
| Reynolds Group Issuer, Inc. / Reynolds Group Issuer LLC (Containers & Packaging) |
7.125% | 04/15/2019 | 175,000 | 189,000 | ||||||||||||
| Reynolds Group Issuer, Inc. / Reynolds Group Issuer LLC (Containers & Packaging) |
(b) | 5.750% | 10/15/2020 | 1,000,000 | 1,035,000 | |||||||||||
| Sealed Air Corp. (Containers & Packaging) |
(b) | 8.375% | 09/15/2021 | 1,350,000 | 1,549,125 | |||||||||||
| Sealed Air Corp. (Containers & Packaging) |
(b) | 6.500% | 12/01/2020 | 125,000 | 135,625 | |||||||||||
| Compass Minerals International, Inc. (Metals & Mining) |
8.000% | 06/01/2019 | 275,000 | 298,375 | ||||||||||||
| Clearwater Paper Corp. (Paper & Forest Products) |
10.625% | 06/15/2016 | 125,000 | 136,875 | ||||||||||||
| Clearwater Paper Corp. (Paper & Forest Products) |
7.125% | 11/01/2018 | 125,000 | 136,875 | ||||||||||||
| Longview Fibre Paper & Packaging, Inc. (Paper & Forest Products) |
(b) | 8.000% | 06/01/2016 | 650,000 | 685,750 | |||||||||||
|
|
|
|||||||||||||||
| 23,545,293 | ||||||||||||||||
|
|
|
|||||||||||||||
| TELECOMMUNICATION SERVICES – 5.2% |
||||||||||||||||
| GXS Worldwide, Inc. (Diversified Telecom. Svs.) |
9.750% | 06/15/2015 | 225,000 | 235,406 | ||||||||||||
| Level 3 Communications, Inc. (Diversified Telecom. Svs.) |
(b) | 8.875% | 06/01/2019 | 350,000 | 374,063 | |||||||||||
| Level 3 Financing, Inc. (Diversified Telecom. Svs.) |
8.125% | 07/01/2019 | 925,000 | 1,012,875 | ||||||||||||
| Level 3 Financing, Inc. (Diversified Telecom. Svs.) |
8.625% | 07/15/2020 | 275,000 | 306,281 | ||||||||||||
| Level 3 Financing, Inc. (Diversified Telecom. Svs.) |
(b) | 7.000% | 06/01/2020 | 475,000 | 498,156 | |||||||||||
| tw telecom holdings, Inc. (Diversified Telecom. Svs.) |
(b) | 5.375% | 10/01/2022 | 175,000 | 183,969 | |||||||||||
| 65 | (continued) |
| Ohio National Fund, Inc. | High Income Bond Portfolio (Continued) |
| Schedule of Investments |
December 31, 2012 |
| Corporate Bonds (Continued) | Rate | Maturity | Face Amount | Value | ||||||||||||
| TELECOMMUNICATION SERVICES (continued) |
||||||||||||||||
| Windstream Corp. (Diversified Telecom. Svs.) |
8.125% | 09/01/2018 | $ | 650,000 | $ | 713,375 | ||||||||||
| Digicel Group Ltd. (Wireless Telecom. Svs.) |
(b) | 8.250% | 09/30/2020 | 1,575,000 | 1,740,375 | |||||||||||
| Digicel Ltd. (Wireless Telecom. Svs.) |
(b) | 12.000% | 04/01/2014 | 650,000 | 710,125 | |||||||||||
| Digicel Ltd. (Wireless Telecom. Svs.) |
(b) | 8.250% | 09/01/2017 | 675,000 | 729,000 | |||||||||||
| MetroPCS Wireless, Inc. (Wireless Telecom. Svs.) |
7.875% | 09/01/2018 | 925,000 | 1,005,938 | ||||||||||||
| MetroPCS Wireless, Inc. (Wireless Telecom. Svs.) |
6.625% | 11/15/2020 | 875,000 | 932,969 | ||||||||||||
| Sprint Capital Corp. (Wireless Telecom. Svs.) |
6.875% | 11/15/2028 | 1,100,000 | 1,149,500 | ||||||||||||
| Sprint Capital Corp. (Wireless Telecom. Svs.) |
6.900% | 05/01/2019 | 2,500,000 | 2,737,500 | ||||||||||||
| Sprint Nextel Corp. (Wireless Telecom. Svs.) |
(b) | 9.000% | 11/15/2018 | 1,025,000 | 1,268,438 | |||||||||||
| Sprint Nextel Corp. (Wireless Telecom. Svs.) |
(b) | 7.000% | 03/01/2020 | 350,000 | 407,750 | |||||||||||
| Sprint Nextel Corp. (Wireless Telecom. Svs.) |
6.000% | 11/15/2022 | 475,000 | 490,438 | ||||||||||||
| Syniverse Holdings, Inc. (Wireless Telecom. Svs.) |
9.125% | 01/15/2019 | 1,600,000 | 1,716,000 | ||||||||||||
|
|
|
|||||||||||||||
| 16,212,158 | ||||||||||||||||
|
|
|
|||||||||||||||
| UTILITIES – 1.8% |
||||||||||||||||
| Energy Future Intermediate Holding Co. LLC / EFIH Finance, Inc. (Electric Utilities) |
10.000% | 12/01/2020 | 500,000 | 566,250 | ||||||||||||
| Energy Future Intermediate Holding Co. LLC / EFIH Finance, Inc. (Electric Utilities) |
(b) | 11.750% | 03/01/2022 | 625,000 | 696,875 | |||||||||||
| Energy Future Intermediate Holding Co. LLC / EFIH Finance, Inc. (Electric Utilities) |
(b) | 6.875% | 08/15/2017 | 375,000 | 401,250 | |||||||||||
| Texas Competitive Electric Holdings Co. LLC / TCEH Finance, Inc. (Electric Utilities) |
(b) | 11.500% | 10/01/2020 | 125,000 | 98,438 | |||||||||||
| Suburban Propane Partners LP / Suburban Energy Finance Corp. (Gas Utilities) |
7.500% | 10/01/2018 | 211,000 | 228,408 | ||||||||||||
| Suburban Propane Partners LP / Suburban Energy Finance Corp. (Gas Utilities) |
7.375% | 08/01/2021 | 506,000 | 552,805 | ||||||||||||
| Calpine Corp. (Ind. Power Prod. & Energy Traders) |
(b) | 7.500% | 02/15/2021 | 833,000 | 924,630 | |||||||||||
| NRG Energy, Inc. (Ind. Power Prod. & Energy Traders) |
8.250% | 09/01/2020 | 750,000 | 843,750 | ||||||||||||
| NRG Energy, Inc. (Ind. Power Prod. & Energy Traders) |
7.875% | 05/15/2021 | 475,000 | 529,625 | ||||||||||||
| NRG Energy, Inc. (Ind. Power Prod. & Energy Traders) |
7.625% | 05/15/2019 | 700,000 | 752,500 | ||||||||||||
| FPL Energy National Wind Portfolio LLC (Acquired 05/27/2009, Cost $126,243)(Multi-Utilities) |
(b)(f) | 6.125% | 03/25/2019 | 145,275 | 123,873 | |||||||||||
|
|
|
|||||||||||||||
| 5,718,404 | ||||||||||||||||
|
|
|
|||||||||||||||
| Total Corporate Bonds (Cost $289,773,573) |
$ | 306,187,127 | ||||||||||||||
|
|
|
|||||||||||||||
| Common Stocks – 0.0% | Shares | Value | ||||||||||||||
| CONSUMER DISCRETIONARY – 0.0% |
||||||||||||||||
| General Motors Co. (Automobiles) |
(a) | 4,443 | $ | 128,092 | ||||||||||||
|
|
|
|||||||||||||||
| Total Common Stocks (Cost $415,829) |
$ | 128,092 | ||||||||||||||
|
|
|
|||||||||||||||
| Preferred Stocks – 0.1% | Shares | Value | ||||||||||||||
| FINANCIALS – 0.1% |
||||||||||||||||
| Ally Financial, Inc. (Consumer Finance) |
(b) | 346 | $ | 339,848 | ||||||||||||
|
|
|
|||||||||||||||
| Total Preferred Stocks (Cost $0) |
$ | 339,848 | ||||||||||||||
|
|
|
|||||||||||||||
| Warrants – 0.0% | Quantity | Value | ||||||||||||||
| CONSUMER DISCRETIONARY – 0.0% |
||||||||||||||||
| General Motors Co. (Automobiles) Expiration: 07/10/16, Exercise Price: $10.00 |
(a) | 4,039 | $ | 78,761 | ||||||||||||
| General Motors Co. (Automobiles) Expiration: 07/10/19, Exercise Price: $18.33 |
(a) | 4,039 | 50,447 | |||||||||||||
|
|
|
|||||||||||||||
| Total Warrants (Cost $476,540) |
$ | 129,208 | ||||||||||||||
|
|
|
|||||||||||||||
| Other – 0.0% | Shares | Value | ||||||||||||||
| CONSUMER DISCRETIONARY – 0.0% |
||||||||||||||||
| Motors Liquidation Co. GUC Trust (Automobiles) |
(a) | 1,116 | $ | 23,659 | ||||||||||||
|
|
|
|||||||||||||||
| Total Other (Cost $0) |
$ | 23,659 | ||||||||||||||
|
|
|
|||||||||||||||
| Money Market Funds – 0.5% | Shares | Value | ||||||||||||||
| Fidelity Institutional Money Market Funds |
1,440,000 | $ | 1,440,000 | |||||||||||||
|
|
|
|||||||||||||||
| Total Money Market Funds (Cost $1,440,000) |
$ | 1,440,000 | ||||||||||||||
|
|
|
|||||||||||||||
| Total Investments – 98.8% (Cost $292,105,942) |
(g) | $ | 308,247,934 | |||||||||||||
| Other Assets in Excess of Liabilities – 1.2% |
3,667,003 | |||||||||||||||
|
|
|
|||||||||||||||
| Net Assets – 100.0% |
$ | 311,914,937 | ||||||||||||||
|
|
|
|||||||||||||||
Percentages are stated as a percent of net assets.
Footnotes:
| (a) | Non-income producing security. |
| 66 | (continued) |
| Ohio National Fund, Inc. | High Income Bond Portfolio (Continued) |
| Schedule of Investments |
December 31, 2012 |
| (b) | Security exempt from registration under Regulation D of the Securities Act of 1933. These securities may be resold in transactions exempt from registration, normally to qualified buyers under Rule 144A. At December 31, 2012, the value of these securities totaled $109,000,892, or 34.9% of the Portfolio’s net assets. Unless also noted with (f), as defined below, these securities were deemed liquid pursuant to procedures approved by the Board of Directors. |
| (c) | Issuer of the security has the option to make coupon payments in cash or in additional par value of this bond. Rate presented is the coupon rate for the cash option. |
| (d) | Security is a variable rate instrument in which the coupon rate is adjusted quarterly, or semi-annually, in concert with U.S. LIBOR. Interest rates stated are those in effect at December 31, 2012. |
| (e) | Represents a security that is in default. Unless noted by (f), as defined below, these securities were deemed liquid pursuant to procedures approved by the Board of Directors. |
| (f) | Represents a security deemed to be illiquid. At December 31, 2012, the value of illiquid securities in the Portfolio totaled $1,663,123, or 0.5% of the Portfolio’s net assets. |
| (g) | Represents cost for financial reporting purposes, which may differ from cost basis for federal income tax purposes. See also Note 7 of the Notes to Financial Statements. |
The accompanying notes are an integral part of these financial statements.
| 67 |
| Ohio National Fund, Inc. | Capital Growth Portfolio |
| 68 | (continued) |
| Ohio National Fund, Inc. | Capital Growth Portfolio (Continued) |
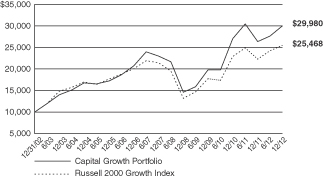
| 69 |
| Ohio National Fund, Inc. | Capital Growth Portfolio |
| Schedule of Investments |
December 31, 2012 |
| 70 | (continued) |
| Ohio National Fund, Inc. | Capital Growth Portfolio (Continued) |
| Schedule of Investments |
December 31, 2012 |
Percentages are stated as a percent of net assets.
Abbreviations:
ADR: American Depositary Receipts
Footnotes:
| (a) | Non-income producing security. |
| (b) | Represents cost for financial reporting purposes, which may differ from cost basis for federal income tax purposes. See also Note 7 of the Notes to Financial Statements. |
The accompanying notes are an integral part of these financial statements.
| 71 |
| Ohio National Fund, Inc. | Nasdaq-100® Index Portfolio |
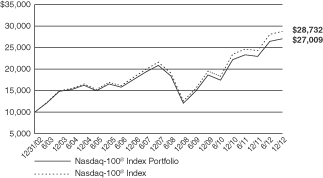
| 72 | (continued) |
| Ohio National Fund, Inc. | Nasdaq-100® Index Portfolio (Continued) |
| (1) | Composition of Portfolio subject to change. |
| (2) | Short-term investments have been excluded from the list of Top 10 Portfolio Holdings. |
| (3) | Sectors: |
| % of Net Assets | ||||
| Information Technology |
61.8 | |||
| Consumer Discretionary |
16.6 | |||
| Health Care |
11.4 | |||
| Consumer Staples |
3.6 | |||
| Industrials |
2.0 | |||
| Telecommunication Services |
1.1 | |||
| Materials |
0.4 | |||
|
|
|
|||
| 96.9 | ||||
|
|
|
| 73 |
| Ohio National Fund, Inc. | Nasdaq-100® Index Portfolio |
| Schedule of Investments |
December 31, 2012 |
| 74 | (continued) |
| Ohio National Fund, Inc. | Nasdaq-100® Index Portfolio (Continued) |
| Schedule of Investments |
December 31, 2012 |
Percentages are stated as a percent of net assets.
Abbreviations:
ADR: American Depositary Receipts
Footnotes:
| (a) | Non-income producing security. |
| (b) | Represents cost for financial reporting purposes, which may differ from cost basis for federal income tax purposes. See also Note 7 of the Notes to Financial Statements. |
The accompanying notes are an integral part of these financial statements.
| 75 |
| Ohio National Fund, Inc. | Bristol Portfolio |
| 76 | (continued) |
| Ohio National Fund, Inc. | Bristol Portfolio (Continued) |
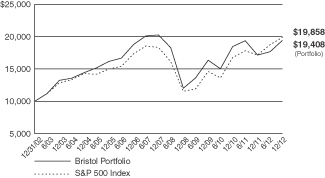
| (1) | Composition of Portfolio subject to change. |
| (2) | Short-term investments have been excluded from the list of Top 10 Portfolio Holdings. |
| (3) | Sectors: |
| % of Net Assets | ||||
| Information Technology |
23.5 | |||
| Industrials |
21.7 | |||
| Financials |
15.3 | |||
| Consumer Discretionary |
14.2 | |||
| Energy |
7.7 | |||
| Health Care |
7.5 | |||
| Materials |
6.1 | |||
| Consumer Staples |
1.9 | |||
|
|
|
|||
| 97.9 | ||||
|
|
|
| 77 |
| Ohio National Fund, Inc. | Bristol Portfolio |
| Schedule of Investments |
December 31, 2012 |
Percentages are stated as a percent of net assets.
Abbreviations:
ADR: American Depositary Receipts
Footnotes:
| (a) | Non-income producing security. |
| (b) | Represents cost for financial reporting purposes, which may differ from cost basis for federal income tax purposes. See also Note 7 of the Notes to Financial Statements. |
The accompanying notes are an integral part of these financial statements.
| 78 |
| Ohio National Fund, Inc. | Bryton Growth Portfolio |
| 79 | (continued) |
| Ohio National Fund, Inc. | Bryton Growth Portfolio (Continued) |
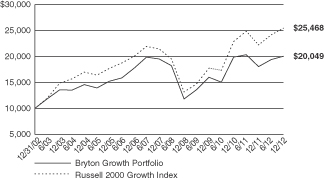
| (1) | Composition of Portfolio subject to change. |
| (2) | Short-term investments have been excluded from the list of Top 10 Portfolio Holdings. |
| (3) | Sectors: |
| % of Net Assets | ||||
| Information Technology |
26.9 | |||
| Industrials |
20.4 | |||
| Health Care |
14.2 | |||
| Consumer Discretionary |
11.0 | |||
| Consumer Staples |
10.1 | |||
| Energy |
6.8 | |||
| Materials |
4.2 | |||
| Telecommunication Services |
1.9 | |||
|
|
|
|||
| 95.5 | ||||
|
|
|
| 80 |
| Ohio National Fund, Inc. | Bryton Growth Portfolio |
| Schedule of Investments |
December 31, 2012 |
Percentages are stated as a percent of net assets.
Abbreviations:
ADR: American Depositary Receipts
Footnotes:
| (a) | Non-income producing security. |
| (b) | Represents cost for financial reporting purposes, which may differ from cost basis for federal income tax purposes. See also Note 7 of the Notes to Financial Statements. |
The accompanying notes are an integral part of these financial statements.
| 81 |
| Ohio National Fund, Inc. | U.S. Equity Portfolio |
| 82 | (continued) |
| Ohio National Fund, Inc. | U.S. Equity Portfolio (Continued) |
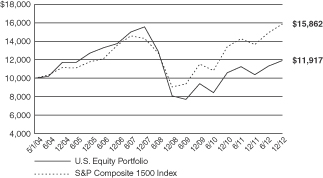
| (1) | Composition of Portfolio subject to change. |
| (2) | Short-term investments have been excluded from the list of Top 10 Portfolio Holdings. |
| (3) | Sectors: |
| % of Net Assets | ||||
| Consumer Discretionary |
34.7 | |||
| Industrials |
18.5 | |||
| Information Technology |
17.3 | |||
| Energy |
12.0 | |||
| Financials |
7.1 | |||
| Health Care |
7.0 | |||
| Materials |
3.7 | |||
|
|
|
|||
| 100.3 | ||||
|
|
|
| 83 |
| Ohio National Fund, Inc. | U.S. Equity Portfolio |
| Schedule of Investments |
December 31, 2012 |
Percentages are stated as a percent of net assets.
Footnotes:
| (a) | Non-income producing security. |
| (b) | Represents cost for financial reporting purposes, which may differ from cost basis for federal income tax purposes. See also Note 7 of the Notes to Financial Statements. |
The accompanying notes are an integral part of these financial statements.
| 84 |
| Ohio National Fund, Inc. | Balanced Portfolio |
| 85 | (continued) |
| Ohio National Fund, Inc. | Balanced Portfolio (Continued) |
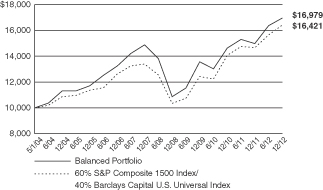
| (1) | Composition of Portfolio subject to change. |
| (2) | Short-term investments have been excluded from the list of Top 10 Portfolio Holdings. |
| (3) | Sectors (combined): |
| % of Net Assets | ||||
| Consumer Discretionary |
17.7 | |||
| Industrials |
15.9 | |||
| Financials |
13.0 | |||
| Consumer Staples |
12.2 | |||
| Information Technology |
10.5 | |||
| Energy |
10.3 | |||
| Health Care |
7.6 | |||
| Telecommunication Services |
2.5 | |||
| Materials |
2.3 | |||
| Utilities |
1.0 | |||
|
|
|
|||
| 93.0 | ||||
|
|
|
| 86 |
| Ohio National Fund, Inc. | Balanced Portfolio |
| Schedule of Investments |
December 31, 2012 |
| Common Stocks – 68.6% | Shares | Value | ||||||||||||
| CONSUMER DISCRETIONARY – 13.9% |
| |||||||||||||
| LKQ Corp. (Distributors) |
(a) | 16,080 | $ | 339,288 | ||||||||||
| Jarden Corp. (Household Durables) |
13,010 | 672,617 | ||||||||||||
| DIRECTV (Media) |
(a) | 8,420 | 422,347 | |||||||||||
| Time Warner Cable, Inc. (Media) |
3,590 | 348,912 | ||||||||||||
| Viacom, Inc. Class B (Media) |
9,250 | 487,845 | ||||||||||||
| Walt Disney Co. / The (Media) |
21,790 | 1,084,924 | ||||||||||||
| Dollar Tree, Inc. (Multiline Retail) |
(a) | 12,730 | 516,329 | |||||||||||
| Nordstrom, Inc. (Multiline Retail) |
12,230 | 654,305 | ||||||||||||
| Target Corp. (Multiline Retail) |
9,170 | 542,589 | ||||||||||||
| Home Depot, Inc. / The (Specialty Retail) |
12,200 | 754,570 | ||||||||||||
| Jos. A Bank Clothiers, Inc. (Specialty Retail) |
(a) | 3,760 | 160,101 | |||||||||||
| Tiffany & Co. (Specialty Retail) |
11,670 | 669,158 | ||||||||||||
| TJX Cos., Inc. (Specialty Retail) |
34,190 | 1,451,365 | ||||||||||||
| Tractor Supply Co. (Specialty Retail) |
16,590 | 1,465,892 | ||||||||||||
| NIKE, Inc. Class B (Textiles, Apparel & Luxury Goods) |
3,680 | 189,888 | ||||||||||||
| V.F. Corp. (Textiles, Apparel & Luxury Goods) |
5,610 | 846,942 | ||||||||||||
| Wolverine World Wide, Inc. (Textiles, Apparel & Luxury Goods) |
3,770 | 154,495 | ||||||||||||
|
|
|
|||||||||||||
| 10,761,567 | ||||||||||||||
|
|
|
|||||||||||||
| CONSUMER STAPLES – 7.6% |
||||||||||||||
| Costco Wholesale Corp. (Food & Staples Retailing) |
12,530 | 1,237,588 | ||||||||||||
| Wal-Mart Stores, Inc. (Food & Staples Retailing) |
4,140 | 282,472 | ||||||||||||
| Bunge Ltd. (Food Products) |
9,410 | 684,013 | ||||||||||||
| Ingredion, Inc. (Food Products) |
9,360 | 603,065 | ||||||||||||
| Nestle SA - ADR (Food Products) |
6,230 | 406,009 | ||||||||||||
| Kimberly-Clark Corp. (Household Products) |
3,620 | 305,637 | ||||||||||||
| British American Tobacco PLC - ADR (Tobacco) |
6,000 | 607,500 | ||||||||||||
| Lorillard, Inc. (Tobacco) |
2,570 | 299,842 | ||||||||||||
| Philip Morris International, Inc. (Tobacco) |
8,820 | 737,705 | ||||||||||||
| Reynolds American, Inc. (Tobacco) |
16,020 | 663,709 | ||||||||||||
|
|
|
|||||||||||||
| 5,827,540 | ||||||||||||||
|
|
|
|||||||||||||
| ENERGY – 9.7% |
||||||||||||||
| Atwood Oceanics, Inc. (Energy Equip. & Svs.) |
(a) | 11,500 | 526,585 | |||||||||||
| Dril-Quip, Inc. (Energy Equip. & Svs.) |
(a) | 20,000 | 1,461,000 | |||||||||||
| National Oilwell Varco, Inc. (Energy Equip. & Svs.) |
8,460 | 578,241 | ||||||||||||
| Noble Corp. (Energy Equip. & Svs.) |
10,050 | 349,941 | ||||||||||||
| Oceaneering International, Inc. (Energy Equip. & Svs.) |
26,940 | 1,449,103 | ||||||||||||
| Energy Transfer Partners LP (Oil, Gas & Consumable Fuels) |
15,750 | 676,147 | ||||||||||||
| Exxon Mobil Corp. (Oil, Gas & Consumable Fuels) |
7,020 | 607,581 | ||||||||||||
| Tesoro Corp. (Oil, Gas & Consumable Fuels) |
20,750 | 914,037 | ||||||||||||
| Valero Energy Corp. (Oil, Gas & Consumable Fuels) |
26,220 | 894,626 | ||||||||||||
|
|
|
|||||||||||||
| 7,457,261 | ||||||||||||||
|
|
|
|||||||||||||
| FINANCIALS – 7.1% |
||||||||||||||
| Franklin Resources, Inc. (Capital Markets) |
3,470 | 436,179 | ||||||||||||
| Northern Trust Corp. (Capital Markets) |
17,480 | 876,797 | ||||||||||||
| Waddell & Reed Financial, Inc. Class A (Capital Markets) |
13,900 | 483,998 | ||||||||||||
| U.S. Bancorp (Commercial Banks) |
25,000 | 798,500 | ||||||||||||
| Wells Fargo & Co. (Commercial Banks) |
38,160 | 1,304,309 | ||||||||||||
| American Express Co. (Consumer Finance) |
17,500 | 1,005,900 | ||||||||||||
| World Acceptance Corp. (Consumer Finance) |
(a) | 2,840 | 211,750 | |||||||||||
| JPMorgan Chase & Co. (Diversified Financial Svs.) |
7,390 | 324,938 | ||||||||||||
|
|
|
|||||||||||||
| 5,442,371 | ||||||||||||||
|
|
|
|||||||||||||
| HEALTH CARE – 4.5% |
||||||||||||||
| Amgen, Inc. (Biotechnology) |
4,510 | 389,303 | ||||||||||||
| Celgene Corp. (Biotechnology) |
(a) | 2,260 | 177,907 | |||||||||||
| Abbott Laboratories (Health Care Equip. & Supplies) |
5,010 | 328,155 | ||||||||||||
| Covidien PLC (Health Care Equip. & Supplies) |
4,130 | 238,466 | ||||||||||||
| Stryker Corp. (Health Care Equip. & Supplies) |
4,500 | 246,690 | ||||||||||||
| Express Scripts Holding Co. (Health Care Providers & Svs.) |
(a) | 8,790 | 474,660 | |||||||||||
| McKesson Corp. (Health Care Providers & Svs.) |
4,380 | 424,685 | ||||||||||||
| Johnson & Johnson (Pharmaceuticals) |
3,860 | 270,586 | ||||||||||||
| Pfizer, Inc. (Pharmaceuticals) |
7,270 | 182,332 | ||||||||||||
| Watson Pharmaceuticals, Inc. (Pharmaceuticals) |
(a) | 8,900 | 765,400 | |||||||||||
|
|
|
|||||||||||||
| 3,498,184 | ||||||||||||||
|
|
|
|||||||||||||
| 87 | (continued) |
| Ohio National Fund, Inc. | Balanced Portfolio (Continued) |
| Schedule of Investments |
December 31, 2012 |
| Common Stocks (Continued) | Shares | Value | ||||||||||||||
| INDUSTRIALS – 13.6% |
||||||||||||||||
| General Dynamics Corp. (Aerospace & Defense) |
11,630 | $ | 805,610 | |||||||||||||
| United Technologies Corp. (Aerospace & Defense) |
6,480 | 531,425 | ||||||||||||||
| Healthcare Services Group, Inc. (Commercial Svs. & Supplies) |
24,000 | 557,520 | ||||||||||||||
| Fluor Corp. (Construction & Engineering) |
20,000 | 1,174,800 | ||||||||||||||
| AMETEK, Inc. (Electrical Equip.) |
37,440 | 1,406,621 | ||||||||||||||
| Eaton Corp PLC (Electrical Equip.) |
6,290 | 340,918 | ||||||||||||||
| Hubbell, Inc. Class B (Electrical Equip.) |
1,580 | 133,715 | ||||||||||||||
| Danaher Corp. (Industrial Conglomerates) |
4,420 | 247,078 | ||||||||||||||
| Caterpillar, Inc. (Machinery) |
5,070 | 454,171 | ||||||||||||||
| Crane Co. (Machinery) |
12,000 | 555,360 | ||||||||||||||
| Dover Corp. (Machinery) |
5,230 | 343,663 | ||||||||||||||
| Canadian National Railway Co. (Road & Rail) |
4,140 | 376,781 | ||||||||||||||
| Union Pacific Corp. (Road & Rail) |
7,030 | 883,812 | ||||||||||||||
| Fastenal Co. (Trading Companies & Distributors) |
22,400 | 1,045,856 | ||||||||||||||
| W.W. Grainger, Inc. (Trading Companies & Distributors) |
8,090 | 1,637,173 | ||||||||||||||
|
|
|
|||||||||||||||
| 10,494,503 | ||||||||||||||||
|
|
|
|||||||||||||||
| INFORMATION TECHNOLOGY – 8.9% |
||||||||||||||||
| Apple, Inc. (Computers & Peripherals) |
2,350 | 1,252,621 | ||||||||||||||
| EMC Corp. (Computers & Peripherals) |
(a) | 14,180 | 358,754 | |||||||||||||
| Google, Inc. Class A (Internet Software & Svs.) |
(a) | 500 | 354,685 | |||||||||||||
| Accenture PLC Class A (IT Svs.) |
7,760 | 516,040 | ||||||||||||||
| Automatic Data Processing, Inc. (IT Svs.) |
3,820 | 217,778 | ||||||||||||||
| CACI International, Inc. Class A (IT Svs.) |
(a) | 3,960 | 217,919 | |||||||||||||
| Cognizant Technology Solutions Corp. Class A (IT Svs.) |
(a) | 7,370 | 545,749 | |||||||||||||
| International Business Machines Corp. (IT Svs.) |
6,310 | 1,208,680 | ||||||||||||||
| Mastercard, Inc. Class A (IT Svs.) |
1,910 | 938,345 | ||||||||||||||
| Visa, Inc. (IT Svs.) |
5,570 | 844,301 | ||||||||||||||
| Microsoft Corp. (Software) |
14,870 | 397,475 | ||||||||||||||
|
|
|
|||||||||||||||
| 6,852,347 | ||||||||||||||||
|
|
|
|||||||||||||||
| MATERIALS – 1.1% |
||||||||||||||||
| Ecolab, Inc. (Chemicals) |
6,090 | 437,871 | ||||||||||||||
| Praxair, Inc. (Chemicals) |
3,900 | 426,855 | ||||||||||||||
|
|
|
|||||||||||||||
| 864,726 | ||||||||||||||||
|
|
|
|||||||||||||||
| TELECOMMUNICATION SERVICES – 1.5% |
||||||||||||||||
| AT&T, Inc. (Diversified Telecom. Svs.) |
9,720 | 327,661 | ||||||||||||||
| Verizon Communications, Inc. (Diversified Telecom. Svs.) |
19,600 | 848,092 | ||||||||||||||
|
|
|
|||||||||||||||
| 1,175,753 | ||||||||||||||||
|
|
|
|||||||||||||||
| UTILITIES – 0.7% |
||||||||||||||||
| Southern Co. / The (Electric Utilities) |
8,970 | 384,006 | ||||||||||||||
| American Water Works Co., Inc. (Water Utilities) |
4,910 | 182,308 | ||||||||||||||
|
|
|
|||||||||||||||
| 566,314 | ||||||||||||||||
|
|
|
|||||||||||||||
| Total Common Stocks (Cost $50,385,599) |
$ | 52,940,566 | ||||||||||||||
|
|
|
|||||||||||||||
| Corporate Bonds – 24.4% | Rate | Maturity | Face Amount | Value | ||||||||||||
| CONSUMER DISCRETIONARY – 3.8% |
||||||||||||||||
| Jarden Corp. (Household Durables) |
7.500% | 01/15/2020 | $ | 200,000 | $ | 220,500 | ||||||||||
| Toll Brothers Finance Corp. (Household Durables) |
6.750% | 11/01/2019 | 100,000 | 119,285 | ||||||||||||
| DIRECTV Holdings LLC / DIRECTV Financing Co., Inc. (Media) |
2.400% | 03/15/2017 | 300,000 | 307,503 | ||||||||||||
| DISH DBS Corp. (Media) |
7.125% | 02/01/2016 | 300,000 | 337,500 | ||||||||||||
| Dollar General Corp. (Multiline Retail) |
4.125% | 07/15/2017 | 300,000 | 316,500 | ||||||||||||
| J.C. Penney Corp., Inc. (Multiline Retail) |
7.950% | 04/01/2017 | 25,300 | 24,414 | ||||||||||||
| J.C. Penney Corp., Inc. (Multiline Retail) |
5.750% | 02/15/2018 | 200,000 | 177,000 | ||||||||||||
| Target Corp. (Multiline Retail) |
3.875% | 07/15/2020 | 300,000 | 336,589 | ||||||||||||
| AutoNation, Inc. (Specialty Retail) |
5.500% | 02/01/2020 | 200,000 | 215,750 | ||||||||||||
| Gap, Inc. / The (Specialty Retail) |
5.950% | 04/12/2021 | 500,000 | 572,436 | ||||||||||||
| Limited Brands, Inc. (Specialty Retail) |
5.625% | 02/15/2022 | 150,000 | 163,875 | ||||||||||||
| Limited Brands, Inc. (Specialty Retail) |
6.950% | 03/01/2033 | 150,000 | 153,375 | ||||||||||||
|
|
|
|||||||||||||||
| 2,944,727 | ||||||||||||||||
|
|
|
|||||||||||||||
| CONSUMER STAPLES – 4.6% |
||||||||||||||||
| Coca-Cola Co. / The (Beverages) |
4.875% | 03/15/2019 | 150,000 | 179,029 | ||||||||||||
| Coca-Cola Co. / The (Beverages) |
3.300% | 09/01/2021 | 500,000 | 551,656 | ||||||||||||
| Constellation Brands, Inc. (Beverages) |
7.250% | 09/01/2016 | 200,000 | 232,000 | ||||||||||||
| PepsiCo, Inc. (Beverages) |
5.000% | 06/01/2018 | 150,000 | 178,053 | ||||||||||||
| PepsiCo, Inc. (Beverages) |
3.125% | 11/01/2020 | 500,000 | 536,246 | ||||||||||||
| 88 | (continued) |
| Ohio National Fund, Inc. | Balanced Portfolio (Continued) |
| Schedule of Investments |
December 31, 2012 |
| Corporate Bonds (Continued) | Rate | Maturity | Face Amount | Value | ||||||||||||
| CONSUMER STAPLES (continued) |
||||||||||||||||
| Wal-Mart Stores, Inc. (Food & Staples Retailing) |
7.550% | 02/15/2030 | $ | 200,000 | $ | 294,445 | ||||||||||
| Wal-Mart Stores, Inc. (Food & Staples Retailing) |
3.250% | 10/25/2020 | 300,000 | 326,875 | ||||||||||||
| Wal-Mart Stores, Inc. (Food & Staples Retailing) |
4.250% | 04/15/2021 | 100,000 | 116,224 | ||||||||||||
| Wal-Mart Stores, Inc. (Food & Staples Retailing) |
4.125% | 02/01/2019 | 100,000 | 113,852 | ||||||||||||
| Dean Holding Co. (Food Products) |
6.900% | 10/15/2017 | 50,000 | 54,750 | ||||||||||||
| Kellogg Co. (Food Products) |
4.000% | 12/15/2020 | 100,000 | 111,478 | ||||||||||||
| Central Garden and Pet Co. (Household Products) |
8.250% | 03/01/2018 | 50,000 | 53,125 | ||||||||||||
| Energizer Holdings, Inc. (Household Products) |
4.700% | 05/24/2022 | 200,000 | 214,344 | ||||||||||||
| Altria Group, Inc. (Tobacco) |
9.950% | 11/10/2038 | 50,000 | 82,433 | ||||||||||||
| Altria Group, Inc. (Tobacco) |
9.250% | 08/06/2019 | 51,000 | 70,989 | ||||||||||||
| Altria Group, Inc. (Tobacco) |
4.125% | 09/11/2015 | 300,000 | 325,818 | ||||||||||||
| Lorillard Tobacco Co. (Tobacco) |
6.875% | 05/01/2020 | 100,000 | 121,967 | ||||||||||||
|
|
|
|||||||||||||||
| 3,563,284 | ||||||||||||||||
|
|
|
|||||||||||||||
| ENERGY – 0.6% |
||||||||||||||||
| Petrobras International Finance Co. – Pifco (Oil, Gas & Consumable Fuels) |
7.750% | 09/15/2014 | 50,000 | 55,375 | ||||||||||||
| Tesoro Corp. (Oil, Gas & Consumable Fuels) |
4.250% | 10/01/2017 | 400,000 | 416,000 | ||||||||||||
|
|
|
|||||||||||||||
| 471,375 | ||||||||||||||||
|
|
|
|||||||||||||||
| FINANCIALS – 5.9% |
||||||||||||||||
| Merrill Lynch & Co., Inc. (Capital Markets) |
5.450% | 02/05/2013 | 150,000 | 150,655 | ||||||||||||
| Morgan Stanley (Capital Markets) |
(b) | 0.820% | 10/15/2015 | 300,000 | 290,889 | |||||||||||
| Morgan Stanley (Capital Markets) |
(c) | 3.500% | 10/15/2020 | 50,000 | 50,037 | |||||||||||
| Morgan Stanley (Capital Markets) |
(b) | 0.651% | 01/09/2014 | 400,000 | 397,276 | |||||||||||
| CIT Group, Inc. (Commercial Banks) |
5.000% | 08/15/2022 | 200,000 | 214,045 | ||||||||||||
| Wachovia Corp. (Commercial Banks) |
(b) | 0.578% | 06/15/2017 | 200,000 | 195,513 | |||||||||||
| Wells Fargo & Co. (Commercial Banks) |
(b) | 0.513% | 10/28/2015 | 300,000 | 297,534 | |||||||||||
| Wells Fargo Bank NA (Commercial Banks) |
(b) | 0.520% | 05/16/2016 | 100,000 | 97,956 | |||||||||||
| Ford Motor Credit Co. LLC (Consumer Finance) |
8.000% | 06/01/2014 | 100,000 | 109,076 | ||||||||||||
| Bank of America NA (Diversified Financial Svs.) |
(b) | 0.608% | 06/15/2017 | 50,000 | 46,393 | |||||||||||
| Citigroup, Inc. (Diversified Financial Svs.) |
5.125% | 05/05/2014 | 1,000 | 1,054 | ||||||||||||
| General Electric Capital Corp. (Diversified Financial Svs.) |
4.750% | 09/15/2014 | 200,000 | 213,606 | ||||||||||||
| General Electric Capital Corp. (Diversified Financial Svs.) |
(b) | 0.480% | 02/15/2017 | 300,000 | 292,153 | |||||||||||
| JPMorgan Chase Bank NA (Diversified Financial Svs.) |
(b) | 0.639% | 06/13/2016 | 250,000 | 243,247 | |||||||||||
| American International Group, Inc. (Insurance) |
4.250% | 05/15/2013 | 100,000 | 101,252 | ||||||||||||
| Berkshire Hathaway Finance Corp. (Insurance) |
5.400% | 05/15/2018 | 300,000 | 361,155 | ||||||||||||
| Berkshire Hathaway Finance Corp. (Insurance) |
3.000% | 05/15/2022 | 300,000 | 312,835 | ||||||||||||
| Berkshire Hathaway Finance Corp. (Insurance) |
4.250% | 01/15/2021 | 150,000 | 172,231 | ||||||||||||
| Berkshire Hathaway, Inc. (Insurance) |
3.400% | 01/31/2022 | 200,000 | 215,627 | ||||||||||||
| HCP, Inc. (Real Estate Investment Trusts) |
6.700% | 01/30/2018 | 200,000 | 241,398 | ||||||||||||
| Health Care REIT, Inc. (Real Estate Investment Trusts) |
4.125% | 04/01/2019 | 150,000 | 161,459 | ||||||||||||
| Ventas Realty LP l Corp. (Real Estate Investment Trusts) |
4.000% | 04/30/2019 | 150,000 | 161,337 | ||||||||||||
| Vornado Realty LP (Real Estate Investment Trusts) |
4.250% | 04/01/2015 | 200,000 | 211,503 | ||||||||||||
|
|
|
|||||||||||||||
| 4,538,231 | ||||||||||||||||
|
|
|
|||||||||||||||
| HEALTH CARE – 3.1% |
||||||||||||||||
| Gilead Sciences, Inc. (Biotechnology) |
4.400% | 12/01/2021 | 200,000 | 228,176 | ||||||||||||
| Medco Health Solutions, Inc. (Health Care Providers & Svs.) |
2.750% | 09/15/2015 | 150,000 | 156,447 | ||||||||||||
| Thermo Fisher Scientific, Inc. (Life Sciences Tools & Svs.) |
4.500% | 03/01/2021 | 200,000 | 226,152 | ||||||||||||
| Thermo Fisher Scientific, Inc. (Life Sciences Tools & Svs.) |
3.200% | 03/01/2016 | 200,000 | 212,504 | ||||||||||||
| Endo Health Solutions, Inc. (Pharmaceuticals) |
7.000% | 07/15/2019 | 200,000 | 214,250 | ||||||||||||
| Hospira, Inc. (Pharmaceuticals) |
6.050% | 03/30/2017 | 50,000 | 58,086 | ||||||||||||
| Johnson & Johnson (Pharmaceuticals) |
2.950% | 09/01/2020 | 300,000 | 324,694 | ||||||||||||
| Johnson & Johnson (Pharmaceuticals) |
5.550% | 08/15/2017 | 400,000 | 482,934 | ||||||||||||
| Merck & Co., Inc. (Pharmaceuticals) |
6.000% | 09/15/2017 | 200,000 | 245,291 | ||||||||||||
| Novartis Capital Corp. (Pharmaceuticals) |
4.400% | 04/24/2020 | 200,000 | 233,443 | ||||||||||||
|
|
|
|||||||||||||||
| 2,381,977 | ||||||||||||||||
|
|
|
|||||||||||||||
| INDUSTRIALS – 2.3% |
||||||||||||||||
| Lockheed Martin Corp. (Aerospace & Defense) |
4.250% | 11/15/2019 | 200,000 | 225,663 | ||||||||||||
| Lockheed Martin Corp. (Aerospace & Defense) |
2.125% | 09/15/2016 | 300,000 | 311,017 | ||||||||||||
| TransDigm, Inc. (Aerospace & Defense) |
7.750% | 12/15/2018 | 200,000 | 222,250 | ||||||||||||
| United Parcel Service, Inc. (Air Freight & Logistics) |
5.125% | 04/01/2019 | 500,000 | 608,477 | ||||||||||||
| Pitney Bowes, Inc. (Commercial Svs. & Supplies) |
5.750% | 09/15/2017 | 200,000 | 213,972 | ||||||||||||
| Valmont Industries, Inc. (Machinery) |
6.625% | 04/20/2020 | 150,000 | 176,721 | ||||||||||||
|
|
|
|||||||||||||||
| 1,758,100 | ||||||||||||||||
|
|
|
|||||||||||||||
| INFORMATION TECHNOLOGY – 1.6% |
||||||||||||||||
| Google, Inc. (Internet Software & Svs.) |
3.625% | 05/19/2021 | 300,000 | 334,119 | ||||||||||||
| Fiserv, Inc. (IT Svs.) |
3.500% | 10/01/2022 | 300,000 | 305,712 | ||||||||||||
| 89 | (continued) |
| Ohio National Fund, Inc. | Balanced Portfolio (Continued) |
| Schedule of Investments |
December 31, 2012 |
| Corporate Bonds (Continued) | Rate | Maturity | Face Amount | Value | ||||||||||||
| INFORMATION TECHNOLOGY (continued) |
||||||||||||||||
| Microsoft Corp. (Software) |
4.200% | 06/01/2019 | $ | 500,000 | $ | 576,765 | ||||||||||
|
|
|
|||||||||||||||
| 1,216,596 | ||||||||||||||||
|
|
|
|||||||||||||||
| MATERIALS – 1.2% |
||||||||||||||||
| Ecolab, Inc. (Chemicals) |
4.350% | 12/08/2021 | 200,000 | 223,420 | ||||||||||||
| Ball Corp. (Containers & Packaging) |
5.000% | 03/15/2022 | 200,000 | 215,000 | ||||||||||||
| AngloGold Ashanti Holdings PLC (Metals & Mining) |
5.375% | 04/15/2020 | 100,000 | 103,274 | ||||||||||||
| Reliance Steel & Aluminum Co. (Metals & Mining) |
6.200% | 11/15/2016 | 200,000 | 227,906 | ||||||||||||
| Southern Copper Corp. (Metals & Mining) |
5.375% | 04/16/2020 | 150,000 | 172,741 | ||||||||||||
|
|
|
|||||||||||||||
| 942,341 | ||||||||||||||||
|
|
|
|||||||||||||||
| TELECOMMUNICATION SERVICES – 1.0% |
||||||||||||||||
| AT&T, Inc. (Diversified Telecom. Svs.) |
5.800% | 02/15/2019 | 200,000 | 245,549 | ||||||||||||
| Telefonica Emisiones SAU (Diversified Telecom. Svs.) |
6.421% | 06/20/2016 | 200,000 | 221,800 | ||||||||||||
| Windstream Corp. (Diversified Telecom. Svs.) |
8.125% | 08/01/2013 | 50,000 | 52,125 | ||||||||||||
| Comcast Cable Communications Holdings, Inc. (Wireless Telecom. Svs.) |
9.455% | 11/15/2022 | 150,000 | 226,958 | ||||||||||||
|
|
|
|||||||||||||||
| 746,432 | ||||||||||||||||
|
|
|
|||||||||||||||
| UTILITIES – 0.3% |
||||||||||||||||
| Entergy Corp. (Electric Utilities) |
3.625% | 09/15/2015 | 50,000 | 52,354 | ||||||||||||
| AmeriGas Finance LLC / AmeriGas Finance Corp. (Gas Utilities) |
7.000% | 05/20/2022 | 150,000 | 167,625 | ||||||||||||
|
|
|
|||||||||||||||
| 219,979 | ||||||||||||||||
|
|
|
|||||||||||||||
| Total Corporate Bonds (Cost $18,606,396) |
$ | 18,783,042 | ||||||||||||||
|
|
|
|||||||||||||||
| U.S. Treasury Obligations – 4.8% | Rate | Maturity | Face Amount | Value | ||||||||||||
| U.S. Treasury Note |
3.250% | 03/31/2017 | $ | 800,000 | $ | 889,625 | ||||||||||
| U.S. Treasury Note |
0.625% | 08/31/2017 | 800,000 | 799,125 | ||||||||||||
| U.S. Treasury Note |
1.250% | 01/31/2019 | 700,000 | 712,305 | ||||||||||||
| U.S. Treasury Note |
2.625% | 11/15/2020 | 400,000 | 438,656 | ||||||||||||
| U.S. Treasury Note |
2.125% | 08/15/2021 | 300,000 | 315,141 | ||||||||||||
| U.S. Treasury Note |
2.000% | 02/15/2022 | 500,000 | 516,602 | ||||||||||||
|
|
|
|||||||||||||||
| Total U.S. Treasury Obligations (Cost $3,653,585) |
$ | 3,671,454 | ||||||||||||||
|
|
|
|||||||||||||||
| Purchased Options – 0.5% | Contracts (d) | Value | ||||||||||||||
| S&P 500 Index Put Option Expiration: February 2013, Exercise Price: $1,375.00 |
210 | $ | 401,100 | |||||||||||||
|
|
|
|||||||||||||||
| Total Purchased Options (Cost $418,606) |
$ | 401,100 | ||||||||||||||
|
|
|
|||||||||||||||
| Money Market Funds – 1.2% | Shares | Value | ||||||||||||||
| Fidelity Institutional Money Market Funds |
966,000 | $ | 966,000 | |||||||||||||
|
|
|
|||||||||||||||
| Total Money Market Funds (Cost $966,000) |
$ | 966,000 | ||||||||||||||
|
|
|
|||||||||||||||
| Total Investments – 99.5% (Cost $74,030,186) |
(e) | $ | 76,762,162 | |||||||||||||
| Other Assets in Excess of Liabilities – 0.5% |
374,765 | |||||||||||||||
|
|
|
|||||||||||||||
| Net Assets – 100.0% |
$ | 77,136,927 | ||||||||||||||
|
|
|
|||||||||||||||
Percentages are stated as a percent of net assets.
Abbreviations:
ADR: American Depositary Receipts
Footnotes:
| (a) | Non-income producing security. |
| (b) | Securities are variable rate instruments in which the coupon rates are adjusted quarterly or semi-annually in concert with U.S. LIBOR. Interest rates stated are those in effect at December 31, 2012. |
| (c) | Security was initially issued at one coupon rate, but the coupon rate is scheduled to be updated at later specified dates. The coupon rate shown is the rate that is in effect at December 31, 2012. |
| (d) | 100 shares per contract. |
| (e) | Represents cost for financial reporting purposes, which may differ from cost basis for federal income tax purposes. See also Note 7 of the Notes to Financial Statements. |
The accompanying notes are an integral part of these financial statements.
| 90 |
| Ohio National Fund, Inc. | Income Opportunity Portfolio |
| 91 | (continued) |
| Ohio National Fund, Inc. | Income Opportunity Portfolio (Continued) |
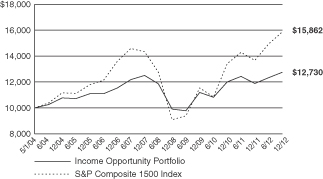
| (1) | Composition of Portfolio subject to change. |
| (2) | Short-term investments have been excluded from the list of Top 10 Portfolio Holdings. |
| (3) | Sectors: |
| % of Net Assets | ||||
| Consumer Discretionary |
20.9 | |||
| Information Technology |
20.2 | |||
| Industrials |
15.3 | |||
| Health Care |
11.0 | |||
| Energy |
10.9 | |||
| Consumer Staples |
10.7 | |||
| Financials |
9.0 | |||
| Materials |
2.4 | |||
| Utilities |
1.3 | |||
|
|
|
|||
| 101.7 | ||||
|
|
|
| 92 |
| Ohio National Fund, Inc. | Income Opportunity Portfolio |
| Schedule of Investments |
December 31, 2012 |
Percentages are stated as a percent of net assets.
Footnotes:
| (a) | Non-income producing security. |
| (b) | 100 shares per contract. |
| (c) | Represents cost for financial reporting purposes, which may differ from cost basis for federal income tax purposes. See also Note 7 of the Notes to Financial Statements. |
The accompanying notes are an integral part of these financial statements.
| 93 |
| Ohio National Fund, Inc. | Target VIP Portfolio |
Change in Value of $10,000 Investment
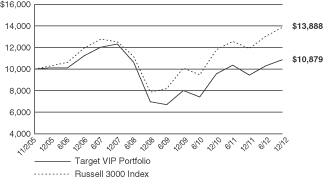
Hypothetical illustration based on past performance. Future performance will vary. The Portfolio’s returns reflect reinvested dividends. The Portfolio’s holdings may differ significantly from the securities in the index. The index is unmanaged and therefore does not reflect the cost of portfolio management and accounting.
The Russell 3000 Index measures the performance of the largest 3000 U.S. companies representing approximately 98% of the investable U.S. equity market. The Russell 3000 Index is constructed to provide a comprehensive, unbiased, and stable barometer of the broad market and is completely reconstituted annually to ensure new and growing equities are reflected. The index presented includes the effects of reinvested dividends.
| 94 | (continued) |
| Ohio National Fund, Inc. | Target VIP Portfolio (Continued) |
| (1) | Composition of Portfolio subject to change. |
| (2) | Short-term investments have been excluded from the list of Top 10 Portfolio Holdings. |
| (3) | Sectors: |
| % of Net Assets | ||||
| Information Technology |
20.9 | |||
| Consumer Discretionary |
19.9 | |||
| Health Care |
12.7 | |||
| Energy |
10.5 | |||
| Financials |
8.9 | |||
| Telecommunication Services |
8.7 | |||
| Utilities |
6.0 | |||
| Industrials |
4.9 | |||
| Consumer Staples |
4.1 | |||
| Materials |
1.7 | |||
|
|
|
|||
| 98.3 | ||||
|
|
|
| 95 |
| Ohio National Fund, Inc. | Target VIP Portfolio |
| Schedule of Investments |
December 31, 2012 |
| 96 | (continued) |
| Ohio National Fund, Inc. | Target VIP Portfolio (Continued) |
| Schedule of Investments |
December 31, 2012 |
Percentages are stated as a percent of net assets.
Abbreviations:
ADR: American Depositary Receipts
Footnotes:
| (a) | Non-income producing security. |
| (b) | Represents cost for financial reporting purposes, which may differ from cost basis for federal income tax purposes. See also Note 7 of the Notes to Financial Statements. |
The accompanying notes are an integral part of these financial statements.
| 97 |
| Ohio National Fund, Inc. | Target Equity/Income Portfolio |
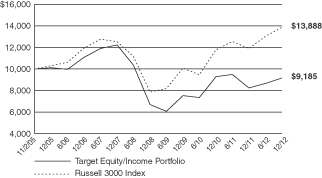
| 98 | (continued) |
| Ohio National Fund, Inc. | Target Equity/Income Portfolio (Continued) |
| (1) | Composition of Portfolio subject to change. |
| (2) | Short-term investments have been excluded from the list of Top 10 Portfolio Holdings. |
| (3) | Sectors: |
| % of Net Assets | ||||
| Utilities |
14.7 | |||
| Financials |
13.9 | |||
| Consumer Discretionary |
12.9 | |||
| Energy |
11.8 | |||
| Telecommunication Services |
11.5 | |||
| Materials |
11.2 | |||
| Industrials |
9.6 | |||
| Health Care |
6.0 | |||
| Information Technology |
4.9 | |||
| Consumer Staples |
1.4 | |||
|
|
|
|||
| 97.9 | ||||
|
|
|
| 99 |
| Ohio National Fund, Inc. | Target Equity/Income Portfolio |
| Schedule of Investments |
December 31, 2012 |
Percentages are stated as a percent of net assets.
Abbreviations:
ADR: American Depositary Receipts
Footnotes:
| (a) | Non-income producing security. |
| (b) | Represents cost for financial reporting purposes, which may differ from cost basis for federal income tax purposes. See also Note 7 of the Notes to Financial Statements. |
The accompanying notes are an integral part of these financial statements.
| 100 |
| Ohio National Fund, Inc. | Bristol Growth Portfolio |
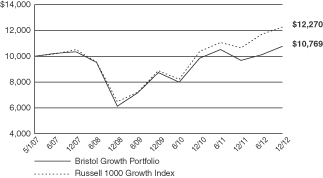
| 101 | (continued) |
| Ohio National Fund, Inc. | Bristol Growth Portfolio (Continued) |
| 102 |
| (1) | Composition of Portfolio subject to change. |
| (2) | Short-term investments have been excluded from the list of Top 10 Portfolio Holdings. |
| (3) | Sectors: |
| % of Net Assets | ||||
| Information Technology |
31.9 | |||
| Industrials |
23.8 | |||
| Consumer Discretionary |
15.0 | |||
| Health Care |
7.2 | |||
| Consumer Staples |
5.2 | |||
| Materials |
4.6 | |||
| Financials |
4.4 | |||
| Energy |
3.5 | |||
| Telecommunication Services |
0.9 | |||
|
|
|
|||
| 96.5 | ||||
|
|
|
| Ohio National Fund, Inc. | Bristol Growth Portfolio |
| Schedule of Investments |
December 31, 2012 |
Percentages are stated as a percent of net assets.
Abbreviations:
ADR: American Depositary Receipts
Footnotes:
| (a) | Non-income producing security. |
| (b) | Represents cost for financial reporting purposes, which may differ from cost basis for federal income tax purposes. See also Note 7 of the Notes to Financial Statements. |
The accompanying notes are an integral part of these financial statements.
| 103 |
| Ohio National Fund, Inc. |
| December 31, 2012 |
| Equity Portfolio |
Money Market Portfolio |
Bond Portfolio |
Omni Portfolio |
International Portfolio |
Capital Appreciation Portfolio |
Millennium Portfolio |
International Small-Mid Company Portfolio |
|||||||||||||||||||||||||
| Assets: |
||||||||||||||||||||||||||||||||
| Investments in securities, at value* |
$ | 185,992,088 | $ | 214,227,894 | $ | 170,137,932 | $ | 32,980,676 | $ | 184,293,269 | $ | 115,955,385 | $ | 34,210,831 | $ | 64,682,785 | ||||||||||||||||
| Cash |
145,417 | 43,959,992 | 503 | 618 | — | 380 | 564 | — | ||||||||||||||||||||||||
| Foreign currencies, at value** |
— | — | — | — | 15,454 | — | — | 3,332 | ||||||||||||||||||||||||
| Receivable for securities sold |
294,452 | — | — | 524,959 | — | 618,653 | 433,443 | — | ||||||||||||||||||||||||
| Variation margin receivable from broker |
— | — | — | — | 21 | — | — | — | ||||||||||||||||||||||||
| Due from adviser |
— | 49,787 | — | — | — | — | — | — | ||||||||||||||||||||||||
| Receivable for fund shares sold |
447,841 | 1,905,656 | 949,328 | 64,665 | 393,508 | 299,283 | 28,338 | 49,860 | ||||||||||||||||||||||||
| Dividends and accrued interest receivable |
151,836 | 2,456 | 1,676,821 | 105,732 | 117,953 | 54,424 | 61 | 45,330 | ||||||||||||||||||||||||
| Foreign tax reclaim receivable |
— | — | — | — | 33,681 | — | — | 30,570 | ||||||||||||||||||||||||
| Prepaid expenses and other assets |
2,355 | 1,086 | 643 | 425 | 2,210 | 1,440 | 470 | 760 | ||||||||||||||||||||||||
| Net unrealized apppreciation on foreign currency contracts |
— | — | — | — | 749,359 | — | — | — | ||||||||||||||||||||||||
|
|
|
|
|
|
|
|
|
|
|
|
|
|
|
|
|
|||||||||||||||||
| Total assets |
187,033,989 | 260,146,871 | 172,765,227 | 33,677,075 | 185,605,455 | 116,929,565 | 34,673,707 | 64,812,637 | ||||||||||||||||||||||||
|
|
|
|
|
|
|
|
|
|
|
|
|
|
|
|
|
|||||||||||||||||
| Liabilities: |
||||||||||||||||||||||||||||||||
| Payable for securities purchased |
— | — | — | 380,479 | — | 274,122 | 442,260 | 86,419 | ||||||||||||||||||||||||
| Payable for fund shares redeemed |
358,631 | 1,457,394 | 475,014 | 61,684 | 5,089,054 | 891,709 | 84,829 | 148,971 | ||||||||||||||||||||||||
| Payable for investment management services |
124,195 | 53,859 | 81,235 | 16,915 | 127,954 | 77,483 | 22,999 | 54,411 | ||||||||||||||||||||||||
| Accrued custody expense |
1,153 | 1,167 | 659 | 442 | 20,718 | 560 | 541 | 5,059 | ||||||||||||||||||||||||
| Accrued professional fees |
9,042 | 9,042 | 9,042 | 9,042 | 9,042 | 9,042 | 9,042 | 9,042 | ||||||||||||||||||||||||
| Accrued accounting fees |
4,839 | 6,805 | 6,405 | 2,218 | 244 | 3,260 | 1,304 | 2,250 | ||||||||||||||||||||||||
| Accrued printing and filing fees |
8,846 | 12,392 | 8,422 | 1,606 | 8,804 | 5,530 | 1,649 | 3,134 | ||||||||||||||||||||||||
| Withholding tax payable |
— | — | — | — | 5,507 | — | — | 20,760 | ||||||||||||||||||||||||
|
|
|
|
|
|
|
|
|
|
|
|
|
|
|
|
|
|||||||||||||||||
| Total liabilities |
506,706 | 1,540,659 | 580,777 | 472,386 | 5,261,323 | 1,261,706 | 562,624 | 330,046 | ||||||||||||||||||||||||
|
|
|
|
|
|
|
|
|
|
|
|
|
|
|
|
|
|||||||||||||||||
| Net assets |
$ | 186,527,283 | $ | 258,606,212 | $ | 172,184,450 | $ | 33,204,689 | $ | 180,344,132 | $ | 115,667,859 | $ | 34,111,083 | $ | 64,482,591 | ||||||||||||||||
|
|
|
|
|
|
|
|
|
|
|
|
|
|
|
|
|
|||||||||||||||||
| Net assets consist of: |
||||||||||||||||||||||||||||||||
| Par value, $1 per share |
$ | 8,659,520 | $ | 25,860,634 | $ | 11,425,351 | $ | 1,974,055 | $ | 14,536,896 | $ | 4,959,168 | $ | 1,449,857 | $ | 2,741,195 | ||||||||||||||||
| Paid-in capital in excess of par value |
263,004,519 | 232,745,578 | 153,313,226 | 33,576,678 | 215,569,356 | 107,491,611 | 37,836,421 | 59,151,819 | ||||||||||||||||||||||||
| Accumulated net realized gain (loss) on investments |
(109,908,148 | ) | — | (13,095,188 | ) | (4,436,618 | ) | (92,070,009 | ) | (10,000,640 | ) | (7,258,311 | ) | (12,434,368 | ) | |||||||||||||||||
| Net unrealized appreciation (depreciation) on: |
||||||||||||||||||||||||||||||||
| Investments |
24,404,184 | — | 14,784,981 | 1,981,554 | 36,716,589 | 13,134,370 | 2,083,116 | 14,718,957 | ||||||||||||||||||||||||
| Foreign currency contracts |
— | — | — | — | 749,359 | — | — | — | ||||||||||||||||||||||||
| Futures contracts |
— | — | — | — | (15,998 | ) | — | — | — | |||||||||||||||||||||||
| Other foreign currency related transactions |
— | — | — | — | 287 | — | — | (19,362 | ) | |||||||||||||||||||||||
| Undistributed net investment income (loss) |
367,208 | — | 5,756,080 | 109,020 | 4,857,652 | 83,350 | — | 324,350 | ||||||||||||||||||||||||
|
|
|
|
|
|
|
|
|
|
|
|
|
|
|
|
|
|||||||||||||||||
| Net assets |
$ | 186,527,283 | $ | 258,606,212 | $ | 172,184,450 | $ | 33,204,689 | $ | 180,344,132 | $ | 115,667,859 | $ | 34,111,083 | $ | 64,482,591 | ||||||||||||||||
|
|
|
|
|
|
|
|
|
|
|
|
|
|
|
|
|
|||||||||||||||||
| * Investments in securities, at cost |
$ | 161,587,904 | $ | 214,227,894 | $ | 155,352,951 | $ | 30,999,122 | $ | 147,576,680 | $ | 102,821,015 | $ | 32,127,715 | $ | 49,963,828 | ||||||||||||||||
|
|
|
|
|
|
|
|
|
|
|
|
|
|
|
|
|
|||||||||||||||||
| ** Foreign currencies, at cost |
$ | — | $ | — | $ | — | $ | — | $ | 15,513 | $ | — | $ | — | $ | 3,327 | ||||||||||||||||
|
|
|
|
|
|
|
|
|
|
|
|
|
|
|
|
|
|||||||||||||||||
| Shares outstanding |
8,659,520 | 25,860,634 | 11,425,351 | 1,974,055 | 14,536,896 | 4,959,168 | 1,449,857 | 2,741,195 | ||||||||||||||||||||||||
|
|
|
|
|
|
|
|
|
|
|
|
|
|
|
|
|
|||||||||||||||||
| Authorized Fund shares allocated to Portfolio |
30,000,000 | 80,000,000 | 30,000,000 | 10,000,000 | 45,000,000 | 15,000,000 | 10,000,000 | 10,000,000 | ||||||||||||||||||||||||
|
|
|
|
|
|
|
|
|
|
|
|
|
|
|
|
|
|||||||||||||||||
| Net asset value per share |
$ | 21.54 | $ | 10.00 | $ | 15.07 | $ | 16.82 | $ | 12.41 | $ | 23.32 | $ | 23.53 | $ | 23.52 | ||||||||||||||||
|
|
|
|
|
|
|
|
|
|
|
|
|
|
|
|
|
|||||||||||||||||
The accompanying notes are an integral part of these financial statements.
| 104 |
| Ohio National Fund, Inc. |
| December 31, 2012 |
| Aggressive Growth Portfolio |
Small Cap Growth Portfolio |
Mid Cap Opportunity Portfolio |
S&P
500® Index Portfolio |
Strategic Value Portfolio |
High Income Bond Portfolio |
Capital Growth Portfolio |
Nasdaq-100® Index Portfolio |
|||||||||||||||||||||||||
| Assets: |
||||||||||||||||||||||||||||||||
| Investments in securities, at value* |
$ | 33,182,034 | $ | 35,043,492 | $ | 67,412,503 | $ | 207,804,819 | $ | 259,834,646 | $ | 308,247,934 | $ | 55,799,816 | $ | 67,684,982 | ||||||||||||||||
| Cash |
480 | 106 | 134 | 202,181 | 442 | 6,827 | 44,148 | — | ||||||||||||||||||||||||
| Receivable for securities sold |
— | — | — | 29,729 | — | — | 28,394 | 314,403 | ||||||||||||||||||||||||
| Receivable for fund shares sold |
15,378 | 10,620 | 137,940 | 188,409 | 7,354,944 | 326,074 | 21,937 | 850,055 | ||||||||||||||||||||||||
| Dividends and accrued interest receivable |
7,731 | 8,545 | 8,511 | 276,695 | 1,400,937 | 5,686,839 | 25,932 | 30,801 | ||||||||||||||||||||||||
| Foreign tax reclaim receivable |
2,371 | — | — | 153 | — | — | — | — | ||||||||||||||||||||||||
| Prepaid expenses and other assets |
363 | 429 | 802 | 2,356 | 848 | 1,090 | 679 | 788 | ||||||||||||||||||||||||
|
|
|
|
|
|
|
|
|
|
|
|
|
|
|
|
|
|||||||||||||||||
| Total assets |
33,208,357 | 35,063,192 | 67,559,890 | 208,504,342 | 268,591,817 | 314,268,764 | 55,920,906 | 68,881,029 | ||||||||||||||||||||||||
|
|
|
|
|
|
|
|
|
|
|
|
|
|
|
|
|
|||||||||||||||||
| Liabilities: |
||||||||||||||||||||||||||||||||
| Cash overdraft |
— | — | — | — | — | — | — | 186,638 | ||||||||||||||||||||||||
| Payable for securities purchased |
— | 1,350 | 101,354 | — | — | — | 638,409 | — | ||||||||||||||||||||||||
| Payable for fund shares redeemed |
28,807 | 38,316 | 333,626 | 630,531 | 184,680 | 2,137,035 | 112,439 | 114,229 | ||||||||||||||||||||||||
| Payable for investment management services |
22,272 | 26,214 | 48,222 | 65,672 | 160,165 | 178,031 | 41,267 | 22,993 | ||||||||||||||||||||||||
| Accrued custody expense |
571 | 1,289 | 702 | 1,512 | 1,373 | 1,304 | 557 | 443 | ||||||||||||||||||||||||
| Accrued professional fees |
9,042 | 9,042 | 9,042 | 9,367 | 12,335 | 9,042 | 9,042 | 9,042 | ||||||||||||||||||||||||
| Accrued accounting fees |
1,393 | 1,331 | 2,106 | 6,856 | 6,780 | 13,214 | 1,850 | 2,212 | ||||||||||||||||||||||||
| Accrued printing and filing fees |
1,591 | 1,671 | 3,232 | 9,884 | 12,641 | 15,201 | 2,607 | 3,269 | ||||||||||||||||||||||||
| Withholding tax payable |
— | — | — | — | 50,133 | — | — | — | ||||||||||||||||||||||||
|
|
|
|
|
|
|
|
|
|
|
|
|
|
|
|
|
|||||||||||||||||
| Total liabilities ... |
63,676 | 79,213 | 498,284 | 723,822 | 428,107 | 2,353,827 | 806,171 | 338,826 | ||||||||||||||||||||||||
|
|
|
|
|
|
|
|
|
|
|
|
|
|
|
|
|
|||||||||||||||||
| Net assets |
$ | 33,144,681 | $ | 34,983,979 | $ | 67,061,606 | $ | 207,780,520 | $ | 268,163,710 | $ | 311,914,937 | $ | 55,114,735 | $ | 68,542,203 | ||||||||||||||||
|
|
|
|
|
|
|
|
|
|
|
|
|
|
|
|
|
|||||||||||||||||
| Net assets consist of: |
||||||||||||||||||||||||||||||||
| Par value, $1 per share |
$ | 3,485,972 | $ | 2,244,195 | $ | 3,145,041 | $ | 13,774,474 | $ | 24,191,137 | $ | 21,030,762 | $ | 1,793,261 | $ | 10,007,317 | ||||||||||||||||
| Paid-in capital in excess of par value |
22,780,430 | 25,078,012 | 79,088,807 | 150,170,982 | 246,094,234 | 248,766,439 | 40,180,446 | 41,195,771 | ||||||||||||||||||||||||
| Accumulated net realized gain (loss) on investments |
(930,973 | ) | 5,557,796 | (24,793,903 | ) | (3,032,894 | ) | (6,057,062 | ) | 4,698,612 | 3,682,277 | (320,562 | ) | |||||||||||||||||||
| Net unrealized appreciation (depreciation) on: |
||||||||||||||||||||||||||||||||
| Investments |
7,706,033 | 2,103,976 | 9,621,661 | 46,123,786 | 1,680,092 | 16,141,992 | 9,458,751 | 17,463,457 | ||||||||||||||||||||||||
| Foreign currency related transactions |
41 | — | — | — | 6,441 | — | — | — | ||||||||||||||||||||||||
| Undistributed net investment income (loss) |
103,178 | — | — | 744,172 | 2,248,868 | 21,277,132 | — | 196,220 | ||||||||||||||||||||||||
|
|
|
|
|
|
|
|
|
|
|
|
|
|
|
|
|
|||||||||||||||||
| Net assets |
$ | 33,144,681 | $ | 34,983,979 | $ | 67,061,606 | $ | 207,780,520 | $ | 268,163,710 | $ | 311,914,937 | $ | 55,114,735 | $ | 68,542,203 | ||||||||||||||||
|
|
|
|
|
|
|
|
|
|
|
|
|
|
|
|
|
|||||||||||||||||
| * Investments in securities, at cost |
$ | 25,476,001 | $ | 32,939,516 | $ | 57,790,842 | $ | 161,681,033 | $ | 258,154,554 | $ | 292,105,942 | $ | 46,341,065 | $ | 50,221,525 | ||||||||||||||||
|
|
|
|
|
|
|
|
|
|
|
|
|
|
|
|
|
|||||||||||||||||
| Shares outstanding |
3,485,972 | 2,244,195 | 3,145,041 | 13,774,474 | 24,191,137 | 21,030,762 | 1,793,261 | 10,007,317 | ||||||||||||||||||||||||
|
|
|
|
|
|
|
|
|
|
|
|
|
|
|
|
|
|||||||||||||||||
| Authorized Fund shares allocated to Portfolio |
10,000,000 | 10,000,000 | 10,000,000 | 35,000,000 | 10,000,000 | 60,000,000 | 10,000,000 | 25,000,000 | ||||||||||||||||||||||||
|
|
|
|
|
|
|
|
|
|
|
|
|
|
|
|
|
|||||||||||||||||
| Net asset value per share |
$ | 9.51 | $ | 15.59 | $ | 21.32 | $ | 15.08 | $ | 11.09 | $ | 14.83 | $ | 30.73 | $ | 6.85 | ||||||||||||||||
|
|
|
|
|
|
|
|
|
|
|
|
|
|
|
|
|
|||||||||||||||||
The accompanying notes are an integral part of these financial statements.
| 105 |
| Ohio National Fund, Inc. |
| December 31, 2012 |
| Bristol Portfolio |
Bryton Growth Portfolio |
U.S. Equity Portfolio |
Balanced Portfolio |
Income Opportunity Portfolio |
Target VIP Portfolio |
Target Equity/Income Portfolio |
Bristol Growth Portfolio |
|||||||||||||||||||||||||
| Assets: |
||||||||||||||||||||||||||||||||
| Investments in securities, at value* |
$ | 203,608,235 | $ | 155,307,940 | $ | 15,602,309 | $ | 76,762,162 | $ | 9,639,069 | $ | 21,099,223 | $ | 21,891,689 | $ | 105,954,635 | ||||||||||||||||
| Cash |
691 | 657 | — | — | — | 826 | 675 | 928 | ||||||||||||||||||||||||
| Receivable for securities sold |
3,735,790 | 1,247,712 | — | — | — | 77,961 | — | 1,590,239 | ||||||||||||||||||||||||
| Receivable for fund shares sold |
978,299 | 2,428,578 | 47,232 | 288,374 | 28,119 | 6,956 | 24,468 | 2,220,872 | ||||||||||||||||||||||||
| Dividends and accrued interest receivable |
83,852 | 17,054 | 6,955 | 258,947 | 10,884 | 28,595 | 62,745 | 37,184 | ||||||||||||||||||||||||
| Foreign tax reclaim receivable |
— | — | 1,847 | 425 | — | 4,999 | — | — | ||||||||||||||||||||||||
| Prepaid expenses and other assets |
2,395 | 1,867 | 183 | 294 | 138 | 276 | 285 | 1,265 | ||||||||||||||||||||||||
|
|
|
|
|
|
|
|
|
|
|
|
|
|
|
|
|
|||||||||||||||||
| Total assets |
208,409,262 | 159,003,808 | 15,658,526 | 77,310,202 | 9,678,210 | 21,218,836 | 21,979,862 | 109,805,123 | ||||||||||||||||||||||||
|
|
|
|
|
|
|
|
|
|
|
|
|
|
|
|
|
|||||||||||||||||
| Liabilities: |
||||||||||||||||||||||||||||||||
| Cash overdraft |
— | — | 38,426 | 87,739 | 222,506 | — | — | — | ||||||||||||||||||||||||
| Payable for securities purchased |
3,144,596 | 1,136,688 | — | — | — | — | — | 1,628,798 | ||||||||||||||||||||||||
| Payable for fund shares redeemed |
206,675 | 81,655 | 37,467 | 29,677 | 14,395 | 12,302 | 28,331 | 54,238 | ||||||||||||||||||||||||
| Payable for investment management services |
129,004 | 106,788 | 9,745 | 39,400 | 6,466 | 10,735 | 11,096 | 71,102 | ||||||||||||||||||||||||
| Accrued custody expense |
1,076 | 1,318 | 75 | 573 | 137 | 472 | 224 | 722 | ||||||||||||||||||||||||
| Accrued professional fees |
9,042 | 9,042 | 9,042 | 9,042 | 9,042 | 9,042 | 9,042 | 9,042 | ||||||||||||||||||||||||
| Accrued accounting fees |
5,305 | 4,210 | 743 | 3,279 | 701 | 1,152 | 911 | 2,971 | ||||||||||||||||||||||||
| Accrued printing and filing fees |
9,818 | 7,583 | 731 | 3,330 | 467 | 1,013 | 1,036 | 5,111 | ||||||||||||||||||||||||
| Withholding tax payable |
— | — | — | 235 | — | 1,778 | 2,719 | — | ||||||||||||||||||||||||
|
|
|
|
|
|
|
|
|
|
|
|
|
|
|
|
|
|||||||||||||||||
| Total liabilities |
3,505,516 | 1,347,284 | 96,229 | 173,275 | 253,714 | 36,494 | 53,359 | 1,771,984 | ||||||||||||||||||||||||
|
|
|
|
|
|
|
|
|
|
|
|
|
|
|
|
|
|||||||||||||||||
| Net assets |
$ | 204,903,746 | $ | 157,656,524 | $ | 15,562,297 | $ | 77,136,927 | $ | 9,424,496 | $ | 21,182,342 | $ | 21,926,503 | $ | 108,033,139 | ||||||||||||||||
|
|
|
|
|
|
|
|
|
|
|
|
|
|
|
|
|
|||||||||||||||||
| Net assets consist of: |
||||||||||||||||||||||||||||||||
| Par value, $1 per share |
$ | 15,746,101 | $ | 11,509,029 | $ | 1,360,936 | $ | 4,893,685 | $ | 740,338 | $ | 2,096,542 | $ | 2,681,061 | $ | 10,134,287 | ||||||||||||||||
| Paid-in capital in excess of par value |
171,396,317 | 134,588,724 | 17,796,595 | 69,189,012 | 7,416,071 | 23,248,866 | 33,035,225 | 86,098,954 | ||||||||||||||||||||||||
| Accumulated net realized gain (loss) on investments |
6,765,180 | 11,296,773 | (5,766,338 | ) | (329,680 | ) | (175,697 | ) | (6,404,320 | ) | (15,314,959 | ) | 6,210,552 | |||||||||||||||||||
| Net unrealized appreciation (depreciation) on: |
||||||||||||||||||||||||||||||||
| Investments |
10,560,138 | 271,837 | 2,148,659 | 2,731,976 | 1,324,025 | 2,161,450 | 1,408,989 | 5,367,747 | ||||||||||||||||||||||||
| Foreign currency related transactions |
— | — | — | (4 | ) | — | — | — | — | |||||||||||||||||||||||
| Undistributed net investment income (loss) |
436,010 | (9,839 | ) | 22,445 | 651,938 | 119,759 | 79,804 | 116,187 | 221,599 | |||||||||||||||||||||||
|
|
|
|
|
|
|
|
|
|
|
|
|
|
|
|
|
|||||||||||||||||
| Net assets |
$ | 204,903,746 | $ | 157,656,524 | $ | 15,562,297 | $ | 77,136,927 | $ | 9,424,496 | $ | 21,182,342 | $ | 21,926,503 | $ | 108,033,139 | ||||||||||||||||
|
|
|
|
|
|
|
|
|
|
|
|
|
|
|
|
|
|||||||||||||||||
| * Investments in securities, at cost |
$ | 193,048,097 | $ | 155,036,103 | $ | 13,453,650 | $ | 74,030,186 | $ | 8,315,044 | $ | 18,937,773 | $ | 20,482,700 | $ | 100,586,888 | ||||||||||||||||
|
|
|
|
|
|
|
|
|
|
|
|
|
|
|
|
|
|||||||||||||||||
| Shares outstanding |
15,746,101 | 11,509,029 | 1,360,936 | 4,893,685 | 740,338 | 2,096,542 | 2,681,061 | 10,134,287 | ||||||||||||||||||||||||
|
|
|
|
|
|
|
|
|
|
|
|
|
|
|
|
|
|||||||||||||||||
| Authorized Fund shares allocated to Portfolio |
40,000,000 | 35,000,000 | 10,000,000 | 10,000,000 | 10,000,000 | 10,000,000 | 10,000,000 | 25,000,000 | ||||||||||||||||||||||||
|
|
|
|
|
|
|
|
|
|
|
|
|
|
|
|
|
|||||||||||||||||
| Net asset value per share |
$ | 13.01 | $ | 13.70 | $ | 11.43 | $ | 15.76 | $ | 12.73 | $ | 10.10 | $ | 8.18 | $ | 10.66 | ||||||||||||||||
|
|
|
|
|
|
|
|
|
|
|
|
|
|
|
|
|
|||||||||||||||||
The accompanying notes are an integral part of these financial statements.
| 106 |
| Ohio National Fund, Inc. |
| For the Year Ended December 31, 2012 |
| Equity Portfolio |
Money Market Portfolio |
Bond Portfolio |
Omni Portfolio |
International Portfolio |
Capital Appreciation Portfolio |
Millennium Portfolio |
International Small-Mid Company Portfolio |
|||||||||||||||||||||||||
| Investment income: |
||||||||||||||||||||||||||||||||
| Interest |
$ | 1,235 | $ | 222,773 | $ | 6,875,464 | $ | 404,015 | $ | 163 | $ | 8,773 | $ | 1,010 | $ | — | ||||||||||||||||
| Dividends, net of taxes withheld* |
4,613,023 | — | — | 385,725 | 4,806,669 | 1,797,504 | 189,358 | 1,156,587 | ||||||||||||||||||||||||
|
|
|
|
|
|
|
|
|
|
|
|
|
|
|
|
|
|||||||||||||||||
| Total investment income |
4,614,258 | 222,773 | 6,875,464 | 789,740 | 4,806,832 | 1,806,277 | 190,368 | 1,156,587 | ||||||||||||||||||||||||
|
|
|
|
|
|
|
|
|
|
|
|
|
|
|
|
|
|||||||||||||||||
| Expenses: |
||||||||||||||||||||||||||||||||
| Management fees |
1,496,004 | 699,656 | 944,829 | 206,512 | 1,490,415 | 919,974 | 293,781 | 624,354 | ||||||||||||||||||||||||
| Custodian fees |
13,666 | 14,001 | 8,397 | 5,722 | 176,121 | 7,917 | 6,610 | 55,989 | ||||||||||||||||||||||||
| Directors’ fees |
21,031 | 28,781 | 18,867 | 3,847 | 20,034 | 12,925 | 4,082 | 6,997 | ||||||||||||||||||||||||
| Professional fees |
25,968 | 30,729 | 23,947 | 14,864 | 25,355 | 20,665 | 15,019 | 16,853 | ||||||||||||||||||||||||
| Accounting fees |
61,760 | 84,975 | 78,226 | 26,443 | 66,431 | 41,325 | 16,992 | 26,458 | ||||||||||||||||||||||||
| Printing and filing fees |
40,339 | 47,244 | 32,057 | 8,301 | 35,018 | 23,418 | 9,116 | 13,596 | ||||||||||||||||||||||||
| Compliance expense |
10,583 | 10,583 | 10,583 | 10,583 | 10,583 | 10,583 | 10,583 | 10,583 | ||||||||||||||||||||||||
| Other |
7,287 | 4,482 | 2,478 | 1,341 | 8,145 | 4,367 | 1,433 | 2,519 | ||||||||||||||||||||||||
|
|
|
|
|
|
|
|
|
|
|
|
|
|
|
|
|
|||||||||||||||||
| Total expenses |
1,676,638 | 920,451 | 1,119,384 | 277,613 | 1,832,102 | 1,041,174 | 357,616 | 757,349 | ||||||||||||||||||||||||
|
|
|
|
|
|
|
|
|
|
|
|
|
|
|
|
|
|||||||||||||||||
| Less expenses reduced or reimbursed by adviser |
— | (697,678 | ) | — | — | — | — | — | — | |||||||||||||||||||||||
|
|
|
|
|
|
|
|
|
|
|
|
|
|
|
|
|
|||||||||||||||||
| Net expenses |
1,676,638 | 222,773 | 1,119,384 | 277,613 | 1,832,102 | 1,041,174 | 357,616 | 757,349 | ||||||||||||||||||||||||
|
|
|
|
|
|
|
|
|
|
|
|
|
|
|
|
|
|||||||||||||||||
| Net investment income (loss) |
2,937,620 | — | 5,756,080 | 512,127 | 2,974,730 | 765,103 | (167,248 | ) | 399,238 | |||||||||||||||||||||||
|
|
|
|
|
|
|
|
|
|
|
|
|
|
|
|
|
|||||||||||||||||
| Realized/unrealized gain (loss) on investments, futures contracts, foreign currency contracts, and other foreign currency related transactions: |
||||||||||||||||||||||||||||||||
| Net realized gain (loss) on: |
||||||||||||||||||||||||||||||||
| Investments |
15,135,180 | — | 1,428,098 | 1,090,841 | 5,503,639 | 7,245,366 | 4,063,768 | 1,300,902 | ||||||||||||||||||||||||
| Futures contracts |
— | — | — | — | 103,370 | — | — | — | ||||||||||||||||||||||||
| Foreign currency contracts |
— | — | — | — | 4,177,750 | — | — | — | ||||||||||||||||||||||||
| Other foreign currency related transactions |
— | — | — | 16 | (309,620 | ) | (648 | ) | — | (74,888 | ) | |||||||||||||||||||||
| Change in unrealized appreciation/depreciation on: |
||||||||||||||||||||||||||||||||
| Investments |
9,664,589 | — | 4,568,299 | 2,337,094 | 21,801,349 | 10,984,140 | (511,771 | ) | 10,930,346 | |||||||||||||||||||||||
| Futures contracts |
— | — | — | — | (55,602 | ) | — | — | — | |||||||||||||||||||||||
| Foreign currency contracts |
— | — | — | — | (1,235,849 | ) | — | — | — | |||||||||||||||||||||||
| Other foreign currency related transactions |
— | — | — | — | 333,534 | — | — | (11,158 | ) | |||||||||||||||||||||||
|
|
|
|
|
|
|
|
|
|
|
|
|
|
|
|
|
|||||||||||||||||
| Net realized/unrealized gain (loss) on investments, futures contracts, foreign currency contracts, and other foreign currency related transactions |
24,799,769 | — | 5,996,397 | 3,427,951 | 30,318,571 | 18,228,858 | 3,551,997 | 12,145,202 | ||||||||||||||||||||||||
|
|
|
|
|
|
|
|
|
|
|
|
|
|
|
|
|
|||||||||||||||||
| Change in net assets from operations |
$ | 27,737,389 | $ | — | $ | 11,752,477 | $ | 3,940,078 | $ | 33,293,301 | $ | 18,993,961 | $ | 3,384,749 | $ | 12,544,440 | ||||||||||||||||
|
|
|
|
|
|
|
|
|
|
|
|
|
|
|
|
|
|||||||||||||||||
| * Taxes withheld |
$ | 52,830 | $ | — | $ | — | $ | 300 | $ | 532,093 | $ | 36,567 | $ | 278 | $ | 89,293 | ||||||||||||||||
|
|
|
|
|
|
|
|
|
|
|
|
|
|
|
|
|
|||||||||||||||||
The accompanying notes are an integral part of these financial statements.
| 107 |
| Ohio National Fund, Inc. |
| For the Year Ended December 31, 2012 |
| Aggressive Growth Portfolio |
Small Cap Growth Portfolio |
Mid Cap Opportunity Portfolio |
S&P
500® Index Portfolio |
Strategic Value Portfolio |
High Income Bond Portfolio |
Capital Growth Portfolio |
Nasdaq-100® Index Portfolio |
|||||||||||||||||||||||||
| Investment income: |
||||||||||||||||||||||||||||||||
| Interest |
$ | 2,275 | $ | 1,986 | $ | 1,547 | $ | 228 | $ | 2,599 | $ | 23,588,405 | $ | 1,130 | $ | 87 | ||||||||||||||||
| Dividends, net of taxes withheld* |
399,681 | 306,096 | 580,006 | 4,530,875 | 7,049,197 | 24,220 | 515,307 | 992,003 | ||||||||||||||||||||||||
|
|
|
|
|
|
|
|
|
|
|
|
|
|
|
|
|
|||||||||||||||||
| Total investment income |
401,956 | 308,082 | 581,553 | 4,531,103 | 7,051,796 | 23,612,625 | 516,437 | 992,090 | ||||||||||||||||||||||||
|
|
|
|
|
|
|
|
|
|
|
|
|
|
|
|
|
|||||||||||||||||
| Expenses: |
||||||||||||||||||||||||||||||||
| Management fees |
241,204 | 308,222 | 553,663 | 726,354 | 1,096,042 | 2,004,768 | 494,691 | 262,904 | ||||||||||||||||||||||||
| Custodian fees |
3,766 | 14,128 | 8,536 | 15,701 | 13,727 | 15,817 | 5,534 | 7,252 | ||||||||||||||||||||||||
| Directors’ fees |
3,361 | 3,789 | 7,272 | 21,475 | 16,252 | 33,234 | 6,147 | 7,351 | ||||||||||||||||||||||||
| Professional fees |
14,404 | 14,754 | 16,987 | 27,009 | 31,864 | 32,412 | 16,296 | 16,946 | ||||||||||||||||||||||||
| Accounting fees |
16,540 | 16,868 | 25,836 | 81,931 | 51,119 | 156,630 | 23,410 | 26,980 | ||||||||||||||||||||||||
| Printing and filing fees |
7,231 | 7,681 | 14,269 | 32,896 | 20,328 | 77,838 | 11,164 | 13,711 | ||||||||||||||||||||||||
| Compliance expense |
10,583 | 10,583 | 10,583 | 10,583 | 10,583 | 10,583 | 10,583 | 10,583 | ||||||||||||||||||||||||
| Other |
851 | 1,223 | 2,388 | 6,650 | 1,593 | 4,211 | 1,978 | 2,195 | ||||||||||||||||||||||||
|
|
|
|
|
|
|
|
|
|
|
|
|
|
|
|
|
|||||||||||||||||
| Total expenses |
297,940 | 377,248 | 639,534 | 922,599 | 1,241,508 | 2,335,493 | 569,803 | 347,922 | ||||||||||||||||||||||||
|
|
|
|
|
|
|
|
|
|
|
|
|
|
|
|
|
|||||||||||||||||
| Net investment income (loss) |
104,016 | (69,166 | ) | (57,981 | ) | 3,608,504 | 5,810,288 | 21,277,132 | (53,366 | ) | 644,168 | |||||||||||||||||||||
|
|
|
|
|
|
|
|
|
|
|
|
|
|
|
|
|
|||||||||||||||||
| Realized/unrealized gain (loss) on investments and foreign currency related transactions: |
||||||||||||||||||||||||||||||||
| Net realized gain (loss) on: |
||||||||||||||||||||||||||||||||
| Investments |
(286,293 | ) | 5,846,220 | 4,035,775 | 1,892,406 | 1,288,010 | 4,698,612 | 3,854,057 | 513,217 | |||||||||||||||||||||||
| Foreign currency related transactions |
8 | (18 | ) | — | — | 356,986 | — | — | (37 | ) | ||||||||||||||||||||||
| Change in unrealized appreciation/depreciation on: |
||||||||||||||||||||||||||||||||
| Investments |
5,979,667 | (231,728 | ) | 7,639,334 | 21,351,067 | (2,817,861 | ) | 13,264,229 | 3,014,667 | 8,702,070 | ||||||||||||||||||||||
| Foreign currency related transactions |
(187 | ) | — | — | — | 6,917 | — | — | — | |||||||||||||||||||||||
|
|
|
|
|
|
|
|
|
|
|
|
|
|
|
|
|
|||||||||||||||||
| Net realized/unrealized gain (loss) on investments and foreign currency related transactions |
5,693,195 | 5,614,474 | 11,675,109 | 23,243,473 | (1,165,948 | ) | 17,962,841 | 6,868,724 | 9,215,250 | |||||||||||||||||||||||
|
|
|
|
|
|
|
|
|
|
|
|
|
|
|
|
|
|||||||||||||||||
| Change in net assets from operations |
$ | 5,797,211 | $ | 5,545,308 | $ | 11,617,128 | $ | 26,851,977 | $ | 4,644,340 | $ | 39,239,973 | $ | 6,815,358 | $ | 9,859,418 | ||||||||||||||||
|
|
|
|
|
|
|
|
|
|
|
|
|
|
|
|
|
|||||||||||||||||
| * Taxes withheld |
$ | 8,596 | $ | 3,098 | $ | 3,740 | $ | 2,619 | $ | 234,087 | $ | — | $ | — | $ | 2,027 | ||||||||||||||||
|
|
|
|
|
|
|
|
|
|
|
|
|
|
|
|
|
|||||||||||||||||
The accompanying notes are an integral part of these financial statements.
| 108 |
| Ohio National Fund, Inc. |
| Statements of Operations |
For the Year Ended December 31, 2012 |
| Bristol Portfolio |
Bryton Growth Portfolio |
U.S. Equity Portfolio |
Balanced Portfolio |
Income Opportunity Portfolio |
Target VIP Portfolio |
Target Equity/Income Portfolio |
Bristol Growth Portfolio |
|||||||||||||||||||||||||
| Investment income: |
||||||||||||||||||||||||||||||||
| Interest |
$ | 7,067 | $ | 9,803 | $ | 220 | $ | 366,235 | $ | 341 | $ | 689 | $ | 717 | $ | 4,606 | ||||||||||||||||
| Dividends, net of taxes withheld* |
3,053,176 | 537,371 | 260,931 | 579,679 | 246,697 | 566,965 | 757,290 | 1,557,245 | ||||||||||||||||||||||||
|
|
|
|
|
|
|
|
|
|
|
|
|
|
|
|
|
|||||||||||||||||
| Total investment income |
3,060,243 | 547,174 | 261,151 | 945,914 | 247,038 | 567,654 | 758,007 | 1,561,851 | ||||||||||||||||||||||||
|
|
|
|
|
|
|
|
|
|
|
|
|
|
|
|
|
|||||||||||||||||
| Expenses: |
||||||||||||||||||||||||||||||||
| Management fees |
1,500,387 | 1,258,148 | 112,365 | 223,191 | 85,412 | 131,340 | 136,796 | 834,211 | ||||||||||||||||||||||||
| Custodian fees |
13,535 | 14,042 | 930 | 4,751 | 3,756 | 11,523 | 4,047 | 9,270 | ||||||||||||||||||||||||
| Directors’ fees |
22,323 | 17,292 | 1,673 | 3,693 | 1,195 | 2,444 | 2,540 | 11,750 | ||||||||||||||||||||||||
| Professional fees |
26,602 | 23,811 | 13,417 | 13,988 | 13,150 | 13,901 | 20,413 | 19,828 | ||||||||||||||||||||||||
| Accounting fees |
65,060 | 51,964 | 9,130 | 29,299 | 9,249 | 14,373 | 11,481 | 36,722 | ||||||||||||||||||||||||
| Printing and filing fees |
61,275 | 53,110 | 3,877 | 7,389 | 3,494 | 5,050 | 5,265 | 41,253 | ||||||||||||||||||||||||
| Compliance expense |
10,583 | 10,583 | 10,583 | 10,583 | 10,583 | 10,583 | 10,583 | 10,583 | ||||||||||||||||||||||||
| Other |
6,999 | 5,301 | 528 | 1,089 | 440 | 810 | 846 | 3,640 | ||||||||||||||||||||||||
|
|
|
|
|
|
|
|
|
|
|
|
|
|
|
|
|
|||||||||||||||||
| Total expenses |
1,706,764 | 1,434,251 | 152,503 | 293,983 | 127,279 | 190,024 | 191,971 | 967,257 | ||||||||||||||||||||||||
|
|
|
|
|
|
|
|
|
|
|
|
|
|
|
|
|
|||||||||||||||||
| Net investment income (loss) |
1,353,479 | (887,077 | ) | 108,648 | 651,931 | 119,759 | 377,630 | 566,036 | 594,594 | |||||||||||||||||||||||
|
|
|
|
|
|
|
|
|
|
|
|
|
|
|
|
|
|||||||||||||||||
| Realized/unrealized gain (loss) on investments, foreign currency related transactions, and written options: |
||||||||||||||||||||||||||||||||
| Net realized gain (loss) on: |
||||||||||||||||||||||||||||||||
| Investments |
8,239,529 | 12,311,861 | 528,811 | 498,190 | 203,573 | 632,540 | (2,479,190 | ) | 6,499,048 | |||||||||||||||||||||||
| Foreign currency related transactions |
130 | 136 | — | 7 | — | (50 | ) | (145 | ) | — | ||||||||||||||||||||||
| Written options |
— | — | — | (139,933 | ) | (263,013 | ) | — | — | — | ||||||||||||||||||||||
| Change in unrealized appreciation/depreciation on: |
||||||||||||||||||||||||||||||||
| Investments |
16,070,240 | 5,904,468 | 1,332,996 | 2,012,825 | 683,714 | 2,048,046 | 4,258,398 | 4,359,363 | ||||||||||||||||||||||||
| Foreign currency related transactions |
— | — | — | (4 | ) | — | — | — | — | |||||||||||||||||||||||
| Written options |
— | — | — | — | 22,751 | — | — | — | ||||||||||||||||||||||||
|
|
|
|
|
|
|
|
|
|
|
|
|
|
|
|
|
|||||||||||||||||
| Net realized/unrealized gain (loss) on investments, foreign currency related transactions, and written options |
24,309,899 | 18,216,465 | 1,861,807 | 2,371,085 | 647,025 | 2,680,536 | 1,779,063 | 10,858,411 | ||||||||||||||||||||||||
|
|
|
|
|
|
|
|
|
|
|
|
|
|
|
|
|
|||||||||||||||||
| Change in net assets from operations |
$ | 25,663,378 | $ | 17,329,388 | $ | 1,970,455 | $ | 3,023,016 | $ | 766,784 | $ | 3,058,166 | $ | 2,345,099 | $ | 11,453,005 | ||||||||||||||||
|
|
|
|
|
|
|
|
|
|
|
|
|
|
|
|
|
|||||||||||||||||
| * Taxes withheld |
$ | 2,448 | $ | 38,083 | $ | 2,435 | $ | 1,731 | $ | 231 | $ | 38,550 | $ | 11,151 | $ | — | ||||||||||||||||
|
|
|
|
|
|
|
|
|
|
|
|
|
|
|
|
|
|||||||||||||||||
The accompanying notes are an integral part of these financial statements.
| 109 |
| Ohio National Fund, Inc. |
| Equity Portfolio |
Money Market Portfolio |
Bond Portfolio |
Omni Portfolio |
|||||||||||||||||||||||||||||
| Year Ended December 31, 2012 |
Year Ended December 31, 2011 |
Year Ended December 31, 2012 |
Year Ended December 31, 2011 |
Year Ended December 31, 2012 |
Year Ended December 31, 2011 |
Year Ended December 31, 2012 |
Year Ended December 31, 2011 |
|||||||||||||||||||||||||
| Increase (Decrease) in Net Assets: |
||||||||||||||||||||||||||||||||
| Operations: |
||||||||||||||||||||||||||||||||
| Net investment income (loss) |
$ | 2,937,620 | $ | 2,050,230 | $ | — | $ | — | $ | 5,756,080 | $ | 5,641,940 | $ | 512,127 | $ | 539,778 | ||||||||||||||||
| Net realized gain (loss) on investments and foreign currency related transactions |
15,135,180 | (1,586,673 | ) | — | — | 1,428,098 | 824,712 | 1,090,857 | 2,378,862 | |||||||||||||||||||||||
| Change in unrealized appreciation/depreciation on investments |
9,664,589 | (7,441,587 | ) | — | — | 4,568,299 | 2,856,388 | 2,337,094 | (4,379,083 | ) | ||||||||||||||||||||||
|
|
|
|
|
|
|
|
|
|
|
|
|
|
|
|
|
|||||||||||||||||
| Change in net assets from operations |
27,737,389 | (6,978,030 | ) | — | — | 11,752,477 | 9,323,040 | 3,940,078 | (1,460,443 | ) | ||||||||||||||||||||||
|
|
|
|
|
|
|
|
|
|
|
|
|
|
|
|
|
|||||||||||||||||
| Distributions to shareholders: |
||||||||||||||||||||||||||||||||
| Distributions from net investment income |
(2,551,766 | ) | (1,709,149 | ) | — | — | — | — | (434,512 | ) | (467,625 | ) | ||||||||||||||||||||
|
|
|
|
|
|
|
|
|
|
|
|
|
|
|
|
|
|||||||||||||||||
| Capital transactions: |
||||||||||||||||||||||||||||||||
| Received from shares sold |
12,859,425 | 18,469,577 | 178,859,238 | 325,508,308 | 50,714,394 | 54,452,714 | 2,645,867 | 3,650,326 | ||||||||||||||||||||||||
| Received from dividends reinvested |
2,551,766 | 1,709,149 | — | — | — | — | 434,512 | 467,625 | ||||||||||||||||||||||||
| Paid for shares redeemed |
(41,926,289 | ) | (43,066,271 | ) | (206,441,123 | ) | (332,767,148 | ) | (52,317,398 | ) | (49,917,819 | ) | (8,034,239 | ) | (8,714,120 | ) | ||||||||||||||||
|
|
|
|
|
|
|
|
|
|
|
|
|
|
|
|
|
|||||||||||||||||
| Change in net assets from capital transactions |
(26,515,098 | ) | (22,887,545 | ) | (27,581,885 | ) | (7,258,840 | ) | (1,603,004 | ) | 4,534,895 | (4,953,860 | ) | (4,596,169 | ) | |||||||||||||||||
|
|
|
|
|
|
|
|
|
|
|
|
|
|
|
|
|
|||||||||||||||||
| Change in net assets |
(1,329,475 | ) | (31,574,724 | ) | (27,581,885 | ) | (7,258,840 | ) | 10,149,473 | 13,857,935 | (1,448,294 | ) | (6,524,237 | ) | ||||||||||||||||||
| Net Assets: |
||||||||||||||||||||||||||||||||
| Beginning of year |
187,856,758 | 219,431,482 | 286,188,097 | 293,446,937 | 162,034,977 | 148,177,042 | 34,652,983 | 41,177,220 | ||||||||||||||||||||||||
|
|
|
|
|
|
|
|
|
|
|
|
|
|
|
|
|
|||||||||||||||||
| End of year |
$ | 186,527,283 | $ | 187,856,758 | $ | 258,606,212 | $ | 286,188,097 | $ | 172,184,450 | $ | 162,034,977 | $ | 33,204,689 | $ | 34,652,983 | ||||||||||||||||
|
|
|
|
|
|
|
|
|
|
|
|
|
|
|
|
|
|||||||||||||||||
| Undistributed net investment income |
$ | 367,208 | $ | 321,507 | $ | — | $ | — | $ | 5,756,080 | $ | 5,644,604 | $ | 109,020 | $ | 72,151 | ||||||||||||||||
|
|
|
|
|
|
|
|
|
|
|
|
|
|
|
|
|
|||||||||||||||||
The accompanying notes are an integral part of these financial statements.
| 110 |
| Ohio National Fund, Inc. |
| Statements of Changes in Net Assets |
| International Portfolio |
Capital Appreciation Portfolio |
Millennium Portfolio |
International Small-Mid Company Portfolio |
|||||||||||||||||||||||||||||
| Year Ended December 31, 2012 |
Year Ended December 31, 2011 |
Year Ended December 31, 2012 |
Year Ended December 31, 2011 |
Year Ended December 31, 2012 |
Year Ended December 31, 2011 |
Year Ended December 31, 2012 |
Year Ended December 31, 2011 |
|||||||||||||||||||||||||
| Increase (Decrease) in Net Assets: |
||||||||||||||||||||||||||||||||
| Operations: |
||||||||||||||||||||||||||||||||
| Net investment income (loss) |
$ | 2,974,730 | $ | 2,763,902 | $ | 765,103 | $ | 512,592 | $ | (167,248 | ) | $ | (265,247 | ) | $ | 399,238 | $ | 759,480 | ||||||||||||||
| Net realized gain (loss) on investments, futures contracts, foreign currency contracts, and other foreign currency related transactions .. |
9,475,139 | 5,625,132 | 7,244,718 | 13,380,126 | 4,063,768 | 5,455,807 | 1,226,014 | 7,051,106 | ||||||||||||||||||||||||
| Change in unrealized appreciation/depreciation on investments, futures contracts, foreign currency contracts, and other foreign currency related transactions |
20,843,432 | (36,962,218 | ) | 10,984,140 | (15,407,876 | ) | (511,771 | ) | (5,423,430 | ) | 10,919,188 | (20,184,071 | ) | |||||||||||||||||||
|
|
|
|
|
|
|
|
|
|
|
|
|
|
|
|
|
|||||||||||||||||
| Change in net assets from operations |
33,293,301 | (28,573,184 | ) | 18,993,961 | (1,515,158 | ) | 3,384,749 | (232,870 | ) | 12,544,440 | (12,373,485 | ) | ||||||||||||||||||||
|
|
|
|
|
|
|
|
|
|
|
|
|
|
|
|
|
|||||||||||||||||
| Distributions to shareholders: |
||||||||||||||||||||||||||||||||
| Distributions from net investment income |
— | — | (681,205 | ) | (471,108 | ) | — | — | — | — | ||||||||||||||||||||||
|
|
|
|
|
|
|
|
|
|
|
|
|
|
|
|
|
|||||||||||||||||
| Capital transactions: |
||||||||||||||||||||||||||||||||
| Received from shares sold |
16,648,592 | 26,491,894 | 11,383,622 | 13,034,340 | 3,189,215 | 6,473,011 | 10,692,767 | 11,780,860 | ||||||||||||||||||||||||
| Received from dividends reinvested |
— | — | 681,205 | 471,108 | — | — | — | — | ||||||||||||||||||||||||
| Paid for shares redeemed |
(42,407,744 | ) | (38,194,519 | ) | (29,380,202 | ) | (26,649,763 | ) | (8,938,109 | ) | (11,842,246 | ) | (16,239,923 | ) | (20,534,648 | ) | ||||||||||||||||
|
|
|
|
|
|
|
|
|
|
|
|
|
|
|
|
|
|||||||||||||||||
| Change in net assets from capital transactions |
(25,759,152 | ) | (11,702,625 | ) | (17,315,375 | ) | (13,144,315 | ) | (5,748,894 | ) | (5,369,235 | ) | (5,547,156 | ) | (8,753,788 | ) | ||||||||||||||||
|
|
|
|
|
|
|
|
|
|
|
|
|
|
|
|
|
|||||||||||||||||
| Change in net assets |
7,534,149 | (40,275,809 | ) | 997,381 | (15,130,581 | ) | (2,364,145 | ) | (5,602,105 | ) | 6,997,284 | (21,127,273 | ) | |||||||||||||||||||
| Net Assets: |
||||||||||||||||||||||||||||||||
| Beginning of year |
172,809,983 | 213,085,792 | 114,670,478 | 129,801,059 | 36,475,228 | 42,077,333 | 57,485,307 | 78,612,580 | ||||||||||||||||||||||||
|
|
|
|
|
|
|
|
|
|
|
|
|
|
|
|
|
|||||||||||||||||
| End of year |
$ | 180,344,132 | $ | 172,809,983 | $ | 115,667,859 | $ | 114,670,478 | $ | 34,111,083 | $ | 36,475,228 | $ | 64,482,591 | $ | 57,485,307 | ||||||||||||||||
|
|
|
|
|
|
|
|
|
|
|
|
|
|
|
|
|
|||||||||||||||||
| Undistributed net investment income (loss) |
$ | 4,857,652 | $ | (975,843 | ) | $ | 83,350 | $ | 42,139 | $ | — | $ | — | $ | 324,350 | $ | 729,334 | |||||||||||||||
|
|
|
|
|
|
|
|
|
|
|
|
|
|
|
|
|
|||||||||||||||||
The accompanying notes are an integral part of these financial statements.
| 111 |
| Ohio National Fund, Inc. |
| Statements of Changes in Net Assets |
| Aggressive Growth Portfolio |
Small Cap Growth Portfolio |
Mid Cap Opportunity Portfolio |
S&P 500®
Index Portfolio |
|||||||||||||||||||||||||||||
| Year Ended December 31, 2012 |
Year Ended December 31, 2011 |
Year Ended December 31, 2012 |
Year Ended December 31, 2011 |
Year Ended December 31, 2012 |
Year Ended December 31, 2011 |
Year Ended December 31, 2012 |
Year Ended December 31, 2011 |
|||||||||||||||||||||||||
| Increase (Decrease) in Net Assets: |
||||||||||||||||||||||||||||||||
| Operations: |
||||||||||||||||||||||||||||||||
| Net investment income (loss) |
$ | 104,016 | $ | 4,686 | $ | (69,166 | ) | $ | (199,385 | ) | $ | (57,981 | ) | $ | (190,720 | ) | $ | 3,608,504 | $ | 2,834,031 | ||||||||||||
| Net realized gain (loss) on investments and foreign currency related transactions |
(286,285 | ) | 2,027,613 | 5,846,202 | 4,917,380 | 4,035,775 | 5,767,671 | 1,892,406 | (572,071 | ) | ||||||||||||||||||||||
| Change in unrealized appreciation/depreciation on investments and foreign currency related transactions |
5,979,480 | (3,411,059 | ) | (231,728 | ) | (3,905,022 | ) | 7,639,334 | (7,616,332 | ) | 21,351,067 | 489,142 | ||||||||||||||||||||
|
|
|
|
|
|
|
|
|
|
|
|
|
|
|
|
|
|||||||||||||||||
| Change in net assets from operations |
5,797,211 | (1,378,760 | ) | 5,545,308 | 812,973 | 11,617,128 | (2,039,381 | ) | 26,851,977 | 2,751,102 | ||||||||||||||||||||||
|
|
|
|
|
|
|
|
|
|
|
|
|
|
|
|
|
|||||||||||||||||
| Distributions to shareholders: |
||||||||||||||||||||||||||||||||
| Distributions from net investment income |
— | — | — | — | — | — | (2,826,655 | ) | (2,390,576 | ) | ||||||||||||||||||||||
|
|
|
|
|
|
|
|
|
|
|
|
|
|
|
|
|
|||||||||||||||||
| Capital transactions: |
||||||||||||||||||||||||||||||||
| Received from shares sold |
9,567,587 | 6,293,281 | 9,304,509 | 10,807,715 | 11,126,601 | 9,234,055 | 54,598,878 | 39,553,518 | ||||||||||||||||||||||||
| Received from dividends reinvested |
— | — | — | — | — | — | 2,826,655 | 2,390,576 | ||||||||||||||||||||||||
| Paid for shares redeemed |
(7,975,462 | ) | (8,916,428 | ) | (11,364,585 | ) | (12,221,376 | ) | (16,745,113 | ) | (16,499,127 | ) | (44,349,542 | ) | (47,804,467 | ) | ||||||||||||||||
|
|
|
|
|
|
|
|
|
|
|
|
|
|
|
|
|
|||||||||||||||||
| Change in net assets from capital transactions |
1,592,125 | (2,623,147 | ) | (2,060,076 | ) | (1,413,661 | ) | (5,618,512 | ) | (7,265,072 | ) | 13,075,991 | (5,860,373 | ) | ||||||||||||||||||
|
|
|
|
|
|
|
|
|
|
|
|
|
|
|
|
|
|||||||||||||||||
| Change in net assets |
7,389,336 | (4,001,907 | ) | 3,485,232 | (600,688 | ) | 5,998,616 | (9,304,453 | ) | 37,101,313 | (5,499,847 | ) | ||||||||||||||||||||
| Net Assets: |
||||||||||||||||||||||||||||||||
| Beginning of year |
25,755,345 | 29,757,252 | 31,498,747 | 32,099,435 | 61,062,990 | 70,367,443 | 170,679,207 | 176,179,054 | ||||||||||||||||||||||||
|
|
|
|
|
|
|
|
|
|
|
|
|
|
|
|
|
|||||||||||||||||
| End of year |
$ | 33,144,681 | $ | 25,755,345 | $ | 34,983,979 | $ | 31,498,747 | $ | 67,061,606 | $ | 61,062,990 | $ | 207,780,520 | $ | 170,679,207 | ||||||||||||||||
|
|
|
|
|
|
|
|
|
|
|
|
|
|
|
|
|
|||||||||||||||||
| Undistributed net investment income (loss) |
$ | 103,178 | $ | 3,051 | $ | — | $ | — | $ | — | $ | — | $ | 744,172 | $ | 437,674 | ||||||||||||||||
|
|
|
|
|
|
|
|
|
|
|
|
|
|
|
|
|
|||||||||||||||||
The accompanying notes are an integral part of these financial statements.
| 112 |
| Ohio National Fund, Inc. |
| Statements of Changes in Net Assets |
| Strategic Value Portfolio |
High Income Bond Portfolio |
Capital Growth Portfolio |
Nasdaq-100®
Index Portfolio |
|||||||||||||||||||||||||||||
| Year Ended December 31, 2012 |
Year Ended December 31, 2011 |
Year Ended December 31, 2012 |
Year Ended December 31, 2011 |
Year Ended December 31, 2012 |
Year Ended December 31, 2011 |
Year Ended December 31, 2012 |
Year Ended December 31, 2011 |
|||||||||||||||||||||||||
| Increase (Decrease) in Net Assets: |
||||||||||||||||||||||||||||||||
| Operations: |
||||||||||||||||||||||||||||||||
| Net investment income (loss) |
$ | 5,810,288 | $ | 1,209,761 | $ | 21,277,132 | $ | 21,132,185 | $ | (53,366 | ) | $ | (352,177 | ) | $ | 644,168 | $ | 225,802 | ||||||||||||||
| Net realized gain (loss) on investments, foreign currency contracts, and other foreign currency related transactions |
1,644,996 | 957,858 | 4,698,612 | 4,997,438 | 3,854,057 | 8,111,683 | 513,180 | 7,286,117 | ||||||||||||||||||||||||
| Change in unrealized appreciation/depreciation on investments, foreign currency contracts, and other foreign currency related transactions |
(2,810,944 | ) | 2,070,206 | 13,264,229 | (13,026,934 | ) | 3,014,667 | (9,323,741 | ) | 8,702,070 | (5,817,310 | ) | ||||||||||||||||||||
|
|
|
|
|
|
|
|
|
|
|
|
|
|
|
|
|
|||||||||||||||||
| Change in net assets from operations |
4,644,340 | 4,237,825 | 39,239,973 | 13,102,689 | 6,815,358 | (1,564,235 | ) | 9,859,418 | 1,694,609 | |||||||||||||||||||||||
|
|
|
|
|
|
|
|
|
|
|
|
|
|
|
|
|
|||||||||||||||||
| Distributions to shareholders: |
||||||||||||||||||||||||||||||||
| Distributions from net investment income |
(3,918,367 | ) | (599,193 | ) | — | — | — | — | (447,911 | ) | (205,415 | ) | ||||||||||||||||||||
|
|
|
|
|
|
|
|
|
|
|
|
|
|
|
|
|
|||||||||||||||||
| Capital transactions: |
||||||||||||||||||||||||||||||||
| Received from shares sold |
257,036,279 | 23,250,524 | 84,212,118 | 88,330,748 | 12,566,131 | 21,876,325 | 26,139,975 | 21,724,700 | ||||||||||||||||||||||||
| Received from dividends reinvested |
3,918,367 | 599,193 | — | — | — | — | 447,911 | 205,415 | ||||||||||||||||||||||||
| Paid for shares redeemed |
(35,500,770 | ) | (9,851,748 | ) | (78,999,032 | ) | (103,758,722 | ) | (15,372,139 | ) | (21,618,111 | ) | (22,928,127 | ) | (22,886,769 | ) | ||||||||||||||||
|
|
|
|
|
|
|
|
|
|
|
|
|
|
|
|
|
|||||||||||||||||
| Change in net assets from capital transactions |
225,453,876 | 13,997,969 | 5,213,086 | (15,427,974 | ) | (2,806,008 | ) | 258,214 | 3,659,759 | (956,654 | ) | |||||||||||||||||||||
|
|
|
|
|
|
|
|
|
|
|
|
|
|
|
|
|
|||||||||||||||||
| Change in net assets |
226,179,849 | 17,636,601 | 44,453,059 | (2,325,285 | ) | 4,009,350 | (1,306,021 | ) | 13,071,266 | 532,540 | ||||||||||||||||||||||
| Net Assets: |
||||||||||||||||||||||||||||||||
| Beginning of year |
41,983,861 | 24,347,260 | 267,461,878 | 269,787,163 | 51,105,385 | 52,411,406 | 55,470,937 | 54,938,397 | ||||||||||||||||||||||||
|
|
|
|
|
|
|
|
|
|
|
|
|
|
|
|
|
|||||||||||||||||
| End of year |
$ | 268,163,710 | $ | 41,983,861 | $ | 311,914,937 | $ | 267,461,878 | $ | 55,114,735 | $ | 51,105,385 | $ | 68,542,203 | $ | 55,470,937 | ||||||||||||||||
|
|
|
|
|
|
|
|
|
|
|
|
|
|
|
|
|
|||||||||||||||||
| Undistributed net investment income (loss) |
$ | 2,248,868 | $ | 560,303 | $ | 21,277,132 | $ | 21,132,185 | $ | — | $ | — | $ | 196,220 | $ | 20,387 | ||||||||||||||||
|
|
|
|
|
|
|
|
|
|
|
|
|
|
|
|
|
|||||||||||||||||
The accompanying notes are an integral part of these financial statements.
| 113 |
| Ohio National Fund, Inc. |
| Statements of Changes in Net Assets |
| Bristol Portfolio |
Bryton Growth Portfolio |
U.S. Equity Portfolio |
Balanced Portfolio |
|||||||||||||||||||||||||||||
| Year Ended December 31, 2012 |
Year Ended December 31, 2011 |
Year Ended December 31, 2012 |
Year Ended December 31, 2011 |
Year Ended December 31, 2012 |
Year Ended December 31, 2011 |
Year Ended December 31, 2012 |
Year Ended December 31, 2011 |
|||||||||||||||||||||||||
| Increase (Decrease) in Net Assets: |
||||||||||||||||||||||||||||||||
| Operations: |
||||||||||||||||||||||||||||||||
| Net investment income (loss) |
$ | 1,353,479 | $ | 980,932 | $ | (887,077 | ) | $ | (949,037 | ) | $ | 108,648 | $ | 87,152 | $ | 651,931 | $ | 382,509 | ||||||||||||||
| Net realized gain (loss) on investments, foreign currency related transactions, and written options |
8,239,659 | 13,130,771 | 12,311,997 | 23,283,240 | 528,811 | 890,153 | 358,264 | 351,511 | ||||||||||||||||||||||||
| Change in unrealized appreciation/depreciation on investments and foreign currency related transactions |
16,070,240 | (26,663,794 | ) | 5,904,468 | (33,319,384 | ) | 1,332,996 | (1,205,424 | ) | 2,012,821 | (479,142 | ) | ||||||||||||||||||||
|
|
|
|
|
|
|
|
|
|
|
|
|
|
|
|
|
|||||||||||||||||
| Change in net assets from operations |
25,663,378 | (12,552,091 | ) | 17,329,388 | (10,985,181 | ) | 1,970,455 | (228,119 | ) | 3,023,016 | 254,878 | |||||||||||||||||||||
|
|
|
|
|
|
|
|
|
|
|
|
|
|
|
|
|
|||||||||||||||||
| Distributions to shareholders: |
||||||||||||||||||||||||||||||||
| Distributions from net investment income |
(1,149,626 | ) | (910,805 | ) | — | — | (86,203 | ) | — | — | (324,529 | ) | ||||||||||||||||||||
|
|
|
|
|
|
|
|
|
|
|
|
|
|
|
|
|
|||||||||||||||||
| Capital transactions: |
||||||||||||||||||||||||||||||||
| Received from shares sold |
33,161,237 | 51,481,798 | 33,597,917 | 51,927,445 | 2,935,494 | 2,353,412 | 64,188,382 | 7,783,601 | ||||||||||||||||||||||||
| Received from dividends reinvested |
1,149,626 | 910,805 | — | — | 86,203 | — | — | 324,529 | ||||||||||||||||||||||||
| Paid for shares redeemed |
(46,593,004 | ) | (28,902,202 | ) | (48,711,366 | ) | (22,913,491 | ) | (2,679,663 | ) | (3,298,269 | ) | (7,131,199 | ) | (5,474,697 | ) | ||||||||||||||||
|
|
|
|
|
|
|
|
|
|
|
|
|
|
|
|
|
|||||||||||||||||
| Change in net assets from capital transactions |
(12,282,141 | ) | 23,490,401 | (15,113,449 | ) | 29,013,954 | 342,034 | (944,857 | ) | 57,057,183 | 2,633,433 | |||||||||||||||||||||
|
|
|
|
|
|
|
|
|
|
|
|
|
|
|
|
|
|||||||||||||||||
| Change in net assets |
12,231,611 | 10,027,505 | 2,215,939 | 18,028,773 | 2,226,286 | (1,172,976 | ) | 60,080,199 | 2,563,782 | |||||||||||||||||||||||
| Net Assets: |
||||||||||||||||||||||||||||||||
| Beginning of year |
192,672,135 | 182,644,630 | 155,440,585 | 137,411,812 | 13,336,011 | 14,508,987 | 17,056,728 | 14,492,946 | ||||||||||||||||||||||||
|
|
|
|
|
|
|
|
|
|
|
|
|
|
|
|
|
|||||||||||||||||
| End of year |
$ | 204,903,746 | $ | 192,672,135 | $ | 157,656,524 | $ | 155,440,585 | $ | 15,562,297 | $ | 13,336,011 | $ | 77,136,927 | $ | 17,056,728 | ||||||||||||||||
|
|
|
|
|
|
|
|
|
|
|
|
|
|
|
|
|
|||||||||||||||||
| Undistributed net investment income (loss) |
$ | 436,010 | $ | 70,114 | $ | (9,839 | ) | $ | 830,443 | $ | 22,445 | $ | 87,152 | $ | 651,938 | $ | 57,379 | |||||||||||||||
|
|
|
|
|
|
|
|
|
|
|
|
|
|
|
|
|
|||||||||||||||||
The accompanying notes are an integral part of these financial statements.
| 114 |
| Ohio National Fund, Inc. |
| Statements of Changes in Net Assets |
| Income Opportunity Portfolio |
Target VIP Portfolio |
Target Equity/Income Portfolio |
Bristol Growth Portfolio |
|||||||||||||||||||||||||||||
| Year Ended December 31, 2012 |
Year Ended December 31, 2011 |
Year Ended December 31, 2012 |
Year Ended December 31, 2011 |
Year Ended December 31, 2012 |
Year Ended December 31, 2011 |
Year Ended December 31, 2012 |
Year Ended December 31, 2011 |
|||||||||||||||||||||||||
| Increase (Decrease) in Net Assets: |
||||||||||||||||||||||||||||||||
| Operations: |
||||||||||||||||||||||||||||||||
| Net investment income (loss) |
$ | 119,759 | $ | 107,822 | $ | 377,630 | $ | 233,238 | $ | 566,036 | $ | 423,961 | $ | 594,594 | $ | 383,901 | ||||||||||||||||
| Net realized gain (loss) on investments, foreign currency related transactions, and written options |
(59,440 | ) | 450,532 | 632,490 | 2,534,963 | (2,479,335 | ) | 3,694,903 | 6,499,048 | 7,769,008 | ||||||||||||||||||||||
| Change in unrealized appreciation/depreciation on investments, foreign currency related transactions, and written options |
706,465 | (687,249 | ) | 2,048,046 | (3,060,087 | ) | 4,258,398 | (6,895,822 | ) | 4,359,363 | (9,674,876 | ) | ||||||||||||||||||||
|
|
|
|
|
|
|
|
|
|
|
|
|
|
|
|
|
|||||||||||||||||
| Change in net assets from operations |
766,784 | (128,895 | ) | 3,058,166 | (291,886 | ) | 2,345,099 | (2,776,958 | ) | 11,453,005 | (1,521,967 | ) | ||||||||||||||||||||
|
|
|
|
|
|
|
|
|
|
|
|
|
|
|
|
|
|||||||||||||||||
| Distributions to shareholders: |
||||||||||||||||||||||||||||||||
| Distributions from net investment income |
— | — | (297,777 | ) | (209,154 | ) | (449,704 | ) | (373,545 | ) | (473,865 | ) | (366,489 | ) | ||||||||||||||||||
|
|
|
|
|
|
|
|
|
|
|
|
|
|
|
|
|
|||||||||||||||||
| Capital transactions: |
||||||||||||||||||||||||||||||||
| Received from shares sold |
3,644,658 | 3,882,060 | 2,834,544 | 3,992,391 | 4,614,373 | 4,881,643 | 21,509,893 | 31,340,964 | ||||||||||||||||||||||||
| Received from dividends reinvested |
— | — | 297,777 | 209,154 | 449,704 | 373,545 | 473,865 | 366,489 | ||||||||||||||||||||||||
| Paid for shares redeemed |
(5,821,018 | ) | (2,567,327 | ) | (5,246,749 | ) | (5,020,379 | ) | (6,662,741 | ) | (7,036,529 | ) | (24,843,136 | ) | (15,201,793 | ) | ||||||||||||||||
|
|
|
|
|
|
|
|
|
|
|
|
|
|
|
|
|
|||||||||||||||||
| Change in net assets from capital transactions |
(2,176,360 | ) | 1,314,733 | (2,114,428 | ) | (818,834 | ) | (1,598,664 | ) | (1,781,341 | ) | (2,859,378 | ) | 16,505,660 | ||||||||||||||||||
|
|
|
|
|
|
|
|
|
|
|
|
|
|
|
|
|
|||||||||||||||||
| Change in net assets |
(1,409,576 | ) | 1,185,838 | 645,961 | (1,319,874 | ) | 296,731 | (4,931,844 | ) | 8,119,762 | 14,617,204 | |||||||||||||||||||||
| Net Assets: |
||||||||||||||||||||||||||||||||
| Beginning of year |
10,834,072 | 9,648,234 | 20,536,381 | 21,856,255 | 21,629,772 | 26,561,616 | 99,913,377 | 85,296,173 | ||||||||||||||||||||||||
|
|
|
|
|
|
|
|
|
|
|
|
|
|
|
|
|
|||||||||||||||||
| End of year |
$ | 9,424,496 | $ | 10,834,072 | $ | 21,182,342 | $ | 20,536,381 | $ | 21,926,503 | $ | 21,629,772 | $ | 108,033,139 | $ | 99,913,377 | ||||||||||||||||
|
|
|
|
|
|
|
|
|
|
|
|
|
|
|
|
|
|||||||||||||||||
| Undistributed net investment income |
$ | 119,759 | $ | 107,843 | $ | 79,804 | $ | 24,084 | $ | 116,187 | $ | 50,416 | $ | 221,599 | $ | 17,406 | ||||||||||||||||
|
|
|
|
|
|
|
|
|
|
|
|
|
|
|
|
|
|||||||||||||||||
The accompanying notes are an integral part of these financial statements.
| 115 |
| Ohio National Fund, Inc. |
| Equity Portfolio | Money Market Portfolio | |||||||||||||||||||||||||||||||||||||||
| Years Ended December 31, | Years Ended December 31, | |||||||||||||||||||||||||||||||||||||||
| 2012 | 2011 | 2010 | 2009 | 2008 | 2012 | 2011 | 2010 | 2009 | 2008 | |||||||||||||||||||||||||||||||
| Selected Per-Share Data: |
||||||||||||||||||||||||||||||||||||||||
| Net asset value, beginning of year |
$ | 18.88 | $ | 19.72 | $ | 18.31 | $ | 13.19 | $ | 29.65 | $ | 10.00 | $ | 10.00 | $ | 10.00 | $ | 10.00 | $ | 10.00 | ||||||||||||||||||||
| Operations: |
||||||||||||||||||||||||||||||||||||||||
| Net investment income |
0.35 | 0.21 | 0.04 | 0.05 | 0.22 | — | — | — | — | 0.17 | ||||||||||||||||||||||||||||||
| Net realized and unrealized gain (loss) on investments and foreign currency related transactions |
2.61 | (0.88 | ) | 1.41 | 5.11 | (16.48 | ) | — | — | — | — | — | ||||||||||||||||||||||||||||
|
|
|
|
|
|
|
|
|
|
|
|
|
|
|
|
|
|
|
|
|
|||||||||||||||||||||
| Total from operations |
2.96 | (0.67 | ) | 1.45 | 5.16 | (16.26 | ) | — | — | — | — | 0.17 | ||||||||||||||||||||||||||||
|
|
|
|
|
|
|
|
|
|
|
|
|
|
|
|
|
|
|
|
|
|||||||||||||||||||||
| Distributions: |
||||||||||||||||||||||||||||||||||||||||
| Distributions from net investment income |
(0.30 | ) | (0.17 | ) | (0.04 | ) | (0.04 | ) | (0.20 | ) | — | — | — | — | (0.17 | ) | ||||||||||||||||||||||||
|
|
|
|
|
|
|
|
|
|
|
|
|
|
|
|
|
|
|
|
|
|||||||||||||||||||||
| Net asset value, end of year |
$ | 21.54 | $ | 18.88 | $ | 19.72 | $ | 18.31 | $ | 13.19 | $ | 10.00 | $ | 10.00 | $ | 10.00 | $ | 10.00 | $ | 10.00 | ||||||||||||||||||||
|
|
|
|
|
|
|
|
|
|
|
|
|
|
|
|
|
|
|
|
|
|||||||||||||||||||||
| Total return |
15.69 | % | –3.38 | % | 7.91 | % | 39.11 | % | –54.81 | % | 0.00 | % | 0.00 | % | 0.00 | % | 0.00 | % | 1.77 | % | ||||||||||||||||||||
| Ratios and supplemental data: |
||||||||||||||||||||||||||||||||||||||||
| Net assets at end of year (millions) |
$ | 186.5 | $ | 187.9 | $ | 219.4 | $ | 226.5 | $ | 187.5 | $ | 258.6 | $ | 286.2 | $ | 293.4 | $ | 341.2 | $ | 402.5 | ||||||||||||||||||||
| Ratios to average net assets: |
||||||||||||||||||||||||||||||||||||||||
| Ratios net of expenses reduced or reimbursed by adviser: |
||||||||||||||||||||||||||||||||||||||||
| Expenses |
0.89 | % | 0.87 | % | 0.87 | % | 0.88 | % | 0.84 | % | 0.09 | % | 0.11 | % | 0.17 | % | 0.19 | % | 0.32 | % | ||||||||||||||||||||
| Net investment income |
1.55 | % | 1.00 | % | 0.21 | % | 0.27 | % | 0.89 | % | 0.00 | % | 0.00 | % | 0.00 | % | 0.00 | % | 1.72 | % | ||||||||||||||||||||
| Ratios assuming no expenses reduced or reimbursed by adviser: |
||||||||||||||||||||||||||||||||||||||||
| Expenses .. |
0.89 | % | 0.87 | % | 0.87 | % | 0.88 | % | 0.84 | % | 0.35 | % | 0.34 | % | 0.35 | % | 0.36 | % | 0.35 | % | ||||||||||||||||||||
| Net investment income (loss) |
1.55 | % | 1.00 | % | 0.21 | % | 0.27 | % | 0.89 | % | –0.26 | % | –0.23 | % | –0.18 | % | –0.17 | % | 1.68 | % | ||||||||||||||||||||
| Portfolio turnover rate |
48 | % | 54 | % | 50 | % | 24 | % | 39 | % | 0 | % | 0 | % | 0 | % | 0 | % | 0 | % | ||||||||||||||||||||
The accompanying notes are an integral part of these financial statements.
| 116 |
| Ohio National Fund, Inc. |
| Financial Highlights |
| Bond Portfolio | Omni Portfolio | |||||||||||||||||||||||||||||||||||||||
| Years Ended December 31, | Years Ended December 31, | |||||||||||||||||||||||||||||||||||||||
| 2012 | 2011 | 2010 | 2009 | 2008 | 2012 | 2011 | 2010 | 2009 | 2008 | |||||||||||||||||||||||||||||||
| Selected Per-Share Data: |
||||||||||||||||||||||||||||||||||||||||
| Net asset value, beginning of year |
$ | 14.05 | $ | 13.21 | $ | 12.25 | $ | 10.13 | $ | 11.44 | $ | 15.21 | $ | 16.08 | $ | 14.42 | $ | 11.02 | $ | 16.60 | ||||||||||||||||||||
| Operations: |
||||||||||||||||||||||||||||||||||||||||
| Net investment income |
0.51 | 0.48 | 0.52 | 0.49 | 1.04 | 0.26 | 0.25 | 0.28 | 0.29 | 0.40 | ||||||||||||||||||||||||||||||
| Net realized and unrealized gain (loss) on investments and foreign currency related transactions |
0.51 | 0.36 | 0.44 | 1.63 | (2.35 | ) | 1.57 | (0.91 | ) | 1.62 | 3.36 | (5.63 | ) | |||||||||||||||||||||||||||
|
|
|
|
|
|
|
|
|
|
|
|
|
|
|
|
|
|
|
|
|
|||||||||||||||||||||
| Total from operations |
1.02 | 0.84 | 0.96 | 2.12 | (1.31 | ) | 1.83 | (0.66 | ) | 1.90 | 3.65 | (5.23 | ) | |||||||||||||||||||||||||||
|
|
|
|
|
|
|
|
|
|
|
|
|
|
|
|
|
|
|
|
|
|||||||||||||||||||||
| Distributions: |
||||||||||||||||||||||||||||||||||||||||
| Distributions from net investment income |
— | — | — | — | — | (0.22 | ) | (0.21 | ) | (0.24 | ) | (0.25 | ) | (0.35 | ) | |||||||||||||||||||||||||
|
|
|
|
|
|
|
|
|
|
|
|
|
|
|
|
|
|
|
|
|
|||||||||||||||||||||
| Net asset value, end of year |
$ | 15.07 | $ | 14.05 | $ | 13.21 | $ | 12.25 | $ | 10.13 | $ | 16.82 | $ | 15.21 | $ | 16.08 | $ | 14.42 | $ | 11.02 | ||||||||||||||||||||
|
|
|
|
|
|
|
|
|
|
|
|
|
|
|
|
|
|
|
|
|
|||||||||||||||||||||
| Total return |
7.26 | % | 6.36 | % | 7.84 | % | 20.93 | % | –11.45 | % | 12.04 | % | –4.12 | % | 13.19 | % | 33.15 | % | –31.46 | % | ||||||||||||||||||||
| Ratios and supplemental data: |
||||||||||||||||||||||||||||||||||||||||
| Net assets at end of year (millions) |
$ | 172.2 | $ | 162.0 | $ | 148.2 | $ | 137.9 | $ | 107.8 | $ | 33.2 | $ | 34.7 | $ | 41.2 | $ | 41.5 | $ | 34.9 | ||||||||||||||||||||
| Ratios to average net assets: |
||||||||||||||||||||||||||||||||||||||||
| Expenses |
0.66 | % | 0.66 | % | 0.67 | % | 0.69 | % | 0.66 | % | 0.81 | % | 0.77 | % | 0.78 | % | 0.79 | % | 0.74 | % | ||||||||||||||||||||
| Net investment income |
3.41 | % | 3.70 | % | 3.91 | % | 5.06 | % | 5.35 | % | 1.49 | % | 1.40 | % | 1.71 | % | 2.18 | % | 2.43 | % | ||||||||||||||||||||
| Portfolio turnover rate |
18 | % | 15 | % | 22 | % | 27 | % | 15 | % | 179 | % | 147 | % | 182 | % | 157 | % | 128 | % | ||||||||||||||||||||
The accompanying notes are an integral part of these financial statements.
| 117 |
| Ohio National Fund, Inc. |
| Financial Highlights |
| International Portfolio | Capital Appreciation Portfolio | |||||||||||||||||||||||||||||||||||||||
| Years Ended December 31, | Years Ended December 31, | |||||||||||||||||||||||||||||||||||||||
| 2012 | 2011 | 2010 | 2009 | 2008 | 2012 | 2011 | 2010 | 2009 | 2008 | |||||||||||||||||||||||||||||||
| Selected Per-Share Data: |
||||||||||||||||||||||||||||||||||||||||
| Net asset value, beginning of year |
$ | 10.32 | $ | 12.20 | $ | 10.45 | $ | 7.56 | $ | 14.02 | $ | 19.95 | $ | 20.37 | $ | 17.45 | $ | 12.35 | $ | 20.45 | ||||||||||||||||||||
| Operations: |
||||||||||||||||||||||||||||||||||||||||
| Net investment income |
0.20 | 0.17 | 0.14 | 0.14 | 0.13 | 0.15 | 0.09 | 0.06 | 0.22 | 0.14 | ||||||||||||||||||||||||||||||
| Net realized and unrealized gain (loss) on investments, futures contracts, foreign currency contracts, and other foreign currency related transactions |
1.89 | (2.05 | ) | 1.61 | 2.75 | (6.59 | ) | 3.36 | (0.43 | ) | 2.90 | 5.07 | (8.12 | ) | ||||||||||||||||||||||||||
|
|
|
|
|
|
|
|
|
|
|
|
|
|
|
|
|
|
|
|
|
|||||||||||||||||||||
| Total from operations |
2.09 | (1.88 | ) | 1.75 | 2.89 | (6.46 | ) | 3.51 | (0.34 | ) | 2.96 | 5.29 | (7.98 | ) | ||||||||||||||||||||||||||
|
|
|
|
|
|
|
|
|
|
|
|
|
|
|
|
|
|
|
|
|
|||||||||||||||||||||
| Distributions: |
||||||||||||||||||||||||||||||||||||||||
| Distributions from net investment income |
— | — | — | — | — | (0.14 | ) | (0.08 | ) | (0.04 | ) | (0.19 | ) | (0.12 | ) | |||||||||||||||||||||||||
|
|
|
|
|
|
|
|
|
|
|
|
|
|
|
|
|
|
|
|
|
|||||||||||||||||||||
| Net asset value, end of year |
$ | 12.41 | $ | 10.32 | $ | 12.20 | $ | 10.45 | $ | 7.56 | $ | 23.32 | $ | 19.95 | $ | 20.37 | $ | 17.45 | $ | 12.35 | ||||||||||||||||||||
|
|
|
|
|
|
|
|
|
|
|
|
|
|
|
|
|
|
|
|
|
|||||||||||||||||||||
| Total return |
20.25 | % | –15.41 | % | 16.75 | % | 38.23 | % | –46.08 | % | 17.59 | % | –1.65 | % | 16.99 | % | 42.84 | % | –39.01 | % | ||||||||||||||||||||
| Ratios and supplemental data: |
||||||||||||||||||||||||||||||||||||||||
| Net assets at end of year (millions) |
$ | 180.3 | $ | 172.8 | $ | 213.1 | $ | 210.0 | $ | 179.7 | $ | 115.7 | $ | 114.7 | $ | 129.8 | $ | 126.3 | $ | 103.6 | ||||||||||||||||||||
| Ratios to average net assets: |
||||||||||||||||||||||||||||||||||||||||
| Expenses |
1.02 | % | 1.02 | % | 1.03 | % | 1.07 | % | 0.91 | % | 0.90 | % | 0.88 | % | 0.89 | % | 0.90 | % | 0.87 | % | ||||||||||||||||||||
| Net investment income |
1.65 | % | 1.41 | % | 1.15 | % | 1.47 | % | 1.03 | % | 0.66 | % | 0.41 | % | 0.31 | % | 1.38 | % | 0.71 | % | ||||||||||||||||||||
| Portfolio turnover rate |
61 | % | 58 | % | 67 | % | 168 | % | 214 | % | 39 | % | 61 | % | 58 | % | 84 | % | 79 | % | ||||||||||||||||||||
The accompanying notes are an integral part of these financial statements.
| 118 |
| Ohio National Fund, Inc. |
| Financial Highlights |
| Millennium Portfolio | International Small-Mid Company Portfolio | |||||||||||||||||||||||||||||||||||||||
| Years Ended December 31, | Years Ended December 31, | |||||||||||||||||||||||||||||||||||||||
| 2012 | 2011 | 2010 | 2009 | 2008 | 2012 | 2011 | 2010 | 2009 | 2008 | |||||||||||||||||||||||||||||||
| Selected Per-Share Data: |
||||||||||||||||||||||||||||||||||||||||
| Net asset value, beginning of year |
$ | 21.50 | $ | 21.69 | $ | 17.45 | $ | 14.44 | $ | 25.13 | $ | 19.17 | $ | 23.24 | $ | 19.41 | $ | 13.29 | $ | 27.29 | ||||||||||||||||||||
| Operations: |
||||||||||||||||||||||||||||||||||||||||
| Net investment income (loss) |
(0.12 | ) | (0.16 | ) | (0.27 | ) | (0.07 | ) | (0.16 | ) | 0.17 | 0.26 | 0.07 | 0.07 | 0.08 | |||||||||||||||||||||||||
| Net realized and unrealized gain (loss) on investments and foreign currency related transactions |
2.15 | (0.03 | ) | 4.51 | 3.08 | (10.53 | ) | 4.18 | (4.33 | ) | 3.76 | 6.05 | (14.08 | ) | ||||||||||||||||||||||||||
|
|
|
|
|
|
|
|
|
|
|
|
|
|
|
|
|
|
|
|
|
|||||||||||||||||||||
| Total from operations |
2.03 | (0.19 | ) | 4.24 | 3.01 | (10.69 | ) | 4.35 | (4.07 | ) | 3.83 | 6.12 | (14.00 | ) | ||||||||||||||||||||||||||
|
|
|
|
|
|
|
|
|
|
|
|
|
|
|
|
|
|
|
|
|
|||||||||||||||||||||
| Net asset value, end of year |
$ | 23.53 | $ | 21.50 | $ | 21.69 | $ | 17.45 | $ | 14.44 | $ | 23.52 | $ | 19.17 | $ | 23.24 | $ | 19.41 | $ | 13.29 | ||||||||||||||||||||
|
|
|
|
|
|
|
|
|
|
|
|
|
|
|
|
|
|
|
|
|
|||||||||||||||||||||
| Total return |
9.44 | % | –0.88 | % | 24.30 | % | 20.84 | % | –42.54 | % | 22.69 | % | –17.51 | % | 19.73 | % | 46.05 | % | –51.30 | % | ||||||||||||||||||||
| Ratios and supplemental data: |
||||||||||||||||||||||||||||||||||||||||
| Net assets at end of year (millions) |
$ | 34.1 | $ | 36.5 | $ | 42.1 | $ | 110.3 | $ | 34.2 | $ | 64.5 | $ | 57.5 | $ | 78.6 | $ | 71.1 | $ | 52.7 | ||||||||||||||||||||
| Ratios to average net assets: |
||||||||||||||||||||||||||||||||||||||||
| Expenses |
0.97 | % | 0.94 | % | 0.92 | % | 0.93 | % | 0.92 | % | 1.21 | % | 1.20 | % | 1.25 | % | 1.28 | % | 1.19 | % | ||||||||||||||||||||
| Net investment income (loss) |
–0.46 | % | –0.65 | % | –0.69 | % | –0.67 | % | –0.70 | % | 0.64 | % | 1.07 | % | 0.32 | % | 0.47 | % | 0.36 | % | ||||||||||||||||||||
| Portfolio turnover rate |
282 | % | 228 | % | 254 | % | 248 | % | 224 | % | 55 | % | 67 | % | 81 | % | 125 | % | 75 | % | ||||||||||||||||||||
The accompanying notes are an integral part of these financial statements.
| 119 |
| Ohio National Fund, Inc. |
| Financial Highlights |
| Aggressive Growth Portfolio | Small Cap Growth Portfolio | |||||||||||||||||||||||||||||||||||||||
| Years Ended December 31, | Years Ended December 31, | |||||||||||||||||||||||||||||||||||||||
| 2012 | 2011 | 2010 | 2009 | 2008 | 2012 | 2011 | 2010 | 2009 | 2008 | |||||||||||||||||||||||||||||||
| Selected Per-Share Data: |
||||||||||||||||||||||||||||||||||||||||
| Net asset value, beginning of year |
$ | 7.74 | $ | 8.17 | $ | 7.43 | $ | 5.21 | $ | 9.25 | $ | 13.21 | $ | 12.86 | $ | 9.89 | $ | 6.56 | $ | 12.54 | ||||||||||||||||||||
| Operations: |
||||||||||||||||||||||||||||||||||||||||
| Net investment income (loss) |
0.03 | — | 0.01 | (0.02 | ) | (0.01 | ) | (0.03 | ) | (0.08 | ) | (0.07 | ) | (0.06 | ) | (0.08 | ) | |||||||||||||||||||||||
| Net realized and unrealized gain (loss) on investments and foreign currency related transactions |
1.74 | (0.43 | ) | 0.73 | 2.24 | (4.03 | ) | 2.41 | 0.43 | 3.04 | 3.39 | (5.90 | ) | |||||||||||||||||||||||||||
|
|
|
|
|
|
|
|
|
|
|
|
|
|
|
|
|
|
|
|
|
|||||||||||||||||||||
| Total from operations |
1.77 | (0.43 | ) | 0.74 | 2.22 | (4.04 | ) | 2.38 | 0.35 | 2.97 | 3.33 | (5.98 | ) | |||||||||||||||||||||||||||
|
|
|
|
|
|
|
|
|
|
|
|
|
|
|
|
|
|
|
|
|
|||||||||||||||||||||
| Net asset value, end of year |
$ | 9.51 | $ | 7.74 | $ | 8.17 | $ | 7.43 | $ | 5.21 | $ | 15.59 | $ | 13.21 | $ | 12.86 | $ | 9.89 | $ | 6.56 | ||||||||||||||||||||
|
|
|
|
|
|
|
|
|
|
|
|
|
|
|
|
|
|
|
|
|
|||||||||||||||||||||
| Total return |
22.87 | % | –5.26 | % | 9.96 | % | 42.61 | % | –43.68 | % | 18.02 | % | 2.72 | % | 30.03 | % | 50.76 | % | –47.69 | % | ||||||||||||||||||||
| Ratios and supplemental data: |
||||||||||||||||||||||||||||||||||||||||
| Net assets at end of year (millions) |
$ | 33.1 | $ | 25.8 | $ | 29.8 | $ | 27.2 | $ | 18.0 | $ | 35.0 | $ | 31.5 | $ | 32.1 | $ | 22.8 | $ | 13.2 | ||||||||||||||||||||
| Ratios to average net assets: |
||||||||||||||||||||||||||||||||||||||||
| Expenses |
0.99 | % | 1.04 | % | 1.05 | % | 1.04 | % | 0.98 | % | 1.10 | % | 1.08 | % | 1.13 | % | 1.21 | % | 1.18 | % | ||||||||||||||||||||
| Net investment income (loss) |
0.34 | % | 0.02 | % | 0.17 | % | –0.23 | % | –0.04 | % | –0.20 | % | –0.60 | % | –0.70 | % | –0.77 | % | –0.84 | % | ||||||||||||||||||||
| Portfolio turnover rate |
17 | % | 47 | % | 37 | % | 28 | % | 43 | % | 65 | % | 58 | % | 94 | % | 50 | % | 37 | % | ||||||||||||||||||||
The accompanying notes are an integral part of these financial statements.
| 120 |
| Ohio National Fund, Inc. |
| Financial Highlights |
| Mid Cap Opportunity Portfolio | S&P 500® Index Portfolio | |||||||||||||||||||||||||||||||||||||||
| Years Ended December 31, | Years Ended December 31, | |||||||||||||||||||||||||||||||||||||||
| 2012 | 2011 | 2010 | 2009 | 2008 | 2012 | 2011 | 2010 | 2009 | 2008 | |||||||||||||||||||||||||||||||
| Selected Per-Share Data: |
||||||||||||||||||||||||||||||||||||||||
| Net asset value, beginning of year |
$ | 17.81 | $ | 18.43 | $ | 15.41 | $ | 10.96 | $ | 22.50 | $ | 13.25 | $ | 13.21 | $ | 11.69 | $ | 9.41 | $ | 15.36 | ||||||||||||||||||||
| Operations: |
||||||||||||||||||||||||||||||||||||||||
| Net investment income (loss) |
(0.02 | ) | (0.06 | ) | (0.06 | ) | (0.05 | ) | (0.07 | ) | 0.26 | 0.22 | 0.19 | 0.17 | 0.24 | |||||||||||||||||||||||||
| Net realized and unrealized gain (loss) on investments |
3.53 | (0.56 | ) | 3.08 | 4.50 | (11.47 | ) | 1.78 | 0.01 | 1.50 | 2.26 | (5.98 | ) | |||||||||||||||||||||||||||
|
|
|
|
|
|
|
|
|
|
|
|
|
|
|
|
|
|
|
|
|
|||||||||||||||||||||
| Total from operations |
3.51 | (0.62 | ) | 3.02 | 4.45 | (11.54 | ) | 2.04 | 0.23 | 1.69 | 2.43 | (5.74 | ) | |||||||||||||||||||||||||||
|
|
|
|
|
|
|
|
|
|
|
|
|
|
|
|
|
|
|
|
|
|||||||||||||||||||||
| Distributions: |
||||||||||||||||||||||||||||||||||||||||
| Distributions from net investment income |
— | — | — | — | — | (0.21 | ) | (0.19 | ) | (0.17 | ) | (0.15 | ) | (0.21 | ) | |||||||||||||||||||||||||
|
|
|
|
|
|
|
|
|
|
|
|
|
|
|
|
|
|
|
|
|
|||||||||||||||||||||
| Net asset value, end of year |
$ | 21.32 | $ | 17.81 | $ | 18.43 | $ | 15.41 | $ | 10.96 | $ | 15.08 | $ | 13.25 | $ | 13.21 | $ | 11.69 | $ | 9.41 | ||||||||||||||||||||
|
|
|
|
|
|
|
|
|
|
|
|
|
|
|
|
|
|
|
|
|
|||||||||||||||||||||
| Total return |
19.71 | % | –3.36 | % | 19.60 | % | 40.60 | % | –51.29 | % | 15.40 | % | 1.77 | % | 14.45 | % | 25.83 | % | –37.30 | % | ||||||||||||||||||||
| Ratios and supplemental data: |
||||||||||||||||||||||||||||||||||||||||
| Net assets at end of year (millions) |
$ | 67.1 | $ | 61.1 | $ | 70.4 | $ | 63.5 | $ | 79.6 | $ | 207.8 | $ | 170.7 | $ | 176.2 | $ | 160.7 | $ | 106.2 | ||||||||||||||||||||
| Ratios to average net assets: |
||||||||||||||||||||||||||||||||||||||||
| Expenses |
0.98 | % | 0.96 | % | 0.98 | % | 0.97 | % | 0.94 | % | 0.48 | % | 0.47 | % | 0.49 | % | 0.51 | % | 0.48 | % | ||||||||||||||||||||
| Net investment income (loss) |
–0.09 | % | –0.29 | % | –0.35 | % | –0.27 | % | –0.53 | % | 1.87 | % | 1.62 | % | 1.59 | % | 1.85 | % | 1.85 | % | ||||||||||||||||||||
| Portfolio turnover rate |
45 | % | 51 | % | 56 | % | 276 | % | 297 | % | 7 | % | 9 | % | 8 | % | 21 | % | 12 | % | ||||||||||||||||||||
The accompanying notes are an integral part of these financial statements.
| 121 |
| Ohio National Fund, Inc. |
| Financial Highlights |
| Strategic Value Portfolio | High Income Bond Portfolio | |||||||||||||||||||||||||||||||||||||||
| Years Ended December 31, | Years Ended December 31, | |||||||||||||||||||||||||||||||||||||||
| 2012 | 2011 | 2010 | 2009 | 2008 | 2012 | 2011 | 2010 | 2009 | 2008 | |||||||||||||||||||||||||||||||
| Selected Per-Share Data: |
||||||||||||||||||||||||||||||||||||||||
| Net asset value, beginning of year |
$ | 10.50 | $ | 9.36 | $ | 8.64 | $ | 7.97 | $ | 11.81 | $ | 12.97 | $ | 12.31 | $ | 10.79 | $ | 7.21 | $ | 9.68 | ||||||||||||||||||||
| Operations: |
||||||||||||||||||||||||||||||||||||||||
| Net investment income |
0.13 | 0.33 | 0.35 | 0.27 | 0.56 | 0.99 | 1.08 | 0.58 | 0.46 | 0.68 | ||||||||||||||||||||||||||||||
| Net realized and unrealized gain (loss) on investments and foreign currency related transactions |
0.63 | 0.98 | 0.68 | 0.65 | (3.91 | ) | 0.87 | (0.42 | ) | 0.94 | 3.12 | (3.15 | ) | |||||||||||||||||||||||||||
|
|
|
|
|
|
|
|
|
|
|
|
|
|
|
|
|
|
|
|
|
|||||||||||||||||||||
| Total from operations |
0.76 | 1.31 | 1.03 | 0.92 | (3.35 | ) | 1.86 | 0.66 | 1.52 | 3.58 | (2.47 | ) | ||||||||||||||||||||||||||||
|
|
|
|
|
|
|
|
|
|
|
|
|
|
|
|
|
|
|
|
|
|||||||||||||||||||||
| Distributions: |
||||||||||||||||||||||||||||||||||||||||
| Distributions from net investment income |
(0.17 | ) | (0.17 | ) | (0.24 | ) | (0.25 | ) | (0.49 | ) | — | — | — | — | — | |||||||||||||||||||||||||
| Return of capital distributions |
— | — | (0.07 | ) | — | — | — | — | — | — | — | |||||||||||||||||||||||||||||
|
|
|
|
|
|
|
|
|
|
|
|
|
|
|
|
|
|
|
|
|
|||||||||||||||||||||
| Total distributions |
(0.17 | ) | (0.17 | ) | (0.31 | ) | (0.25 | ) | (0.49 | ) | — | — | — | — | — | |||||||||||||||||||||||||
|
|
|
|
|
|
|
|
|
|
|
|
|
|
|
|
|
|
|
|
|
|||||||||||||||||||||
| Net asset value, end of year |
$ | 11.09 | $ | 10.50 | $ | 9.36 | $ | 8.64 | $ | 7.97 | $ | 14.83 | $ | 12.97 | $ | 12.31 | $ | 10.79 | $ | 7.21 | ||||||||||||||||||||
|
|
|
|
|
|
|
|
|
|
|
|
|
|
|
|
|
|
|
|
|
|||||||||||||||||||||
| Total return |
7.21 | % | 14.03 | % | 11.98 | % | 11.52 | % | –28.27 | % | 14.34 | % | 5.36 | % | 14.09 | % | 49.65 | % | –25.52 | % | ||||||||||||||||||||
| Ratios and supplemental data: |
||||||||||||||||||||||||||||||||||||||||
| Net assets at end of year (millions) |
$ | 268.2 | $ | 42.0 | $ | 24.3 | $ | 19.8 | $ | 13.3 | $ | 311.9 | $ | 267.5 | $ | 269.8 | $ | 159.9 | $ | 71.3 | ||||||||||||||||||||
| Ratios to average net assets: |
||||||||||||||||||||||||||||||||||||||||
| Expenses |
0.82 | % | 0.96 | % | 0.96 | % | 1.02 | % | 0.96 | % | 0.79 | % | 0.78 | % | 0.81 | % | 0.88 | % | 0.88 | % | ||||||||||||||||||||
| Net investment income |
3.84 | % | 4.07 | % | 4.11 | % | 4.31 | % | 4.68 | % | 7.17 | % | 7.69 | % | 8.03 | % | 9.14 | % | 8.77 | % | ||||||||||||||||||||
| Portfolio turnover rate |
30 | % | 19 | % | 31 | % | 42 | % | 162 | % | 35 | % | 35 | % | 33 | % | 20 | % | 18 | % | ||||||||||||||||||||
The accompanying notes are an integral part of these financial statements.
| 122 |
| Ohio National Fund, Inc. |
| Financial Highlights |
| Capital Growth Portfolio | Nasdaq-100® Index Portfolio | |||||||||||||||||||||||||||||||||||||||
| Years Ended December 31, | Years Ended December 31, | |||||||||||||||||||||||||||||||||||||||
| 2012 | 2011 | 2010 | 2009 | 2008 | 2012 | 2011 | 2010 | 2009 | 2008 | |||||||||||||||||||||||||||||||
| Selected Per-Share Data: |
||||||||||||||||||||||||||||||||||||||||
| Net asset value, beginning of year |
$ | 27.00 | $ | 27.68 | $ | 20.29 | $ | 15.00 | $ | 23.57 | $ | 5.85 | $ | 5.69 | $ | 4.78 | $ | 3.11 | $ | 5.36 | ||||||||||||||||||||
| Operations: |
||||||||||||||||||||||||||||||||||||||||
| Net investment income (loss) |
(0.03 | ) | (0.19 | ) | (0.11 | ) | — | (0.12 | ) | 0.06 | 0.02 | 0.02 | 0.01 | — | ||||||||||||||||||||||||||
| Net realized and unrealized gain (loss) on investments |
3.76 | (0.49 | ) | 7.50 | 5.29 | (8.45 | ) | 0.99 | 0.16 | 0.91 | 1.66 | (2.25 | ) | |||||||||||||||||||||||||||
|
|
|
|
|
|
|
|
|
|
|
|
|
|
|
|
|
|
|
|
|
|||||||||||||||||||||
| Total from operations |
3.73 | (0.68 | ) | 7.39 | 5.29 | (8.57 | ) | 1.05 | 0.18 | 0.93 | 1.67 | (2.25 | ) | |||||||||||||||||||||||||||
|
|
|
|
|
|
|
|
|
|
|
|
|
|
|
|
|
|
|
|
|
|||||||||||||||||||||
| Distributions: |
||||||||||||||||||||||||||||||||||||||||
| Distributions from net investment income |
— | — | — | — | — | (0.05 | ) | (0.02 | ) | (0.02 | ) | — | — | |||||||||||||||||||||||||||
|
|
|
|
|
|
|
|
|
|
|
|
|
|
|
|
|
|
|
|
|
|||||||||||||||||||||
| Net asset value, end of year |
$ | 30.73 | $ | 27.00 | $ | 27.68 | $ | 20.29 | $ | 15.00 | $ | 6.85 | $ | 5.85 | $ | 5.69 | $ | 4.78 | $ | 3.11 | ||||||||||||||||||||
|
|
|
|
|
|
|
|
|
|
|
|
|
|
|
|
|
|
|
|
|
|||||||||||||||||||||
| Total return |
13.81 | % | –2.46 | % | 36.42 | % | 35.27 | % | –36.36 | % | 17.88 | % | 3.19 | % | 19.38 | % | 53.70 | % | –41.98 | % | ||||||||||||||||||||
| Ratios and supplemental data: |
||||||||||||||||||||||||||||||||||||||||
| Net assets at end of year (millions) |
$ | 55.1 | $ | 51.1 | $ | 52.4 | $ | 36.8 | $ | 27.1 | $ | 68.5 | $ | 55.5 | $ | 54.9 | $ | 47.6 | $ | 28.1 | ||||||||||||||||||||
| Ratios to average net assets: |
||||||||||||||||||||||||||||||||||||||||
| Expenses |
1.04 | % | 1.02 | % | 1.04 | % | 1.07 | % | 1.04 | % | 0.53 | % | 0.52 | % | 0.54 | % | 0.56 | % | 0.54 | % | ||||||||||||||||||||
| Net investment income (loss) |
–0.10 | % | –0.64 | % | –0.50 | % | 0.02 | % | –0.66 | % | 0.98 | % | 0.41 | % | 0.39 | % | 0.19 | % | 0.01 | % | ||||||||||||||||||||
| Portfolio turnover rate |
42 | % | 44 | % | 56 | % | 67 | % | 63 | % | 25 | % | 44 | % | 30 | % | 29 | % | 27 | % | ||||||||||||||||||||
The accompanying notes are an integral part of these financial statements.
| 123 |
| Ohio National Fund, Inc. |
| Financial Highlights |
| Bristol Portfolio | Bryton Growth Portfolio | |||||||||||||||||||||||||||||||||||||||
| Years Ended December 31, | Years Ended December 31, | |||||||||||||||||||||||||||||||||||||||
| 2012 | 2011 | 2010 | 2009 | 2008 | 2012 | 2011 | 2010 | 2009 | 2008 | |||||||||||||||||||||||||||||||
| Selected Per-Share Data: |
||||||||||||||||||||||||||||||||||||||||
| Net asset value, beginning of year |
$ | 11.56 | $ | 12.51 | $ | 11.12 | $ | 8.23 | $ | 14.02 | $ | 12.31 | $ | 13.57 | $ | 10.94 | $ | 8.06 | $ | 13.33 | ||||||||||||||||||||
| Operations: |
||||||||||||||||||||||||||||||||||||||||
| Net investment income (loss) |
0.09 | 0.06 | 0.07 | 0.06 | 0.11 | (0.07 | ) | (0.08 | ) | (0.06 | ) | (0.05 | ) | (0.05 | ) | |||||||||||||||||||||||||
| Net realized and unrealized gain (loss) on investments and foreign currency related transactions |
1.43 | (0.95 | ) | 1.39 | 2.89 | (5.80 | ) | 1.46 | (1.18 | ) | 2.69 | 2.93 | (5.22 | ) | ||||||||||||||||||||||||||
|
|
|
|
|
|
|
|
|
|
|
|
|
|
|
|
|
|
|
|
|
|||||||||||||||||||||
| Total from operations |
1.52 | (0.89 | ) | 1.46 | 2.95 | (5.69 | ) | 1.39 | (1.26 | ) | 2.63 | 2.88 | (5.27 | ) | ||||||||||||||||||||||||||
|
|
|
|
|
|
|
|
|
|
|
|
|
|
|
|
|
|
|
|
|
|||||||||||||||||||||
| Distributions: |
||||||||||||||||||||||||||||||||||||||||
| Distributions from net investment income |
(0.07 | ) | (0.06 | ) | (0.07 | ) | (0.06 | ) | (0.10 | ) | — | — | — | — | — | |||||||||||||||||||||||||
|
|
|
|
|
|
|
|
|
|
|
|
|
|
|
|
|
|
|
|
|
|||||||||||||||||||||
| Net asset value, end of year |
$ | 13.01 | $ | 11.56 | $ | 12.51 | $ | 11.12 | $ | 8.23 | $ | 13.70 | $ | 12.31 | $ | 13.57 | $ | 10.94 | $ | 8.06 | ||||||||||||||||||||
|
|
|
|
|
|
|
|
|
|
|
|
|
|
|
|
|
|
|
|
|
|||||||||||||||||||||
| Total return |
13.19 | % | –7.16 | % | 13.10 | % | 35.83 | % | –40.54 | % | 11.29 | % | –9.29 | % | 24.04 | % | 35.73 | % | –39.53 | % | ||||||||||||||||||||
| Ratios and supplemental data: |
||||||||||||||||||||||||||||||||||||||||
| Net assets at end of year (millions) |
$ | 204.9 | $ | 192.7 | $ | 182.6 | $ | 142.8 | $ | 81.5 | $ | 157.7 | $ | 155.4 | $ | 137.4 | $ | 113.4 | $ | 59.0 | ||||||||||||||||||||
| Ratios to average net assets: |
||||||||||||||||||||||||||||||||||||||||
| Expenses. |
0.85 | % | 0.84 | % | 0.86 | % | 0.89 | % | 0.90 | % | 0.93 | % | 0.91 | % | 0.93 | % | 0.96 | % | 0.96 | % | ||||||||||||||||||||
| Net investment income (loss) |
0.68 | % | 0.52 | % | 0.70 | % | 0.79 | % | 1.13 | % | –0.57 | % | –0.67 | % | –0.49 | % | –0.64 | % | –0.62 | % | ||||||||||||||||||||
| Portfolio turnover rate |
244 | % | 198 | % | 253 | % | 223 | % | 184 | % | 152 | % | 156 | % | 118 | % | 82 | % | 54 | % | ||||||||||||||||||||
The accompanying notes are an integral part of these financial statements.
| 124 |
| Ohio National Fund, Inc. |
| Financial Highlights |
| U.S. Equity Portfolio | Balanced Portfolio | |||||||||||||||||||||||||||||||||||||||
| Years Ended December 31, | Years Ended December 31, | |||||||||||||||||||||||||||||||||||||||
| 2012 | 2011 | 2010 | 2009 | 2008 | 2012 | 2011 | 2010 | 2009 | 2008 | |||||||||||||||||||||||||||||||
| Selected Per-Share Data: |
||||||||||||||||||||||||||||||||||||||||
| Net asset value, beginning of year |
$ | 10.03 | $ | 10.23 | $ | 9.16 | $ | 7.91 | $ | 15.45 | $ | 13.91 | $ | 13.87 | $ | 13.13 | $ | 10.74 | $ | 14.70 | ||||||||||||||||||||
| Operations: |
||||||||||||||||||||||||||||||||||||||||
| Net investment income |
0.08 | 0.07 | 0.08 | 0.07 | 0.14 | 0.10 | 0.31 | 0.32 | 0.29 | 0.25 | ||||||||||||||||||||||||||||||
| Net realized and unrealized gain (loss) on investments foreign currency related transactions, and written options |
1.38 | (0.27 | ) | 1.06 | 1.24 | (7.56 | ) | 1.75 | (0.00 | ) | 0.70 | 2.39 | (4.21 | ) | ||||||||||||||||||||||||||
|
|
|
|
|
|
|
|
|
|
|
|
|
|
|
|
|
|
|
|
|
|||||||||||||||||||||
| Total from operation |
1.46 | (0.20 | ) | 1.14 | 1.31 | (7.42 | ) | 1.85 | 0.31 | 1.02 | 2.68 | (3.96 | ) | |||||||||||||||||||||||||||
|
|
|
|
|
|
|
|
|
|
|
|
|
|
|
|
|
|
|
|
|
|||||||||||||||||||||
| Distributions: |
||||||||||||||||||||||||||||||||||||||||
| Distributions from net investment income |
(0.06 | ) | — | (0.07 | ) | (0.06 | ) | (0.12 | ) | — | (0.27 | ) | (0.28 | ) | (0.29 | ) | — | |||||||||||||||||||||||
|
|
|
|
|
|
|
|
|
|
|
|
|
|
|
|
|
|
|
|
|
|||||||||||||||||||||
| Net asset value, end of year |
$ | 11.43 | $ | 10.03 | $ | 10.23 | $ | 9.16 | $ | 7.91 | $ | 15.76 | $ | 13.91 | $ | 13.87 | $ | 13.13 | $ | 10.74 | ||||||||||||||||||||
|
|
|
|
|
|
|
|
|
|
|
|
|
|
|
|
|
|
|
|
|
|||||||||||||||||||||
| Total return |
14.61 | % | –1.96 | % | 12.46 | % | 16.57 | % | –47.98 | % | 13.30 | % | 2.29 | % | 7.78 | % | 24.92 | % | –26.94 | % | ||||||||||||||||||||
| Ratios and supplemental data: |
||||||||||||||||||||||||||||||||||||||||
| Net assets at end of year (millions) |
$ | 15.6 | $ | 13.3 | $ | 14.5 | $ | 14.6 | $ | 13.0 | $ | 77.1 | $ | 17.1 | $ | 14.5 | $ | 13.6 | $ | 9.6 | ||||||||||||||||||||
| Ratios to average net assets: |
||||||||||||||||||||||||||||||||||||||||
| Expenses |
1.02 | % | 0.99 | % | 1.01 | % | 1.04 | % | 0.96 | % | 0.86 | % | 0.94 | % | 0.99 | % | 1.08 | % | 1.09 | % | ||||||||||||||||||||
| Net investment income |
0.73 | % | 0.61 | % | 0.86 | % | 0.90 | % | 1.19 | % | 1.90 | % | 2.33 | % | 2.48 | % | 2.99 | % | 2.29 | % | ||||||||||||||||||||
| Portfolio turnover rate |
53 | % | 75 | % | 98 | % | 173 | % | 216 | % | 60 | % | 47 | % | 56 | % | 72 | % | 80 | % | ||||||||||||||||||||
The accompanying notes are an integral part of these financial statements.
| 125 |
| Ohio National Fund, Inc. |
| Financial Highlights |
| Income Opportunity Portfolio | Target VIP Portfolio | |||||||||||||||||||||||||||||||||||||||
| Years Ended December 31, | Years Ended December 31, | |||||||||||||||||||||||||||||||||||||||
| 2012 | 2011 | 2010 | 2009 | 2008 | 2012 | 2011 | 2010 | 2009 | 2008 | |||||||||||||||||||||||||||||||
| Selected Per-Share Data: |
||||||||||||||||||||||||||||||||||||||||
| Net asset value, beginning of year |
$ | 11.86 | $ | 11.99 | $ | 11.19 | $ | 9.89 | $ | 12.49 | $ | 8.89 | $ | 9.11 | $ | 7.72 | $ | 6.81 | $ | 12.23 | ||||||||||||||||||||
| Operations: |
||||||||||||||||||||||||||||||||||||||||
| Net investment income (loss) |
0.19 | 0.11 | 0.08 | 0.01 | 0.10 | 0.18 | 0.10 | 0.13 | 0.11 | 0.12 | ||||||||||||||||||||||||||||||
| Net realized and unrealized gain (loss) on investments, foreign currency related transactions, and written options |
0.68 | (0.24 | ) | 0.72 | 1.29 | (2.70 | ) | 1.17 | (0.23 | ) | 1.37 | 0.90 | (5.42 | ) | ||||||||||||||||||||||||||
|
|
|
|
|
|
|
|
|
|
|
|
|
|
|
|
|
|
|
|
|
|||||||||||||||||||||
| Total from operations |
0.87 | (0.13 | ) | 0.80 | 1.30 | (2.60 | ) | 1.35 | (0.13 | ) | 1.50 | 1.01 | (5.30 | ) | ||||||||||||||||||||||||||
|
|
|
|
|
|
|
|
|
|
|
|
|
|
|
|
|
|
|
|
|
|||||||||||||||||||||
| Distributions: |
||||||||||||||||||||||||||||||||||||||||
| Distributions from net investment income |
— | — | — | — | — | (0.14 | ) | (0.09 | ) | (0.11 | ) | (0.10 | ) | (0.12 | ) | |||||||||||||||||||||||||
|
|
|
|
|
|
|
|
|
|
|
|
|
|
|
|
|
|
|
|
|
|||||||||||||||||||||
| Net asset value, end of year |
$ | 12.73 | $ | 11.86 | $ | 11.99 | $ | 11.19 | $ | 9.89 | $ | 10.10 | $ | 8.89 | $ | 9.11 | $ | 7.72 | $ | 6.81 | ||||||||||||||||||||
|
|
|
|
|
|
|
|
|
|
|
|
|
|
|
|
|
|
|
|
|
|||||||||||||||||||||
| Total return |
7.34 | % | –1.08 | % | 7.15 | % | 13.14 | % | –20.82 | % | 15.24 | % | –1.41 | % | 19.47 | % | 14.77 | % | –43.34 | % | ||||||||||||||||||||
| Ratios and supplemental data: |
||||||||||||||||||||||||||||||||||||||||
| Net assets at end of year (millions) |
$ | 9.4 | $ | 10.8 | $ | 9.6 | $ | 6.7 | $ | 4.5 | $ | 21.2 | $ | 20.5 | $ | 21.9 | $ | 20.6 | $ | 18.2 | ||||||||||||||||||||
| Ratios to average net assets: |
||||||||||||||||||||||||||||||||||||||||
| Ratios net of expenses reduced or reimbursed by adviser: |
||||||||||||||||||||||||||||||||||||||||
| Expenses |
1.19 | % | 1.18 | % | 1.27 | % | 1.56 | % | 1.62 | % | 0.87 | % | 0.84 | % | 0.82 | % | 0.83 | % | 0.80 | % | ||||||||||||||||||||
| Net investment income (loss) |
1.12 | % | 1.04 | % | 0.89 | % | 0.40 | % | 0.98 | % | 1.73 | % | 1.07 | % | 1.50 | % | 1.53 | % | 1.45 | % | ||||||||||||||||||||
| Ratios assuming no expenses reduced or reimbursed by adviser: |
||||||||||||||||||||||||||||||||||||||||
| Expenses |
1.19 | % | 1.18 | % | 1.30 | % | 1.56 | % | 1.62 | % | 0.87 | % | 0.84 | % | 0.82 | % | 0.83 | % | 0.80 | % | ||||||||||||||||||||
| Net investment income (loss) |
1.12 | % | 1.04 | % | 0.87 | % | 0.40 | % | 0.98 | % | 1.73 | % | 1.07 | % | 1.50 | % | 1.53 | % | 1.45 | % | ||||||||||||||||||||
| Portfolio turnover rate |
53 | % | 114 | % | 92 | % | 200 | % | 203 | % | 70 | % | 79 | % | 92 | % | 91 | % | 79 | % | ||||||||||||||||||||
The accompanying notes are an integral part of these financial statements.
| 126 |
| Ohio National Fund, Inc. |
| Financial Highlights |
| Target Equity/Income Portfolio | Bristol Growth Portfolio | |||||||||||||||||||||||||||||||||||||||
| Years Ended December 31, | Years Ended December 31, | |||||||||||||||||||||||||||||||||||||||
| 2012 | 2011 | 2010 | 2009 | 2008 | 2012 | 2011 | 2010 | 2009 | 2008 | |||||||||||||||||||||||||||||||
| Selected Per-Share Data: |
||||||||||||||||||||||||||||||||||||||||
| Net asset value, beginning of period |
$ | 7.52 | $ | 8.61 | $ | 7.07 | $ | 6.41 | $ | 12.00 | $ | 9.63 | $ | 9.84 | $ | 8.75 | $ | 6.15 | $ | 10.35 | ||||||||||||||||||||
| Operations: |
||||||||||||||||||||||||||||||||||||||||
| Net investment income |
0.22 | 0.15 | 0.12 | 0.15 | 0.19 | 0.06 | 0.04 | 0.02 | 0.01 | 0.01 | ||||||||||||||||||||||||||||||
| Net realized and unrealized gain (loss) on investments |
0.61 | (1.11 | ) | 1.52 | 0.64 | (5.61 | ) | 1.02 | (0.21 | ) | 1.10 | 2.59 | (4.21 | ) | ||||||||||||||||||||||||||
|
|
|
|
|
|
|
|
|
|
|
|
|
|
|
|
|
|
|
|
|
|||||||||||||||||||||
| Total from operations. |
0.83 | (0.96 | ) | 1.64 | 0.79 | (5.42 | ) | 1.08 | (0.17 | ) | 1.12 | 2.60 | (4.20 | ) | ||||||||||||||||||||||||||
|
|
|
|
|
|
|
|
|
|
|
|
|
|
|
|
|
|
|
|
|
|||||||||||||||||||||
| Distributions: |
||||||||||||||||||||||||||||||||||||||||
| Distributions from net investment income |
(0.17 | ) | (0.13 | ) | (0.10 | ) | (0.13 | ) | (0.17 | ) | (0.05 | ) | (0.04 | ) | (0.03 | ) | — | — | ||||||||||||||||||||||
|
|
|
|
|
|
|
|
|
|
|
|
|
|
|
|
|
|
|
|
|
|||||||||||||||||||||
| Net asset value, end of period |
$ | 8.18 | $ | 7.52 | $ | 8.61 | $ | 7.07 | $ | 6.41 | $ | 10.66 | $ | 9.63 | $ | 9.84 | $ | 8.75 | $ | 6.15 | ||||||||||||||||||||
|
|
|
|
|
|
|
|
|
|
|
|
|
|
|
|
|
|
|
|
|
|||||||||||||||||||||
| Total return |
11.08 | % | –11.09 | % | 23.23 | % | 12.33 | % | –45.07 | % | 11.20 | % | –1.77 | % | 12.79 | % | 42.28 | % | –40.58 | % | ||||||||||||||||||||
| Ratios and supplemental data: |
||||||||||||||||||||||||||||||||||||||||
| Net assets at end of period (millions) |
$ | 21.9 | $ | 21.6 | $ | 26.6 | $ | 22.6 | $ | 24.1 | $ | 108.0 | $ | 99.9 | $ | 85.3 | $ | 10.5 | $ | 4.8 | ||||||||||||||||||||
| Ratios to average net assets: |
||||||||||||||||||||||||||||||||||||||||
| Expenses |
0.84 | % | 0.78 | % | 0.78 | % | 0.79 | % | 0.74 | % | 0.92 | % | 0.90 | % | 0.93 | % | 1.29 | % | 1.26 | % | ||||||||||||||||||||
| Net investment income |
2.48 | % | 1.75 | % | 1.56 | % | 2.03 | % | 2.05 | % | 0.57 | % | 0.41 | % | 0.63 | % | 0.26 | % | 0.18 | % | ||||||||||||||||||||
| Portfolio turnover rate |
83 | % | 99 | % | 90 | % | 95 | % | 105 | % | 229 | % | 187 | % | 268 | % | 218 | % | 175 | % | ||||||||||||||||||||
The accompanying notes are an integral part of these financial statements.
| 127 |
| Ohio National Fund, Inc. |
| December 31, 2012 |
| (1) | Organization |
Ohio National Fund, Inc. (the “Fund”) is a Maryland corporation registered under the Investment Company Act of 1940, as amended (the “40 Act”), as an open-end management investment company. The Fund consists of twenty-four separate investment portfolios (the “Portfolios”) that seek the following objectives and strategies:
| ¢ | Equity Portfolio — Long-term growth of capital by investing at least 80% of its assets in equity securities. |
| ¢ | Money Market Portfolio — Maximum current income consistent with preservation of capital and liquidity by investing in high quality money market instruments. |
| ¢ | Bond Portfolio — High level of income and opportunity for capital appreciation consistent with preservation of capital by investing primarily in intermediate-term and long-term fixed income securities. |
| ¢ | Omni Portfolio — High level of long-term total return consistent with preservation of capital by investing in stocks, bonds, and money market instruments. |
| ¢ | International Portfolio — Long term growth of capital by investing at least 80% of its assets in securities of foreign companies. |
| ¢ | Capital Appreciation Portfolio — Long-term capital growth by investing primarily in common stocks of established companies with either current or emerging earnings growth not fully appreciated or recognized by the market. |
| ¢ | Millennium Portfolio — Capital growth by investing primarily in common stocks of small sized companies. |
| ¢ | International Small-Mid Company Portfolio — Long-term growth of capital by investing at least 80% of its assets in equity securities of foreign small and mid-cap companies. |
| ¢ | Aggressive Growth Portfolio — Long-term capital growth by investing primarily in domestic and foreign equity securities selected for growth potential. |
| ¢ | Small Cap Growth Portfolio — Long-term capital appreciation by investing at least 80% of its net assets in stocks of small companies. |
| ¢ | Mid Cap Opportunity Portfolio — Long-term total return by investing at least 80% of its net assets in equity securities of mid-cap companies, primarily those that are strategically positioned for long-term growth. |
| ¢ | S&P 500® Index Portfolio — Total return that approximates the total return of the Standard & Poor’s 500® Index, at a risk level consistent with that of the Standard & Poor’s 500® Index. |
| ¢ | Strategic Value Portfolio — Growth of capital and income by investing primarily in securities of high dividend yielding, undervalued stocks with dividend growth potential. |
| ¢ | High Income Bond Portfolio — High current income by investing at least 80% of its net assets in lower rated corporate debt obligations commonly referred to as “junk bonds”. The Portfolio’s investments are generally rated Ba or lower by Moody’s, or BB or lower by Standard & Poor’s or Fitch. |
| ¢ | Capital Growth Portfolio — Long-term capital appreciation by investing primarily in an actively managed portfolio of equity securities of small cap growth companies. |
| ¢ | Nasdaq-100® Index Portfolio — Long-term growth of capital by investing primarily in stocks that are included in the Nasdaq-100® Index. Unlike the other Portfolios of the Fund, the Nasdaq-100® Index Portfolio is a non-diversified portfolio for purposes of Section 5(b) of the 40 Act. |
| ¢ | Bristol Portfolio — Long-term growth of capital by investing primarily in common stocks of the 1,000 largest publicly traded U.S. companies in terms of market capitalization. |
| ¢ | Bryton Growth Portfolio — Long-term growth of capital by investing primarily in common stocks of growth-oriented U.S. companies smaller than the 500 largest publicly traded U.S. companies in terms of market capitalization. |
| ¢ | U.S. Equity Portfolio — Capital appreciation with a secondary objective of capital preservation to provide long term growth by investing at least 80% of its net assets in equity securities traded in the U.S. within under-priced sectors and industries. |
| 128 | (continued) |
| Ohio National Fund, Inc. |
| Notes to Financial Statements (Continued) |
December 31, 2012 |
| ¢ | Balanced Portfolio — Capital appreciation and income by investing normally up to 75% of its assets in equity securities within under-priced sectors and industries while maintaining a minimum of 25% of its assets in fixed income securities. |
| ¢ | Income Opportunity Portfolio — Modest capital appreciation and maximization of realized gains by investing in equity securities traded in the U.S. |
| ¢ | Target VIP Portfolio — Above average total return by investing in the common stocks of companies which are identified by a model that applies separate uniquely specialized strategies. |
| ¢ | Target Equity/Income Portfolio — Above average total return by adhering to a disciplined, quantitative investment process that incorporates two distinct strategy methodologies. |
| ¢ | Bristol Growth Portfolio — Long-term growth of capital by investing primarily in common stocks of the 1,000 largest publicly traded U.S. companies in terms of market capitalization. |
Additional detail regarding portfolio-specific objectives, policies, and investment strategies is provided in the prospectus and Statement of Additional Information of Ohio National Fund, Inc. There are no assurances that these objectives will be met. Each Portfolio, except the Nasdaq-100® Index Portfolio, is classified as diversified for purposes of Section 5(b) of the 40 Act.
At present, the Fund sells its shares only to separate accounts of The Ohio National Life Insurance Company (“ONLIC”), Ohio National Life Assurance Corporation (“ONLAC”), and National Security Life and Annuity Company (“NSLA”) to support certain benefits under variable contracts issued by those entities. In the future, Fund shares may be used for other purposes but, unless there is a change in applicable law, they will not be sold directly to the public.
Interest in each Portfolio is represented by a separate class of the Fund’s capital stock, par value $1. Each share of a Portfolio participates equally in the Portfolio’s dividends, distributions, net assets, and voting matters.
The Fund is authorized to issue 550 million of its capital shares. These authorized shares have been allocated to specific Portfolios of the Fund as follows:
The Fund’s Board of Directors (the “Board”) periodically reallocates authorized shares among the Portfolios of the Fund and may authorize additional shares as deemed necessary.
Under the Fund’s organizational documents, its Officers and Directors are indemnified against certain liabilities arising out of the performance of their duties to the Fund. In addition, in the normal course of business, the Fund enters into contracts with its vendors and others that provide for general indemnifications. The Fund’s maximum exposure under these arrangements is unknown as this would involve future claims that may be made against the Fund. However, based on experience, the risk of loss to the Fund is expected to be remote.
| 129 | (continued) |
| Ohio National Fund, Inc. |
| Notes to Financial Statements (Continued) |
December 31, 2012 |
| (2) | Significant Accounting Policies |
The following is a summary of significant accounting policies followed by the Fund in preparation of its financial statements:
Use of Estimates
The preparation of financial statements in conformity with U.S. generally accepted accounting principles (“GAAP”) requires management to make estimates and assumptions that affect the reported amounts of assets and liabilities and disclosure of contingent assets and liabilities at the date of the financial statements and the reported amounts of increases and decreases in net assets from operations during the reporting period. Actual results could differ from those estimates.
Security Valuation
Investments are valued using pricing procedures approved by the Board.
Various investments in the Money Market Portfolio are valued at amortized cost in accordance with Rule 2a-7 of the 40 Act. In all Portfolios of the Fund, fixed income instruments that mature in sixty days or less, and of sufficient credit quality, are valued at amortized cost. Amortized cost valuation involves valuing a security at its cost initially and thereafter amortizing to maturity any discounts or premiums on the level-yield method, regardless of the impact of fluctuating market interest rates on the value of the security. In these instances, amortized cost approximates fair value.
Investments, other than those securities aforementioned, are valued as follows:
Domestic equity securities that are traded on U.S. exchanges are valued at the last trade price reported by the primary exchange of each security (4:00 pm Eastern Time for normal trading sessions). Over-the-counter domestic equity securities are valued at the last trade price reported daily as of 4:00 pm Eastern Time (normal trading sessions). Over-the-counter traded ADRs may also be valued at an evaluated price based on the value of the underlying securities. If a domestic equity security is not traded on a particular day, the mean between the bid and ask prices reported at 4:00 pm Eastern Time (normal trading sessions) by the primary exchange will generally be used for valuation purposes. The principal sources for market quotations are independent pricing services that have been approved by the Board.
Fixed income securities that have a remaining maturity exceeding sixty days are generally valued at the mean between the daily close bid and ask prices reported at 4:00 pm Eastern Time (normal trading sessions), as provided by independent pricing services approved by the Board.
Shares of open-end mutual funds are valued at each fund’s last calculated net asset value per share.
Repurchase agreements are valued at amortized cost, which approximates fair value.
Restricted securities, illiquid securities, or other investments for which market quotations or other observable market inputs are not readily available are valued at an estimate of value using methods determined in good faith by the Fund’s Pricing Committee under the supervision of the Board.
Foreign equity securities are initially priced at the reported close price of the exchange on which a security is primarily traded. Securities not traded on a particular day are valued at the mean between the last reported bid and ask quotes at daily close, or the last sale price when appropriate. The principal sources for market quotations are independent pricing services that have been approved by the Board.
Equity securities that are primarily traded on foreign exchanges, other than those in North or South America, are further subjected to fair valuation pricing procedures provided by an independent fair valuation service. The service provides data that can be used to estimate the price of a foreign issue that would prevail in a liquid market given market information available daily at 4:00 pm Eastern Time (normal trading sessions). Multiple factors may be considered in performing this valuation, including an issue’s local close price, relevant general and sector indices, currency fluctuations, and pricing of related depository receipts, exchange traded funds, and futures. The pricing procedures are performed for each individual security for which there is a fairly large degree of certainty that the local close price is not the liquid market price at the time of U.S. market close. The procedures are performed each day there is a change in a consistently used market index from the time of local close to the U.S. market close. Backtesting analysis is performed on a quarterly basis to monitor the effectiveness of these procedures. The testing is reviewed by management of the Fund as well as the Fund’s Board. Prior results have indicated that these procedures have been effective in reaching valuation objectives.
| 130 | (continued) |
| Ohio National Fund, Inc. |
| Notes to Financial Statements (Continued) |
December 31, 2012 |
The differences between the aggregate cost and values of investments are reflected as unrealized appreciation or unrealized depreciation.
Pricing inputs used in the Fund’s determination of its investment values are categorized according to a three-tier hierarchy framework. The hierarchy is summarized in three broad levels:
| Level 1: | Quoted prices in active markets for identical securities. |
| Level 2: | Other significant observable inputs, including quoted prices for similar securities, interest rates, prepayment speeds, credit risk, etc. |
| Level 3: | Significant unobservable inputs, including the Fund’s own assumptions used to determine the value of securities. |
The following is a summary of the inputs used in valuing each of the Portfolio’s assets (liabilities) at value as of December 31, 2012:
| Portfolio |
Financial Instrument Type |
Level 1 | Level 2 | Level 3 | ||||||||||
| Equity |
Common Stocks** | $ | 181,176,531 | $ | — | $ | — | |||||||
| Preferred Stocks** | 3,040,557 | — | — | |||||||||||
| Money Market Funds | 1,775,000 | — | — | |||||||||||
|
|
|
|
|
|
|
|||||||||
| $ | 185,992,088 | $ | — | $ | — | |||||||||
|
|
|
|
|
|
|
|||||||||
| Money Market* |
Commercial Paper** | $ | — | $ | 160,992,668 | $ | — | |||||||
| Asset-Backed Securities** | — | 1,237,913 | — | |||||||||||
| U.S. Government Agency Issues | — | 11,998,035 | — | |||||||||||
| U.S. Treasury Obligations | — | 9,999,278 | — | |||||||||||
| Money Market Funds | 30,000,000 | — | — | |||||||||||
|
|
|
|
|
|
|
|||||||||
| $ | 30,000,000 | $ | 184,227,894 | $ | — | |||||||||
|
|
|
|
|
|
|
|||||||||
| Bond |
Corporate Bonds** | $ | — | $ | 158,137,120 | $ | — | |||||||
| U.S. Treasury Obligations | — | 8,117,812 | — | |||||||||||
| Money Market Funds | 3,883,000 | — | — | |||||||||||
|
|
|
|
|
|
|
|||||||||
| $ | 3,883,000 | $ | 166,254,932 | $ | — | |||||||||
|
|
|
|
|
|
|
|||||||||
| Omni |
Common Stocks** | $ | 24,087,551 | $ | — | $ | — | |||||||
| Corporate Bonds** | — | 7,331,273 | — | |||||||||||
| U.S. Treasury Obligations | — | 443,852 | — | |||||||||||
| Money Market Funds | 1,118,000 | — | — | |||||||||||
|
|
|
|
|
|
|
|||||||||
| $ | 25,205,551 | $ | 7,775,125 | $ | — | |||||||||
|
|
|
|
|
|
|
|||||||||
| International |
Common Stocks** | $ | 45,346,176 | $ | 127,832,331 | $ | — | |||||||
| Preferred Stocks** | 1,237,729 | — | — | |||||||||||
| U.S. Treasury Obligations | — | 324,989 | — | |||||||||||
| Money Market Funds | 9,552,044 | — | — | |||||||||||
|
|
|
|
|
|
|
|||||||||
| $ | 56,135,949 | $ | 128,157,320 | $ | — | |||||||||
|
|
|
|
|
|
|
|||||||||
| Foreign currency contracts | $ | 749,359 | $ | — | $ | — | ||||||||
|
|
|
|
|
|
|
|||||||||
| Futures contracts | $ | (15,998 | ) | $ | — | $ | — | |||||||
|
|
|
|
|
|
|
|||||||||
| Capital Appreciation |
Common Stocks** | $ | 107,368,660 | $ | 3,476,725 | $ | — | |||||||
| Money Market Funds | 5,110,000 | — | — | |||||||||||
|
|
|
|
|
|
|
|||||||||
| $ | 112,478,660 | $ | 3,476,725 | $ | — | |||||||||
|
|
|
|
|
|
|
|||||||||
| Millennium |
Common Stocks** | $ | 33,706,831 | $ | — | $ | — | |||||||
| Money Market Funds | 504,000 | — | — | |||||||||||
|
|
|
|
|
|
|
|||||||||
| $ | 34,210,831 | $ | — | $ | — | |||||||||
|
|
|
|
|
|
|
|||||||||
| International Small-Mid Company |
Common Stocks** | $ | 14,998,918 | $ | 46,204,976 | $ | — | |||||||
| Money Market Funds | 3,478,891 | — | — | |||||||||||
|
|
|
|
|
|
|
|||||||||
| $ | 18,477,809 | $ | 46,204,976 | $ | — | |||||||||
|
|
|
|
|
|
|
|||||||||
| 131 | (continued) |
| Ohio National Fund, Inc. |
| Notes to Financial Statements (Continued) |
December 31, 2012 |
| Portfolio |
Financial Instrument Type |
Level 1 | Level 2 | Level 3 | ||||||||||
| Aggressive Growth |
Common Stocks** | $ | 25,736,292 | $ | 4,995,733 | $ | — | |||||||
| VVPR Strips** | 9 | — | — | |||||||||||
| Commercial Paper | — | 100,000 | — | |||||||||||
| Money Market Funds | 2,350,000 | — | — | |||||||||||
|
|
|
|
|
|
|
|||||||||
| $ | 28,086,301 | $ | 5,095,733 | $ | — | |||||||||
|
|
|
|
|
|
|
|||||||||
| Small Cap Growth |
Common Stocks** | $ | 33,572,492 | $ | — | $ | — | |||||||
| Commercial Paper | — | 100,000 | — | |||||||||||
| Money Market Funds | 1,371,000 | — | — | |||||||||||
|
|
|
|
|
|
|
|||||||||
| $ | 34,943,492 | $ | 100,000 | $ | — | |||||||||
|
|
|
|
|
|
|
|||||||||
| Mid Cap Opportunity |
Common Stocks** | $ | 66,711,503 | $ | — | $ | — | |||||||
| Money Market Funds | 701,000 | — | — | |||||||||||
|
|
|
|
|
|
|
|||||||||
| $ | 67,412,503 | $ | — | $ | — | |||||||||
|
|
|
|
|
|
|
|||||||||
| S&P 500® Index |
Common Stocks** | $ | 199,927,026 | $ | — | $ | — | |||||||
| Exchange Traded Funds | 7,877,793 | — | — | |||||||||||
|
|
|
|
|
|
|
|||||||||
| $ | 207,804,819 | $ | — | $ | — | |||||||||
|
|
|
|
|
|
|
|||||||||
| Strategic Value |
Common Stocks** | $ | 193,607,311 | $ | 64,896,335 | $ | — | |||||||
| Money Market Funds | 1,331,000 | — | — | |||||||||||
|
|
|
|
|
|
|
|||||||||
| $ | 194,938,311 | $ | 64,896,335 | $ | — | |||||||||
|
|
|
|
|
|
|
|||||||||
| High Income Bond |
Corporate Bonds** | $ | — | $ | 306,187,127 | $ | — | |||||||
| Common Stocks** | 128,092 | — | — | |||||||||||
| Preferred Stocks** | 339,848 | — | — | |||||||||||
| Warrants** | 129,208 | — | — | |||||||||||
| Other** | 23,659 | — | — | |||||||||||
| Money Market Funds | 1,440,000 | — | — | |||||||||||
|
|
|
|
|
|
|
|||||||||
| $ | 2,060,807 | $ | 306,187,127 | $ | — | |||||||||
|
|
|
|
|
|
|
|||||||||
| Capital Growth |
Common Stocks** | $ | 55,035,816 | $ | — | $ | — | |||||||
| Money Market Funds | 764,000 | — | — | |||||||||||
|
|
|
|
|
|
|
|||||||||
| $ | 55,799,816 | $ | — | $ | — | |||||||||
|
|
|
|
|
|
|
|||||||||
| Nasdaq-100® Index |
Common Stocks** | $ | 66,417,616 | $ | — | $ | — | |||||||
| Exchange Traded Funds | 1,267,366 | — | — | |||||||||||
|
|
|
|
|
|
|
|||||||||
| $ | 67,684,982 | $ | — | $ | — | |||||||||
|
|
|
|
|
|
|
|||||||||
| Bristol |
Common Stocks** | $ | 200,642,235 | $ | — | $ | — | |||||||
| Money Market Funds | 2,966,000 | — | — | |||||||||||
|
|
|
|
|
|
|
|||||||||
| $ | 203,608,235 | $ | — | $ | — | |||||||||
|
|
|
|
|
|
|
|||||||||
| Bryton Growth |
Common Stocks** | $ | 150,541,940 | $ | — | $ | — | |||||||
| Money Market Funds | 4,766,000 | — | — | |||||||||||
|
|
|
|
|
|
|
|||||||||
| $ | 155,307,940 | $ | — | $ | — | |||||||||
|
|
|
|
|
|
|
|||||||||
| U.S. Equity |
Common Stocks** | $ | 15,602,309 | $ | — | $ | — | |||||||
|
|
|
|
|
|
|
|||||||||
| Balanced |
Common Stocks** | $ | 52,940,566 | $ | — | $ | — | |||||||
| Corporate Bonds** | — | 18,783,042 | — | |||||||||||
| U.S. Treasury Obligations | — | 3,671,454 | — | |||||||||||
| Purchased Options | 401,100 | — | — | |||||||||||
| Money Market Funds | 966,000 | — | — | |||||||||||
|
|
|
|
|
|
|
|||||||||
| $ | 54,307,666 | $ | 22,454,496 | $ | — | |||||||||
|
|
|
|
|
|
|
|||||||||
| 132 | (continued) |
| Ohio National Fund, Inc. |
| Notes to Financial Statements (Continued) |
December 31, 2012 |
| Portfolio |
Financial Instrument Type |
Level 1 | Level 2 | Level 3 | ||||||||||
| Income Opportunity |
Common Stocks** | $ | 9,581,769 | $ | — | $ | — | |||||||
| Purchased Options | 57,300 | — | — | |||||||||||
|
|
|
|
|
|
|
|||||||||
| $ | 9,639,069 | $ | — | $ | — | |||||||||
|
|
|
|
|
|
|
|||||||||
| Target VIP |
Common Stocks** | $ | 20,824,223 | $ | — | $ | — | |||||||
| Money Market Funds | 275,000 | — | — | |||||||||||
|
|
|
|
|
|
|
|||||||||
| $ | 21,099,223 | $ | — | $ | — | |||||||||
|
|
|
|
|
|
|
|||||||||
| Target Equity/Income |
Common Stocks** | $ | 21,461,689 | $ | — | $ | — | |||||||
| Money Market Funds | 430,000 | — | — | |||||||||||
|
|
|
|
|
|
|
|||||||||
| $ | 21,891,689 | $ | — | $ | — | |||||||||
|
|
|
|
|
|
|
|||||||||
| Bristol Growth |
Common Stocks** | $ | 104,210,635 | $ | — | $ | — | |||||||
| Money Market Funds | 1,744,000 | — | — | |||||||||||
|
|
|
|
|
|
|
|||||||||
| $ | 105,954,635 | $ | — | $ | — | |||||||||
|
|
|
|
|
|
|
|||||||||
| * | At December 31, 2012, the Money Market Portfolio’s investments, with the exception of money market funds, were valued using amortized cost, in accordance with rules under the 40 Act. Amortized cost approximates the current fair value of a security, but since the value is not obtained from a quoted price in an active market, such securities are considered to be valued using Level 2 inputs. |
| ** | For detailed industry descriptions see the accompanying Schedules of Investments. |
As stated above, the value assigned to the Fund’s foreign securities will, in most cases, not be the quoted or published prices of the investments on their respective primary markets or exchanges. Securities that are priced using fair value estimates are categorized as Level 2 in the fair value hierarchy, whereas securities that do not meet the established criteria are categorized as Level 1. The valuation of a foreign security from one valuation period to the next may result in a transfer between Levels 1 and 2 if the degree of certainty that the local close price is not the liquid market price at the time of U.S. market close is not similar for both periods. The Fund’s policy is to recognize transfers between fair value hierarchy levels at the reporting period end. In the International Small-Mid Company Portfolio, there was one transfer of a security, which was reported in the Level 2 pricing category at December 31, 2011, to Level 1 at December 31, 2012. This security was that Portfolio’s holding of Remy Cointreau SA common stock . The fair valuation service provider reported that the security did not meet the minimum predictability threshold at December 31, 2012, and was not fair valued in the current year; whereas in the prior year, the security met the threshold to be fair valued. The value of this holding was $296,368 and $630,939 at December 31, 2012 and 2011, respectively.
Below is a reconciliation that details the activity of securities in Level 3 during the year ended December 31, 2012:
| Aggressive Growth |
S&P
500® Index |
High Income Bond |
Nasdaq-100® Index |
|||||||||||||
| Beginning Balance – December 31, 2011 |
$ | 9 | $ | 198 | $ | 20,781 | $ | 776 | ||||||||
| Total gains or losses (realized/unrealized): |
||||||||||||||||
| Included in earnings (or changes in net assets) |
— | 427 | (5,156 | ) | 1,669 | |||||||||||
| Issuances |
— | — | — | — | ||||||||||||
| Settlements |
— | (625 | ) | (15,625 | ) | (2,445 | ) | |||||||||
| Transfers out of Level 3 to Level 1 (due to availability of active market quotation) |
(9 | ) | — | — | — | |||||||||||
|
|
|
|
|
|
|
|
|
|||||||||
| Ending Balance – December 31, 2012 |
$ | — | $ | — | $ | — | $ | — | ||||||||
|
|
|
|
|
|
|
|
|
|||||||||
| The amount of total gains or losses for the period included in earnings (or changes in net assets) attributable to the change in unrealized gains or losses relating to assets still held at the reporting date |
$ | — | $ | 427 | $ | (5,156 | ) | $ | 1,669 | |||||||
|
|
|
|
|
|
|
|
|
|||||||||
Foreign Securities and Currency
The books and records of all the Portfolios are maintained in U.S. dollars. All investments and cash quoted in foreign currencies are valued daily in U.S. dollars on the basis of the foreign currency exchange rates provided by an independent source. These
| 133 | (continued) |
| Ohio National Fund, Inc. |
| Notes to Financial Statements (Continued) |
December 31, 2012 |
exchange rates are currently determined daily, at 4:00 pm Eastern Time for normal trading sessions. Purchases and sales of foreign-denominated investments are recorded at rates of exchange prevailing on the respective dates of such transactions.
The Fund may not fully isolate that portion of the results of operations resulting from changes in foreign exchange rates from fluctuations arising from changes in market prices on foreign currency-denominated investments. For the portion that is isolated, amounts are reflected as the Statements of Operations as other foreign currency related transactions. However, for tax purposes, the Fund does fully isolate the effect of fluctuations in foreign exchange rates when determining the gain or loss upon sale or maturity of such investments to the extent required by federal income tax regulations.
All Portfolios of the Fund may invest in securities of foreign issuers. Securities of foreign issuers that are purchased by the Money Market Portfolio are limited to 50% of that Portfolio’s assets and must be denominated in U.S. dollars and held in custody in the United States of America. The International and International Small-Mid Company Portfolios may be invested entirely in foreign securities. Investments in securities of foreign issuers, including investments in foreign companies through the use of depositary receipts, carry certain risks not ordinarily associated with investments in securities of domestic issuers. Such risks include future political and economic developments, and the possible imposition of exchange controls or other foreign governmental laws and restrictions. In addition, with respect to certain countries, there is the possibility of expropriation of assets, confiscatory taxation, political or social instability, or diplomatic developments that could adversely affect capital investment within those countries.
Repurchase Agreements
The Portfolios may acquire repurchase agreements from member banks of the Federal Reserve System which are deemed creditworthy under guidelines approved by the Board, subject to the seller’s agreement to repurchase such securities at a mutually agreed upon date and price. The repurchase price generally equals the price paid by a Portfolio plus interest negotiated on the basis of current short-term rates, which may be more or less than the rate on the underlying securities. The maturities of these instruments vary from overnight to one week. The seller, under a repurchase agreement, is required to maintain as collateral for the repurchase transaction securities in which the Portfolio has a perfected security interest with a value not less than 100% of the repurchase price (including accrued interest). Securities subject to repurchase agreements are held by the Portfolio’s custodian or another qualified custodian or in the Federal Reserve/Treasury book-entry system. In the event of counterparty default, the Fund has the right to use the collateral to offset losses incurred. There is potential for loss to the Fund in the event the Fund is delayed or prevented from exercising its rights to dispose of the collateral securities, including the risk of a possible decline in the value of the underlying securities during the period while the Fund seeks to assert its rights.
Restricted and Illiquid Securities
Restricted securities are those securities purchased through a private offering and cannot be resold to the general public without prior registration under the Securities Act of 1933 (“the 1933 Act”) or pursuant to the resale limitations provided by Rule 144A under the 1933 Act, or an exemption from the registration requirements of the 1933 Act. 144A securities are issued by corporations without registration in reliance on 1933 Act provisions allowing for the private resale of unregistered securities to qualified institutional buyers. Section 4(2) commercial paper is issued pursuant to Section 4(2) of the 1933 Act which exempts an issue from registration. This paper may be used to finance non-current transactions, such as acquisitions, stock repurchase programs, and other long-term assets. Investments by a portfolio in Rule 144A and Section 4(2) securities could have the effect of decreasing the liquidity of a Portfolio during any period in which qualified institutional investors were no longer interested in purchasing these securities.
Typically, the restricted securities noted above are not considered illiquid. The criteria used to determine if a restricted security is illiquid includes frequency of trades and quotes, available dealers willing to make transactions, availability of market makers in the security, and the nature of the security and its trades. The Money Market, Bond, and Omni Portfolios may invest up to 10% of their respective assets in illiquid securities. Each of the other Portfolios of the Fund may invest up to 15% of its net assets in illiquid securities.
Investment Transactions and Related Income
For financial reporting purposes, investment transactions are accounted for on a trade date basis. For purposes of executing separate account shareholder transactions in the normal course of business, however, the Fund’s investment transactions are recorded no later than the first calculation on the first business day following the trade date in accordance with Rule 2a-4 of the 40 Act. Accordingly, differences between the net asset values for financial reporting and for executing separate account shareholder transactions may arise.
| 134 | (continued) |
| Ohio National Fund, Inc. |
| Notes to Financial Statements (Continued) |
December 31, 2012 |
Dividend income is recognized on the ex-dividend date, except in the case of those Portfolios holding foreign securities, in which dividends are recorded as soon after the ex-dividend date as the Fund’s information agents become aware of such dividends. Interest income is accrued daily as earned and includes the amortization of premium and accretion of discount. Net realized gain or loss on investments and foreign exchange transactions are determined using the specific identification method.
Distributions to Shareholders and Federal Taxes
Net investment income of the Money Market Portfolio is declared and paid daily as a dividend to shareholders immediately before the computation of the net asset value of Money Market Portfolio shares. Dividends are automatically reinvested in additional Money Market Portfolio shares at the net asset value immediately following such computation. Distributions arising from net investment income and net capital gains from the remaining Portfolios are declared and paid to shareholders periodically as required for each of the Portfolios to continue to qualify as a regulated investment company pursuant to Subchapter M of the Internal Revenue Code. The Fund, excluding the Money Market Portfolio, may also fully or partially satisfy its distribution requirements by using consent dividends rather than cash dividends. The Fund has the intent to continue to comply with tax provisions pertaining to regulated investment companies and make distributions of taxable income sufficient to relieve it from substantially all federal income and excise taxes. As such, no provisions for federal income or excise taxes have been recorded.
The character of income and realized capital gains distributions are determined in accordance with federal income tax regulations and may differ from net investment income and realized gains for financial reporting purposes. These “book/tax” differences are either considered temporary or permanent in nature. To the extent these differences are permanent in nature they are reclassified within the composition of net assets; temporary differences do not require such reclassification. Distributions to shareholders that exceed taxable income and net taxable realized gains are reported as return of capital distributions.
The Fund’s management and its tax agent, U.S. Bancorp Fund Services, LLC, perform an affirmative evaluation of tax positions taken or expected to be taken in the course of preparing the Fund’s tax returns to determine whether it is more-likely-than-not (i.e. greater than 50-percent) that each tax position will be sustained upon examination by a taxing authority based on the technical merits of the position. A tax position that meets the more-likely-than-not recognition threshold is measured to determine the amount of benefit to recognize in the financial statements. Differences between tax positions taken in a tax return and amounts recognized in the financial statements will generally result in an increase in a liability for taxes payable (or a reduction of a tax refund receivable), including the recognition of any related interest and penalties as an operating expense. Implementation of the evaluation included a review of tax positions taken in tax years that remain subject to examination by all major tax jurisdictions, including federal tax and the state of Maryland (i.e., the last four tax year ends and the interim tax period since then). The determination has been made that there are no uncertain tax positions that would require the Portfolios to record a tax liability and, therefore, there is no impact to the Portfolios’ financial statements.
Expense Allocation
Expenses directly attributable to a Portfolio are charged to that Portfolio. Expenses that cannot be directly attributed to a Portfolio are allocated among all the benefited Portfolios on a basis of relative net assets or other appropriate method.
Foreign Withholding Taxes
Certain Portfolios in the Fund may be subject to taxes imposed by countries in which they invest with respect to their investments in issuers existing or operating in such countries. Such taxes are generally withheld based on income earned. These Portfolios accrue such taxes as the related income is earned.
Subsequent Events
Management has evaluated events and transactions through the date the financial statements were issued, for purposes of recognition or disclosure in these financial statements, and there are no subsequent events to report.
| (3) | Related Party and Other Transactions |
The Fund has an Investment Advisory Agreement with Ohio National Investments, Inc. (“ONI”), a wholly-owned subsidiary of ONLIC. Under the terms of this agreement, ONI provides portfolio management and investment advice to the Fund and
| 135 | (continued) |
| Ohio National Fund, Inc. |
| Notes to Financial Statements (Continued) |
December 31, 2012 |
administers its operations, subject to the supervision of the Fund’s Board. This agreement is renewed annually upon the approval by the Board. As compensation for its services, ONI receives advisory fees from the Fund calculated on the basis of each Portfolio’s average daily net assets and the following current schedule of Board-approved annualized fee breakpoints.
| 136 | (continued) |
| Ohio National Fund, Inc. |
| Notes to Financial Statements (Continued) |
December 31, 2012 |
| (1) | For the year ended December 31, 2012, ONI waived advisory fees in excess of an annualized rate of 0.25% of the first $100 million of average daily net assets in the Money Market Portfolio. Waivers related to the Money Market Portfolio are voluntary and are not subject to recoupment in subsequent periods. The amount of the waiver for the year ended December 31, 2012 was $50,000. If ONI did not agree to reimburse these expenses, the total expenses incurred by the Money Market Portfolio for the six-month period ended December 31, 2012 would have been higher than the net expenses reflected in the Statements of Operations. |
Under the Investment Advisory Agreement, the Fund authorizes ONI to retain sub-advisers (“the Sub-Advisers”) for the Equity, Omni, International, Capital Appreciation, Millennium, International Small-Mid Company, Aggressive Growth, Small Cap Growth, Mid Cap Opportunity, Strategic Value, High Income Bond, Capital Growth, Bristol, Bryton Growth, U.S. Equity, Balanced, Income Opportunity, Target VIP, Target Equity/Income, and Bristol Growth Portfolios subject to the approval of the Board. ONI has entered into sub-advisory agreements with Legg Mason Capital Management, Inc. (“Legg Mason”), Suffolk Capital Management, LLC (“Suffolk”), Federated Global Investment Management Corp. (“Federated Global”), Jennison Associates LLC (“Jennison”), Neuberger Berman Management LLC (“Neuberger Berman”), Janus Capital Management LLC (“Janus”), Goldman Sachs Asset Management, L.P. (“Goldman Sachs”), Federated Equity Management Company of Pennsylvania (“Federated Equity”), Federated Investment Management Company (“Federated Investment”), Eagle Asset Management, Inc. (“Eagle”), ICON Advisers, Inc. (“ICON”), and First Trust Advisors L.P. (“First Trust”), to manage the investment of those Portfolios’ assets, subject to the supervision of ONI. As compensation for their services, the Sub-Advisers receive from ONI a sub-advisory fee calculated on the basis of each of the aforementioned Portfolio’s average daily net assets and the following current Board-approved schedule of annualized fee breakpoints.
| 137 | (continued) |
| Ohio National Fund, Inc. |
| Notes to Financial Statements (Continued) |
December 31, 2012 |
Suffolk, the sub-adviser for the Omni, Bristol, Bryton Growth, and Bristol Growth Portfolios has an affiliation with ONI. Ohio National Financial Services, Inc. (ONFS) owns 100% of ONLIC, the parent company of ONI, and also owns 84.7% of the voting securities of Suffolk. There were no Fund liabilities payable to Suffolk at December 31, 2012 and fees paid to Suffolk are an expense of ONI, not of the Fund.
Pursuant to a service agreement among ONI, ONLIC and the Fund, ONLIC has agreed to provide personnel and facilities to ONI on a cost-reimbursement basis. These personnel members include officers of the Fund. ONLIC also provides clerical and administrative services and such supplies and equipment as may be reasonably required in order for ONI to properly perform its advisory function pursuant to the Investment Advisory Agreement. ONLIC further performs duties to fulfill the transfer agent function on behalf of the Fund. Performance of these duties by ONLIC and availability of facilities, personnel, supplies, and equipment does not represent an expense to the Fund in excess of the advisory fees paid to ONI.
Pursuant to the Investment Advisory Agreement, if the total expenses applicable to any Portfolio during any calendar quarter (excluding taxes, brokerage commissions, interest expense and management fees) exceed 1%, on an annualized basis, evaluated quarterly, of such Portfolio’s average daily net asset value, ONI will reimburse the Portfolio for such excess expenses. There were no expense reimbursements associated with this agreement during the year ended December 31, 2012.
During the year ended December 31, 2012, ONI voluntarily reimbursed the amount of daily gross expenses of the Money Market Portfolio in excess of daily income earned by the Portfolio. The amount reimbursed to the Portfolio for the year ended December 31, 2012 was $647,678, of which $49,787 was receivable from ONI at December 31, 2012. This reimbursement is also not subject to recoupment in subsequent periods.
The Investment Advisory Agreement allows for a portion of the expenses related to the Fund’s Chief Compliance Officer and staff to be incurred by the Fund and paid from the Fund to the Fund’s adviser, ONI. Pursuant to the service agreement among ONI, ONLIC, and the Fund, ONLIC has provided the personnel, services, and equipment necessary to perform the Fund’s regulation-mandated compliance function and ONI has reimbursed ONLIC for such costs. For the year ended December 31, 2012, the Fund incurred compliance expenses totaling $253,992, which was equally allocated to the Portfolios. Expenses incurred by the Portfolios are reflected on the Statements of Operations as “Compliance expense”.
Each director of the Board is currently paid a quarterly retainer fee of $10,000, $3,000 for each Board meeting attended, $1,000 for each Audit Committee meeting attended, and $500 for each other Board committee or independent directors meetings attended. The Board chair receives an additional quarterly retainer fee of $3,750, the lead independent director of the Board receives an additional quarterly retainer fee of $3,125, and the Audit Committee chair receives an additional quarterly retainer fee of $1,250. For the year ended December 31, 2012, directors’ compensation and reimbursement of director expenses by the Fund totaled $278,355.
U.S. Bancorp Fund Services, LLC, 615 East Michigan Street, Milwaukee, Wisconsin, serves as the accounting agent for all but the International and International Small-Mid Company Portfolios. U.S. Bank Institutional Trust & Custody, 425 Walnut Street, Cincinnati, Ohio serves as the custodian for all but the International and International Small-Mid Company Portfolios. The accounting agent and custodian for the International and International Small-Mid Company Portfolios is State Street Bank-Kansas City, 801 Pennsylvania Ave., Kansas City, Missouri. For assets held outside the United States, U.S. Bank and State Street Bank-Kansas City enter into sub-custodial agreements, subject to approval by the Board.
| 138 | (continued) |
| Ohio National Fund, Inc. |
| Notes to Financial Statements (Continued) |
December 31, 2012 |
| (4) | Capital Share Transactions |
Capital share transactions for the years ended December 31, 2012 and 2011 were as follows:
| Equity | Money Market | Bond | ||||||||||||||||||||||
| Year Ended 12/31/2012 |
Year Ended 12/31/2011 |
Year Ended 12/31/2012 |
Year Ended 12/31/2011 |
Year Ended 12/31/2012 |
Year Ended 12/31/2011 |
|||||||||||||||||||
| Capital shares issued on sales |
623,661 | 941,226 | 17,885,924 | 32,550,831 | 3,488,174 | 3,958,882 | ||||||||||||||||||
| Capital shares issued on reinvested dividends |
121,339 | 91,840 | — | — | — | — | ||||||||||||||||||
| Capital shares redeemed |
(2,033,054 | ) | (2,212,809 | ) | (20,644,112 | ) | (33,276,715 | ) | (3,594,023 | ) | (3,646,628 | ) | ||||||||||||
|
|
|
|
|
|
|
|
|
|
|
|
|
|||||||||||||
| Net increase/(decrease) |
(1,288,054 | ) | (1,179,743 | ) | (2,758,188 | ) | (725,884 | ) | (105,849 | ) | 312,254 | |||||||||||||
|
|
|
|
|
|
|
|
|
|
|
|
|
|||||||||||||
| Omni | International | Capital Appreciation | ||||||||||||||||||||||
| Year Ended 12/31/2012 |
Year Ended 12/31/2011 |
Year Ended 12/31/2012 |
Year Ended 12/31/2011 |
Year Ended 12/31/2012 |
Year Ended 12/31/2011 |
|||||||||||||||||||
| Capital shares issued on sales |
161,999 | 229,768 | 1,497,944 | 2,497,915 | 519,553 | 651,665 | ||||||||||||||||||
| Capital shares issued on reinvested dividends |
26,019 | 30,504 | — | — | 30,035 | 24,159 | ||||||||||||||||||
| Capital shares redeemed |
(492,128 | ) | (543,608 | ) | (3,706,950 | ) | (3,222,960 | ) | (1,339,064 | ) | (1,300,067 | ) | ||||||||||||
|
|
|
|
|
|
|
|
|
|
|
|
|
|||||||||||||
| Net increase/(decrease) |
(304,110 | ) | (283,336 | ) | (2,209,006 | ) | (725,045 | ) | (789,476 | ) | (624,243 | ) | ||||||||||||
|
|
|
|
|
|
|
|
|
|
|
|
|
|||||||||||||
| Millennium | International Small-Mid Company |
Aggressive Growth | ||||||||||||||||||||||
| Year Ended 12/31/2012 |
Year Ended 12/31/2011 |
Year Ended 12/31/2012 |
Year Ended 12/31/2011 |
Year Ended 12/31/2012 |
Year Ended 12/31/2011 |
|||||||||||||||||||
| Capital shares issued on sales |
136,922 | 286,300 | 485,545 | 537,442 | 1,042,101 | 776,637 | ||||||||||||||||||
| Capital shares issued on reinvested dividends |
— | — | — | — | — | — | ||||||||||||||||||
| Capital shares redeemed |
(383,783 | ) | (529,962 | ) | (742,828 | ) | (922,145 | ) | (882,813 | ) | (1,093,898 | ) | ||||||||||||
|
|
|
|
|
|
|
|
|
|
|
|
|
|||||||||||||
| Net increase/(decrease) |
(246,861 | ) | (243,662 | ) | (257,283 | ) | (384,703 | ) | 159,288 | (317,261 | ) | |||||||||||||
|
|
|
|
|
|
|
|
|
|
|
|
|
|||||||||||||
| Small Cap Growth | Mid Cap Opportunity | S&P 500® Index | ||||||||||||||||||||||
| Year Ended 12/31/2012 |
Year Ended 12/31/2011 |
Year Ended 12/31/2012 |
Year Ended 12/31/2011 |
Year Ended 12/31/2012 |
Year Ended 12/31/2011 |
|||||||||||||||||||
| Capital shares issued on sales |
626,681 | 810,468 | 549,005 | 509,487 | 3,730,507 | 2,954,040 | ||||||||||||||||||
| Capital shares issued on reinvested dividends |
— | — | — | — | 189,836 | 184,032 | ||||||||||||||||||
| Capital shares redeemed |
(767,540 | ) | (921,986 | ) | (831,618 | ) | (899,024 | ) | (3,031,332 | ) | (3,584,999 | ) | ||||||||||||
|
|
|
|
|
|
|
|
|
|
|
|
|
|||||||||||||
| Net increase/(decrease) |
(140,859 | ) | (111,518 | ) | (282,613 | ) | (389,537 | ) | 889,011 | (446,927 | ) | |||||||||||||
|
|
|
|
|
|
|
|
|
|
|
|
|
|||||||||||||
| Strategic Value | High Income Bond | Capital Growth | ||||||||||||||||||||||
| Year Ended 12/31/2012 |
Year Ended 12/31/2011 |
Year Ended 12/31/2012 |
Year Ended 12/31/2011 |
Year Ended 12/31/2012 |
Year Ended 12/31/2011 |
|||||||||||||||||||
| Capital shares issued on sales |
23,078,732 | 2,328,044 | 6,070,090 | 6,947,607 | 427,102 | 771,713 | ||||||||||||||||||
| Capital shares issued on reinvested dividends |
351,423 | 59,209 | — | — | — | — | ||||||||||||||||||
| Capital shares redeemed |
(3,236,694 | ) | (990,362 | ) | (5,662,829 | ) | (8,236,398 | ) | (526,289 | ) | (772,696 | ) | ||||||||||||
|
|
|
|
|
|
|
|
|
|
|
|
|
|||||||||||||
| Net increase/(decrease) |
20,193,461 | 1,396,891 | 407,261 | (1,288,791 | ) | (99,187 | ) | (983 | ) | |||||||||||||||
|
|
|
|
|
|
|
|
|
|
|
|
|
|||||||||||||
| Nasdaq-100® Index | Bristol | Bryton Growth | ||||||||||||||||||||||
| Year Ended 12/31/2012 |
Year Ended 12/31/2011 |
Year Ended 12/31/2012 |
Year Ended 12/31/2011 |
Year Ended 12/31/2012 |
Year Ended 12/31/2011 |
|||||||||||||||||||
| Capital shares issued on sales |
3,852,022 | 3,696,576 | 2,698,502 | 4,320,041 | 2,464,569 | 4,275,291 | ||||||||||||||||||
| Capital shares issued on reinvested dividends |
65,966 | 35,054 | 89,395 | 77,847 | — | — | ||||||||||||||||||
| Capital shares redeemed |
(3,392,616 | ) | (3,897,497 | ) | (3,705,062 | ) | (2,334,927 | ) | (3,580,153 | ) | (1,779,694 | ) | ||||||||||||
|
|
|
|
|
|
|
|
|
|
|
|
|
|||||||||||||
| Net increase/(decrease) |
525,372 | (165,867 | ) | (917,165 | ) | 2,062,961 | (1,115,584 | ) | 2,495,597 | |||||||||||||||
|
|
|
|
|
|
|
|
|
|
|
|
|
|||||||||||||
| 139 | (continued) |
| Ohio National Fund, Inc. |
| Notes to Financial Statements (Continued) |
December 31, 2012 |
| U.S. Equity | Balanced | Income Opportunity | ||||||||||||||||||||||
| Year Ended 12/31/2012 |
Year Ended 12/31/2011 |
Year Ended 12/31/2012 |
Year Ended 12/31/2011 |
Year Ended 12/31/2012 |
Year Ended 12/31/2011 |
|||||||||||||||||||
| Capital shares issued on sales |
261,888 | 232,873 | 4,132,176 | 550,440 | 293,125 | 326,009 | ||||||||||||||||||
| Capital shares issued on reinvested dividends |
7,717 | — | — | 23,706 | — | — | ||||||||||||||||||
| Capital shares redeemed |
(237,667 | ) | (322,718 | ) | (464,792 | ) | (392,980 | ) | (466,598 | ) | (217,024 | ) | ||||||||||||
|
|
|
|
|
|
|
|
|
|
|
|
|
|||||||||||||
| Net increase/(decrease) |
31,938 | (89,845 | ) | 3,667,384 | 181,166 | (173,473 | ) | 108,985 | ||||||||||||||||
|
|
|
|
|
|
|
|
|
|
|
|
|
|||||||||||||
| Target VIP | Target Equity/Income | Bristol Growth | ||||||||||||||||||||||
| Year Ended 12/31/2012 |
Year Ended 12/31/2011 |
Year Ended 12/31/2012 |
Year Ended 12/31/2011 |
Year Ended 12/31/2012 |
Year Ended 12/31/2011 |
|||||||||||||||||||
| Capital shares issued on sales |
292,064 | 420,361 | 575,533 | 596,268 | 2,078,689 | 3,189,221 | ||||||||||||||||||
| Capital shares issued on reinvested dividends |
29,837 | 23,633 | 55,864 | 50,753 | 44,746 | 37,666 | ||||||||||||||||||
| Capital shares redeemed |
(535,048 | ) | (533,998 | ) | (825,534 | ) | (857,927 | ) | (2,365,571 | ) | (1,519,700 | ) | ||||||||||||
|
|
|
|
|
|
|
|
|
|
|
|
|
|||||||||||||
| Net increase/(decrease) |
(213,147 | ) | (90,004 | ) | (194,137 | ) | (210,906 | ) | (242,136 | ) | 1,707,187 | |||||||||||||
|
|
|
|
|
|
|
|
|
|
|
|
|
|||||||||||||
| (5) | Investment Transactions |
Cost of purchases and proceeds from sales of investments (excluding short-term and government securities) for the year ended December 31, 2012 were as follows:
| Equity | Bond | Omni | International | Capital Appreciation | ||||||||||||||||
| Cost of purchases |
$ | 89,305,085 | $ | 26,096,392 | $ | 58,973,472 | $ | 100,712,931 | $ | 43,057,065 | ||||||||||
| Proceeds from sales |
$ | 113,271,625 | $ | 20,115,224 | $ | 63,490,428 | $ | 112,215,582 | $ | 62,120,645 | ||||||||||
| Millennium | International Small-Mid Company |
Aggressive Growth | Small Cap Growth | Mid Cap Opportunity | ||||||||||||||||
| Cost of purchases |
$ | 102,000,992 | $ | 32,114,828 | $ | 5,130,124 | $ | 21,631,145 | $ | 28,764,478 | ||||||||||
| Proceeds from sales |
$ | 107,933,155 | $ | 37,867,109 | $ | 4,767,218 | $ | 24,891,086 | $ | 34,520,639 | ||||||||||
| S&P 500® Index | Strategic Value | High Income Bond | Capital Growth | Nasdaq-100® Index | ||||||||||||||||
| Cost of purchases |
$ | 28,947,693 | $ | 263,906,802 | $ | 131,316,427 | $ | 22,827,863 | $ | 19,279,948 | ||||||||||
| Proceeds from sales |
$ | 14,149,834 | $ | 43,419,735 | $ | 99,902,146 | $ | 24,544,959 | $ | 16,180,919 | ||||||||||
| Bristol | Bryton Growth | U.S. Equity | Balanced | Income Opportunity | ||||||||||||||||
| Cost of purchases |
$ | 477,169,049 | $ | 226,820,547 | $ | 8,308,368 | $ | 73,557,311 | $ | 6,980,219 | ||||||||||
| Proceeds from sales |
$ | 483,633,926 | $ | 235,789,555 | $ | 7,865,215 | $ | 20,659,481 | $ | 9,160,399 | ||||||||||
| Target VIP | Target Equity/Income | Bristol Growth | ||||||||||||||||||
| Cost of purchases |
$ | 14,984,309 | $ | 18,551,576 | $ | 234,291,357 | ||||||||||||||
| Proceeds from sales |
$ | 16,998,258 | $ | 20,077,569 | $ | 235,187,978 | ||||||||||||||
Cost of purchases and proceeds from sales of government securities for the year ended December 31, 2012 were as follows:
| Bond | Omni | Balanced | ||||||||||||||
| Cost of purchases |
$ | 13,428,594 | $ | 97,828 | $ | 4,534,540 | ||||||||||
| Proceeds from sales |
$ | 9,970,899 | $ | — | $ | 983,391 | ||||||||||
| (6) | Financial Instruments |
The Fund’s Portfolios, other than the Money Market Portfolio, may trade in financial instruments with off-balance sheet risk for hedging purposes or, otherwise, in accordance with stated investing objectives. These financial instruments may include options, futures, and foreign currency contracts that may involve, to a varying degree, elements of risk in excess of the amounts recognized on financial statements.
| 140 | (continued) |
| Ohio National Fund, Inc. |
| Notes to Financial Statements (Continued) |
December 31, 2012 |
Options
A Portfolio may buy and write (i.e., sell) call and put options. In writing call options, the Portfolio gives the purchaser of the call option the right to purchase the underlying securities from the Portfolio at a specified “exercise” price at any time prior to the expiration of the option, normally within nine months. A Portfolio writes a covered call option when it owns the underlying securities and an uncovered call option when it does not. In purchasing put options, a Portfolio pays the seller of the put option a premium for the right of the Portfolio to sell the underlying securities to the seller at a specified exercise price prior to the expiration of the option. When a Portfolio sells a put option, it has the obligation to buy, and the purchaser of the put the right to sell, the underlying security at the exercise price during the option period. Whenever a Portfolio has a written covered call option outstanding, the underlying securities will be segregated by the Custodian and held in an escrow account to assure that such securities will be delivered to the option holder if the option is exercised. While the underlying securities are subject to the option, the Portfolio remains the record owner of the securities, entitling it to receive dividends and to exercise any voting rights. Whenever a Portfolio has a written uncovered call option outstanding, it will segregate with the Custodian cash or liquid assets that, when added to the amounts deposited with the broker as margin, equal to the market value of the securities underlying the call option (but not less than the exercise price of the call option). To cover a written put option, the Portfolio writing the option deposits cash or liquid securities in a segregated account at the Custodian. In order to terminate its position as the writer or the purchaser of an option, the Portfolio may enter into a “closing” transaction, which is the purchase (if the Portfolio has written the option) or sale (if the Portfolio is the purchaser of the option) of an option on the same underlying securities and having the same exercise price and expiration date as the option previously written or purchased by the Portfolio.
When a Portfolio writes a put or call option, an amount equal to the premium received is included on the Statement of Assets and Liabilities as a liability. The amount of the liability is subsequently marked-to-market to reflect the current market value of the option. Such liability is subject to off balance sheet risks to the extent of any future increases in market value of the written options. If an option expires on its stipulated expiration date or if the Portfolio enters into a closing purchase transaction, a gain or loss is realized. If a written call option on an individual security is exercised, a gain or loss is realized for the sale of the underlying security, and the proceeds from the sale are increased by the premium originally received. If a written call option on a securities index is exercised, a gain or loss is realized as determined by the premium originally received, the exercise price and the market value of the index. If a written put option on an individual security is exercised, the cost of the security acquired is decreased by the premium originally received. When a Portfolio purchases a put or call option, an amount equal to the premium paid is included on the Portfolio’s Statement of Assets and Liabilities as an investment, and is subsequently marked-to-market to reflect the current market value of the option. If an option expires on the stipulated expiration date or if the Portfolio enters into a closing sale transaction, a gain or loss is realized. If a Portfolio exercises a call option on an individual security, the cost of the security acquired is increased by the premium paid for the call. If the Portfolio exercises a put option on an individual security, a gain or loss is realized from the sale of the underlying security, and the proceeds from such a sale are decreased by the premium originally paid. If the Portfolio exercises a put option on a security index, a gain or loss is realized as determined by the premium originally paid, the exercise price and the market value of the index.
The Balanced and Income Opportunity Portfolios wrote call options and purchased put options on the S&P 500 Index during the year ended December 31, 2012. These instruments were used by the Portfolios to provide a hedge against equity price risk. During a period in which the prices of the Portfolios’ common stocks may decline, these instruments are designed to increase in value, thus providing price accumulation gains that partially offset the price accumulation losses of the common stocks in the Portfolios.
The Balanced and Income Opportunity Portfolios’ written call options are collateralized by cash and/or securities held with the Portfolios’ prime broker and in segregated accounts at the Portfolios’ custodian. Such collateral for the Portfolios is restricted from use. The cash collateral or borrowings from the prime broker, if necessary, are included on the Statement of Assets and Liabilities. The securities pledged as collateral are noted as such on the Portfolios’ Schedules of Investments. Written and purchased options are non-income producing securities.
| 141 | (continued) |
| Ohio National Fund, Inc. |
| Notes to Financial Statements (Continued) |
December 31, 2012 |
The activity in the number of option contracts written and the premiums received by the Balanced Portfolio for the year ended December 31, 2012 were as follows:
| Number of Contracts |
Premiums Received |
|||||||
| Options outstanding, beginning of year |
— | $ | — | |||||
| Options written |
375 | 506,684 | ||||||
| Options exercised |
— | — | ||||||
| Options expired |
— | — | ||||||
| Options closed |
(375 | ) | (506,684 | ) | ||||
|
|
|
|
|
|||||
| Options outstanding, end of year |
— | $ | — | |||||
|
|
|
|
|
|||||
Transactions involving purchased options by the Balanced Portfolio for the year ended December 31, 2012 were: Cost of purchases: $1,926,237, Proceeds from sales: $1,193,031, Expirations: $314,600.
The activity in the number of option contracts written and the premiums received by the Income Opportunity Portfolio for the year ended December 31, 2012 were as follows:
| Number of Contracts |
Premiums Received |
|||||||
| Options outstanding, beginning of year |
50 | $ | 102,249 | |||||
| Options written |
538 | 1,062,580 | ||||||
| Options exercised |
— | — | ||||||
| Options expired |
— | — | ||||||
| Options closed |
(588 | ) | (1,164,829 | ) | ||||
|
|
|
|
|
|||||
| Options outstanding, end of year |
— | $ | — | |||||
|
|
|
|
|
|||||
Transactions involving purchased options by the Income Opportunity Portfolio for the year ended December 31, 2012 were: Cost of purchases: $1,243,154, Proceeds from sales: $713,649, Expirations: $548,145.
Futures Contracts
A Portfolio may buy or sell two kinds of financial futures contracts: stock index futures contracts and interest rate futures contracts. Stock index futures contracts are contracts developed by and traded on national commodity exchanges whereby the buyer will, on a specified future date, pay or receive a final cash payment equal to the difference between the actual value of the stock index on the last day of the contract and the value of the stock index established by the contract multiplied by the specific dollar amount set by the exchange. Futures contracts may be based on broad-based stock indexes such as the S&P 500 Index or on narrow-based stock indexes. A particular index will be selected according to the Adviser’s investment strategy for the particular Portfolio. An interest rate futures contract is an agreement whereby one party agrees to sell and another party agrees to purchase a specified amount of a specified financial instrument (debt security) at a specified price at a specified date, time and place. Although interest rate futures contracts typically require actual future delivery of and payment for financial instruments, the contracts are usually closed out before the delivery date. A public market exists in interest rate futures contracts covering primarily the following financial instruments: U.S. Treasury bonds; U.S. Treasury notes; Government National Mortgage Association (GNMA) modified pass-through mortgage-backed securities; three-month U.S. Treasury bills; 90-day commercial paper; bank certificates of deposit; and Eurodollar certificates of deposit. U.S. futures contracts are traded on exchanges which have been designated “contract markets” by the Commodities Futures Trading Commission (“CFTC”) and must be executed through a futures commission merchant (“FCM”), or brokerage firm, which is a member of the relevant contract market. It is expected that futures contracts trading in additional financial instruments will be authorized.
The Fund, on behalf of each Portfolio, has filed with the National Futures Association, a notice claiming an exclusion from the definition of the term “commodity pool operator” under the Commodity Exchange Act, as amended, and the rules of the Commodity Futures Trading Commission promulgated thereunder, with respect to each Portfolio’s operation. Accordingly, the Portfolios are not subject to registration or regulation as a commodity pool operator.
The buyer or seller of a futures contract is not required to deliver or pay for the underlying instrument unless the contract is held until the delivery date. However, both the buyer and seller are required to deposit “initial margin” for the benefit of the broker when the contract is entered into. Initial margin deposits are equal to a percentage of the contract’s value, as set by the exchange on which the contract is traded, and are similar to good faith deposits or performance bonds.
| 142 | (continued) |
| Ohio National Fund, Inc. |
| Notes to Financial Statements (Continued) |
December 31, 2012 |
Unlike margin extended by a securities broker, initial margin payments do not constitute purchasing securities on margin for purposes of a Portfolio’s investment limitations. A Portfolio, its futures commission merchant and the Custodian retain control of the initial margin until the contract is liquidated. If the value of either party’s position declines, that party will be required to make additional “variation margin” payments to settle the change in value on a daily basis. The party that has a gain may be entitled to receive all or a portion of this amount. In the event of the bankruptcy of the FCM that holds margin on behalf of a Portfolio, the Portfolio may be entitled to return of margin owed to the Portfolio only in proportion to the amount received by the FCM’s other customers. ONI and the Sub-Advisers will attempt to minimize this risk by carefully monitoring the creditworthiness of the FCMs with which the Portfolios do business. In addition to the margin restrictions discussed above, transactions in futures contracts and options on futures contracts may involve the segregation of funds pursuant to requirements imposed by the SEC. Under those requirements, where a Portfolio has a long position in a futures contract or sells a put option, it will be required to establish a segregated account (not with an FCM or broker) containing cash or certain liquid assets equal to the purchase price of the contract or the exercise price of the option (less any margin on deposit). For a short position in futures contacts held by a Portfolio or call options sold by a Portfolio, those requirements mandate the establishment of a segregated account (not with a futures commission merchant or broker) containing cash or certain liquid assets that, when added to the amounts deposited as margin, equal the market value of the instruments underlying the futures contracts or call options. However, segregation of assets is not required if a Portfolio “covers” its position.
At December 31, 2012, there was one outstanding futures contract in the International Portfolio. Details of this contract were as follows:
| Type |
Description |
Expiration |
Number of contracts |
Counterparty |
Contract at value |
Initial contract amount |
Unrealized Appreciation (Depreciation) |
Variation Margin Receivable (Payable) |
||||||||||||||||
| Long |
DAX Index Futures |
March 15, 2013 | 8 | J.P. Morgan Securities LLC |
$ | 2,011,209 | $ | 2,027,207 | $ | (15,998) | $ | 21 | ||||||||||||
The International Portfolio’s holdings of U.S. Treasury Bills, as noted on the Portfolio’s Schedule of Investments, were pledged at December 31, 2012 as collateral for this contract. The cost and value of the amount pledged at December 31, 2012 were $324,940 and $324,989, respectively.
This futures contract was executed for the purpose of increasing exposure to an attractive equities market, beyond that evidenced by the Portfolio’s investment in common stocks, while maintaining a significant cash balance that could be used for potentially higher-than-average shareholder transactions. There were other index futures contracts that were executed and closed in the International Portfolio during the year ended December 31, 2012. These were executed for similar purposes as those for futures contracts outstanding at December 31, 2012. For the year ended December 31, 2012, the notional values of futures contracts opened and closed prior to contract settlement date by the International Portfolio were approximately $11.5 million and $11.4 million, respectively.
Foreign Currency Contracts
In order to hedge against changes in the exchange rates of foreign currencies in relation to the U.S. dollar, each Portfolio, other than the Money Market Portfolio, may engage in forward foreign currency contracts, foreign currency options and foreign currency futures contracts in connection with the purchase, sale or ownership of a specific security. The International Portfolio, International Small-Mid Company Portfolio, Strategic Value Portfolio and High Income Bond Portfolio may engage in non-hedging related transactions to implement their investment strategies.
The Portfolios generally conduct their foreign currency exchange transactions on a spot (i.e., cash) basis at the spot rate prevailing in the foreign exchange currency market. When a Portfolio purchases or sells a security denominated in or exposed to a foreign currency, it may enter into a forward foreign currency contract (“forward contract”) for the purchase or sale, for a fixed amount of dollars, of the amount of currency involved in the underlying security transaction. A forward contract involves an obligation to purchase or sell a specific currency at a future date, which may be any fixed number of days from the date of the contract agreed upon by the parties, at a price set at the time of the contract. In this manner, a Portfolio may obtain protection against a possible loss resulting from an adverse change in the relationship between the U.S. dollar and the foreign currency during the period between the date the security is purchased or sold and the date upon which payment is made or received. Although such contracts tend to minimize the risk of loss due to the decline in the value of the hedged currency, at the same time they tend to limit any potential gain which might result should the value of such currency increase.
| 143 | (continued) |
| Ohio National Fund, Inc. |
| Notes to Financial Statements (Continued) |
December 31, 2012 |
Forward contracts are traded in the interbank market conducted directly between currency traders (usually large commercial banks) and their customers. Generally a forward contract has no deposit requirement, and no commissions are charged. Although foreign exchange dealers do not charge a fee for conversion, they do realize a profit based on the difference between the prices at which they buy and sell various currencies. When the Portfolio manager believes that the currency of a particular foreign country may suffer a substantial decline against the U.S. dollar, a Portfolio may enter into a forward contract to sell, for a fixed amount of dollars, the amount of foreign currency approximating the value of some or all of that Portfolio’s securities denominated in or exposed to such foreign currency. No Portfolio will enter into such forward contracts or maintain a net exposure to such contracts where the consummation of the contracts would obligate the Portfolio to deliver an amount of foreign currency in excess of the value of its assets denominated in or exposed to that currency. At the consummation of a forward contract for delivery by a Portfolio of a foreign currency, the Portfolio may either make delivery of the foreign currency or terminate its contractual obligation to deliver the foreign currency by purchasing an offsetting contract obligating it to purchase, at the same maturity date, the same amount of the foreign currency. If the Portfolio chooses to make delivery of the foreign currency, it may be required to obtain such currency through the sale of its securities denominated in such currency or through conversion of other Portfolio assets into such currency. It is impossible to forecast the market value of Portfolio securities at the expiration of the forward contract. Accordingly, it may be necessary for the Portfolio to purchase additional foreign currency on the spot market (and bear the expense of such purchase) if the market value of the security is less than the amount of foreign currency the Portfolio is obligated to deliver, and if a decision is made to sell the security and make delivery of the foreign currency. Conversely, it may be necessary for the Portfolio to sell on the spot market some of the foreign currency received on the sale of its hedged security if the security’s market value exceeds the amount of foreign currency the Portfolio is obligated to deliver.
If the Portfolio retains the hedged security and engages in an offsetting transaction, it will incur a gain or loss to the extent that there has been movement in spot or forward contract prices. If a Portfolio engages in an offsetting transaction, it may subsequently enter into a new forward contract to sell the foreign currency. Should forward prices decline during the period between the Portfolio’s entering into a forward contract for the sale of a foreign currency and the date it enters into an offsetting contract for the purchase of the foreign currency, the Portfolio will realize a gain to the extent the price of the currency it has agreed to sell exceeds the price of the currency it has agreed to purchase. Should forward prices increase, the Portfolio will suffer a loss to the extent the price of the currency it has agreed to purchase exceeds the price of the currency it has agreed to sell.
Buyers and sellers of foreign currency options and futures contracts are subject to the same risks previously described with respect to options and futures generally. In addition, settlement of currency options and futures contracts with respect to most currencies must occur at a bank located in the issuing nation. The ability to establish and close out positions on such options is subject to the maintenance of a liquid market that may not always be available. Currency rates may fluctuate based on political considerations and governmental actions as opposed to purely economic factors.
Predicting the movements of foreign currency in relation to the U.S. dollar is difficult and requires different skills than those necessary to predict movements in the securities market. There is no assurance that the use of foreign currency hedging transactions can successfully protect a Portfolio against loss resulting from the movements of foreign currency in relation to the U.S. dollar. In addition, it must be remembered that these methods of protecting the value of a Portfolio’s securities against a decline in the value of a currency does not eliminate fluctuations in the underlying prices of the securities. It simply establishes a rate of exchange which can be achieved at some future point in time. Additionally, although such contracts tend to minimize the risk of loss due to the decline in the value of the hedged currency, at the same time they tend to limit any potential gain which might result should the value of such currency increase.
| 144 | (continued) |
| Ohio National Fund, Inc. |
| Notes to Financial Statements (Continued) |
December 31, 2012 |
Details of the foreign currency contracts outstanding in the International Portfolio at December 31, 2012 are as follows:
Contracts to buy foreign currency:
| Date of contract |
Exchange date |
Counterparty |
Currency to receive |
Currency to |
Contract at value |
Unrealized Appreciation (Depreciation) |
||||||||||
| October 8, 2012 |
January 10, 2013 |
HSBC | 85,604,000 RUB |
$2,715,002 |
$ | 2,798,879 | $ | 83,877 | ||||||||
| November 14, 2012 |
January 22, 2013 |
BARC | 96,805,000 INR |
$1,744,234 |
$ | 1,760,090 | $ | 15,856 | ||||||||
| November 29, 2012 |
January 22, 2013 |
HSBC | 93,520,900 INR |
$1,693,299 |
$ | 1,700,379 | $ | 7,080 | ||||||||
| November 27, 2012 |
March 6, 2013 |
HSBC | 4,400,000 NZD |
$3,592,028 |
$ | 3,621,753 | $ | 29,725 | ||||||||
| December 14, 2012 |
March 13, 2013 |
HSBC | 227,900,000 JPY |
$2,731,631 |
$ | 2,631,958 | $ | (99,673 | ) | |||||||
| December 18, 2012 |
March 13, 2013 |
HSBC | 154,620,300 JPY |
$1,839,404 |
$ | 1,785,670 | $ | (53,734 | ) | |||||||
| December 11, 2012 |
March 14, 2013 |
HSBC | 1,870,000 GBP |
$3,012,682 |
$ | 3,037,061 | $ | 24,379 | ||||||||
| December 11, 2012 |
March 14, 2013 |
HSBC | 3,390,000 CAD |
$3,430,653 |
$ | 3,402,996 | $ | (27,657 | ) | |||||||
| December 11, 2012 |
March 14, 2013 |
JPM | 4,575,000 GBP |
$7,366,473 |
$ | 7,430,242 | $ | 63,769 | ||||||||
|
|
|
|
|
|
||||||||||||
| $28,125,406 |
$ | 28,169,028 | $ | 43,622 | ||||||||||||
|
|
|
|
|
|
||||||||||||
Contracts to sell foreign currency:
| International |
||||||||||||||||
| Date of contract |
Exchange date |
Counterparty |
Currency to |
Currency to deliver |
Contract at value |
Unrealized Appreciation (Depreciation) |
||||||||||
| November 14, 2012 |
January 22, 2013 |
BARC | $ 3,426,657 |
7,160,000 BRL |
$ | 3,488,198 | $ | (61,541 | ) | |||||||
| December 4, 2012 |
March 13, 2013 |
HSBC | $ 13,988,415 |
1,144,811,910 JPY |
$ | 13,221,137 | $ | 767,278 | ||||||||
|
|
|
|
|
|
||||||||||||
| $ 17,415,072 |
$ | 16,709,335 | $ | 705,737 | ||||||||||||
|
|
|
|
|
|
||||||||||||
| Counterparties |
Currencies | |
| HSBC – HSBC Bank USA, N.A. |
RUB – New Russian Rubel | |
| JPM – JPMorgan Chase Bank, N.A. |
INR – Indian Rupee | |
| BARC – Barclays Bank PLC |
NZD – New Zealand Dollar | |
| JPY – Japanese Yen | ||
| GBP – British Pound | ||
| CAD – Canadian Dollar | ||
| BRL – Brazilian Real |
Foreign currency contracts were executed in the International Portfolio in order to mitigate the effect that exchange rate volatility had on the valuation of the Portfolio’s investments that were either under-weighted or over-weighted in relation to the Portfolio’s benchmark index. The Portfolio was under-weighted in equity investments within the countries of Russia, India, New Zealand, Great Britain, and Canada. The Portfolio executed contracts to buy those countries’ currencies to mitigate the effects that volatility in those currencies’ exchange rates might otherwise have on the Portfolio’s performance relative to the benchmark. The Portfolio was over-weighted in equity investments within the countries of Brazil and Japan and, likewise, executed contracts to sell those countries’ currencies in order to mitigate the effect that volatility in the exchange rate might otherwise have on relative performance.
The Portfolio entered into other foreign currency contracts during the year for similar benchmark performance hedging purposes. The Portfolio also entered into contracts that were the inverse of previously executed contracts to effectively exit prior contracts earlier than stated contract delivery dates, as over-weights or under-weights were reduced, or as previously executed contracts resulted in an attractive return to the Portfolio. For the year ended December 31, 2012, the notional value of foreign currency contracts executed by the International Portfolio were approximately $326.9 million for currencies bought and approximately $319.4 million for currencies sold.
| 145 | (continued) |
| Ohio National Fund, Inc. |
| Notes to Financial Statements (Continued) |
December 31, 2012 |
The values and financial statement effects of derivative instruments that were not accounted for as hedging instruments as of, and for the year ended December 31, 2012, were as follows:
| Portfolio |
Instrument |
Primary Risk Type |
Value-Asset Derivatives |
Value-Liability Derivatives |
Location on Statements of Assets and Liabilities |
|||||||||||
| International |
Contracts to buy foreign currencies |
Currency exchange rate |
$ | 28,169,028 | $ | (28,125,406 | ) | (1) | ||||||||
|
|
|
|
|
|||||||||||||
| Contracts to sell foreign currencies |
Currency exchange rate |
$ | 17,415,072 | $ | (16,709,335 | ) | (1) | |||||||||
|
|
|
|
|
|||||||||||||
| Futures contracts |
Equity price |
$ | 2,011,209 | $ | (2,027,207 | ) | (2) | |||||||||
|
|
|
|
|
|||||||||||||
| Balanced |
Purchased options |
Equity price |
$ | 401,100 | $ | — | (3) | |||||||||
|
|
|
|
|
|||||||||||||
| Income Opportunity |
Purchased options |
Equity price |
$ | 57,300 | $ | — | (3) | |||||||||
|
|
|
|
|
|||||||||||||
| (1) | Net unrealized appreciation on foreign currency contacts |
| (2) | Net unrealized appreciation on futures contracts |
| (3) | Investments in securities, at value |
| (4) | Options written, at value |
| Portfolio |
Instrument |
Risk Type |
Realized Gain (Loss) on Derivatives Recognized in Income |
Change in Unrealized Appreciation/ Depreciation on Derivatives Recognized in Income |
Location on Statements of Operations |
|||||||||||
| International |
Foreign currency contracts |
Currency exchange rate |
$ | 4,177,750 | $ | (1,235,849 | ) | (1), (2) | ||||||||
|
|
|
|
|
|||||||||||||
| Futures contracts |
Equity price |
$ | 103,370 | $ | (55,602 | ) | (3), (4) | |||||||||
|
|
|
|
|
|||||||||||||
| Balanced |
Purchased options |
Equity price |
$ | (314,600 | ) | $ | (17,505 | ) | (5), (6) | |||||||
|
|
|
|
|
|||||||||||||
| Written options |
Equity price |
$ | (139,933 | ) | $ | — | (7), (8) | |||||||||
|
|
|
|
|
|||||||||||||
| Income Opportunity |
Purchased options |
Equity price |
$ | (548,145 | ) | $ | 64,465 | (5), (6) | ||||||||
|
|
|
|
|
|||||||||||||
| Written options |
Equity price |
$ | (263,013 | ) | $ | 22,751 | (7), (8) | |||||||||
|
|
|
|
|
|||||||||||||
| (1) | Net realized gain (loss) on foreign currency contracts |
| (2) | Change in unrealized appreciation/depreciation on foreign currency contracts |
| (3) | Net realized gain (loss) on futures contracts |
| (4) | Change in unrealized appreciation/depreciation on futures contracts |
| (5) | Net realized gain (loss) on investments |
| (6) | Change in unrealized appreciation/depreciation on investments |
| (7) | Net realized gain (loss) on written options |
| (8) | Change in unrealized appreciation/depreciation on written options |
| 146 | (continued) |
| Ohio National Fund, Inc. |
| Notes to Financial Statements (Continued) |
December 31, 2012 |
| (7) | Federal Income Tax Information |
At December 31, 2012, the components of accumulated earnings (deficit) on a tax basis were as follows:
| Portfolio |
Undistributed Ordinary Income |
Undistributed Long-Term Capital Gains (Losses) |
Accumulated Earnings |
Accumulated Capital and Other Losses |
Unrealized Appreciation (Depreciation)(1) |
Total Accumulated Earnings (Deficit) |
||||||||||||||||||
| Equity |
$ | 367,208 | $ | — | $ | 367,208 | $ | (109,176,644 | ) | $ | 23,672,680 | $ | (85,136,756 | ) | ||||||||||
| Money Market |
— | — | — | — | — | — | ||||||||||||||||||
| Bond |
5,756,080 | — | 5,756,080 | (13,095,188 | ) | 14,784,981 | 7,445,873 | |||||||||||||||||
| Omni |
116,546 | — | 116,546 | (4,281,450 | ) | 1,818,860 | (2,346,044 | ) | ||||||||||||||||
| International. |
5,607,011 | — | 5,607,011 | (91,803,628 | ) | 36,434,497 | (49,762,120 | ) | ||||||||||||||||
| Capital Appreciation |
83,350 | — | 83,350 | (9,467,074 | ) | 12,600,804 | 3,217,080 | |||||||||||||||||
| Millennium |
— | — | — | (7,160,910 | ) | 1,985,715 | (5,175,195 | ) | ||||||||||||||||
| International Small-Mid Company |
324,350 | — | 324,350 | (12,428,660 | ) | 14,693,887 | 2,589,577 | |||||||||||||||||
| Aggressive Growth |
103,178 | — | 103,178 | (926,592 | ) | 7,701,693 | 6,878,279 | |||||||||||||||||
| Small Cap Growth |
1,231,899 | 4,665,376 | 5,897,275 | — | 1,764,497 | 7,661,772 | ||||||||||||||||||
| Mid Cap Opportunity. |
— | — | — | (24,689,868 | ) | 9,517,626 | (15,172,242 | ) | ||||||||||||||||
| S&P 500® Index |
741,137 | — | 741,137 | (1,370,102 | ) | 44,464,029 | 43,835,064 | |||||||||||||||||
| Strategic Value |
2,248,868 | — | 2,248,868 | (6,052,041 | ) | 1,681,512 | (2,121,661 | ) | ||||||||||||||||
| High Income Bond |
21,490,144 | 4,485,600 | 25,975,744 | — | 16,141,992 | 42,117,736 | ||||||||||||||||||
| Capital Growth |
488,764 | 3,302,339 | 3,791,103 | — | 9,349,925 | 13,141,028 | ||||||||||||||||||
| Nasdaq-100® Index |
431,659 | 244,406 | 676,065 | — | 16,663,050 | 17,339,115 | ||||||||||||||||||
| Bristol |
563,023 | 7,883,154 | 8,446,177 | — | 9,315,151 | 17,761,328 | ||||||||||||||||||
| Bryton Growth |
7,458,993 | 4,746,750 | 12,205,743 | — | (646,972 | ) | 11,558,771 | |||||||||||||||||
| U.S. Equity |
22,445 | — | 22,445 | (5,766,338 | ) | 2,148,659 | (3,595,234 | ) | ||||||||||||||||
| Balanced |
651,938 | — | 651,938 | (344,425 | ) | 2,746,717 | 3,054,230 | |||||||||||||||||
| Income Opportunity |
119,759 | — | 119,759 | (178,081 | ) | 1,326,409 | 1,268,087 | |||||||||||||||||
| Target VIP |
79,804 | — | 79,804 | (6,313,615 | ) | 2,070,745 | (4,163,066 | ) | ||||||||||||||||
| Target Equity/Income |
116,187 | — | 116,187 | (15,288,008 | ) | 1,382,038 | (13,789,783 | ) | ||||||||||||||||
| Bristol Growth |
1,134,150 | 5,795,060 | 6,929,210 | — | 4,870,688 | 11,799,898 | ||||||||||||||||||
| (1) | The differences between book-basis and tax-basis unrealized appreciation/(depreciation) are attributed primarliy to tax deferral of losses on wash sales and the realization for tax purposes of unrealized gains/(losses) on certain instruments. |
For Federal income tax purposes, the following Portfolios had capital loss carry forwards as of December 31, 2012 that are available to offset future realized gains, if any:
| Total Loss Carryforward |
Expiration | |||||||||||||||||||||||
| Portfolio |
2016 | 2017 | 2018 | No Expiration Short Term |
No Expiration Long Term |
|||||||||||||||||||
| Equity |
$ | 109,176,644 | $ | 58,736,517 | $ | 47,422,387 | $ | 3,017,740 | $ | — | $ | — | ||||||||||||
| Bond |
13,095,188 | 3,572,434 | 9,522,754 | — | — | — | ||||||||||||||||||
| Omni |
4,281,450 | — | 4,281,450 | — | — | — | ||||||||||||||||||
| International. |
91,803,628 | 26,011,498 | 65,792,130 | — | — | — | ||||||||||||||||||
| Capital Appreciation |
9,467,074 | — | 9,467,074 | — | — | — | ||||||||||||||||||
| Millennium |
7,160,910 | — | 7,160,910 | — | — | — | ||||||||||||||||||
| International Small-Mid Company |
12,428,660 | 1,536,227 | 10,892,433 | — | — | — | ||||||||||||||||||
| Aggressive Growth |
926,592 | — | 705,621 | — | 220,971 | — | ||||||||||||||||||
| Mid Cap Opportunity. |
24,689,868 | 11,038,408 | 13,651,460 | — | — | — | ||||||||||||||||||
| S&P 500® Index |
1,370,102 | — | 58,164 | 1,311,938 | — | — | ||||||||||||||||||
| Strategic Value |
6,052,041 | 3,585,588 | 2,272,799 | 193,654 | — | — | ||||||||||||||||||
| U.S. Equity |
5,766,338 | 1,759,920 | 4,006,418 | — | — | — | ||||||||||||||||||
| Balanced |
344,425 | — | 344,425 | — | — | — | ||||||||||||||||||
| Income Opportunity |
178,081 | — | 37,641 | 140,440 | — | — | ||||||||||||||||||
| Target VIP |
6,313,615 | — | 6,313,615 | — | — | — | ||||||||||||||||||
| Target Equity/Income |
15,288,008 | — | 12,624,380 | — | 2,663,628 | — | ||||||||||||||||||
| 147 | (continued) |
| Ohio National Fund, Inc. |
| Notes to Financial Statements (Continued) |
December 31, 2012 |
The Board does not intend to authorize a distribution of any realized gain for a Portfolio until the capital loss carry over has been offset or expires.
The Regulated Investment Company Modernization Act of 2010 (the “Act”) was enacted on December 22, 2010. The Act makes changes to several tax rules impacting the Fund. In general, the provisions of the Act were effective for the Fund’s fiscal year ending December 31, 2012. Although the Act provides several benefits, including the unlimited carryover of future capital losses, there may be a greater likelihood that all or a portion of each Portfolio’s pre-enactment capital loss carryovers may expire without being utilized due to the Act’s requirement that post-enactment capital losses be utilized before pre-enactment capital loss carryovers.
The tax characteristics of distributions paid to shareholders for the year ended December 31, 2012 were as follows:
| Portfolio |
Ordinary Income |
Net Long-Term Capital Gains |
Total Distribution Paid |
|||||||||
| Equity |
$ | 2,551,766 | $ | — | $ | 2,551,766 | ||||||
| Omni |
434,512 | — | 434,512 | |||||||||
| Capital Appreciation |
681,205 | — | 681,205 | |||||||||
| S&P 500® Index |
2,826,655 | — | 2,826,655 | |||||||||
| Strategic Value |
3,918,367 | — | 3,918,367 | |||||||||
| Nasdaq-100® Index |
447,911 | — | 447,911 | |||||||||
| Bristol |
1,149,626 | — | 1,149,626 | |||||||||
| US Equity |
86,203 | — | 86,203 | |||||||||
| Target VIP |
297,777 | — | 297,777 | |||||||||
| Target Equity/Income |
449,704 | — | 449,704 | |||||||||
| Bristol Growth |
473,865 | — | 473,865 | |||||||||
The tax characteristics of distributions paid to shareholders for the year ended December 31, 2011 were as follows:
| Portfolio |
Ordinary Income |
Net Long-Term Capital Gains |
Total Distribution Paid |
|||||||||
| Equity |
$ | 1,709,149 | $ | — | $ | 1,709,149 | ||||||
| Omni |
467,625 | — | 467,625 | |||||||||
| Capital Appreciation |
471,108 | — | 471,108 | |||||||||
| S&P 500® Index |
2,390,576 | — | 2,390,576 | |||||||||
| Strategic Value |
599,193 | — | 599,193 | |||||||||
| Nasdaq-100® Index |
205,415 | — | 205,415 | |||||||||
| Bristol |
910,805 | — | 910,805 | |||||||||
| Balanced |
324,529 | — | 324,529 | |||||||||
| Target VIP |
209,154 | — | 209,154 | |||||||||
| Target Equity/Income |
373,545 | — | 373,545 | |||||||||
| Bristol Growth |
366,489 | — | 366,489 | |||||||||
| 148 | (continued) |
Ohio National Fund, Inc.
| Notes to Financial Statements (Continued) |
December 31, 2012 |
During the year, the Fund recorded classifications within the composition of net assets for permanent book/tax differences. These classifications were as follows:
| Equity | Money Market |
Bond | Omni | International | Capital Appreciation |
Millennium | International Small-Mid Company |
Aggressive Growth |
Small Cap Growth |
Mid Cap Opportunity |
S&P
500® Index |
|||||||||||||||||||||||||||||||||||||
| Consent distributions |
||||||||||||||||||||||||||||||||||||||||||||||||
| Paid in capital in excess of par value |
$ | 324,074 | $ | — | $ | 5,641,940 | $ | 73,015 | $ | 1,009,365 | $ | 43,504 | $ | — | $ | 729,334 | $ | 3,051 | $ | 1,520,145 | $ | — | $ | 408,791 | ||||||||||||||||||||||||
| Undistributed net investment income |
(324,074 | ) | — | (5,641,940 | ) | (73,015 | ) | (1,009,365 | ) | (43,504 | ) | — | (729,334 | ) | (3,051 | ) | — | — | (408,791 | ) | ||||||||||||||||||||||||||||
| Accumulated net realized gain (loss) on investments |
— | — | — | — | — | — | — | — | — | (1,520,145 | ) | — | — | |||||||||||||||||||||||||||||||||||
| Undistributed net investment losses |
||||||||||||||||||||||||||||||||||||||||||||||||
| Paid in capital in excess of par value |
— | — | — | — | — | — | (167,248 | ) | — | — | — | (90,469 | ) | — | ||||||||||||||||||||||||||||||||||
| Undistributed net investment income |
— | — | — | — | — | — | 167,248 | — | — | 69,184 | 90,469 | — | ||||||||||||||||||||||||||||||||||||
| Accumulated net realized gain (loss) on investments |
— | — | — | — | — | — | — | — | — | (69,184 | ) | — | — | |||||||||||||||||||||||||||||||||||
| Foreign currency related reclassifications |
||||||||||||||||||||||||||||||||||||||||||||||||
| Undistributed net investment income |
— | — | — | 16 | 3,868,130 | (648 | ) | — | (74,888 | ) | 8 | (18 | ) | — | — | |||||||||||||||||||||||||||||||||
| Accumulated net realized gain (loss) on investments |
— | — | — | (16 | ) | (3,868,130 | ) | 648 | — | 74,888 | (8 | ) | 18 | — | — | |||||||||||||||||||||||||||||||||
| Real estate investment trust (REIT) reclassifications |
||||||||||||||||||||||||||||||||||||||||||||||||
| Undistributed net investment income |
(16,079 | ) | — | — | — | — | — | — | — | (846 | ) | — | — | (61,826 | ) | |||||||||||||||||||||||||||||||||
| Accumulated net realized gain (loss) on investments |
16,079 | — | — | — | — | — | — | — | 846 | — | — | 61,826 | ||||||||||||||||||||||||||||||||||||
| Passive Foreign Investment Company (PFIC) reclassifications |
||||||||||||||||||||||||||||||||||||||||||||||||
| Undistributed net investment income |
— | — | — | 32,253 | — | 5,991 | — | — | — | — | — | — | ||||||||||||||||||||||||||||||||||||
| Accumulated net realized gain (loss) on investments |
— | — | — | (32,253 | ) | — | (5,991 | ) | — | — | — | — | — | — | ||||||||||||||||||||||||||||||||||
| Other permanent differences |
||||||||||||||||||||||||||||||||||||||||||||||||
| Paid in capital in excess of par value |
— | — | — | — | — | — | — | — | — | — | (295 | ) | — | |||||||||||||||||||||||||||||||||||
| Undistributed net investment income |
— | — | (2,664 | ) | — | — | (4,526 | ) | — | — | — | — | (32,488 | ) | (4,734 | ) | ||||||||||||||||||||||||||||||||
| Accumulated net realized gain (loss) on investments |
— | — | 2,664 | — | — | 4,526 | — | — | — | — | 32,783 | 4,734 | ||||||||||||||||||||||||||||||||||||
| 149 | (continued) |
Ohio National Fund, Inc.
| Notes to Financial Statements (Continued) |
December 31, 2012 |
| Strategic Value |
High Income Bond |
Capital Growth |
Nasdaq-100® Index |
Bristol | Bryton Growth |
U.S. Equity |
Balanced | Income Opportunity |
Target VIP |
Target Equity/Income |
Bristol Growth |
|||||||||||||||||||||||||||||||||||||
| Consent distributions |
||||||||||||||||||||||||||||||||||||||||||||||||
| Paid in capital in excess of par value |
$ | 559,206 | $ | 22,704,018 | $ | 2,711,694 | $ | 4,882,212 | $ | 3,107,885 | $ | 22,416,519 | $ | 87,152 | $ | 57,455 | $ | 108,336 | $ | 24,083 | $ | 50,416 | $ | 7,814,376 | ||||||||||||||||||||||||
| Undistributed net investment income |
(559,206 | ) | (21,132,185 | ) | — | (20,387 | ) | (76,535 | ) | (830,922 | ) | (87,152 | ) | (57,455 | ) | (108,336 | ) | (24,083 | ) | (50,416 | ) | (20,648 | ) | |||||||||||||||||||||||||
| Accumulated net realized gain (loss) on investments |
— | (1,571,833 | ) | (2,711,694 | ) | (4,861,825 | ) | (3,031,350 | ) | (21,585,597 | ) | — | — | — | — | — | (7,793,728 | ) | ||||||||||||||||||||||||||||||
| Undistributed net investment losses |
||||||||||||||||||||||||||||||||||||||||||||||||
| Paid in capital in excess of par value |
— | — | — | — | — | — | — | — | — | — | — | — | ||||||||||||||||||||||||||||||||||||
| Undistributed net investment income |
— | — | 96,135 | — | — | 766,536 | — | — | — | — | — | — | ||||||||||||||||||||||||||||||||||||
| Accumulated net realized gain (loss) on investments |
— | — | (96,135 | ) | — | — | (766,536 | ) | — | — | — | — | — | — | ||||||||||||||||||||||||||||||||||
| Foreign currency related reclassifications |
||||||||||||||||||||||||||||||||||||||||||||||||
| Undistributed net investment income |
356,986 | — | — | (37 | ) | 130 | 136 | — | 7 | — | (50 | ) | (145 | ) | — | |||||||||||||||||||||||||||||||||
| Accumulated net realized gain (loss) on investments |
(356,986 | ) | — | — | 37 | (130 | ) | (136 | ) | — | (7 | ) | — | 50 | 145 | — | ||||||||||||||||||||||||||||||||
| Real estate investment trust (REIT) reclassifications |
||||||||||||||||||||||||||||||||||||||||||||||||
| Undistributed net investment income |
(39 | ) | — | (28,069 | ) | — | — | 111,045 | — | 76 | 7 | — | — | — | ||||||||||||||||||||||||||||||||||
| Accumulated net realized gain (loss) on investments |
39 | — | 28,069 | — | — | (111,045 | ) | — | (76 | ) | (7 | ) | — | — | — | |||||||||||||||||||||||||||||||||
| Passive Foreign Investment Company (PFIC) reclassifications |
||||||||||||||||||||||||||||||||||||||||||||||||
| Undistributed net investment income |
— | — | — | — | 238,448 | — | — | — | — | — | — | 104,112 | ||||||||||||||||||||||||||||||||||||
| Accumulated net realized gain (loss) on investments |
— | — | — | — | (238,448 | ) | — | — | — | — | — | — | (104,112 | ) | ||||||||||||||||||||||||||||||||||
| Other permanent differences |
||||||||||||||||||||||||||||||||||||||||||||||||
| Paid in capital in excess of par value |
— | — | (2,376 | ) | — | — | — | — | — | (66 | ) | — | — | — | ||||||||||||||||||||||||||||||||||
| Undistributed net investment income |
(1,097 | ) | — | (14,700 | ) | — | — | — | — | — | 486 | — | — | — | ||||||||||||||||||||||||||||||||||
| Accumulated net realized gain (loss) on investments |
1,097 | — | 17,076 | — | — | — | — | — | (420 | ) | — | — | — | |||||||||||||||||||||||||||||||||||
| 150 | (continued) |
| Ohio National Fund, Inc. |
| Notes to Financial Statements (Continued) |
December 31, 2012 |
The cost basis for Federal income tax purposes may differ from the cost basis for financial reporting purposes. The table below details the unrealized appreciation (depreciation) and aggregate cost of securities at December 31, 2012 for Federal income tax purposes.
| Equity | Bond | Omni | International | Capital Appreciation |
Millennium | |||||||||||||||||||
| Gross unrealized: |
||||||||||||||||||||||||
| Appreciation |
$ | 31,948,835 | $ | 15,004,072 | $ | 2,660,049 | $ | 40,269,309 | $ | 16,804,570 | $ | 2,553,854 | ||||||||||||
| Depreciation |
(8,276,155 | ) | (219,091 | ) | (841,189 | ) | (3,834,812 | ) | (4,203,766 | ) | (568,139 | ) | ||||||||||||
|
|
|
|
|
|
|
|
|
|
|
|
|
|||||||||||||
| Net unrealized appreciation (depreciation) |
$ | 23,672,680 | $ | 14,784,981 | $ | 1,818,860 | $ | 36,434,497 | $ | 12,600,804 | $ | 1,985,715 | ||||||||||||
|
|
|
|
|
|
|
|
|
|
|
|
|
|||||||||||||
| Aggregate cost of securities: |
$ | 162,319,408 | $ | 155,352,951 | $ | 31,161,816 | $ | 147,858,772 | $ | 103,354,581 | $ | 32,225,116 | ||||||||||||
|
|
|
|
|
|
|
|
|
|
|
|
|
|||||||||||||
| International Small-Mid Company |
Aggressive Growth |
Small Cap Growth |
Mid Cap Opportunity |
S&P 500® Index |
Strategic Value |
|||||||||||||||||||
| Gross unrealized: |
||||||||||||||||||||||||
| Appreciation |
$ | 15,184,297 | $ | 8,992,204 | $ | 4,028,478 | $ | 12,604,032 | $ | 67,493,585 | $ | 9,685,136 | ||||||||||||
| Depreciation |
(490,410 | ) | (1,290,511 | ) | (2,263,981 | ) | (3,086,406 | ) | (23,029,556 | ) | (8,003,624 | ) | ||||||||||||
|
|
|
|
|
|
|
|
|
|
|
|
|
|||||||||||||
| Net unrealized appreciation (depreciation) |
$ | 14,693,887 | $ | 7,701,693 | $ | 1,764,497 | $ | 9,517,626 | $ | 44,464,029 | $ | 1,681,512 | ||||||||||||
|
|
|
|
|
|
|
|
|
|
|
|
|
|||||||||||||
| Aggregate cost of securities: |
$ | 49,988,898 | $ | 25,480,341 | $ | 33,278,995 | $ | 57,894,877 | $ | 163,340,790 | $ | 258,153,134 | ||||||||||||
|
|
|
|
|
|
|
|
|
|
|
|
|
|||||||||||||
| High Income Bond |
Capital Growth |
Nasdaq-100® Index |
Bristol | Bryton Growth | U.S. Equity | |||||||||||||||||||
| Gross unrealized: |
||||||||||||||||||||||||
| Appreciation |
$ | 19,884,012 | $ | 12,208,669 | $ | 19,572,754 | $ | 15,866,901 | $ | 13,452,745 | $ | 2,524,742 | ||||||||||||
| Depreciation |
(3,742,020 | ) | (2,858,744 | ) | (2,909,704 | ) | (6,551,750 | ) | (14,099,717 | ) | (376,083 | ) | ||||||||||||
|
|
|
|
|
|
|
|
|
|
|
|
|
|||||||||||||
| Net unrealized appreciation (depreciation) |
$ | 16,141,992 | $ | 9,349,925 | $ | 16,663,050 | $ | 9,315,151 | $ | (646,972 | ) | $ | 2,148,659 | |||||||||||
|
|
|
|
|
|
|
|
|
|
|
|
|
|||||||||||||
| Aggregate cost of securities: |
$ | 292,105,942 | $ | 46,449,891 | $ | 51,021,932 | $ | 194,293,084 | $ | 155,954,912 | $ | 13,453,650 | ||||||||||||
|
|
|
|
|
|
|
|
|
|
|
|
|
|||||||||||||
| Balanced | Income Opportunity |
Target VIP | Target Equity/Income |
Bristol Growth | ||||||||||||||||||||
| Gross unrealized: |
||||||||||||||||||||||||
| Appreciation |
$ | 3,866,192 | $ | 1,447,186 | $ | 3,496,576 | $ | 2,314,061 | $ | 8,002,507 | ||||||||||||||
| Depreciation |
(1,119,475 | ) | (120,777 | ) | (1,425,831 | ) | (932,023 | ) | (3,131,819 | ) | ||||||||||||||
|
|
|
|
|
|
|
|
|
|
|
|||||||||||||||
| Net unrealized appreciation (depreciation) |
$ | 2,746,717 | $ | 1,326,409 | $ | 2,070,745 | $ | 1,382,038 | $ | 4,870,688 | ||||||||||||||
|
|
|
|
|
|
|
|
|
|
|
|||||||||||||||
| Aggregate cost of securities: |
$ | 74,015,445 | $ | 8,312,660 | $ | 19,028,478 | $ | 20,509,651 | $ | 101,083,947 | ||||||||||||||
|
|
|
|
|
|
|
|
|
|
|
|||||||||||||||
| (8) | Legal Matters |
In December 2007, the Target Equity/Income Portfolio, as a shareholder of Lyondell Chemical Company (“Lyondell”), participated in a cash out merger of Lyondell in which it received $48 per share of consideration (the “Merger”). Lyondell later filed for bankruptcy and two entities created by the Lyondell bankruptcy plan of reorganization have initiated lawsuits seeking to recover, or clawback, proceeds received by shareholders in the December 2007 merger based on fraudulent transfer claims.
The first action, Edward S. Weisfelner, as Trustee of the LB Creditor Trust v. Morgan Stanley & Co., Inc., et. al., was initiated on October 22, 2010 (the “Creditor Trust Action”), in the Supreme Court of the State of New York in the County of New York but has subsequently been removed to the U.S. Bankruptcy Court for the Southern District of New York. The second action, Edward S. Weisfelner, as Trustee of the LB Litigation Trust v. Holmes TTEE, et. al., was initiated on December 23, 2010 (the “Litigation Trust Action”), in the U.S. Bankruptcy Court for the Southern District of New York. Both actions attempt to recover the proceeds paid out to the holders of Lyondell shares at the time of the 2007 merger.
On January 4, 2012, the Fund was named in a second amended complaint in the Creditor Trust Action. The Target Equity/Income Portfolio composes part of the Fund. The value of the proceeds received by the Target Equity/Income Portfolio as a result of the Merger was $1,772,400. On March 2, 2012, the Fund moved the U.S. Bankruptcy Court for the Southern District of New York to dismiss it from the Creditor Trust Action. The Court has yet to take any action on the motion to dismiss. The outcome of these
| 151 | (continued) |
| Ohio National Fund, Inc. |
| Notes to Financial Statements (Continued) |
December 31, 2012 |
proceedings on the Portfolio cannot be predicted. Management of the Fund is currently assessing the cases and has not yet determined the potential effect, if any, on the net asset value of the Target Equity/Income Portfolio.
Also, in December 2007, the S&P 500® Index and Strategic Value Portfolios, shareholders of the Tribune Company, participated in a similar cash out merger in which shareholders received $34 per share of consideration. The company subsequently filed for bankruptcy and several legal complaints have been initiated by groups of Tribune Company creditors seeking to recover, or clawback, proceeds received by shareholders based on fraudulent transfer claims (the “Tribune Bankruptcy”).
The first action, Official Committee of Unsecured Creditors of Tribune Company v. FitzSimons, et. al., was initiated on November 1, 2010 in the U.S. Bankruptcy Court for the District of Delaware. As a result of these proceedings, the Court agreed to allow individual creditors to file similar complaints in U.S. state courts. The Fund is specifically named in a complaint in the U.S. District Court, Southern District of Ohio, Western Division, Deutsche Bank Trust Company Americas, et. al. v. American Electric Power, et. al., that was initiated in June of 2011. The Fund, along with the Strategic Value Portfolio, is also named in a similar complaint in the U.S. District Court, Eastern District of Pennsylvania, Deutsche Bank Trust Company Americas, et. al. v. Ametek Inc. Employees Master Retirement Trust, et. al. These Tribune litigation actions have been consolidated into a single Multidistrict Litigation (“MDL”) in the U.S. District Court, Southern District of New York. On November 6, 2012, the Fund, along with other similarly situated defendants in the MDL, filed a motion to dismiss the individual creditor actions. Subsequently, the Court scheduled oral arguments on the motion to dismiss for March 1, 2013. The value of the proceeds received by the S&P 500® Index and Strategic Value Portfolios, was $37,910 and $384,200, respectively. The outcome of these proceedings on the two Portfolios of the Fund cannot be predicted. Management of the Fund is currently assessing the complaints and has not yet determined the potential effect, if any, on the respective net assets values of those Portfolios.
| 152 |
| Ohio National Fund, Inc. |
The Board of Directors and Shareholders Ohio National Fund, Inc.:
We have audited the accompanying statements of assets and liabilities of the Equity Portfolio, Money Market Portfolio, Bond Portfolio, Omni Portfolio, International Portfolio, Capital Appreciation Portfolio, Millennium Portfolio, International Small-Mid Company Portfolio, Aggressive Growth Portfolio, Small Cap Growth Portfolio, Mid Cap Opportunity Portfolio, S&P 500 Index Portfolio, Strategic Value Portfolio, High Income Bond Portfolio, Capital Growth Portfolio, Nasdaq-100 Index Portfolio, Bristol Portfolio, Bryton Growth Portfolio, U.S. Equity Portfolio, Balanced Portfolio, Income Opportunity Portfolio, Target VIP Portfolio, Target Equity/Income Portfolio and Bristol Growth Portfolio (each a Portfolio and collectively, the Portfolios of the Ohio National Fund, Inc.), including the schedules of investments, as of December 31, 2012, and the related statements of operations for the year then ended, the statements of changes in net assets for each of the years in the two-year period then ended, and the financial highlights for each of the years in the five-year period then ended. These financial statements and financial highlights are the responsibility of the Portfolios’ management. Our responsibility is to express an opinion on these financial statements and financial highlights based on our audits.
We conducted our audits in accordance with the standards of the Public Company Accounting Oversight Board (United States). Those standards require that we plan and perform the audit to obtain reasonable assurance about whether the financial statements and financial highlights are free of material misstatement. An audit includes examining, on a test basis, evidence supporting the amounts and disclosures in the financial statements. Our procedures included confirmation of securities owned as of December 31, 2012, by correspondence with custodians and brokers. An audit also includes assessing the accounting principles used and significant estimates made by management, as well as evaluating the overall financial statement presentation. We believe that our audits provide a reasonable basis for our opinion.
In our opinion, the financial statements and financial highlights referred to above present fairly, in all material respects, the financial position of the Portfolios as of December 31, 2012, the results of their operations for the year then ended, the changes in their net assets for each of the years in the two-year period then ended, and the financial highlights for each of the years in the five-year period then ended, in conformity with U.S. generally accepted accounting principles.
/s/ KPMG LLP
Columbus, Ohio
February 18, 2013
| 153 |
| Ohio National Fund, Inc. |
| December 31, 2012 |
| (1) | Review and Approval of Advisory and Sub-advisory Agreements |
At a meeting held on November 13, 2012, the Board of Directors, including a majority of the Directors who are not “interested persons” of the Fund (the “Independent Directors”), approved the continuation of the Investment Advisory Agreement with ONI (the “Adviser”) and, as applicable, the sub-advisory agreement with the Sub-Adviser (each a “Sub-Adviser,” and together the “Sub-Advisers”) for each of the Portfolios identified below. The Independent Directors were separately represented by independent legal counsel in connection with their consideration of the approval of the continuation of these agreements.
The Directors noted that the Adviser is responsible for monitoring the investment performance and other responsibilities of the various Sub-Advisers that have day-to-day responsibility for the decisions made for certain of the Fund’s investment portfolios. They also noted that the Adviser reports to the Fund’s Board on its analysis of each Sub-Adviser’s performance at the regular meetings of the Board, which are held at least quarterly. Where warranted, the Adviser will add or remove a particular Sub-Adviser from a watchlist that it maintains. Watchlist criteria include, for example: (a) fund performance over various time periods; (b) fund risk issues, such as changes in key personnel involved with fund management or changes in investment philosophy or process; and (c) organizational risk issues, such as regulatory, compliance or legal concerns, or changes in the ownership of the Sub-Adviser.
In considering the Investment Advisory and sub-advisory agreements, the Board requested and reviewed a significant amount of information relating to each Portfolio, the Adviser and the Sub-Advisers, including the following: (1) performance data for each Portfolio for various time periods, including year-to-date through September 30, 2012, (2) comparative performance, advisory fee and expense ratio information for a peer group of funds in the respective Portfolio’s Morningstar category (a “Morningstar Peer Group”), as well as management fee peer comparison charts showing where each Portfolio’s advisory fee was located in the dispersion of its peer funds’ advisory fees; (3) comparable performance information for each Portfolio’s relevant benchmark index or indices; (4) comparative data regarding advisory fees, including data regarding the fees charged by the Adviser and Sub-Advisers for managing other institutional funds and institutional accounts using investment strategies and techniques similar to those used in managing the Portfolios; (5) comparative data regarding the expense ratio of each Portfolio, as compared to its Morningstar Peer Group; (6) profitability analyses for the Adviser with respect to each Portfolio; and (7) other information regarding the nature, extent and quality of services provided by the Adviser and the Sub-Advisers, as applicable. The Directors also took into account information on the services provided by the Adviser and each Sub-Adviser and performance, fee and expense ratio information regarding each Portfolio provided to them periodically throughout the year. They also met with a representative of the Adviser to review the relative performance of each Portfolio, as compared with its benchmark(s) and peers, and in particular discussed those Portfolios that were on the watchlist.
The Independent Directors were assisted by experienced independent legal counsel throughout the contract review process. They discussed the proposed continuances in private session with such counsel at which no representatives of management, the Adviser or any Sub-Adviser were present. The Independent Directors relied upon the advice of independent legal counsel and their own business judgment in determining the material factors to be considered in evaluating each Advisory and sub-advisory agreement and the weight to be given to each such factor. The conclusions reached by the Independent Directors were based on a comprehensive evaluation of all of the information provided and were not the result of any one factor. Moreover, each Independent Director may have afforded different weight to the various factors in reaching his or her conclusions with respect to each Advisory and sub-advisory agreement.
Nature, Extent and Quality of Services
The Board evaluated the nature, extent and quality of the advisory services provided to the Portfolios by the Adviser. As part of its review, the Board reviewed information regarding the Adviser’s operations, procedures and personnel. The Directors took into account information they received during the previous year at Board meetings and other discussions and through periodic reports regarding the Adviser’s performance of its duties. The Directors considered the capabilities and resources that the Adviser has dedicated to performing services on behalf of the Fund and its Portfolios. The quality of administrative and other services, including the Adviser’s role in monitoring the performance and quality of compliance of the Sub-Advisers, also was considered. The Directors also considered the quality of the compliance programs of the Adviser and its responsiveness to inquiries and requests from the Board.
For each Portfolio subject to a sub-advisory agreement (all Portfolios other than the Money Market Portfolio, Bond Portfolio, S&P 500® Index Portfolio, Nasdaq-100® Index Portfolio and the fixed income portion of the Omni Portfolio), the Board considered similar criteria as applied to each Sub-Adviser, including the nature, extent and quality of the sub-advisory services provided by each Sub-Adviser. In addition to the criteria used to review the Adviser, the Directors reviewed biographical information on each Sub-Adviser’s portfolio management and other professional staff, and each Sub-Adviser’s brokerage practices, including any soft dollar benefits received. The Directors also reviewed the performance record of each Portfolio or portion of a Portfolio managed by the applicable Sub-Adviser. The Board also considered the quality of each Sub-Adviser’s compliance program as it relates to the applicable Portfolio. It was the Directors’ conclusion that overall, they were satisfied with the nature, extent and quality of services provided to the Fund and each of the Portfolios.
Investment Performance
A representative of the Adviser reviewed with the Directors each Portfolio’s performance year-to-date and for the 1-, 3- and 5-year periods ended September 30, 2012, as compared to the Portfolio’s Morningstar Peer Group and benchmark(s). The Board also considered the Adviser’s
| 154 | (continued) |
| Ohio National Fund, Inc. |
| Additional Information (Unaudited) (Continued) |
December 31, 2012 |
effectiveness in monitoring the performance of each Sub-Adviser and the Adviser’s timeliness in responding to performance issues. A Portfolio-by-Portfolio discussion of each Portfolio’s performance and the Board’s conclusions regarding that performance is set forth below.
Fees and Expenses
The Board considered the advisory fee for each Portfolio, as well as the fee’s difference from the average advisory fee for the Portfolio’s Morningstar Peer Group and the fee’s percentile ranking within the peer group. The Board also considered the difference between each Portfolio’s overall expense ratio and that of its Morningstar Peer Group, as well as the expense ratio’s percentile ranking within the peer group.
Additionally, the Board considered certain adjusted statistics for Portfolios whose Morningstar Peer Group’s average advisory fee was likely to be skewed by the inclusion of index funds and funds of funds. The Board looked at the average assets for each fund in the respective peer group, excluding index funds and funds of funds (the “Adjusted Peer Group”) and then compared the advisory fee that would have been paid by the Portfolio if the Portfolio had assets equal to the adjusted peer group’s average assets. The Board considered that comparison on an absolute and percentile ranking basis.
The Board also considered the fees paid to Sub-Advisers. With respect to the Portfolios sub-advised by Suffolk, an affiliate of the Adviser, the Board evaluated the reasonableness of the total fees received by the Adviser. With respect to those Portfolios sub-advised by a Sub-Adviser that is not affiliated with the Adviser, the Board relied to a degree on the Adviser’s negotiation of each sub-advisory agreement on an arm’s-length basis, noting that in the past the Adviser has negotiated decreases in the sub-advisory fee for certain Portfolios and that the Adviser had always passed on the decrease by reducing its advisory fee by the same amount. Additionally, the Board considered the fees charged by the Adviser and Sub-Advisers to their separately managed institutional accounts and other accounts, and had no concerns with those rates relative to the fees charged to the Portfolio. The Directors also recognized that it is difficult to make comparisons of advisory fees because there are variations in the services that are included in the fees paid by other funds and separately managed accounts.
Profitability
The Board considered the advisory fee paid to the Adviser for each Portfolio and noted the pre-tax profit margins reported by the Adviser for each Portfolio. The Directors noted that the Adviser, and not the Portfolios, is responsible for paying sub-advisory fees to the Portfolio Sub-Advisers. The Board also evaluated whether the net advisory fee received by the Adviser for each Portfolio, after paying sub-advisory fees to the Sub-Adviser, was reasonable, given the level of the Adviser’s services to the Portfolio. The Directors took into account the fact that the Adviser is contractually obligated to reimburse each Portfolio for certain of its expenses should they exceed a specified amount. Additionally, the Directors acknowledged that calculating the Adviser’s profitability related to a specific Portfolio can be challenging and imprecise because of the difficulties in appropriately allocating the Adviser’s expenses across the Portfolios.
The Board also noted that the Adviser has been subsidizing the Money Market Portfolio to assure that it continues to be available to all of Ohio National Fund, Inc.’s shareholders (i.e., the shareholders of every Portfolio), so that shareholders in other Portfolios can elect to invest in the Money Market Portfolio to the extent they want to take a more defensive posture. Consequently, because the Adviser’s subsidization of the Money Market Portfolio benefits the shareholders of every Portfolio, the Board acknowledged that a portion of the costs incurred by the Adviser in subsidizing the Money Market Portfolio should be considered with respect to the Adviser’s profitability from managing each of the other Portfolios.
The Board also considered the reasonableness of the sub-advisory fees paid by the Adviser to each Sub-Adviser. The Directors relied on the ability of the Adviser to negotiate the terms of each sub-advisory agreement, including the sub-advisory fee, at arm’s-length, noting that the Adviser is not affiliated with any Portfolio Sub-Adviser other than Suffolk. Accordingly, the cost of services provided by each unaffiliated Sub-Adviser and the profitability to the Sub-Adviser of its relationship with the applicable Portfolio were not material factors in the Board’s deliberations. For similar reasons, the Board concluded that the potential realization of economies of scale by the Portfolios from the sub-advisory arrangements with the unaffiliated Sub-Advisers should not be a material factor in the Board’s deliberations.
In considering the reasonableness of the sub-advisory fees payable by the Adviser to Suffolk, the Directors noted that the Adviser, not the Portfolios, is responsible for paying sub-advisory fees to Suffolk and therefore concluded that the profitability to Suffolk of its relationship to the applicable Portfolios should not be a material factor in the Board’s deliberations. For similar reasons, the Board concluded that the potential realization of economies of scale by the applicable Portfolios from the sub-advisory arrangements with Suffolk should not be a material factor in the Board’s deliberations.
After considering all of the above, the Board concluded that the profitability of the Adviser with respect to each Portfolio was reasonable.
Economies of Scale
The Directors noted that all of the advisory and sub-advisory fee schedules contain breakpoints that would reduce the applicable advisory or sub-advisory fees on assets above a specified level as the applicable Portfolio’s assets increase. The Directors also noted that a Portfolio would realize additional economies of scale if the Portfolio’s assets increase over time proportionately more than certain other expenses. The Directors took into account that many of the Portfolios had relatively few assets under management. After considering each Portfolio’s current size and potential for growth, the Board concluded that each Portfolio is likely to benefit from economies of scale as the Portfolio’s assets increase.
| 155 | (continued) |
| Ohio National Fund, Inc. |
| Additional Information (Unaudited) (Continued) |
December 31, 2012 |
Portfolio-by-Portfolio Analysis
In addition to the foregoing, the Directors considered the specific factors and related conclusions set forth below with respect to each Portfolio’s performance and fees and expenses. Except as otherwise indicated, the performance data described below for each Portfolio is for periods ending September 30, 2012 and the advisory fee and expense data described below is through August 31, 2012 for a Portfolio’s Morningstar peer group and its Adjusted Peer Group.
Equity Portfolio (Adviser — ONI, Sub-Adviser — Legg Mason). The Portfolio underperformed its benchmark index and peer group average for the year-to-date and 1-, 3-, and 5-year periods. While expressing significant concern about the underperformance, the Adviser noted that the Portfolio outperformed its peer group average in 8 of the 11 months prior to the meeting, but that the Portfolio’s underperformance in the other 3 months was extensive enough to result in underperformance for the entire year-to-date period. The Adviser indicated that the Portfolio remains on its watchlist. The Directors noted that the Portfolio’s advisory fee was higher than the peer group average, and recognized that the Portfolio’s expense ratio was at the peer group average. After a lengthy discussion, the Adviser agreed to closely monitor the performance of the Portfolio and proposed that the agreement with the Sub-Adviser should be renewed only through May 31, 2013. Based upon its review, the Board concluded that approval of the continuation of the sub-advisory agreement only through May 31, 2013 was appropriate in order to address performance, and that the advisory and sub-advisory fees were reasonable.
Money Market Portfolio (Adviser — ONI). The Portfolio outperformed its peer group average for the year-to-date and trailing 1- and 3-year periods, but underperformed its peer group average for the 5-year period. The Directors noted that the Portfolio’s advisory fee and expense ratio were well below average relative to its peer group and that the Adviser has a negative profit margin for the Portfolio. Overall, the Board concluded that the Portfolio’s performance was satisfactory and that the advisory fee was reasonable.
Bond Portfolio (Adviser — ONI). Although the Portfolio underperformed its benchmark index for the year-to-date and 1-, 3- and 5-year periods and its peer group average for the 5-year period, the Directors noted that the Portfolio outperformed its peer group average for the year-to-date and 1- and 3-year periods. The Adviser pointed out that the relative performance of the peer group to the benchmark was indicative that the recent periods had been difficult for active managers, and he recommended that the Directors focus on the Portfolio’s performance relative to that of its peer group average. The Directors noted that, although the Portfolio’s advisory fee was slightly above the peer group average, the Portfolio’s expense ratio was below the peer group average. Overall, the Board concluded that the Portfolio’s performance was satisfactory and that the advisory fee was reasonable.
Omni Portfolio (Adviser — ONI, Sub-Adviser — Suffolk). The Omni Portfolio underperformed its benchmark index for the year-to-date, 1-, 3- and 5-year periods and its peer group average for the 3- and 5-year periods, while outperforming the peer group average in the year-to-date and 1-year periods. The Adviser pointed out, however, that the Portfolio had performed in the top 1 percent of the US Insurance Fund Moderate Allocation group over the 3-month period ending September 30, 2012, and outperformed the same group average over the trailing 10-year period. The Adviser also pointed out that the relative performance of the peer group to the benchmark was indicative that the recent periods had been difficult for active managers, and he recommended that the Directors focus on the Portfolio’s performance relative to that of its peer group average. The Board noted that the Portfolio’s advisory fee and expense ratio were below the Portfolio’s peer group average. Overall, the Board concluded that the Portfolio’s performance was satisfactory and that the advisory and sub-advisory fees were reasonable.
International Portfolio (Adviser — ONI, Sub-Adviser — Federated Global). The International Portfolio outperformed its peer group average for the year-to-date, 1-, 3-, and 5-year periods, and outperformed its benchmark index in each of the same periods except the 5-year period. The Board noted that while the Portfolio’s advisory fee was above the peer group average, its expense ratio was at the peer group average. Overall, the Board concluded that the Portfolio’s performance was satisfactory and that the advisory and sub-advisory fees were reasonable.
Capital Appreciation Portfolio (Adviser — ONI, Sub-Adviser — Jennison). The Portfolio outperformed its benchmark index for the 5-year period and its peer group average for the 3- and 5-year periods, but underperformed both for the year-to-date and 1-year periods and the benchmark index for the 3-year period. The Board noted that it focuses more on longer term performance, particularly because recent periods have been difficult for active managers. The Board noted that the Portfolio’s advisory fee was higher than the peer group average, but the expense ratio was only slightly above average. Overall, the Board concluded that the Portfolio’s performance was satisfactory and that the advisory and sub-advisory fees were reasonable.
Millennium Portfolio (Adviser — ONI, Sub-Adviser — Neuberger Berman). The Millennium Portfolio underperformed its benchmark index and its peer group average over the 1-, 3-, and 5-year periods, but outperformed its benchmark index year-to-date and kept pace with its peer group average over the same period. The Adviser noted that the Portfolio’s longer term relative performance was weighed down by underperformance in 2009 and 2010, when lower quality stocks outperformed. The Directors remarked that the advisory fee and expense ratio for the Portfolio were below the peer group average. Overall, the Board concluded that the Portfolio’s performance was satisfactory and that the advisory and sub-advisory fees were reasonable.
International Small-Mid Company Portfolio (Adviser — ONI, Sub-Adviser — Federated Global). The Portfolio outperformed its benchmark index and peer group average for the year-to-date and 1- and 3-year periods, while underperforming both for the 5-year period. The Board noted that the Portfolio’s advisory fee was higher than the peer group average, but the expense ratio was only slightly above average relative to the peer group. Overall, the Board concluded that the Portfolio’s performance was satisfactory and that the advisory and sub-advisory fees were reasonable.
| 156 | (continued) |
| Ohio National Fund, Inc. |
| Additional Information (Unaudited) (Continued) |
December 31, 2012 |
Aggressive Growth Portfolio (Adviser — ONI, Sub-Adviser — Janus). The Portfolio outperformed its benchmark index and peer group average for the year-to-date and 1-year periods, and underperformed the index and peer group average for the 3- and 5-year periods. The Adviser indicated that the Portfolio had outperformed over the 10-year period as well. The Board noted that the Portfolio’s advisory fee and expense ratio were both above average compared to its peer group, but that the advisory fee was still within the range of its peers. Overall, the Board concluded that the Portfolio’s performance was satisfactory and that the advisory and sub-advisory fees were reasonable.
Small Cap Growth Portfolio (Adviser — ONI, Sub-Adviser — Janus). The Portfolio has outperformed its benchmark and peer group average for the year-to-date and the 1-, 3- and 5-year periods. The Board noted that the Portfolio’s advisory fee and expense ratio were both above average compared to its peer group, but that the advisory fee was still within the range of its peers. Overall, the Board concluded that the Portfolio’s performance was satisfactory and that the advisory and sub-advisory fees were reasonable.
Mid Cap Opportunity Portfolio (Adviser — ONI, Sub-Adviser — Goldman Sachs). The Adviser reminded the Board that the Portfolio had changed to a new Sub-Adviser effective in December 2009, and thus only the more recent performance is relevant. The Board noted that the Portfolio underperformed its benchmark index for the 3- and 5-year periods and its peer group average for the 5-year period, while outperforming both in the year-to-date and 1-year periods and the peer group average in the 3-year period. The Board also noted that the Portfolio’s advisory fee was above the peer group average, although the Portfolio’s expense ratio was below the peer group average. Overall, the Board concluded that the Portfolio’s performance was satisfactory and that the advisory and sub-advisory fees were reasonable.
S&P 500® Index Portfolio (Adviser — ONI). While the Portfolio underperformed its benchmark over the year-to-date, 1-, 3-, and 5-year periods, the Board noted that its performance generally was in line with the S&P 500® Index when expenses were excluded. The Board did not rely on peer group comparison figures for the Portfolio because the Board considers peer groups for index funds to be generally irrelevant. The Board noted that the overall expense ratio is the statistic most important to index fund shareholders, and the Portfolio’s expense ratio was slightly lower than the average for the peer group. Overall, the Board concluded that the Portfolio’s performance was satisfactory and that the advisory fees were reasonable.
Strategic Value Portfolio (Adviser — ONI, Sub-Adviser — Federated Equity). The Portfolio underperformed its benchmark index for the year-to-date, 1-, 3- and 5-year periods, underperformed its peer group average for the year-to-date and 1-year periods, and outperformed its peer group average for the 3- and 5-year periods. The Adviser pointed out that the Portfolio invests in dividend paying stocks, and the recent performance was hurt by its overweighting in financial stocks. The Board noted that it focuses more on longer term performance, particularly because recent periods have been difficult for active managers. The Directors also noted that the Portfolio’s advisory fee and expense ratio were both above average compared to its peer group, but that the advisory fee was still within the range of its peers. Overall, the Board concluded that the Portfolio’s performance was satisfactory and that the advisory and sub-advisory fees were reasonable.
High Income Bond Portfolio (Adviser — ONI, Sub-Adviser — Federated Investment). The Portfolio underperformed its benchmark index for the year-to-date, 1-, 3-, and 5-year periods, while outperforming its peer group average over the same periods. The Directors noted that the advisory fee was above the peer group average, while the expense ratio was below the peer group average. Overall, the Board concluded that the Portfolio’s performance was satisfactory and that the advisory and sub-advisory fees were reasonable.
Capital Growth Portfolio (Adviser — ONI, Sub-Adviser — Eagle). The Portfolio has underperformed its benchmark index and peer group average for the year-to-date and 1-year periods, while outperforming its benchmark and peer group average over the 3- and 5-year periods. The Board noted that it focuses more on longer term performance, particularly because recent periods have been difficult for active managers. The Directors noted that although the advisory fee was above average for the peer group, the expense ratio was below average. Overall, the Board concluded that the Portfolio’s performance was satisfactory and that the advisory and sub-advisory fees were reasonable.
Nasdaq-100® Index Portfolio (Adviser — ONI). While the Portfolio underperformed its benchmark over the year-to-date, 1-, 3-, and 5-year periods, the Board noted that its performance generally was in line with the Nasdaq-100 Index when expenses were excluded. The Board did not rely on peer group comparison figures for the Portfolio because the Board considers peer groups for index funds to be generally irrelevant. The Board noted that the overall expense ratio is the statistic most important to index fund shareholders, and the Portfolio’s expense ratio was significantly below the average for the peer group. Overall, the Board concluded that the Portfolio’s performance was satisfactory and that the advisory fees were reasonable.
Bristol Portfolio (Adviser — ONI, Sub-Adviser — Suffolk). The Portfolio underperformed its benchmark and peer group average for the year-to-date and 1-, 3- and 5-year periods. The Adviser indicated that although the Portfolio remains on its watchlist, the Portfolio’s performance for the 10-year period exceeded the performance of the US Insurance Fund Large Blend category and its performance in the 3rd quarter of 2012 placed it in the top 2 percent of the US Insurance Fund Large Blend category. The Directors noted that the Portfolio’s advisory fee was above average, but that the Portfolio’s expense ratio was below average. Overall, the Board concluded that the Portfolio’s performance was satisfactory and that the advisory and sub-advisory fees were reasonable.
Bryton Growth Portfolio (Adviser — ONI, Sub-Adviser — Suffolk). The Portfolio underperformed its benchmark index and peer group average year-to-date and for the 3- and 5-year periods, while outperforming both the benchmark index and the peer group average over the 1-year period. The Board considered that the Portfolio’s advisory fee and expense ratio were below the peer group average. Overall, the Board concluded that the Portfolio’s performance was satisfactory and that the advisory and sub-advisory fees were reasonable.
| 157 | (continued) |
| Ohio National Fund, Inc. |
| Additional Information (Unaudited) (Continued) |
December 31, 2012 |
U.S. Equity Portfolio (Adviser — ONI, Sub-Adviser — ICON). The Portfolio has underperformed its benchmark index for the year-to-date, 1-, 3-, and 5-year periods and its peer group average for the 3- and 5-year periods, while outperforming the peer group average for the year-to-date and 1-year periods. The Adviser noted that it appears that the performance has turned around, as the Portfolio has outperformed its peer group average since the Sub-Adviser changed the Portfolio Manager. The Directors noted that the Portfolio’s advisory fee and expense ratio were both above average compared to its peer group, but that the advisory fee was still within the range of its peers. Overall, the Board concluded that the Portfolio’s performance was satisfactory and that the advisory and sub-advisory fees were reasonable.
Balanced Portfolio (Adviser — ONI, Sub-Adviser — ICON). The Portfolio outperformed its benchmark for the year-to-date and 1-year periods and its peer group average for the year-to-date, 1-, 3-, and 5-year periods, while underperforming the benchmark index in the 3- and 5-year periods. The Directors considered that the Portfolio’s advisory fee was slightly above the peer group average, and its expense ratio was above the peer group average. Overall, the Board concluded that the Portfolio’s performance was satisfactory and that the advisory and sub-advisory fees were reasonable.
Income Opportunity Portfolio (Adviser — ONI, Sub-Adviser — ICON). The Portfolio underperformed its benchmark index and its peer group average for the year-to-date, 1-, and 3-year periods, while outperforming its peer group average and slightly underperforming its benchmark index over the trailing 5-year period. The Adviser pointed out that it would expect the Portfolio to trail in rising markets and outperform in falling markets. The Board considered that the Portfolio’s strategy is to provide downside protection at the expense of upside returns and noted that the Portfolio had outperformed in 2008 when the market was down. The Adviser also pointed out the Portfolio did not have a peer group or benchmark that was good for comparison purposes, given the Portfolio’s strategy. The Board considered that the Portfolio’s advisory fee and expense ratio were both above average compared to its peer group, but that the advisory fee was still within the range of its peers. Overall, the Board concluded that the Portfolio’s performance was satisfactory and that the advisory and sub-advisory fees were reasonable.
Target VIP Portfolio (Adviser — ONI, Sub-Adviser — First Trust). The Portfolio has outperformed its benchmark index for the year-to-date and its peer group average for the year-to-date and 3-year periods, but has underperformed both for the 1- and 5-year periods and its benchmark for the 3-year period. The Board noted that, because the Portfolio is not actively managed, its performance does not reflect on the Sub-Adviser, but is a function of the effectiveness of the model. The Portfolio’s advisory fee and expense ratio were below its peer group average. Overall, the Board concluded that the performance of the Portfolio was satisfactory and that the advisory and sub-advisory fees were reasonable.
Target Equity/Income Portfolio (Adviser — ONI, Sub-Adviser — First Trust). The Portfolio has significantly underperformed its benchmark index and peer group average for the year-to-date and 1-, 3- and 5-year periods. The Adviser indicated that the Portfolio remains on its watchlist. The Directors also noted that the advisory fee and expense ratio were below its peer group average. After a lengthy discussion, the Adviser agreed to closely monitor the performance of the Portfolio and proposed that the agreement with the Sub-Adviser should be renewed only through May 31, 2013. Based upon its review, the Board concluded that approval of the continuation of the sub-advisory agreement only through May 31, 2013 was appropriate in order to address performance, and that the advisory and sub-advisory fees were reasonable.
Bristol Growth Portfolio (Adviser — ONI, Sub-Adviser — Suffolk). The Portfolio underperformed its benchmark index and peer group average for the year-to-date, 1-, 3-, and 5-year periods. The Adviser indicated that although the Portfolio remains on its watchlist, the Portfolio had performed well relative to its peer group average in 2008, 2009, and 2011, but not in 2010 and year-to-date 2012. The Directors considered that the Portfolio’s advisory fee was above its peer group average while its overall expense ratio was below its peer group average. Overall, the Board concluded that the Portfolio’s performance was satisfactory and that the advisory and sub-advisory fees were reasonable.
After consideration of the foregoing, the Board reached the following conclusions regarding the Investment Advisory Agreement and, as applicable, the sub-advisory agreement with respect to each Portfolio, in addition to the conclusions set forth above: (a) ONI and the Sub-Adviser had demonstrated that they possessed the capability and resources to perform the duties required of them under the Investment Advisory Agreement and applicable sub-advisory agreement, respectively; (b) the investment philosophy, strategies and techniques of ONI (with respect to the Portfolios without a Sub-Adviser) and the Sub-Adviser were appropriate for pursuing the applicable Portfolio’s investment objective; (c) ONI (with respect to the Portfolios without a Sub-Adviser) and the Sub-Adviser were likely to execute their investment philosophy, strategies and techniques consistently over time; and (d) ONI and the Sub-Adviser maintained appropriate compliance programs. Based on all of the above-mentioned factors and their related conclusions, with no single factor or conclusion being determinative and with each Director not necessarily attributing the same weight to each factor, the Directors unanimously concluded that approval of the continuation of the Investment Advisory Agreement and, as applicable, the sub-advisory agreement was in the best interests of each Portfolio and its shareholders. Accordingly, the Board, including all of the Independent Directors, voted unanimously to approve the continuation of the Investment Advisory Agreement and, as applicable, the sub-advisory agreement for each Portfolio.
| (2) | Expense Disclosure |
An individual may not buy or own membership interests of the Fund directly. An individual acquires an indirect interest in the Fund by purchasing a variable annuity contract or variable insurance policy and allocating premiums or purchase payments to Fund Portfolios available through the separate accounts of ONLIC, ONLAC, and NSLA. Separate accounts of these entities are the shareholders of the Fund.
| 158 | (continued) |
| Ohio National Fund, Inc. |
| Additional Information (Unaudited) (Continued) |
December 31, 2012 |
As a shareholder of the Fund, a separate account incurs ongoing costs, including management fees and other Fund expenses. This example is intended to help a policy/contract owner understand ongoing costs (in dollars) associated with the underlying investment in the Fund’s Portfolios by the separate account shareholder and to compare these costs with the ongoing costs associated with investing in other mutual funds.
The example is based on an investment of $1,000 invested at July 1, 2012 and held through December 31, 2012.
Actual Expenses
The table below provides information about investment values and actual expenses associated with each Portfolio of the Fund. The information below, together with the amount of an underlying investment, can be used to estimate expenses paid over the period. An estimate can be obtained by simply dividing an underlying investment value by $1,000 (for example, an $8,600 investment value divided by $1,000 = 8.6), then multiplying the result by the number in the table under the heading entitled “Expenses Paid During Period”.
| Portfolio |
Beginning Investment Value 7/1/2012 |
Ending Investment Value 12/31/2012 |
Expense Paid During Period* 7/1/2012 – 12/31/2012 |
Expense Ratio During Period 7/1/2012 – 12/31/2012 (Annualized) |
||||||||||||
| Equity |
$ | 1,000.00 | $ | 1,086.71 | $ | 4.56 | 0.87 | % | ||||||||
| Money Market |
1,000.00 | 1,000.00 | 0.50 | 0.10 | % | |||||||||||
| Bond |
1,000.00 | 1,033.61 | 3.32 | 0.65 | % | |||||||||||
| Omni |
1,000.00 | 1,084.08 | 4.24 | 0.81 | % | |||||||||||
| International |
1,000.00 | 1,132.30 | 5.36 | 1.00 | % | |||||||||||
| Capital Appreciation |
1,000.00 | 1,097.29 | 4.69 | 0.89 | % | |||||||||||
| Millennium |
1,000.00 | 1,006.42 | 4.89 | 0.97 | % | |||||||||||
| International Small-Mid Company |
1,000.00 | 1,115.75 | 6.44 | 1.21 | % | |||||||||||
| Aggressive Growth |
1,000.00 | 1,057.84 | 5.17 | 1.00 | % | |||||||||||
| Small Cap Growth |
1,000.00 | 1,042.81 | 5.70 | 1.11 | % | |||||||||||
| Mid Cap Opportunity |
1,000.00 | 1,071.36 | 5.05 | 0.97 | % | |||||||||||
| S&P 500® Index |
1,000.00 | 1,056.68 | 2.43 | 0.47 | % | |||||||||||
| Strategic Value |
1,000.00 | 1,016.94 | 4.06 | 0.80 | % | |||||||||||
| High Income Bond |
1,000.00 | 1,063.85 | 3.99 | 0.77 | % | |||||||||||
| Capital Growth |
1,000.00 | 1,087.02 | 5.40 | 1.03 | % | |||||||||||
| Nasdaq-100® Index |
1,000.00 | 1,023.11 | 2.64 | 0.52 | % | |||||||||||
| Bristol |
1,000.00 | 1,098.60 | 4.38 | 0.83 | % | |||||||||||
| Bryton Growth |
1,000.00 | 1,033.96 | 4.60 | 0.90 | % | |||||||||||
| U.S. Equity |
1,000.00 | 1,053.68 | 5.32 | 1.03 | % | |||||||||||
| Balanced |
1,000.00 | 1,036.16 | 4.25 | 0.83 | % | |||||||||||
| Income Opportunity |
1,000.00 | 1,033.28 | 6.34 | 1.24 | % | |||||||||||
| Target VIP |
1,000.00 | 1,056.16 | 4.50 | 0.87 | % | |||||||||||
| Target Equity/Income |
1,000.00 | 1,060.04 | 4.30 | 0.83 | % | |||||||||||
| Bristol Growth |
1,000.00 | 1,063.37 | 4.62 | 0.89 | % | |||||||||||
| 159 | (continued) |
| Ohio National Fund, Inc. |
| Additional Information (Unaudited) (Continued) |
December 31, 2012 |
Hypothetical Example for Comparison Purposes
The table below provides information about hypothetical investment values and hypothetical expenses based on each respective Portfolio’s actual expense ratio and an assumed rate of return of 5% per year before expenses, which is not an actual return. The hypothetical investment values and expenses may not be used to estimate the actual ending investment balance or expenses actually paid for the period by the shareholders. A policy/contract holder may use this information to compare this 5% hypothetical example with the 5% hypothetical examples that appear in the shareholder reports of other funds.
| Portfolio |
Beginning Investment Value 7/1/2012 |
Ending Investment Value 12/31/2012 |
Expense Paid During Period* 7/1/2012 – 12/31/2012 |
Expense Ratio During Period 7/1/2012 – 12/31/2012 (Annualized) |
||||||||||||
| Equity |
$ | 1,000.00 | $ | 1,020.76 | $ | 4.42 | 0.87 | % | ||||||||
| Money Market |
1,000.00 | 1,024.63 | 0.51 | 0.10 | % | |||||||||||
| Bond |
1,000.00 | 1,021.87 | 3.30 | 0.65 | % | |||||||||||
| Omni |
1,000.00 | 1,021.06 | 4.12 | 0.81 | % | |||||||||||
| International |
1,000.00 | 1,020.11 | 5.08 | 1.00 | % | |||||||||||
| Capital Appreciation |
1,000.00 | 1,020.66 | 4.52 | 0.89 | % | |||||||||||
| Millennium |
1,000.00 | 1,020.26 | 4.93 | 0.97 | % | |||||||||||
| International Small-Mid Company |
1,000.00 | 1,019.05 | 6.14 | 1.21 | % | |||||||||||
| Aggressive Growth |
1,000.00 | 1,020.11 | 5.08 | 1.00 | % | |||||||||||
| Small Cap Growth |
1,000.00 | 1,019.56 | 5.63 | 1.11 | % | |||||||||||
| Mid Cap Opportunity |
1,000.00 | 1,020.26 | 4.93 | 0.97 | % | |||||||||||
| S&P 500® Index |
1,000.00 | 1,022.77 | 2.39 | 0.47 | % | |||||||||||
| Strategic Value |
1,000.00 | 1,021.11 | 4.06 | 0.80 | % | |||||||||||
| High Income Bond |
1,000.00 | 1,021.27 | 3.91 | 0.77 | % | |||||||||||
| Capital Growth |
1,000.00 | 1,019.96 | 5.23 | 1.03 | % | |||||||||||
| Nasdaq-100® Index |
1,000.00 | 1,022.52 | 2.64 | 0.52 | % | |||||||||||
| Bristol |
1,000.00 | 1,020.96 | 4.22 | 0.83 | % | |||||||||||
| Bryton Growth |
1,000.00 | 1,020.61 | 4.57 | 0.90 | % | |||||||||||
| U.S. Equity |
1,000.00 | 1,019.96 | 5.23 | 1.03 | % | |||||||||||
| Balanced |
1,000.00 | 1,020.96 | 4.22 | 0.83 | % | |||||||||||
| Income Opportunity |
1,000.00 | 1,018.90 | 6.29 | 1.24 | % | |||||||||||
| Target VIP |
1,000.00 | 1,020.76 | 4.42 | 0.87 | % | |||||||||||
| Target Equity/Income |
1,000.00 | 1,020.96 | 4.22 | 0.83 | % | |||||||||||
| Bristol Growth |
1,000.00 | 1,020.66 | 4.52 | 0.89 | % | |||||||||||
| * | Expenses are equal to the average account value times the Fund’s annualized expense ratio multiplied by the number of days in the most recent fiscal half-year (184 days) divided by the number of days in the fiscal year (366 days). Please note that the expenses shown in these tables are meant to highlight ongoing Fund costs only and do not reflect any contract-level expenses or Fund transactional costs, such as sales charges (loads) or exchange fees (if any). Therefore, these tables are useful in comparing ongoing fund costs only, and will not fully assist a policy/contract owner in determining the relative total expenses of different funds. In addition, if transactional costs were included, costs may have been higher for these Portfolios as well as for a fund being compared. |
| (3) | Other Federal Tax Information |
For corporate shareholders, the percentages of the total ordinary income dividends paid in 2012, and ordinary income consent dividends that were incurred in the 2012 tax year, that qualify for the corporate dividends received deduction are as follows:
| 160 | (continued) |
| Ohio National Fund, Inc. |
| Additional Information (Unaudited) (Continued) |
December 31, 2012 |
Pursuant to Section 853 of the Internal Revenue Code, the Fund designates the following amounts as foreign taxes paid for the year ended December 31, 2012:
| Creditable Foreign Taxes Paid |
Per Share Amount |
Portion of Ordinary Income Distribution Derived from Foreign Sourced Income |
||||||||||
| International |
$ | 421,154 | 0.0290 | 100.00 | % | |||||||
| International Small-Mid Company |
$ | 66,082 | 0.0241 | 100.00 | % | |||||||
Foreign taxes paid for purposes of Section 853 may be less than actual foreign taxes paid for financial statement purposes. None of the Portfolios listed above derived any income from ineligible foreign sources, as defined under Section 901(j) of the Internal Revenue Code.
| 161 |
| Ohio National Fund, Inc. |
| December 31, 2012 (Unaudited) |
| Name and Address |
Age | Position(s) with the Fund |
Term of Office and Length of Time Served |
Number of Portfolios |
Principal Occupation(s) and Other Directorships During Past Five Years | |||||||
| Independent Directors |
||||||||||||
| James E. Bushman One Financial Way Cincinnati, Ohio |
68 | Director, Chairman of Audit Committee and Member of Independent Directors Committee | Indefinite; Since March 2000 |
24 | Director, Chairman and CEO: Cast-Fab Technologies, Inc. (a manufacturing company); Director: The Midland Company (1998-2008), Air Transport Services Group, Inc., The Littleford Group, Inc. (1984-2010), Hilltop Basic Resources, Inc., The Elizabeth Gamble Deaconess Home Association, The Christ Hospital, The University of Cincinnati Foundation. | |||||||
| George M. Vredeveld One Financial Way Cincinnati, Ohio |
70 | Lead Independent Director, Member of Audit and Independent Directors Committees | Indefinite; Since March 1996 |
24 | Professor of Economics: University of Cincinnati | |||||||
| John I. Von Lehman One Financial Way Cincinnati, Ohio |
60 | Director, Member of Audit and Independent Directors Committees | Indefinite; Since August 2007 | 24 | Executive Vice President, CFO, Secretary, and Director: The Midland Company (1988-2007); Director, Audit Committee and Corporate Governance Committee Member: American Financial Group, Inc.; Finance Committee and Investment Committee Member: Life Enriching Communities; Investment Committee: Xavier University Foundation. | |||||||
| Madeleine W. Ludlow One Financial Way Cincinnati, Ohio |
58 | Director, Member of Audit and Independent Directors Committees | Indefinite; Since April 2012 |
24 | Founder/Managing Director: West Capital Partners LLC (2010-present), Ludlow Ward Capital Advisors LLC (2005-2009); Director, ALLETE, Inc. (2004-present) | |||||||
| Interested Director |
||||||||||||
| John J. Palmer One Financial Way Cincinnati, Ohio |
73 | Chairman and Director | Indefinite; Since July 1997 |
24 | Insurance industry consultant (April 2010 to present), President: Oho National Fund, Inc. (1997-2010); Director and Vice Chairman: ONLIC (1997-2010); President, CEO, and Director: NSLA (2002-2010), Director: ONI and various affiliated companies (1997-2010), Cincinnati Symphony Orchestra, Tucson Symphony Orchestra, and Pima Canyon Estates Homeowners' Association. | |||||||
| Officers |
||||||||||||
| Christopher A. Carlson One Financial Way Cincinnati, Ohio |
53 | President | Indefinite; Since March 2000 |
24 | Executive Vice President and Chief Investment Officer: ONLIC; President and Director: ONI; Chief Investment Officer: NSLA; Officer and Director of various other Ohio National-affiliated companies. Prior to March 2010, was Vice President of the Fund. | |||||||
| Thomas A. Barefield One Financial Way Cincinnati, Ohio |
59 | Vice President | Indefinite; Since February 1998 | 24 | Executive Vice President — Distribution: ONLIC; Director and Vice President — Marketing: NSLA; Director: ONI; Senior Vice President: Ohio National Equities, Inc.; Recent graduate of class XXIX of Leadership Cincinnati. | |||||||
| Dennis R. Taney One Financial Way Cincinnati, Ohio |
65 | Chief Compliance Officer | Indefinite; Since August 2004 | 24 | Second Vice President: ONLIC, Chief Compliance Officer: ONLIC, ONI, NSLA, and other Ohio National-affiliated companies. | |||||||
| R. Todd Brockman One Financial Way Cincinnati, Ohio |
45 | Treasurer | Indefinite; Since August 2004 | 24 | Second Vice President, Mutual Fund Operations: ONLIC and NSLA; Treasurer: ONI. | |||||||
| Kimberly A. Plante One Financial Way Cincinnati, Ohio |
39 | Secretary | Indefinite; Since March 2005 |
24 | Senior Associate Counsel: ONLIC; Secretary: ONI; Officer of various other Ohio National-affiliated companies. Prior to August 2007, was Assistant Secretary. | |||||||
| Catherine E. Gehr One Financial Way Cincinnati, Ohio |
41 | Assistant Treasurer | Indefinite; Since March 2005 |
24 | Manager, Mutual Fund Operations: ONLIC; Assistant Treasurer: ONI. | |||||||
| 162 |
Ohio National Fund, Inc.
Post Office Box 371
Cincinnati, Ohio 45201
Form 1320 Rev. 2-13
| Item 2. | Code Of Ethics. |
As of the end of the period covered by this report, Ohio National Fund, Inc. (the “Fund”) has adopted a code of ethics that applies to the Fund’s principal executive officer and principal financial officer. There were no substantive amendments or waivers to the Code of Ethics during the period covered by this report.
A copy of this Code of Ethics is filed as Exhibit EX-99.CODE to this Form N-CSR and is also available, without charge, upon request, by calling 877-781-6392 toll free.
| Item 3. | Audit Committee Financial Expert. |
The Fund’s Board of Directors has determined that the Fund has an audit committee financial expert serving on its Audit Committee. The Audit Committee financial expert is Mr. John I. Von Lehman. Mr. Von Lehman is independent for purposes of Item 3 of Form N-CSR.
| Item 4. | Principal Accountant Fees And Services. |
The aggregate fees for each of the last two fiscal years for professional services rendered by the principal accountant for the audit of the Fund’s annual financial statements or services that are normally provided by the accountant in connection with statutory and regulatory filings or engagements for those fiscal years are listed below.
| (a) | Audit Fees. |
| Fiscal year ended December 31, 2012: |
$ | 292,000 | ||
| Fiscal year ended December 31, 2011: |
$ | 284,000 |
| (b) | Audit-Related Fees. |
Professional services rendered in connection with the consent on the Fund’s N1A filing.
| Fiscal year ended December 31, 2012: |
$5,000 | |
| Fiscal year ended December 31, 2011: |
$5,000 |
| (c) | Tax Fees. None. |
| (d) | All Other Fees. None. |
| (e)(1) | Audit Committee Pre-Approval Policies and Procedures: |
The Fund’s Audit Committee has adopted an Audit Committee Charter that requires that the Audit Committee oversee the quality and appropriateness of the accounting methods used in the preparation of the Fund’s financial statements, and the independent audit thereof; approve the selection and compensation of the independent auditors; and pre-approve the performance, by the independent auditors, of non-audit services for the Fund, its investment adviser, or any affiliated entity controlling, controlled by or under common control with the investment adviser that provides ongoing services to the Fund.
| (e)(2) | Services Approved Pursuant to Paragraph (c)(7)(i)(C) of Rule 2-01 of Regulation S-X: |
During the fiscal years ended December 31, 2012 and 2011, there were no non-audit services provided by the Fund’s principal accountant that would have required pre-approval by the Fund’s Audit Committee. The audit related fees aforementioned were pre-approved by the Fund’s Audit Committee, although not required by paragraph (c) (7) (ii) of Regulation S-X as the audit-related fees were less than five percent of the total amount of revenues paid to the Fund’s principal accountant.
| (f) | Not applicable. |
| (g) | There were no non-audit services provided by the Fund’s principal accountant, other than items disclosed in item (b) above, in which a fee was billed to the Fund, the Fund’s adviser, and any entity controlling, controlled by, or under common control with the adviser that provides ongoing services to the registrant for the last two fiscal years. |
| (h) | Not applicable, as there were no non-audit services performed by the Fund’s principal accountant that were rendered to the Fund, the Fund’s adviser, or any entity controlling, controlled by, or under common control with the adviser that provided ongoing services to the registrant that were not pre-approved for the last two fiscal years. |
| Item 5. | Audit Committee Of Listed Registrants. |
Not applicable.
| Item 6. | Schedule of Investments. |
Not applicable.
| Item 7. | Disclosure Of Proxy Voting Policies And Procedures For Closed-End Management Investment Companies. |
Not Applicable.
| Item 8. | Portfolio Managers of Closed-End Management Investment Companies. |
Not Applicable.
| Item 9. | Purchases of Equity Securities by Closed-End Management Investment Company and Affiliated Purchasers. |
Not Applicable.
| Item 10. | Submission of Matters to a Vote of Security Holders. |
There were no material changes to the procedures by which shareholders may recommend nominees to the Fund’s Board of Directors.
| Item 11. | Controls and Procedures. |
| (a) | The Fund’s principal executive officer and principal financial officer have concluded, based on their evaluation conducted as of a date within 90 days of the filing of this report, that the Fund’s disclosure controls and procedures are adequately designed and are operating effectively to ensure (i) that material information relating to the Fund, including its consolidated subsidiaries, is made known to them by others within those entities, particularly during the period in which this report is being prepared; and (ii) that information required to be disclosed by the Fund on Form N-CSR is recorded, processed, summarized and reported within the time periods specified in the Securities and Exchange Commission’s rules and forms. |
| (b) | There were no changes in the Fund’s internal control over financial reporting that occurred during the second fiscal quarter of the period covered by this report that have materially affected, or are reasonably likely to materially affect, the Fund’s internal control over financial reporting. |
| Item 12. | Exhibits. |
| (a)(1) | The Fund’s Code of Ethics pursuant to Item 2 of Form N-CSR is filed and attached hereto as EX-99.CODE. |
| (a)(2) | A separate certification for each principal executive officer and principal financial officer of the Fund as required by Rule 30a-2(a) under the
Investment Company Act of 1940 (17 CFR 270.30a-2(a)) is attached hereto as |
The certifications required by Section 906 of the Sarbanes-Oxley Act of 2002 are attached hereto as
EX-99.906CERT.
SIGNATURES
Pursuant to the requirements of the Securities Exchange Act of 1934 and the Investment Company Act of 1940, the registrant has duly caused this report to be signed on its behalf by the undersigned, thereunto duly authorized.
| Ohio National Fund, Inc. | ||
| By: |
/s/ Christopher A. Carlson | |
| Christopher A. Carlson | ||
| President | ||
| March 8, 2013 | ||
Pursuant to the requirements of the Securities Exchange Act of 1934 and the Investment Company Act of 1940, this report has been signed below by the following persons on behalf of the registrant and in the capacities and on the dates indicated.
| Ohio National Fund, Inc. | ||
| By: |
/s/ Christopher A. Carlson | |
| Christopher A. Carlson | ||
| President | ||
| March 8, 2013 | ||
| By: |
/s/ R. Todd Brockman | |
| R. Todd Brockman | ||
| Treasurer | ||
| March 8, 2013 | ||