UNITED STATES
SECURITIES AND EXCHANGE COMMISSION
WASHINGTON, D.C. 20549
FORM
(Mark One)
For the quarterly period ended
or
For the transition period from ____ to ____
Commission file no:
(Exact name of registrant as specified in its charter)
|
|
(Address of principal executive offices)
Telephone Number: (
Securities Registered Pursuant to Section 12(b) of the Act:
Title of each class | Trading symbol | Name of each exchange on which registered | ||
Indicate by check mark whether the registrant: (1) has filed all reports required to be filed by Section 13 or 15(d) of the Securities Exchange Act of 1934 during the preceding 12 months (or for such shorter period that the registrant was required to file such reports), and (2) has been subject to such filing requirements for the past 90 days.
Indicate by check mark whether the registrant has submitted electronically every Interactive Data File required to be submitted pursuant to Rule 405 of Regulation S-T (§232.405 of this chapter) during the preceding 12 months (or for such shorter period that the registrant was required to submit such files).
Indicate by check mark whether the registrant is a large accelerated filer, an accelerated filer, a non-accelerated filer, a smaller reporting company, or an emerging growth company. See the definitions of “large accelerated filer,” “accelerated filer,” “smaller reporting company,” and “emerging growth company” in Rule 12b-2 of the Exchange Act.
☒ | Accelerated filer | ☐ | |
Non-accelerated filer | ☐ | Smaller reporting company | |
Emerging growth company | |
If an emerging growth company, indicate by check mark if the registrant has elected not to use the extended transition period for complying with any new or revised financial accounting standards provided pursuant to Section 13(a) of the Exchange Act. ☐
Indicate by check mark whether the registrant is a shell company (as defined in Rule 12b-2 of the Exchange Act).
Yes
At July 28, 2024,
PART I. FINANCIAL INFORMATION
Item 1.FINANCIAL STATEMENTS
DEERE & COMPANY | |||||||||||||
STATEMENTS OF CONSOLIDATED INCOME | |||||||||||||
For the Three and Nine Months Ended July 28, 2024 and July 30, 2023 | |||||||||||||
(In millions of dollars and shares except per share amounts) Unaudited | |||||||||||||
Three Months Ended | Nine Months Ended | ||||||||||||
| 2024 |
| 2023 |
| 2024 |
| 2023 |
| |||||
Net Sales and Revenues | |||||||||||||
Net sales |
| $ | $ |
| $ | $ | |||||||
Finance and interest income |
|
| |||||||||||
Other income |
|
| |||||||||||
Total |
|
| |||||||||||
Costs and Expenses | |||||||||||||
Cost of sales |
|
| |||||||||||
Research and development expenses |
|
| |||||||||||
Selling, administrative and general expenses |
|
| |||||||||||
Interest expense |
|
| |||||||||||
Other operating expenses |
|
| |||||||||||
Total |
|
| |||||||||||
Income of Consolidated Group before Income Taxes |
|
| |||||||||||
Provision for income taxes |
|
| |||||||||||
Income of Consolidated Group |
|
| |||||||||||
Equity in income of unconsolidated affiliates |
|
| |||||||||||
Net Income |
|
| |||||||||||
Less: Net loss attributable to noncontrolling interests | ( |
| ( | ( |
| ( | |||||||
Net Income Attributable to Deere & Company |
| $ | $ |
| $ | $ | |||||||
Per Share Data | |||||||||||||
Basic |
| $ | $ |
| $ | $ | |||||||
Diluted |
|
| |||||||||||
Dividends declared | |||||||||||||
Dividends paid | |||||||||||||
Average Shares Outstanding | |||||||||||||
Basic |
|
| |||||||||||
Diluted |
|
| |||||||||||
See Condensed Notes to Interim Consolidated Financial Statements.
2
DEERE & COMPANY | |||||||||||||
STATEMENTS OF CONSOLIDATED COMPREHENSIVE INCOME | |||||||||||||
For the Three and Nine Months Ended July 28, 2024 and July 30, 2023 | |||||||||||||
(In millions of dollars) Unaudited | |||||||||||||
Three Months Ended | Nine Months Ended | ||||||||||||
| 2024 |
| 2023 |
| 2024 |
| 2023 |
| |||||
Net Income |
| $ | $ |
| $ | $ | |||||||
Other Comprehensive Income (Loss), Net of Income Taxes | |||||||||||||
Retirement benefits adjustment | ( |
| ( | ( |
| ( | |||||||
Cumulative translation adjustment | ( |
| ( |
| |||||||||
Unrealized gain (loss) on derivatives | ( |
| ( |
| ( | ||||||||
Unrealized gain (loss) on debt securities |
| ( |
| ||||||||||
Other Comprehensive Income (Loss), Net of Income Taxes | ( |
| ( |
| |||||||||
Comprehensive Income of Consolidated Group |
|
| |||||||||||
Less: Comprehensive income (loss) attributable to noncontrolling interests | ( |
| ( | ( |
| ||||||||
Comprehensive Income Attributable to Deere & Company |
| $ | $ |
| $ | $ | |||||||
See Condensed Notes to Interim Consolidated Financial Statements.
3
DEERE & COMPANY | ||||||||||
CONDENSED CONSOLIDATED BALANCE SHEETS | ||||||||||
(In millions of dollars) Unaudited | ||||||||||
| July 28 |
| October 29 |
| July 30 |
| ||||
2024 | 2023 | 2023 |
| |||||||
Assets | ||||||||||
Cash and cash equivalents |
| $ | $ | $ | ||||||
Marketable securities |
|
| ||||||||
Trade accounts and notes receivable – net |
|
| ||||||||
Financing receivables – net |
|
| ||||||||
|
| |||||||||
Other receivables |
|
| ||||||||
Equipment on operating leases – net |
|
| ||||||||
Inventories |
|
| ||||||||
Property and equipment – net |
|
| ||||||||
Goodwill |
|
| ||||||||
Other intangible assets – net |
|
| ||||||||
Retirement benefits |
|
| ||||||||
Deferred income taxes |
|
| ||||||||
Other assets |
|
| ||||||||
Assets held for sale |
|
|
| |||||||
Total Assets |
| $ | $ | $ | ||||||
Liabilities and Stockholders’ Equity | ||||||||||
Liabilities | ||||||||||
Short-term borrowings | $ | $ | $ | |||||||
Short-term securitization borrowings |
|
| ||||||||
Accounts payable and accrued expenses |
|
| ||||||||
Deferred income taxes |
|
| ||||||||
Long-term borrowings |
|
| ||||||||
Retirement benefits and other liabilities |
|
| ||||||||
Liabilities held for sale |
|
|
| |||||||
Total liabilities |
|
| ||||||||
Commitments and contingencies (Note 16) | ||||||||||
Redeemable noncontrolling interest | ||||||||||
Stockholders’ Equity | ||||||||||
Common stock, $ |
|
| ||||||||
Common stock in treasury | ( |
| ( |
| ( | |||||
Retained earnings |
|
| ||||||||
Accumulated other comprehensive income (loss) | ( |
| ( |
| ( | |||||
Total Deere & Company stockholders’ equity |
|
| ||||||||
Noncontrolling interests |
|
| ||||||||
Total stockholders’ equity |
|
| ||||||||
Total Liabilities and Stockholders’ Equity | $ | $ | $ | |||||||
See Condensed Notes to Interim Consolidated Financial Statements.
4
DEERE & COMPANY | |||||||
STATEMENTS OF CONSOLIDATED CASH FLOWS | |||||||
For the Nine Months Ended July 28, 2024 and July 30, 2023 | |||||||
(In millions of dollars) Unaudited | |||||||
| 2024 |
| 2023 |
| |||
Cash Flows from Operating Activities |
|
| |||||
Net income |
| $ | $ | ||||
Adjustments to reconcile net income to net cash provided by operating activities: | |||||||
Provision (credit) for credit losses |
| ( | |||||
Provision for depreciation and amortization |
| ||||||
Impairments and other adjustments |
| ||||||
Share-based compensation expense |
| ||||||
Credit for deferred income taxes | ( |
| ( | ||||
Changes in assets and liabilities: | |||||||
Receivables related to sales | ( |
| ( | ||||
Inventories |
| ( | |||||
Accounts payable and accrued expenses | ( |
| |||||
Accrued income taxes payable/receivable |
| ( | |||||
Retirement benefits | ( |
| ( | ||||
Other | ( |
| |||||
Net cash provided by operating activities |
| ||||||
Cash Flows from Investing Activities | |||||||
Collections of receivables (excluding receivables related to sales) |
| ||||||
Proceeds from maturities and sales of marketable securities |
| ||||||
Proceeds from sales of equipment on operating leases |
| ||||||
Cost of receivables acquired (excluding receivables related to sales) | ( |
| ( | ||||
Purchases of marketable securities | ( |
| ( | ||||
Purchases of property and equipment | ( |
| ( | ||||
Cost of equipment on operating leases acquired | ( |
| ( | ||||
Collateral on derivatives – net | |||||||
Other | ( |
| ( | ||||
Net cash used for investing activities | ( |
| ( | ||||
Cash Flows from Financing Activities | |||||||
Net proceeds (payments) in short-term borrowings (original maturities three months or less) | ( |
| |||||
Proceeds from borrowings issued (original maturities greater than three months) |
| ||||||
Payments of borrowings (original maturities greater than three months) | ( |
| ( | ||||
Repurchases of common stock | ( |
| ( | ||||
Dividends paid | ( |
| ( | ||||
Other | ( |
| ( | ||||
Net cash provided by (used for) financing activities | ( |
| |||||
Effect of Exchange Rate Changes on Cash, Cash Equivalents, and Restricted Cash | ( |
| |||||
Net Increase (Decrease) in Cash, Cash Equivalents, and Restricted Cash | ( | ||||||
Cash, Cash Equivalents, and Restricted Cash at Beginning of Period |
| ||||||
Cash, Cash Equivalents, and Restricted Cash at End of Period | $ | $ | |||||
Components of Cash, Cash Equivalents, and Restricted Cash | |||||||
Cash and cash equivalents | $ | $ | |||||
Cash, cash equivalents, and restricted cash (Assets held for sale) | |||||||
Restricted cash (Other assets) | |||||||
Total Cash, Cash Equivalents, and Restricted Cash | $ | $ | |||||
See Condensed Notes to Interim Consolidated Financial Statements.
5
DEERE & COMPANY | |||||||||||||||||||||||
STATEMENTS OF CHANGES IN CONSOLIDATED STOCKHOLDERS’ EQUITY | |||||||||||||||||||||||
For the Three and Nine Months Ended July 28, 2024 and July 30, 2023 | |||||||||||||||||||||||
(In millions of dollars) Unaudited | |||||||||||||||||||||||
Total Stockholders’ Equity | |||||||||||||||||||||||
Deere & Company Stockholders |
| ||||||||||||||||||||||
Accumulated | |||||||||||||||||||||||
Total | Other | Redeemable | |||||||||||||||||||||
Stockholders’ | Common | Treasury | Retained | Comprehensive | Noncontrolling | Noncontrolling | |||||||||||||||||
| Equity |
| Stock |
| Stock |
| Earnings |
| Income (Loss) |
| Interests |
|
| Interest | |||||||||
Three Months Ended July 30, 2023 | |||||||||||||||||||||||
Balance April 30, 2023 |
| $ | $ | $ | ( | $ | $ | ( | $ | $ | |||||||||||||
Net income (loss) |
|
| ( | ||||||||||||||||||||
Other comprehensive income |
|
| |||||||||||||||||||||
Repurchases of common stock |
| ( | ( | ||||||||||||||||||||
Treasury shares reissued |
| ||||||||||||||||||||||
Dividends declared |
| ( | ( | ( |
| ||||||||||||||||||
Share based awards and other |
| ( | |||||||||||||||||||||
Balance July 30, 2023 | $ | $ | $ | ( | $ | $ | ( | $ | $ | ||||||||||||||
Nine Months Ended July 30, 2023 |
|
| |||||||||||||||||||||
Balance October 30, 2022 |
| $ | $ | $ | ( | $ | $ | ( | $ | $ |
| ||||||||||||
Net income (loss) |
| ( | |||||||||||||||||||||
Other comprehensive income |
|
| |||||||||||||||||||||
Repurchases of common stock |
| ( | ( | ||||||||||||||||||||
Treasury shares reissued |
| ||||||||||||||||||||||
Dividends declared |
| ( | ( | ( |
| ||||||||||||||||||
Share based awards and other |
| ( | |||||||||||||||||||||
Balance July 30, 2023 | $ | $ | $ | ( | $ | $ | ( | $ | $ | ||||||||||||||
|
| ||||||||||||||||||||||
Three Months Ended July 28, 2024 | |||||||||||||||||||||||
Balance April 28, 2024 | $ | $ | $ | ( | $ | $ | ( | $ | $ | ||||||||||||||
Net income (loss) |
| ( | |||||||||||||||||||||
Other comprehensive loss | ( | ( |
|
| |||||||||||||||||||
Repurchases of common stock | ( | ( | |||||||||||||||||||||
Treasury shares reissued | |||||||||||||||||||||||
Dividends declared | ( | ( | ( |
| |||||||||||||||||||
Noncontrolling interest redemption (Note 21) | ( | ||||||||||||||||||||||
Share based awards and other |
|
| ( | ||||||||||||||||||||
Balance July 28, 2024 | $ | $ | $ | ( | $ | $ | ( | $ | $ | ||||||||||||||
Nine Months Ended July 28, 2024 | |||||||||||||||||||||||
Balance October 29, 2023 | $ | $ | $ | ( | $ | $ | ( | $ | $ | ||||||||||||||
Net income (loss) | ( | ||||||||||||||||||||||
Other comprehensive income (loss) | ( | ( |
| ||||||||||||||||||||
Repurchases of common stock | ( | ( | |||||||||||||||||||||
Treasury shares reissued | |||||||||||||||||||||||
Dividends declared | ( | ( | ( |
| |||||||||||||||||||
Noncontrolling interest redemption (Note 21) | ( | ||||||||||||||||||||||
Share based awards and other | ( |
| |||||||||||||||||||||
Balance July 28, 2024 | $ | $ | $ | ( | $ | $ | ( | $ | $ | ||||||||||||||
See Condensed Notes to Interim Consolidated Financial Statements.
6
Condensed Notes to Interim Consolidated Financial Statements (Unaudited)
(1) Organization and Consolidation
Deere & Company has been developing innovative solutions to help its customers become more profitable for more than 185 years. References to “Deere & Company,” “John Deere,” “we,” “us,” or “our” include our consolidated subsidiaries. We manage our business through the following operating segments: production and precision agriculture (PPA), small agriculture and turf (SAT), construction and forestry (CF), and financial services (FS). References to “agriculture and turf” include both PPA and SAT.
We use a 52/53 week fiscal year with quarters ending on the last Sunday in the reporting period. The third quarter ends for fiscal year 2024 and 2023 were July 28, 2024 and July 30, 2023, respectively. Both third quarters contained
All amounts are presented in millions of dollars, unless otherwise specified.
(2) Summary of Significant Accounting Policies and New Accounting PROnouncements
Quarterly Financial Statements
The interim consolidated financial statements of Deere & Company have been prepared by us, without audit, pursuant to the rules and regulations of the U.S. Securities and Exchange Commission (SEC). Certain information and footnote disclosures normally included in annual financial statements prepared in accordance with accounting principles generally accepted in the U.S. have been condensed or omitted as permitted by such rules and regulations. All normal recurring adjustments have been included. Management believes the disclosures are adequate to present fairly the financial position, results of operations, and cash flows at the dates and for the periods presented. It is suggested these interim consolidated financial statements be read in conjunction with the consolidated financial statements and the notes thereto appearing in our latest Annual Report on Form 10-K. Results for interim periods are not necessarily indicative of those to be expected for the fiscal year.
Use of Estimates in Financial Statements
Certain accounting policies require management to make estimates and assumptions in determining the amounts reflected in the financial statements and related disclosures. Actual results could differ from those estimates.
New Accounting Pronouncements
We closely monitor all Accounting Standard Updates (ASUs) issued by the Financial Accounting Standards Board (FASB) and other authoritative guidance.
Accounting Pronouncements Adopted
We adopted the following standards in 2024, none of which had a material effect on our consolidated financial statements.
Accounting Pronouncements to be Adopted
In December 2023, the FASB issued
We will also adopt the following standards in future periods, none of which are expected to have a material effect on our consolidated financial statements.
7
(3) Revenue Recognition
Our net sales and revenues by primary geographic market, major product line, and timing of revenue recognition follow:
Three Months Ended July 28, 2024 | ||||||||||||||||
| Production & Precision Ag |
| Small Ag & Turf |
| Construction |
| Financial |
| Total | |||||||
Primary geographic markets: |
|
| ||||||||||||||
United States | $ | $ | $ | $ | $ | |||||||||||
Canada |
|
| ||||||||||||||
Western Europe |
|
| ||||||||||||||
Central Europe and CIS |
|
| ||||||||||||||
Latin America |
|
| ||||||||||||||
Asia, Africa, Oceania, and Middle East | ||||||||||||||||
Total | $ | $ | $ | $ | $ | |||||||||||
Major product lines: |
|
| ||||||||||||||
Production agriculture | $ |
|
|
| $ | |||||||||||
Small agriculture |
| $ |
|
|
|
| ||||||||||
Turf |
|
|
|
|
| |||||||||||
Construction |
|
| $ |
|
|
| ||||||||||
Compact construction |
|
|
| |||||||||||||
Roadbuilding |
|
|
|
|
| |||||||||||
Forestry |
|
|
|
|
| |||||||||||
Financial products | $ |
| ||||||||||||||
Other |
|
|
| |||||||||||||
Total | $ | $ | $ | $ | $ | |||||||||||
Revenue recognized: |
|
| ||||||||||||||
At a point in time | $ | $ | $ | $ | $ | |||||||||||
Over time | ||||||||||||||||
Total | $ | $ | $ | $ | $ | |||||||||||
| Nine Months Ended July 28, 2024 | |||||||||||||||
Production & Precision Ag |
| Small Ag & Turf |
| Construction |
| Financial |
| Total | ||||||||
Primary geographic markets: | ||||||||||||||||
United States | $ | $ | $ | $ | $ | |||||||||||
Canada |
|
| ||||||||||||||
Western Europe |
|
| ||||||||||||||
Central Europe and CIS |
|
| ||||||||||||||
Latin America |
|
| ||||||||||||||
Asia, Africa, Oceania, and Middle East | ||||||||||||||||
Total | $ | $ | $ | $ | $ | |||||||||||
Major product lines: |
|
| ||||||||||||||
Production agriculture | $ |
|
|
| $ | |||||||||||
Small agriculture |
| $ |
|
|
|
| ||||||||||
Turf |
|
|
|
|
| |||||||||||
Construction |
|
| $ |
|
|
| ||||||||||
Compact construction |
|
|
| |||||||||||||
Roadbuilding |
|
|
|
|
| |||||||||||
Forestry |
|
|
|
| ||||||||||||
Financial products | $ |
| ||||||||||||||
Other |
|
|
| |||||||||||||
Total | $ | $ | $ | $ | $ | |||||||||||
Revenue recognized: |
|
| ||||||||||||||
At a point in time | $ | $ | $ | $ | $ | |||||||||||
Over time | ||||||||||||||||
Total | $ | $ | $ | $ | $ | |||||||||||
8
Three Months Ended July 30, 2023 | ||||||||||||||||
| Production & Precision Ag |
| Small Ag & Turf |
| Construction |
| Financial |
| Total | |||||||
Primary geographic markets: |
|
| ||||||||||||||
United States | $ | $ | $ | $ | $ | |||||||||||
Canada |
|
| ||||||||||||||
Western Europe |
| |||||||||||||||
Central Europe and CIS |
| |||||||||||||||
Latin America |
| |||||||||||||||
Asia, Africa, Oceania, and Middle East | ||||||||||||||||
Total | $ | $ | $ | $ | $ | |||||||||||
Major product lines: |
|
| ||||||||||||||
Production agriculture | $ |
|
| $ | ||||||||||||
Small agriculture | $ |
|
|
|
| |||||||||||
Turf |
|
|
|
| ||||||||||||
Construction |
| $ |
|
|
| |||||||||||
Compact construction |
|
| ||||||||||||||
Roadbuilding |
|
|
|
| ||||||||||||
Forestry |
|
|
|
| ||||||||||||
Financial products | $ |
| ||||||||||||||
Other |
|
|
| |||||||||||||
Total | $ | $ | $ | $ | $ | |||||||||||
Revenue recognized: |
|
| ||||||||||||||
At a point in time | $ | $ | $ | $ | $ | |||||||||||
Over time | ||||||||||||||||
Total | $ | $ | $ | $ | $ | |||||||||||
Nine Months Ended July 30, 2023 | ||||||||||||||||
| Production & Precision Ag |
| Small Ag & Turf |
| Construction |
| Financial |
| Total | |||||||
Primary geographic markets: | ||||||||||||||||
United States | $ | $ | $ | $ | $ | |||||||||||
Canada |
| |||||||||||||||
Western Europe |
| |||||||||||||||
Central Europe and CIS |
| |||||||||||||||
Latin America |
| |||||||||||||||
Asia, Africa, Oceania, and Middle East | ||||||||||||||||
Total | $ | $ | $ | $ | $ | |||||||||||
Major product lines: |
|
| ||||||||||||||
Production agriculture | $ |
|
|
| $ | |||||||||||
Small agriculture |
| $ |
|
|
| |||||||||||
Turf |
|
|
|
| ||||||||||||
Construction |
|
| $ |
|
| |||||||||||
Compact construction |
|
|
| |||||||||||||
Roadbuilding |
|
|
|
| ||||||||||||
Forestry |
|
|
|
| ||||||||||||
Financial products | $ |
| ||||||||||||||
Other |
|
| ||||||||||||||
Total | $ | $ | $ | $ | $ | |||||||||||
Revenue recognized: |
|
| ||||||||||||||
At a point in time | $ | $ | $ | $ | $ | |||||||||||
Over time | ||||||||||||||||
Total | $ | $ | $ | $ | $ | |||||||||||
9
We invoice in advance of recognizing the sale of certain products and the revenue for certain services. These relate to extended warranty premiums, advance payments for future equipment sales, and subscription and service revenue related to precision guidance, telematic services, and other information enabled solutions. These advanced customer payments are presented as deferred revenue, a contract liability, in “Accounts payable and accrued expenses.” The deferred revenue received, but not recognized in revenue, was $
The amount of unsatisfied performance obligations for contracts with an original duration greater than one year was $
(4) Other Comprehensive Income Items
The after-tax components of accumulated other comprehensive income (loss) follow:
July 28 | October 29 | July 30 | ||||||||
2024 | 2023 | 2023 | ||||||||
Retirement benefits adjustment | $ | ( | $ | ( | $ | ( | ||||
Cumulative translation adjustment | ( | ( | ( | |||||||
Unrealized gain (loss) on derivatives | ( | ( | ( | |||||||
Unrealized gain (loss) on debt securities | ( | ( | ( | |||||||
Total accumulated other comprehensive income (loss) | $ | ( | $ | ( | $ | ( | ||||
The following tables reflect amounts recorded in other comprehensive income (loss), as well as reclassifications out of other comprehensive income (loss).
| Before |
| Tax |
| After |
| ||||
Tax | (Expense) | Tax |
| |||||||
Three Months Ended July 28, 2024 | Amount | Credit | Amount |
| ||||||
Cumulative translation adjustment |
| $ | ( |
|
|
| $ | ( | ||
Unrealized gain (loss) on derivatives: | ||||||||||
Unrealized hedging gain (loss) | ( | $ | ( | |||||||
Reclassification of realized (gain) loss to: | ||||||||||
Interest rate contracts – Interest expense | ( | ( | ||||||||
Net unrealized gain (loss) on derivatives | ( | ( | ||||||||
Unrealized gain (loss) on debt securities: | ||||||||||
Unrealized holding gain (loss) | ( | |||||||||
Net unrealized gain (loss) on debt securities | ( | |||||||||
Retirement benefits adjustment: | ||||||||||
Net actuarial gain (loss) | ( | ( | ||||||||
Reclassification to Other operating expenses through amortization of: | ||||||||||
Actuarial (gain) loss | ( | ( | ||||||||
Prior service (credit) cost | ( | |||||||||
Settlements | ( |
| ||||||||
Net unrealized gain (loss) on retirement benefits adjustment | ( | ( | ||||||||
Total other comprehensive income (loss) |
| $ | ( | $ | $ | ( | ||||
10
| Before |
| Tax |
| After |
| ||||
Tax | (Expense) | Tax |
| |||||||
Nine Months Ended July 28, 2024 | Amount | Credit | Amount |
| ||||||
Cumulative translation adjustment |
| $ | ( | $ | $ | ( | ||||
Unrealized gain (loss) on derivatives: | ||||||||||
Unrealized hedging gain (loss) |
| |||||||||
Reclassification of realized (gain) loss to: | ||||||||||
Interest rate contracts – Interest expense | ( | ( | ||||||||
Net unrealized gain (loss) on derivatives | ( | ( | ||||||||
Unrealized gain (loss) on debt securities: | ||||||||||
Unrealized holding gain (loss) | ||||||||||
Reclassification of realized (gain) loss – Other income | ( | |||||||||
Net unrealized gain (loss) on debt securities | ( | |||||||||
Retirement benefits adjustment: | ||||||||||
Net actuarial gain (loss) | ( | ( | ||||||||
Reclassification to Other operating expenses through amortization of: | ||||||||||
Actuarial (gain) loss | ( | ( | ||||||||
Prior service (credit) cost | ( | |||||||||
Settlements | ( | |||||||||
Net unrealized gain (loss) on retirement benefits adjustment | ( | ( | ||||||||
Total other comprehensive income (loss) |
| $ | ( | $ | $ | ( | ||||
| Before |
| Tax |
| After |
| ||||
Tax | (Expense) | Tax |
| |||||||
Three Months Ended July 30, 2023 | Amount | Credit | Amount |
| ||||||
Cumulative translation adjustment |
| $ | $ |
| $ | |||||
Unrealized gain (loss) on derivatives: | ||||||||||
Unrealized hedging gain (loss) | ( | |||||||||
Reclassification of realized (gain) loss to: |
| |||||||||
Interest rate contracts – Interest expense | ( | ( | ||||||||
Net unrealized gain (loss) on derivatives | ( | |||||||||
Unrealized gain (loss) on debt securities: | ||||||||||
Unrealized holding gain (loss) | ( | ( | ||||||||
Net unrealized gain (loss) on debt securities | ( | ( | ||||||||
Retirement benefits adjustment: | ||||||||||
Net actuarial gain (loss) | ( |
| ( | |||||||
Reclassification to Other operating expenses through amortization of: |
| |||||||||
Actuarial (gain) loss | ( | ( | ||||||||
Prior service (credit) cost | ( | |||||||||
Net unrealized gain (loss) on retirement benefits adjustment | ( | ( | ||||||||
Total other comprehensive income (loss) |
| $ | $ | $ | ||||||
11
| Before |
| Tax |
| After |
| ||||
Tax | (Expense) | Tax |
| |||||||
Nine Months Ended July 30, 2023 | Amount | Credit | Amount |
| ||||||
Cumulative translation adjustment |
| $ | $ | $ | ||||||
Unrealized gain (loss) on derivatives: | ||||||||||
Unrealized hedging gain (loss) | ( | |||||||||
Reclassification of realized (gain) loss to: |
| |||||||||
Interest rate contracts – Interest expense | ( | ( | ||||||||
Net unrealized gain (loss) on derivatives | ( | ( | ||||||||
Unrealized gain (loss) on debt securities: | ||||||||||
Unrealized holding gain (loss) | ( | |||||||||
Net unrealized gain (loss) on debt securities | ( | |||||||||
Retirement benefits adjustment: | ||||||||||
Net actuarial gain (loss) | ( | ( | ||||||||
Reclassification to Other operating expenses through amortization of: |
| |||||||||
Actuarial (gain) loss | ( | ( | ||||||||
Prior service (credit) cost | ( | |||||||||
Settlements | ( | |||||||||
Net unrealized gain (loss) on retirement benefits adjustment | ( | ( | ||||||||
Total other comprehensive income (loss) |
| $ | $ | $ | ||||||
(5) Earnings Per Share
A reconciliation of basic and diluted net income per share attributable to Deere & Company follows in millions, except per share amounts:
| Three Months Ended | Nine Months Ended |
| ||||||||||
July 28 | July 30 | July 28 | July 30 |
| |||||||||
2024 | 2023 | 2024 | 2023 |
| |||||||||
Net income attributable to Deere & Company |
| $ |
| $ |
| $ |
| $ | |||||
Average shares outstanding |
|
| |||||||||||
Basic per share | $ | $ | $ | $ | |||||||||
Average shares outstanding |
|
| |||||||||||
Effect of dilutive stock options and restricted stock awards |
|
| |||||||||||
Total potential shares outstanding |
|
| |||||||||||
Diluted per share | $ | $ | $ | $ | |||||||||
Shares excluded from EPS calculation, as antidilutive | |||||||||||||
12
(6) Pension and Other Postretirement Benefits
We have several funded and unfunded defined benefit pension plans and other postretirement benefit (OPEB) plans. These plans cover U.S. employees and certain foreign employees.
Three Months Ended | Nine Months Ended |
| |||||||||||
July 28 | July 30 | July 28 | July 30 |
| |||||||||
2024 | 2023 | 2024 | 2023 |
| |||||||||
Pensions: | |||||||||||||
Service cost |
| $ |
| $ |
| $ |
| $ | |||||
|
| ||||||||||||
( |
| ( | ( |
| ( | ||||||||
( |
| ( | ( |
| ( | ||||||||
|
| ||||||||||||
|
|
| |||||||||||
Net benefit | $ | ( | $ | ( | $ | ( | $ | ( | |||||
OPEB: | |||||||||||||
Service cost |
| $ |
| $ |
| $ |
| $ | |||||
|
| ||||||||||||
( |
| ( | ( |
| ( | ||||||||
( |
| ( | ( |
| ( | ||||||||
( |
| ( | ( |
| ( | ||||||||
Net cost | $ | $ | $ | $ | |||||||||
The components of net periodic pension and OPEB (benefit) cost excluding the service cost component are included in the line item “Other operating expenses.”
During the first nine months of 2024, we contributed and expect to contribute the following amounts to our pension and OPEB plans:
Pensions | OPEB | ||||||
Contributed |
| $ |
| $ |
| ||
Expected contributions remainder of the year |
| ||||||
13
(7) Segment DATA
Information relating to operations by operating segment follows:
Three Months Ended | Nine Months Ended |
| |||||||||||||||
| July 28 | July 30 | % | July 28 | July 30 | % |
| ||||||||||
2024 | 2023 | Change | 2024 | 2023 | Change |
| |||||||||||
Net sales and revenues: |
|
|
|
|
|
|
|
|
|
|
| ||||||
Production & precision ag net sales |
| $ | $ | - |
| $ | $ | - | |||||||||
Small ag & turf net sales | - | - | |||||||||||||||
Construction & forestry net sales |
| - |
| - | |||||||||||||
Financial services revenues |
| + |
| + | |||||||||||||
Other revenues |
| - |
| + | |||||||||||||
Total net sales and revenues |
| $ | $ | - |
| $ | $ | - | |||||||||
Operating profit: | |||||||||||||||||
Production & precision ag |
| $ | $ | - |
| $ | $ | - | |||||||||
Small ag & turf | - | - | |||||||||||||||
Construction & forestry |
| - |
| - | |||||||||||||
Financial services |
| - |
| + | |||||||||||||
Total operating profit |
| - |
| - | |||||||||||||
Reconciling items |
| - |
| + | |||||||||||||
Income taxes | ( |
| ( | - | ( |
| ( | - | |||||||||
Net income attributable to Deere & Company |
| $ | $ | - |
| $ | $ | - | |||||||||
Intersegment sales and revenues: | |||||||||||||||||
Production & precision ag net sales |
| $ | $ | - |
| $ | $ | - | |||||||||
Small ag & turf net sales |
| - | - | ||||||||||||||
Construction & forestry net sales |
|
|
|
|
| ||||||||||||
Financial services revenues |
| - |
| - | |||||||||||||
Operating profit for PPA, SAT, and CF is income from continuing operations before corporate expenses, certain external interest expenses, certain foreign exchange gains and losses, and income taxes. Operating profit of financial services includes the effect of interest expense and foreign exchange gains and losses. Reconciling items to net income are primarily corporate expenses, certain interest income and expenses, certain foreign exchange gains and losses, pension and OPEB benefit (cost) amounts excluding the service cost component, and net income attributable to noncontrolling interests.
Identifiable operating assets were as follows:
| July 28 |
| October 29 | July 30 |
| |||||
2024 | 2023 | 2023 |
| |||||||
Production & precision ag |
| $ | $ | $ | ||||||
Small ag & turf | ||||||||||
Construction & forestry |
|
| ||||||||
Financial services |
|
| ||||||||
Corporate |
|
| ||||||||
Total assets |
| $ | $ | $ | ||||||
(8)
We monitor the credit quality of financing receivables based on delinquency status, defined as follows:
| ● | Past due balances represent any payments |
| ● | Non-performing financing receivables represent receivables for which we have stopped accruing finance income. This generally occurs when receivables are |
| ● | Write-offs generally occur when receivables are |
14
The credit quality analysis of retail notes, financing leases, and revolving charge accounts (collectively, retail customer receivables) by year of origination was as follows:
July 28, 2024 | |||||||||||||||||||||||||
2024 | 2023 | 2022 | 2021 | 2020 | Prior Years | Revolving Charge Accounts | Total | ||||||||||||||||||
Retail customer receivables: |
|
|
|
|
|
|
|
|
|
|
|
|
|
|
|
|
|
|
|
|
|
|
|
| |
Agriculture and turf | |||||||||||||||||||||||||
Current | $ | $ | $ | $ | $ | $ | $ | $ | |||||||||||||||||
30-59 days past due | |||||||||||||||||||||||||
60-89 days past due | |||||||||||||||||||||||||
90+ days past due |
|
|
| ||||||||||||||||||||||
Non-performing | |||||||||||||||||||||||||
Construction and forestry | |||||||||||||||||||||||||
Current | |||||||||||||||||||||||||
30-59 days past due | |||||||||||||||||||||||||
60-89 days past due | |||||||||||||||||||||||||
90+ days past due |
|
| |||||||||||||||||||||||
Non-performing | |||||||||||||||||||||||||
Total retail customer receivables | $ | $ | $ | $ | $ | $ | $ | $ | |||||||||||||||||
October 29, 2023 | |||||||||||||||||||||||||
2023 | 2022 | 2021 | 2020 | 2019 | Prior | Revolving Charge Accounts | Total | ||||||||||||||||||
Retail customer receivables: |
|
|
|
|
|
|
|
|
|
|
|
|
|
|
|
|
|
|
|
|
|
|
|
| |
Agriculture and turf | |||||||||||||||||||||||||
Current | $ | $ | $ | $ | $ | $ | $ | $ | |||||||||||||||||
30-59 days past due | |||||||||||||||||||||||||
60-89 days past due | |||||||||||||||||||||||||
90+ days past due | |||||||||||||||||||||||||
Non-performing | |||||||||||||||||||||||||
Construction and forestry | |||||||||||||||||||||||||
Current | |||||||||||||||||||||||||
30-59 days past due |
| ||||||||||||||||||||||||
60-89 days past due | |||||||||||||||||||||||||
90+ days past due |
|
|
| ||||||||||||||||||||||
Non-performing | |||||||||||||||||||||||||
Total retail customer receivables | $ | $ | $ | $ | $ | $ | $ | $ | |||||||||||||||||
July 30, 2023 | |||||||||||||||||||||||||
2023 | 2022 | 2021 | 2020 | 2019 | Prior | Revolving Charge Accounts | Total | ||||||||||||||||||
Retail customer receivables: |
|
|
|
|
|
|
|
|
|
|
|
|
|
|
|
|
|
|
|
|
|
|
|
| |
Agriculture and turf | |||||||||||||||||||||||||
Current | $ | $ | $ | $ | $ | $ | $ | $ | |||||||||||||||||
30-59 days past due | |||||||||||||||||||||||||
60-89 days past due | |||||||||||||||||||||||||
90+ days past due |
|
|
|
|
|
| |||||||||||||||||||
Non-performing | |||||||||||||||||||||||||
Construction and forestry | |||||||||||||||||||||||||
Current | |||||||||||||||||||||||||
30-59 days past due | |||||||||||||||||||||||||
60-89 days past due | |||||||||||||||||||||||||
90+ days past due |
|
|
|
| |||||||||||||||||||||
Non-performing | |||||||||||||||||||||||||
Total retail customer receivables | $ | $ | $ | $ | $ | $ | $ | $ | |||||||||||||||||
15
The credit quality analysis of wholesale receivables by year of origination was as follows:
July 28, 2024 | |||||||||||||||||||||||||
2024 | 2023 | 2022 | 2021 | 2020 | Prior | Revolving | Total | ||||||||||||||||||
Wholesale receivables: |
|
|
|
|
|
|
|
|
|
|
|
|
|
|
|
|
|
|
|
|
|
|
|
| |
Agriculture and turf | |||||||||||||||||||||||||
Current | $ | $ | $ | $ | $ | $ | $ | $ | |||||||||||||||||
30+ days past due |
|
|
|
|
|
| |||||||||||||||||||
Non-performing |
|
|
|
|
|
| |||||||||||||||||||
Construction and forestry | |||||||||||||||||||||||||
Current |
|
| |||||||||||||||||||||||
30+ days past due |
|
|
|
|
|
| |||||||||||||||||||
Non-performing |
|
|
|
|
|
|
|
| |||||||||||||||||
Total wholesale receivables | $ | $ | $ | $ | $ | $ | $ | $ | |||||||||||||||||
October 29, 2023 | |||||||||||||||||||||||||
2023 | 2022 | 2021 | 2020 | 2019 | Prior | Revolving | Total | ||||||||||||||||||
Wholesale receivables: |
|
|
|
|
|
|
|
|
|
|
|
|
|
|
|
|
|
|
|
|
|
|
|
| |
Agriculture and turf | |||||||||||||||||||||||||
Current | $ | $ | $ | $ | $ | $ | $ | $ | |||||||||||||||||
30+ days past due |
| ||||||||||||||||||||||||
Non-performing |
| ||||||||||||||||||||||||
Construction and forestry | |||||||||||||||||||||||||
Current |
|
| |||||||||||||||||||||||
30+ days past due |
| ||||||||||||||||||||||||
Non-performing |
| ||||||||||||||||||||||||
Total wholesale receivables | $ | $ | $ | $ | $ | $ | $ | ||||||||||||||||||
July 30, 2023 | |||||||||||||||||||||||||
2023 | 2022 | 2021 | 2020 | 2019 | Prior | Revolving | Total | ||||||||||||||||||
Wholesale receivables: |
|
|
|
|
|
|
|
|
|
|
|
|
|
|
|
|
|
|
|
|
|
|
|
| |
Agriculture and turf | |||||||||||||||||||||||||
Current | $ | $ | $ | $ | $ | $ | $ | $ | |||||||||||||||||
30+ days past due |
|
|
|
|
|
|
|
| |||||||||||||||||
Non-performing |
|
|
|
|
|
| |||||||||||||||||||
Construction and forestry | |||||||||||||||||||||||||
Current |
| ||||||||||||||||||||||||
30+ days past due |
|
|
|
|
|
|
|
| |||||||||||||||||
Non-performing |
|
|
|
|
|
|
|
| |||||||||||||||||
Total wholesale receivables | $ | $ | $ | $ | $ | $ | $ | $ | |||||||||||||||||
16
An analysis of the allowance for credit losses and investment in financing receivables follows:
Retail Notes | Revolving | ||||||||||||
& Financing | Charge | Wholesale | |||||||||||
Leases | Accounts | Receivables | Total | ||||||||||
Three Months Ended July 28, 2024 | |||||||||||||
Allowance: |
|
|
|
|
|
|
|
|
|
|
|
|
|
Beginning of period balance |
| $ |
| $ | $ | $ | |||||||
Provision |
| ||||||||||||
Provision reversal for assets held for sale | ( |
| ( | ||||||||||
Provision subtotal |
| ||||||||||||
Write-offs | ( | ( |
| ( | |||||||||
Recoveries |
| ||||||||||||
Translation adjustments | ( |
|
| ( | |||||||||
End of period balance |
| $ |
| $ | $ | $ | |||||||
Nine Months Ended July 28, 2024 | |||||||||||||
Allowance: |
| ||||||||||||
Beginning of period balance |
| $ |
| $ | $ | $ | |||||||
Provision |
| ||||||||||||
Provision reversal for assets held for sale | ( |
|
| ( | |||||||||
Provision subtotal |
| ||||||||||||
Write-offs | ( | ( |
| ( | |||||||||
Recoveries |
| ||||||||||||
Translation adjustments | ( |
| ( | ( | |||||||||
End of period balance |
| $ |
| $ | $ | $ | |||||||
Financing receivables: | |||||||||||||
End of period balance |
| $ |
| $ | $ | $ | |||||||
Retail Notes | Revolving |
| |||||||||||
& Financing | Charge | Wholesale |
| ||||||||||
Leases | Accounts | Receivables | Total | ||||||||||
Three Months Ended July 30, 2023 | |||||||||||||
Allowance: |
|
|
|
|
|
|
|
|
|
|
|
| |
Beginning of period balance | $ |
| $ | $ | $ | ||||||||
Provision |
|
|
| ||||||||||
Write-offs |
| ( | ( |
|
| ( | |||||||
Recoveries |
|
|
| ||||||||||
Translation adjustments |
|
|
|
| |||||||||
End of period balance | $ | | $ | | $ | | $ | | |||||
Nine Months Ended July 30, 2023 | |||||||||||||
Allowance: |
|
|
|
|
|
|
|
|
|
| |||
Beginning of period balance | $ |
| $ | $ | $ | ||||||||
Provision |
| | | ||||||||||
Provision reversal for assets held for sale | ( |
|
| ( | |||||||||
Provision (credit) subtotal | ( | | ( | ||||||||||
Write-offs |
| ( | ( |
| ( | ||||||||
Recoveries |
| | |
| |||||||||
Translation adjustments | ( |
| ( |
| ( | ||||||||
End of period balance | $ | $ | $ | $ | |||||||||
Financing receivables: | |||||||||||||
End of period balance | $ | |
| $ | | $ | | $ | |||||
In the third quarter of 2024, we determined that the financial services business in Brazil met the held for sale criteria. The receivables in Brazil were reclassified to “Assets held for sale.” The associated allowance for credit losses was reversed and a valuation allowance for the assets held for sale was recorded (see Note 21). Excluding the business in Brazil, the allowance for credit losses on retail notes and financing lease receivables increased in the third quarter and first nine months of 2024,
17
primarily due to higher expected losses as a result of elevated delinquencies and a decline in market conditions. This increase was partially offset by a decrease in the allowance on revolving charge accounts, driven by write-offs of seasonal financing program accounts and recoveries expected on those accounts in the future.
In the first quarter of 2023, the financial services business in Russia met the held for sale criteria. The allowance for credit losses for the financing receivables in Russia was reversed and a valuation allowance for the assets held for sale was recorded. These operations were sold in the second quarter of 2023 (see Note 20).
Write-offs by year of origination were as follows:
Nine Months Ended July 28, 2024 | |||||||||||||||||||||||||
2024 | 2023 | 2022 | 2021 | 2020 | Prior Years | Revolving Charge Accounts | Total | ||||||||||||||||||
Retail customer receivables: |
|
|
|
|
|
|
|
|
|
|
|
|
|
|
|
|
|
|
|
|
|
|
|
| |
Agriculture and turf | $ | $ | $ | $ | $ | $ | $ | $ | |||||||||||||||||
Construction and forestry | |||||||||||||||||||||||||
Total retail customer receivables | $ | $ | $ | $ | $ | $ | $ | $ | |||||||||||||||||
Modifications
We occasionally grant contractual modifications to customers experiencing financial difficulties. Before offering a modification, we evaluate the ability of the customer to meet the modified payment terms. Modifications offered include payment deferrals, term extensions, or a combination thereof. Finance charges continue to accrue during the deferral or extension period with the exception of modifications related to bankruptcy proceedings. Our allowance for credit losses incorporates historical loss information, including the effects of loan modifications with customers. Therefore, additional adjustments to the allowance are generally not recorded upon modification of a loan.
The ending amortized cost of modified loans with borrowers experiencing financial difficulty during the third quarter and the nine months ended July 28, 2024 were $
Defaults and subsequent write-offs of loans modified in the prior twelve months were not significant during the third quarter or the first nine months of 2024. In addition, at July 28, 2024, commitments to provide additional financing to these customers were not significant.
(9) Securitization of Financing Receivables
Our funding strategy includes receivable securitizations, which allows us to receive cash for financing receivables immediately. While these securitization programs are administered in various forms, they are accomplished in the following basic steps:
| 1. | We transfer financing receivables into a bankruptcy-remote special purpose entity (SPE). |
| 2. | The SPE issues debt to investors. The debt is secured by the financing receivables. |
| 3. | Investors are paid back based on cash receipts from the financing receivables. |
As part of step 1, these receivables are legally isolated from the claims of our general creditors. This ensures cash receipts from the financing receivables are accessible to pay back securitization program investors. The structure of these transactions does not meet the accounting criteria for a sale of receivables. As a result, they are accounted for as a secured borrowing. The receivables and borrowings remain on our balance sheet and are separately reported as “Financing receivables securitized – net” and “Short-term securitization borrowings,” respectively.
The components of securitization programs were as follows:
| July 28 |
| October 29 |
| July 30 |
| ||||
2024 | 2023 | 2023 |
| |||||||
Financing receivables securitized (retail notes) |
| $ | $ | $ | ||||||
Allowance for credit losses | ( |
| ( |
| ( | |||||
Other assets (primarily restricted cash) |
|
| ||||||||
Total restricted securitized assets |
| $ | $ | $ | ||||||
Short-term securitization borrowings | $ | $ | $ | |||||||
Accrued interest on borrowings |
| |||||||||
Total liabilities related to restricted securitized assets | $ | $ | $ | |||||||
18
(10) Inventories
A majority of inventories owned by us are valued at cost on the “last-in, first-out” (LIFO) basis.
| July 28 |
| October 29 |
| July 30 |
| ||||
2024 | 2023 | 2023 |
| |||||||
Raw materials and supplies |
| $ | $ | $ | ||||||
Work-in-process |
|
| ||||||||
Finished goods and parts |
|
| ||||||||
Total FIFO value |
|
| ||||||||
Excess of FIFO over LIFO |
|
| ||||||||
Inventories |
| $ | $ | $ | ||||||
(11) Goodwill and Other Intangible Assets – Net
The changes in amounts of goodwill by operating segments were as follows. There were no accumulated goodwill impairment losses.
| Production & |
| Small Ag |
| Construction |
|
|
|
| ||||
Precision Ag | & Turf | & Forestry | Total |
| |||||||||
Goodwill at October 30, 2022 |
| $ | $ | $ | $ | ||||||||
Acquisitions |
|
| |||||||||||
Translation adjustments |
| ||||||||||||
Goodwill at July 30, 2023 | $ | $ | $ | $ | |||||||||
Goodwill at October 29, 2023 | $ | $ | $ | $ | |||||||||
Translation adjustments | ( | ||||||||||||
Goodwill at July 28, 2024 | $ | $ | $ | $ | |||||||||
The components of other intangible assets were as follows:
| July 28 |
| October 29 |
| July 30 |
| ||||
2024 | 2023 | 2023 |
| |||||||
Customer lists and relationships | $ | $ | $ | |||||||
Technology, patents, trademarks, and other |
|
| ||||||||
Total at cost |
|
| ||||||||
Less accumulated amortization: |
|
| ||||||||
Customer lists and relationships | ||||||||||
Technology, patents, trademarks, and other | ||||||||||
Total accumulated amortization | ||||||||||
Other intangible assets – net | $ | $ | $ | |||||||
The amortization of other intangible assets in the third quarter and the first nine months of 2024 was $
(12) Short-Term Borrowings
Short-term borrowings were as follows:
July 28 | October 29 | July 30 | ||||||||
| 2024 |
| 2023 |
| 2023 | |||||
Commercial paper | $ | $ | $ | |||||||
Notes payable to banks | ||||||||||
Finance lease obligations due within one year | ||||||||||
Long-term borrowings due within one year |
|
|
| |||||||
Short-term borrowings | $ | $ | $ | |||||||
19
(13) Accounts Payable and Accrued Expenses
Accounts payable and accrued expenses consisted of the following:
| July 28 |
| October 29 |
| July 30 |
| ||||
2024 | 2023 | 2023 | ||||||||
Accounts payable: |
|
|
|
|
|
|
|
|
| |
Trade payables | $ |
| $ |
| $ | |||||
Dividends payable |
|
|
| |||||||
Deposits withheld from dealers and merchants | ||||||||||
Payables to unconsolidated affiliates | ||||||||||
Other |
|
|
| |||||||
Accrued expenses: | ||||||||||
Employee benefits |
|
|
| |||||||
Product warranties |
|
|
| |||||||
Accrued taxes | ||||||||||
Derivative liabilities | ||||||||||
Dealer sales discounts |
|
|
| |||||||
Extended warranty premium | ||||||||||
Unearned revenue (contractual liability) |
|
|
| |||||||
Unearned operating lease revenue | ||||||||||
Accrued interest | ||||||||||
Parts return liability | ||||||||||
Other |
|
|
| |||||||
Accounts payable and accrued expenses |
| $ |
| $ | $ | |||||
Amounts are presented net of eliminations, which primarily consist of dealer sales incentives with a right of set-off against trade receivables of $
(14) Long-Term Borrowings
Long-term borrowings consisted of:
July 28 | October 29 | July 30 | ||||||||
| 2024 |
| 2023 |
| 2023 | |||||
Underwritten term debt |
|
|
| |||||||
U.S. dollar notes and debentures: | ||||||||||
| $ | $ | ||||||||
$ |
|
| ||||||||
|
|
| ||||||||
|
|
| ||||||||
|
|
| ||||||||
|
|
| ||||||||
Euro notes: | ||||||||||
Serial issuances | ||||||||||
Medium-term notes |
| |||||||||
Other notes and finance lease obligations |
|
|
| |||||||
Less debt issuance costs and debt discounts | ( | ( | ( | |||||||
Long-term borrowings |
| $ | $ | $ | ||||||
Medium-term notes due through 2034 are primarily offered by prospectus and issued at fixed and variable rates. The principal balances of the medium-term notes were $
20
(15) Leases – Lessor
We lease equipment manufactured or sold by us through John Deere Financial. Sales-type and direct financing leases are reported in “Financing receivables – net.” Operating leases are reported in “Equipment on operating leases – net.”
Lease revenues earned by us follow:
Three Months Ended | Nine Months Ended | ||||||||||||
July 28 | July 30 | July 28 | July 30 | ||||||||||
2024 | 2023 | 2024 | 2023 | ||||||||||
Sales-type and direct finance lease revenues | $ | $ | $ | $ | |||||||||
Operating lease revenues | |||||||||||||
Variable lease revenues |
| ||||||||||||
Total lease revenues | $ | $ | $ | $ | |||||||||
(16) Commitments and Contingencies
A standard warranty is provided as assurance that the equipment will function as intended. The standard warranty period varies by product and region. At the time a sale is recognized, we record an estimate of future warranty costs based on historical claims rate experience and estimated population under warranty.
The reconciliation of the changes in the warranty liability follows:
Three Months Ended | Nine Months Ended |
| |||||||||||
July 28 | July 30 | July 28 | July 30 |
| |||||||||
2024 | 2023 | 2024 | 2023 |
| |||||||||
Beginning of period balance |
| $ |
| $ |
| $ |
| $ | |||||
Warranty claims paid | ( |
| ( | ( |
| ( | |||||||
New product warranty accruals |
|
| |||||||||||
Foreign exchange | ( |
| ( |
| |||||||||
End of period balance | $ | $ | $ | $ | |||||||||
The costs for extended warranty programs are recognized as incurred.
In certain international markets, we provide guarantees to banks for the retail financing of John Deere equipment. At July 28, 2024, the notional value of these guarantees was $
We also had other miscellaneous contingent liabilities and guarantees totaling approximately $
At July 28, 2024, we had commitments of approximately $
We are subject to various unresolved legal actions. The accrued losses on these matters were not material at July 28, 2024. We believe the reasonably possible range of losses for these unresolved legal actions would not have a material effect on our financial statements. The most prevalent legal claims relate to product liability (including asbestos-related liability), retail credit, employment, patent, trademark, and antitrust matters.
(17) FAIR VALUE MEASUREMENTS
The fair values of financial instruments that do not approximate the carrying values were as follows. Long-term borrowings exclude finance lease liabilities.
July 28, 2024 | October 29, 2023 | July 30, 2023 |
| ||||||||||||||||
Carrying | Fair | Carrying | Fair | Carrying | Fair |
| |||||||||||||
Financing receivables – net | $ | $ | $ | $ | $ | $ | |||||||||||||
Financing receivables securitized – net | |||||||||||||||||||
Short-term securitization borrowings | |||||||||||||||||||
Long-term borrowings due within one year | |||||||||||||||||||
Long-term borrowings | |||||||||||||||||||
Fair value measurements above were Level 3 for all financing receivables and Level 2 for all borrowings.
21
Fair values of the financing receivables that were issued long-term were based on the discounted values of their related cash flows at interest rates currently being offered by us for similar financing receivables. The fair values of the remaining financing receivables approximated the carrying amounts. In May 2024, we acquired a held-to-maturity marketable security that matures in less than one year. The carrying value of the held-to-maturity marketable security was $
Fair values of long-term borrowings and short-term securitization borrowings were based on current market quotes for identical or similar borrowings and credit risk, or on the discounted values of their related cash flows at current market interest rates.
Assets and liabilities measured at fair value on a recurring basis follow, excluding our cash equivalents, which were carried at a cost that approximates fair value and consisted of money market funds and time deposits.
| July 28 |
| October 29 |
| July 30 |
| ||||
2024 | 2023 | 2023 |
| |||||||
Level 1 | ||||||||||
Marketable securities: | ||||||||||
International equity securities |
| $ | $ | |||||||
International mutual funds securities |
|
| ||||||||
U.S. equity fund |
| |||||||||
U.S. fixed income fund |
|
|
| |||||||
U.S. government debt securities | $ |
|
| |||||||
Total Level 1 marketable securities | ||||||||||
Level 2 | ||||||||||
Marketable securities: | ||||||||||
Corporate debt securities |
|
| ||||||||
International debt securities | ||||||||||
Mortgage-backed securities |
|
| ||||||||
Municipal debt securities |
|
| ||||||||
U.S. government debt securities | ||||||||||
Total Level 2 marketable securities |
|
| ||||||||
Other assets – Derivatives |
| |||||||||
Accounts payable and accrued expenses – Derivatives |
| |||||||||
Level 3 | ||||||||||
Accounts payable and accrued expenses – Deferred consideration | ||||||||||
The mortgage-backed securities are primarily issued by U.S. government-sponsored enterprises.
The contractual maturities of available-for-sale debt securities at July 28, 2024 follow:
| Amortized |
| Fair |
| |||
Cost | Value |
| |||||
Due in one year or less |
| $ | $ | ||||
Due after one through five years | |||||||
Due after five through 10 years | |||||||
Due after 10 years | |||||||
Mortgage-backed securities | |||||||
Debt securities |
| $ |
| $ | |||
Actual maturities may differ from contractual maturities because some securities may be called or prepaid. Mortgage-backed securities contain prepayment provisions and are not categorized by contractual maturity.
Fair value, nonrecurring Level 3 measurements from impairments were as follows:
Fair Value | Losses | |||||||||||||||||||||
|
|
|
|
|
|
|
|
| Three Months Ended | Nine Months Ended | ||||||||||||
July 28 | October 29 | July 30 | July 28 | July 30 | July 28 | July 30 | ||||||||||||||||
| 2024 |
| 2023 |
| 2023 |
| 2024 |
| 2023 |
| 2024 |
| 2023 |
| ||||||||
Assets held for sale | $ | | $ | | $ | | ||||||||||||||||
22
The following is a description of the valuation methodologies we use to measure certain financial instruments on the balance sheets at fair value:
Marketable securities – The portfolio of investments is valued on a market approach (matrix pricing model) in which all significant inputs are observable or can be derived from or corroborated by observable market data such as interest rates, yield curves, volatilities, credit risk, and prepayment speeds. Funds are valued using the fund’s net asset value, based on the fair value of the underlying securities. International debt securities are valued using quoted prices for identical assets in inactive markets.
Derivatives – Our derivative financial instruments consist of interest rate contracts (swaps), foreign currency exchange contracts (futures, forwards, and swaps), and cross-currency interest rate contracts (swaps). The portfolio is valued based on an income approach (discounted cash flow) using market observable inputs, including swap curves and both forward and spot exchange rates for currencies.
Assets held for sale – The impairment was measured at the lower of the carrying amount or fair value less cost to sell. Fair value was based on the probable sale price. The inputs included estimates of the final sale price (see Note 21).
(18) Derivative Instruments
Fair values of our derivative instruments and the associated notional amounts were as follows. Assets are recorded in “Other assets,” while liabilities are recorded in “Accounts payable and accrued expenses.”
July 28, 2024 | October 29, 2023 | July 30, 2023 |
| |||||||||||||||||||||||||
Fair Value | Fair Value | Fair Value |
| |||||||||||||||||||||||||
Notional | Assets | Liabilities | Notional | Assets | Liabilities | Notional | Assets | Liabilities |
| |||||||||||||||||||
Cash flow hedges: |
|
|
|
|
|
|
|
|
|
|
|
|
|
|
|
|
|
|
|
|
|
|
|
|
|
|
|
|
Interest rate contracts |
| $ | $ | $ |
| $ | $ |
| $ | $ | $ | |||||||||||||||||
| ||||||||||||||||||||||||||||
Fair value hedges: | ||||||||||||||||||||||||||||
Interest rate contracts | $ | |||||||||||||||||||||||||||
Cross-currency interest rate contracts | ||||||||||||||||||||||||||||
| ||||||||||||||||||||||||||||
Not designated as hedging instruments: | ||||||||||||||||||||||||||||
Interest rate contracts | ||||||||||||||||||||||||||||
Foreign exchange contracts |
|
|
|
| ||||||||||||||||||||||||
Cross-currency interest rate contracts |
|
|
|
|
| |||||||||||||||||||||||
The amounts recorded in the consolidated balance sheets related to borrowings designated in fair value hedging relationships were as follows. Fair value hedging adjustments are included in the carrying amount of the hedged item.
Active Hedging Relationships | Discontinued Hedging Relationships | ||||||||||||
Carrying Amount | Cumulative Fair Value | Carrying Amount of | Cumulative Fair Value | ||||||||||
of Hedged Item | Hedging Amount | Formerly Hedged Item | Hedging Amount | ||||||||||
July 28, 2024 | |||||||||||||
Short-term borrowings | $ | $ | ( | $ | $ | ||||||||
Long-term borrowings | ( | ( | |||||||||||
October 29, 2023 | |||||||||||||
Short-term borrowings | $ | $ | |||||||||||
Long-term borrowings | $ | ( | ( | ||||||||||
July 30, 2023 | |||||||||||||
Short-term borrowings | $ | $ | |||||||||||
Long-term borrowings | $ | $ | ( | ( | |||||||||
23
The classification and gains (losses), including accrued interest expense, related to derivative instruments on the statements of consolidated income consisted of the following:
Three Months Ended | Nine Months Ended |
| |||||||||||
July 28 | July 30 | July 28 | July 30 |
| |||||||||
2024 | 2023 | 2024 | 2023 |
| |||||||||
Fair Value Hedges |
|
|
|
|
|
|
|
|
| ||||
Interest rate contracts – Interest expense* |
| $ | $ | ( |
| $ | $ | ( | |||||
| |||||||||||||
Cash Flow Hedges | |||||||||||||
Recognized in OCI: | |||||||||||||
Interest rate contracts – OCI (pretax) | $ | ( | $ | $ | $ | ||||||||
Reclassified from OCI: | |||||||||||||
Interest rate contracts – Interest expense |
|
| |||||||||||
| |||||||||||||
Not Designated as Hedges | |||||||||||||
Interest rate contracts – Net sales |
| $ |
|
| |||||||||
Interest rate contracts – Interest expense* |
| $ |
| $ | $ | ||||||||
Foreign exchange contracts – Net sales | ( |
| |||||||||||
Foreign exchange contracts – Cost of sales |
| ( | ( | ||||||||||
Foreign exchange contracts – Other operating expenses* |
| ( | ( |
| ( | ||||||||
Total not designated |
| $ | $ | ( |
| $ | ( | $ | ( | ||||
* Includes interest and foreign exchange gains (losses) from cross-currency interest rate contracts.
Certain of our derivative agreements contain credit support provisions that may require us to post collateral based on the size of the net liability positions and credit ratings. The aggregate fair value of all derivatives with credit-risk-related contingent features that were in a net liability position at July 28, 2024, October 29, 2023, and July 30, 2023, was $
Derivatives are recorded without offsetting for netting arrangements or collateral. The impact on the derivative assets and liabilities related to netting arrangements and collateral follows:
Gross Amounts | Netting |
| |||||||||||
| Recognized |
| Arrangements |
| Collateral |
| Net Amount |
| |||||
July 28, 2024 |
|
|
|
|
|
|
|
|
|
|
|
| |
Assets |
| $ |
| $ | ( |
|
|
| $ | ||||
Liabilities | ( | $ | ( | ||||||||||
| |||||||||||||
October 29, 2023 |
|
|
|
|
| ||||||||
Assets | $ |
| $ | ( |
|
|
| $ | |||||
Liabilities |
| ( | $ | ( | |||||||||
|
| ||||||||||||
July 30, 2023 |
| ||||||||||||
Assets | $ |
| $ | ( |
| $ | ( | $ | |||||
Liabilities |
| ( | ( |
| |||||||||
(19) Share-Based Awards
We are authorized to grant shares for stock options and restricted stock units. The outstanding shares authorized were
24
During the nine months ended July 28, 2024, the restricted stock units (RSUs) granted in thousands of shares and the weighted-average grant date fair values, using the closing price of our common stock on the grant date, in dollars follow:
Grant Date | ||||||
Shares | Fair Value | |||||
Service-based |
|
| $ |
| ||
Performance/service-based | ||||||
Market/service-based | ||||||
In December 2023, we granted market/service-based RSUs. The vesting period for the market/service-based RSUs is
(20) Disposition
In March 2023, we sold our financial services business in Russia to Insight Investment Group. The total proceeds, net of restricted cash sold, were $
(21) Special ItemS
2024
Employee-Separation Programs
In the third quarter of 2024, we implemented employee-separation programs for our salaried workforce in several geographic areas, including the United States, Europe, Asia, and Latin America. The programs’ main purpose was to help meet our strategic priorities while reducing overlap and redundancy in roles and responsibilities. The programs were largely involuntary in nature with the expense recorded when management committed to a plan, the plan was communicated to the employees, and the employees were not required to provide service beyond the legal notification period.
The programs’ total pretax expenses are estimated to be approximately $
PPA |
| SAT |
| CF |
| FS |
| Total | ||||||||
Employee-Separation Programs: |
| |||||||||||||||
Cost of sales | $ | $ | $ | $ | ||||||||||||
Research and development expenses | ||||||||||||||||
Selling, administrative and general expenses | $ | |||||||||||||||
Total operating profit decrease | $ | $ | $ | $ | ||||||||||||
Non-operating profit expenses* | ||||||||||||||||
Total | $ | |||||||||||||||
* Relates primarily to corporate expenses.
Banco John Deere S.A.
In the third quarter of 2024, our board of directors authorized the sale of
25
The major classes of the total consolidated assets and liabilities of BJD that were classified as held for sale and liabilities of BJD to other intercompany parties were as follows:
July 28 | ||||
2024 | ||||
Cash and cash equivalents | $ | |||
Trade accounts and notes receivable – net | ||||
Financing receivables – net | ||||
Deferred income taxes | ||||
Other miscellaneous assets* | ||||
Valuation allowance | ( | |||
Total assets held for sale | $ | |||
Short-term borrowings | ||||
Accounts payable and accrued expenses | ||||
Long-term borrowings | ||||
Retirement benefits and other liabilities | ||||
Total liabilities held for sale | $ | |||
Total intercompany payables | $ | |||
* Includes $
In August 2024, we entered into an agreement with a Brazilian bank, Banco Bradesco S.A. (Bradesco), for Bradesco to invest and become
Redeemable Noncontrolling Interest
In the third quarter of 2024, we exercised our right to purchase the remaining
2023
Brazil Tax Ruling
In the third quarter of 2023, the Brazil Superior Court of Justice published a favorable tax ruling regarding taxability of local incentives, which allowed us to record a $
Financial Services Financing Incentives Correction
In the second quarter of 2023, we corrected the for financing incentives offered to John Deere dealers, which impacted the timing of expense recognition and the presentation of incentive costs in the consolidated financial statements. The cumulative effect of this correction, $
Summary of 2024 and 2023 Special Items
The following table summarizes the operating profit impact of the special items recorded for the three months and nine months ended July 28, 2024 and July 30, 2023.
Three Months Ended | Nine Months Ended | ||||||||||||||||||||||||||||||
PPA |
| SAT |
| CF |
| FS |
| Total | PPA | SAT |
| CF |
| FS |
| Total | |||||||||||||||
2024 Expense: |
|
|
|
|
|
|
|
|
|
|
|
|
|
|
|
|
|
|
|
|
|
|
|
|
|
|
|
|
|
| |
Employee-separation programs | $ | $ | $ | $ | $ | $ | $ | $ | $ | $ | |||||||||||||||||||||
BJD remeasurement | |||||||||||||||||||||||||||||||
Total 2024 expense | |||||||||||||||||||||||||||||||
|
| ||||||||||||||||||||||||||||||
2023 Expense: | |||||||||||||||||||||||||||||||
Financing incentives correction |
| ||||||||||||||||||||||||||||||
Period over period change | $ | $ | $ | $ | $ | $ | $ | $ | $ | ( | $ | ( | |||||||||||||||||||
(22) Subsequent EventS
In August 2024, we entered into an agreement with a Brazilian bank, Banco Bradesco S.A., to invest and become
On
26
Item 2.MANAGEMENT’S DISCUSSION AND ANALYSIS OF FINANCIAL CONDITION AND RESULTS OF OPERATIONS
RESULTS OF OPERATIONS
All amounts are presented in millions of dollars unless otherwise specified.
Overview
Organization
Deere & Company is a global leader in the production of agricultural, turf, construction, and forestry equipment and solutions. John Deere Financial provides financing for John Deere equipment, parts, services, and other input costs customers need to run their operations. Our operations are managed through the production and precision agriculture (PPA), small agriculture and turf (SAT), construction and forestry (CF), and financial services operating segments. References to “equipment operations” include PPA, SAT, and CF, while references to “agriculture and turf” include both PPA and SAT.
Smart Industrial Operating Model and Leap Ambitions
We announced the Smart Industrial Operating Model in 2020. This operating model is based on three focus areas:
(a) | Production systems: A strategic alignment of products and solutions around our customers’ operations. |
(b) | Technology stack: Investments in technology, as well as research and development, that deliver intelligent solutions to our customers through digital capabilities, automation, autonomy, and alternative power technologies. |
(c) | Lifecycle solutions: The integration of our aftermarket and support capabilities to more effectively manage customer equipment, service, and technology needs across the full lifetime of a John Deere product. |
Our Leap Ambitions were launched in 2022. These ambitions are designed to boost economic value and sustainability for our customers. The ambitions align across our customers’ production systems seeking to optimize their operations to deliver better outcomes with fewer resources.
Trends and Economic Conditions
Industry Sales Outlook for Fiscal Year 2024
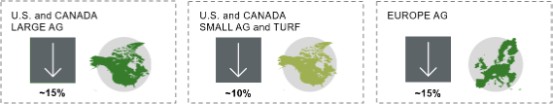
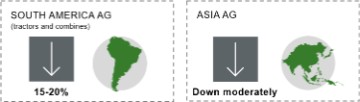
Agriculture and Turf
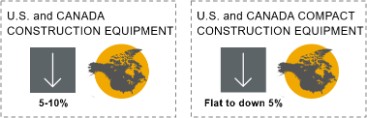
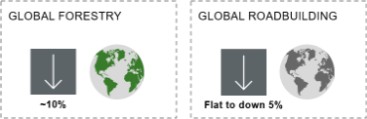
Construction and Forestry
Company Trends
Customers seek to improve profitability, productivity, and sustainability through technology. Integration of technology into equipment is a persistent market trend. Our Smart Industrial Operating Model and Leap Ambitions are intended to capitalize on this market trend. These technologies are incorporated into products within each of our operating segments. We expect this trend to persist for the foreseeable future. Our progress is demonstrated, in part, by the growing use of the John Deere Operations Center (our digital operations management system) engaging more agricultural acres globally. Engaged acres give us a foundational understanding of customer utilization of John Deere technology. The investments in these technologies and establishing a Solutions as a Service business model may increase our operating costs and decrease operating margins during the transition period.
Company Outlook for 2024
Production volumes are expected to continue to decline during the remainder of 2024 due to reduced demand amid challenges in the global agricultural and turf sectors and construction industry coupled with inventory management through planned underproduction to retail demand.
27
Agriculture and Turf Outlook for 2024
| ● | We expect large and small agricultural equipment sales to be down from 2023 levels across all our major markets. |
| ● | Agricultural fundamentals are expected to continue to moderate in 2024 due to rising global grain stocks from excellent growing conditions, lower commodity prices, elevated interest rates, and geopolitical uncertainty. |
| ● | Demand in the U.S. and Canada continues to be affected by declining farm income margins partially offset by stable farm balance sheets. |
| ● | The U.S. equipment fleet age is elevated for tractors and in line with historic averages for combines. However, increases in used inventory levels are impacting purchasing decisions. |
| ● | Sales of compact utility tractors in the U.S. are forecasted to be down due to higher interest rates, partially offset by small and mid-tractor tailwinds from improving dairy and livestock fundamentals. |
| ● | In Europe, volatile weather conditions continue to drive uncertainty about crop yields and along with elevated input costs are impacting demand in the region, while the dairy and livestock sector remains steady due to stronger pricing and lower feed costs. |
| ● | Demand in Brazil is expected to be down due to strong global yields driving down commodity prices and persistently high interest rates. |
| ● | Industry sales in Asia are forecasted to be down moderately due to commodity price changes, inventory reductions, and weather impacts. |
Construction and Forestry Outlook for 2024
| ● | Construction equipment industry sales are forecasted to be down from 2023 levels. |
| ● | Benefits from strong U.S. infrastructure spending and increasing manufacturing investment levels are expected to partially offset declines in housing starts, decreases in rental purchases, low levels of commercial real estate construction, and the effect of inventory levels having recovered from historical lows. |
| ● | Roadbuilding demand remains strong in the U.S., largely offset by continuing softness in Europe. |
Financial Services Outlook for 2024
Net Income | Up moderately | ||||||
+ Higher average portfolio | Favorable | ||||||
+ Prior period special item | Favorable | ||||||
(-) Provision for credit losses | Unfavorable | ||||||
(-) Financing spreads | Unfavorable | ||||||
Additional Trends
Agricultural Market Business Cycle. The agricultural market is affected by various factors including commodity prices, acreage planted, crop yields, and government policies. These factors affect farmers’ income and may result in lower demand for equipment. We may experience any of the following effects during unfavorable market conditions: lower net sales, higher sales discounts, higher receivable write-offs, and losses on equipment on operating leases.
In the third quarter of 2024, we implemented employee-separation programs for our salaried workforce to help meet our strategic priorities while reducing overlap and redundancy in roles and responsibilities. The programs’ total pretax expenses are estimated to be approximately $150, of which $124 was recorded in the third quarter of 2024. Annual pretax savings from these programs are estimated to be approximately $230, with $100 estimated to be realized in 2024 (See Note 21).
Interest Rates. Central bank policy interest rates increased in 2023 and have remained elevated. Increased rates impacted us in several ways, primarily affecting the demand for our products and financing spreads for the financial services operations.
The markets for our agriculture, turf, and construction products were negatively impacted by elevated interest rates and their effect on borrowing costs for our customers.
Most retail customer receivables are fixed rate. Wholesale financing receivables generally are variable rate. Both types of receivables are financed with fixed and floating rate borrowings. We manage our exposure to interest rate fluctuations by matching our receivables with our funding sources. We also enter into interest rate swap agreements to match our interest rate exposure.
Rising interest rates have historically impacted our borrowings sooner than the benefit is realized from receivable and lease portfolios. As a result, our financial services operations experienced $66 (after-tax) less favorable financing spreads in 2024 compared to 2023. We expect to continue experiencing spread compression in 2024.
Higher interest rates are driven by factors outside of our control, and as a result we cannot reasonably foresee when this condition will subside.
28
Other Items of Concern and Uncertainties
Other items that could impact our results are:
| ● | global and regional political conditions, including the ongoing war between Russia and Ukraine and the conflict in the Middle East, |
| ● | economic, tax, and trade policies, |
| ● | new or retaliatory tariffs, |
| ● | capital market disruptions, |
| ● | foreign currency and capital control policies, |
| ● | regulations and legislation regarding right to repair or right to modify, |
| ● | weather conditions, |
| ● | marketplace adoption, and monetization of technologies we have invested in, |
| ● | our ability to strengthen our digital capabilities, automation, autonomy, and alternative power technologies, |
| ● | workforce reductions impact on employee retention, morale, and institutional knowledge, |
| ● | changes in demand and pricing for new and used equipment, |
| ● | delays or disruptions in our supply chain, |
| ● | significant fluctuations in foreign currency exchange rates, |
| ● | volatility in the prices of many commodities, and |
| ● | slower economic growth or recession. |
Consolidated Results – 2024 Compared with 2023
Three Months Ended | Nine Months Ended | ||||||||||||||||
Deere & Company | July 28 | July 30 | % | July 28 | July 30 | % | |||||||||||
(In millions of dollars, except per share amounts) | 2024 | 2023 | Change | 2024 | 2023 | Change | |||||||||||
Net sales and revenues | $ | 13,152 | $ | 15,801 | -17 | $ | 40,572 | $ | 45,839 | -11 | |||||||
Net income attributable to Deere & Company | 1,734 | 2,978 | -42 | 5,855 | 7,797 | -25 | |||||||||||
Diluted earnings per share | 6.29 | 10.20 | 21.04 | 26.35 | |||||||||||||
Net sales and revenues decreased for both the quarter and year-to-date periods primarily due to lower sales volumes. Net income and diluted EPS decreased driven by lower sales. The discussion of net sales and operating profit is included in the Business Segment Results below. Net income in each of the periods presented were impacted by special items. See Note 21 for additional details.
An explanation of the cost of sales to net sales ratio and other significant statement of consolidated income changes follows:
Three Months Ended | Nine Months Ended | ||||||||||||||||
July 28 | July 30 | % | July 28 | July 30 | % | ||||||||||||
Deere & Company | 2024 | 2023 | Change | 2024 | 2023 | Change | |||||||||||
Cost of sales to net sales | 68.9% | 67.4% | 68.2% | 67.7% | |||||||||||||
Increased for both periods mostly due to higher overhead costs from reduced volumes resulting in production inefficiencies, partially offset by sales price realization, lower material cost, and reduced inbound freight costs. | |||||||||||||||||
Other income | $ | 304 | $ | 264 | +15 | $ | 881 | $ | 748 | +18 | |||||||
Higher for the first nine months primarily due to investment income earned on international mutual funds securities. | |||||||||||||||||
Research and development expenses | 567 | 528 | +7 | 1,664 | 1,571 | +6 | |||||||||||
Higher for both periods due to continued focus on developing and incorporating technology solutions. | |||||||||||||||||
Selling, administrative and general expenses | 1,278 | 1,110 | +15 | 3,608 | 3,392 | +6 | |||||||||||
Increased mostly due to a higher provision for credit losses, higher employee pay driven by inflationary conditions and profit sharing incentives, and employee-separation programs’ expenses. | |||||||||||||||||
Interest expense | 840 | 623 | +35 | 2,478 | 1,671 | +48 | |||||||||||
Increased for both periods primarily due to higher average borrowing rates and higher average borrowings. | |||||||||||||||||
Other operating expenses | 264 | 310 | -15 | 930 | 971 | -4 | |||||||||||
Lower in both periods due to higher pension benefits (see Note 6) and lower foreign exchange losses. | |||||||||||||||||
Provision for income taxes | 625 | 636 | -2 | 1,845 | 2,164 | -15 | |||||||||||
Decreased for both periods as a result of lower pretax income, partially offset by the prior periods’ favorable income tax ruling in Brazil. | |||||||||||||||||
29
Business Segment Results – 2024 Compared with 2023
Three Months Ended | Nine Months Ended | ||||||||||||||||
July 28 | July 30 | % | July 28 | July 30 | % | ||||||||||||
Production and Precision Agriculture | 2024 | 2023 | Change | 2024 | 2023 | Change | |||||||||||
Net sales | $ | 5,099 | $ | 6,806 | -25 | $ | 16,529 | $ | 19,826 | -17 | |||||||
Operating profit | 1,162 | 1,782 | -35 | 3,857 | 5,160 | -25 | |||||||||||
Operating margin | 22.8% | 26.2% | 23.3% | 26.0% | |||||||||||||
Price realization | +3 | +3 | |||||||||||||||
Currency translation impact on Net sales | -1 | ||||||||||||||||
Production and precision agriculture sales decreased for the quarter as a result of lower shipment volumes (primarily in the U.S., Europe, Brazil, and Asia) driven mainly by lower commodity prices and higher interest rates, partially offset by price realization in the U.S. and Canada. Operating profit decreased primarily due to lower shipment volumes and employee-separation programs’ expenses, partially offset by price realization and lower warranty expenses.
Production & Precision Agriculture Operating Profit
Third Quarter 2024 Compared to Third Quarter 2023
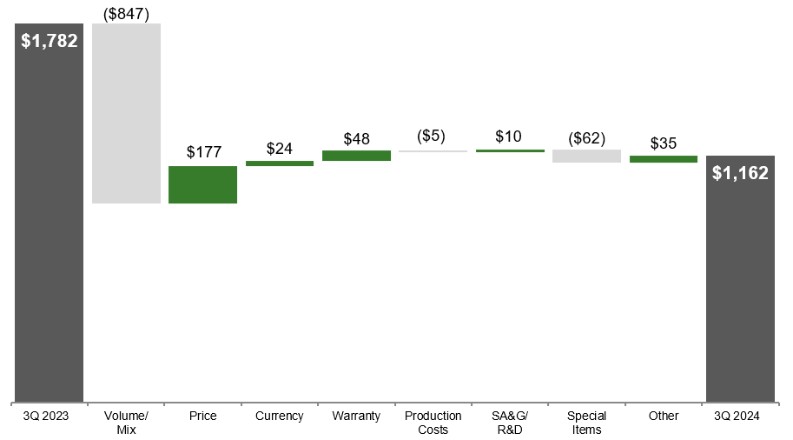
Sales for the first nine months decreased as a result of lower shipment volumes (primarily in Brazil, the U.S., and Europe) partially offset by price realization in the U.S. and Canada. Operating profit for the first nine months decreased due to lower sales volume, higher selling, administrative, and general expenses and research and development expenses, partially offset by price realization and lower warranty expenses.
Production & Precision Agriculture Operating Profit
First Nine Months 2024 Compared to First Nine Months 2023
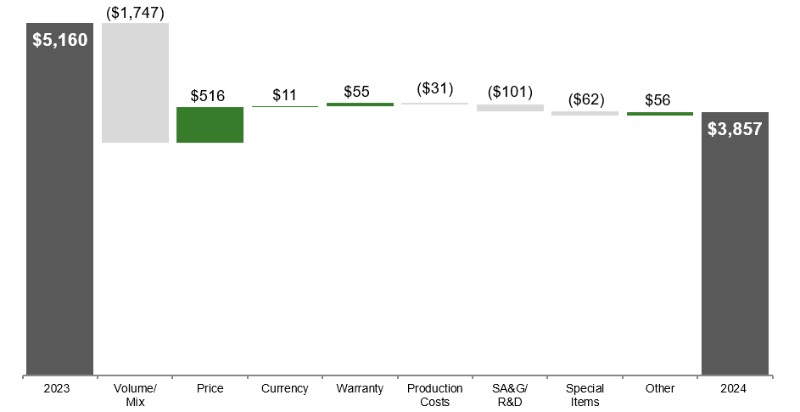
30
Three Months Ended | Nine Months Ended | ||||||||||||||||
July 28 | July 30 | % | July 28 | July 30 | % | ||||||||||||
Small Agriculture and Turf | 2024 | 2023 | Change | 2024 | 2023 | Change | |||||||||||
Net sales | $ | 3,053 | $ | 3,739 | -18 | $ | 8,663 | $ | 10,886 | -20 | |||||||
Operating profit | 496 | 732 | -32 | 1,393 | 2,028 | -31 | |||||||||||
Operating margin | 16.2% | 19.6% | 16.1% | 18.6% | |||||||||||||
Price realization | +2 | +2 | |||||||||||||||
Currency translation impact on Net sales | |||||||||||||||||
Small agriculture and turf sales decreased for the quarter due to lower shipment volumes (primarily in Europe, the U.S., and Mexico) driven mainly by uncertainty in commodity prices and higher interest rates, partially offset by price realization in the U.S. and Europe. Operating profit decreased due to lower shipment volumes and higher warranty expenses, partially offset by price realization.
Small Agriculture & Turf Operating Profit
Third Quarter 2024 Compared to Third Quarter 2023
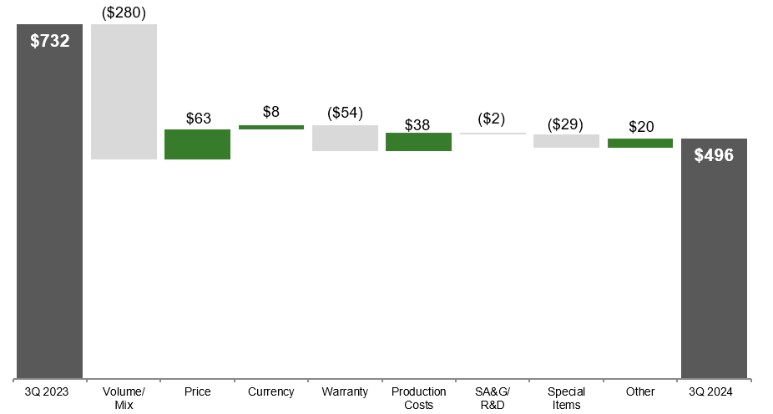
Sales for the first nine months decreased as a result of lower shipment volumes (primarily in the U.S., Europe, and Mexico), partially offset by price realization. Operating profit for the first nine months decreased primarily as a result of lower sales volumes and higher warranty expenses. These items were partially offset by price realization and lower production costs.
Small Agriculture & Turf Operating Profit
First Nine Months 2024 Compared to First Nine Months 2023
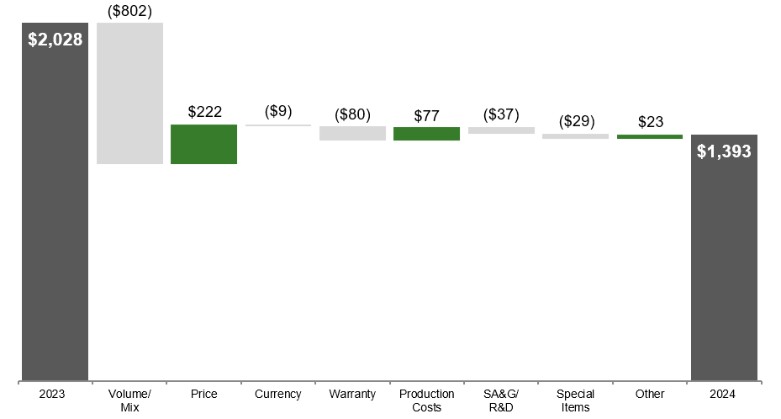
31
Three Months Ended | Nine Months Ended | ||||||||||||||||
July 28 | July 30 | % | July 28 | July 30 | % | ||||||||||||
Construction and Forestry | 2024 | 2023 | Change | 2024 | 2023 | Change | |||||||||||
Net sales | $ | 3,235 | $ | 3,739 | -13 | $ | 10,292 | $ | 11,053 | -7 | |||||||
Operating profit | 448 | 716 | -37 | 1,682 | 2,179 | -23 | |||||||||||
Operating margin | 13.8% | 19.1% | 16.3% | 19.7% | |||||||||||||
Price realization | -1 | +1 | |||||||||||||||
Currency translation impact on Net sales | -1 | ||||||||||||||||
Construction and forestry sales decreased for the quarter due to lower U.S. shipment volumes, driven by moderating demand and efforts to reduce field inventory. Operating profit decreased due to lower sales volumes, unfavorable mix, and unfavorable price realization.
Construction & Forestry Operating Profit
Third Quarter 2024 Compared to Third Quarter 2023
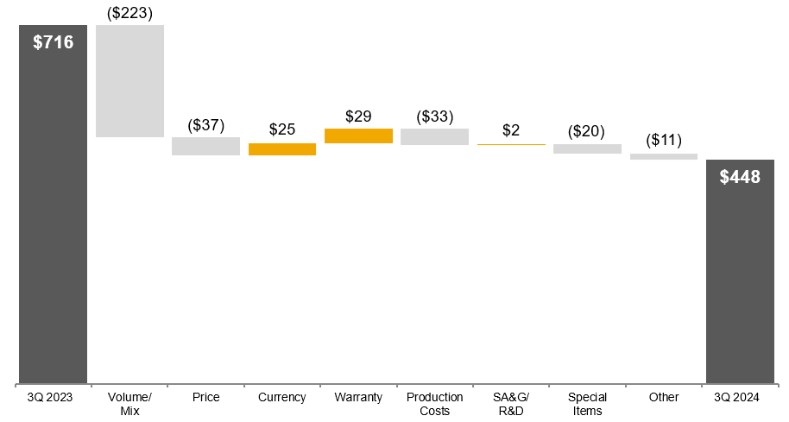
Sales for the first nine months decreased due to lower worldwide shipment volumes, partially offset by price realization. Operating profit for the first nine months decreased due to lower sales volumes, increased production costs driven by low volume inefficiencies, and higher selling, administrative, and general expenses and research and development expenses. These factors were partially offset by price realization.
Construction & Forestry Operating Profit
First Nine Months 2024 Compared to First Nine Months 2023
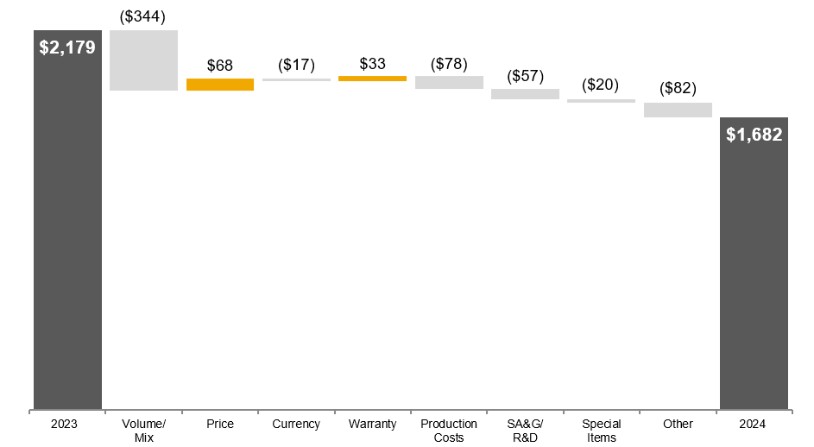
32
Three Months Ended | Nine Months Ended | ||||||||||||||||
July 28 | July 30 | % | July 28 | July 30 | % | ||||||||||||
Financial Services | 2024 | 2023 | Change | 2024 | 2023 | Change | |||||||||||
Revenue (including intercompany) | $ | 1,667 | $ | 1,445 | +15 | $ | 4,807 | $ | 3,987 | +21 | |||||||
Interest expense | 812 | 622 | +31 | 2,354 | 1,604 | +47 | |||||||||||
Net income | 153 | 216 | -29 | 523 | 429 | +22 | |||||||||||
The average balance of receivables and leases financed was 12 percent higher in the third quarter of 2024 and 16 percent higher in the first nine months of 2024 compared with the same periods last year. Revenue also increased due to higher average financing rates in both periods. Interest expense increased compared to both prior periods as a result of higher average borrowing rates and higher average borrowings. Financial services net income decreased in the third quarter of 2024 due to a higher provision for credit losses and less favorable financing spreads, partially offset by income earned on higher average portfolio balances and favorable discrete tax items. Excluding the impact of an accounting correction in the prior year, financial services net income decreased in the first nine months of 2024 due to a higher provision for credit losses and less favorable financing spreads, partially offset by income earned on higher average portfolio balances. Net income for the first nine months of 2023 was affected by a correction of the accounting treatment for financing incentives offered to John Deere dealers. The cumulative effect of this correction, $173 pretax ($135 after-tax), was recorded in the second quarter of 2023.
Critical Accounting Estimates
See our critical accounting estimates discussed in the Management’s Discussion and Analysis of the most recently filed Annual Report on Form 10-K. There have been no material changes to these policies.
Capital Resources and Liquidity – 2024 Compared with 2023
We have access to global markets at a reasonable cost. Sources of liquidity include:
| ● | cash, cash equivalents, and marketable securities on hand, |
| ● | funds from operations, |
| ● | the issuance of commercial paper and term debt, |
| ● | the securitization of retail notes, and |
| ● | bank lines of credit. |
We closely monitor our cash requirements. Based on the available sources of liquidity, we expect to meet our funding needs in the short term (next 12 months) and long term (beyond 12 months). We are forecasting lower operating cash flows from equipment operations in 2024 compared with 2023 driven by a decrease in net income adjusted for non-cash provisions and a reduction in accounts payable and accrued expenses.
We operate in multiple industries, which have unique funding requirements. The equipment operations are capital intensive. Historically, these operations have been subject to seasonal variations in financing requirements for inventories and receivables from dealers.
The financial services operations rely on their ability to raise substantial amounts of funds to finance their receivable and lease portfolios. Banco John Deere S.A. assets and liabilities were reclassified to held for sale in the third quarter of 2024 (see Note 21).
Key metrics are provided in the following table:
July 28 | October 29 | July 30 | ||||||||
2024 | 2023 | 2023 | ||||||||
Cash, cash equivalents, and marketable securities | $ | 8,144 | $ | 8,404 | $ | 7,417 | ||||
Trade accounts and notes receivable – net | 7,469 | 7,739 | 9,297 | |||||||
Ratio to prior 12 month’s net sales | 15% | 14% | 17% | |||||||
Inventories | 7,696 | 8,160 | 9,350 | |||||||
Ratio to prior 12 month’s cost of sales | 23% | 22% | 24% | |||||||
Unused credit lines | 4,917 | 841 | 950 | |||||||
Financial Services: | ||||||||||
Ratio of interest-bearing debt to stockholder’s equity | 8.5 to 1 | 8.4 to 1 | 8.1 to 1 | |||||||
33
In 2024, we invested $177 in U.S. dollar denominated bonds issued by the central bank of Argentina. The bonds are recorded in “Marketable securities,” classified as “International debt securities.” These bonds can be held until maturity or sold in a secondary market outside of Argentina to settle intercompany debt.
The increase in unused credit lines in 2024 compared to both prior periods relates to a decrease in commercial paper outstanding.
There have been no material changes to the contractual obligations and other cash requirements identified in our most recently filed Annual Report on Form 10-K.
Cash Flows
Nine Months Ended | |||||||
July 28, 2024 | July 30, 2023 | ||||||
Net cash provided by operating activities | $ | 4,139 | $ | 2,896 | |||
Net cash used for investing activities | (3,671) | (4,563) | |||||
Net cash provided by (used for) financing activities | (789) | 3,379 | |||||
Effect of exchange rate changes on cash, cash equivalents, and restricted cash | (6) | 125 | |||||
Net increase (decrease) in cash, cash equivalents, and restricted cash | $ | (327) | $ | 1,837 | |||
Cash inflows from consolidated operating activities in the first nine months of 2024 were $4,139. This resulted mainly from net income adjusted for non-cash provisions, partially offset by a working capital change. Included in the working capital change was a cash outflow of $1,015 from accounts payable and accrued expenses due to less trade payables consistent with our forecasted decrease in production and lower accrued expenses related to dealer sales discounts and employee benefits. Cash outflows from investing activities were $3,671 in the first nine months of this year. The primary drivers were growth in the retail customer receivable portfolio and equipment on operating leases and purchases of property and equipment. Cash outflows from financing activities were $789 in the first nine months of 2024, as cash returned to shareholders was partially offset by higher external borrowings. Cash returned to shareholders was $4,429 in the first nine months of 2024. Cash, cash equivalents, and restricted cash decreased $327 during the first nine months of 2024.
Key Metrics and Balance Sheet Changes
Trade Accounts and Notes Receivable. Trade accounts and notes receivable arise from sales of goods to customers. Trade receivables decreased $270 during the first nine months of 2024 and decreased $1,828 compared to a year ago, primarily due to lower sales volumes. The percentage of total worldwide trade receivables outstanding for periods exceeding 12 months was 3 percent at July 28, 2024, 1 percent at October 29, 2023, and 1 percent at July 30, 2023.
Financing Receivables and Equipment on Operating Leases. Financing receivables and equipment on operating leases consist of retail notes originated in connection with financing of new and used equipment, operating leases, revolving charge accounts, sales-type and direct financing leases, and wholesale notes. Financing receivables and equipment on operating leases increased $1,363 during the first nine months of 2024 and increased $4,276 in the past 12 months due to higher dealer inventory levels and an increase in the retail customer receivable portfolio, partially offset by the reclassification of Banco John Deere S.A. receivables to “Assets held for sale” in the third quarter of 2024 (see Note 21). Total acquisition volumes of financing receivables and equipment on operating leases were 8 percent higher in the first nine months of 2024, compared with the same period last year, as volumes of wholesale notes, operating leases, financing leases, and retail notes were higher, while revolving charge accounts were flat compared to July 30, 2023.
Inventories. Inventories decreased by $464 during the first nine months of 2024 and decreased by $1,654 compared to a year ago. The decreases were due to lower forecasted shipment volumes. A majority of these inventories are valued on the last-in, first out (LIFO) method.
Property and Equipment. Property and equipment cash expenditures in the first nine months of 2024 were $1,043 compared with $887 in the same period last year. Capital expenditures in 2024 are estimated to be approximately $1,850.
Accounts Payable and Accrued Expenses. Accounts payable and accrued expenses decreased by $1,733 in the first nine months of 2024, primarily due to decreased accounts payable associated with trade payables, and a decrease in accrued expenses associated with derivative liabilities, dealer sales discounts, and employee benefits. Accounts payable and accrued expenses decreased $943 compared to a year ago due to a decrease in accounts payable associated with trade payables and a decrease in accrued expenses associated with derivative liabilities, partially offset by an increase in extended warranty liabilities.
34
Borrowings. Total external borrowings increased by $2,444 in the first nine months of 2024 and increased $3,992 compared to a year ago, generally corresponding with the level of the receivable and lease portfolios, as well as other working capital requirements. The change in borrowings was also impacted by the reclassification of Banco John Deere S.A. borrowings to “Liabilities held for sale” in the third quarter of 2024 (see Note 21).
John Deere Capital Corporation (Capital Corporation), a U.S. financial services subsidiary, has a revolving warehouse facility to utilize bank conduit facilities to securitize retail notes (see Note 9). The facility was renewed in November 2023 with an expiration in November 2024 and with an increase in the total capacity or “financing limit” from $1,500 to $2,000. At July 28, 2024, $1,566 of securitization borrowings were outstanding under the facility. At the end of the contractual revolving period, unless the banks and Capital Corporation agree to renew, Capital Corporation would liquidate the secured borrowings over time as payments on the retail notes are collected.
In the first nine months of 2024, the financial services operations issued $3,722 and retired $2,849 of retail note securitization borrowings, which are presented in “Net proceeds (payments) in short-term borrowings (original maturities three months or less).”
Lines of Credit. We have access to bank lines of credit with various banks throughout the world.
Worldwide lines of credit totaled $10,930 at July 28, 2024, consisting primarily of:
| ● | a 364-day credit facility agreement of $5,000 expiring in the second quarter of 2025, |
| ● | a credit facility agreement of $2,750 expiring in the second quarter of 2028, and |
| ● | a credit facility agreement of $2,750 expiring in the second quarter of 2029. |
At July 28, 2024, $4,917 of these worldwide lines of credit were unused. For the purpose of computing unused credit lines, commercial paper and short-term bank borrowings were considered to constitute utilization. These credit agreements require Capital Corporation and other parts of our business to maintain certain performance metrics and liquidity targets. All requirements in the credit agreements have been met during the periods included in the financial statements.
Debt Ratings. To access public debt capital markets, we rely on credit rating agencies to assign short-term and long-term credit ratings to our debt securities as an indicator of credit quality for fixed income investors. A security rating is not a recommendation by the rating agency to buy, sell, or hold our securities. A credit rating agency may change or withdraw ratings based on its assessment of our current and future ability to meet interest and principal repayment obligations. Each agency’s rating should be evaluated independently of any other rating. Lower credit ratings generally result in higher borrowing costs, including costs of derivative transactions, and reduced access to debt capital markets. The senior long-term and short-term debt ratings and outlook currently assigned to unsecured company securities by the rating agencies engaged by us are as follows:
| Senior |
|
|
| |||
Long-Term | Short-Term | Outlook |
| ||||
Fitch Ratings | A+ | F1 | Stable | ||||
Moody’s Investors Service, Inc. |
| A1 |
| Prime-1 |
| Stable | |
Standard & Poor’s |
| A |
| A-1 |
| Stable |
FORWARD-LOOKING STATEMENTS
Certain statements contained herein, including in the section entitled “Overview” relating to future events, expectations, and trends constitute “forward-looking statements” as defined in the Private Securities Litigation Reform Act of 1995 and involve factors that are subject to change, assumptions, risks, and uncertainties that could cause actual results to differ materially. Some of these risks and uncertainties could affect all lines of our operations generally while others could more heavily affect a particular line of business.
Forward-looking statements are based on currently available information and current assumptions, expectations, and projections about future events and should not be relied upon. Except as required by law, we expressly disclaim any obligation to update or revise our forward-looking statements. Many factors, risks, and uncertainties could cause actual results to differ materially from these forward-looking statements. Among these factors are risks related to:
| ● | changes in and compliance with U.S., foreign and international laws, regulations, and policies relating to trade, economic sanctions, data privacy, spending, taxing, banking, monetary, environmental (including climate change and engine emissions), and farming policies; |
| ● | political, economic, and social instability of the geographies in which we operate, including the ongoing war between Russia and Ukraine and the conflict in the Middle East; |
| ● | adverse macroeconomic conditions, including unemployment, inflation, interest rate volatility, changes in consumer practices due to slower economic growth, and regional or global liquidity constraints; |
| ● | worldwide demand for food and different forms of renewable energy; |
35
| ● | the ability to execute business strategies, including our Smart Industrial Operating Model, Leap Ambitions, and mergers and acquisitions; |
| ● | the ability to understand and meet customers’ changing expectations and demand for John Deere products and solutions; |
| ● | accurately forecasting customer demand for products and services and adequately managing inventory; |
| ● | the ability to integrate new technology, including automation and machine learning, and deliver precision technology and solutions to customers; |
| ● | changes to governmental communications channels (radio frequency technology); |
| ● | the ability to adapt in highly competitive markets; |
| ● | dealer practices and their ability to manage inventory and distribution of John Deere products and to provide support and service precision technology solutions; |
| ● | changes in climate patterns, unfavorable weather events, and natural disasters; |
| ● | governmental and other actions designed to address climate change in connection with a transition to a lower-carbon economy; |
| ● | higher interest rates and currency fluctuations which could adversely affect the U.S. dollar, customer confidence, access to capital, and demand for John Deere products and solutions; |
| ● | availability and price of raw materials, components, and whole goods; |
| ● | delays or disruptions in our supply chain; |
| ● | our equipment fails to perform as expected, which could result in warranty claims, post-sales repairs or recalls, product liability litigation, and regulatory investigations; |
| ● | the ability to attract, develop, engage, and retain qualified employees; |
| ● | the impact of workforce reductions on employee retention, morale, and institutional knowledge; |
| ● | security breaches, cybersecurity attacks, technology failures, and other disruptions to John Deere information technology infrastructure and products; |
| ● | loss of or challenges to intellectual property rights; |
| ● | legislation introduced or enacted that could affect our business model and intellectual property, such as right to repair or right to modify legislation; |
| ● | investigations, claims, lawsuits, or other legal proceedings; |
| ● | events that damage our reputation or brand; |
| ● | the agricultural business cycle, which can be unpredictable and is affected by factors such as world grain stocks, available farm acres, acreage planted, soil conditions, harvest yields, prices for commodities and livestock, input costs, and availability of transport for crops; and |
| ● | housing starts and supply, real estate and housing prices, levels of public and non-residential construction, and infrastructure investment. |
Further information concerning us and our businesses, including factors that could materially affect our financial results, is included in our other filings with the SEC (including, but not limited to, the factors discussed in Item 1A. “Risk Factors” of our most recent Annual Report on Form 10-K and this Quarterly Report on Form 10-Q). There also may be other factors that we cannot anticipate or that are not described herein because we do not currently perceive them to be material.
SUPPLEMENTAL CONSOLIDATING DATA
The supplemental consolidating data presented on the subsequent pages is presented for informational purposes. Equipment operations represents the enterprise without financial services. Equipment operations includes production and precision agriculture operations, small agriculture and turf operations, construction and forestry operations, and other corporate assets, liabilities, revenues, and expenses not reflected within financial services. Transactions between the equipment operations and financial services have been eliminated to arrive at the consolidated financial statements.
Equipment operations and financial services participate in different industries. Equipment operations primarily generate earnings and cash flows by manufacturing and selling equipment, service parts, and technology solutions to dealers and retail customers. Financial services finances sales and leases by dealers of new and used equipment that is largely manufactured by equipment operations. Those earnings and cash flows generally are the difference between the finance income received from customer payments less interest expense, and depreciation on equipment subject to an operating lease. The two businesses are capitalized differently and have separate performance metrics. The supplemental consolidating data is also used by management due to these differences.
36
DEERE & COMPANY | ||||||||||||||||||||||||||
SUPPLEMENTAL CONSOLIDATING DATA | ||||||||||||||||||||||||||
STATEMENTS OF INCOME | ||||||||||||||||||||||||||
For the Three Months Ended July 28, 2024 and July 30, 2023 | ||||||||||||||||||||||||||
Unaudited | ||||||||||||||||||||||||||
EQUIPMENT | FINANCIAL | |||||||||||||||||||||||||
OPERATIONS | SERVICES | ELIMINATIONS | CONSOLIDATED |
| ||||||||||||||||||||||
2024 | 2023 | 2024 | 2023 | 2024 | 2023 | 2024 | 2023 |
| ||||||||||||||||||
Net Sales and Revenues |
|
|
|
|
|
|
|
|
|
|
|
| ||||||||||||||
Net sales | $ | 11,387 | $ | 14,284 | $ | 11,387 | $ | 14,284 | ||||||||||||||||||
Finance and interest income | 155 |
| 210 | $ | 1,537 | $ | 1,335 | $ | (231) | $ | (292) | 1,461 | 1,253 | 1 | ||||||||||||
Other income | 246 |
| 222 | 130 |
| 110 | (72) |
| (68) | 304 |
| 264 | 2, 3 | |||||||||||||
Total | 11,788 |
| 14,716 | 1,667 |
| 1,445 | (303) |
| (360) | 13,152 |
| 15,801 | ||||||||||||||
Costs and Expenses | ||||||||||||||||||||||||||
Cost of sales | 7,855 |
| 9,630 | (7) |
| (6) | 7,848 | 9,624 | 4 | |||||||||||||||||
Research and development expenses | 567 |
| 528 | 567 | 528 | |||||||||||||||||||||
Selling, administrative and general expenses | 962 |
| 913 | 318 |
| 199 | (2) |
| (2) | 1,278 |
| 1,110 | 4 | |||||||||||||
Interest expense | 91 |
| 94 | 812 |
| 622 | (63) |
| (93) | 840 |
| 623 | 1 | |||||||||||||
Interest compensation to Financial Services | 168 |
| 199 | (168) |
| (199) |
|
| 1 | |||||||||||||||||
Other operating expenses | (16) |
| 34 | 343 |
| 336 | (63) |
| (60) | 264 |
| 310 | 3, 5 | |||||||||||||
Total | 9,627 |
| 11,398 | 1,473 |
| 1,157 | (303) |
| (360) | 10,797 |
| 12,195 | ||||||||||||||
Income before Income Taxes | 2,161 |
| 3,318 | 194 |
| 288 |
|
|
| 2,355 |
| 3,606 | ||||||||||||||
Provision for income taxes | 583 |
| 564 | 42 |
| 72 |
|
|
| 625 |
| 636 | ||||||||||||||
Income after Income Taxes | 1,578 |
| 2,754 | 152 |
| 216 |
|
|
| 1,730 |
| 2,970 | ||||||||||||||
Equity in income of unconsolidated affiliates |
|
| 2 | 1 |
|
| 1 | 2 | ||||||||||||||||||
Net Income | 1,578 |
| 2,756 | 153 |
| 216 |
|
|
| 1,731 |
| 2,972 | ||||||||||||||
Less: Net loss attributable to noncontrolling interests | (3) |
| (6) |
|
|
|
| (3) | (6) | |||||||||||||||||
Net Income Attributable to Deere & Company | $ | 1,581 | $ | 2,762 | $ | 153 | $ | 216 |
|
| $ | 1,734 | $ | 2,978 | ||||||||||||
1 Elimination of intercompany interest income and expense.
2 Elimination of equipment operations’ margin from inventory transferred to equipment on operating leases.
3 Elimination of income and expenses between equipment operations and financial services related to intercompany guarantees of investments in certain international markets and intercompany service revenues and expenses.
4 Elimination of intercompany service fees.
5 Elimination of financial services’ lease depreciation expense related to inventory transferred to equipment on operating leases.
37
DEERE & COMPANY | ||||||||||||||||||||||||||
SUPPLEMENTAL CONSOLIDATING DATA (Continued) | ||||||||||||||||||||||||||
STATEMENTS OF INCOME | ||||||||||||||||||||||||||
For the Nine Months Ended July 28, 2024 and July 30, 2023 | ||||||||||||||||||||||||||
Unaudited | ||||||||||||||||||||||||||
EQUIPMENT | FINANCIAL | |||||||||||||||||||||||||
OPERATIONS | SERVICES | ELIMINATIONS | CONSOLIDATED |
| ||||||||||||||||||||||
2024 | 2023 | 2024 | 2023 | 2024 | 2023 | 2024 | 2023 |
| ||||||||||||||||||
Net Sales and Revenues |
|
|
|
|
|
|
|
|
| |||||||||||||||||
Net sales | $ | 35,484 | $ | 41,765 | $ | 35,484 | $ | 41,765 | ||||||||||||||||||
Finance and interest income | 441 |
| 444 | $ | 4,466 | $ | 3,609 | $ | (700) | $ | (727) | 4,207 | 3,326 | 1 | ||||||||||||
Other income | 732 |
| 639 | 341 |
| 378 | (192) |
| (269) | 881 |
| 748 | 2, 3 | |||||||||||||
Total | 36,657 |
| 42,848 | 4,807 |
| 3,987 | (892) |
| (996) | 40,572 |
| 45,839 | ||||||||||||||
Costs and Expenses | ||||||||||||||||||||||||||
Cost of sales | 24,226 |
| 28,306 | (21) |
| (18) | 24,205 | 28,288 | 4 | |||||||||||||||||
Research and development expenses | 1,664 |
| 1,571 | 1,664 | 1,571 | |||||||||||||||||||||
Selling, administrative and general expenses | 2,844 |
| 2,630 | 771 |
| 769 | (7) |
| (7) | 3,608 |
| 3,392 | 4 | |||||||||||||
Interest expense | 314 |
| 298 | 2,354 |
| 1,604 | (190) |
| (231) | 2,478 |
| 1,671 | 1 | |||||||||||||
Interest compensation to Financial Services | 510 |
| 496 | (510) |
| (496) |
|
| 1 | |||||||||||||||||
Other operating expenses | 76 |
| 172 | 1,018 |
| 1,043 | (164) |
| (244) | 930 |
| 971 | 3, 5 | |||||||||||||
Total | 29,634 |
| 33,473 | 4,143 |
| 3,416 | (892) |
| (996) | 32,885 |
| 35,893 | ||||||||||||||
Income before Income Taxes | 7,023 |
| 9,375 | 664 |
| 571 |
|
|
| 7,687 |
| 9,946 | ||||||||||||||
Provision for income taxes | 1,700 |
| 2,020 | 145 |
| 144 |
|
|
| 1,845 |
| 2,164 | ||||||||||||||
Income after Income Taxes | 5,323 |
| 7,355 | 519 |
| 427 |
|
|
| 5,842 |
| 7,782 | ||||||||||||||
Equity in income of unconsolidated affiliates |
|
| 3 | 4 |
| 2 | 4 | 5 | ||||||||||||||||||
Net Income | 5,323 |
| 7,358 | 523 |
| 429 |
|
|
| 5,846 |
| 7,787 | ||||||||||||||
Less: Net loss attributable to noncontrolling interests | (9) |
| (10) |
|
|
| (9) | (10) | ||||||||||||||||||
Net Income Attributable to Deere & Company | $ | 5,332 | $ | 7,368 | $ | 523 | $ | 429 |
|
| $ | 5,855 | $ | 7,797 | ||||||||||||
1 Elimination of intercompany interest income and expense.
2 Elimination of equipment operations’ margin from inventory transferred to equipment on operating leases.
3 Elimination of income and expenses between equipment operations and financial services related to intercompany guarantees of investments in certain international markets and intercompany service revenues and expenses.
4 Elimination of intercompany service fees.
5 Elimination of financial services’ lease depreciation expense related to inventory transferred to equipment on operating leases.
38
DEERE & COMPANY | ||||||||||||||||||||||||||||||||||||||
SUPPLEMENTAL CONSOLIDATING DATA (Continued) | ||||||||||||||||||||||||||||||||||||||
CONDENSED BALANCE SHEETS | ||||||||||||||||||||||||||||||||||||||
Unaudited | ||||||||||||||||||||||||||||||||||||||
EQUIPMENT | FINANCIAL | |||||||||||||||||||||||||||||||||||||
OPERATIONS | SERVICES | ELIMINATIONS | CONSOLIDATED | |||||||||||||||||||||||||||||||||||
Jul 28 | Oct 29 | Jul 30 | Jul 28 | Oct 29 | Jul 30 | Jul 28 | Oct 29 | Jul 30 | Jul 28 | Oct 29 | Jul 30 | |||||||||||||||||||||||||||
2024 | 2023 | 2023 | 2024 | 2023 | 2023 | 2024 | 2023 | 2023 | 2024 | 2023 | 2023 | |||||||||||||||||||||||||||
Assets |
|
|
|
|
|
|
|
|
|
|
|
|
|
|
|
|
|
|
|
|
|
|
|
|
|
|
|
|
|
|
|
|
|
|
|
| ||
Cash and cash equivalents | $ | 5,385 | $ | 5,720 | $ | 4,858 | $ | 1,619 | $ | 1,738 | $ | 1,718 |
|
|
| $ | 7,004 | $ | 7,458 | $ | 6,576 | |||||||||||||||||
Marketable securities | 155 |
| 104 |
| 3 | 985 |
| 842 |
| 838 |
|
|
|
|
| 1,140 |
| 946 |
| 841 | ||||||||||||||||||
Receivables from Financial Services | 3,951 |
| 4,516 |
| 5,312 | $ | (3,951) | $ | (4,516) | $ | (5,312) |
|
|
| 6 | |||||||||||||||||||||||
Trade accounts and notes receivable – net | 1,150 |
| 1,320 |
| 1,589 | 8,890 |
| 8,687 |
| 9,991 | (2,571) |
| (2,268) |
| (2,283) | 7,469 |
| 7,739 |
| 9,297 | 7 | |||||||||||||||||
Financing receivables – net | 82 |
| 64 |
| 60 | 43,814 |
| 43,609 |
| 41,242 |
|
|
|
|
| 43,896 |
| 43,673 |
| 41,302 | ||||||||||||||||||
Financing receivables securitized – net | 2 |
|
| 8,272 |
| 7,335 |
| 7,001 |
|
|
|
|
| 8,274 |
| 7,335 |
| 7,001 | ||||||||||||||||||||
Other receivables | 1,821 |
| 1,813 |
| 2,599 | 494 |
| 869 |
| 599 | (45) |
| (59) |
| (80) | 2,270 |
| 2,623 |
| 3,118 | 7 | |||||||||||||||||
Equipment on operating leases – net | 7,118 |
| 6,917 |
| 6,709 |
|
|
|
|
| 7,118 |
| 6,917 |
| 6,709 | |||||||||||||||||||||||
Inventories | 7,696 |
| 8,160 |
| 9,350 |
|
|
| 7,696 | 8,160 | 9,350 | |||||||||||||||||||||||||||
Property and equipment – net | 7,058 |
| 6,843 |
| 6,385 | 34 |
| 36 |
| 33 |
|
|
|
|
| 7,092 |
| 6,879 |
| 6,418 | ||||||||||||||||||
Goodwill | 3,960 |
| 3,900 |
| 3,994 |
|
|
| 3,960 | 3,900 | 3,994 | |||||||||||||||||||||||||||
Other intangible assets – net | 1,030 |
| 1,133 |
| 1,199 |
|
|
|
|
|
|
| 1,030 |
| 1,133 |
| 1,199 | |||||||||||||||||||||
Retirement benefits | 3,047 |
| 2,936 |
| 3,503 | 80 |
| 72 |
| 71 | (1) |
| (1) |
| (1) | 3,126 |
| 3,007 |
| 3,573 | 8 | |||||||||||||||||
Deferred income taxes | 2,192 |
| 2,133 |
| 1,393 | 35 |
| 68 |
| 65 | (329) |
| (387) |
| (98) | 1,898 |
| 1,814 |
| 1,360 | 9 | |||||||||||||||||
Other assets | 2,236 |
| 1,948 |
| 2,083 | 675 |
| 559 |
| 583 | (8) |
| (4) |
| (7) | 2,903 |
| 2,503 |
| 2,659 | ||||||||||||||||||
Assets held for sale |
|
|
|
| 2,965 |
|
|
|
|
| 2,965 |
|
| |||||||||||||||||||||||||
Total Assets | $ | 39,765 | $ | 40,590 | $ | 42,328 | $ | 74,981 | $ | 70,732 | $ | 68,850 | $ | (6,905) | $ | (7,235) | $ | (7,781) | $ | 107,841 | $ | 104,087 | $ | 103,397 | ||||||||||||||
Liabilities and Stockholders’ Equity | ||||||||||||||||||||||||||||||||||||||
Liabilities | ||||||||||||||||||||||||||||||||||||||
Short-term borrowings | $ | 983 | $ | 1,230 | $ | 1,773 | $ | 14,311 | $ | 16,709 | $ | 15,370 |
|
|
| $ | 15,294 | $ | 17,939 | $ | 17,143 | |||||||||||||||||
Short-term securitization borrowings | 1 |
|
| 7,868 |
| 6,995 |
| 6,608 |
|
|
|
|
| 7,869 |
| 6,995 |
| 6,608 | ||||||||||||||||||||
Payables to Equipment Operations |
|
|
|
|
| 3,951 |
| 4,516 |
| 5,312 | $ | (3,951) | $ | (4,516) | $ | (5,312) |
|
|
|
|
| 6 | ||||||||||||||||
Accounts payable and accrued expenses | 13,880 |
| 14,862 |
| 14,403 | 3,141 |
| 3,599 |
| 3,307 | (2,624) |
| (2,331) |
| (2,370) | 14,397 |
| 16,130 |
| 15,340 | 7 | |||||||||||||||||
Deferred income taxes | 420 |
| 452 |
| 420 | 390 |
| 455 |
| 184 | (329) |
| (387) |
| (98) | 481 |
| 520 |
| 506 | 9 | |||||||||||||||||
Long-term borrowings | 6,592 |
| 7,210 |
| 7,299 | 36,100 |
| 31,267 |
| 30,813 |
|
|
|
|
| 42,692 |
| 38,477 |
| 38,112 | ||||||||||||||||||
Retirement benefits and other liabilities | 2,048 |
| 2,032 |
| 2,423 | 109 |
| 109 |
| 114 | (1) |
| (1) |
| (1) | 2,156 |
| 2,140 |
| 2,536 | 8 | |||||||||||||||||
Liabilities held for sale |
|
|
|
| 1,803 |
|
|
|
|
| 1,803 |
|
| |||||||||||||||||||||||||
Total liabilities | 23,924 | 25,786 | 26,318 | 67,673 | 63,650 | 61,708 | (6,905) | (7,235) | (7,781) | 84,692 | 82,201 | 80,245 | ||||||||||||||||||||||||||
Commitments and contingencies (Note 16) | ||||||||||||||||||||||||||||||||||||||
Redeemable noncontrolling interest | 84 | 97 | 101 |
|
|
|
|
|
| 84 | 97 | 101 | ||||||||||||||||||||||||||
Stockholders’ Equity | ||||||||||||||||||||||||||||||||||||||
Total Deere & Company stockholders’ equity | 23,062 |
| 21,785 |
| 23,048 | 7,308 | 7,082 | 7,142 | (7,308) | (7,082) | (7,142) | 23,062 | 21,785 | 23,048 | 10 | |||||||||||||||||||||||
Noncontrolling interests | 3 |
| 4 |
| 3 |
|
|
|
|
|
| 3 | 4 | 3 | ||||||||||||||||||||||||
Financial Services’ equity | (7,308) |
| (7,082) |
| (7,142) |
|
|
| 7,308 | 7,082 | 7,142 |
|
|
| 10 | |||||||||||||||||||||||
Adjusted total stockholders’ equity | 15,757 |
| 14,707 |
| 15,909 | 7,308 |
| 7,082 |
| 7,142 |
|
|
|
|
| 23,065 |
| 21,789 |
| 23,051 | ||||||||||||||||||
Total Liabilities and Stockholders’ Equity | $ | 39,765 | $ | 40,590 | $ | 42,328 | $ | 74,981 | $ | 70,732 | $ | 68,850 | $ | (6,905) | $ | (7,235) | $ | (7,781) | $ | 107,841 | $ | 104,087 | $ | 103,397 | ||||||||||||||
6 Elimination of receivables / payables between equipment operations and financial services.
7 Primarily reclassification of sales incentive accruals on receivables sold to financial services.
8 Reclassification of net pension assets / liabilities.
9 Reclassification of deferred tax assets / liabilities in the same taxing jurisdictions.
10 Elimination of financial services’ equity.
39
DEERE & COMPANY | ||||||||||||||||||||||||||
SUPPLEMENTAL CONSOLIDATING DATA (Continued) | ||||||||||||||||||||||||||
STATEMENTS OF CASH FLOWS | ||||||||||||||||||||||||||
For the Nine Months Ended July 28, 2024 and July 30, 2023 | ||||||||||||||||||||||||||
Unaudited | ||||||||||||||||||||||||||
EQUIPMENT | FINANCIAL | |||||||||||||||||||||||||
OPERATIONS | SERVICES | ELIMINATIONS | CONSOLIDATED | |||||||||||||||||||||||
2024 | 2023 | 2024 | 2023 | 2024 | 2023 | 2024 | 2023 | |||||||||||||||||||
Cash Flows from Operating Activities |
|
|
|
|
|
|
|
|
|
|
|
|
|
|
|
|
| |||||||||
Net income | $ | 5,323 | $ | 7,358 | $ | 523 | $ | 429 |
|
| $ | 5,846 | $ | 7,787 | ||||||||||||
Adjustments to reconcile net income to net cash provided by operating activities: | ||||||||||||||||||||||||||
Provision (credit) for credit losses |
| 10 |
| 3 |
| 212 |
| (67) |
|
|
|
|
| 222 |
| (64) | ||||||||||
Provision for depreciation and amortization |
| 932 |
| 872 |
| 773 |
| 757 | $ | (107) | $ | (102) |
| 1,598 |
| 1,527 | 11 | |||||||||
Impairments and other adjustments |
|
|
|
| 53 |
| 173 |
|
|
|
|
| 53 |
| 173 | |||||||||||
Share-based compensation expense |
|
|
|
| 159 | 112 | 159 | 112 | 12 | |||||||||||||||||
Distributed earnings of Financial Services |
| 250 |
| 31 |
|
|
|
|
| (250) |
| (31) |
|
|
|
| 13 | |||||||||
Credit for deferred income taxes |
| (49) |
| (322) |
| (76) |
| (107) |
|
|
|
|
| (125) |
| (429) | ||||||||||
Changes in assets and liabilities: | ||||||||||||||||||||||||||
Receivables related to sales |
| 106 |
| (293) |
|
| (2,552) | (4,766) | (2,446) | (5,059) | 14, 16 | |||||||||||||||
Inventories |
| 391 |
| (534) |
|
| (157) | (129) | 234 | (663) | 15 | |||||||||||||||
Accounts payable and accrued expenses |
| (924) |
| 730 |
| 212 |
| 303 |
| (303) |
| (986) |
| (1,015) |
| 47 | 16 | |||||||||
Accrued income taxes payable/receivable |
| 13 |
| (619) |
| 18 |
| 24 |
|
|
|
|
| 31 |
| (595) | ||||||||||
Retirement benefits |
| (241) |
| (115) |
| (5) |
| (1) |
|
|
|
|
| (246) |
| (116) | ||||||||||
Other |
| (109) |
| 247 |
| 44 |
| (15) |
| (107) |
| (56) |
| (172) |
| 176 | 11, 12, 15 | |||||||||
Net cash provided by operating activities |
| 5,702 |
| 7,358 |
| 1,754 |
| 1,496 |
| (3,317) |
| (5,958) |
| 4,139 |
| 2,896 | ||||||||||
Cash Flows from Investing Activities | ||||||||||||||||||||||||||
Collections of receivables (excluding receivables related to sales) |
|
|
| 19,826 |
| 18,440 |
| (683) |
| (848) |
| 19,143 |
| 17,592 | 14 | |||||||||||
Proceeds from maturities and sales of marketable securities |
| 56 |
| 68 |
| 277 |
| 59 |
|
|
|
|
| 333 |
| 127 | ||||||||||
Proceeds from sales of equipment on operating leases |
|
|
| 1,451 |
| 1,445 |
|
|
|
|
| 1,451 |
| 1,445 | ||||||||||||
Cost of receivables acquired (excluding receivables related to sales) |
|
|
| (21,395) |
| (21,043) |
| 282 |
| 329 |
| (21,113) |
| (20,714) | 14 | |||||||||||
Purchases of marketable securities | (220) |
| (19) |
| (352) |
| (194) |
|
|
|
|
| (572) |
| (213) | |||||||||||
Purchases of property and equipment |
| (1,041) |
| (885) |
| (2) |
| (2) |
|
|
|
|
| (1,043) |
| (887) | ||||||||||
Cost of equipment on operating leases acquired |
|
|
| (2,377) |
| (2,143) |
| 212 |
| 175 |
| (2,165) |
| (1,968) | 15 | |||||||||||
Decrease (increase) in investment in Financial Services | 11 | (811) |
|
|
|
|
| (11) |
| 811 |
|
|
|
| 17 | |||||||||||
Increase in trade and wholesale receivables |
|
|
| (3,255) |
| (6,270) |
| 3,255 |
| 6,270 |
|
|
|
| 14 | |||||||||||
Collateral on derivatives – net |
|
| 390 | 240 |
|
| 390 | 240 | ||||||||||||||||||
Other |
| (88) |
| (210) |
| (8) |
| 24 |
| 1 |
| 1 |
| (95) |
| (185) | ||||||||||
Net cash used for investing activities |
| (1,282) |
| (1,857) |
| (5,445) |
| (9,444) |
| 3,056 |
| 6,738 |
| (3,671) |
| (4,563) | ||||||||||
Cash Flows from Financing Activities | ||||||||||||||||||||||||||
Net proceeds (payments) in short-term borrowings (original maturities three months or less) |
| 81 |
| (152) |
| (1,073) |
| 5,192 |
|
|
|
|
| (992) |
| 5,040 | ||||||||||
Change in intercompany receivables/payables |
| 558 |
| 1,476 |
| (558) |
| (1,476) |
|
|
|
|
|
|
|
| ||||||||||
Proceeds from borrowings issued (original maturities greater than three months) |
| 115 |
| 60 |
| 15,397 |
| 9,912 |
|
|
|
|
| 15,512 |
| 9,972 | ||||||||||
Payments of borrowings (original maturities greater than three months) |
| (1,061) |
| (116) |
| (9,731) |
| (5,746) |
|
|
|
|
| (10,792) |
| (5,862) | ||||||||||
Repurchases of common stock |
| (3,227) |
| (4,663) |
|
|
|
| (3,227) | (4,663) | ||||||||||||||||
Capital investment from Equipment Operations |
|
|
| (11) | 811 | 11 | (811) |
|
| 17 | ||||||||||||||||
Dividends paid |
| (1,202) |
| (1,065) |
| (250) | (31) |
| 250 | 31 |
| (1,202) | (1,065) | 13 | ||||||||||||
Other |
| (37) |
| 4 |
| (51) |
| (47) |
|
|
|
|
| (88) |
| (43) | ||||||||||
Net cash provided by (used for) financing activities |
| (4,773) |
| (4,456) |
| 3,723 |
| 8,615 |
| 261 |
| (780) |
| (789) |
| 3,379 | ||||||||||
Effect of Exchange Rate Changes on Cash, Cash Equivalents, and Restricted Cash |
| 12 |
| 108 |
| (18) |
| 17 |
|
|
|
|
| (6) |
| 125 | ||||||||||
Net Increase (Decrease) in Cash, Cash Equivalents, and Restricted Cash |
| (341) |
| 1,153 |
| 14 |
| 684 |
|
|
|
|
| (327) |
| 1,837 | ||||||||||
Cash, Cash Equivalents, and Restricted Cash at Beginning of Period |
| 5,755 |
| 3,781 |
| 1,865 |
| 1,160 |
|
|
|
|
| 7,620 |
| 4,941 | ||||||||||
Cash, Cash Equivalents, and Restricted Cash at End of Period | $ | 5,414 | $ | 4,934 | $ | 1,879 | $ | 1,844 |
|
| $ | 7,293 | $ | 6,778 | ||||||||||||
Components of Cash, Cash Equivalents, and Restricted Cash | ||||||||||||||||||||||||||
Cash and cash equivalents | $ | 5,385 | $ | 4,858 | $ | 1,619 | $ | 1,718 |
|
| $ | 7,004 | $ | 6,576 | ||||||||||||
Cash, cash equivalents, and restricted cash (Assets held for sale) | 108 | 108 | ||||||||||||||||||||||||
Restricted cash (Other assets) | 29 | 76 | 152 | 126 | 181 | 202 | ||||||||||||||||||||
Total Cash, Cash Equivalents, and Restricted Cash | $ | 5,414 | $ | 4,934 | $ | 1,879 | $ | 1,844 |
|
| $ | 7,293 | $ | 6,778 | ||||||||||||
11 Elimination of depreciation on leases related to inventory transferred to equipment on operating leases.
12 Reclassification of share-based compensation expense.
13 Elimination of dividends from financial services to the equipment operations, which are included in the equipment operations’ operating activities.
14 Primarily reclassification of receivables related to the sale of equipment.
15 Reclassification of direct lease agreements with retail customers.
16 Reclassification of sales incentive accruals on receivables sold to financial services.
17 Elimination of change in investment from equipment operations to financial services.
40
Item 3.QUANTITATIVE AND QUALITATIVE DISCLOSURES ABOUT MARKET RISK
See our most recently filed Annual Report on Form 10-K (Part II, Item 7A). There have been no material changes in this information.
Item 4.CONTROLS AND PROCEDURES
Our principal executive officer and principal financial officer have concluded that our disclosure controls and procedures (as defined in Rules 13a-15(e) and 15d-15(e) of the Securities Exchange Act of 1934, as amended (the Exchange Act)) were effective as of July 28, 2024, based on the evaluation of these controls and procedures required by Rule 13a-15(b) or 15d-15(b) of the Exchange Act. During the third quarter of 2024, there were no changes that have materially affected or are reasonably likely to materially affect our internal control over financial reporting.
PART II. OTHER INFORMATION
Item 1.Legal Proceedings
We are subject to various unresolved legal actions, the most prevalent of which relate to product liability (including asbestos-related liability), retail credit, employment, patent, trademark, and antitrust matters. We believe the reasonably possible range of losses for these unresolved legal actions would not have a material effect on our consolidated financial statements.
Item 1A.Risk Factors
See our most recently filed Annual Report on Form 10-K (Part I, Item 1A). The risks described in the Annual Report on Form 10-K, and the “Forward-Looking Statements” in this report, are not the only risks we face. Additional risks and uncertainties may also materially affect our business, financial condition, or operating results. One should not consider the risk factors to be a complete discussion of risks, uncertainties, and assumptions.
Item 2.Unregistered Sales of Equity Securities and Use of Proceeds
Issuer Purchases of Equity Securities
Purchases of our common stock during the third quarter of 2024 were as follows:
|
| Total Number of |
|
|
| ||||||
Shares Purchased as | Maximum Number of |
|
| ||||||||
Total Number of | Part of Publicly | Shares that May Yet Be |
|
| |||||||
Shares | Announced Plans or | Purchased under the |
|
| |||||||
Purchased | Average Price | Programs (1) | Plans or Programs (1) |
|
| ||||||
Period | (thousands) | Per Share | (thousands) | (millions) |
|
| |||||
Apr 29 to May 26 | 900 |
| $ | 403.24 | 900 | 26.3 | |||||
May 27 to Jun 23 | 659 | 375.46 | 659 | 25.7 | |||||||
Jun 24 to Jul 28 | 537 | 375.06 | 537 | 25.2 | |||||||
Total | 2,096 | 2,096 | |||||||||
| (1) | We have a share repurchase plan that was announced in December 2022 to purchase up to $18.0 billion of shares of our common stock. The maximum number of shares that may yet be purchased under this plan was 25.2 million based on the closing price of our common stock on the New York Stock Exchange as of the end of the third quarter of 2024 of $386.55 per share. At the end of the third quarter of 2024, $9.7 billion of common stock remained to be purchased under this plan. |
41
Item 3.Defaults Upon Senior Securities
None.
Item 4.Mine Safety Disclosures
Not applicable.
Item 5.Other Information
Item 6.Exhibits
Certain instruments relating to long-term borrowings constituting less than 10 percent of the registrant’s total assets are not filed as exhibits herewith pursuant to Item 601(b)(4)(iii)(A) of Regulation S-K. The registrant will furnish copies of such instruments to the Commission upon request of the Commission.
3.1 | |
3.2 | |
31.1 | |
31.2 | |
32 | |
101.INS | Inline XBRL Instance Document (the instance document does not appear in the Interactive Data File because its XBRL tags are embedded within the Inline XBRL document) |
101.SCH | Inline XBRL Taxonomy Extension Schema Document |
101.CAL | Inline XBRL Taxonomy Extension Calculation Linkbase Document |
101.DEF | Inline XBRL Taxonomy Extension Definition Linkbase Document |
101.LAB | Inline XBRL Taxonomy Extension Label Linkbase Document |
101.PRE | Inline XBRL Taxonomy Extension Presentation Linkbase Document |
104 | Cover Page Interactive Data File (formatted as Inline XBRL and contained in Exhibit 101) |
* Incorporated by reference.
42
SIGNATURES
Pursuant to the requirements of the Securities Exchange Act of 1934, the registrant has duly caused this report to be signed on its behalf by the undersigned thereunto duly authorized.
DEERE & COMPANY | ||||
Date: | August 29, 2024 | By: | /s/ Joshua A. Jepsen | |
Joshua A. Jepsen (Principal Financial Officer and Principal Accounting Officer) | ||||
43