Item 2.MANAGEMENT’S DISCUSSION AND ANALYSIS OF FINANCIAL CONDITION AND RESULTS OF OPERATIONS
RESULTS OF OPERATIONS
All amounts are presented in millions of dollars unless otherwise specified.
Overview
Organization
Deere & Company is a global leader in the production of agricultural, turf, construction, and forestry equipment and solutions. John Deere Financial provides financing for John Deere equipment, parts, services, and other input costs customers need to run their operations. Our operations are managed through the production and precision agriculture (PPA), small agriculture and turf (SAT), construction and forestry (CF), and financial services operating segments. References to “equipment operations” include PPA, SAT, and CF, while references to “agriculture and turf” include both PPA and SAT.
Smart Industrial Operating Model and Leap Ambitions
We announced the Smart Industrial Operating Model in 2020. This operating model is based on three focus areas:
(a) | Production systems: A strategic alignment of products and solutions around our customers’ operations. |
(b) | Technology stack: Investments in technology, as well as research and development, that deliver intelligent solutions to our customers through digital capabilities, automation, autonomy, and alternative power technologies. |
(c) | Lifecycle solutions: The integration of our aftermarket and support capabilities to more effectively manage customer equipment, service, and technology needs across the full lifetime of a John Deere product. |
Our Leap Ambitions were launched in 2022. These ambitions are designed to boost economic value and sustainability for our customers. The ambitions align across our customers’ production systems seeking to optimize their operations to deliver better outcomes with fewer resources.
Trends and Economic Conditions
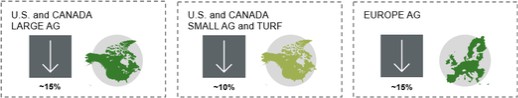
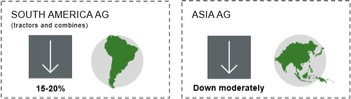
Industry Sales Outlook for Fiscal Year 2024
Agriculture and Turf
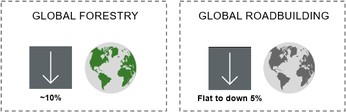
Construction and Forestry

Company Trends
Customers seek to improve profitability, productivity, and sustainability through technology. Integration of technology into equipment is a persistent market trend. Our Smart Industrial Operating Model and Leap Ambitions are intended to capitalize on this market trend. These technologies are incorporated into products within each of our operating segments. We expect this trend to persist for the foreseeable future. Our progress is demonstrated, in part, by the growing use of the John Deere Operations Center (our digital operations management system) engaging more agricultural acres globally. Engaged acres give us a foundational understanding of customer utilization of John Deere technology. The investments in these technologies and establishing a Solutions as a Service business model may increase our operating costs and decrease operating margins during the transition period.
Company Outlook for 2024
Production volumes are expected to continue to decline during the remainder of 2024 due to demand shifts amid challenges in the global agricultural and turf sectors coupled with proactive production and inventory management while the construction industry remains relatively stable.
25