|
|
|
|
(Filed herewith) |
NEWS RELEASE
Contact:
Ken Golden
Director, Global Public Relations
309-765-5678
Deere Announces Record First-Quarter Earnings of $681 Million
§ Income for quarter climbs 5%; earnings per share up 10%.
§ Improvement broad-based with all divisions reporting higher income.
§ Results reflect solid execution and successful cost management.
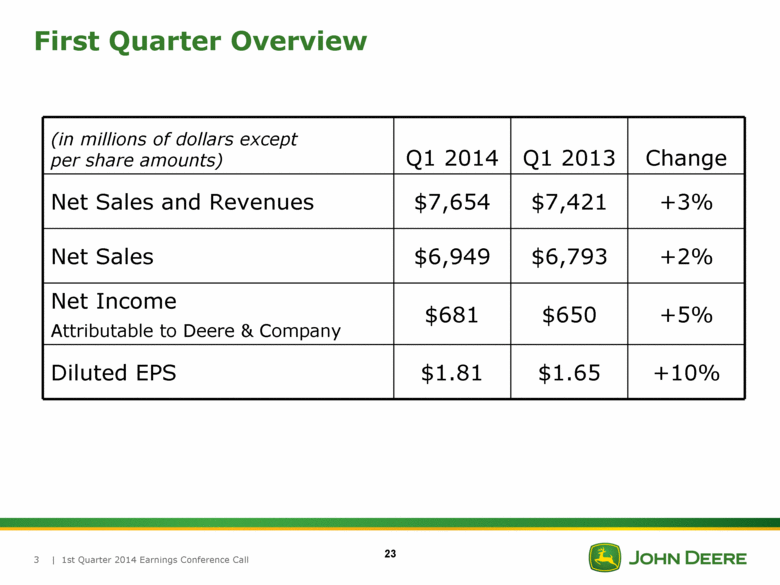
MOLINE, Illinois (February 12, 2014) — Net income attributable to Deere & Company was $681.1 million, or $1.81 per share, for the first quarter ended January 31, compared with $649.7 million, or $1.65 per share, for the same period last year.
Worldwide net sales and revenues for the first quarter increased 3 percent, to $7.654 billion, compared with $7.421 billion last year. Net sales of the equipment operations were $6.949 billion for the quarter compared with $6.793 billion a year ago.
“With another record quarter, John Deere has started 2014 on a strong note,” said Samuel R. Allen, chairman and chief executive officer. “Our results demonstrate the adept execution of our operating and marketing plans, which are aimed at expanding our global market position and helping our customers throughout the world be more profitable and productive,” he said. “In addition, we are seeing further benefit from efforts to hold the line on costs.”
Summary of Operations
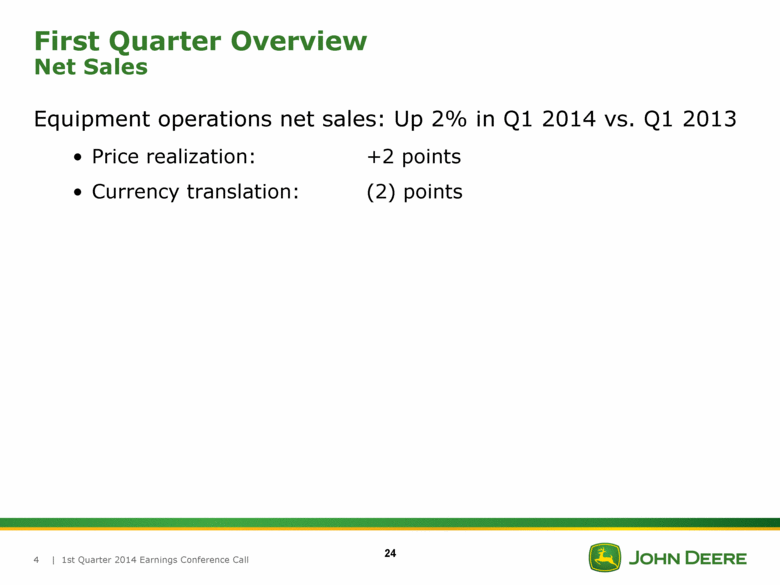
Net sales of the worldwide equipment operations increased 2 percent for the quarter. Sales included price increases of 2 percent and an unfavorable currency-translation effect of 2 percent. Equipment net sales in the United States and Canada rose 3 percent for the quarter. Outside the U.S. and Canada, net sales increased 2 percent, including an unfavorable currency-translation effect of 3 percent.
Deere’s equipment operations reported operating profit of $891 million for the quarter, compared with $837 million last year. Results benefited from price realization, partially
|
Deere Announces First-Quarter Earnings |
|
|
offset by a less favorable product mix and the unfavorable effects of foreign-currency exchange.
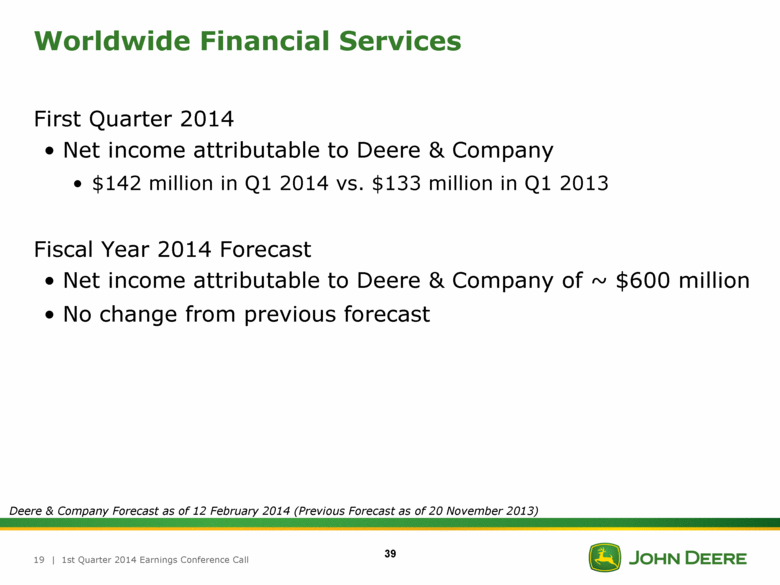
Financial services reported net income attributable to Deere & Company of $142.2 million for the quarter compared with $132.9 million last year. The improvement was primarily related to growth in the credit portfolio and a more favorable effective tax rate. These factors were partially offset by lower crop insurance margins, increased selling, administrative and general expenses and less favorable financing spreads.
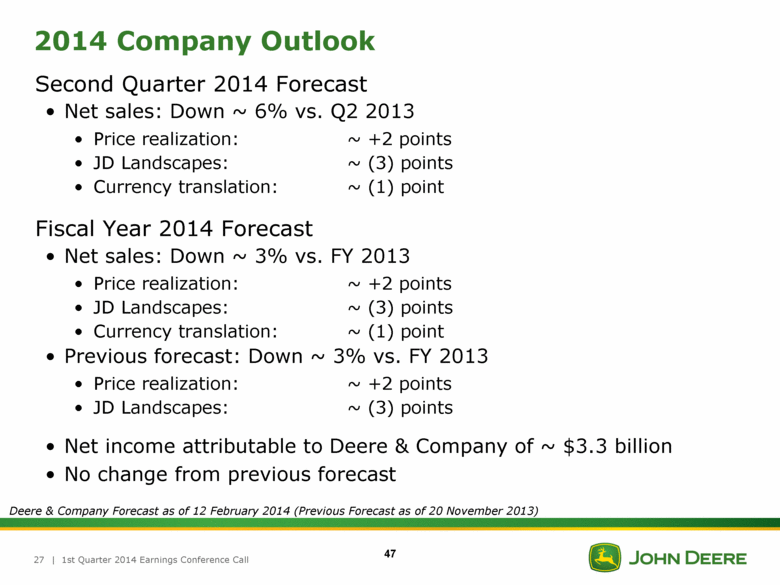
Company Outlook & Summary
Company equipment sales are projected to decrease about 3 percent for fiscal 2014 and be down about 6 percent for the second quarter compared with the same periods of 2013. For the full year, net income attributable to Deere & Company is anticipated to be approximately $3.3 billion.
“Even in the face of moderating demand for agricultural equipment, Deere is well-positioned to deliver solid performance,” said Allen. “We believe that our extensive investments in new products and new markets will provide strong support to our results and keep our strategic plans moving ahead.” These plans are essential to helping meet the world’s growing need for food, shelter and infrastructure, Allen said, and he expressed confidence they would produce significant benefits for the company’s investors and customers over the long term.
* * *
Equipment Division Performance
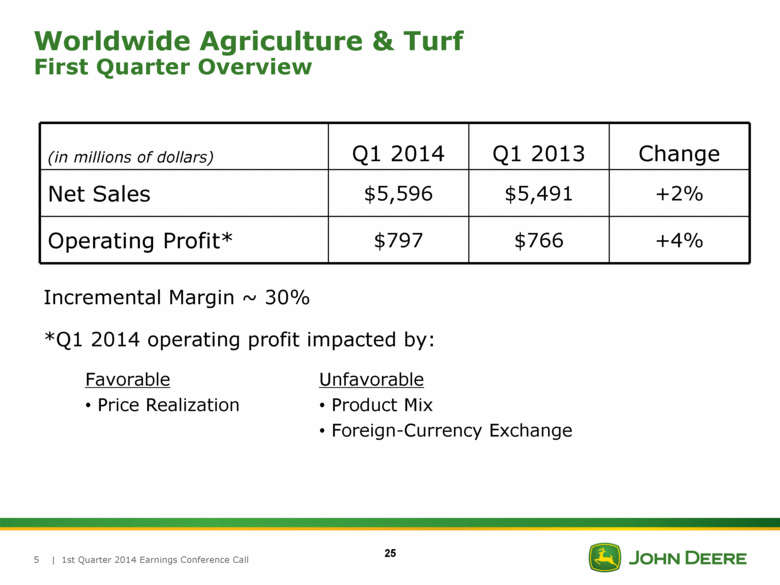
Agriculture & Turf. Sales increased 2 percent for the quarter due largely to price realization and higher shipment volumes, partially offset by the unfavorable effects of currency translation. Operating profit was $797 million compared with $766 million for the quarter last year. The improvement was due primarily to price realization, partially offset by a less favorable product mix and the unfavorable effects of foreign-currency exchange.
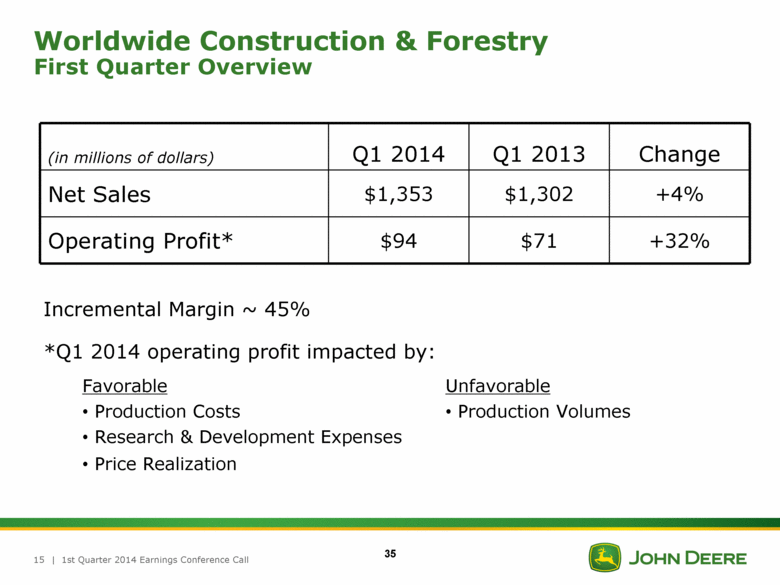
Construction & Forestry. Construction and forestry sales rose 4 percent for the quarter, with operating profit of $94 million compared with $71 million a year ago. The improvement in operating profit was due primarily to lower production costs, decreased
|
Deere Announces First-Quarter Earnings |
|
|
research and development expenses, and price realization. These factors were partially offset by the impact of lower production volumes.
Market Conditions & Outlook
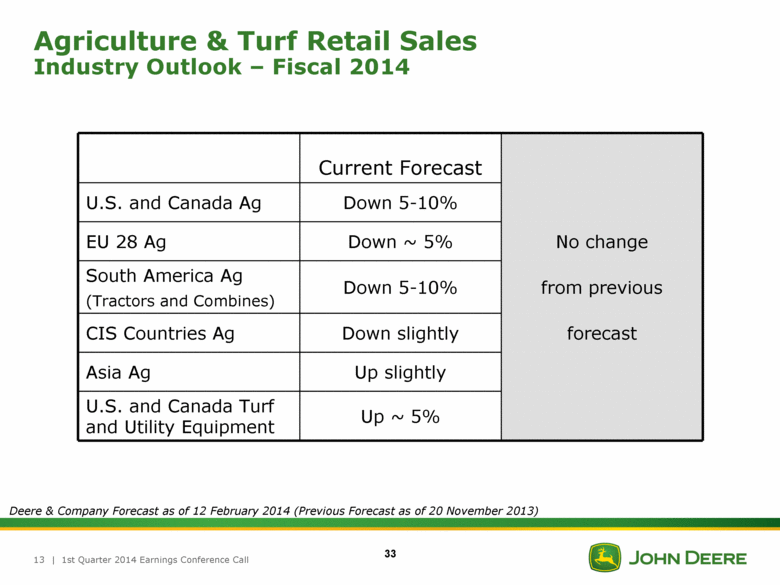
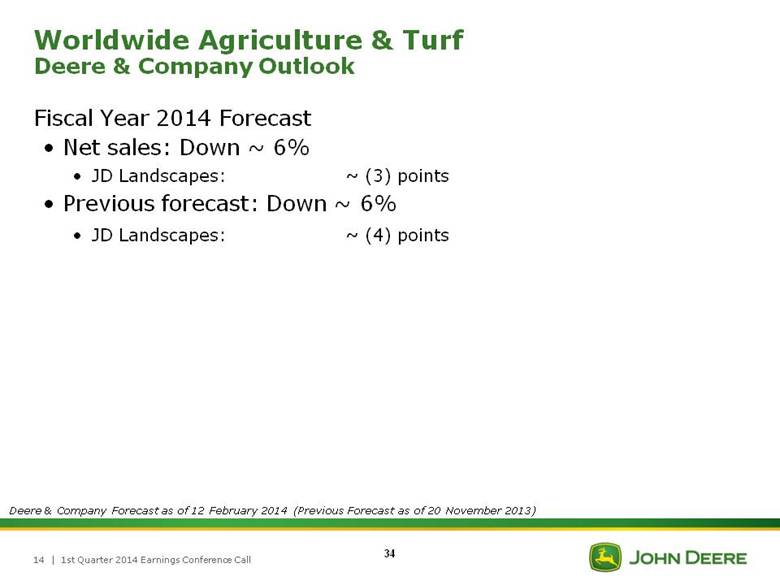
Agriculture & Turf. Deere’s worldwide sales of agriculture and turf equipment are forecast to decrease by about 6 percent for fiscal 2014. Although farm incomes are expected to remain at healthy levels in 2014, they are forecast to be lower than in the previous year. In Deere’s view, the decline will have a dampening effect on demand, especially for larger models of equipment. Partly as a result of these factors, industry sales for agricultural machinery in the U.S. and Canada are forecast to be down 5 to 10 percent for the year, with the decline mainly reflecting lower sales of high-horsepower tractors and combines.
Full-year industry sales in the EU28 are forecast to be down about 5 percent due to lower crop prices and farm incomes. In South America, industry sales of tractors and combines are projected to be down 5 to 10 percent from strong 2013 levels. Industry sales in the Commonwealth of Independent States are expected to be down slightly for the year, while Asian sales are projected to be up slightly.
In the U.S. and Canada, industry sales of turf and utility equipment are expected to be up about 5 percent for 2014 as a result of improved market conditions.
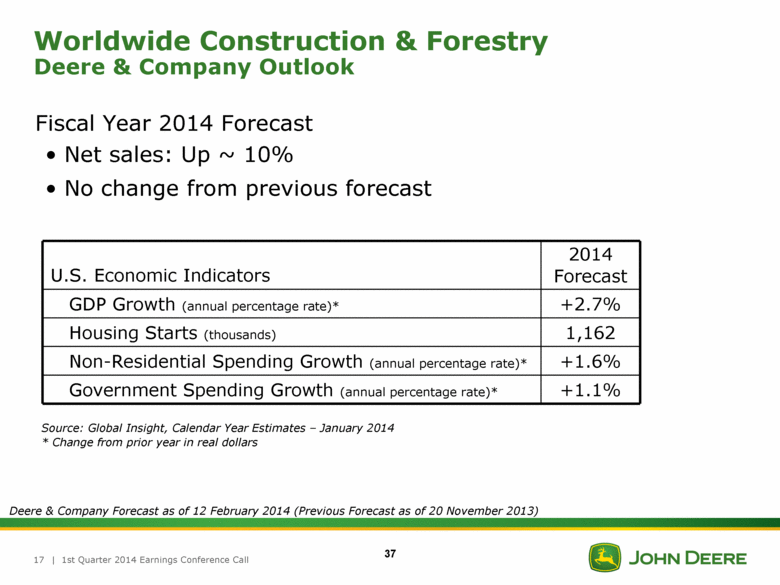
Construction & Forestry. Deere’s worldwide sales of construction and forestry equipment are forecast to increase by about 10 percent for 2014. The gain reflects further economic recovery and higher housing starts in the U.S. as well as sales increases outside the U.S. and Canada. Global forestry sales are expected to be up for the year due to general economic growth and improved sales in European markets.
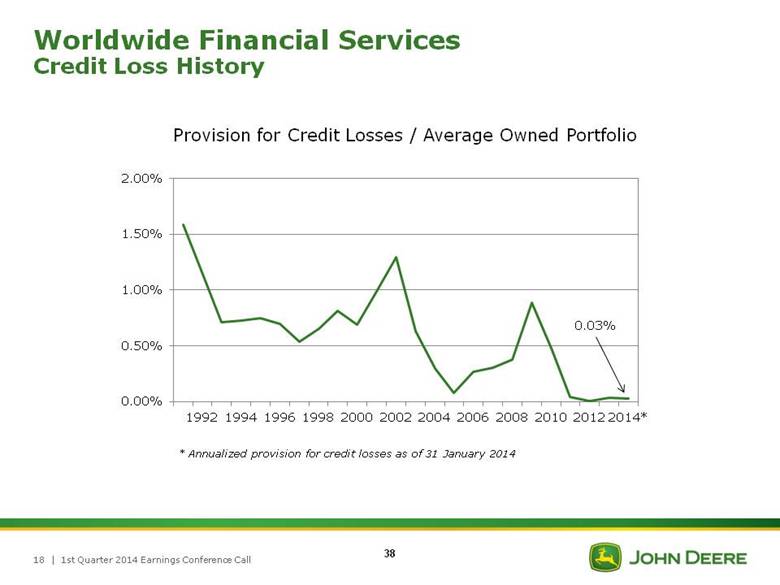
Financial Services. Full-year 2014 net income attributable to Deere & Company for the financial services operations is expected to be approximately $600 million. The outlook reflects improvement primarily due to expected growth in the credit portfolio and a more favorable tax rate. These factors are projected to be partially offset by an increase in the provision for credit losses from the low level in 2013, less favorable financing spreads, and higher selling, general and administrative expenses.
|
Deere Announces First-Quarter Earnings |
|
|
John Deere Capital Corporation
|
|
The following is disclosed on behalf of the company’s financial services subsidiary, John Deere Capital Corporation (JDCC), in connection with the disclosure requirements applicable to its periodic issuance of debt securities in the public market.
Net income attributable to John Deere Capital Corporation was $136.5 million for the first quarter, compared with $105.0 million last year. Results improved for the quarter primarily due to growth in the credit portfolio and a more favorable effective tax rate, partially offset by less favorable financing spreads.
Net receivables and leases financed by JDCC were $30.019 billion and $26.329 billion at January 31, 2014 and 2013, respectively.
Safe Harbor Statement
|
|
Safe Harbor Statement under the Private Securities Litigation Reform Act of 1995: Statements under “Company Outlook & Summary,” “Market Conditions & Outlook,” and other forward-looking statements herein that relate to future events, expectations, trends and operating periods involve certain factors that are subject to change, and important risks and uncertainties that could cause actual results to differ materially. Some of these risks and uncertainties could affect particular lines of business, while others could affect all of the company’s businesses.
The company’s agricultural equipment business is subject to a number of uncertainties including the many interrelated factors that affect farmers’ confidence. These factors include worldwide economic conditions, demand for agricultural products, world grain stocks, weather conditions (including its effects on timely planting and harvesting), soil conditions (including low subsoil moisture from recent drought conditions), harvest yields, prices for commodities and livestock, crop and livestock production expenses, availability of transport for crops, the growth and sustainability of non-food uses for some crops (including ethanol and biodiesel production), real estate values, available acreage for farming, the land ownership policies of various governments, changes in government farm programs and policies (including those in Argentina, Brazil, China, the European Union, India, Russia and the U.S.), international reaction to such programs, changes in and effects of crop insurance programs, global trade agreements, animal diseases and their effects on poultry, beef and pork consumption and prices, crop pests and diseases, and the level of farm product exports (including concerns about genetically modified organisms).
|
Deere Announces First-Quarter Earnings |
|
|
Factors affecting the outlook for the company’s turf and utility equipment include general economic conditions, consumer confidence, weather conditions, customer profitability, consumer borrowing patterns, consumer purchasing preferences, housing starts, infrastructure investment, spending by municipalities and golf courses, and consumable input costs.
General economic conditions, consumer spending patterns, real estate and housing prices, the number of housing starts and interest rates are especially important to sales of the company’s construction and forestry equipment. The levels of public and non-residential construction also impact the results of the company’s construction and forestry segment. Prices for pulp, paper, lumber and structural panels are important to sales of forestry equipment.
All of the company’s businesses and its reported results are affected by general economic conditions in the global markets in which the company operates, especially material changes in economic activity in these markets; customer confidence in general economic conditions; foreign currency exchange rates and their volatility, especially fluctuations in the value of the U.S. dollar; interest rates; and inflation and deflation rates. General economic conditions can affect demand for the company’s equipment as well. Uncertainty about and actual government spending and taxing could adversely affect the economy, employment, consumer and corporate spending, and company results.
Customer and company operations and results could be affected by changes in weather patterns (including the effects of drought conditions in parts of the U.S. and dryer than normal conditions in certain other markets); the political and social stability of the global markets in which the company operates; the effects of, or response to, terrorism and security threats; wars and other conflicts and the threat thereof; and the spread of major epidemics.
Significant changes in market liquidity conditions and any failure to comply with financial covenants in credit agreements could impact access to funding and funding costs, which could reduce the company’s earnings and cash flows. Financial market conditions could also negatively impact customer access to capital for purchases of the company’s products and customer confidence and purchase decisions; borrowing and repayment practices; and the number and size of customer loan delinquencies and defaults. A debt crisis, in Europe or elsewhere, could negatively impact currencies, global financial markets, social and political stability, funding sources and costs, asset and obligation values, customers, suppliers, and company operations and results. State debt crises also could negatively impact customers, suppliers, demand for equipment, and company operations
|
Deere Announces First-Quarter Earnings |
|
|
and results. The company’s investment management activities could be impaired by changes in the equity and bond markets, which would negatively affect earnings.
Additional factors that could materially affect the company’s operations, access to capital, expenses and results include changes in and the impact of governmental trade, banking, monetary and fiscal policies, including financial regulatory reform and its effects on the consumer finance industry, derivatives, funding costs and other areas, and governmental programs, policies and tariffs in particular jurisdictions or for the benefit of certain industries or sectors (including protectionist and expropriation policies and trade and licensing restrictions that could disrupt international commerce); actions by the U.S. Federal Reserve Board and other central banks; actions by the U.S. Securities and Exchange Commission (SEC), the U.S. Commodity Futures Trading Commission and other financial regulators; actions by environmental, health and safety regulatory agencies, including those related to engine emissions (in particular Interim Tier 4/Stage IIIb and Final Tier 4/Stage IV non-road diesel emission requirements in the U.S. and European Union), carbon and other greenhouse gas emissions, noise and the risk of climate change; changes in labor regulations; changes to accounting standards; changes in tax rates, estimates, and regulations and company actions related thereto; compliance with U.S. and foreign laws when expanding to new markets and otherwise; and actions by other regulatory bodies including changes in laws and regulations affecting the sectors in which the company operates. Customer and company operations and results also could be affected by changes to GPS radio frequency bands or their permitted uses.
Other factors that could materially affect results include production, design and technological innovations and difficulties, including capacity and supply constraints and prices; the availability and prices of strategically sourced materials, components and whole goods; delays or disruptions in the company’s supply chain or the loss of liquidity by suppliers; the failure of suppliers to comply with laws, regulations and company policy pertaining to employment, human rights, health, safety, the environment and other ethical business practices; events that damage the company’s reputation or brand; start-up of new plants and new products; the success of new product initiatives and customer acceptance of new products; changes in customer product preferences and sales mix whether as a result of changes in equipment design to meet government regulations or for other reasons; gaps or limitations in rural broadband coverage, capacity and speed needed to support technology solutions; oil and energy prices and supplies; the availability and cost of freight; actions of competitors in the various industries in which the company competes, particularly price discounting; dealer practices especially as to levels of new and used field inventories;
|
Deere Announces First-Quarter Earnings |
|
|
labor relations; acquisitions and divestitures of businesses, the integration of new businesses; the implementation of organizational changes; difficulties related to the conversion and implementation of enterprise resource planning systems that disrupt business, negatively impact supply or distribution relationships or create higher than expected costs; security breaches and other disruptions to the company’s information technology infrastructure; changes in company declared dividends and common stock issuances and repurchases.
Company results are also affected by changes in the level and funding of employee retirement benefits, changes in market values of investment assets, the level of interest and discount rates, and compensation, retirement and mortality rates which impact retirement benefit costs, and significant changes in health care costs including those which may result from governmental action.
The liquidity and ongoing profitability of John Deere Capital Corporation and other credit subsidiaries depend largely on timely access to capital to meet future cash flow requirements and fund operations and the costs associated with engaging in diversified funding activities and to fund purchases of the company’s products. If market uncertainty increases or general economic conditions worsen, funding could be unavailable or insufficient. Additionally, customer confidence levels may result in declines in credit applications and increases in delinquencies and default rates, which could materially impact write-offs and provisions for credit losses. The failure of reinsurers of the company’s insurance business also could materially affect results.
The company’s outlook is based upon assumptions relating to the factors described above, which are sometimes based upon estimates and data prepared by government agencies. Such estimates and data are often revised. The company, except as required by law, undertakes no obligation to update or revise its outlook, whether as a result of new developments or otherwise. Further information concerning the company and its businesses, including factors that potentially could materially affect the company’s financial results, is included in the company’s other filings with the SEC (including, but not limited to, the factors discussed in Item 1A. Risk Factors of the company’s most recent annual report on Form 10-K and quarterly reports on Form 10-Q).
|
Deere Announces First-Quarter Earnings |
|
|
First Quarter 2014 Press Release
(in millions of dollars)
Unaudited
|
|
|
Three Months Ended |
| |||||||||||||
|
|
|
2014 |
|
2013 |
|
% |
| |||||||||
|
Net sales and revenues: |
|
|
|
|
|
|
|
|
| |||||||
|
Agriculture and turf |
|
$ |
5,596 |
|
|
$ |
5,491 |
|
|
+2 |
| |||||
|
Construction and forestry |
|
1,353 |
|
|
1,302 |
|
|
+4 |
| |||||||
|
Total net sales |
|
6,949 |
|
|
6,793 |
|
|
+2 |
| |||||||
|
Financial services |
|
587 |
|
|
527 |
|
|
+11 |
| |||||||
|
Other revenues |
|
118 |
|
|
101 |
|
|
+17 |
| |||||||
|
Total net sales and revenues |
|
$ |
7,654 |
|
|
$ |
7,421 |
|
|
+3 |
| |||||
|
|
|
|
|
|
|
|
|
|
| |||||||
|
Operating profit * |
|
|
|
|
|
|
|
|
| |||||||
|
Agriculture and turf |
|
$ |
797 |
|
|
$ |
766 |
|
|
+4 |
| |||||
|
Construction and forestry |
|
94 |
|
|
71 |
|
|
+32 |
| |||||||
|
Financial services |
|
182 |
|
|
197 |
|
|
-8 |
| |||||||
|
Total operating profit |
|
1,073 |
|
|
1,034 |
|
|
+4 |
| |||||||
|
Reconciling items ** |
|
(112 |
) |
|
(95 |
) |
|
+18 |
| |||||||
|
Income taxes |
|
(280 |
) |
|
(289 |
) |
|
-3 |
| |||||||
|
Net income attributable to Deere & Company |
|
$ |
681 |
|
|
$ |
650 |
|
|
+5 |
| |||||
|
|
|
|
|
|
|
|
| |||||||||
|
* Operating profit is income from continuing operations before corporate expenses, certain external interest expense, certain foreign exchange gains and losses and income taxes. Operating profit of the financial services segment includes the effect of interest expense and foreign exchange gains or losses. | ||||||||||||||||
|
| ||||||||||||||||
|
** Reconciling items are primarily corporate expenses, certain external interest expense, certain foreign exchange gains and losses and net income attributable to noncontrolling interests. | ||||||||||||||||
DEERE & COMPANY
STATEMENT OF CONSOLIDATED INCOME
For the Three Months Ended January 31, 2014 and 2013
(In millions of dollars and shares except per share amounts) Unaudited
|
|
|
|
|
|
| ||||||||
|
|
|
|
|
|
| ||||||||
|
|
|
2014 |
|
2013 |
| ||||||||
|
|
|
|
|
|
|
|
| ||||||
|
Net Sales and Revenues |
|
|
|
|
|
|
| ||||||
|
Net sales |
|
$ |
6,948.5 |
|
|
$ |
6,792.8 |
|
| ||||
|
Finance and interest income |
|
531.5 |
|
|
501.0 |
|
| ||||||
|
Other income |
|
174.0 |
|
|
127.6 |
|
| ||||||
|
Total |
|
7,654.0 |
|
|
7,421.4 |
|
| ||||||
|
|
|
|
|
|
|
|
| ||||||
|
Costs and Expenses |
|
|
|
|
|
|
| ||||||
|
Cost of sales |
|
5,195.5 |
|
|
5,014.8 |
|
| ||||||
|
Research and development expenses |
|
323.7 |
|
|
356.5 |
|
| ||||||
|
Selling, administrative and general expenses |
|
765.9 |
|
|
781.5 |
|
| ||||||
|
Interest expense |
|
171.7 |
|
|
180.1 |
|
| ||||||
|
Other operating expenses |
|
232.3 |
|
|
142.4 |
|
| ||||||
|
Total |
|
6,689.1 |
|
|
6,475.3 |
|
| ||||||
|
|
|
|
|
|
|
|
| ||||||
|
Income of Consolidated Group before Income Taxes |
|
964.9 |
|
|
946.1 |
|
| ||||||
|
Provision for income taxes |
|
280.5 |
|
|
289.0 |
|
| ||||||
|
Income of Consolidated Group |
|
684.4 |
|
|
657.1 |
|
| ||||||
|
Equity in loss of unconsolidated affiliates |
|
(3.1 |
) |
|
(7.5 |
) |
| ||||||
|
Net Income |
|
681.3 |
|
|
649.6 |
|
| ||||||
|
Less: Net income (loss) attributable to noncontrolling interests |
|
.2 |
|
|
(.1 |
) |
| ||||||
|
Net Income Attributable to Deere & Company |
|
$ |
681.1 |
|
|
$ |
649.7 |
|
| ||||
|
|
|
|
|
|
|
|
| ||||||
|
Per Share Data |
|
|
|
|
|
|
| ||||||
|
Basic |
|
$ |
1.83 |
|
|
$ |
1.67 |
|
| ||||
|
Diluted |
|
$ |
1.81 |
|
|
$ |
1.65 |
|
| ||||
|
|
|
|
|
|
|
|
| ||||||
|
Average Shares Outstanding |
|
|
|
|
|
|
| ||||||
|
Basic |
|
371.9 |
|
|
388.4 |
|
| ||||||
|
Diluted |
|
375.4 |
|
|
393.0 |
|
| ||||||
|
|
|
|
|
|
|
|
| ||||||
|
|
|
|
|
|
| ||||||||
|
|
|
|
|
|
| ||||||||
See Condensed Notes to Interim Consolidated Financial Statements.
DEERE & COMPANY
CONDENSED CONSOLIDATED BALANCE SHEET
(In millions of dollars) Unaudited
|
|
|
January 31 |
|
October 31 |
|
January 31 |
| |||
|
|
|
2014 |
|
2013 |
|
2013 |
| |||
|
|
|
|
|
|
|
|
| |||
|
Assets |
|
|
|
|
|
|
| |||
|
Cash and cash equivalents |
|
$ |
3,188.6 |
|
$ |
3,504.0 |
|
$ |
3,672.1 |
|
|
Marketable securities |
|
1,438.4 |
|
1,624.8 |
|
1,375.6 |
| |||
|
Receivables from unconsolidated affiliates |
|
35.2 |
|
31.2 |
|
44.6 |
| |||
|
Trade accounts and notes receivable - net |
|
3,716.8 |
|
3,758.2 |
|
3,926.4 |
| |||
|
Financing receivables - net |
|
25,242.3 |
|
25,632.7 |
|
22,070.7 |
| |||
|
Financing receivables securitized - net |
|
3,490.9 |
|
4,153.1 |
|
3,032.9 |
| |||
|
Other receivables |
|
1,157.6 |
|
1,464.0 |
|
1,280.2 |
| |||
|
Equipment on operating leases - net |
|
3,026.0 |
|
3,152.2 |
|
2,452.3 |
| |||
|
Inventories |
|
5,554.6 |
|
4,934.7 |
|
6,242.7 |
| |||
|
Property and equipment - net |
|
5,351.0 |
|
5,466.9 |
|
5,042.6 |
| |||
|
Investments in unconsolidated affiliates |
|
297.5 |
|
221.4 |
|
201.5 |
| |||
|
Goodwill |
|
834.6 |
|
844.8 |
|
934.0 |
| |||
|
Other intangible assets - net |
|
74.6 |
|
77.1 |
|
98.5 |
| |||
|
Retirement benefits |
|
583.5 |
|
551.1 |
|
22.8 |
| |||
|
Deferred income taxes |
|
2,323.4 |
|
2,325.4 |
|
3,311.6 |
| |||
|
Other assets |
|
1,344.2 |
|
1,274.7 |
|
1,461.1 |
| |||
|
Assets held for sale |
|
|
|
505.0 |
|
|
| |||
|
Total Assets |
|
$ |
57,659.2 |
|
$ |
59,521.3 |
|
$ |
55,169.6 |
|
|
|
|
|
|
|
|
|
| |||
|
Liabilities and Stockholders’ Equity |
|
|
|
|
|
|
| |||
|
Short-term borrowings |
|
$ |
8,657.3 |
|
$ |
8,788.9 |
|
$ |
7,331.7 |
|
|
Short-term securitization borrowings |
|
3,490.8 |
|
4,109.1 |
|
3,043.9 |
| |||
|
Payables to unconsolidated affiliates |
|
89.1 |
|
106.9 |
|
70.5 |
| |||
|
Accounts payable and accrued expenses |
|
7,330.0 |
|
8,973.6 |
|
7,200.3 |
| |||
|
Deferred income taxes |
|
154.8 |
|
160.3 |
|
169.4 |
| |||
|
Long-term borrowings |
|
22,265.2 |
|
21,577.7 |
|
22,170.2 |
| |||
|
Retirement benefits and other liabilities |
|
5,414.2 |
|
5,416.7 |
|
7,698.1 |
| |||
|
Liabilities held for sale |
|
|
|
120.4 |
|
|
| |||
|
Total liabilities |
|
47,401.4 |
|
49,253.6 |
|
47,684.1 |
| |||
|
Total Deere & Company stockholders’ equity |
|
10,255.7 |
|
10,265.8 |
|
7,483.7 |
| |||
|
Noncontrolling interests |
|
2.1 |
|
1.9 |
|
1.8 |
| |||
|
Total stockholders’ equity |
|
10,257.8 |
|
10,267.7 |
|
7,485.5 |
| |||
|
Total Liabilities and Stockholders’ Equity |
|
$ |
57,659.2 |
|
$ |
59,521.3 |
|
$ |
55,169.6 |
|
See Condensed Notes to Interim Consolidated Financial Statements.
DEERE & COMPANY
STATEMENT OF CONSOLIDATED CASH FLOWS
For the Three Months Ended January 31, 2014 and 2013
(In millions of dollars) Unaudited
|
|
|
2014 |
|
2013 | ||
|
|
|
|
|
| ||
|
Cash Flows from Operating Activities |
|
|
|
| ||
|
Net income |
|
$ |
681.3 |
|
$ |
649.6 |
|
Adjustments to reconcile net income to net cash used for operating activities: |
|
|
|
| ||
|
Provision (credit) for credit losses |
|
2.4 |
|
(.5) | ||
|
Provision for depreciation and amortization |
|
343.1 |
|
277.1 | ||
|
Impairment charges |
|
26.3 |
|
| ||
|
Share-based compensation expense |
|
23.2 |
|
22.3 | ||
|
Undistributed earnings of unconsolidated affiliates |
|
3.0 |
|
15.6 | ||
|
Credit for deferred income taxes |
|
(8.6) |
|
(20.6) | ||
|
Changes in assets and liabilities: |
|
|
|
| ||
|
Trade, notes and financing receivables related to sales |
|
126.7 |
|
94.9 | ||
|
Insurance receivables |
|
101.9 |
|
338.0 | ||
|
Inventories |
|
(836.8) |
|
(1,169.0) | ||
|
Accounts payable and accrued expenses |
|
(1,387.1) |
|
(1,539.1) | ||
|
Accrued income taxes payable/receivable |
|
137.5 |
|
146.6 | ||
|
Retirement benefits |
|
53.4 |
|
96.2 | ||
|
Other |
|
(12.5) |
|
(160.5) | ||
|
Net cash used for operating activities |
|
(746.2) |
|
(1,249.4) | ||
|
|
|
|
|
| ||
|
Cash Flows from Investing Activities |
|
|
|
| ||
|
Collections of receivables (excluding receivables related to sales) |
|
4,660.7 |
|
4,341.9 | ||
|
Proceeds from maturities and sales of marketable securities |
|
403.6 |
|
215.4 | ||
|
Proceeds from sales of equipment on operating leases |
|
276.4 |
|
249.4 | ||
|
Proceeds from sales of businesses, net of cash sold |
|
303.7 |
|
| ||
|
Cost of receivables acquired (excluding receivables related to sales) |
|
(4,190.1) |
|
(3,933.6) | ||
|
Purchases of marketable securities |
|
(222.4) |
|
(125.1) | ||
|
Purchases of property and equipment |
|
(250.7) |
|
(294.0) | ||
|
Cost of equipment on operating leases acquired |
|
(251.6) |
|
(197.6) | ||
|
Other |
|
(56.3) |
|
(39.5) | ||
|
Net cash provided by investing activities |
|
673.3 |
|
216.9 | ||
|
|
|
|
|
| ||
|
Cash Flows from Financing Activities |
|
|
|
| ||
|
Increase (decrease) in total short-term borrowings |
|
(736.7) |
|
691.9 | ||
|
Proceeds from long-term borrowings |
|
2,241.1 |
|
877.8 | ||
|
Payments of long-term borrowings |
|
(1,100.0) |
|
(1,379.5) | ||
|
Proceeds from issuance of common stock |
|
54.3 |
|
117.6 | ||
|
Repurchases of common stock |
|
(477.3) |
|
(96.4) | ||
|
Dividends paid |
|
(192.5) |
|
(178.7) | ||
|
Excess tax benefits from share-based compensation |
|
14.6 |
|
35.4 | ||
|
Other |
|
(13.0) |
|
(20.4) | ||
|
Net cash provided by (used for) financing activities |
|
(209.5) |
|
47.7 | ||
|
Effect of Exchange Rate Changes on Cash and Cash Equivalents |
|
(33.0) |
|
4.7 | ||
|
|
|
|
|
| ||
|
Net Decrease in Cash and Cash Equivalents |
|
(315.4) |
|
(980.1) | ||
|
Cash and Cash Equivalents at Beginning of Period |
|
3,504.0 |
|
4,652.2 | ||
|
Cash and Cash Equivalents at End of Period |
|
$ |
3,188.6 |
|
$ |
3,672.1 |
See Condensed Notes to Interim Consolidated Financial Statements.
Condensed Notes to Interim Consolidated Financial Statements (Unaudited)
|
(1) |
In December 2013, the Company closed the sale of 60 percent of its subsidiary John Deere Landscapes, LLC (Landscapes) to a private equity investment firm affiliated with Clayton, Dubilier & Rice, LLC. At October 31, 2013, the total assets of $505 million and liabilities of $120 million for Landscapes were classified as held for sale in the consolidated financial statements and written down to realizable value, which consisted of $153 million of receivables, $219 million of inventories, $37 million of property and equipment, $106 million of goodwill, $25 million of other intangible assets and $10 million of other assets less a $45 million asset impairment. The related liabilities held for sale consisted of accounts payable and accrued expenses. The Company initially retained 40 percent of the Landscapes business in the form of common stock and reports the results as an equity investment in unconsolidated affiliates. The fair value of the Company’s retained equity investment was approximately $80 million at closing. The total amount of proceeds from the sale at closing was approximately $305 million with no significant gain or loss. |
|
|
|
|
(2) |
Dividends declared and paid on a per share basis were as follows: |
|
|
|
Three Months Ended | ||||
|
|
|
2014 |
|
2013 | ||
|
Dividends declared |
|
$ |
.51 |
|
$ |
.46 |
|
Dividends paid |
|
.51 |
|
.46 | ||
|
(3) |
The calculation of basic net income per share is based on the average number of shares outstanding. The calculation of diluted net income per share recognizes any dilutive effect of share-based compensation. |
|
|
|
|
(4) |
The consolidated financial statements represent the consolidation of all Deere & Company’s subsidiaries. In the supplemental consolidating data in Note 5 to the financial statements, “Equipment Operations” include the Company’s agriculture and turf operations and construction and forestry operations with “Financial Services” reflected on the equity basis. |
(5) SUPPLEMENTAL CONSOLIDATING DATA
STATEMENT OF INCOME
For the Three Months Ended January 31, 2014 and 2013
|
(In millions of dollars) Unaudited |
|
EQUIPMENT OPERATIONS* |
|
FINANCIAL SERVICES | ||||||||
|
|
|
2014 |
|
2013 |
|
2014 |
|
2013 | ||||
|
|
|
|
|
|
|
|
|
| ||||
|
Net Sales and Revenues |
|
|
|
|
|
|
|
| ||||
|
Net sales |
|
$ |
6,948.5 |
|
$ |
6,792.8 |
|
|
|
| ||
|
Finance and interest income |
|
17.2 |
|
17.5 |
|
$ |
569.2 |
|
$ |
533.8 | ||
|
Other income |
|
150.5 |
|
130.2 |
|
64.4 |
|
38.1 | ||||
|
Total |
|
7,116.2 |
|
6,940.5 |
|
633.6 |
|
571.9 | ||||
|
|
|
|
|
|
|
|
|
| ||||
|
Costs and Expenses |
|
|
|
|
|
|
|
| ||||
|
Cost of sales |
|
5,195.9 |
|
5,015.2 |
|
|
|
| ||||
|
Research and development expenses |
|
323.7 |
|
356.5 |
|
|
|
| ||||
|
Selling, administrative and general expenses |
|
643.2 |
|
672.6 |
|
126.0 |
|
111.7 | ||||
|
Interest expense |
|
75.3 |
|
69.6 |
|
107.8 |
|
119.3 | ||||
|
Interest compensation to Financial Services |
|
42.3 |
|
41.6 |
|
|
|
| ||||
|
Other operating expenses |
|
52.5 |
|
35.1 |
|
218.3 |
|
144.6 | ||||
|
Total |
|
6,332.9 |
|
6,190.6 |
|
452.1 |
|
375.6 | ||||
|
|
|
|
|
|
|
|
|
| ||||
|
Income of Consolidated Group before Income Taxes |
|
783.3 |
|
749.9 |
|
181.5 |
|
196.3 | ||||
|
Provision for income taxes |
|
240.3 |
|
225.4 |
|
40.1 |
|
63.7 | ||||
|
Income of Consolidated Group |
|
543.0 |
|
524.5 |
|
141.4 |
|
132.6 | ||||
|
|
|
|
|
|
|
|
|
| ||||
|
Equity in Income (Loss) of Unconsolidated Subsidiaries and Affiliates |
|
|
|
|
|
|
|
| ||||
|
Financial Services |
|
142.2 |
|
132.9 |
|
.8 |
|
.3 | ||||
|
Other |
|
(3.9) |
|
(7.8) |
|
|
|
| ||||
|
Total |
|
138.3 |
|
125.1 |
|
.8 |
|
.3 | ||||
|
Net Income |
|
681.3 |
|
649.6 |
|
142.2 |
|
132.9 | ||||
|
Less: Net income (loss) attributable to noncontrolling interests |
|
.2 |
|
(.1) |
|
|
|
| ||||
|
Net Income Attributable to Deere & Company |
|
$ |
681.1 |
|
$ |
649.7 |
|
$ |
142.2 |
|
$ |
132.9 |
* Deere & Company with Financial Services on the equity basis.
The supplemental consolidating data is presented for informational purposes. Transactions between the “Equipment Operations” and “Financial Services” have been eliminated to arrive at the consolidated financial statements.
SUPPLEMENTAL CONSOLIDATING DATA (Continued)
CONDENSED BALANCE SHEET
|
(In millions of dollars) Unaudited |
|
EQUIPMENT OPERATIONS* |
|
FINANCIAL SERVICES | ||||||||||||||
|
|
|
January 31 |
|
October 31 |
|
January 31 |
|
January 31 |
|
October 31 |
|
January 31 | ||||||
|
|
|
|
|
|
|
|
|
|
|
|
|
| ||||||
|
Assets |
|
|
|
|
|
|
|
|
|
|
|
| ||||||
|
Cash and cash equivalents |
|
$ |
2,659.7 |
|
$ |
3,023.3 |
|
$ |
3,176.5 |
|
$ |
529.0 |
|
$ |
480.8 |
|
$ |
495.6 |
|
Marketable securities |
|
1,008.3 |
|
1,207.2 |
|
1,000.7 |
|
430.2 |
|
417.6 |
|
375.0 | ||||||
|
Receivables from unconsolidated subsidiaries and affiliates |
|
3,334.4 |
|
3,502.0 |
|
1,674.4 |
|
|
|
|
|
| ||||||
|
Trade accounts and notes receivable - net |
|
848.3 |
|
1,061.8 |
|
1,030.0 |
|
3,827.9 |
|
3,555.9 |
|
3,850.9 | ||||||
|
Financing receivables - net |
|
9.1 |
|
16.5 |
|
5.2 |
|
25,233.2 |
|
25,616.2 |
|
22,065.5 | ||||||
|
Financing receivables securitized - net |
|
|
|
|
|
|
|
3,490.9 |
|
4,153.1 |
|
3,032.9 | ||||||
|
Other receivables |
|
842.0 |
|
983.1 |
|
946.2 |
|
342.3 |
|
486.6 |
|
355.8 | ||||||
|
Equipment on operating leases - net |
|
|
|
|
|
|
|
3,026.0 |
|
3,152.2 |
|
2,452.3 | ||||||
|
Inventories |
|
5,554.6 |
|
4,934.7 |
|
6,242.7 |
|
|
|
|
|
| ||||||
|
Property and equipment - net |
|
5,294.0 |
|
5,408.5 |
|
4,982.3 |
|
57.0 |
|
58.4 |
|
60.4 | ||||||
|
Investments in unconsolidated subsidiaries and affiliates |
|
4,764.4 |
|
4,569.0 |
|
4,230.9 |
|
10.9 |
|
10.2 |
|
9.4 | ||||||
|
Goodwill |
|
834.6 |
|
844.8 |
|
934.0 |
|
|
|
|
|
| ||||||
|
Other intangible assets - net |
|
70.6 |
|
73.1 |
|
94.5 |
|
4.0 |
|
4.0 |
|
4.0 | ||||||
|
Retirement benefits |
|
548.3 |
|
517.7 |
|
17.4 |
|
36.8 |
|
37.5 |
|
43.1 | ||||||
|
Deferred income taxes |
|
2,563.3 |
|
2,575.4 |
|
3,531.4 |
|
65.8 |
|
51.3 |
|
48.8 | ||||||
|
Other assets |
|
702.4 |
|
654.3 |
|
610.0 |
|
644.1 |
|
622.2 |
|
852.3 | ||||||
|
Assets held for sale |
|
|
|
505.0 |
|
|
|
|
|
|
|
| ||||||
|
Total Assets |
|
$ |
29,034.0 |
|
$ |
29,876.4 |
|
$ |
28,476.2 |
|
$ |
37,698.1 |
|
$ |
38,646.0 |
|
$ |
33,646.0 |
|
|
|
|
|
|
|
|
|
|
|
|
|
| ||||||
|
Liabilities and Stockholders’ Equity |
|
|
|
|
|
|
|
|
|
|
|
| ||||||
|
Short-term borrowings |
|
$ |
1,759.6 |
|
$ |
1,080.4 |
|
$ |
1,126.6 |
|
$ |
6,897.7 |
|
$ |
7,708.5 |
|
$ |
6,205.1 |
|
Short-term securitization borrowings |
|
|
|
|
|
|
|
3,490.8 |
|
4,109.1 |
|
3,043.9 | ||||||
|
Payables to unconsolidated subsidiaries and affiliates |
|
89.1 |
|
106.9 |
|
70.5 |
|
3,299.2 |
|
3,470.8 |
|
1,629.7 | ||||||
|
Accounts payable and accrued expenses |
|
6,678.6 |
|
7,990.9 |
|
6,559.1 |
|
1,640.0 |
|
1,849.8 |
|
1,618.9 | ||||||
|
Deferred income taxes |
|
81.3 |
|
92.4 |
|
98.3 |
|
379.2 |
|
369.1 |
|
339.8 | ||||||
|
Long-term borrowings |
|
4,828.2 |
|
4,870.9 |
|
5,464.9 |
|
17,437.0 |
|
16,706.8 |
|
16,705.3 | ||||||
|
Retirement benefits and other liabilities |
|
5,339.4 |
|
5,346.8 |
|
7,671.3 |
|
76.4 |
|
74.1 |
|
64.5 | ||||||
|
Liabilities held for sale |
|
|
|
120.4 |
|
|
|
|
|
|
|
| ||||||
|
Total liabilities |
|
18,776.2 |
|
19,608.7 |
|
20,990.7 |
|
33,220.3 |
|
34,288.2 |
|
29,607.2 | ||||||
|
Total Deere & Company stockholders’ equity |
|
10,255.7 |
|
10,265.8 |
|
7,483.7 |
|
4,477.8 |
|
4,357.8 |
|
4,038.8 | ||||||
|
Noncontrolling interests |
|
2.1 |
|
1.9 |
|
1.8 |
|
|
|
|
|
| ||||||
|
Total stockholders’ equity |
|
10,257.8 |
|
10,267.7 |
|
7,485.5 |
|
4,477.8 |
|
4,357.8 |
|
4,038.8 | ||||||
|
Total Liabilities and Stockholders’ Equity |
|
$ |
29,034.0 |
|
$ |
29,876.4 |
|
$ |
28,476.2 |
|
$ |
37,698.1 |
|
$ |
38,646.0 |
|
$ |
33,646.0 |
* Deere & Company with Financial Services on the equity basis.
The supplemental consolidating data is presented for informational purposes. Transactions between the “Equipment Operations” and “Financial Services” have been eliminated to arrive at the consolidated financial statements.
|
SUPPLEMENTAL CONSOLIDATING DATA (Continued) |
|
|
|
|
|
| ||||||||||
|
STATEMENT OF CASH FLOWS |
|
|
|
|
|
| ||||||||||
|
For the Three Months Ended January 31, 2014 and 2013 |
|
|
|
|
|
| ||||||||||
|
(In millions of dollars) Unaudited |
|
EQUIPMENT OPERATIONS* |
|
|
FINANCIAL SERVICES |
| ||||||||||
|
|
|
2014 |
|
|
2013 |
|
|
2014 |
|
|
2013 |
| ||||
|
Cash Flows from Operating Activities |
|
|
|
|
|
|
|
|
|
|
|
| ||||
|
Net income |
|
$ |
681.3 |
|
|
$ |
649.6 |
|
|
$ |
142.2 |
|
|
$ |
132.9 |
|
|
Adjustments to reconcile net income to net cash provided by (used for) operating activities: |
|
|
|
|
|
|
|
|
|
|
|
| ||||
|
Provision (credit) for credit losses |
|
.1 |
|
|
(1.2 |
) |
|
2.4 |
|
|
.7 |
| ||||
|
Provision for depreciation and amortization |
|
229.7 |
|
|
185.3 |
|
|
136.3 |
|
|
117.3 |
| ||||
|
Impairment charges |
|
26.3 |
|
|
|
|
|
|
|
|
|
| ||||
|
Undistributed earnings of unconsolidated subsidiaries and affiliates |
|
(138.4 |
) |
|
(87.0 |
) |
|
(.8 |
) |
|
(.3 |
) | ||||
|
Provision (credit) for deferred income taxes |
|
(3.8 |
) |
|
(23.7 |
) |
|
(4.7 |
) |
|
3.0 |
| ||||
|
Changes in assets and liabilities: |
|
|
|
|
|
|
|
|
|
|
|
| ||||
|
Trade receivables |
|
167.0 |
|
|
253.8 |
|
|
|
|
|
|
| ||||
|
Insurance receivables |
|
|
|
|
|
|
|
101.9 |
|
|
338.0 |
| ||||
|
Inventories |
|
(721.1 |
) |
|
(1,081.8 |
) |
|
|
|
|
|
| ||||
|
Accounts payable and accrued expenses |
|
(1,169.7 |
) |
|
(1,028.1 |
) |
|
(117.0 |
) |
|
(370.4 |
) | ||||
|
Accrued income taxes payable/receivable |
|
124.5 |
|
|
161.7 |
|
|
13.0 |
|
|
(15.2 |
) | ||||
|
Retirement benefits |
|
49.7 |
|
|
91.4 |
|
|
3.7 |
|
|
4.8 |
| ||||
|
Other |
|
36.8 |
|
|
(129.2 |
) |
|
(9.2 |
) |
|
(3.4 |
) | ||||
|
Net cash provided by (used for) operating activities |
|
(717.6 |
) |
|
(1,009.2 |
) |
|
267.8 |
|
|
207.4 |
| ||||
|
|
|
|
|
|
|
|
|
|
|
|
|
| ||||
|
Cash Flows from Investing Activities |
|
|
|
|
|
|
|
|
|
|
|
| ||||
|
Collections of receivables (excluding trade and wholesale) |
|
|
|
|
|
|
|
5,008.5 |
|
|
4,668.8 |
| ||||
|
Proceeds from maturities and sales of marketable securities |
|
400.0 |
|
|
200.0 |
|
|
3.6 |
|
|
15.4 |
| ||||
|
Proceeds from sales of equipment on operating leases |
|
|
|
|
|
|
|
276.4 |
|
|
249.4 |
| ||||
|
Proceeds from sales of businesses, net of cash sold |
|
303.7 |
|
|
|
|
|
|
|
|
|
| ||||
|
Cost of receivables acquired (excluding trade and wholesale) |
|
|
|
|
|
|
|
(4,529.1 |
) |
|
(4,235.5 |
) | ||||
|
Purchases of marketable securities |
|
(203.7 |
) |
|
(99.8 |
) |
|
(18.7 |
) |
|
(25.4 |
) | ||||
|
Purchases of property and equipment |
|
(250.5 |
) |
|
(293.3 |
) |
|
(.2 |
) |
|
(.7 |
) | ||||
|
Cost of equipment on operating leases acquired |
|
|
|
|
|
|
|
(407.9 |
) |
|
(315.5 |
) | ||||
|
Increase in trade and wholesale receivables |
|
|
|
|
|
|
|
(149.0 |
) |
|
(324.5 |
) | ||||
|
Other |
|
(44.3 |
) |
|
(40.1 |
) |
|
(48.4 |
) |
|
(36.0 |
) | ||||
|
Net cash provided by (used for) investing activities |
|
205.2 |
|
|
(233.2 |
) |
|
135.2 |
|
|
(4.0 |
) | ||||
|
|
|
|
|
|
|
|
|
|
|
|
|
| ||||
|
Cash Flows from Financing Activities |
|
|
|
|
|
|
|
|
|
|
|
| ||||
|
Increase (decrease) in total short-term borrowings |
|
703.1 |
|
|
708.0 |
|
|
(1,439.8 |
) |
|
(16.1 |
) | ||||
|
Change in intercompany receivables/payables |
|
79.2 |
|
|
(96.3 |
) |
|
(79.2 |
) |
|
96.3 |
| ||||
|
Proceeds from long-term borrowings |
|
6.0 |
|
|
44.0 |
|
|
2,235.1 |
|
|
833.8 |
| ||||
|
Payments of long-term borrowings |
|
(15.9 |
) |
|
(17.6 |
) |
|
(1,084.1 |
) |
|
(1,361.9 |
) | ||||
|
Proceeds from issuance of common stock |
|
54.3 |
|
|
117.6 |
|
|
|
|
|
|
| ||||
|
Repurchases of common stock |
|
(477.3 |
) |
|
(96.4 |
) |
|
|
|
|
|
| ||||
|
Dividends paid |
|
(192.5 |
) |
|
(178.7 |
) |
|
|
|
|
(30.0 |
) | ||||
|
Excess tax benefits from share-based compensation |
|
14.6 |
|
|
35.4 |
|
|
|
|
|
|
| ||||
|
Other |
|
(6.0 |
) |
|
(16.5 |
) |
|
29.5 |
|
|
32.7 |
| ||||
|
Net cash provided by (used for) financing activities |
|
165.5 |
|
|
499.5 |
|
|
(338.5 |
) |
|
(445.2 |
) | ||||
|
|
|
|
|
|
|
|
|
|
|
|
|
| ||||
|
Effect of Exchange Rate Changes on Cash and Cash Equivalents |
|
(16.7 |
) |
|
11.5 |
|
|
(16.3 |
) |
|
(6.9 |
) | ||||
|
|
|
|
|
|
|
|
|
|
|
|
|
| ||||
|
Net Increase (Decrease) in Cash and Cash Equivalents |
|
(363.6 |
) |
|
(731.4 |
) |
|
48.2 |
|
|
(248.7 |
) | ||||
|
Cash and Cash Equivalents at Beginning of Period |
|
3,023.3 |
|
|
3,907.9 |
|
|
480.8 |
|
|
744.3 |
| ||||
|
Cash and Cash Equivalents at End of Period |
|
$ |
2,659.7 |
|
|
$ |
3,176.5 |
|
|
$ |
529.0 |
|
|
$ |
495.6 |
|
* Deere & Company with Financial Services on the equity basis.
The supplemental consolidating data is presented for informational purposes. Transactions between the “Equipment Operations” and “Financial Services” have been eliminated to arrive at the consolidated financial statements.