(Filed herewith)
For immediate release
News Media Contact:
Ken Golden
Director, Global Public Relations
Deere & Company
309-765-5678
DEERE REPORTS RECORD SECOND-QUARTER EARNINGS
OF $904 MILLION
¾ Income jumps 65 percent on 25 percent increase in net sales and revenues.
¾ Sales and profit set all-time quarterly record.
¾ Performance paced by strong demand for farm machinery.
¾ Earnings forecast for year increased to about $2.65 billion.
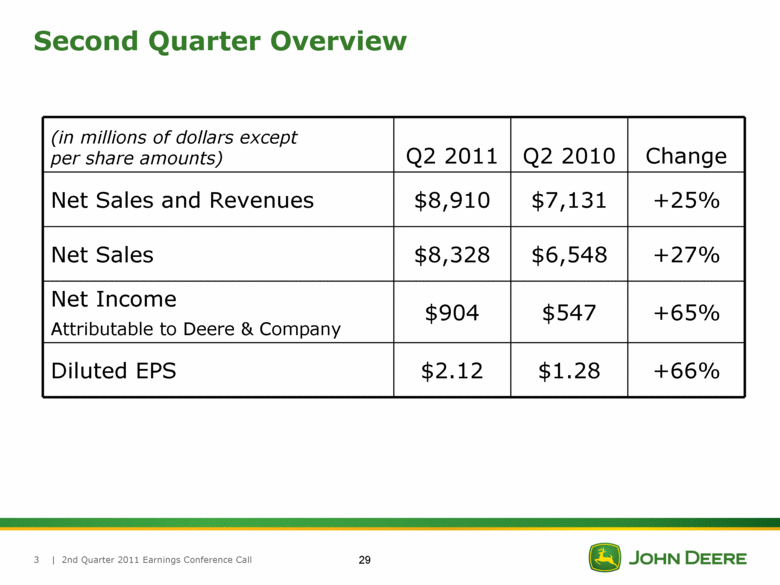
MOLINE, Illinois (May 18, 2011) — Net income attributable to Deere & Company was $904.3 million, or $2.12 per share, for the second quarter ended April 30, compared with $547.5 million, or $1.28 per share, for the same period last year.
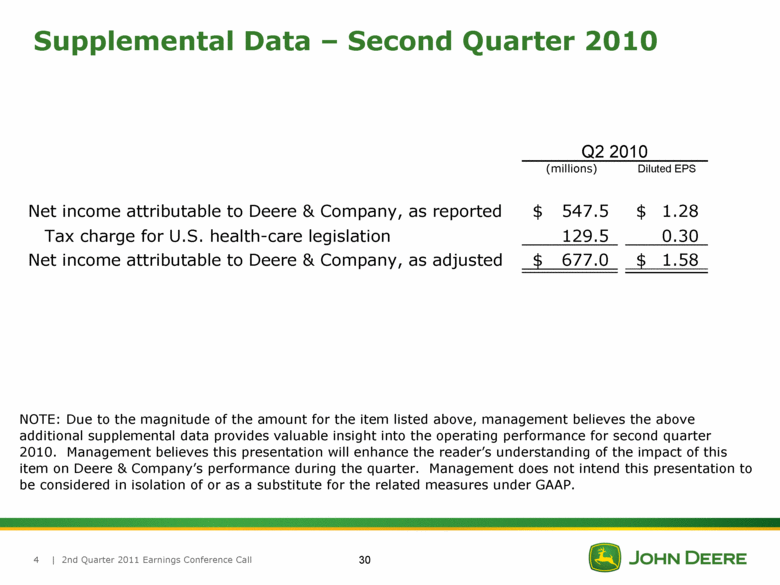
Second-quarter 2010 earnings were $677.0 million, or $1.58 per share, excluding a tax charge of $129.5 million, or $0.30 per share, related to the enactment of U.S. health-care legislation. (Information on non-GAAP financial measures is included in the appendix.)
For the first six months of the year, net income attributable to Deere & Company was $1.418 billion, or $3.32 per share, compared with $790.7 million, or $1.85 per share, last year. Six-month 2010 results also were affected by the tax charge.
|
Deere Announces Second-Quarter Earnings |
Worldwide net sales and revenues increased 25 percent, to $8.910 billion, for the second quarter and were up 26 percent to $15.029 billion for six months. Net sales of the equipment operations were $8.328 billion for the quarter and $13.841 billion for six months, compared with $6.548 billion and $10.785 billion for the corresponding periods last year.
“With our record second-quarter performance, John Deere is well on its way to a year of exceptional results,” said Samuel R. Allen, chairman and chief executive officer. “Our success reflects strong demand for our innovative lines of equipment and the continued skillful execution of our business plans. Deere’s actions to expand its global competitive position are attracting new customers worldwide and making a major contribution to our results.”
Sales of large farm machinery, particularly in the United States, Canada and Brazil, are continuing to support the company’s performance. Construction equipment shipments are moving higher in spite of lingering weakness in the residential and commercial construction sectors. “Markets for construction equipment in the U.S. and for farm machinery in Europe are in the early stages of recovery,” Allen said. “We’re optimistic about the longer-term opportunity for further improvement in these and other key areas.”
Summary of Operations
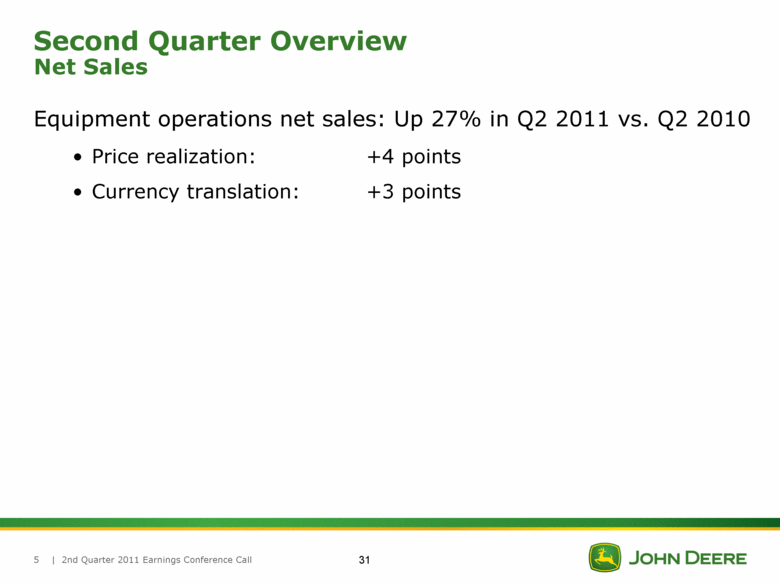
Net sales of the worldwide equipment operations increased 27 percent for the quarter and 28 percent for six months compared with the same periods a year ago. Sales included a favorable currency-translation effect of 3 percent for the quarter and 2 percent for six months and price realization of 4 percent for the quarter and 3 percent for the year to date. Equipment net sales in the United States and Canada increased 17 percent for the quarter and were up 24 percent year to date. Outside the U.S. and Canada, net sales were up 45 percent for the quarter and 36 percent for six months, with
|
Deere Announces Second-Quarter Earnings |
favorable currency-translation effects of 8 percent and 4 percent for these periods.
Deere’s equipment operations reported operating profit of $1.268 billion for the quarter and $1.914 billion for six months, compared with $988 million and $1.303 billion last year.
Results were better in both periods primarily due to the impact of higher shipment and production volumes and improved price realization, partially offset by increased raw-material costs and higher selling, administrative and general expenses.
Net income of the company’s equipment operations was $797 million for the quarter and $1.193 billion for six months, compared with $454 million and $623 million for the respective periods last year. The same operating factors mentioned above, along with a lower effective tax rate, affected both quarterly and six-month results. The lower tax rate was mainly due to the previously mentioned tax charge in 2010.
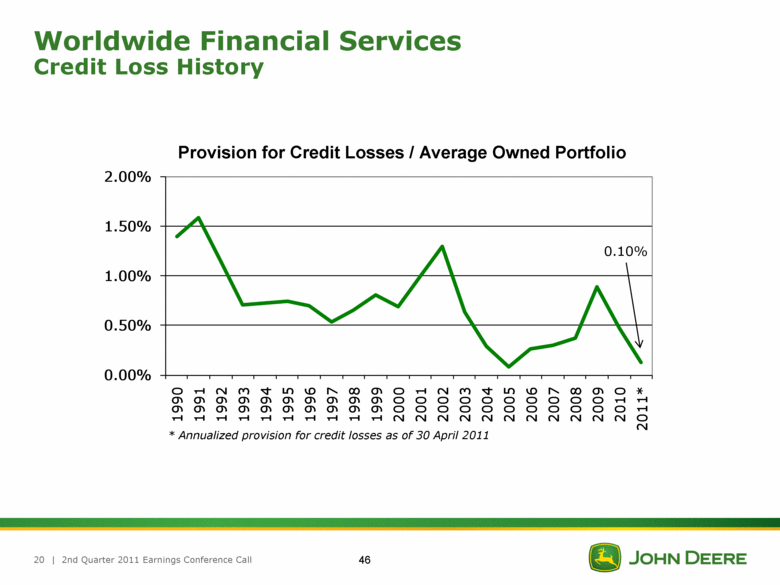
Financial services reported net income attributable to Deere & Company of $105.1 million for the quarter and $223.3 million for six months compared with $86.9 million and $172.0 million last year. Results were higher for both periods primarily due to growth in the portfolio and a lower provision for credit losses.
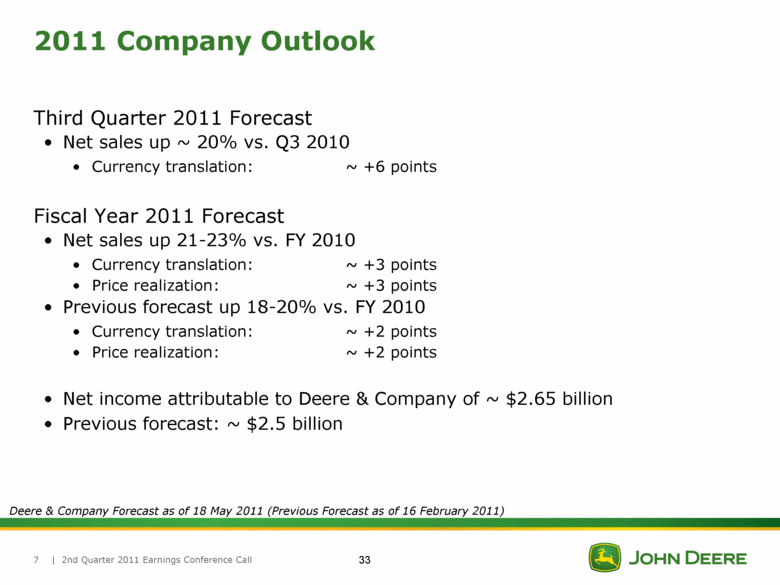
Company Outlook & Summary
Company equipment sales are projected to be up 21 to 23 percent for fiscal 2011 and up about 20 percent for the third quarter compared with the same periods a year ago. Included is a favorable currency-translation impact of about 3 percent for the year and about 6 percent for the quarter. For the full year, net income attributable to Deere & Company is anticipated to be about $2.650 billion.
The annual forecast includes a negative impact of approximately $300 million in sales and $70 million in operating profit resulting from the recent Japanese earthquake and tsunami.
|
Deere Announces Second-Quarter Earnings |
According to Allen, the company’s record of strong financial performance is helping support aggressive levels of organic growth. “Our consistent investment in new products and expanded global capacity puts the company on a solid footing for the future,” he said. “As a result, John Deere is well-positioned to address the world’s growing need for agricultural commodities, shelter and infrastructure. We believe these developments will have a positive impact on demand for productive farm and construction equipment in the years ahead and hold exciting promise for the company well into the future.”
* * *
Equipment Division Performance
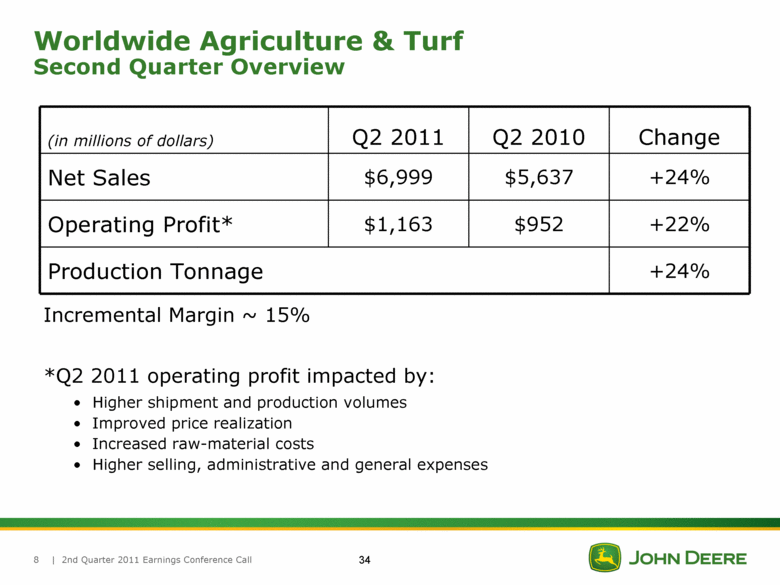
Agriculture & Turf. Sales rose 24 percent for the quarter and 23 percent for six months largely due to higher shipment volumes, improved price realization and the favorable effects of currency translation.
Operating profit was $1.163 billion for the quarter and $1.720 billion year to date, compared with $952 million and $1.304 billion, respectively, last year. Operating profit was higher in both periods primarily due to the impact of higher shipment and production volumes and improved price realization, partially offset by increased raw-material costs and higher selling, administrative and general expenses.
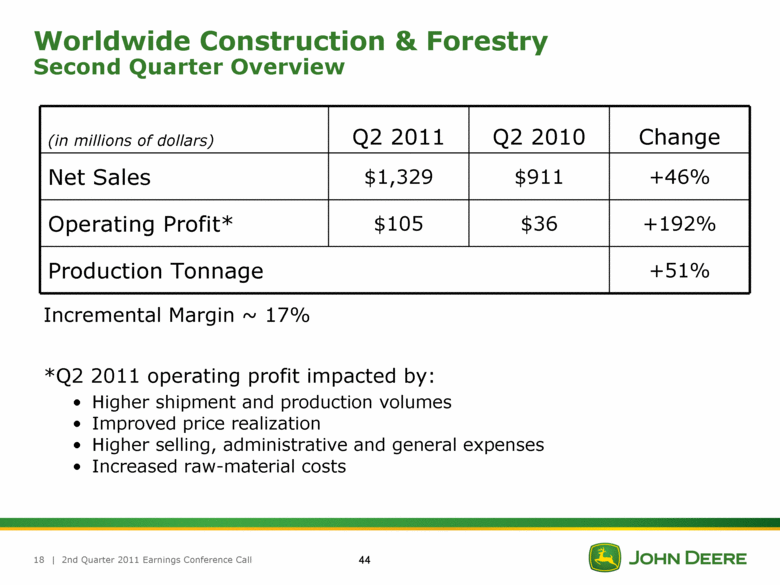
Construction & Forestry. Construction and forestry sales climbed 46 percent for the quarter and 61 percent for six months mainly due to higher shipment volumes and improved price realization. The division had operating profit of $105 million for the quarter and $194 million for six months, compared with last year’s operating profit of $36 million in the quarter and an operating loss of $1 million for the six-month period. The improvement in both periods was primarily due to higher shipment and production volumes and improved price realization, partially offset by higher selling, administrative and general expenses and increased raw-material costs.
|
Deere Announces Second-Quarter Earnings |
Market Conditions & Outlook
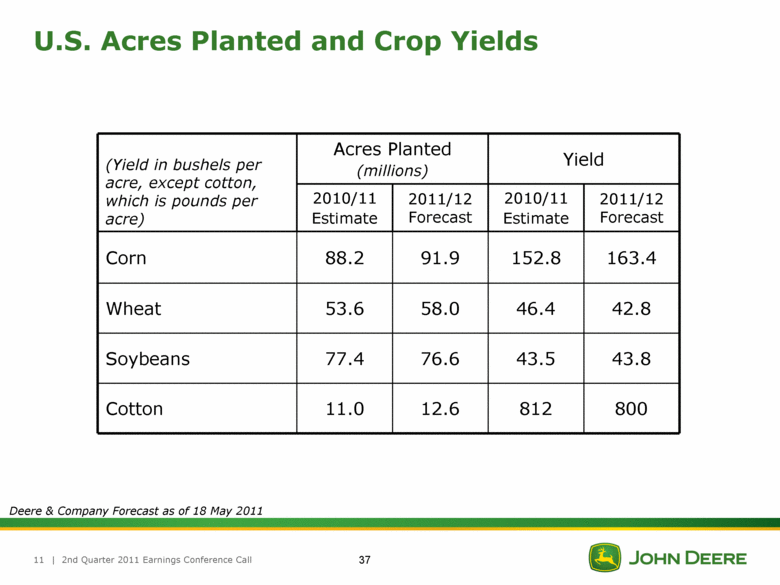
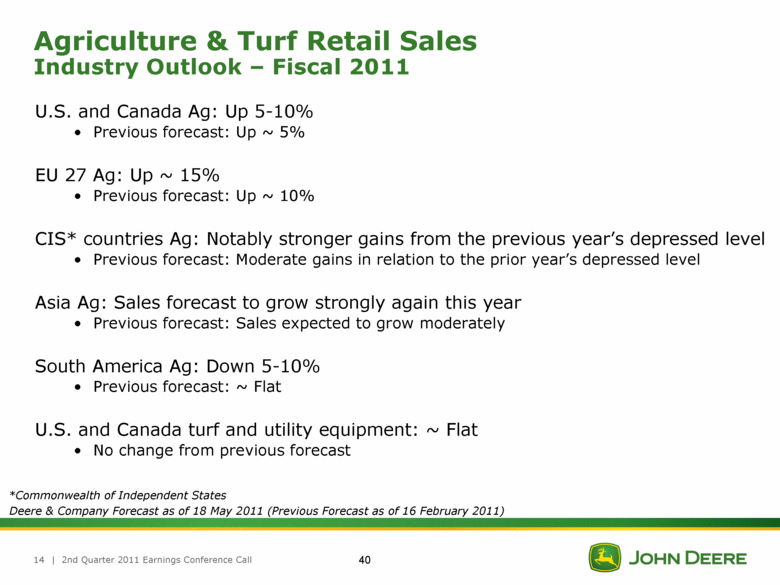
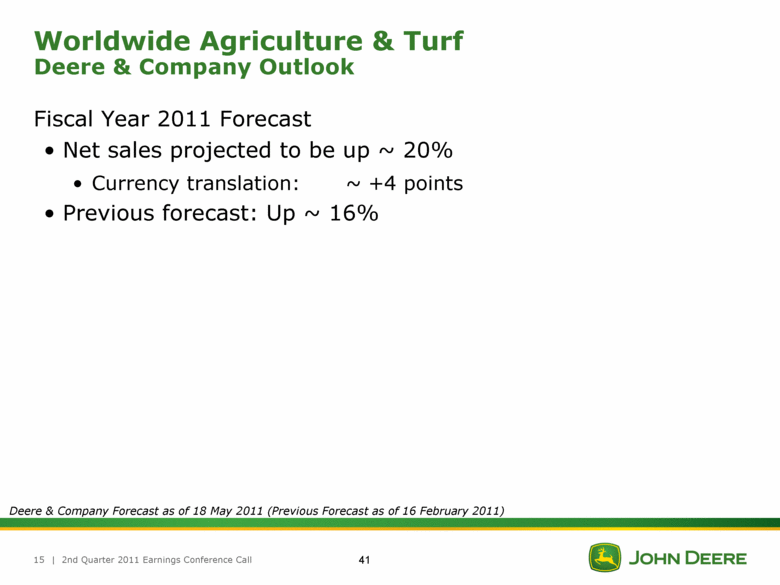
Agriculture & Turf. Worldwide sales of agriculture and turf equipment are forecast to increase by about 20 percent for full-year 2011, benefiting from favorable global farm conditions and a positive currency-translation impact of about 4 percent.
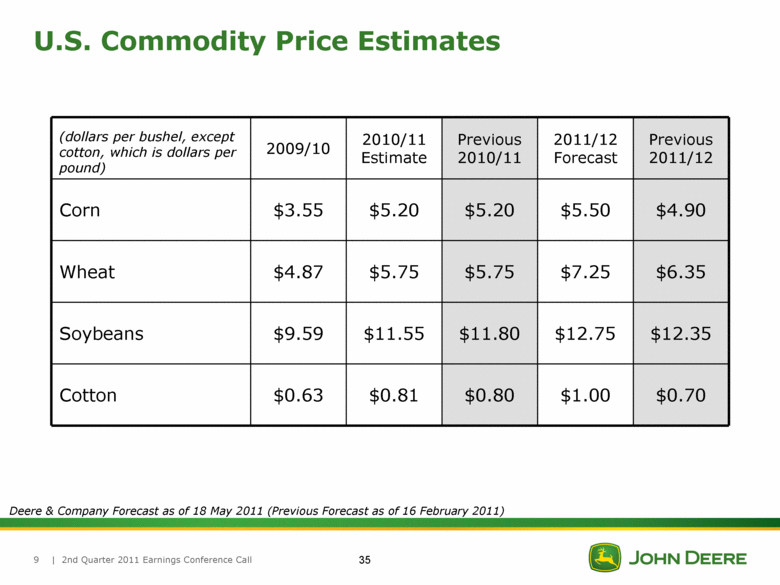
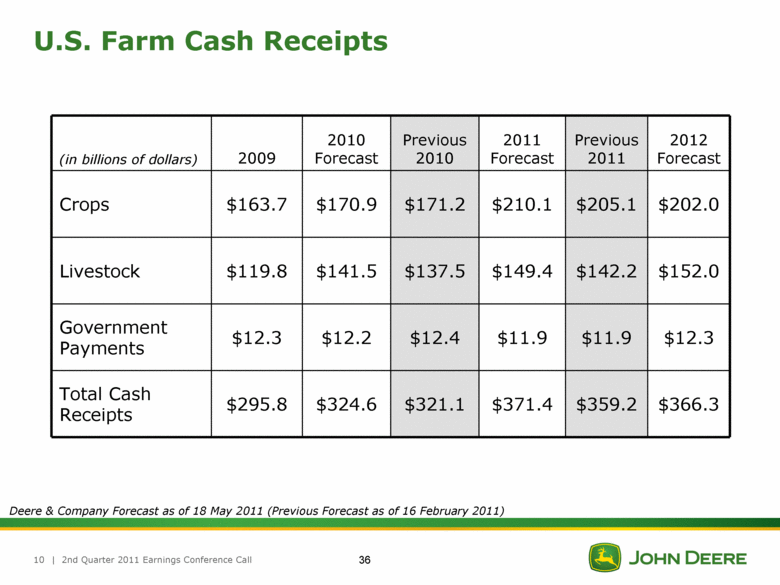
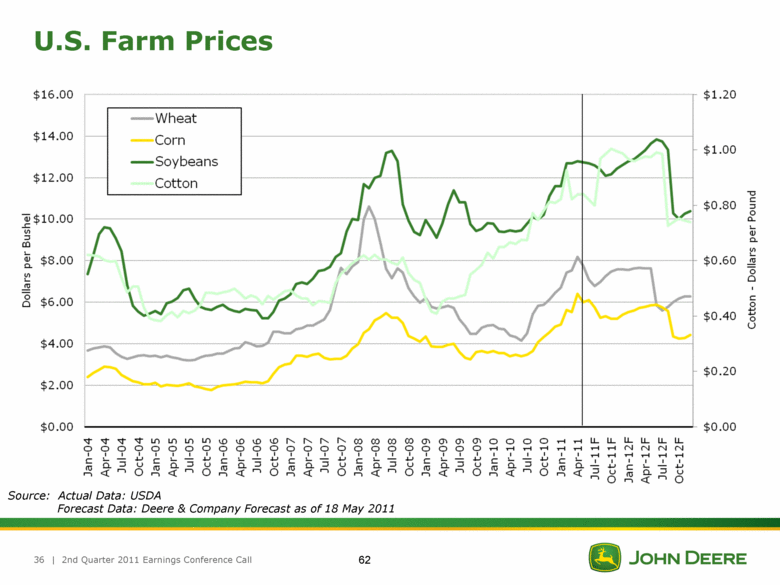
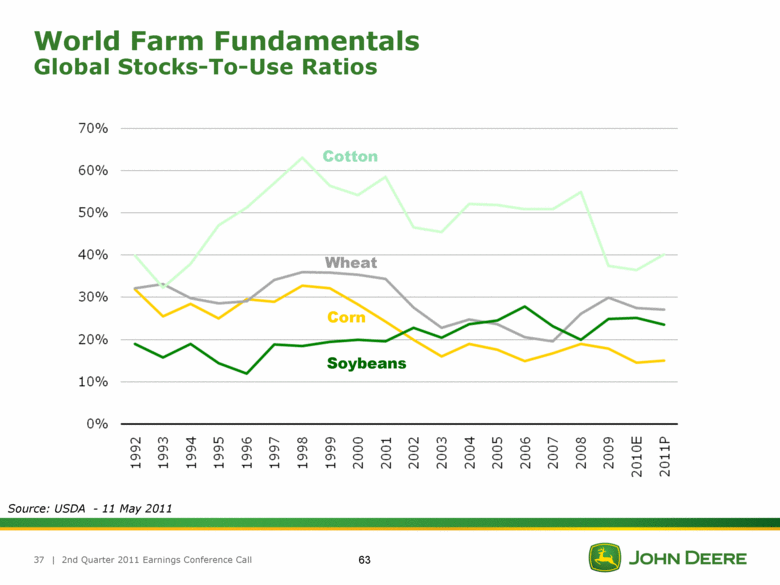
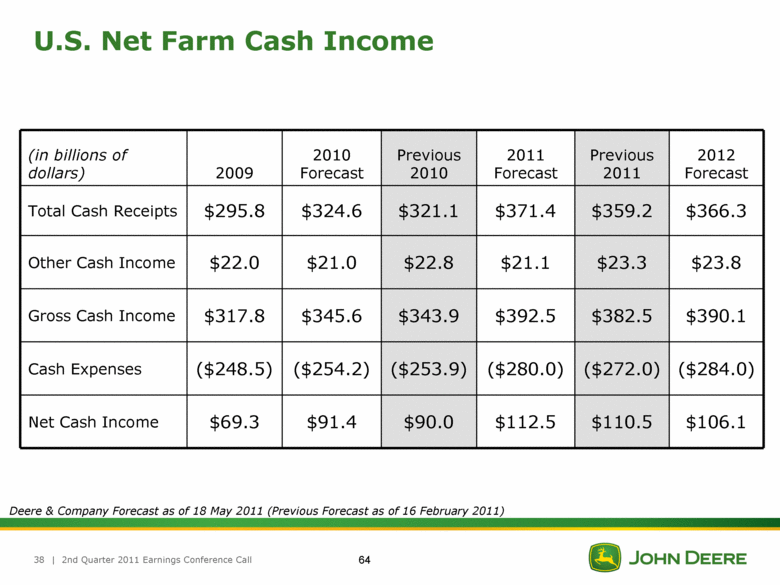
Farmers in most of the world’s major markets are experiencing solid levels of income due to strong global demand for agricultural commodities, low grain stocks in relation to use, and relatively high prices for key crops. Farm commodity prices have escalated sharply since the beginning of the year and are expected to average well above prior-year levels for 2011.
After staging a healthy advance in 2010, industry farm-machinery sales in the U.S. and Canada are forecast to be up 5 to 10 percent for 2011. Overall conditions remain positive and demand for high-horsepower equipment continues to be strong. Production limits and transitional issues, both associated with the broad launch of Interim Tier 4 emissions-compliant equipment, are having a moderating effect on near-term sales potential.
Industry sales in the EU 27 nations of Western and Central Europe are forecast to increase by about 15 percent, while sales in the Commonwealth of Independent States are expected to see notably stronger gains from the previous year’s depressed level. Farm conditions are strengthening in the European and CIS markets. Sales in Asia are forecast to grow strongly again this year.
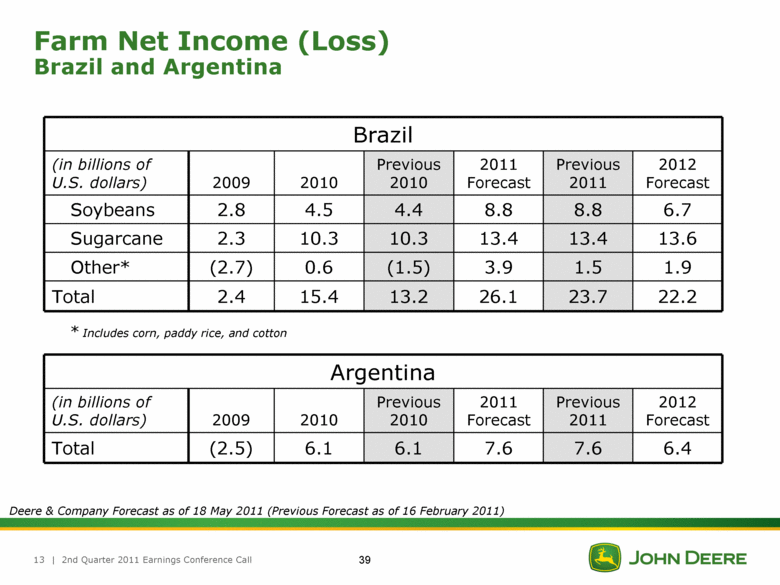
In South America, industry sales for the year are projected to be down 5 to 10 percent versus the strong levels of 2010. Weakness in the small-tractor market in Brazil and recently enacted trade policies in Argentina are contributing to the decline. Deere’s own sales in the region are benefiting from a broader lineup of recently introduced products.
Industry sales of turf and utility equipment in the U.S. and Canada are expected to be flat after experiencing modest recovery in 2010.
|
Deere Announces Second-Quarter Earnings |
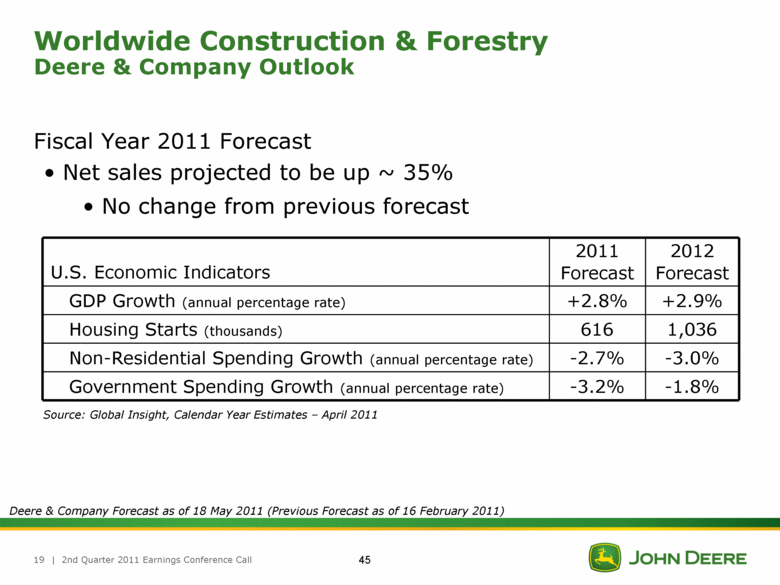
Construction & Forestry. Deere’s worldwide sales of construction and forestry equipment are forecast to rise by about 35 percent for 2011. The increase reflects somewhat-improved market conditions in relation to the prior year’s low level and increased activity outside of the U.S. and Canada. Construction equipment sales to independent rental companies are seeing growth, while world forestry markets are experiencing further improvement as a result of strong wood and pulp prices.
Financial Services. Full-year 2011 net income attributable to Deere & Company for the financial services operations is forecast to be approximately $435 million. The forecast increase from 2010 is primarily due to growth in the portfolio and a lower provision for credit losses.
John Deere Capital Corporation
The following is disclosed on behalf of the company’s credit subsidiary, John Deere Capital Corporation (JDCC), in connection with the disclosure requirements applicable to its periodic issuance of debt securities in the public market.
Net income attributable to John Deere Capital Corporation was $85.9 million for the second quarter and $169.6 million year to date, compared with $69.4 million and $133.4 million for the respective periods last year. Results were higher for both periods primarily due to growth in the portfolio and a lower provision for credit losses.
Net receivables and leases financed by JDCC were $22.482 billion at April 30, 2011, compared with $19.818 billion last year.
|
Deere Announces Second-Quarter Earnings |
APPENDIX
DEERE & COMPANY
SUPPLEMENTAL STATEMENT OF CONSOLIDATED INCOME INFORMATION
RECONCILIATION OF GAAP TO NON-GAAP FINANCIAL MEASURES
(Millions, except per-share amounts)
(Unaudited)
In addition to reporting financial results in conformity with accounting principles generally accepted in the United States (GAAP), the company also discusses non-GAAP measures that exclude the tax charge due to the enactment of U.S. health-care legislation during the company’s second fiscal quarter in 2010. Net income attributable to Deere & Company and diluted earnings per share measures that exclude this item are not in accordance with, nor are they a substitute for, GAAP measures. The company believes that discussion of results excluding this item provides a useful analysis of ongoing operating trends.
The table below provides a reconciliation of the non-GAAP financial measure with the most directly comparable GAAP financial measure for the three months ended April 30, 2010.
|
|
|
Three Months Ended |
| ||||
|
|
|
April 30, 2010 |
| ||||
|
|
|
|
|
|
| ||
|
|
|
Net Income |
|
Diluted |
| ||
|
|
|
|
|
|
| ||
|
GAAP measure |
|
$ |
547.5 |
|
$ |
1.28 |
|
|
|
|
|
|
|
| ||
|
Tax charge due to enactment of Patient Protection and Affordable Care Act as amended by the Healthcare and Education Reconciliation Act of 2010 |
|
129.5 |
|
.30 |
| ||
|
|
|
|
|
|
| ||
|
Non-GAAP measure |
|
$ |
677.0 |
|
$ |
1.58 |
|
|
Deere Announces Second-Quarter Earnings |
Safe Harbor Statement
Safe Harbor Statement under the Private Securities Litigation Reform Act of 1995: Statements under “Company Outlook & Summary,” “Market Conditions & Outlook,” and other forward-looking statements herein that relate to future events, expectations, trends and operating periods involve certain factors that are subject to change, and important risks and uncertainties that could cause actual results to differ materially. Some of these risks and uncertainties could affect particular lines of business, while others could affect all of the company’s businesses.
The company’s agricultural equipment business is subject to a number of uncertainties including the many interrelated factors that affect farmers’ confidence. These factors include worldwide economic conditions, demand for agricultural products, world grain stocks, weather conditions (including its effects on timely planting and harvesting), soil conditions, harvest yields, prices for commodities and livestock, crop and livestock production expenses, availability of transport for crops, the growth of non-food uses for some crops (including ethanol and biodiesel production), real estate values, available acreage for farming, the land ownership policies of various governments, changes in government farm programs and policies (including those in the U.S., Russia, Argentina and Brazil), international reaction to such programs, global trade agreements, animal diseases and their effects on poultry, beef and pork consumption and prices, crop pests and diseases, and the level of farm product exports (including concerns about genetically modified organisms).
Factors affecting the outlook for the company’s turf and utility equipment include general economic conditions, consumer confidence, weather conditions, customer profitability, consumer borrowing patterns, consumer purchasing preferences, housing starts, infrastructure investment, spending by municipalities and golf courses, and consumable input costs.
General economic conditions, consumer spending patterns, real estate and housing prices, the number of housing starts and interest rates are
|
Deere Announces Second-Quarter Earnings |
especially important to sales of the company’s construction and forestry equipment. The levels of public and non-residential construction also impact the results of the company’s construction and forestry segment. Prices for pulp, paper, lumber and structural panels are important to sales of forestry equipment.
All of the company’s businesses and its reported results are affected by general economic conditions in the global markets in which the company operates, especially material changes in economic activity in these markets; customer confidence in general economic conditions; foreign currency exchange rates and their volatility, especially fluctuations in the value of the U.S. dollar; interest rates; and inflation and deflation rates. General economic conditions can affect demand for the company’s equipment as well.
Customer and company operations and results could be affected by changes in weather patterns (including the effects of dry weather in France, Germany and Poland and the effects of flooding in the U.S.); the political and social stability of the global markets in which the company operates; the effects of, or response to, terrorism and security threats; wars and other conflicts and the threat thereof; and the spread of major epidemics.
Significant changes in market liquidity conditions and any failure to comply with financial covenants in credit agreements could impact access to funding and funding costs, which could reduce the company’s earnings and cash flows. Market conditions could also negatively impact customer access to capital for purchases of the company’s products; borrowing and repayment practices; and the number and size of customer loan delinquencies and defaults. A sovereign debt crisis, in Europe or elsewhere, could negatively impact currencies, global financial markets, social and political stability, funding sources and costs, customers, and company operations and results. State debt crises also could negatively impact customers, suppliers, demand for equipment, and company operations and results. The company’s investment management activities could be impaired by changes in the equity and bond markets, which would negatively affect earnings.
|
Deere Announces Second-Quarter Earnings |
Additional factors that could materially affect the company’s operations, access to capital, expenses and results include changes in and the impact of governmental trade, banking, monetary and fiscal policies, including financial regulatory reform and its effects on the consumer finance industry, derivatives and other areas, and governmental programs in particular jurisdictions or for the benefit of certain industries or sectors (including protectionist policies and trade and licensing restrictions that could disrupt international commerce); actions by the U.S. Federal Reserve Board and other central banks; actions by the U.S. Securities and Exchange Commission (SEC), the U.S. Commodity Futures Trading Commission and other financial regulators; actions by environmental, health and safety regulatory agencies, including those related to engine emissions (in particular Interim Tier 4 and Final Tier 4 emission requirements), carbon emissions, noise and the risk of climate change; changes in labor regulations; changes to accounting standards; changes in tax rates and regulations; and actions by other regulatory bodies including changes in laws and regulations affecting the sectors in which the company operates.
Other factors that could materially affect results include production, design and technological innovations and difficulties, including capacity and supply constraints and prices; the availability and prices of strategically sourced materials, components and whole goods; delays or disruptions in the company’s supply chain due to weather, natural disasters or financial hardship or the loss of liquidity by suppliers (including the impact of the earthquake and resulting events in Japan); start-up of new plants and new products; the success of new product initiatives and customer acceptance of new products; changes in customer product preferences and sales mix whether as a result of changes in equipment design to meet government regulations or for other reasons; oil and energy prices and supplies; the availability and cost of freight; actions of competitors in the various industries in which the company competes, particularly price discounting; dealer practices especially as to levels of new and used field inventories; labor relations; acquisitions and divestitures of businesses, the integration of
|
Deere Announces Second-Quarter Earnings |
new businesses; the implementation of organizational changes; difficulties related to the conversion and implementation of enterprise resource planning systems that disrupt business, negatively impact supply or distribution relationships or create higher than expected costs; changes in company declared dividends and common stock issuances and repurchases.
Company results are also affected by changes in the level of employee retirement benefits, changes in market values of investment assets and the level of interest rates, which impact retirement benefit costs, and significant changes in health care costs including those which may result from governmental action.
The liquidity and ongoing profitability of John Deere Capital Corporation and other credit subsidiaries depend largely on timely access to capital to meet future cash flow requirements and fund operations and the costs associated with engaging in diversified funding activities and to fund purchases of the company’s products. If market uncertainty increases and general economic conditions worsen, funding could be unavailable or insufficient. Additionally, customer confidence levels may result in declines in credit applications and increases in delinquencies and default rates, which could materially impact write-offs and provisions for credit losses.
The company’s outlook is based upon assumptions relating to the factors described above, which are sometimes based upon estimates and data prepared by government agencies. Such estimates and data are often revised. The company, except as required by law, undertakes no obligation to update or revise its outlook, whether as a result of new developments or otherwise. Further information concerning the company and its businesses, including factors that potentially could materially affect the company’s financial results, is included in the company’s other filings with the SEC (including, but not limited to, the factors discussed in Item 1A. Risk Factors of the company’s most recent annual report on Form 10-K and quarterly reports on Form 10-Q).
|
Deere Announces Second-Quarter Earnings |
Second Quarter 2011 Press Release
(in millions of dollars)
Unaudited
|
|
|
Three Months Ended |
|
Six Months Ended |
| ||||||||||||
|
|
|
2011 |
|
2010 |
|
% |
|
2011 |
|
2010 |
|
% |
| ||||
|
|
|
|
|
|
|
|
|
|
|
|
|
|
| ||||
|
Net sales and revenues: |
|
|
|
|
|
|
|
|
|
|
|
|
| ||||
|
Agriculture and turf |
|
$ |
6,999 |
|
$ |
5,637 |
|
+24 |
|
$ |
11,369 |
|
$ |
9,245 |
|
+23 |
|
|
Construction and forestry |
|
1,329 |
|
911 |
|
+46 |
|
2,472 |
|
1,540 |
|
+61 |
| ||||
|
Total net sales |
|
8,328 |
|
6,548 |
|
+27 |
|
13,841 |
|
10,785 |
|
+28 |
| ||||
|
Financial services * |
|
491 |
|
499 |
|
-2 |
|
998 |
|
1,005 |
|
-1 |
| ||||
|
Other revenues |
|
91 |
|
84 |
|
+8 |
|
190 |
|
176 |
|
+8 |
| ||||
|
Total net sales and revenues |
|
$ |
8,910 |
|
$ |
7,131 |
|
+25 |
|
$ |
15,029 |
|
$ |
11,966 |
|
+26 |
|
|
|
|
|
|
|
|
|
|
|
|
|
|
|
| ||||
|
Operating profit (loss): ** |
|
|
|
|
|
|
|
|
|
|
|
|
| ||||
|
Agriculture and turf |
|
$ |
1,163 |
|
$ |
952 |
|
+22 |
|
$ |
1,720 |
|
$ |
1,304 |
|
+32 |
|
|
Construction and forestry |
|
105 |
|
36 |
|
+192 |
|
194 |
|
(1) |
|
|
| ||||
|
Financial services * |
|
163 |
|
110 |
|
+48 |
|
335 |
|
212 |
|
+58 |
| ||||
|
Total operating profit |
|
1,431 |
|
1,098 |
|
+30 |
|
2,249 |
|
1,515 |
|
+48 |
| ||||
|
Other reconciling items *** |
|
(527) |
|
(551) |
|
-4 |
|
(831) |
|
(724) |
|
+15 |
| ||||
|
Net income attributable to Deere & Company |
|
$ |
904 |
|
$ |
547 |
|
+65 |
|
$ |
1,418 |
|
$ |
791 |
|
+79 |
|
|
|
|
|
|
|
|
|
|
|
|
|
|
|
| ||||
|
Equipment operations outside the U.S. and Canada: |
|
|
|
|
|
|
|
|
|
|
|
|
| ||||
|
Net sales |
|
$ |
3,403 |
|
$ |
2,341 |
|
+45 |
|
$ |
5,496 |
|
$ |
4,052 |
|
+36 |
|
|
Operating profit |
|
334 |
|
207 |
|
+61 |
|
548 |
|
325 |
|
+69 |
| ||||
* At the beginning of the first quarter of 2011, the Company combined the reporting of the credit segment and the “Other” segment into the financial services segment. The “Other” segment consisted of an insurance business related to extended warranty policies that did not meet the materiality threshold of reporting. The revenues and operating profit for previous periods were revised as shown above or as follows:
|
|
|
Third Quarter |
|
Years |
|
|
|
|
|
|
| ||
|
|
|
2010 |
|
2010 |
|
2009 |
|
|
|
|
|
|
|
|
Financial Services |
|
|
|
|
|
|
|
|
|
|
|
|
|
|
Revenues |
|
528 |
|
2,073 |
|
2,029 |
|
|
|
|
|
|
|
|
Operating profit |
|
148 |
|
499 |
|
242 |
|
|
|
|
|
|
|
** Operating profit (loss) is income from continuing operations before corporate expenses, certain external interest expense, certain foreign exchange gains and losses and income taxes. Operating profit of the financial services segment includes the effect of interest expense and foreign exchange gains or losses.
*** Other reconciling items are primarily corporate expenses, certain external interest expense, certain foreign exchange gains and losses, income taxes and net income attributable to noncontrolling interests.
DEERE & COMPANY
STATEMENT OF CONSOLIDATED INCOME
For the Three Months Ended April 30, 2011 and 2010
(In millions of dollars and shares except per share amounts) Unaudited
|
|
|
2011 |
|
2010 |
| ||
|
|
|
|
|
|
| ||
|
Net Sales and Revenues |
|
|
|
|
| ||
|
Net sales |
|
$ |
8,327.6 |
|
$ |
6,548.2 |
|
|
Finance and interest income |
|
468.5 |
|
435.1 |
| ||
|
Other income |
|
113.6 |
|
147.6 |
| ||
|
Total |
|
8,909.7 |
|
7,130.9 |
| ||
|
|
|
|
|
|
| ||
|
Costs and Expenses |
|
|
|
|
| ||
|
Cost of sales |
|
6,106.9 |
|
4,765.2 |
| ||
|
Research and development expenses |
|
298.5 |
|
266.0 |
| ||
|
Selling, administrative and general expenses |
|
828.2 |
|
733.3 |
| ||
|
Interest expense |
|
192.3 |
|
207.3 |
| ||
|
Other operating expenses |
|
143.1 |
|
170.2 |
| ||
|
Total |
|
7,569.0 |
|
6,142.0 |
| ||
|
|
|
|
|
|
| ||
|
Income of Consolidated Group before Income Taxes |
|
1,340.7 |
|
988.9 |
| ||
|
Provision for income taxes |
|
438.9 |
|
448.4 |
| ||
|
Income of Consolidated Group |
|
901.8 |
|
540.5 |
| ||
|
Equity in income of unconsolidated affiliates |
|
4.9 |
|
9.3 |
| ||
|
Net Income |
|
906.7 |
|
549.8 |
| ||
|
Less: Net income attributable to noncontrolling interests |
|
2.4 |
|
2.3 |
| ||
|
Net Income Attributable to Deere & Company |
|
$ |
904.3 |
|
$ |
547.5 |
|
|
|
|
|
|
|
| ||
|
Per Share Data |
|
|
|
|
| ||
|
Basic |
|
$ |
2.15 |
|
$ |
1.29 |
|
|
Diluted |
|
$ |
2.12 |
|
$ |
1.28 |
|
|
|
|
|
|
|
| ||
|
Average Shares Outstanding |
|
|
|
|
| ||
|
Basic |
|
420.7 |
|
424.4 |
| ||
|
Diluted |
|
426.4 |
|
429.0 |
| ||
|
|
|
|
|
|
| ||
See Condensed Notes to Interim Financial Statements.
DEERE & COMPANY
STATEMENT OF CONSOLIDATED INCOME
For the Six Months Ended April 30, 2011 and 2010
(In millions of dollars and shares except per share amounts) Unaudited
|
|
|
2011 |
|
2010 |
| ||
|
Net Sales and Revenues |
|
|
|
|
| ||
|
Net sales |
|
$ |
13,841.4 |
|
$ |
10,785.5 |
|
|
Finance and interest income |
|
928.6 |
|
902.3 |
| ||
|
Other income |
|
258.9 |
|
277.9 |
| ||
|
Total |
|
15,028.9 |
|
11,965.7 |
| ||
|
|
|
|
|
|
| ||
|
Costs and Expenses |
|
|
|
|
| ||
|
Cost of sales |
|
10,201.0 |
|
7,970.7 |
| ||
|
Research and development expenses |
|
567.4 |
|
501.7 |
| ||
|
Selling, administrative and general expenses |
|
1,493.1 |
|
1,375.6 |
| ||
|
Interest expense |
|
394.8 |
|
425.7 |
| ||
|
Other operating expenses |
|
285.9 |
|
338.9 |
| ||
|
Total |
|
12,942.2 |
|
10,612.6 |
| ||
|
|
|
|
|
|
| ||
|
Income of Consolidated Group before Income Taxes |
|
2,086.7 |
|
1,353.1 |
| ||
|
Provision for income taxes |
|
671.0 |
|
558.3 |
| ||
|
Income of Consolidated Group |
|
1,415.7 |
|
794.8 |
| ||
|
Equity in income of unconsolidated affiliates |
|
5.4 |
|
.6 |
| ||
|
Net Income |
|
1,421.1 |
|
795.4 |
| ||
|
Less: Net income attributable to noncontrolling interests |
|
3.0 |
|
4.7 |
| ||
|
Net Income Attributable to Deere & Company |
|
$ |
1,418.1 |
|
$ |
790.7 |
|
|
|
|
|
|
|
| ||
|
Per Share Data |
|
|
|
|
| ||
|
Basic |
|
$ |
3.36 |
|
$ |
1.86 |
|
|
Diluted |
|
$ |
3.32 |
|
$ |
1.85 |
|
|
|
|
|
|
|
| ||
|
Average Shares Outstanding |
|
|
|
|
| ||
|
Basic |
|
421.3 |
|
424.0 |
| ||
|
Diluted |
|
427.0 |
|
428.2 |
| ||
|
|
|
|
|
|
| ||
See Condensed Notes to Interim Financial Statements.
DEERE & COMPANY
CONDENSED CONSOLIDATED BALANCE SHEET
(In millions of dollars) Unaudited
|
|
|
April 30 |
|
October 31 |
|
April 30 |
| |||
|
|
|
2011 |
|
2010 |
|
2010 |
| |||
|
Assets |
|
|
|
|
|
|
| |||
|
Cash and cash equivalents |
|
$ |
3,949.8 |
|
$ |
3,790.6 |
|
$ |
3,614.9 |
|
|
Marketable securities |
|
239.5 |
|
227.9 |
|
234.2 |
| |||
|
Receivables from unconsolidated affiliates |
|
45.1 |
|
38.8 |
|
37.7 |
| |||
|
Trade accounts and notes receivable - net |
|
4,157.4 |
|
3,464.2 |
|
4,014.2 |
| |||
|
Financing receivables - net |
|
18,455.4 |
|
17,682.2 |
|
15,039.7 |
| |||
|
Financing receivables securitized - net |
|
2,871.2 |
|
2,238.3 |
|
3,084.6 |
| |||
|
Other receivables |
|
828.6 |
|
925.6 |
|
610.6 |
| |||
|
Equipment on operating leases - net |
|
1,945.2 |
|
1,936.2 |
|
1,717.3 |
| |||
|
Inventories |
|
4,687.0 |
|
3,063.0 |
|
3,002.9 |
| |||
|
Property and equipment - net |
|
3,968.5 |
|
3,790.7 |
|
4,430.4 |
| |||
|
Investments in unconsolidated affiliates |
|
220.9 |
|
244.5 |
|
227.0 |
| |||
|
Goodwill |
|
1,038.7 |
|
998.6 |
|
1,006.4 |
| |||
|
Other intangible assets - net |
|
130.7 |
|
117.0 |
|
129.3 |
| |||
|
Retirement benefits |
|
200.8 |
|
146.7 |
|
169.0 |
| |||
|
Deferred income taxes |
|
2,825.8 |
|
2,477.1 |
|
2,593.4 |
| |||
|
Other assets |
|
1,020.9 |
|
1,194.0 |
|
1,102.5 |
| |||
|
Assets held for sale |
|
|
|
931.4 |
|
|
| |||
|
Total Assets |
|
$ |
46,585.5 |
|
$ |
43,266.8 |
|
$ |
41,014.1 |
|
|
|
|
|
|
|
|
|
| |||
|
Liabilities and Stockholders’ Equity |
|
|
|
|
|
|
| |||
|
Short-term borrowings |
|
$ |
7,071.9 |
|
$ |
5,325.7 |
|
$ |
3,195.0 |
|
|
Short-term securitization borrowings |
|
2,821.5 |
|
2,208.8 |
|
3,065.6 |
| |||
|
Payables to unconsolidated affiliates |
|
193.5 |
|
203.5 |
|
151.4 |
| |||
|
Accounts payable and accrued expenses |
|
6,777.2 |
|
6,481.7 |
|
5,625.9 |
| |||
|
Deferred income taxes |
|
162.6 |
|
144.3 |
|
136.5 |
| |||
|
Long-term borrowings |
|
16,192.2 |
|
16,814.5 |
|
17,375.8 |
| |||
|
Retirement benefits and other liabilities |
|
5,933.0 |
|
5,784.9 |
|
5,804.5 |
| |||
|
Total liabilities |
|
39,151.9 |
|
36,963.4 |
|
35,354.7 |
| |||
|
Total Deere & Company stockholders’ equity |
|
7,423.3 |
|
6,290.3 |
|
5,650.9 |
| |||
|
Noncontrolling interests |
|
10.3 |
|
13.1 |
|
8.5 |
| |||
|
Total stockholders’ equity |
|
7,433.6 |
|
6,303.4 |
|
5,659.4 |
| |||
|
Total Liabilities and Stockholders’ Equity |
|
$ |
46,585.5 |
|
$ |
43,266.8 |
|
$ |
41,014.1 |
|
|
|
|
|
|
|
|
|
| |||
See Condensed Notes to Interim Financial Statements.
DEERE & COMPANY
STATEMENT OF CONSOLIDATED CASH FLOWS
For the Six Months Ended April 30, 2011 and 2010
(In millions of dollars) Unaudited
|
|
|
2011 |
|
2010 |
| ||
|
Cash Flows from Operating Activities |
|
|
|
|
| ||
|
Net income |
|
$ |
1,421.1 |
|
$ |
795.4 |
|
|
Adjustments to reconcile net income to net cash provided by (used for) operating activities: |
|
|
|
|
| ||
|
Provision for doubtful receivables |
|
13.7 |
|
59.3 |
| ||
|
Provision for depreciation and amortization |
|
448.7 |
|
463.4 |
| ||
|
Share-based compensation expense |
|
33.1 |
|
51.7 |
| ||
|
Undistributed earnings of unconsolidated affiliates |
|
4.1 |
|
4.5 |
| ||
|
Provision (credit) for deferred income taxes |
|
(310.3) |
|
109.1 |
| ||
|
Changes in assets and liabilities: |
|
|
|
|
| ||
|
Trade, notes and financing receivables related to sales |
|
(1,228.4) |
|
(1,220.4) |
| ||
|
Inventories |
|
(1,623.6) |
|
(754.9) |
| ||
|
Accounts payable and accrued expenses |
|
284.3 |
|
458.6 |
| ||
|
Accrued income taxes payable/receivable |
|
239.5 |
|
199.1 |
| ||
|
Retirement benefits |
|
220.2 |
|
(34.5) |
| ||
|
Other |
|
(167.7) |
|
285.3 |
| ||
|
Net cash provided by (used for) operating activities |
|
(665.3) |
|
416.6 |
| ||
|
|
|
|
|
|
| ||
|
Cash Flows from Investing Activities |
|
|
|
|
| ||
|
Collections of receivables (excluding receivables related to sales) |
|
6,664.8 |
|
5,889.8 |
| ||
|
Proceeds from maturities and sales of marketable securities |
|
18.8 |
|
9.2 |
| ||
|
Proceeds from sales of equipment on operating leases |
|
383.4 |
|
330.9 |
| ||
|
Government grants related to property and equipment |
|
|
|
21.6 |
| ||
|
Proceeds from sales of businesses, net of cash sold |
|
893.5 |
|
5.8 |
| ||
|
Cost of receivables (excluding receivables related to sales) |
|
(7,041.7) |
|
(6,034.9) |
| ||
|
Purchases of marketable securities |
|
(34.0) |
|
(45.7) |
| ||
|
Purchases of property and equipment |
|
(441.0) |
|
(311.2) |
| ||
|
Cost of equipment on operating leases acquired |
|
(265.7) |
|
(208.2) |
| ||
|
Acquisitions of businesses, net of cash acquired |
|
(46.6) |
|
(41.6) |
| ||
|
Other |
|
(121.0) |
|
(65.8) |
| ||
|
Net cash provided by (used for) investing activities |
|
10.5 |
|
(450.1) |
| ||
|
|
|
|
|
|
| ||
|
Cash Flows from Financing Activities |
|
|
|
|
| ||
|
Increase (decrease) in total short-term borrowings |
|
803.2 |
|
(77.3) |
| ||
|
Proceeds from long-term borrowings |
|
1,440.6 |
|
939.8 |
| ||
|
Payments of long-term borrowings |
|
(782.1) |
|
(1,609.2) |
| ||
|
Proceeds from issuance of common stock |
|
160.7 |
|
43.5 |
| ||
|
Repurchases of common stock |
|
(601.2) |
|
(3.8) |
| ||
|
Dividends paid |
|
(275.0) |
|
(237.6) |
| ||
|
Excess tax benefits from share-based compensation |
|
64.7 |
|
13.7 |
| ||
|
Other |
|
(24.9) |
|
(19.9) |
| ||
|
Net cash provided by (used for) financing activities |
|
786.0 |
|
(950.8) |
| ||
|
|
|
|
|
|
| ||
|
Effect of Exchange Rate Changes on Cash and Cash Equivalents |
|
28.0 |
|
(52.5) |
| ||
|
|
|
|
|
|
| ||
|
Net Increase (Decrease) in Cash and Cash Equivalents |
|
159.2 |
|
(1,036.8) |
| ||
|
Cash and Cash Equivalents at Beginning of Period |
|
3,790.6 |
|
4,651.7 |
| ||
|
Cash and Cash Equivalents at End of Period |
|
$ |
3,949.8 |
|
$ |
3,614.9 |
|
|
|
|
|
|
|
|
|
|
See Condensed Notes to Interim Financial Statements.
Condensed Notes to Interim Financial Statements (Unaudited)
(1) Dividends declared and paid on a per share basis were as follows:
|
|
|
Three Months Ended |
|
Six Months Ended |
| ||||||||||||
|
|
|
2011 |
|
2010 |
|
2011 |
|
2010 |
| ||||||||
|
|
|
|
|
|
|
|
|
|
|
|
|
|
| ||||
|
Dividends declared |
|
$ |
.35 |
|
|
$ |
.28 |
|
|
$ |
.70 |
|
|
$ |
.56 |
|
|
|
Dividends paid |
|
$ |
.35 |
|
|
$ |
.28 |
|
|
$ |
.65 |
|
|
$ |
.56 |
|
|
(2) The calculation of basic net income per share is based on the average number of shares outstanding. The calculation of diluted net income per share recognizes any dilutive effect of share-based compensation.
(3) Total comprehensive income, which includes all changes in the total stockholders’ equity during the period except transactions with stockholders, was as follows in millions of dollars:
|
|
|
Three Months Ended |
|
Six Months Ended |
| ||||||||
|
|
|
2011 |
|
2010 |
|
2011 |
|
2010 |
| ||||
|
|
|
|
|
|
|
|
|
|
| ||||
|
Net income |
|
$ |
906.7 |
|
$ |
549.8 |
|
$ |
1,421.1 |
|
$ |
795.4 |
|
|
Other comprehensive income, net of tax: |
|
|
|
|
|
|
|
|
| ||||
|
Retirement benefits adjustment |
|
36.1 |
|
155.2 |
|
102.3 |
|
227.0 |
| ||||
|
Cumulative translation adjustment |
|
223.7 |
|
34.4 |
|
244.1 |
|
(75.5) |
| ||||
|
Unrealized gain on derivatives |
|
4.5 |
|
15.6 |
|
9.6 |
|
21.9 |
| ||||
|
Unrealized gain (loss) on investments |
|
.7 |
|
.3 |
|
(3.4) |
|
.6 |
| ||||
|
Comprehensive income |
|
$ |
1,171.7 |
|
$ |
755.3 |
|
$ |
1,773.7 |
|
$ |
969.4 |
|
(4) The consolidated financial statements represent the consolidation of all Deere & Company’s subsidiaries. In the supplemental consolidating data in Note 5 to the financial statements, “Equipment Operations” include the Company’s agriculture and turf operations and construction and forestry operations, with “Financial Services” reflected on the equity basis.
(5) SUPPLEMENTAL CONSOLIDATING DATA
STATEMENT OF INCOME
For the Three Months Ended April 30, 2011 and 2010
|
(In millions of dollars) Unaudited |
|
EQUIPMENT OPERATIONS* |
|
FINANCIAL SERVICES |
| ||||||||||
|
|
|
2011 |
|
2010 |
|
2011 |
|
2010 |
| ||||||
|
Net Sales and Revenues |
|
|
|
|
|
|
|
|
|
|
| ||||
|
Net sales |
|
$ |
8,327.6 |
|
|
$ |
6,548.2 |
|
|
|
|
|
| ||
|
Finance and interest income |
|
18.0 |
|
|
7.6 |
|
$ |
513.0 |
|
|
$ |
482.8 |
| ||
|
Other income |
|
109.8 |
|
|
99.6 |
|
36.6 |
|
|
73.2 |
| ||||
|
Total |
|
8,455.4 |
|
|
6,655.4 |
|
549.6 |
|
|
556.0 |
| ||||
|
|
|
|
|
|
|
|
|
|
|
|
| ||||
|
Costs and Expenses |
|
|
|
|
|
|
|
|
|
|
| ||||
|
Cost of sales |
|
6,107.2 |
|
|
4,765.6 |
|
|
|
|
|
| ||||
|
Research and development expenses |
|
298.5 |
|
|
266.0 |
|
|
|
|
|
| ||||
|
Selling, administrative and general expenses |
|
728.4 |
|
|
611.1 |
|
102.8 |
|
|
124.9 |
| ||||
|
Interest expense |
|
50.1 |
|
|
45.4 |
|
156.2 |
|
|
171.8 |
| ||||
|
Interest compensation to Financial Services |
|
48.5 |
|
|
49.2 |
|
|
|
|
|
| ||||
|
Other operating expenses |
|
44.7 |
|
|
39.4 |
|
127.9 |
|
|
149.3 |
| ||||
|
Total |
|
7,277.4 |
|
|
5,776.7 |
|
386.9 |
|
|
446.0 |
| ||||
|
|
|
|
|
|
|
|
|
|
|
|
| ||||
|
Income of Consolidated Group before Income Taxes |
|
1,178.0 |
|
|
878.7 |
|
162.7 |
|
|
110.0 |
| ||||
|
Provision for income taxes |
|
381.0 |
|
|
424.8 |
|
57.9 |
|
|
23.4 |
| ||||
|
Income of Consolidated Group |
|
797.0 |
|
|
453.9 |
|
104.8 |
|
|
86.6 |
| ||||
|
|
|
|
|
|
|
|
|
|
|
|
| ||||
|
Equity in Income of Unconsolidated Subsidiaries and Affiliates |
|
|
|
|
|
|
|
|
|
|
| ||||
|
Financial Services |
|
105.1 |
|
|
86.9 |
|
.3 |
|
|
.2 |
| ||||
|
Other |
|
4.6 |
|
|
9.1 |
|
|
|
|
|
| ||||
|
Total |
|
109.7 |
|
|
96.0 |
|
.3 |
|
|
.2 |
| ||||
|
Net Income |
|
906.7 |
|
|
549.9 |
|
105.1 |
|
|
86.8 |
| ||||
|
Less: Net income (loss) attributable to noncontrolling interests |
|
2.4 |
|
|
2.4 |
|
|
|
|
(.1) |
| ||||
|
Net Income Attributable to Deere & Company |
|
$ |
904.3 |
|
|
$ |
547.5 |
|
$ |
105.1 |
|
|
$ |
86.9 |
|
|
|
|
|
|
|
|
|
|
|
|
|
| ||||
* Deere & Company with Financial Services on the equity basis.
The supplemental consolidating data is presented for informational purposes. Transactions between the “Equipment Operations” and “Financial Services” have been eliminated to arrive at the consolidated financial statements.
SUPPLEMENTAL CONSOLIDATING DATA (Continued)
STATEMENT OF INCOME
For the Six Months Ended April 30, 2011 and 2010
|
(In millions of dollars) Unaudited |
|
EQUIPMENT OPERATIONS* |
|
FINANCIAL SERVICES |
| |||||||||||||
|
|
|
2011 |
|
2010 |
|
2011 |
|
2010 |
| |||||||||
|
Net Sales and Revenues |
|
|
|
|
|
|
|
|
|
|
|
|
| |||||
|
Net sales |
|
$ |
13,841.4 |
|
|
$ |
10,785.5 |
|
|
|
|
|
|
|
| |||
|
Finance and interest income |
|
33.5 |
|
|
33.3 |
|
|
$ |
1,011.0 |
|
|
$ |
969.2 |
|
| |||
|
Other income |
|
223.7 |
|
|
189.8 |
|
|
93.7 |
|
|
146.3 |
|
| |||||
|
Total |
|
14,098.6 |
|
|
11,008.6 |
|
|
1,104.7 |
|
|
1,115.5 |
|
| |||||
|
|
|
|
|
|
|
|
|
|
|
|
|
|
| |||||
|
Costs and Expenses |
|
|
|
|
|
|
|
|
|
|
|
|
| |||||
|
Cost of sales |
|
10,201.6 |
|
|
7,971.4 |
|
|
|
|
|
|
|
| |||||
|
Research and development expenses |
|
567.4 |
|
|
501.7 |
|
|
|
|
|
|
|
| |||||
|
Selling, administrative and general expenses |
|
1,299.7 |
|
|
1,139.3 |
|
|
199.2 |
|
|
241.6 |
|
| |||||
|
Interest expense |
|
101.9 |
|
|
88.7 |
|
|
319.5 |
|
|
356.7 |
|
| |||||
|
Interest compensation to Financial Services |
|
89.3 |
|
|
91.8 |
|
|
|
|
|
|
|
| |||||
|
Other operating expenses |
|
86.3 |
|
|
73.5 |
|
|
251.6 |
|
|
306.2 |
|
| |||||
|
Total |
|
12,346.2 |
|
|
9,866.4 |
|
|
770.3 |
|
|
904.5 |
|
| |||||
|
|
|
|
|
|
|
|
|
|
|
|
|
|
| |||||
|
Income of Consolidated Group before Income Taxes |
|
1,752.4 |
|
|
1,142.2 |
|
|
334.4 |
|
|
211.0 |
|
| |||||
|
Provision for income taxes |
|
559.4 |
|
|
518.8 |
|
|
111.7 |
|
|
39.6 |
|
| |||||
|
Income of Consolidated Group |
|
1,193.0 |
|
|
623.4 |
|
|
222.7 |
|
|
171.4 |
|
| |||||
|
|
|
|
|
|
|
|
|
|
|
|
|
|
| |||||
|
Equity in Income of Unconsolidated Subsidiaries and Affiliates |
|
|
|
|
|
|
|
|
|
|
|
|
| |||||
|
Financial Services |
|
223.3 |
|
|
172.0 |
|
|
.6 |
|
|
.5 |
|
| |||||
|
Other |
|
4.8 |
|
|
.1 |
|
|
|
|
|
|
|
| |||||
|
Total |
|
228.1 |
|
|
172.1 |
|
|
.6 |
|
|
.5 |
|
| |||||
|
Net Income |
|
1,421.1 |
|
|
795.5 |
|
|
223.3 |
|
|
171.9 |
|
| |||||
|
Less: |
Net income (loss) attributable to noncontrolling interests |
|
3.0 |
|
|
4.8 |
|
|
|
|
|
(.1 |
) |
| ||||
|
Net Income Attributable to Deere & Company |
|
$ |
1,418.1 |
|
|
$ |
790.7 |
|
|
$ |
223.3 |
|
|
$ |
172.0 |
|
| |
|
|
|
|
|
|
|
|
|
|
|
|
|
|
| |||||
* Deere & Company with Financial Services on the equity basis.
The supplemental consolidating data is presented for informational purposes. Transactions between the “Equipment Operations” and “Financial Services” have been eliminated to arrive at the consolidated financial statements.
SUPPLEMENTAL CONSOLIDATING DATA (Continued)
CONDENSED BALANCE SHEET
|
|
|
|
|
|
|
|
|
|
|
|
|
|
|
|
|
|
|
|
|
|
(In millions of dollars) Unaudited |
|
EQUIPMENT OPERATIONS * |
|
| |||||||||||||||
|
|
|
April 30 |
|
October 31 |
|
April 30 |
|
April 30 |
|
October 31 |
|
April 30 |
| ||||||
|
|
|
|
|
|
|
|
|
|
|
|
|
|
| ||||||
|
Assets |
|
|
|
|
|
|
|
|
|
|
|
|
| ||||||
|
Cash and cash equivalents |
|
$ |
3,515.0 |
|
$ |
3,348.3 |
|
$ |
3,290.7 |
|
$ |
434.8 |
|
$ |
442.3 |
|
$ |
324.1 |
|
|
Marketable securities |
|
|
|
|
|
|
|
239.5 |
|
227.9 |
|
234.2 |
| ||||||
|
Receivables from unconsolidated subsidiaries and affiliates |
|
1,785.7 |
|
1,712.6 |
|
1,401.5 |
|
|
|
1.6 |
|
1.5 |
| ||||||
|
Trade accounts and notes receivable - net |
|
1,066.3 |
|
999.8 |
|
834.5 |
|
3,786.2 |
|
2,979.7 |
|
3,783.5 |
| ||||||
|
Financing receivable - net |
|
8.9 |
|
9.4 |
|
8.4 |
|
18,446.4 |
|
17,672.8 |
|
15,031.2 |
| ||||||
|
Financing receivables securitized - net |
|
|
|
|
|
|
|
2,871.2 |
|
2,238.3 |
|
3,084.6 |
| ||||||
|
Other receivables |
|
715.1 |
|
889.5 |
|
490.9 |
|
120.8 |
|
49.4 |
|
121.4 |
| ||||||
|
Equipment on operating leases - net |
|
|
|
|
|
|
|
1,945.2 |
|
1,936.2 |
|
1,717.3 |
| ||||||
|
Inventories |
|
4,687.0 |
|
3,063.0 |
|
3,002.9 |
|
|
|
|
|
|
| ||||||
|
Property and equipment - net |
|
3,902.0 |
|
3,722.4 |
|
3,368.2 |
|
66.5 |
|
68.3 |
|
1,062.2 |
| ||||||
|
Investments in unconsolidated subsidiaries and affiliates |
|
3,381.5 |
|
3,420.2 |
|
3,333.9 |
|
8.1 |
|
7.0 |
|
6.3 |
| ||||||
|
Goodwill |
|
1,038.7 |
|
998.6 |
|
1,006.4 |
|
|
|
|
|
|
| ||||||
|
Other intangible assets - net |
|
126.8 |
|
113.0 |
|
125.3 |
|
4.0 |
|
4.0 |
|
4.0 |
| ||||||
|
Retirement benefits |
|
200.0 |
|
145.8 |
|
167.9 |
|
29.9 |
|
31.4 |
|
6.9 |
| ||||||
|
Deferred income taxes |
|
2,917.7 |
|
2,737.1 |
|
2,750.9 |
|
103.8 |
|
103.2 |
|
98.7 |
| ||||||
|
Other assets |
|
446.4 |
|
381.2 |
|
355.9 |
|
574.6 |
|
812.9 |
|
746.9 |
| ||||||
|
Assets held for sale |
|
|
|
|
|
|
|
|
|
931.4 |
|
|
| ||||||
|
Total Assets |
|
$ |
23,791.1 |
|
$ |
21,540.9 |
|
$ |
20,137.4 |
|
$ |
28,631.0 |
|
$ |
27,506.4 |
|
$ |
26,222.8 |
|
|
|
|
|
|
|
|
|
|
|
|
|
|
|
| ||||||
|
Liabilities and Stockholders’ Equity |
|
|
|
|
|
|
|
|
|
|
|
|
| ||||||
|
Short-term borrowings |
|
$ |
431.6 |
|
$ |
85.0 |
|
$ |
368.7 |
|
$ |
6,640.3 |
|
$ |
5,240.7 |
|
$ |
2,826.2 |
|
|
Short-term securitization borrowings |
|
|
|
|
|
|
|
2,821.5 |
|
2,208.8 |
|
3,065.6 |
| ||||||
|
Payables to unconsolidated subsidiaries and affiliates |
|
193.5 |
|
205.2 |
|
152.9 |
|
1,740.5 |
|
1,673.7 |
|
1,363.8 |
| ||||||
|
Accounts payable and accrued expenses |
|
6,355.3 |
|
5,757.1 |
|
5,056.3 |
|
1,124.6 |
|
1,253.3 |
|
1,175.5 |
| ||||||
|
Deferred income taxes |
|
102.8 |
|
92.0 |
|
79.5 |
|
255.5 |
|
415.5 |
|
313.1 |
| ||||||
|
Long-term borrowings |
|
3,361.4 |
|
3,328.6 |
|
3,053.4 |
|
12,830.8 |
|
13,485.9 |
|
14,322.3 |
| ||||||
|
Retirement benefits and other liabilities |
|
5,912.9 |
|
5,771.6 |
|
5,768.9 |
|
49.2 |
|
43.8 |
|
41.4 |
| ||||||
|
Total liabilities |
|
16,357.5 |
|
15,239.5 |
|
14,479.7 |
|
25,462.4 |
|
24,321.7 |
|
23,107.9 |
| ||||||
|
Total Deere & Company stockholders’ equity |
|
7,423.3 |
|
6,290.3 |
|
5,650.9 |
|
3,168.6 |
|
3,182.7 |
|
3,113.3 |
| ||||||
|
Noncontrolling interests |
|
10.3 |
|
11.1 |
|
6.8 |
|
|
|
2.0 |
|
1.6 |
| ||||||
|
Total stockholders’ equity |
|
7,433.6 |
|
6,301.4 |
|
5,657.7 |
|
3,168.6 |
|
3,184.7 |
|
3,114.9 |
| ||||||
|
Total Liabilities and Stockholders’ Equity |
|
$ |
23,791.1 |
|
$ |
21,540.9 |
|
$ |
20,137.4 |
|
$ |
28,631.0 |
|
$ |
27,506.4 |
|
$ |
26,222.8 |
|
|
|
|
|
|
|
|
|
|
|
|
|
|
|
| ||||||
* Deere & Company with Financial Services on the equity basis.
The supplemental consolidating data is presented for informational purposes. Transactions between the “Equipment Operations” and “Financial Services” have been eliminated to arrive at the consolidated financial statements.
SUPPLEMENTAL CONSOLIDATING DATA (Continued)
STATEMENT OF CASH FLOWS
For the Six Months Ended April 30, 2011 and 2010
|
(In millions of dollars) Unaudited |
|
EQUIPMENT OPERATIONS* |
|
FINANCIAL SERVICES |
| ||||||||||||
|
|
|
2011 |
|
2010 |
|
2011 |
|
2010 |
| ||||||||
|
Cash Flows from Operating Activities |
|
|
|
|
|
|
|
|
|
|
|
|
| ||||
|
Net income |
|
$ |
1,421.1 |
|
|
$ |
795.5 |
|
|
$ |
223.3 |
|
|
$ |
171.9 |
|
|
|
Adjustments to reconcile net income to net cash provided by operating activities: |
|
|
|
|
|
|
|
|
|
|
|
|
| ||||
|
Provision for doubtful receivables |
|
1.4 |
|
|
1.7 |
|
|
12.2 |
|
|
57.6 |
|
| ||||
|
Provision for depreciation and amortization |
|
294.6 |
|
|
282.1 |
|
|
191.6 |
|
|
213.1 |
|
| ||||
|
Undistributed earnings of unconsolidated subsidiaries and affiliates |
|
(24.4 |
) |
|
(97.0 |
) |
|
(.6 |
) |
|
(.5 |
) |
| ||||
|
Provision (credit) for deferred income taxes |
|
(314.9 |
) |
|
108.3 |
|
|
4.6 |
|
|
.7 |
|
| ||||
|
Changes in assets and liabilities: |
|
|
|
|
|
|
|
|
|
|
|
|
| ||||
|
Receivables |
|
(20.4 |
) |
|
(105.9 |
) |
|
|
|
|
(9.4 |
) |
| ||||
|
Inventories |
|
(1,458.1 |
) |
|
(598.2 |
) |
|
|
|
|
|
|
| ||||
|
Accounts payable and accrued expenses |
|
465.1 |
|
|
604.9 |
|
|
(1.1 |
) |
|
(46.9 |
) |
| ||||
|
Accrued income taxes payable/receivable |
|
250.4 |
|
|
200.3 |
|
|
(10.9 |
) |
|
(1.1 |
) |
| ||||
|
Retirement benefits |
|
213.7 |
|
|
(42.4 |
) |
|
6.5 |
|
|
8.0 |
|
| ||||
|
Other |
|
(153.2 |
) |
|
127.7 |
|
|
39.3 |
|
|
232.0 |
|
| ||||
|
Net cash provided by operating activities |
|
675.3 |
|
|
1,277.0 |
|
|
464.9 |
|
|
625.4 |
|
| ||||
|
|
|
|
|
|
|
|
|
|
|
|
|
|
| ||||
|
Cash Flows from Investing Activities |
|
|
|
|
|
|
|
|
|
|
|
|
| ||||
|
Collections of receivables (excluding trade and wholesale) |
|
|
|
|
|
|
|
7,202.4 |
|
|
6,477.9 |
|
| ||||
|
Proceeds from maturities and sales of marketable securities |
|
|
|
|
|
|
|
18.8 |
|
|
9.2 |
|
| ||||
|
Proceeds from sales of equipment on operating leases |
|
|
|
|
|
|
|
383.4 |
|
|
330.9 |
|
| ||||
|
Government grants related to property and equipment |
|
|
|
|
|
|
|
|
|
|
21.6 |
|
| ||||
|
Proceeds from sales of businesses, net of cash sold |
|
893.5 |
|
|
5.8 |
|
|
|
|
|
|
|
| ||||
|
Cost of receivables acquired (excluding trade and wholesale) |
|
|
|
|
|
|
|
(7,575.1 |
) |
|
(6,476.0 |
) |
| ||||
|
Purchases of marketable securities |
|
|
|
|
|
|
|
(34.0 |
) |
|
(45.7 |
) |
| ||||
|
Purchases of property and equipment |
|
(440.2 |
) |
|
(281.3 |
) |
|
(.9 |
) |
|
(29.9 |
) |
| ||||
|
Cost of equipment on operating leases acquired |
|
|
|
|
|
|
|
(489.4 |
) |
|
(420.0 |
) |
| ||||
|
Acquisitions of businesses, net of cash acquired |
|
(46.6 |
) |
|
(33.3 |
) |
|
|
|
|
(8.3 |
) |
| ||||
|
Increase in trade and wholesale receivables |
|
|
|
|
|
|
|
(1,390.8 |
) |
|
(1,361.0 |
) |
| ||||
|
Other |
|
(60.7 |
) |
|
(59.7 |
) |
|
(86.3 |
) |
|
(39.6 |
) |
| ||||
|
Net cash provided by (used for) investing activities |
|
346.0 |
|
|
(368.5 |
) |
|
(1,971.9 |
) |
|
(1,540.9 |
) |
| ||||
|
|
|
|
|
|
|
|
|
|
|
|
|
|
| ||||
|
Cash Flows from Financing Activities |
|
|
|
|
|
|
|
|
|
|
|
|
| ||||
|
Increase (decrease) in total short-term borrowings |
|
291.8 |
|
|
(126.3 |
) |
|
511.4 |
|
|
49.0 |
|
| ||||
|
Change in intercompany receivables/payables |
|
(544.3 |
) |
|
(941.6 |
) |
|
544.3 |
|
|
941.6 |
|
| ||||
|
Proceeds from long-term borrowings |
|
31.6 |
|
|
.1 |
|
|
1,409.1 |
|
|
939.6 |
|
| ||||
|
Payments of long-term borrowings |
|
(11.5 |
) |
|
(5.9 |
) |
|
(770.6 |
) |
|
(1,603.3 |
) |
| ||||
|
Proceeds from issuance of common stock |
|
160.7 |
|
|
43.5 |
|
|
|
|
|
|
|
| ||||
|
Repurchases of common stock |
|
(601.2 |
) |
|
(3.8 |
) |
|
|
|
|
|
|
| ||||
|
Dividends paid |
|
(275.0 |
) |
|
(237.6 |
) |
|
(194.1 |
) |
|
(70.0 |
) |
| ||||
|
Excess tax benefits from share-based compensation |
|
64.7 |
|
|
13.7 |
|
|
|
|
|
|
|
| ||||
|
Other |
|
(9.3 |
) |
|
(9.5 |
) |
|
9.3 |
|
|
33.1 |
|
| ||||
|
Net cash provided by (used for) financing activities |
|
(892.5 |
) |
|
(1,267.4 |
) |
|
1,509.4 |
|
|
290.0 |
|
| ||||
|
|
|
|
|
|
|
|
|
|
|
|
|
|
| ||||
|
Effect of Exchange Rate Changes on Cash and Cash Equivalents |
|
37.9 |
|
|
(40.2 |
) |
|
(9.9 |
) |
|
(12.3 |
) |
| ||||
|
|
|
|
|
|
|
|
|
|
|
|
|
|
| ||||
|
Net Increase (Decrease) in Cash and Cash Equivalents |
|
166.7 |
|
|
(399.1 |
) |
|
(7.5 |
) |
|
(637.8 |
) |
| ||||
|
Cash and Cash Equivalents at Beginning of Period |
|
3,348.3 |
|
|
3,689.8 |
|
|
442.3 |
|
|
961.9 |
|
| ||||
|
Cash and Cash Equivalents at End of Period |
|
$ |
3,515.0 |
|
|
$ |
3,290.7 |
|
|
$ |
434.8 |
|
|
$ |
324.1 |
|
|
|
|
|
|
|
|
|
|
|
|
| ||||||||
* Deere & Company with Financial Services on the equity basis.
The supplemental consolidating data is presented for informational purposes. Transactions between the “Equipment Operations” and “Financial Services” have been eliminated to arrive at the consolidated financial statements.