False2021FYBP PLC0000313807trueP3YP3YP20Y00003138072021-01-012021-12-310000313807dei:BusinessContactMember2021-01-012021-12-310000313807bp:AmericanDepositarySharesMember2021-01-012021-12-310000313807ifrs-full:OrdinarySharesMember2021-01-012021-12-310000313807bp:FloatingRateGuaranteedNotesDue2022Member2021-01-012021-12-310000313807bp:A2500GuaranteedNotesDue2022Member2021-01-012021-12-310000313807bp:A2750GuaranteedNotesDue2023Member2021-01-012021-12-310000313807bp:A3994GuaranteedNotesDue2023Member2021-01-012021-12-310000313807bp:A3535GuaranteedNotesDue2024Member2021-01-012021-12-310000313807bp:A3814GuaranteedNotesDue2024Member2021-01-012021-12-310000313807bp:A3790GuaranteedNotesDue2024Member2021-01-012021-12-310000313807bp:A3194GuaranteedNotesDue2025Member2021-01-012021-12-310000313807bp:A3506GuaranteedNotesDue2025Member2021-01-012021-12-310000313807bp:A3796GuaranteedNotesDue2025Member2021-01-012021-12-310000313807bp:A3119GuaranteedNotesDue2026Member2021-01-012021-12-310000313807bp:A3410GuaranteedNotesDue2026Member2021-01-012021-12-310000313807bp:A3017GuaranteedNotesDue2027Member2021-01-012021-12-310000313807bp:A3279GuaranteedNotesDue2027Member2021-01-012021-12-310000313807bp:A3543GuaranteedNotesDue2027Member2021-01-012021-12-310000313807bp:A3588GuaranteedNotesDue2027Member2021-01-012021-12-310000313807bp:A3723GuaranteedNotesDue2028Member2021-01-012021-12-310000313807bp:A3937GuaranteedNotesDue2028Member2021-01-012021-12-310000313807bp:A4234GuaranteedNotesDue2028Member2021-01-012021-12-310000313807bp:A1749GuaranteedNotesDue2030Member2021-01-012021-12-310000313807bp:A3633GuaranteedNotesDue2030Member2021-01-012021-12-310000313807bp:A3060GuaranteedNotesDue2041Member2021-01-012021-12-310000313807bp:A2772GuaranteedNotesDue2050Member2021-01-012021-12-310000313807bp:A3000GuaranteedNotesDue2050Member2021-01-012021-12-310000313807bp:A3067GuaranteedNotesDue2050Member2021-01-012021-12-310000313807bp:A2939GuaranteedNotesDue2051Member2021-01-012021-12-310000313807bp:A3001GuaranteedNotesDue2052Member2021-01-012021-12-310000313807bp:A3379GuaranteedNotesDue2061Member2021-01-012021-12-310000313807bp:A4375PerpetualSubordinatedNonCall525FixedRateResetNotesMember2021-01-012021-12-310000313807bp:A4875PerpetualSubordinatedNonCall10FixedRateResetNotesMember2021-01-012021-12-310000313807ifrs-full:OrdinarySharesMember2021-12-31xbrli:shares0000313807bp:FirstPreferenceSharesMember2021-12-310000313807bp:SecondPreferenceSharesMember2021-12-31iso4217:USD00003138072020-01-012020-12-3100003138072019-01-012019-12-31iso4217:USDxbrli:shares0000313807ifrs-full:OrdinarySharesMember2020-01-012020-12-310000313807ifrs-full:OrdinarySharesMember2019-01-012019-12-310000313807bp:AmericanDepositaryShareMember2021-01-012021-12-310000313807bp:AmericanDepositaryShareMember2020-01-012020-12-310000313807bp:AmericanDepositaryShareMember2019-01-012019-12-310000313807bp:ShareCapitalAndCapitalReserveMember2020-12-310000313807ifrs-full:TreasurySharesMember2020-12-310000313807ifrs-full:ReserveOfExchangeDifferencesOnTranslationMember2020-12-310000313807bp:TotalReserveOfAvailableForSaleSecuritiesAndCashFlowHedgesMember2020-12-310000313807ifrs-full:RetainedEarningsMember2020-12-310000313807ifrs-full:EquityAttributableToOwnersOfParentMember2020-12-310000313807bp:NonControllingInterestsHybridBondsMember2020-12-310000313807bp:NonControllingInterestsOtherInterestMember2020-12-3100003138072020-12-310000313807ifrs-full:RetainedEarningsMember2021-01-012021-12-310000313807ifrs-full:EquityAttributableToOwnersOfParentMember2021-01-012021-12-310000313807bp:NonControllingInterestsHybridBondsMember2021-01-012021-12-310000313807bp:NonControllingInterestsOtherInterestMember2021-01-012021-12-310000313807ifrs-full:ReserveOfExchangeDifferencesOnTranslationMember2021-01-012021-12-310000313807bp:TotalReserveOfAvailableForSaleSecuritiesAndCashFlowHedgesMember2021-01-012021-12-310000313807bp:ShareCapitalAndCapitalReserveMember2021-01-012021-12-310000313807ifrs-full:TreasurySharesMember2021-01-012021-12-310000313807bp:ShareCapitalAndCapitalReserveMember2021-12-310000313807ifrs-full:TreasurySharesMember2021-12-310000313807ifrs-full:ReserveOfExchangeDifferencesOnTranslationMember2021-12-310000313807bp:TotalReserveOfAvailableForSaleSecuritiesAndCashFlowHedgesMember2021-12-310000313807ifrs-full:RetainedEarningsMember2021-12-310000313807ifrs-full:EquityAttributableToOwnersOfParentMember2021-12-310000313807bp:NonControllingInterestsHybridBondsMember2021-12-310000313807bp:NonControllingInterestsOtherInterestMember2021-12-3100003138072021-12-310000313807bp:ShareCapitalAndCapitalReserveMember2019-12-310000313807ifrs-full:TreasurySharesMember2019-12-310000313807ifrs-full:ReserveOfExchangeDifferencesOnTranslationMember2019-12-310000313807bp:TotalReserveOfAvailableForSaleSecuritiesAndCashFlowHedgesMember2019-12-310000313807ifrs-full:RetainedEarningsMember2019-12-310000313807ifrs-full:EquityAttributableToOwnersOfParentMember2019-12-310000313807bp:NonControllingInterestsOtherInterestMember2019-12-3100003138072019-12-310000313807ifrs-full:RetainedEarningsMember2020-01-012020-12-310000313807ifrs-full:EquityAttributableToOwnersOfParentMember2020-01-012020-12-310000313807bp:NonControllingInterestsHybridBondsMember2020-01-012020-12-310000313807bp:NonControllingInterestsOtherInterestMember2020-01-012020-12-310000313807ifrs-full:ReserveOfExchangeDifferencesOnTranslationMember2020-01-012020-12-310000313807bp:TotalReserveOfAvailableForSaleSecuritiesAndCashFlowHedgesMember2020-01-012020-12-310000313807bp:ShareCapitalAndCapitalReserveMember2020-01-012020-12-310000313807ifrs-full:TreasurySharesMember2020-01-012020-12-310000313807bp:ShareCapitalAndCapitalReserveMember2018-12-310000313807ifrs-full:TreasurySharesMember2018-12-310000313807ifrs-full:ReserveOfExchangeDifferencesOnTranslationMember2018-12-310000313807bp:TotalReserveOfAvailableForSaleSecuritiesAndCashFlowHedgesMember2018-12-310000313807ifrs-full:RetainedEarningsMember2018-12-310000313807ifrs-full:EquityAttributableToOwnersOfParentMember2018-12-310000313807bp:NonControllingInterestsOtherInterestMember2018-12-3100003138072018-12-310000313807bp:IFRS16LeasesMembersrt:CumulativeEffectPeriodOfAdoptionAdjustmentMemberifrs-full:IncreaseDecreaseDueToChangesInAccountingPolicyRequiredByIFRSsMemberbp:TotalReserveOfAvailableForSaleSecuritiesAndCashFlowHedgesMember2018-12-310000313807bp:IFRS16LeasesMemberifrs-full:RetainedEarningsMembersrt:CumulativeEffectPeriodOfAdoptionAdjustmentMemberifrs-full:IncreaseDecreaseDueToChangesInAccountingPolicyRequiredByIFRSsMember2018-12-310000313807bp:IFRS16LeasesMembersrt:CumulativeEffectPeriodOfAdoptionAdjustmentMemberifrs-full:IncreaseDecreaseDueToChangesInAccountingPolicyRequiredByIFRSsMemberifrs-full:EquityAttributableToOwnersOfParentMember2018-12-310000313807bp:IFRS16LeasesMemberifrs-full:IncreaseDecreaseDueToChangesInAccountingPolicyRequiredByIFRSsMemberbp:NonControllingInterestsOtherInterestMember2018-12-310000313807bp:IFRS16LeasesMembersrt:CumulativeEffectPeriodOfAdoptionAdjustmentMemberifrs-full:IncreaseDecreaseDueToChangesInAccountingPolicyRequiredByIFRSsMember2018-12-310000313807srt:CumulativeEffectPeriodOfAdoptionAdjustedBalanceMemberbp:ShareCapitalAndCapitalReserveMember2018-12-310000313807ifrs-full:TreasurySharesMembersrt:CumulativeEffectPeriodOfAdoptionAdjustedBalanceMember2018-12-310000313807srt:CumulativeEffectPeriodOfAdoptionAdjustedBalanceMemberifrs-full:ReserveOfExchangeDifferencesOnTranslationMember2018-12-310000313807srt:CumulativeEffectPeriodOfAdoptionAdjustedBalanceMemberbp:TotalReserveOfAvailableForSaleSecuritiesAndCashFlowHedgesMember2018-12-310000313807ifrs-full:RetainedEarningsMembersrt:CumulativeEffectPeriodOfAdoptionAdjustedBalanceMember2018-12-310000313807srt:CumulativeEffectPeriodOfAdoptionAdjustedBalanceMemberifrs-full:EquityAttributableToOwnersOfParentMember2018-12-310000313807srt:CumulativeEffectPeriodOfAdoptionAdjustedBalanceMemberbp:NonControllingInterestsOtherInterestMember2018-12-310000313807srt:CumulativeEffectPeriodOfAdoptionAdjustedBalanceMember2018-12-310000313807ifrs-full:RetainedEarningsMember2019-01-012019-12-310000313807ifrs-full:EquityAttributableToOwnersOfParentMember2019-01-012019-12-310000313807bp:NonControllingInterestsOtherInterestMember2019-01-012019-12-310000313807ifrs-full:ReserveOfExchangeDifferencesOnTranslationMember2019-01-012019-12-310000313807bp:TotalReserveOfAvailableForSaleSecuritiesAndCashFlowHedgesMember2019-01-012019-12-310000313807bp:ShareCapitalAndCapitalReserveMember2019-01-012019-12-310000313807ifrs-full:TreasurySharesMember2019-01-012019-12-3100003138072018-01-010000313807bp:ProvisionsforDecommissioningMember2021-01-012021-12-310000313807bp:RosneftMember2021-01-012021-12-31xbrli:pure0000313807bp:JSCRosneftegazMemberbp:RosneftMember2021-01-012021-12-310000313807bp:JSCRosneftegazMemberbp:RosneftMember2020-01-012020-12-310000313807bp:RosneftMember2020-01-012020-12-310000313807bp:AkerBPMember2021-01-012021-12-310000313807bp:AkerBPMemberifrs-full:AssetsAndLiabilitiesClassifiedAsHeldForSaleMember2021-12-310000313807bp:PatentsLicencesAndTrademarksMemberifrs-full:BottomOfRangeMember2021-01-012021-12-310000313807ifrs-full:TopOfRangeMemberbp:PatentsLicencesAndTrademarksMember2021-01-012021-12-310000313807ifrs-full:BottomOfRangeMemberifrs-full:ComputerSoftwareMember2021-01-012021-12-310000313807ifrs-full:TopOfRangeMemberifrs-full:ComputerSoftwareMember2021-01-012021-12-310000313807ifrs-full:BottomOfRangeMemberbp:LandImprovements1Member2021-01-012021-12-310000313807ifrs-full:TopOfRangeMemberbp:LandImprovements1Member2021-01-012021-12-310000313807ifrs-full:BuildingsMemberifrs-full:BottomOfRangeMember2021-01-012021-12-310000313807ifrs-full:TopOfRangeMemberifrs-full:BuildingsMember2021-01-012021-12-310000313807ifrs-full:BottomOfRangeMemberbp:RefineriesMember2021-01-012021-12-310000313807ifrs-full:TopOfRangeMemberbp:RefineriesMember2021-01-012021-12-310000313807bp:Pipelines1Memberifrs-full:BottomOfRangeMember2021-01-012021-12-310000313807ifrs-full:TopOfRangeMemberbp:Pipelines1Member2021-01-012021-12-310000313807bp:ServiceStationsMember2021-01-012021-12-310000313807ifrs-full:OfficeEquipmentMemberifrs-full:BottomOfRangeMember2021-01-012021-12-310000313807ifrs-full:TopOfRangeMemberifrs-full:OfficeEquipmentMember2021-01-012021-12-310000313807ifrs-full:FixturesAndFittingsMemberifrs-full:BottomOfRangeMember2021-01-012021-12-310000313807ifrs-full:TopOfRangeMemberifrs-full:FixturesAndFittingsMember2021-01-012021-12-310000313807bp:LowCarbonEnergyAssetsMember2021-12-310000313807ifrs-full:BottomOfRangeMember2021-12-310000313807ifrs-full:TopOfRangeMember2021-12-310000313807ifrs-full:BottomOfRangeMember2020-12-310000313807ifrs-full:TopOfRangeMember2020-12-310000313807bp:OilAndGasPropertiesPortionWithHeadroomEqualToOrLessThanTwentyPercentOfCarryingValueMember2021-12-310000313807bp:OilAndGasPropertiesPortionWithHeadroomEqualToOrLessThanTwentyPercentOfCarryingValueMember2020-12-310000313807bp:OilAndGasProperties1Member2021-01-012021-12-310000313807ifrs-full:NotLaterThanOneYearMember2021-01-012021-12-31bp:usd_per_bbl0000313807ifrs-full:LaterThanOneYearAndNotLaterThanFiveYearsMember2021-01-012021-12-310000313807ifrs-full:LaterThanFiveYearsAndNotLaterThanTenYearsMember2021-01-012021-12-310000313807bp:LaterThanTenYearsAndNotLaterThanTwentyYearsMember2021-01-012021-12-310000313807bp:LaterThanTwentyYearsAndNotLaterThanThirtyYearsMember2021-01-012021-12-31bp:usd_per_mmBtu0000313807ifrs-full:NotLaterThanOneYearMember2020-01-012020-12-310000313807ifrs-full:LaterThanOneYearAndNotLaterThanFiveYearsMember2020-01-012020-12-310000313807ifrs-full:LaterThanFiveYearsAndNotLaterThanTenYearsMember2020-01-012020-12-310000313807bp:LaterThanTenYearsAndNotLaterThanTwentyYearsMember2020-01-012020-12-310000313807bp:LaterThanTwentyYearsAndNotLaterThanThirtyYearsMember2020-01-012020-12-310000313807bp:OilAndGasProperties1Memberifrs-full:BottomOfRangeMemberbp:TenPercentagePointDecreaseMember2021-01-012021-12-310000313807ifrs-full:TopOfRangeMemberbp:OilAndGasProperties1Memberbp:TenPercentagePointDecreaseMember2021-01-012021-12-310000313807bp:TenPercentagePointIncreaseMemberbp:OilAndGasProperties1Memberifrs-full:BottomOfRangeMember2021-01-012021-12-310000313807bp:TenPercentagePointIncreaseMemberifrs-full:TopOfRangeMemberbp:OilAndGasProperties1Member2021-01-012021-12-310000313807bp:OnePercentagePointIncreaseMember2021-01-012021-12-310000313807bp:OnePercentagePointDecreaseMember2021-01-012021-12-310000313807bp:GasLowCarbonEnergyAndOilProductionOperationsMember2021-12-310000313807bp:AssetsPreviouslySoldMemberifrs-full:ProvisionForDecommissioningRestorationAndRehabilitationCostsMember2021-01-012021-12-310000313807bp:NotLaterThanTenYearsMemberifrs-full:ProvisionForDecommissioningRestorationAndRehabilitationCostsMember2021-01-012021-12-310000313807bp:NotLaterThanTenYearsMemberifrs-full:ProvisionForDecommissioningRestorationAndRehabilitationCostsMember2020-01-012020-12-310000313807bp:TenToTwentyYearsMemberifrs-full:ProvisionForDecommissioningRestorationAndRehabilitationCostsMember2021-01-012021-12-310000313807bp:TenToTwentyYearsMemberifrs-full:ProvisionForDecommissioningRestorationAndRehabilitationCostsMember2020-01-012020-12-310000313807bp:LaterThanTwentyYearsMemberifrs-full:ProvisionForDecommissioningRestorationAndRehabilitationCostsMember2021-01-012021-12-310000313807bp:LaterThanTwentyYearsMemberifrs-full:ProvisionForDecommissioningRestorationAndRehabilitationCostsMember2020-01-012020-12-310000313807bp:A05PercentagePointIncreaseMember2021-01-012021-12-310000313807bp:A05PercentagePointIncreaseMember2020-01-012020-12-310000313807bp:ChangeInTimingOfFutureExpenditureMemberifrs-full:ProvisionForDecommissioningRestorationAndRehabilitationCostsMember2021-01-012021-12-310000313807bp:ChangeInTimingOfFutureExpenditureMemberifrs-full:ProvisionForDecommissioningRestorationAndRehabilitationCostsMember2020-01-012020-12-310000313807bp:TenPercentagePointIncreaseMember2021-12-310000313807bp:TenPercentagePointIncreaseMember2020-12-310000313807bp:TenPercentagePointIncreaseMember2021-01-012021-12-310000313807bp:TenPercentagePointIncreaseMember2020-01-012020-12-310000313807bp:GasLowCarbonEnergyMemberifrs-full:OperatingSegmentsMembersrt:ScenarioPreviouslyReportedMember2020-01-012020-12-310000313807bp:GasLowCarbonEnergyMemberifrs-full:OperatingSegmentsMember2020-01-012020-12-310000313807srt:RestatementAdjustmentMemberbp:GasLowCarbonEnergyMemberifrs-full:OperatingSegmentsMember2020-01-012020-12-310000313807bp:GasLowCarbonEnergyMemberifrs-full:OperatingSegmentsMembersrt:ScenarioPreviouslyReportedMember2019-01-012019-12-310000313807bp:GasLowCarbonEnergyMemberifrs-full:OperatingSegmentsMember2019-01-012019-12-310000313807srt:RestatementAdjustmentMemberbp:GasLowCarbonEnergyMemberifrs-full:OperatingSegmentsMember2019-01-012019-12-310000313807ifrs-full:OperatingSegmentsMembersrt:ScenarioPreviouslyReportedMemberbp:OilProductionOperationsMember2020-01-012020-12-310000313807ifrs-full:OperatingSegmentsMemberbp:OilProductionOperationsMember2020-01-012020-12-310000313807srt:RestatementAdjustmentMemberifrs-full:OperatingSegmentsMemberbp:OilProductionOperationsMember2020-01-012020-12-310000313807ifrs-full:OperatingSegmentsMembersrt:ScenarioPreviouslyReportedMemberbp:OilProductionOperationsMember2019-01-012019-12-310000313807ifrs-full:OperatingSegmentsMemberbp:OilProductionOperationsMember2019-01-012019-12-310000313807srt:RestatementAdjustmentMemberifrs-full:OperatingSegmentsMemberbp:OilProductionOperationsMember2019-01-012019-12-310000313807ifrs-full:OperatingSegmentsMemberbp:CustomersProductsMembersrt:ScenarioPreviouslyReportedMember2020-01-012020-12-310000313807ifrs-full:OperatingSegmentsMemberbp:CustomersProductsMember2020-01-012020-12-310000313807srt:RestatementAdjustmentMemberifrs-full:OperatingSegmentsMemberbp:CustomersProductsMember2020-01-012020-12-310000313807ifrs-full:OperatingSegmentsMemberbp:CustomersProductsMembersrt:ScenarioPreviouslyReportedMember2019-01-012019-12-310000313807ifrs-full:OperatingSegmentsMemberbp:CustomersProductsMember2019-01-012019-12-310000313807srt:RestatementAdjustmentMemberifrs-full:OperatingSegmentsMemberbp:CustomersProductsMember2019-01-012019-12-310000313807bp:OtherBusinessAndCorporateNonSegmentMembersrt:ScenarioPreviouslyReportedMember2020-01-012020-12-310000313807bp:OtherBusinessAndCorporateNonSegmentMember2020-01-012020-12-310000313807bp:OtherBusinessAndCorporateNonSegmentMembersrt:RestatementAdjustmentMember2020-01-012020-12-310000313807bp:OtherBusinessAndCorporateNonSegmentMembersrt:ScenarioPreviouslyReportedMember2019-01-012019-12-310000313807bp:OtherBusinessAndCorporateNonSegmentMember2019-01-012019-12-310000313807bp:OtherBusinessAndCorporateNonSegmentMembersrt:RestatementAdjustmentMember2019-01-012019-12-310000313807srt:ScenarioPreviouslyReportedMember2020-01-012020-12-310000313807srt:RestatementAdjustmentMember2020-01-012020-12-310000313807srt:ScenarioPreviouslyReportedMember2019-01-012019-12-310000313807srt:RestatementAdjustmentMember2019-01-012019-12-310000313807ifrs-full:EliminationOfIntersegmentAmountsMembersrt:ScenarioPreviouslyReportedMember2020-01-012020-12-310000313807ifrs-full:EliminationOfIntersegmentAmountsMember2020-01-012020-12-310000313807srt:RestatementAdjustmentMemberifrs-full:EliminationOfIntersegmentAmountsMember2020-01-012020-12-310000313807ifrs-full:EliminationOfIntersegmentAmountsMembersrt:ScenarioPreviouslyReportedMember2019-01-012019-12-310000313807ifrs-full:EliminationOfIntersegmentAmountsMember2019-01-012019-12-310000313807srt:RestatementAdjustmentMemberifrs-full:EliminationOfIntersegmentAmountsMember2019-01-012019-12-310000313807bp:OilAndGasCrudeOilMembersrt:ScenarioPreviouslyReportedMember2020-01-012020-12-310000313807bp:OilAndGasCrudeOilMember2020-01-012020-12-310000313807srt:RestatementAdjustmentMemberbp:OilAndGasCrudeOilMember2020-01-012020-12-310000313807bp:OilAndGasCrudeOilMembersrt:ScenarioPreviouslyReportedMember2019-01-012019-12-310000313807bp:OilAndGasCrudeOilMember2019-01-012019-12-310000313807srt:RestatementAdjustmentMemberbp:OilAndGasCrudeOilMember2019-01-012019-12-310000313807bp:OilandGasOilProductsMembersrt:ScenarioPreviouslyReportedMember2020-01-012020-12-310000313807bp:OilandGasOilProductsMember2020-01-012020-12-310000313807srt:RestatementAdjustmentMemberbp:OilandGasOilProductsMember2020-01-012020-12-310000313807bp:OilandGasOilProductsMembersrt:ScenarioPreviouslyReportedMember2019-01-012019-12-310000313807bp:OilandGasOilProductsMember2019-01-012019-12-310000313807srt:RestatementAdjustmentMemberbp:OilandGasOilProductsMember2019-01-012019-12-310000313807bp:NaturalGasProductsMembersrt:ScenarioPreviouslyReportedMember2020-01-012020-12-310000313807bp:NaturalGasProductsMember2020-01-012020-12-310000313807srt:RestatementAdjustmentMemberbp:NaturalGasProductsMember2020-01-012020-12-310000313807bp:NaturalGasProductsMembersrt:ScenarioPreviouslyReportedMember2019-01-012019-12-310000313807bp:NaturalGasProductsMember2019-01-012019-12-310000313807srt:RestatementAdjustmentMemberbp:NaturalGasProductsMember2019-01-012019-12-310000313807bp:ProductAndServiceOther1Membersrt:ScenarioPreviouslyReportedMember2020-01-012020-12-310000313807bp:ProductAndServiceOther1Member2020-01-012020-12-310000313807srt:RestatementAdjustmentMemberbp:ProductAndServiceOther1Member2020-01-012020-12-310000313807bp:ProductAndServiceOther1Membersrt:ScenarioPreviouslyReportedMember2019-01-012019-12-310000313807bp:ProductAndServiceOther1Member2019-01-012019-12-310000313807srt:RestatementAdjustmentMemberbp:ProductAndServiceOther1Member2019-01-012019-12-310000313807bp:RumailaMember2021-12-310000313807bp:AkerBPMember2021-12-310000313807bp:Block61Member2020-01-012020-12-310000313807bp:PTTExplorationAndProductionPublicCompanyLimitedMember2021-01-012021-12-310000313807ifrs-full:NoncurrentAssetsHeldForSaleMember2021-12-310000313807ifrs-full:NoncurrentAssetsHeldForSaleMember2020-12-310000313807bp:GasLowCarbonEnergyMember2021-01-012021-12-310000313807bp:GasLowCarbonEnergyMember2020-01-012020-12-310000313807bp:GasLowCarbonEnergyMember2019-01-012019-12-310000313807bp:OilProductionOperationsMember2021-01-012021-12-310000313807bp:OilProductionOperationsMember2020-01-012020-12-310000313807bp:OilProductionOperationsMember2019-01-012019-12-310000313807bp:CustomersProductsMember2021-01-012021-12-310000313807bp:CustomersProductsMember2020-01-012020-12-310000313807bp:CustomersProductsMember2019-01-012019-12-310000313807bp:OtherBusinessAndCorporateNonSegmentMember2021-01-012021-12-310000313807bp:OtherBusinessAndCorporateNonSegmentMember2020-01-012020-12-310000313807bp:OtherBusinessAndCorporateNonSegmentMember2019-01-012019-12-310000313807bp:Block61Membercountry:OM2021-01-012021-12-310000313807bp:Block61Memberifrs-full:DiscontinuedOperationsMembercountry:OM2021-01-012021-12-310000313807ifrs-full:DiscontinuedOperationsMemberstpr:AK2021-01-012021-12-310000313807ifrs-full:DiscontinuedOperationsMemberbp:PetrochemicalsMember2021-01-012021-12-310000313807ifrs-full:DiscontinuedOperationsMemberstpr:AK2021-12-310000313807stpr:AK2021-12-310000313807bp:Block61Memberbp:GasLowCarbonEnergyMembercountry:OM2021-01-012021-12-310000313807bp:OilProductionOperationsMemberbp:AkerBPMember2021-01-012021-12-310000313807ifrs-full:DiscontinuedOperationsMemberbp:OilProductionOperationsMemberbp:AkerBPMember2021-01-012021-12-310000313807country:BRbp:OilProductionOperationsMember2021-01-012021-12-310000313807bp:OilProductionOperationsMemberstpr:AK2020-01-012020-12-310000313807bp:NorthSeaMemberbp:OilProductionOperationsMember2020-01-012020-12-310000313807country:USbp:OilProductionOperationsMember2020-01-012020-12-310000313807bp:BruceKeithandDevinickMemberbp:OilProductionOperationsMember2019-01-012019-12-310000313807bp:OilProductionOperationsMemberstpr:AK2019-01-012019-12-310000313807bp:PetrochemicalsMemberbp:CustomersProductsMember2021-01-012021-12-310000313807bp:CustomersProductsMemberbp:KwinanaMember2019-01-012019-12-310000313807ifrs-full:DiscontinuedOperationsMember2021-12-310000313807ifrs-full:DiscontinuedOperationsMember2020-12-310000313807ifrs-full:DiscontinuedOperationsMember2019-12-310000313807ifrs-full:DiscontinuedOperationsMember2021-01-012021-12-310000313807ifrs-full:DiscontinuedOperationsMember2020-01-012020-12-310000313807ifrs-full:DiscontinuedOperationsMember2019-01-012019-12-310000313807ifrs-full:DiscontinuedOperationsMemberstpr:AK2020-01-012020-12-310000313807bp:MauritaniaSenegalMemberbp:GasLowCarbonEnergyMemberbp:TortueMember2021-01-012021-12-310000313807bp:GasLowCarbonEnergyMemberbp:KGD6Membercountry:IN2021-01-012021-12-310000313807bp:GasLowCarbonEnergyMembercountry:TT2021-01-012021-12-310000313807bp:GasLowCarbonEnergyMember2021-12-310000313807bp:GasLowCarbonEnergyMembercountry:TT2020-01-012020-12-310000313807bp:MauritaniaSenegalMemberbp:GasLowCarbonEnergyMember2020-01-012020-12-310000313807bp:GasLowCarbonEnergyMembercountry:IN2020-01-012020-12-310000313807bp:GasLowCarbonEnergyMember2020-12-310000313807bp:BPXEnergyMemberbp:OilProductionOperationsMember2021-01-012021-12-310000313807bp:NorthSeaMemberbp:OilProductionOperationsMember2021-01-012021-12-310000313807bp:HawkvilleMemberbp:OilProductionOperationsMember2021-01-012021-12-310000313807bp:OilProductionOperationsMember2021-12-310000313807bp:NorthSeaMemberbp:OilProductionOperationsMember2020-01-012020-12-310000313807country:CAbp:OilProductionOperationsMember2020-01-012020-12-310000313807bp:BPXEnergyMemberbp:OilProductionOperationsMember2019-01-012019-12-310000313807bp:GasLowCarbonEnergyMemberifrs-full:OperatingSegmentsMember2021-01-012021-12-310000313807ifrs-full:OperatingSegmentsMemberbp:OilProductionOperationsMember2021-01-012021-12-310000313807ifrs-full:OperatingSegmentsMemberbp:CustomersProductsMember2021-01-012021-12-310000313807ifrs-full:OperatingSegmentsMemberbp:RosneftSegmentMember2021-01-012021-12-310000313807bp:OtherBusinessAndCorporateNonSegmentMember2021-01-012021-12-310000313807ifrs-full:EliminationOfIntersegmentAmountsMember2021-01-012021-12-310000313807country:USbp:GasLowCarbonEnergyMemberifrs-full:OperatingSegmentsMember2021-01-012021-12-310000313807country:USifrs-full:OperatingSegmentsMemberbp:OilProductionOperationsMember2021-01-012021-12-310000313807country:USifrs-full:OperatingSegmentsMemberbp:CustomersProductsMember2021-01-012021-12-310000313807country:USifrs-full:OperatingSegmentsMemberbp:RosneftSegmentMember2021-01-012021-12-310000313807bp:OtherBusinessAndCorporateNonSegmentMembercountry:US2021-01-012021-12-310000313807country:USifrs-full:EliminationOfIntersegmentAmountsMember2021-01-012021-12-310000313807country:US2021-01-012021-12-310000313807bp:GasLowCarbonEnergyMemberifrs-full:OperatingSegmentsMemberbp:NonUS1Member2021-01-012021-12-310000313807ifrs-full:OperatingSegmentsMemberbp:OilProductionOperationsMemberbp:NonUS1Member2021-01-012021-12-310000313807ifrs-full:OperatingSegmentsMemberbp:CustomersProductsMemberbp:NonUS1Member2021-01-012021-12-310000313807ifrs-full:OperatingSegmentsMemberbp:NonUS1Memberbp:RosneftSegmentMember2021-01-012021-12-310000313807bp:OtherBusinessAndCorporateNonSegmentMemberbp:NonUS1Member2021-01-012021-12-310000313807ifrs-full:EliminationOfIntersegmentAmountsMemberbp:NonUS1Member2021-01-012021-12-310000313807bp:NonUS1Member2021-01-012021-12-310000313807bp:GasLowCarbonEnergyMemberifrs-full:OperatingSegmentsMember2021-12-310000313807ifrs-full:OperatingSegmentsMemberbp:OilProductionOperationsMember2021-12-310000313807ifrs-full:OperatingSegmentsMemberbp:CustomersProductsMember2021-12-310000313807ifrs-full:OperatingSegmentsMemberbp:RosneftSegmentMember2021-12-310000313807bp:OtherBusinessAndCorporateNonSegmentMember2021-12-310000313807ifrs-full:EliminationOfIntersegmentAmountsMember2021-12-310000313807ifrs-full:OperatingSegmentsMemberbp:RosneftSegmentMember2020-01-012020-12-310000313807country:USbp:GasLowCarbonEnergyMemberifrs-full:OperatingSegmentsMember2020-01-012020-12-310000313807country:USifrs-full:OperatingSegmentsMemberbp:OilProductionOperationsMember2020-01-012020-12-310000313807country:USifrs-full:OperatingSegmentsMemberbp:CustomersProductsMember2020-01-012020-12-310000313807country:USifrs-full:OperatingSegmentsMemberbp:RosneftSegmentMember2020-01-012020-12-310000313807bp:OtherBusinessAndCorporateNonSegmentMembercountry:US2020-01-012020-12-310000313807country:USifrs-full:EliminationOfIntersegmentAmountsMember2020-01-012020-12-310000313807country:US2020-01-012020-12-310000313807bp:GasLowCarbonEnergyMemberifrs-full:OperatingSegmentsMemberbp:NonUS1Member2020-01-012020-12-310000313807ifrs-full:OperatingSegmentsMemberbp:OilProductionOperationsMemberbp:NonUS1Member2020-01-012020-12-310000313807ifrs-full:OperatingSegmentsMemberbp:CustomersProductsMemberbp:NonUS1Member2020-01-012020-12-310000313807ifrs-full:OperatingSegmentsMemberbp:NonUS1Memberbp:RosneftSegmentMember2020-01-012020-12-310000313807bp:OtherBusinessAndCorporateNonSegmentMemberbp:NonUS1Member2020-01-012020-12-310000313807ifrs-full:EliminationOfIntersegmentAmountsMemberbp:NonUS1Member2020-01-012020-12-310000313807bp:NonUS1Member2020-01-012020-12-310000313807bp:GasLowCarbonEnergyMemberifrs-full:OperatingSegmentsMember2020-12-310000313807ifrs-full:OperatingSegmentsMemberbp:OilProductionOperationsMember2020-12-310000313807ifrs-full:OperatingSegmentsMemberbp:CustomersProductsMember2020-12-310000313807ifrs-full:OperatingSegmentsMemberbp:RosneftSegmentMember2020-12-310000313807bp:OtherBusinessAndCorporateNonSegmentMember2020-12-310000313807ifrs-full:EliminationOfIntersegmentAmountsMember2020-12-310000313807ifrs-full:OperatingSegmentsMemberbp:RosneftSegmentMember2019-01-012019-12-310000313807country:USbp:GasLowCarbonEnergyMemberifrs-full:OperatingSegmentsMember2019-01-012019-12-310000313807country:USifrs-full:OperatingSegmentsMemberbp:OilProductionOperationsMember2019-01-012019-12-310000313807country:USifrs-full:OperatingSegmentsMemberbp:CustomersProductsMember2019-01-012019-12-310000313807country:USifrs-full:OperatingSegmentsMemberbp:RosneftSegmentMember2019-01-012019-12-310000313807bp:OtherBusinessAndCorporateNonSegmentMembercountry:US2019-01-012019-12-310000313807country:USifrs-full:EliminationOfIntersegmentAmountsMember2019-01-012019-12-310000313807country:US2019-01-012019-12-310000313807bp:GasLowCarbonEnergyMemberifrs-full:OperatingSegmentsMemberbp:NonUS1Member2019-01-012019-12-310000313807ifrs-full:OperatingSegmentsMemberbp:OilProductionOperationsMemberbp:NonUS1Member2019-01-012019-12-310000313807ifrs-full:OperatingSegmentsMemberbp:CustomersProductsMemberbp:NonUS1Member2019-01-012019-12-310000313807ifrs-full:OperatingSegmentsMemberbp:NonUS1Memberbp:RosneftSegmentMember2019-01-012019-12-310000313807bp:OtherBusinessAndCorporateNonSegmentMemberbp:NonUS1Member2019-01-012019-12-310000313807ifrs-full:EliminationOfIntersegmentAmountsMemberbp:NonUS1Member2019-01-012019-12-310000313807bp:NonUS1Member2019-01-012019-12-310000313807bp:GasLowCarbonEnergyMemberifrs-full:OperatingSegmentsMember2019-12-310000313807ifrs-full:OperatingSegmentsMemberbp:OilProductionOperationsMember2019-12-310000313807ifrs-full:OperatingSegmentsMemberbp:CustomersProductsMember2019-12-310000313807ifrs-full:OperatingSegmentsMemberbp:RosneftSegmentMember2019-12-310000313807bp:OtherBusinessAndCorporateNonSegmentMember2019-12-310000313807ifrs-full:EliminationOfIntersegmentAmountsMember2019-12-310000313807country:US2021-12-310000313807bp:NonUS1Member2021-12-310000313807ifrs-full:CountryOfDomicileMember2021-01-012021-12-310000313807ifrs-full:CountryOfDomicileMember2021-12-310000313807country:US2020-12-310000313807bp:NonUS1Member2020-12-310000313807ifrs-full:CountryOfDomicileMember2020-01-012020-12-310000313807ifrs-full:CountryOfDomicileMember2020-12-310000313807country:US2019-12-310000313807bp:NonUS1Member2019-12-310000313807ifrs-full:CountryOfDomicileMember2019-01-012019-12-310000313807ifrs-full:CountryOfDomicileMember2019-12-310000313807bp:OilAndGasCrudeOilMember2021-01-012021-12-310000313807bp:OilandGasOilProductsMember2021-01-012021-12-310000313807bp:NaturalGasProductsMember2021-01-012021-12-310000313807bp:ProductAndServiceOther1Member2021-01-012021-12-310000313807ifrs-full:FinancialAssetsAtAmortisedCostMember2021-01-012021-12-310000313807ifrs-full:FinancialAssetsAtAmortisedCostMember2020-01-012020-12-310000313807ifrs-full:FinancialAssetsAtAmortisedCostMember2019-01-012019-12-310000313807ifrs-full:FinancialAssetsAtFairValueMember2021-01-012021-12-310000313807ifrs-full:FinancialAssetsAtFairValueMember2020-01-012020-12-310000313807ifrs-full:FinancialAssetsAtFairValueMember2019-01-012019-12-310000313807bp:GulfOfMexicoOilSpillMember2021-01-012021-12-310000313807bp:GulfOfMexicoOilSpillMember2020-01-012020-12-310000313807bp:GulfOfMexicoOilSpillMember2019-01-012019-12-310000313807ifrs-full:FinancialLiabilitiesAtAmortisedCostMember2021-01-012021-12-310000313807ifrs-full:FinancialLiabilitiesAtAmortisedCostMember2020-01-012020-12-310000313807ifrs-full:FinancialLiabilitiesAtAmortisedCostMember2019-01-012019-12-310000313807bp:GasLowCarbonEnergyAndOilProductionOperationsMember2021-01-012021-12-310000313807bp:GasLowCarbonEnergyAndOilProductionOperationsMember2020-01-012020-12-310000313807bp:GasLowCarbonEnergyAndOilProductionOperationsMember2019-01-012019-12-310000313807ifrs-full:IntangibleExplorationAndEvaluationAssetsMemberbp:GasLowCarbonEnergyAndOilProductionOperationsMember2021-01-012021-12-310000313807ifrs-full:IntangibleExplorationAndEvaluationAssetsMemberbp:GasLowCarbonEnergyAndOilProductionOperationsMember2020-01-012020-12-310000313807ifrs-full:IntangibleExplorationAndEvaluationAssetsMemberbp:GasLowCarbonEnergyAndOilProductionOperationsMember2019-01-012019-12-310000313807ifrs-full:IntangibleExplorationAndEvaluationAssetsMemberbp:GasLowCarbonEnergyAndOilProductionOperationsMember2021-12-310000313807ifrs-full:IntangibleExplorationAndEvaluationAssetsMemberbp:GasLowCarbonEnergyAndOilProductionOperationsMember2020-12-310000313807ifrs-full:IntangibleExplorationAndEvaluationAssetsMemberbp:GasLowCarbonEnergyAndOilProductionOperationsMember2019-12-310000313807bp:GasLowCarbonEnergyAndOilProductionOperationsMember2020-12-310000313807bp:GasLowCarbonEnergyAndOilProductionOperationsMember2019-12-310000313807ifrs-full:IntangibleExplorationAndEvaluationAssetsMemberbp:GasLowCarbonEnergyAndOilProductionOperationsMemberbp:GulfOfMexicoMember2020-01-012020-12-310000313807country:CAifrs-full:IntangibleExplorationAndEvaluationAssetsMemberbp:GasLowCarbonEnergyAndOilProductionOperationsMember2020-01-012020-12-310000313807ifrs-full:IntangibleExplorationAndEvaluationAssetsMemberbp:GasLowCarbonEnergyAndOilProductionOperationsMembercountry:BR2020-01-012020-12-310000313807ifrs-full:IntangibleExplorationAndEvaluationAssetsMemberbp:GasLowCarbonEnergyAndOilProductionOperationsMembercountry:EG2020-01-012020-12-310000313807country:AOifrs-full:IntangibleExplorationAndEvaluationAssetsMemberbp:GasLowCarbonEnergyAndOilProductionOperationsMember2020-01-012020-12-310000313807country:CAifrs-full:IntangibleExplorationAndEvaluationAssetsMemberbp:GasLowCarbonEnergyAndOilProductionOperationsMember2019-12-310000313807bp:MiddleEastMemberbp:GasLowCarbonEnergyAndOilProductionOperationsMember2021-12-310000313807bp:MiddleEastMemberbp:GasLowCarbonEnergyAndOilProductionOperationsMember2020-12-310000313807bp:DepreciationRelatedTemporaryDifferencesDeferredTaxLiabilityMemberbp:BeforeOffsetAmountMember2021-01-012021-12-310000313807bp:DepreciationRelatedTemporaryDifferencesDeferredTaxLiabilityMemberbp:BeforeOffsetAmountMember2020-01-012020-12-310000313807bp:DepreciationRelatedTemporaryDifferencesDeferredTaxLiabilityMemberbp:BeforeOffsetAmountMember2019-01-012019-12-310000313807bp:DepreciationRelatedTemporaryDifferencesDeferredTaxLiabilityMemberbp:BeforeOffsetAmountMember2021-12-310000313807bp:DepreciationRelatedTemporaryDifferencesDeferredTaxLiabilityMemberbp:BeforeOffsetAmountMember2020-12-310000313807bp:PensionPlanSurplusesRelatedTemporaryDifferencesDeferredTaxLiabilityMemberbp:BeforeOffsetAmountMember2021-01-012021-12-310000313807bp:PensionPlanSurplusesRelatedTemporaryDifferencesDeferredTaxLiabilityMemberbp:BeforeOffsetAmountMember2020-01-012020-12-310000313807bp:PensionPlanSurplusesRelatedTemporaryDifferencesDeferredTaxLiabilityMemberbp:BeforeOffsetAmountMember2019-01-012019-12-310000313807bp:PensionPlanSurplusesRelatedTemporaryDifferencesDeferredTaxLiabilityMemberbp:BeforeOffsetAmountMember2021-12-310000313807bp:PensionPlanSurplusesRelatedTemporaryDifferencesDeferredTaxLiabilityMemberbp:BeforeOffsetAmountMember2020-12-310000313807bp:BeforeOffsetAmountMemberbp:DerivativeFinancialInstrumentsRelatedTemporaryDifferencesDeferredTaxLiabilityMember2021-01-012021-12-310000313807bp:BeforeOffsetAmountMemberbp:DerivativeFinancialInstrumentsRelatedTemporaryDifferencesDeferredTaxLiabilityMember2020-01-012020-12-310000313807bp:BeforeOffsetAmountMemberbp:DerivativeFinancialInstrumentsRelatedTemporaryDifferencesDeferredTaxLiabilityMember2019-01-012019-12-310000313807bp:BeforeOffsetAmountMemberbp:DerivativeFinancialInstrumentsRelatedTemporaryDifferencesDeferredTaxLiabilityMember2021-12-310000313807bp:BeforeOffsetAmountMemberbp:DerivativeFinancialInstrumentsRelatedTemporaryDifferencesDeferredTaxLiabilityMember2020-12-310000313807bp:OtherTemporaryDifferencesDeferredTaxLiabilityMemberbp:BeforeOffsetAmountMember2021-01-012021-12-310000313807bp:OtherTemporaryDifferencesDeferredTaxLiabilityMemberbp:BeforeOffsetAmountMember2020-01-012020-12-310000313807bp:OtherTemporaryDifferencesDeferredTaxLiabilityMemberbp:BeforeOffsetAmountMember2019-01-012019-12-310000313807bp:OtherTemporaryDifferencesDeferredTaxLiabilityMemberbp:BeforeOffsetAmountMember2021-12-310000313807bp:OtherTemporaryDifferencesDeferredTaxLiabilityMemberbp:BeforeOffsetAmountMember2020-12-310000313807bp:TemporaryDifferencesDeferredTaxLiabilityMemberbp:BeforeOffsetAmountMember2021-01-012021-12-310000313807bp:TemporaryDifferencesDeferredTaxLiabilityMemberbp:BeforeOffsetAmountMember2020-01-012020-12-310000313807bp:TemporaryDifferencesDeferredTaxLiabilityMemberbp:BeforeOffsetAmountMember2019-01-012019-12-310000313807bp:BeforeOffsetAmountMember2021-12-310000313807bp:BeforeOffsetAmountMember2020-12-310000313807bp:DepreciationRelatedTemporaryDifferencesDeferredTaxAssetMemberbp:BeforeOffsetAmountMember2021-01-012021-12-310000313807bp:DepreciationRelatedTemporaryDifferencesDeferredTaxAssetMemberbp:BeforeOffsetAmountMember2020-01-012020-12-310000313807bp:DepreciationRelatedTemporaryDifferencesDeferredTaxAssetMemberbp:BeforeOffsetAmountMember2019-01-012019-12-310000313807bp:DepreciationRelatedTemporaryDifferencesDeferredTaxAssetMemberbp:BeforeOffsetAmountMember2021-12-310000313807bp:DepreciationRelatedTemporaryDifferencesDeferredTaxAssetMemberbp:BeforeOffsetAmountMember2020-12-310000313807bp:LeaseLiabilitiesRelatedTemporaryDifferencesDeferredTaxAssetMemberbp:BeforeOffsetAmountMember2021-01-012021-12-310000313807bp:LeaseLiabilitiesRelatedTemporaryDifferencesDeferredTaxAssetMemberbp:BeforeOffsetAmountMember2020-01-012020-12-310000313807bp:LeaseLiabilitiesRelatedTemporaryDifferencesDeferredTaxAssetMemberbp:BeforeOffsetAmountMember2019-01-012019-12-310000313807bp:LeaseLiabilitiesRelatedTemporaryDifferencesDeferredTaxAssetMemberbp:BeforeOffsetAmountMember2021-12-310000313807bp:LeaseLiabilitiesRelatedTemporaryDifferencesDeferredTaxAssetMemberbp:BeforeOffsetAmountMember2020-12-310000313807bp:PensionPlanAndOtherPostRetirementBenefitPlanDeficitsRelatedTemporaryDifferencesDeferredTaxAssetMemberbp:BeforeOffsetAmountMember2021-01-012021-12-310000313807bp:PensionPlanAndOtherPostRetirementBenefitPlanDeficitsRelatedTemporaryDifferencesDeferredTaxAssetMemberbp:BeforeOffsetAmountMember2020-01-012020-12-310000313807bp:PensionPlanAndOtherPostRetirementBenefitPlanDeficitsRelatedTemporaryDifferencesDeferredTaxAssetMemberbp:BeforeOffsetAmountMember2019-01-012019-12-310000313807bp:PensionPlanAndOtherPostRetirementBenefitPlanDeficitsRelatedTemporaryDifferencesDeferredTaxAssetMemberbp:BeforeOffsetAmountMember2021-12-310000313807bp:PensionPlanAndOtherPostRetirementBenefitPlanDeficitsRelatedTemporaryDifferencesDeferredTaxAssetMemberbp:BeforeOffsetAmountMember2020-12-310000313807bp:BeforeOffsetAmountMemberbp:DecommissioningEnvironmentalAndOtherProvisionsRelatedTemporaryDifferencesDeferredTaxAssetMember2021-01-012021-12-310000313807bp:BeforeOffsetAmountMemberbp:DecommissioningEnvironmentalAndOtherProvisionsRelatedTemporaryDifferencesDeferredTaxAssetMember2020-01-012020-12-310000313807bp:BeforeOffsetAmountMemberbp:DecommissioningEnvironmentalAndOtherProvisionsRelatedTemporaryDifferencesDeferredTaxAssetMember2019-01-012019-12-310000313807bp:BeforeOffsetAmountMemberbp:DecommissioningEnvironmentalAndOtherProvisionsRelatedTemporaryDifferencesDeferredTaxAssetMember2021-12-310000313807bp:BeforeOffsetAmountMemberbp:DecommissioningEnvironmentalAndOtherProvisionsRelatedTemporaryDifferencesDeferredTaxAssetMember2020-12-310000313807bp:BeforeOffsetAmountMemberbp:DerivativeFinancialInstrumentsRelatedTemporaryDifferencesDeferredTaxAssetMember2021-01-012021-12-310000313807bp:BeforeOffsetAmountMemberbp:DerivativeFinancialInstrumentsRelatedTemporaryDifferencesDeferredTaxAssetMember2020-01-012020-12-310000313807bp:BeforeOffsetAmountMemberbp:DerivativeFinancialInstrumentsRelatedTemporaryDifferencesDeferredTaxAssetMember2019-01-012019-12-310000313807bp:BeforeOffsetAmountMemberbp:DerivativeFinancialInstrumentsRelatedTemporaryDifferencesDeferredTaxAssetMember2021-12-310000313807bp:BeforeOffsetAmountMemberbp:DerivativeFinancialInstrumentsRelatedTemporaryDifferencesDeferredTaxAssetMember2020-12-310000313807ifrs-full:UnusedTaxCreditsMemberbp:BeforeOffsetAmountMember2021-01-012021-12-310000313807ifrs-full:UnusedTaxCreditsMemberbp:BeforeOffsetAmountMember2020-01-012020-12-310000313807ifrs-full:UnusedTaxCreditsMemberbp:BeforeOffsetAmountMember2019-01-012019-12-310000313807ifrs-full:UnusedTaxCreditsMemberbp:BeforeOffsetAmountMember2021-12-310000313807ifrs-full:UnusedTaxCreditsMemberbp:BeforeOffsetAmountMember2020-12-310000313807ifrs-full:UnusedTaxLossesMemberbp:BeforeOffsetAmountMember2021-01-012021-12-310000313807ifrs-full:UnusedTaxLossesMemberbp:BeforeOffsetAmountMember2020-01-012020-12-310000313807ifrs-full:UnusedTaxLossesMemberbp:BeforeOffsetAmountMember2019-01-012019-12-310000313807ifrs-full:UnusedTaxLossesMemberbp:BeforeOffsetAmountMember2021-12-310000313807ifrs-full:UnusedTaxLossesMemberbp:BeforeOffsetAmountMember2020-12-310000313807bp:OtherTemporaryDifferencesDeferredTaxAssetMemberbp:BeforeOffsetAmountMember2021-01-012021-12-310000313807bp:OtherTemporaryDifferencesDeferredTaxAssetMemberbp:BeforeOffsetAmountMember2020-01-012020-12-310000313807bp:OtherTemporaryDifferencesDeferredTaxAssetMemberbp:BeforeOffsetAmountMember2019-01-012019-12-310000313807bp:OtherTemporaryDifferencesDeferredTaxAssetMemberbp:BeforeOffsetAmountMember2021-12-310000313807bp:OtherTemporaryDifferencesDeferredTaxAssetMemberbp:BeforeOffsetAmountMember2020-12-310000313807bp:TemporaryDifferencesDeferredTaxAssetsMemberbp:BeforeOffsetAmountMember2021-01-012021-12-310000313807bp:TemporaryDifferencesDeferredTaxAssetsMemberbp:BeforeOffsetAmountMember2020-01-012020-12-310000313807bp:TemporaryDifferencesDeferredTaxAssetsMemberbp:BeforeOffsetAmountMember2019-01-012019-12-310000313807bp:GulfOfMexicoOilSpillMember2021-12-310000313807bp:GulfOfMexicoOilSpillMember2020-12-310000313807country:GB2021-12-310000313807country:IN2021-12-310000313807country:AO2021-12-310000313807country:IN2020-12-310000313807country:AU2020-12-310000313807country:TT2020-12-310000313807bp:ForeignTaxAuthorityMemberbp:InternalRevenueServiceIRS1Member2021-12-310000313807bp:ForeignTaxAuthorityMemberbp:InternalRevenueServiceIRS1Member2020-12-310000313807bp:HerMajestysRevenueAndCustomsAndOtherForeignTaxAuthoritiesExcludingInternalRevenueServiceMember2021-12-310000313807bp:HerMajestysRevenueAndCustomsAndOtherForeignTaxAuthoritiesExcludingInternalRevenueServiceMember2020-12-310000313807bp:DomesticTaxAuthorityMember2021-12-310000313807bp:DomesticTaxAuthorityMember2020-12-310000313807bp:FixedAssetRelatedTemporaryDifferencesMember2021-12-310000313807bp:FixedAssetRelatedTemporaryDifferencesMember2020-12-310000313807bp:ForeignTaxAuthorityMemberifrs-full:BottomOfRangeMemberbp:InternalRevenueServiceIRS1Member2021-12-310000313807ifrs-full:TopOfRangeMemberbp:ForeignTaxAuthorityMemberbp:InternalRevenueServiceIRS1Member2021-12-310000313807ifrs-full:PreferenceSharesMember2021-01-012021-12-310000313807ifrs-full:PreferenceSharesMember2020-01-012020-12-310000313807ifrs-full:PreferenceSharesMember2019-01-012019-12-3100003138072021-01-012021-03-31iso4217:GBPxbrli:shares00003138072020-01-012020-03-3100003138072019-01-012019-03-3100003138072021-04-012021-06-3000003138072020-04-012020-06-3000003138072019-04-012019-06-3000003138072021-07-012021-09-3000003138072020-07-012020-09-3000003138072019-07-012019-09-3000003138072021-10-012021-12-3100003138072020-10-012020-12-3100003138072019-10-012019-12-310000313807bp:SubsequentEvent1Member2022-01-012022-03-310000313807bp:SubsequentEvent1Memberifrs-full:OrdinarySharesMember2022-01-012022-02-250000313807bp:EquitySettledShareBasedPaymentArrangementMember2021-12-310000313807bp:EquitySettledShareBasedPaymentArrangementMember2020-12-310000313807bp:EquitySettledShareBasedPaymentArrangementMember2021-01-012021-12-310000313807bp:EquitySettledShareBasedPaymentArrangementMember2020-01-012020-12-310000313807bp:EquitySettledShareBasedPaymentArrangementShareUnitMember2021-01-012021-12-310000313807bp:EquitySettledShareBasedPaymentArrangementShareUnitMember2021-12-310000313807bp:EquitySettledShareBasedPaymentArrangementShareUnitMember2020-12-310000313807bp:EquitySettledShareBasedPaymentArrangementShareUnitMember2020-01-012020-12-310000313807bp:SubsequentEvent1Memberifrs-full:OrdinarySharesMember2021-01-012021-02-250000313807ifrs-full:GrossCarryingAmountMemberifrs-full:PropertyPlantAndEquipmentNotSubjectToOperatingLeasesMemberifrs-full:LandMember2020-12-310000313807ifrs-full:BuildingsMemberifrs-full:GrossCarryingAmountMemberifrs-full:PropertyPlantAndEquipmentNotSubjectToOperatingLeasesMember2020-12-310000313807bp:OilAndGasProperties1Memberifrs-full:GrossCarryingAmountMemberifrs-full:PropertyPlantAndEquipmentNotSubjectToOperatingLeasesMember2020-12-310000313807ifrs-full:MachineryMemberifrs-full:GrossCarryingAmountMemberifrs-full:PropertyPlantAndEquipmentNotSubjectToOperatingLeasesMember2020-12-310000313807ifrs-full:GrossCarryingAmountMemberifrs-full:PropertyPlantAndEquipmentNotSubjectToOperatingLeasesMemberbp:FixturesFittingsAndOfficeEquipmentMember2020-12-310000313807ifrs-full:VehiclesMemberifrs-full:GrossCarryingAmountMemberifrs-full:PropertyPlantAndEquipmentNotSubjectToOperatingLeasesMember2020-12-310000313807ifrs-full:GrossCarryingAmountMemberifrs-full:PropertyPlantAndEquipmentNotSubjectToOperatingLeasesMemberbp:OilAndGasAssetsDepotsTanksAndServiceStationsMember2020-12-310000313807ifrs-full:GrossCarryingAmountMemberifrs-full:PropertyPlantAndEquipmentNotSubjectToOperatingLeasesMember2020-12-310000313807ifrs-full:GrossCarryingAmountMemberifrs-full:PropertyPlantAndEquipmentNotSubjectToOperatingLeasesMemberifrs-full:LandMember2021-01-012021-12-310000313807ifrs-full:BuildingsMemberifrs-full:GrossCarryingAmountMemberifrs-full:PropertyPlantAndEquipmentNotSubjectToOperatingLeasesMember2021-01-012021-12-310000313807bp:OilAndGasProperties1Memberifrs-full:GrossCarryingAmountMemberifrs-full:PropertyPlantAndEquipmentNotSubjectToOperatingLeasesMember2021-01-012021-12-310000313807ifrs-full:MachineryMemberifrs-full:GrossCarryingAmountMemberifrs-full:PropertyPlantAndEquipmentNotSubjectToOperatingLeasesMember2021-01-012021-12-310000313807ifrs-full:GrossCarryingAmountMemberifrs-full:PropertyPlantAndEquipmentNotSubjectToOperatingLeasesMemberbp:FixturesFittingsAndOfficeEquipmentMember2021-01-012021-12-310000313807ifrs-full:VehiclesMemberifrs-full:GrossCarryingAmountMemberifrs-full:PropertyPlantAndEquipmentNotSubjectToOperatingLeasesMember2021-01-012021-12-310000313807ifrs-full:GrossCarryingAmountMemberifrs-full:PropertyPlantAndEquipmentNotSubjectToOperatingLeasesMemberbp:OilAndGasAssetsDepotsTanksAndServiceStationsMember2021-01-012021-12-310000313807ifrs-full:GrossCarryingAmountMemberifrs-full:PropertyPlantAndEquipmentNotSubjectToOperatingLeasesMember2021-01-012021-12-310000313807ifrs-full:GrossCarryingAmountMemberifrs-full:PropertyPlantAndEquipmentNotSubjectToOperatingLeasesMemberifrs-full:LandMember2021-12-310000313807ifrs-full:BuildingsMemberifrs-full:GrossCarryingAmountMemberifrs-full:PropertyPlantAndEquipmentNotSubjectToOperatingLeasesMember2021-12-310000313807bp:OilAndGasProperties1Memberifrs-full:GrossCarryingAmountMemberifrs-full:PropertyPlantAndEquipmentNotSubjectToOperatingLeasesMember2021-12-310000313807ifrs-full:MachineryMemberifrs-full:GrossCarryingAmountMemberifrs-full:PropertyPlantAndEquipmentNotSubjectToOperatingLeasesMember2021-12-310000313807ifrs-full:GrossCarryingAmountMemberifrs-full:PropertyPlantAndEquipmentNotSubjectToOperatingLeasesMemberbp:FixturesFittingsAndOfficeEquipmentMember2021-12-310000313807ifrs-full:VehiclesMemberifrs-full:GrossCarryingAmountMemberifrs-full:PropertyPlantAndEquipmentNotSubjectToOperatingLeasesMember2021-12-310000313807ifrs-full:GrossCarryingAmountMemberifrs-full:PropertyPlantAndEquipmentNotSubjectToOperatingLeasesMemberbp:OilAndGasAssetsDepotsTanksAndServiceStationsMember2021-12-310000313807ifrs-full:GrossCarryingAmountMemberifrs-full:PropertyPlantAndEquipmentNotSubjectToOperatingLeasesMember2021-12-310000313807ifrs-full:PropertyPlantAndEquipmentNotSubjectToOperatingLeasesMemberifrs-full:AccumulatedDepreciationAndAmortisationMemberifrs-full:LandMember2020-12-310000313807ifrs-full:BuildingsMemberifrs-full:PropertyPlantAndEquipmentNotSubjectToOperatingLeasesMemberifrs-full:AccumulatedDepreciationAndAmortisationMember2020-12-310000313807bp:OilAndGasProperties1Memberifrs-full:PropertyPlantAndEquipmentNotSubjectToOperatingLeasesMemberifrs-full:AccumulatedDepreciationAndAmortisationMember2020-12-310000313807ifrs-full:MachineryMemberifrs-full:PropertyPlantAndEquipmentNotSubjectToOperatingLeasesMemberifrs-full:AccumulatedDepreciationAndAmortisationMember2020-12-310000313807ifrs-full:PropertyPlantAndEquipmentNotSubjectToOperatingLeasesMemberbp:FixturesFittingsAndOfficeEquipmentMemberifrs-full:AccumulatedDepreciationAndAmortisationMember2020-12-310000313807ifrs-full:VehiclesMemberifrs-full:PropertyPlantAndEquipmentNotSubjectToOperatingLeasesMemberifrs-full:AccumulatedDepreciationAndAmortisationMember2020-12-310000313807ifrs-full:PropertyPlantAndEquipmentNotSubjectToOperatingLeasesMemberifrs-full:AccumulatedDepreciationAndAmortisationMemberbp:OilAndGasAssetsDepotsTanksAndServiceStationsMember2020-12-310000313807ifrs-full:PropertyPlantAndEquipmentNotSubjectToOperatingLeasesMemberifrs-full:AccumulatedDepreciationAndAmortisationMember2020-12-310000313807ifrs-full:PropertyPlantAndEquipmentNotSubjectToOperatingLeasesMemberifrs-full:AccumulatedDepreciationAndAmortisationMemberifrs-full:LandMember2021-01-012021-12-310000313807ifrs-full:BuildingsMemberifrs-full:PropertyPlantAndEquipmentNotSubjectToOperatingLeasesMemberifrs-full:AccumulatedDepreciationAndAmortisationMember2021-01-012021-12-310000313807bp:OilAndGasProperties1Memberifrs-full:PropertyPlantAndEquipmentNotSubjectToOperatingLeasesMemberifrs-full:AccumulatedDepreciationAndAmortisationMember2021-01-012021-12-310000313807ifrs-full:MachineryMemberifrs-full:PropertyPlantAndEquipmentNotSubjectToOperatingLeasesMemberifrs-full:AccumulatedDepreciationAndAmortisationMember2021-01-012021-12-310000313807ifrs-full:PropertyPlantAndEquipmentNotSubjectToOperatingLeasesMemberbp:FixturesFittingsAndOfficeEquipmentMemberifrs-full:AccumulatedDepreciationAndAmortisationMember2021-01-012021-12-310000313807ifrs-full:VehiclesMemberifrs-full:PropertyPlantAndEquipmentNotSubjectToOperatingLeasesMemberifrs-full:AccumulatedDepreciationAndAmortisationMember2021-01-012021-12-310000313807ifrs-full:PropertyPlantAndEquipmentNotSubjectToOperatingLeasesMemberifrs-full:AccumulatedDepreciationAndAmortisationMemberbp:OilAndGasAssetsDepotsTanksAndServiceStationsMember2021-01-012021-12-310000313807ifrs-full:PropertyPlantAndEquipmentNotSubjectToOperatingLeasesMemberifrs-full:AccumulatedDepreciationAndAmortisationMember2021-01-012021-12-310000313807ifrs-full:PropertyPlantAndEquipmentNotSubjectToOperatingLeasesMemberifrs-full:AccumulatedDepreciationAndAmortisationMemberifrs-full:LandMember2021-12-310000313807ifrs-full:BuildingsMemberifrs-full:PropertyPlantAndEquipmentNotSubjectToOperatingLeasesMemberifrs-full:AccumulatedDepreciationAndAmortisationMember2021-12-310000313807bp:OilAndGasProperties1Memberifrs-full:PropertyPlantAndEquipmentNotSubjectToOperatingLeasesMemberifrs-full:AccumulatedDepreciationAndAmortisationMember2021-12-310000313807ifrs-full:MachineryMemberifrs-full:PropertyPlantAndEquipmentNotSubjectToOperatingLeasesMemberifrs-full:AccumulatedDepreciationAndAmortisationMember2021-12-310000313807ifrs-full:PropertyPlantAndEquipmentNotSubjectToOperatingLeasesMemberbp:FixturesFittingsAndOfficeEquipmentMemberifrs-full:AccumulatedDepreciationAndAmortisationMember2021-12-310000313807ifrs-full:VehiclesMemberifrs-full:PropertyPlantAndEquipmentNotSubjectToOperatingLeasesMemberifrs-full:AccumulatedDepreciationAndAmortisationMember2021-12-310000313807ifrs-full:PropertyPlantAndEquipmentNotSubjectToOperatingLeasesMemberifrs-full:AccumulatedDepreciationAndAmortisationMemberbp:OilAndGasAssetsDepotsTanksAndServiceStationsMember2021-12-310000313807ifrs-full:PropertyPlantAndEquipmentNotSubjectToOperatingLeasesMemberifrs-full:AccumulatedDepreciationAndAmortisationMember2021-12-310000313807ifrs-full:PropertyPlantAndEquipmentNotSubjectToOperatingLeasesMemberifrs-full:LandMember2021-12-310000313807ifrs-full:BuildingsMemberifrs-full:PropertyPlantAndEquipmentNotSubjectToOperatingLeasesMember2021-12-310000313807bp:OilAndGasProperties1Memberifrs-full:PropertyPlantAndEquipmentNotSubjectToOperatingLeasesMember2021-12-310000313807ifrs-full:MachineryMemberifrs-full:PropertyPlantAndEquipmentNotSubjectToOperatingLeasesMember2021-12-310000313807ifrs-full:PropertyPlantAndEquipmentNotSubjectToOperatingLeasesMemberbp:FixturesFittingsAndOfficeEquipmentMember2021-12-310000313807ifrs-full:VehiclesMemberifrs-full:PropertyPlantAndEquipmentNotSubjectToOperatingLeasesMember2021-12-310000313807ifrs-full:PropertyPlantAndEquipmentNotSubjectToOperatingLeasesMemberbp:OilAndGasAssetsDepotsTanksAndServiceStationsMember2021-12-310000313807ifrs-full:PropertyPlantAndEquipmentNotSubjectToOperatingLeasesMember2021-12-310000313807ifrs-full:PropertyPlantAndEquipmentSubjectToOperatingLeasesMemberifrs-full:LandMember2021-12-310000313807ifrs-full:BuildingsMemberifrs-full:PropertyPlantAndEquipmentSubjectToOperatingLeasesMember2021-12-310000313807bp:OilAndGasProperties1Memberifrs-full:PropertyPlantAndEquipmentSubjectToOperatingLeasesMember2021-12-310000313807ifrs-full:MachineryMemberifrs-full:PropertyPlantAndEquipmentSubjectToOperatingLeasesMember2021-12-310000313807ifrs-full:PropertyPlantAndEquipmentSubjectToOperatingLeasesMemberbp:FixturesFittingsAndOfficeEquipmentMember2021-12-310000313807ifrs-full:VehiclesMemberifrs-full:PropertyPlantAndEquipmentSubjectToOperatingLeasesMember2021-12-310000313807ifrs-full:PropertyPlantAndEquipmentSubjectToOperatingLeasesMemberbp:OilAndGasAssetsDepotsTanksAndServiceStationsMember2021-12-310000313807ifrs-full:PropertyPlantAndEquipmentSubjectToOperatingLeasesMember2021-12-310000313807ifrs-full:LandMember2021-12-310000313807ifrs-full:BuildingsMember2021-12-310000313807bp:OilAndGasProperties1Member2021-12-310000313807ifrs-full:MachineryMember2021-12-310000313807bp:FixturesFittingsAndOfficeEquipmentMember2021-12-310000313807ifrs-full:VehiclesMember2021-12-310000313807bp:OilAndGasAssetsDepotsTanksAndServiceStationsMember2021-12-310000313807ifrs-full:GrossCarryingAmountMemberifrs-full:PropertyPlantAndEquipmentNotSubjectToOperatingLeasesMemberifrs-full:LandMember2019-12-310000313807ifrs-full:BuildingsMemberifrs-full:GrossCarryingAmountMemberifrs-full:PropertyPlantAndEquipmentNotSubjectToOperatingLeasesMember2019-12-310000313807bp:OilAndGasProperties1Memberifrs-full:GrossCarryingAmountMemberifrs-full:PropertyPlantAndEquipmentNotSubjectToOperatingLeasesMember2019-12-310000313807ifrs-full:MachineryMemberifrs-full:GrossCarryingAmountMemberifrs-full:PropertyPlantAndEquipmentNotSubjectToOperatingLeasesMember2019-12-310000313807ifrs-full:GrossCarryingAmountMemberifrs-full:PropertyPlantAndEquipmentNotSubjectToOperatingLeasesMemberbp:FixturesFittingsAndOfficeEquipmentMember2019-12-310000313807ifrs-full:VehiclesMemberifrs-full:GrossCarryingAmountMemberifrs-full:PropertyPlantAndEquipmentNotSubjectToOperatingLeasesMember2019-12-310000313807ifrs-full:GrossCarryingAmountMemberifrs-full:PropertyPlantAndEquipmentNotSubjectToOperatingLeasesMemberbp:OilAndGasAssetsDepotsTanksAndServiceStationsMember2019-12-310000313807ifrs-full:GrossCarryingAmountMemberifrs-full:PropertyPlantAndEquipmentNotSubjectToOperatingLeasesMember2019-12-310000313807ifrs-full:GrossCarryingAmountMemberifrs-full:PropertyPlantAndEquipmentNotSubjectToOperatingLeasesMemberifrs-full:LandMember2020-01-012020-12-310000313807ifrs-full:BuildingsMemberifrs-full:GrossCarryingAmountMemberifrs-full:PropertyPlantAndEquipmentNotSubjectToOperatingLeasesMember2020-01-012020-12-310000313807bp:OilAndGasProperties1Memberifrs-full:GrossCarryingAmountMemberifrs-full:PropertyPlantAndEquipmentNotSubjectToOperatingLeasesMember2020-01-012020-12-310000313807ifrs-full:MachineryMemberifrs-full:GrossCarryingAmountMemberifrs-full:PropertyPlantAndEquipmentNotSubjectToOperatingLeasesMember2020-01-012020-12-310000313807ifrs-full:GrossCarryingAmountMemberifrs-full:PropertyPlantAndEquipmentNotSubjectToOperatingLeasesMemberbp:FixturesFittingsAndOfficeEquipmentMember2020-01-012020-12-310000313807ifrs-full:VehiclesMemberifrs-full:GrossCarryingAmountMemberifrs-full:PropertyPlantAndEquipmentNotSubjectToOperatingLeasesMember2020-01-012020-12-310000313807ifrs-full:GrossCarryingAmountMemberifrs-full:PropertyPlantAndEquipmentNotSubjectToOperatingLeasesMemberbp:OilAndGasAssetsDepotsTanksAndServiceStationsMember2020-01-012020-12-310000313807ifrs-full:GrossCarryingAmountMemberifrs-full:PropertyPlantAndEquipmentNotSubjectToOperatingLeasesMember2020-01-012020-12-310000313807ifrs-full:PropertyPlantAndEquipmentNotSubjectToOperatingLeasesMemberifrs-full:AccumulatedDepreciationAndAmortisationMemberifrs-full:LandMember2019-12-310000313807ifrs-full:BuildingsMemberifrs-full:PropertyPlantAndEquipmentNotSubjectToOperatingLeasesMemberifrs-full:AccumulatedDepreciationAndAmortisationMember2019-12-310000313807bp:OilAndGasProperties1Memberifrs-full:PropertyPlantAndEquipmentNotSubjectToOperatingLeasesMemberifrs-full:AccumulatedDepreciationAndAmortisationMember2019-12-310000313807ifrs-full:MachineryMemberifrs-full:PropertyPlantAndEquipmentNotSubjectToOperatingLeasesMemberifrs-full:AccumulatedDepreciationAndAmortisationMember2019-12-310000313807ifrs-full:PropertyPlantAndEquipmentNotSubjectToOperatingLeasesMemberbp:FixturesFittingsAndOfficeEquipmentMemberifrs-full:AccumulatedDepreciationAndAmortisationMember2019-12-310000313807ifrs-full:VehiclesMemberifrs-full:PropertyPlantAndEquipmentNotSubjectToOperatingLeasesMemberifrs-full:AccumulatedDepreciationAndAmortisationMember2019-12-310000313807ifrs-full:PropertyPlantAndEquipmentNotSubjectToOperatingLeasesMemberifrs-full:AccumulatedDepreciationAndAmortisationMemberbp:OilAndGasAssetsDepotsTanksAndServiceStationsMember2019-12-310000313807ifrs-full:PropertyPlantAndEquipmentNotSubjectToOperatingLeasesMemberifrs-full:AccumulatedDepreciationAndAmortisationMember2019-12-310000313807ifrs-full:PropertyPlantAndEquipmentNotSubjectToOperatingLeasesMemberifrs-full:AccumulatedDepreciationAndAmortisationMemberifrs-full:LandMember2020-01-012020-12-310000313807ifrs-full:BuildingsMemberifrs-full:PropertyPlantAndEquipmentNotSubjectToOperatingLeasesMemberifrs-full:AccumulatedDepreciationAndAmortisationMember2020-01-012020-12-310000313807bp:OilAndGasProperties1Memberifrs-full:PropertyPlantAndEquipmentNotSubjectToOperatingLeasesMemberifrs-full:AccumulatedDepreciationAndAmortisationMember2020-01-012020-12-310000313807ifrs-full:MachineryMemberifrs-full:PropertyPlantAndEquipmentNotSubjectToOperatingLeasesMemberifrs-full:AccumulatedDepreciationAndAmortisationMember2020-01-012020-12-310000313807ifrs-full:PropertyPlantAndEquipmentNotSubjectToOperatingLeasesMemberbp:FixturesFittingsAndOfficeEquipmentMemberifrs-full:AccumulatedDepreciationAndAmortisationMember2020-01-012020-12-310000313807ifrs-full:VehiclesMemberifrs-full:PropertyPlantAndEquipmentNotSubjectToOperatingLeasesMemberifrs-full:AccumulatedDepreciationAndAmortisationMember2020-01-012020-12-310000313807ifrs-full:PropertyPlantAndEquipmentNotSubjectToOperatingLeasesMemberifrs-full:AccumulatedDepreciationAndAmortisationMemberbp:OilAndGasAssetsDepotsTanksAndServiceStationsMember2020-01-012020-12-310000313807ifrs-full:PropertyPlantAndEquipmentNotSubjectToOperatingLeasesMemberifrs-full:AccumulatedDepreciationAndAmortisationMember2020-01-012020-12-310000313807ifrs-full:PropertyPlantAndEquipmentNotSubjectToOperatingLeasesMemberifrs-full:LandMember2020-12-310000313807ifrs-full:BuildingsMemberifrs-full:PropertyPlantAndEquipmentNotSubjectToOperatingLeasesMember2020-12-310000313807bp:OilAndGasProperties1Memberifrs-full:PropertyPlantAndEquipmentNotSubjectToOperatingLeasesMember2020-12-310000313807ifrs-full:MachineryMemberifrs-full:PropertyPlantAndEquipmentNotSubjectToOperatingLeasesMember2020-12-310000313807ifrs-full:PropertyPlantAndEquipmentNotSubjectToOperatingLeasesMemberbp:FixturesFittingsAndOfficeEquipmentMember2020-12-310000313807ifrs-full:VehiclesMemberifrs-full:PropertyPlantAndEquipmentNotSubjectToOperatingLeasesMember2020-12-310000313807ifrs-full:PropertyPlantAndEquipmentNotSubjectToOperatingLeasesMemberbp:OilAndGasAssetsDepotsTanksAndServiceStationsMember2020-12-310000313807ifrs-full:PropertyPlantAndEquipmentNotSubjectToOperatingLeasesMember2020-12-310000313807ifrs-full:PropertyPlantAndEquipmentSubjectToOperatingLeasesMemberifrs-full:LandMember2020-12-310000313807ifrs-full:BuildingsMemberifrs-full:PropertyPlantAndEquipmentSubjectToOperatingLeasesMember2020-12-310000313807bp:OilAndGasProperties1Memberifrs-full:PropertyPlantAndEquipmentSubjectToOperatingLeasesMember2020-12-310000313807ifrs-full:MachineryMemberifrs-full:PropertyPlantAndEquipmentSubjectToOperatingLeasesMember2020-12-310000313807ifrs-full:PropertyPlantAndEquipmentSubjectToOperatingLeasesMemberbp:FixturesFittingsAndOfficeEquipmentMember2020-12-310000313807ifrs-full:VehiclesMemberifrs-full:PropertyPlantAndEquipmentSubjectToOperatingLeasesMember2020-12-310000313807ifrs-full:PropertyPlantAndEquipmentSubjectToOperatingLeasesMemberbp:OilAndGasAssetsDepotsTanksAndServiceStationsMember2020-12-310000313807ifrs-full:PropertyPlantAndEquipmentSubjectToOperatingLeasesMember2020-12-310000313807ifrs-full:LandMember2020-12-310000313807ifrs-full:BuildingsMember2020-12-310000313807bp:OilAndGasProperties1Member2020-12-310000313807ifrs-full:MachineryMember2020-12-310000313807bp:FixturesFittingsAndOfficeEquipmentMember2020-12-310000313807ifrs-full:VehiclesMember2020-12-310000313807bp:OilAndGasAssetsDepotsTanksAndServiceStationsMember2020-12-310000313807ifrs-full:ConstructionInProgressMember2021-12-310000313807ifrs-full:ConstructionInProgressMember2020-12-310000313807ifrs-full:BuildingsMemberifrs-full:PropertyPlantAndEquipmentSubjectToOperatingLeasesMemberifrs-full:AccumulatedDepreciationAndAmortisationMember2021-01-012021-12-310000313807bp:OilAndGasProperties1Memberifrs-full:PropertyPlantAndEquipmentSubjectToOperatingLeasesMemberifrs-full:AccumulatedDepreciationAndAmortisationMember2021-01-012021-12-310000313807ifrs-full:MachineryMemberifrs-full:PropertyPlantAndEquipmentSubjectToOperatingLeasesMemberifrs-full:AccumulatedDepreciationAndAmortisationMember2021-01-012021-12-310000313807ifrs-full:PropertyPlantAndEquipmentSubjectToOperatingLeasesMemberbp:FixturesFittingsAndOfficeEquipmentMemberifrs-full:AccumulatedDepreciationAndAmortisationMember2021-01-012021-12-310000313807ifrs-full:VehiclesMemberifrs-full:PropertyPlantAndEquipmentSubjectToOperatingLeasesMemberifrs-full:AccumulatedDepreciationAndAmortisationMember2021-01-012021-12-310000313807ifrs-full:PropertyPlantAndEquipmentSubjectToOperatingLeasesMemberifrs-full:AccumulatedDepreciationAndAmortisationMemberbp:OilAndGasAssetsDepotsTanksAndServiceStationsMember2021-01-012021-12-310000313807ifrs-full:PropertyPlantAndEquipmentSubjectToOperatingLeasesMemberifrs-full:AccumulatedDepreciationAndAmortisationMember2021-01-012021-12-310000313807ifrs-full:BuildingsMemberifrs-full:PropertyPlantAndEquipmentSubjectToOperatingLeasesMemberifrs-full:AccumulatedDepreciationAndAmortisationMember2020-01-012020-12-310000313807bp:OilAndGasProperties1Memberifrs-full:PropertyPlantAndEquipmentSubjectToOperatingLeasesMemberifrs-full:AccumulatedDepreciationAndAmortisationMember2020-01-012020-12-310000313807ifrs-full:MachineryMemberifrs-full:PropertyPlantAndEquipmentSubjectToOperatingLeasesMemberifrs-full:AccumulatedDepreciationAndAmortisationMember2020-01-012020-12-310000313807ifrs-full:PropertyPlantAndEquipmentSubjectToOperatingLeasesMemberbp:FixturesFittingsAndOfficeEquipmentMemberifrs-full:AccumulatedDepreciationAndAmortisationMember2020-01-012020-12-310000313807ifrs-full:VehiclesMemberifrs-full:PropertyPlantAndEquipmentSubjectToOperatingLeasesMemberifrs-full:AccumulatedDepreciationAndAmortisationMember2020-01-012020-12-310000313807ifrs-full:PropertyPlantAndEquipmentSubjectToOperatingLeasesMemberifrs-full:AccumulatedDepreciationAndAmortisationMemberbp:OilAndGasAssetsDepotsTanksAndServiceStationsMember2020-01-012020-12-310000313807ifrs-full:PropertyPlantAndEquipmentSubjectToOperatingLeasesMemberifrs-full:AccumulatedDepreciationAndAmortisationMember2020-01-012020-12-310000313807bp:DrillingrigsMemberifrs-full:PropertyPlantAndEquipmentSubjectToOperatingLeasesMember2021-12-310000313807bp:DrillingrigsMemberifrs-full:PropertyPlantAndEquipmentSubjectToOperatingLeasesMember2020-12-310000313807ifrs-full:PropertyPlantAndEquipmentSubjectToOperatingLeasesMemberifrs-full:ShipsMember2021-12-310000313807ifrs-full:PropertyPlantAndEquipmentSubjectToOperatingLeasesMemberifrs-full:ShipsMember2020-12-310000313807ifrs-full:PropertyPlantAndEquipmentNotSubjectToOperatingLeasesMember2019-12-310000313807ifrs-full:JointVenturesMember2021-12-310000313807ifrs-full:JointVenturesMember2020-12-310000313807ifrs-full:JointVenturesMember2019-12-310000313807ifrs-full:AssociatesMember2021-12-310000313807ifrs-full:AssociatesMember2020-12-310000313807ifrs-full:AssociatesMember2019-12-310000313807ifrs-full:GrossCarryingAmountMemberifrs-full:GoodwillMember2020-12-310000313807ifrs-full:GrossCarryingAmountMemberifrs-full:GoodwillMember2019-12-310000313807ifrs-full:GrossCarryingAmountMemberifrs-full:GoodwillMember2021-01-012021-12-310000313807ifrs-full:GrossCarryingAmountMemberifrs-full:GoodwillMember2020-01-012020-12-310000313807ifrs-full:GrossCarryingAmountMemberifrs-full:GoodwillMember2021-12-310000313807ifrs-full:GoodwillMemberifrs-full:AccumulatedImpairmentMember2020-12-310000313807ifrs-full:GoodwillMemberifrs-full:AccumulatedImpairmentMember2019-12-310000313807ifrs-full:GoodwillMemberifrs-full:AccumulatedImpairmentMember2021-01-012021-12-310000313807ifrs-full:GoodwillMemberifrs-full:AccumulatedImpairmentMember2020-01-012020-12-310000313807ifrs-full:GoodwillMemberifrs-full:AccumulatedImpairmentMember2021-12-310000313807ifrs-full:GoodwillMember2021-12-310000313807ifrs-full:GoodwillMember2020-12-310000313807ifrs-full:GoodwillMember2019-12-310000313807bp:GasLowCarbonEnergyMemberifrs-full:GoodwillMember2021-12-310000313807bp:GasLowCarbonEnergyMemberifrs-full:GoodwillMember2020-12-310000313807ifrs-full:GoodwillMemberbp:OilProductionOperationsMember2021-12-310000313807ifrs-full:GoodwillMemberbp:OilProductionOperationsMember2020-12-310000313807ifrs-full:GoodwillMemberbp:CustomersProductsMember2021-12-310000313807ifrs-full:GoodwillMemberbp:CustomersProductsMember2020-12-310000313807bp:OtherBusinessAndCorporateNonSegmentMemberifrs-full:GoodwillMember2021-12-310000313807bp:OtherBusinessAndCorporateNonSegmentMemberifrs-full:GoodwillMember2020-12-310000313807bp:OilProductionOperationsMember2020-12-31utr:MMBoe0000313807ifrs-full:GoodwillMemberifrs-full:WeightedAverageMember2021-12-310000313807ifrs-full:GoodwillMemberifrs-full:WeightedAverageMember2020-12-310000313807ifrs-full:GoodwillMemberbp:CustomersProductsMemberbp:CastrolMember2021-12-310000313807bp:USFuelsMemberifrs-full:GoodwillMemberbp:CustomersProductsMember2021-12-310000313807ifrs-full:GoodwillMemberbp:CustomersProductsMemberbp:EuropeanFuelsMember2021-12-310000313807ifrs-full:GoodwillMemberbp:OtherProductsMemberbp:CustomersProductsMember2021-12-310000313807ifrs-full:GoodwillMemberbp:CustomersProductsMemberbp:CastrolMember2020-12-310000313807bp:USFuelsMemberifrs-full:GoodwillMemberbp:CustomersProductsMember2020-12-310000313807ifrs-full:GoodwillMemberbp:CustomersProductsMemberbp:EuropeanFuelsMember2020-12-310000313807ifrs-full:GoodwillMemberbp:OtherProductsMemberbp:CustomersProductsMember2020-12-310000313807ifrs-full:TopOfRangeMemberbp:CustomersProductsMember2021-01-012021-12-310000313807bp:CustomersProductsMemberbp:CastrolMember2021-12-310000313807ifrs-full:GrossCarryingAmountMemberifrs-full:IntangibleExplorationAndEvaluationAssetsMember2020-12-310000313807ifrs-full:OtherIntangibleAssetsMemberifrs-full:GrossCarryingAmountMember2020-12-310000313807ifrs-full:GrossCarryingAmountMember2020-12-310000313807ifrs-full:GrossCarryingAmountMemberifrs-full:IntangibleExplorationAndEvaluationAssetsMember2019-12-310000313807ifrs-full:OtherIntangibleAssetsMemberifrs-full:GrossCarryingAmountMember2019-12-310000313807ifrs-full:GrossCarryingAmountMember2019-12-310000313807ifrs-full:GrossCarryingAmountMemberifrs-full:IntangibleExplorationAndEvaluationAssetsMember2021-01-012021-12-310000313807ifrs-full:OtherIntangibleAssetsMemberifrs-full:GrossCarryingAmountMember2021-01-012021-12-310000313807ifrs-full:GrossCarryingAmountMember2021-01-012021-12-310000313807ifrs-full:GrossCarryingAmountMemberifrs-full:IntangibleExplorationAndEvaluationAssetsMember2020-01-012020-12-310000313807ifrs-full:OtherIntangibleAssetsMemberifrs-full:GrossCarryingAmountMember2020-01-012020-12-310000313807ifrs-full:GrossCarryingAmountMember2020-01-012020-12-310000313807ifrs-full:GrossCarryingAmountMemberifrs-full:IntangibleExplorationAndEvaluationAssetsMember2021-12-310000313807ifrs-full:OtherIntangibleAssetsMemberifrs-full:GrossCarryingAmountMember2021-12-310000313807ifrs-full:GrossCarryingAmountMember2021-12-310000313807ifrs-full:IntangibleExplorationAndEvaluationAssetsMemberifrs-full:AccumulatedDepreciationAndAmortisationMember2020-12-310000313807ifrs-full:OtherIntangibleAssetsMemberifrs-full:AccumulatedDepreciationAndAmortisationMember2020-12-310000313807ifrs-full:AccumulatedDepreciationAndAmortisationMember2020-12-310000313807ifrs-full:IntangibleExplorationAndEvaluationAssetsMemberifrs-full:AccumulatedDepreciationAndAmortisationMember2019-12-310000313807ifrs-full:OtherIntangibleAssetsMemberifrs-full:AccumulatedDepreciationAndAmortisationMember2019-12-310000313807ifrs-full:AccumulatedDepreciationAndAmortisationMember2019-12-310000313807ifrs-full:IntangibleExplorationAndEvaluationAssetsMemberifrs-full:AccumulatedDepreciationAndAmortisationMember2021-01-012021-12-310000313807ifrs-full:OtherIntangibleAssetsMemberifrs-full:AccumulatedDepreciationAndAmortisationMember2021-01-012021-12-310000313807ifrs-full:AccumulatedDepreciationAndAmortisationMember2021-01-012021-12-310000313807ifrs-full:IntangibleExplorationAndEvaluationAssetsMemberifrs-full:AccumulatedDepreciationAndAmortisationMember2020-01-012020-12-310000313807ifrs-full:OtherIntangibleAssetsMemberifrs-full:AccumulatedDepreciationAndAmortisationMember2020-01-012020-12-310000313807ifrs-full:AccumulatedDepreciationAndAmortisationMember2020-01-012020-12-310000313807ifrs-full:IntangibleExplorationAndEvaluationAssetsMemberifrs-full:AccumulatedDepreciationAndAmortisationMember2021-12-310000313807ifrs-full:OtherIntangibleAssetsMemberifrs-full:AccumulatedDepreciationAndAmortisationMember2021-12-310000313807ifrs-full:AccumulatedDepreciationAndAmortisationMember2021-12-310000313807ifrs-full:IntangibleExplorationAndEvaluationAssetsMember2021-12-310000313807ifrs-full:OtherIntangibleAssetsMember2021-12-310000313807ifrs-full:IntangibleExplorationAndEvaluationAssetsMember2020-12-310000313807ifrs-full:OtherIntangibleAssetsMember2020-12-310000313807ifrs-full:IntangibleExplorationAndEvaluationAssetsMember2019-12-310000313807ifrs-full:OtherIntangibleAssetsMember2019-12-310000313807bp:PanAmericanEnergyGroupMember2021-01-012021-12-310000313807bp:PanAmericanEnergyGroupMember2020-01-012020-12-310000313807bp:PanAmericanEnergyGroupMember2019-01-012019-12-310000313807bp:PanAmericanEnergyGroupMember2021-12-310000313807bp:PanAmericanEnergyGroupMember2020-12-310000313807ifrs-full:AggregatedIndividuallyImmaterialJointVenturesMember2021-01-012021-12-310000313807ifrs-full:AggregatedIndividuallyImmaterialJointVenturesMember2020-01-012020-12-310000313807ifrs-full:AggregatedIndividuallyImmaterialJointVenturesMember2019-01-012019-12-310000313807ifrs-full:AggregatedIndividuallyImmaterialJointVenturesMember2021-12-310000313807ifrs-full:AggregatedIndividuallyImmaterialJointVenturesMember2020-12-310000313807ifrs-full:JointVenturesMember2021-01-012021-12-310000313807ifrs-full:JointVenturesMember2020-01-012020-12-310000313807ifrs-full:JointVenturesMember2019-01-012019-12-310000313807bp:PanAmericanEnergyGroupMember2021-01-012021-12-310000313807bp:PanAmericanEnergyGroupMember2020-01-012020-12-310000313807bp:PanAmericanEnergyGroupMember2019-01-012019-12-310000313807bp:PanAmericanEnergyGroupMember2021-12-310000313807bp:PanAmericanEnergyGroupMember2020-12-310000313807ifrs-full:BottomOfRangeMemberifrs-full:JointVenturesMember2021-01-012021-12-310000313807ifrs-full:TopOfRangeMemberifrs-full:JointVenturesMember2021-01-012021-12-310000313807ifrs-full:JointVenturesMemberbp:OilProductionOperationsMember2021-01-012021-12-310000313807ifrs-full:JointVenturesMemberbp:OilProductionOperationsMember2020-01-012020-12-310000313807bp:RosneftMember2019-01-012019-12-310000313807bp:RosneftMember2021-12-310000313807bp:RosneftMember2020-12-310000313807ifrs-full:AggregatedIndividuallyImmaterialAssociatesMember2021-01-012021-12-310000313807ifrs-full:AggregatedIndividuallyImmaterialAssociatesMember2020-01-012020-12-310000313807ifrs-full:AggregatedIndividuallyImmaterialAssociatesMember2019-01-012019-12-310000313807ifrs-full:AggregatedIndividuallyImmaterialAssociatesMember2021-12-310000313807ifrs-full:AggregatedIndividuallyImmaterialAssociatesMember2020-12-310000313807ifrs-full:AssociatesMember2021-01-012021-12-310000313807ifrs-full:AssociatesMember2020-01-012020-12-310000313807ifrs-full:AssociatesMember2019-01-012019-12-310000313807bp:RosneftMember2021-01-012021-12-310000313807bp:RosneftMember2020-01-012020-12-310000313807bp:RosneftMember2019-01-012019-12-310000313807bp:RosneftMember2021-12-310000313807bp:RosneftMember2020-12-310000313807ifrs-full:AssociatesMemberifrs-full:BottomOfRangeMember2021-01-012021-12-310000313807ifrs-full:TopOfRangeMemberifrs-full:AssociatesMember2021-01-012021-12-310000313807ifrs-full:EquityInvestmentsMember2021-12-310000313807ifrs-full:EquityInvestmentsMember2020-12-310000313807ifrs-full:ContingentConsiderationMember2021-12-310000313807ifrs-full:ContingentConsiderationMember2020-12-310000313807bp:OtherMiscellaneousFinancialAssetsMember2021-12-310000313807bp:OtherMiscellaneousFinancialAssetsMember2020-12-310000313807bp:HydrocarbonInventoryMember2021-12-310000313807bp:HydrocarbonInventoryMember2020-12-310000313807bp:HydrocarbonInventoryMember2021-01-012021-12-310000313807bp:HydrocarbonInventoryMember2020-01-012020-12-310000313807bp:TradingInventoriesMember2021-12-310000313807ifrs-full:FinancialInstrumentsCreditimpairedMember2021-01-012021-12-310000313807bp:TradeAndOtherReceivablesMember2020-12-310000313807bp:FixedAssetInvestmentsMember2020-12-310000313807bp:TradeAndOtherReceivablesMember2019-12-310000313807bp:FixedAssetInvestmentsMember2019-12-310000313807bp:TradeAndOtherReceivablesMember2018-12-310000313807bp:FixedAssetInvestmentsMember2018-12-310000313807bp:TradeAndOtherReceivablesMember2021-01-012021-12-310000313807bp:FixedAssetInvestmentsMember2021-01-012021-12-310000313807bp:TradeAndOtherReceivablesMember2020-01-012020-12-310000313807bp:FixedAssetInvestmentsMember2020-01-012020-12-310000313807bp:TradeAndOtherReceivablesMember2019-01-012019-12-310000313807bp:FixedAssetInvestmentsMember2019-01-012019-12-310000313807bp:TradeAndOtherReceivablesMember2021-12-310000313807bp:FixedAssetInvestmentsMember2021-12-310000313807ifrs-full:FinancialInstrumentsCreditimpairedMember2021-12-310000313807ifrs-full:FinancialInstrumentsCreditimpairedMember2020-12-310000313807ifrs-full:FinancialInstrumentsCreditimpairedMember2019-12-310000313807ifrs-full:FinancialInstrumentsNotCreditimpairedMember2021-12-310000313807ifrs-full:FinancialInstrumentsNotCreditimpairedMember2020-12-310000313807ifrs-full:FinancialInstrumentsNotCreditimpairedMember2019-12-31bp:participant0000313807bp:NaturalResourceDamagesMemberbp:GulfOfMexicoOilSpillMember2021-12-310000313807bp:GulfOfMexicoOilSpillMemberbp:StateClaimsMember2021-12-310000313807bp:CleanWaterActPenaltiesMemberbp:GulfOfMexicoOilSpillMember2021-12-310000313807bp:ProvisionsforDecommissioningMember2020-12-310000313807bp:ProvisionsForEnvironmentalMember2020-12-310000313807bp:LitigationAndClaimsMember2020-12-310000313807bp:EmissionsMember2020-12-310000313807ifrs-full:MiscellaneousOtherProvisionsMember2020-12-310000313807bp:ProvisionsForEnvironmentalMember2021-01-012021-12-310000313807bp:LitigationAndClaimsMember2021-01-012021-12-310000313807bp:EmissionsMember2021-01-012021-12-310000313807ifrs-full:MiscellaneousOtherProvisionsMember2021-01-012021-12-310000313807bp:ProvisionsforDecommissioningMember2021-12-310000313807bp:ProvisionsForEnvironmentalMember2021-12-310000313807bp:LitigationAndClaimsMember2021-12-310000313807bp:EmissionsMember2021-12-310000313807ifrs-full:MiscellaneousOtherProvisionsMember2021-12-31bp:directorbp:chairman0000313807bp:FundedPlan1Member2021-01-012021-12-310000313807bp:FundedPlan1Member2020-01-012020-12-310000313807bp:FundedPlan1Member2019-01-012019-12-310000313807bp:EuropeExceptUnitedKingdomMember2021-12-310000313807bp:EuropeExceptUnitedKingdomMember2020-12-310000313807bp:EuropeExceptUnitedKingdomMember2019-12-310000313807ifrs-full:CountryOfDomicileMember2021-06-300000313807ifrs-full:CountryOfDomicileMember2021-07-010000313807bp:MaleCurrentlyAtAge60Memberifrs-full:CountryOfDomicileMember2021-12-310000313807bp:MaleCurrentlyAtAge60Memberifrs-full:CountryOfDomicileMember2020-12-310000313807bp:MaleCurrentlyAtAge60Memberifrs-full:CountryOfDomicileMember2019-12-310000313807bp:MaleCurrentlyAtAge60Membercountry:US2021-12-310000313807bp:MaleCurrentlyAtAge60Membercountry:US2020-12-310000313807bp:MaleCurrentlyAtAge60Membercountry:US2019-12-310000313807bp:EuropeExceptUnitedKingdomMemberbp:MaleCurrentlyAtAge60Member2021-12-310000313807bp:EuropeExceptUnitedKingdomMemberbp:MaleCurrentlyAtAge60Member2020-12-310000313807bp:EuropeExceptUnitedKingdomMemberbp:MaleCurrentlyAtAge60Member2019-12-310000313807ifrs-full:CountryOfDomicileMemberbp:MaleAt60ForIndividualsCurrentlyAtAge40Member2021-12-310000313807ifrs-full:CountryOfDomicileMemberbp:MaleAt60ForIndividualsCurrentlyAtAge40Member2020-12-310000313807ifrs-full:CountryOfDomicileMemberbp:MaleAt60ForIndividualsCurrentlyAtAge40Member2019-12-310000313807country:USbp:MaleAt60ForIndividualsCurrentlyAtAge40Member2021-12-310000313807country:USbp:MaleAt60ForIndividualsCurrentlyAtAge40Member2020-12-310000313807country:USbp:MaleAt60ForIndividualsCurrentlyAtAge40Member2019-12-310000313807bp:EuropeExceptUnitedKingdomMemberbp:MaleAt60ForIndividualsCurrentlyAtAge40Member2021-12-310000313807bp:EuropeExceptUnitedKingdomMemberbp:MaleAt60ForIndividualsCurrentlyAtAge40Member2020-12-310000313807bp:EuropeExceptUnitedKingdomMemberbp:MaleAt60ForIndividualsCurrentlyAtAge40Member2019-12-310000313807bp:FemaleCurrentlyAtAge60Memberifrs-full:CountryOfDomicileMember2021-12-310000313807bp:FemaleCurrentlyAtAge60Memberifrs-full:CountryOfDomicileMember2020-12-310000313807bp:FemaleCurrentlyAtAge60Memberifrs-full:CountryOfDomicileMember2019-12-310000313807bp:FemaleCurrentlyAtAge60Membercountry:US2021-12-310000313807bp:FemaleCurrentlyAtAge60Membercountry:US2020-12-310000313807bp:FemaleCurrentlyAtAge60Membercountry:US2019-12-310000313807bp:EuropeExceptUnitedKingdomMemberbp:FemaleCurrentlyAtAge60Member2021-12-310000313807bp:EuropeExceptUnitedKingdomMemberbp:FemaleCurrentlyAtAge60Member2020-12-310000313807bp:EuropeExceptUnitedKingdomMemberbp:FemaleCurrentlyAtAge60Member2019-12-310000313807bp:FemaleAt60ForIndividualsCurrentlyAtAge40Memberifrs-full:CountryOfDomicileMember2021-12-310000313807bp:FemaleAt60ForIndividualsCurrentlyAtAge40Memberifrs-full:CountryOfDomicileMember2020-12-310000313807bp:FemaleAt60ForIndividualsCurrentlyAtAge40Memberifrs-full:CountryOfDomicileMember2019-12-310000313807country:USbp:FemaleAt60ForIndividualsCurrentlyAtAge40Member2021-12-310000313807country:USbp:FemaleAt60ForIndividualsCurrentlyAtAge40Member2020-12-310000313807country:USbp:FemaleAt60ForIndividualsCurrentlyAtAge40Member2019-12-310000313807bp:EuropeExceptUnitedKingdomMemberbp:FemaleAt60ForIndividualsCurrentlyAtAge40Member2021-12-310000313807bp:EuropeExceptUnitedKingdomMemberbp:FemaleAt60ForIndividualsCurrentlyAtAge40Member2020-12-310000313807bp:EuropeExceptUnitedKingdomMemberbp:FemaleAt60ForIndividualsCurrentlyAtAge40Member2019-12-310000313807ifrs-full:CountryOfDomicileMemberbp:GovernmentIssuedNominalBondsMember2021-12-310000313807ifrs-full:CountryOfDomicileMemberbp:GovernmentIssuedNominalBondsMember2020-12-310000313807bp:GovernmentIssuedIndexlinkedBondsMemberifrs-full:CountryOfDomicileMember2021-12-310000313807bp:GovernmentIssuedIndexlinkedBondsMemberifrs-full:CountryOfDomicileMember2020-12-310000313807bp:ListedEquityFundsDevelopedMarketsMemberifrs-full:CountryOfDomicileMember2021-12-310000313807bp:ListedEquityFundsDevelopedMarketsMembercountry:US2021-12-310000313807bp:EuropeExceptUnitedKingdomMemberbp:ListedEquityFundsDevelopedMarketsMember2021-12-310000313807bp:ListedEquityFundsDevelopedMarketsMemberbp:CountriesExcludingUnitedStatesAndEuropeMember2021-12-310000313807bp:ListedEquityFundsDevelopedMarketsMember2021-12-310000313807bp:ListedEquityFundsEmergingMarketsMemberifrs-full:CountryOfDomicileMember2021-12-310000313807country:USbp:ListedEquityFundsEmergingMarketsMember2021-12-310000313807bp:EuropeExceptUnitedKingdomMemberbp:ListedEquityFundsEmergingMarketsMember2021-12-310000313807bp:CountriesExcludingUnitedStatesAndEuropeMemberbp:ListedEquityFundsEmergingMarketsMember2021-12-310000313807bp:ListedEquityFundsEmergingMarketsMember2021-12-310000313807bp:PrivateEquityFunds1Memberifrs-full:CountryOfDomicileMember2021-12-310000313807country:USbp:PrivateEquityFunds1Member2021-12-310000313807bp:EuropeExceptUnitedKingdomMemberbp:PrivateEquityFunds1Member2021-12-310000313807bp:CountriesExcludingUnitedStatesAndEuropeMemberbp:PrivateEquityFunds1Member2021-12-310000313807bp:PrivateEquityFunds1Member2021-12-310000313807country:USbp:GovernmentIssuedNominalBondsMember2021-12-310000313807bp:EuropeExceptUnitedKingdomMemberbp:GovernmentIssuedNominalBondsMember2021-12-310000313807bp:CountriesExcludingUnitedStatesAndEuropeMemberbp:GovernmentIssuedNominalBondsMember2021-12-310000313807bp:GovernmentIssuedNominalBondsMember2021-12-310000313807bp:GovernmentIssuedIndexlinkedBondsMembercountry:US2021-12-310000313807bp:GovernmentIssuedIndexlinkedBondsMemberbp:EuropeExceptUnitedKingdomMember2021-12-310000313807bp:GovernmentIssuedIndexlinkedBondsMemberbp:CountriesExcludingUnitedStatesAndEuropeMember2021-12-310000313807bp:GovernmentIssuedIndexlinkedBondsMember2021-12-310000313807ifrs-full:CountryOfDomicileMemberbp:CorporateDebtSecurities1Member2021-12-310000313807country:USbp:CorporateDebtSecurities1Member2021-12-310000313807bp:EuropeExceptUnitedKingdomMemberbp:CorporateDebtSecurities1Member2021-12-310000313807bp:CountriesExcludingUnitedStatesAndEuropeMemberbp:CorporateDebtSecurities1Member2021-12-310000313807bp:CorporateDebtSecurities1Member2021-12-310000313807bp:CountriesExcludingUnitedStatesAndEuropeMember2021-12-310000313807bp:ListedEquityFundsDevelopedMarketsMemberifrs-full:CountryOfDomicileMember2020-12-310000313807bp:ListedEquityFundsDevelopedMarketsMembercountry:US2020-12-310000313807bp:EuropeExceptUnitedKingdomMemberbp:ListedEquityFundsDevelopedMarketsMember2020-12-310000313807bp:ListedEquityFundsDevelopedMarketsMemberbp:CountriesExcludingUnitedStatesAndEuropeMember2020-12-310000313807bp:ListedEquityFundsDevelopedMarketsMember2020-12-310000313807bp:ListedEquityFundsEmergingMarketsMemberifrs-full:CountryOfDomicileMember2020-12-310000313807country:USbp:ListedEquityFundsEmergingMarketsMember2020-12-310000313807bp:EuropeExceptUnitedKingdomMemberbp:ListedEquityFundsEmergingMarketsMember2020-12-310000313807bp:CountriesExcludingUnitedStatesAndEuropeMemberbp:ListedEquityFundsEmergingMarketsMember2020-12-310000313807bp:ListedEquityFundsEmergingMarketsMember2020-12-310000313807bp:PrivateEquityFunds1Memberifrs-full:CountryOfDomicileMember2020-12-310000313807country:USbp:PrivateEquityFunds1Member2020-12-310000313807bp:EuropeExceptUnitedKingdomMemberbp:PrivateEquityFunds1Member2020-12-310000313807bp:CountriesExcludingUnitedStatesAndEuropeMemberbp:PrivateEquityFunds1Member2020-12-310000313807bp:PrivateEquityFunds1Member2020-12-310000313807country:USbp:GovernmentIssuedNominalBondsMember2020-12-310000313807bp:EuropeExceptUnitedKingdomMemberbp:GovernmentIssuedNominalBondsMember2020-12-310000313807bp:CountriesExcludingUnitedStatesAndEuropeMemberbp:GovernmentIssuedNominalBondsMember2020-12-310000313807bp:GovernmentIssuedNominalBondsMember2020-12-310000313807bp:GovernmentIssuedIndexlinkedBondsMembercountry:US2020-12-310000313807bp:GovernmentIssuedIndexlinkedBondsMemberbp:EuropeExceptUnitedKingdomMember2020-12-310000313807bp:GovernmentIssuedIndexlinkedBondsMemberbp:CountriesExcludingUnitedStatesAndEuropeMember2020-12-310000313807bp:GovernmentIssuedIndexlinkedBondsMember2020-12-310000313807ifrs-full:CountryOfDomicileMemberbp:CorporateDebtSecurities1Member2020-12-310000313807country:USbp:CorporateDebtSecurities1Member2020-12-310000313807bp:EuropeExceptUnitedKingdomMemberbp:CorporateDebtSecurities1Member2020-12-310000313807bp:CountriesExcludingUnitedStatesAndEuropeMemberbp:CorporateDebtSecurities1Member2020-12-310000313807bp:CorporateDebtSecurities1Member2020-12-310000313807bp:CountriesExcludingUnitedStatesAndEuropeMember2020-12-310000313807bp:ListedEquityFundsDevelopedMarketsMemberifrs-full:CountryOfDomicileMember2019-12-310000313807bp:ListedEquityFundsDevelopedMarketsMembercountry:US2019-12-310000313807bp:EuropeExceptUnitedKingdomMemberbp:ListedEquityFundsDevelopedMarketsMember2019-12-310000313807bp:ListedEquityFundsDevelopedMarketsMemberbp:CountriesExcludingUnitedStatesAndEuropeMember2019-12-310000313807bp:ListedEquityFundsDevelopedMarketsMember2019-12-310000313807bp:ListedEquityFundsEmergingMarketsMemberifrs-full:CountryOfDomicileMember2019-12-310000313807country:USbp:ListedEquityFundsEmergingMarketsMember2019-12-310000313807bp:EuropeExceptUnitedKingdomMemberbp:ListedEquityFundsEmergingMarketsMember2019-12-310000313807bp:CountriesExcludingUnitedStatesAndEuropeMemberbp:ListedEquityFundsEmergingMarketsMember2019-12-310000313807bp:ListedEquityFundsEmergingMarketsMember2019-12-310000313807bp:PrivateEquityFunds1Memberifrs-full:CountryOfDomicileMember2019-12-310000313807country:USbp:PrivateEquityFunds1Member2019-12-310000313807bp:EuropeExceptUnitedKingdomMemberbp:PrivateEquityFunds1Member2019-12-310000313807bp:CountriesExcludingUnitedStatesAndEuropeMemberbp:PrivateEquityFunds1Member2019-12-310000313807bp:PrivateEquityFunds1Member2019-12-310000313807ifrs-full:CountryOfDomicileMemberbp:GovernmentIssuedNominalBondsMember2019-12-310000313807country:USbp:GovernmentIssuedNominalBondsMember2019-12-310000313807bp:EuropeExceptUnitedKingdomMemberbp:GovernmentIssuedNominalBondsMember2019-12-310000313807bp:CountriesExcludingUnitedStatesAndEuropeMemberbp:GovernmentIssuedNominalBondsMember2019-12-310000313807bp:GovernmentIssuedNominalBondsMember2019-12-310000313807bp:GovernmentIssuedIndexlinkedBondsMemberifrs-full:CountryOfDomicileMember2019-12-310000313807bp:GovernmentIssuedIndexlinkedBondsMembercountry:US2019-12-310000313807bp:GovernmentIssuedIndexlinkedBondsMemberbp:EuropeExceptUnitedKingdomMember2019-12-310000313807bp:GovernmentIssuedIndexlinkedBondsMemberbp:CountriesExcludingUnitedStatesAndEuropeMember2019-12-310000313807bp:GovernmentIssuedIndexlinkedBondsMember2019-12-310000313807ifrs-full:CountryOfDomicileMemberbp:CorporateDebtSecurities1Member2019-12-310000313807country:USbp:CorporateDebtSecurities1Member2019-12-310000313807bp:EuropeExceptUnitedKingdomMemberbp:CorporateDebtSecurities1Member2019-12-310000313807bp:CountriesExcludingUnitedStatesAndEuropeMemberbp:CorporateDebtSecurities1Member2019-12-310000313807bp:CorporateDebtSecurities1Member2019-12-310000313807bp:CountriesExcludingUnitedStatesAndEuropeMember2019-12-310000313807bp:EuropeExceptUnitedKingdomMember2021-01-012021-12-310000313807bp:CountriesExcludingUnitedStatesAndEuropeMember2021-01-012021-12-310000313807ifrs-full:PresentValueOfDefinedBenefitObligationMemberifrs-full:CountryOfDomicileMember2020-12-310000313807ifrs-full:PresentValueOfDefinedBenefitObligationMembercountry:US2020-12-310000313807bp:EuropeExceptUnitedKingdomMemberifrs-full:PresentValueOfDefinedBenefitObligationMember2020-12-310000313807ifrs-full:PresentValueOfDefinedBenefitObligationMemberbp:CountriesExcludingUnitedStatesAndEuropeMember2020-12-310000313807ifrs-full:PresentValueOfDefinedBenefitObligationMember2020-12-310000313807ifrs-full:PresentValueOfDefinedBenefitObligationMemberifrs-full:CountryOfDomicileMember2021-01-012021-12-310000313807ifrs-full:PresentValueOfDefinedBenefitObligationMembercountry:US2021-01-012021-12-310000313807bp:EuropeExceptUnitedKingdomMemberifrs-full:PresentValueOfDefinedBenefitObligationMember2021-01-012021-12-310000313807ifrs-full:PresentValueOfDefinedBenefitObligationMemberbp:CountriesExcludingUnitedStatesAndEuropeMember2021-01-012021-12-310000313807ifrs-full:PresentValueOfDefinedBenefitObligationMember2021-01-012021-12-310000313807ifrs-full:PresentValueOfDefinedBenefitObligationMemberbp:FundedPlan1Memberifrs-full:CountryOfDomicileMember2021-01-012021-12-310000313807ifrs-full:PresentValueOfDefinedBenefitObligationMembercountry:USbp:FundedPlan1Member2021-01-012021-12-310000313807bp:EuropeExceptUnitedKingdomMemberifrs-full:PresentValueOfDefinedBenefitObligationMemberbp:FundedPlan1Member2021-01-012021-12-310000313807ifrs-full:PresentValueOfDefinedBenefitObligationMemberbp:CountriesExcludingUnitedStatesAndEuropeMemberbp:FundedPlan1Member2021-01-012021-12-310000313807ifrs-full:PresentValueOfDefinedBenefitObligationMemberbp:FundedPlan1Member2021-01-012021-12-310000313807ifrs-full:PresentValueOfDefinedBenefitObligationMemberbp:UnfundedPlan1Memberifrs-full:CountryOfDomicileMember2021-01-012021-12-310000313807ifrs-full:PresentValueOfDefinedBenefitObligationMembercountry:USbp:UnfundedPlan1Member2021-01-012021-12-310000313807bp:EuropeExceptUnitedKingdomMemberifrs-full:PresentValueOfDefinedBenefitObligationMemberbp:UnfundedPlan1Member2021-01-012021-12-310000313807ifrs-full:PresentValueOfDefinedBenefitObligationMemberbp:CountriesExcludingUnitedStatesAndEuropeMemberbp:UnfundedPlan1Member2021-01-012021-12-310000313807ifrs-full:PresentValueOfDefinedBenefitObligationMemberbp:UnfundedPlan1Member2021-01-012021-12-310000313807ifrs-full:PresentValueOfDefinedBenefitObligationMemberifrs-full:CountryOfDomicileMember2021-12-310000313807ifrs-full:PresentValueOfDefinedBenefitObligationMembercountry:US2021-12-310000313807bp:EuropeExceptUnitedKingdomMemberifrs-full:PresentValueOfDefinedBenefitObligationMember2021-12-310000313807ifrs-full:PresentValueOfDefinedBenefitObligationMemberbp:CountriesExcludingUnitedStatesAndEuropeMember2021-12-310000313807ifrs-full:PresentValueOfDefinedBenefitObligationMember2021-12-310000313807ifrs-full:PlanAssetsMemberifrs-full:CountryOfDomicileMember2020-12-310000313807country:USifrs-full:PlanAssetsMember2020-12-310000313807bp:EuropeExceptUnitedKingdomMemberifrs-full:PlanAssetsMember2020-12-310000313807bp:CountriesExcludingUnitedStatesAndEuropeMemberifrs-full:PlanAssetsMember2020-12-310000313807ifrs-full:PlanAssetsMember2020-12-310000313807ifrs-full:PlanAssetsMemberifrs-full:CountryOfDomicileMember2021-01-012021-12-310000313807country:USifrs-full:PlanAssetsMember2021-01-012021-12-310000313807bp:EuropeExceptUnitedKingdomMemberifrs-full:PlanAssetsMember2021-01-012021-12-310000313807bp:CountriesExcludingUnitedStatesAndEuropeMemberifrs-full:PlanAssetsMember2021-01-012021-12-310000313807ifrs-full:PlanAssetsMember2021-01-012021-12-310000313807ifrs-full:PlanAssetsMemberbp:FundedPlan1Memberifrs-full:CountryOfDomicileMember2021-01-012021-12-310000313807country:USifrs-full:PlanAssetsMemberbp:FundedPlan1Member2021-01-012021-12-310000313807bp:EuropeExceptUnitedKingdomMemberifrs-full:PlanAssetsMemberbp:FundedPlan1Member2021-01-012021-12-310000313807bp:CountriesExcludingUnitedStatesAndEuropeMemberifrs-full:PlanAssetsMemberbp:FundedPlan1Member2021-01-012021-12-310000313807ifrs-full:PlanAssetsMemberbp:FundedPlan1Member2021-01-012021-12-310000313807ifrs-full:PlanAssetsMemberifrs-full:CountryOfDomicileMember2021-12-310000313807country:USifrs-full:PlanAssetsMember2021-12-310000313807bp:EuropeExceptUnitedKingdomMemberifrs-full:PlanAssetsMember2021-12-310000313807bp:CountriesExcludingUnitedStatesAndEuropeMemberifrs-full:PlanAssetsMember2021-12-310000313807ifrs-full:PlanAssetsMember2021-12-310000313807bp:FundedPlan1Memberifrs-full:CountryOfDomicileMember2021-12-310000313807country:USbp:FundedPlan1Member2021-12-310000313807bp:EuropeExceptUnitedKingdomMemberbp:FundedPlan1Member2021-12-310000313807bp:CountriesExcludingUnitedStatesAndEuropeMemberbp:FundedPlan1Member2021-12-310000313807bp:FundedPlan1Member2021-12-310000313807bp:UnfundedPlan1Memberifrs-full:CountryOfDomicileMember2021-12-310000313807country:USbp:UnfundedPlan1Member2021-12-310000313807bp:EuropeExceptUnitedKingdomMemberbp:UnfundedPlan1Member2021-12-310000313807bp:CountriesExcludingUnitedStatesAndEuropeMemberbp:UnfundedPlan1Member2021-12-310000313807bp:UnfundedPlan1Member2021-12-310000313807ifrs-full:PresentValueOfDefinedBenefitObligationMemberbp:FundedPlan1Memberifrs-full:CountryOfDomicileMember2021-12-310000313807ifrs-full:PresentValueOfDefinedBenefitObligationMembercountry:USbp:FundedPlan1Member2021-12-310000313807bp:EuropeExceptUnitedKingdomMemberifrs-full:PresentValueOfDefinedBenefitObligationMemberbp:FundedPlan1Member2021-12-310000313807ifrs-full:PresentValueOfDefinedBenefitObligationMemberbp:CountriesExcludingUnitedStatesAndEuropeMemberbp:FundedPlan1Member2021-12-310000313807ifrs-full:PresentValueOfDefinedBenefitObligationMemberbp:FundedPlan1Member2021-12-310000313807ifrs-full:PresentValueOfDefinedBenefitObligationMemberbp:UnfundedPlan1Memberifrs-full:CountryOfDomicileMember2021-12-310000313807ifrs-full:PresentValueOfDefinedBenefitObligationMembercountry:USbp:UnfundedPlan1Member2021-12-310000313807bp:EuropeExceptUnitedKingdomMemberifrs-full:PresentValueOfDefinedBenefitObligationMemberbp:UnfundedPlan1Member2021-12-310000313807ifrs-full:PresentValueOfDefinedBenefitObligationMemberbp:CountriesExcludingUnitedStatesAndEuropeMemberbp:UnfundedPlan1Member2021-12-310000313807ifrs-full:PresentValueOfDefinedBenefitObligationMemberbp:UnfundedPlan1Member2021-12-310000313807ifrs-full:PresentValueOfDefinedBenefitObligationMembercountry:USbp:PensionPlansDefinedBenefit1Member2021-12-310000313807ifrs-full:PresentValueOfDefinedBenefitObligationMembercountry:USbp:PostemploymentRetirementBenefits1Member2021-12-310000313807ifrs-full:PresentValueOfDefinedBenefitObligationMembercountry:DE2021-12-310000313807bp:EuropeExceptUnitedKingdomMember2020-01-012020-12-310000313807bp:CountriesExcludingUnitedStatesAndEuropeMember2020-01-012020-12-310000313807ifrs-full:PresentValueOfDefinedBenefitObligationMemberifrs-full:CountryOfDomicileMember2019-12-310000313807ifrs-full:PresentValueOfDefinedBenefitObligationMembercountry:US2019-12-310000313807bp:EuropeExceptUnitedKingdomMemberifrs-full:PresentValueOfDefinedBenefitObligationMember2019-12-310000313807ifrs-full:PresentValueOfDefinedBenefitObligationMemberbp:CountriesExcludingUnitedStatesAndEuropeMember2019-12-310000313807ifrs-full:PresentValueOfDefinedBenefitObligationMember2019-12-310000313807ifrs-full:PresentValueOfDefinedBenefitObligationMemberifrs-full:CountryOfDomicileMember2020-01-012020-12-310000313807ifrs-full:PresentValueOfDefinedBenefitObligationMembercountry:US2020-01-012020-12-310000313807bp:EuropeExceptUnitedKingdomMemberifrs-full:PresentValueOfDefinedBenefitObligationMember2020-01-012020-12-310000313807ifrs-full:PresentValueOfDefinedBenefitObligationMemberbp:CountriesExcludingUnitedStatesAndEuropeMember2020-01-012020-12-310000313807ifrs-full:PresentValueOfDefinedBenefitObligationMember2020-01-012020-12-310000313807ifrs-full:PresentValueOfDefinedBenefitObligationMemberbp:FundedPlan1Memberifrs-full:CountryOfDomicileMember2020-01-012020-12-310000313807ifrs-full:PresentValueOfDefinedBenefitObligationMembercountry:USbp:FundedPlan1Member2020-01-012020-12-310000313807bp:EuropeExceptUnitedKingdomMemberifrs-full:PresentValueOfDefinedBenefitObligationMemberbp:FundedPlan1Member2020-01-012020-12-310000313807ifrs-full:PresentValueOfDefinedBenefitObligationMemberbp:CountriesExcludingUnitedStatesAndEuropeMemberbp:FundedPlan1Member2020-01-012020-12-310000313807ifrs-full:PresentValueOfDefinedBenefitObligationMemberbp:FundedPlan1Member2020-01-012020-12-310000313807ifrs-full:PresentValueOfDefinedBenefitObligationMemberbp:UnfundedPlan1Memberifrs-full:CountryOfDomicileMember2020-01-012020-12-310000313807ifrs-full:PresentValueOfDefinedBenefitObligationMembercountry:USbp:UnfundedPlan1Member2020-01-012020-12-310000313807bp:EuropeExceptUnitedKingdomMemberifrs-full:PresentValueOfDefinedBenefitObligationMemberbp:UnfundedPlan1Member2020-01-012020-12-310000313807ifrs-full:PresentValueOfDefinedBenefitObligationMemberbp:CountriesExcludingUnitedStatesAndEuropeMemberbp:UnfundedPlan1Member2020-01-012020-12-310000313807ifrs-full:PresentValueOfDefinedBenefitObligationMemberbp:UnfundedPlan1Member2020-01-012020-12-310000313807ifrs-full:PlanAssetsMemberifrs-full:CountryOfDomicileMember2019-12-310000313807country:USifrs-full:PlanAssetsMember2019-12-310000313807bp:EuropeExceptUnitedKingdomMemberifrs-full:PlanAssetsMember2019-12-310000313807bp:CountriesExcludingUnitedStatesAndEuropeMemberifrs-full:PlanAssetsMember2019-12-310000313807ifrs-full:PlanAssetsMember2019-12-310000313807ifrs-full:PlanAssetsMemberifrs-full:CountryOfDomicileMember2020-01-012020-12-310000313807country:USifrs-full:PlanAssetsMember2020-01-012020-12-310000313807bp:EuropeExceptUnitedKingdomMemberifrs-full:PlanAssetsMember2020-01-012020-12-310000313807bp:CountriesExcludingUnitedStatesAndEuropeMemberifrs-full:PlanAssetsMember2020-01-012020-12-310000313807ifrs-full:PlanAssetsMember2020-01-012020-12-310000313807ifrs-full:PlanAssetsMemberbp:FundedPlan1Memberifrs-full:CountryOfDomicileMember2020-01-012020-12-310000313807country:USifrs-full:PlanAssetsMemberbp:FundedPlan1Member2020-01-012020-12-310000313807bp:EuropeExceptUnitedKingdomMemberifrs-full:PlanAssetsMemberbp:FundedPlan1Member2020-01-012020-12-310000313807bp:CountriesExcludingUnitedStatesAndEuropeMemberifrs-full:PlanAssetsMemberbp:FundedPlan1Member2020-01-012020-12-310000313807ifrs-full:PlanAssetsMemberbp:FundedPlan1Member2020-01-012020-12-310000313807bp:FundedPlan1Memberifrs-full:CountryOfDomicileMember2020-12-310000313807country:USbp:FundedPlan1Member2020-12-310000313807bp:EuropeExceptUnitedKingdomMemberbp:FundedPlan1Member2020-12-310000313807bp:CountriesExcludingUnitedStatesAndEuropeMemberbp:FundedPlan1Member2020-12-310000313807bp:FundedPlan1Member2020-12-310000313807bp:UnfundedPlan1Memberifrs-full:CountryOfDomicileMember2020-12-310000313807country:USbp:UnfundedPlan1Member2020-12-310000313807bp:EuropeExceptUnitedKingdomMemberbp:UnfundedPlan1Member2020-12-310000313807bp:CountriesExcludingUnitedStatesAndEuropeMemberbp:UnfundedPlan1Member2020-12-310000313807bp:UnfundedPlan1Member2020-12-310000313807ifrs-full:PresentValueOfDefinedBenefitObligationMemberbp:FundedPlan1Memberifrs-full:CountryOfDomicileMember2020-12-310000313807ifrs-full:PresentValueOfDefinedBenefitObligationMembercountry:USbp:FundedPlan1Member2020-12-310000313807bp:EuropeExceptUnitedKingdomMemberifrs-full:PresentValueOfDefinedBenefitObligationMemberbp:FundedPlan1Member2020-12-310000313807ifrs-full:PresentValueOfDefinedBenefitObligationMemberbp:CountriesExcludingUnitedStatesAndEuropeMemberbp:FundedPlan1Member2020-12-310000313807ifrs-full:PresentValueOfDefinedBenefitObligationMemberbp:FundedPlan1Member2020-12-310000313807ifrs-full:PresentValueOfDefinedBenefitObligationMemberbp:UnfundedPlan1Memberifrs-full:CountryOfDomicileMember2020-12-310000313807ifrs-full:PresentValueOfDefinedBenefitObligationMembercountry:USbp:UnfundedPlan1Member2020-12-310000313807bp:EuropeExceptUnitedKingdomMemberifrs-full:PresentValueOfDefinedBenefitObligationMemberbp:UnfundedPlan1Member2020-12-310000313807ifrs-full:PresentValueOfDefinedBenefitObligationMemberbp:CountriesExcludingUnitedStatesAndEuropeMemberbp:UnfundedPlan1Member2020-12-310000313807ifrs-full:PresentValueOfDefinedBenefitObligationMemberbp:UnfundedPlan1Member2020-12-310000313807ifrs-full:PresentValueOfDefinedBenefitObligationMembercountry:USbp:PensionPlansDefinedBenefit1Member2020-12-310000313807ifrs-full:PresentValueOfDefinedBenefitObligationMembercountry:USbp:PostemploymentRetirementBenefits1Member2020-12-310000313807ifrs-full:PresentValueOfDefinedBenefitObligationMembercountry:DE2020-12-310000313807bp:EuropeExceptUnitedKingdomMember2019-01-012019-12-310000313807bp:CountriesExcludingUnitedStatesAndEuropeMember2019-01-012019-12-310000313807ifrs-full:ActuarialAssumptionOfDiscountRatesMemberifrs-full:CountryOfDomicileMember2021-12-310000313807ifrs-full:ActuarialAssumptionOfDiscountRatesMembercountry:US2021-12-310000313807ifrs-full:ActuarialAssumptionOfDiscountRatesMemberbp:EuropeExceptUnitedKingdomMember2021-12-310000313807ifrs-full:ActuarialAssumptionOfExpectedRatesOfInflationMemberifrs-full:CountryOfDomicileMember2021-12-310000313807country:USifrs-full:ActuarialAssumptionOfExpectedRatesOfInflationMember2021-12-310000313807bp:EuropeExceptUnitedKingdomMemberifrs-full:ActuarialAssumptionOfExpectedRatesOfInflationMember2021-12-310000313807ifrs-full:ActuarialAssumptionOfMortalityRatesMemberifrs-full:CountryOfDomicileMember2021-12-310000313807ifrs-full:ActuarialAssumptionOfMortalityRatesMembercountry:US2021-12-310000313807bp:EuropeExceptUnitedKingdomMemberifrs-full:ActuarialAssumptionOfMortalityRatesMember2021-12-310000313807bp:NonUKCountriesMember2021-12-310000313807bp:NonUKCountriesMember2020-12-310000313807bp:Borrowings1Member2021-12-310000313807bp:Borrowings1Member2020-12-310000313807bp:LongTermBorrowingsExcludingFinanceLeaseLiabilitiesMemberifrs-full:GrossCarryingAmountMemberifrs-full:NotLaterThanOneYearMember2021-12-310000313807bp:LongTermBorrowingsExcludingFinanceLeaseLiabilitiesMemberifrs-full:GrossCarryingAmountMemberifrs-full:NotLaterThanOneYearMember2020-12-310000313807ifrs-full:GrossCarryingAmountMemberbp:CommercialPaper1Memberifrs-full:NotLaterThanOneYearMember2021-12-310000313807ifrs-full:GrossCarryingAmountMemberbp:CommercialPaper1Memberifrs-full:NotLaterThanOneYearMember2020-12-310000313807ifrs-full:GrossCarryingAmountMemberbp:AccruedInterestMemberifrs-full:NotLaterThanOneYearMember2021-12-310000313807ifrs-full:GrossCarryingAmountMemberbp:AccruedInterestMemberifrs-full:NotLaterThanOneYearMember2020-12-310000313807bp:EuroAndSterlingBondsMember2021-01-012021-12-310000313807bp:EuroAndSterlingBondsMember2020-01-012020-12-310000313807bp:USDollarBorrowingsMemberifrs-full:FixedInterestRateMemberifrs-full:WeightedAverageMember2021-12-310000313807bp:USDollarBorrowingsMemberifrs-full:FixedInterestRateMemberifrs-full:WeightedAverageMember2021-01-012021-12-310000313807bp:USDollarBorrowingsMemberifrs-full:FixedInterestRateMember2021-12-310000313807ifrs-full:FloatingInterestRateMemberbp:USDollarBorrowingsMemberifrs-full:WeightedAverageMember2021-12-310000313807ifrs-full:FloatingInterestRateMemberbp:USDollarBorrowingsMember2021-12-310000313807bp:USDollarBorrowingsMember2021-12-310000313807ifrs-full:FixedInterestRateMemberifrs-full:WeightedAverageMemberbp:NonUSDollarBorrowingsMember2021-12-310000313807ifrs-full:FixedInterestRateMemberifrs-full:WeightedAverageMemberbp:NonUSDollarBorrowingsMember2021-01-012021-12-310000313807ifrs-full:FixedInterestRateMemberbp:NonUSDollarBorrowingsMember2021-12-310000313807ifrs-full:FloatingInterestRateMemberifrs-full:WeightedAverageMemberbp:NonUSDollarBorrowingsMember2021-12-310000313807ifrs-full:FloatingInterestRateMemberbp:NonUSDollarBorrowingsMember2021-12-310000313807bp:NonUSDollarBorrowingsMember2021-12-310000313807ifrs-full:FixedInterestRateMember2021-12-310000313807ifrs-full:FloatingInterestRateMember2021-12-310000313807bp:USDollarBorrowingsMemberifrs-full:FixedInterestRateMemberifrs-full:WeightedAverageMember2020-12-310000313807bp:USDollarBorrowingsMemberifrs-full:FixedInterestRateMemberifrs-full:WeightedAverageMember2020-01-012020-12-310000313807bp:USDollarBorrowingsMemberifrs-full:FixedInterestRateMember2020-12-310000313807ifrs-full:FloatingInterestRateMemberbp:USDollarBorrowingsMemberifrs-full:WeightedAverageMember2020-12-310000313807ifrs-full:FloatingInterestRateMemberbp:USDollarBorrowingsMember2020-12-310000313807bp:USDollarBorrowingsMember2020-12-310000313807ifrs-full:FixedInterestRateMemberifrs-full:WeightedAverageMemberbp:NonUSDollarBorrowingsMember2020-12-310000313807ifrs-full:FixedInterestRateMemberifrs-full:WeightedAverageMemberbp:NonUSDollarBorrowingsMember2020-01-012020-12-310000313807ifrs-full:FixedInterestRateMemberbp:NonUSDollarBorrowingsMember2020-12-310000313807ifrs-full:FloatingInterestRateMemberifrs-full:WeightedAverageMemberbp:NonUSDollarBorrowingsMember2020-12-310000313807ifrs-full:FloatingInterestRateMemberbp:NonUSDollarBorrowingsMember2020-12-310000313807bp:NonUSDollarBorrowingsMember2020-12-310000313807ifrs-full:FixedInterestRateMember2020-12-310000313807ifrs-full:FloatingInterestRateMember2020-12-310000313807ifrs-full:ShorttermBorrowingsMember2021-12-310000313807ifrs-full:ShorttermBorrowingsMember2020-12-310000313807ifrs-full:LongtermBorrowingsMember2021-12-310000313807ifrs-full:LongtermBorrowingsMember2020-12-310000313807bp:Borrowings1Member2021-12-310000313807bp:Borrowings1Member2020-12-310000313807bp:DebtHedgesMemberifrs-full:DerivativesMember2021-12-310000313807bp:DebtHedgesMemberifrs-full:DerivativesMember2020-12-310000313807bp:Borrowings1Member2020-12-310000313807ifrs-full:CurrencySwapContractMember2020-12-310000313807ifrs-full:LeaseLiabilitiesMember2020-12-310000313807bp:NetpartnerpayableforleasesenteredintoonbehalfofjointoperationsMember2020-12-310000313807bp:Borrowings1Member2021-01-012021-12-310000313807ifrs-full:CurrencySwapContractMember2021-01-012021-12-310000313807ifrs-full:LeaseLiabilitiesMember2021-01-012021-12-310000313807bp:NetpartnerpayableforleasesenteredintoonbehalfofjointoperationsMember2021-01-012021-12-310000313807bp:Borrowings1Member2021-12-310000313807ifrs-full:CurrencySwapContractMember2021-12-310000313807ifrs-full:LeaseLiabilitiesMember2021-12-310000313807bp:NetpartnerpayableforleasesenteredintoonbehalfofjointoperationsMember2021-12-310000313807bp:Borrowings1Member2019-12-310000313807ifrs-full:CurrencySwapContractMember2019-12-310000313807ifrs-full:LeaseLiabilitiesMember2019-12-310000313807bp:NetpartnerpayableforleasesenteredintoonbehalfofjointoperationsMember2019-12-310000313807bp:Borrowings1Member2020-01-012020-12-310000313807ifrs-full:CurrencySwapContractMember2020-01-012020-12-310000313807ifrs-full:LeaseLiabilitiesMember2020-01-012020-12-310000313807bp:NetpartnerpayableforleasesenteredintoonbehalfofjointoperationsMember2020-01-012020-12-310000313807ifrs-full:NotLaterThanOneYearMember2021-12-310000313807ifrs-full:NotLaterThanOneYearMember2020-12-310000313807ifrs-full:LaterThanOneYearAndNotLaterThanTwoYearsMember2021-12-310000313807ifrs-full:LaterThanOneYearAndNotLaterThanTwoYearsMember2020-12-310000313807ifrs-full:LaterThanTwoYearsAndNotLaterThanThreeYearsMember2021-12-310000313807ifrs-full:LaterThanTwoYearsAndNotLaterThanThreeYearsMember2020-12-310000313807ifrs-full:LaterThanThreeYearsAndNotLaterThanFourYearsMember2021-12-310000313807ifrs-full:LaterThanThreeYearsAndNotLaterThanFourYearsMember2020-12-310000313807ifrs-full:LaterThanFourYearsAndNotLaterThanFiveYearsMember2021-12-310000313807ifrs-full:LaterThanFourYearsAndNotLaterThanFiveYearsMember2020-12-310000313807ifrs-full:LaterThanFiveYearsAndNotLaterThanTenYearsMember2021-12-310000313807ifrs-full:LaterThanFiveYearsAndNotLaterThanTenYearsMember2020-12-310000313807ifrs-full:LaterThanTenYearsMember2021-12-310000313807ifrs-full:LaterThanTenYearsMember2020-12-310000313807bp:OtherFinancialAssetsMemberifrs-full:FinancialAssetsAtFairValueThroughProfitOrLossMandatorilyMeasuredAtFairValueCategoryMember2021-12-310000313807bp:OtherFinancialAssetsMember2021-12-310000313807ifrs-full:FinancialAssetsAtAmortisedCostMemberifrs-full:LoanCommitmentsMember2021-12-310000313807ifrs-full:FinancialAssetsAtFairValueThroughProfitOrLossMandatorilyMeasuredAtFairValueCategoryMemberifrs-full:LoanCommitmentsMember2021-12-310000313807ifrs-full:LoanCommitmentsMember2021-12-310000313807ifrs-full:TradeReceivablesMemberifrs-full:FinancialAssetsAtAmortisedCostMember2021-12-310000313807ifrs-full:TradeReceivablesMember2021-12-310000313807ifrs-full:FinancialAssetsAtFairValueThroughProfitOrLossMandatorilyMeasuredAtFairValueCategoryMemberifrs-full:DerivativesMember2021-12-310000313807ifrs-full:FinancialAssetsAtFairValueThroughProfitOrLossDesignatedUponInitialRecognitionCategoryMemberifrs-full:DerivativesMember2021-12-310000313807ifrs-full:DerivativesMember2021-12-310000313807bp:CashAndCashEquivalents1Memberifrs-full:FinancialAssetsAtAmortisedCostMember2021-12-310000313807bp:CashAndCashEquivalents1Memberifrs-full:FinancialAssetsAtFairValueThroughProfitOrLossMandatorilyMeasuredAtFairValueCategoryMember2021-12-310000313807bp:CashAndCashEquivalents1Member2021-12-310000313807bp:TradeAndOtherPayablesMemberifrs-full:FinancialLiabilitiesAtAmortisedCostCategoryMember2021-12-310000313807bp:FinancialLiabilitiesAtFairValueThroughProfitOrLossMandatorilyMeasuredAtFairValueMemberifrs-full:DerivativesMember2021-12-310000313807ifrs-full:DerivativesMemberifrs-full:FinancialLiabilitiesAtFairValueThroughProfitOrLossDesignatedUponInitialRecognitionCategoryMember2021-12-310000313807ifrs-full:DerivativesMember2021-12-310000313807ifrs-full:FinancialLiabilitiesAtAmortisedCostCategoryMemberbp:AccrualsMember2021-12-310000313807bp:AccrualsMember2021-12-310000313807ifrs-full:FinancialLiabilitiesAtAmortisedCostCategoryMemberifrs-full:LeaseLiabilitiesMember2021-12-310000313807ifrs-full:LeaseLiabilitiesMember2021-12-310000313807bp:Borrowings1Memberifrs-full:FinancialLiabilitiesAtAmortisedCostCategoryMember2021-12-310000313807ifrs-full:FinancialLiabilitiesAtAmortisedCostCategoryMember2021-12-310000313807ifrs-full:FinancialAssetsAtFairValueThroughProfitOrLossMandatorilyMeasuredAtFairValueCategoryMember2021-12-310000313807ifrs-full:FinancialAssetsAtFairValueThroughProfitOrLossDesignatedUponInitialRecognitionCategoryMember2021-12-310000313807bp:OtherFinancialAssetsMemberifrs-full:FinancialAssetsAtFairValueThroughProfitOrLossMandatorilyMeasuredAtFairValueCategoryMember2020-12-310000313807bp:OtherFinancialAssetsMember2020-12-310000313807ifrs-full:FinancialAssetsAtAmortisedCostMemberifrs-full:LoanCommitmentsMember2020-12-310000313807ifrs-full:FinancialAssetsAtFairValueThroughProfitOrLossMandatorilyMeasuredAtFairValueCategoryMemberifrs-full:LoanCommitmentsMember2020-12-310000313807ifrs-full:LoanCommitmentsMember2020-12-310000313807ifrs-full:TradeReceivablesMemberifrs-full:FinancialAssetsAtAmortisedCostMember2020-12-310000313807ifrs-full:TradeReceivablesMember2020-12-310000313807ifrs-full:FinancialAssetsAtFairValueThroughProfitOrLossMandatorilyMeasuredAtFairValueCategoryMemberifrs-full:DerivativesMember2020-12-310000313807ifrs-full:FinancialAssetsAtFairValueThroughProfitOrLossDesignatedUponInitialRecognitionCategoryMemberifrs-full:DerivativesMember2020-12-310000313807ifrs-full:DerivativesMember2020-12-310000313807bp:CashAndCashEquivalents1Memberifrs-full:FinancialAssetsAtAmortisedCostMember2020-12-310000313807bp:CashAndCashEquivalents1Memberifrs-full:FinancialAssetsAtFairValueThroughProfitOrLossMandatorilyMeasuredAtFairValueCategoryMember2020-12-310000313807bp:CashAndCashEquivalents1Member2020-12-310000313807bp:TradeAndOtherPayablesMemberifrs-full:FinancialLiabilitiesAtAmortisedCostCategoryMember2020-12-310000313807bp:FinancialLiabilitiesAtFairValueThroughProfitOrLossMandatorilyMeasuredAtFairValueMemberifrs-full:DerivativesMember2020-12-310000313807ifrs-full:DerivativesMemberifrs-full:FinancialLiabilitiesAtFairValueThroughProfitOrLossDesignatedUponInitialRecognitionCategoryMember2020-12-310000313807ifrs-full:DerivativesMember2020-12-310000313807ifrs-full:FinancialLiabilitiesAtAmortisedCostCategoryMemberbp:AccrualsMember2020-12-310000313807bp:AccrualsMember2020-12-310000313807ifrs-full:FinancialLiabilitiesAtAmortisedCostCategoryMemberifrs-full:LeaseLiabilitiesMember2020-12-310000313807ifrs-full:LeaseLiabilitiesMember2020-12-310000313807bp:Borrowings1Memberifrs-full:FinancialLiabilitiesAtAmortisedCostCategoryMember2020-12-310000313807ifrs-full:FinancialLiabilitiesAtAmortisedCostCategoryMember2020-12-310000313807ifrs-full:FinancialAssetsAtFairValueThroughProfitOrLossMandatorilyMeasuredAtFairValueCategoryMember2020-12-310000313807ifrs-full:FinancialLiabilitiesAtFairValueThroughProfitOrLossDesignatedUponInitialRecognitionCategoryMember2020-12-310000313807bp:TradingMemberifrs-full:CommodityPriceRiskMember2021-12-310000313807bp:TradingMemberifrs-full:CommodityPriceRiskMember2020-12-310000313807srt:ArithmeticAverageMemberifrs-full:CommodityPriceRiskMember2021-12-310000313807srt:ArithmeticAverageMemberifrs-full:CommodityPriceRiskMember2020-12-310000313807ifrs-full:CurrencyRiskMember2021-12-310000313807ifrs-full:CurrencyRiskMember2020-12-310000313807ifrs-full:TopOfRangeMemberifrs-full:CurrencyRiskMember2021-12-310000313807ifrs-full:CurrencyRiskMember2021-01-012021-12-310000313807ifrs-full:CurrencyRiskMemberbp:CurrencyForwardContractUSDAndSterlingMember2021-12-310000313807ifrs-full:CurrencyRiskMemberbp:CurrencyForwardContractUSDAndSterlingMember2020-12-310000313807ifrs-full:InterestRateRiskMember2021-12-310000313807ifrs-full:InterestRateRiskMember2020-12-310000313807ifrs-full:InterestRateRiskMemberifrs-full:FixedInterestRateMemberifrs-full:WeightedAverageMember2021-12-310000313807ifrs-full:InterestRateRiskMemberifrs-full:FixedInterestRateMemberifrs-full:WeightedAverageMember2020-12-310000313807ifrs-full:InterestRateRiskMemberifrs-full:FixedInterestRateMember2021-01-012021-12-310000313807ifrs-full:InterestRateRiskMemberifrs-full:FixedInterestRateMember2020-01-012020-12-310000313807ifrs-full:InterestRateRiskMember2021-01-012021-12-310000313807ifrs-full:InterestRateRiskMember2020-01-012020-12-310000313807ifrs-full:FinancialGuaranteeContractsMemberbp:JointVenturesAndAssociatesMemberifrs-full:CreditRiskMember2021-12-310000313807ifrs-full:FinancialGuaranteeContractsMemberbp:JointVenturesAndAssociatesMemberifrs-full:CreditRiskMember2020-12-310000313807bp:ThirdPartyArrangementMemberifrs-full:FinancialGuaranteeContractsMemberifrs-full:CreditRiskMember2021-12-310000313807bp:ThirdPartyArrangementMemberifrs-full:FinancialGuaranteeContractsMemberifrs-full:CreditRiskMember2020-12-310000313807ifrs-full:CreditRiskMember2021-12-310000313807ifrs-full:CreditRiskMember2020-12-310000313807bp:FinancialAssetsWhichAreSubjectToReviewForImpairmentUnderIFRS9Memberifrs-full:CreditRiskMember2021-12-310000313807bp:FinancialAssetsWhichAreSubjectToReviewForImpairmentUnderIFRS9Memberifrs-full:CreditRiskMember2020-12-310000313807bp:FinancialAssetsWhichAreSubjectToReviewForImpairmentUnderIFRS9Memberbp:AAAToAAMinusRatingMember2021-12-310000313807bp:FinancialAssetsWhichAreSubjectToReviewForImpairmentUnderIFRS9Memberbp:AAAToAAMinusRatingMember2020-12-310000313807bp:APlusToAMinusRatingMemberbp:FinancialAssetsWhichAreSubjectToReviewForImpairmentUnderIFRS9Member2021-12-310000313807bp:APlusToAMinusRatingMemberbp:FinancialAssetsWhichAreSubjectToReviewForImpairmentUnderIFRS9Member2020-12-310000313807bp:BBBPlusToBBBMinusRatingMemberbp:FinancialAssetsWhichAreSubjectToReviewForImpairmentUnderIFRS9Member2021-12-310000313807bp:BBBPlusToBBBMinusRatingMemberbp:FinancialAssetsWhichAreSubjectToReviewForImpairmentUnderIFRS9Member2020-12-310000313807bp:BBPlusToBBMinusRatingMemberbp:FinancialAssetsWhichAreSubjectToReviewForImpairmentUnderIFRS9Member2021-12-310000313807bp:BBPlusToBBMinusRatingMemberbp:FinancialAssetsWhichAreSubjectToReviewForImpairmentUnderIFRS9Member2020-12-310000313807bp:BPlusToBMinusRatingMemberbp:FinancialAssetsWhichAreSubjectToReviewForImpairmentUnderIFRS9Member2021-12-310000313807bp:BPlusToBMinusRatingMemberbp:FinancialAssetsWhichAreSubjectToReviewForImpairmentUnderIFRS9Member2020-12-310000313807bp:FinancialAssetsWhichAreSubjectToReviewForImpairmentUnderIFRS9Memberbp:CCCPlusAndBelowRatingMember2021-12-310000313807bp:FinancialAssetsWhichAreSubjectToReviewForImpairmentUnderIFRS9Memberbp:CCCPlusAndBelowRatingMember2020-12-310000313807bp:TradeAndOtherCurrentPayablesMember2021-12-310000313807bp:TradeAndOtherCurrentPayablesMember2020-12-310000313807bp:CommittedLetterOfCreditFacilitiesMemberifrs-full:LiquidityRiskMember2021-12-310000313807bp:CommittedLetterOfCreditFacilitiesMemberifrs-full:LiquidityRiskMember2020-12-310000313807ifrs-full:TopOfRangeMemberbp:CommittedLetterOfCreditFacilitiesMemberifrs-full:LiquidityRiskMember2021-01-012021-12-310000313807ifrs-full:LiquidityRiskMemberbp:UncommittedSecuredLetterOfCreditFacilitiesMember2021-12-310000313807ifrs-full:LiquidityRiskMemberbp:UncommittedSecuredLetterOfCreditFacilitiesMember2020-12-310000313807bp:CommittedLetterOfCreditFacilitiesMemberifrs-full:LiquidityRiskMember2021-12-31bp:bank0000313807bp:LongTermTaxableBondsMemberifrs-full:LiquidityRiskMember2021-01-012021-12-310000313807bp:LongTermTaxableBondsMemberifrs-full:LiquidityRiskMember2020-01-012020-12-310000313807bp:LongTermTaxableBondsMemberifrs-full:BottomOfRangeMemberifrs-full:LiquidityRiskMember2021-01-012021-12-310000313807ifrs-full:TopOfRangeMemberbp:LongTermTaxableBondsMemberifrs-full:LiquidityRiskMember2021-01-012021-12-310000313807ifrs-full:LiquidityRiskMemberbp:NonControllingInterestsHybridBondsMember2021-01-012021-12-310000313807ifrs-full:LiquidityRiskMemberbp:NonControllingInterestsHybridBondsMember2020-01-012020-12-310000313807ifrs-full:LiquidityRiskMember2021-12-310000313807ifrs-full:LiquidityRiskMember2020-12-310000313807bp:CreditFacilityMemberifrs-full:LiquidityRiskMember2021-12-310000313807bp:CreditFacilityMemberifrs-full:LiquidityRiskMember2020-12-310000313807ifrs-full:LiquidityRiskMemberbp:StandbyCreditFacilityMember2021-12-310000313807ifrs-full:LiquidityRiskMemberbp:StandbyCreditFacilityMember2020-12-310000313807bp:StandbyCreditFacilityMemberifrs-full:LiquidityRiskMember2021-12-310000313807bp:TradeAndOtherPayablesMemberifrs-full:NotLaterThanOneYearMember2021-12-310000313807bp:AccrualsMemberifrs-full:NotLaterThanOneYearMember2021-12-310000313807bp:BorrowingsExcludingFairValueAdjustmentMemberifrs-full:NotLaterThanOneYearMember2021-12-310000313807bp:InterestOnBorrowingsMemberifrs-full:NotLaterThanOneYearMember2021-12-310000313807bp:TradeAndOtherPayablesMemberifrs-full:NotLaterThanOneYearMember2020-12-310000313807bp:AccrualsMemberifrs-full:NotLaterThanOneYearMember2020-12-310000313807bp:BorrowingsExcludingFairValueAdjustmentMemberifrs-full:NotLaterThanOneYearMember2020-12-310000313807bp:InterestOnBorrowingsMemberifrs-full:NotLaterThanOneYearMember2020-12-310000313807bp:TradeAndOtherPayablesMemberifrs-full:LaterThanOneYearAndNotLaterThanTwoYearsMember2021-12-310000313807ifrs-full:LaterThanOneYearAndNotLaterThanTwoYearsMemberbp:AccrualsMember2021-12-310000313807ifrs-full:LaterThanOneYearAndNotLaterThanTwoYearsMemberbp:BorrowingsExcludingFairValueAdjustmentMember2021-12-310000313807ifrs-full:LaterThanOneYearAndNotLaterThanTwoYearsMemberbp:InterestOnBorrowingsMember2021-12-310000313807bp:TradeAndOtherPayablesMemberifrs-full:LaterThanOneYearAndNotLaterThanTwoYearsMember2020-12-310000313807ifrs-full:LaterThanOneYearAndNotLaterThanTwoYearsMemberbp:AccrualsMember2020-12-310000313807ifrs-full:LaterThanOneYearAndNotLaterThanTwoYearsMemberbp:BorrowingsExcludingFairValueAdjustmentMember2020-12-310000313807ifrs-full:LaterThanOneYearAndNotLaterThanTwoYearsMemberbp:InterestOnBorrowingsMember2020-12-310000313807ifrs-full:LaterThanTwoYearsAndNotLaterThanThreeYearsMemberbp:TradeAndOtherPayablesMember2021-12-310000313807ifrs-full:LaterThanTwoYearsAndNotLaterThanThreeYearsMemberbp:AccrualsMember2021-12-310000313807ifrs-full:LaterThanTwoYearsAndNotLaterThanThreeYearsMemberbp:BorrowingsExcludingFairValueAdjustmentMember2021-12-310000313807ifrs-full:LaterThanTwoYearsAndNotLaterThanThreeYearsMemberbp:InterestOnBorrowingsMember2021-12-310000313807ifrs-full:LaterThanTwoYearsAndNotLaterThanThreeYearsMemberbp:TradeAndOtherPayablesMember2020-12-310000313807ifrs-full:LaterThanTwoYearsAndNotLaterThanThreeYearsMemberbp:AccrualsMember2020-12-310000313807ifrs-full:LaterThanTwoYearsAndNotLaterThanThreeYearsMemberbp:BorrowingsExcludingFairValueAdjustmentMember2020-12-310000313807ifrs-full:LaterThanTwoYearsAndNotLaterThanThreeYearsMemberbp:InterestOnBorrowingsMember2020-12-310000313807bp:TradeAndOtherPayablesMemberifrs-full:LaterThanThreeYearsAndNotLaterThanFourYearsMember2021-12-310000313807ifrs-full:LaterThanThreeYearsAndNotLaterThanFourYearsMemberbp:AccrualsMember2021-12-310000313807bp:BorrowingsExcludingFairValueAdjustmentMemberifrs-full:LaterThanThreeYearsAndNotLaterThanFourYearsMember2021-12-310000313807ifrs-full:LaterThanThreeYearsAndNotLaterThanFourYearsMemberbp:InterestOnBorrowingsMember2021-12-310000313807bp:TradeAndOtherPayablesMemberifrs-full:LaterThanThreeYearsAndNotLaterThanFourYearsMember2020-12-310000313807ifrs-full:LaterThanThreeYearsAndNotLaterThanFourYearsMemberbp:AccrualsMember2020-12-310000313807bp:BorrowingsExcludingFairValueAdjustmentMemberifrs-full:LaterThanThreeYearsAndNotLaterThanFourYearsMember2020-12-310000313807ifrs-full:LaterThanThreeYearsAndNotLaterThanFourYearsMemberbp:InterestOnBorrowingsMember2020-12-310000313807ifrs-full:LaterThanFourYearsAndNotLaterThanFiveYearsMemberbp:TradeAndOtherPayablesMember2021-12-310000313807ifrs-full:LaterThanFourYearsAndNotLaterThanFiveYearsMemberbp:AccrualsMember2021-12-310000313807ifrs-full:LaterThanFourYearsAndNotLaterThanFiveYearsMemberbp:BorrowingsExcludingFairValueAdjustmentMember2021-12-310000313807ifrs-full:LaterThanFourYearsAndNotLaterThanFiveYearsMemberbp:InterestOnBorrowingsMember2021-12-310000313807ifrs-full:LaterThanFourYearsAndNotLaterThanFiveYearsMemberbp:TradeAndOtherPayablesMember2020-12-310000313807ifrs-full:LaterThanFourYearsAndNotLaterThanFiveYearsMemberbp:AccrualsMember2020-12-310000313807ifrs-full:LaterThanFourYearsAndNotLaterThanFiveYearsMemberbp:BorrowingsExcludingFairValueAdjustmentMember2020-12-310000313807ifrs-full:LaterThanFourYearsAndNotLaterThanFiveYearsMemberbp:InterestOnBorrowingsMember2020-12-310000313807ifrs-full:LaterThanFiveYearsAndNotLaterThanTenYearsMemberbp:TradeAndOtherPayablesMember2021-12-310000313807ifrs-full:LaterThanFiveYearsAndNotLaterThanTenYearsMemberbp:AccrualsMember2021-12-310000313807ifrs-full:LaterThanFiveYearsAndNotLaterThanTenYearsMemberbp:BorrowingsExcludingFairValueAdjustmentMember2021-12-310000313807ifrs-full:LaterThanFiveYearsAndNotLaterThanTenYearsMemberbp:InterestOnBorrowingsMember2021-12-310000313807ifrs-full:LaterThanFiveYearsAndNotLaterThanTenYearsMemberbp:TradeAndOtherPayablesMember2020-12-310000313807ifrs-full:LaterThanFiveYearsAndNotLaterThanTenYearsMemberbp:AccrualsMember2020-12-310000313807ifrs-full:LaterThanFiveYearsAndNotLaterThanTenYearsMemberbp:BorrowingsExcludingFairValueAdjustmentMember2020-12-310000313807ifrs-full:LaterThanFiveYearsAndNotLaterThanTenYearsMemberbp:InterestOnBorrowingsMember2020-12-310000313807bp:TradeAndOtherPayablesMemberifrs-full:LaterThanTenYearsMember2021-12-310000313807ifrs-full:LaterThanTenYearsMemberbp:AccrualsMember2021-12-310000313807ifrs-full:LaterThanTenYearsMemberbp:BorrowingsExcludingFairValueAdjustmentMember2021-12-310000313807ifrs-full:LaterThanTenYearsMemberbp:InterestOnBorrowingsMember2021-12-310000313807bp:TradeAndOtherPayablesMemberifrs-full:LaterThanTenYearsMember2020-12-310000313807ifrs-full:LaterThanTenYearsMemberbp:AccrualsMember2020-12-310000313807ifrs-full:LaterThanTenYearsMemberbp:BorrowingsExcludingFairValueAdjustmentMember2020-12-310000313807ifrs-full:LaterThanTenYearsMemberbp:InterestOnBorrowingsMember2020-12-310000313807bp:TradeAndOtherPayablesMember2021-12-310000313807bp:BorrowingsExcludingFairValueAdjustmentMember2021-12-310000313807bp:InterestOnBorrowingsMember2021-12-310000313807bp:TradeAndOtherPayablesMember2020-12-310000313807bp:BorrowingsExcludingFairValueAdjustmentMember2020-12-310000313807bp:InterestOnBorrowingsMember2020-12-310000313807bp:TradeAndOtherPayablesMemberbp:GulfOfMexicoOilSpillMember2021-12-310000313807bp:TradeAndOtherPayablesMemberbp:GulfOfMexicoOilSpillMember2020-12-310000313807bp:TradeAndOtherPayablesMemberbp:GulfOfMexicoOilSpillMemberifrs-full:LaterThanOneYearMember2021-12-310000313807bp:TradeAndOtherPayablesMemberbp:GulfOfMexicoOilSpillMemberifrs-full:LaterThanOneYearMember2020-12-310000313807bp:CurrencyAndInterestRateRiskMember2021-12-310000313807bp:CurrencyAndInterestRateRiskMember2020-12-310000313807ifrs-full:CurrencySwapContractMember2021-12-310000313807ifrs-full:CurrencySwapContractMember2020-12-310000313807bp:OilRelatedDerivativeMember2021-12-310000313807bp:OilRelatedDerivativeMember2020-12-310000313807bp:NaturalGasRelatedDerivativeMember2021-12-310000313807bp:NaturalGasRelatedDerivativeMember2020-12-310000313807bp:PowerRelatedDerivativeMember2021-12-310000313807bp:PowerRelatedDerivativeMember2020-12-310000313807bp:OtherContract1Member2021-12-310000313807bp:OtherContract1Member2020-12-310000313807bp:CurrencyForwardContractFuturesContractAndCylindersContractMemberifrs-full:CashFlowHedgesMember2021-12-310000313807bp:CurrencyForwardContractFuturesContractAndCylindersContractMemberifrs-full:CashFlowHedgesMember2020-12-310000313807bp:GasPriceFuturesMemberifrs-full:CashFlowHedgesMember2021-12-310000313807bp:GasPriceFuturesMemberifrs-full:CashFlowHedgesMember2020-12-310000313807ifrs-full:CashFlowHedgesMember2021-12-310000313807ifrs-full:CashFlowHedgesMember2020-12-310000313807ifrs-full:FairValueHedgesMemberbp:CurrencyForwardContractFuturesContractAndSwapContractMember2021-12-310000313807ifrs-full:FairValueHedgesMemberbp:CurrencyForwardContractFuturesContractAndSwapContractMember2020-12-310000313807ifrs-full:FairValueHedgesMemberifrs-full:InterestRateSwapContractMember2021-12-310000313807ifrs-full:FairValueHedgesMemberifrs-full:InterestRateSwapContractMember2020-12-310000313807ifrs-full:FairValueHedgesMember2021-12-310000313807ifrs-full:FairValueHedgesMember2020-12-310000313807ifrs-full:NotLaterThanOneYearMemberifrs-full:CurrencySwapContractMember2021-12-310000313807ifrs-full:LaterThanOneYearAndNotLaterThanTwoYearsMemberifrs-full:CurrencySwapContractMember2021-12-310000313807ifrs-full:LaterThanTwoYearsAndNotLaterThanThreeYearsMemberifrs-full:CurrencySwapContractMember2021-12-310000313807ifrs-full:LaterThanThreeYearsAndNotLaterThanFourYearsMemberifrs-full:CurrencySwapContractMember2021-12-310000313807ifrs-full:LaterThanFourYearsAndNotLaterThanFiveYearsMemberifrs-full:CurrencySwapContractMember2021-12-310000313807ifrs-full:LaterThanFiveYearsMemberifrs-full:CurrencySwapContractMember2021-12-310000313807bp:OilRelatedDerivativeMemberifrs-full:NotLaterThanOneYearMember2021-12-310000313807bp:OilRelatedDerivativeMemberifrs-full:LaterThanOneYearAndNotLaterThanTwoYearsMember2021-12-310000313807ifrs-full:LaterThanTwoYearsAndNotLaterThanThreeYearsMemberbp:OilRelatedDerivativeMember2021-12-310000313807bp:OilRelatedDerivativeMemberifrs-full:LaterThanThreeYearsAndNotLaterThanFourYearsMember2021-12-310000313807ifrs-full:LaterThanFourYearsAndNotLaterThanFiveYearsMemberbp:OilRelatedDerivativeMember2021-12-310000313807bp:OilRelatedDerivativeMemberifrs-full:LaterThanFiveYearsMember2021-12-310000313807bp:NaturalGasRelatedDerivativeMemberifrs-full:NotLaterThanOneYearMember2021-12-310000313807bp:NaturalGasRelatedDerivativeMemberifrs-full:LaterThanOneYearAndNotLaterThanTwoYearsMember2021-12-310000313807ifrs-full:LaterThanTwoYearsAndNotLaterThanThreeYearsMemberbp:NaturalGasRelatedDerivativeMember2021-12-310000313807bp:NaturalGasRelatedDerivativeMemberifrs-full:LaterThanThreeYearsAndNotLaterThanFourYearsMember2021-12-310000313807ifrs-full:LaterThanFourYearsAndNotLaterThanFiveYearsMemberbp:NaturalGasRelatedDerivativeMember2021-12-310000313807ifrs-full:LaterThanFiveYearsMemberbp:NaturalGasRelatedDerivativeMember2021-12-310000313807ifrs-full:NotLaterThanOneYearMemberbp:PowerRelatedDerivativeMember2021-12-310000313807ifrs-full:LaterThanOneYearAndNotLaterThanTwoYearsMemberbp:PowerRelatedDerivativeMember2021-12-310000313807ifrs-full:LaterThanTwoYearsAndNotLaterThanThreeYearsMemberbp:PowerRelatedDerivativeMember2021-12-310000313807ifrs-full:LaterThanThreeYearsAndNotLaterThanFourYearsMemberbp:PowerRelatedDerivativeMember2021-12-310000313807ifrs-full:LaterThanFourYearsAndNotLaterThanFiveYearsMemberbp:PowerRelatedDerivativeMember2021-12-310000313807ifrs-full:LaterThanFiveYearsMemberbp:PowerRelatedDerivativeMember2021-12-310000313807bp:OtherContract1Memberifrs-full:NotLaterThanOneYearMember2021-12-310000313807ifrs-full:LaterThanOneYearAndNotLaterThanTwoYearsMemberbp:OtherContract1Member2021-12-310000313807ifrs-full:LaterThanTwoYearsAndNotLaterThanThreeYearsMemberbp:OtherContract1Member2021-12-310000313807ifrs-full:LaterThanThreeYearsAndNotLaterThanFourYearsMemberbp:OtherContract1Member2021-12-310000313807ifrs-full:LaterThanFourYearsAndNotLaterThanFiveYearsMemberbp:OtherContract1Member2021-12-310000313807ifrs-full:LaterThanFiveYearsMemberbp:OtherContract1Member2021-12-310000313807ifrs-full:LaterThanFiveYearsMember2021-12-310000313807ifrs-full:NotLaterThanOneYearMemberifrs-full:CurrencySwapContractMember2020-12-310000313807ifrs-full:LaterThanOneYearAndNotLaterThanTwoYearsMemberifrs-full:CurrencySwapContractMember2020-12-310000313807ifrs-full:LaterThanTwoYearsAndNotLaterThanThreeYearsMemberifrs-full:CurrencySwapContractMember2020-12-310000313807ifrs-full:LaterThanThreeYearsAndNotLaterThanFourYearsMemberifrs-full:CurrencySwapContractMember2020-12-310000313807ifrs-full:LaterThanFourYearsAndNotLaterThanFiveYearsMemberifrs-full:CurrencySwapContractMember2020-12-310000313807ifrs-full:LaterThanFiveYearsMemberifrs-full:CurrencySwapContractMember2020-12-310000313807bp:OilRelatedDerivativeMemberifrs-full:NotLaterThanOneYearMember2020-12-310000313807bp:OilRelatedDerivativeMemberifrs-full:LaterThanOneYearAndNotLaterThanTwoYearsMember2020-12-310000313807ifrs-full:LaterThanTwoYearsAndNotLaterThanThreeYearsMemberbp:OilRelatedDerivativeMember2020-12-310000313807bp:OilRelatedDerivativeMemberifrs-full:LaterThanThreeYearsAndNotLaterThanFourYearsMember2020-12-310000313807ifrs-full:LaterThanFourYearsAndNotLaterThanFiveYearsMemberbp:OilRelatedDerivativeMember2020-12-310000313807bp:OilRelatedDerivativeMemberifrs-full:LaterThanFiveYearsMember2020-12-310000313807bp:NaturalGasRelatedDerivativeMemberifrs-full:NotLaterThanOneYearMember2020-12-310000313807bp:NaturalGasRelatedDerivativeMemberifrs-full:LaterThanOneYearAndNotLaterThanTwoYearsMember2020-12-310000313807ifrs-full:LaterThanTwoYearsAndNotLaterThanThreeYearsMemberbp:NaturalGasRelatedDerivativeMember2020-12-310000313807bp:NaturalGasRelatedDerivativeMemberifrs-full:LaterThanThreeYearsAndNotLaterThanFourYearsMember2020-12-310000313807ifrs-full:LaterThanFourYearsAndNotLaterThanFiveYearsMemberbp:NaturalGasRelatedDerivativeMember2020-12-310000313807ifrs-full:LaterThanFiveYearsMemberbp:NaturalGasRelatedDerivativeMember2020-12-310000313807ifrs-full:NotLaterThanOneYearMemberbp:PowerRelatedDerivativeMember2020-12-310000313807ifrs-full:LaterThanOneYearAndNotLaterThanTwoYearsMemberbp:PowerRelatedDerivativeMember2020-12-310000313807ifrs-full:LaterThanTwoYearsAndNotLaterThanThreeYearsMemberbp:PowerRelatedDerivativeMember2020-12-310000313807ifrs-full:LaterThanThreeYearsAndNotLaterThanFourYearsMemberbp:PowerRelatedDerivativeMember2020-12-310000313807ifrs-full:LaterThanFourYearsAndNotLaterThanFiveYearsMemberbp:PowerRelatedDerivativeMember2020-12-310000313807ifrs-full:LaterThanFiveYearsMemberbp:PowerRelatedDerivativeMember2020-12-310000313807bp:OtherContract1Memberifrs-full:NotLaterThanOneYearMember2020-12-310000313807ifrs-full:LaterThanOneYearAndNotLaterThanTwoYearsMemberbp:OtherContract1Member2020-12-310000313807ifrs-full:LaterThanTwoYearsAndNotLaterThanThreeYearsMemberbp:OtherContract1Member2020-12-310000313807ifrs-full:LaterThanThreeYearsAndNotLaterThanFourYearsMemberbp:OtherContract1Member2020-12-310000313807ifrs-full:LaterThanFourYearsAndNotLaterThanFiveYearsMemberbp:OtherContract1Member2020-12-310000313807ifrs-full:LaterThanFiveYearsMemberbp:OtherContract1Member2020-12-310000313807ifrs-full:LaterThanFiveYearsMember2020-12-310000313807ifrs-full:Level1OfFairValueHierarchyMemberbp:DerivativesHeldForTradingMemberifrs-full:NotLaterThanOneYearMember2021-12-310000313807ifrs-full:Level1OfFairValueHierarchyMemberifrs-full:LaterThanOneYearAndNotLaterThanTwoYearsMemberbp:DerivativesHeldForTradingMember2021-12-310000313807ifrs-full:LaterThanTwoYearsAndNotLaterThanThreeYearsMemberifrs-full:Level1OfFairValueHierarchyMemberbp:DerivativesHeldForTradingMember2021-12-310000313807ifrs-full:Level1OfFairValueHierarchyMemberifrs-full:LaterThanThreeYearsAndNotLaterThanFourYearsMemberbp:DerivativesHeldForTradingMember2021-12-310000313807ifrs-full:LaterThanFourYearsAndNotLaterThanFiveYearsMemberifrs-full:Level1OfFairValueHierarchyMemberbp:DerivativesHeldForTradingMember2021-12-310000313807ifrs-full:Level1OfFairValueHierarchyMemberifrs-full:LaterThanFiveYearsMemberbp:DerivativesHeldForTradingMember2021-12-310000313807ifrs-full:Level1OfFairValueHierarchyMemberbp:DerivativesHeldForTradingMember2021-12-310000313807ifrs-full:Level2OfFairValueHierarchyMemberbp:DerivativesHeldForTradingMemberifrs-full:NotLaterThanOneYearMember2021-12-310000313807ifrs-full:LaterThanOneYearAndNotLaterThanTwoYearsMemberifrs-full:Level2OfFairValueHierarchyMemberbp:DerivativesHeldForTradingMember2021-12-310000313807ifrs-full:LaterThanTwoYearsAndNotLaterThanThreeYearsMemberifrs-full:Level2OfFairValueHierarchyMemberbp:DerivativesHeldForTradingMember2021-12-310000313807ifrs-full:Level2OfFairValueHierarchyMemberifrs-full:LaterThanThreeYearsAndNotLaterThanFourYearsMemberbp:DerivativesHeldForTradingMember2021-12-310000313807ifrs-full:LaterThanFourYearsAndNotLaterThanFiveYearsMemberifrs-full:Level2OfFairValueHierarchyMemberbp:DerivativesHeldForTradingMember2021-12-310000313807ifrs-full:LaterThanFiveYearsMemberifrs-full:Level2OfFairValueHierarchyMemberbp:DerivativesHeldForTradingMember2021-12-310000313807ifrs-full:Level2OfFairValueHierarchyMemberbp:DerivativesHeldForTradingMember2021-12-310000313807ifrs-full:Level3OfFairValueHierarchyMemberbp:DerivativesHeldForTradingMemberifrs-full:NotLaterThanOneYearMember2021-12-310000313807ifrs-full:Level3OfFairValueHierarchyMemberifrs-full:LaterThanOneYearAndNotLaterThanTwoYearsMemberbp:DerivativesHeldForTradingMember2021-12-310000313807ifrs-full:LaterThanTwoYearsAndNotLaterThanThreeYearsMemberifrs-full:Level3OfFairValueHierarchyMemberbp:DerivativesHeldForTradingMember2021-12-310000313807ifrs-full:Level3OfFairValueHierarchyMemberifrs-full:LaterThanThreeYearsAndNotLaterThanFourYearsMemberbp:DerivativesHeldForTradingMember2021-12-310000313807ifrs-full:LaterThanFourYearsAndNotLaterThanFiveYearsMemberifrs-full:Level3OfFairValueHierarchyMemberbp:DerivativesHeldForTradingMember2021-12-310000313807ifrs-full:Level3OfFairValueHierarchyMemberifrs-full:LaterThanFiveYearsMemberbp:DerivativesHeldForTradingMember2021-12-310000313807ifrs-full:Level3OfFairValueHierarchyMemberbp:DerivativesHeldForTradingMember2021-12-310000313807bp:DerivativesHeldForTradingMemberifrs-full:NotLaterThanOneYearMember2021-12-310000313807ifrs-full:LaterThanOneYearAndNotLaterThanTwoYearsMemberbp:DerivativesHeldForTradingMember2021-12-310000313807ifrs-full:LaterThanTwoYearsAndNotLaterThanThreeYearsMemberbp:DerivativesHeldForTradingMember2021-12-310000313807ifrs-full:LaterThanThreeYearsAndNotLaterThanFourYearsMemberbp:DerivativesHeldForTradingMember2021-12-310000313807ifrs-full:LaterThanFourYearsAndNotLaterThanFiveYearsMemberbp:DerivativesHeldForTradingMember2021-12-310000313807ifrs-full:LaterThanFiveYearsMemberbp:DerivativesHeldForTradingMember2021-12-310000313807bp:DerivativesHeldForTradingMember2021-12-310000313807ifrs-full:Level1OfFairValueHierarchyMemberbp:DerivativesHeldForTradingMemberifrs-full:NotLaterThanOneYearMember2020-12-310000313807ifrs-full:Level1OfFairValueHierarchyMemberifrs-full:LaterThanOneYearAndNotLaterThanTwoYearsMemberbp:DerivativesHeldForTradingMember2020-12-310000313807ifrs-full:LaterThanTwoYearsAndNotLaterThanThreeYearsMemberifrs-full:Level1OfFairValueHierarchyMemberbp:DerivativesHeldForTradingMember2020-12-310000313807ifrs-full:Level1OfFairValueHierarchyMemberifrs-full:LaterThanThreeYearsAndNotLaterThanFourYearsMemberbp:DerivativesHeldForTradingMember2020-12-310000313807ifrs-full:LaterThanFourYearsAndNotLaterThanFiveYearsMemberifrs-full:Level1OfFairValueHierarchyMemberbp:DerivativesHeldForTradingMember2020-12-310000313807ifrs-full:Level1OfFairValueHierarchyMemberifrs-full:LaterThanFiveYearsMemberbp:DerivativesHeldForTradingMember2020-12-310000313807ifrs-full:Level1OfFairValueHierarchyMemberbp:DerivativesHeldForTradingMember2020-12-310000313807ifrs-full:Level2OfFairValueHierarchyMemberbp:DerivativesHeldForTradingMemberifrs-full:NotLaterThanOneYearMember2020-12-310000313807ifrs-full:LaterThanOneYearAndNotLaterThanTwoYearsMemberifrs-full:Level2OfFairValueHierarchyMemberbp:DerivativesHeldForTradingMember2020-12-310000313807ifrs-full:LaterThanTwoYearsAndNotLaterThanThreeYearsMemberifrs-full:Level2OfFairValueHierarchyMemberbp:DerivativesHeldForTradingMember2020-12-310000313807ifrs-full:Level2OfFairValueHierarchyMemberifrs-full:LaterThanThreeYearsAndNotLaterThanFourYearsMemberbp:DerivativesHeldForTradingMember2020-12-310000313807ifrs-full:LaterThanFourYearsAndNotLaterThanFiveYearsMemberifrs-full:Level2OfFairValueHierarchyMemberbp:DerivativesHeldForTradingMember2020-12-310000313807ifrs-full:LaterThanFiveYearsMemberifrs-full:Level2OfFairValueHierarchyMemberbp:DerivativesHeldForTradingMember2020-12-310000313807ifrs-full:Level2OfFairValueHierarchyMemberbp:DerivativesHeldForTradingMember2020-12-310000313807ifrs-full:Level3OfFairValueHierarchyMemberbp:DerivativesHeldForTradingMemberifrs-full:NotLaterThanOneYearMember2020-12-310000313807ifrs-full:Level3OfFairValueHierarchyMemberifrs-full:LaterThanOneYearAndNotLaterThanTwoYearsMemberbp:DerivativesHeldForTradingMember2020-12-310000313807ifrs-full:LaterThanTwoYearsAndNotLaterThanThreeYearsMemberifrs-full:Level3OfFairValueHierarchyMemberbp:DerivativesHeldForTradingMember2020-12-310000313807ifrs-full:Level3OfFairValueHierarchyMemberifrs-full:LaterThanThreeYearsAndNotLaterThanFourYearsMemberbp:DerivativesHeldForTradingMember2020-12-310000313807ifrs-full:LaterThanFourYearsAndNotLaterThanFiveYearsMemberifrs-full:Level3OfFairValueHierarchyMemberbp:DerivativesHeldForTradingMember2020-12-310000313807ifrs-full:Level3OfFairValueHierarchyMemberifrs-full:LaterThanFiveYearsMemberbp:DerivativesHeldForTradingMember2020-12-310000313807ifrs-full:Level3OfFairValueHierarchyMemberbp:DerivativesHeldForTradingMember2020-12-310000313807bp:DerivativesHeldForTradingMemberifrs-full:NotLaterThanOneYearMember2020-12-310000313807ifrs-full:LaterThanOneYearAndNotLaterThanTwoYearsMemberbp:DerivativesHeldForTradingMember2020-12-310000313807ifrs-full:LaterThanTwoYearsAndNotLaterThanThreeYearsMemberbp:DerivativesHeldForTradingMember2020-12-310000313807ifrs-full:LaterThanThreeYearsAndNotLaterThanFourYearsMemberbp:DerivativesHeldForTradingMember2020-12-310000313807ifrs-full:LaterThanFourYearsAndNotLaterThanFiveYearsMemberbp:DerivativesHeldForTradingMember2020-12-310000313807ifrs-full:LaterThanFiveYearsMemberbp:DerivativesHeldForTradingMember2020-12-310000313807bp:DerivativesHeldForTradingMember2020-12-310000313807bp:OilRelatedDerivativeMemberifrs-full:Level3OfFairValueHierarchyMemberifrs-full:DerivativesMember2020-12-310000313807ifrs-full:Level3OfFairValueHierarchyMemberbp:NaturalGasRelatedDerivativeMemberifrs-full:DerivativesMember2020-12-310000313807ifrs-full:Level3OfFairValueHierarchyMemberifrs-full:DerivativesMemberbp:PowerRelatedDerivativeMember2020-12-310000313807ifrs-full:Level3OfFairValueHierarchyMemberbp:CurrencyDerivativesMemberifrs-full:DerivativesMember2020-12-310000313807ifrs-full:Level3OfFairValueHierarchyMemberbp:OtherContract1Memberifrs-full:DerivativesMember2020-12-310000313807ifrs-full:Level3OfFairValueHierarchyMemberifrs-full:DerivativesMember2020-12-310000313807bp:OilRelatedDerivativeMemberifrs-full:Level3OfFairValueHierarchyMemberifrs-full:DerivativesMember2021-01-012021-12-310000313807ifrs-full:Level3OfFairValueHierarchyMemberbp:NaturalGasRelatedDerivativeMemberifrs-full:DerivativesMember2021-01-012021-12-310000313807ifrs-full:Level3OfFairValueHierarchyMemberifrs-full:DerivativesMemberbp:PowerRelatedDerivativeMember2021-01-012021-12-310000313807ifrs-full:Level3OfFairValueHierarchyMemberbp:CurrencyDerivativesMemberifrs-full:DerivativesMember2021-01-012021-12-310000313807ifrs-full:Level3OfFairValueHierarchyMemberbp:OtherContract1Memberifrs-full:DerivativesMember2021-01-012021-12-310000313807ifrs-full:Level3OfFairValueHierarchyMemberifrs-full:DerivativesMember2021-01-012021-12-310000313807bp:OilRelatedDerivativeMemberifrs-full:Level3OfFairValueHierarchyMemberifrs-full:DerivativesMember2021-12-310000313807ifrs-full:Level3OfFairValueHierarchyMemberbp:NaturalGasRelatedDerivativeMemberifrs-full:DerivativesMember2021-12-310000313807ifrs-full:Level3OfFairValueHierarchyMemberifrs-full:DerivativesMemberbp:PowerRelatedDerivativeMember2021-12-310000313807ifrs-full:Level3OfFairValueHierarchyMemberbp:CurrencyDerivativesMemberifrs-full:DerivativesMember2021-12-310000313807ifrs-full:Level3OfFairValueHierarchyMemberbp:OtherContract1Memberifrs-full:DerivativesMember2021-12-310000313807ifrs-full:Level3OfFairValueHierarchyMemberifrs-full:DerivativesMember2021-12-310000313807ifrs-full:Level3OfFairValueHierarchyMember2021-01-012021-12-310000313807ifrs-full:Level3OfFairValueHierarchyMember2021-12-310000313807bp:OilRelatedDerivativeMemberifrs-full:Level3OfFairValueHierarchyMemberifrs-full:DerivativesMember2019-12-310000313807ifrs-full:Level3OfFairValueHierarchyMemberbp:NaturalGasRelatedDerivativeMemberifrs-full:DerivativesMember2019-12-310000313807ifrs-full:Level3OfFairValueHierarchyMemberifrs-full:DerivativesMemberbp:PowerRelatedDerivativeMember2019-12-310000313807ifrs-full:Level3OfFairValueHierarchyMemberbp:CurrencyDerivativesMemberifrs-full:DerivativesMember2019-12-310000313807ifrs-full:Level3OfFairValueHierarchyMemberbp:OtherContract1Memberifrs-full:DerivativesMember2019-12-310000313807ifrs-full:Level3OfFairValueHierarchyMemberifrs-full:DerivativesMember2019-12-310000313807bp:OilRelatedDerivativeMemberifrs-full:Level3OfFairValueHierarchyMemberifrs-full:DerivativesMember2020-01-012020-12-310000313807ifrs-full:Level3OfFairValueHierarchyMemberbp:NaturalGasRelatedDerivativeMemberifrs-full:DerivativesMember2020-01-012020-12-310000313807ifrs-full:Level3OfFairValueHierarchyMemberifrs-full:DerivativesMemberbp:PowerRelatedDerivativeMember2020-01-012020-12-310000313807ifrs-full:Level3OfFairValueHierarchyMemberbp:CurrencyDerivativesMemberifrs-full:DerivativesMember2020-01-012020-12-310000313807ifrs-full:Level3OfFairValueHierarchyMemberbp:OtherContract1Memberifrs-full:DerivativesMember2020-01-012020-12-310000313807ifrs-full:Level3OfFairValueHierarchyMemberifrs-full:DerivativesMember2020-01-012020-12-310000313807ifrs-full:Level3OfFairValueHierarchyMember2020-01-012020-12-310000313807ifrs-full:Level3OfFairValueHierarchyMember2020-12-310000313807ifrs-full:Level3OfFairValueHierarchyMemberbp:DerivativesHeldForTradingMemberifrs-full:DerivativesMember2021-01-012021-12-310000313807ifrs-full:Level3OfFairValueHierarchyMemberbp:DerivativesHeldForTradingMemberifrs-full:DerivativesMember2020-01-012020-12-310000313807bp:FuturesOptionsSwapsAndForwardDerivativeContractsMember2021-01-012021-12-310000313807bp:FuturesOptionsSwapsAndForwardDerivativeContractsMember2020-01-012020-12-310000313807bp:FuturesOptionsSwapsAndForwardDerivativeContractsMember2019-01-012019-12-310000313807ifrs-full:CurrencyRiskMemberbp:HighlyProbableForecastCapitalExpenditureMemberifrs-full:CashFlowHedgesMember2021-01-012021-12-310000313807bp:HighlyProbableForecastSalesMemberifrs-full:CashFlowHedgesMemberifrs-full:CommodityPriceRiskMember2021-01-012021-12-310000313807ifrs-full:CurrencyRiskMemberbp:HighlyProbableForecastCapitalExpenditureMemberifrs-full:CashFlowHedgesMember2020-01-012020-12-310000313807bp:HighlyProbableForecastSalesMemberifrs-full:CashFlowHedgesMemberifrs-full:CommodityPriceRiskMember2020-01-012020-12-310000313807ifrs-full:CurrencyRiskMemberbp:HighlyProbableForecastCapitalExpenditureMemberifrs-full:CashFlowHedgesMember2021-12-310000313807bp:HighlyProbableForecastSalesMemberifrs-full:CashFlowHedgesMemberifrs-full:CommodityPriceRiskMember2021-12-31utr:MMBTU0000313807ifrs-full:CurrencyRiskMemberbp:HighlyProbableForecastCapitalExpenditureMemberifrs-full:CashFlowHedgesMember2020-12-310000313807bp:HighlyProbableForecastSalesMemberifrs-full:CashFlowHedgesMemberifrs-full:CommodityPriceRiskMember2020-12-310000313807bp:HighlyProbableForecastSalesMemberifrs-full:CashFlowHedgesMemberifrs-full:NotLaterThanOneYearMemberifrs-full:CommodityPriceRiskMember2021-12-310000313807bp:HighlyProbableForecastSalesMemberifrs-full:CashFlowHedgesMemberifrs-full:NotLaterThanOneYearMemberifrs-full:CommodityPriceRiskMember2020-12-310000313807bp:HighlyProbableForecastSalesMemberifrs-full:LaterThanOneYearAndNotLaterThanTwoYearsMemberifrs-full:CashFlowHedgesMemberifrs-full:CommodityPriceRiskMember2021-12-310000313807bp:HighlyProbableForecastSalesMemberifrs-full:LaterThanOneYearAndNotLaterThanTwoYearsMemberifrs-full:CashFlowHedgesMemberifrs-full:CommodityPriceRiskMember2020-12-310000313807bp:HighlyProbableForecastCapitalExpenditureMemberifrs-full:CashFlowHedgesMember2021-01-012021-12-31bp:gBPPerUSD0000313807bp:HighlyProbableForecastCapitalExpenditureMemberifrs-full:CashFlowHedgesMember2020-01-012020-12-31bp:kRWPerUSD0000313807bp:HighlyProbableForecastSalesMemberifrs-full:CashFlowHedgesMember2021-12-310000313807bp:HighlyProbableForecastSalesMemberifrs-full:CashFlowHedgesMember2020-12-310000313807ifrs-full:FairValueHedgesMemberifrs-full:InterestRateRiskMember2021-01-012021-12-310000313807ifrs-full:FairValueHedgesMemberbp:CurrencyAndInterestRateRiskMember2021-01-012021-12-310000313807ifrs-full:FairValueHedgesMemberifrs-full:InterestRateRiskMember2020-01-012020-12-310000313807ifrs-full:FairValueHedgesMemberbp:CurrencyAndInterestRateRiskMember2020-01-012020-12-310000313807ifrs-full:FairValueHedgesMemberifrs-full:InterestRateRiskMember2021-12-310000313807ifrs-full:FairValueHedgesMemberbp:CurrencyAndInterestRateRiskMember2021-12-310000313807ifrs-full:FairValueHedgesMemberifrs-full:InterestRateRiskMember2020-12-310000313807ifrs-full:FairValueHedgesMemberbp:CurrencyAndInterestRateRiskMember2020-12-310000313807ifrs-full:FairValueHedgesMemberifrs-full:InterestRateRiskMemberifrs-full:NotLaterThanOneYearMember2021-12-310000313807ifrs-full:FairValueHedgesMemberifrs-full:InterestRateRiskMemberifrs-full:LaterThanOneYearAndNotLaterThanTwoYearsMember2021-12-310000313807ifrs-full:LaterThanTwoYearsAndNotLaterThanThreeYearsMemberifrs-full:FairValueHedgesMemberifrs-full:InterestRateRiskMember2021-12-310000313807ifrs-full:FairValueHedgesMemberifrs-full:InterestRateRiskMemberifrs-full:LaterThanThreeYearsAndNotLaterThanFourYearsMember2021-12-310000313807ifrs-full:LaterThanFourYearsAndNotLaterThanFiveYearsMemberifrs-full:FairValueHedgesMemberifrs-full:InterestRateRiskMember2021-12-310000313807ifrs-full:FairValueHedgesMemberifrs-full:InterestRateRiskMemberifrs-full:LaterThanFiveYearsAndNotLaterThanTenYearsMember2021-12-310000313807ifrs-full:FairValueHedgesMemberifrs-full:InterestRateRiskMemberifrs-full:LaterThanTenYearsMember2021-12-310000313807ifrs-full:FairValueHedgesMemberbp:CurrencyAndInterestRateRiskMemberifrs-full:NotLaterThanOneYearMember2021-12-310000313807ifrs-full:FairValueHedgesMemberifrs-full:LaterThanOneYearAndNotLaterThanTwoYearsMemberbp:CurrencyAndInterestRateRiskMember2021-12-310000313807ifrs-full:LaterThanTwoYearsAndNotLaterThanThreeYearsMemberifrs-full:FairValueHedgesMemberbp:CurrencyAndInterestRateRiskMember2021-12-310000313807ifrs-full:FairValueHedgesMemberifrs-full:LaterThanThreeYearsAndNotLaterThanFourYearsMemberbp:CurrencyAndInterestRateRiskMember2021-12-310000313807ifrs-full:LaterThanFourYearsAndNotLaterThanFiveYearsMemberifrs-full:FairValueHedgesMemberbp:CurrencyAndInterestRateRiskMember2021-12-310000313807ifrs-full:FairValueHedgesMemberifrs-full:LaterThanFiveYearsAndNotLaterThanTenYearsMemberbp:CurrencyAndInterestRateRiskMember2021-12-310000313807ifrs-full:FairValueHedgesMemberifrs-full:LaterThanTenYearsMemberbp:CurrencyAndInterestRateRiskMember2021-12-310000313807ifrs-full:FairValueHedgesMemberifrs-full:InterestRateRiskMemberifrs-full:NotLaterThanOneYearMember2020-12-310000313807ifrs-full:FairValueHedgesMemberifrs-full:InterestRateRiskMemberifrs-full:LaterThanOneYearAndNotLaterThanTwoYearsMember2020-12-310000313807ifrs-full:LaterThanTwoYearsAndNotLaterThanThreeYearsMemberifrs-full:FairValueHedgesMemberifrs-full:InterestRateRiskMember2020-12-310000313807ifrs-full:FairValueHedgesMemberifrs-full:InterestRateRiskMemberifrs-full:LaterThanThreeYearsAndNotLaterThanFourYearsMember2020-12-310000313807ifrs-full:LaterThanFourYearsAndNotLaterThanFiveYearsMemberifrs-full:FairValueHedgesMemberifrs-full:InterestRateRiskMember2020-12-310000313807ifrs-full:FairValueHedgesMemberifrs-full:InterestRateRiskMemberifrs-full:LaterThanFiveYearsAndNotLaterThanTenYearsMember2020-12-310000313807ifrs-full:FairValueHedgesMemberifrs-full:InterestRateRiskMemberifrs-full:LaterThanTenYearsMember2020-12-310000313807ifrs-full:FairValueHedgesMemberbp:CurrencyAndInterestRateRiskMemberifrs-full:NotLaterThanOneYearMember2020-12-310000313807ifrs-full:FairValueHedgesMemberifrs-full:LaterThanOneYearAndNotLaterThanTwoYearsMemberbp:CurrencyAndInterestRateRiskMember2020-12-310000313807ifrs-full:LaterThanTwoYearsAndNotLaterThanThreeYearsMemberifrs-full:FairValueHedgesMemberbp:CurrencyAndInterestRateRiskMember2020-12-310000313807ifrs-full:FairValueHedgesMemberifrs-full:LaterThanThreeYearsAndNotLaterThanFourYearsMemberbp:CurrencyAndInterestRateRiskMember2020-12-310000313807ifrs-full:LaterThanFourYearsAndNotLaterThanFiveYearsMemberifrs-full:FairValueHedgesMemberbp:CurrencyAndInterestRateRiskMember2020-12-310000313807ifrs-full:FairValueHedgesMemberifrs-full:LaterThanFiveYearsAndNotLaterThanTenYearsMemberbp:CurrencyAndInterestRateRiskMember2020-12-310000313807ifrs-full:FairValueHedgesMemberifrs-full:LaterThanTenYearsMemberbp:CurrencyAndInterestRateRiskMember2020-12-310000313807ifrs-full:FloatingInterestRateMemberifrs-full:FairValueHedgesMemberifrs-full:InterestRateSwapContractMember2021-12-310000313807ifrs-full:FloatingInterestRateMemberifrs-full:FairValueHedgesMemberbp:CrossCurrencyInterestRateSwapsMember2021-12-310000313807ifrs-full:FloatingInterestRateMemberifrs-full:FairValueHedgesMemberifrs-full:InterestRateSwapContractMember2020-12-310000313807ifrs-full:FloatingInterestRateMemberifrs-full:FairValueHedgesMemberbp:CrossCurrencyInterestRateSwapsMember2020-12-310000313807bp:CrossCurrencyInterestRateSwapsMember2021-01-012021-12-310000313807bp:CrossCurrencyInterestRateSwapsMember2020-01-012020-12-31bp:eURPerUSDbp:cADPerUSD0000313807bp:HighlyProbableForecastCapitalExpenditureMemberifrs-full:CashFlowHedgesMember2020-12-310000313807bp:PurchaseOfEquityMemberifrs-full:CashFlowHedgesMember2020-12-310000313807ifrs-full:FairValueHedgesMemberbp:InterestRateAndForeignCurrencyRiskOnFinanceDebtMember2020-12-310000313807bp:HighlyProbableForecastSalesMemberifrs-full:CashFlowHedgesMember2021-01-012021-12-310000313807bp:PurchaseOfEquityMemberifrs-full:CashFlowHedgesMember2021-01-012021-12-310000313807ifrs-full:FairValueHedgesMemberbp:InterestRateAndForeignCurrencyRiskOnFinanceDebtMember2021-01-012021-12-310000313807bp:HighlyProbableForecastCapitalExpenditureMemberifrs-full:CashFlowHedgesMember2021-12-310000313807bp:PurchaseOfEquityMemberifrs-full:CashFlowHedgesMember2021-12-310000313807ifrs-full:FairValueHedgesMemberbp:InterestRateAndForeignCurrencyRiskOnFinanceDebtMember2021-12-310000313807bp:HighlyProbableForecastCapitalExpenditureMemberifrs-full:CashFlowHedgesMember2019-12-310000313807bp:HighlyProbableForecastSalesMemberifrs-full:CashFlowHedgesMember2019-12-310000313807bp:PurchaseOfEquityMemberifrs-full:CashFlowHedgesMember2019-12-310000313807ifrs-full:FairValueHedgesMemberbp:InterestRateAndForeignCurrencyRiskOnFinanceDebtMember2019-12-310000313807bp:HighlyProbableForecastSalesMemberifrs-full:CashFlowHedgesMember2020-01-012020-12-310000313807bp:PurchaseOfEquityMemberifrs-full:CashFlowHedgesMember2020-01-012020-12-310000313807ifrs-full:FairValueHedgesMemberbp:InterestRateAndForeignCurrencyRiskOnFinanceDebtMember2020-01-012020-12-310000313807bp:FirstPreferenceSharesMember2021-01-012021-12-310000313807bp:FirstPreferenceSharesMember2020-12-310000313807bp:FirstPreferenceSharesMember2019-12-310000313807bp:SecondPreferenceSharesMember2021-01-012021-12-310000313807bp:SecondPreferenceSharesMember2020-12-310000313807bp:SecondPreferenceSharesMember2019-12-310000313807ifrs-full:PreferenceSharesMember2021-12-310000313807ifrs-full:PreferenceSharesMember2020-12-310000313807ifrs-full:PreferenceSharesMember2019-12-310000313807ifrs-full:OrdinarySharesMember2020-12-310000313807ifrs-full:OrdinarySharesMember2019-12-310000313807ifrs-full:OrdinarySharesMember2018-12-31iso4217:GBPbp:vote0000313807ifrs-full:OrdinarySharesMember2022-01-012022-03-310000313807ifrs-full:TreasurySharesMember2021-01-012021-12-310000313807ifrs-full:TreasurySharesMember2020-01-012020-12-310000313807ifrs-full:TreasurySharesMember2019-01-012019-12-310000313807bp:TreasurySharesHeldByParentMember2021-12-310000313807bp:TreasurySharesHeldByParentMember2020-12-310000313807bp:TreasurySharesHeldByParentMember2019-12-310000313807bp:TreasurySharesHeldInEmployeeShareOwnershipPlansMember2021-12-310000313807bp:TreasurySharesHeldInEmployeeShareOwnershipPlansMember2020-12-310000313807bp:TreasurySharesHeldInEmployeeShareOwnershipPlansMember2019-12-310000313807country:USbp:TreasurySharesHeldInEmployeeSharebasedPaymentPlansMember2021-12-310000313807country:USbp:TreasurySharesHeldInEmployeeSharebasedPaymentPlansMember2020-12-310000313807country:USbp:TreasurySharesHeldInEmployeeSharebasedPaymentPlansMember2019-12-310000313807ifrs-full:IssuedCapitalMember2020-12-310000313807ifrs-full:SharePremiumMember2020-12-310000313807ifrs-full:CapitalRedemptionReserveMember2020-12-310000313807ifrs-full:MergerReserveMember2020-12-310000313807ifrs-full:IssuedCapitalMember2021-01-012021-12-310000313807ifrs-full:SharePremiumMember2021-01-012021-12-310000313807ifrs-full:CapitalRedemptionReserveMember2021-01-012021-12-310000313807ifrs-full:IssuedCapitalMember2021-12-310000313807ifrs-full:SharePremiumMember2021-12-310000313807ifrs-full:CapitalRedemptionReserveMember2021-12-310000313807ifrs-full:MergerReserveMember2021-12-310000313807ifrs-full:IssuedCapitalMember2019-12-310000313807ifrs-full:SharePremiumMember2019-12-310000313807ifrs-full:CapitalRedemptionReserveMember2019-12-310000313807ifrs-full:MergerReserveMember2019-12-310000313807ifrs-full:IssuedCapitalMember2020-01-012020-12-310000313807ifrs-full:SharePremiumMember2020-01-012020-12-310000313807ifrs-full:CapitalRedemptionReserveMember2020-01-012020-12-310000313807country:GB2020-01-012020-12-310000313807country:NZ2020-01-012020-12-310000313807ifrs-full:ReserveOfCashFlowHedgesMember2020-12-310000313807ifrs-full:ReserveOfChangeInValueOfForeignCurrencyBasisSpreadsMember2020-12-310000313807ifrs-full:ReserveOfCashFlowHedgesMember2021-01-012021-12-310000313807ifrs-full:ReserveOfChangeInValueOfForeignCurrencyBasisSpreadsMember2021-01-012021-12-310000313807ifrs-full:ReserveOfCashFlowHedgesMember2021-12-310000313807ifrs-full:ReserveOfChangeInValueOfForeignCurrencyBasisSpreadsMember2021-12-310000313807ifrs-full:ReserveOfCashFlowHedgesMember2019-12-310000313807ifrs-full:ReserveOfChangeInValueOfForeignCurrencyBasisSpreadsMember2019-12-310000313807bp:NonControllingInterestsHybridBondsMember2019-12-310000313807ifrs-full:ReserveOfCashFlowHedgesMember2020-01-012020-12-310000313807ifrs-full:ReserveOfChangeInValueOfForeignCurrencyBasisSpreadsMember2020-01-012020-12-310000313807ifrs-full:IssuedCapitalMember2018-12-310000313807ifrs-full:SharePremiumMember2018-12-310000313807ifrs-full:CapitalRedemptionReserveMember2018-12-310000313807ifrs-full:MergerReserveMember2018-12-310000313807ifrs-full:IssuedCapitalMembersrt:CumulativeEffectPeriodOfAdoptionAdjustedBalanceMember2018-12-310000313807srt:CumulativeEffectPeriodOfAdoptionAdjustedBalanceMemberifrs-full:SharePremiumMember2018-12-310000313807srt:CumulativeEffectPeriodOfAdoptionAdjustedBalanceMemberifrs-full:CapitalRedemptionReserveMember2018-12-310000313807srt:CumulativeEffectPeriodOfAdoptionAdjustedBalanceMemberifrs-full:MergerReserveMember2018-12-310000313807ifrs-full:IssuedCapitalMember2019-01-012019-12-310000313807ifrs-full:SharePremiumMember2019-01-012019-12-310000313807ifrs-full:CapitalRedemptionReserveMember2019-01-012019-12-310000313807ifrs-full:ReserveOfCashFlowHedgesMember2018-12-310000313807ifrs-full:ReserveOfChangeInValueOfForeignCurrencyBasisSpreadsMember2018-12-310000313807bp:NonControllingInterestsHybridBondsMember2018-12-310000313807bp:IFRS16LeasesMemberifrs-full:RetainedEarningsMembersrt:CumulativeEffectPeriodOfAdoptionAdjustmentMember2018-12-310000313807bp:IFRS16LeasesMembersrt:CumulativeEffectPeriodOfAdoptionAdjustmentMemberifrs-full:EquityAttributableToOwnersOfParentMember2018-12-310000313807bp:IFRS16LeasesMembersrt:CumulativeEffectPeriodOfAdoptionAdjustmentMemberbp:NonControllingInterestsOtherInterestMember2018-12-310000313807bp:IFRS16LeasesMembersrt:CumulativeEffectPeriodOfAdoptionAdjustmentMember2018-12-310000313807ifrs-full:ReserveOfCashFlowHedgesMembersrt:CumulativeEffectPeriodOfAdoptionAdjustedBalanceMember2018-12-310000313807srt:CumulativeEffectPeriodOfAdoptionAdjustedBalanceMemberifrs-full:ReserveOfChangeInValueOfForeignCurrencyBasisSpreadsMember2018-12-310000313807srt:CumulativeEffectPeriodOfAdoptionAdjustedBalanceMemberbp:NonControllingInterestsHybridBondsMember2018-12-310000313807bp:NonControllingInterestsHybridBondsMember2019-01-012019-12-310000313807ifrs-full:ReserveOfCashFlowHedgesMember2019-01-012019-12-310000313807ifrs-full:ReserveOfChangeInValueOfForeignCurrencyBasisSpreadsMember2019-01-012019-12-310000313807ifrs-full:AnnouncementOfPlanToDiscontinueOperationMemberbp:RosneftMemberifrs-full:ReserveOfExchangeDifferencesOnTranslationMember2021-12-310000313807ifrs-full:ReserveOfCashFlowHedgesMemberbp:RosneftMember2021-12-310000313807bp:RosneftMember2015-01-012015-12-310000313807ifrs-full:BottomOfRangeMemberifrs-full:FixedInterestRateMember2021-01-012021-12-310000313807ifrs-full:TopOfRangeMemberifrs-full:FixedInterestRateMember2021-01-012021-12-310000313807bp:CorporateBondsMember2021-01-012021-12-310000313807bp:CorporateBondsMember2020-01-012020-12-310000313807bp:NonControllingInterestsHybridBondsMemberbp:CorporateBondsMember2021-01-012021-12-310000313807bp:NonControllingInterestsHybridBondsMemberbp:CorporateBondsMember2020-01-012020-12-310000313807bp:NonControllingInterestsHybridBondsMemberbp:CorporateBondsMember2021-12-310000313807bp:NonControllingInterestsHybridBondsMemberbp:CorporateBondsMember2020-12-310000313807bp:ProjectSpecificBondsMemberbp:NonControllingInterestsHybridBondsMember2021-01-012021-12-310000313807bp:ProjectSpecificBondsMemberbp:NonControllingInterestsHybridBondsMember2021-12-31bp:case0000313807bp:GulfOfMexicoOilSpillMemberbp:SPCClaimsMember2021-01-012021-12-310000313807bp:GulfOfMexicoOilSpillMemberbp:PMCPClaimsMember2021-01-012021-12-310000313807bp:MedicalBenefitsClassActionSettlementMemberbp:GulfOfMexicoOilSpillMember2021-01-012021-12-310000313807bp:LMPCClaimsMemberbp:GulfOfMexicoOilSpillMember2021-01-012021-12-310000313807bp:GulfOfMexicoOilSpillMemberbp:OtherCivilComplaintsEconomicLossMember2021-01-012021-12-310000313807bp:GulfCoastMemberbp:OtherCivilComplaintsPersonalInjuryMemberbp:GulfOfMexicoOilSpillMember2021-01-012021-12-310000313807bp:OtherCivilComplaintsPersonalInjuryMemberbp:GulfOfMexicoOilSpillMemberbp:EasternDistrictLouisianaMember2021-01-012021-12-310000313807bp:OtherCivilComplaintsPersonalInjuryMemberbp:GulfOfMexicoOilSpillMember2021-01-012021-12-310000313807bp:FERCAndCFTCMattersMember2016-07-110000313807bp:LouisianaCoastalRestorationMember2021-01-012021-12-310000313807bp:LouisianaCoastalRestorationPrivateLandownersMember2021-01-012021-12-310000313807bp:KeyManagementPersonnelOfEntityOrParentDirectorMember2021-01-012021-12-310000313807bp:KeyManagementPersonnelOfEntityOrParentDirectorMember2020-01-012020-12-310000313807bp:KeyManagementPersonnelOfEntityOrParentDirectorMember2019-01-012019-12-310000313807bp:KeyManagementPersonnelOfEntityOrParentSeniorManagementAndNonExecutiveDirectorsMember2021-01-012021-12-310000313807bp:KeyManagementPersonnelOfEntityOrParentSeniorManagementAndNonExecutiveDirectorsMember2020-01-012020-12-310000313807bp:KeyManagementPersonnelOfEntityOrParentSeniorManagementAndNonExecutiveDirectorsMember2019-01-012019-12-31bp:employees0000313807bp:ServiceStationStaffMemberifrs-full:OperatingSegmentsMemberbp:CustomersProductsMember2021-01-012021-12-310000313807bp:ServiceStationStaffMemberifrs-full:OperatingSegmentsMemberbp:CustomersProductsMember2020-01-012020-12-310000313807bp:ServiceStationStaffMemberifrs-full:OperatingSegmentsMemberbp:CustomersProductsMember2019-01-012019-12-310000313807bp:OtherBusinessAndCorporateNonSegmentMemberbp:AgriculturalOperationalAndSeasonalMembercountry:BR2021-01-012021-12-310000313807bp:OtherBusinessAndCorporateNonSegmentMemberbp:AgriculturalOperationalAndSeasonalMembercountry:BR2020-01-012020-12-310000313807bp:OtherBusinessAndCorporateNonSegmentMemberbp:AgriculturalOperationalAndSeasonalMembercountry:BR2019-01-012019-12-310000313807bp:BPCorporateHoldingsMember2021-01-012021-12-310000313807bp:BPExplorationOperatingCompanyMember2021-01-012021-12-310000313807bp:BPGlobalInvestmentsMember2021-01-012021-12-310000313807bp:BPInternationalMember2021-01-012021-12-310000313807bp:BPOilInternationalMember2021-01-012021-12-310000313807bp:BurmahCastrolMember2021-01-012021-12-310000313807bp:BPExplorationAngolaMember2021-01-012021-12-310000313807bp:BPExplorationCaspianSeaMember2021-01-012021-12-310000313807bp:BPExplorationAzerbaijanMember2021-01-012021-12-310000313807bp:BPHoldingsCanadaMember2021-01-012021-12-310000313807bp:BPExplorationDeltaMember2021-01-012021-12-310000313807bp:BPEuropaSEMember2021-01-012021-12-310000313807bp:BPExplorationAlphaMember2021-01-012021-12-310000313807bp:BPTrinidadandTobagoMember2021-01-012021-12-310000313807bp:BPCapitalMarketsMember2021-01-012021-12-310000313807bp:BPHoldingsNorthAmericaMember2021-01-012021-12-310000313807bp:AtlanticRichfieldCompanyMember2021-01-012021-12-310000313807bp:BPAmericaMember2021-01-012021-12-310000313807bp:BPAmericaProductionCompanyMember2021-01-012021-12-310000313807bp:BPCompanyNorthAmericaMember2021-01-012021-12-310000313807bp:BPCorporationNorthAmericaMember2021-01-012021-12-310000313807bp:BPProductsNorthAmericaMember2021-01-012021-12-310000313807bp:StandardOilCompanyMember2021-01-012021-12-310000313807bp:BPCapitalMarketsAmericaMember2021-01-012021-12-310000313807bp:PanAmericanEnergyGroupMember2021-01-012021-12-310000313807ifrs-full:AnnouncementOfPlanToDiscontinueOperationMemberbp:RosneftMember2021-01-012021-12-310000313807ifrs-full:AnnouncementOfPlanToDiscontinueOperationMemberbp:RosneftMember2021-12-310000313807ifrs-full:AnnouncementOfPlanToDiscontinueOperationMemberifrs-full:ReserveOfExchangeDifferencesOnTranslationMember2021-12-310000313807ifrs-full:AnnouncementOfPlanToDiscontinueOperationMemberbp:OtherAssociatesMember2021-12-31
UNITED STATES
SECURITIES AND EXCHANGE COMMISSION
Washington, D.C. 20549
FORM 20-F
(Mark One)
| | | | | |
☐ | REGISTRATION STATEMENT PURSUANT TO SECTION 12(b) or (g) OF THE SECURITIES EXCHANGE ACT OF 1934 |
OR
| | | | | |
☒ | ANNUAL REPORT PURSUANT TO SECTION 13 OR 15(d) OF THE SECURITIES EXCHANGE ACT OF 1934 |
For the fiscal year ended 31 December 2021
OR
| | | | | |
☐
| TRANSITION REPORT PURSUANT TO SECTION 13 OR 15(d) OF THE SECURITIES EXCHANGE ACT OF 1934 |
OR
| | | | | |
☐
| SHELL COMPANY REPORT PURSUANT TO SECTION 13 OR 15(d) OF THE SECURITIES EXCHANGE ACT OF 1934 |
Commission file number: 1-06262
BP p.l.c.
(Exact name of Registrant as specified in its charter)
England and Wales
(Jurisdiction of incorporation or organization)
1 St James’s Square, London SW1Y 4PD
United Kingdom
(Address of principal executive offices)
Murray Auchincloss
BP p.l.c.
1 St James’s Square, London SW1Y 4PD
United Kingdom
Tel +44 (0) 20 7496 4000
Fax +44 (0) 20 7496 4630
(Name, Telephone, E-mail and/or Facsimile number and Address of Company Contact Person)
Securities registered or to be registered pursuant to Section 12(b) of the Act
| | | | | | | | | | | |
| Title of each class | Trading Symbol(s) | Name of each exchange on which registered | |
| American Depositary Shares | BP | New York Stock Exchange | |
| Ordinary Shares of 25c each | | New York Stock Exchange | * |
| Floating Rate Guaranteed Notes due 2022 | BP/22D and
BP/22H | New York Stock Exchange | |
| 2.500% Guaranteed Notes due 2022 | BP/22B | New York Stock Exchange | |
| 2.750% Guaranteed Notes due 2023 | BP/23 and
BP/23D | New York Stock Exchange | |
| 3.994% Guaranteed Notes due 2023 | BP/23A | New York Stock Exchange | |
| 3.535% Guaranteed Notes due 2024 | BP/24A | New York Stock Exchange | |
| 3.814% Guaranteed Notes due 2024 | BP/24 | New York Stock Exchange | |
| 3.790% Guaranteed Notes due 2024 | BP/24C | New York Stock Exchange | |
| 3.194% Guaranteed Notes due 2025 | BP/25B | New York Stock Exchange | |
| 3.506% Guaranteed Notes due 2025 | BP/25 | New York Stock Exchange | |
| 3.796% Guaranteed Notes due 2025 | BP/25A | New York Stock Exchange | |
| 3.119% Guaranteed Notes due 2026 | BP/26 and
BP/26A | New York Stock Exchange | |
| 3.410% Guaranteed Notes due 2026 | BP/26C | New York Stock Exchange | |
| 3.017% Guaranteed Notes due 2027 | BP/27 and
BP/27D | New York Stock Exchange | |
| 3.279% Guaranteed Notes due 2027 | BP/27B | New York Stock Exchange | |
| 3.543% Guaranteed Notes due 2027 | BP/27E | New York Stock Exchange | |
| 3.588% Guaranteed Notes due 2027 | BP/27A and
BP/27C | New York Stock Exchange | |
| 3.723% Guaranteed Notes due 2028 | BP/28 | New York Stock Exchange | |
| 3.937% Guaranteed Notes due 2028 | BP/28A | New York Stock Exchange | |
| 4.234% Guaranteed Notes due 2028 | BP/28B | New York Stock Exchange | |
| 1.749% Guaranteed Notes due 2030 | BP/30A | New York Stock Exchange | |
| 3.633% Guaranteed Notes due 2030 | BP/30 | New York Stock Exchange | |
| 3.060% Guaranteed Notes due 2041 | BP/41 | New York Stock Exchange | |
| 2.772% Guaranteed Notes due 2050 | BP/50B | New York Stock Exchange | |
| 3.000% Guaranteed Notes due 2050 | BP/50A | New York Stock Exchange | |
| 3.067% Guaranteed Notes due 2050 | BP/50 | New York Stock Exchange | |
| 2.939% Guaranteed Notes due 2051 | BP/51 | New York Stock Exchange | |
| 3.001% Guaranteed Notes due 2052 | BP/52 | New York Stock Exchange | |
| 3.379% Guaranteed Notes due 2061 | BP/61 | New York Stock Exchange | |
| 4.375% Perpetual Subordinated Non-Call 5.25 Fixed Rate Reset Notes | BP/P1 | New York Stock Exchange | |
| 4.875% Perpetual Subordinated Non-Call 10 Fixed Rate Reset Notes | BP/P2 | New York Stock Exchange | |
| | | | | |
| * | Not for trading, but only in connection with the registration of American Depositary Shares, pursuant to the requirements of the Securities and Exchange Commission |
Securities registered or to be registered pursuant to Section 12(g) of the Act.
None
Securities for which there is a reporting obligation pursuant to Section 15(d) of the Act.
None
Indicate the number of outstanding shares of each of the issuer’s classes of capital or common stock as of the close of the period covered by the annual report.
| | | | | |
| |
| Ordinary Shares of 25c each | 20,778,081,819 | |
| Cumulative First Preference Shares of £1 each | 7,232,838 | |
| Cumulative Second Preference Shares of £1 each | 5,473,414 | |
Indicate by check mark if the registrant is a well-known seasoned issuer, as defined in Rule 405 of the Securities Act. Yes ☒ No ☐
If this report is an annual or transition report, indicate by check mark if the registrant is not required to file reports pursuant to Section 13 or 15(d) of the Securities Exchange Act of 1934. Yes ☐ No ☒
Note—Checking the box above will not relieve any registrant required to file reports pursuant to Section 13 or 15(d) of the Securities Exchange Act of 1934 from their obligations under those Sections.
Indicate by check mark whether the Registrant (1) has filed all reports required to be filed by Section 13 or 15(d) of the Securities Exchange Act of 1934 during the preceding 12 months (or for such shorter period that the Registrant was required to file such reports), and (2) has been subject to such filing requirements for the past 90 days. Yes ☒ No ☐
Indicate by check mark whether the registrant has submitted electronically every Interactive Data File required to be submitted pursuant to Rule 405 of Regulation S-T (§ 232.405 of this chapter) during the preceding 12 months (or for such shorter period that the registrant was required to submit such files). Yes ☒ No ☐
Indicate by check mark whether the registrant is a large accelerated filer, an accelerated filer, a non-accelerated filer, or an emerging growth company. See definition of “large accelerated filer,” “accelerated filer,” and “emerging growth company” in Rule 12b-2 of the Exchange Act. (Check one):
Large accelerated filer ☒ Accelerated filer ☐ Non-accelerated filer ☐ Emerging growth company ☐
If an emerging growth company that prepares its financial statements in accordance with U.S. GAAP, indicate by check mark if the registrant has elected not to use the extended transition period for complying with any new or revised financial accounting standards† provided pursuant to Section 13(a) of the Exchange Act. ☐
† The term “new or revised financial accounting standard” refers to any update issued by the Financial Accounting Standards Board to its Accounting Standards Codification after April 5, 2012.
Indicate by check mark whether the registrant has filed a report on and attestation to its management’s assessment of the effectiveness of its internal control over financial reporting under Section 404(b) of the Sarbanes-Oxley Act (15 U.S.C. 7262(b)) by the registered public accounting firm that prepared or issued its audit report. ☒
Indicate by check mark which basis of accounting the registrant has used to prepare the financial statements included in this filing:
| | | | | | | | | | | | | | |
U.S. GAAP ☐ | | International Financial Reporting Standards as issued by the International Accounting Standards Board ☒ | | Other ☐ |
If “Other” has been checked in response to the previous question, indicate by check mark which financial statement item the registrant has elected to follow.
Item 17 ☐ Item 18 ☐
If this is an annual report, indicate by check mark whether the registrant is a shell company (as defined in Rule 12b-2 of the Exchange Act). Yes ☐ No ☒
Performing bp Annual Report and Form 20-F 2021 while transforming

Convenience and mobility Sustainability Integration Low carbon energy Resilient hydrocarbons About bp By delivering the energy the world needs today… Performing while transforming As we transform bp, we remain committed to delivering for our customers, partners, suppliers, employees, society and investors. And the cities and countries we work with. We are focused on performing while transforming to: • Grow value and returns. • Deliver compelling distributions. • Invest in the energy transition and drive down emissions. In 2021 we made strong strategic progress in our transformation to an integrated energy company: • Focusing and high-grading our hydrocarbons business. • Growing our convenience and mobility businesses. • Building with discipline a low carbon energy business. … and executing our strategy to become an integrated energy company. More information Progress against our strategy, page 16 Sustainability, page 51 Integration, page 14 Our strategy

1 Strategic report bp Annual Report and Form 20-F 2021 We deliver energy products and services to our customers around the world, and we plan to do so increasingly in ways that we believe will help drive the transition to a lower carbon future. We have operations in Europe, North and South America, Australasia, Asia and Africa. Strategic report 2021 at a glance 2 Chair’s letter 4 Chief executive officer’s letter 6 Global context 8 Energy outlook 10 Our strategy and business model 12 Progress against our strategy: our strategic focus areas 16 Our financial frame and investor proposition 20 Key performance indicators 24 Consistency with the Paris goals 30 Our investment process 32 Group performance 37 Gas & low carbon energy 41 Oil production & operations 44 Customers & products 46 Rosneft 48 Other businesses & corporate 50 Sustainability 51 Climate-related financial disclosures (TCFD) 55 How we manage risk 73 Risk factors 76 Compliance information 80 Section 172 statement 80 Corporate governance Introduction from the chair 82 Board of directors 84 Leadership team 88 Board activities and governance framework 90 How the board has engaged with shareholders, the workforce and other stakeholders 93 Decision-making by the board 97 Learning, development and induction 100 Board evaluation 102 People and governance committee 104 Audit committee 107 Safety and sustainability committee 114 Directors’ remuneration report 116 Remuneration committee 116 Financial statements Consolidated financial statements of the bp group 145 Notes on the financial statements 178 Supplementary information on oil and natural gas (unaudited) 254 Additional disclosures 337 Shareholder information 367 Glossary 377 Non-GAAP measures reconciliations 386 Signatures 389 Cross-reference to Form 20-F 390 Information about this report 391 Exhibits 391 Our quick read provides a concise summary of the annual report, highlighting strategy, performance and sustainability information. bp.com/annualreport Our reporting centre brings together our key reports, including our sustainability report, Net zero ambition report and the bp energy outlook. bp.com/reportingcentre Glossary Words and terms marked with  are defined in the glossary. See page 377 Task Force on Climate-Related Financial Disclosures (TCFD) Information that supports TCFD Recommendations and Recommended Disclosures in relation to Metrics & Targets is indicated with T .

2 bp Annual Report and Form 20-F 2021 2021 at a glance In numbers As at 31 December 2021 Our scale Our performanceOur strategy Safety and sustainability 65,900 employees (2020 63,600) 20,500 retail sites (2020 20,300) >65 countries of operation (2020 >70) 13,100 electric vehicle charge points (2020 10,100) 2•2 million barrels of oil equivalent per day – upstream production excluding Rosneft (2020 2.4mmboe/d) $7•6bn profit for the year attributable to bp shareholders (2020 loss $(20.3)bn) 94•8% bp-operated refining availability (2020 96.0%) $12•8bn underlying replacement cost (RC) profit (2020 loss $(5.7)bn) 94.0% bp-operated hydrocarbon plant availability (2020 94.0%) 2,150 strategic convenience sites (2020 1,900) 62 tier 1 and 2 process safety events (2020 70) 4•4GW developed renewables to FID (2020 3.3GW) $6•82/boe upstream unit cost production (2020 $6.39/boe) 1•6 million tonnes of CO2 equivalent – sustainable greenhouse gas emissions reductions (2020 1.0/MtCO2e) Key Strategic metric, see page 16 Key performance indicator, see page 24 Group performance, page 37

3 Strategic report bp Annual Report and Form 20-F 2021 Financial reporting segments Our new financial reporting model came into place on 1 January 2021. This is our first year reporting under this segmental structurea. Gas & low carbon energyb Comprises our gas and low carbon businesses. Our gas business includes regions with upstream activities that predominantly produce natural gas, integrated gas and power, and gas and power trading. Our low carbon business includes solar, offshore and onshore wind, hydrogen and CCS and our share in bp Bunge Bioenergia. Rosneft Includes equity-accounted earnings from our investment in Rosneft. As a result of bp’s nominated directors stepping down from the Rosneft board, bp has determined that as of 27 February 2022, the group no longer has significant influence over Rosneft taking into account the criteria set out in IAS 28 Investments in associates and joint ventures, bp will therefore no longer equity account for its interest in Rosneft as of that date, treating the investment prospectively as a financial asset measured at fair value within ‘other investments’ until the shareholding is derecognized. The discontinuation of equity accounting combined with the market impact on Russian assets that has arisen following the military action in Ukraine will have a material effect on the group’s first quarter 2022 interim financial statements including on the carrying amount of bp’s investment in Rosneft, which at 31 December 2021 stood at approximately $14 billion. In addition, foreign exchange losses and other cumulative charges to other comprehensive income will be taken to the income statement. At 31 December 2021, these amounts stood at approximately $11 billion. Oil production & operationsb Comprises regions with upstream activities that predominantly produce crude oil, including bpx energy. Other businesses & corporate Comprises innovation & engineering, bp ventures, Launchpad, regions, cities & solutions; and our corporate activities and functions. Customers & products Comprises customer-focused businesses, spanning convenience and mobility, which includes convenience and retail fuels, EV charging, as well as Castrol, aviation and B2B and midstream. It also includes our oil products businesses, refining & trading. $2•1bn RC profit before interest and tax (2020 loss $(7.1)bn) $7•5bn Underlying RC profit before interest and tax (2020 $0.7bn) $2•4bn RC profit before interest and tax (2020 loss $(0.1)bn) $2•7bn Underlying RC profit before interest and tax (2020 $0.1bn) $10•5bn RC profit before interest and tax (2020 loss $(14.6)bn) $10•3bn Underlying RC profit before interest and tax (2020 loss $(5.9)bn) $(2•8)bn RC loss before interest and tax (2020 loss $(0.6)bn) $(1•4)bn Underlying RC loss before interest and tax (2020 loss $(0.9)bn) $2•2bn RC profit before interest and tax (2020 $3.4bn) $3•3bn Underlying RC profit before interest and tax (2020 $3.1bn) See page 41 See page 48 See page 44 See page 50 See page 46 For a description of our organizational model see page 12 a At 31 December 2020, the group’s reportable segments were Upstream, Downstream and Rosneft. From the first quarter of 2021, the group’s reportable segments were gas & low carbon energy, oil production & operations, customers & products and Rosneft. Comparative information for 2020 has been restated to reflect the changes in reportable segments. b The AGT and Middle East regions have been further subdivided by asset to allow reporting in either gas & low carbon energy or oil production & operations as appropriate.  See glossary on page 377 The change in accounting treatment also means that bp will no longer recognize a share in Rosneft’s net income, production and reserves from 27 February 2022. For the period from 1 January 2022 to 27 February 2022, any net income from Rosneft will be classified as an adjusting item. The group will cease to report Rosneft as a separate segment in the group’s financial reporting for 2022.

4 bp Annual Report and Form 20-F 2021 Chair’s letter Throughout the transition, our goal will be to maintain the high performance and steady progress we have shown since our transformation journey began in 2020. Helge Lund Chair Dear fellow shareholders, In uncertain times, one of bp’s primary roles is to maintain the safe, secure supply of the energy on which societies depend. The importance of that role has rarely been clearer than in recent weeks – a period marked by worldwide energy shortages, record prices and volatility. The causes are complex, but they include the disruptive legacy of the pandemic and Russia’s act of aggression against Ukraine. At the same time as maintaining secure supplies, bp must pursue its emissions targets and aims, while continuing to increase its supply of energy from low carbon sources. I believe bp’s strategy gets the balance right. But recent events have demonstrated why, alongside pursuing its strategy, bp must have the agility necessary to make adjustments. Following Russia’s attack on Ukraine, the bp board undertook a thorough review of bp’s involvement with Rosneft in Russia. After careful consideration, the board concluded that bp’s continuing involvement would be inconsistent with our business and strategy. As we said at the time, the board believes that these decisions are in the best long- term interests of all our shareholders. Importantly, our decision to end bp’s involvement with Rosneft in Russia did not mean that any changes to our strategy, financial frame or shareholder distributions guidance were required. We remain confident that the impact of this decision can be accommodated within the plans we have laid out and refined over the past two years. Meanwhile, global action on climate remains vitally important. Despite progress at last year’s COP26 in Glasgow, the world remains on an unsustainable path and has yet to move decisively towards a net zero society. Doing so will require building a global energy system capable of delivering affordable, secure and increasingly clean energy, and with energy demand and supply moving in tandem. Building such a system will require collaboration, within the right policy framework, between business, government, academia and civil society. Achieving all of that will be complex. But that complexity is precisely why purposeful companies need to get involved. Climate change can be addressed more forcefully if the world is able to draw upon high-performing businesses’ capacity to innovate, allocate capital, scale technology and drive efficiency. 4.8% annual dividend yield ordinary share (2020 7.9%) $4•15bn buybacks announced from 2021 surplus cash flow $4•3bn total dividends distributed to bp shareholders (2020 $6.4bn) Progressing with purpose

5 Strategic report  See glossary on page 377 bp Annual Report and Form 20-F 2021 Strategic progress – performing while transforming As we have said before, the energy transition will be a multi-decade process. It is unlikely always to proceed smoothly and may involve periods of turbulence for reasons that are outside of bp’s control. But throughout the transition, our goal will be to maintain the high performance and steady progress we have shown since our transformation journey began in 2020. Indeed, in 2021 that progress allowed the company to further reduce debt, increase its dividend, and begin share buybacks – all in accordance with a considered financial frame. Most important of all is that safety performance improves, and bp’s safety record is showing improvements. We continue the constant pursuit of our goal of no accidents, no harm to people, no damage to the environment. Confidence in bp’s team Every one of bp’s people deserves credit for the achievements of 2021, especially given the disruption imposed by the pandemic. On behalf of the board, I offer them all my sincere thanks. The confidence I have in bp’s people extends fully to its leadership. For what is still a relatively new team, it has achieved a lot – steadily leading bp through a period of volatility and change. I particularly thank Bernard for his commitment to bp and for his leadership. Adjusted aims Confident in bp’s strategy, performance and people, the board concluded in February 2022 that bp should accelerate its net zero ambition. I hope that these changes – set out in detail on page 51 – demonstrate that in a fast-moving, complex environment, bp is evolving in a responsive, dynamic way. And I am pleased that bp intends to provide shareholders with the opportunity of an advisory vote on its net zero ambition at its 2022 AGM. Purposeful engagement Even ahead of that opportunity, we are pleased that shareholders increasingly express their support for the transition that bp is making – recognizing that the company is able to meet both the risks and the opportunities that the energy transition presents. In fact, the board’s engagement across all of bp’s stakeholders is deeper and more extensive than ever before, whether through drop-in sessions with bp teams, consultation with governments, or meetings with shareholders. During these conversations, we often hear suggestions for how we can improve. I am always grateful for those suggestions; after all, bp began this transformation journey after listening to friends and critics who told us that bp needed to change. I am glad we listened. We will continue to do so as your constructive criticism makes bp better. My thanks In our complex world, bp’s guiding light remains its purpose – reimagining energy for people and our planet. To succeed, we must continue to win and grow the trust of our stakeholders, including our shareholders. I am deeply grateful to everyone who has stood by bp – and equally grateful to the many new shareholders who have joined us on the journey. The past two years have shown that it won’t always be easy, but I am confident that, with your support, bp will continue performing while transforming. The energy transition has already given bp a huge opportunity. Now, we are on our way. Thank you for your support. Helge Lund Chair 18 March 2022

6 bp Annual Report and Form 20-F 2021 Chief executive officer’s letter $7•6bn profit attributable to bp shareholders (2020 loss $(20.3)bn) Performing while transforming bp’s finances are strong and resilient. We are making substantial progress on our strategy to pivot from an international oil company to an integrated energy company. Bernard Looney Chief executive officer 2020: Direction We set out a new direction: a new purpose, ambition, strategy, financial frame, sustainability frame, and a new leadership team. 2021: Change This year was about change and the largest restructuring in our history – so that we are organized to deliver. 2022 and beyond: Deliver And now it’s about delivery. The safe, efficient and disciplined delivery of the plans we have laid out. Performing while transforming

7 Strategic report bp Annual Report and Form 20-F 2021 Dear shareholders, The desperate situation in Ukraine is dominating our thoughts at bp as I write to you. Our hearts go out to everyone affected, especially the people of Ukraine and in the wider region. As Helge sets out in his letter, we already announced we will exit our involvement with Rosneft in Russia. Our ongoing priority continues to be our employees and their families in Russia. Additionally we are supporting the humanitarian efforts in the region – for example, leveraging our businesses in neighbouring countries, leveraging our global employees’ desire to help, as well as donations to charities. Like Helge, I am absolutely convinced that the decisions we have taken are in the best long-term interests of shareholders – and consistent with who we are as a company. Strengthening and improving Against that backdrop – bp’s finances are strong and resilient. We are making substantial progress on our strategy to pivot from an international oil company to an integrated energy company. To repeat words that you may have heard me use before, we are performing while transforming – delivering for you today while preparing bp for tomorrow. The bedrock, as always, has been safe and reliable operations, day-in, day-out. Overall, we saw improvements in safety during 2021 across several areas. Tragically though, we lost a colleague in a fatal accident at our Castellón refinery in Spain, and a cyclist in the UK died in an accident with one of our contractors’ road tankers. We will remain constantly focused on eliminating accidents, particularly those that take or change lives – nothing is more important. With this foundation we are building a track record of delivery. We met our target of $2.5 billion of cash cost savings (compared with 2019), reduced our net debta by over $8 billion, and grew returns (ROACE)b to 13.3%. Our operating cash flow for the year was $23.6 billion and our underlying RC profit was $12.8 billion. This performance enabled the board, in line with our disciplined financial frame, to make a number of decisions in relation to distributions. First, an increase of 4% to the dividend in the second quarter. Second, to return $4.15 billion to you through share buybacks from 2021 surplus cash flow. And third, an expectation that we can deliver buybacks of around $4 billion a year and will have the capacity to increase the dividend per ordinary share by 4% each year through to 2025 – based on our current forecasts at an oil price of around $60 and subject to the board’s discretion. Progressing our strategy I want to pay tribute to the bp team, not just for the strong performance delivered in 2021, but also the strong progress they have achieved across each of the three pillars of our strategy: resilient hydrocarbons, convenience and mobility, and low carbon energy. • Resilient hydrocarbons – we started up seven major projects in the year. These are part of a programme of 35 projects initiated in 2016, completed on schedule and, on average, around 15% under budget. We will continue to high-grade our portfolio with four more start-ups planned in 2022. • Convenience and mobility – we have grown margin share from convenience and electrification from 25% to 29% since 2019c – demonstrating the strength of our customer offers; and we increased the number of EV charge points to over 13,000, installing 115 charging points a week at the end of 2021. We now aim to grow our EV charge points to more than 100,000 globally by 2030, up from our previous aim of 70,000. • Low carbon energy – our renewables pipeline quadrupled to over 23GW since the start of 2020, and now includes three offshore wind projects in two of the world’s best regions. We have also built a portfolio of options in hydrogen. You will find more information on our strategic progress throughout this report, including how our trading and shipping and regions, cities and solutions teams are helping to knit together integrated energy solutions for our customers. Integration in action Nowhere better illustrates the potential of an integrated energy company than our home market of the UK, where in the next few years we anticipate spending £2 for every £1 of profit we make. We plan to continue to invest in the North Sea, to produce much-needed oil and gas while lowering emissions through efficiencies, working to eliminate routine flaring and electrification of our operations. We’re building a new renewables business with large-scale offshore wind projects in the Irish Sea and off the coast of Scotland. As these businesses grow, they can not only power millions of homes but also our growing network of electric vehicle chargers – an increasingly important part of our retail network, where customers come to fuel their vehicles as well as enjoy the growing number of M&S convenience stores on our forecourts. And looking further ahead, we are leading the industrial regeneration of the north-east of England. Here we have with plans for a gas-fired power station connected with a carbon capture and storage system, which will safely lock away the vast majority of the CO2 emissions. And at the same time – we are laying the foundations for a world-class hydrogen sector for the UK. Opportunity and resilience Given the inherent uncertainties in a decades- long energy transition, we developed bp’s strategy for both responsiveness and resilience – responsiveness to opportunities and resilience to volatility. In terms of opportunity – we see great potential for our company in five transition growth engines – bioenergy, convenience, electric vehicle charging, renewables and hydrogen. In each of these areas, our skills, networks, assets and brand give us real competitive advantage. There are all in growth sectors where the potential for returns is strong. In terms of uncertainty, our strategy is designed to accommodate a range of scenarios for the energy transition. This also gives us confidence that it is resilient to the heightened volatility in energy markets arising from the conflict in Ukraine. Exiting from bp’s shareholding in Rosneft will result in some material non-cash charges in our financial results for the first quarter of 2022. Importantly, this does not mean any changes to our strategy or our financial frame, as detailed elsewhere in this report. In 2020 we set a new direction for the company, with our new purpose, ambition and strategy. That is now done. In 2021 we reorganized the company from top to bottom through the most wide-ranging restructuring in bp’s history. That is also done. We are now focused on one thing and one thing only – the safe delivery of our strategy. Delivering for you, our shareholders, today. Delivering the energy the world needs, today. All while transforming bp for tomorrow. Thank you for your continued support for and belief in bp – especially through these unprecedented times of challenge and change. Bernard Looney Chief executive officer 18 March 2022 a Nearest equivalent GAAP measure is finance debt. See Financial statement – Note 26 for more information. b Nearest equivalent GAAP measures of the numerator and denominator are profit or loss for the year attributable to bp shareholders ($7.6 billion) and total equity ($90.4 billion) respectively. c Nearest equivalent GAAP measures of the numerator and denominator are replacement cost profit before interest and tax for the customers & products segment. A reconciliation to GAAP information is provided on page 354.  See glossary on page 377

8 bp Annual Report and Form 20-F 2021 Energy markets Energy markets are fundamentally shifting towards low carbon. This is creating challenges and opportunities for our industry and influencing the way we operate. We monitor global trends closely, exploring and tracking the changes shaping our future. Global context Macroeconomic outlook March 2022 The energy markets are being impacted by the military action in Ukraine, which is adding significant upside pressure to prices. There remains, at this point in time, uncertainty, but price volatility is likely. On the macroeconomic side this is likely to have significant economic and financial consequences for the region and potentially globally. Global economy After a contraction of 3.5% in 2020, global real GDP has rebounded and reached its pre-pandemic peak (of the fourth quarter of 2019) in the second quarter of 2021. The global economy grew by an estimated 5.9% in 2021, its strongest post-recession pace in 80 years. However, the recovery was uneven amid unequal COVID-19 vaccine access and differences in policy support across the globe. Growth in developed economies was 5.0% in 2021, driven by a strong recovery in the US, and GDP in emerging markets grew by 6.5%, driven by China.b Oil The oil market continued its rebalancing process in 2021. Oil demand rebounded with global oil consumptionc increasing by 5.5mmb/d to 96.4mmb/d for the year (+6.0%) on the back of the economic recovery, supported by the increasing vaccination roll-out and gradual lifting of public health measures. On the supply side, continued active supply management by OPEC+ countries also helped accelerate the rebalancing process, with global oil productiond increasing by 1.5mmb/d to 95.3mmb/d. Dated Brent prices averaged $70.91/bbl in 2021 – a 69% increase from 2020 levelsd. Prices rose consistently during 2021, reaching a peak of $86/bbl in late October on the back of a positive macroeconomic outlook, which supported a strong rebound in oil demand. Other factors such as supply disruptions and OPEC+ supply restraint added further upside pressure on prices. Urals prices in north-west Europe (Rotterdam) averaged $68.65/bbl in 2021, up from $41.71/bbl in 2020e. Natural gas The global economic recovery supported natural gas demand in 2021, and prices in all three key gas regions rebounded strongly. A series of compounding factors helped to push prices up, with record, unprecedented pricing levels seen in many regions. Henry Hub prices increased to $3.9/ mmBtu in 2021 from $2/mmBtu in 2020f. US LNG exports increased, driving demand for feedgas into LNG. Capital discipline constraints restrained gas production growth, and coal retirements limited gas-to-coal switching in the power sector, together reducing the gas market’s flexibility to respond to higher prices. The UK National Balancing Point hub price also rose significantly from 25 pence per therm ($3.2/mmBtu) in 2020, up to 116 pence per therm ($15.8/mmBtu) in 2021g, due to exceptionally tight market conditions. An extended heating season in the first half of the year drove storage stocks well below historical average levels. Through the summer, strong competition for LNG supply as well as constraints from Russian pipeline gas supplies tightened the market and prevented stocks from being replenished. Thus, the winter heating season started with stocks at historical lows and prices increased to record levels to reflect significant market risk. Elevated coal and carbon prices further supported European gas prices in 2021. Asian LNG spot prices increased from $4.39/ mmBtu in 2020 to $18.6/mmBtu in 2021 amid a very tight LNG market, with prices rising to $56/mmBtu at their highest pointh. China was the principal driver of LNG demand growth, as the country overtook Japan as the world’s largest LNG importer. Strong LNG demand in South America, multiple LNG supply outages, and tight LNG shipping market conditions at times, compounded the market’s tightness to drive higher prices. 6•0% year-on-year increase in global oil consumption in 2021 4•7% estimated increase in global gas demand in 2021a
9 Strategic report bp Annual Report and Form 20-F 2021 See glossary on page 377 Continuing impact of COVID-19 At the time of writing, the world is still experiencing the effects of COVID-19. We continue to take steps to protect and support our employees through the pandemic. We are taking precautions in our operations and offices and providing enhanced support and guidance to employees, with a focus on safety, health and hygiene, homeworking and mental health. We continue to take decisions on working practices and return to office-based working with caution and in compliance with local and national guidelines and regulations. Refining marker margin We track the refining margin environment using a global refining marker margin (RMM)i. Refining margins showed a gradual recovery towards pre-COVID historical levels averaging $13.2/bbl in 2021, significantly above the 2020 level ($6.8/bblj), but still below the 2015-19 average ($14.1/bbl). Higher US margins are a result of strong demand rebound and higher renewable identification number (RIN) prices, which have more than doubled since last year. RINs represent environmental compliance costs and have increased due to a delay in the US EPA proposing the 2021 renewable volume obligation (RVO), together with various other market-and regulatory-related reasons. Power and renewables Increasing commodity prices and shipping rates, driven by the return to pre-COVID economic growth and supply chain constraints, meant an increase in the capital cost for wind and solar projects in 2021, halting a multi-year trend of cost reduction. In Europe, high natural gas prices caused electricity prices to reach record highs, leading to societal and political pressure in some countries for a reform of electricity pricing to ensure the affordability of the energy transition. Hydrogen and carbon capture and storage (CCS) Global momentum behind hydrogen’s role in decarbonizing hard-to-abate sectors is accelerating, notably in industry and heavy transport. Several more countries have now published hydrogen strategies and, increasingly, this is being followed by announcements of policy support. The pipeline of announced projects has continued to scale rapidly, with cumulative clean hydrogen production capacity in 2030 projected to be 11Mtpa, with over $100 billion of direct investmentk. Despite this surge, however, there remains a significant shortfall versus projected demand in many Paris-consistent scenarios. Momentum is also growing for CCS, in part driven by governments providing additional incentives. Interest in CCS has been bolstered by the need to abate process emissions from heavy industries such as cement and steel manufacture, together with a growing recognition of the need for negative emissions to meet Paris climate goals. a IEA Gas Market Report Q1 2022. b IMF World Economic Outlook, January 2022 update. c IEA Oil Market Report, January 2022. d Refinitiv Data Service (Dated Brent spot price). e Refinitiv Data Service (Urals CIF Rotterdam). f Refinitiv Data Service (Henry Hub cash price). g Refinitiv Data Service (National Balancing Point Day Ahead price). h Refinitiv Data Service (JMK spot price). i The RMM may not be representative of the margin achieved by bp in any period because of bp’s particular refinery configurations and crude and product slates. In addition, the RMM does not include estimates of energy or other variable costs. j This number is updated from 6.7/bbl as stated in the 2020 Annual Report and Form 20-F to reflect the 2021 RMM, which has been updated to reflect changes in bp’s portfolio, and the update of crude reference for the Mediterranean region. k Hydrogen Council.

Carbon emissions Gt of CO2ec 20502019 20302025 2035 2040 20452015201020052000 40 History 0 5 10 15 20 25 30 35 10 bp Annual Report and Form 20-F 2021 Energy markets continued The bp Energy Outlook 2022 considers scenarios that explore possible pathways the energy transition may take out to 2050a. The uncertainty associated with the energy transition is substantial, and these scenarios are not predictions of what is likely to happen or what bp would like to see happen. Rather they explore the possible implications of different judgements and assumptions concerning the nature of the energy transition. Energy outlook Global energy demand across the scenarios Although the three energy outlook scenarios differ in many respects, some trends are common across them and across the wide range of other analyses and information we refer to, such as the International Energy Agency (IEA)'s World Energy Outlook and S&P Global's Energy and Climate Scenarios: • Global energy demand continues to grow, at least for a period, driven by increasing prosperity and living standards in the emerging world. • The share of fossil fuels in global primary energy falls from around 80% in 2019 to between 60% and 20% by 2050 in the three scenarios. • The rapid growth in renewables is supported by the increasing role of electricity in total final energy consumption in the three scenarios. bp.com/energyoutlook Three scenarios to explore the energy transition to 2050 New Momentum This new scenario is the result of work carried out inside bp to review the pace of the energy transition. It acknowledges that the level of ambition from government and corporates has increased since the bp Energy Outlook 2020; however it is constrained by the slow pace of transition in some sectors. This scenario is not considered to be consistent with Paris and results in a reduction in global energy emissions of only 20% by 2050 versus 2019. Net Zero In which global energy systems emissions fall by 95% by 2050 versus 2019, in line with a 1.5°C pathway. Changes in societal actions and behaviours are a key driver in this scenario. Accelerated One of many possible scenarios that can be considered consistent with Paris, in line with a well-below 2°C pathwayb. In this scenario emissions from energy use and most industrial processes fall by around 75% by 2050 versus 2019, with a fall of approximately 90% in the developed world and around 65% in the emerging world. a The scenarios included in the bp Energy Outlook 2022 were prepared before the outbreak of the military action in Ukraine and do not include any analysis of its possible implications for economic growth and global energy markets. b For more information on Paris-consistent pathways, see page 30. c Carbon emissions include CO2 emissions from energy use, industrial processes, natural gas flaring and methane emissions from energy production.

11 Strategic report bp Annual Report and Form 20-F 2021 Scenarios for strategic decision making We have been using scenarios at bp to inform strategy, manage risk and improve decision-making for many years. The scenarios we used to inform our ambition and strategy, which we set out in 2020, were based on a collaborative approach between our economists, strategists and our senior management team and board. Some scenarios start from today and project forward over a timeframe in which the current structure of the energy system helps to inform the pace and nature of the transition path. Other scenarios start in the future, breaking free from the inherent inertia in the energy system (and potentially our thinking), and look back to the present from that new perspective. In thinking about appropriate scenarios to inform our strategy, we used both approaches. The scenarios chosen to explore the range of uncertainty surrounding the future of the global energy system span a broad range of energy transition paths. They consider the possible implications of different judgements and assumptions and so help to design a strategy which is resilient to the wide range of uncertainty we face. By considering various time horizons, we can identify key milestones or signposts which might emerge over the next five, 10 or 30 years and inform our view of the key sources of uncertainty affecting the global energy system. We actively monitor for changes in the external environment, and refresh or review our scenarios as needed in response to these signals, as we have done with our New Momentum scenario. How we create scenarios We quantify a range of scenarios in the bp Energy Outlook 2022 using our global energy modelling system. This comprises a suite of models developed over the past 10 years to help us understand supply and demand dynamics of the global energy system as well as production in intermediate sectors. The modelling framework uses historical data based on the bp Statistical Review of World Energy, the IEA and a range of other data sets. Each scenario is determined by a set of key assumptions including population and economic growth, pace of technological change, resource constraints and government policies. These are informed by expert views from external organizations including United Nations, Oxford Economics, Rystad Energy and a proprietary integrated assessment model. Prices are used to balance supply and demand. The modelling techniques used vary by sector and include a combination of econometric modelling, least-cost optimization, adoption curves and consumer choice modelling. For the bp Energy Outlook 2022, the outputs have been expanded to capture 16 regions and 15 end-use sectors; in addition process emissions from key industrial sectors are included, for the first time. In developing the scenarios, we benchmark our views against scenarios from external organizations including the IEA’s World Energy Outlook, the Intergovernmental Panel on Climate Change (IPCC), and S&P Global's Energy and Climate Scenarios. How scenarios inform our strategy The use of scenarios described in the bp Energy Outlook 2022 and from other organizations aids our understanding of the energy transition and the global energy system. This helps us to think about different outcomes and how they might impact our strategy. The use of a broad range of scenarios to inform our strategy supports our efforts to make it robust and resilient to the range of uncertainty we face. Given that, we believe that it is neither useful nor sensible to try to identify one scenario as being more or less likely than another. How we use scenarios in resilience analysis For the purposes of testing the resilience of our strategy to the range of uncertainty in the energy transition we have used scenarios drawn from the soon-to-be published World Business Council for Sustainable Development (WBCSD) ‘Climate Scenario Analysis Reference Approach for Companies in the Energy System’. By using standard variables from this Scenario Catalogue we believe it will help enable comparability and consistency. For more on our resilience analysis and the outcome of that work, see page 55

Convenience and mobility Sustainability Integration Low carbon energy Resilient hydrocarbons – Oil and gas – Refining – Bioenergy – Convenience and retail fuels – EV charging – Castrol, aviation, B2B and midstream businesses – Renewables – Hydrogen 12 bp Annual Report and Form 20-F 2021 Our strategy and business model Delivering energy solutions to customers around the world Resilient hydrocarbons We are driving returns, high-grading our portfolio and lowering our emissions, through three focus areas: oil and gas, refining and bioenergy. As the world seeks lower carbon fuels, we see opportunities to leverage our portfolio of assets and customer base – with bioenergy as one of our transition growth engines. Convenience and mobility We aim to double adjusted EBITDA by 2030a, while sustaining ROACE of 15-20%a, all through a focus on customers. We expect this growth to be driven by our differentiated convenience and fuels offers, selective growth markets expansion, acceleration of our EV charging ambition, as well as our Castrol, aviation, B2B and midstream businesses. Convenience and EV charging are two of our transition growth engines. Low carbon energy We are building scale with capital discipline and returns focus. We plan to create integrated low carbon energy hubs, enabled by two of our transition growth engines, renewables and hydrogen. Sustainability: embedded across our strategic focus areas is our sustainability frame, which sets out our aims for getting to net zero, improving people’s lives and caring for our planet, see page 51. Integration: binding this all together is integration. Harnessing our collective capabilities as the energy system transitions, to help more and more customers get the clean, reliable and affordable energy they want – and in doing so – creating value for our shareholders, see pages 14-15. Progress against our strategy, page 16 Our purpose Our resources and relationships Our business groups Our strategy An integrated energy company delivering solutions for customers. Reimagining energy Some of the tangible and intangible assets that support how we generate and preserve value for our stakeholders, as at 31 December 2021. Our three business groups are supported by four integrators to facilitate collaboration and unlock value: innovation & engineering; regions, cities & solutions; strategy, sustainability & ventures; and trading & shipping. And four teams serve as enablers of business delivery: communications & advocacy; finance; legal; and people & culture. Energy sector experience >110 years experience in the world of energy 70 years annual publication of the bp Statistical Review of World Energy Incumbent capability >10,000 engineers ~2,000 digital experts Global context, page 8 Sustainability, page 51 a At bp planning assumptions including that annual capital expenditure through to 2030 and number of customer touchpoints, retail sites, strategic convenience sites and EV charge points increase in line with bp’s targets and aims. Reconciling strategic focus areas to our reporting segmentsa Oil production & operations Customers & products Gas & low carbon energyb Resilient hydrocarbons Oil production Refining and products Bioenergyc Gas production Gas marketing and trading Convenience and mobility Convenience Fuels EV charging Castrol, aviation, B2B/midstream Low carbon energyb Renewables Hydrogen Denotes transition growth engine, see page 16. a bp reporting segments also included Rosneft and other businesses & corporate in 2021. b Includes bp Bunge Bioenergia. c Biogas is reported in the gas & low carbon energy reporting segment.
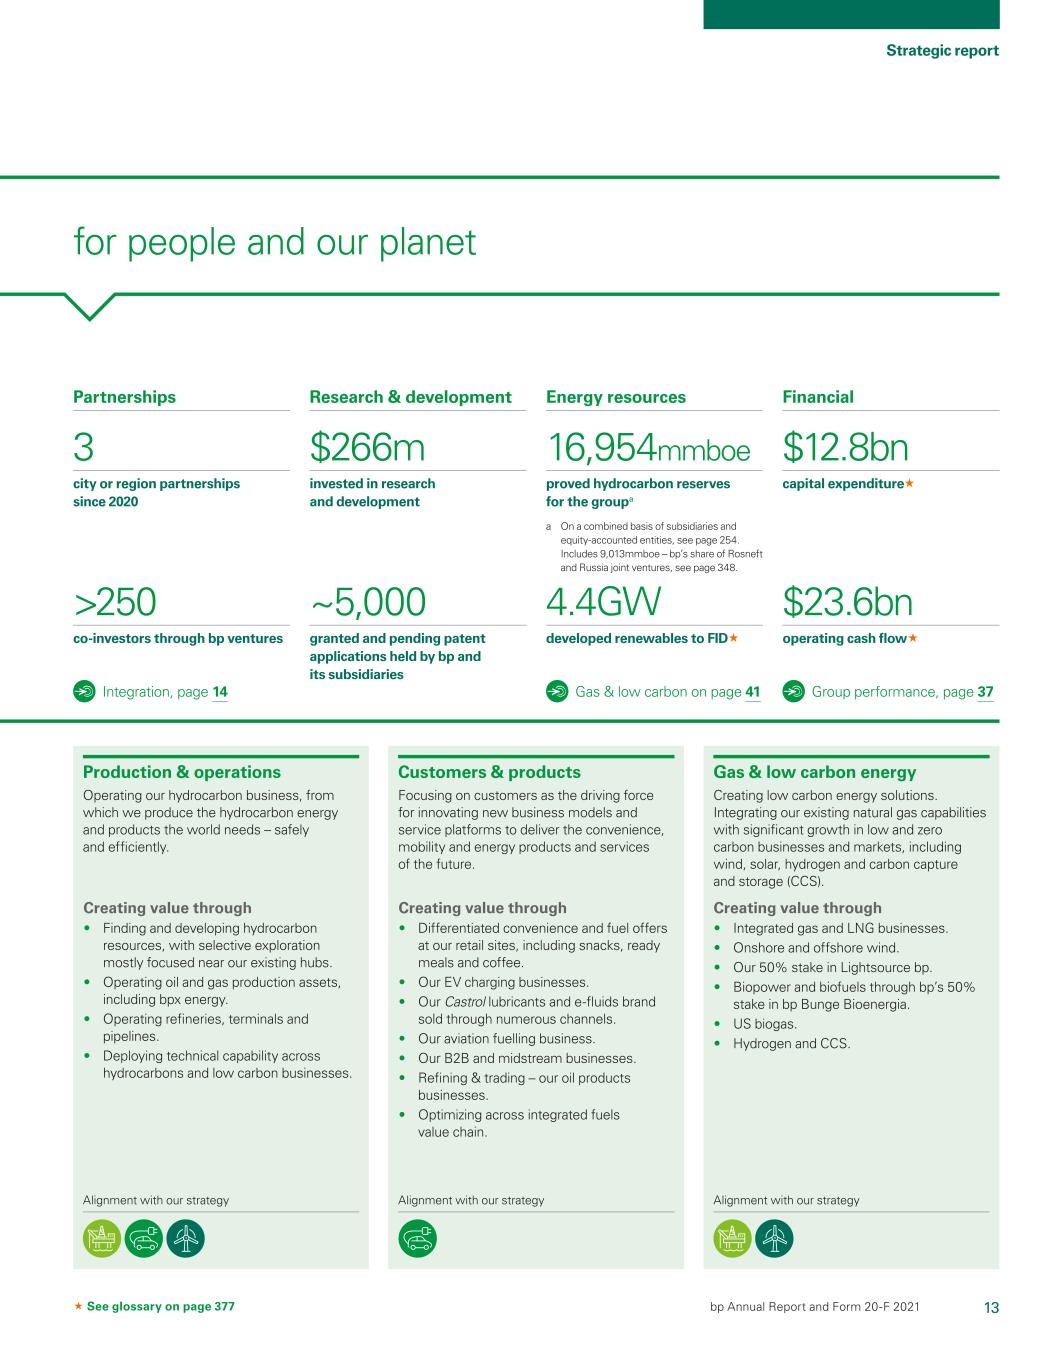
13 Strategic report bp Annual Report and Form 20-F 2021 See glossary on page 377 Production & operations Operating our hydrocarbon business, from which we produce the hydrocarbon energy and products the world needs – safely and efficiently. Gas & low carbon energy Creating low carbon energy solutions. Integrating our existing natural gas capabilities with significant growth in low and zero carbon businesses and markets, including wind, solar, hydrogen and carbon capture and storage (CCS). Customers & products Focusing on customers as the driving force for innovating new business models and service platforms to deliver the convenience, mobility and energy products and services of the future. for people and our planet Partnerships 3 city or region partnerships since 2020 Energy resources 16,954mmboe proved hydrocarbon reserves for the groupa a On a combined basis of subsidiaries and equity-accounted entities, see page 254. Includes 9,013mmboe – bp’s share of Rosneft and Russia joint ventures, see page 348. 4.4GW developed renewables to FID Research & development $266m invested in research and development Financial $12.8bn capital expenditure ~5,000 granted and pending patent applications held by bp and its subsidiaries >250 co-investors through bp ventures $23.6bn operating cash flow Integration, page 14 Gas & low carbon on page 41 Group performance, page 37 Creating value through • Differentiated convenience and fuel offers at our retail sites, including snacks, ready meals and coffee. • Our EV charging businesses. • Our Castrol lubricants and e-fluids brand sold through numerous channels. • Our aviation fuelling business. • Our B2B and midstream businesses. • Refining & trading – our oil products businesses. • Optimizing across integrated fuels value chain. Creating value through • Integrated gas and LNG businesses. • Onshore and offshore wind. • Our 50% stake in Lightsource bp. • Biopower and biofuels through bp’s 50% stake in bp Bunge Bioenergia. • US biogas. • Hydrogen and CCS. Creating value through • Finding and developing hydrocarbon resources, with selective exploration mostly focused near our existing hubs. • Operating oil and gas production assets, including bpx energy. • Operating refineries, terminals and pipelines. • Deploying technical capability across hydrocarbons and low carbon businesses. Alignment with our strategy Alignment with our strategy Alignment with our strategy

14 bp Annual Report and Form 20-F 2021 Business model continued What makes us different We believe we have the scale and expertise to navigate complex markets and manage increasingly integrated energy systems Harnessing our collective capabilities as the energy system transitions, helping more customers get the energy they want and creating value for our shareholders. By leveraging relationships and building new partnerships we aim to provide integrated energy and mobility solutions to help cities and industries reduce carbon emissions while creating exciting business opportunities. Integrating energy systems Partnering with countries, cities and industries Working to decarbonize the aviation sector We are working with airlines and airports to support the decarbonization of the aviation sector and our aim to be a net zero company by 2050 or sooner: • Sustainable aviation fuel (SAF) is expected to play a critical part in decarbonizing this sector and we are working at pace to promote SAF availability, accessibility and affordability. • We have an established position in SAF and aim to be a sector leader, with 20% marketing share by 2030. • As an integrated energy company, our global capabilities, expertise and experience positions us well to help our partners and our customers move at a faster pace on the energy transition journey. • We aim to increase our biofuels production three-fold at three of our refineries through bio co-processing, and invest in five major biofuels projects including three adjacent to existing refineries and the conversion of up to two bio-refineries by 2030. Progress in 2021 • Received accreditation from the Carbon Offsetting and Reduction Scheme for International Aviation (CORSIA) for the production of SAF at our Castellón refinery, the first refinery in the world to receive this status. • Formed a strategic partnership with Qantas to work on opportunities to decarbonize the aviation sector and agreed to supply SAF to the airline from 2022 for selected flights from London to Australia departing from London’s Heathrow Airport. Developing low carbon, CCS-enabled hydrogen in the UK We’re developing plans for a blue hydrogen production facility in Teesside, aiming for 1GW of blue hydrogen production by 2030 and supporting development of the region as the UK’s first hydrogen transport hub – H2Teesside. H2Teesside aims to help surrounding industries decarbonize their existing operations by switching fuel from natural gas to low carbon hydrogen, enabling their manufacturing facilities to produce low carbon products as society progresses towards a net zero future. The development is expected to: • Capture and send for storage up to 2MtCO2 per year. • Help lead a low carbon transformation, supporting jobs, regeneration and the revitalization of the surrounding area. H2Teesside and HyGreen Teesside – a new large-scale green hydrogen production facility project planned by bp – together have the potential to deliver 30% of the UK’s 2030 target for low carbon hydrogen production. bp has signed a memorandum of understanding with seven potential customers – with existing or planned Teesside operations – for hydrogen produced by the project. • A final investment decision is due in early 2024, with potential to begin production in 2027 or earlier. Integration Stakeholders impacted: C I P S Stakeholders impacted: C G P
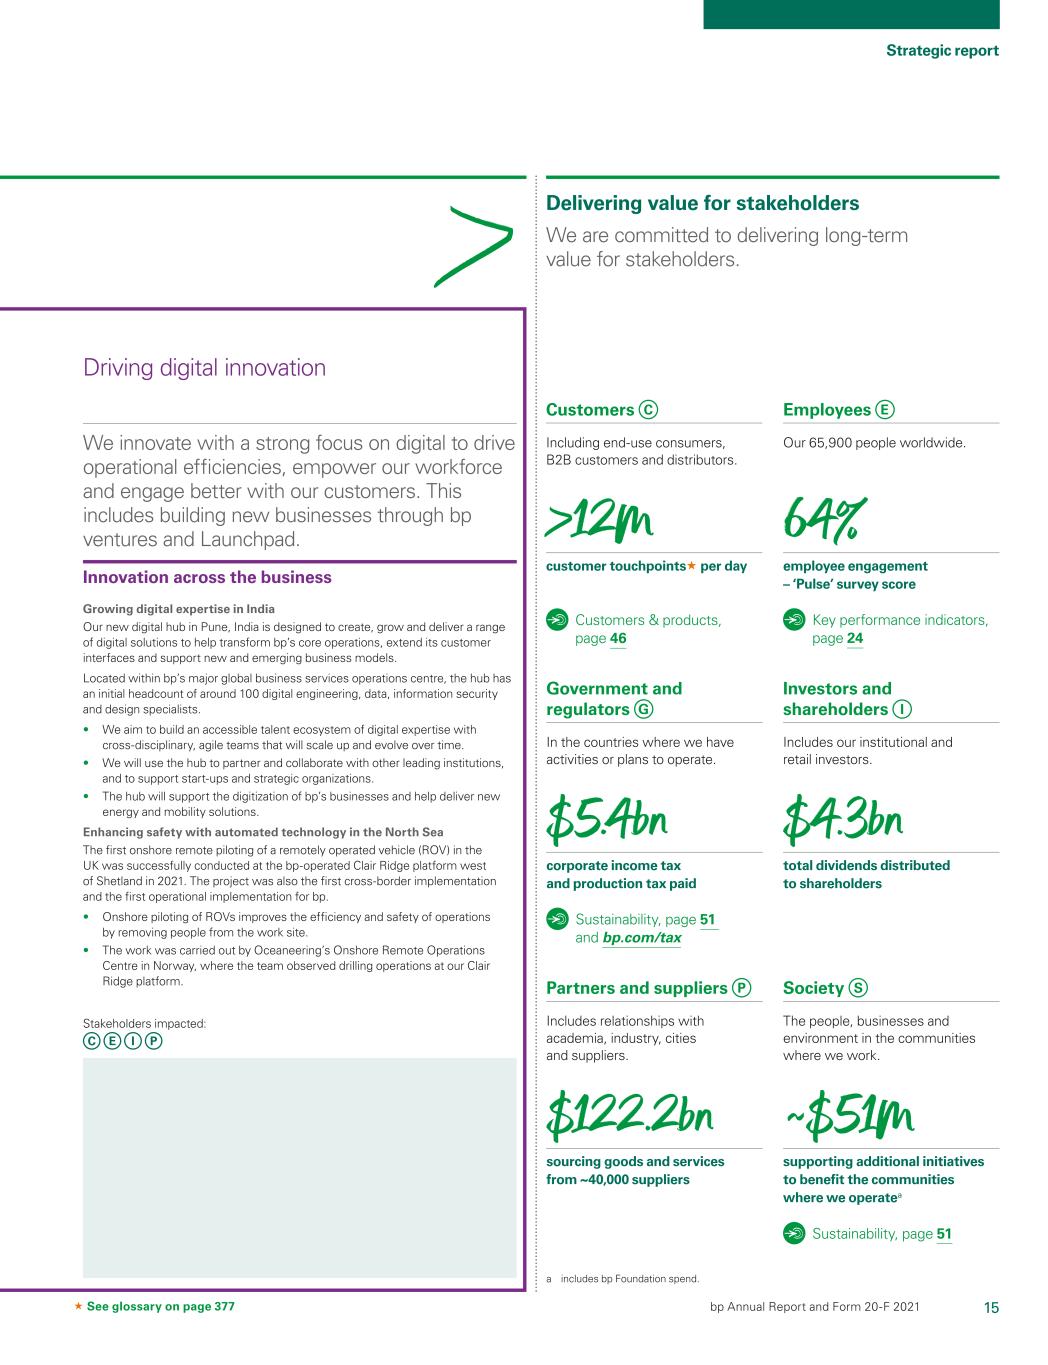
15 Strategic report bp Annual Report and Form 20-F 2021 See glossary on page 377 Delivering value for stakeholders We innovate with a strong focus on digital to drive operational efficiencies, empower our workforce and engage better with our customers. This includes building new businesses through bp ventures and Launchpad. We are committed to delivering long-term value for stakeholders. Driving digital innovation Innovation across the business Growing digital expertise in India Our new digital hub in Pune, India is designed to create, grow and deliver a range of digital solutions to help transform bp’s core operations, extend its customer interfaces and support new and emerging business models. Located within bp’s major global business services operations centre, the hub has an initial headcount of around 100 digital engineering, data, information security and design specialists. • We aim to build an accessible talent ecosystem of digital expertise with cross-disciplinary, agile teams that will scale up and evolve over time. • We will use the hub to partner and collaborate with other leading institutions, and to support start-ups and strategic organizations. • The hub will support the digitization of bp’s businesses and help deliver new energy and mobility solutions. Enhancing safety with automated technology in the North Sea The first onshore remote piloting of a remotely operated vehicle (ROV) in the UK was successfully conducted at the bp-operated Clair Ridge platform west of Shetland in 2021. The project was also the first cross-border implementation and the first operational implementation for bp. • Onshore piloting of ROVs improves the efficiency and safety of operations by removing people from the work site. • The work was carried out by Oceaneering’s Onshore Remote Operations Centre in Norway, where the team observed drilling operations at our Clair Ridge platform. Customers & products, page 46 Sustainability, page 51 Sustainability, page 51 and bp.com/tax Key performance indicators, page 24 a includes bp Foundation spend. Stakeholders impacted: C E I P Society The people, businesses and environment in the communities where we work. ~$51m supporting additional initiatives to benefit the communities where we operatea Investors and shareholders Includes our institutional and retail investors. $4.3bn total dividends distributed to shareholders Customers Including end-use consumers, B2B customers and distributors. >12m customer touchpoints per day Government and regulators In the countries where we have activities or plans to operate. $5.4bn corporate income tax and production tax paid Partners and suppliers Includes relationships with academia, industry, cities and suppliers. $122.2bn sourcing goods and services from ~40,000 suppliers Employees Our 65,900 people worldwide. 64% employee engagement – ‘Pulse’ survey score C E G I P S

Convenience and mobility Low carbon energy Resilient hydrocarbons – Bioenergy – Convenience – EV charging – Renewables – Hydrogen 16 bp Annual Report and Form 20-F 2021 Our strategic focus areas Progress against our strategy In February 2022 we announced our aim to increase the proportion of capital expenditure in transition growth businesses to more than 40% by 2025 and to around 50% by 2030. These businesses are in high- growth sectors and are underpinned by five transition growth engines: Bioenergy, including biofuels, biogas and sustainable aviation fuel: we anticipate investing in five major biofuels projects, including the conversion of up to two refineries, and investment in three standalone bio-plants. And we plan to grow biogas production and marketing. Convenience: we aim to grow convenience gross margin at around 7% per annum, supported by the expansion of our strategic convenience network to around 3,500 sites by 2030. Electric vehicle charging: we are accelerating our EV charging ambition across key growth markets, through a focus on ‘on-the-go’ charging and fleets, and aim to grow our network to more than 100,000 EV charge points by 2030. Renewables: we aim to build a leadership position in offshore wind and accelerate our solar growth through Lightsource bp and bp’s US solar pipeline. Hydrogen: we aim to capture a 10% share in core markets by 2030. As hydrogen markets develop, we aim to create a portfolio of globally advantaged supply hubs. We aim to leverage bp’s existing refinery demand to build regional supply positions. MetricsStrategic focus areas Developed renewables to final investment decision Customer touchpoints Bioenergy production Strategic convenience sitesc LNG portfolio Retail sites in growth marketsc Electric vehicle charge pointsc Traded electricity Castrol sales and other operating revenues Margin share from convenience and electrificationd Low carbon energy T Convenience and mobility T Building scale with capital discipline and returns focus. Doubling adjusted EBITDAa, sustaining returns, focused on customers. Upstream unit production costs Upstream productionb bp-operated hydrocarbon plant reliability bp-operated refining availability Refining throughput Resilient hydrocarbons High-grading our portfolio, lowering our emissions and driving returns. Transition growth businesses For examples of progress against our strategy in 2021, see pages 18, 22 and 28

17 Strategic report bp Annual Report and Form 20-F 2021 See glossary on page 377 2030 aim Performing while transforming2025 target2021 4.4GW 2020 3.3GW >12 million 2020 >11 million 20GW >15 million 50GW >20 million 26Kb/d 2020 30Kb/d 2,150 2020 1,900 50Kb/d ~3,000 >100Kb/d ~3,500 18Mtpa 2020 20Mtpa 2,700 2020 2,700 13,100 2020 10,100 25Mtpa ~5,000 >40,000 30Mtpa >6,000 >100,000 202TWh 2020 214TWh $6.8bn 2020 $5.4bn 29.1% 2020 27.6% 350TWh ~$7.5bn ~35% 500TWh >$8bn ~50% $6.82/boe 2020 $6.39/boe ~$6/boe ~$6/boe 2.2mmboe/d 2020 2.4mmboe/d ~2mmboe/d ~1.5mmboe/d 94% 2020 94% 94.8% 2020 96% 96% 96% >96% >96% 1.6mmb/d 2020 1.6mmb/d <1.5mmb/d ~1.2mmb/d • Delivered record convenience gross margin in 2021, supported by more than 200 strategic convenience sites. • Took full ownership of the Thorntons business, positioning bp to be a leading convenience operator in the Midwest US, see page 19. • In 2022, bp and Marks & Spencer agreed to extend their convenience partnership for bp’s UK retail forecourts until at least 2030, see page 23. • Jio-bp, our fuels and mobility joint venture in India with Reliance, opened their first ’mobility station’, providing a fully integrated customer offer. • Added ~3,000 EV charge points, with nearly half of our network now either rapid or ultra-fast charging. • Acquired charging provider AMPLY Power in the US, accelerating bp’s entry into one of the fastest growing fleet charging markets in the world. • Strategic investment in Digital Charging Solutions with Mercedes- Benz and BMW, a leading developer of digital charging software for automotive manufacturers and fleet operators, see page 23. • Extended our Castrol branded service and maintenance offers globally – we now have 28,000 independent branded workshops. • Increased margin share from convenience and electrification to 29.1%. • Started up seven major projects achieving our 2016 target of 900mboe/d of new major project production by 2021, and around 15% under budget: – Raven in Egypt’s West Nile Delta – KG D6 Satellite Cluster in India (see page 29) – Platina and Zinia Phase 2 in Angola – Matapal in Trinidad – Thunder Horse South Expansion Phase 2 and Manuel in the US Gulf of Mexico (see page 19). • Made three hydrocarbon discoveries: Puma West (oil) in the US Gulf of Mexico, Verknekubinskiy (gas) in Russiae and Shafag Asiman (gas) in the Azerbaijan-Georgia-Turkey region. • Announced plans to invest around $270 million to improve efficiency, reduce emissions and grow renewable diesel production at our US Cherry Point refinery, see page 19. • Completed the sales of our 25% participating interest in the Shallow Water Absheron Peninsula exploration project in the Caspian Sea to LUKOIL, and a 20% stake in Oman’s Block 61 to PTTEP. • bp and Shenzhen Gas signed a natural gas supply agreement to provide gas to customers in China starting in 2023. • Signed 10-year LNG supply agreement starting in 2023 for Singapore with Pavilion Energy, and delivered our first carbon offset LNG cargo to CPC Corporation in Taiwan. • Announced our ‘Morgan’ and ‘Mona’ UK offshore wind projects in the Irish Sea (see page 23), and were awarded a lease option off the east coast of Scotland to develop a wind project ‘Morven’, both with EnBW. • Acquired 9GW of solar development projects from US solar developer 7X Energy, see page 19. • Joined forces with NYK Line to collaborate on future fuels and transportation solutions to help industrial sectors, including shipping, decarbonize. • East Coast Cluster, a collaboration between Northern Endurance Partnership, Net Zero Teesside – both led by bp – and Zero Carbon Humber, selected by the UK government as one of the UK’s first two carbon capture, use and storage projects. • Formed a joint venture with Aberdeen City Council to develop, build and operate a scalable, green hydrogen production hub in Scotland. a At bp planning assumptions including that annual capital expenditure through to 2030 and number of customer touchpoints, retail sites, strategic convenience sites and EV charge points increase in line with bp’s targets and aims. b Relative to 2019, we expect our hydrocarbon production to be around 40% lower by 2030 reflecting active management and high-grading of the portfolio, including divestment of non-core assets. c Reported to the nearest 100. d The nearest GAAP measures of the numerator and denominator are RC profit before interest and tax for customers & products. A reconciliation to GAAP information is provided on page 354. e Discovered by our Russian joint venture Yermak Neftegaz LLC. On 27 February 2022 bp announced that it will exit its other businesses with Rosneft in Russia.

18 bp Annual Report and Form 20-F 2021 Our strategy in action 4 5 6 1 2 3 Strengthening our US presence

19 Strategic report bp Annual Report and Form 20-F 2021 See glossary on page 377 Strong performance in the Gulf of Mexico In 2021 we started up two major projects in the US Gulf of Mexico, where we plan to grow our oil and gas production to around 400mboe/d net by the mid-2020s. • Thunder Horse South Expansion Phase 2: consists of two subsea drill centres operated by 10-inch dual flow lines with the opportunity for simultaneous mobile offshore drilling unit operations. • Manuel: includes a new subsea production system for two new wells tied in to the Na Kika platform. These projects are two of seven major project start-ups in 2021 globally, adding 900mboe/d of new production net to bp from new major projects, since 2016. Continued growth We achieved a significant milestone for the Mad Dog 2 development with Argos – a new semi-submersible floating production platform – now in position ahead of planned start-up in 2022. This has been a pivotal year for our Gulf of Mexico business as we continue to start up new projects. Bringing high-margin, resilient barrels online in basins we know best is central to bp’s strategy. Starlee Sykes SVP Gulf of Mexico and Canada Generating economic value in Louisiana >340 employees in the state of Louisiana >5,200 total jobs supported >$61m spend with >70 suppliers in 2020a 1 Driving down flaring at bpx energy We are on track to achieve our aim of zero routine flaring in our bpx energy US onshore operations by 2025. When we began operating these assets in 2019, flaring intensity was over 16%; today it is less than 1%, a 95% reduction. 2 Investing around $270 million in three projects at Cherry Point refinery These projects are aimed at improving the refinery’s efficiency, reducing its CO2 emissions and increasing its renewable diesel production capability. They are expected to create more than 300 local jobs over the next three years. 5 Purchasing 9GW of solar development projects from 7X Energy The projects span 12 states and are expected to have the capacity to generate enough clean energy to power around 1.7 million US homes once developed. The acquisition is a significant step towards bp’s target of having developed renewables to final investment decision of 20GW by 2025 and aim to increase this to 50GW by 2030. 6 Key Resilient hydrocarbons Convenience and mobility Low carbon energy Taking full ownership of Thorntons retail business The deal marks bp’s re-entry into fully owned and operated stores in the US and positions bp to be a leading convenience operator in the US Midwest. Acquired AMPLY Power Our acquisition of charging provider AMPLY Power has accelerated our entry into the US – one of the fastest growing fleet charging markets in the world. 3 4 For more on our strategic focus areas, see page 16 a 2021 data unavailable at time of publication.

20 bp Annual Report and Form 20-F 2021 Our financial frame and investor proposition We are performing while transforming by delivering returns for shareholders today as we transform bp for tomorrow. Operating within a resilient and disciplined financial frame Continued discipline in executing the financial frame A hierarchy of priorities To deliver our strategy, we must continue to operate within a resilient and disciplined financial frame. Our financial frame comprises a hierarchy of priorities governing how we intend to allocate the cash flow that we generate to strengthen our finances, grow distributions to shareholders and invest to create value through our strategic transformation. Following its announcement that bp is exiting its interest in Rosneft, it has removed Rosneft dividend payments from its financial frame. However, bp remains confident in the flexibility and resilience of its financial frame, underpinned by an average 2021-25 cash balance point of around $40 per barrel. This includes reaffirming the guidance regarding its financial frame out to 2025 that was given with its 2021 full-year results in February 2022. #1 Resilient dividend A resilient dividend is our first priority within our financial frame. Reflecting the underlying performance of the business, an improving outlook for the environment, confidence in our balance sheet and commencement of the share buyback programme, the board announced a 4% increase in the second quarter 2021 dividend to 5.46 cents per ordinary share. This increase is accommodated within a 2021-25 average cash balance point of around $40 per barrel Brent, $11 per barrel RMM and $3 per mmBtu Henry Hub (all 2020 $ real). Based on our current forecasts, at around $60 per barrel Brent and subject to the board’s discretion each quarter, we expect to have capacity for an annual increase in the dividend per ordinary share of around 4%, through 2025. #2 Strong investment grade credit rating For the full year 2021 we reduced finance debt by $11.5 billion and net debt by $8.3 billion. During the first quarter of 2021 we reached our target of reducing net debt to below $35 billion around one year earlier than expected, with net debt reaching $30.6 billion at year end. We intend to allocate 40% of 2022 surplus cash flow to further strengthen the balance sheet. Disciplined investment allocation We are focused on the disciplined allocation of capital to deliver on our strategic objectives. In 2021 capital expenditure was $12.8 billion. We expect capital expenditure to be in a range of $14-15 billion in 2022 and $14-16 billion per annum between 2023-25. Investment is allocated across our businesses based on a set of criteria that balances strategic alignment, stringent hurdle rates, volatility, integration value, sustainability and risk. 5.46¢ per ordinary share for 4Q21 Capacity for annual increase of the dividend per ordinary share of ~4% through 2025 at ~$60/bbl 40% 2022 surplus cash flow Intend to allocate 40% 2022 surplus cash flow to further strengthen the balance sheet $14-15bn 2022 capital expenditure 2023-2025: $14-16bn 60% 2022 surplus cash flowab Commitment to allocate ≥60% surplus cash flowa to share buybacks (60% in 2022) and expect to average ~$4bn per year through 2025 at ~$60/bbl $5-7bn per year Low carbon energy and convenience & mobility $9-10bn per year Resilient hydrocarbons a Subject to maintaining a strong investment grade credit rating. b In addition, executed a $500 million buyback programme during 1Q22 to offset expected full-year dilution from vesting of awards under employee share schemes in 2022. #5#1 #2 #3 #4 Resilient dividend Strong investment grade credit rating Share buybacks Disciplined investment allocation

21 Strategic report bp Annual Report and Form 20-F 2021 See glossary on page 377 2022 guidance 2021 actual 2022 guidance Upstream reported and underlying production excluding Rosneft 2.2mmboe/d Expected to be broadly flat Total capital expenditure $12.8bn $14-15bn Depreciation, depletion and amortization $14.8bn Similar level to 2021 Divestments and other proceeds $7.6bn $2-3bn Gulf of Mexico oil spill paymentsa (pre-tax) $1.5bn ~$1.4bn Other businesses and corporate underlying annual charge $1.4bn $1.2-1.4bn Underlying effective tax rate 32%b Expected to be around 40%c a See Financial statements – Note 21 for more information on payables related to the Gulf of Mexico oil spill. b Nearest equivalent GAAP measure: effective tax rate (44%). c Updated from prior guidance of around 35% to reflect the exclusion of Rosneft from bp’s underlying result effective 1 January 2022. #3 Investing to grow convenience & mobility and low carbon energy Within our $14-16 billion range for capital expenditure, we plan to allocate $5-7 billion a year through 2025 into convenience & mobility and low carbon energy. In low carbon energy we are focused on building scale with capital discipline and a focus on returns. In renewable power we will look for opportunities that we believe can meet an internal rate of return hurdle of 8-10% levered. And as we invest in convenience & mobility, we aim to sustain ROACE at 15-20% to 2030a. #4 Investing to drive returns in resilient hydrocarbons We plan to invest around $9 billion in 2022 and $9-10 billion per year from 2023 to 2025 into our upstream oil and gas, and refining and bioenergy businesses. As we invest, we have stringent hurdle rates for final investment decisions: • A payback of less than 10 years for investments in upstream oil and refining. • A payback of less than 15 years for upstream gas. This focused and disciplined capital frame together with a deep hopper of attractive investment opportunities in oil and gas is expected to maximize returns. #5 Share buybacks We are committed to returning at least 60% of surplus cash flow through share buybacks, subject to maintaining a strong investment grade credit rating. In considering the quantum of share buybacks and in setting the dividend per ordinary share each quarter, the board will take account of factors including the cumulative level of, and outlook for, surplus cash flow, the cash balance point and the maintenance of a strong investment grade credit rating. For 2021 we announced share buybacks of $4.15 billion from surplus cash flow. For 2022, and subject to maintaining a strong investment grade credit rating, we are committed to using 60% of surplus cash flow for share buybacks. On average, based on our current forecasts, at around $60 per barrel Brent and subject to the board’s discretion each quarter, we expect to be able to deliver buybacks of around $4.0 billion per annum through 2025. In addition to the commitment to share buybacks from surplus cash flow, we intend to offset the expected dilution from vesting of awards under employee share schemes through share buybacks. During the second quarter of 2021 we executed a $500-million share buyback to offset the expected dilution from the 2021 vesting of awards under employee share schemes. And during the first quarter of 2022 we executed a $500-million share buyback to offset the expected dilution from the 2022 vesting of awards under employee share schemes. a At bp planning assumptions including that annual capital expenditure through to 2030 and number of customer touchpoints, retail sites, strategic convenience sites and EV charge points increase in line with bp’s targets and aims. Our investor proposition Our strategy and financial frame together underpin our investor proposition of delivering long-term value for shareholders through: • A resilient dividend. • The commitment to return at least 60% of surplus cash flow through share buybacks, subject to maintaining a strong investment grade credit rating. • As measured by adjusted EBIDA per share compound annual growth rate between the second half 2019/first half 2020 and 2025. • Growing ROACE to between 12% and 14% by 2025a. • Expecting to increase the proportion of group capital employedb within transition to over 20% in 2025. • Aiming for net zero by 2050 or sooner for Scopes 1, 2 and 3. a $50-60/bbl (2020 $ real) and bp planning assumptions. b Excludes goodwill and cash and cash equivalents. Committed distributions Profitable growth Sustainable value Delivering long-term shareholder value

4 5 1 1 1 23 22 bp Annual Report and Form 20-F 2021 Our strategy in action Growth in Europe

23 Strategic report bp Annual Report and Form 20-F 2021 See glossary on page 377 Growing our charging network We are accelerating our electric vehicle (EV) charging ambition across key growth markets, through a focus on ‘on-the-go’ charging and fleets. Partnerships are a key part of our approach, enabling better and faster utilization of our network. In 2021, we took significant steps towards our aim to grow our EV charge points to more than 100,000 globally by 2030. • Joined forces with Mercedes-Benz and BMW to help accelerate electrification through the Digital Charging Solutions (DCS) partnership. DCS aims to connect drivers with a growing network of EV charge points across Europe, while providing a seamless charging experience. • Opened EV-only charging hubs in Europe, including the UK’s first fleet-dedicated rapid EV charging hub in London. The new rapid charging hubs aim to deliver charging at scale, in locations where fleet and business vehicles need it most. • Rolled out more than 500 ultra-fast charge points at retail sites in Germany under our Aral Pulse brand. Fast, reliable charging infrastructure in convenient locations is essential to give business and fleet customers the confidence to make the switch to electric. Globally, nearly half of our network is now rapid or ultra-fast charging, driving higher utilization and margins. Richard Bartlett SVP, future mobility & solutions >9,300 EV charge points in Europe 8,250 retail sites in Europe Global target to deliver ~50% margin share from convenience and electrification by 2030 1 Building the largest green hydrogen plant in northwest Europe We are partnering with HyCC and the Port of Rotterdam on H2-Fifty, a project to build a 250MW green hydrogen plant at bp’s Rotterdam refinery in the Netherlands. The plant is scheduled for completion in 2025 and would use offshore wind power to produce 40,000 tonnes of green hydrogen a year, replacing the current grey hydrogen at the Port of Rotterdam refinery. 2 Entering the UK offshore power sector bp and Energie Baden-Württemberg (EnBW) were awarded two offshore wind leases in the Irish Sea – Morgan and Mona – as well as a lease option off the east coast of Scotland, to be known as Morven. The projects are expected to have 3GW and 2.9GW total potential generating capacity respectively, marking further progress towards bp’s aim to rapidly build a world-class offshore wind energy business. 4 Rapidly expanding solar across Europe Lightsource bp, in which we have a 50% share, acquired an 845MW solar portfolio in Spain from Iberia Solar in 2021, as well as powering up its 247 megawatt peak (MWp) flagship solar project Vendimia in Zaragoza, Spain. Lightsource bp now has a total of 2.9GW of projects in development or under construction in Spain. The business also made new market entries into Greece and Poland in 2021, strengthening its position in Europe. 5 Key Resilient hydrocarbons Convenience and mobility Low carbon energy Extending our relationship with M&S Food bp and Marks & Spencer agreed to extend their convenience partnership for bp’s UK retail forecourts until at least 2030, aiming to build on the success of our 16-year collaboration. The agreement combines bp’s expertise in forecourt retail with one of the UK’s leading food retailers. We plan to work together to evolve our offer to customers as their behaviours change over the coming decade. 3 For more on our strategic focus areas, see page 16

2020 7017 53 2021 6216 46 2019 9826 72 2018 7216 56 2017 7918 61 Tier 1 process safety events Tier 2 process safety events 2020 0.132 2021 0.164 2019 0.166 2018 0.198 2017 0.218 24 bp Annual Report and Form 20-F 2021 Key performance indicators We assess the performance of the group across a wide range of measures and indicators that are consistent with our strategy and investor proposition. Our key performance indicators (KPIs) provide a balanced set of metrics that give emphasis to both financial and non-financial measures. These help the board and leadership team assess bp’s performance. Our leadership team uses these measures to evaluate operating performance and make financial, strategic and operating decisions. Measuring our progress Changes to KPIs Our greenhouse gas (GHG) emissions KPI now comprises Scope 1 and Scope 2 data included in our aim 1 – net zero operations on an operational control basis. We have retired our previous GHG KPI, which was on an equity share basis, as this is not aligned with our aim 1. We still track and report this data, see page 51. For more on our aims see page 51 Remuneration To help align the focus of our board and executive management with the interests of our shareholders, certain measures are used for executive remuneration. Directors’ remuneration report see page 116 Safety Tier 1 and 2 process safety eventsa We track tier 1 and tier 2 events and report the aggregated outcome. Tier 1 events are losses of primary containment from a process of greatest consequence, or causing harm to a member of the workforce, damage to equipment from a fire or explosion, a community impact or exceeding defined quantities. Tier 2 events are those of lesser consequence. Reported recordable injury frequencya Reported recordable injury frequency (RIF) measures the number of reported work-related employee and contractor incidents that result in a fatality or injury per 200,000 hours worked. 2021 performance The generally reducing trend in tier 1 and 2 process safety events continued into 2021. We had fewer tier 1 and tier 2 process safety events (PSEs) in 2021 compared with 2020. Our combined tier 1 and 2 PSEs have reduced year on year for 10 years, excluding 2019. 2021 performance Our RIF increased by over 20% compared with 2020, where the unique impact that the COVID-19 pandemic had on personal safety in 2020 was reflected in a lower RIF for that year. RIF has slightly improved compared to 2019 and we have seen a decrease in RIF of 25% over the past five years.
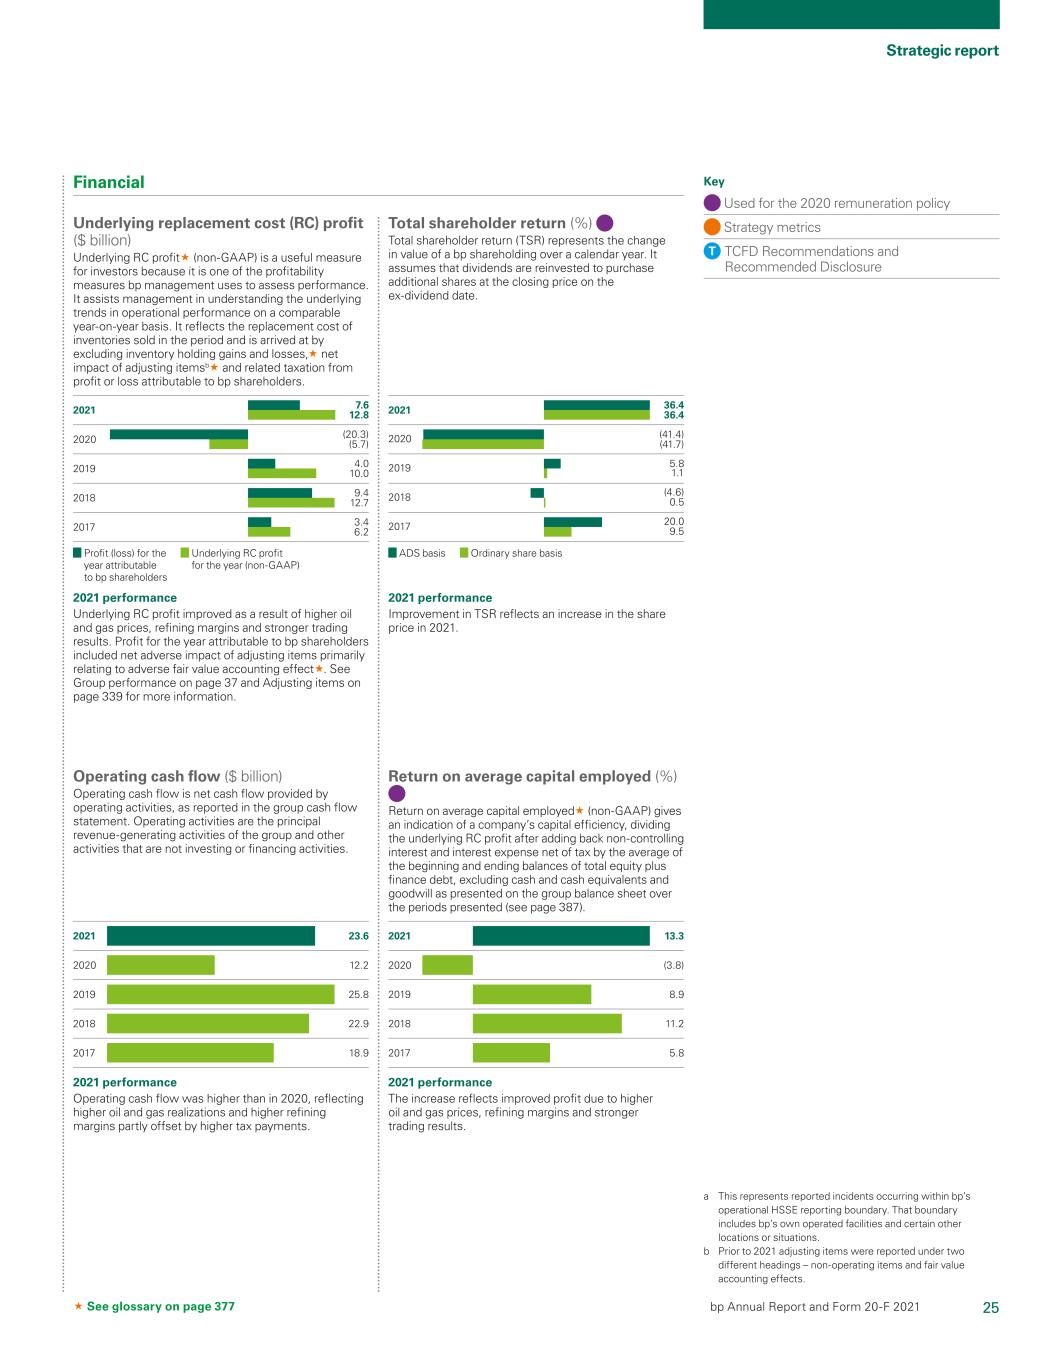
2020 (20.3) 2021 7.6 2019 4.0 2018 9.4 2017 3.4 (5.7) 12.8 10.0 12.7 6.2 Profit (loss) for the year attributable to bp shareholders Underlying RC profit for the year (non-GAAP) 2020 5.8 2021 (41.4) 2019 (4.6)2018 20.02017 1.1 (41.7) 36.4 36.4 0.5 9.5 ADS basis Ordinary share basis 2020 (3.8) 2021 13.3 2019 8.9 2018 11.2 2017 5.8 2020 12.2 2021 23.6 2019 25.8 2018 22.9 2017 18.9 25 Strategic report bp Annual Report and Form 20-F 2021 See glossary on page 377 Financial Underlying replacement cost (RC) profit ($ billion) Underlying RC profit (non-GAAP) is a useful measure for investors because it is one of the profitability measures bp management uses to assess performance. It assists management in understanding the underlying trends in operational performance on a comparable year-on-year basis. It reflects the replacement cost of inventories sold in the period and is arrived at by excluding inventory holding gains and losses, net impact of adjusting itemsb and related taxation from profit or loss attributable to bp shareholders. Operating cash flow ($ billion) Operating cash flow is net cash flow provided by operating activities, as reported in the group cash flow statement. Operating activities are the principal revenue-generating activities of the group and other activities that are not investing or financing activities. Total shareholder return (%) Total shareholder return (TSR) represents the change in value of a bp shareholding over a calendar year. It assumes that dividends are reinvested to purchase additional shares at the closing price on the ex-dividend date. Return on average capital employed (%) Return on average capital employed (non-GAAP) gives an indication of a company’s capital efficiency, dividing the underlying RC profit after adding back non-controlling interest and interest expense net of tax by the average of the beginning and ending balances of total equity plus finance debt, excluding cash and cash equivalents and goodwill as presented on the group balance sheet over the periods presented (see page 387). Key Used for the 2020 remuneration policy Strategy metrics T TCFD Recommendations and Recommended Disclosure 2021 performance Underlying RC profit improved as a result of higher oil and gas prices, refining margins and stronger trading results. Profit for the year attributable to bp shareholders included net adverse impact of adjusting items primarily relating to adverse fair value accounting effect. See Group performance on page 37 and Adjusting items on page 339 for more information. 2021 performance Improvement in TSR reflects an increase in the share price in 2021. 2021 performance Operating cash flow was higher than in 2020, reflecting higher oil and gas realizations and higher refining margins partly offset by higher tax payments. 2021 performance The increase reflects improved profit due to higher oil and gas prices, refining margins and stronger trading results. a This represents reported incidents occurring within bp’s operational HSSE reporting boundary. That boundary includes bp’s own operated facilities and certain other locations or situations. b Prior to 2021 adjusting items were reported under two different headings – non-operating items and fair value accounting effects.

2020 96.0 2021 94.8 2019 94.9 2018 95.0 2017 95.2 2020 4 2021 7 2019 5 2018 6 2017 7 2020 94.0 2021 94.0 2019 94.4 2018 95.7 2017 94.7 2020 6.39 2021 6.82 2019 6.84 2018 7.15 2017 7.11 41.7 3.8 49.2 5.2 48.8 5.4 50.5 6.1 2020 45.5 2021 2019 54.5 2018 54.2 2017 56.6 35.633.2 2.4 Scope 1 (direct) emissions Scope 2 (indirect) emissions 2020 0.12 2021 0.07 2019 0.14 2018 0.16 26 bp Annual Report and Form 20-F 2021 Key performance indicators continued Sustainable operations Non-financial Refining availability (%) bp-operated refining availability represents Solomon Associates’ operational availability for bp-operated refineries. The measure shows the percentage of the year that a unit is available for processing after subtracting the annualized time lost due to turnaround activity and all planned mechanical, process and regulatory downtime. Refining availability is an important indicator of the operational performance of our downstream businesses. Hydrocarbon plant reliability (%) bp-operated hydrocarbon plant reliability is calculated taking 100% less the ratio of total unplanned plant deferrals divided by installed production capacity, excluding non-operated assets and bpx energy. Unplanned plant deferrals are associated with the topside plant and, where applicable, the subsea equipment (excluding wells and reservoir). Unplanned plant deferrals include breakdowns, which does not include Gulf of Mexico weather-related downtime. Major project delivery We monitor the progress of our major projects to gauge whether we are delivering our core pipeline of projects under construction on time. Projects take many years to complete, requiring differing amounts of resource, so a smooth or increasing trend should not be anticipated. Major projects are defined as those with a bp net investment of at least $250 million, or considered to be of strategic importance to bp, or of a high degree of complexity. Greenhouse gas emissionsc – operational control (MtCO2e) T We report Scope 1 and Scope 2 greenhouse gas (GHG) emissions material to our business on a carbon dioxide-equivalent basis. This KPI comprises Scope 1 (from running the assets within our operational control boundary) and Scope 2 (associated with producing the electricity, heating and cooling that is bought in to run those operations) data covered by aim 1 (to be net zero across our operations by 2050 or sooner). It comprises 100% of Scope 1 and 2 emissions for activities within bp’s operational control boundary. Upstream unit production costs ($/boe) The upstream unit production cost is calculated as production cost divided by units of production. Production cost does not include ad valorem and severance taxes. Units of production are barrels for liquids and thousands of cubic feet for gas. Amounts disclosed are for bp subsidiaries only and do not include bp’s share of equity-accounted entities. Methane intensity (%) T We define methane intensity as the amount of methane emissions from our upstream oil and gas operations as a percentage of the gas that goes to market from those operations. This applies to methane emissions within our operational control boundary, where we have the highest degree of control. Methane emissions from non-producing activities, such as exploration drilling, are excluded. The 2021 methane intensity is calculated using existing methodology and, while it reflects progress in reducing methane emissions, it will not directly correlate with progress towards delivering the 2025 target under aim 4. 2021 performance Refining availability reduced slightly in 2021, due to a higher level of maintenance activity. 2021 performance Started up seven major projects, achieving our 2016 target to achieve 900mboe/d of new major project production by 2021, and around 15% under budget. 2021 performance Scope 1 (direct) emissions, covered by aim 1, were 33.2MtCO2e in 2021, a decrease of 20% from 41.7MtCO2e in 2020. This decrease is due to divestments, delivery of sustainable emissions reductions (SERs) and other permanent operational changes. Scope 2 (indirect) emissions were 2.4MtCO2e in 2021, a decrease of 37% from 3.8MtCO2e in 2020 . This decrease resulted from lower carbon power agreements, including at our Gelsenkirchen refinery and chemical facility, and the divestment of the petrochemicals business at the end of 2020. 2021 performance Operations were robust in 2021 with plant reliability remaining at 94%. 2021 performance Unit production costs increased slightly in 2021, but remained below their five-year average. 2021 performance Our methane intensity in 2021d was 0.07%, an improvement from 0.12% in 2020. Methane emissions from upstream operations, used to calculate our intensity, decreased to around 43.0kt, from 71.6kt in 2020. This continues a declining trend in absolute upstream methane emissions since 2016.

2020 25 2021 32 2019 242018 212017 25 30 29 31 24 24 Women in group leadership People from beyond the UK and US in group leadership 2020 64 2021 64 2019 65 2018 66 2017 66 2020 1.0 2021 1.6 2019 1.4 2018 1.3 2017 0.5 27 Strategic report bp Annual Report and Form 20-F 2021 See glossary on page 377 Non-financial Sustainable GHG emissions reductions (MtCO2e) T This measure includes actions taken by our businesses to improve energy efficiency and reduce methane emissions and flaring – all leading to ongoing, quantifiable GHG reductions. These refer to the GHG emissions on an operational control basis, which comprise 100% of emissions from activities that are operated by bp and would have occurred had we not made the change - i.e. they could be absolute in nature or underlying. Since 2019, progress against this target is used as a factor in determining bonuses for approximately 22,000 eligible employeese, including executives. Diversity and inclusionf Each year we report the percentage of women and individuals from countries other than the UK and the US among bp’s group leaders. Employee engagement We conduct an annual employee survey to understand and monitor levels of employee engagement and identify areas for improvement. Key Used for the 2020 remuneration policy Strategy metrics T TCFD Recommendations and Recommended Disclosure 2021 performance We delivered 1.6Mte of SERs from reduction projects including reductions in Scope 2 emissions through new lower carbon power agreements at Gelsenkirchen refinery, waste heat recovery modifications in our Azerbaijan, Georgia, Turkey (AGT) region and reductions through green completions and well-testing without flaring in Oman. 2021 performance The percentage of women in group leadership and the percentage of people from beyond the UK and US in group leadership increased. As a global business we are committed to increasing the diversity of our workforce and leadership. 2021 performance We introduced a new overall engagement metric in 2021, which scored 64%. Scores prior to 2021 are not directly comparable. Building on what we have heard, we are now focusing action planning on four key areas to strengthen engagement: connecting with purpose and strategy, employees’ future excitement at work, career development, and inclusion. c Total (100%) Scope 1 (direct) GHG emissions from source activities operated by bp or otherwise within bp’s operational control boundary. bp’s reported GHG emissions include CH4 and CO2. Other GHGs are not included as they are not material to our operations. d The 2021 methane intensity is calculated using existing methodology and, while it reflects progress in reducing methane emissions, it will not directly correlate with progress towards delivering the 2025 target under aim 4. e This figure was approximately 37,000 in February 2020. It has been updated to reflect the number of employees eligible for a cash bonus in 2021. f Relates to bp employees.

4 5 1 2 3 28 bp Annual Report and Form 20-F 2021 Our strategy in action Developing our presence in Asia-Pacific

29 Strategic report bp Annual Report and Form 20-F 2021 Creating an integrated gas value chain in China In 2021 we started directly supplying customers in China with gas from liquefied natural gas (LNG) imported by bp, completing our first fully integrated gas value chain into the country. The chain directly connects upstream resources, transportation and trading with downstream gas customers. The first cargo of gas was delivered under bp’s new terminal usage agreement at the Guangdong Dapeng LNG Company Limited (GDLNG) import terminal in Guangdong Province. This milestone builds on gas supply agreements we signed with ENN Group and Foran Energy in 2020. For each, we have agreed to supply 300,000 tonnes per year of pipeline gas, re-gasified from LNG, for two years from 2021. Increasing the availability of natural gas to customers across China supports the country’s aim to transition from coal to gas as well as our own aim to grow our integrated gas portfolio, including equity, LNG and merchant gas. With our world-class technologies, marketing and trading capabilities, we have developed an innovative, diversified and flexible integrated business model enabling us to both provide more LNG to the region and increase our access to downstream gas markets. Federica Berra SVP, integrated gas and power 30% bp’s interest in GDLNG ~22% of China’s total LNG imports accounted for by GDLNG 1 Reimagining convenience and mobility in India Jio-bp, our fuels and mobility joint venture with Reliance Industries Limited (RIL), has opened its first ’mobility station’, providing a fully integrated customer offer. This includes: high-quality fuels, EV charge points, tailored convenience offers – including our Wild Bean Cafe, and Castrol products and services. We expect the existing network of 1,400 Reliance fuel stations to be rebranded to Jio-bp over the coming months. 2 EV charging goes carbon neutral in China bp-xiaoju – an EV charging joint venture between bp and DiDi – now provides all customers using its network of charging sites across China with carbon neutral charging. The offer was built around China’s new national standard for carbon neutrality, and offsets the lifecycle carbon emissions from the power purchased by customers. 4 Powering bp service stations with 100% renewable energy Lightsource bp’s West Wyalong solar farm is set to supply renewable energy to 88 bp retail sites across New South Wales, Australia through a power purchase agreement with Snowy Hydro. The sites are expected to be powered by 100% renewables from January 2023, marking another step towards our net zero ambition. 5 Key Resilient hydrocarbons Convenience and mobility Low carbon energy Starting up a new deepwater gas field in India bp and RIL started production from the Satellite Cluster gas field in block KG D6 (operated by RIL) off the east coast of India in 2021. The Satellite Cluster is the second of three deepwater gas developments in the block to come onstream, which together are expected to produce around 1 billion cubic feet a day of natural gas by 2023, meeting up to 15% of India’s gas demand. 3 For more on our strategic focus areas, see page 16

30 bp Annual Report and Form 20-F 2021 What we mean by Paris-consistent As a reminder, the CA100+ 2019 resolution requires us to disclose the strategy that the board considers in good faith to be consistent with the Paris goals. When we refer to ‘consistency with Paris’ we consider this to mean consistency with the world meeting the goals set out in Articles 2.1(a) and 4.1 of the Paris Agreement on Climate Change. The Glasgow Climate Pact agreed by the Parties at COP26 in November 2021 reaffirmed the temperature goal set out in Article 2 of the Paris Agreement. We believe the world is on an unsustainable path – the carbon budget is running out – and needs to reach net zero greenhouse gas emissions. We believe there are a range of global pathways to achieve the Paris goals, with differing implications for regions, industries and sectors, so business strategies need to be flexible and resilient to this uncertainty. bp’s strategy is informed by all these considerations. It is designed to create long-term value for shareholders, while enabling delivery of our net zero ambition – to become a net zero company by 2050 or sooner, and to help the world get to net zero. It is designed to be resilient to the uncertainty of the energy transition across many different potential pathways, including various Paris-consistent pathways. In the 2020 bp Annual Report and Form 20-F we set out, based on three key principles, why the board considers our strategy to be consistent with the Paris goals. Here we set out, on the same three grounds, why the board continues to consider this to be the case, and why our progress over the last year has reinforced our confidence in this belief. 1. Informed by Paris-consistent energy transition scenarios We use scenarios described in the bp Energy Outlook and from other organizations to inform our core beliefs about the energy transition. We believe that it is neither useful nor sensible to try to identify one scenario as being more or less likely than another, and therefore considering a broad range of scenarios from multiple sources to develop and test our strategic thinking helps to increase our confidence in the robustness and resilience of our strategy to the range of uncertainty we face. Pursuing a strategy that is consistent with the Paris goals Consistency with the Paris goals We are confident that our approach is science- based. We see the Intergovernmental Panel on Climate Change (IPCC) as the most authoritative source of information on the evolving science of climate change and we use it and other sources to inform our strategy. The IPCC highlights that there are a range of global pathways by which the world can meet the Paris goals, with differing implications for regions, industry sectors and sources of energy. In the last year… The bp Energy Outlook 2022 has been updated to reflect the significant developments in the pace and nature of the energy transition. It includes two Paris-consistent scenarios that we use to inform the company’s strategy, specifically the Accelerated and Net Zero scenarios. See Energy Outlook, page 10 and bp.com/energyoutlook 2. Strategic resilience We believe our strategy positions bp for success and resilience in a Paris-consistent world – a world that is progressing on one of the many global trajectories considered to be Paris consistent, and ultimately meets the Paris goals. In setting the strategy, the board and management referred to a range of scenarios including those set out in the bp Energy Outlook 2022. The strategy diversifies bp’s portfolio and business interests, reducing the risk that challenges facing a single business area might adversely affect bp’s strategic resilience. In addition, within the inevitable constraints associated with factors such as long-term capital investments, contractual commitments and organizational capabilities at any given time, part of the company’s ability to maintain its strategic resilience rests on the governance by which the strategy can be kept under review as necessary in light of new information and changes in circumstances. In our climate-related financial disclosures on page 55 we describe how we have conducted a scenario analysis to test our view of the resilience of our strategy to different climate-related scenarios, including those that are classified by the World Business Council for Sustainable Development (WBCSD) to be consistent with well below 2°C and 1.5°C outcomes. As we explain on page 61, for the purposes of the scenario analysis, the resilience of our strategy to climate-related transition risks and opportunities was considered through three lenses – our ability to continue to (i) deliver shareholder value, (ii) maintain a strong balance sheet and (iii) invest in the energy transition under a range of possible transition pathways, including those that are Paris-consistent. The scenario analysis and resilience test were designed to identify the most relevant transition risk variables for each in-scope business area, and the most extreme range in 2030 for each of those variables across all of the scenarios included in the WBCSD Catalogue as of January 2022. Oil price was the only such variable we considered to have the potential to adversely affect the resilience of our strategy in the timeframe of the analysis. We therefore conducted a quantified test of the resilience of our strategy against the most extreme downside of that range for the oil price from 2023-2030. While the results of any such analysis must be treated with caution – because each is necessarily dependent on many assumptions and methodological choices, and each has its own limitations – overall, this resilience test reinforced our confidence in the resilience of our strategy to a wide range of ways in which the energy system could evolve throughout this decade, including in scenarios consistent with limiting temperature rise to 1.5°C. The analysis also reinforced our recognition that in a sustained very low oil price environment mitigating actions may be necessary, while highlighting that there is no clear-cut correspondence between oil price and the temperature goal with which a scenario is associated. Notably, while the lowest oil price was associated with a 1.5°C scenario, in four of the six 1.5°C scenarios we used – and in four of the six 2°C scenarios used – the oil price in 2030 was found to be higher than bp’s own oil price planning assumption for 2030. In the last year… For the purposes of the scenario analysis exercise referred to above, we used scenarios from the soon-to-be published WBCSD ‘Climate Scenario Analysis Reference Approach for Companies in the Energy System’, developed at the request of, and with support from, the Task Force on Climate-related Financial Disclosures (TCFD). Our chief economist participated in this work.

31 Strategic report bp Annual Report and Form 20-F 2021 See glossary on page 377 The WBCSD Scenario Catalogue comprises three ‘Climate Scenario Reference Families’: ‘Paris Ambitious 1.5°C ’, ‘Paris-Aligned Well-Below 2°C’ and ‘Current Policies/BAU’. We have drawn on the Scenario Catalogue to test the resilience of our strategy and understand the potential implications of a range of possible energy transition scenarios for a potential future bp portfolio mix. Our approach to this scenario analysis, and the outputs from it, are discussed in detail in our TCFD Strategy disclosures. See Climate-related financial disclosures, page 55 3. Contributes to net zero We believe that our strategy enables bp to make a positive contribution to the world achieving net zero GHG emissions and meeting the Paris temperature goals – outcomes which we believe to be in the best interests of bp as well as beneficial to society generally. We see huge opportunity in the energy transition – the transformation of the energy system that we believe to be a necessary feature of the world’s efforts to meet the Paris goals. There are many different ways in which a company at the heart of the energy sector can make a meaningful contribution to the world getting to net zero. These include: policy advocacy and seeking to use the company’s influence with trade associations who also conduct climate-related policy advocacy, low carbon collaboration and support for others, such as cities and companies, in their own decarbonization efforts, and investments in low carbon and technology development. bp seeks to advance these areas through our aims in support of our net zero ambition, including aims 6-10 which are focused on activities which can help the world get to net zero, see page 51. And as we pursue our strategy, our diversification and the growth of our low carbon businesses may also contribute to helping the world get to net zero. For example, in markets where we plan to scale our electric vehicle (EV) charging networks, this may contribute to reducing the ‘range anxiety’ which is one factor holding people back from purchasing electric vehicles. Some ways of contributing are more readily measured by quantitative metrics than others – but all can be important, whether or not they translate into GHG reductions for the company. To illustrate this, in terms of low carbon investment, by 2030 we aim to increase our amount of developed renewables to final investment decision to 50GW, as part of our increased capital expenditure on low carbon businesses. This aim supports the Paris goals by increasing the low carbon options available to energy consumers. However, it does not reduce our Scope 1, 2 or 3 emissions. And it may not result in a decrease in the overall intensity of bp’s marketed products, because that is dependent on the extent to which we – rather than another party such as a buyer of the developed project – market the resulting renewable power, which Responding to increased shareholder interest on Paris consistency In 2019 the board recommended that shareholders support a special resolution requisitioned by Climate Action 100+ (CA100+) on climate change disclosures. The CA100+ resolution passed with more than 99% of the vote. This is the third year we have included responses throughout the annual report. We have adopted a similar approach to that taken in the bp Annual Report and Form 20-F 2020. The CA100+ resolution, which includes safeguards such as protections for commercially confidential and competitively sensitive information, is on page 377. Key terms related to this resolution response are indicated with  and defined in the glossary on page 377. These should be reviewed with the following information. Element of the CA100+ resolution Related content Where Strategy that the board considers in good faith to be consistent with the Paris goals. Our strategy and business model Pursuing a strategy that is consistent with the Paris goals 12 30 How bp evaluates each new material capex investment for consistency with the Paris goals and other outcomes relevant to bp strategy. Our investment process 32 Disclosure of bp’s principal metrics and relevant targets or goals over the short, medium and long term, consistent with the Paris goals. Key performance indicators Sustainability: net zero targets and aims See ‘TCFD metrics and targets’ for an overview 24 51 66 Anticipated levels of investment in: (i) Oil and gas resources and reserves. (ii) Other energy sources and technologies. Financial frame: disciplined investment allocation Investment in non-oil and gas 20 33 bp’s targets to promote operational GHG reductions. Sustainability: net zero targets and aims (in table) 51 Estimated carbon intensity of bp’s energy products and progress over time. Sustainability: aim 3 52 Any linkage between above targets and executive pay remuneration. Directors’ remuneration report 2021 annual bonus outcome 2020 remuneration policy on page 116 122 137 is a commercial consideration. Where we do not sell that power, our development of the renewables is effectively ‘invisible’ in terms of our GHG metrics. Under aim 6 we aim to more actively advocate for policies that support net zero, including carbon pricing. Helping policymakers to design and put in place low carbon policies can help deliver our strategy and capitalize on the huge opportunities associated with achieving the Paris goals. Well-designed low carbon policies can advance the decarbonization of a whole economy – something potentially of far greater impact than anything a single company can achieve through its own portfolio. In the last year… Our progress against our strategy and growing confidence in business opportunities associated with net zero value chains meant that in February 2022 we were able to announce some changes to our net zero aims 1 and 3 as part of an update on our strategic progress. For more information see page 51. This creates a package of net zero carbon aims across our operations, production and sales. These announcements also reinforce our belief that our strategy enables us to make a positive contribution to meeting the Paris goals. We have also actively advocated for policy to support net zero, for some examples of this work, see page 52.

32 bp Annual Report and Form 20-F 2021 Our investment process Our investment process How we use price assumptions Our price assumptions are determined for use in our investment appraisal processes. They are also used to inform decisions about internal planning and the value-in-use impairment testing of assets for financial reporting. The role of price assumptions As part of our strategy development, we review our portfolio and capital development plans. This work informs our view of the price environment and its balanced investment criteria. Together these create a framework that seeks to ensure investments align with our strategy and add shareholder value. We attach increasing weight to the possibility that the pace of transition to a lower carbon economy and energy system could accelerate. While we increased our price assumption for Brent oil out to 2030 in the second quarter of 2021 to reflect near-term supply constraints, we also revised down our long- term Brent oil price assumptions to 2050. Over the next few years we expect to see continued periods of market volatility as demand recovers against a backdrop of reduced levels of investment. However the role of long-term price assumptions is to look through this near-term volatility and help us to confirm the resilience we expect of our future projects to the longer-term trends affecting our industry. In the second quarter of 2021 our investment appraisal long-term price assumptions were reviewed. For Brent oil and Henry Hub gas, they average around $56/bbl and $2.9/ mmBtu (2020 $ real) respectively, from 2022 to 2050, and we consider these long-term price assumptions to be in line with a range of transition paths consistent with the Paris goals. However, they do not correspond to any specific Paris-consistent scenario. Where applicable, we also continue to use carbon prices rising to $100/tCO2e in 2030 and $250/tCO2e by 2050 (2020 $ real) for operational greenhouse gas (GHG) emissions in certain investment cases, as explained on page 34. Investment process price assumptions All investments are evaluated against our long-term price assumptions across a range of alternative prices (central, upper and lower) for oil, natural gas and refining margins. In addition, all investment cases with anticipated annual GHG emissions (bp net basis) from operations above 20,000 tonnes of CO2 equivalent must estimate those anticipated GHG emissions and include an associated carbon price in the investment economics. All price assumptions place some weight on scenarios in which the transition to a low carbon energy system is sufficiently rapid to meet the goals of the Paris Agreement, as well as scenarios in which the transition is not, or may not be, sufficiently rapid. They also place some weight on a range of other factors, which can drive prices, and which are not related to the Paris goals. These price ranges do not link to specific scenarios or outcomes, but instead try to capture the range of different possibilities surrounding the future path of the global energy system. The nature of the uncertainty means that these price ranges inevitably reflect considerable judgement. The ranges are reviewed and updated on an annual basis as our understanding and judgement about the energy transition evolves. In addition to consideration of a range of price assumptions, investment cases are asked to assess the impact of alternative assumptions covering a range of other variables related to the economics of the investment, such as cost, resource, policy changes and schedule, to highlight the robustness of investment cases to a range of other factors. Key investment appraisal assumptions T 2020 $ real 2022 2025 2030 2040 2050 Brent oil ($/bbl) 60 60 60 55 45 Henry Hub gas ($/mmBtu) 3.00 3.00 3.00 3.00 2.75 Refining marker margina 11 12 12 10 10 Carbon price (US$/tCO2e) T 2020 $ real 2022 2025 2030 2040 2050 50 50 100 200 250 Impairment testing Our best estimate of future prices for use in value-in-use impairment testing continues to be based on the annual review of investment appraisal price assumptions, with quarterly review of near-term prices to confirm that the assumptions appropriately reflect any changes to expectations due to short-term market trends. As a result of the revision made in the second quarter of 2021 to oil and gas price assumptions used for investment appraisal, we also revised the price assumptions we use in value-in-use impairment testing. Other than the 2022 Brent and Henry Hub price assumptions, which are $70/bbl and $4.00/mmBtu (both 2020 $ real) respectively, for value-in-use impairment testing, these two price sets remain aligned, except that potential future emissions costs that could be borne by bp are included in investment appraisals as bp costs, generally without assuming incremental revenue, in order to incentivize engineering solutions to mitigate carbon emissions on projects. For the treatment of emission cost assumptions in value-in-use impairment testing, see Financial statements – Note 1 a The disclosed RMM assumption in this table excludes carbon pricing impacts and assumes a normalized cost of renewable identification numbers (RINs).

33 Strategic report bp Annual Report and Form 20-F 2021 See glossary on page 377 Investment in non-oil and gas Our aim 5 is to increase the proportion of investment we make into our non-oil and gas activities. Over time, as investment goes up in low and no carbon, we see it going down in oil and gas. As we continue towards our net zero ambition, we target increasing our low carbon investment to $3-4 billion per year in 2025, and aim to increase it to at least $5 billion per year in 2030. In 2021, our investment in low carbon increased from around $750 million in 2020 to nearly $2.2 billion, the majority of which is related to investments in offshore wind, electric vehicle charging and solar. Offshore wind: we completed the formation of a 50:50 strategic US offshore wind partnership with Equinor to jointly develop up to 4.4GW of capacity in two major lease areas off the US east coast through projects Empire Wind and Beacon. In the UK, bp and 50:50 partner EnBW were jointly selected as the preferred bidder for two 60-year leases in the UK’s first offshore wind leasing round in a decade, see page 23. Solar: Lightsource bp is further accelerating growth, now targeting up to 25GW of capacity by 2025 and has agreed to exclusively develop a 9GW solar pipeline for bp, following our 2021 acquisition of 7X Energy, see page 19. Convenience & mobility: we have increased investment in our EV charging business compared to 2020. This aligns with our aim to accelerate our EV charging ambition across key growth markets and to grow our network of around 13,100 charge points today, to more than 100,000 by 2030. In 2021, we acquired AMPLY Power, an EV charging and energy management provider for fleets in the US, accelerating our entry into one of the fastest growing fleet charging markets in the world. In Europe, we entered a strategic partnership with Mercedes- Benz and BMW with an investment in Digital Charging Solutions, a leading developer of digital charging software for automotive manufacturers and fleet operators, connecting EV drivers across Europe to our network of charge points. Hydrogen is another key area where we expect significant future scale-up through our announced H2 Teesside (see page 14), Lingen and Oman projects, which are part of our high- graded hopper. As announced in February 2022, going forward we expect to increase the proportion of capital expenditure invested in transition growth businesses to more than 40% of total spend by 2025 rising to around 50% by 2030. This is underpinned by five transition growth engines: bioenergy, convenience, EV charging, renewables and hydrogen see page 16. Investment governance and evaluating consistency with the Paris goals Governance framework bp’s investments fall within a governance framework. This seeks to ensure investments align with our strategy, fall within our prevailing financial frame, and add shareholder value. It also means that investments can be assessed consistently and against a range of outcomes relevant to our strategy, including a range of environmental and sustainability criteria. Investments follow an integrated stage-gate process designed to enable our businesses to choose and develop the most attractive investment cases. A balanced set of investment criteria is used, see page 34. This allows for the comparison and prioritization of investments across an increasingly diverse range of business models. The governance framework also specifies that proposed investments are tested against the relevant assumptions, including carbon prices for projected operational emissions where applicable, and are subject to assurance by functions independent of the business before a final investment decision (FID) is taken. The role of the board The board assesses capital allocation across the bp portfolio, including the level and mix of capital expenditures and divestments, strategic acquisitions, distribution choices and deleverage. The board reviews and approves capital investments that are more than $3 billion for investments in resilient hydrocarbons projects, more than $1 billion for investments in all non-oil and gas investments and, in addition, any significant inorganic acquisition that is exceptional or unique in nature. Resource commitment meeting For capital investments above defined financial thresholds for organic or inorganic spend, investment approval is conducted through the executive-level resource commitment meeting (RCM), which is chaired by the chief executive officer. The RCM reviews the merits of each investment case against a balanced set of criteria and considers any key issues raised in the assurance process. The CA100+ resolution requires bp to disclose how we evaluate the consistency of new material capex investments with (i) the Paris goals and (ii) a range of other outcomes relevant to bp’s strategy. bp’s evaluation of consistency of such investments with the Paris goals was undertaken by the RCM for new material capex investments sanctioned in 2021, see page 36. bp’s evaluation of an investment’s consistency with ‘a range of other relevant outcomes’ is achieved by considering its merits against bp’s balanced investment criteria, described on page 34. Cross-group meetings and forums Meetings and forums to allow cross-group discussions and integration. Includes country forums, regional energy plan forum, the production & operations carbon table and digital forum. The forums do not hold decision rights, but inform and underpin the decision- making process delivering integration opportunities across bp. bp board Reviews and approves investment cases more than $3 billion for resilient hydrocarbons, more than $1 billion for all transition or low carbon investments and any significant inorganic acquisition that is exceptional or unique in nature. Resource commitment meeting Forum for approval of investments related to existing and new lines of business above $250 million organic and $25 million inorganic, or which exceed the relevant EVP financial authority, and any project considered strategically important such as a new market entry. Investment allocation committees EVP-level forums to review investment cases within a business group as per individual EVP financial authority (up to $250 million organic, $25 million inorganic capital investment). Business unit investment governance meetings SVP-level forums which review investment cases within a business group, enabler or integrator up to the individual SVP financial authority.

34 bp Annual Report and Form 20-F 2021 Our investment process continued Six investment criteria T Strategic alignment Safety and risks Sustainability Optionality and integration Investment criteria Volatility and rateability Investment economics Strategic alignment For all investment cases, we consider whether the investment supports delivery of our strategy to become an integrated energy company and our net zero aims. We also assess if the investment case involves distinctive capability that bp has, or intends to develop, and whether it adds to an existing ‘scale’ business within the portfolio or could help us create one. Safety and risks For all investment cases, we provide an assessment of the key risks unique to the investment which have a significantly higher probability than usual or have a significantly greater impact (relative to the size of the project) were they to occur. Safety risk management at bp is underpinned by our operating management system, which is designed to sustainably deliver safe, reliable and compliant bp operations. Sustainability For all investment cases, we consider how any proposed business opportunity is connected to the energy transition and societal needs and the environment. This approach is underpinned by our sustainability frame and purpose. Investment cases above defined thresholds for anticipated annual GHG emissions from operations must estimate those anticipated emissions and factor carbon pricing for those emissions into the investment economics. Investment economics For all investment cases, we consider investment economics against a range of relevant measures, including internal rate of return, net present value, discounted payback, and profitability index, using relevant commodity prices, margins and carbon prices, see page 32. Investments are considered against differentiated hurdle rates at different price assumptions. 1. For our resilient hydrocarbons portfolio, a payback of less than 10 years for upstream oil and refining and 15 years for upstream gas; together with an internal rate of return hurdle of 15-20%. 2. For our convenience and mobility business, we seek a portfolio-level return in excess of 15%. 3. For renewables, which typically receive debt financing, we seek levered internal rates of return of 8-10%. Each investment’s expected internal rate of return in our lower-price case is also considered against a cost of capital hurdle rate. Volatility and rateability Our investment economics metrics also consider the degree of uncertainty of the cash flows when considering investment cases. For example, some cases have more certainty of future costs and revenue projections. Variations in net present values for the key variables in an investment case are quantified by sensitivity analysis to give a range of potential outcomes against our key investment hurdles. Optionality and integration Our assessments seek out integration along value chains. For example, we can integrate our US crude production with demand for refined products in Australia, Europe or China. We also look for integration across multiple products and services and multiple geographies and customers. For example, we explore ways to couple renewable power supply from wind and solar with gas- fired generation and investments in green hydrogen to address intermittency, which can offer customers more reliable electricity. We are also investing in technology companies with offerings designed to optimize energy use – these have the potential to leverage our trading activity and complement our own customer offers. Our investments from our natural climate solutions portfolio can offer credits to help offset carbon emissions associated with products offered to some of our customers. Balanced investment criteria All group-wide investment cases must set out their investment merits and are considered against a set of balanced investment criteria. This standardized approach is intended to create a level playing field for decision-making and allows portfolio-wide comparisons of investment cases. Further, the decision to endorse an investment based on the information provided represents bp’s evaluation that the investment is consistent with what the 2019 CA100+ resolution refers to as “a range of other outcomes relevant to bp’s strategy”. In 2021 the standardized approach for investment cases was reviewed to place more prominence on how the investment cases fit with our sustainability aims. The intent is to facilitate the discussion of an investment case’s consistency with the Paris goals, any significant sustainability issues that have been identified, and any impact on or contribution to our aims 1 to 3, in the context of the strategic rationale for the investment case. This helps to maintain the consistency of our investment framework with our strategy. When taking investment decisions, decision makers in bp are expected to consider the six investment criteria outlined below, although their decisions may also take other factors into account as appropriate. Strategy and business model, see page 12 Our net zero aims, see page 51

35 Strategic report bp Annual Report and Form 20-F 2021 See glossary on page 377 Quantitative evaluations T We considered quantitative guide levels to inform the evaluation of each investment’s consistency with the goals of the Paris Agreement. As we stated in the bp Annual Report and Form 20-F 2020, we continue to develop our approach. As a result, in the third quarter of 2021, we added a guide level for investment economics related to our lower-price case – that an investment’s expected internal rate of return (IRR) exceeds the expected cost of capital even under our lower-price case. We have also lowered our operational carbon intensity guide in line with our decreasing portfolio average. As our approach matures with experience, we may continue to adjust or supplement our methodology. There may be instances when new material capex investments are evaluated as consistent with the Paris goals despite either or both of these guide levels not being met. Investment economics We calculate economic indicators using our central and lower-price cases, and applying our carbon price assumptions to relevant operational GHG emissions. See page 32 for our key oil and natural gas price assumptions, which – as noted above – are in line with a range of scenarios consistent with the Paris goals. We then compare the economic indicators to the relevant economic hurdles, see page 34. We would typically target a minimum threshold of greater than 1.0x the relevant IRR guide levels, and less than 1.0x any relevant payback guide level. Sustainability Where appropriate, we measure the operational carbon intensity of the investment relative to that of the 2021 portfolio average for the segment or the related business activity (upstream and refining). We would normally target a ratio of less than 100%, meaning that the investment is expected to reduce the average operational carbon intensity of that portfolio. The potential impact of new material capex investments on bp’s net zero aims is a further consideration. Paris consistency evaluation process Our new material capex investments are intended to support the delivery of bp’s strategy. Investments in scope for evaluation are defined as: New: investment in a new project or extension of an existing project/asset or share of an entity that is new to bp or a substantial increase in bp’s share. Material: more than $250 million capex investment. When evaluating the consistency of our 2021 new material capex investments with the Paris goals, a focus of the evaluation was on their competitiveness and financial robustness as the prices of different forms of energy and products adjust in response to the changing market environment. For new material capex investment decisions, the evaluation used our central price assumptions, key elements of which are set out on page 32. Starting in the third quarter we also evaluated investments using our lower-price case. The evaluation also used our carbon price assumptions when relevant, applied to the anticipated operational greenhouse gas emissions associated with the investment, for the period to 2050. These include a price of $100/tCO2 in 2030 which rises to $250/tCO2 in 2050 (2020 $ real). In addition to the quantitative evaluations described below, the RCM may also evaluate new material capex investments against the six balanced investment criteria (see page 34) using qualitative assessments.

Investment economics Against economic hurdles Sustainabilityb Carbon intensity (%) Guide Guide Low carbon cases a The 2021 investments have been compared to relevant guides (as applicable to the evaluation of each investment) and are presented here in order of the ratio to the relevant central-price case IRR guide level. As a result, the evaluations against the two types of quantitative benchmark do not necessarily follow the same order. b For two of the investments, the carbon intensity was not calculated due to the nature of these investments. The projected carbon intensity of low carbon and electric vehicle businesses is not considered necessary to quantify for these purposes as the relevant operational emissions are not expected to be significant. 36 bp Annual Report and Form 20-F 2021 Our investment process continued Evaluation outcome Decisions taken in 2021 In 2021 three new material capex investment decisions (more than $250 million) were evaluated for Paris consistency. ScotWind offshore wind bp and Energie Baden-Württemberg AG (EnBW) have been awarded a lease option off the east coast of Scotland to develop a major offshore wind project called Morven. The location allows the partners to develop a fixed-bottom offshore wind project with a total generating capacity of around 2.9GW, sufficient to power more than three million homes. We also aim to accelerate Scotland’s energy transition and create a new global offshore wind operations and maintenance centre of excellence in Aberdeen. bp has a 50% interest in this investment. Irish Sea offshore wind bp and EnBW entered the UK’s offshore wind power sector, forming a 50:50 joint venture to jointly develop and operate two projects (Morgan and Mona) in the Irish Sea that we expect to offer a combined potential generating capacity of 3GW, sufficient to power the equivalent of approximately 3.4 million UK households with clean electricity. Mento gas development in Trinidad & Tobago bp and field operator EOG have approved gas development at the Mento project in Trinidad & Tobago. bp has a 50% working interest share of this investment. In 2021 three new material capex investments were approved. All three of these investments were evaluated as being consistent with the Paris goals. Two out of the three new material capex investments were offshore wind projects in our low carbon portfolio. Evaluation of investment performance against each of the quantitative guide levelsa All three investments met the relevant ‘central-price case’ IRR hurdle guide level as shown on the chart and are either low carbon investments (and therefore not evaluated against operational carbon intensity) or met the carbon intensity guide level. For this reason, the two in-scope low carbon investments are not presented in the carbon intensity evaluation.
| | | | | |
| |
| Strategic report |
| Group performance | |
| Performing while transforming |
| | |
$7.6bn |
profit attributable to bp shareholders (2020 loss $(20.3)bn) |
$12.8bn |
underlying replacement cost (RC) profit« (2020 loss $(5.7)bn) |
$23.6bn |
operating cash flow« (2020 $12.2bn) |
Financial and operating performance
| | | | | | | | | | | | | | |
| | $ million except per share amounts |
| | 2021 | 2020 | 2019 |
Sales and other operating revenuesa | | 157,739 | | 105,944 | 159,307 |
| Profit (loss) before interest and tax | | 18,082 | | (21,740) | 11,706 |
| Finance costs and net finance expense relating to pensions and other post-retirement benefits | | (2,855) | | (3,148) | (3,552) |
| Taxation | | (6,740) | | 4,159 | (3,964) |
| Non-controlling interest | | (922) | | 424 | (164) |
| Profit (loss) for the year attributable to bp shareholders | | 7,565 | | (20,305) | 4,026 |
Inventory holding (gains) losses«, before tax | | (3,655) | | 2,868 | (667) |
| Taxation charge (credit) on inventory holding gains and losses | | 829 | | (667) | 156 |
Replacement cost (RC) profit (loss)« | | 4,739 | | (18,104) | 3,515 |
Net (favourable) adverse impact of adjusting items«b, before tax | | 8,697 | | 16,649 | 8,263 |
| Total taxation charge (credit) on adjusting items | | (621) | | (4,235) | (1,788) |
| Underlying RC profit (loss) | | 12,815 | | (5,690) | 9,990 |
Adjusted EBIDA« | | 30,783 | | 19,244 | 31,606 |
| Dividend paid per ordinary share | | | | |
| – cents | | 21.42 | | 31.50 | 41.00 |
| – pence | | 15.538 | | 24.458 | 31.976 |
| Profit (loss) per ordinary share (cents) | | 37.57 | | (100.42) | 19.84 |
| Profit (loss) per ADS (dollars) | | 2.25 | | (6.03) | 1.19 |
Underlying RC profit (loss) per ordinary share« (cents) | | 63.65 | | (28.14) | 49.24 |
Underlying RC profit (loss) per ADS« (dollars) | | 3.82 | | (1.69) | 2.95 |
a2020 and 2019 have been restated as a result of changes to the presentation of revenues and purchases relating to physically settled derivative contracts effective 1 January 2021. For more information see Financial statements – Note 1 Basis of preparation – Voluntary change in accounting policy.
bPrior to 2021 adjusting items were reported under two different headings – non-operating items and fair value accounting effects«. See page 339 for more information.
| | | | | | | | | | | | | | |
| | bp Annual Report and Form 20-F 2021 | | 37 |
| | | | | |
| |
| |
| |
| Group performance continued | |
Results
The profit for the year ended 31 December 2021 attributable to bp shareholders was $7.6 billion, compared with a loss of $20.3 billion in 2020. Adjusting for inventory holding gains, RC profit was $4.7 billion, compared with a loss of $18.1 billion in 2020.
After adjusting RC profit for a net adverse impact of adjusting items of $8.1 billion (on a post-tax basis), underlying RC profit for the year ended 31 December 2021 was $12.8 billion. The result reflected higher oil and gas prices and refining margins, and strong trading results.
For 2020, after adjusting RC loss for a net adverse impact of adjusting items of $12.4 billion (on a post-tax basis), underlying RC loss was $5.7 billion. The result reflected low oil and gas prices, significant exploration write-offs, low refining margins and depressed demand.
For a discussion of bp’s financial and operating performance for the year ending 31 December 2019 and 31 December 2020, see bp's Annual Report and Form 20-F 2020, pages 42-47; and bp’s Report on Form 6-K filed with the Securities and Exchange Commission on 31 January 2022, pages 4-8, restated to effect the change in accounting policy related to the presentation of revenues and purchases relating to physically settled derivative contracts and the change in segmentation. The consolidated financial statements contained on Form 20-F for the year ended 31 December 2020 have been superseded by the audited consolidated financial statements on Form 6-K filed on 31 January 2022.
Adjusting items | | | | | | | | | | | | | | |
| | $ million |
| | 2021 | 2020 | 2019 |
Gains on sale of businesses and fixed assets | | 1,851 | | 2,874 | | 192 | |
| Net impairment and losses on sale of businesses and fixed assets | | 1,123 | | (14,369) | | (8,074) | |
| Environmental and other provisions | | (1,536) | | (212) | | (341) | |
| Restructuring, integration and rationalization costs | | (249) | | (1,296) | | 2 | |
| Fair value accounting effects | | (8,075) | | (212) | | 866 | |
| Gulf of Mexico oil spill | | (70) | | (255) | | (319) | |
| Other | | (959) | | (2,554) | | (78) | |
| Total before interest and taxation | | (7,915) | | (16,024) | | (7,752) | |
| Finance costs | | (782) | | (625) | | (511) | |
| Total before taxation | | (8,697) | | (16,649) | | (8,263) | |
| | | | |
| | | | |
| Total taxation | | 621 | | 4,235 | | 1,788 | |
| | (8,076) | | (12,414) | | (6,475) | |
Prior to 2021 adjusting items were reported under two different headings – non-operating items and fair value accounting effects.
In 2021 the net adverse pre-tax impact of adjusting items was $8.7 billion, mainly relating to adverse fair value accounting effects primarily arising from the exceptional increase in forward gas prices, partially offset by net impairment reversals of $1.3 billion and $1.0 billion relating to a gain from
the divestment of a 20% stake in Oman Block 61. Under IFRS, reported earnings include the mark-to-market value of the hedges used to risk-manage LNG contracts, but not of the LNG contracts themselves. This mismatch at the end of 2021 is expected to unwind if prices decline and as the cargoes are delivered. See Financial statements – Note 3 for more information on impairments.
In 2020 the net adverse pre-tax impact of adjusting items was $16.6 billion, mainly related to impairment charges, a gain on the disposal of our petrochemicals business, certain exploration write-offs (reported within the ‘other’ category), and restructuring costs associated with the reinvent bp programme. The impairment charges mainly related to producing assets and principally arose as a result of changes to the group’s oil and gas price assumptions. Impairment charges also included amounts relating to the disposal of the group’s interests in its Alaska business.
Cumulative reinvent bp restructuring costs from the third quarter of 2020 to 31 December 2021 were $1.5 billion. The process is largely complete with the significant majority of restructuring charges booked by 30 June 2021.
See pages 339 and 340 for more information on adjusting items and fair value accounting effects.
Taxation
| | | | | | | | | | | | | | |
| | % |
| Effective tax rate | | 2021 | 2020 | 2019 |
| Effective tax rate (ETR) on profit or loss for the year | | 44 | | 17 | | 49 | |
Underlying ETR« | | 32 | | (14) | | 36 | |
The charge for corporate income taxes was $6,740 million in 2021 compared with a credit of $4,159 million in 2020. The increase mainly reflects the profit for 2021 compared with a loss in 2020. The effective tax rate (ETR) on the profit for the year in 2021 was impacted by fair value accounting effects. The ETR on the loss for the year in 2020 was impacted by impairment charges and exploration write-offs. Excluding inventory holding impacts and adjusting items, the underlying ETR in 2021 was higher than in 2020 due to the absence of the exploration write-offs with a limited deferred tax benefit and the reassessment of deferred tax asset recognition. The underlying ETR for 2022 is expected to be around 40% but is sensitive to the impact that volatility in the current price environment may have on the geographical mix of the group’s profits and losses. Underlying ETR is a non-GAAP measure. A reconciliation to GAAP information is provided on page 386.
Outlook for 2022
Macro outlook
•The energy markets are being impacted by the military action in Ukraine, which is adding significant upside pressure to prices. There remains, at this point in time, uncertainty, but price volatility is likely.
•On the macroeconomic side this is likely to have significant economic and financial consequences for the region with global consequences.
2022 guidance
•For full year 2022 we expect both reported and underlying upstream« production to be broadly flat compared with 2021. Within this, we
| | | | | | | | | | | | | | |
38 | | bp Annual Report and Form 20-F 2021 | | |
expect production from oil production & operations to be slightly higher and production from gas & low carbon to be slightly lower. We expect the start-up of Mad Dog Phase 2 in the second half of the year and first gas from the Tangguh expansion project in 2023.
•In our customer businesses we expect product demand to remain impacted by ongoing uncertainty around COVID-19 restrictions and continued additive supply shortages in Castrol in the first half of 2022.
•In products we expect industry refining margins to return to pre-COVID historical levels as demand continues to rebound, further supported by elevated RIN prices. However we expect realized margins to remain impacted by high energy costs.
•The other businesses & corporate underlying annual charge is expected to be in a range of $1.2-1.4 billion for 2022. The charge may vary from quarter to quarter.
Cash flow and debt information | | | | | | | | | | | | | | |
| | $ million |
| | 2021 | 2020 | 2019 |
| Cash flow | | | | |
Operating cash flow« | | 23,612 | | 12,162 | | 25,770 | |
| Net cash used in investing activities | | (5,694) | | (7,858) | | (16,974) | |
| Net cash provided by (used in) financing activities | | (18,079) | | 3,956 | | (8,817) | |
| Cash and cash equivalents at end of year | | 30,681 | | 31,111 | | 22,472 | |
Capital expenditure« | | | | |
Organic capital expenditure« | | (11,779) | | (12,034) | | (15,238) | |
Inorganic capital expenditure« | | (1,069) | | (2,021) | | (4,183) | |
| | (12,848) | | (14,055) | | (19,421) | |
| Divestment and other proceeds | | | | |
Divestment proceeds« | | 6,957 | | 5,480 | | 2,201 | |
| Other proceeds | | 675 | | 1,106 | | 566 | |
| | 7,632 | | 6,586 | | 2,767 | |
| Debt | | | | |
| Finance debt | | 61,176 | | 72,664 | | 67,724 | |
Net debt« | | 30,613 | | 38,941 | | 45,442 | |
Net debt including leases« | | 39,411 | | 48,196 | | 55,006 | |
Finance debt ratio« (%) | | 40.3% | 45.9% | 40.2% |
Gearing« (%) | | 25.3% | 31.3% | 31.1% |
Gearing including leases« (%) | | 30.4% | 36.0% | 35.3% |
Operating cash flow
Operating cash flow for the year ended 31 December 2021 was $23.6 billion, $11.4 billion higher than 2020. Compared with 2020, operating cash flows in 2021 reflected higher oil and gas realizations and higher refining margins partly offset by higher tax payments.
Movements in working capital« adversely impacted cash flow in the year by $0.6 billion, including an adverse impact on working capital from the Gulf of Mexico oil spill of $1.4 billion. Other working capital effects were principally an increase in other current assets and inventory offset by an increase in other current liabilities. bp actively manages its working capital balances to optimize and reduce volatility in cash flow.
Operating cash flow for the year ended 31 December 2020 was $12.2 billion, $13.6 billion lower than 2019. Operating cash flow in 2020 reflected $1.8 billion of pre-tax cash outflows related to the Gulf of Mexico oil spill. Compared with 2019, operating cash flows in 2020 reflected lower oil and gas realizations, lower refining margins and lower fuels volumes partly offset by lower tax payments and lower working capital build.
Movements in working capital adversely impacted cash flow in the year by $0.1 billion, including an adverse impact on working capital from the Gulf of Mexico oil spill of $1.6 billion. Other working capital effects, principally a decrease in inventory and other current and non-current assets partially offset by a decrease in other current and non-current liabilities, had a favourable effect of $1.5 billion.
Net cash used in investing activities
Net cash used in investing activities for the year ended 31 December 2021 decreased by $2.2 billion compared with 2020.
The decrease mainly reflected lower capital expenditure and an increase in divestment proceeds received.
Total capital expenditure for 2021 was $12.8 billion (2020 $14.1 billion), of which organic capital expenditure was $11.8 billion (2020 $12.0 billion). Sources of funding are fungible, but the majority of the group’s funding requirements for new investment comes from cash generated by existing operations. We expect capital expenditure of $14-15 billion in 2022 and continue to expect a range of $14-16 billion per annum through 2025.
Total divestment and other proceeds for 2021 amounted to $7.6 billion, including $2.4 billion from the divestment of a 20% stake in Oman Block 61, $2.2 billion of proceeds relating to the 2020 divestment of bp's Alaska business to Hilcorp and the $1.0 billion final instalment for the sale of the petrochemicals business. Other proceeds for 2021 include $675 million from the sale of a 49% interest in a controlled affiliate holding certain refined product and crude logistics assets onshore US and this transaction was reported within financing activities in the group cash flow statement.
Total divestment and other proceeds for 2020 amounted to $6.6 billion, including $3.9 billion of proceeds from the sale of the petrochemicals business. Other proceeds for 2020 include a loan repayment of $455 million relating to the TANAP pipeline refinancing; and $481 million from the sale of interests in bp’s retail property portfolio in the UK and New Zealand. The other proceeds from the UK and New Zealand transactions were reported within financing activities in the group cash flow statement.
As at 31 December 2021 our target of $25 billion of divestment and other proceeds between the second half of 2020 and 2025 was underpinned by agreed or completed transactions of around $15.5 billion with almost $12.8 billion of proceeds received. We expect divestment and other proceeds of $2-3 billion in 2022.
Net cash provided by (used in) financing activities
Net cash used in financing activities for the year ended 31 December 2021 was $18.1 billion, compared with net cash provided of $4.0 billion in 2020. Financing cash flows in 2021 reflect higher net payments arising from actively managing the group’s debt portfolio and lower receipts from the issue of perpetual hybrid bonds.
| | | | | | | | | | | | | | |
| | bp Annual Report and Form 20-F 2021 | | 39 |
| | | | | |
| |
| |
| |
| Group performance continued | |
In 2021, 707 million of ordinary shares (2020 120 million) were repurchased for cancellation for a total cost of $3.2 billion (2020 $0.8 billion), including transaction costs of $17 million (2020 $4 million).
Total dividends distributed to shareholders in 2021 were 21.42 cents per share, 10.08 cents lower than 2020. This amounted to a total distribution to shareholders of $4.3 billion in 2021. In 2020 the total distribution to shareholders was $6.3 billion. The board decided not to offer a scrip dividend alternative in respect of the 2021 and 2020 dividends.
Debt
Finance debt at the end of 2021 decreased by $11.5 billion from the end of 2020. The finance debt ratio at the end of 2021 decreased to 40.3% from 45.9% at the end of 2020. Net debt at the end of 2021 decreased by $8.3 billion from the 2020 year-end position. Gearing at the end of 2021 decreased to 25.3% from 31.3% at the end of 2020. The decrease in net debt and gearing reflected strong performance and related cash flow generation during the year. Net debt and gearing are non-GAAP measures. See Financial statements – Notes 25 and 26 for further information on finance debt and net debt.
For information on financing the group’s activities see Financial statements – Note 28 and Liquidity and capital resources on page 342.
Group reserves and production (including Rosneft segment)a | | | | | | | | | | | | | | |
| | 2021 | 2020 | 2019 |
Estimated net proved reserves (net of royalties) | | | | |
| Liquids (mmb) | | 10,124 | | 10,661 | | 11,478 | |
| Natural gas (bcf) | | 39,615 | | 42,467 | | 45,601 | |
Total hydrocarbons (mmboe)b | | 16,954 | | 17,982 | | 19,341 | |
| Of which: | | | | |
Equity-accounted entitiesb | | 10,065 | | 10,100 | | 9,965 | |
Production (net of royalties) | | | | |
| Liquids (mb/d) | | 1,951 | | 2,106 | | 2,211 | |
| Natural gas (mmcf/d) | | 7,915 | | 7,929 | | 9,102 | |
Total hydrocarbons (mboe/d)c | | 3,316 | | 3,473 | | 3,781 | |
| Of which: | | | | |
| Subsidiaries | | 1,994 | | 2,146 | | 2,420 | |
Equity-accounted entitiesc | | 1,322 | | 1,326 | | 1,360 | |
aBecause of rounding, some totals may not agree exactly with the sum of their component parts.
bIncludes bp’s share of Rosneft and Russia joint ventures (2021 9,013mmboe). See Supplementary information on oil and natural gas on page 254 for further information.
cIncludes bp’s share of Rosneft and Russia joint ventures (2021 1,136mboe/d). See Oil and gas disclosures for the group on page 351 for further information.
Total hydrocarbon proved reserves at 31 December 2021, on an oil equivalent basis including equity-accounted entities, decreased by 6% compared with 31 December 2020. Natural gas represented about 40% (46% for subsidiaries and 36% for equity-accounted entities) of these reserves. The change includes a net decrease from acquisitions and disposals of 408mmboe (decrease of 282mmboe within our subsidiaries and decrease of 126mmboe within our equity-accounted entities). Acquisition and divestment activity occurred in our equity-accounted entities in the Southern Cone, the North Sea and Russia, and divestment activity in our subsidiaries in the US, the Middle East and the North Sea.
Total hydrocarbon production for the group was 4.5% lower compared with 2020. The decrease comprised a 7.1% decrease (12.5% decrease for liquids and 1.6% decrease for gas) for subsidiaries and a 0.3% decrease (1.9% decrease for liquids and 4.7% increase for gas) for equity-accounted entities.
| | | | | | | | | | | | | | |
40 | | bp Annual Report and Form 20-F 2021 | | |
| | | | | |
| |
| Strategic report |
| |
| Gas & low carbon energy | |
Gas & low carbon energy segment comprises our gas and low carbon businesses. Our gas business includes regions with upstream activities that predominantly produce natural gas, integrated gas and power, and gas and power trading. Our low carbon business includes solar, offshore and onshore wind, hydrogen and CCS and our share in bp Bunge Bioenergia. Gas-producing regionsa were previously reported in the Upstream segment, and our renewables businesses were previously reported as part of other businesses & corporate.
Financial and operating performance
| | | | | | | | | | | | | | |
| | | $ million | |
| | 2021 | 2020 | 2019 |
Sales and other operating revenuesb | | 30,840 | | 16,275 | | 27,045 | |
| Profit (loss) before interest and tax | | 2,166 | | (7,049) | | 2,939 | |
Inventory holding (gains) losses« | | (33) | | (19) | | 6 | |
| RC profit (loss) before interest and tax | | 2,133 | | (7,068) | | 2,945 | |
Net (favourable) adverse impact of adjusting items« | | 5,395 | | 7,757 | | 503 | |
Underlying RC profit (loss) before interest and tax« | | 7,528 | | 689 | | 3,448 | |
| Taxation on an underlying RC basis | | (1,677) | | (773) | | (982) | |
| Underlying RC profit (loss) before interest | | 5,851 | | (84) | | 2,466 | |
| Depreciation, depletion and amortization | | 4,464 | | 3,457 | | 5,146 | |
Exploration write-offsc | | 43 | | 1,741 | | 340 | |
Adjusted EBITDA«d | | 12,035 | | 5,214 | | 8,934 | |
Capital expenditure« | | | | |
| Gas | | 3,180 | | 4,012 | | 5,529 | |
| Low carbon energy | | 1,561 | | 596 | | 161 | |
| | 4,741 | | 4,608 | | 5,690 | |
aThe AGT and Middle East regions have been further subdivided by asset to allow reporting in either gas & low carbon or oil production & operations as appropriate.
bIncludes sales to other segments.
c2020 includes a write-off of $673 million which has been classified within the ‘other’ category of adjusting items.
dA reconciliation to RC profit before interest and tax is provided on page 388.
Financial results
Sales and other operating revenues for 2021 were higher due to higher gas marketing and trading revenues, higher realizations, and higher production. The decrease in 2020 compared with 2019 primarily reflected lower gas and liquids realizations, lower gas marketing and trading revenues and were further impacted by lower sales volumes.
RC profit before interest and tax for 2021 included a net adverse impact of adjusting items of $5,395 million, primarily relates to adverse fair value accounting effects« of $7,662 million relative to management’s view of performance, partly offset by the gain on the partial divestment in Oman and net impairment reversals.
RC loss before interest and tax for 2020 included a net adverse impact of adjusting items of $7,757 million (including adverse fair value accounting effects of $738 million relative to management’s view of performance). This primarily relates to impairments associated with revisions to the long-term price assumptions.
RC loss before interest and tax for 2019 included a net adverse impact of adjusting items of $503 million (including favourable fair value accounting effects of $714 million relative to management’s view of performance), primarily related to reclassification of accumulated foreign exchange losses from reserves to the income statement upon the contribution of our Brazilian biofuels business to bp Bunge Bioenergia.
After excluding adjusting items, the underlying replacement cost profit before interest and tax for 2021 reflects exceptionally strong gas marketing and trading results, as well as higher realizations and production offset by higher depreciation, depletion and amortization in the gas business.
Compared with 2019, the 2020 underlying RC result before interest and tax reflected lower gas realizations and the impact of writing down certain exploration intangible carrying values.
See Financial statements – Note 4 for further information on segmental analysis.
Operational update
Reported production for 2021 was 912mboe/d, higher than the same period in 2020 mainly due to major project« start-ups, partially offset by base decline and the partial divestment in Oman. Underlying production« was also higher, by 9.0%, mainly due to major project start-ups, partially offset by base decline.
Renewables pipeline« at the end of the year was 23.1GW (bp net). In 2021 the pipeline grew by 12.2GW (bp net), due to growth in Lightsource bp, in which bp has a 50% share, and the acquisition of a 9GW development pipeline from 7X Energy.
In renewables by the end of 2021 we have brought 4.4GW solar and onshore wind projects to final investment decision (FID) and have 23GW project in our pipeline with a further hopper of options being evaluated.
| | | | | | | | | | | | | | |
| | bp Annual Report and Form 20-F 2021 | | 41 |
| | | | | |
| |
| |
| |
| Gas & low carbon energy continued | |
Strategic progress
Gas
Three major projects started during the year: the Matapal subsea gas development in Trinidad, the Raven field third stage of the West Nile Delta development in Egypt, and the Satellite cluster gas field in block KG D6 offshore India.
bp's sale of a 20% interest in Oman Block 61 to PTT Exploration and Production Public Company Limited (PTTEP) of Thailand (bp operator 40%, OQ 30%, PTTEP 20%, Petronas 10%) closed in March 2021.
Integrated gas and power and LNG trading
•In September, Gas Natural Açu (GNA), a joint venture between bp, Prumo, Siemens and SPIC Brasil, started GNA I commercial operations, a 1.3GW LNG to power thermoelectric plant located in Porto do Açu, Rio de Janeiro, Brazil.
•Shenzhen Gas, State Power Investment Co. Ltd. (SPIC) and Qianhai Foran Energy Co. Ltd., in China – for these three contracts bp will provide approximately 600,000 tonnes per year for 10 years starting in 2023 from the Guangdong Dapeng LNG receiving terminal, in which bp has a 30% stake.
•Pavilion Energy trading & Supply Pte Ltd. in Singapore, bp will supply 800,000 tonnes per year for 10 years, starting in 2024.
See Oil and gas disclosures for the group on page 344 for more information on oil and gas operations in regions.
Low carbon energy
Offshore wind
In offshore wind, in 2021 bp was one of the top developers in terms of acreage. We have built scale in two of the most attractive markets, US and UK. In Scotland for example, these positions in offshore will enable us to leverage integration opportunities with green hydrogen«, EV mobility and power trading as we build the business. We are building a global leadership position in offshore wind.
•In January 2021 bp and Equinor completed their strategic US offshore wind partnership to develop four projects in two existing leases located offshore New York and Massachusetts, which together are expected to have a total generating capacity of 4.4GW (2.2GW net to bp). On 14 January 2022 this partnership signed a 25-year purchase and sale agreement with the New York State Energy Research and Development Authority for 2.5GW of power offtake agreements for US projects Empire Wind II and Beacon Wind I, adding to the 0.8GW power offtake contract secured for Empire Wind 1.
•In February 2021 bp and partner EnBW were announced as the preferred bidder for two highly advantaged 60-year leases in the UK’s first offshore wind leasing round in a decade. The leases, both located in the Irish Sea, offer a combined potential generating capacity of 3GW (1.5GW net to bp).
•In January 2022 bp and its partner EnBW were awarded a lease option off the east coast of Scotland to develop a major offshore wind project. The partnership will develop it as a fixed-bottom offshore wind project with a total generating capacity of around 2.9GW (1.45GW bp net), sufficient to power more than three million homes. After this award bp
offshore wind pipeline as of January 2022 stands at 5.2GW of secured projects.
Solar
In solar, we continue accelerating growth through our Lightsource bp partnership and developing our 9GW portfolio of US solar projects which was acquired in July 2021.
•Since bp’s investment in late 2017, Lightsource bp has brought 53 projects to FID at weighted average expected internal rate of return (levered) of 8-10% and entered 14 new countries.
Hydrogen and carbon capture and storage
In hydrogen and carbon capture and storage (CCS), bp has created a hopper of 0.7mtpa of projects of which half have been announced such as H2 Teesside and Lingen. This hopper has the potential to grow further up to 1.3mtpa, as we continue to activate demand and scale up production.
bp’s growth in hydrogen is focused on growing scale in key regionally integrated markets, such as the UK, Europe, and the US. And as hydrogen markets develop, we aim to create a portfolio of globally advantaged supply hubs. These will deliver cost advantaged low carbon hydrogen for export to global customers. Our strategic partnerships with ADNOC and MASDAR and in Oman are examples of this.
•In January 2022 bp and Oman formed a strategic partnership to progress world-class scale renewable energy and green hydrogen development in Oman. bp will capture and evaluate solar and wind data from 8,000km2 of land, to support the government of Oman in approving the future developments of renewable energy and green hydrogen hubs.
•In October 2021, the East Coast Cluster was selected as one of the UK’s first two CCS projects by the UK government, enabling our Teesside projects, creating UK’s leading hydrogen hub to decarbonize industry and heavy transport.
•bp announced a blue hydrogen project (H2Teesside) in March 2021 and awarded the first engineering contracts for Northern Endurance Partnership and Net Zero Teesside power station.
| | | | | | | | | | | | | | |
42 | | bp Annual Report and Form 20-F 2021 | | |
Estimated net proved reserves and productiona (net of royalties) | | | | | | | | | | | | | | |
| | 2021 | 2020 | 2019 |
Estimated net proved reserves (net of royalties) | | | | |
Crude oilb (mmb) | | 228 | | 292 | | 283 | |
| Natural gas liquids (mmb) | | 32 | | 37 | | 43 | |
Total liquids«c | | 260 | | 329 | | 325 | |
Natural gasc (bcf) | | 11,882 | | 15,367 | | 16,377 | |
Total hydrocarbons«c (mmboe) | | 2,309 | | 2,979 | | 3,149 | |
Of which equity-accounted entitiesd: | | | | |
| Liquids (mmb) | | — | | — | | — | |
| Natural gas (bcf) | | — | | — | | — | |
| Total hydrocarbons (mmboe) | | — | | — | | — | |
Production (net of royalties) | | | | |
Crude oilb (mb/d) | | 97 | | 77 | | 103 | |
| Natural gas liquids (mb/d) | | 16 | | 19 | | 23 | |
| Total liquids (mb/d) | | 113 | | 96 | | 125 | |
| Natural gas (mmcf/d) | | 4,632 | | 4,379 | | 4,876 | |
| Total hydrocarbons (mboe/d) | | 912 | | 851 | | 966 | |
Of which equity-accounted entitiesde: | | | | |
| Liquids (mb/d) | | 3 | | 2 | | 3 | |
| Natural gas (mmcf/d) | | — | | — | | — | |
| Total hydrocarbons (mboe/d) | | 3 | | 2 | | 3 | |
Average realizations«f | | | | |
| Liquids ($/bbl) | | 63.60 | | 35.63 | | 56.92 | |
| Natural gas ($/mcf) | | 5.11 | | 3.25 | | 4.10 | |
| Total hydrocarbons ($/boe) | | 33.75 | | 20.71 | | 28.00 | |
aBecause of rounding, some totals may not agree exactly with the sum of their component parts.
bIncludes condensate and bitumen.
cIncludes 10 million barrels of total liquids (11 million barrels at 31 December 2020 and 11 million barrels at 31 December 2019) and 690 billion cubic feet of natural gas (1,059 billion cubic feet at 31 December 2020 and 1,330 billion cubic feet at 31 December 2019) in respect of the 30% non-controlling interest in BP Trinidad & Tobago LLC.
dbp’s share of reserves of equity-accounted entities in the gas & low carbon energy segment.
ebp’s share of production of equity-accounted entities in the gas & low carbon energy segment.
fRealizations are based on sales by consolidated subsidiaries only – this excludes equity-accounted entities.
Renewables
| | | | | | | | | | | | | | |
| | 2021 | 2020 | 2019 |
| Renewables (bp net, GW) | | | | |
Installed renewables capacity« | | 1.9 | | 1.5 | | 1.1 | |
| | | | |
Developed renewables to FID« | | 4.4 | | 3.3 | | 2.6 |
| Renewables pipeline | | 23.1 | | 10.9 | | |
| of which by geographical area: | | | | |
| Renewables pipeline – Americas | | 16.2 | | 6.3 | | |
| Renewables pipeline – Asia Pacific | | 1.4 | | 0.8 | | |
| Renewables pipeline – Europe | | 5.3 | | 3.7 | | |
| Renewables pipeline – Other | | 0.2 | | 0.1 | | |
| of which by technology: | | | | |
| Renewables pipeline – offshore wind | | 3.7 | | 2.2 | | |
| Renewables pipeline – solar | | 19.4 | | 8.7 | | |
| Total developed renewables to FID and renewables pipeline | | 27.5 | | 14.1 | | |
| | | | | | | | | | | | | | |
| | bp Annual Report and Form 20-F 2021 | | 43 |
| | | | | |
| |
| |
| |
| Oil production & operations |
Oil production & operations segment comprises regionsa with upstream activities that predominantly produce crude oil, including bpx energy. These were previously reported in the Upstream segment.
Financial and operating performance
| | | | | | | | | | | | | | |
| | | $ million | |
| | 2021 | 2020 | 2019 |
Sales and other operating revenuesb | | 24,519 | 17,234 | | 28,702 | |
| Profit (loss) before interest and tax | | 10,509 | (14,585) | | 1,047 | |
Inventory holding (gains) losses« | | (8) | 2 | | 2 | |
| RC profit (loss) before interest and tax | | 10,501 | (14,583) | | 1,049 | |
Net (favourable) adverse impact of adjusting items« | | (209) | 8,695 | | 6,616 | |
Underlying RC profit (loss) before interest and tax« | | 10,292 | (5,888) | | 7,665 | |
| Taxation on an underlying RC basis | | (4,123) | 70 | | (3,784) | |
| Underlying RC profit (loss) before interest | | 6,169 | (5,818) | | 3,881 | |
| Depreciation, depletion and amortization | | 6,528 | 7,787 | | 9,166 | |
Exploration write-offsc | | 125 | 8,179 | | 291 | |
Adjusted EBITDA«d | | 16,945 | 8,777 | | 17,122 | |
Capital expenditure« | | 4,838 | 5,829 | | 10,358 | |
aThe AGT and Middle East regions have been further subdivided by asset to allow reporting in either gas & low carbon or oil production & operations as appropriate.
bIncludes sales to other segments.
c2020 includes a write-off of $1,301 million which has been classified within the ‘other’ category of adjusting items.
dA reconciliation to RC profit before interest and tax is provided on page 388.
Financial results
Sales and other operating revenues for 2021 were higher due to higher liquids and gas realizations, partly offset by lower sales volumes. The decrease in 2020 compared with 2019 primarily reflected lower liquids and gas realizations and was further impacted by lower sales volumes.
RC profit before interest and tax for 2021 included a net favourable impact of adjusting items of $209 million. This primarily relates to gains on sales of businesses and net impairment reversals, partly offset by updates to decommissioning provisions related to previously sold assets.
RC loss before interest and tax for 2020 included a net adverse impact of adjusting items of $8,695 million. This primarily related to impairments associated with revisions to bp’s long-term price assumptions. The 2019 result included a net adverse impact of adjusting items of $6,616 million (including adverse fair value accounting effects of $8 million), primarily related to impairment charges arising from disposal transactions.
After excluding adjusting items, the underlying RC profit before interest and tax for 2021 primarily reflected higher liquids and gas realizations and significantly lower exploration write-downs, partially offset by lower volumes.
Compared with 2019, the 2020 underlying RC result before interest and tax reflected lower liquids and gas realizations and the impact of writing down certain exploration intangible carrying values.
See Financial statements – Note 4 for further information on segmental analysis.
Operational update
Reported production for 2021 was 1,307mboe/d, 14.2% lower than the same period in 2020. This includes price impacts on PSA« and TSC« entitlement volumes and the impact of divestments in Alaska and bpx energy. Underlying production decreased by 3.8% mainly due to impacts from reduced capital investment and decline.
Strategic progress
•Four major projects started up during 2021: Zinia Phase 2 in Block 17 and Platina in Block 18, Angola; and Manuel and Thunder Horse South Expansion Phase 2 in the US deepwater Gulf of Mexico.
•We announced an oil discovery in a high-quality Miocene reservoir at the Puma West prospect in the US deepwater Gulf of Mexico.
•bp and PetroChina agreed to establish Basra Energy Company, an incorporated joint venture, intended to own and manage the companies’ interests in the Rumaila field in Iraq.
•bp sold shares representing a 2.1% stake in Aker BP ASA for a total of $273 million. Following the sale, bp holds a 27.9% interest, Subsequently, Aker BP announced its proposed acquisition of the oil and gas business of Lundin Energy, through a statutory merger. Following completion of the merger, which is subject to approvals, bp is expected to own 15.9% in the combined company.
•In March 2022, bp and Eni signed an agreement to form a new 50:50 independent company, Azule Energy, a bp and Eni company, through the combination of the two companies’ Angolan businesses. The agreement follows the memorandum of understanding between the companies agreed in May 2021. The creation of Azule Energy will be subject to customary governmental and other approvals, with the aim of completing the transaction in the second half of 2022.
See Oil and gas disclosures for the group on page 344 for more information on oil and gas operations in regions.
| | | | | | | | | | | | | | |
44 | | bp Annual Report and Form 20-F 2021 | | |
Estimated net proved reserves and productiona (net of royalties) | | | | | | | | | | | | | | |
| | 2021 | 2020 | 2019 |
Estimated net proved reserves (net of royalties) | | | | |
Crude oilb (mmb) | | 3,872 | | 4,287 | | 4,894 | |
| Natural gas liquids (mmb) | | 361 | | 361 | | 513 | |
| Total liquids | | 4,234 | | 4,648 | | 5,408 | |
| Natural gas (bcf) | | 11,499 | | 10,776 | | 14,520 | |
Total hydrocarbons« (mmboe) | | 6,216 | | 6,506 | | 7,911 | |
Of which equity-accounted entitiesc: | | | | |
| Liquids (mmb) | | 795 | | 782 | | 831 | |
| Natural gas (bcf) | | 4,880 | | 4,758 | | 4,951 | |
| Total hydrocarbons (mmboe) | | 1,637 | | 1,602 | | 1,685 | |
Production (net of royalties) | | | | |
Crude oilb (mb/d) | | 898 | | 1,041 | | 1,070 | |
| Natural gas liquids (mb/d) | | 81 | | 93 | | 92 | |
| Total liquids (mb/d) | | 978 | | 1,133 | | 1,163 | |
| Natural gas (mmcf/d) | | 1,903 | | 2,264 | | 2,947 | |
| Total hydrocarbons (mboe/d) | | 1,307 | | 1,524 | | 1,671 | |
Of which equity-accounted entitiesd: | | | | |
| Liquids (mb/d) | | 140 | | 143 | | 135 | |
| Natural gas (mmcf/d) | | 468 | | 480 | | 457 | |
| Total hydrocarbons (mboe/d) | | 221 | | 226 | | 213 | |
Average realizations«e | | | | |
| Liquids ($/bbl) | | 62.57 | | 36.21 | | 57.83 | |
| Natural gas ($/mcf) | | 5.90 | | 1.53 | | 2.04 | |
| Total hydrocarbons ($/boe) | | 56.19 | | 29.88 | | 44.43 | |
aBecause of rounding, some totals may not agree exactly with the sum of their component parts.
bIncludes condensate and bitumen.
cbp’s share of reserves of equity-accounted entities in the oil production & operations segment. Includes bp’s share of reserves of Russia joint ventures. During 2021 gas operations in Argentina, Bolivia, Mexico, Russia and Norway as well as some of our operations in Angola were conducted through equity-accounted entities.
dbp’s share of production of equity-accounted entities in the oil production & operations segment. Includes bp’s share of production of Russia joint ventures.
eRealizations are based on sales by consolidated subsidiaries only – this excludes equity-accounted entities.
| | | | | | | | | | | | | | |
| | bp Annual Report and Form 20-F 2021 | | 45 |
Customers & products segment comprises our customer-focused businesses, spanning convenience and mobility, which includes convenience and retail fuels, EV charging, as well as Castrol, aviation and B2B and midstream. It also includes our oil products businesses, refining & trading. The petrochemicals business is reported in restated comparative information as part of customers & products up to its sale in December 2020.
This segment is unchanged from the former Downstream segment with the exception of the disposal of our petrochemicals business.
Financial and operating performance
| | | | | | | | | | | | | | |
| | $ million |
| | 2021 | 2020 | 2019 |
Sales and other operating revenuesa | | 130,095 | | 90,744 | | 132,864 | |
| Profit (loss) before interest and tax | | 5,563 | | 622 | | 7,187 | |
Inventory holding (gains) losses« | | (3,355) | | 2,796 | | (685) | |
| Replacement cost (RC) profit (loss) before interest and tax | | 2,208 | | 3,418 | | 6,502 | |
Net (favourable) adverse impact of adjusting items« | | 1,044 | | (330) | | (83) | |
Underlying RC profit (loss) before interest and tax« | | 3,252 | | 3,088 | | 6,419 | |
| Of which: | | | | |
| customers – convenience & mobility | | 3,052 | | 2,883 | | 3,790 | |
| Castrol – included in customers | | 1,037 | | 818 | | 1,258 | |
| products – refining & trading | | 200 | | (28) | | 2,227 | |
| petrochemicals | | — | | 233 | | 402 | |
| Taxation on an underlying RC basis | | (1,210) | | (537) | | (1,214) | |
| Underlying RC profit (loss) before interest | | 2,042 | | 2,551 | | 5,205 | |
| | | | | | | | | | | | | | |
| | $ million |
| | 2021 | 2020 | 2019 |
| Depreciation, depletion and amortization | | | | |
| Of which: | | | | |
| customers – convenience & mobility | | 1,306 | | 1,200 | | 1,113 | |
| Castrol – included in customers | | 150 | | 161 | | 144 | |
| products – refining & trading | | 1,694 | | 1,686 | | 1,603 | |
| petrochemicals | | — | | 104 | | 205 | |
| | 3,000 | | 2,990 | | 2,921 | |
Adjusted EBITDAb« | | | | |
| Of which: | | | | |
| customers – convenience & mobility | | 4,358 | | 4,083 | | 4,903 | |
| Castrol – included in customers | | 1,187 | | 979 | | 1,402 | |
| products – refining & trading | | 1,894 | | 1,658 | | 3,830 | |
| petrochemicals | | — | | 337 | | 607 | |
| | 6,252 | | 6,078 | | 9,340 | |
Capital expenditure« | | | | |
| Of which: | | | | |
| customers – convenience & mobility | | 1,564 | | 2,157 | | 1,543 | |
| Castrol – included in customers | | 173 | | 173 | | 229 | |
| products – refining & trading | | 1,308 | | 1,067 | | 1,385 | |
| petrochemicals | | — | | 91 | | 137 | |
| | 2,872 | | 3,315 | | 3,065 | |
aIncludes sales to other segments.
bA reconciliation to RC profit before interest and tax by business is provided on page 354.
Financial results
Sales and other operating revenues in 2021 were higher than in 2020 mainly due to higher crude and product prices as COVID-19 restrictions eased and demand recovered. The decrease in 2020 compared with 2019 was mainly due to lower crude and product prices and the demand impact of COVID-19.
RC profit before interest and tax for 2021 included a net adverse impact of adjusting items of $1,044 million (including favourable fair value accounting effects of $436 million), which principally relate to impairment charges arising due to increased future expenditure and anticipated portfolio changes in the products business.
RC profit before interest and tax for 2020 result included a net favourable impact of adjusting items of $330 million (including adverse fair value accounting effects of $149 million). The net favourable impact reflected a profit of $2.3 billion on the sale of our petrochemicals business, which was partially offset by restructuring costs and impairments. The 2019 result included a net favourable impact of adjusting items of $83 million (including favourable fair value accounting effects of $160 million).
After excluding adjusting items, underlying RC profit before interest and tax for 2021 was $3,252 million (2020 $3,088 million, 2019 $6,419 million).
| | | | | | | | | | | | | | |
46 | | bp Annual Report and Form 20-F 2021 | | |
The customers & products results for 2021 reflect a stronger performance compared to 2020, despite the absence of earnings from our divested petrochemicals business and ongoing COVID-19 impacts.
Customers – convenience and mobility result, excluding Castrol, for the full year was similar to 2020 with the benefit of higher volumes offset by the impact of rising commodity costs and increased employee and digital and marketing expenditure in support of our strategic growth agenda. Convenience gross margin« delivery for the year was a record.
Castrol result was stronger, with volumes, revenues and growth markets earnings materially higher than 2020, despite the impact of significantly higher industry base oil prices, additive shortages and continued COVID-19 impacts.
Products – in refining, the result for the full year was higher due to improved refining margins, higher utilization and commercial optimization, compared to 2020. This was partially offset by a higher level of combined turnaround and maintenance activity and increased energy costs. The result for the year also reflected a weaker contribution from trading due to an exceptionally strong trading performance in the second quarter of 2020.
Operational update
Refinery utilization for the full year was around 5 percentage points higher than in 2020 mainly due to lower COVID-19 related demand impacts. bp-operated refining availability« for the full year was 94.8%, lower compared with 96.0% in 2020, due to a higher level of maintenance activity.
Strategic progress
Strategic convenience sites« grew to 2,150, an increase of more than 200 compared to 2020. Additionally, we have extended and strengthened our convenience offers:
•In August 2021, took full ownership of the Thorntons business in the US, positioning bp to be a leading convenience operator in the Midwest US.
•In January 2022, agreed to extend our convenience partnership with Marks & Spencer for our UK retail forecourts until at least 2030.
•In January 2021, extended our partnership with PAYBACK, Europe’s largest multi-partner loyalty programme, which has over 30 million customers, to become the first provider in Germany to exclusively offer PAYBACK loyalty rewards to electric vehicle drivers.
•In November 2021, we signed a contract with Grabango, a leading provider of checkout-free technology, to bring a more seamless store experience to our customers.
EV charge points« grew to over 13,100, of which nearly half are now rapid or ultra-fast charging«. In addition:
•In December 2021, in EV fleet, we acquired charging provider AMPLY Power in the US, accelerating bp’s entry into one of the fastest growing fleet charging markets in the world.
•In October 2021, we finalized our strategic investment in Digital Charging Solutions with Mercedes-Benz and BMW, a leading developer of digital charging software for automotive manufacturers and fleet operators.
•In June 2021, we opened the UK’s first fleet-dedicated rapid EV charging hub in London, as part of our EV only charging hub roll-out in Europe.
In October 2021, Jio-bp, our fuels and mobility joint venture in India with Reliance, opened their first ’mobility station’, providing a fully-integrated customer offer, including high-quality additivized fuels, EV charging points, tailored convenience offers, as well as our Castrol products and services.
Castrol has a market-leading position in advanced e-fluids, with more than two thirds of the world’s major vehicle manufacturersa having now approved Castrol ON products as part of their factory fill. In October 2021, Castrol also signed a contract with Williams Advanced Engineering to co-develop electric vehicle fluids.
In refining:
•In February 2021, ceased production at our Kwinana refinery in preparation to convert it to an import terminal.
•In October 2021, announced plans to invest around $270 million at the Cherry Point refinery in the US, to improve efficiency, reduce CO₂ emissions and increase its renewable diesel production capability.
•In October 2021, received accreditation from the Carbon Offsetting and Reduction Scheme for International Aviation (CORSIA) for the production of sustainable aviation fuel at our Castellón refinery, the first refinery in the world to receive such status.
•In December 2021, announced our intention to invest in creating an integrated energy hub at our Castellón refinery, to reduce its operational emissions while scaling the production of low carbon products.
aBased on LMCA data for top 20 selling original equipment manufacturers (OEMs) (total new car sales) in 2019.
| | | | | | | | | | | | | | |
| | bp Annual Report and Form 20-F 2021 | | 47 |
The Rosneft segment includes our equity-accounted earnings from our investment in Rosneft.
bp had a 19.75% shareholding and bp’s economic interest as of 31 December 2021 was 22.03% (2020 22.03%, 2019 19.75%). bp’s share of profit or loss of Rosneft reflected its average economic interest for the period.
Financial and operating performance
| | | | | | | | | | | | | | |
| | $ million |
| | 2021 | 2020 | 2019 |
| Profit (loss) before interest and tax | | 2,688 | | (238) | | 2,306 | |
Inventory holding (gains) losses« | | (259) | | 89 | | 10 | |
| Replacement cost (RC) profit (loss) before interest and tax | | 2,429 | | (149) | | 2,316 | |
Net (favourable) adverse impact of adjusting items« | | 291 | | 205 | | 103 | |
Underlying RC profit (loss) before interest and tax« | | 2,720 | | 56 | | 2,419 | |
| Taxation on an underlying RC basis | | (269) | | (3) | | (234) | |
| Underlying RC profit (loss) before interest | | 2,451 | | 53 | | 2,185 | |
Financial results
RC profit before interest and tax for 2021 included a net adverse impact of adjusting items of $291 million. The 2020 and 2019 results included a net adverse impact of adjusting items of $205 million and $103 million respectively.
After excluding adjusting items, the underlying RC profit before interest and tax in 2021 primarily reflected higher oil prices and favourable foreign exchange effects compared with 2020 underlying profit. Compared with 2019, the underlying RC profit before interest and tax for 2020 reflected lower oil prices and unfavourable foreign exchange and adverse duty lag effects.
In July, bp received a payment of $176 million, after a deduction of withholding tax, related to the dividends for 2020. In November, bp received a payment of $464 million, after a deduction of withholding tax, related to an interim dividend for the first half of 2021.
| | | | | | | | | | | | | | |
| | 2021 | 2020 | 2019 |
Estimated net proved reserves (net of royalties) (bp share) | | | | |
Crude oila (mmb) | | 5,490 | | 5,533 | | 5,604 | |
| Natural gas liquids (mmb) | | 140 | | 151 | | 141 | |
Total liquids«b | | 5,630 | | 5,683 | | 5,745 | |
Natural gasc (bcf) | | 16,233 | | 16,324 | | 14,705 | |
Total hydrocarbons« (mmboe) | | 8,429 | | 8,498 | | 8,281 | |
Production (net of royalties) | | | | |
Crude oila (mb/d) | | 857 | | 873 | | 920 | |
| Natural gas liquids (mb/d) | | 3 | | 3 | | 3 | |
| Total liquids (mb/d) | | 860 | | 877 | | 923 | |
| Natural gas (mmcf/d) | | 1,380 | | 1,286 | | 1,279 | |
| Total hydrocarbons (mboe/d) | | 1,098 | | 1,098 | | 1,144 | |
aIncludes condensate.
bIncludes 396mmb (405mmb at 31 December 2020; 357mmb at 31 December 2019) for the 7.04% non-controlling interest (7.12% at 31 December 2020; 6.21% at 31 December 2019) in Rosneft held assets in Russia including 22 million barrels (19mmb at 31 December 2020; 26mmb at 31 December 2019) held through bp’s interests in Russia other than Rosneft.
cIncludes 1,656bcf (1,640bcf at 31 December 2020; 1,430bcf at 31 December 2019) for the 10.20% non-controlling interest (10.01% at 31 December 2020; 9.72% at 31 December 2019) in Rosneft held assets in Russia including 621bcf (614bcf at 31 December 2020; 569bcf at 31 December 2019) held through bp’s interests in Russia other than Rosneft.
| | | | | | | | | | | | | | |
48 | | bp Annual Report and Form 20-F 2021 | | |
2021 summary
Rosneft became the only Russian and one of four global oil and gas companies announced as Global Compact LEAD in the area of sustainable development due to ongoing commitment to the United Nations Global Compact and its Ten Principles for responsible business.
Rosneft completed the sale of its 50% investment in the share capital of JSC Tomskneft, previously accounted for as an investment in joint operations in August, and 100% shares in subsidiaries, mainly engaged in participation in joint operations for gas production and transportation in Vietnam in September.
Also in September, Rosneft closed a deal on the sale of 5% stake in LLC Vostok Oil to a consortium of Vitol S.A. and Mercantile & Maritime Energy Pte. Ltd. for Euro 3.5 billion.
In November, Rosneft announced that the Yermak Neftegaz LLC joint venture (Rosneft 51%, bp 49%) discovered a material new gas condensate field in the Taymyr Peninsula.
In December, Rosneft’s Board of Directors approved a new Rosneft-2030 strategy, which incorporates an ambition to be net zero by 2050 for scope 1 and 2 operational emissions.
See Additional information for Rosneft on page 355 for more information on Rosneft.
bp to exit Rosneft shareholding
On 27 February 2022, bp announced it will exit its shareholding in Rosneft. bp’s two nominated Rosneft directors, bp chief executive officer Bernard Looney and former bp group chief executive Bob Dudley, both stepped down from Rosneft’s board on that date and have submitted letters of resignation.
As a result of bp’s nominated directors stepping down from Rosneft’s board, bp has determined that it no longer meets the criteria set out under International Financial Reporting Standards (IFRS) for having ‘significant influence’ over Rosneft. bp will therefore no longer equity account for its interest in Rosneft, treating it now as a financial asset measured at fair value. The change in accounting treatment also means that bp will no longer recognize a share in Rosneft’s net income, production and reserves.
bp will no longer report Rosneft as a separate segment from first quarter 2022 results.
| | | | | | | | | | | | | | |
| | bp Annual Report and Form 20-F 2021 | | 49 |
| | | | | |
| |
| |
| |
| Other businesses & corporate |
Other businesses & corporate comprises innovation & engineering, bp ventures, Launchpad, regions, cities & solutions; and our corporate activities & functions.
Financial and operating performance
| | | | | | | | | | | | | | |
| | $ million |
| | 2021 | 2020 | 2019 |
Sales and other operating revenuesa | | 1,724 | | 1,666 | | 1,418 | |
| Profit (loss) before interest and tax | | (2,777) | | (579) | | (1,848) | |
Inventory holding (gains) losses« | | — | | — | | — | |
| Replacement cost (RC) profit (loss) before interest and tax | | (2,777) | | (579) | | (1,848) | |
Net (favourable) adverse impact of adjusting items« | | 1,394 | | (303) | | 613 | |
Underlying RC profit (loss) before interest and tax« | | (1,383) | | (882) | | (1,235) | |
| Taxation on an underlying RC basis | | 294 | | 37 | | 130 | |
| Underlying RC profit (loss) before interest | | (1,089) | | (845) | | (1,105) | |
| Depreciation, depletion and amortization | | 813 | | 655 | | 547 | |
Capital expenditure« | | 397 | | 303 | | 308 | |
aIncludes sales to other segments.
Financial results
RC loss before interest and tax for 2021 included a net adverse impact of adjusting items of $1,394 million. This includes adverse fair value accounting effects of $849 million and $113 million restructuring costs. The 2020 result included a net favourable impact of adjusting items of $303 million, primarily reflecting favourable fair value accounting effects of $675 million and a gain on disposal, partly offset by Gulf of Mexico oil spill related costs of $255 million and $258 million restructuring costs. The 2019 result included a net adverse impact of adjusting items of $613 million including Gulf of Mexico oil spill related costs of $319 million.
After excluding adjusting items, the underlying RC loss before interest and tax for 2021 was $1,383 million. Compared with 2020, the underlying RC loss before interest and tax for 2021 included lower uplifts in valuation of ventures investments.
Strategic progress
In 2021, partnering with countries, cities and industries as they shape their own paths to net zero, we signed the following agreements:
•Memorandum of understanding (MoU) with Qantas on 15 January, to collaborate on opportunities to reduce carbon emissions in the aviation sector.
•MoU with CEMEX on 13 May, to explore solutions to help decarbonize the production and distribution of CEMEX’s products and develop lower carbon offers for CEMEX and bp customers worldwide.
•MoU with NYK Line on 24 August, to collaborate on future fuels and transportation solutions to help industrial sectors including shipping decarbonize.
Additionally:
•We formed a joint venture with Aberdeen City Council to build and operate Scotland’s first green hydrogen hub.
•We agreed with Infosys to co-develop and pilot an energy as a service solution, which will aim to help businesses improve the energy efficiency of infrastructure, and help meet their decarbonization goals, on 28 October.
bp also continued to invest in a portfolio of technology businesses, which we see as having the potential for high growth and to benefit and extend our core businesses, through bp ventures and Launchpad. Main investments in 2021:
•IoTecha, an electric vehicle (EV) charging firm which uses Internet of Things technology to connect EV charge points with the electricity grid, homes, and buildings, on 25 May.
•BluSmart, an all-electric ride hailing & EV charging start-up, India's first and largest integrated EV ride-hailing and charging service, on 24 September.
•Acquisition of Open Energi, an advanced software technology company that uses AI algorithms to optimize distributed commercial and industrial power assets at scale, on 28 June.
•Acquisition of Blue Print Power, a US-based company whose technology is focused on optimizing the power networks of buildings by connecting them to energy markets through cloud-based software, on 2 September.
During the first quarter 2021 bp divested its holding in Palantir for $443 million.
bp ventures portfolio company Lightning eMotors became a public listed company on the New York Stock Exchange on 7 May. Lightning eMotors designs and manufactures electric vehicles for commercial fleets, including school buses and ambulances, as well as offering charging technologies for commercial and government vehicles. bp, which has supported that company since 2014, owns approximately 30% of that company.
| | | | | | | | | | | | | | |
50 | | bp Annual Report and Form 20-F 2021 | | |

51 Strategic report bp Annual Report and Form 20-F 2021 See glossary on page 377 Sustainability Sustainability at bp Our frame focuses on three areas where we believe we can make the biggest difference – getting to net zero, improving people’s lives and caring for our planet – with aims and objectives linked to the UN Sustainable Development Goals. We report on our progress embedding and delivering our frame in our latest sustainability report. Read more at bp.com/sustainability Our focus area: Getting to net zero Sustainability is a critical foundation of our strategy. Our sustainability frame links our strategy to our purpose – reimagining energy for people and our planet. Our ambition is to be a net zero company by 2050 or sooner, and to help the world get to net zero. In 2021 we continued to make progress against the five aims to help bp get to net zero that we announced in February 2020. In February 2022 we announced that our strategic progress, combined with growing confidence in the business opportunities that the energy transition offers, has enabled us to update some of our net zero aims. We now aim to be net zero across operations, production and sales. a Cumulative reductions against the 2019 baseline on an absolute basis. b Previously 30-35%. c Cumulative impact on average emissions intensity of marketed energy products against the 2019 baseline d Cumulative reduction in the carbon intensity of the energy products we sell against the 2019 baseline. e Previously >15%. f Previously 50% cumulative reduction in the average emissions intensity of marketed energy products against the 2019 baseline. g The 2021 methane intensity is calculated using existing methodology and, while it reflects progress in reducing methane emissions, will not directly correlate with progress towards delivering the 2025 target under aim 4. h The 0.20% carbon intensity target is based on our new measurement approach, which we aim to have in place across the relevant operations by the end of 2023. The 50% reduction we are aiming for is against a new baseline which we plan to set based on that new measurement approach. i In 2021, capital expenditure against our aim 5 activities has increased from $750 million in 2020 to nearly $2.2 billion, the majority of which related to investments in offshore wind, electric vehicle charging infrastructure and solar. Reporting on sustainability We updated our sustainability materiality assessment process in 2021 to take into account our sustainability frame as well as external developments related to sustainability and environmental, social and governance (ESG) issues. For the purposes of this section we have covered material issues, along with additional non-financial information in the following areas: • For aim 1, which encompasses our Scope 1 and 2 emissions from our operations, we are accelerating our 2030 aim from 30-35% to 50%. • For aim 3, we are aiming to reduce to net zero the carbon intensity of the energy products we sell by 2050 or sooner. Previously we had been aiming for a reduction of 50% in their carbon intensity. This aim now includes physical trades of energy products as well as marketing sales. For 2030 we are now aiming for a 15-20% reduction in the lifecycle carbon intensity of these products. These changes are not yet reflected in our basis of reporting. For 2021 purposes we report using the prior year basis. Looking ahead, we plan to report progress against these updated aims. What we mean by net zero See glossary on page 378 for our definition of net zero. • Getting to net zero – below. • Climate-related financial disclosures – see pages 55. • Improving people’s lives – see page 67. • Caring for our planet – see page 68. • Foundations – values and code of conduct, safety, people, ethics and compliance, see page 69. Read more bp Sustainability Report 2021 Aim 2021 performance 2025 target 2030 aim 2050, or sooner, aim 1 Net zero operations 35%a 20%a 50%a,b Net zero 2 Net zero production 16%a 20%a 35-40%a Net zero 3 Net zero sales 0%c 5%d 15-20%d,e Net zerof 4 Reducing methane 0.07%g 0.20%h 50% reductionh 5 More $ for new energies $2.2bni $3-4bn ~$5bn

52 bp Annual Report and Form 20-F 2021 Sustainability continued Aim 1 is to be net zero across our entire operations on an absolute basis by 2050 or sooner. This aim relates to our Scope 1 (from running the assets within our operational control boundary) and Scope 2 (associated with producing the electricity, heating and cooling that is bought in to run those operations) GHG emissions on an operational control boundary. Our combined Scope 1 and Scope 2 emissions decreased by 35% against the 2019 baseline (54.4MtCO2e)a and by 22% compared to 2020 (45.5MtCO2e)a. This means that while we have exceeded our 2025 target, we have more work to do to achieve our overall net zero aim by reducing emissions while bringing new projects online. Scope 1 (direct) emissions, covered by aim 1, were 33.2MtCO2ea in 2021, a decrease of 20% from 41.7MtCO2ea in 2020. 32.0MtCO2ea of those emissions were from CO2 and 1.1MtCO2ea from methaneb. Scope 2 (indirect) emissions decreased by 1.4MtCO2ea, to 2.4MtCO2ea in 2021, a 37% reduction compared to 2020. bp equity share reporting We also report our Scope 1 and 2 emissions on an equity share basisc. In 2021, our combined Scope 1 and 2 equity share emissions decreased by around 14% to 39.1MtCO2e (2020 45.5MtCO2e). The reduction was associated with a number of factors such as divestments, including of our Alaska operations, sustainable emissions reductions (SERs) and turnarounds. Find more data at bp.com/ESGdata Aim 2 is to be net zero on an absolute basis across the carbon in our upstream oil and gas production by 2050 or sooner. This is our Scope 3 aim and, based on bp’s net share of productionc, excluding bp’s share of production in Rosneft. It is associated with the CO2 emissions from the assumed combustion of upstream production of crude oil, natural gas and natural gas liquids (NGLs). The estimated emissions from the carbon in our upstream oil and gas production were 304MtCO2ea in 2021, a reduction of approximately 7% from 328MtCO2ea in 2020, mainly associated with portfolio changes, including divestments and existing field decline. This is in line with our aim to reduce our oil and gas production and was partially offset by major project start-ups and new well deliveries. We are on track to meet our 2025 target of a 20% reduction against a 2019 baseline. Aim 3 is to reduce to net zero the carbon intensity of the energy products we sell by 2050 or sooner. This is a lifecycle carbon intensity approach, per unit of energy. This aim relates to the rate of GHG emissions estimated on a lifecycle basis from the use, production, and distribution of energy products per unit of energy (MJ) delivered. For the 2019 to 2021 reporting years, it covers marketing sales of energy productsd. As updated in February 2022, the scope of aim 3 for future reporting years is expanding to include physically traded energy products as well as marketed sales. In future, it may also cover certain other products, for example, those associated with land carbon projects. Compared to the 2019 baseline, the carbon intensity of bp’s marketing sales of energy productse remained flat. This is because of a lower share in sales of gas and power products from 2019 to 2021, caused by a number of factors including a reduction in demand over the period and an increase in refined products demand post- COVID-19. Average emissions intensity of marketed energy productsefg (gCO2e/MJ) 2021 2020 2019 Average emissions intensity of marketed energy products 79a 79a 79a Refined energy products 92 92 93 Gas products 72 71 71 Bio-products 27 28 29 Power products 38 43 44 Aim 4 is to install methane measurement at all our existing major oil and gas processing sites by 2023, publish the data, and then drive a 50% reduction in methane intensity of our operations. And we will work to influence our joint ventures to set their own methane intensity targets of 0.2%. In 2020 we set an intensity target of 0.20% by 2025, using a measurement approach. Our methane intensity in 2021 was 0.07%ah, down from 0.12%a in 2020. Methane emissions from upstream operations, used to calculate our intensity, decreased by 40% to around 43.0kt, from 71.6kt in 2020. Marketed gas volumes decreased by 1% from 3,075bcf in 2020 to 3,058bcf in 2021. Aim 5 is to increase the proportion of investment we make into our non-oil and gas businesses. Our investment increased from around $750 million in 2020 to nearly $2.2 billion, the majority of which related to activities in offshore wind, solar and electric vehicle charging infrastructure. Read more about aim 5 on page 33. Aim 6 is to more actively advocate for policies that support net zero, including carbon pricing. We have stopped corporate reputation advertising campaigns and this is enabling us to redirect resources to promote well-designed climate policies. We publish examples of our activity in support of aim 6 online. See bp.com/advocacyactivities Aim 7 is to incentivize our global workforce to deliver on our aims and mobilize them to become advocates for net zero. This will include continuing to allocate a percentage of remuneration linked to emissions reductions for leadership and around 22,000i employees. a Deloitte has provided independent limited assurance, in accordance with the International Standard for Assurance Engagements (ISAE) 3000 (Revised), on selected sustainability information (subject matter), for the financial year ended 31 December 2021. Their assurance statement will be made available in the bp sustainability report 2021 at bp.com/sustainability. b Excluding bp’s share of production in Rosneft. On 27 February 2022, following the military action in Ukraine, the bp board announced that bp intends to exit its 19.75% shareholding in Rosneft Oil Company (Rosneft). c Due to rounding some totals may not agree exactly to the sum of their component parts. d Please see the Basis of reporting for the list of energy products covered at bp.com/basisofreporting e The weighted average GHG emissions per unit of energy delivered (in grams CO2e/MJ), estimated in respect of marketing sales of energy products. GHG emissions are estimated on a lifecycle basis covering production, distribution and use of the relevant products (assuming full stoichiometric combustion of the product to CO2). f We now report carbon intensity for aim 3 to the nearest whole number in gCO2e/MJ. Following publication of the 2020 bp Annual Report and Form 20-F, bp sustainability report and ESG datasheet, we identified minor data reporting corrections and implemented methodological improvements which have impacted the previously reported aim 3 figures. Recognizing that amendments and methodological enhancements may continue to occur in the future, we believe that the rounding of aim 3 figures in this way provides a more reliable and consistent representation of our performance. Since this is the first year of reporting on this basis, our ESG datasheet on bp.com also includes carbon intensity on the prior basis of rounding to one decimal place. g The aggregate lifecycle emissions and energy values used in the calculation of the average emissions intensity of marketed energy products is provided in our ESG datasheet on bp.com h The 2021 methane intensity is calculated using existing methodology and, while it reflects progress in reducing methane emissions, will not directly correlate with progress towards delivering the 2025 target under aim 4. i This figure was approximately 37,000 in February 2020. It has been updated to reflect the number of employees eligible for a cash bonus in 2021.

53 Strategic report bp Annual Report and Form 20-F 2021 See glossary on page 377 Our annual bonus for all eligible employees, including the bp leadership team, has been linked to a sustainability measure since 2019. The bonus scorecard against which our employees are measured incentivizes our people based on three themes: safety and sustainability (30%), operational performance (20%) and financial performance (50%). This includes a measure related to sustainable emissions reductions. In 2022 our annual bonus scorecard will remain unchanged for employees and we will expand sustainability measures in the long-term incentive plan scorecard for group leaders, through two social measures; employee engagement and an improvement in ethnic representation. From 2022, over 40% of the performance-based share awards for our senior leaders will be related to low carbon actions and delivering our purpose of reimagining energy for people and our planet. See the Directors’ remuneration report on page 116 and Share ownership on page 72 for more detail. Aim 8 is to set new expectations for our relationships with trade associations around the globe. We will make the case for our views on climate change within the associations we belong to and we will be transparent where we differ. And where we can’t reach alignment, we will be prepared to leave. In 2021 we published an update on the progress made by five organizations that we had found to be only partially aligned in our 2020 inaugural report. We plan to publish a further review in 2022. See bp.com/tradeassociations Aim 9 is to be recognized as an industry leader for the transparency of our reporting. On 12 February 2020, we declared our support for the recommendations of the Task Force on Climate-related Financial Disclosures (TCFD). We intend to work constructively with the TCFD and others – such as the Sustainability Accounting Standards Board (SASB)a – to develop good practices and standards for transparency. a SASB is now part of the Value Reporting Foundation (VRF). In 2021 we published our reporting against the SASB exploration & production standard. We also resumed submission to the CDP (Climate Disclosure Project) climate questionnaire and received an A- score. Streamlined energy and carbon reporting (SECR) information Further information on our greenhouse gas (GHG) emissions, energy consumption and energy efficiency is set out here and on the following page and includes disclosures in respect of the SECR requirements. Further breakdown of our GHG and energy data is available in our ESG datasheet at bp.com/ESG. Operational controlab Unit 2021 2020 Scope 1 (direct) emissionsc MtCO2e 33.2 41.7 UK and offshorec MtCO2e 1.0 1.7 Global (excluding UK and offshore)c MtCO2e 32.1 40.0 Scope 2 (indirect) emissions – location-basedd MtCO2e 2.4 3.2 UK and offshore MtCO2e 0.03 0.05 Global (excluding UK and offshore) MtCO2e 2.37 3.13 Scope 2 (indirect) emissions – market-basedcd MtCO2e 2.4 3.8 UK and offshorec MtCO2e 0.03 0.04 Global (excluding UK and offshore)c MtCO2e 2.38 3.77 Energy consumptione GWh 128,805 180,004 UK and offshorec GWh 4,386 7,005 Global (excluding UK and offshore)c GWh 124,419 172,999 Ratio of Scope 1 (direct) and Scope 2 (indirect) emissions to gross productionf teCO2e/te 0.17 0.20 UK and offshore teCO2e/te 0.13 0.17 Global (excluding UK and offshore) teCO2e/te 0.17 0.20 a Operational control data comprises 100% of emissions from activities operated by bp, going beyond the IPIECA guidelines by including emissions from certain other activities such as contracted drilling activities. b Due to rounding some totals may not agree exactly to the sum of their component parts. c Deloitte has provided independent limited assurance, in accordance with the International Standard for Assurance Engagements (ISAE) 3000 (Revised), on selected sustainability information (subject matter), for the financial year ended 31 December 2021. Their assurance statement will be made available in the bp sustainability report 2021 at bp.com/sustainability. d Value rounded to one decimal place. e Energy content of flared or vented gas is excluded from energy consumption reported as although it reflects loss of energy resources, it does not reflect energy use required for production or manufacturing of products. f Gross production comprises upstream production, refining throughput and petrochemicals produced. In support of our aim to work constructively with the TCFD and others, our chief economist participated in work with the World Business Council for Sustainable Development (WBCSD), co-ordinated by the Energy Forum and supported by the TCFD, to develop a Scenario Reference Catalogue to assist with corporate scenario analysis. We have used the WBCSD scenarios to inform our own scenario analysis and hope that others also find it useful. For our expanded TCFD disclosures, see page 55 Aim 10 is to launch a new team to create integrated clean energy and mobility solutions. We launched our regions, cities and solutions team in 2020. It will help countries, cities and corporations around the world decarbonize. In 2021 we continued to work towards our aim of partnering with 10-15 cities globally over the next decade. We now have three city or region partnerships. See bp.com/rcs
54 bp Annual Report and Form 20-F 2021 Energy efficiency measures Since 2016 we have delivered 6.5MtCO2e of sustainable emissions reductions (SERs) across our operated sites. This is our key metric for tracking annual reductions in greenhouse gas (GHG) emissions from energy efficiency savings and direct GHG emissions. A total of 120 SERs were delivered in 2021 leading to reductions of 1.6MtCO2e. This follows SERs of 1.0MtCO2e in 2020, which included reduced fuel use for water injection pumps through energy efficiency optimization in the Azerbaijan Georgia Turkey (AGT) region, and our US onshore operations, bpx energy, driving operational efficiencies and substantively reducing our methane emissions profile. Energy efficiency projects delivered in 2021 include: • AGT region – waste heat recovery logic modification to ensure the reliable performance and constant use of hot oil heater with fuel gas consumption reduction. • bpx energy – multiple projects across bpx sites including electrification and removal of existing compressors reducing fuel use in the Permian basin. • bp shipping – reduced fuel consumption by introducing more frequent hull cleaning, which improves the efficiency of our ships. • Oman operations – the automation of gas turbine generators (power export optimization) through automating the manual set point and reducing exported power to a minimum. • Eastern Trough Area Project (ETAP) facility in the North Sea – reduced fuel consumption through delivering spinning reserve reduction by running just one gas turbine. Sustainability continued Streamlined energy and carbon reporting (SECR) information continued We take a portfolio-wide approach to assessing and prioritizing spinning reserve reduction opportunities. Spinning reserve involves running additional power generation machines to provide an excess of energy supply to protect production from plant vulnerabilities, including power generation reliability. Reducing spinning reserve can cause greater production exposure to power fluctuations. We use a risk-based appraisal of the benefit and impact of implementing reductions when considering reducing the number of running machines. This allows bp to realize the emissions and maintenance cost reductions from fewer running machines, while managing the associated production risk. In 2021, we increased the size of the central energy efficiency team focusing on upstream and downstream assets. This team champions and builds knowledge within the energy efficiency discipline at bp by establishing energy best practices, benchmarking, and working on operational excellence. In 2021, several energy best practices were updated, and a scorecard was assembled to track key energy metrics for refineries. The team is involved in several external groups working on energy efficiency including OGCI, IOGP, and Energy Star. bp runs an annual training course for new chemical engineers which includes energy efficiency and offers GHG & energy efficiency training for more experienced engineers and practitioners. Reporting methodology Our approach to reporting GHG emissions broadly follows the IPIECA/API/IOGP Petroleum Industry Guidelines for Reporting GHG Emissions. We calculate CO2 emissions based on the fuel consumption and fuel properties for major sources, such as flares. We report CO2 and methane. We do not include nitrous oxide, hydrofluorocarbons, perfluorocarbons and sulphur hexafluoride as they are not material to our operations and it is not practical to collect this data. Ratio of Scope 1 and Scope 2 emissions to gross production bp reports a ratio of Scope 1 and Scope 2 emissions to gross production, see SECR table on page 53. This covers all our emissions and uses gross operated sales from our operated oil and gas facilities, refinery throughput and petrochemicals produced. The denominator uses output from production businesses, refineries and petrochemical facilities, which account for 95% of total operated emissions. The intensity ratio has improved due to our aim 1 reductions, as described on page 52.

55 Strategic report bp Annual Report and Form 20-F 2021 See glossary on page 377 Climate-related financial disclosures We support the recommendations of the Task Force on Climate-related Financial Disclosures (TCFD), which was established by the Financial Stability Board to improve the reporting of climate-related risks and opportunities. Consistent with our aim 9 – to be a recognized industry leader in the transparency of reporting – we announced in 2020 that we would work constructively with the TCFD, and others, to develop good practices and standards for transparency. In 2021 we contributed to work requested by the TCFD of the World Business Council for Sustainable Development (WBCSD) to develop a ‘Climate Scenario Analysis Reference Approach for Companies in the Energy System’. This work, due to be published in March 2022, is intended to provide business-relevant approaches to climate scenario analysis that support and inform disclosures about strategic resilience. Read more about how we have used the WBCSD Scenario Catalogue to inform our own scenario analysis under Strategy Recommended Disclosurea, page 61. TCFD statement This year we are reporting in line with the FCA listing rule for premium listed companies LR 9.8.6(8)b, which requires us to report on a ‘comply or explain’ basis against the TCFD Recommendations and Recommended Disclosures in respect of the financial year ended 31 December 2021c. We consider our climate-related financial disclosures to be consistent with all of the TCFD Recommendations and Recommended Disclosures and are therefore compliant with the requirements of Listing Rule 9.8.6(8). We have set out our disclosures against each TCFD Recommended Disclosure and in doing so have covered both the Recommended Disclosure and the related Recommendationd. Where applicable, therefore, we have made disclosures that take into consideration references made to the materiality of information in the Recommendations related to Strategy and Metrics & Targets. Although this is our first year of disclosing in compliance with the listing rule, our disclosures build on previous years. In preparing them we have had to make several judgements, and while we are satisfied that they are consistent with the Recommendations and Recommended Disclosures, we will continue to evaluate our options for future TCFD disclosures. We plan to monitor TCFD guidance as it evolves and will consider opportunities to enhance our disclosures. We welcome feedback on our disclosures. Governance TCFD Recommendation: Disclose the organization’s governance around climate-related issues and opportunities. Recommended Disclosure: a. Describe the board’s oversight of climate-related risks and opportunities. The role of the board is to promote the long-term sustainable success of the company, generating value for our shareholders while having regard to the interests of our other stakeholders, the impact of our operations on the communities where we operate and the environment. In performing this role, the board sets and monitors bp’s strategy and is responsible for monitoring bp’s management and operations and obtaining assurance about the delivery of its strategy. Any changes to the company’s purpose, strategy and values are reserved for the board for approval in accordance with the board-approved corporate governance framework. The board considers that the strategy allows us to be flexible to adapt to market changes and scenarios to remain consistent with the Paris goals, see page 30. The board’s responsibilities extend to oversight of bp’s internal control and risk management a Describe the resilience of the organization’s strategy, taking into consideration different climate-related scenarios, including a 2°C or lower scenario. b https://www.handbook.fca.org.uk/instrument/2020/FCA_2020_75.pdf c In considering the consistency of our disclosures with the TCFD Recommendations and Recommended Disclosures we have had regard to, among other things, the documents referred to in LR 9.8.6B and 6C, as applicable to the financial year 2021. d In preparing the disclosures we have referred to the TCFD implementation guidance ‘Annex: Implementing the Recommendations of the Task Force on Climate-related Financial Disclosures (June 2017)’, available from fsb-tcfd.org/publication e We interpret the term ‘climate-related issues’ to relate primarily to those climate-related risks and opportunities for bp which are relevant to the delivery of long-term shareholder value in the context of the low carbon transition. frameworks, including with respect to bp’s climate-related risks and opportunities. This is set out in the terms of reference of the board, which are available online at bp.com/governance. The board and its committees, including the safety and sustainability, audit, people and governance and remuneration committees, have oversight of climate-related issuese, which include climate-related risks and opportunities. The role of the committees in respect of climate- related risks and opportunities is set out below. Climate-related risks and opportunities were discussed at every board meeting covering strategy, of which six were held in 2021. The board committees consider climate-related issues where they consider it appropriate to do so in the execution of their responsibilities. Oral reports from each of the committee chairs are included at the board meeting so that the board is kept appraised of relevant matters discussed in those committees including, where applicable, in respect of climate-related risks and opportunities. The board continues to develop its knowledge and expertise on climate-related matters. For example, in 2021, it received a paper prepared by the chief economist to update them on key indicators which are used to track the energy transition, some of the key issues associated with these, and other developments shaping the political and societal trends affecting the energy transition. They also received training on Scope 1, 2 and 3 emissions to assist with their oversight of bp’s net zero aims 1-3. The board also reviewed corporate reporting documents containing climate-related disclosures. Our company secretary’s office manages the process by which board and committee agendas are set and works closely with teams in bp to develop materials that assist the board to discharge its responsibilities, including in respect of climate-related issues where relevant.

56 bp Annual Report and Form 20-F 2021 The table below sets out some examples from the year ended 31 December 2021, where the board and its committees considered climate-related issues: Forum How climate-related matters have been considered The board Reviewing and guiding the strategy and considering the annual plan and strategy • Consulted shareholders in a review of its aims and strategy to navigate the energy transition and meet the Paris goals. It considered and approved our new people and planet aims including those related to the just transition and natural climate solutions. • Reviewed individual business group strategy and performance, which in turn informed the budget and planning process for 2022. This review extended to understanding the capital commitments that are contemplated and their consistency with our strategy and with the Paris goals. • In considering the plan and budget for 2022 the board also considered, among other matters, our emissions and methane targets and aims, strategic priorities and opportunities, including electrification, offshore wind and hydrogen, alongside the ‘energy transition key indicators and issues’ paper from the chief economist. Risk Management • Approved revisions to the governance framework to give more clarity, to the extent considered appropriate, of how the board, committee and CEO’s roles relate to the management of climate change risk and opportunities. • The board receives yearly updates on Risk Management and, since July 2021, has received an update on emerging risk at each board meeting that includes transition risk. For further detail on the board’s role regarding risk oversight, see page 74. Monitoring implementation and performance • Monitored management’s progress in the execution of bp’s strategy, with updates from the CEO and CFO at board meetings covering, among other matters, performance against bp aims 1-3 and a sustainability and ESG update. • Reviewed the effectiveness of investment, including the emissions intensity of the project portfolio. Capital expenditure, acquisitions and divestments • At every board meeting the CEO provides an update on business development. This update covers projects across bp (which may include opportunities in the low carbon space, M&A opportunities and divestment options) which either involve investment or proceeds of more than $100 million or would represent a strategic business entry. The CFO provides a verbal update and where appropriate specific climate-related considerations are drawn out. • The board reviews and approves transition and low carbon investments above $1 billion and in 2021 considered bp’s bids alongside partner EnBW for leases in the UK’s offshore wind leasing round in the Irish Sea and the ScotWind bid in the North Sea, see page 33. Audit committee Read more on page 107 Risk Management • Evaluated the approach to governance of risk and recommended to the board for approval the allocation of the principal risks across the board and committees (including climate change and the transition to a lower carbon economy and process safety, personal safety and environmental risks). • Considered bp’s control and assurance framework in respect of bp’s ESG reporting and climate-related metrics. • Conducted its annual review of energy price assumptions covering the period 2022-2050 and challenged those assumptions for, among other matters, their consistency with the goals of the Paris Agreement compared to a broad spectrum of external Paris-consistent scenarios. Safety and sustainability committee Read more on page 114 Monitoring implementation and performance • Conducted a review of aims 1 and 4. The committee also received a summary of an executive outreach programme on the sustainability aims and considered the sustainability assurance findings. • Reviewed an update on the near-term and long-term reduction of emissions in the Permian including lower emission technologies and looked at GHG and methane measurements during its virtual site visit of Angola. • Received updates on the implementation of our sustainability frame (which includes our net zero ambition and aims) via reports from the EVP strategy, sustainability & ventures. Remuneration committee Read more on page 116 Performance objectives • Discussed and agreed the climate measures in the annual scorecards, for example the weighting for sustainable emissions reductions, required for bonus awards and the long-term incentive plans to align with bp’s purpose, strategy, values, culture and long-term sustainable success. People and governance committee Read more on page 104 Performance objectives • Reviewed people capability plans analyzing the skills and experience required for bp to deliver its strategy and net zero ambition including the skills requirements and programmes to develop capability and acquire knowledge across new businesses including offshore wind, hydrogen and electrification. Sustainability continued
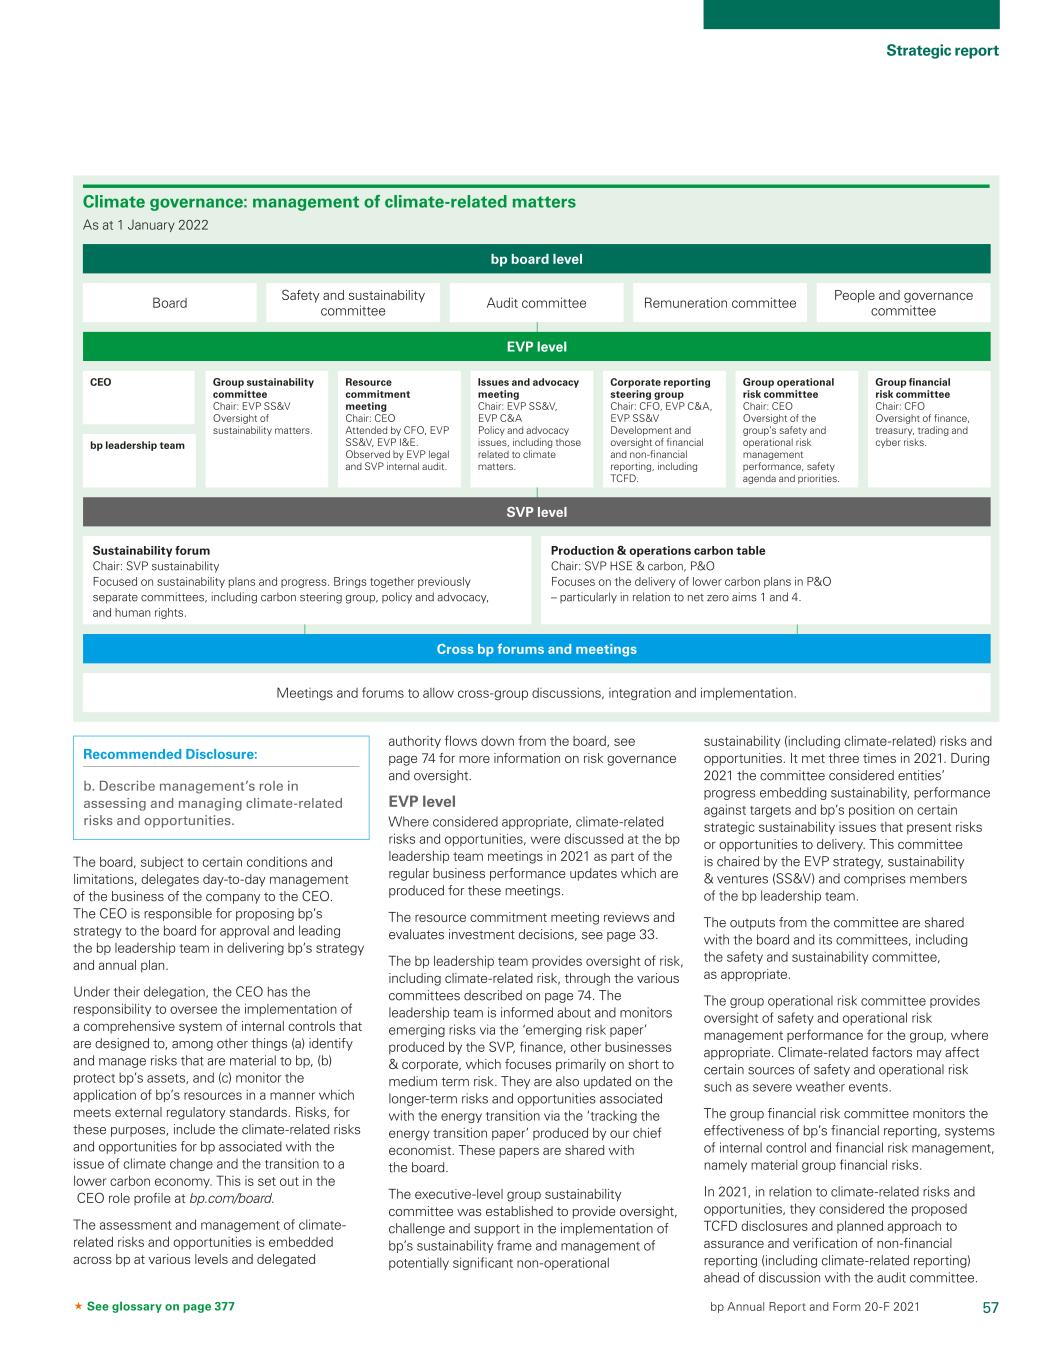
57 Strategic report bp Annual Report and Form 20-F 2021 See glossary on page 377 authority flows down from the board, see page 74 for more information on risk governance and oversight. EVP level Where considered appropriate, climate-related risks and opportunities, were discussed at the bp leadership team meetings in 2021 as part of the regular business performance updates which are produced for these meetings. The resource commitment meeting reviews and evaluates investment decisions, see page 33. The bp leadership team provides oversight of risk, including climate-related risk, through the various committees described on page 74. The leadership team is informed about and monitors emerging risks via the ‘emerging risk paper’ produced by the SVP, finance, other businesses & corporate, which focuses primarily on short to medium term risk. They are also updated on the longer-term risks and opportunities associated with the energy transition via the ‘tracking the energy transition paper’ produced by our chief economist. These papers are shared with the board. The executive-level group sustainability committee was established to provide oversight, challenge and support in the implementation of bp’s sustainability frame and management of potentially significant non-operational sustainability (including climate-related) risks and opportunities. It met three times in 2021. During 2021 the committee considered entities’ progress embedding sustainability, performance against targets and bp’s position on certain strategic sustainability issues that present risks or opportunities to delivery. This committee is chaired by the EVP strategy, sustainability & ventures (SS&V) and comprises members of the bp leadership team. The outputs from the committee are shared with the board and its committees, including the safety and sustainability committee, as appropriate. The group operational risk committee provides oversight of safety and operational risk management performance for the group, where appropriate. Climate-related factors may affect certain sources of safety and operational risk such as severe weather events. The group financial risk committee monitors the effectiveness of bp’s financial reporting, systems of internal control and financial risk management, namely material group financial risks. In 2021, in relation to climate-related risks and opportunities, they considered the proposed TCFD disclosures and planned approach to assurance and verification of non-financial reporting (including climate-related reporting) ahead of discussion with the audit committee. Climate governance: management of climate-related matters As at 1 January 2022 Board CEO bp leadership team Group financial risk committee Chair: CFO Oversight of finance, treasury, trading and cyber risks. Group sustainability committee Chair: EVP SS&V Oversight of sustainability matters. Issues and advocacy meeting Chair: EVP SS&V, EVP C&A Policy and advocacy issues, including those related to climate matters. Resource commitment meeting Chair: CEO Attended by CFO, EVP SS&V, EVP I&E. Observed by EVP legal and SVP internal audit. Corporate reporting steering group Chair: CFO, EVP C&A, EVP SS&V Development and oversight of financial and non-financial reporting, including TCFD. Group operational risk committee Chair: CEO Oversight of the group’s safety and operational risk management performance, safety agenda and priorities. Safety and sustainability committee Audit committee Remuneration committee People and governance committee bp board level EVP level Sustainability forum Chair: SVP sustainability Focused on sustainability plans and progress. Brings together previously separate committees, including carbon steering group, policy and advocacy, and human rights. Production & operations carbon table Chair: SVP HSE & carbon, P&O Focuses on the delivery of lower carbon plans in P&O – particularly in relation to net zero aims 1 and 4. Meetings and forums to allow cross-group discussions, integration and implementation. SVP level Cross bp forums and meetings Recommended Disclosure: b. Describe management’s role in assessing and managing climate-related risks and opportunities. The board, subject to certain conditions and limitations, delegates day-to-day management of the business of the company to the CEO. The CEO is responsible for proposing bp’s strategy to the board for approval and leading the bp leadership team in delivering bp’s strategy and annual plan. Under their delegation, the CEO has the responsibility to oversee the implementation of a comprehensive system of internal controls that are designed to, among other things (a) identify and manage risks that are material to bp, (b) protect bp’s assets, and (c) monitor the application of bp’s resources in a manner which meets external regulatory standards. Risks, for these purposes, include the climate-related risks and opportunities for bp associated with the issue of climate change and the transition to a lower carbon economy. This is set out in the CEO role profile at bp.com/board. The assessment and management of climate- related risks and opportunities is embedded across bp at various levels and delegated

58 bp Annual Report and Form 20-F 2021 For more on how the relative significance of identified risks are evaluated, see Risk Management on page 65. Climate-related transition risks and opportunities At a group level, we have identified three broad, material climate-related transition risks, which are underpinned by underlying risks that are managed through the risk process outlined on page 65. These transition risks may cut across our short, medium and long-term time horizons, however we indicate below wherever there is a particular time horizon in which the risk has been considered. The transition risks are also global in nature, so we do not discuss specific geographies here, but the underlying risks refer to specific geographies where appropriatea. We also recognize significant potential for upside – or opportunity – associated with some of these risks. These are discussed under each risk and in respect of Recommended Disclosure (b) below we also describe the potential impacts of both the risks and opportunities to bp. #1 The value of our hydrocarbon business could be impacted by climate change and the energy transition. Changes in policy, legislation, consumer preferences or markets as a result of growing concerns about climate change and the energy transition could reduce demand for fossil fuels or lower their price relative to our financial planning assumptions, particularly in the medium to long term, negatively impacting returns from or the value of our hydrocarbon businesses. Alternatively, prices for oil and natural gas and refined products during the next decade could remain higher than our financial planning assumptions under certain transition pathways, including those that are aligned with 1.5°C. The energy transition could impact the demand for commodities such as oil, natural gas and refined products and their future prices relative to our financial planning assumptions, which in turn may affect the returns from our hydrocarbon businesses. Changes in regulations, including carbon pricing and fossil fuel policies, could also impact compliance and operating costs in our oil and natural gas production and refining businesses. If oil, natural gas and refined product prices are higher than our financial planning assumptions, this could strengthen returns from our hydrocarbon businesses (including securing higher proceeds from assets we choose to divest) which may enable us to deliver enhanced shareholder value, further strengthen our balance sheet and invest more in the transition, in line with our financial frame. Demand for oil, natural gas and/or refined products could also remain higher for longer, which could support stronger and more sustained refining and trading margins – particularly as we focus our oil, natural gas and refining portfolios as part of our strategy (see page 12). We intend to reduce our hydrocarbon production over time. #2 Our ability to grow or deliver expected returns from our transition growth businesses could be impacted by the energy transition. Factors including a lack of, or insufficient development and application of, policies, regulations and frameworks that support low carbon businesses; insufficient consumer demand for our low carbon offering; strong competition in the market; or the insufficiently rapid development of supporting technologies and supply chains for low carbon energies could restrict growth of, or returns from, our transition businesses. This could particularly impact bp in the short to medium term as we seek to grow our low carbon businesses but could also represent a longer-term risk. Alternatively, demand, policy support or enabling technology for renewables could support a more rapid portfolio shift with expansion of our low carbon businesses and higher returns from them. Some low carbon businesses, including renewable power, bioenergy and emerging technologies such as hydrogen and carbon capture and storage (CCS), rely on policy support to promote growth. Our aim 6 is to more actively advocate for policies that support net zero, including carbon pricing (see page 52). Changes in customer preferences, pace of technology development and costs could also impact the markets for low carbon products and services. For example, the pace of adoption of electric vehicles (EV) could impact utilization rates, and consequently returns, from our EV charging networks – this is an area we are seeing an acceleration in growth in some regions, and hence are stepping up our strategic plans (see page 16). We recognize that the pace of our transition relative to our core low carbon target sectors and regions is important. If we move more slowly than those markets, we may miss investment opportunities and customers may prefer different suppliers with potential negative consequences both to demand for our products and our reputation. If we move faster than these markets, we risk investing in technologies or low carbon products that are unsuccessful because there is insufficient demand for them – but our investment may also help to stimulate demand and provide us with a leading position in growth markets. SVP level and beyond The bp leadership team is supported by bp’s senior-level leadership and their respective teams, with dedicated business and functional expertise focused on climate-related risks and opportunities or on matters which may be affected by such risks and opportunities, including health, safety, environment and carbon; risk; strategy and sustainability (which includes our carbon ambition, policy and economics teams). Alignment between group, business and functional leaders is fostered through other meetings, for example, the C&P Sustainability Management Forum or the TCFD working group which leads the preparation of bp’s TCFD disclosures. Strategy TCFD Recommendation: Disclose the actual and potential impacts of climate-related risks and opportunities on the organization’s business, strategy and financial planning where such information is material. Recommended Disclosure: a. Describe the climate-related risk and opportunities that the organization has identified over the short, medium, and long term. In setting and monitoring delivery of bp’s strategy, the board and leadership team consider climate-related risks and opportunities across three time horizons: • Short term (to 2025): the next four years are defined by business and financial plans that are performance managed in order to deliver our 2025 targets. • Medium term (to 2030): looking out to the end of this decade enables us to think beyond our short-term targets and adjust course if appropriate. • Long term (to 2050): we use scenarios to help us explore the wide range of uncertainty surrounding the energy transition over the next 30 years. For more detail on our approach, see page 11. TCFD categorizes climate-related transition risk and opportunity as follows: policy and legal, market, reputation and technology. It also refers to climate-related acute and chronic physical risks and opportunities. Risks in each of these categories have been identified using a risk management process that our businesses, integrators and enablers are required to follow. a Underlying risks are specific, for example, local or business-specific risks identified by specific bp entities through the risk processes described below under Risk Management. Sustainability continued

59 Strategic report bp Annual Report and Form 20-F 2021 See glossary on page 377 #3 Our ability to implement our strategy could be impacted by evolving attitudes towards the energy sector, climate change and the energy transition. If bp, or the energy sector more broadly, is perceived negatively by stakeholders, this could have a number of consequences, for example: adverse litigation; reputational impacts, including our ability to attract and retain talent; and shareholder action. These consequences could occur in the short, medium or long term. Alternatively, increased support from our stakeholders could enable access to additional capital and new investors, strengthening our ability to deliver our strategy and enabling faster growth of our low carbon businesses. We see signs that the energy transition is accelerating, and along with the strategic progress we are already making, this gives us growing confidence in the opportunities of the energy transition, allowing us to accelerate our net zero ambition and aims, see page 51. Perceived inconsistencies between our business and the pace of our transition with policy and societal trends could have reputational and commercial impacts that impair our ability to deliver our strategy – but we also see potential for bp to be positively differentiated as a result of delivering against our strategy, ambition and aims. Climate-related physical risks In addition to transition risks, we have also identified potential climate-related physical risks. These primarily relate to severe weather and often represent potential for increased drivers for safety and operational risks to our operations, particularly process safety, personal safety, and environmental risks, see Risk factors page 76. In relation to our offshore facilities, climate change could create greater uncertainty around severe weather events, such as extreme waves, particularly in the medium to long term, which in turn could affect the future risk profile of an asset over its lifetime. We also recognize that we could face other forms of physical climate-related risk over the longer term, for example associated with sea level rise, extreme temperatures and flooding, which could impact our operations. Given the primarily operational, and locally specific, nature of the identified physical risks, they are not grouped in the same way as transition risks. Water resources are increasingly under pressure from various factors, including, climate change and those pose a potential risk to some of our operations that depend on the availability of freshwater. Based on analysis using the World Resources Institute (WRI) Aqueduct Global Water Risk Atlas, four of our 17 major operating sites were located in regions with medium to extremely high water stress in 2021. See page 68 for more information on steps we are taking to improve water efficiency. In common with other businesses around the world, in the longer term we could face adverse market conditions associated with large-scale cumulative impacts of physical climate change if global mitigation and adaptation efforts are insufficient or unsuccessful. The bp Energy Outlook 2022 used estimates that drew on available economic literature to explore the potential impact of climate change on GDP over the next 30 years. It assumed that in all scenarios, GDP is lower than in a hypothetical world where greenhouse gas concentrations do not rise any further. However, the analysis highlighted that estimating the potential size of these impacts is highly uncertain. We support the goals of the Paris Agreement and believe that the best mitigation against these types of physical risk is to seek to contribute along with others, to the success of global climate mitigation efforts. Our strategy seeks to position us to make such a positive contribution. We do not currently foresee any material opportunities arising from changes in the physical environment as a result of climate change. However, the actions we are taking to make our operations more resilient, for example through improving efficiency of our freshwater use, may also bring about benefits such as reduced costs. Recommended Disclosure: b. Describe the impact of climate-related risks and opportunities on the organization’s businesses, strategy, and financial planning. Our strategy to evolve from being an international oil company focused on producing resources to an integrated energy company focused on delivering solutions for customers, including our net zero ambition and aims (see page 51), has been informed by, among other inputs, the climate-related risks and opportunities associated with the energy transition described above; the same is true of our financial and business processes. We describe how we use scenarios to inform our strategy on page 11. The opportunities presented by the energy transition have enabled us to go further with our net zero aims. In February 2022 we announced that we are now aiming to be net zero across operations, production and sales by 2050 or sooner. We believe our ambition is both good business and supports society’s drive towards the Paris goals. • Resilient hydrocarbons: recognizing the risks that the energy transition could present to our hydrocarbons business, we are focusing our upstream portfolio to be smaller and more price resilient. In support of this, we are also working to manage down both our costs and the operational GHG emissions associated with bp’s hydrocarbon operations. In 2020 we raised the investment thresholds for new oil and natural gas projects (see page 32) to help our portfolio generate sustainable cash flows even in a lower price environment. We also adjusted our long-term oil and natural gas price assumptions downwards, and consequently recognized material impairment charges and exploration write-offs, totalling around $23 billion. In 2021 net impairment reversals of around $1 billion were recognized, see Financial statements – Note 3 and Note 7 for more information. As a result of future investments and divestments, and the natural depletion of fields, we expect our net production of oil, natural gas and natural gas liquids in 2030 to be around 1.5 million barrels of oil equivalent per day, or 40%, lower than in 2019 (see page 16), and the Scope 1 and 2 emissions from our operations (the majority of which are associated with the operating assets in our hydrocarbons portfolio) to be 50% lower in 2030 than in 2019. We see cash flow from our hydrocarbon businesses, as well as proceeds from divestments, as helping to fund our investment into transition growth businesses as well as delivering shareholder value and maintaining a strong balance sheet. The energy transition may also impact demand for certain refined products in the future, which could reduce prices for these products leading to lower refinery margins and forcing less efficient refineries to be retired. Consequently, we are improving and high-grading our refining business – through conversion, consolidation of less advantaged units, or divestments – to provide resilience in a lower margin environment, while simultaneously transforming parts of our portfolio into low carbon fuel production hubs. As a result, we are aiming for our oil refining throughput to fall from 1.7 million barrels a day (mmb/d) in 2019 to around 1.2mmb/d by 2030, and for biofuels production to triple over the same period. We also aim to increase production of biogas 20-fold by 2030 through leveraging our existing position as the largest US biogas supplier to the road transportation sector and expansion in Europe. Accounting judgements and estimates made in assessing the impact of climate change and the transition to a lower carbon economy on our hydrocarbon assets, including consideration of potential impacts over the expected useful lives of upstream oil and gas and refining assets, are described further in Financial statements – Note 1.

60 bp Annual Report and Form 20-F 2021 • Convenience & mobility: recognizing the growing opportunities in low carbon mobility that the energy transition offers, we are accelerating our EV charging rollout and aim to have >100,000 charge points installed by 2030 and are further expanding our Castrol business into the EV market. We see these and other businesses being supported by our focus on ‘on-the-go’ charging and end-to-end integrated fleet offer. As the aviation industry also transitions, we are aiming to be a sector leader in sustainable aviation fuel (SAF), with a 20% share of supply by 2030. We recognize the risk of a decline in demand for conventional vehicle fuels and products due to the energy transition and we are working to increase the efficiency and resiliency of our existing fuels and lubricants businesses through operating cost reductions and margin optimization. We are also leveraging digital solutions to deepen our customer-centricity and expand our customer and loyalty engagement platforms. Integration of the customer-facing aspects of our strategy with our production of biofuels, hydrogen, liquefied natural gas (LNG) and electricity also helps to provide security of supply and access to higher margins in a potentially supply-constrained faster transition. • Low carbon energy: recognizing the opportunity to scale up our low carbon businesses over the next decade to meet growing demand and regulatory requirements, we aim to grow our renewables businesses and seek early positions in hydrogen and carbon capture and storage (CCS). In renewable power, we aim to build a leadership position in offshore wind and accelerate our solar growth through Lightsource bp and bp’s US solar pipeline. We seek levered returns of 8 to 10% for renewable power investments (see Financial frame, page 20). In hydrogen, we aim to leverage bp’s existing refinery demand to build regional supply positions. As hydrogen markets develop, we aim to create a portfolio of globally advantaged supply hubs, and we are aiming to capture a 10% share of core markets. Increasingly, we will work to integrate CCS capability with our blue hydrogen and hydrocarbon projects. To help maintain resilience to the possibility of a slower transition, we continue to consider whether the necessary regulatory support is in place and seek to secure a customer- backed route to market for a reasonable share of energy produced by our renewable power and hydrogen projects prior to final investment. Impact on technology We are investing in technology that can help to generate value for bp and also help to accelerate the transition through focused scale-up and innovation. Over time, we expect bp’s research and development spend to be increasingly oriented towards technologies with the potential for reducing carbon emissions and enabling our new low carbon businesses. See page 50 for examples of our technology investments in 2021. Recognizing the potential for disruptive technologies to impact our strategy, our bp ventures and Launchpad portfolios include investments in emerging technologies and business models that may help enable the transition to a low carbon economy. By investing in both our existing portfolio and new companies we can respond to both short-term and longer- term technology trends. Physical risk The potential impacts of the physical risks we have identified could include reduced production or throughput, supply chain disruption, damage to facilities, or in a most extreme case loss of life or an asset. Due to the uncertainty associated with the impact of climate change on severe weather events in the future, it is difficult to quantify the potential impacts associated with any increase in these risks as a result of climate change. However, where appropriate, depending on both the location and academic consensus on the ability of climate models to adequately represent future trends in the parameter of interest, we seek to take this uncertainty resulting from climate-related physical risk into account in our approach to design criteria for existing assets and new major projects. We have updated our metocean design criteria, where appropriate, to include consideration of additional models including climate and synthetic models and both forward-looking and historic models in an attempt to mitigate both model and extrapolation uncertainty. The particular models chosen will depend in part on geographic location. See Risk Management, page 65, for how we manage these uncertainties. We are taking steps to improve the resilience of our operations to the physical changes that might occur as a result of climate change – including changes in the frequency or severity of extreme weather events, and the potential for increased water scarcity, as described above. We have undertaken screening of present-day and future potential physical risk exposure for selected key assets and identified those sites with potential for heightened exposure to physical risks in order to prioritize these for further site-based assessment. As part of this prioritized approach, in 2021 we began a detailed site-based study at our Whiting refinery in the US, where projected climate change may increase the frequency or severity of extreme heat, precipitation and storm surge events. Recognizing the potential impact of climate change on water resources, we are taking steps to be more efficient in operational freshwater use and effluent management. Our aim 17 is becoming water positive by 2035, see page 68. Impacts on our financial planning Capital allocation: We plan to allocate sufficient capital to advance our energy transition strategy – both to mitigate the risks and capture the opportunities we have identified. This includes continuing to invest in resilient hydrocarbons while seeking to maximize value and scaling-up investment in our transition growth engines: bioenergy, convenience, EV charging, renewables and hydrogen, see page 16. Over time, as investment goes up in our transition growth businesses, we see it going down in oil and natural gas. Investment into our transition growth businesses described on page 16 is expected to represent over 40% of total capital expenditure by 2025, rising to around 50% by 2030. We expect that the capital employeda in those businesses will rise from over 20% in 2025 to around 40% by 2030. Access to capital: Concerns about the energy transition could reduce the appetite of banks or debt investors to finance hydrocarbon activity. We do not anticipate any material change to funding in the short to medium term, and our financial frame includes working to reduce net debt and maintaining a strong investment grade credit rating. In 2021 we reduced our net debt by over $8 billion. Since the end of 2019 we have repurchased around $15 billion of short-dated existing bonds and issued over $11 billion of new bonds with a duration of 20 years or longer, more than doubling the duration of our debt book to over nine years. Additionally we have continued to have good access to the commercial paper markets. Subject to maintaining an investment grade credit rating, we plan to allocate 40% of surplus cash flow to further strengthen the balance sheet in 2022. Investment criteria: all investments are evaluated against our long-term price assumptions which we consider to be broadly in line with a range of transition paths consistent with the Paris goals, see page 32. In addition, all investment cases above defined thresholds for anticipated annual greenhouse gas (GHG) emissions from operations include an associated carbon price into the investment economics, including $100/teCO2 in 2030 (2020 $ real). a Excludes goodwill and cash and cash equivalents. Sustainability continued

61 Strategic report bp Annual Report and Form 20-F 2021 See glossary on page 377 Recommended Disclosure: c. Describe the resilience of the organization’s strategy, taking into consideration different climate-related scenarios, including a 2°C or lower scenario Our strategy is designed to be resilient to a range of climate-related scenarios including those consistent with well-below 2°C and 1.5°C outcomes (see page 30). This year we used a scenario-based approach to test this resilience (see box – Scenarios and risks). We see this approach as having the potential to inform our strategy in the future. For the purposes of our analysis we evaluated the potential financial impact that could occur on the majority of our businesses under business-as- usual (BAU), well-below 2°C and 1.5°C outcomes, based on the WBCSD Scenario Catalogue described on page 55, and assessed the possible impact on our 2030 group adjusted EBITDA in order to assess relative materiality of exposure. We then focused our resilience test on the most material downside scenario (lowest oil price) and assessed our resilience (as defined below) for the period from 2023 to 2030. We based these analyses on our reference group business outlook (see box: Our approach to testing resilience to transition risk, page 63) that aligns to our strategic aims and lies within the adjusted EBITDA range disclosed at our 4Q results and update on strategic progress on 8 February 2022. A core assumption of the analysis was necessarily that, aside from any implications of the external scenarios being used for the analysis, bp would deliver the assumed underlying strategic and planned financial outcomes for each in-scope business area out to 2030. We have not sought to mitigate the impact of the scenarios tested, for example through cost management or strategic adjustments, for the purpose of this assessment, but reflect that these remain potential future levers if required. In order to undertake this exercise, we needed to identify criteria which could be modelled as proxies for strategic resilience, and we chose to do this through three lenses – our ability to continue to (i) deliver shareholder value, (ii) maintain a strong balance sheet and (iii) invest in the energy transition (see box: Our approach to testing resilience to transition risk, page 63). This was not intended to represent a ‘definition’ of resilience beyond the purposes of this exercise. Scenarios and risks As described on page 11, given the inherent uncertainty in the pace and direction of the energy transition, scenarios can play a useful role in describing a wide range of external economic, market, policy, technological and societal conditions in which our strategy might be executed, and the outcomes we might see as a result. These outcomes can help test a judgement about the financial resilience of our strategy to the uncertainty surrounding the transition. Such scenarios do not and cannot represent all possible futures, however we value them as a simplified and schematic way to consider the potential implications of, and uncertainty inherent within, a range of possible energy transition pathways to a future bp portfolio mix. For the scenario analysis exercise described here, we used the WBCSD Scenario Catalogue, see the table on page 64. We used all of the scenarios contained in a pre-publication version of the catalogue for our work.a Recognizing the inherent uncertainty in the transition, our analysis did not consider the likelihood of any specific scenario, rather took the full range of possible outcomes for specific transition variables from the WBCSD Scenario Catalogue. The analysis we undertook is directly applicable to transition risks #1 and #2 – as well as their associated opportunities –as these lend themselves to a financially quantified scenario-based analysis. The scenario analysis did not directly address transition risk #3 – however, we believe that some of the potential drivers for transition risk #3, namely policy and societal trends, may be implicit in these scenarios, and we believe that the successful execution of our strategy will, over time, help to mitigate this risk to bp as well as positioning us to take advantage of the potential associated opportunities. This scenario analysis exercise also does not specifically address climate-related physical risk, our strategic resilience to which is further discussed below. Key insights from our scenario analysis and resilience test • There is significant uncertainty in the pace and nature of the transition to 2030. Across, and often within, each WBCSD Scenario Catalogue family (BAU, well-below 2°C and 1.5°C), the range of some of the variables selected for the scenario analysis is significant, reflecting the complexity and interdependencies of the energy transition, as shown in the table on page 64. Generally, we observed that the faster the pace of transition, the greater the uncertainty in the exact shape of the resulting energy system in 2030. As an example, while the minimum 2030 oil price in the WBCSD Scenario Catalogue 1.5°C family is lower than in the well-below 2°C or BAU families, a wide range of prices are observed and the majority of the oil prices in both the 1.5°C and the well-below 2°C scenario families of oil prices are higher than our long-term planning price of $60/bbl (2020 $ real) – see chart below. As explained above, while our resilience test was conducted against the most extreme low case oil price across all of these scenarios, it is observed that although some scenarios could result in a downside financial pressure, other scenarios, including several oil price scenarios consistent with a 1.5°C outcome, could offer financial upside relative to our reference group business outlook. Recognizing this complexity, we are cautious about placing too much weight on any one scenario or set of assumptions. WBCSD Scenario Catalogue oil prices in 2030 1.5°C BAUWell-below 2°C 100 90 80 70 60 50 40 30 20 10 0 $/ bb l ( 20 19 $ re al ) bp investment appraisal assumption ($60/bbl 2020 $ real) • Despite planning to grow the capital employed in the energy transition, we expect oil price to remain our primary climate-related uncertainty through 2030. Oil price is likely to remain the main source of climate-related transition uncertainty for our strategy through to 2030, reflecting both the wide range of outcomes and the share of our expected total adjusted EBITDA over this period, that oil-price-linked businesses represent – note that for the purposes of our scenario analysis and resilience test, we have assessed the impact of oil price across both our oil production businesses and those natural gas businesses for which commercial outcomes are linked to oil price. All of the oil prices in the WBCSD Scenario Catalogue BAU family offer upside opportunity in terms of group adjusted EBITDA, versus our a We used a catalogue dated 2022-01-21 for our analysis, which did not include the Bloomberg NEF New Energy Outlook 2021 and IEA World Energy Outlook 2021 Stated Policies Scenario (STEPS) scenarios which will be included in the first release of the WBCSD Scenario Catalogue due to be published in March 2022.
62 bp Annual Report and Form 20-F 2021 2030 reference case (see the chart on page 61 and box: Our approach to testing resilience to transition risk on page 63 for the range of 2030 oil prices in the WBCSD Scenario Catalogue). In the 1.5°C family, the potential downside suggested by the lowest oil prices is around 26% of group adjusted EBITDA. However, oil price in several of the 1.5°C scenarios could offer a financial upside relative to our reference group business outlook. In comparison, the potential scale of impact to our remaining natural gas and refining and fossil fuel retail businesses, based on the WBCSD Scenario Catalogue ranges, is smaller (<5% maximum exposure to 2030 expected group adjusted EBITDA across the BAU and 1.5°C scenarios). While we aim to significantly grow capital employed and adjusted EBITDA in our transition businesses over this period, the transition-related uncertainty to any particular business as a proportion of the group adjusted EBITDA in 2030 remains small (<3% for each business area). Our diversified portfolio helps mitigate exposure risk to any one sector. • As a direct result of our strategy, we expect to be less exposed to low oil price in 2030 than we are today. Our strategy to grow our transition growth businesses, together with our aim to reduce net upstream oil and gas production by 40% by 2030 through active portfolio management (see page 16), is expected to reduce our exposure to oil price over the decade. Though the relationship is complex, in a sustained low oil price scenario, we could see some natural offsetting of the resulting decline in revenues from hydrocarbons from faster growth or higher margins from our growth engines by 2030. • Our analysis supports our view that our strategy is resilient to a range of climate- related oil price scenarios including those consistent with well-below 2°C and 1.5°C outcomes.a Having identified that oil price associated with the most extreme cases of the family of 1.5°C scenarios was the only variable with the potential to have financial impacts of sufficient materiality to potentially impact the resilience of our strategy, we then considered the resilience of our strategy to this potential downside. While the results of any such analysis must be treated with caution – each is necessarily dependent on numerous assumptions and methodological choices, and each has its own limitations – overall, this analysis and resilience test reinforced our confidence in the resilience of our strategy to a wide range of oil price scenarios throughout this decade, including in scenarios consistent with limiting temperature rise to 1.5°C. Even with the most extreme low oil price environment (as defined above) in any of the scenarios, sustained over the eight years from 2023-2030, in our analysis bp was found to be able to deliver shareholder value, maintain a strong balance sheet and invest in the energy transition, as defined below. In a BAU scenario, we believe our transitioning strategy mitigates against the risk of a delayed and disorderly transition which might follow. Should the growth of any one of our in-scope transition business areas be challenged by the downside range in the relevant variable, our analysis suggests that the impact of this on group adjusted EBITDA in 2030 would not be sufficient to impact the resilience of our strategy in that timeframe. It is reasonable to consider each potential outcome in isolation since the outcomes for different business areas vary across scenarios. Maintaining strategic resilience to the transition Within the inevitable constraints associated with factors such as long-term capital investment, contractual commitments and organizational capabilities at any given time, part of bp’s ability to maintain its strategic resilience rests in the governance by which the strategy can be kept under review as necessary in light of new information and changes in circumstances. To enable us to understand and respond to the changing pace of the energy transition, we monitor and assess key indicators and metrics, such as policy development, renewables installed capacity, electric vehicle sales, and low carbon technology costs. Our strategy as well as the associated risks, opportunities and our resilience, is also reviewed routinely by the bp leadership team and the board and updated where appropriate. Resilience to physical risk As described above, we have identified a number of physical risks which may affect our business and assets, the frequency or severity of which could be affected by climate change. We seek to manage these risks currently. We consider that our approach to managing these risks, described in Risk Management Recommended Disclosure (b) on page 65, supports our strategic resilience to them. For the purposes of this Recommended Disclosure, we have considered the potential for physical risks to bp operated assets to increase as a result of climate change (namely, increases in the potential frequency or intensity of extreme weather events) to such an extent as to have the potential to impact the resilience of our strategy. As with our transition risk scenario analysis described above, we have considered our medium-term timeframe to 2030. This is because, given the nature of our strategic plans, a It is important to note that conclusions from this analysis are necessarily limited by the scenarios, methodologies and business assumptions therein and are designed to be used as one of a number of sources to provide directional insight in a highly uncertain environment. They should not be taken as a prediction of the future nor as a basis for investment decisions. beyond that time horizon we do not consider it to be realistic or helpful to seek to present what would inevitably be an increasingly speculative view of the nature and potential location of assets we might expect to have in our operated portfolio; nor to seek to assess the impact of physical risk on them. Exposure to physical climate-related risk is highly dependent on geographical location and on factors such as asset design. We have considered the potential scale of financial impact that might be required to potentially affect our strategic resilience. Our transition risk scenario analysis identified impacts on the earnings of our oil-priced businesses as having the most potential to impact the resilience of our strategy in 2030. Therefore, and viewing resilience through the same lenses that we describe above, we have considered the extent to which our oil and gas production business would need to be impacted by evolving physical risk for the scale of financial impact to be sufficient to jeopardise the resilience of our strategy in 2030. We concluded that a significant proportion of our combined oil and gas portfolio would need to be either permanently shut-in or temporarily shutdown to jeopardise our strategic resilience in this way. Historically, severe weather risks to our operated assets have not manifested at a scale which could reduce earnings so significantly as to jeopardise the resilience of our strategy. As reflected in the latest science from the IPCC, it is in the nature of climate-induced severe weather events that their occurrence, intensity and severity are unpredictable and uncertain. Our own modelling work, undertaken on a subset of those bp-operated assets we consider to be potentially most exposed to present day physical risk, and which incorporated future projections of climate change, is consistent with this IPCC view. Despite this uncertainty, we have found no basis in either the IPCC report or the limited number of detailed studies we have undertaken, to conclude that climate change induced increases in the frequency or severity of severe weather events would be likely to result, at any point in time out to 2030, in disruption and shutdowns across our oil and gas portfolio on a scale that would reduce earnings so significantly as to jeopardise the resilience of our strategy. For the purposes of this Recommended Disclosure, the resilience of our strategy was considered separately for the relevant transition and physical risks; accordingly, we did not seek to take account of any interdependencies or cumulative effects between the two types of climate-related risk, and the associated potential financial impact. Sustainability continued
63 Strategic report bp Annual Report and Form 20-F 2021 See glossary on page 377 Our approach to testing resilience to transition risk The steps we took as part of our scenario analysis approach are outlined here at a high level. 1. We focused our analysis on our medium-term time horizon (2030) which is far enough ahead to provide a divergent range of scenarios, while not being so far ahead that it is unrealistic to attempt to generate credible financial metrics for bp or for an individual business area within bp. For variables considered material (see below), we also assessed resilience over the period 2023-2030. 2. Nine business areas, shown in the table on page 64, were included in the scope of the scenario analysis. These cover approximately three quarters of our expected 2030 adjusted EBITDA. Our analysis therefore covers the majority, though not all, of our expected 2030 portfolio. 3. Our analysis sought to quantify the potential impact of a range of scenarios on bp’s currently held (as at the time the analysis was completed) internal reference group business outlook to 2030. This outlook is used for internal corporate planning and holds a current deterministic view of our portfolio, activity set, cost and capital frame. The outlook used in our analysis aligned to the strategic direction shared in the ‘bp update on strategic progress’ announced on 8 February 2022, and the financials lie within the range of financial outcomes set out in that announcement. It also took into account a preliminary assessment of the revised adjusted EBITDA and cash flow, which bp may expect as a result of its decision to exit its 19.75% shareholding in Rosneft as disclosed in bp’s announcement on 27 February 2022. 4. For each business area, we selected appropriate variables from the WBSCD Scenario Catalogue representing what we consider to be the primary area of exposure to the energy transition, and the full range of 2030 outcomes within each scenario ‘family’ (using the ‘world’ values in the Catalogue except for gas price, see table on page 64). 5. By calibrating the WBCSD Scenario Catalogue 2030 scenarios to relevant business metrics underpinning our strategic planning (for example, oil price or EV demand/utilization), we were able to model the impact of each variable across the full range of scenarios and each scenario family, on associated 2030 expected earnings (adjusted EBITDA) for the business area(s) with which that variable was associated. For example, we applied an earnings rule of thumb appropriate to the period in question to the deviation of oil prices versus our reference case price. This analysis was unmitigated (see ’Other key considerations’). 6. This screening enabled us to assess the potential ability of each scenario to materially impact group adjusted EBITDA in 2030 (and by implication associated cash flows), against the reference group business outlook. By modelling the specific business area within the reference group business outlook (described in step 3 above), both the relative contribution of the business area to group earnings at that point in time, and its exposure to the most extreme range of the respective scenario, could be assessed to identify which variables(s) and scenario(s) could have the potential to impact strategic resilience (as defined below) most materially, and as such should be carried forward into a multi-year resilience assessment. In this case, only oil price was assessed as sufficiently material and hence carried forward. 7. Our multi-year (2023-30) oil price resilience test considered sustained low oil prices consistent with the most extreme WBCSD Scenario Catalogue 2025 and 2030 scenarios – for 2025 the IEA (World Energy Model Net Zero Energy 2050) price at $36/bbl, and for 2030 the UN PRI (Inevitable Policy Response Required Policy Scenario) at $30/bbl (both 2019 $ real). 8. For the purposes of this exercise, we considered the resilience of our strategy to climate-related transition risk through the three lenses described on page 61. We defined the following as proxy indicators for these lenses: • Positive group surplus cash flow, to confirm whether after funding, among other things, our disclosed capital frame (8 February 2022 investor update) and the dividend/share assumed in our reference group business outlook, sufficient surplus cash flow remains to maintain or reduce net debt and/or make share buybacks. • Healthy cash cover ratio as an indicator of the ability to maintain a strong investment grade credit rating. Other key considerations • To aid transparency, we made the simplifying assumption that, aside from the oil price modelled, our strategy, operating model, cost basis, volumes, margins, sales proceeds and taxes would remain unchanged out to 2030. We have also used bp’s internal view of potential shape of future distributions and uses of surplus cash as a basis for analysis. Hence, we do not consider actions which we might naturally expect to make in response to external trends, such as cost reductions, portfolio adjustments or capital reallocation. In reality, we keep our strategy under review and would seek to make use of opportunities to maintain our strategic flexibility in the face of the many uncertainties of the energy transition. • The design of a strategic resilience analysis involves numerous methodological choices and assumptions – any one of which could reasonably have been different, leading to different outcomes. We have found value in conducting this analysis; however, we are mindful of the limitations to any such exercise and the highly qualified nature of any conclusions which may be drawn from it. The disclosures provided here should be read in conjunction with the rest of our strategic report, where we discuss how we have developed, and continue to evolve, our strategic approach. • As outlined above, we have utilized our latest internal reference group business outlook as the basis against which resilience has been tested, as this is our latest deterministic view against which to model the transition sensitivities to 2030. Alongside disclosed elements such as the capital frame to 2030, this includes shaping assumptions such as future distribution and net debt management. Through conducting this analysis, we do not intend to imply or commit to a specific forward trajectory of usage of cash, beyond those disclosed in the full year and 4Q results update on 8 February 2022. While we cannot disclose, for confidentiality reasons, the detail of the deterministic case, the test assesses whether the resilience indicators in our reference group business outlook are impacted by the transition uncertainties tested. Further, by the nature of the timeframes considered, a variety of uncertainties exist around this deterministic case (including transition risk itself) as indicated by the range of adjusted EBITDA disclosed in the full year and 4Q results on 8 February 2022. It is not practical, and we have not attempted, to extend the analysis conducted here to any other potential outcomes within the disclosed range of group adjusted EBITDA. • Where rules of thumb have been applied, to convert variance in hydrocarbon price to variance in adjusted EBITDA, these are appropriate to the period in question – i.e. they reflect the respective 2025 and 2030 production portfolios and contract/price leverage for this period. Due to the evolution of bp’s portfolio, these rules of thumb may diverge from any short-term rule of thumb that we publish.

64 bp Annual Report and Form 20-F 2021 WBCSD Scenario Catalogue family ranges for 2030 key transition variables Business area TCFD/WBCSD variable Scenario family Min Max Resilient hydrocarbons Oil and natural gas production Oil pricea ($2019/bbl) BAU 62.82 81.77 Well-Below 2°C 45.00 78.45 1.5°C 30.00 71.22 Natural gas priceb ($2019/mmbtu) BAU 2.59 3.34 Well-Below 2°C 2.07 3.48 1.5°C 1.90 4.17 Refining Primary energy demand for oil (% vs 2020) BAU 0.4% 11.1% Well-Below 2°C -4.4% 11.6% 1.5°C -44.1% 1.4% Biojet fuels Final demand for liquid biofuels in aviation (EJ/yr) BAU 0.38 0.40 Well-Below 2°C 0.38 0.97 1.5°C 0.26 2.05 Biogas production Biogas demand in road transport (EJ/yr) BAU 0.01 0.01 Well-Below 2°C 0.01 0.01 1.5°C 0.01 0.18 Convenience and mobility EV charging Final energy demand for electricity in road transport (EJ/yr) BAU 1.69 3.80 Well-Below 2°C 1.64 3.87 1.5°C 1.85 6.69 Conventional fuel retail Final energy demand for liquid oil in road transport (EJ/yr) BAU 57.86 85.00 Well-Below 2°C 58.32 85.44 1.5°C 45.43 76.76 Low carbon energy Renewables Wind + solar photovoltaic capacity additions (GW vs 2020) BAU 1,553 3,614 Well-Below 2°C 1,553 5,892 1.5°C 4,585 8,077 Hydrogen production Hydrogen consumption (EJ/yr) BAU 0.83 2.64 Well-Below 2°C 0.73 2.64 1.5°C 0.79 9.15 a Oil price sensitivities have been applied to the oil and gas production portfolio that is linked to oil marker prices – as such it not only reflects oil production exposure, but also a proportion of bp’s natural gas production that is contracted off oil marker prices. b Gas prices shown reflect Henry Hub price ranges. Where available in the TCFD/WBCSD data sets Asian and UK gas price sensitivities have also been selected and compared to the Henry Hub sensitivity percentages with the maximum deviation selected and applied to the respective Asian and NBP rules of thumb for these parts of the gas portfolio, in order to provide the most conservative uncertainty range. Sustainability continued

65 Strategic report bp Annual Report and Form 20-F 2021 Risk Management TCFD Recommendation: Disclose how the organization identifies, assesses and manages climate-related risks. Recommended Disclosure: a. Describe the organization’s processes for identifying and assessing climate- related risks. bp’s risk management system and policy, described on page 73, are designed to address all types of risks including our principal risks and uncertainties described on page 76. As part of this system our businesses, integrators and enablers are responsible for identifying, assessing, managing, and monitoring risks associated with their business or functional area. Risks are identified as outlined on page 74 and guidance to support consistency has been made available to our businesses, integrators and enablers and provides them with a climate-related framework and taxonomy, which they are able to use if they consider it helpful. Where risks are identified, businesses, integrators and enablers are required by our policies to assess them, including climate-related risks, in line with bp’s risk management policy and this includes an impact and likelihood assessment which supports consideration of relative significance and risk prioritization of risk management activities. The impact criteria outlined on page 74 include health and safety, environmental, financial and non-financial (such as regulatory impact) criteria and are to be used for assessing risks, including climate-related risks. This provides a consistent basis for assessment across bp. For the purposes of our TCFD disclosures, we have made use of the TCFD’s distinction between ‘physical’ and ‘transition’ climate-related risks. Recommended Disclosures: b. Describe the organization’s processes for managing climate-related risks. c. Describe how processes for identifying, assessing and managing climate-related risks are integrated into the organization’s overall Risk Management. Risk Management process Risks which may be identified include potential effects on operations at asset level, performance at business level and developments at regional level from extreme weather or the transition to a lower carbon economy. As part of our annual process the bp leadership team and board review the group’s principal risks and uncertainties. Climate change and the transition to a lower carbon economy has been identified as a principal risk, see page 77. It covers various aspects of how risks associated with the energy transition could manifest. Similarly, physical risks such as extreme weather, which may be affected or intensified by climate change, are covered in our principal risks related to safety and operations. Physical risk Physical risks are typically identified at the asset or project level and are managed depending on the level of risk assessed. In the North Sea and Gulf of Mexico, regions more prone to severe weather conditions, our offshore facilities monitor meteorological and oceanographic conditions through the collection of measurements. This data is collated and periodically compared against the ‘Basis of Design’ for the facility. If significant differences are observed, then this may trigger an update to the Basis of Design, prompting action to re-assess risks such as structural integrity and station- keeping and if necessary, implement additional risk mitigations, for example updating procedures for shutting down and removing personnel from facilities ahead of severe weather events. Updates may also be made as a result of other new knowledge, analysis methods and data, including climate projections where appropriate. Our major projects are required to assess the potential impact of severe weather and projected climate-related physical impacts. Where relevant, potential changes in environmental conditions, such as sea level rise and ambient temperatures, over the expected lifetime of a project are to be considered as part of the design process. For other assets, such as our retail sites, that are typically not exposed to a comparable level of severe weather risk, climate-related risks such as flooding or wind damage may be managed where appropriate through the emergency response plans and business continuity plans which are mandated through company-wide policies. Additionally at a group level we recognize risk associated with the potential for increased water scarcity due to climate change and other factors and the impact this could have on our operations and in the catchments where we operate. The impact of this risk is assessed by looking at a combination of the water availability in the catchment area and the water needs of the relevant asset, see page 68. Transition risk The board establishes bp’s strategy and monitors bp’s management and operations to obtain assurance over the delivery of its strategy. This approach ensures the effective management of climate-related transition risks and opportunities facing bp associated with the energy transition. For the purposes of our TCFD disclosures, we have grouped transition risks identified by our businesses, integrators and enablers, as described above, into the three broad material climate-related transition risks to bp, see page 58. However, we still assess and manage the component parts of those broad transition risks. • Policy and legal risks Our policy & partnerships team monitors and develops policy positions in line with bp’s sustainability aims. This team works with bp’s regional organization as well as corporate entities to discuss regional and global policy trends and support external positioning and interactions relating to policy and advocacy topics. Our group sustainability committee provides oversight of sustainability matters and our issues and advocacy meeting covers emerging advocacy issues. Our legal team manage bp’s litigation, including climate-related litigation and advise on the management of associated risks. This includes the use of internal lawyers and, where appropriate, external counsel. • Market risks In developing our business strategies, we consider market risks, controls and mitigations including future demand in the different geographies in which we might operate, the competitive landscape and the potential value proposition. We manage these risks through our investment decisions, our hedge trading and optimization activity, and through key business processes including the group investment assurance and approval process. • Reputational risks Our investor relations and communications & advocacy teams work to mitigate reputation- related risks, which includes the risk of shareholder action. Our investor relations team co-ordinates engagement with key investors on both a bilateral basis and through investor initiatives to support understanding of bp’s strategy and gain insights to inform feedback they provide to the group. Our communications & advocacy team manages corporate reputation through identification and monitoring of key issues and both proactive and reactive engagement with relevant stakeholder groups to communicate bp’s positions. Under our aim 6, which is to actively advocate for policies that promote net zero, the team also leads advocacy campaigns for policies that support net zero, including carbon pricing, see page 52.
66 bp Annual Report and Form 20-F 2021 • Technology risks Our technology insights team work to both mitigate risks and identify opportunities associated with evolving and emerging technologies that play a role in the changing global energy system. The team generates technology assessments and disruptive technology reports for review by bp senior executives and the recommendations are overseen by the board through the Innovation Advisory Council. In appropriate cases this helps to underpin and appraise the business case for new investments, new partnerships, new customer offers or new business models where these are being driven by technology innovation. Sustainability continued Our group-wide principal metrics and relevant targets/goals TCFD recommended disclosures Where a. Disclose the metrics used by the organization to assess climate-related risks and opportunities in line with its strategy and Risk Management process • Our strategic metrics: low carbon energy and convenience and mobility 2025, 2030 metrics, pages 16 and 17 (in table, relevant metrics with a T ). • Sustainability at bp: five aims to get to net zero, page 51 (in table). Our financial frame and investor proposition. • Disciplined investment allocation: 2022-2025 guidance (~$5-7 billion in low carbon and convenience and mobility). #3 investing at scale in the energy transition: capital allocation in low carbon and convenience and mobility and internal rate of return (IRR) hurdle rates, page 20. Our investment process • Price assumptions, Key investment appraisal assumptions, page 32 (in table, indicated with a T ). • Carbon price, page 32 (in table, indicated with a T ). Consistency with the Paris goals: • Six investment criteria: Investment economics, page 32 (in green box, indicated with a T ). • Paris consistency evaluation process: Quantitative evaluations, page 35 (in green box, indicated with a T ). KPIs: • Key performance indicators, page 24 (relevant KPIs shown with a T ). Sustainability at bp: • Water metrics, page 68. • Biodiversity metrics, page 68. Directors’ remuneration report: • Director’s remuneration report, page 116. • 2021 annual bonus outcome, page 122. • 2022 remuneration policy on a page, page 137. Incentivizing our employees to advocate for net zero: • Aim 7, page 52. b. Disclose Scope 1, Scope 2, and, if appropriate, Scope 3 greenhouse gas (GHG) emissions, and the related risks. Sustainability at bp: • Scope 1,2 in SECR table, page 53. • Ratio of Scope 1 and 2 emissions: gross production, page 53. • Scope 3 (category 11, which is broadly aligned to our aim 2) performance, page 52a • TCFD: risks as described in Strategy A, page 56. • Risk factors, page 76. c. Describe the targets used by the organization to manage climate- related risks and opportunities and performance against targets. Sustainability: net zero aims • Aim 1-5 summary of 2020 performance, 2025 targets and 2030 aims, page 51. • Aim 1 performance (Scope 1 and 2), page 52. • Aim 2 performance (Scope 3), page 52. • Aim 3 performance (emissions from the carbon in our upstream oil and gas production), page 52. • Aim 4 performance (methane), page 52. a In determining the Scope 3 emissions that are ‘appropriate’ to be disclosed for the purposes of this Recommended Disclosure, we have considered this term in the context of the recommendation to disclose the metrics and targets used to assess and manage relevant climate related risks and opportunities. The relevant target that we use in respect of Scope 3 emissions is our aim 3, which is broadly aligned to category 11 of Scope 3. Metrics and targets TCFD Recommendation: Disclose the metrics and targets used to assess and manage relevant climate- related risks and opportunities where such information is material. The principal metrics and targets used at group level to help monitor progress on delivery of our strategic consistency with the Paris goals (including Scope 1, 2 and 3 emissions) – are disclosed at the most appropriate locations in this strategic report. We present the principal group-wide metrics and targets used to assess and manage climate-related risks and opportunities below. In addition, we report on selected energy group illustrative metrics. In the context of the strategic report as a whole, we have judged that it is best to present this reference table online at bp.com/TCFD. Looking ahead, we will consider the updated TCFD guidance on Metrics & Targets, published in October 2021.
67 Strategic report bp Annual Report and Form 20-F 2021 See glossary on page 377 Our focus area: Improving people’s lives We have five aims to improve people’s lives. We recognize the importance of health and wellbeing, supporting livelihoods, treating people with respect and working to enhance diversity, equity and inclusion. Our people aims build on strong social impact and risk management requirements and guidance in our operating management system. These aims focus on how we think bp can make the biggest difference in the places where we work. They are underpinned by specific objectives and targets. Summary of our aims and 2021 performance Aim 2021 performance More clean energy Aim 11 is to develop enough clean energy to benefit more than 36 million people. • We brought 4.4GW (2020 3.3GW) of developed renewables to FID by end of 2021 and have a renewables pipeline of 23GW. • Our development pipeline includes new solar development projects agreed by Lightsource bp in the US across 12 states and in New South Wales, Australia, as well as new offshore wind projects with Equinor in the US and EnBW in the UK. Just transition Aim 12 is to support a just energy transition which advances human rights and education. • We focused on defining and building the systems, processes and metrics we will need to progress towards our 2025 targets and 2030 aims. • We advanced initiatives that support a just transition for the bp workforce and for people living in communities where we operate. Sustainable livelihoods Aim 13 is helping more than 1 million people build sustainable livelihoods and resilience. • We are working to define a more systematic approach to helping people and communities develop sustainable livelihoods and become more resilient. • We partnered with the Fair Wage Network to increase our understanding of the different definitions of fair wages and to benchmark against their extensive fair and living wage database. Greater equity Aim 14 is greater diversity, equity and inclusion for our workforce and customers, and to increase supplier diversity spend to $1 billion. • Launched our Leadership Inclusion for Talent (LIFT) programme to support the progression of Black and African American colleagues into senior leadership roles. • Developed and rolled out Race for Equity, a mandatory racial equity and inclusion programme for bp leadership. • Published our first bp diversity, equity & inclusion report, which we plan to update annually. Read more about diversity, equity & inclusion and our people on page 71 Enhance wellbeing Aim 15 is to enhance the health and wellbeing of our employees, contractors and local communities. • Launched ‘Thrive’ – our new wellbeing portal – to support our workforce, and their friends and family, in building and maintaining healthy habits across all aspects of wellbeing. • Started to implement our global health hubs strategy that aims to improve access to health resources for employees and their families. Read more on page 72 For more information about our aims and performance in 2021, see the bp Sustainability Report 2021 Human rights We believe everyone deserves to be treated with fairness, respect and dignity. At bp we strive to conduct our business in a responsible way, respecting the human rights of our workers and everyone we come into contact with. Our human rights policy and our code of conduct help us do that. We respect internationally recognized human rights as set out in the International Bill of Human Rights and the International Labour Organization’s Declaration on Fundamental Principles and Rights at Work, including the core Conventions. These include the rights of our workforce and those living in communities potentially affected by our activities. We incorporate the UN Guiding Principles on Business and Human Rights, which set out how companies should prevent, address and remedy human rights impacts, into our business processes. When working to remediate any impacts on the rights of local communities we are open to co-operating in good faith to agree remedial actions through state-led mechanisms such as the Organisation for Economic Co-operation and Development National Contact Points. We recognize the importance of accessible and effective operational-level grievance mechanisms in addressing our impacts. See bp.com/humanrights

68 bp Annual Report and Form 20-F 2021 Our focus area: Caring for our planet We have set five aims to care for our planet. These aims focus on how we think bp can make the biggest difference in the places where we work. In 2021 much of our focus was on setting the foundations needed to deliver these aims. Our five planet aims build on our environmental impact and risk management requirements and guidance in our operating management system. They are underpinned by specific objectives and targets. Summary of our aims and 2021 performance Aim 2021 performance Enhancing biodiversity Aim 16 is making a positive impact through our actions to restore, maintain and enhance biodiversity where we work. • Joined the Taskforce on Nature-related Financial Disclosures (TNFD) Forum and the Science-Based Targets for Nature’s corporate engagement programme. • We are working on developing our methodology for achieving net positive impact (NPI) on biodiversity in new projects from planned activities. Water positive Aim 17 is becoming water positive by 2035. • A key focus for 2021 was evolving our water management by developing a methodology and approach to improve water efficiency. We are working to align our actions with international water stewardship good practices and to follow a water management framework. Championing nature-based solutions Aim 18 is championing nature- based solutions and enabling certified natural climate solutions. • We are working towards the delivery of a nature-based solutions (NbS) action plan by the end of 2022. • Continued our external engagement to support the scaling of high-quality natural climate solutions in carbon markets. Unlock circularity Aim 19 is to unlock new sources of value through circularity. • Continued building the foundations needed to embrace circularity in bp, by evaluating the suitability of respected third-party definitions and frameworks to be adopted as our internal methodology. • Focused on reducing generated waste in all our activities, from construction to operating and decommissioning. Around 270kt of hazardous and non-hazardous waste was disposed in 2021, a 4% decrease from around 280kt in 2020. Sustainable purchasing Aim 20 is developing a more sustainable supply chain. • Trialled the inclusion of sustainability factors in major purchasing decisions and focused on supplier sustainability strategies, greenhouse gas (GHG) emissions, use of renewable energy and circular approaches to product design. • Created a roadmap of high priority areas of goods and services with a focus on improving GHG emissions performance, continuing to act on opportunities as we identify them. For more information about our aims and performance in 2021, see the bp Sustainability Report 2021 Water consumption In 2021 we saw a 2.2% fall in freshwater withdrawals and a 4.1% fall in freshwater consumption compared with our 2020 baselinea. This was largely due to an improvement in the calculation of freshwater consumption across our retail sites and some measures of operational efficiency. At major operating sites, 0.1% of our total freshwater withdrawals and 0.6% of freshwater consumption were from regions with high or extremely high water stress in 2021 (compared to 4% and 8% in 2020 respectively). This is mainly due to the divestment of Geel Chemicals and a downgrading of Kwinana refinery to low baseline water stress by the WRI. Air emissions We monitor our air emissions and, where relevant, put measures in place to reduce the potential impact of our operational activities on local communities and the environment. In 2021 our total air emissions reduced by 38% from 2020 largely due to reductions in flaring at some of bp’s operating facilities, including US onshore operations. bp’s operated shipping fleet transitioned to very low or ultra-low sulphur fuels in 2020 to comply with the International Maritime Organization’s 2020 MARPOL regulation. Biodiversity Our biodiversity position, published in 2020, builds on the robust practices we already had in place to manage biodiversity across bp projects up to that date. We expect that from 2022 all new bp projects in scope will have plans in place aiming to achieve net positive impact (NPI), with a target to deliver 90% of actions within five years of project approval. We also aim to enhance biodiversity at our major operating sites and support biodiversity restoration and sustainable use of natural resource projects in the countries where we have current or growing investments. Sustainability continued a The baseline freshwater consumption is defined as 55.8 million m3 in the bp Sustainability Report 2020.

69 Strategic report bp Annual Report and Form 20-F 2021 See glossary on page 377 Our values and code of conduct Our values of safety, respect, excellence, courage and one team represent the qualities and actions we wish to see at bp. They inform how we do business and the decisions we make. We use these values as part of our recruitment, promotion and individual performance management processes. Our code of conduct is based on our values and sets clear expectations for how we work at bp. It applies to all bp employees and members of the board. Employees, contractors or other third parties who have a question about our code of conduct or see something that they feel is unethical or unsafe can discuss this with their managers, supporting teams, works councils (where relevant) or through OpenTalk, a confidential and anonymous helpline operated by an independent company. We received more than 1,400 concerns or enquiries through these channels in 2021 (2020 1,600). We take steps to identify and correct areas of non-conformance and take disciplinary action where appropriate. In 2021 our businesses dismissed approximately 26 bp employees for non-conformance with our code of conduct or unethical behaviour (2020 50c). This excludes dismissals of contractors and vendors, and employees at our retail service stations. Safety Safety is our core value and it is underpinned by our operating management system (OMS), which sets out how we aim to sustainably deliver safe, reliable and compliant operations. Tragically, in July 2021 a contractor died in a pipe lifting incident at our Castellón refinery in Spain. We deeply regret this loss. We are taking action to learn from this incident by codifying lessons into our OMS and sharing them internally and externally, so we can try to mitigate the potential for this kind of incident to happen again. e Incidents that result in an injury where a person is unable to work for a day (shift) or more per 200,000 hours worked. Foundations Our sustainability frame is built on strong foundations: our values, our continued focus on safety, our commitment to ethics and compliance, our people, and the economic value we create. Our safety goal is to eliminate tier 1 process safety events, fatalities and life-changing injuries and we have set out a bp-wide plan to help us achieve this. And in 2021, we continued work to strengthen our safety culture with the launch of a refreshed set of harmonized ‘safety leadership principles’, designed to guide behaviour and ways of working across bp – driving a robust, consistent safety culture. Keeping people safe We monitor and report on key workforce personal safety metrics in line with industry standards. We include both employees and contractors in our data. We have seen gradual improvements in our personal safety metrics over the past five years, which we believe reflect our increasingly systematic approach and improvements in safety leadership and human performance. This work is ongoing with a continuing focus on our updated safety leadership principles and initiatives such as our roll-out of the IOGP Life Saving Rules. These safety rules guide our workers on staying safe while performing tasks with the potential to cause most harm. The rules are aligned with our operating management system (OMS) and focus on areas such as working at heights, lifting operations and driving safety. Our recordable injury frequency (RIF) increased by over 20% compared with 2020, where the unique impact that the COVID-19 pandemic had on personal safety in 2020 was reflected in a lower RIF for that year. Compared with 2019, in 2021 our RIF slightly improved and, except for 2020, it was better than any time in the past 15 years. For absolute injuries, there was a small increase in recordable injuries (RI) between 2021 and 2020, and a small decrease in days away from work cases (DAFWC) over the same period. In 2021, DAFWC were at their lowest ever recorded level. Read more at bp.com/ESGdata 2021 2020 2019 Day away from work case frequencye 0.051 0.044 0.047 Severe vehicle accident rate 0.034 0.009 0.050 Recordable injury frequency Workforce incidents per 200,000 hours worked 2020 2021201920182017 0.14 0.18 0.20 0.19 0 0.1 0.2 0.3 Workforce 0.218 0.198 0.166 0.132 0.164 Employees 0.202 0.152 0.128 0.094 0.117 Contractors 0.229 0.233 0.193 0.163 0.204 International Association of Oil & Gas Producers benchmark* * IOGP 2021 data reports are not available until May 2022. Our operating management system The way our businesses around the world are expected to understand and manage their environmental and social impacts is set out in our OMS. This includes requirements on engaging with stakeholders who may be affected by our activities. OMS is a group-wide framework designed to help us manage risks in our operating activities and drive performance improvements.

70 bp Annual Report and Form 20-F 2021 It brings together bp requirements on health, safety, security, the environment, social responsibility and operational reliability, as well as related issues, such as maintenance, contractor relations and organizational learning, into a common management system. Our OMS also helps us improve the quality of our activities by setting a common framework that our operations must work to. We review and amend these requirements from time to time to reflect our priorities. Any variations in the application of our OMS, in order to meet local regulations or circumstances, are subject to a governance process. Recently acquired operations need to transition to our OMS. In planning our projects, we identify potential impacts from our activities and use the results to identify actions and mitigation measures and look to implement these in project design, construction and operations. Our OMS requires each of bp’s operating businesses and functions to create and maintain its own OMS handbook, describing how it will carry out its local operating activities. Through self-verification, local business processes are reviewed and areas for improvement are prioritized, allowing focus on delivering safe, reliable and compliant operations. Three lines of defence bp has a three lines of defence model to improve the effective management of all types of risk, including safety. The nature and extent of first, second and third lines of defence activities are based on the type and level of risk and comprise: • Businesses and functions – the first line of defence: accountable for working to meet business objectives, including risk management, and for self-verifying the effectiveness of their own risk management. • Group functions – the second line of defence: support the first line of defence in their management of risk and consider the effectiveness of their activities. Functions determine their activity set based on the type and level of risk which may include defining requirements, providing expertise (systems, tools and processes), building capability and conducting monitoring independent of the first line. The second line reports outside the line conducting the first line activity. • Internal audit – the third line of defence: considers whether the group’s system of internal control is adequately designed and operating effectively. Internal audit also tests the management of significant risks in the first and second lines of defence across the organization over time. The third line is independent of the first and second lines of defence. Preventing incidents We carefully plan our operations, with the aim of identifying potential hazards and having rigorous operating and maintenance practices applied by capable people to manage risks at every stage. We design our new facilities in line with process safety, good design and engineering principles. We track our safety performance using industry- aligned metrics such as those found in the American Petroleum Institute recommended practice 754 and the International Association of Oil & Gas Producers recommended practice 456. The overall downward trend in tier 1 and tier 2 process safety events (PSEs) continued into 2021. Our combined PSEs have generally decreased over the last 10 years, apart from 2019. Our performance improved in 2021 with one fewer tier 1 PSEs and seven fewer tier 2 PSEs, compared with 2020. The combined tier 1 and tier 2 PSEs were down 11% in 2021 compared to 2020. We investigate incidents including near misses, and we also use leading indicators, such as inspections and equipment tests, to monitor the strength of controls to prevent incidents. 2021 2020 2019 Tier 1 and tier 2 process safety events 62 70 98 Oil spills – number 121 121 152 Oil spills contained 73 70 90 Oil spills reaching land and water 47 46 58 Oil spilled – volume (thousand litres) 655 784 710 Oil unrecovered (thousand litres) 308 494 300 Emergency preparedness The scale and spread of bp’s operations means we must be prepared to respond to a range of possible disruptions and emergency events. We maintain disaster recovery, crisis and business continuity management plans and work to build day-to-day response capabilities to support local management of incidents. Security We monitor for hostile actions that could harm our people or disrupt our operations. These actions might be connected to political or social unrest, terrorism, armed conflict or criminal activity. We take these potential threats seriously and assess them continuously. Our 24-hour response information centre in the UK uses state-of-the-art technology to monitor evolving high-risk situations in real time. It helps us to assess the safety of our people and provide them with practical advice if there is an emergency. Cyber security The severity, sophistication and scale of cyber attacks continues to evolve. The increasing digitalization and reliance on IT systems and cloud platforms makes managing cyber risk an even greater priority for many industries, including our own. The risk comes from a variety of cyber threat actors, including nation states, criminals, terrorists, hacktivists and insiders. As with previous years, we’ve experienced threats to the security of our digital infrastructure, but none of these had a significant impact on our business in 2021. We have a range of measures to manage this risk, including the use of cyber-security policies and procedures, security protection tools, continuous threat monitoring and event detection capabilities, and incident response plans. We also conduct exercises to test our response to and recovery from cyber attacks. To encourage vigilance among our employees, our cyber security training and awareness programme covers topics such as phishing and the correct classification and handling of our information. We collaborate closely with governments, law enforcement and industry peers to understand and respond to new and emerging threats. Sustainability continued
71 Strategic report bp Annual Report and Form 20-F 2021 Working with contractors Through documents that help bridge between our policies and those of our contractors, we define the way our safety management system co-exists with those of our contractors to manage risk on a site. For our contractors facing the most serious risks, we conduct quality, technical, health, safety and security audits before awarding contracts. Once they start work, we continue to monitor their safety performance. Our OMS includes requirements and practices for working with contractors. Our standard model contracts include health, safety and security requirements. We expect and encourage our contractors and their employees to act in a way that is consistent with our code of conduct and take appropriate action if those expectations, or their contractual obligations, are not met. Our partners in joint arrangements In joint arrangements where we are the operator, our OMS, code of conduct and other policies apply. We aim to report on aspects of our business where we are the operator – as we directly manage the performance of these operations. We monitor performance and how risk is managed in our joint arrangements, whether we are the operator or not. Where we are not the operator, our OMS is available as a reference point for bp businesses when engaging with operators and co-venturers. We have a group framework to assess and manage bp’s exposure related to safety, operational and bribery and corruption risk from our participation in these types of arrangements. Where appropriate, we may seek to influence how risk is managed in arrangements where we are not the operator. Our people are the most important element of our success. We need a motivated, engaged, and diverse workforce to deliver our purpose and strategy. We promote a culture that generates the diversity of thought, approach and ideas needed to reimagine energy and move to a low carbon environment. The people and governance committee reviews workforce policies and practices and their alignment with bp’s strategy, purpose, values and culture and conducts workforce engagement measures. For more on the people and governance committee, see page 106 Number of employees at 31 Decemberb 2021 2020 2019 Gas & low carbon energy 4,000 – – Oil production & operations 8,800 – – Customers & products 43,600 – – Other businesses and corporate 9,500 – – Total 65,900 63,600 70,100 Attraction, retention and development We aim to recruit talented people from diverse backgrounds, and invest in training, development and competitive rewards for all our people. We invest in employee development – with a focus on driving safe, reliable and compliant operations, and on building technical, functional and leadership capability. This includes a range of development opportunities for our people through a mix of on-the-job learning, developmental relationships with mentors, managers and peers, and training delivered face-to-face, virtually and through simulation or e-learning. Diversity, equity & inclusion Our DE&I ambition is for bp to reflect the world around us. Gender equality Overall, the proportion of women employed across bp remained at 39% of our global workforce in 2021 (39% in 2020). 41% of our 120 extended leadership team are women and our goal is to increase this. At the end of 2021 we had four female directors (2020 5) on our board. Our people and governance committee remains mindful of diversity when considering potential candidates. See our gender pay gap report at bp.com/ukgenderpaygap Our people Workforce by gendera Male Female Female % As at 31 December 2021 2021 2020 2021 2020 2021 2020 Board directors 6 6 4 5 40 45 Leadership team 7 8 4 4 36 33 Group leaders 192 193 89 77 32 29 Subsidiary directors 674 1,351 303 284 31 17 All employees 39,912 38,826 25,933 24,719 39 39 Ethnic diversity Our global, US and UK frameworks for action guide how we aim to improve DE&I in bp. In 2021 we published a comprehensive global DE&I report, embedding expectations and metrics on DE&I delivery in our operating plans. In 2022 we reported on our UK ethnicity pay gap for the first time. We also aim to double our spend with US-based diverse suppliers by 2023. In 2021, 31% of our group leaders came from countries other than the UK and the US (2020 30%). See our DE&I report at bp.com/diversity For more on the composition of our board, see page 84 Inclusion To promote an inclusive culture we provide leadership training and support employee-run advocacy groups in areas such as gender, ethnicity, sexual orientation and disability. As well as bringing employees together, these groups support our recruitment programmes and provide feedback on the potential impact of policy changes. Each group is sponsored by a senior executive. We aim to provide equal opportunity in recruitment, career development, promotion, training and reward for all employees – regardless of ethnicity, national origin, religion, gender, age, sexual orientation, marital status, disability, or any other characteristic protected by applicable laws. Where existing employees become disabled, our policy is to engage and use reasonable accommodations or adjustments to enable continued employment. In 2021 bp joined the Valuable 500 – a global business collective made up of 500 CEOs and their companies, to drive lasting change for people around the world living with a disability. a The number of subsidiary directors is lower than prior years following a change in the way that the data is collated for subsidiary companies, with associated undertakings no longer included in the data set. b We do not report number of employees data against our new financial reporting segments for 2020 and 2019 as the numbers are not comparable following our reorganization in 2020.

72 bp Annual Report and Form 20-F 2021 We are making progress in the areas of recruitment, workspaces and assistive technology. We have also formed partnerships to help source talent, assist with research and training and support students with disabilities build the skills they need to access the workplace. Employee engagement Our managers hold team and one-to-one meetings with their team members, complemented by formal processes through works councils in parts of Europe. We regularly communicate with employees on factors that affect bp’s performance, and seek to maintain constructive relationships with labour unions formally representing our employees. To understand what our employees think and feel about bp, we run an annual ‘Pulse’ survey as well as ‘Pulse Live’ surveys, which enable us to monitor changes in employee sentiment on a weekly basis. We introduced a new overall engagement metric in 2021, which scored 64%. Pride in working for bp remained strong at 73%, but has declined by two percentage points since 2019. Employees participating in the 2021 ‘Pulse’ survey told us that their trust in our senior leadership had increased and more employees believe we are making progress on transformation with a simplified organizational structure. Some employees told us they do not fully understand our strategy. bp has committed to centrally focus and direct action planning in four key areas to strengthen engagement: connecting with purpose and strategy, future excitement, career development and inclusion. Mental health and wellbeing In 2021 we continued to offer employees access to a range of mental health support services. This included support from our well-established 24/7 Employee Assistance Programme, which saw increased usage in most regions. We also enabled employees to share access to the Headspace meditation app with two family members. Share ownership We continue to encourage employee share ownership and have a number of employee share plans in place. For example, we operate a ShareMatch plan in more than 50 countries, matching bp shares purchased by our employees. We also make annual share awards as part of our total reward package all for senior and mid-level employees globally, and a portion of our more junior professional grade employees. In February 2021, we introduced the Reinvent bp share award to incentivize our employees in meeting our aims. All individuals employed by the bp group at the grant date will receive a one-off grant of either share units or share options, depending on employee level, that will become available to keep, sell or transfer in the first quarter of 2025, provided the employee remains in employment to this date. Ethics and compliance Anti-bribery and corruption We operate in parts of the world where bribery and corruption present a high risk. We have a responsibility to our employees, our shareholders and the countries and communities in which we do business to be ethical and lawful in all our work. Our code of conduct explicitly prohibits engaging in bribery or corruption in any form. Our group-wide anti-bribery and corruption policy and procedures include measures and guidance to assess risks, understand relevant laws and report concerns. They apply to all bp-operated businesses. We provide training to employees appropriate to the nature or location of their role. In 2021, over 12,700 employees completed anti-bribery and corruption training (2020 7,700). We assess any exposure to bribery and corruption risk when working with suppliers and business partners. Where appropriate, we put in place a risk mitigation plan or we reject them if we conclude that risks are too high. We also conduct anti-bribery compliance audits on selected suppliers to assess their conformance with our anti-bribery and corruption contractual requirements. We take corrective action with suppliers and business partners that fail to meet our expectations, which may include terminating contracts. In 2021 we issued 4a audit reports (2020 35). Political donations and activity We prohibit the use of bp funds or resources to support any political candidate or party. We recognize the rights of our employees to participate in the political process and these rights are governed by the applicable laws in the countries where we operate. The way in which we interact with those governments depends on the legal and regulatory framework in each country. Our stance on political activity is defined in our code of conduct. In the US we provide administrative support for the bp employee political action committee (PAC), which is a non-partisan committee that encourages voluntary employee participation in the political process. All bp employee PAC contributions are reviewed for compliance with federal and state law and are publicly reported in accordance with US election laws. The PAC paused all contributions beginning in January 2021 and we expect to restart them in 2022. During this time PAC re-evaluated its criteria for candidate support. Tax transparency Our code of conduct informs the responsible approach we take to managing taxes. We endorse the B Team responsible tax principles and we engage in open and constructive dialogue with governments and tax authorities. We do not tolerate the facilitation of tax evasion by people who act for or on behalf of bp. We are committed to transparency around our tax principles and the taxes we pay. We paid $5.4 billion in corporate income and production taxes to governments in 2021 (2020 $3.3 billion). In 2021 we published the latest bp tax report, providing more detailed information on how we approach tax matters and the tax payments we make. Read more bp.com/tax Sustainability continued a Fewer reports were issued in-year in 2021 as the audit programme was delayed as a result of the COVID-19 pandemic and the Reinvent bp programme.

Day-to-day risk management Identify, manage and report risks Business and strategic risk management Plan, manage performance and assure Oversight and governance Set policy and monitor principal risks Facilities, assets and operations Businesses, integrators and enablers Leadership team and enablers The board 73 Strategic report bp Annual Report and Form 20-F 2021 How we manage risk and risk factors How we manage risk bp’s system of internal control is a holistic set of internal controls that includes policies, processes, management systems, organizational structures, culture and behaviours employed to conduct bp’s business and manage associated risks. bp’s risk management system bp’s risk management system and policy is designed to be a consistent and clear framework for managing and reporting risks from the group’s business activities and operations to management and to the board. The system seeks to avoid incidents and enhance business outcomes by allowing us to: • Understand the risk environment, identify the specific risks and assess the potential exposure for bp. • Determine how best to deal with these risks to manage overall potential exposure. • Manage the identified risks in appropriate ways. • Monitor and seek assurance of the effectiveness of the management of these risks and intervene for improvement where necessary. • Report up the management chain and to the board on a periodic basis on how principal risks are being managed, monitored, assured and the improvements that are being made. Our risk management activities Day-to-day risk management Management and employees at our facilities, assets, and within our businesses, integrators and enablers (see page 12) seek to identify and manage risk, promoting safe, compliant and reliable operations. bp requirements, which take into account applicable laws and regulations, underpin the practical plans developed to help reduce risk and deliver safe, compliant and reliable operations as well as greater efficiency and sustainable financial results. Business and strategic risk management Our businesses, integrators and enablers integrate risk management into key business processes such as strategy, planning, performance management, resource and capital allocation and project appraisal. We do this by using a standard framework for collating risk data, assessing risk management activities, making further improvements and in connection with planning new activities. bp manages, monitors and reports on the principal risks and uncertainties we have identified that can impact our ability to deliver our strategy. These risks are described in the Risk factors on page 76. Oversight and governance Throughout the year, management, the leadership team, the board and relevant committees provide oversight of how principal risks to bp are identified, assessed and managed. They support appropriate governance of risk management including having relevant policies in place to help manage risks. Such oversight may include internal audit reports, group risk reports and reviews of the outcomes of business processes including strategy, planning and resource and capital allocation. bp’s group risk team analyses the group’s risk profile and maintains the group’s risk management system. Our internal audit team provides independent assurance to the chief executive and board as to whether the group’s system of internal control is adequately designed and operating effectively to respond appropriately to the risks that are significant to bp.

74 bp Annual Report and Form 20-F 2021 How we manage risk and risk factors continued • Inform prioritization of specific risk management activities and resource allocation. bp’s risk management policy sets out requirements for businesses, integrators and enablers to follow. These requirements support the consideration of the following risk types: • Strategic and commercial • Safety and operational • Compliance and control Risk identification – businesses, integrators and enablers identify risks across the three risk types. Risks are identified on an ongoing basis – this can be done using a range of approaches including workshops, subject matter expertise, hazard identification processes and engineering requirements. Risk assessment – identified risks are assessed for potential impact across a number of criteria including: • Health and safety • Environmental • Financial • Non-financial (includes reputation and regulatory impact levels) Likelihood is also assessed using a standardized set of criteria. This aims to provide a consistent basis for the evaluation of potential impact and likelihood, facilitating a comparison across risks. Risk management and monitoring – risk management activities can be prioritized where improvements are needed based on a number of factors, including the risk assessment, strength of existing risk management measures, strategy and plans and legal and regulatory requirements. Risk management measures, including mitigations, are to be identified for each risk and monitored to the extent considered appropriate. To support leadership oversight of decisions relating to the risk assessment and management measures, risks are to be notified to, and the business’s risk management measures are subject to endorsement at, the appropriate organizational level (EVP, SVP, VP) depending on the assessed potential impact and likelihood. As part of bp’s annual planning process, the leadership team and the board review the group’s principal risks and uncertainties and determine risks for particular oversight by the leadership team, the board and their respective committees. These may be updated during the year in response to changes in internal and external circumstances. There can be no certainty that our risk management activities will mitigate or prevent these, or other risks, from occurring. Further details of the principal risks and uncertainties we face are set out in Risk factors on page 74. Our risk profile The nature of our business operations is long term, resulting in many of our risks being enduring in nature. Nonetheless, risks can develop and evolve over time and their potential impact or likelihood may vary in response to internal and external events. These may include emerging risks which are considered through existing processes, including an emerging risk paper considered at board meetings, bp’s risk management system, the bp Energy Outlook, bp’s Technology Insights Radar and ongoing emerging technology scanning and group strategic reviews. We identify risks for particular oversight by the board and its various committees in the coming year. Risks for particular oversight by the leadership team, the board and their committees in 2022 Areas of risk for particular oversight in 2022 have been reviewed and are listed below. These may be updated during the year in response to changes in internal and external circumstances. The oversight of other risks is undertaken in the normal course of business. Climate-related risks Risks associated with climate change and the transition to a lower carbon economy impact many elements of our strategy and, as such, these risks are considered through key business processes including agreeing the strategy, annual plan, capital allocation and investment decisions. The outputs of these key business processes are reviewed in line with the cadence of these activities. Further details are described in Climate-related financial disclosures on page 55. Strategic and commercial risks Financial liquidity External market conditions can impact our financial performance. Supply and demand and the prices achieved for our products can be affected by a wide range of factors including Risk oversight and governance Key risk oversight and governance committees include the following: Leadership team and its committees • Leadership team meeting – for oversight and for strategic and commercial risks. • Group operations risk committee – for health, safety, security, environment and operations integrity risks. • Group financial risk committee – for finance, treasury, trading and cyber risks. • Group disclosure committee – for financial reporting risks. • People and culture committee – for employee risks. • Group ethics and compliance committee – for legal and regulatory compliance and ethics risks. • Group sustainability committee – for non-operational sustainability risks. • Resource commitment meeting – for investment decision risks. • bp quarterly internal audit meeting – for assurance on the oversight of bp’s principal risks. Board and its committees • bp board. • Audit committee. • Safety and sustainability committee. • Remuneration committee. • People and governance committee. For Board activities see page 90, bp governance framework see page 92 and committee reports see pages 104-117 Risk management processes We aim for a consistent basis of measuring risk to: • Establish a common understanding of risks on a like-for-like basis, taking into account potential impact and likelihood. • Report risks and their management to the appropriate levels of the organization.

75 Strategic report bp Annual Report and Form 20-F 2021 See glossary on page 377 political developments, consumer preferences for low carbon energy, global economic conditions and the influence of OPEC+. We seek to manage this risk through bp’s diversified portfolio, our financial framework, liquidity stress testing, maintaining a significant cash buffer, regular reviews of market conditions and our planning and investment processes. See Energy markets, page 8 and Liquidity, financial capacity and financial, including credit, exposure, page 76 The impact of COVID-19 The continued impacts of COVID-19, including the impacts of measures implemented around the world in response to the pandemic, have contributed to significant volatility in the oil and gas prices and refining margins. bp’s future financial performance will be impacted by the extent and duration of the current market conditions and the effectiveness of the actions that it and others take, including its financial interventions. Our financial frame is designed to be robust to periods of low price, whether or not due to COVID-19, with flexibility to reduce cost and capital expenditure if required. COVID-19 can also have operational impacts. We continue to monitor the impact of COVID-19 on our employees and operations and have instigated and maintained mitigation plans where the business considers them necessary. Cyber security Both targeted and indiscriminate threats to the security of our digital infrastructure and those of third parties continue to evolve rapidly and are increasingly prevalent across industries worldwide. We seek to manage this risk through a range of measures, which include cyber security standards, security protection tools, ongoing detection and monitoring of threats and testing of cyber response and recovery procedures. We collaborate with governments, law enforcement agencies and industry peers to understand and respond to new and emerging cyber threats. We build awareness with our employees, share information on incidents with leadership for continuous learning and conduct regular exercises including with the leadership team to test response and recovery procedures. Geopolitical The diverse locations of our business activities and operations around the world expose us to a wide range of political developments and consequent changes to the economic and operating environment. Geopolitical risk is inherent to many regions in which we operate, and heightened political or social tensions or changes in key relationships could adversely affect the group. We seek to manage this risk through development and maintenance of relationships with governments and stakeholders and by being trusted partners in each country and region. In addition, we closely monitor events and implement risk mitigation plans where deemed appropriate. bp’s exit from its businesses in Russia bp announced it will exit its 19.75% shareholding in Rosneft and its other businesses with Rosneft in Russia. This decision was approved by the bp board on 27 February 2022. In response to the conflict in Ukraine, bp’s business continuity plans have been activated and executive, country and business support teams have been established. We continue to monitor impacts to our people and our operations, and mitigation plans are being implemented where needed. For further information see the segmental overviews on pages 3, 48 and 49. Safety and operational risks Process safety, personal safety and environmental risks The nature of the group’s operating activities exposes us to a wide range of significant health, safety and environmental risks such as incidents associated with releases of hydrocarbons when drilling wells, operating facilities and transporting hydrocarbons. Our operating management system helps us manage these risks and drive performance improvements. It sets out the standards and requirements which govern key risk management activities such as inspection, maintenance, testing, business continuity and crisis response planning and competency development. In addition, we conduct our drilling activity through a wells organization in order to promote a consistent approach for designing, constructing and managing wells. Security Hostile acts such as terrorism or piracy could harm our people and disrupt our operations. We monitor for emerging threats and vulnerabilities to manage our physical and information security. Our intelligence, security and crisis management teams provide strategic and operational risk management to our businesses through a network of regional security managers who provide front line risk management as well as conduct assurance activities through a team independent of the business. We continue to monitor threats globally and maintain disaster recovery, crisis and business continuity management plans. Compliance and control risks Ethical misconduct and legal or regulatory non-compliance Ethical misconduct or breaches of applicable laws or regulations could damage our reputation, result in litigation, regulatory action and penalties, adversely affect results and shareholder value, and potentially affect our licence to operate. Our code of conduct and our values and behaviours, applicable to all employees, are central to managing this risk. Additionally, we have various group requirements and training covering areas such as anti-bribery and corruption, anti-money laundering, competition/ anti-trust law and international trade regulations. We seek to keep abreast of new regulations and legislation that could materially affect the implementation of our strategy or business and plan our response to them. We offer an independent confidential helpline, OpenTalk, for employees, contractors and other third parties. Trading non-compliance In the normal course of business, we are subject to risks around our trading activities which could arise from shortcomings or failures in our systems, risk management methodology, internal control processes or employee conduct. We have specific operating standards and control processes to manage these risks, including guidelines specific to trading, and seek to monitor compliance through our dedicated compliance teams. We also seek to maintain a positive and collaborative relationship with regulators and the industry at large.

76 bp Annual Report and Form 20-F 2021 How we manage risk and risk factors continued Risk factors Strategic and commercial risks Prices and markets – our financial performance is impacted by fluctuating prices of oil, gas and refined products, technological change, exchange rate fluctuations, and the general macroeconomic outlook. Oil, gas and product prices are subject to international supply and demand and margins can be volatile. Political developments, increased supply from new oil and gas or alternative low carbon energy sources, technological change, global economic conditions, public health situations (including the continued impact of the COVID-19 pandemic or any future epidemic or pandemic), the introduction of new carbon costs and the influence of OPEC+ can impact supply and demand and prices for our products. Decreases in oil, gas or product prices could have an adverse effect on revenue, margins, profitability and cash flows. If these reductions are significant or for a prolonged period, we may have to write down assets and reassess the viability of certain projects, which may impact future cash flows, profit, capital expenditure, the ability to work within our financial frame and maintain our long-term investment programme. Conversely, an increase in oil, gas and product prices may not improve margin performance as there could be increased fiscal take, cost inflation and more onerous terms for access to resources. The profitability of our refining activities can be volatile, with periodic over-supply or supply tightness in regional markets and fluctuations in demand. Exchange rate fluctuations can create currency exposures and impact underlying costs and revenues. Crude oil prices are generally set in US dollars, while products vary in currency. Many of our major project development costs are denominated in local currencies, which may be subject to fluctuations against the US dollar. Accessing and progressing hydrocarbon resources and low carbon opportunities – inability to access and progress hydrocarbon resources and low carbon opportunities could adversely affect delivery of our strategy. Delivery of our strategy depends partly on our ability to progress hydrocarbon resources from our existing portfolio and access new resources in our existing core regions. Our ability to progress upstream resources and develop technologies at a level in line with our strategic outlook for hydrocarbon production could impact our future production and financial performance. Furthermore, our ability to access low carbon opportunities and the commercial terms associated with those opportunities could impact our financial performance and the pace of our transition to an integrated energy company in line with our strategy. Major project delivery – failure to invest in the best opportunities or deliver major projects successfully could adversely affect our financial performance. We face challenges in developing major projects, particularly in geographically and technically challenging areas. Poor investment choice, efficiency or delivery, or operational challenges at any major project that underpins production or production growth, could adversely affect our financial performance. Geopolitical – exposure to a range of political developments and consequent changes to the operating and regulatory environment could cause business disruption. We operate and may seek new opportunities in countries, regions and cities where political, economic and social transition may take place. Political instability, changes to the regulatory environment or taxation, international trade disputes and barriers to free trade, international sanctions, expropriation or nationalization of property, civil strife, strikes, insurrections, acts of terrorism, acts of war and public health situations (including the continued impact of the COVID-19 pandemic or any future epidemic or pandemic) may disrupt or curtail our operations, business activities or investments. These may in turn cause production to decline, limit our ability to pursue new opportunities, affect the recoverability of our assets and our related earnings and cash flow or cause us to incur additional costs, particularly due to the long-term nature of many of our projects and significant capital expenditure required. Events in, or relating to Russia and the conflict in Ukraine, including trade restrictions, international sanctions or any other actions taken by governmental authorities or other relevant persons will adversely impact our income and investment in or relating to Russia and could impact our ability to exit our interests in Rosneft and our other businesses with Rosneft within Russia, and the value we can realise for those interests. Liquidity, financial capacity and financial, including credit, exposure – failure to work within our financial framework could impact our ability to operate and result in financial loss. Failure to accurately forecast or work within our financial framework could impact our ability to operate and result in financial loss. Trade and other receivables, including overdue receivables, may not be recovered, divestments may not be successfully completed and a substantial and unexpected cash call or funding request could disrupt our financial framework or overwhelm our ability to meet our obligations. An event such as a significant operational incident, legal proceedings or a geopolitical event in an area where we have significant activities, could reduce our financial liquidity and our credit ratings. Credit rating downgrades could potentially increase financing costs and limit access to financing or engagement in our trading activities on acceptable terms, which could put pressure on the group’s liquidity. The risks discussed below, separately or in combination, could have a material adverse effect on the implementation of our strategy, our business, financial performance, results of operations, cash flows, liquidity, prospects, shareholder value and returns and reputation.

77 Strategic report bp Annual Report and Form 20-F 2021 See glossary on page 377 They could also potentially require the company to review the funding arrangements with the bp pension trustees. In the event of extended constraints on our ability to obtain financing, we could be required to reduce capital expenditure or increase asset disposals in order to provide additional liquidity. See Liquidity and capital resources, page 342 and Financial statements – Note 28 Joint arrangements and contractors – varying levels of control over the standards, operations and compliance of our partners, contractors and sub-contractors could result in legal liability and reputational damage. We conduct many of our activities through joint arrangements, associates or with contractors and sub-contractors where we may have limited influence and control over the performance of such operations. Our partners and contractors are responsible for the adequacy of their resources and capabilities. If these are found to be lacking, there may be financial, operational or safety exposures for bp. Should an incident occur in an operation that bp participates in, our partners and contractors may be unable or unwilling to fully compensate us against costs we may incur on their behalf or on behalf of the arrangement. Where we do not have operational control of a venture or direct oversight of contractor activity, we may still be pursued by regulators or claimants in the event of an incident. Digital infrastructure, cyber security and data protection – breach or failure of our or third parties’ digital infrastructure or cyber security, including loss or misuse of sensitive information could damage our operations, increase costs and damage our reputation. The energy industry is subject to fast-evolving risks, including ransomware, from cyber threat actors, including nation states, criminals, terrorists, hacktivists and insiders. Current geopolitical factors have increased these risks. There is also growing regulation around data protection and data privacy. A breach or failure of our or third parties’ digital infrastructure – including control systems – due to breaches of our cyber defences, or those of third parties, negligence, intentional misconduct or other reasons, could seriously disrupt our operations. This could result in the loss or misuse of data or sensitive information, including employees’ and customers’ personal data, injury to people, disruption to our business, harm to the environment or our assets, legal or regulatory breaches, legal liability and significant costs including fines, cost of remediation or reputational consequences. Furthermore, the rapid detection of attempts to gain unauthorized access to our digital infrastructure, often through the use of sophisticated and co-ordinated means, is a challenge and any delay or failure to detect could compound these potential harms. Climate change and the transition to a lower carbon economy – developments in policy, law, regulation, technology and markets, including societal and investor sentiment, related to the issue of climate change could increase costs, reduce revenues, constrain our operations and affect our business plans and financial performance. Laws, regulations, policies, obligations, government actions, social attitudes and customer preferences relating to climate change and the transition to a lower carbon economy, including the pace of change to any of these factors, and also the pace of the transition itself, could have adverse impacts on our business including on our access to and realization of competitive opportunities in any of our strategic focus areas, a decline in demand for, or constraints on our ability to sell certain products, constraints on production and supply, adverse litigation and regulatory or litigation outcomes, increased costs from compliance and increased provisions for environmental and legal liabilities. Investor preferences and sentiment are influenced by environmental, social and corporate governance (ESG) considerations including climate change and the transition to a lower carbon economy. Changes in those preferences and sentiment could affect our access to capital markets and our attractiveness to potential investors, potentially resulting in reduced access to financing, increased financing costs and impacts upon our business plans and financial performance. Technological improvements or innovations that support the transition to a lower carbon economy, and customer preferences or regulatory incentives that alter fuel or power choices, could impact demand for oil and gas. Depending on the nature and speed of any such changes and our response, these changes could increase costs, reduce our profitability, reduce demand for certain products, limit our access to new opportunities, require us to write down certain assets or curtail or cease certain operations, and affect investor sentiment, our access to capital markets, our competitiveness and financial performance. Policy, legal regulatory, technological and market developments related to climate change could also affect future price assumptions used in the assessment of recoverability of asset carrying values including goodwill, the judgement as to whether there is continued intent to develop exploration and appraisal intangible assets, the timing of decommissioning of assets and the useful economic lives of assets used for the calculation of depreciation and amortization. See Climate-related financial disclosures, page 55 and Financial statements – Note 1 Competition – inability to remain efficient, maintain a high-quality portfolio of assets and innovate could negatively impact delivery of our strategy in a highly competitive market. Our strategic progress and performance could be impeded if we are unable to control our development and operating costs and margins, if we fail to scale our businesses at pace, or to sustain, develop and operate a high-quality portfolio of assets efficiently. Furthermore, as we transition from an international oil company to an integrated energy company, we face an expanded and rapidly evolving range of competitors in the sectors in which we operate. We could be adversely affected if competitors offer superior terms for access rights or licences, or if our innovation in areas such as new low carbon technologies, digital, customer offer, exploration, production, refining, manufacturing or renewable energy lags behind those of our competitors. Our performance could also be negatively impacted if we fail to protect our intellectual property. Talent and capability – inability to attract, develop and retain people with necessary skills and capabilities could negatively impact delivery of our strategy. The sectors in which we operate face increasing challenges to attract and retain diverse, skilled and capable talent. An inability to successfully recruit, develop and retain core skills and capabilities and to reskill existing talent could negatively impact delivery of our strategy.

78 bp Annual Report and Form 20-F 2021 How we manage risk and risk factors continued Crisis management and business continuity – failure to address an incident effectively could potentially disrupt our business. Our business activities could be disrupted if we do not respond, or are perceived not to respond, in an appropriate manner to any major crisis or if we are not able to restore or replace critical operational capacity. Insurance – our insurance strategy could expose the group to material uninsured losses. bp generally purchases insurance only in situations where this is legally and contractually required. Some risks are insured with third parties and reinsured by group insurance companies. Uninsured losses could have a material adverse effect on our financial position, particularly if they arise at a time when we are facing material costs as a result of a significant operational event which could put pressure on our liquidity and cash flows. Safety and operational risks Process safety, personal safety, and environmental risks – exposure to a wide range of health, safety, security and environmental risks could cause harm to people, the environment and our assets and result in regulatory action, legal liability, business interruption, increased costs, damage to our reputation and potentially denial of our licence to operate. Technical integrity failure, natural disasters, extreme weather or a change in its frequency or severity, human error and other adverse events or conditions, including breach of digital security, could lead to loss of containment of hydrocarbons or other hazardous materials. This could also lead to constrained availability of resources used in our operating activities, as well as fires, explosions or other personal and process safety incidents, including when drilling wells, operating facilities and those associated with transportation by road, sea or pipeline. There can be no certainty that our operating management system or other policies and procedures will adequately identify all process safety, personal safety and environmental risks or that all our operating activities, including acquired businesses, will be conducted in conformance with these systems. See Safety, page 69 Such events or conditions, including a marine incident, or inability to provide safe environments for our workforce and the public while at our facilities, premises or during transportation, could lead to injuries, loss of life or environmental damage. As a result we could face regulatory action and legal liability, including penalties and remediation obligations, increased costs and potentially denial of our licence to operate. Our activities are sometimes conducted in hazardous, remote or environmentally sensitive locations, where the consequences of such events or conditions could be greater than in other locations. Drilling and production – challenging operational environments and other uncertainties could impact drilling and production activities. Our activities require high levels of investment and are sometimes conducted in challenging environments such as those prone to natural disasters and extreme weather, which heightens the risks of technical integrity failure. The physical characteristics of an oil or natural gas field, and cost of drilling, completing or operating wells is often uncertain. We may be required to curtail, delay or cancel drilling operations or stop production because of a variety of factors, including unexpected drilling conditions, pressure or irregularities in geological formations, equipment failures or accidents, adverse weather conditions and compliance with governmental requirements. Security – hostile acts against our employees and activities could cause harm to people and disrupt our operations. Acts of terrorism, piracy, sabotage and similar activities directed against our operations and facilities, pipelines, transportation or digital infrastructure could cause harm to people and severely disrupt operations. Our activities could also be severely affected by conflict, civil strife or political unrest. Product quality – supplying customers with off-specification products could damage our reputation, lead to regulatory action and legal liability, and impact our financial performance. Failure to meet product quality specifications could cause harm to people and the environment, damage our reputation, result in regulatory action and legal liability, and impact financial performance.

79 Strategic report bp Annual Report and Form 20-F 2021 See glossary on page 377 Compliance and control risks Ethical misconduct and non-compliance – ethical misconduct or breaches of applicable laws by our businesses or our employees could be damaging to our reputation, and could result in litigation, regulatory action and penalties. Incidents of ethical misconduct or non- compliance with applicable laws and regulations, including anti-bribery and corruption, competition and antitrust, and anti-fraud laws, trade restrictions or other sanctions, could damage our reputation, and result in litigation, regulatory action, penalties and potentially affect our licence to operate. In relation to trade restrictions or other sanctions, current geopolitical factors have increased these risks. Regulation – changes in the law and regulation could increase costs, constrain our operations and affect our business plans and financial performance. Our businesses and operations are subject to the laws and regulations applicable in each country, state or other regional or local area in which they occur. These laws and regulations result in an often complex, uncertain and changing legal and regulatory environment for our global businesses and operations. Changes in laws or regulations, including how they are interpreted and enforced, can and does impact all aspects of our business. Royalties and taxes, particularly those applied to our hydrocarbon activities, tend to be high compared with those imposed on similar commercial activities. In certain jurisdictions there is also a degree of uncertainty relating to tax law interpretation and changes. Governments may change their fiscal and regulatory frameworks in response to public pressure on finances, resulting in increased amounts payable to them or their agencies. Changes in law or regulation could increase the compliance and litigation risk and costs, reduce our profitability, reduce demand for or constrain our ability to sell certain products, limit our access to new opportunities, require us to divest or write down certain assets or curtail or cease certain operations, or affect the adequacy of our provisions for pensions, tax, decommissioning, environmental and legal liabilities. Changes in laws or regulations could result in the nationalization, expropriation, cancellation, non- renewal or renegotiation of our interests, assets and related rights. Potential changes to pension or financial market regulation could also impact funding requirements of the group. Following the Gulf of Mexico oil spill, we may be subjected to a higher level of fines or penalties imposed in relation to any alleged breaches of laws or regulations, which could result in increased costs. See Regulation of the group’s business, page 356 Trading and treasury trading activities – ineffective oversight of trading and treasury trading activities could lead to business disruption, financial loss, regulatory intervention or damage to our reputation and affect our permissions to trade. We are subject to operational risk around our trading and treasury trading activities in financial and commodity markets, some of which are regulated. Failure to process, manage and monitor a large number of complex transactions across many markets and currencies while complying with all regulatory requirements could hinder profitable trading opportunities. There is a risk that a single trader or a group of traders could act outside of our delegations and controls, leading to regulatory intervention and resulting in financial loss, fines and potentially damaging our reputation, and could affect our permissions to trade. See Financial statements – Note 28 Reporting – failure to accurately report our data could lead to regulatory action, legal liability and reputational damage. External reporting of financial and non-financial data, including reserves estimates, relies on the integrity of the control environment, our systems and people operating them. Failure to report data accurately and in compliance with applicable standards could result in regulatory action, legal liability and damage to our reputation.

80 bp Annual Report and Form 20-F 2021 Compliance information Section 172 statement In accordance with the requirements of Section 172 of the Companies Act 2006 (‘the Act’), the directors consider that, during the financial year ended 31 December 2021, they have acted in a way that they consider, in good faith, would most likely promote the success of the company for the benefit of its members as a whole, having regard to the likely consequences of any decision in the long term and the broader interests of other stakeholders, as required by the Act. See page 97 for more information in support of this statement, including a description of the board’s activities during 2021. bp non-financial reporting information statement Produced in compliance with Sections 414CA and 414CB of the Companies Act. Information incorporated by cross reference. Requirement Relevant policies and standards Information related to policies, any due diligence process and the outcome (a-e) a. Environmental matters • Net zero aims • TCFD (governance and risk management) • Sustainability frame • Biodiversity position (online) • Climate-related financial disclosures– pages 55-66. • Caring for our planet aims – page 68. • Our operating management system (OMS) – page 69. • Decision making by the board – page 97. b. Employees • Reinvent bp guidelines • bp values and code of conduct (online) • Our people – pages 71-72. • Safety – pages 69-71 • Our values and code of conduct – page 69. • Employee engagement (Pulse survey) – page 72. • How the board engaged with stakeholders (workforce) – pages 93-96. c. Social matters • Sustainability frame • Caring for our planet – page 68. • Our operating management system – page 69. • Improving people’s lives – page 67. • Decision making by the board – page 97. d. Respect for human rights • Business and human rights policy (online) • Modern slavery statement (online) • Labour rights and modern slavery principles (online) • Code of conduct (online) • Human rights – page 67. • Our values and code of conduct – page 69. e. Anti-corruption and anti-bribery • Anti-bribery and corruption policy • Code of conduct (online) • Ethics and compliance – page 72. • Our partners in joint arrangements – page 71. Description of principal risks relating to matters (a-e above) • How we manage risk – pages 73-75. • Risk factors – pages 76-79. • TCFD (climate-related risk management) – page 65. Relevant information Business model description • Business model – pages 12-15. Description of non-financial KPIs • Measuring our progress – pages 24, 26-27. TCFD index table Our expanded TCFD disclosures can be found on the following pages. TCFD Recommendation TCFD Recommended Disclosure Where reported Governance Disclose the organization’s governance around climate-related issues and opportunities. a. Describe the board’s oversight of climate-related risks and opportunities. • Pages 55-57. b. Describe the management’s role in assessing and managing climate-related risks and opportunities. • Page 57-58. Strategy Disclose the actual and potential impacts of climate-related risks and opportunities on the organization’s business, strategy and financial planning where such information is material. a. Describe the climate-related risks and opportunities the organization has identified over the short, medium, and long term. • Pursuing a strategy that is consistent with the Paris goals, page 30. • Strategy – page 58-60. • Risk factors, page 76. b. Describe the impact of climate-related risks and opportunities on the organization’s businesses, strategy, and financial planning. • Risk factors, page 76 – description of principal risks. • Strategy – page 58-60. c. Describe the resilience of the organization’s strategy, taking into consideration different climate-related scenarios, including a 2°C or lower scenario. • Strategy, page 58-60. • Pursuing a strategy that is consistent with the Paris goals, page 30. Risk management Disclose how the organization identifies, assesses and manages climate-related risks. a. Describe the organization’s processes for identifying and assessing climate-related risks. • Risk management – page 65. • How we manage risk, pages 73. • Risk factors – page 76. b. Describe the organization’s processes for managing climate-related risks. • Risk management, pages 65. • How we manage risk, page 73. c. Describe how processes for identifying, assessing, and managing climate-related risks are integrated into the organization’s overall risk management. • Risk management, pages 65. • How we manage risk, page 73. • Risk factors – pages 76. Metrics and targets Disclose the metrics and targets used to assess and manage relevant climate-related risks and opportunities where such information is material. a. Disclose the metrics used by the organization to assess climate- related risks and opportunities in line with its strategy and risk management process. • Our strategic focus areas and metrics, page 16. • Our group-wide principal metrics and relevant targets – page 66. b. Disclose Scope 1, Scope 2, and, if appropriate, Scope 3 GHG emissions, and the related risks. • GHG emissions data – pages 51-54. c. Describe the targets used by the organization to manage climate- related risks and opportunities and performance against targets. • Our net zero targets and aims at a glance – pages 51. The Strategic report was approved by the board and signed on its behalf by Ben J.S.Mathews, company secretary, on 18 March 2022

81 Corporate governance bp Annual Report and Form 20-F 2021 Corporate governance Introduction from the chair 82 Board of directors 84 Leadership team 88 Board activities and governance framework 90 How the board has engaged with shareholders, the workforce and other stakeholders 93 Decision making by the board 97 Learning, development and induction 100 Board evaluation 102 People and governance committee 104 Audit committee 107 Safety and sustainability committee 114 Directors’ remuneration report 116 Remuneration committee 116

82 bp Annual Report and Form 20-F 2021 Introduction from the chair Dear fellow shareholders, It has now been two years since bp set out its new purpose, ambition and aims – shortly followed by a new strategy and financial and sustainability frames. Within just a few weeks of bp launching its new direction, the world was struck by a global pandemic. As we said in last year’s annual report, it was a period in which the board felt especially keenly its responsibilities for overseeing the delivery of the new strategy and for monitoring the performance of the new organization. Turning to 2021, this was a year of further change – the reinvention of bp, helping to ensure that we have the right skills and capabilities in support of the energy transition, while delivering on our investor proposition and increasing distributions to shareholders. At the beginning of the year, we put in place a new governance framework underpinning the board’s role and its responsibilities to its shareholders. Founded upon four pillars – Strategy, People, Performance, and Governance – this new framework has stood up well against the challenges of the pandemic and a rapidly evolving and increasingly complex external environment. Commissioning an independent effectiveness review of the board in 2021 provided an objective view of the performance of the board operating against that framework. It proposed some areas for focus as we seek to continue modernizing our approach. Details are set out on page 104. In February 2022, bp’s governance was tested once again, this time by Russia’s attack on Ukraine. Within days of military action, the board had met, undertaken a thorough process of review, and after careful consideration announced bp’s decision to exit from its shareholding of Rosneft in Russia. bp’s governance framework provided the clarity and flexibility we needed to act decisively and promptly, having satisfied ourselves that to do so was in the long-term interests of the company’s shareholders. 2021 was a year of further change – the re-invention of bp, helping to ensure that we have the right skills and capabilities in support of the energy transition, while delivering on our investor proposition and increasing distributions to shareholders. Helge Lund Chair Extensive engagement One of the privileges of serving on bp’s board is being able to meet such a variety of people, with different roles, backgrounds and experiences, and in so many places around the world – inside and outside bp. Our formal engagement programme allowed the board to meet people based in the tropical rainforests of West Papua, the Abu Dhabi desert, our US retail stations, a refinery in Spain, and our Indian offices – to highlight just a fraction. These were mostly digital meetings, but the gradual lifting of lockdown restrictions opened opportunities to visit bp’s new EV charging infrastructure on London’s Park Lane, colleagues in front-line roles during a visit to Aberdeen, and representatives from the local community surrounding our proposed low carbon hydrogen projects on Teesside in England. Our investors are also a vital part of bp’s community. We have spent a great deal of time with them, seeking their views on matters ranging from our climate strategy to board governance, diversity and to remuneration. Discussion with our investors ultimately helped to inform the adjustments we announced to some of our net zero aims on 8 February 2022, and our decision to offer shareholders a vote on bp Net zero ambition report. We are hugely grateful for these important engagement opportunities. Diversity, equity and inclusion One of the most striking conversations we had in 2021 was with a range of UK and US colleagues representing ethnic minority groups. Hearing people, some of whom had worked with bp for more than 20 years, reflect on changing attitudes over that period was enlightening, but also encouraging. It was clear that there is still work to do in improving diversity and promoting inclusion across bp.

83 Corporate governance bp Annual Report and Form 20-F 2021 The need to improve diversity is why in 2021 the board introduced a diversity policy of its own. I believe board diversity matters; it sets the tone for the rest of the organization and allows us to draw upon a variety of experiences and perspectives. I am pleased that bp’s board already meets the FTSE Women Leaders Review targets of 40% for representation of women and a female appointed to the position of senior independent director. We have also met the Parker Review’s target for black and minority ethnic directors. But I believe bp should consider all dimensions of diversity. Our new diversity policy sets a standard from which we will build. It will see the board encouraging an inclusive environment and overseeing a diverse succession pipeline – among other important commitments. In addition, bp has expanded its gender ambition to cover all levels of the business and the board will oversee bp’s progress. The board has also increased its focus on the talent management and development of all bp’s people. Evolution of board During 2021, we said goodbye to two longstanding board members who served bp and its shareholders with distinction. Professor Dame Ann Dowling and Brendan Nelson stood down after nine and 11 dedicated years’ service, respectively. We are grateful to Brendan for continuing beyond the nine-year tenure to properly hand over his role as chair of the audit committee to Tushar Morzaria. We were pleased to welcome Karen Richardson and Johannes Teyssen to the board. Karen has brought exceptional knowledge of technology, start-ups and cybersecurity, and a digital mindset honed during a career in Silicon Valley. Johannes’s long experience leading one of Europe’s largest energy companies means he brings deep and valued knowledge of our sector and its continuing transformation. Closing thanks Many people contributed to bp’s success in 2021 – our suppliers, our strategic partners, and, of course, our customers. It would be impossible to thank everyone, but I do want to mention three groups. First, I am deeply grateful to bp’s investors, especially those of you who in 2021 shared your views on bp’s direction, whether through voting, in writing, or in conversation with the board. We look forward to repaying the faith you have placed in this company. Second, my fellow directors. They have made a strong contribution to bp through a challenging period. Third, Bernard and his leadership team, for all they have achieved so far, and for how they have achieved it – with characteristic determination. But perhaps the greatest thanks should go to bp’s people. I could not hope for a better team to entrust the challenge of reimagining energy for people and our planet. Thank you for all you do for bp. Helge Lund Chair 18 March 2022

Board gender diversity 1. Male 2. Female 6 4 1. 2. Non executive directors’ tenure 1. 2. 1. 1–3 years 2. 4–6 years 5 3 Board nationality 1. 2. 1. UK 2. US 2 4 3. Non UK/US 4 3. 84 bp Annual Report and Form 20-F 2021 Board of directors As at 18 March 2022 P Helge Lund Chair Appointed Board: 26 July 2018; Chair: 1 January 2019 Nationality Norwegian Outside interests Chair of Novo Nordisk AS; Operating advisor to Clayton Dubilier & Rice; Member of the Board of Trustees of the International Crisis Group; Member of the European Round Table for Industry; Mentor at Chair Mentors International Career summary Helge Lund was appointed chair of the bp board on 1 January 2019. He served as chief executive of BG Group from 2015 to 2016, when it merged with Shell. He joined BG Group from Equinor (formerly Statoil) where he served as its president and chief executive officer for 10 years from 2004. Prior to Equinor, Helge was president and chief executive officer of the industrial conglomerate Aker Kvaerner, and has also held executive positions in the Norwegian industrial holding company, Aker RGI, and the former Norwegian power and industry company, Hafslund Nycomed. He worked as a consultant with McKinsey & Company and served as a political advisor for the parliamentary group of the Conservative party in Norway. Prior to joining bp, he was a non-executive director of the oil service group Schlumberger from 2016 to 2018, and Nokia from 2011 to 2014. He served as a member of the United Nations Secretary-General’s Advisory Group on Sustainable Energy from 2011 to 2014. Skills and experience Helge’s distinguished career as a leader in the energy industry and his open-minded and forward-looking approach is vital as he leads the board in its oversight of the delivery of bp’s new strategy. He has deep industry knowledge and global business experience – not only in the oil and gas industry but also in pharmaceuticals, healthcare and construction. His innovative leadership of the board drives cohesion and a strong environment for constructive challenge and oversight as bp works to transform into an integrated energy company. P Bernard Looney Chief executive officer Appointed 5 February 2020 Nationality Irish Outside interests Fellow of the Royal Academy of Engineering; Fellow of the Energy Institute; Mentor for the FTSE 100 Cross-Company Mentoring Executive Programme Career summary Bernard Looney was appointed chief executive officer in February 2020. He previously ran bp’s Upstream business from April 2016 and has been a member of the company’s executive management team since November 2010. As chief executive, Upstream, Bernard was responsible for bp’s oil and gas exploration, development and production activities worldwide. In this role, Bernard oversaw improvements in both process and personal safety performances, and production grew by 20%. He led access into new countries, high-graded the portfolio and created innovative new business models. In earlier Upstream executive roles, he was responsible for all bp-operated oil and gas production worldwide and for all bp’s drilling and major project activity. Bernard joined bp in 1991 as a drilling engineer and worked in operational roles in the North Sea, Vietnam and the Gulf of Mexico. Skills and experience Bernard has spent his career at bp and has demonstrated dynamic leadership and vision while progressing through various roles. During his 10 years as a leader of Upstream, Bernard saw the segment through one of the most difficult periods in bp’s history, helping transform the organization into a safer, stronger and more resilient business. He has been instrumental in a number of workforce-based initiatives to promote a diverse and inclusive environment. Bernard set out bp’s new strategy in 2020 and is guiding the company through its transformation from international oil company to integrated energy company. Committee membership key Chair A Audit committee S Safety and sustainability committee R Remuneration committee P People and governance committee

85 Corporate governance bp Annual Report and Form 20-F 2021 P Murray Auchincloss Chief financial officer Appointed 1 July 2020 Nationality Canadian Outside interests Board member of Aker BP ASA; Member of The 100 Group Main Committee Career summary Murray Auchincloss qualified as a chartered financial analyst in the US, leading on to a wide range of tax and financial roles, first for Amoco and then for bp after the two organizations merged in 1998. Murray has worked in both the US and UK, in a range of roles including chief financial officer, Upstream, and chief financial officer, North Sea. He held responsibility for the company’s North American Gas business and, as head of the chief executive’s office for three years, managed all aspects of that office and the executive process. As chief financial officer, Murray heads up finance, tax, treasury, planning and performance management, mergers and acquisitions, investor relations, audit, global business services and procurement. Murray is currently a member of the board of directors for Aker BP ASA, Norway, and a member of The 100 Group Main Committee. Skills and experience Murray’s financial expertise, experience and knowledge make him a trusted advisor and Group leader. His broad experience of working across the group has provided him with deep insight into bp’s assets and businesses. Murray has a degree in commerce from the University of Calgary, Canada, and qualified as a chartered financial analyst at the University of West Virginia, US. His drive to modernize is improving bp’s financial teams, controlling costs and continuing to deliver transparent financial disclosures to investors and markets. A R Pamela Daley Independent non-executive director Appointed 26 July 2018 Nationality American Outside interests Director of BlackRock, Inc.; Director of SecureWorks, Inc. Career summary Pamela Daley joined General Electric Company (GE) in 1989 as tax counsel and held a number of senior executive roles in the company, including senior vice president of business development from 2004 to 2013 overseeing a wide range of corporate transactions, and serving as senior vice president and senior advisor to the chair in 2013, before retiring from GE at the end of 2013. Pamela has served as a director of BlackRock since 2014 and of SecureWorks since 2016. She was a director of BG Group plc from 2014 to 2016 until its acquisition by Shell. She was a director of Patheon N.V. from 2016 to 2017 until its acquisition by Thermo Fisher. Prior to joining GE, she was a partner at Morgan, Lewis & Bockius, a major US law firm, where she specialized in domestic and cross-border tax-oriented financings and commercial transactions. Skills and experience Pamela is a qualified lawyer with significant management insight obtained from previous senior positions held at companies that operate in highly regulated industries. Pamela has a wealth of experience in global business and strategy gained from over 20 years in an executive role at GE. She also has experience in the UK oil and gas industry from her time served on the BG Group plc board. Pamela contributes important insight to the audit committee from her previous executive experience. In 2019, she joined the remuneration committee, where her understanding of employee and investor perspectives brings value. R A P Paula Rosput Reynolds Senior independent director Appointed Board: 14 May 2015; senior independent director: 27 May 2020 Nationality American Outside interests Director and chair of National Grid plc; Non-executive director of General Electric Company; Chair of the Seattle Cancer Care Alliance Career summary Paula Rosput Reynolds started her energy career at Pacific Gas & Electric Corp in 1979 and spent over 25 years in the energy industry. She has held a number of executive positions during her career, including CEO of Duke Energy Power Services; chair, president and CEO of AGL Resources; chair and CEO of Safeco Corporation; and vice chair and chief restructuring officer of AIG. Paula was previously a non-executive director of TransCanada Corporation, CBRE Group, Inc, BAE Systems PLC, Anadarko Petroleum, Delta Air Lines and Coca Cola Enterprises. Paula was awarded the National Association of Corporate Directors (US) Lifetime Achievement Award in 2014. She was appointed chair of National Grid plc in 2021. Skills and experience Paula has had a long career leading global companies in the energy and financial sectors. Her experience with international and US companies, including several restructuring processes and mergers, gives her insight into strategic and regulatory issues, which is an asset to the board. Her wider business experience and understanding of the views of investors make her well-suited to her roles as chair of bp’s remuneration committee and senior independent director.

86 bp Annual Report and Form 20-F 2021 Board of directors continued As at 18 March 2022 A R Tushar Morzaria Independent non-executive director Appointed 1 September 2020 Nationality British Outside interests Group finance director of Barclays plc; Member of The 100 Group Main Committee; Chair of the Sterling Risk-Free Reference Rates Working Group Career summary Tushar Morzaria is a chartered accountant with over 25 years of strategic financial management, investment banking, operational and regulatory relations experience. He will step down from his current role as group finance director and member of the board of Barclays plc, the British universal banking and financial services company, in April 2022. Prior to joining Barclays in 2013, Tushar held various senior roles at JP Morgan including the CFO of its Corporate & Investment Bank at the time of the merger of the investment bank and the wholesale treasury/ security services business. Tushar will be joining the board of Legal & General Group plc as a non-executive director from May 2022. Skills and experience Tushar’s position as group finance director of Barclays PLC gives him a breadth of knowledge and insight into financial, tax, treasury, investor relations and strategic matters which provides benefit to Tushar’s role as the audit committee chair. He has strong experience in delivering corporate change programmes while maintaining a focus on performance. A Karen Richardson Independent non-executive director Appointed 1 January 2021 Nationality American Outside interests Chair of Origin Materials Inc.; Partner at Artius Capital Partners; Director of Exponent Inc.; Director of Doma Holdings, Inc. Career summary Karen Richardson was vice president of sales at Netscape Communications Corporation from 1995 to 1998 before embarking on several senior executive roles at E.piphany from 1998 to 2003 and was chief executive officer between 2003 and 2006. In 2011 she became a non-executive director of BT plc where she served for seven years and between 2016 and 2019 Karen was a director of Worldpay Inc. (Worldpay Group plc). Karen is currently chair at Origin Materials and a director of Doma Holdings. She has also been a director of Exponent Inc., the engineering and scientific consulting company, since 2013. Karen has a Bachelor of Science degree in Industrial Engineering from Stanford University and was awarded distinctions from the Stanford Industrial Engineering Department and the American Institute of Industrial Engineers. Skills and experience Karen’s 30 years’ experience in the technology industry means that she brings exceptional knowledge of digital, technology, cyber and IT security matters from working with innovative companies in Silicon Valley. Karen is considered to have the necessary skills and experience to help drive strong performance, in particular across the growth businesses of Convenience & Mobility and Gas & Low Carbon Energy. S R Melody Meyer Independent non-executive director Appointed 17 May 2017 Nationality American Outside interests Non-executive director of AbbVie Inc.; Non-executive director of NOV, Inc; Non-executive director of Energy Internet Corporation; President of Melody Meyer Energy LLC; Director of the National Bureau of Asian Research; Trustee of Trinity University Career summary Melody Meyer retired as President of Chevron Asia Pacific E&P in 2016 after 37 years of distinguished service in key leadership roles in global exploration and production across many operational assignments, projects and technology. Melody is an advocate for the advancement of women in energy as the prior executive sponsor of the Chevron Women’s Network, a member of the advisory board for McKinsey Advancing Women in Energy and through other venues. Melody is a C200 member, and has received recognition throughout her career: by Hart Energy as an ‘Influential Woman in Energy’ in 2018; by Women Inc as one of 2018’s ‘Most Influential Corporate Board Directors’; by 50/50 Women on Boards as an ‘Outstanding Director’ in 2020; and by Transition Economist TE100 as one of the ‘Women of the Energy Transition’ in 2021. Skills and experience Melody brings a world-class operational perspective to the board, with a deep understanding of the factors influencing safe, efficient and commercially high-performing projects in a global organization. Her extensive career in the oil and gas industry is predicated on a dedication to excellence, safety and performance improvements. She has expertise in the execution of major capital projects, technology, R&D, creation of businesses in new countries, strategic business planning, merger integration, leading change, and safe and reliable operations. Melody’s vast experience and knowledge in these areas have made her an ideal chair of the safety and sustainability committee, a position she has held since November 2019.

87 Corporate governance bp Annual Report and Form 20-F 2021 S P Sir John Sawers Independent non-executive director Appointed 14 May 2015 Nationality British Outside interests Visiting professor at King’s College London; Senior adviser at Chatham House; Senior fellow at the Royal United Services Institute; Global adviser at the Council on Foreign Relations; Governor of the Ditchley Foundation; Director of the Bilderberg Association, UK; Executive chair of Newbridge Advisory Limited Career summary Sir John Sawers spent 36 years in public service in the UK, working on foreign policy, international security and intelligence. He was chief of the Secret Intelligence Service, MI6, from 2009 to 2014 and prior to that spent the bulk of his career in the Diplomatic Service, representing the British government around the world and leading negotiations at the UN, in the European Union and in the G8. After he left public service, Sir John was chair and general partner of Macro Advisory Partners, a firm that advises clients on the intersection of policy, politics and markets, from February 2015 to May 2019. He then set up his own firm, Newbridge Advisory, to carry out similar work. Sir John was appointed Knight Grand Cross of the Order of St Michael and St George in the 2015 New Year Honours for services to national security. Skills and experience Sir John’s deep experience of international political and commercial matters is an asset to the board in navigating the geopolitical issues faced by a modern global company. Sir John’s unique skill set make him an ideal chair of the recently established geopolitical advisory council. S Dr Johannes Teyssen Independent non-executive director Appointed 1 January 2021 Nationality German Outside interests Senior advisor to Kohlberg Kravis Roberts; President of Alpiq Holding Ltd Career summary Johannes began his professional career at VEBA AG in 1989. There he held a number of leadership positions across Legal Affairs and Key Account Sales. In 2000 VEBA became part of E.ON and in 2001 Johannes became a member of the Board of Management of the E.ON Group’s central management company in Munich. In 2004, he was also appointed to the Board of Management of E.ON SE in Düsseldorf and later went on to become Vice Chairman in 2008 and CEO in 2010. He was president of Eurelectric from 2013 to 2015 and the World Energy Council’s vice chair responsible for Europe between 2006 to 2012. Johannes was a member of the Supervisory Board of Deutsche Bank AG between 2008 and 2018. He is a senior advisor to Kohlberg Kravis Roberts (KKR) for their European infrastructure and impact interests and was recently appointed as president of Alpiq Holding Ltd, a leading Swiss energy company (power generator and trader). Skills and experience Johannes brings exceptional experience and deep knowledge of the sector and its continuing transformation. His skill set further diversifies and strengthens the overall demographic and attributes of the board. His experience in the energy sector is a key asset for the entire board which enhances its ability to support and oversee the delivery of bp’s new strategy. Johannes has a doctorate in law from the University of Göttingen. Ben J S Mathews Company secretary Appointed 7 May 2019 Career summary Ben joined bp as a company secretary in May 2019. He is chair of the Association of General Counsel and Company Secretaries of the FTSE 100 (GC100) and the co-chair of the Corporate Governance Council of the Conference Board. Ben is also a Fellow of the Institute of Chartered Secretaries and Administrators. Former appointments include Group Company Secretary of HSBC Holdings plc and Rio Tinto.

88 bp Annual Report and Form 20-F 2021 Leadership team As at 18 March 2022 The leadership team represents the principal executive leadership of the bp group. Its members include bp’s executive directors (Bernard Looney and Murray Auchincloss, whose biographies appear on page 84-85) and the members of senior management listed here. Kerry Dryburgh EVP, people & culture Leadership team tenure Appointed on 1 July 2020 Nationality British Other board memberships Kerry is one of the Commissioners leading on the Levelling Up Goals, an architecture for purpose-led organizations to support levelling up in the UK in the wake of COVID-19, and a director of the 25x25 initiative, which aims for 25 women CEOs in the FTSE100 by 2025 Career summary Kerry was previously head of HR for the Upstream and has held a series of senior HR positions. She was a key driver behind the Upstream people transformation during 2015-2017. Kerry previously ran HR in bp’s Shipping, IST and corporate functions teams. She brings experience from other sectors in Europe and Asia, having worked at both BT and Honeywell before joining bp. William Lin EVP, regions, cities & solutions Leadership team tenure Appointed on 1 July 2020 Nationality American Other board memberships William is a non-executive director of Pan American Energy Group, a leading private integrated energy producer in Argentina. He is currently an advisor to the supervisory board for Corbion, a Dutch-listed global food ingredients and biochemicals company, as his nomination as a member of the supervisory board is progressing. Career summary William served as chief operating officer, Upstream regions before joining the leadership team. He has worked in bp for 26 years, having spent most of his career working abroad in different countries. His previous senior roles include vice president – gas development and operations for Egypt, regional president for Asia Pacific and head of the group chief executive’s office. William managed the successful completion, start-up and operation of the Tangguh LNG facility during his time in Indonesia. Gordon Birrell EVP, production & operations Leadership team tenure Appointed on 1 July 2020 Gordon previously served on bp’s executive team starting on 12 February 2020. Nationality British Other board memberships None Career summary Before being appointed to his new role, Gordon was chief operating officer for production, transformation and carbon. In his bp career, Gordon has spent time in various leadership, technical, safety and operational risk roles, including four years as bp president Azerbaijan, Georgia and Turkey. Gordon is a Fellow of the Royal Academy of Engineering. Business groups Integrators Enablers

89 Corporate governance bp Annual Report and Form 20-F 2021 Carol Howle EVP, trading & shipping Leadership team tenure Appointed on 1 July 2020 Nationality British Other board memberships None Career summary Before taking on her current role, Carol ran bp Shipping and was the chief operating officer for IST oil. She has more than 20 years’ experience in the energy industry, many in integrated supply and trading. Her previous roles include chief operating officer for natural gas liquids, regional leader of global oil Europe and finance. Carol also served as the head of the group chief executive’s office. Emma Delaney EVP, customers & products Leadership team tenure Appointed on 1 July 2020 Emma previously served on bp’s executive team starting on 1 April 2020 Nationality Irish Other board memberships None Career summary Emma has spent 26 years working in bp, both in the Upstream and the Downstream. Prior to joining bp’s executive team on 1 April 2020, she was Regional President for West Africa. She has held a variety of senior roles including Upstream Chief Financial Officer for Asia Pacific and Head of Business Development for gas value chains. In Downstream she held roles in retail and commercial fuels and planning. Leigh-Ann Russell EVP, innovation & engineering Leadership team tenure Appointed on 1 March 2022 Nationality British Other board memberships Leigh-Ann is a non-executive director of Hill & Smith Holdings. Career summary Leigh-Ann was previously bp’s SVP for procurement, accountable for a supply chain of around $30 billion of global spend. Prior to this, she was global head of upstream supply chain and VP of technical functions and performance in the global wells organization. Leigh-Ann holds a degree in mechanical engineering and is a Chartered Petroleum Engineer. She is a Fellow of the Royal Academy of Engineering and a Fellow of the Energy Institute. Giulia Chierchia EVP, strategy, sustainability & ventures Leadership team tenure Appointed on 1 July 2020 Nationality Belgian and Italian Other board memberships None Career summary Giulia joined bp from McKinsey, where she was a senior partner. She led the global downstream oil and gas practice and was a key member of the chemicals and electricity, power and natural gas practices. She has more than 10 years’ experience in the energy sector, including helping companies shape their strategies for the energy transition. Anja Dotzenrath EVP, gas & low carbon energy Leadership team tenure Appointed on 1 March 2022 Nationality German Other board memberships Anja is an independent member of the board of directors of Elkem; an Honorary Consul of Norway; a member of the UK Government’s new Investment Council; and a member of the Senate of the Fraunhofer-Gesellschaft. Career summary Anja joins bp with 30 years of experience in the global energy industry. Prior to her appointment, Anja was chief executive officer of RWE Renewables, one of the world’s leading renewables businesses. She previously held a broad range of leadership roles in E.ON, including chief executive officer of E.ON Climate & Renewables. Anja held a number of senior roles in management consultancy over 15 years before joining E.ON, with a focus on energy and the industrial sector. Eric Nitcher EVP, legal Leadership team tenure Appointed on 1 July 2020 Eric previously served on bp’s executive team starting on 1 January 2017. Nationality American Other board memberships Eric is a non-executive director of Pan American Energy Group, a leading private integrated energy producer in Argentina. Career summary Eric sat on the executive team as group general counsel from 2017. He played a key role in forming the Russian joint venture TNK-BP and resolving Deepwater Horizon claims. He began his career as a litigation and regulatory lawyer in Wichita, Kansas. He joined Amoco in 1990 and over the years has held a wide variety of roles, both in the US and elsewhere.
90 bp Annual Report and Form 20-F 2021 Board activities and governance framework Board activities The board and its committees met regularly in 2021, as well as on an ad hoc basis, as required by business needs. Despite the challenges and global travel restrictions that carried on from 2020 into 2021, the board continued to embrace the opportunities identified during the earlier stages of the pandemic. These included more frequent use of hybrid meetings and other productivity and efficiency gains that could be derived given the reduced demands of global travel. Despite these benefits, board members recognized that the optimum meeting format was in-person, as this maximized opportunities for interaction among board members, and also with the bp leadership team and the workforce more generally. The ways of working we put in place in 2020 also carried on through 2021. Board meeting agendas continued to be structured along four distinct pillars: strategy, performance, people and governance, with the overarching focus being on monitoring strategic progress and performance as bp transforms into an integrated energy company. Primary tasks of the board during 2021 included: • Oversight of strategic progress: The board continued to monitor and oversee the activities and performance of bp’s leadership team in delivering against the targets and aims that we communicated to the market in 2020. This was the second year of strategy execution since bp announced its transformative net zero ambition. • People: Throughout the year, the board reflected on key reinvent bp activities delivered in 2020 and 2021, including design and selection, health and wellbeing, management of change and employee engagement. The board was also consulted in the development of bp’s new leadership framework, which seeks to enhance leaders’ understanding of bp’s expectations of them. • Value generation for shareholders: In the second quarter, the board approved an increase in the resilient dividend of 4% per ordinary share and in addition, the commencement of share buybacks from first half surplus cash flow, taking into account factors including the cumulative level of and outlook for surplus cash flow, the cash balance point and maintenance of a strong investment grade credit rating. 1 Strategy Building on work undertaken to establish bp’s purpose and strategy in 2020, the board’s approach was informed by output from the 2020 board effectiveness review. This was underpinned by the strength of relationship with the CEO and his leadership team to monitor and oversee progress against the targets and aims set out in 2020. This was undertaken through a comprehensive schedule of thematic deep-dives and business reviews including the following: • Convenience & mobility, with particular focus on electrification and next generation mobility. • Resilient hydrocarbons and options to high-grade the portfolio while lowering emissions. • The value of integration in creating value as bp participates across the value chain, de-risking cash flows and customer success. • Low carbon energy and the acceleration of bp’s participation in the renewables sector, with particular focus on wind and solar. • Other strategic reflections since the September 2020 capital markets day. Through these engagements, the board supported and provided guidance to management. For more information see Decision-making by the board on page 97. Sustainability continued to be a key area of focus for the board in 2021. The board reviewed the environment, social and governance landscape, noting the importance of steps that management was taking to deliver the sustainability framework, announced in September 2020. The importance of defining what bp stands for in sustainability and embedding this across the organization, while engaging with stakeholders was underscored. It was against this backdrop that the board approved an update to our sustainability framework, with five further aims to help improve people’s lives and another five aims to care for our planet. Early in 2022, following on from board discussions during the fourth quarter of 2021, the board approved changes to bp’s aims. Further information on these changes can be found on page 51. Early in 2021, demonstrating the new governance framework in action, the board supported a request from management to bid for up to 3GW (1.5GW net to bp) of offshore wind capacity in the UK’s Offshore Wind Round 4, together with EnBW (through a 50/50 joint venture). This project aligns with bp’s net zero ambitions, including bp’s aims to have increased its annual low carbon investment to around $5 billion a year by 2030, as well as achieving 50GW of developed renewables to final investment decision by 2030, contributing 1.5GW. 2 Performance The board reviewed project, operational and safety performance throughout the year, as well as a retrospective look at the full-year delivery against plan. The company’s financial performance, liquidity, credit position and associated financial risks were closely and regularly monitored by the board. Inputs that assisted the board in discharging its oversight of performance included reports from the CEO and CFO, quarterly and full-year results, and the annual plan and associated capital allocation commitments. T he board’s focus

91 Corporate governance bp Annual Report and Form 20-F 2021 With regard to distributions, underpinned by the underlying performance of our business, an improving environment and confidence in our balance sheet, the board approved an increase of our resilient dividend by 4% per ordinary share and in addition, the commencement of share buybacks in the second quarter from first half surplus cash flow, taking into account factors including the cumulative level of and outlook for surplus cash flow, the cash balance point and maintenance of a strong investment grade credit rating. The board also approved at the time of our third quarter results that, based on bp’s current forecasts, at around $60 per barrel Brent and subject to the board’s discretion each quarter, bp expected to be able to deliver buybacks of around $1.0 billion per quarter and have capacity for an annual increase in the dividend per ordinary share of around 4% through 2025. As required under the UK Corporate Governance Code, the board carried out a robust assessment of bp’s emerging and principal risks. Following this assessment, the board approved a new framework for the oversight of principal risks by the board and its committees. The new approach creates a clearer linkage between bp’s underlying risk profile and its principal risks. On internal controls, the board assessed the effectiveness of the group’s system of internal control and risk management as part of the process through which it reviews and ultimately, approves the bp Annual Report and Form 20-F. No specific areas were identified in this assessment. The board concluded that the group’s system of internal control continued to be resilient. The board also concluded that the overall design of the group’s system of internal control generally meets external expectations of components to be included in internal control frameworks. In arriving at these conclusions, the board took into account reports from group risk and internal audit, as well as deep-dives and business reviews undertaken by the board and its committees during the year. For more information on bp’s system of risk management see How we manage risk on page 73. 3 People Throughout 2021, the board, through its people & governance committee, discussed key people priorities. This included bp’s journey to reinvent bp, a continued focus on employee engagement and management’s early thinking on how bp will develop high performing, inspiring leaders under a proposed leadership framework that is being developed by management. The board received direct updates during the year on reinvent bp as well as leadership development and succession planning. It was recognized that bp’s talent management arrangements would need to evolve as the organization continues to deliver against its stated net zero ambitions and aims. This included the recruitment of new talent from outside the organization, to drive growth and innovation in pivotal areas such as digital, mobility and convenience and low carbon energy. The board considered and approved the adoption of the ‘alternative arrangements’ method as its workforce engagement mechanism for 2021. To help inform board discussions and decisions and in line with these arrangements, board members engaged directly with the workforce in various events as set out on page 95. Diversity continued to be a key area of focus during 2021. As stated in the board’s terms of reference which became effective in January 2021, the board developed and approved a new board diversity, equity and inclusion policy. The policy contains statements which align to the requirements of the UK Corporate Governance Code alongside aspirational targets for board diversity. A copy of the policy is available on our website, bp.com/governance. 4 Governance During 2021, the board embedded the governance framework that it established in 2020. For more information on this framework, see page 92. Under the leadership of the board chair and the people & governance committee, an externally facilitated evaluation of the board was conducted in 2021. For more information on the board evaluation, see page 102. Strategy Establishing Monitoring Performance Metrics & information Monitoring Supporting & challenging People Diversity Competency Succession Governance Risk management Controls Conflicts, ethics and integrity How the board works Reimagining energy for people and our planet Culture Values Our purpose 1 2 3 4
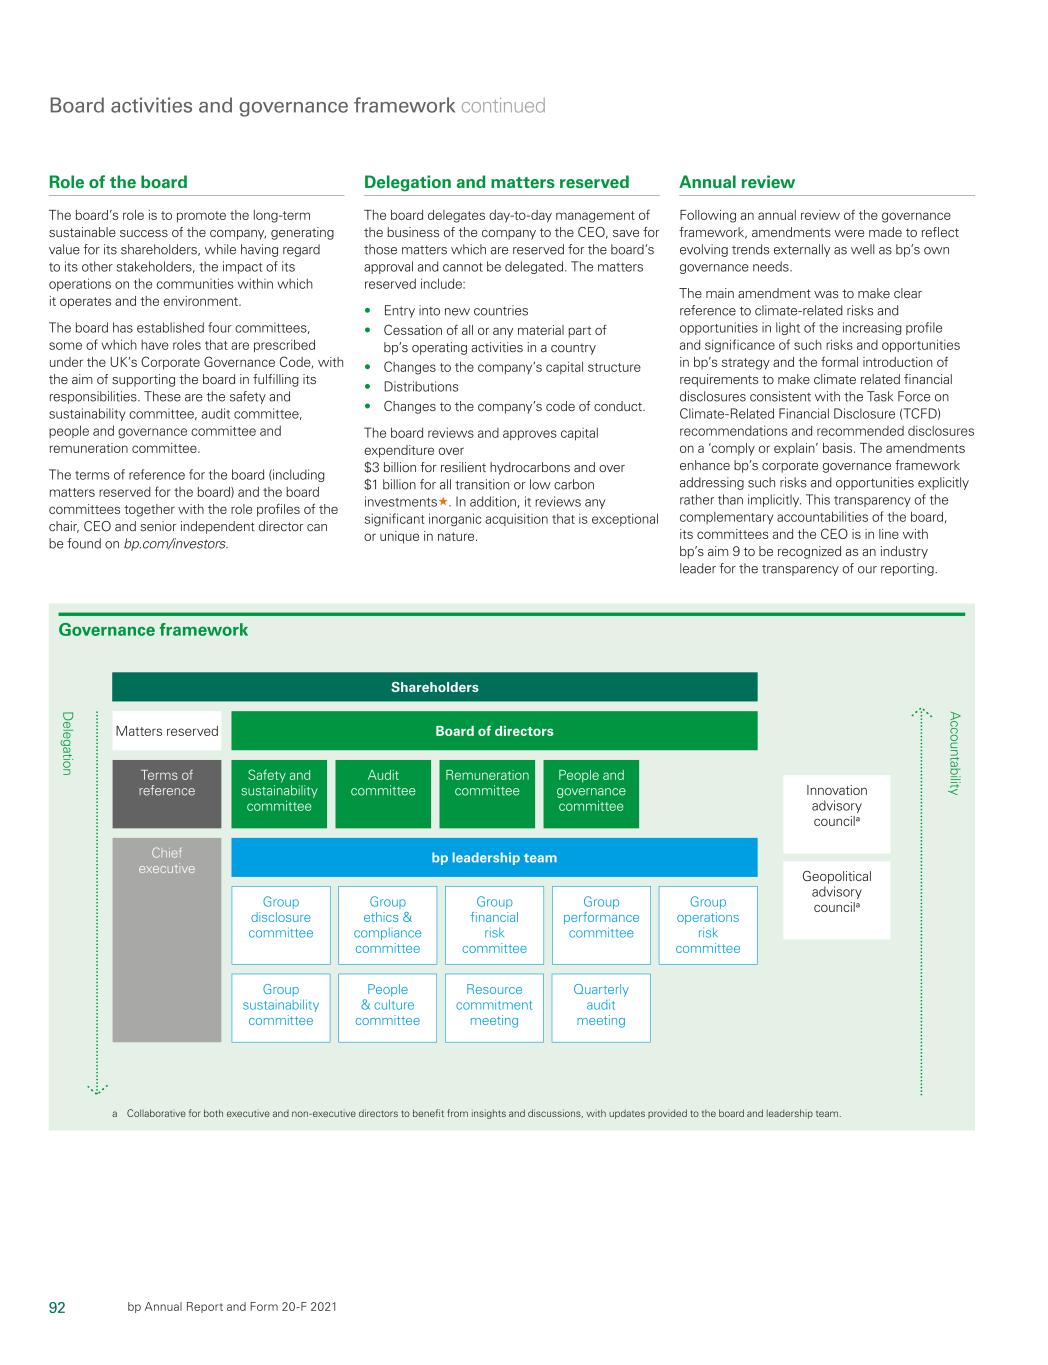
92 bp Annual Report and Form 20-F 2021 Board activities and governance framework continued Role of the board The board’s role is to promote the long-term sustainable success of the company, generating value for its shareholders, while having regard to its other stakeholders, the impact of its operations on the communities within which it operates and the environment. The board has established four committees, some of which have roles that are prescribed under the UK’s Corporate Governance Code, with the aim of supporting the board in fulfilling its responsibilities. These are the safety and sustainability committee, audit committee, people and governance committee and remuneration committee. The terms of reference for the board (including matters reserved for the board) and the board committees together with the role profiles of the chair, CEO and senior independent director can be found on bp.com/investors. Delegation and matters reserved The board delegates day-to-day management of the business of the company to the CEO, save for those matters which are reserved for the board’s approval and cannot be delegated. The matters reserved include: • Entry into new countries • Cessation of all or any material part of bp’s operating activities in a country • Changes to the company’s capital structure • Distributions • Changes to the company’s code of conduct. The board reviews and approves capital expenditure over $3 billion for resilient hydrocarbons and over $1 billion for all transition or low carbon investments. In addition, it reviews any significant inorganic acquisition that is exceptional or unique in nature. Annual review Following an annual review of the governance framework, amendments were made to reflect evolving trends externally as well as bp’s own governance needs. The main amendment was to make clear reference to climate-related risks and opportunities in light of the increasing profile and significance of such risks and opportunities in bp’s strategy and the formal introduction of requirements to make climate related financial disclosures consistent with the Task Force on Climate-Related Financial Disclosure (TCFD) recommendations and recommended disclosures on a ‘comply or explain’ basis. The amendments enhance bp’s corporate governance framework addressing such risks and opportunities explicitly rather than implicitly. This transparency of the complementary accountabilities of the board, its committees and the CEO is in line with bp’s aim 9 to be recognized as an industry leader for the transparency of our reporting. Governance framework D elegation A ccountability Matters reserved Chief executive Shareholders Terms of reference Board of directors Safety and sustainability committee Audit committee Remuneration committee People and governance committee bp leadership team Group sustainability committee People & culture committee Resource commitment meeting Quarterly audit meeting Group disclosure committee Group ethics & compliance committee Group financial risk committee Group performance committee Group operations risk committee Geopolitical advisory councila Innovation advisory councila a Collaborative for both executive and non-executive directors to benefit from insights and discussions, with updates provided to the board and leadership team.

93 Corporate governance bp Annual Report and Form 20-F 2021 See glossary on page 377 Stakeholder engagement Institutional investors We regularly engage with our institutional shareholders through an active investor relations programme including face-to-face or virtual meetings. The board receives feedback from shareholders in many ways, including through the executive engagement led by the CEO and CFO, as well as other members of the leadership team. From a non-executive perspective, this engagement is primarily led by the chair. In 2021, he hosted several one-to-one meetings with major institutional investors and proxy advisory groups. These engagements generated valuable and insightful feedback which was shared with other board members and committees, as well as the executive management, and has helped to inform the formulation and execution of our strategy. During 2021, investor engagement by executive management focused on financial and business performance and the execution of the new strategy and its associated targets and aims. For the chair, this engagement covered board, governance, strategy (including bp’s climate strategy), financial frame and people and succession topics. Additional information on investor engagement activity following the 2021 AGM is set out below. Retail investors In May we held our annual event for retail investors in conjunction with the UK Shareholders’ Association (UKSA) and the UK Individual Shareholders Society. The chair, company secretary and SVP investor relations gave presentations on bp’s annual results, strategy and the work of the board. Shareholder questions primarily focused on bp’s sustainability strategy, financial frame and performance, as well as the resolutions proposed at the 2021 AGM. AGM The 2021 AGM was a hybrid meeting. In line with government rules at the time, attendance in person was limited to the directors and support staff only. Shareholders were able to submit questions before or during the meeting and participate by telephone to speak with the directors. The event was broadcast on bp.com, enabling non-bp shareholders to view the meeting. Shareholders who were not able to attend the meeting electronically were able to vote by proxy in the usual way. The overall turnout was 58.7% of the total voting rights, including voting rights cast as withheld by the shareholder. This compares to 62.1% in 2020 and 67.1% in 2019. All resolutions were passed at the meeting in line with the board’s recommendations. We anticipate that the 2022 AGM will be a hybrid meeting, building on the successful format introduced in 2021 and allowing for wider shareholder participation. Shareholders will be able to attend the meeting via bp’s electronic meeting platform or in person. Further details on how to join and participate in the meeting are set out in the notice of meeting, available on bp.com/agm. Response to resolution 13 at the 2021 AGM Resolution 13, a shareholder resolution on climate change targets, was not supported by the board. Shareholders strongly supported the board’s recommendation to reject this resolution, but 20.65% of the votes cast still supported it. Despite the low level of shareholder support, bp recognizes that some shareholders chose to support the resolution. On 2 December 2021 bp published its response to the vote on resolution 13 in accordance with Provision 4 of the UK Corporate Governance Code (‘Code’). The response explained that extensive engagement with shareholders had been undertaken prior to the AGM and that this dialogue continued after the vote to better understand shareholders’ views on bp’s climate plans. Through the consultation bp gained valuable insights on the evolution of shareholders’ views on strategy, targets and aims – irrespective of how they voted on resolution 13. The response was published a few weeks later than the 6 month period set out in the Code to allow for the extensive engagement process to be concluded. Overall, through our engagement activity, we heard clear support for our strategy. Shareholders told us they recognize the importance of maintaining a strategy that remains resilient to the risks and opportunities of the evolving energy transition and are encouraging bp to continue focusing on value-generating activities to fulfil our ambition to get to net zero by 2050 or sooner and to help the world get to net zero. Net zero: from ambition to action Since the 2021 AGM, bp has seen the world’s ambition accelerating. This, coupled with the insights gained from the consultation and our wider engagement with investors, has created an opportunity for us to raise our low carbon ambitions and we now aim to be net zero across operations, production and sales by 2050 or sooner. In addition, as announced on 8 February 2022, we intend to provide shareholders with the opportunity of an advisory vote on our net zero ambition report at the 2022 AGM. Further information, including the notice of meeting for the 2022 AGM, can be found on bp.com/agm. Other stakeholders The board received regular updates from the CEO and CFO and other members of the leadership team on engagements with other stakeholders, including customers, suppliers and governments and regulators. The regular updates were considered as part of the board’s formulation of bp’s strategy. For example, as part of the decision-making process for the UK Offshore Wind Round 4 bid, the board received updates on community and environmental matters. For more information see page 97. The board also received a report from ethics and compliance where any matters raised by external stakeholders were reported to the board. For more on our stakeholders see Business model, page 12 How the board has engaged with shareholders, the workforce and other stakeholders

94 bp Annual Report and Form 20-F 2021 Shareholder engagement cycle Matters raised Subsequent feedback/engagement Q1 • Fourth quarter and full-year 2020 results presentation • Investor roadshows with executive management following fourth quarter 2020 results • bp Annual Report and Form 20-F 2020 • bp Sustainability Report 2020 • Regular meetings with Climate Action 100+ (CA100+) co-leads • Performance during 2020 and ongoing impact of COVID-19; strategy and bp’s sustainability aims • Remuneration outcomes for executive directors and leadership team • Further engagement with groups of investors such as CA100+ to discuss sustainability aims and strategy Q2 • Investor roadshows with executive management following publication of the annual report and sustainability report • First quarter 2021 results presentation • Investor roadshows with executive management following first quarter 2021 results • Regular meetings with CA100+ co-leads • UK Shareholders’ Association (UKSA) (retail shareholders’) meeting with the chair • Institutional shareholder engagement with the chair and executive management • 2021 AGM • bp Statistical Review of World Energy 2021 • Performance during first quarter 2021 • Financial frame and distributions • Sustainability frame and bp’s climate strategy • Updates to financial frame in third quarter 2021 to provide greater clarity Q3 • Second quarter 2021 results presentation • Investor roadshows with executive management follow second quarter 2021 results • Regular meetings with CA100+ co-leads • Investor engagement with the chair and executive management, including in respect of resolution 13, continuing into the fourth quarter • Updated financial frame • Feedback on resolution 13 • The board published a response to resolution 13 on 2 December 2021 and on 8 February 2022 announced strategic updates, including the intention to include an advisory vote on bp’s climate plan at the 2022 AGM Q4 • Third quarter 2021 results presentation • Regular meetings with CA100+ co-leads • Feedback on resolution 13 Employee engagement Overview In 2020 we developed and put in place a framework of engagement to build on existing mechanisms for the board to engage with bp’s workforce. This programme was successfully delivered during 2021 allowing all board members to participate and hear the views of a wide range of workforce members. Further details of the programme are set out below. To complement the programme, a range of other activities were undertaken throughout the year for the board to engage with members of the workforce. These included: • Receiving reports on key performance indicators on employee engagement, including voluntary attrition rates and engagement scores as measured by employee ‘Pulse’ surveys. • Receiving reports on Speak up, bp’s anonymous whistleblowing service. • Site visits undertaken by the whole board as well as individual board members or small groups of directors e.g. the audit committee visit to the trading team at the Canary Wharf office, London and S&SC virtual site visit to Angola • CEO ‘Keeping Connected’ webcasts with approximately 3,000 colleagues joining each live webcast. • Town hall events hosted by bp chair Helge Lund including during his visit to Aberdeen. Stakeholder engagement continued

95 Corporate governance bp Annual Report and Form 20-F 2021 Workforce engagement programme The workforce engagement programme supports the UK Corporate Governance Code requirement that the board establishes a mechanism to have meaningful and regular dialogue with the workforce to capture key insights and to bring the employee voice into the boardroom. Through the programme, small group sessions with 10-12 individuals are scheduled throughout the year. These are facilitated by the people & Key features of the workforce engagement programme: Representation areas Formal workforce representatives e.g. • European works council leadership • First level leaders in non-UK/US locations Strategically relevant position e.g. • Digital/cyber security colleagues • Low carbon business representatives Special interest groups e.g. • Graduate programme trainees • Business resource group representatives Rotating across different representation areas The broad coverage achieved in hearing views from members of the workforce with diversity in representation of seniority, tenure with bp, business sector and geographic location to promote balance across the full range of bp’s activities. Involving every board member Allowing each board member to participate directly rather than first-hand insights being concentrated in one individual Small group sessions with 10-12 participants Provides for a focused discussion with the opportunity for all voices present to be heard in a meaningful way. Open and honest views encouraged Sessions are ‘unsupervised’ i.e. without line managers/function leaders present in order to allow an unconstrained exchange of views. Sessions are held throughout the year Takes account of different cycles of workstreams and provides a consistent flow of employee feedback for the board. Focus on virtual attendance Having a focus on sessions being held virtually allows colleagues to be drawn from across our global operations including remote locations with a parity of engagement exposure for all attendees. 1 or 2 board members present Maximizes directors’ time by allowing for the whole board to benefit from a greater number of sessions being held across the year. Wide variety of topics covered Each session has a specific engagement purpose but not a set agenda in order to encourage free flowing discussion and the opportunity to explore specific points that may arise during the discussion itself. Front-line workers e.g. • Retail convenience store managers • Refinery operations colleagues Board of directors People and governance committee all non-executive directors individually participate in the programme culture team and the company secretary’s office and give every board member the opportunity to engage directly with different areas of the bp workforce. bp’s workforce encompasses a wide range of employees, contractors, remote and agency workers. These individuals are spread across multiple jurisdictions and carry out a range of different roles, from our retail sites to our refineries to our offshore wind teams. Given the breadth and geographic diversity of our workforce, having this bespoke mechanism provides an effective way for directors to hear from a broad cross-section of our colleagues. The programme is overseen by the people & governance committee which monitors the effectiveness of the programme and also undertakes an annual review to determine the optimum engagement mechanism for the board to use.

96 bp Annual Report and Form 20-F 2021 Stakeholder engagement continued Outcome of 2021 programme During 2021, all eight non-executive directors attended at least one session, engaging in meaningful dialogue with over 90 colleagues representing ten different jurisdictions. These colleagues were drawn from business areas covering all three of our strategic focus areas (resilient hydrocarbons, convenience & mobility and low carbon energy) as well as our integrator and enabler functions. Participants ranged in tenure from a few months to over 20 years’ service including recent graduates as well as senior leaders. Despite the broad range of perspectives represented, it was clear from the feedback that there were common themes impacting individuals from across different business areas and locations, for example: • a sense of excitement about bp’s new purpose of reimagining energy. Colleagues reported that this was helping to attract new talent that would not previously have considered joining our sector. Board members gained valuable insights into how, given the scale of the change across bp, some participants experienced challenges as the new strategy was being implemented; • the significance of supporting remote working arrangements following the COVID-19 pandemic and how this will impact our ongoing ability to retain and attract individuals; • front-line retail colleagues expressed pride in the way that bp enabled them to support local communities during the COVID-19 pandemic but highlighted how their depth of knowledge of local retail markets could be better leveraged when broad marketing campaigns were developed; • motivation levels among our low carbon colleagues are high with a recognition that building strong relationships with our partners will help accelerate this business area. Linkage to board decisions The board recognizes the value of having workforce views in advance of making decisions. In 2021, the board engaged with colleagues to gain a more holistic perspective of the impact of decisions taken. This helps inform the approach for future board decisions and places directors in a stronger position to constructively challenge management on the decisions that they take, for example: • the decision in 2020 to adopt a new strategy and purpose through the Reinvent bp programme. Board members heard from representatives of European Works Councils as well a cross-section of senior leaders to hear about the impact of this transition on delivery, workload and mental wellbeing. Given the open discussion approach used, the impact of the Reinvent bp programme was raised by colleagues at almost every session held in 2021 regardless of the topic of the session. This provided a broad view of the impact of the new strategy and purpose upon many different business areas from retail sites to offshore wind; • a session was held with members of our business resource groups that focus on ethnic diversity. These are employee-led groups offering support and networking opportunities to particular under-represented groups. 2021 Workforce engagement programme Impact of the Reinvent bp programme: tier 2 leaders Melody Meyer held a session with a cross- section of our senior leadership group to learn about the impact of the transition to bp’s new strategy and purpose on the functions they lead. Views were heard from leaders of our hydrocarbons businesses as well as our new low carbon areas and key enabler functions such as strategy, finance and digital. Among the topics discussed were: • How Reinvent bp has strengthened the ability to deliver with a renewed ‘one team’ mindset. • How Reinvent bp has amplified opportunities to offer diverse careers which harness our global capability. • Reflections on what has been learned through the Reinvent bp transition. Groups from the UK and US joined a session in the same period that directors approved and published the board diversity policy. Feedback from this session highlighted how bp’s support for under-represented groups had improved over the years but that there are more opportunities to continue to promote inclusion for all colleagues. These principles are reflected in the board diversity policy which seeks to improve diversity both at board level and also the pipeline of succession to the board; • the decisions taken to support retail customers and colleagues through the COVID-19 pandemic. Review of engagement mechanism After the 2021 programme was completed, the P&GC reflected on its outcomes and effectiveness. A review was undertaken of the approach of other companies including a consideration of alternative options for engagement set out under the Code of a: • director appointed from the workforce; • formal workforce advisory panel; or, • designated non-executive director. It was determined that the current approach remained best suited to the broad range of bp’s workforce and was an effective alternative to the options set out in the Code. Opportunities to refine: Looking ahead to the 2022 programme, a schedule has been developed which targets additional employee groups with a particular focus on understanding bp’s culture. As set out on page 99, this will complement other measures to enhance the board’s assessment of culture. Hosting virtual sessions allowed for participants from different jurisdictions to be brought together so that they could benefit from hearing each other’s views on specific topics. It is expected that the programme will continue on a predominantly virtual basis although some in-person sessions may also be arranged where there are recognized benefits. Consideration will be given to opportunities for engagement with non-English speakers e.g. through the use of interpreters. When new directors join the board, consideration will be given to the use of introductory profiles or videos to be placed on bp’s intranet site so employees can learn more about the director and their role. • Opportunities to improve retention and also the attraction of new colleagues. 10 jurisdictions (including Australia, Poland, Oman, Azerbaijan, Singapore and the US) 9 sessions held >90 colleagues participated

97 Corporate governance bp Annual Report and Form 20-F 2021 Key decisions made The board delegates day-to-day management of the business of the company to the CEO, save for those matters which are reserved for the board’s approval. The board retains responsibility for – and regularly monitors – the execution of this delegation of authority, taking action to update it, as required. The board’s corporate governance framework is set out on page 92. It includes certain matters that are specifically reserved for decision by the board as a whole and which cannot therefore be delegated under its terms of reference. Given the size and scale of bp, there are relatively few matters that come to the board for a decision. These would include transactions involving a capital commitment of more than $3 billion or $1 billion, depending on the business, as well as decisions on strategy and distribution policy. In the context of the board’s activities during 2021, the table below sets out some examples of decision-making during the year and how directors have performed their duty under Section 172. More information on how the board had regard to the Section 172 factors Section 172 factor Key examples The likely consequences of any decision in the long term Our strategy and business model, page 12. Interests of employees How the board has engaged with shareholders, the workforce and other stakeholders, page 93. Sustainability: our people, page 71. Fostering the company’s business relationships with suppliers, customers and others. How the board has engaged with shareholders, the workforce and other stakeholders, page 93. Our strategy and business model, page 12. Sustainability: ethics and compliance, page 72. Sustainability: our values and code of conduct, page 69. Impact of operations on the community and the environment Sustainability: caring for our planet, page 68. Sustainability: safety, page 69. Maintaining a reputation for high standards of business conduct Role of the board, page 90. Sustainability: ethics and compliance, page 72. Sustainability: our values and code of conduct, page 69. Acting fairly between members of the company How the board has engaged with shareholders, the workforce and other stakeholders, page 93. Matters reserved for the board and Section 172 Decision taken How the board had regard to the feedback in its decision-making, including section 172(1)(a) to (f) matters considered, including stakeholder group(s) affected Shareholder distributions: commencement of buybacks and growing dividend The board approved the commencement of share buybacks in the third quarter, and at the same time increased the dividend 4% per ordinary share. • Likely consequences of any decision in the long term: The board’s decision was made with due regard to bp’s financial framework which is underpinned by a resilient dividend, reduction of net debt, investing into the transition, subject to maintaining a strong investment-grade credit rating. • Shareholders: The decision was taken after broad engagement with investors, via roadshows and other bilateral meetings with the chair, CEO and CFO. UK Offshore Wind Round 4 bid The board supported a request from management to bid for up to 3GW (1.5GW net to bp) of offshore wind capacity in the UK’s Offshore Wind Round 4, together with EnBW (through a 50/50 joint venture) • Likely consequences of any decision in the long term: In supporting the request from management, the board considered consistency of the request with bp’s net zero ambitions, including near- and long-term targets and aims. • Fostering business relationships: As bp progresses against its transformative strategic journey, new business relationships are required, as exemplified by EnBW. • Community and the environment: bp’s goal of developing significant renewable energy capacity by 2030 takes into account the UK’s drive towards renewable energy sources. Decision-making by the board

98 bp Annual Report and Form 20-F 2021 Decision-making by the board continued Independence and conflicts of interest All directors have a statutory duty to exercise independent judgement. Independence of non-executive directors (NEDs) is a crucial in bringing constructive challenge to the CEO and the leadership team at board meetings, while providing support and guidance to promote meaningful discussion and, ultimately, informed and effective decision-making. In addition, each director has a statutory duty to disclose actual or potential conflicts of interest. In accordance with the criteria set out in the UK Corporate Governance Code (the Code), the chair was considered independent at the time he was appointed. NEDs are required to provide sufficient information to allow the board to evaluate their independence prior to and following their appointment. During 2021, the board reviewed the process for declaration, review and authorization of conflicts of interest for directors. Formal procedures are in place for new potential conflicts to be reported and recorded during the year. As a consequence of regular reviews in 2021, the board is satisfied that there were no matters giving rise to conflicts of interest which could not be authorized by the board. It has therefore concluded that all bp NEDs are independent. Appointment and time commitment The chair, senior independent director and other NEDs each have letters of appointment with BP p.l.c. and do not serve, nor are they employed, in any executive capacity by bp. NEDs are generally appointed for three-year fixed terms; however, in line with what is considered good governance practice, bp proposes all directors for annual re-election by shareholders at the annual general meeting (AGM) where letters of appointment for each NED are available for inspection. Details on the skills and experience of each director seeking re-election, as well as their individual contributions to the long-term success of the company, are set out in the notice of meeting. In accordance with the recommendations of the Code, NEDs would not be expected to serve beyond nine years unless there are exceptional circumstances. Attendance Board Audit committee Safety and sustainability committee Remuneration committee People and governance committee Non-executive directors Helge Lund 11/11• 4/4• Pamela Daley 11/11 9/9 6/6 Professor Dame Ann Dowling 5/5 2/2 Melody Meyer 11/11 6/6• 6/6 Tushar Morzaria 11/11 9/9• 6/6 Brendan Nelson 5/5 3/3• 3/3 2/2 Paula Reynolds 11/11 9/9 6/6• 4/4 Karen Richardson 10/11 5/6 Sir John Sawers 11/11 6/6 4/4 Johannes Teyssen 10/11 6/6 Executive directors Murray Auchincloss 11/11 Bernard Looney 11/11 Attended meetings/possible meetings • Chair of board/committee Of the 11 board meetings held in 2021, six were board meetings covering a full agenda across strategy, performance, people and governance. Four board meetings were focused on the quarterly results and one board meeting was solely focused on discussing the board evaluation. Karen and Johannes were unable to attend one board meeting each due to commitments made prior to their appointments to bp’s board.

99 Corporate governance bp Annual Report and Form 20-F 2021 On behalf of the board, the people and governance committee reviews the formal appointment process and succession plan. Appointments and succession plans are both based on merit and assessed against objective criteria with the promotion of diversity, equity and inclusion as central considerations. This includes diversity of gender, social and ethnic backgrounds as well as cognitive and personal strengths. In reviewing appointments and succession plans, due consideration is given to ensure smooth transition of board members with specific responsibilities (e.g. committee chair roles) by allowing sufficient time for a detailed handover. This is balanced by the need to have new board members join at regular intervals such that over time there is a controlled approach to board members reaching the end of their tenure. This was reflected in the handover from Brendan Nelson as chair of the audit committee to Tushar Morzaria. Notwithstanding that Brendan had reached the end of nine years’ service as a bp director, it was deemed appropriate for Brendan to extend his tenure in order to have a thorough handover with Tushar. Further details on succession and tenure are set out in the people and governance committee report on page 104. The expectation regarding time commitment for board members to effectively discharge their duties is set out in the directors’ letters of appointment. The time commitment varies with the demands of bp business and other events. In practice, in 2020 and 2021, the impact of the COVID-19 pandemic on the company, as well as the need for the board to oversee the execution of bp’s new strategy, resulted in the NEDs spending additional time fulfilling their responsibilities. The NEDs’ external time commitments – whether through executive, non-executive, advisory or other roles – are regularly reviewed by the company secretary to ensure that, even in the exceptional circumstances of a global pandemic, they are able to allocate appropriate time to bp. The review process takes into account outside appointments and other external commitments, factoring in the complexity of the company in question and the industry, in particular regulated and potentially competing sectors. NEDs are also required to consult with the company secretary and chair before accepting any other role that may impact their ability to commit appropriate time to bp. During 2021, the process for approval of all new external appointments of existing directors was refreshed. In addition to reviewing the time commitment required for the new external appointments to ensure the director has sufficient capacity for their role with bp, a review of independence and potential conflicts of interest is now also undertaken at the same time. The board has concluded that, notwithstanding the NEDs’ other appointments, they are each able to dedicate sufficient time to fulfil their bp duties. As recommended by the Code, neither of the executive directors hold more than one non- executive directorship in a FTSE 100 company or other significant appointments, as set out on pages 84-87. Diversity and culture The board is fully supportive of bp’s UK, US and global frameworks for action which set out how we will advance and integrate diversity, equity and inclusion across our regions and the global businesses. These frameworks include three pillars -transparency, accountability and the development and attraction of diverse talent. The board believes that better decision-making and better overall outcomes can be achieved when people from different backgrounds with different perspectives come together with a common ambition. The board supports a culture of inclusion where everyone is valued and able to play their part in building the success of our company. Further details on our approach to diversity and the board’s diversity, equity and inclusion policy can be found on bp.com and in the people and governance committee report on page 106. Culture is monitored by the board through a number of mechanisms. These include reviews by the people and governance committee of bp’s ways of working, regular updates from the EVP people and culture, information from employee pulse surveys and feedback from both the NED workforce engagement sessions and the global engagement sessions led by the CEO, such as ‘Keeping Connected’. Alongside these mechanisms there are formal and informal channels for employees to raise concerns and significant concerns and insights are shared as part of the ethics and compliance update at the safety and sustainability committee. The board considers all these measures alongside the implementation of our DE&I policies to help satisfy itself that bp’s culture is and remains aligned to its purpose, strategy and values. To further enhance the board’s assessment of culture, plans are being developed for the various data points and reporting measures to be brought together in one place. It is expected that this will complement the approach for workforce engagement in 2022 where a specific focus on culture has been introduced. Our workforce engagement programme (further details set out on pages 95-96 already provides our directors with valued insights directly from our colleagues through small group sessions across the organization. Questions can also be tailored to each engagement session for directors to raise with participants. These questions will be aimed at stimulating discussion and drawing out individuals’ own experience of bp’s culture in their particular part of the business. In this way, the board will have the opportunity to gain a perspective beyond the facts and figures, which provide a useful statistical view of cultural measures, and hear how bp’s culture is operating in practice.

100 bp Annual Report and Form 20-F 2021 Learning, development and induction Induction of new directors, continuing learning and development Following the announcement of a new director’s appointment to the board, a structured and wide-ranging induction programme is compiled. This reflects their individual needs, to help ensure that they are best placed to maximize their contribution to and effectiveness on the board. In 2021, following their appointment to the board, tailored induction programmes were put together for Karen Richardson and Johannes Teyssen (see opposite). Following appointment, the skills and experience of individual board members are routinely reviewed to ensure that they continue to be well placed to assess and inform the evolution of bp’s strategy and purpose, while scrutinizing and holding to account the performance of the leadership team against agreed performance objectives. This review process is also informed by the chair’s individual meetings with the directors and the outputs from the annual effectiveness review process. Together, these steps help to identify learning and development opportunities to plug identified gaps or to provide deeper educational dives into new and evolving business areas. Activities during the year Learning and development activity is divided between developmental and educational needs, mandatory training (being training that all bp employees undertake such as code of conduct and cyber risk, among others) and site visits. During 2021, the board participated in several developmental briefings hosted by subject matter experts to deepen their understanding of their areas of focus. A deep-dive was held on the opportunity presented by growing momentum in the development of renewable energy sources, and how bp is positioned to play an increasingly significant role in this space through its ongoing transformation to become an integrated energy company. Mandatory training sessions were provided on sustainability, ethics and compliance, and directors undertook site visits and meetings with key colleagues to develop their knowledge of bp’s strategy and operations. Despite the challenges of the global pandemic, creative approaches were taken to provide immersive training for board members without the need to travel to the site in question. Further details are set out below: 10 developmental briefings 2 site visits (in person and virtual) Board induction programme A formal and comprehensive induction is provided to all directors following their appointment. Karen Richardson and Dr Johannes Teyssen, appointed on 1 January 2021, undertook robust and tailored inductions including meetings with a wide range of senior management within bp and key external advisors. The importance of the induction cannot be overstated: it is one of the key mechanisms to support directors in meeting their statutory duties, embedding their understanding of bp’s strategic priorities and bringing the board closer to decision-makers and those tasked with the day-to-day management of the business. A selection of these activities is outlined below. Before arrival and within the first month • Introductory meetings with the chair and group company secretary, covering an overview of board and committee matters, priority areas for the board, the governance framework and bp’s corporate structure • Pre-read of board and relevant committee papers from the previous 12 months Within the first three months • Introductions with leadership team members, providing an overview of their business unit and subject matter expertise • Meetings with relevant committee chairs and members to understand ways of working and priority areas • Teach-ins on topics of strategic importance • Briefings from key external advisors on legal, regulatory, audit, finance and other matters Within the first year • Employee engagement session to enable direct feedback opportunities from the workforce to the board • Visit to a bp site, which is facilitated virtually where an in-person visit is not possible

101 Corporate governance bp Annual Report and Form 20-F 2021 I have been impressed with the digital vision at bp. My induction to the bp board has been thorough, informative and rewarding. It hasn’t been without challenge: the lasting effects of the COVID-19 pandemic meant in-person meetings weren’t always possible, though the digital solutions deployed throughout the process to facilitate meaningful engagement were excellent. I was delighted to be able to visit bp’s security operations centre in Houston, Texas during 2021 and look forward to further site visits during 2022 and beyond to continue developing my understanding of bp’s operations. Karen Richardson Independent non-executive director The digital skills programme has successfully raised the profile of bp’s digital strategy. Deep-dives with subject matter experts created rich two-way discussions which, alongside comprehensive e-learning content, helped to develop board members’ understanding of key digital topic areas. These sessions also showcased some of the great digital talent the business has – I welcome the next phase of the programme in 2022. Dr Johannes Teyssen Independent non-executive director Digital skills programme A particular focus of the learning and development programme for 2021 was on enhancing digital skills, intended to empower the board’s oversight of bp’s digital strategy. Each quarter, directors were offered virtual learning content and invited to participate in a discussion with a relevant subject matter experts across four distinct topic areas: digital foundations, digital mindset, emerging digital technology and transformational digital technology. In addition, board members were provided reverse mentoring opportunities with final- year graduates from bp’s innovation & engineering team. In these sessions, digital topics were explored further in order to gain a fresh perspective on digital fluency.

102 bp Annual Report and Form 20-F 2021 Board evaluation Evaluating performance Each year bp evaluates the performance of the board, its committees, the chair and individual directors. This is a well-established process and an important and valued opportunity to take stock of the board’s progress and to test that the board is well placed to provide constructive challenge and be a trusted thought partner for the leadership team. Good progress was made following the 2020 board evaluation. There have been improvements in the quality and cadence of information flows from management to the board, a risk governance review has been completed and board education sessions have been directed at strategic priorities, such as the emerging renewables and low carbon energy businesses, climate change risk and how bp is mitigating it consistent with its financial and sustainability aims. Board and committee time has been optimized and co-ordinated through board roadmaps and the board and committees’ terms of reference. Every third year, recommended practice is for the board evaluation to be externally facilitated. Having completed two annual cycles of internally- facilitated reviews, the people and governance committee oversaw the review process for 2021, including the appointment of an independent provider of board review services. Given the significant strategic progress by bp since 2020, the new leadership and organization that is now in place and the roll-out of bp’s new corporate governance framework, a specialist board review firm was considered the best option to provide an objective perspective on the progress made by the board over this period. Following a request for proposal process, bp selected Independent Board Evaluation to complete an external board evaluation. There is no connection between Independent Board Evaluation and either bp or the directors. The process followed in the evaluation is set out in the graphic to the right. Board evaluation Stage 1 Planning Stage 3 Evaluation Stage 4 Reporting Stage 5 Review Stage 6 Actions agreed Stage 2 Briefing by external evaluator P&GC endorse review process, selection of preferred provider agreed by company secretary and chair. Evaluator sets scope of review; attends board and committee meetings, holds meetings with individual directors and non-board contributors and benchmarks against other boards. Draft reports discussed with board and committee chairs. Final reports discussed by the chair with individual directors, the whole board and committees. Senior independent director hosts session for chair feedback. Board agrees actions to take forward. Evaluator discusses evaluation process with chair and company secretary. Actions implemented and monitored as part of three-year evaluation cycle. Stage 7 Implementation

103 Corporate governance bp Annual Report and Form 20-F 2021 The evaluation supported an overall view that the board performs at a high level. It is focused and engaged, takes effectiveness in governance very seriously and works well with the leadership team. The recommendations made aim to help the board towards optimal effectiveness. The board agreed to implement actions across three areas: Strategy and performance: The board’s overarching focus through 2021 has been on monitoring strategic progress and performance as bp transforms into an integrated energy company. As we move from setting a new strategic direction in 2020, to our re-invention in 2021, 2022 will be about delivery of that strategy. Accordingly, there will be an increasing focus at board meetings on the journey of each of the businesses to deliver the targets and aims that have been set. The leadership team is being encouraged to engage with the board, to take soundings, to build credible and enduring relationships and to use time with the board to bring ideas before they are fully developed. This will help provide greater awareness of the risks and opportunities that are considered, alternative options, while also bringing their experience to the decision-making process. People and culture: Throughout 2021 we have made significant progress on employee engagement with our NEDs, through the structured workforce programme. The chair has also attended drop-ins with the business and other teams. Complementing this will be a gradual return to the board’s (and committees’) practice of in-person site visits to allow for more in person engagement opportunities. In addition to the reverse digital mentoring, we will evaluate other relationship and networking opportunities outside the formality of the boardroom such as informal breakfasts/dinners with some of the leadership team and those employees identified as having the talent to become part of the leadership team over time. Governance and reporting: Recommendations to improve the end-to-end board experience and flow of information are being progressed. In particular: • Further improving the information flows between the board and management through a common frame for board papers. • Adjusting the timing and allocation of time to the CEO and CFO’s report, the committee sessions and the committee feedback so that those matters which are of most importance to bp are raised. Feedback from the evaluation for the committees was considered at each of the committees and the chair held sessions with each director to discuss their individual feedback. In February 2022, the senior independent director led a meeting with the NEDs without the chair present to provide board members with an opportunity to provide any feedback regarding his performance. Strong support for the continued leadership shown by the chair and his engagement with the CEO, CFO and other members of the bp leadership team was provided and relayed by the senior independent director.

104 bp Annual Report and Form 20-F 2021 People and governance committee Chair’s introduction I am delighted to present my report as chair of the people and governance committee. Our focus in 2021 has been across three areas: Overseeing the organizational change resulting from the Reinvent bp programme; providing guidance around a new leadership frame for bp and progressing the design and roll-out of a robust framework for talent management; and the continuing refresh of the board, ensuring we have the right skills, experience, and diversity around the board table to deliver our strategy. Helge Lund Committee chair Committee overview Purpose of the committee The people and governance committee seeks to ensure an orderly succession of candidates for directors, the leadership team and the company secretary. It oversees corporate governance matters, reviewing developments in law, regulation and evolving practice in this space. The committee reviews workforce policies and practices and monitors their consistency with bp’s purpose, strategy and values. Key responsibilities during 2021 • Oversee the development of a diverse pipeline for succession to the board and leadership team (across immediate, medium and long-term time horizons), taking into account the challenges and opportunities facing bp, its strategic priorities and the skills and expertise needed on the board in the future. • Review the outside directorships/commitments/ conflicts of the non-executive directors. • Review workforce policies and practices, and in particular those that have an impact on talent and capability, diversity and inclusion and engagement and culture (including employee wellbeing). • Conduct workforce engagement measures through a range of formal and informal channels. Review and report back to the board on workforce views and priorities in order to strengthen the ‘employee voice’ in the boardroom. • Review and develop the board’s corporate governance framework and monitor its compliance with corporate governance standards and practices while ensuring that it remains appropriate to the size, complexity, and strategy of bp. • Review the board’s diversity policy and the effectiveness of its implementation. Meetings and attendance The committee met four times in 2021 with all members attending each meeting. Membership Helge Lund Member since July 2018 and chair since September 2018 Brendan Nelson Member (Resigned 12 May 2021) Paula Reynolds Member Sir John Sawers Member Helge Lund Committee chair Activities during the year Overseeing organizational change As part of our oversight responsibility on work force engagement and culture we put in place new ground rules for engagement in line with applicable corporate governance rules. We also took a retrospective look at bp’s reinvent journey to ensure that the organization had maintained its focus on safety in its successful delivery of a new structure, a new leadership team, and new ways of working (with the committee reviewing the processes and procedures in place for the adoption of agile working). New leadership frame We provided guidance on the new leadership frame further to an assessment of the core leadership principles and provided oversight on its submission to the board and implementation with a detailed section on page 90. We reviewed the new board governance framework to ensure that bp continues to maintain the highest standards of board and committee governance. Additionally, and as part of this work, we engaged an external provider to complete a detailed board effectiveness review with a detailed summary together with recommendations on page 102. Our focus has been to safely deliver organizational change as part of reinvent bp and develop a robust framework for talent management for both executive and non- executive succession.

105 Corporate governance bp Annual Report and Form 20-F 2021 Board succession planning Karen Richardson and Johannes Teyssen joined the board on 1 January 2021. Dame Alison Carnwath stepped down from the board on 14 January 2021 and Dame Ann Dowling and Brendan Nelson stepped down on 12 May 2021 following the AGM. The new board members bring extensive financial, technological, transformation and energy industry experience to the board and ensure that a strong focus on strategic execution, safety and sustainability and connectivity to bp’s core businesses and markets continues. Under its new terms of reference, the committee has responsibility for identifying and articulating the objectives and criteria of any board appointment process. This is based upon requirements identified from a review of the experience, skills and diversity of background of the board and its committees. For executive directors, the committee gives consideration to existing succession plans. The committee is responsible for engaging an independent executive search consultant, who assists in preparing shortlists of candidates, co-ordinating interviews and seeking references. In accordance with the board diversity, equity and inclusion policy (DE&I policy), the committee engages with external search firms who are able to align with bp’s approach to diversity, equity and inclusion in identifying suitable individuals from diverse pools of candidates. During 2021, the committee engaged with Egon Zehnder, MWM Consulting and Spencer Stuart in support of its ongoing search for new board candidates. Egon Zehnder and Spencer Stuart also provide advice and support on executive recruitment matters to bp. It is expected that all members of the committee meet or speak with the shortlisted candidates and agree upon a recommendation which is put to the board for review, taking account of matters such as the candidate’s existing appointments and associated time commitments as well as any actual or potential conflicts of interest. Diversity: board In line with the transparency and accountability arms of the global framework, in July 2021 further to a recommendation by the people and governance committee, the board approved a DE&I policy which complements bp’s wider diversity policies and which embraces the group’s values, code of conduct and sustainability frame. The full DE&I policy is available on online at bp.com/corporategovernance. Under the DE&I policy, the board commits to: • Encourage a diverse and inclusive working environment in the boardroom, where everyone is accepted, valued and receives fair treatment according to their different needs and situations without discrimination or prejudice. • Continue our journey towards greater diversity on the board across all dimensions, aspiring to achieve gender parity and greater representation of those with an ethnic minority background over time. • Consider all aspects of diversity when reviewing the board’s composition, its skills, experience and overall balance, including when conducting the annual board effectiveness review. • Oversee the development of a diverse pipeline for succession to the board and monitor that all board appointments are subject to a formal, rigorous, and transparent procedure and that such appointments are based on merit and objective criteria taking into account (among other things) factors such as diversity of gender, age, educational and professional background, social, ethnic and geographical background and cognitive and personal strengths. Engage search firms who understand bp’s values and approach to diversity, equity and inclusion and agree to comply with those values and approach in identifying suitable board candidates from diverse candidate pools. Given changes to the composition of the board during 2021, bp currently has a board that is smaller than in previous years. Although work to add new and suitably qualified skills and experience to refresh its composition continues, at the end of 2021 the board had 10 members. Skills matrix Background and experiencea Energy markets Operational excellence and risk management Global business leadership and governance Technology, digital and innovation Climate change and sustainability People leadership and organizational transformation Society, politics and geopolitics Finance, risk and trading Non-executive directors Helge Lund Paula Rosput Reynolds Tushar Morzaria Melody Meyer Sir John Sawers Karen Richardson Pamela Daley Johannes Teyssen a The skills set out here are defined based on bp’s internal assessment.

106 bp Annual Report and Form 20-F 2021 Through these 10 members, a range of personal strengths, industry expertise and nationalities is represented and further details on the skills and backgrounds of individual board members is set out in the board biography section on pages 84-87. From a gender perspective, the board is comprised of four female directors and six male directors, representing 40% female representation (2020 45%, 2019 42%). Two of the four main board committees are chaired by a female director, one of whom holds the position of senior independent director. While the board aspires to achieve gender parity, progress against diversity targets is sensitive to the size of the board. In respect of other forms of diversity, one member of the board self-identifies as being from a non-white ethnic minority background. In accordance with the board’s policy, the board as a whole aspires to have greater representation of those from an ethnic minority over time. Diversity: senior leaders Our senior management, as defined in the Corporate Governance Code 2018 and their direct reports comprise 49% women (2020 43%) and 26% Black, Asian and minority ethnic (BAME individuals (2020 25%). In reviewing the succession pipeline, the committee recognizes the challenges faced by women and those from minority groups, and particularly the additional issues they face in progressing to senior roles. The committee supports the work undertaken by management to support career progression of under-represented groups in a sector that has historically been male-dominated with limited diversity in other forms. Specifically, this includes the ambition to have females in 50% of the top 120 leader roles by 2025, our US minority ambition to have 20% of our group and senior leader roles held by minorities by 2025 and our UK ethnicity ambition to achieve 15% of our senior leader roles to be held by minorities. Diversity: employees The committee recognizes that improving the diversity of senior leaders cannot be achieved without promoting diversity throughout the whole workforce. Diversity, equity and inclusion considerations remain key to the group’s people strategy with a commitment to ensure that talented individuals are able to access fulfilling careers across all of bp’s areas of operations regardless of their background. The board, as a whole, is supportive of the group’s employee-led business resource groups (BRGs) which centre around specific themes including, among others, ethnicity, sexual orientation, working parents and people with disabilities. BRGs provide support and networking opportunities for their members and are open for all employees to join in order to support the group’s diversity and inclusion initiatives. The board is also supportive of awareness training sessions and ‘huddles’ including those hosted this year on neurodiversity and mental wellbeing. During 2021, the chair of the committee held a feedback session with members of two BRGs focused on ethnic minority groups, the USAAN (US-based ‘African American Network’) and the PEN (UK-based ‘Positively Ethnic Network’). This session formed part of the broader workforce engagement programme (details of which are set out on page 95) and brought together ethnic minority colleagues from across bp’s operations and with a range of tenure from over 20 years’ service to those who had recently joined through the graduate programme. A broad range of topics were discussed including how opportunities for ethnic minorities had improved over recent years. The feedback from this session was received by the people and governance committee and later reported to the whole board to deepen directors’ insights into employees’ views and experiences. Succession Karen Richardson and Johannes Teyssen joined the board on 1 January 2021. Dame Alison Carnwath stepped down from the board on 14 January 2021 and Brendan Nelson and Dame Ann Dowling stepped down on 12 May 2021 following the AGM. The new board members bring extensive financial, technological, transformation and energy industry experience to the board and will ensure that a strong focus on strategic execution, safety and sustainability and connectivity to bp’s core businesses and markets continues. Under its terms of reference, the committee has responsibility for identifying and articulating the objectives and criteria of any board appointment process. This is based upon requirements identified from a review of the experience, skills and diversity of background of the board and its committees. For executive directors, the committee gives consideration to existing succession plans. The committee is responsible for engaging an independent executive search consultant, who assists in preparing shortlists of candidates, co-ordinating interviews and seeking references. In accordance with the DE&I policy, the committee engages with external search firms who are able to align with bp’s approach to diversity, equity and inclusion in identifying suitable individuals from diverse pools of candidates. It is expected that all members of the committee meet or speak with the shortlisted candidates and agree upon a recommendation which is put to the board for review, taking account of matters such as the candidate’s existing appointments and associated time commitments as well as any actual or potential conflicts of interest. People and governance committee continued

107 Corporate governance bp Annual Report and Form 20-F 2021 Audit committee Chair’s introduction I am pleased to introduce my first report as audit committee chair. The committee has continued to assist the board in fulfilling its responsibilities, by monitoring the integrity of the group’s financial reporting and risk management systems and challenging management and the external auditor across a number of areas, including key accounting judgements and control matters. Karen Richardson joined the committee following the AGM in May 2021. She brings broad financial and commercial experience to the committee. Brendan Nelson stepped down from the committee and the board at the AGM. I would like to thank him for his diligent leadership, constructive challenge and contribution to the committee over the last 11 years. Prior to standing down, a thorough handover was completed and I held meetings with the committee’s key stakeholders which, among other things, sought to identify possible areas for improvement. The outcome of these meetings was overwhelmingly positive, with stakeholders noting that the committee was working well. Some small improvements were implemented, including the quality of materials presented to the committee and placing additional emphasis on risk and control matters. The committee spent considerable time reviewing trading activities, including how this ‘integrator’ supports bp’s strategy and execution. The committee also considered energy price volatility and how this risk was managed by the business, particularly in the US in February and in Europe and Asia in the latter half of the year. Following the board’s decision to exit its shareholding in Rosneft, the committee has undertaken a preliminary review with the external auditor of the accounting implications arising from that decision. This included consideration of the implications for the going concern assumption, longer-term viability and resilience statements in the context of the current economic and geopolitical environment and to ensure the consistency of the disclosures in the annual report with this decision. In 2022, the committee will monitor the progress in the UK of audit and corporate governance reform proposals by the UK government as well as the work being undertaken by the new International Sustainability Standards Board announced at COP26. Tushar Morzaria Committee chair Committee overview Role of the committee The committee monitors the effectiveness of the group’s financial reporting (including climate-related financial disclosures), systems of internal control and risk management and the integrity of the group’s external and internal audit processes. Key responsibilities • Monitor and critically assess bp’s financial statements and financial information, including the integrity of the financial reporting and related processes, context in which statements are made, compliance with relevant legal and regulatory requirements and financial reporting standards, including TCFD. • Assess the going concern assumption and the longer-term viability statement as to bp’s ability to continue to operate and meet its liabilities. • Review and challenge the application and appropriateness of significant accounting policies and financial reporting judgements. • Evaluate the risk to quality and effectiveness of the financial reporting process and, where requested by the board, advise whether the annual report and accounts are fair, balanced and understandable. • Review the affordability of distributions to shareholders. • Oversee the appointment, remuneration, independence and performance of the external auditor and the integrity of the audit process as a whole, including the engagement of the external auditor to supply non-audit services to bp. • Review the effectiveness of the internal audit function, bp’s internal financial controls and its systems of internal control and risk management. • Monitor the principal risks allocated to the committee by the board and review the mitigations proposed by management in respect of risks associated with bp internal financial controls and reporting responsibilities and such emerging risks that may fall within scope. • Review the systems in place to enable those who work for bp to raise concerns about possible improprieties in financial reporting or other issues, and for those matters to be investigated. Meetings and attendance in 2021 There were nine committee meetings in 2021. All members attended each meeting with the exception of Karen Richardson who was unable to attend one of the meetings. Regular attendees include the chief financial officer, SVP accounting reporting control, SVP internal audit, EVP legal and the external auditor. Membership Tushar Morzaria Member since September 2020 and chair since May 2021 Pamela Daley Member Paula Reynolds Member Karen Richardson Member since May 2021 Brendan Nelson Member and chair - resigned from the board May 2021 Alison Carnwath Member - resigned from the board January 2021 Tushar Morzaria is chair of the audit committee. See page 86 for his biography. The board is satisfied that he is the audit committee member with recent and relevant financial experience as provided for by the UK Corporate Governance Code and that he is competent in accounting and auditing in accordance with the FCA’s Disclosure and Transparency Rules. It considers that the committee as a whole has an appropriate and experienced blend of commercial, financial and audit expertise to assess the issues it is required to address, as well as competence in the oil and gas sector. The board has also determined that, as bp is a foreign private issuer, the audit committee meets the independence criteria provisions of Rule 10A-3 of the US Securities Exchange Act of 1934 and that Mr Morzaria can be regarded as an audit committee financial expert as defined in Item 16A of Form 20-F. Tushar Morzaria Committee chair The committee spent considerable time reviewing trading activities, including how this ‘integrator’ supports bp’s strategy and execution.

108 bp Annual Report and Form 20-F 2021 Fair, balanced and understandable (FBU) reporting Regular audit committee review The committee received updates on key sections of the bp Annual Report and Form 20-F 2021 early in the drafting process to provide sufficient time for comment and review. Report on the financial control environment The committee received updates on the control environment and integrity of the financial reporting process. Verification and management assurance The committee reviewed the assurance process in place for non-financial reporting (incorporating TCFD disclosures) and received reports from internal audit and risk on the system of internal controls and risk management. External auditor report The committee received a report from the external auditor on the outcome of its audit work. Recommendation to the board The committee made a recommendation to the board, which in turn reviewed the report as a whole and confirmed the assessment. Activities during the year How the committee reviewed financial disclosure The committee reviewed the quarterly, half-year and annual financial statements with management, focusing on the: • Integrity of the group’s financial reporting process. • Clarity of disclosure. • Compliance with relevant legal and financial reporting standards. • Application of accounting policies and judgements. As part of its review, the committee received regular updates from management and the external auditor in relation to accounting judgements and estimates, including those relating to recoverability of asset carrying values and the impact of climate risk and opportunities. In considering the bp Annual Report and Form 20-F 2021, the committee assessed whether the report was fair, balanced and understandable and also whether it provided the information necessary for shareholders to assess the group’s position and performance, business model and strategy. In making this assessment, the committee examined disclosures during the year, discussed the requirements with senior management, confirmed that representations to the external auditor had been evidenced and reviewed reports relating to internal control over financial reporting. The committee reviewed the consistency of the narrative disclosures and financial statements with climate risks and opportunities. It received a report from management on the verification process undertaken in respect of the annual report, including TCFD disclosures. The committee made a recommendation to the board, which in turn reviewed the report as a whole, confirmed the assessment and approved the report’s publication. See page 110 for how the committee considered climate risks and opportunities in reviewing financial disclosure. How accounting judgements and estimates were considered and addressed The committee was briefed on a quarterly basis in 2021 on the group’s key accounting judgements and estimates during the preparation of these financial statements, which were discussed with management and the external auditor. The key accounting judgements and estimates are set out on pages 178-196. The committee also considered and addressed key accounting estimates and judgements relating to exploration and appraisal intangibles and pensions and other post-retirement benefits. See Financial statements – Note 1 for further information. The committee is satisfied that the financial statements appropriately address the key accounting judgements and estimates in respect of both the amounts reported and disclosures made and in particular that they reflect the impact of the group’s transition strategy. How risks were reviewed The principal risks allocated to the audit committee for monitoring in 2021 included those associated with: Trading and shipping activities: including risks arising from shortcomings or failures in systems, risk management methodology, internal control processes or employees. In reviewing this risk, the committee focused on external market developments and how bp’s trading and shipping integrator had continued to enhance its control environment and policies to strengthen its compliance and control culture. This was particularly important in relation to the price volatility seen during 2021. The committee further considered updates in trading and shipping’s risk management programme, including compliance with regulatory developments, activities in response to cyber threats and efficiencies derived from more collaborative ways of working across bp and the use of digital technologies. The committee also reviewed the continued impact of COVID-19 on operations and the control environment associated with trading activities, with particular reference to operational considerations associated with increased remote working. Compliance with business and regulations: including ethical misconduct or breaches of applicable laws or regulations that could damage bp’s reputation, adversely affect operational results and/or shareholder value and potentially affect bp’s licence to operate. The committee reviewed the group’s programme of controls and contingencies for managing this risk, including enhanced approaches to monitor the risk in light of business evolution (such as an increase in venturing), as well as other internal and external trends. Digital and cyber security risk: including user access controls, misuse of information and systems and disruption of business activity. The committee reviewed ongoing developments in bp’s digital environment, incorporating aspects of cyber security related to user access controls, the optimization of core services and the modernization of bp. Financial liquidity: including the risk associated with external market conditions, supply and demand and prices achieved for bp’s products which could impact financial performance. The committee reviewed the key assumptions and underlying judgements used to manage the group’s liquidity and capital investments (including appraisal, effectiveness and efficiency) and considered the impact of price volatility on available liquidity. Audit committee continued

109 Corporate governance bp Annual Report and Form 20-F 2021 How other reviews were undertaken Other reviews undertaken in 2021 by the committee included the following, and in each case where the committee received segment and function reviews, each reported on strategy, performance, capability and risk management as well as on their first, second and third lines of defence policies as appropriate: • bp ventures and Launchpad: including the purpose, capabilities, operating model, governance and performance of these entities. • Lightsource bp: including strategy, performance, capital structures, governance and controls and financial and cashflow profiles. • Tax: including strategy, performance, key drivers of the group’s effective tax rate, the global indirect tax environment, the tax modernization programme and the evolving approach to management of key risks. • Trading and shipping: including strategy, performance, capability and risk management. • Effectiveness of investment: review of performance of projects with sanctioned capital over a certain threshold. • Internal controls: assessments of management’s plans to remediate the external auditor’s control findings. How internal control and risk management was assessed Internal audit Internal audit provides key assurance to the committee on the group’s governance, risk management and internal control. The SVP internal audit attends the meetings of the committee. Internal audit has a five-year strategy setting out the goals and vision for the function and an update on progress was provided to the committee during the year. The committee also reviewed and approved the internal audit charter, which sets out the expectations for the function in accordance with the Chartered Institute of Internal Auditors’ (IIA) guidelines. The committee received quarterly reports on the findings of internal audit in 2021, setting out progress against the internal audit plan for the year, adaptations made to the plan as the year progressed and key audit findings, together with management’s response. The committee continued to monitor and review the effectiveness and capabilities of internal audit during the year. In assessing its effectiveness, the committee followed the guidance included in the Financial Reporting Council Guidance on Audit Committees which, in addition to approving the annual plan and reviewing reports on the same as mentioned above, included meeting privately with the SVP internal audit, and receiving feedback from other key stakeholders on the effectiveness of the function. The committee concluded that internal audit had unrestricted scope, together with access to information and sufficient resources to fulfil its mandate. Separately, the committee reviewed the independence and objectivity of the SVP internal audit, who has now served for seven years, in line with IIA best practice guidelines. The committee concluded that the SVP internal audit remained independent and objective. In reaching this conclusion, the committee considered feedback from key stakeholders, access to information Site visit during the year In October 2021, the committee conducted a visit to the trading & shipping integrator in London, UK, including presentations from the trading floor covering low carbon trading, European power and global biofuels. Key areas of discussion during this site visit included the impacts of oil and gas price volatility, business development of global power trading and opportunities and risks associated with the transition to a low carbon economy. and the resources available and the response of management to the challenge received. The committee also received a report from internal audit on its annual review of the system of internal control and risk management, together with an assessment from management on the system of internal control. Further information can be found in the risk management and internal control update on pages 142-143. Non-financial reporting assurance framework In the second half of the year, the committee discussed the control and assurance framework for non-financial reporting (NFR) included in the annual report and other documents published by bp under a broad range of regulatory and voluntary disclosure frameworks and standards, including TCFD. As these frameworks and standards evolve and investors and other stakeholders increasingly come to rely on these data points it is important that a suitable control and assurance framework is put in place. Management presented proposals for the development of the NFR assurance framework. The committee considered the role of the second and third lines of defence, including how the internal audit plan would capture material metrics, and the role of external assurance. Those metrics relevant to TCFD ‘comply or explain’ disclosures were considered material. Internal audit completed an audit of certain metrics and TCFD disclosures and reported the outcome of its work to the committee. The committee will monitor the implementation of the NFR assurance framework as part of its role in overseeing the system of internal control. Training and briefings The committee considered market updates and developments throughout the year. This included technical accounting updates from the SVP accounting reporting control on developments in financial reporting and accounting policy, as well as on accounting and disclosure changes that would be introduced as a result of the reorganization of the group. The committee also received briefings on specific topics, including risk governance and the audit and corporate governance consultation undertaken by the UK government during 2021. The committee, together with the board, received an update on the non-financial disclosures included in the bp Annual Report and Form 20-F 2021 and the assurance process underlying the same shortly after the year end. Above: Tushar and Pamela speaking to colleagues on the trading floor.

110 bp Annual Report and Form 20-F 2021 How the committee considered climate risks and opportunities The committee’s primary role in monitoring the effectiveness of bp’s financial reporting, systems of internal control and risk management means that it is well placed to consider the risks and opportunities associated with climate change and the transition to a lower carbon economy. There are several ways in which the committee has considered climate risk and opportunities during the year, which are set out below. In March 2021, the committee reviewed the Lightsource bp business and received an update on strategy, performance, capability and risk management as well as on its first, second and third lines of defence policies. The committee discussed the capital structures and process for investment decisions. In July 2021, the committee conducted its annual review of energy price assumptions, covering the period 2022-50. The scope included oil, natural gas, refining margins and carbon prices within a broad range of scenarios. The committee reviewed and challenged the underlying assumptions provided by management, the changes from the prior year and their consistency with the goals of the Paris agreement compared to a broad spectrum of external Paris-consistent scenarios. The energy price assumptions are used in investment appraisal assumptions and for determining impairments. The committee assessed the differing treatment of carbon emission costs under each judgement and management’s best estimate of how future changes were likely to affect the future cash flows of the group. The committee reviewed impairments and reversals during the year as part of its review of quarterly financial disclosures and, in February 2022, the committee reviewed the full year. The committee reviewed the process for estimating decommissioning liabilities for our operations, in particular for oil and gas property, plant and equipment, and challenged the assumptions used in determining the same, including the anticipated time period over which decommissioning liabilities were expected to be incurred in respect of the pace of transition to a low carbon economy and the alignment to bp’s aims and ambitions to 2030, particularly with respect to refineries. The committee also assessed the process for monitoring decommissioning reversion risk. The committee considered the impact of energy prices, consistent with those noted above for investment appraisal and impairment, as part of its assessment of going concern and the longer-term viability statement. In the latter half of the year, the committee reviewed bp ventures and Launchpad and received an update on how the investment portfolio was integrated into bp’s strategy. Shortly after the year-end the committee reviewed management’s scenario analysis and the inputs used to determine the resilience of our strategy to different climate scenarios. Further details on the key accounting judgements can be found on pages 178-196. For more information on the resilience of our strategy see the Sustainability section on pages 61 to 64. FRC thematic review The bp Annual Report and Form 20-F 2020 was included in the Financial Reporting Council’s (FRC) sample for its thematic review on the disclosure of alternative performance measures (APMs). The committee noted the findings from the thematic review, where bp’s disclosures were considered to be examples of better practice and how further improvements could be incorporated into bp’s 2021 Annual Report. An FRC review provides no assurance that bp’s 2020 Annual Report was correct in all material respects. The FRC’s role was not to verify the information provided, but to consider compliance with reporting requirements. Its letters are written on the basis that the FRC (which includes the FRC’s officers, employees and agents) accepts no liability for reliance on them by bp or any third party, including but not limited to investors and shareholders. External audit How the committee assessed audit risk The external auditor set out its audit plan for 2021, identifying significant audit risks to be addressed during the course of the audit. These included: • Impairment and reversal of oil and gas property, plant and equipment values. • Accounting for structured commodity transactions. • Valuation of level 3 instruments in trading and shipping. • Management override of controls. A summary of the audit approach is set out in the independent auditor’s report on page 147. The committee received updates during the year on the audit process, including how the auditor had challenged the group’s assumptions on the significant audit risks. How the committee assessed audit fees The audit committee reviews the fee structure, resourcing and terms of engagement for the external auditor annually; in addition it reviews the non-audit services that the auditor provides to the group on a quarterly basis. Fees paid to the external auditor for the year were $58 million (2020 $54 million), of which nil% was for non-audit and other assurance services (see Financial statements – Note 35). The audit committee is satisfied that this level of fee is appropriate in respect of the audit services provided and that an effective audit can be conducted for this fee. There were no non-audit or non-audit related assurance fees for the year (2020 $1 million). Non-audit or non-audit related services consisted of other assurance services. How the committee assessed audit effectiveness As part of its overall assessment of audit effectiveness, the committee considers reports from the external auditor and management (see below) on the audit process and quality procedures, together with responses to questions on the same, and the handling of key judgements. The committee also held private meetings with the external auditor during the year and the committee chair met separately with the external auditor and SVP internal audit at least quarterly. The committee assessed the auditor’s approach to providing audit services, taking account of the insights report and management survey, together with the reporting to the committee. The committee concluded that the audit team was providing the required quality in relation to the provision of the services. The audit team had shown the necessary commitment and ability to provide the services together with a demonstrable depth of knowledge, robustness, independence and objectivity as well as an appreciation of complex issues. The team had posed constructive challenge to management and the committee noted the quality of reporting provided to it. Audit committee continued
111 Corporate governance bp Annual Report and Form 20-F 2021 Audit quality reports received by the committee External auditor insights report: the committee receives a summary of areas of opportunity for improvements to processes related to financial reporting or internal control identified as part of the audit process, management’s response to the recommendations identified and progress made against any prior year items together with areas of focus for the forthcoming year. Management survey: the survey sought views from key internal stakeholders and comprised questions across the following: (i) The external auditor’s performance, for which the main measurement criteria were: – Planning and scope – Robustness of the audit process – Independence and objectivity – Quality of delivery – Quality of people and service. (ii) bp’s commitment to the audit. The overall score from the survey remained flat against the prior year, following an increase in 2020 versus 2019. However, strong improvements were seen across communication, international co-operation and knowledge of controls and risks. How the auditor reappointment and independence were assessed The committee considers the reappointment of the external auditor each year before making a recommendation to the board. The committee assesses the independence of the external auditor on an ongoing basis, taking account of the information and assurances provided by the external auditor and the level of non- audit fees. The external auditor is required to rotate the lead audit partner every five years and other senior audit staff every five to seven years. No partners or senior staff associated with the bp audit may transfer to the group. External audit services were last tendered in 2016 and the external auditor has been in role for four years (since 2018). It is anticipated that a retender will be completed by 2026 or sooner, in line with relevant guidelines. The committee believes that the anticipated timeline for the retender of audit services is in the best interests of shareholders. It provides an appropriate balance of factors such as the auditor knowledge of controls and risks, maintaining audit quality, independence and objectivity, and providing value for money. The company is in compliance with the requirements of the Statutory Audit Services for Large Companies Market Investigation (Mandatory Use of Competitive Tender Processes and Audit Committee Responsibilities) Order 2014. How the committee had oversight of non-audit services The audit committee is responsible for bp’s policy on non-audit services and the approval of non-audit services. Audit objectivity and independence are safeguarded through the prohibition of non-audit tax services being provided by the external auditor and the limitation of audit-related work which falls within defined categories. bp’s policy on non-audit services states that the auditor may not perform non-audit services that are prohibited by the SEC, Public Company Accounting Oversight Board (PCAOB), International Auditing and Assurance Standards Board (IAASB) or the UK Financial Reporting Council (FRC). The audit committee approves the terms of all audit services as well as permitted audit- related and non-audit services in advance. The external auditor is considered for permitted non-audit services only when its expertise and experience of bp is important. Approvals for individual engagements of pre- approved permitted services below certain thresholds are delegated to the SVP accounting reporting control or the chief financial officer. Any proposed service not included in the permitted services categories must be approved in advance either by the audit committee chair or the audit committee before engagement commences. The audit committee, chief financial officer and SVP accounting reporting control monitor overall compliance with bp’s policy on audit-related and non-audit services, including whether the necessary pre-approvals have been obtained. The categories of permitted and pre-approved services are outlined in principal accountant’s fees and services on page 362. Other matters The committee reviewed the affordability of the distribution policy elements of the financial frame (covering dividend increases and share buybacks) as part of its review of the quarterly results. The committee considered bp’s cash flow forecasts as it transitions to an international energy company and the risks associated with oil and gas price changes over the medium term. The committee reviewed, and recommended to the board, updates to the risk framework and changes to the highest priority group risks. The committee reviewed its Terms of reference and minor updates were agreed, including making clear how the committee considers climate risks and opportunities. Further details can be found in the corporate governance framework on page 92. An assessment of going concern was made as part of the quarterly results process. The committee also reviewed the longer-term viability statement.

112 bp Annual Report and Form 20-F 2021 Audit committee continued Examples of how accounting judgements and estimates were considered and addressed Key judgements and estimates in financial report Audit committee activity Conclusions/outcomes Impact of climate change and the energy transition Climate change and the transition to a lower carbon economy may have significant impacts on the currently reported amounts of the group’s assets and liabilities and on similar assets and liabilities that may be recognized in the future. • Reviewed management’s best estimate of oil and natural gas price assumptions for value-in-use impairment testing and investment appraisal. • Reviewed management’s assessment of recoverability of exploration intangibles. • Reviewed management’s assessment on decommissioning provisions. • See how the committee considered climate risks and opportunities on page 110. • Management’s revised best estimate of oil and natural gas prices are in line with a range of transition paths consistent with the goals of the Paris climate change agreement. • How bp applies carbon pricing in its impairment testing is disclosed in Note 1. • Sensitivity analyses estimating the effect of changes in net revenue due to prices, production or carbon prices are disclosed in Note 1. • Reasonable changes in the expected timing of decommissioning do not have a significant impact on the associated provisions. Provisions bp’s most significant provisions relate to decommissioning, environmental remediation and litigation. The group holds provisions for the future decommissioning of oil and natural gas production facilities and pipelines at the end of their economic lives. Most of these decommissioning events are many years in the future and the exact requirements that will have to be met when a removal event occurs are uncertain. Assumptions are made by bp in relation to settlement dates, technology, legal requirements and discount rates. The timing and amounts of future cash flows are subject to significant uncertainty and estimation is required in determining the amounts of provisions to be recognized. There is also a risk that decommissioning obligations from previously divested assets revert to bp. • Received briefings on decommissioning (including the process for managing the risk of decommissioning reversion), environmental, asbestos and litigation provisions. These included the requirements, governance and controls for the development and approval of cost estimates and provisions in the financial statements. • Reviewed the group’s discount rates for calculating provisions. • Decommissioning provisions of $16.7 billion were recognized on the balance sheet at 31 December 2021. • The discount rate used by bp to determine the balance sheet obligation at the end of 2021 was a nominal rate of 2.0% – based on long-dated US government bonds – a reduction of 0.5% from 2020. Recoverability of asset carrying values Determination as to whether and how much an asset, cash generating unit (CGU) or group of CGUs containing goodwill is impaired involves management judgement and estimates on uncertain matters such as future commodity prices, discount rates, production profiles, reserves and the impact of inflation on operating expenses. Reserves estimates based on management’s assumptions for future commodity prices have a direct impact on the assessment of the recoverability of asset carrying values reported in the financial statements. • Reviewed policy and guidelines for compliance with oil and gas reserves disclosure regulation, including the group’s reserves governance framework and controls. • Reviewed the group’s oil and gas price assumptions. • Reviewed the group’s discount rates for impairment testing purposes. • Impairment charges, reversals and ‘watch-list’ items were reviewed as part of the quarterly due diligence process. • The group’s price assumption for Brentoil and for Henry Hub gas were increased in the short term and revised downward in the long-term as set out on page 32 and Note 1. Sensitivity analyses estimating the effect of changes in net revenue and discount rate assumptions have been disclosed in Note 1. • Net impairment reversals/charges of $4.1 billion as disclosed in Note 4.

113 Corporate governance bp Annual Report and Form 20-F 2021 Examples of how accounting judgements and estimates were considered and addressed Key judgements and estimates in financial report Audit committee activity Conclusions/outcomes Impact of COVID-19 The following areas involving judgement and estimates were identified as most relevant with regard to the impact of the COVID-19 pandemic and current economic environment: going concern, discount rate assumptions, oil and natural gas price assumptions, pensions and other post-retirement benefits, impairment of financial assets measured at amortized cost and income taxes. • Received briefings on COVID-19 impacts as part of the quarterly due diligence process. • Reviewed liquidity forecast assessments, performed to support the going concern assertion. • Reviewed discount rates used for impairment testing and provisions. • Reviewed management’s best estimate of oil and natural gas price assumptions for value-in-use impairment testing. • bp continues to be resilient despite current economic conditions. The committee is satisfied with management’s assessment that the group can continue to operate as a going concern for at least 12 months from the date of approval of the financial statements. Investment in Rosneft and Aker BP Judgement is required in assessing the level of control or influence over another entity in which the group holds an interest. bp uses the equity method of accounting for its investment in Rosneft and Aker BP and bp’s share of Rosneft’s and Aker BP’s oil and natural gas reserves are included in the group’s estimated net proved reserves of equity-accounted entities. The equity-accounting treatment of bp’s 19.75% interest in Rosneft in 2021 was dependent on the judgement that bp had significant influence over Rosneft. bp announced on 27 February 2022 that it will exit its shareholding in Rosneft. bp’s interest in Aker BP is expected to fall to 15.9% following Aker BP’s proposed transaction with Lundin Energy however bp expects it will continue to have significant influence over Aker BP. • Reviewed the judgement on whether the group had significant influence over Rosneft during 2021 and expects to continue to have significant influence over Aker BP following completion of the Lundin Energy transaction. • Considered IFRS guidance on evidence of participation in policy- making processes. • Received reports from management which assessed the extent of significant influence, including bp’s participation in decision-making. • Reviewed the accounting implications of bp’s announcement to exit its shareholding in Rosneft. • bp retained significant influence over Rosneft throughout 2021 as defined by IFRS. • As a result of bp’s two nominated directors stepping down from the Rosneft board on 27 February 2022, bp has determined that it no longer has significant influence over Rosneft from that date. See Notes 1 and 37 for further information. • The committee supported the judgement that bp will retain significant influence over Aker BP following the proposed Lundin Energy transaction and therefore has not classified the whole investment as an asset held for sale. See Note 1 and 2 for further information. Derivatives For its level 3 derivative financial instruments, bp estimates their fair values using internal models due to the absence of quoted market pricing or other observable, market-corroborated data. Judgement may be required to determine whether contracts to buy or sell commodities meet the definition of a derivative, in particular LNG contracts. • Received regular reports on derivative accounting judgements. • Received a briefing on the group’s trading risks and reviewed the system of risk management and controls in place. • Reviewed the control process and risks relating to the trading business. • bp considers that contracts to buy or sell LNG do not meet the definition of a derivative under IFRS. • bp has assets and liabilities of $5.7 and $7.6 billion, respectively, recognized on the balance sheet for level 3 derivative financial instruments at 31 December 2021 mainly relating to the activities of the trading and shipping function. • bp’s use of internal models to value certain of these contracts has been disclosed in Note 1.

114 bp Annual Report and Form 20-F 2021 Safety and sustainability committee Melody Meyer Committee chair Committee overview Role of the committee The role of the safety and sustainability committee (S&SC) is to oversee the execution and review the processes that are established and maintained by the leadership team to identify and mitigate significant non-financial risk. This role extends to the leadership team’s management of personal and process safety risks, security and cyber security risks, operational, environmental and social risks, ethics and compliance risks and modern slavery risk management. It also includes monitoring the effectiveness of the implementation of bp’s sustainability frame, including the implementation of bp’s net zero ambition and associated aims and targets. To support with this oversight, the S&SC receives assurance that processes to identify and mitigate such non-financial risks are appropriate in their design and effective in their implementation. Key responsibilities of the S&SC The S&SC terms of reference are available on bp’s website, its responsibilities include: 1. Monitoring and or testing: • bp’s performance in respect of safety and sustainability matters; and • the effectiveness of bp’s system of internal control for the safety and sustainability matters, including applicable management systems, policies, practices, processes, leadership and culture; informed by the receipt of performance and assurance reports. 2. Monitoring the management and mitigation of the principal risks allocated to the S&SC by the board and such emerging risks as the S&SC may determine fall within its scope from time to time. 3. Reviewing and testing management’s responses to relevant quarterly reports of group internal audit and the findings of selected safety investigations. 4. Reviewing bp’s modern slavery risk management, annual sustainability report and such other materials intended for disclosure or publication as may be allocated to it by the board from time to time. 5. Conducting such other oversight activities as may be allocated to it by the board from time to time. However, the S&SC is entitled to investigate all matters falling within its scope. Meetings and attendance There were six S&SC meetings in 2021. Four of these meetings were attended by the CEO and by the chair of the board. The SVP safety and operational risk (S&OR) attended every meeting. The SVP internal audit and/or his delegate and the EVP legal also attended meetings, as required. At the conclusion of each meeting the S&SC holds private sessions purely for its members, without management in attendance, to discuss any issues arising and the quality of the meeting. The CEO receives invitations to join the private meetings on an ad hoc basis. At least once a year the SVP internal audit is invited to a private meeting with the S&SC. The S&SC chair reports to the board after each meeting to ensure that the key matters arising at each S&SC meeting are brought to its attention. S&SC members and appointment dates Melody Meyer Member since May 2017 and chair since November 2019 Professor Dame Ann Dowling Member (resigned 12 May 2021) Sir John Sawers Member Johannes Teyssen (appointed 1 January 2021) Chair’s introduction During 2021, the S&SC continued to monitor the work of the leadership team to drive continued improvement in overall safety and environmental performance, with a specific focus on reducing tier 1 process safety incidents. The committee monitored processes and performance in mitigating personal security and cyber security risks. Overall, I am pleased to report that bp maintained solid safety, environmental, and security performance while managing the continued impacts of the COVID-19 pandemic. Early in 2021, the S&SC agreed a plan for monitoring the effectiveness and implementation of bp’s sustainability frame, which includes embedding many sustainability processes and aims into the operating management system (OMS) as it is a proven process for safety and environmental performance improvement. In July, the S&SC received feedback on the executive outreach programme for the sustainability aims; collecting feedback from academics, corporate partners, government representatives, NGOs and investors. Overall this feedback was positive and the inputs were considered as the sustainability frame evolved. From September, the S&SC assumed primary oversight responsibility for the quarterly review of ethics and compliance matters; with the full board continuing to receive ethics and compliance updates annually as part of its oversight responsibility of bp’s ethics and compliance programme. In December, after a full board evaluation of the risk framework, the S&SC high priority group risks were modified to ensure S&SC oversight of the board principal risks that are assigned to the committee. The S&SC terms of reference were updated and the role of the S&SC clarified with respect to the board’s oversight of climate-related risks and opportunities. For more information, see the corporate governance framework on page 92. During the year the S&SC also held additional focused reviews on process safety improvements, cyber security drills, modern slavery, and took part in deeper dives with the full board on aim 3 and TCFD. In 2022, while continuing to monitor the risks and performance in safety, security and sustainability, the committee will focus on the continued goal to eliminate tier 1 process safety incidents by 2025 and the implementation of bp’s net zero ambition and associated aims and targets. The S&SC will monitor bp’s work to provide input to the newly- formed International Sustainability Standards Board, which plans to establish a global baseline for sustainability-related disclosure standards that can inform decision-making on sustainability- related risks and opportunities. We also look forward to additional site visits in person in 2022. Melody Meyer Committee chair The committee monitored and promoted safe, secure, and reliable operations during the continued impacts of the global pandemic in 2021, and had an expanded focus on embedding bp’s sustainability frame.

115 Corporate governance bp Annual Report and Form 20-F 2021 S&SC’s year in review The S&SC and audit committee worked together, through their chairs and secretaries, to ensure that agendas did not overlap or omit coverage of any key risks during the year. The S&SC is entitled to ask for any independent advice and counsel on an unrestricted basis. Safety, system of internal control and risk management The S&SC received specific reports from the business segments and functions, which include, but are not limited to, the safety and operational risk function, shipping, internal audit and group security. The review of operational risk and performance forms a large part of the S&SC’s agenda. Internal audit provided quarterly reports on its assurance work and its annual review of the system of internal control and risk management. The S&SC also received regular reports from the CEO and SVP S&OR on operational risk, including regular reports prepared on the group’s health, safety, security and environmental performance and operational integrity. These included meeting-by-meeting measures of personal and process safety, environmental and regulatory compliance, security and cyber risk, as well as quarterly reports from internal audit on its activity. In addition, the SVP, internal audit regularly met in private with the chair and other members of the S&SC over the course of the year. During the year the S&SC received separate reports on bp’s management of risks relating to: • Marine • Wells • Pipelines • Explosion or release at our facilities • Major security incidents • Cyber security (process control networks) • Ethics and compliance The S&SC reviewed these risks and their management and mitigation in depth with relevant executive management. Additionally, the S&SC reviewed and approved the 2022 audit plan for the internal audit function. The S&SC also has responsibility for reviewing bp’s modern slavery risk management progress and has responsibility for considering focus areas for bp’s future plans. Corporate reporting The S&SC reviewed the bp sustainability report 2020. They also received an update from the external auditor with respect to their limited assurance of selected sustainability key performance indicators and reviewed the scope of 2021-related sustainability assurance. Embedding the sustainability frame In 1Q 2021, the S&SC reviewed the sustainability frame, with sessions on getting to net zero, improving people’s lives and caring for the planet. In September, the S&SC reviewed progress against aims 1 and 4 on net zero operations and reducing methane. This included plans for emissions management across flaring, operating efficiencies, such as spinning reserve monitoring, and methane measurement. Progress and forward plans on aim 16 enhancing biodiversity was also reviewed. In December, the S&SC endorsed sustainable emissions reduction targets for 2022 and reviewed sustainability implementation progress and plans for 2022. Read more about bp’s approach to sustainability on pages 51 to 54. Virtual site visit In April 2021 the S&SC members made a virtual site visit to Angola, one of bp’s key centres for hydrocarbon exploration. Discussions during this visit covered a broad range of topics including the steps being undertaken to address tier 1 and tier 2 process safety events, integrity and hazard recognition, the impact of COVID-19, the methane measurement project and social impact investment. The virtual site visit was also an opportunity for effective virtual engagement with the local staff in Angola.

116 bp Annual Report and Form 20-F 2021 Directors’ remuneration report Paula Rosput Reynolds Committee chair Dear shareholder, On behalf of the board, I am pleased to present our 2021 directors’ remuneration report. As reflected elsewhere in this annual report, 2021 was another challenging year. The pandemic lingered. Yet, bp people completed the most significant restructuring in the company’s history, safely delivering strong operational results and a return to profitability. For all of this and their commitment to progressing the energy transition, we owe our thanks. Overview of bp performance, and the remuneration outcomes arising for 2021 Every year, we seek to reward performance throughout the organization via an annual bonus plan. The 2021 bonus scorecard consists of three categories of measures, safety and sustainability, operational, and financial. The company met its safety targets which were in line with the preceding year. Emissions reductions were well in excess of target, reflecting a cumulative reduction of almost 5.6 million tonnes since 2017 when we first set goals for emissions reductions. While outcomes for availability and reliability for bp’s hydrocarbon plants and refining operations were below target, the effects of the pandemic continued to make operations challenging in 2021. By contrast, our margin share from convenience and electrification exceeded target as our retail network continued to grow. Financial performance, as measured by free cash flow and cumulative cash cost reductions, was outstanding. Taking all of these measures into account, the formulaic outcome was 1.61 out of 2.0. Given the more than satisfactory achievements overall, the committee did not apply any discretion and the plan should pay out, unadjusted, at 80.5% of maximum. For our employees, this result will be a welcome outcome as last year the vast majority of our workforce received no bonus. Contents Alignment with our strategy and investor proposition 119 2021 performance and pay outcomes 121 Executive directors’ pay for 2021 122 2021 annual bonus outcome 122 2019-21 performance share plan outcome 123 Wider workforce in 2021 126 Stewardship and executive director interests 129 Chair and non-executive director outcomes and interests 132 Past directors 133 Other disclosures 135 Policy implementation for 2022 137 Committee overview Role of the committee The role of the committee is to determine and recommend to the board the remuneration policy and to set chair, executive director and leadership team remuneration. It reviews workforce remuneration and monitors related policies, satisfying itself that incentives and rewards are aligned with bp’s culture. In determining the policy, the committee takes into account various factors, including workforce remuneration structures, the policy to promote the long-term success of the company, and an approach to linking reward to performance. Key responsibilities • Recommend to the board the remuneration principles and policies for the executive directors while considering remuneration and related policies for employees below the board and leadership team. • Set and approve the terms of employment, remuneration, benefits and termination of employment for the executive directors, leadership team, chief internal auditor and the company secretary in accordance with the policy. • Prepare the annual remuneration report for shareholders to show how the policy has been implemented. • Approve the principles of any equity plan that requires shareholder approval. • Ensure termination terms and payments to executive directors and the leadership team are fair. • Receive and consider regular updates on workforce views and engagement initiatives related to remuneration, insights and data from pay ratios, potential pay gaps and workforce remuneration as appropriate. • Maintain appropriate dialogue with shareholders on remuneration matters. Membership Paula Rosput Reynolds Member since September 2017 and chair since May 2018 Pamela Daley Member Melody Meyer Member Tushar Morzaria Member (since January 2021) Brendan Nelson Member (retired May 2021) Meetings and attendance The committee met six times during the year. All directors attended each meeting that they were eligible to attend. In addition to the committee, the chair of the board and the chief executive officer (CEO) attend meetings of the committee except for matters relating to their own remuneration. The CEO is consulted on the remuneration of the chief financial officer (CFO) and the leadership team. The committee advises more broadly on remuneration across the wider employee population, which is chiefly the CEO’s responsibility to set. Both the CEO and CFO are consulted on matters relating to the group’s performance and changes to specific measures. bp’s EVP people and culture, SVP reward and wellbeing, and the committee’s independent advisors attend meetings, other executives may attend where necessary. The committee consults other board committees on the group’s performance and on issues relating to the exercise of judgement or discretion as necessary. 2021 was another challenging year. The pandemic lingered. Yet, bp people completed the most significant restructuring in the company’s history, safely delivering strong operational results and a return to profitability. For all of this and their commitment to progressing the energy transition, we owe our thanks.

117 Corporate governance bp Annual Report and Form 20-F 2021 We also reward executives through the vesting of performance share awards. The 2019-21 awards were the last shares granted under the 2017 remuneration policy, and consist of three measures: relative total shareholder return (rTSR) weighted at 50%; return on average capital employed (ROACE) weighted at 20%; and strategic progress imperatives weighted at 30%. On a formulaic basis, neither the rTSR nor ROACE measures met threshold for vesting. Only the strategic progress measure was met, through a blend of quantitative assessments and qualitative judgements which are described later in this report on pages 123 and 124. The committee considered the outcome in the round, taking into account the external environment. Whilst there will be no vesting in respect of the financial measures, the committee recognizes the strong strategic progress made over the period and concluded that the formulaic outcome of 30% of the maximum was appropriate and there would be no application of discretion. Forward-looking committee decisions When making pay decisions for the wider workforce for 2022, the leadership team has been especially sensitive to the wage trends being experienced across the globe. The committee realizes that these are inflationary times and endorsed a somewhat larger budget for pay increases for the wider workforce this year, confirming our long-held aim to align jobs with market rates. Within the UK, bp has matched increases in the real living wage which exceeds the national minimums, and remains a real living wage employer. Bernard continues to lead the enterprise with a bold vision and has also demonstrated that his goal of ‘performing while transforming’ is being met. Given his continued strong performance for the company, we propose to adjust Bernard’s salary by 4.25% in 2022, in line with the budget for the majority of the wider workforce in the UK. Murray has also continued to grow and fully meet the challenges of the CFO role. He now leads as a seasoned CFO. You will recall that we set his pay upon appointment at a level significantly below that of his predecessor. We increased his salary in 2021 by a rate higher than that of the budget for the majority of the wider workforce in the UK, based on his performance and market comparables. We described our thinking in last year’s report, and signalled that the 2021 increase was likely to be the first of two adjustments to move Murray’s base salary to be more in line with that of his predecessor. We therefore propose to increase Murray’s salary by 6.6% to £800,000 which, in our view, appropriately reflects his many contributions. This also aligns him competitively with CFOs across the FTSE 30 and with roles of similar complexity. Our 2020 remuneration policy established flexibility to adjust performance measures and weightings in our bonus and performance share plans so we can respond to circumstances and tailor incentives. While we have deliberated on our performance measures during our recent meetings, we have determined that the measures and weightings used in our most recent scorecards (2021 bonus and 2021-23 performance shares) continue to align remuneration outcomes with the strategic imperatives. Therefore, we will not make adjustments to measures for the 2022 bonus or the 2022-24 performance share plan. Keeping goals constant should assist in evaluating our progress over the next several years. Shareholder and stakeholder engagement In reaching the remuneration decisions described above, we have appreciated the input which we solicited and received from our largest shareholders and from selected shareholder representative bodies in the first quarter of 2022. Over the last year we have also reflected on the counsel we have received from shareholders, with a particular focus on the need to improve transparency around our long-term incentive targets, the updates we provide on strategy, and the links to remuneration. With this in mind, we have taken strides to improve these disclosures and we hope you will find that your concerns have been addressed with the detail on pages 139 and 140. Wider workforce activities bp aspires to offer a well-balanced, progressive and structured approach to reward, with appropriate variations by business area and location. We also find that the ‘non-financial’ reward elements are essential to a supportive culture, with the wellbeing of staff and family playing an increasingly prominent role in bp’s employment proposition. As part of the programme of board/workforce engagement, we held two engagement sessions with a cross-section of UK and global employees in 2021. In these, members of the committee heard views on remuneration matters and a broad range of other topics including job satisfaction, career development, the transformation and culture. In addition, as covered elsewhere on pages 95 and 96, other board members hosted a variety of engagement sessions with selected members of the workforce, throughout 2021. Employees were candid and constructive, which gave us confidence in the outlook and culture of the company. They showed tremendous commitment and rose to the occasion during the pandemic. However, attitudes regarding career and reward are changing in the aftermath and we must respond accordingly, evolving the reward structures, career opportunities and people processes which are described in more detail on page 126. In last year’s report we covered our aim to grant a one-off share award to every bp employee in 2021, vesting in 2025. This reflected our belief in investing for success broadly while aligning employees’ longer-term interests with those of all shareholders. Having delivered on this ambition, we were delighted to see these awards win the ProShare Awards for Best International Share Plan and for Best Overall Performance in Fostering Employee Share Ownership for a company of over 50,000 employees. Our employees throughout bp have demonstrated their commitment to contribute towards the company’s recovery and future performance; seeing the share price recover and the value of their shares increase is a source of optimism about the future. Other matters For the most part this report looks back at the performance pay outcomes to the end of 2021 and is largely silent on the board’s decision, announced on 27 February 2022, to exit its shareholding in Rosneft. The board believes that this decision is in the best long-term interests of all our shareholders. The changes to bp’s financial reporting and finances will be determined in the first quarter of 2022 which may, in turn, affect some of the performance measures and targets that drive incentive pay outcomes for the entire organization. Therefore, at the end of 2022, the committee will carefully consider the impact of this decision, taken under extraordinary circumstances by the board itself, and we expect to make adjustments, where appropriate, to bring this into account. Separately, I would like to acknowledge the many outstanding contributions Brendan Nelson made to our work prior to his retirement from the board last year. He was always a source of analytically sound and well-balanced advice and his presence is greatly missed. At the same time, we are fortunate to have Tushar Morzaria join the committee and bring a fresh perspective and new valuable insights to our deliberations. As ever, we hope you find our report informative. We welcome feedback from you and, where there are material issues of disagreement, the chance to discuss those differences with an eye to finding common ground. In closing, we ask for your support of this directors’ remuneration report, and the decisions described herein, at the forthcoming annual general meeting. Paula Rosput Reynolds Chair of the remuneration committee 18 March 2022

118 bp Annual Report and Form 20-F 2021 Remuneration at a glance Purpose and key features Outcomes for 2021 Implementation in 2022 Salary and benefits • Fixed remuneration reflecting the scale and complexity of our business, enabling us to attract and keep the highest calibre of global talent. • Reviewed annually and, if appropriate, increased following the annual general meeting. • Benchmarked to market at inception with increases reflective of those of our wider workforce. • Bernard’s salary increased by 2.75% to £1,335,750. • Murray’s salary increased by 8% to £750,500. • Benefits were unchanged. • Bernard’s salary to increase by 4.25% to £1,392,519 from the annual general meeting, in line with the budget for the majority of the wider workforce in the UK. • Murray’s salary to increase by 6.6% to £800,000 from the annual general meeting, see further details on page 117. • Benefits will remain unchanged. Retirement benefits • To recognize competitive practice in home country. • Bernard is a deferred member of a UK final salary pension plan. Since appointment, he has received a cash allowance in lieu of retirement benefits. This was set at 15% of salary, in line with rates for new non-retail UK hires at that time • Murray is a deferred member of a US final salary pension plan. Since appointment, he has received a cash allowance in lieu of retirement benefits. This was set at 15% of salary, in line with rates for new non-retail UK hires at that time. • Bernard’s cash allowance remained unchanged at 15% of salary, and he accrues no further value under his UK deferred pension. • Murray’s cash allowance remained unchanged at 15% of salary, and he accrues no further value under his US deferred pension. • Bernard’s cash allowance will remain unchanged at 15% of salary, and he accrues no further value under his UK deferred pension. • Murray’s cash allowance will remain unchanged at 15% of salary, and he accrues no further value under his US deferred pension. Annual bonus • To incentivize delivery of our annual and strategic goals. • 112.5% of salary at target, and 225% of salary at maximum. • To reinforce the long-term nature of our business and the importance of sustainability, 50% of the bonus is paid in cash and 50% is mandatorily deferred and held in bp shares for three years. • For our 2021 bonus, our scorecard was weighted to the following measures: safety and sustainability (30%), operational (20%) and financial (50%). • Against those scorecard measures, the bonus outcome was 80.5% of maximum, and thus the respective 2021 bonus amounts for Bernard and Murray are £2,419,377 and £1,359,343. • 50% of these amounts have been deferred and are now held in bp shares for three years. • Our 2022 bonus scorecard, measures and weightings will remain unchanged relative to the 2021 scorecard. Performance shares • To align reward to our strategy and long-term performance. Vesting outcomes vary relative to our financial returns and strategic priorities. • Annual grant of performance shares, representing the maximum outcome: 500% of salary for the CEO and 450% of salary for the CFO. • Awards granted in 2019 (the last under our 2017 remuneration policy) were measured against three measures: rTSR (50%), ROACE (20%) averaged over the three-year period, and four strategic progress imperatives (30%). Our 2019-21 performance share vesting outcome is 30% of maximum. • This outcome also determines the vesting of the 2019–21 group share value plan (GSVP) awards granted to Bernard and Murray prior to their appointment as executive directors, and thus Bernard and Murray received shares valued at £493,365 and £224,611 respectively. • For our 2022-24 cycle, grant levels will be the same as the 2021-23 cycle at 500% of salary for Bernard and 450% of salary for Murray. • Similarly, our 2022-24 performance shares scorecard will remain unchanged relative to the 2021-23 plan. Shareholding requirement • To ensure sustained alignment between shareholder and executive director interests. • The CEO and other executive directors are required to maintain shareholdings equivalent to 500% and 450% of salary respectively, including for two years post employment (2020 policy). • Bernard and Murray have not yet achieved their minimum shareholding requirement. The policy requires Bernard and Murray to meet their minimum shareholding requirement five years from their dates of appointment (i.e. by 5 February 2025 for Bernard and 1 July 2025 for Murray). • The minimum shareholding requirements will remain unchanged. Directors’ remuneration report continued

119 Corporate governance bp Annual Report and Form 20-F 2021 Alignment with our strategy and investor proposition It is always challenging to design a remuneration policy that will remain fit for purpose throughout a three-year period. In general, the committee believes our 2020 remuneration policy covers the right components and has flexibility to act in service of our transitioning business. In discussions with shareholders most recently, we identified several areas where greater clarity in the 2023 policy will be beneficial. So, rather than simply use our flexibility, we will handle clarifications in the renewal process. For now, we believe we have the flexibility to address most circumstances that have arisen. Overall, the current policy reflects the five broad themes that emerged from our engagement with shareholders: • Aligns strategy, performance, shareholders’ experience, and reward outcomes • Benchmarks company performance to the performance of peers who are also undergoing transition • Uses clear measures to reflect bp’s operating and financial progress • Provides measures to monitor progress in the energy transition and reductions to carbon impact • Provides committee discretion to respond to the economic environment through the energy transition. How we achieve this Throughout the year, the board reviews and discusses company strategy as well as monitors company performance. The board receives significant shareholder input and we also consider independent analysis available on bp’s strategy and performance as we discuss and debate the options. These deliberations culminate in agreed-upon annual plans and multi-year deployment of capital. In turn, this work forms the basis of the goals and measures the committee adopts for the annual bonus and performance share awards. The outcomes of these incentive arrangements are largely governed through two performance scorecards, each comprising of clear measures and targets relating to safety, sustainability, operational, strategic and financial performance. At the end of each performance period, the committee assesses quantitative performance outcomes relative to targets, and reviews the qualitative strategic accomplishments. To conclude whether any discretionary adjustment is appropriate, we then make an ‘underpin’ assessment to consider safety outcomes and, more broadly, how the result aligns with shareholder experience, environmental stewardship, and societal obligations and expectations. Aligning pay outcomes to results delivered is among the most important tasks that the committee undertakes. Our commitment is to oversee this alignment with care, and to explain the basis for the judgements we make. Flexibility through the transition Generating cash from our resilient hydrocarbons business is the foundation for growth areas. We expect to be directing more than 40% or more of our investment into our transition growth businesses. The reallocation of spend to these future-facing endeavours will be a gradual and non-linear matter, requiring flexibility and judgement from the leadership team. From a committee perspective, as more fully discussed on pages 123 and 124, we must apply judgement in assessing this strategic progress, knowing that there are many factors that impinge on management’s judgement as to the pace and scope of change. Convenience and mobility Sustainability Integration Low carbon energy Resilient hydrocarbons For our most senior leaders, remuneration measures are aligned with our strategy, shown above, while maintaining a balance with delivery against the financial frame of our investor proposition, and with our core value, safety. Our measures and weightings across the bonus plans and three performance share plan cycles under the 2020 policy remain largely unchanged, bringing about continuity for plan participants. Alignment of annual bonus scorecards under the 2020 policy 2020 annual bonus 2021 annual bonus 2022 annual bonus Safety, our core value    Strategic progress: • Resilient hydrocarbons    • Convenience and mobility   • Low carbon energy   Sustainability    Financial frame: • Cash flow    • Profit  • Cumulative cash cost reduction   Alignment of performance share scorecards under the 2020 policy 2020-22 performance shares 2021-23 performance shares 2022-24 performance shares Safety, our core value Underpin Underpin Underpin Strategic progress: • Resilient hydrocarbons  } 30%  } 40%  } 40%• Convenience and mobility    • Low carbon energy    Sustainability    Financial frame: } 70%• rTSR   } 60%  } 60%• ROACE    • Adjusted EBIDA CAGR   In this directors’ remuneration report EBIDA per share CAGR, free cash flow excluding Deepwater Horizon costs, return on average capital employed, margin share from convenience and electrification and cumulative cash cost reductions are non-GAAP measures. These measures, together with sustainable emissions reductions, upstream plant reliability and refining availability, are defined in the glossary on page 377.

120 bp Annual Report and Form 20-F 2021 Directors’ remuneration report continued Strategic progress for the three performance share cycles under our 2020 policy is determined using a balance of quantitative assessments and qualitative judgements. To improve transparency through these performance cycles, we have been tracking key performance indicators that will help inform in-flight progress. The table below represents measures we are tracking and our delivery in 2021. For overall delivery in 2021, all measures delivered at target or better, with the exception of plant reliability and refining availability which delivered below plan (see pages 122 and 123 for more detail). Delivery in 2021 2025 targets Resilient hydrocarbons Production costs per barrel $6.82/boe ~$6/boe Plant reliability 94% 96% Refining availability 94.8% 96% Accelerate growth in convenience and mobility Electric vehicle charge points 13,100 >40,000 Strategic convenience sites 2,150 ~3,000 Margin share from convenience and electrification 29.1% ~35% Demonstrate track record, scale and value in low carbon energy Developed renewables to FID 4.4GW 20GW Bioenergya 26mb/d 50mb/d LNG portfolioa 18Mtpa 25Mtpa a Since establishing the scorecards for the 2020 remuneration policy, a portion of these two business areas have subsequently been positioned under the resilient hydrocarbons strategic theme. Environmental, social and governance (ESG) matters and remuneration bp continues to demonstrate significant commitment to ESG matters, not only through the purpose and net zero ambition announced with our new strategy in 2020, but also through the use of relevant measures in the scorecards for annual bonus and long-term incentive plans. Environmental measures involve a focus on both low carbon and on emissions reductions. The continued use of safety as an underpin for the long-term incentive plan, and as a measure in the annual bonus plan, speaks to our commitment to social matters in the broadest sense. In 2022, bp is expanding the impact of ESG measures through the introduction of two additional social measures: employee engagement and an improvement in ethnic representation. Recognizing the latter, we realize that, as a global company, the opportunity to become more ethnically diverse deserves the same focus and energy that we have put to gender representation and an inclusive environment. We will embed this commitment by incorporating these measures as part of the long-term incentive plan scorecard for the senior leaders of the company. Looking ahead, the committee will assess the appropriateness of including these social measures in the scorecards for executive directors during the 2023 remuneration policy review. Governance is not a specific scorecard measure for management. However, it is woven through our corporate governance framework as described on pages 90-92.
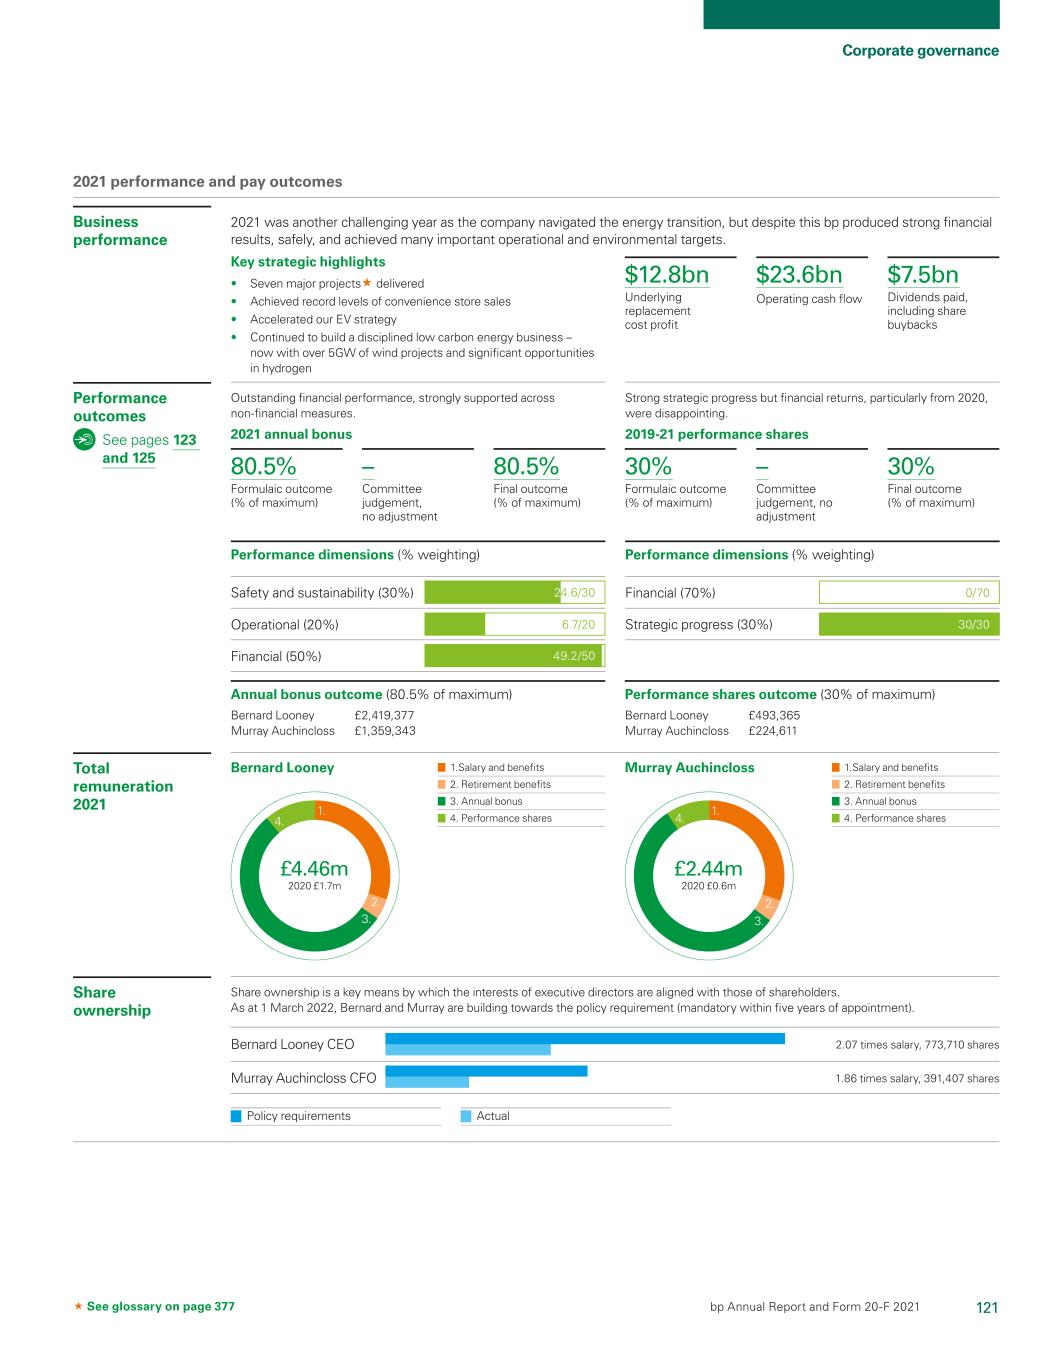
1. 2. 3. 4. £4.46m 2020 £1.7m 1. 2. 3. 4. £2.44m 2020 £0.6m Bernard Looney CEO Murray Auchincloss CFO 2.07 times salary, 773,710 shares 1.86 times salary, 391,407 shares Policy requirements Actual 121 Corporate governance bp Annual Report and Form 20-F 2021 See glossary on page 377 2021 performance and pay outcomes Business performance Performance outcomes See pages 123 and 125 Total remuneration 2021 Share ownership $12.8bn Underlying replacement cost profit $23.6bn Operating cash flow $7.5bn Dividends paid, including share buybacks 30% Formulaic outcome (% of maximum) – Committee judgement, no adjustment 30% Final outcome (% of maximum) 80.5% Formulaic outcome (% of maximum) – Committee judgement, no adjustment 80.5% Final outcome (% of maximum) Performance dimensions (% weighting) Annual bonus outcome (80.5% of maximum) Bernard Looney £2,419,377 Murray Auchincloss £1,359,343 Performance dimensions (% weighting) Performance shares outcome (30% of maximum) Bernard Looney £493,365 Murray Auchincloss £224,611 Key strategic highlights • Seven major projects delivered • Achieved record levels of convenience store sales • Accelerated our EV strategy • Continued to build a disciplined low carbon energy business – now with over 5GW of wind projects and significant opportunities in hydrogen 2021 was another challenging year as the company navigated the energy transition, but despite this bp produced strong financial results, safely, and achieved many important operational and environmental targets. Outstanding financial performance, strongly supported across non-financial measures. Strong strategic progress but financial returns, particularly from 2020, were disappointing. Share ownership is a key means by which the interests of executive directors are aligned with those of shareholders. As at 1 March 2022, Bernard and Murray are building towards the policy requirement (mandatory within five years of appointment). 2019-21 performance shares Safety and sustainability (30%) Operational (20%) Financial (50%) Financial (70%) Strategic progress (30%) 2021 annual bonus 30/306.7/20 24.6/30 49.2/50 0/70 1.Salary and benefits 2. Retirement benefits 3. Annual bonus 4. Performance shares 1.Salary and benefits 2. Retirement benefits 3. Annual bonus 4. Performance shares Bernard Looney Murray Auchincloss

122 bp Annual Report and Form 20-F 2021 Executive directors’ pay for 2021 Single figure table – executive directors (audited) Bernard Looney CEO (thousand) 2021 Murray Auchincloss CFO (thousand) 2021 Bernard Looneya CEO (thousand) 2020 Murray Auchinclossa CFO (thousand) 2020 Salary £1,323 £730 £1,181 £348 Benefits £23 £14 £26 £8 Cash in lieu of retirement benefits £198 £110 £177 £52 Annual bonus, cash (50%) £1,210 £680 – – Annual bonus, deferred (50%) £1,210 £680 – – Performance sharesbc £493 £225 £351 £215 Total remunerationd £4,457 £2,438 £1,735 £623 Total fixed remuneration £1,544 £854 £1,384 £408 Total variable remunerationd £2,913 £1,584 £351 £215 Please refer to the overview section below for additional detail, except where noted otherwise. a Bernard Looney and Murray Auchincloss joined the board on 5 February and 1 July 2020 respectively. 2020 values reflect remuneration outcomes from the date of appointment to the board. b Performance shares for Bernard and Murray relate to awards granted prior to their appointment to the board, and the values shown reflect share prices at close on 16 February 2022 of £4.04 per ordinary share and $32.48 per ADS. c Murray’s 2019-21 performance share award was granted in ADS. The value shown has been converted from USD to pound sterling at 1.3753. d Due to rounding, the totals may not agree exactly with the sum of their component parts. Overview of single figure outcomes Salary and benefits Bernard Looney’s salary increased from £1,300,000 to £1,335,750 from the 2021 annual general meeting. Murray Auchincloss’s salary increased from £695,000 to £750,500 from the 2021 annual general meeting. Both the executive directors receive car-related benefits, coverage of tax return preparation, security assistance, insurance and medical benefits. Cash in lieu of retirement benefits From their appointment as executive directors, Bernard and Murray ceased to receive any retirement benefits for their service, but receive a cash allowance fixed at 15% of salary. They may choose to direct these allowances into retirement plans at their sole discretion, and the amounts are therefore identified as cash in lieu of retirement benefits in the single figure table. Since that decision was made, and as is described on page 126, bp has made significant changes to the retirement benefits of the wider non-retail workforce in the UK. For our wider non-retail workforce in the UK (54% of the full UK workforce), we increased the flexible cash benefits allowance from 15% to 20% of salary from July 2021. Therefore, the 15% allowance for bp’s executive directors may no longer be representative of the wider non-retail workforce in the UK and the committee will review this as part of the 2023 policy review. 2021 annual bonus outcome For 2021 the committee established a bonus scorecard of six measures across three areas: safety and sustainability, operational, and financial performance. These measures align with our strategy and investor proposition (see page 119 for a detailed illustration). bp’s continued focus on safety delivered a year with record low levels of tier 1 and tier 2 process safety events, finishing the year with a total of 62 events. As part of our overview of formulaic outcomes, we rely on the judgement of the safety and sustainability committee (S&SC) for an evaluation of safety outcomes and this year we have given particular regard to the S&SC analysis of the two fatalities (one workforce and one third-party fatality) related to bp’s operations. After review, the S&SC recommended that no adjustment be made and the committee concurred with that view. The S&SC noted that an adjustment should be made if there is a material deterioration in safety and environmental performance, or there have been major incidents that reveal an underlying weakness in safety and environmental management. Emissions reductions were well in excess of target, reflecting a cumulative reduction of almost 5.6 million tonnes since 2017 when we first set goals for emissions reductions. All operating entities within production & operations and shipping contributed to this achievement. Within bpx energy, progress has been made with the reduction of flaring, refining through conversion to green power contracts, and in Angola & North Sea through energy efficiency projects. Availability and reliability of our hydrocarbon plants and refining operations were below target outcome, at 94.5%, due to unplanned hydrocarbon plant outages and higher levels of refining maintenance activity. By contrast, margin share from convenience and electrification exceeded target at 29.1%, with a record annual convenience gross margin. This was supported by the addition of over 200 strategic convenience sites and increased average purchase value. bp also continued the roll-out of electric vehicle charge points with nearly half of the 13,100 charge points now either rapid or ultra-fast charging, which are preferred by motorists. Financial performance, as measured by free cash flow and cumulative cost reductions, was outstanding. Achieving a free cash flow of $16.36 billion was very strong relative to the environment-adjusted target of $15.42 billion, and full-year earnings delivery was supported by lower capital spend from disciplined capital management and accelerated divestment proceeds. Cumulative cash cost reductions of $3.0 billion were delivered above the plan maximum, $2.8 billion. Directors’ remuneration report continued
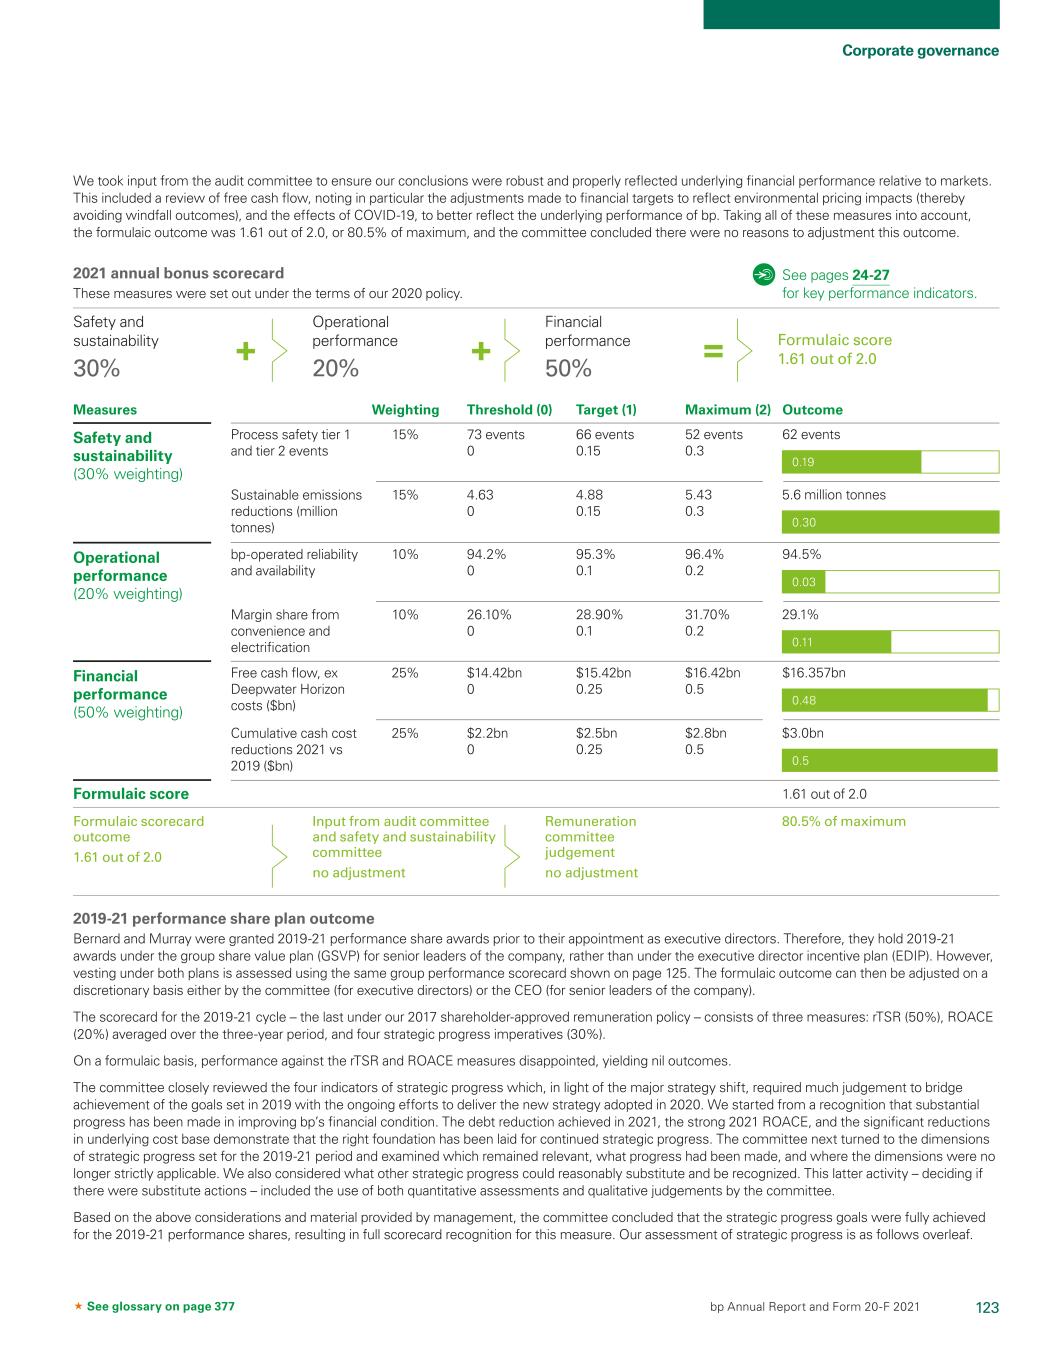
123 Corporate governance bp Annual Report and Form 20-F 2021 See glossary on page 377 Formulaic scorecard outcome 1.61 out of 2.0 Input from audit committee and safety and sustainability committee no adjustment Remuneration committee judgement no adjustment 80.5% of maximum Formulaic score 1.61 out of 2.0 Safety and sustainability 30% Operational performance 20% Financial performance 50% Formulaic score 1.61 out of 2.0 Safety and sustainability (30% weighting) Operational performance (20% weighting) Financial performance (50% weighting) 2021 annual bonus scorecard These measures were set out under the terms of our 2020 policy. Measures OutcomeWeighting Threshold (0) Target (1) Maximum (2) + =+ Sustainable emissions reductions (million tonnes) Margin share from convenience and electrification Cumulative cash cost reductions 2021 vs 2019 ($bn) Process safety tier 1 and tier 2 events bp-operated reliability and availability Free cash flow, ex Deepwater Horizon costs ($bn) 73 events 0 94.2% 0 $14.42bn 0 4.63 0 26.10% 0 $2.2bn 0 15% 10% 25% 15% 10% 25% 66 events 0.15 95.3% 0.1 $15.42bn 0.25 52 events 0.3 96.4% 0.2 $16.42bn 0.5 4.88 0.15 28.90% 0.1 $2.5bn 0.25 5.43 0.3 31.70% 0.2 $2.8bn 0.5 62 events 94.5% $16.357bn 5.6 million tonnes 29.1% $3.0bn 0.19 0.30 0.03 0.11 0.48 0.5 2019-21 performance share plan outcome Bernard and Murray were granted 2019-21 performance share awards prior to their appointment as executive directors. Therefore, they hold 2019-21 awards under the group share value plan (GSVP) for senior leaders of the company, rather than under the executive director incentive plan (EDIP). However, vesting under both plans is assessed using the same group performance scorecard shown on page 125. The formulaic outcome can then be adjusted on a discretionary basis either by the committee (for executive directors) or the CEO (for senior leaders of the company). The scorecard for the 2019-21 cycle – the last under our 2017 shareholder-approved remuneration policy – consists of three measures: rTSR (50%), ROACE (20%) averaged over the three-year period, and four strategic progress imperatives (30%). On a formulaic basis, performance against the rTSR and ROACE measures disappointed, yielding nil outcomes. The committee closely reviewed the four indicators of strategic progress which, in light of the major strategy shift, required much judgement to bridge achievement of the goals set in 2019 with the ongoing efforts to deliver the new strategy adopted in 2020. We started from a recognition that substantial progress has been made in improving bp’s financial condition. The debt reduction achieved in 2021, the strong 2021 ROACE, and the significant reductions in underlying cost base demonstrate that the right foundation has been laid for continued strategic progress. The committee next turned to the dimensions of strategic progress set for the 2019-21 period and examined which remained relevant, what progress had been made, and where the dimensions were no longer strictly applicable. We also considered what other strategic progress could reasonably substitute and be recognized. This latter activity – deciding if there were substitute actions – included the use of both quantitative assessments and qualitative judgements by the committee. Based on the above considerations and material provided by management, the committee concluded that the strategic progress goals were fully achieved for the 2019-21 performance shares, resulting in full scorecard recognition for this measure. Our assessment of strategic progress is as follows overleaf. See pages 24-27 for key performance indicators. We took input from the audit committee to ensure our conclusions were robust and properly reflected underlying financial performance relative to markets. This included a review of free cash flow, noting in particular the adjustments made to financial targets to reflect environmental pricing impacts (thereby avoiding windfall outcomes), and the effects of COVID-19, to better reflect the underlying performance of bp. Taking all of these measures into account, the formulaic outcome was 1.61 out of 2.0, or 80.5% of maximum, and the committee concluded there were no reasons to adjustment this outcome.

124 bp Annual Report and Form 20-F 2021 Directors’ remuneration report continued Progress against the four strategic imperatives: 1. Growing gas and advantaged oil in the upstream. bp aims to invest in new large-scale gas projects, pursue quality oil projects in core basins and seek out new opportunities in selected regions. bp has indicated that it intends to change its investment plans to dedicate more of its capital to projects with a low or no carbon character. The consequence of this clearly changes the investment pattern of how bp meets the goal described above. We are satisfied that management has made wise choices in this regard. Despite the severe challenges presented by the pandemic, bp’s production mix of gas improved from 50% in 2018 to 51% in 2021 and oil project development costs reduced from $17.2/bbl to $15.9/bbl over the same period. The company, despite the change in focus, managed the successful start-up of 16 major projects over the three-year period. The oil-related projects deliver lower average development costs while both oil and gas projects deliver lower carbon intensity than the pre-existing portfolio. 2. Market-led growth in the downstream. bp aims to innovate with advanced products and strategic partnerships. The work to advance what is now convenience & mobility falls well within the ambit of the goal established in 2019. The pandemic presented specific challenges for the customer-focused businesses with fuel sales impacted by demand destruction. However, bp’s continued focus on improving its convenience competitive position is evident through the number of strategic convenience sites increasing from 1,400 in 2018 to 2,150 in 2021. With the Thornton’s transaction, bp is now a leading operator in the US Midwest. The extension of the UK partnership with Marks & Spencer until at least 2030 provides further confidence that the UK forecourts offer can evolve as customers’ behaviour changes. 3. Venturing and low carbon across multiple fronts. bp aims to pursue new ventures and partnerships to meet rapidly evolving trends and develop cross-business solutions to create opportunities or strengthen relationships. This aspect of bp’s ambition has proceeded as it is also highly consistent with bp’s revised strategy. Critically, over 3.9MtCO2e of sustainable emissions reductions were delivered over the 2019 to 2021 period, an important step in our aim 1 to be net zero across our entire operations on an absolute basis by 2050 or sooner. bp Launchpad continued to build its portfolio of companies in the advanced analytics and energy management space with the acquisition of Open Energi and Blueprint Power. bp ventures continued to create options for bp in new technologies and advanced mobility that will support the energy transition with investments in Lightning eMotors, BluSmart, and IoTecha. Material progress has also been made in creating low carbon businesses, as 3.5GW net offshore wind licences have been secured in the US and Irish Sea. Progress has been made in hydrogen with a 1.3mtpa project hopper built, together with Abu Dhabi partnerships and East Coast Cluster selection. In total 33 projects were delivered to final investment decision (FID) stage during 2021. 4. Gas power and renewables trading and marketing growth. bp aims to compete and seize new opportunities with partners and stakeholders in a changing world. This goal too is consistent with the revised strategy and significant progress has been made. bp remains the largest US gas and power marketing company and one of the largest in the world; bp also secured a material deal of 250MW of power for the next 15 years. Trading is integrally related to several segments and therefore results are not compiled as a separate business. In fact, bp finished 2021 with increased earnings and a wider footprint of trading. Moreover, the increase in the scope of renewables trading has been significant. As the world recognizes the value of natural gas as a transition fuel, bp has added three advanced LNG tankers to the bp-operated fleet since 2019, grown US Gulf Coast liquefaction capacity by 7.4mtpa and more than doubled the number of non-equity LNG cargoes versus 2018 levels. Other vesting considerations Along with the results from the scorecard measures, the committee considers an ‘underpin’ to the formulaic outcome in order to determine the final vesting percentage. The underpin broadens our performance assessment, allowing us to consider overall alignment with absolute shareholder returns, environmental and safety factors (including fatalities) and progress in low carbon and climate change matters. Where relevant, we take input from the safety and sustainability committee and the audit committee to deepen our perspective. Having considered the above matters, we concluded that there was no reason to apply a discretionary adjustment to the formulaic vesting outcome for the executive directors, and that the plan should vest in line with the scorecard outcome at 30% of maximum. This yields the outcomes shown in the table below. The scorecard detail is shown on page 125. 2019-21 performance share plan outcomes (audited) Shares awardeda Shares vesting including dividends Value of vested shares, Feb 2022 Impact of share price changeb Bernard Looney 167,960 122,120 £493,365 -£145,117 Murray Auchinclossc 78,234 57,066 £224,611 -£62,856 a Share grants under the GSVP are made at 50% of maximum, not at 100% of maximum as for the EDIP. b These values reflect the impact of the reduction in share price since grant related to the number of shares that vest, excluding dividend equivalents. c Murray’s awards were granted and delivered in respect of ADSs. The numbers in the table reflect calculated equivalents in ordinary shares, and the value has been converted from US dollars to pound sterling at 1.3753. The value of vested shares reflects the share price changes all shareholders have experienced over the three-year period. For this 2019-21 award cycle, the original grant was calculated based on ordinary share and ADS prices of £5.48 and $43.53 respectively, while the values at vesting were £4.04 and $32.48 on 16 February 2022 (see page 129 for more detail). Consequently, the share price fall has reduced the initial face value of these awards by approximately 26% for ordinary shares and 25% for ADSs. The committee has made no discretionary adjustments to vesting outcomes related to these share price changes.

125 Corporate governance bp Annual Report and Form 20-F 2021 See glossary on page 377 Financial Measures OutcomeWeighting Threshold performance Maximum performance Return on average capital employed (2019-21 average) Market-led growth in the downstream Gas power and renewables trading and marketing growth Relative total shareholder return Formulaic vesting 30% Underpin: Committee review of absolute returns, long-term safety and environmental performance, low carbon and climate change considerations: No adjustment Final vesting after committee judgement 30% Venturing and low carbon across multiple fronts Third 8.5% 50% 7.5% 20% 7.5% 7.5% First 12.5% Outcome Outcome 0% 30% Fifth Formulaic 6.2% Strategic progress Growing gas and advantaged oil in the upstream 7.5% Qualitative and quantitative assessment by the committee. No numeric scale for the vesting outcome (see page 124 for more detail) Relative total shareholder return 0% Return on average capital employed 0% Strategic progress 30% Formulaic vesting 30% + =+ 0% 0% 7.5% 7.5% 7.5% 7.5% 30% History of chief executive officer remuneration Year Chief executive officer Total remuneration thousand Annual bonus % of maximum Performance shares % of maximum 2012 Bob Dudley $9,609 64.9 0 2013 Bob Dudley $15,086 88.0 45.5 2014 Bob Dudley $16,390 73.3 63.8 2015 Bob Dudley $19,376 100.0 74.3 2016 Bob Dudley $11,904 61.0 40.0 2017 Bob Dudley $15,108 71.5 70.0 2018 Bob Dudley $15,253 40.5 80.0 2019 Bob Dudley $13,336 67.5 71.2 2020a Bob Dudley $188 0 32.5 Bernard Looney £1,735 0 32.5 2021 Bernard Looney £4,457 80.5 30 a 2020 figures show remuneration for the periods of qualifying service as CEO during 2020. 2019-21 performance share plan scorecard (audited) These measures were set under the terms of our 2017 policy. See pages 24-27 for key performance indicators.

126 bp Annual Report and Form 20-F 2021 Wider workforce in 2021 Workforce experience During 2021 the committee continued to receive and review information on pay outcomes and processes for our wider workforce in order to take account of wider workforce pay and conditions when making decisions on executive remuneration. To further deepen our insights into the workforce experience, we have not relied only upon reports from senior leadership, but this year have engaged directly with representative employees from different parts of the workforce in two specific engagement sessions. In planning these engagement sessions we looked for diversity of input across multiple fronts: including type of role, tenure, location, and nationality. At these sessions we discussed bp’s purpose and ambition, and how this aligns with the organization’s reward programmes. In one of these sessions, we focused on the impact of changes to the UK reward package implemented during the year. Our enquiries ranged from success in attracting and retaining talent, employee preferences in how pay is delivered, the structure of the reward package, and bp’s programmes for international mobility. A recurring theme in the discussions was employees’ desire for flexibility, with empowerment to make individual choices about both work and pay. During 2021 bp conducted a full review of the reward package available to the wider non-retail workforce in the UK. The company completed the final step in closing its defined benefit pension plan, which had remained open for legacy employees only, and adopted a flexible cash-in-lieu benefit arrangement instead. This allowed the company to improve the consistency of benefits across the wider non-retail workforce in the UK, thus increasing the cash-in-lieu value from 15% to 20% of salary. The 20% allowance applies to the wider non-retail workforce in the UK only; bp’s retail employee population are automatically enrolled in the National Employment Savings Trust (NEST), a UK defined contribution pension plan which is aligned with the typical market practice for UK retail businesses. In the interest of fairness, bp has not set a minimum earnings threshold for this population and allows all of the retail population to participate. The fact two very separate schemes exist in the UK does complicate the definition of ‘wider workforce’ in determining the qualifying benefit for executive directors. As mentioned on page 122 we will seek to address this matter as part of the 2023 policy review. We were also pleased to note the enthusiasm felt for the one-off share grant made to every bp employee in 2021. These awards, due to vest in 2025, reflect a belief that employees should be personally invested in the value that can be created through bp’s reinvention, thus aligning their longer-term interests with all shareholders. Looking beyond direct pay into the broader employee proposition, we note the strong emphasis on maintaining a supportive and inclusive working environment, and a general ‘culture of care’. For instance, we note bp’s commitment to family-friendly leave policies, recognition of bp as a top global employer in Stonewall’s list of the best multinational employers for LGBT+ staff, and a fourth consecutive 100% score in the Human Rights Campaign’s 2021 Corporate Equality Index which measures adoption of non-discrimination policies, equitable benefits for LGBT+ employees and families, and supporting an inclusive culture and corporate social responsibility. We are also delighted that bp is and continues to be accredited by the Living Wage Foundation as a real Living Wage employer in the UK. bp is actively developing plans for an equivalent global standard on fair/living wages. With all these programmes bp seeks to avoid bias through the design of appropriate reward programmes and processes. We have reviewed data from bp’s gender and ethnicity pay gap analyses and are satisfied that, while there are pay gaps, these are mainly attributable to difference in representation across the pay hierarchy and not an indicator of bias in programmes or decision-making. As the gender and ethnicity report has already been published on the company’s website bp.com, and with bp’s ongoing commitment to annual diversity, equity and inclusion reporting (first published in 2021), we won’t expand any further here. In conclusion, we find bp employees are positively engaged by their work and conditions, and that the pay structures summarized on page 127 are well-balanced for employees’ needs. Approaches to pay vary by business area and location and therefore the following table covers the ‘core’ offering for the majority of the workforce. Directors’ remuneration report continued

127 Corporate governance bp Annual Report and Form 20-F 2021 Element Policy features for the wider workforce Comparison with executive director remuneration Salary Our salary is the basis for a competitive total reward package for all employees, and we conduct an annual salary review for all non-unionized employees. As we determine salaries in this review, we take account of comparable pay rates at other relevant employers, the skills, knowledge and experience of each individual, and the overall budget we set for each country. In setting the budget each year, we assess how employee pay is currently positioned relative to market rates, forecasts of any further market increases, and business context related to such things as growth plans, workforce turnover and affordability. The salaries of our executive directors form the basis of their total remuneration, and we review these salaries annually. The primary purpose of the review is to stay aligned with relevant market comparators. We intend to keep increases within the salary review budgets set for our wider workforce, except in specific circumstances. Pensions and benefits We offer market-aligned benefits packages reflecting normal practice in each country in which we operate. Where appropriate, and subject to scale, we offer significant elements of personal benefit choice to our employees. For our wider non-retail employees in the UK, covering 54% of the UK workforce, we increased the flexible cash benefits allowance from 15% to 20% of salary from July 2021, following the closure of the defined benefit pension arrangement. Other than the addition of security-related benefits, our executive director benefit packages are broadly aligned with those of other employees who joined bp in the same country at the same time. Under our 2020 remuneration policy, pension benefits have been sharply reduced for our executive directors, who receive a cash-in-lieu of pension allowance set at 15% of salary. Their previously accrued defined benefit calculations are capped on pre-appointment salary and service. Annual bonus Over half of our global workforce participate in an annual cash bonus plan that multiplies a target bonus amount by a bp performance factor in the range 0 to 2. We operate different bonus plans for those distinct parts of our business where remuneration models in the market are markedly different, such as our trading businesses. Annual bonus for executive directors is directly related to the same bp performance measures and outcomes as those for the wider workforce. Performance shares We operate a performance share plan with three-year vesting for employees from our professional entry level and above. Opportunity varies based on seniority in three broad tiers: group leaders (approximately 300); senior leaders (approximately 4,000); and all other professional employees (approximately 30,000 potential participants, of whom 20% will participate). Vesting is subject to bp performance outcomes for the group leader population only. Performance shares for our executive directors have been assessed using the same bp performance scorecard as is used for the group leader performance shares. For the next cycle, 2022-24, we are modifying the scorecard for group leaders to fit more closely with their sphere of influence. We will consider whether to make similar amendments for executive directors next year, as part of our considerations for the 2023 policy.
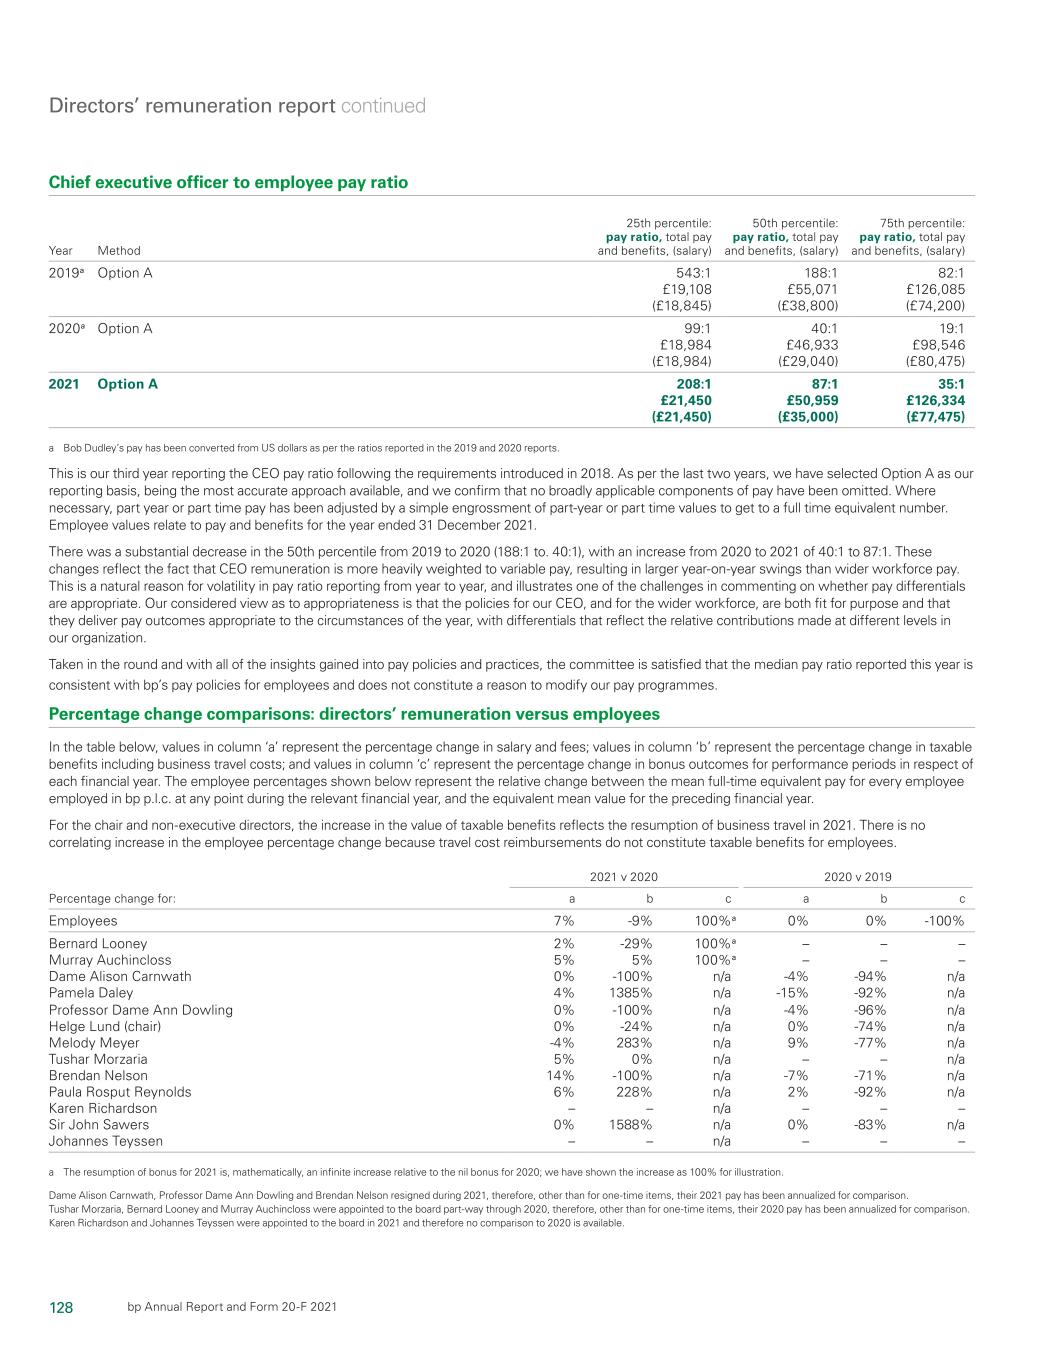
128 bp Annual Report and Form 20-F 2021 Directors’ remuneration report continued Chief executive officer to employee pay ratio Year Method 25th percentile: pay ratio, total pay and benefits, (salary) 50th percentile: pay ratio, total pay and benefits, (salary) 75th percentile: pay ratio, total pay and benefits, (salary) 2019a Option A 543:1 188:1 82:1 £19,108 £55,071 £126,085 (£18,845) (£38,800) (£74,200) 2020a Option A 99:1 40:1 19:1 £18,984 £46,933 £98,546 (£18,984) (£29,040) (£80,475) 2021 Option A 208:1 87:1 35:1 £21,450 £50,959 £126,334 (£21,450) (£35,000) (£77,475) a Bob Dudley’s pay has been converted from US dollars as per the ratios reported in the 2019 and 2020 reports. This is our third year reporting the CEO pay ratio following the requirements introduced in 2018. As per the last two years, we have selected Option A as our reporting basis, being the most accurate approach available, and we confirm that no broadly applicable components of pay have been omitted. Where necessary, part year or part time pay has been adjusted by a simple engrossment of part-year or part time values to get to a full time equivalent number. Employee values relate to pay and benefits for the year ended 31 December 2021. There was a substantial decrease in the 50th percentile from 2019 to 2020 (188:1 to. 40:1), with an increase from 2020 to 2021 of 40:1 to 87:1. These changes reflect the fact that CEO remuneration is more heavily weighted to variable pay, resulting in larger year-on-year swings than wider workforce pay. This is a natural reason for volatility in pay ratio reporting from year to year, and illustrates one of the challenges in commenting on whether pay differentials are appropriate. Our considered view as to appropriateness is that the policies for our CEO, and for the wider workforce, are both fit for purpose and that they deliver pay outcomes appropriate to the circumstances of the year, with differentials that reflect the relative contributions made at different levels in our organization. Taken in the round and with all of the insights gained into pay policies and practices, the committee is satisfied that the median pay ratio reported this year is consistent with bp’s pay policies for employees and does not constitute a reason to modify our pay programmes. Percentage change comparisons: directors’ remuneration versus employees In the table below, values in column ‘a’ represent the percentage change in salary and fees; values in column ‘b’ represent the percentage change in taxable benefits including business travel costs; and values in column ‘c’ represent the percentage change in bonus outcomes for performance periods in respect of each financial year. The employee percentages shown below represent the relative change between the mean full-time equivalent pay for every employee employed in bp p.l.c. at any point during the relevant financial year, and the equivalent mean value for the preceding financial year. For the chair and non-executive directors, the increase in the value of taxable benefits reflects the resumption of business travel in 2021. There is no correlating increase in the employee percentage change because travel cost reimbursements do not constitute taxable benefits for employees. 2021 v 2020 2020 v 2019 Percentage change for: a b c a b c Employees 7% -9% 100%a 0% 0% -100% Bernard Looney 2% -29% 100%a – – – Murray Auchincloss 5% 5% 100%a – – – Dame Alison Carnwath 0% -100% n/a -4% -94% n/a Pamela Daley 4% 1385% n/a -15% -92% n/a Professor Dame Ann Dowling 0% -100% n/a -4% -96% n/a Helge Lund (chair) 0% -24% n/a 0% -74% n/a Melody Meyer -4% 283% n/a 9% -77% n/a Tushar Morzaria 5% 0% n/a – – n/a Brendan Nelson 14% -100% n/a -7% -71% n/a Paula Rosput Reynolds 6% 228% n/a 2% -92% n/a Karen Richardson – – n/a – – – Sir John Sawers 0% 1588% n/a 0% -83% n/a Johannes Teyssen – – n/a – – – a The resumption of bonus for 2021 is, mathematically, an infinite increase relative to the nil bonus for 2020; we have shown the increase as 100% for illustration. Dame Alison Carnwath, Professor Dame Ann Dowling and Brendan Nelson resigned during 2021, therefore, other than for one-time items, their 2021 pay has been annualized for comparison. Tushar Morzaria, Bernard Looney and Murray Auchincloss were appointed to the board part-way through 2020, therefore, other than for one-time items, their 2020 pay has been annualized for comparison. Karen Richardson and Johannes Teyssen were appointed to the board in 2021 and therefore no comparison to 2020 is available.

129 Corporate governance bp Annual Report and Form 20-F 2021 Stewardship and executive director interests We believe that our executive directors should have a material interest in the company, both during their tenure and after they leave bp. Our shareholding policy therefore requires the CEO and CFO to build a personal shareholding of five times and four and a half times, respectively, their salary within five years of their appointment. They are expected to maintain this level of personal shareholdings for two years post employment. Directors’ shareholdings (audited) The table below details the personal shareholdings of each current executive director. Bernard Looney and Murray Auchincloss are building towards the policy requirement that applies five years from their dates of appointment, 5 February and 1 July 2020 respectively. These figures include all beneficial and non-beneficial ownership of shares of bp (or calculated equivalents) that have been disclosed to the company, but exclude shares delivered under 2019-21 performance share awards (as these are included in the performance shares table below). Director Ordinary shares or equivalents at 1 Jan 2021 Ordinary shares or equivalents at 31 Dec 2021 Changes from 31 Dec 2021 to 1 Mar 2022 Ordinary shares or equivalents at 1 Mar 2022 Appointment date Value of current shareholdinga Multiple of salary achieved Bernard Looney 331,711 544,919 228,791 773,710 5 Feb 2020 £2,762,145 2.07x Murray Auchincloss 139,525 286,870 104,537 391,407 1 Jul 2020 £1,397,323 1.86x a Based on ordinary share price at 1 March 2022 of £3.57. The executive directors have additional interests in restricted and performance shares. These interests are shown in aggregate, and by plan, in the tables below. For performance shares, the figures reflect maximum possible vesting levels (excluding the addition of reinvested dividends) even though the actual number of shares that vest will depend on the extent to which performance conditions are satisfied. Aggregated interests, all plans (audited) Director Unvested ordinary shares or equivalents at 1 Jan 2021 Unvested ordinary shares or equivalents as 31 Dec 2021 Changes from 31 Dec 2021 to 1 Mar 2022 Unvested ordinary shares or equivalents at 1 Mar 2022 Bernard Looney 3,193,599 4,882,082 -293,650 4,588,432 Murray Auchincloss 1,581,899 2,447,213 -81,662 2,365,551 Performance shares (audited) Performance period Date of award of performance shares Share element interests Interests vested in 2022 Potential maximum performance sharesa Number of ordinary shares vested Vesting date Face value of awardb, £ At 1 Jan 2021 Awarded 2021 At 31 Dec 2021 Bernard Looney 2019-21c 25 Mar 2019 335,920 – 335,920 122,120 16 Feb 2022 – 2020-22d 11 Aug 2020 2,076,677 – 2,076,677 – – 6,396,165 2021-23d 1 Jun 2021 – 2,218,853 2,218,853 – – 6,989,387 Murray Auchincloss 2019-21ce 25 Mar 2019 156,468 – 156,468 57,066 16 Feb 2022 – 2020-22d 11 Aug 2020 999,201 – 999,201 – – 3,077,539 2021-23d 1 Jun 2021 – 1,122,009 1,122,009 – – 3,534,328 a For awards under the 2019-21 plans, performance conditions are measured 50% on TSR relative to Chevron, ExxonMobil, Shell and Total (comparator companies) over three years, 20% on ROACE averaged over the full performance period, and 30% on strategic progress assessed over the performance period. For awards under the 2020-22 plans performance conditions are measured 40% on TSR relative to an expanded peer group composed of the comparator companies and ENI, Equinor and Repsol (expanded comparator companies) over three years, 30% on ROACE averaged over the full performance period, and 30% on strategic progress assessed over the performance period. For awards under the 2021-23 plans performance conditions are measured 20% on TSR relative to the expanded comparator companies over three years, 20% on ROACE averaged over the performance period, 20% on adjusted EBIDA CAGR per share measured versus year ending June 2020, and 40% on strategic progress assessed over the performance period. See pages 139 and 140 for detail. Each performance period ends on 31 December of the third year. b Face values have been calculated using market prices of ordinary shares at closing on the dates of the award, as follows; £3.08 on 11 August 2020 and £3.15 on 1 June 2021. c Awards granted under the GSVP prior to appointment as executive directors (disclosed share interests reflect maximum vesting, though under this plan awards are granted at 50% of maximum). Represents vesting of shares at the end of the performance period based on performance achieved under the rules of the plan and includes reinvested dividends on the shares vested. Bernard Looney’s 2019-21 award vested on 16 February, when the market price was £4.04 for each share, and Murray Auchincloss’s award vested on 16 February when the market price for each ADS was $32.48. The amounts reported as 2021 income on the single figure table are therefore £493k for Bernard Looney and $309k/£225k for Murray Auchincloss. d Minimum vesting under these awards (below threshold performance) is 0%. At threshold performance of each measure, vesting would be 10% of maximum for 2020-22 and 5% of maximum for 2021-23. e This award was made in the form of ADSs. The above numbers reflect calculated equivalents in ordinary shares. One ADS is equivalent to six ordinary shares.

130 bp Annual Report and Form 20-F 2021 Directors’ remuneration report continued Restricted shares (audited) Restricted period Date of award of restricted shares Share element interests Face value of awarda, £ Number of restricted shares At 1 Jan 2021 Awarded 2021 At 31 Dec 2021 Bernard Looney 2018-21b 20 Mar 2018 104,577 – 104,577 485,237 2019-21c 25 Mar 2019 146,055 – 146,055 800,381 Murray Auchincloss 2018-22b 20 Mar 2018 43,170 – 43,170 200,309 2019-21d 25 Mar 2019 2,835 – 2,835 15,536 2019-21c 25 Mar 2019 86,928 – 86,928 476,365 2020-22d 28 Aug 2020 4,840 – 4,840 12,778 2021-23d 25 Mar 2021 – 21,277 21,277 62,554 2021-23d 16 Jun 2021 – 10,485 10,485 34,496 a Face values have been calculated using market prices of ordinary shares at closing on the dates of award, as follows: £4.64 on 20 March 2018; £5.48 on 25 March 2019; £2.64 on 28 August 2020; £2.94 on 25 March 2021; and £3.29 on 16 June 2021. b Award made under the Restricted Share Plan II prior to appointment as a director. c Awards made under the Individual Share Value Plan prior to appointment as a director. Awards under this plan were granted at 100% of salary. d Interests of person closely associated with Murray Auchincloss. Deferred sharesa (audited) Bonus year Performance period Date of award of deferred shares Deferred share element interests Potential maximum deferred shares Number of ordinary shares Face value of the awardb, £ Bernard Looney 2021 2022-24 16 February 2022 292,902 £1,183,324 Murray Auchincloss 2021 2022-24 16 February 2022 164,569 £664,859 a Since 2010, vesting of the deferred shares has been subject to a safety and environmental sustainability hurdle. If the committee assesses that there has been a material deterioration in safety and environmental performance, or there have been major incidents, either of which reveal underlying weaknesses in safety and environmental management, then it may conclude that shares should vest only in part, or not at all. In reaching its conclusion, the committee obtains advice from the S&SC. There is no identified minimum vesting threshold level. b Face values have been calculated using the market price of ordinary shares on the date of award, as follows; £4.04 on 16 February 2022.

131 Corporate governance bp Annual Report and Form 20-F 2021 Share interests in share option plans (audited) In common with many of our UK employees, Bernard Looney holds options under the bp group Save As You Earn (SAYE) scheme as shown below. These options are not subject to performance conditions. Director Option type At 1 Jan 2021 Granted Exercised At 31 Dec 2021a Option price Market price at date of exercise Date from which first exercisable Expiry date Bernard Looney SAYE 6,024 – – 6,024 £2.49 – 01 Sep 2025 28 Feb 2026 Bernard Looney SAYE – 5,952 – 5,952 £2.52 – 01 Sep 2026 28 Feb 2027 Murray Auchincloss SAYEb 3,614 – – 3,614 £2.49 – 01 Sep 2023 28 Feb 2024 Murray Auchincloss SAYEb – 3,571 – 3,571 £2.52 – 01 Sep 2024 28 Feb 2025 Murray Auchincloss Reinvent bpc – 150,000 – 150,000 £3.15 – 11 Mar 2025 10 Mar 2031 a The closing market price of an ordinary share on 31 December 2021 was £3.31. During 2021 the highest market price was £3.66, and the lowest market price was £2.50. b Interest of person closely associated with Murray Auchincloss. c The Reinvent bp Plan – these options were granted to a person closely associated with Murray Auchincloss and are not subject to performance conditions. Bernard and Murray have no interests in bp preference shares, debentures or option plans (other than as listed above), and neither have interests in shares or loan stock of any subsidiary company. Directors and leadership team No directors or other leadership team members own more than 1% of the ordinary shares in issue. At 1 March 2022, bp’s directors and leadership team members collectively held interests of: 4,147,295 ordinary shares or their calculated equivalents; 7,192,952 restricted share units (with or without conditions) or their calculated equivalents; 6,874,211 performance shares or their calculated equivalents; and 5,953,999 options over ordinary shares or their calculated equivalents, under bp share option schemes. Post-employment share ownership interests Bob Dudley and Brian Gilvary have, and continued to retain, significant interests in bp post employment. They gave their personal commitment as executive directors to maintain actual holdings equivalent to two and a half times salary for two years post employment. That commitment is guaranteed by the fact that their anticipated interests in share awards under group plans which remain subject to vesting and/or holding periods at the time they left bp exceeded the two and a half times salary threshold. Although we instituted a formal post-employment share ownership requirement as part of our 2020 policy, given the foregoing, we have not modified the requirements for these former executives.
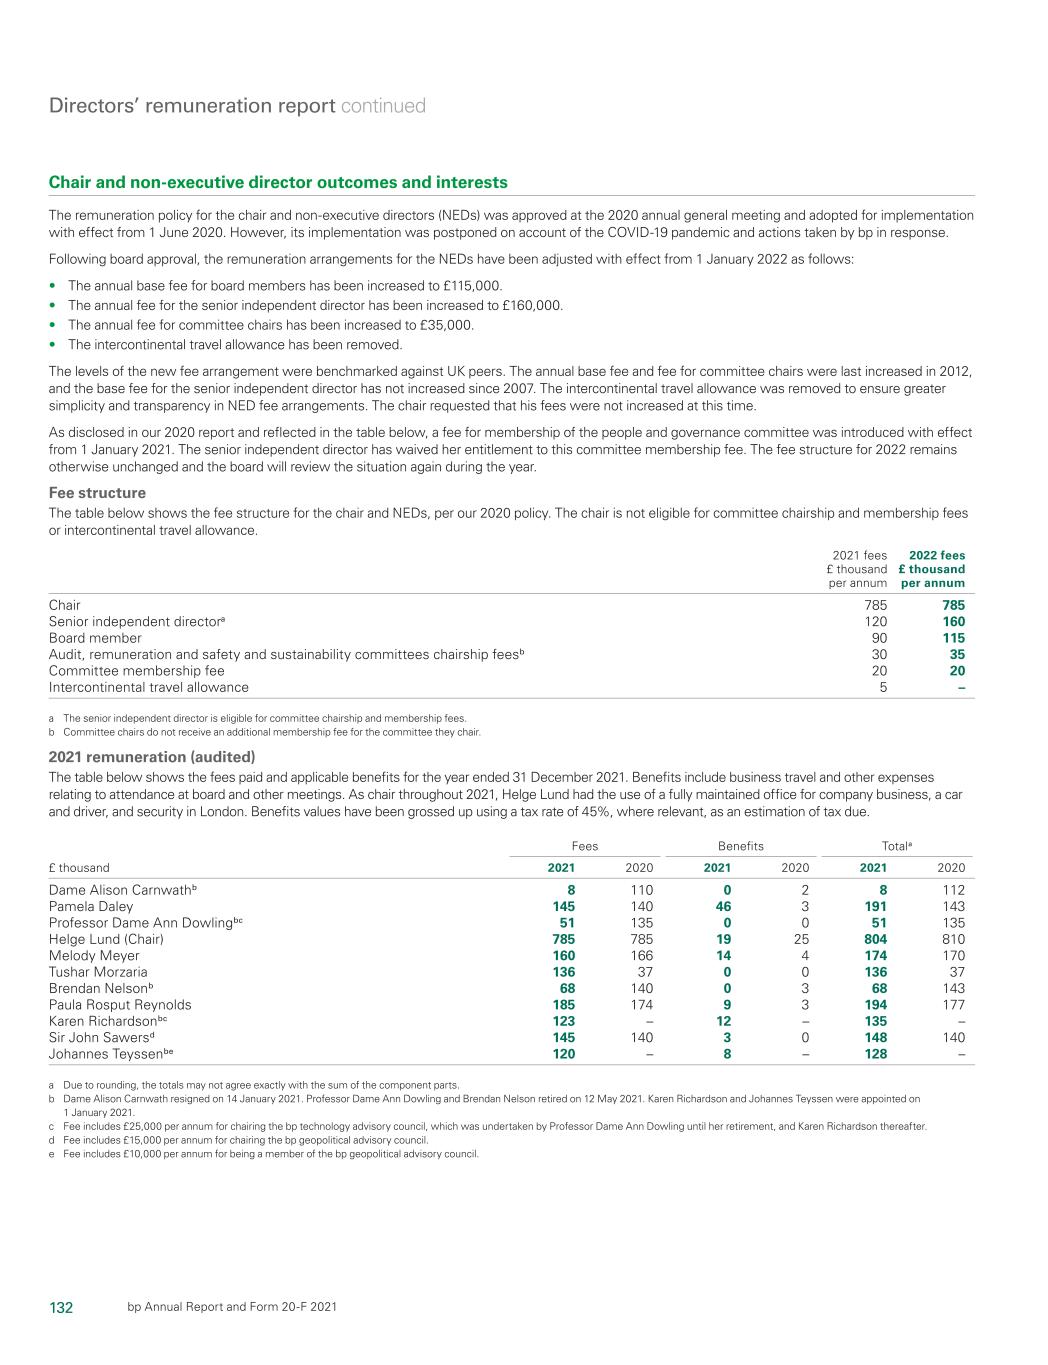
132 bp Annual Report and Form 20-F 2021 Chair and non-executive director outcomes and interests The remuneration policy for the chair and non-executive directors (NEDs) was approved at the 2020 annual general meeting and adopted for implementation with effect from 1 June 2020. However, its implementation was postponed on account of the COVID-19 pandemic and actions taken by bp in response. Following board approval, the remuneration arrangements for the NEDs have been adjusted with effect from 1 January 2022 as follows: • The annual base fee for board members has been increased to £115,000. • The annual fee for the senior independent director has been increased to £160,000. • The annual fee for committee chairs has been increased to £35,000. • The intercontinental travel allowance has been removed. The levels of the new fee arrangement were benchmarked against UK peers. The annual base fee and fee for committee chairs were last increased in 2012, and the base fee for the senior independent director has not increased since 2007. The intercontinental travel allowance was removed to ensure greater simplicity and transparency in NED fee arrangements. The chair requested that his fees were not increased at this time. As disclosed in our 2020 report and reflected in the table below, a fee for membership of the people and governance committee was introduced with effect from 1 January 2021. The senior independent director has waived her entitlement to this committee membership fee. The fee structure for 2022 remains otherwise unchanged and the board will review the situation again during the year. Fee structure The table below shows the fee structure for the chair and NEDs, per our 2020 policy. The chair is not eligible for committee chairship and membership fees or intercontinental travel allowance. 2021 fees £ thousand per annum 2022 fees £ thousand per annum Chair 785 785 Senior independent directora 120 160 Board member 90 115 Audit, remuneration and safety and sustainability committees chairship feesb 30 35 Committee membership fee 20 20 Intercontinental travel allowance 5 – a The senior independent director is eligible for committee chairship and membership fees. b Committee chairs do not receive an additional membership fee for the committee they chair. 2021 remuneration (audited) The table below shows the fees paid and applicable benefits for the year ended 31 December 2021. Benefits include business travel and other expenses relating to attendance at board and other meetings. As chair throughout 2021, Helge Lund had the use of a fully maintained office for company business, a car and driver, and security in London. Benefits values have been grossed up using a tax rate of 45%, where relevant, as an estimation of tax due. Fees Benefits Totala £ thousand 2021 2020 2021 2020 2021 2020 Dame Alison Carnwathb 8 110 0 2 8 112 Pamela Daley 145 140 46 3 191 143 Professor Dame Ann Dowlingbc 51 135 0 0 51 135 Helge Lund (Chair) 785 785 19 25 804 810 Melody Meyer 160 166 14 4 174 170 Tushar Morzaria 136 37 0 0 136 37 Brendan Nelsonb 68 140 0 3 68 143 Paula Rosput Reynolds 185 174 9 3 194 177 Karen Richardsonbc 123 – 12 – 135 – Sir John Sawersd 145 140 3 0 148 140 Johannes Teyssenbe 120 – 8 – 128 – a Due to rounding, the totals may not agree exactly with the sum of the component parts. b Dame Alison Carnwath resigned on 14 January 2021. Professor Dame Ann Dowling and Brendan Nelson retired on 12 May 2021. Karen Richardson and Johannes Teyssen were appointed on 1 January 2021. c Fee includes £25,000 per annum for chairing the bp technology advisory council, which was undertaken by Professor Dame Ann Dowling until her retirement, and Karen Richardson thereafter. d Fee includes £15,000 per annum for chairing the bp geopolitical advisory council. e Fee includes £10,000 per annum for being a member of the bp geopolitical advisory council. Directors’ remuneration report continued

133 Corporate governance bp Annual Report and Form 20-F 2021 Chair and non-executive directors’ interests (audited) The figures below include all the beneficial and non-beneficial interests of the chair and each non-executive director of the company in shares of bp (or calculated equivalents) that have been disclosed according to the disclosure guidance and transparency rules in the Financial Conduct Authority handbook (the DTRs) as at the applicable dates. Please see page 141 for more details on the non-executive director shareholding guidelines. Ordinary shares or equivalents at 1 Jan 2021 Ordinary shares or equivalents at 31 Dec 2021 Changes from 31 Dec 2021 to 1 Mar 2022 Ordinary shares or equivalents at 1 Mar 2022 Value of current shareholdinga % of guideline achieved Dame Alison Carnwathb 17,700 – – – – – Pamela Daley 40,332 40,332 0 40,332 $191,510 116% Professor Dame Ann Dowlingb 22,320 – – – – – Helge Lund (Chair) 600,000 600,000 0 600,000 £2,142,000 273% Melody Meyer 20,646 20,646 0 20,646 $98,034 59% Tushar Morzaria 36,726 51,972 0 51,972 £185,540 155% Brendan Nelsonb 21,626 – – – – – Paula Rosput Reynolds 73,200 73,200 0 73,200 $347,578 211% Karen Richardsonb – 10,746 0 10,746 $51,026 31% Sir John Sawers 23,116 24,242 0 24,242 £86,544 72% Johannes Teyssenb – 35,000 0 35,000 £124,950 104% a Based on share and ADS prices at 1 March 2022 of £3.57 and $28.49. Where a US$ value is provided these shares are held as ADSs. b Dame Alison Carnwath resigned on 14 January 2021. Professor Dame Ann Dowling and Brendan Nelson retired on 12 May 2021. Karen Richardson and Johannes Teyssen were appointed on 1 January 2021. Past directors Payments for loss of office (audited) No payments were made during the financial year for loss of office. Payments to past directors (audited) Since leaving employment, Bob Dudley and Brian Gilvary have received shares upon vesting of awards as detailed in the two tables below. These relate to performance share awards made under the Executive Director Incentive Plan, and to the deferred share elements of prior year annual bonuses. Performance shares Bob and Brian are both regarded as ‘good leavers’ under the terms of the performance share plan, and therefore received shares upon vesting of the 2019-21 performance share plan, as detailed on pages 123-125. Their share vesting has been pro-rated to reflect their periods of actual service, relative to the three-year cycle. Outcomes are as follows: Performance period Date of award of performance shares Shares originally granted Vesting date Value of shares vested (including dividends) Bob Dudleya 2019-21 19 Feb 2019 1,340,766 16 Feb 2022 $1,102,826 Brian Gilvary 2019-21 19 Feb 2019 654,315 16 Feb 2022 £480,493 a These awards were received in the form of ADSs. The above numbers reflect calculated equivalents in ordinary shares. One ADS is equivalent to six ordinary shares. b In addition to the detail above, Bob Dudley’s and Brian Gilvary’s 2018-20 performance share awards vested on 19 February 2021 as disclosed in our 2020 report. Subsequent to that report, on 31 March 2021 Bob and Brian received additional dividend equivalents (the Q4 2020 dividend) on those 2018-20 awards valued at $20,819 and £8,349 respectively. Deferred shares from prior year bonuses As previously reported, Bob Dudley requested that the final assessment and vesting determination of various share awards related to annual bonus outcomes from 2014 to 2019, be deferred until at least one year post retirement. Similarly, Brian Gilvary made the same request of his 2016 matching share award, and that his 2015 matching share award be deferred for an additional two years. Thus the committee extended the original safety and environmental sustainability performance conditions for these awards in line with the extended deferral. Of these voluntary deferrals, awards under the 2014 policy were not reportable in the single figures of total remuneration for the performance years in question (relating to bonus years 2014, 2015 and 2016), but fall instead to be disclosed on vesting.

134 bp Annual Report and Form 20-F 2021 As reported in our 2020 report, the committee concluded, with input from the safety and sustainability committee, that safety performance continued to show improvement with safety embedded in the culture of the organization. As a result, the original safety and environmental sustainability conditions were considered to have been met and these awards vested in 2021, one year after retirement. These vesting outcomes are as follows: Bonus year Type Performance period Date of award of deferred shares Shares originally granted Vesting date Value of shares vested (including dividends) Bob Dudleya 2014 Compulsory 2015-17 11 Feb 2015 147,054 31 Mar 21 $908,742 2014 Voluntary 2015-17 11 Feb 2015 147,054 31 Mar 21 $908,742 2014 Matching 2015-17 11 Feb 2015 294,108 31 Mar 21 $1,590,299 2015 Compulsory 2016-18 4 Mar 2016 275,892 31 Mar 21 $1,592,320 2015 Voluntary 2016-18 4 Mar 2016 275,892 31 Mar 21 $1,592,320 2015 Matching 2016-18 4 Mar 2016 551,784 31 Mar 21 $2,706,990 2016 Compulsory 2017-19 19 May 2017 147,642 31 Mar 21 $779,541 2016 Matching 2017-19 19 May 2017 147,642 31 Mar 21 $633,372 Brian Gilvaryb 2016 Matching 2017-19 19 May 2017 73,070 30 Jun 21 £264,493 a These awards were received in the form of ADSs. The above numbers reflect calculated equivalents in ordinary shares. One ADS is equivalent to six ordinary shares. b In addition to the detail above, Brian Gilvary’s 2015 matching and 2017 compulsory deferred bonus share awards vested on 19 February 2021 as disclosed in our 2020 report. Subsequent to that report, on 31 March 2021 Brian received additional dividend equivalents (the Q4 2020 dividend) on those 2015 and 2017 awards valued at £14,844 and £5,667 respectively. The committee is grateful to Bob and Brian for the act of leadership that these voluntary deferrals signified, and in particular for their commitment to the long-term interests of the company. This has meant that beyond the original vesting date, and even beyond their tenure as executive directors, the size and value of the vestings were not guaranteed. Post-employment benefits Bob Dudley was provided with a car benefit in the UK amounting to $20,581, and coverage with tax return preparation amounting to $7,189. Brian Gilvary was provided coverage with tax return preparation amounting to £26,727. We made no other payments within the scope of the disclosure requirements to any past director of bp during 2021 (we have no de minimis threshold for such disclosures). Directors’ remuneration report continued

135 Corporate governance bp Annual Report and Form 20-F 2021 Other disclosures Historical TSR performance 2020 2021201920182017201620152014201320122011 £0 £50 £100 £150 £200 £250 BP FTSE 100 This graph shows the growth in value of hypothetical £100 investments in bp p.l.c. ordinary shares, and in the FTSE 100 Index (of which bp is a constituent), over 10 years from 31 December 2011 to 31 December 2021. Independence and advice The board considers all committee members to be independent with no personal financial interest, other than as shareholders, in the committee’s decisions. Further detail on the activities of the committee, advice received, and shareholder engagement is set out in the remuneration committee report on page 116. During 2021 Ben Mathews, who was employed by the company and reported to the chair of the board, acted as secretary to the remuneration committee. The committee also received advice on various matters relating to the remuneration of executive directors and senior management from Kerry Dryburgh, EVP people and culture and Ashok Pillai, SVP reward and wellbeing. PricewaterhouseCoopers LLP (PwC) continued to provide independent advice to the committee in 2021, following its appointment as independent advisor to the committee in September 2017 following a competitive tender process. PwC advice included, for example, support with remuneration benchmarking and updates on market practice. PwC is a member of the Remuneration Consulting Group and, as such, operates under the code of conduct in relation to executive remuneration consulting in the UK. The committee is satisfied that the advice received is objective and independent. The committee is comfortable that the PwC engagement partner and team who provides remuneration advice to the committee do not have connections with the company or its directors that may impair their independence. Total fees or other charges (based on an hourly rate) for the provision of remuneration advice to the committee in 2021 (save in respect of legal advice) were £80,121 to PwC. Freshfields Bruckhaus Deringer LLP (Freshfields) provided legal advice on specific compliance matters to the committee. PwC and Freshfields provide other advice in their respective areas to the group. Considerations related to the Corporate Governance Code When setting the 2020 policy, the committee concluded that the scorecard based approach to setting targets and measuring outcomes provides great clarity in our ability to engage transparently with shareholders and the wider workforce on remuneration. Thus, bp continues to operate a simple structure of market-aligned salary with annual and three-year performance-based incentives. Risks are managed through careful setting of performance measures and targets and broad flexibility to apply committee discretion in assessing outcomes. These are complemented with robust malus and clawback measures. Remuneration outcomes are predictable, as shown in the scenario charts of the 2020 policy, and proportional by virtue of the challenging performance levels required to achieve target pay outcomes. Through material weighting in measures related to safety, sustainability and strategy, as shown on page 119, remuneration aligns closely with bp’s culture, as expressed through our purpose and ambition. Relative importance of spend on pay ($ million) 20212020 4,304 Distributions to shareholders 20212020 8,857 Remuneration paid to all employees 20212020 11,779a 6,340 9,878 12,034 Capital investment a Organic capital expenditure

136 bp Annual Report and Form 20-F 2021 Shareholder engagement Throughout 2021 we continued to discuss remuneration policy and approach with many of our largest shareholders, as well as their representative bodies. We plan to continue this dialogue in 2022, as we consider issues and make decisions related to the design of our remuneration policy for 2023 and beyond. The table below shows the votes on the report for the last three years. Annual general meeting directors’ remuneration report vote results Year % vote ‘for’ % vote ‘against’ Votes withheld 2021 95.20% 4.80% 220,577,221 2020 96.05% 3.95% 67,623,825 2019 95.93% 4.07% 337,586,814 The remuneration policy was approved by shareholders at the 2020 annual general meeting in May 2020. The votes on the policy are shown below. 2020 annual general meeting directors’ remuneration policy vote results Year % vote ‘for’ % vote ‘against’ Votes withheld 2020 96.58% 3.42% 65,652,222 Service contracts and letters of appointment The service contracts of executive directors do not have a fixed term. Service agreements for each executive director are available for inspection at the company’s registered office. Each executive director’s service contract contains a 12-month notice period. Consistent with the best interests of the group, the committee will seek to minimize termination payments. Date of contract Effective date Bernard Looney 4 October 2019 5 February 2020 Murray Auchincloss 20 January 2020 1 July 2020 The non-executive directors (NEDs) have letters of appointment, which are available to view at the company’s registered office. Each NED is expected to serve on the board until the end of the annual general meeting following the third anniversary of their appointment. This is subject to election and subsequent annual re-election. Subject to mutual agreement, they are each expected to serve a further three years, and normally up to nine years from appointment in line with the provisions of the 2018 Code, subject to annual re-election. External appointments The board supports executive directors taking up appointments outside the company to broaden their knowledge and experience. Each executive director is permitted to retain any fee from their external appointments. Such external appointments are subject to agreement by the chair and reported to the board. Any external appointment must not conflict with a director’s duties and commitments to bp. Details of appointments as non-executive directors of publicly listed companies during 2021 are shown below. Director Appointee company Additional position held at appointee company Total fees Bernard Looney Rosneftab Director 0 Murray Auchincloss Aker BP ASAa Director 0 a Held as a result of the company’s shareholdings in Rosneft and Aker BP ASA. b As of 27 February 2022, Bernard stepped down from his role as non-executive director of Rosneft. Directors’ remuneration report continued

137 Corporate governance bp Annual Report and Form 20-F 2021 Policy implementation for 2022 The table below shows how the remuneration policy approved by shareholders at the 2020 annual general meeting will be implemented in 2022, alongside a summary of key features. For the full remuneration policy, please go to bp.com/remuneration. Salary and benefits To provide fixed remuneration to reflect the scale and complexity of both the business and the role, and to be competitive with the external market. When setting salaries, the committee considers practice in other oil and gas majors as well as European and US companies of a similar size, geographic spread and business dynamic to bp. Percentage increases for executive directors will not exceed increases for the wider workforce, other than in specific circumstances identified by the committee (e.g. in response to a substantial change in responsibilities). • Bernard Looney’s salary will increase by 4.25% to £1,392,519 following the 2022 annual general meeting. • This compares to the 4.25% budget for the majority of the wider workforce in the UK effective from 1 April, bp’s annual salary review date. • Murray Auchincloss’s salary will increase by 6.6% to £800,000 following the 2022 annual general meeting. • Benefits will remain unchanged for 2022 and include car-related provisions (or cash in lieu), security assistance, insurance and medical cover. Retirement benefits Executive directors normally participate in the company retirement plans that operate in their home country. New appointees from within the bp group retain previously accrued benefits. For their service as a director, retirement benefits will be no more than the median provision offered to the wider workforce in the UK. For future appointments, the committee will carefully review any retirement benefits to be granted to a new director, taking account of retirement policies across the wider group and any arrangements currently in place. • Bernard and Murray are deferred members of final salary pension plans related to their service prior to appointment as executive directors, but now receive a cash allowance in lieu of retirement benefits. • Bernard’s cash allowance will be unchanged at 15% of salary, and he accrues no further value under his UK deferred pension. • Murray’s cash allowance will be unchanged at 15% of salary, and he accrues no further value under his US deferred pension. Annual bonus Bonus is measured against an annual scorecard. The committee has discretion to choose the specific measures and the relative weightings adopted in the annual scorecard, to reflect the annual plan as agreed with the board. Numeric scales are set for each measure, to score outcomes relative to targets. A scorecard outcome of 1.0 reflects the target outcome, and half of the maximum outcome. Target bonus is 112.5% of salary, and maximum bonus is 225% of salary. Half of the bonus for each year is paid in cash, and half is delivered as a deferred share award vesting in three years. • For our 2022 bonus, our scorecard will remain unchanged relative to 2021, with three measures; safety and sustainability (30%), operational (20%), and financial (50%). Please see annual bonus measures on page 139 for more detail. • Awards are subject to robust malus and clawback provisions as described below.

138 bp Annual Report and Form 20-F 2021 Performance shares Performance shares are granted with a three-year performance period, measured against a scorecard. The committee holds discretion to choose the specific measures and the relative weightings adopted in the scorecard, to ensure they are focused on the near-term priorities for delivering the bp strategy in the interests of shareholders. Annual grants are 500% of salary for the CEO, and 450% of salary for any other executive director. Awards will vest in proportion to the outcomes measured through the performance scorecard, subject to any adjustment by the committee. • For our 2022-24 cycle, the measures and weighting remain unchanged from the 2021-23 cycle at 20% for rTSR, 20% for ROACE, 20% for adjusted EBIDA CAGR, and 40% for strategic progress. Please see performance share plan measures on page 139 for more detail. • The 2022-24 awards will be granted based on the average closing share price of each trading day in the 90-day period ending on the date of bp’s 2022 annual general meeting. • Awards are subject to robust malus and clawback provisions as described below. Shareholding requirement Group chief executive to build a shareholding of at least five times salary, and other executive directors four and a half times salary, within five years of appointment. Executive directors are required to maintain that level for at least two years post employment. • Bernard and Murray have not yet reached five years since appointment, and are therefore building their share interests towards the level required by policy. Malus and clawback Malus provisions may apply where there is: a material safety or environmental failure; an incorrect award outcome due to miscalculation or incorrect information; a restatement due to financial reporting failure or misstatement of audited results; material misconduct; or other exceptional circumstances that the committee consider similar in nature. Clawback provisions may apply where there is: an incorrect outcome due to miscalculation or incorrect information; a restatement due to financial reporting failure or misstatement of audited results; or material misconduct. Committee flexibility The committee holds discretion to adjust performance measures and weightings, and to revise the peer group for the rTSR measure. This discretion allows appropriate re-alignment, throughout the policy term, for changes in the annual plan and for the anticipated evolution of the low carbon business environment. The committee also holds discretion in determining the outcomes for annual bonus and performance shares, allowing them to take broad views on alignment with shareholder experience and environmental, societal and other relevant considerations. • The committee has agreed to an ongoing review of the outcomes of the 2020-22 and 2021-23 performance shares to ensure appropriateness, given the market turmoil in share price at the time the awards were granted. • On 27 February 2022, bp announced its decision to exit its shareholding in Rosneft. The board believes that this decision is in the best long-term interests of all our shareholders. The changes to bp’s financial reporting and finances will be determined in the first quarter of 2022 which may, in turn, affect some of the performance measures and targets that drive incentive pay outcomes for the entire organization. Therefore, at the end of 2022, the committee will carefully consider the impact of this decision, taken under extraordinary circumstances by the board itself, and we expect to make adjustments, where appropriate, to bring this into account. Directors’ remuneration report continued

139 Corporate governance bp Annual Report and Form 20-F 2021 – Underpin will take into account safety outcomes prior to determining final vesting percentage. – RemCo discretion will reflect shareholder experience, environment, societal and other inputs (including bringing into account potential impacts arising from bp’s announced intention to exit its shareholding in Rosneft). – Robust malus and clawback may apply in certain circumstances. Safety and sustainability 30% Measures include Weighting Tier 1 and 2 process safety events 15% Sustainable emissions reductions 15% Relative total shareholder return (rTSR) vs eight peers 20% Peer group of eight companies: Chevron, Eni, Equinor, ExxonMobil, Repsol, Shell, TotalEnergies (and bp) Operations 20% Measures include Weighting bp-operated reliability and availability 10% Margin share from convenience and electrification 10% Financials 20% ROACE (average 2022-24) Financials 50% Measures include Weighting Free cash flow (%bn) 25% Cumulative cash cost reductions (2022 vs 2019) ($bn) 25% Growth 20% Adjusted EBIDA per share CAGR Strategic progress 40% Weighting of measures subject to remuneration committee judgement: • Deliver value through a resilient hydrocarbon business (13.3%). • Accelerate growth in customers and products (13.3%). • Demonstrate track record, scale and value in low carbon energy (13.3%). See page 120 for key performance indicators related to the strategic progress measures. The tables below illustrate the performance measures and weightings for the 2022 annual bonus and 2022-24 performance shares. The targets for the 2022 annual bonus are commercially sensitive and will be disclosed in the 2022 report. Having reflected on the counsel received from shareholders, disclosure for the long-term incentive targets have been improved. Performance measures for incentive plans commencing in 2022 Measures for 2022 annual bonus Measures for 2022-24 performance shares Peer ranking 8 7 6 5 4 3 2 1 0% 25% 50% 75% 100% rTSR ranking Ve st in g % fo r e ac h el em en t Below 13.1% 13.35% 13.60% 13.85% Above 14.1% 0% 25% 50% 75% 100% ROACE Ve st in g % fo r e ac h el em en t Adjusted EBIDA per share CAGR Below 7.7% 8.20% 8.70% 9.20% Above 9.7% 0% 25% 50% 75% 100% Ve st in g % fo r e ac h el em en t

140 bp Annual Report and Form 20-F 2021 Relative total shareholder return (rTSR) vs eight peers 20% Peer group of eight companies: Chevron, Eni, Equinor, ExxonMobil, Repsol, Shell, TotalEnergies (and bp) Relative total shareholder return (rTSR) vs eight peers 40% Peer group of eight companies: Shell, TotalEnergies, ExxonMobil, Chevron, Eni, Equinor, Repsol (and bp) Financials 20% ROACE (average 2021-23) Returns 30% ROACE (average 2020-22) Growth 20% Adjusted EBIDA per share CAGR Strategic progress 30% Weighting of measures subject to remuneration committee judgement: • Deliver value through a resilient hydrocarbon business (10%). • Accelerate growth in customers and products (10%). • Demonstrate track record, scale and value in low carbon energy (10%). See page 120 for key performance indicators related to the strategic progress measures. Strategic progress 40% Weighting of measures subject to remuneration committee judgement: • Deliver value through a resilient hydrocarbon business (13.3%). • Accelerate growth in customers and products (13.3%). • Demonstrate track record, scale and value in low carbon energy (13.3%). See page 120 for key performance indicators related to the strategic progress measures. Measures for 2021-23 performance shares Measures for 2020-22 performance shares – Underpin will take into account safety outcomes prior to determining final vesting percentage. – Remuneration committee discretion will reflect shareholder experience, environment, societal and other inputs (including bringing into account potential impacts arising from bp’s announced intention to exit its shareholding in Rosneft). – Robust malus and clawback may apply in certain circumstances. – Underpin will take into account safety outcomes prior to determining final vesting percentage. – RemCo discretion will reflect shareholder experience, environment, societal and other inputs (including bringing into account potential impacts arising from bp’s announced intention to exit its shareholding in Rosneft). – Robust malus and clawback may apply in certain circumstances. Performance measures for long term incentive plans 2021-23 and 2020-22 Having reflected on the counsel received from shareholders, our disclosure for the long-term incentive targets have been improved. In the interest of completeness, we have also included below the long-term incentive targets for the 2021-23 performance shares and 2020-22 performance shares. Peer ranking Peer ranking 8 7 6 5 4 3 2 1 0% 25% 50% 75% 100% rTSR ranking Ve st in g % fo r e ac h el em en t 0% 25% 50% 75% 100% 8 7 6 5 4 3 2 1 rTSR ranking Ve st in g % fo r e ac h el em en t Below 9.50% 9.75% 10.00% 10.25% Above 10.5% 0% 25% 50% 75% 100% ROACE Ve st in g % fo r e ac h el em en t Below 9.00% 10.00% 11.00% 12.00% Above 13.00% 0% 25% 50% 75% 100% ROACE Ve st in g % fo r e ac h el em en t Adjusted EBIDA per share CAGR Below 4.5% 5.00% 5.50% 6.00% Above 6.5% 0% 25% 50% 75% 100% Ve st in g % fo r e ac h el em en t Directors’ remuneration report continued

141 Corporate governance bp Annual Report and Form 20-F 2021 Policy table – non-executive directors Non-executive chair Fees Approach Remuneration is in the form of cash fees, payable monthly. The level and structure of the chair’s remuneration will primarily be compared against UK best practice. Operation and opportunity The quantum and structure of the non-executive chair’s remuneration is reviewed annually by the remuneration committee, which makes a recommendation to the board. Benefits and expenses Approach The chair is provided with support and reasonable travelling expenses. Operation and opportunity The chair is provided with an office and full-time secretarial and administrative support in London and a contribution to an office and secretarial support in his home country as appropriate. A car and the use of a driver is provided in London, together with security assistance. All reasonable travelling and other expenses (including any relevant tax) incurred in carrying out his duties are reimbursed. Non-executive directors Fees Approach Remuneration is in the form of cash fees, payable monthly. Remuneration practice is consistent with recognized best practice standards for non-executive directors’ remuneration and, as a UK-listed company, the level and structure of non-executive directors’ remuneration will primarily be compared against UK best practice. Additional fees may be payable to reflect additional board responsibilities, for example committee chairship and membership and for the role of senior independent director. Operation and opportunity The level and structure of non-executive directors’ remuneration is reviewed by the chair, the CEO and the company secretary who make a recommendation to the board. Non-executive directors do not vote on their own remuneration. Remuneration for non-executive directors is reviewed annually. Intercontinental allowancea Approach Non-executive directors may receive an allowance to reflect the global nature of the company’s business. The intercontinental travel allowance may be payable for the purpose of attending board or committee meetings or site visits. Operation and opportunity The allowance is paid in cash following each event of intercontinental travel. Benefits and expenses Approach Non-executive directors are provided with administrative support and reasonable travelling expenses. Professional fees are reimbursed in the form of cash, payable following the provision of advice and assistance. Operation and opportunity Non-executive directors are reimbursed for all reasonable travelling and subsistence expenses (including any relevant tax) incurred in carrying out their duties. Non-executive directors based outside the UK are entitled to the reimbursement of professional fees incurred in connection with advice and assistance on UK tax compliance matters. Shareholding guidelines Approach Non-executive directors are encouraged to establish a holding in bp shares of the equivalent value of one year’s base fee. a Removed with effect from 1 January 2022. This directors’ remuneration report was approved by the board and signed on its behalf by Ben J. S. Mathews, company secretary, on 18 March 2022.

142 bp Annual Report and Form 20-F 2021 Pages 142-143 have been removed as they do not form part of bp’s Annual Report on Form 20-F as filed with the SEC.
143 Corporate governance bp Annual Report and Form 20-F 2021 Pages 142-143 have been removed as they do not form part of bp’s Annual Report on Form 20-F as filed with the SEC.
144 bp Annual Report and Form 20-F 2021 This page intentionally left blank.
| | | | | | | | | | | | | | | | | | | | | | | | | | | | | | | | | | | | | | |
| | | | | | | | |
| | | | | | | |
| Consolidated financial statements of the bp group |
| | | | | | | |
Independent auditor's reports (PCAOB ID 1147) | | | Group statement of changes in equity | |
| Group income statement | | | Group balance sheet | |
| Group statement of comprehensive income | | | Group cash flow statement | |
| | | | | | | |
| | | | | | | |
| | | | | | | |
| Notes on financial statements |
| 1. | Significant accounting policies | | | 21. | Trade and other payables | |
| 2. | Non-current assets held for sale | | | 22. | Provisions | |
| 3. | Disposals and impairment | | | 23. | Pensions and other post-retirement benefits | |
| 4. | Segmental analysis | | |
| 5. | Sales and other operating revenues | | | 24. | Cash and cash equivalents | |
| 6. | Income statement analysis | | | 25. | Finance debt | |
| 7. | Exploration for and evaluation of oil and natural gas resources | | | 26. | Capital disclosures and net debt | |
| 27. | Leases | |
| 8. | Taxation | | | 28. | Financial instruments and financial risk factors | |
| 9. | Dividends | | |
| 10. | Earnings per share | | | 29. | Derivative financial instruments | |
| 11. | Property, plant and equipment | | | 30. | Called-up share capital | |
| 12. | Capital commitments | | | 31. | Capital and reserves | |
| 13. | Goodwill | | | 32. | Contingent liabilities and legal proceedings | |
| 14. | Intangible assets | | | 33. | Remuneration of senior management and non-executive directors | |
| 15. | Investments in joint ventures | | |
| 16. | Investments in associates | | | 34. | Employee costs and numbers | |
| 17. | Other investments | | | 35. | Auditor's remuneration | |
| 18. | Inventories | | | 36. | Subsidiaries, joint arrangements and associates | |
| 19. | Trade and other receivables | | |
| 20. | Valuation and qualifying accounts | | | 37. | Events after the reporting period | |
| | | | | | | |
| | | | | | | |
| | | | | | | |
| | | | | | | |
| Supplementary information on oil and natural gas (unaudited) |
| | | | | | | |
| Oil and natural gas exploration and production activities | | | Standardized measure of discounted future net cash flows and changes therein relating to proved oil and gas reserves | |
| Movements in estimated net proved reserves | | |
| | | | | Operational and statistical information | |
| | | | | | | |
| | | | | | | |
| | | | | | | |
|
| | | | | | | |
| | | | | |
| | | | | |
| | | | | |
| | | | | |
| | | | | |
| | | | | | |
| | | | | | |
| | | | | | |
| | | | | | |
| | | | | | |
| | | | | | |
| | | | | | | |
| | | | | | | |
| | | | | | | |
| | | | | | | |
| | | | | | | | | | | | |
| | | | | | | | | | | | | | |
| | bp Annual Report and Form 20-F 2021 | | 145 |
Consolidated financial statements of the bp group
Pages 146-165 have been removed as they do not form part of bp's Annual Report on Form 20-F as filed with the SEC.
This page does not form part of bp's Annual Report on Form 20-F as filed with the SEC.
| | | | | | | | | | | | | | |
146 | | bp Annual Report and Form 20-F 2021 | | |
Pages 146-165 have been removed as they do not form part of bp's Annual Report on Form 20-F as filed with the SEC.
This page does not form part of BP's Annual Report on Form 20-F as filed with the SEC.
| | | | | | | | | | | | | | |
| | bp Annual Report and Form 20-F 2021 | | 147 |
Consolidated financial statements of the bp group
Report of Independent Registered Public Accounting Firm
To the shareholders and board of directors of BP p.l.c.
Opinion on the financial statements
We have audited the accompanying consolidated group balance sheets of BP p.l.c. and subsidiaries (together the company) as at 31 December 2021 and 2020, the related consolidated group income statements, group statements of comprehensive income, group statements of changes in equity, and group cash flow statements, for each of the three years in the period ended 31 December 2021, and the related notes (collectively referred to as the 'financial statements'). In our opinion, the financial statements present fairly, in all material respects, the financial position of the company as at 31 December 2021 and 2020, and the results of its operations and its cash flows for each of the three years in the period ended 31 December 2021,in conformity with United Kingdom adopted international accounting standards and International Financial Reporting Standards (IFRSs) as adopted by the European Union and IFRSs as issued by the International Accounting Standards Board.
We have also audited, in accordance with the standards of the Public Company Accounting Oversight Board (United States) (PCAOB), the company's internal control over financial reporting as of 31 December 2021, based on criteria established in the UK Financial Reporting Council’s Guidance on Risk Management, Internal Control and Related Financial and Business Reporting relating to internal control over financial reporting and our report dated 18 March 2022 expressed an unqualified opinion on the group's internal control over financial reporting.
Change in accounting principle
As discussed in Note 1 to the financial statements, the Company has changed its accounting policy related to the presentation of revenues and purchases relating to physically settled derivative contracts.
Basis for opinion
These financial statements are the responsibility of the group's management. Our responsibility is to express an opinion on the group's financial statements based on our audits. We are a public accounting firm registered with the PCAOB and are required to be independent with respect to the group in accordance with the U.S. federal securities laws and the applicable rules and regulations of the Securities and Exchange Commission and the PCAOB.
We conducted our audits in accordance with the standards of the PCAOB. Those standards require that we plan and perform the audit to obtain reasonable assurance about whether the financial statements are free of material misstatement, whether due to error or fraud. Our audits included performing procedures to assess the risks of material misstatement of the financial statements, whether due to error or fraud, and performing procedures that respond to those risks. Such procedures included examining, on a test basis, evidence regarding the amounts and disclosures in the financial statements. Our audits also included evaluating the accounting principles used and significant estimates made by management, as well as evaluating the overall presentation of the financial statements. We believe that our audits provide a reasonable basis for our opinion.
Critical Audit Matters
The critical audit matters communicated below are matters arising from the current-period audit of the financial statements that were communicated or required to be communicated to the audit committee and that (1) relate to accounts or disclosures that are material to the financial statements and (2) involved our especially challenging, subjective, or complex judgments. The communication of critical audit matters does not alter in any way our opinion on the financial statements, taken as a whole, and we are not, by communicating the critical audit matters below, providing separate opinions on the critical audit matters or on the accounts or disclosures to which they relate.
1.Impairment of upstream oil and gas property, plant and equipment (PP&E) assets – Notes 1, 3 and 11 to the financial statements
Critical Audit Matter Description
The group balance sheet at 31 December 2021 includes PP&E of $113 billion, of which $74 billion is oil and gas properties within the OP&O ($47 billion) and G&LCE ($32 billion) segments.
Management’s 'best estimate' of oil and gas price assumptions for value-in-use impairment tests were revised during 2021 as set out in Note 1 on page 178. The upward revisions to Brent oil assumptions up to 2030, and Henry Hub gas assumptions for 2022, compared to the prior year reflect expected near-term supply constraints. Brent oil assumptions post 2030 were revised downwards compared to the prior year, as bp expects an acceleration in the pace of transition to a low carbon economy. Aside from 2022, Henry Hub gas assumptions are unchanged from the prior year.
Given the significance of the price assumption revisions during 2021, alongside certain CGU specific new indicators, management tested most oil and gas CGUs for impairment and/or impairment reversal during the year. Management recorded $4.8 billion of pre-tax oil and gas CGU impairment reversals, in large part due to the oil and gas price upwards revisions detailed above, and $2.4 billion of pre-tax oil and gas CGU impairment charges. Further information has been provided in Note 1 on page 184 and Note 3 on page 198.
We identified three key management estimates in management’s determination of the level of impairment charge and/or reversal to record. These are:
•Oil and gas prices - bp’s oil and gas price assumptions have a significant impact on many CGU impairment assessments performed across the OP&O and G&LCE segments and are inherently uncertain. The estimation of future prices is subject to increased uncertainty given climate change, the global energy transition and COVID-19. There is a risk that management do not forecast reasonable 'best estimate' oil and gas price forecasts when assessing CGUs for impairment and/or reversal, leading to material misstatements. These price assumptions are highly judgmental and are pervasive inputs to bp’s oil and gas CGU valuations, such that any misstatements would also aggregate. There is also a risk that management’s oil and gas price related disclosures are not reasonable.
The group's oil and gas price assumptions for value-in use impairment assessments are aligned with bp’s investment appraisal assumptions, except that potential future emissions costs that could be borne by bp are included in investment appraisals as bp costs without assuming incremental revenue.
As described in Note 1 on page 178, emissions costs forecasts interrelate with bp’s oil and gas prices, because bp’s price assumptions for value-in-use estimates represent ‘net producer prices’, i.e., net of any further emissions costs that may be enacted in the future. There is a risk management’s judgement is not reasonable, that the potential impact of such further emissions costs being borne by producers including bp is not expected to have a material impact on the group’s oil and gas CGU carrying values as costs would effectively be borne by oil and gas end users via overall higher commodity prices.
| | | | | | | | | | | | | | |
166 | | bp Annual Report and Form 20-F 2021 | | |
•Discount rates - Given the long timeframes involved, certain CGU impairment assessments are sensitive to the discount rate applied. Discount rates should reflect the return required by the market and the risks inherent in the cash flows being discounted. There is a risk that management do not assume reasonable discount rates, adjusted as applicable for country risks and relevant tax rates, leading to material misstatements. Determining a reasonable discount rate is highly judgmental and, consistent with price assumptions above, the discount rate assumption is also a pervasive input across bp’s oil and gas CGU valuations, before adjustments for asset specific risks and tax rates, such that any misstatements would also aggregate.
•Reserves and resources estimates - A key input to certain CGU impairment assessments is the oil and gas production forecast, which is based on underlying reserves estimates and field specific development assumptions. Certain CGU production forecasts include specific risk adjusted resource volumes, in addition to proved and/or probable reserves estimates, that are inherently less certain than reserves; and assumptions related to these volumes can be particularly judgemental. There is a risk that material misstatements could arise from unreasonable production forecasts for individually material CGUs and/or from the aggregation of systematic flaws in bp’s reserves and resources estimation policies across the OP&O and G&LCE segments.
We identified certain individual CGUs with a total carrying value of $33 billion which we determined would be most at risk of material impairment charges (and/or impairment reversals for CGUs with a combined $25 billion carrying value within this population) as a result of a plausible change in the oil and gas price assumptions. We identified that a subset of these CGUs were also individually materially sensitive to the discount rate assumption.
We also identified CGUs with a further $12 billion of combined carrying value which were less sensitive as they would be potentially at risk, in aggregate, to a material impairment by a plausible change in some or all of the key assumptions. No impairment reversals are available for these CGUs. Further information regarding these sensitivities is given in Note 1 on page 186.
Impairment and/or reversal assessments of upstream oil and gas PP&E assets remain a critical audit matter because recoverable values are reliant on forecasts that are inherently judgemental and complex for management to estimate, and the magnitude of the potential misstatement risk is material to the group.
How the Critical Audit Matter was addressed in the Audit
We tested management’s key internal controls over the estimation of oil and gas prices, discount rates and reserve and resources estimates, as well as key internal controls over the performance of the impairment and/or reversal assessments where we identified audit risks. In addition, we conducted the following substantive procedures.
Oil and gas prices
•We independently developed a reasonable range of forecasts based on external data obtained, against which we compared management’s oil and gas price assumptions in order to challenge whether they are reasonable.
•In developing this range, we obtained a variety of reputable and reliable third party forecasts, peer information and other relevant market data.
•In challenging management’s price assumptions, we considered the extent to which they and each of the forecast pricing scenarios obtained from third parties reflect the impact of lower oil and gas demand due to climate change and the energy transition.
•The 2015 COP 21 Paris Agreement goals of 'Holding the increase in the global average temperature to well below 2°C above pre-industrial levels and pursuing efforts to limit the temperature increase to 1.5°C above pre-industrial levels' was reaffirmed at COP 26 in Glasgow during November 2021. Nevertheless, we understand that certain stakeholders are focussed increasingly on the 'no greater than 1.5°C' ambition element of the Paris Agreement.
•We specifically analysed third party forecasts stated as being, or interpreted by us, as being consistent with scenarios achieving the Paris 'well below 2°C goal' and/or '1.5°C ambition' and considered whether they presented contradictory audit evidence.
•We challenged management’s judgement, described in Note 1 on page 179, that the potential impact of further emission costs being borne by producers including bp is not expected to have a material impact on the group’s oil and gas CGU carrying values. We inquired of certain third party forecasters included in our reasonable range and reviewed their forecast price reports, to understand whether their oil and gas prices are forecast on a ‘net producer prices’ basis, (i.e. net of potential future emissions costs that are assumed to be borne by oil and gas end users), consistent with the basis of bp’s value-in-use price assumptions.
•We assessed management’s disclosures in Notes 1 and 3, including the sensitivity of forecast revenue cash inflows to lower oil and gas prices and how climate change and the energy transition, potential future emissions costs and/or reduced demand scenarios may impact bp to a greater extent than currently anticipated in the group’s value-in-use estimates for oil and gas CGUs.
Discount rates
•We independently evaluated bp’s discount rates used in impairment tests with input from Deloitte valuation specialists, against relevant third party market and peer data.
•We assessed whether specific country risks and tax adjustments were reasonably reflected in bp’s discount rates.
•We challenged management’s disclosures in Notes 1 and 3 including in relation to the sensitivity of discount rate assumptions.
Reserves and resources estimates
With the assistance of Deloitte oil and gas reserves specialists we:
•assessed bp’s reserves and resources estimation methods and policies
•assessed, guided by our risk assessment, how these policies had been applied to a sample of bp’s reserves and resources estimates which included those that we judged to represent the greatest risk of material misstatement
•read a sample of reports provided by management’s external reserves experts and assessed the scope of work and findings of these third parties
•assessed the competence, capability and objectivity of bp’s internal and external reserve experts; through understanding their relevant professional qualifications and experience
•compared the production forecasts used in the impairment tests with management’s approved reserves and resources estimates, those estimates having been subjected to the controls that we had tested and
•performed a retrospective assessment to check for indications of estimation bias over time.
Other procedures
•We challenged and assessed management’s CGU determinations, and considered whether there was any contradictory evidence present.
| | | | | | | | | | | | | | |
| | bp Annual Report and Form 20-F 2021 | | 167 |
•We assessed whether bp’s impairment methodology was acceptable under IFRS and tested the integrity and mechanical accuracy of certain impairment models.
•We challenged and assessed other CGU specific valuation input assumptions, including but not limited to material cost and tax forecasts, by comparing forecasts to approved internal and third party budgets, development plans, independent expectations and historical actuals. We assessed whether management’s forecasts are consistent overall with bp’s strategy, including the group’s expectation to reduce its hydrocarbon production (by around 40% by 2030 relative to 2019).
•Where relevant, we assessed management’s historical forecasting accuracy and whether the estimates had been determined and applied on a consistent basis across the group.
2.Decommissioning provisions – Notes 1 and 22
Critical Audit Matter Description
A decommissioning provision of $16.4 billion has been recognised in the financial statements at 31 December 2021. The estimation of decommissioning provisions is a highly judgemental area as it involves a number of key estimates related to the cost and timing of decommissioning, as well as inflation and discount rate. Given management expects hydrocarbon production to be around 40% lower by 2030 relative to 2019 as stated on page 17, consistency of that expectation with the timing of decommissioning expenditure and underlying cost assumptions is a key consideration. The estimated undiscounted cost of its obligations and the timing of future payment are set out in Note 1 on page 191.
Economic factors, future activities and the legislative environments that bp operates in are used to inform cost estimates, whereas the timing of decommissioning activities is dependent on cessation of production (CoP) dates, which are sensitive to changes in bp’s price forecasts as price estimates determine economic cut off of oil and gas reserve estimates.
The inflation rate used in bp’s decommissioning provision calculations has remained unchanged during 2021 at 1.5%. The impact of inflation on the forecast cost assumptions is an area of specific focus given the significant and sustained inflationary increases experienced globally since early 2021. In the second quarter of 2021 bp reduced its discount rate used for calculating its decommissioning provisions from 2.5% to 2.0% due to ongoing challenging macroeconomic conditions decreasing US treasury bond rates.
Additionally, bp is potentially exposed to decommissioning obligations that could revert back to bp in respect of historical divestments to third parties. Judgement is required to assess the potential risk of reversion and if applicable, the estimated exposure, for each historically divested asset. The risk of possible exposure was enhanced due to the impacts of the COVID-19 pandemic and climate change, which have heightened liquidity and financial resilience concerns for many industry participants. The risk has further increased following a US legal judgement in the year which required a specific provision and increased the likelihood of decommissioning liabilities reverting to former owners as part of a bankruptcy proceeding.
Provisions for decommissioning refining assets, previously not generally recognised on the basis that the potential obligations cannot be measured given their indeterminate settlement dates, might need to be recognised if reductions in demand due to climate change curtail their operational lives. As disclosed in Note 1 on page 191 management concluded that, although obligations may arise if refineries cease manufacturing operations, they would only be recognised at the point when sufficient information became available to determine potential settlement dates. Management has conducted analysis which supports a conclusion that demand for refined products is expected to remain strong in areas served by its existing refineries Accordingly, other than where a decision has been made to cease refining operations, no triggers for assessing the need to record a decommissioning provision have been identified.
We determined this to be a critical audit matter given the high degree of auditor judgment and the increased extent of effort by senior members of the engagement team.
How the Critical Audit Matter was addressed in the Audit
We obtained an understanding of the group’s decommissioning estimate and provisioning process and evaluated the effectiveness of the relevant controls.
Cost and timing estimates
•We assessed the completeness and accuracy of the assets subject to decommissioning, including understanding the process to establish whether a legal or constructive obligation existed.
•We evaluated changes in key cost assumptions including rig rates, vessel rates, well plug and abandonment duration and non-productive time assumptions. We also assessed the reasonableness of key cost assumptions with reference to internal and appropriate third party data.
•We considered the expectation that demand for oil and gas products and related activities will decrease, primarily in response to climate change and energy transition effects pivoting future energy industry investment and development activity towards renewable sources. We challenged management’s assessment of the impact this will have on the decommissioning provisions.
•We assessed changes in assumptions for the estimated date of decommissioning and evaluated whether CoP dates used for decommissioning estimation are aligned with CoP assumptions in other areas, including PP&E impairment testing and oil and gas reserve estimation.
•We assessed the accuracy of bp’s additional disclosure of the estimated undiscounted cost of its obligations and the timing of future decommissioning payments.
Inflation and discount rates
•With the help of our valuation specialists, we evaluated the discount and inflation rate assumptions used, comparing them against latest external market data.
•We challenged how management has considered the current high level of inflation in setting 2021 decommissioning cost assumptions.
•We tested the decommissioning models, assessing the application of cost, timing, inflation and discount rate assumptions when calculating the final provisions.
Reversion risk
•We obtained an understanding of the group’s decommissioning reversion risk assessment process, noting that the process was enhanced during 2021 in direct response to the increased potential default risk in respect of historical divestments to third parties.
•We tested management’s key internal controls within this enhanced process, including those controls over the completeness and accuracy of the previously divested asset data.
| | | | | | | | | | | | | | |
168 | | bp Annual Report and Form 20-F 2021 | | |
•We challenged management’s key judgements related to the decommissioning reversion risk and conclusions on whether any additional provision should be recognised or specific contingent liability disclosure made. We assessed the relevant internal and external evidence used in forming this judgement, including the financial health of the counterparty or counterparties in the ownership chain for the divested assets and the existence of any other pertinent factors which could indicate a higher probability of decommissioning obligations reverting to bp.
Potential decommissioning of refinery assets
•We challenged and evaluated management’s analysis which supported their judgement that no decommissioning provisions should be recognised in respect of refineries where there is ongoing activity and management has no current intention to cease these activities. In making this evaluation, we considered internal and external demand forecasts and assessed external profitability benchmarking.
•We also met with refinery management to understand the potential alternative use cases under consideration for refineries in the future, which include options for the production of low carbon and sustainable fuels.
3.Accounting for complex transactions executed by the trading and shipping (T&S) function to deliver against the wider group strategy and valuation of commodity financial derivatives, where fraud risks may arise in revenue recognition (potentially impacting all financial statement accounts, in particular finance debt) - Notes 1, 19, 21, 28 and 29 to the financial statements
Critical Audit Matter Description
In the normal course of business, T&S enters into a variety of transactions for delivering value across the group’s supply chain. Amongst other things, to achieve bp’s 'net zero' ambition and to support the group strategy, T&S as a function is increasingly focused on executing long term renewable power offtake/supply contracts in existing and new markets whilst providing solutions to bp’s customer through offering eco-friendly hydro-carbons. The nature of these transactions requires significant audit effort to be directed towards challenging management’s adopted accounting treatment and/or valuation estimates.
Throughout the year, we have kept our risk assessment updated by undertaking a review of portfolio composition. This process aided a deeper understanding of the impact of commodity price volatility, demand destruction resulting from the COVID-19 pandemic and the changing structure of the markets, including the impact of the transition to renewables across all regions where bp operates, allowing us to focus our audit effort to areas of highest risk.
Accounting for structured commodity transactions (SCTs):
T&S may also enter into a variety of transactions which we refer to as structured commodity transactions (SCTs). We generally consider a SCT to be an arrangement having one of the following features:
•two or more counterparties with non-standard contractual terms
•reference multiple commodity-based transactions and/or
•contractual arrangements entered into in contemplation of each other.
SCTs are often long-dated, can have a significant multi-year financial impact, and may require the use of complex valuation models or unobservable inputs when determining their fair value, in which case they will be classified as level 3 financial instruments under IFRS 13, ‘Fair Value Measurement’.
Accounting for SCTs is typically complex and involves significant judgment, as a feature of these transactions is that they often include multiple elements that will have a material impact on the presentation and disclosure in the financial statements, including in particular the classification of liabilities as finance debt.
Valuation of commodity financial derivatives:
Commodity markets remained volatile during the year on the back of continuing demand uncertainty as a result of the pandemic and supply disruptions following geo-political tensions. In response to the volatility observed, we focused our audit efforts across valuation of all commodity derivatives and designed procedures to specifically test for management bias.
Unlike other financial instruments whose values or inputs are readily observable and therefore more easily independently corroborated, there are certain transactions for which the valuation is inherently more subjective due to the use of either complex valuation models and/or unobservable inputs. These instruments are classified as level 3 financial assets or liabilities. This degree of subjectivity also gives rise to a risk of potential fraud through management incorporating bias in determining fair values.
As at 31 December 2021, the group’s total financial assets and liabilities measured at fair value were $12.8 billion and $13.9 billion, of which level 3 derivative financial assets were $5.5 billion and level 3 derivative financial liabilities were $3.9 billion.
How the Critical Audit Matter was addressed in the Audit
Accounting for structured commodity transactions:
For structured commodity transactions, we:
•Tested controls related to the accounting for complex transactions.
•Developed an understanding of the commercial rationale of the transactions through discussions with management and reading transaction documents and executed agreements.
•Performed a detailed accounting analysis for a sample of SCTs involving significant day one profits, offtake arrangements and/or significant contractual commitments. We confirmed that any day one profits were appropriately deferred.
•Selected a sample of existing working capital arrangements and financing structures to assess whether associated trading activity was in compliance with boundary conditions and whether the conclusions reached remained in compliance with relevant accounting standards.
•For SCTs which were identified during the prior years and that continue through 2021, we have refreshed our assessment in 2021 taking account of any amendments to the contracts. We assessed whether the conclusions reached previously remain appropriate and in accordance with relevant accounting standards.
To assess the appropriateness of the accounting treatment of SCTs, we embedded technical accounting specialists within the audit team.
Valuation of commodity financial derivatives:
In response to the increased volatility observed in the market and to test for management bias, we altered the extent and timing of our procedures by performing an independent valuation of a sample of distinct Level 2 derivatives at 30 June, 30 September and 31 December, and on a sample of
| | | | | | | | | | | | | | |
| | bp Annual Report and Form 20-F 2021 | | 169 |
distinct Level 3 derivatives at 30 September and 31 December. In addition, we have focused our testing on price inputs where bp has substantial exposure to illiquid (Level 3) or long dated (Level 2) curves.
To address the complexities associated with auditing the value of level 3 financial instruments, the engagement team included valuation specialists having significant quantitative and modelling expertise to assist in performing our audit procedures. Our valuation audit included the following control and substantive procedures:
•We tested the group’s valuation controls including the:
–model certification control, which is designed to review a model’s theoretical soundness and the appropriateness of its valuation methodology and
–independent price verification control, which is designed to review the appropriateness of valuation inputs that are not observable and are significant to the financial instrument’s valuation.
•We performed substantive valuation testing procedures at interim and year-end balance sheet dates, including:
–comparing management’s input assumptions against the expected assumptions of other market participants and observable market data
–evaluating management’s valuation methodologies against standard valuation practice and analysing whether a consistent framework is applied across the business period over period and
–engaging a Deloitte valuations specialist to challenge models, develop fair value estimates and verify consistency in management’s modelling and input assumptions throughout the year. Our independent estimates were established using independently sourced inputs (where available). We evaluated whether the differences between our independent estimates and management’s estimates were within a reasonable range. In situations where we utilised management’s inputs, these were compared to external data sources to determine whether they were reasonable.
4. Impairment of E&A assets and refinery PP&E as a consequence, inter alia, of climate change and the energy transition – Notes 1, 3 and 14
Critical Audit Matter Description
Intangible Assets
The recoverability of certain of the group’s $4.3 billion total exploration and appraisal (E&A) assets capitalised at 31 December 2021 are inherently judgemental and are potentially exposed to climate change and the global energy transition risk factors (see Note 14). This is because a greater number of E&A projects may not proceed as a consequence of lower forecast future oil and gas prices and bp’s intention to reduce its hydrocarbon production. The determination of whether and when E&A costs should be written off, impaired, or retained on the balance sheet as E&A assets, remains complex, continues to require significant management judgement for certain E&A projects.
PP&E
The recoverability of certain of the group’s $18.1 billion PP&E refining assets capitalised at 31 December 2021 are judgmental due to forecasting of cash flows and other key inputs of such assets which are impacted by the changes in supply and demand which arise as a consequence of climate change and the energy transition. Impairment tests were performed to assess the recoverability of each refinery’s carrying values. As disclosed in Note 3 to the accounts on page 200, management has recorded impairment charges of $962 million in the C&P segment, which primarily related to their refining assets.
bp’s intention to reduce its hydrocarbon production (by around 40% by 2030 relative to 2019) and the group’s wider strategy includes potentially disposing of certain high emissions intensity upstream oil assets and others. As a consequence for certain assets judgement is required in the determination of the recoverable amount as to whether it should consider the estimated disposal proceeds from a third party as a key input. Management recorded $1.1 billion of pre-tax impairment charges in 2021 for such potential disposals as described in Note 3. There is an audit risk that management judgements taken to determine whether impairment charges are required based on bp’s view of whether transactions are likely to proceed or not, and bp’s strategic appetite regarding the value of disposal consideration that would be accepted, are not reasonable.
How the Critical Audit Matter Was Addressed in the Audit
We established a climate change steering committee comprising a group of senior partners with specific climate change and technical audit and accounting expertise within Deloitte to provide an independent challenge to our key decisions and conclusions with respect to this area.
Audit procedures
In respect of the recoverability of E&A assets capitalised at 31 December 2021 we:
•Obtained an understanding of the group’s E&A write-off and impairment assessment processes and tested management’s key internal controls, including the controls that assess climate change related risks.
•Challenged and evaluated management’s key E&A judgements, with regards to the impairment criteria of IFRS 6 and bp’s accounting policy. We corroborated key internal and external evidence for assets that remained on the balance sheet. This included analysing evidence of future E&A plans, budgets and capital allocation decisions, assessing management’s key accounting judgement papers, holding discussions to challenge top level operational and finance management on the key judgements taken and reading external press releases, meeting minutes, licence documentation and evidence of active dialogue with partners and regulators including negotiations to renew licences or modify key terms.
•Assessed whether the progression of any projects that remain on the balance sheet would be inconsistent with elements of bp’s strategy and in particular its net zero carbon commitments, bp’s intention to reduce its hydrocarbon production (by around 40% by 2030 relative to 2019), and the group’s ‘no exploration in new countries’ commitment.
In respect of the recoverability of PP&E refining assets capitalised at 31 December 2021 we:
•tested management’s internal controls over the impairment evaluation
•assessed the valuation methodology, discount rate, including testing of source information and the mathematical accuracy of the calculation
•evaluated management’s ability to forecast future cash flows and margins by comparing actual results to historical forecasts
•evaluated the cash flows and other key inputs of the impairment testing of PP&E refining assets by considering internal and external market studies of future supply and demand and conducting sensitivity analysis and
•assessed the integrity and mechanical accuracy of the impairment models and assessed the appropriateness of key assumptions and inputs.
| | | | | | | | | | | | | | |
170 | | bp Annual Report and Form 20-F 2021 | | |
We challenged management’s analysis, that identified the specific assets that are likely to be disposed of by the group as part of its strategy. Where relevant, we challenged bp’s asset impairment assessments based on their estimated disposal proceeds and whether transactions are judged likely to proceed or not. We obtained evidence of any negotiations with third parties; and carefully considered the group’s strategic intent in this context.
/s/ Deloitte LLP
London
United Kingdom
18 March 2022
We have served as the company's auditor since 2018.
| | | | | | | | | | | | | | |
| | bp Annual Report and Form 20-F 2021 | | 171 |
Consolidated financial statements of the bp group
Report of Independent Registered Public Accounting Firm
To the shareholders and board of directors of BP p.l.c.
Opinion on internal control over financial reporting
We have audited the internal control over financial reporting of BP p.l.c. and subsidiaries (the Company) as of 31 December 2021, based on the criteria established in the UK Financial Reporting Council’s Guidance on Risk Management, Internal Control and Related Financial and Business Reporting relating to internal control over financial reporting (UK FRC Guidance). In our opinion, the Company maintained, in all material respects, effective internal control over financial reporting as of 31 December 2021, based on the criteria established in the UK FRC Guidance.
We have also audited, in accordance with the standards of the Public Company Accounting Oversight Board (United States) (PCAOB), the consolidated financial statements as at and for the year ended 31 December 2021, of the Company and our report dated 18 March 2022, expressed an unqualified opinion on those financial statements and included an explanatory paragraph regarding the Company’s change in accounting principle.
Basis for opinion
The Company's management is responsible for maintaining effective internal control over financial reporting and for its assessment of the effectiveness of internal control over financial reporting, included in the accompanying Management’s report on internal control over financial reporting. Our responsibility is to express an opinion on the Company's internal control over financial reporting based on our audit. We are a public accounting firm registered with the PCAOB and are required to be independent with respect to the Company in accordance with the U.S. federal securities laws and the applicable rules and regulations of the Securities and Exchange Commission and the PCAOB.
We conducted our audit in accordance with the standards of the PCAOB. Those standards require that we plan and perform the audit to obtain reasonable assurance about whether effective internal control over financial reporting was maintained in all material respects. Our audit included obtaining an understanding of internal control over financial reporting, assessing the risk that a material weakness exists, testing and evaluating the design and operating effectiveness of internal control based on the assessed risk, and performing such other procedures as we considered necessary in the circumstances. We believe that our audit provides a reasonable basis for our opinion.
Definition and limitations of internal control over financial reporting
A company’s internal control over financial reporting is a process designed to provide reasonable assurance regarding the reliability of financial reporting and the preparation of financial statements for external purposes in accordance with generally accepted accounting principles. A company’s internal control over financial reporting includes those policies and procedures that (1) pertain to the maintenance of records that, in reasonable detail, accurately and fairly reflect the transactions and dispositions of the assets of the company; (2) provide reasonable assurance that transactions are recorded as necessary to permit preparation of financial statements in accordance with generally accepted accounting principles, and that receipts and expenditures of the company are being made only in accordance with authorizations of management and directors of the company; and (3) provide reasonable assurance regarding prevention or timely detection of unauthorized acquisition, use, or disposition of the company’s assets that could have a material effect on the financial statements.
Because of its inherent limitations, internal control over financial reporting may not prevent or detect misstatements. Also, projections of any evaluation of effectiveness to future periods are subject to the risk that controls may become inadequate because of changes in conditions, or that the degree of compliance with the policies or procedures may deteriorate.
/s/ Deloitte LLP
London, United Kingdom
18 March 2022
| | | | | | | | | | | | | | |
172 | | bp Annual Report and Form 20-F 2021 | | |
Group income statement
| | | | | | | | | | | | | | | | | |
| For the year ended 31 December | | | | | $ million |
| | | Note | 2021 | 2020 | 2019 |
Sales and other operating revenuesa | | 5 | | 157,739 | | 105,944 | | 159,307 | |
| Earnings from joint ventures – after interest and tax | | 15 | | 543 | | (302) | | 576 | |
| Earnings from associates – after interest and tax | | 16 | | 3,456 | | (101) | | 2,681 | |
| Interest and other income | | 6 | | 581 | | 663 | | 769 | |
| Gains on sale of businesses and fixed assets | | 3 | | 1,876 | | 2,874 | | 193 | |
| Total revenues and other income | | | 164,195 | | 109,078 | | 163,526 | |
Purchasesa | | 18 | | 92,923 | | 57,682 | | 90,582 | |
| Production and manufacturing expenses | | | 25,843 | | 22,494 | | 21,815 | |
| Production and similar taxes | | 4 | | 1,308 | | 695 | | 1,547 | |
| Depreciation, depletion and amortization | | 4 | | 14,805 | | 14,889 | | 17,780 | |
| Net impairment and losses on sale of businesses and fixed assets | | 3 | | (1,121) | | 14,381 | | 8,075 | |
| Exploration expense | | 7 | | 424 | | 10,280 | | 964 | |
| Distribution and administration expenses | | | 11,931 | | 10,397 | | 11,057 | |
| Profit (loss) before interest and taxation | | | 18,082 | | (21,740) | | 11,706 | |
| Finance costs | | 6 | | 2,857 | | 3,115 | | 3,489 | |
| Net finance (income) expense relating to pensions and other post-retirement benefits | | 23 | | (2) | | 33 | | 63 | |
| Profit (loss) before taxation | | | 15,227 | | (24,888) | | 8,154 | |
| Taxation | | 8 | | 6,740 | | (4,159) | | 3,964 | |
| Profit (loss) for the year | | | 8,487 | | (20,729) | | 4,190 | |
| Attributable to | | | | | |
| bp shareholders | | | 7,565 | | (20,305) | | 4,026 | |
| Non-controlling interests | | | 922 | | (424) | | 164 | |
| | | 8,487 | | (20,729) | | 4,190 | |
| Earnings per share | | | | | |
| Profit (loss) for the year attributable to bp shareholders | | | | | |
| Per ordinary share (cents) | | | | | |
| Basic | | 10 | | 37.57 | | (100.42) | | 19.84 | |
| Diluted | | 10 | | 37.33 | | (100.42) | | 19.73 | |
| Per ADS (dollars) | | | | | |
| Basic | | 10 | | 2.25 | | (6.03) | | 1.19 | |
| Diluted | | 10 | | 2.24 | | (6.03) | | 1.18 | |
a 2020 and 2019 numbers have been restated as a result of changes to the presentation of revenues and purchases relating to physically settled derivative contracts effective 1 January 2021. For more information see Note 1 Basis of preparation - Voluntary change in accounting policy.
| | | | | | | | | | | | | | |
| | bp Annual Report and Form 20-F 2021 | | 173 |
Group statement of comprehensive incomea
| | | | | | | | | | | | | | | | | |
| For the year ended 31 December | | | | | $ million |
| | Note | 2021 | 2020 | 2019 |
| Profit (loss) for the year | | | 8,487 | | (20,729) | | 4,190 | |
| Other comprehensive income | | | | | |
| Items that may be reclassified subsequently to profit or loss | | | | | |
| Currency translation differences | | | (921) | | (1,843) | | 1,538 | |
Exchange (gains) losses on translation of foreign operations reclassified to gain or loss on sale of businesses and fixed assets | | | 36 | | (353) | | 880 | |
| Cash flow hedges marked to market | | 29 | | (430) | | 78 | | (100) | |
| Cash flow hedges reclassified to the income statement | | 29 | | 255 | | (37) | | 106 | |
| | | | | |
| | | | | |
| Costs of hedging marked to market | | 29 | | (105) | | 42 | | (4) | |
| Costs of hedging reclassified to the income statement | | 29 | | 21 | | 22 | | 57 | |
| | | | | |
| Share of items relating to equity-accounted entities, net of tax | | 15, 16 | 44 | | 312 | | 82 | |
| Income tax relating to items that may be reclassified | | 8 | | 65 | | 66 | | (70) | |
| | | (1,035) | | (1,713) | | 2,489 | |
| Items that will not be reclassified to profit or loss | | | | | |
Remeasurements of the net pension and other post-retirement benefit liability or asset | | 23 | | 4,416 | | 170 | | 328 | |
| Cash flow hedges that will subsequently be transferred to the balance sheet | | 29 | | 1 | | 7 | | (3) | |
| | | | | |
| Income tax relating to items that will not be reclassified | | 8 | | (1,317) | | (105) | | (157) | |
| | | 3,100 | | 72 | | 168 | |
| Other comprehensive income | | | 2,065 | | (1,641) | | 2,657 | |
| Total comprehensive income | | | 10,552 | | (22,370) | | 6,847 | |
| Attributable to | | | | | |
| bp shareholders | | | 9,654 | | (21,983) | | 6,674 | |
| Non-controlling interests | | | 898 | | (387) | | 173 | |
| | | 10,552 | | (22,370) | | 6,847 | |
a See Note 31 for further information.
| | | | | | | | | | | | | | |
174 | | bp Annual Report and Form 20-F 2021 | | |
Group statement of changes in equitya
| | | | | | | | | | | | | | | | | | | | | | | | | | | | | | | | |
| | | | | | | | | | $ million |
| | Share capital and capital reserves | Treasury shares | Foreign currency translation reserve | Fair value reserves | Profit and loss account | bp shareholders' equity | Non-controlling interests | Total equity |
| Hybrid bonds | Other interest |
| At 1 January 2021 | | 46,701 | | (13,224) | | (8,719) | | (808) | | 47,300 | | 71,250 | | 12,076 | | 2,242 | | 85,568 | |
| Profit for the year | | — | | — | | — | | — | | 7,565 | | 7,565 | | 507 | | 415 | | 8,487 | |
| Other comprehensive income | | — | | — | | (846) | | (209) | | 3,144 | | 2,089 | | — | | (24) | | 2,065 | |
| Total comprehensive income | | — | | — | | (846) | | (209) | | 10,709 | | 9,654 | | 507 | | 391 | | 10,552 | |
Dividendsb | | — | | — | | — | | — | | (4,316) | | (4,316) | | — | | (311) | | (4,627) | |
Cash flow hedges transferred to the balance sheet, net of tax | | — | | — | | — | | (10) | | — | | (10) | | — | | — | | (10) | |
| | | | | | | | | | |
Repurchase of ordinary share capitalc | | — | | — | | — | | — | | (3,151) | | (3,151) | | — | | — | | (3,151) | |
Share-based payments, net of tax | | 170 | | 600 | | — | | — | | (138) | | 632 | | — | | — | | 632 | |
Share of equity-accounted entities’ changes in equity, net of tax | | — | | — | | — | | — | | 556 | | 556 | | — | | — | | 556 | |
Issue of perpetual hybrid bondsa | | — | | — | | — | | — | | (26) | | (26) | | 950 | | — | | 924 | |
| | | | | | | | | | |
| Payments on perpetual hybrid bonds | | — | | — | | (7) | | — | | — | | (7) | | (492) | | — | | (499) | |
| | | | | | | | | | |
| Tax on issue of perpetual hybrid bonds | | — | | — | | — | | — | | — | | — | | — | | — | | — | |
Transactions involving non-controlling interests, net of tax | | — | | — | | — | | — | | 881 | | 881 | | — | | (387) | | 494 | |
| At 31 December 2021 | | 46,871 | | (12,624) | | (9,572) | | (1,027) | | 51,815 | | 75,463 | | 13,041 | | 1,935 | | 90,439 | |
| | | | | | | | | | |
| At 1 January 2020 | | 46,525 | | (14,412) | | (6,495) | | (912) | | 73,706 | | 98,412 | | — | | 2,296 | | 100,708 | |
| Profit for the year | | — | | — | | — | | — | | (20,305) | | (20,305) | | 256 | | (680) | | (20,729) | |
| Other comprehensive income | | — | | — | | (2,224) | | 98 | | 448 | | (1,678) | | — | | 37 | | (1,641) | |
| Total comprehensive income | | — | | — | | (2,224) | | 98 | | (19,857) | | (21,983) | | 256 | | (643) | | (22,370) | |
Dividendsb | | — | | — | | — | | — | | (6,367) | | (6,367) | | — | | (238) | | (6,605) | |
Cash flow hedges transferred to the balance sheet, net of tax | | — | | — | | — | | 6 | | — | | 6 | | — | | — | | 6 | |
Repurchase of ordinary share capital | | — | | — | | — | | — | | (776) | | (776) | | — | | — | | (776) | |
Share-based payments, net of tax | | 176 | | 1,188 | | — | | — | | (638) | | 726 | | — | | — | | 726 | |
Share of equity-accounted entities’ changes in equity, net of tax | | — | | — | | — | | — | | 1,341 | | 1,341 | | — | | — | | 1,341 | |
| Issue of perpetual hybrid bonds | | — | | — | | — | | — | | (48) | | (48) | | 11,909 | | — | | 11,861 | |
| Payments on perpetual hybrid bonds | | — | | — | | — | | — | | — | | — | | (89) | | — | | (89) | |
| Tax on issue of perpetual hybrid bonds | | — | | — | | — | | — | | 3 | | 3 | | — | | — | | 3 | |
Transactions involving non-controlling interests, net of tax | | — | | — | | — | | — | | (64) | | (64) | | — | | 827 | | 763 | |
| At 31 December 2020 | | 46,701 | | (13,224) | | (8,719) | | (808) | | 47,300 | | 71,250 | | 12,076 | | 2,242 | | 85,568 | |
| | | | | | | | | | |
| At 31 December 2018 | | 46,352 | | (15,767) | | (8,902) | | (987) | | 78,748 | | 99,444 | | — | | 2,104 | | 101,548 | |
| Adjustment on adoption of IFRS 16, net of tax | | — | | — | | — | | — | | (329) | | (329) | | — | | (1) | | (330) | |
| At 1 January 2019 | | 46,352 | | (15,767) | | (8,902) | | (987) | | 78,419 | | 99,115 | | — | | 2,103 | | 101,218 | |
| Profit for the year | | — | | — | | — | | — | | 4,026 | | 4,026 | | — | | 164 | | 4,190 | |
| Other comprehensive income | | — | | — | | 2,407 | | 52 | | 189 | | 2,648 | | — | | 9 | | 2,657 | |
| Total comprehensive income | | — | | — | | 2,407 | | 52 | | 4,215 | | 6,674 | | — | | 173 | | 6,847 | |
Dividendsb | | — | | — | | — | | — | | (6,929) | | (6,929) | | — | | (213) | | (7,142) | |
| Cash flow hedges transferred to the balance sheet, net of tax | | — | | — | | — | | 23 | | — | | 23 | | — | | — | | 23 | |
| Repurchase of ordinary share capital | | — | | — | | — | | — | | (1,511) | | (1,511) | | — | | — | | (1,511) | |
Share-based payments, net of tax | | 173 | | 1,355 | | — | | — | | (809) | | 719 | | — | | — | | 719 | |
Share of equity-accounted entities’ changes in equity, net of tax | | — | | — | | — | | — | | 5 | | 5 | | — | | — | | 5 | |
Transactions involving non-controlling interests, net of tax | | — | | — | | — | | — | | 316 | | 316 | | — | | 233 | | 549 | |
| At 31 December 2019 | | 46,525 | | (14,412) | | (6,495) | | (912) | | 73,706 | | 98,412 | | — | | 2,296 | | 100,708 | |
a See Note 31 for further information.
b See Note 9 for further information.
c See Note 30 for further information.
| | | | | | | | | | | | | | |
| | bp Annual Report and Form 20-F 2021 | | 175 |
Group balance sheet
| | | | | | | | | | | | | | |
| At 31 December | | | | $ million |
| | Note | 2021 | 2020 |
| Non-current assets | | | | |
| Property, plant and equipment | | 11 | | 112,902 | | 114,836 | |
| Goodwill | | 13 | | 12,373 | | 12,480 | |
| Intangible assets | | 14 | | 6,451 | | 6,093 | |
| Investments in joint ventures | | 15 | | 9,982 | | 8,362 | |
| Investments in associates | | 16 | | 21,001 | | 18,975 | |
| Other investments | | 17 | | 2,544 | | 2,746 | |
| Fixed assets | | | 165,253 | | 163,492 | |
| Loans | | | 922 | | 840 | |
| Trade and other receivables | | 19 | | 2,693 | | 4,351 | |
| Derivative financial instruments | | 29 | | 7,006 | | 9,755 | |
| Prepayments | | | 479 | | 533 | |
| Deferred tax assets | | 8 | | 6,410 | | 7,744 | |
| Defined benefit pension plan surpluses | | 23 | | 11,919 | | 7,957 | |
| | | 194,682 | | 194,672 | |
| Current assets | | | | |
| Loans | | | 355 | | 458 | |
| Inventories | | 18 | | 23,711 | | 16,873 | |
| Trade and other receivables | | 19 | | 27,139 | | 17,948 | |
| Derivative financial instruments | | 29 | | 5,744 | | 2,992 | |
| Prepayments | | | 2,486 | | 1,269 | |
| Current tax receivable | | | 542 | | 672 | |
| Other investments | | 17 | | 280 | | 333 | |
| Cash and cash equivalents | | 24 | | 30,681 | | 31,111 | |
| | | 90,938 | | 71,656 | |
| Assets classified as held for sale | | 2 | | 1,652 | | 1,326 | |
| | | 92,590 | | 72,982 | |
| Total assets | | | 287,272 | | 267,654 | |
| Current liabilities | | | | |
| Trade and other payables | | 21 | | 52,611 | | 36,014 | |
| Derivative financial instruments | | 29 | | 7,565 | | 2,998 | |
| Accruals | | | 5,638 | | 4,650 | |
| Lease liabilities | | 27 | | 1,747 | | 1,933 | |
| Finance debt | | 25 | | 5,557 | | 9,359 | |
| Current tax payable | | | 1,554 | | 1,038 | |
| Provisions | | 22 | | 5,256 | | 3,761 | |
| | | 79,928 | | 59,753 | |
| Liabilities directly associated with assets classified as held for sale | | 2 | | 359 | | 46 | |
| | | 80,287 | | 59,799 | |
| Non-current liabilities | | | | |
| Other payables | | 21 | | 10,567 | | 12,112 | |
| Derivative financial instruments | | 29 | | 6,356 | | 5,404 | |
| Accruals | | | 968 | | 852 | |
| Lease liabilities | | 27 | | 6,864 | | 7,329 | |
| Finance debt | | 25 | | 55,619 | | 63,305 | |
| Deferred tax liabilities | | 8 | | 8,780 | | 6,831 | |
| Provisions | | 22 | | 19,572 | | 17,200 | |
| Defined benefit pension plan and other post-retirement benefit plan deficits | | 23 | | 7,820 | | 9,254 | |
| | | 116,546 | | 122,287 | |
| Total liabilities | | | 196,833 | | 182,086 | |
| Net assets | | | 90,439 | | 85,568 | |
| Equity | | | | |
| bp shareholders’ equity | | 31 | | 75,463 | | 71,250 | |
| Non-controlling interests | | 31 | | 14,976 | | 14,318 | |
| Total equity | | 31 | | 90,439 | | 85,568 | |
Helge Lund Chair
Bernard Looney Chief executive officer
18 March 2022
| | | | | | | | | | | | | | |
176 | | bp Annual Report and Form 20-F 2021 | | |
Group cash flow statement
| | | | | | | | | | | | | | | | | |
| For the year ended 31 December | | | | | $ million |
| | Note | 2021 | 2020 | 2019 |
| Operating activities | | | | | |
| Profit (loss) before taxation | | | 15,227 | | (24,888) | | 8,154 | |
Adjustments to reconcile profit before taxation to net cash provided by operating activities | | | | | |
| Exploration expenditure written off | | 7 | | 167 | | 9,920 | | 631 | |
| Depreciation, depletion and amortization | | 4 | | 14,805 | | 14,889 | | 17,780 | |
| Impairment and (gain) loss on sale of businesses and fixed assets | | 3 | | (2,997) | | 11,507 | | 7,882 | |
| Earnings from joint ventures and associates | | | (3,999) | | 403 | | (3,257) | |
Dividends received from joint ventures and associates | | | 1,842 | | 1,442 | | 1,962 | |
| Interest receivable | | | (235) | | (258) | | (441) | |
| Interest received | | | 320 | | 74 | | 416 | |
| Finance costs | | 6 | | 2,857 | | 3,115 | | 3,489 | |
| Interest paid | | | (2,474) | | (2,728) | | (2,870) | |
Net finance expense relating to pensions and other post-retirement benefits | | 23 | | (2) | | 33 | | 63 | |
Share-based payments | | | 627 | | 723 | | 730 | |
Net operating charge for pensions and other post-retirement benefits, less contributions and benefit payments for unfunded plans | | 23 | | (655) | | (282) | | (238) | |
Net charge for provisions, less payments | | | 2,934 | | 735 | | (176) | |
| | | | | |
(Increase) decrease in inventories | | | (7,458) | | 3,963 | | (3,406) | |
(Increase) decrease in other current and non-current assets | | | (13,263) | | 4,230 | | (2,335) | |
Increase (decrease) in other current and non-current liabilities | | | 20,095 | | (8,278) | | 2,823 | |
| Income taxes paid | | | (4,179) | | (2,438) | | (5,437) | |
| Net cash provided by operating activities | | | 23,612 | | 12,162 | | 25,770 | |
| Investing activities | | | | | |
| Expenditure on property, plant and equipment, intangible and other assets | | | (10,887) | | (12,306) | | (15,418) | |
| Acquisitions, net of cash acquired | | | (186) | | (44) | | (3,562) | |
| Investment in joint ventures | | | (1,440) | | (567) | | (137) | |
| Investment in associates | | | (335) | | (1,138) | | (304) | |
| Total cash capital expenditure | | | (12,848) | | (14,055) | | (19,421) | |
| Proceeds from disposals of fixed assets | | 3 | | 1,145 | | 491 | | 500 | |
Proceeds from disposals of businesses, net of cash disposed | | 3 | | 5,812 | | 4,989 | | 1,701 | |
| Proceeds from loan repayments | | | 197 | | 717 | | 246 | |
| Net cash used in investing activities | | | (5,694) | | (7,858) | | (16,974) | |
| Financing activities | | | | | |
| Repurchase of shares | | | (3,151) | | (776) | | (1,511) | |
| Lease liability payments | | | (2,082) | | (2,442) | | (2,372) | |
| Proceeds from long-term financing | | | 6,987 | | 14,736 | | 8,597 | |
| Repayments of long-term financing | | | (16,804) | | (12,179) | | (7,118) | |
| Net increase (decrease) in short-term debt | | | 1,077 | | (1,234) | | 180 | |
| Issue of perpetual hybrid bonds | | | 924 | | 11,861 | | — | |
| | | | | |
| Payments relating to perpetual hybrid bonds | | | (538) | | (89) | | — | |
| Payments relating to transactions involving non-controlling interests (other) | | | (560) | | (8) | | — | |
| Receipts relating to transactions involving non-controlling interests (other) | | | 683 | | 665 | | 566 | |
| Dividends paid | | | | | |
| bp shareholders | | 9 | | (4,304) | | (6,340) | | (6,946) | |
| Non-controlling interests | | | (311) | | (238) | | (213) | |
| Net cash provided by (used in) financing activities | | | (18,079) | | 3,956 | | (8,817) | |
Currency translation differences relating to cash and cash equivalents | | | (269) | | 379 | | 25 | |
| Increase (decrease) in cash and cash equivalents | | | (430) | | 8,639 | | 4 | |
| Cash and cash equivalents at beginning of year | | | 31,111 | | 22,472 | | 22,468 | |
| Cash and cash equivalents at end of year | | | 30,681 | | 31,111 | | 22,472 | |
| | | | | | | | | | | | | | |
| | bp Annual Report and Form 20-F 2021 | | 177 |
Notes on financial statements
1. Significant accounting policies, judgements, estimates and assumptions
Authorization of financial statements and statement of compliance with International Financial Reporting Standards
The consolidated financial statements of BP p.l.c and its subsidiaries (collectively referred to as bp or the group) for the year ended 31 December 2021 were approved and signed by the chief executive officer and chairman on 18 March 2022 having been duly authorized to do so by the board of directors. BP p.l.c. is a public limited company incorporated and domiciled in England and Wales. The consolidated financial statements have been prepared in accordance with International Financial Reporting Standards (IFRS) as issued by the International Accounting Standards Board (IASB), IFRS as adopted in the European Union (EU) and in accordance with the provisions of the UK Companies Act 2006 as applicable to companies reporting under international accounting standards. As a result of the UK's withdrawal from the EU, with effect from 1 January 2021, the consolidated financial statements are also prepared in accordance with IFRS as adopted by the UK. IFRS as adopted by the UK does not differ from IFRS as adopted by the EU. IFRS as adopted by the UK and EU differs in certain respects from IFRS as issued by the IASB. The differences have no impact on the group’s consolidated financial statements for the years presented. The UK’s withdrawal from the EU has not had a significant impact on the consolidated financial statements. The significant accounting policies and accounting judgements, estimates and assumptions of the group are set out below.
Basis of preparation
The consolidated financial statements have been prepared on a going concern basis and in accordance with IFRS and IFRS Interpretations Committee (IFRIC) interpretations issued and effective for the year ended 31 December 2021. The accounting policies that follow have been consistently applied to all years presented, except where otherwise indicated.
The consolidated financial statements are presented in US dollars and all values are rounded to the nearest million dollars ($ million), except where otherwise indicated.
Significant accounting policies: use of judgements, estimates and assumptions
Inherent in the application of many of the accounting policies used in preparing the consolidated financial statements is the need for bp management to make judgements, estimates and assumptions that affect the reported amounts of assets and liabilities, the disclosure of contingent assets and liabilities, and the reported amounts of revenues and expenses. Actual outcomes could differ from the estimates and assumptions used. The accounting judgements and estimates that have a significant impact on the results of the group are set out in boxed text below, and should be read in conjunction with the information provided in the Notes on financial statements.
The areas requiring the most significant judgement and estimation in the preparation of the consolidated financial statements are: accounting for the investments in Rosneft and Aker BP; exploration and appraisal intangible assets; the recoverability of asset carrying values, including the estimation of reserves; supplier financing arrangements; derivative financial instruments; provisions and contingencies; and pensions and other post-retirement benefits. Judgements and estimates, not all of which are significant, made in assessing the impact of the COVID-19 pandemic, and climate change and the transition to a lower carbon economy on the consolidated financial statements are also set out in boxed text below. Where an estimate has a significant risk of resulting in a material adjustment to the carrying amounts of assets and liabilities within the next financial year this is specifically noted within the boxed text.
| | |
Judgements and estimates made in assessing the impact of climate change and the transition to a lower carbon economy Climate change and the transition to a lower carbon economy were considered in preparing the consolidated financial statements. These may have significant impacts on the currently reported amounts of the group’s assets and liabilities discussed below and on similar assets and liabilities that may be recognized in the future. The group’s assumptions for investment appraisal (see page 32) form part of an investment decision-making framework for currently unsanctioned future capital expenditure on property, plant and equipment, and intangibles including exploration and appraisal assets, that is designed to support the effective and resilient implementation of bp’s strategy. The price assumptions used for investment appraisal include oil and gas price assumptions, which are producer prices and are therefore net of any future carbon prices that the purchaser may be required to pay, and an assumption of a single carbon emissions cost imposed on the producer in respect of operational greenhouse gas (GHG) emissions (carbon dioxide and methane) in order to incentivize engineering solutions to mitigate GHG emissions on projects. The group's oil, gas and carbon price assumptions for value-in-use impairment testing are aligned with those investment appraisal assumptions, except for, 2022 oil and gas prices which reflect near-term market conditions, and the assumptions for future carbon emissions costs described below. Impairment of property, plant and equipment, and goodwill The energy transition is likely to impact the future prices of commodities such as oil and natural gas which in turn may affect the recoverable amount of property, plant and equipment, and goodwill in the oil and gas industry. Management’s best estimate of oil price assumptions for value-in-use impairment testing was revised during 2021. The assumption up to 2030 was increased to reflect near-term supply constraints whereas the long-term assumption was decreased as bp's management expects an acceleration of the pace of transition to a lower carbon economy. Henry Hub gas price assumptions remain unchanged from 2020 except that the assumption for 2022 has been increased to reflect short-term market conditions. The revised assumptions sit within the range of external scenarios considered by management and are in line with a range of transition paths consistent with the temperature goal of the Paris climate change agreement, of holding the increase in the global average temperature to well below 2°C above pre-industrial levels and pursuing efforts to limit the temperature increase to 1.5°C above pre-industrial levels. As noted above, the group’s investment appraisal process includes a single carbon emissions price assumption for the investment economics which is applied to bp's anticipated share of bp's forecast of the investments assets' scope 1 and 2 GHG emissions where they exceed defined thresholds, and is assumed to be payable by bp as the producer or as a non-operator. However, for value-in-use impairment testing on bp's existing cash generating units (CGUs), consistent with all other relevant cash flows estimated, bp is required to reflect management's best estimate of any expected applicable carbon emission costs payable by bp, including where bp in not the operator, in the future for each jurisdiction in which the group has interests. This requires management’s best estimate of how future changes to relevant carbon emission cost policies and/or legislation are likely to affect the future cash flows of the group’s applicable CGUs, whether currently enacted or not. Future potential carbon pricing and/or costs of carbon emissions allowances are included in the value-in-use calculations to the extent management has sufficient information to make such an estimate. Currently this results in limited application of carbon price assumptions in value-in-use impairment tests given that carbon pricing legislation in most jurisdictions where the group has interests is not in place and there is not sufficient information available as to the relevant policy makers' future intentions regarding carbon pricing to support an estimate. |
| | | | | | | | | | | | | | |
178 | | bp Annual Report and Form 20-F 2021 | | |
1. Significant accounting policies, judgements, estimates and assumptions – continued
| | |
However, as bp’s forecast future prices are producer prices, the group considers it reasonable to assume that if, in addition to the costs already in place, further scope 1 and 2 emission costs were partially to be borne directly by oil and gas producers including bp in future and the prevalence of such costs were to become widespread, the gross oil and gas prices realised by producers would be correspondingly higher over the long term, resulting in no expected overall materially negative impacts on the group’s net cash flows. See significant judgements and estimates: recoverability of asset carrying values for further information including sensitivity analysis in relation to reasonably possible changes in the price assumptions and carbon costs. Production assumptions within upstream property, plant and equipment, and goodwill value-in-use impairment tests reflect management’s current best estimate of future production of the existing upstream portfolio. The group’s sees the expected reduction in upstream hydrocarbon production by around 40% by 2030 from its 2019 baseline (see page 17) being achieved through future active management and high-grading of the portfolio. Changes in upstream production since 2019 will be included in the best estimate however as the specific future changes to the portfolio are not yet known, the current best estimate does not include the full extent of the expected upstream production reduction. See significant judgements and estimates: recoverability of asset carrying values and Note 13 for sensitivity analyses in relation to reasonably possible changes in production for upstream oil and gas properties and goodwill respectively. Impairment reversals were recognized on certain upstream oil and gas properties partly as a result of the higher near-term assumptions. See Note 3 for further information. For the customers & products segment, though the energy transition may impact demand for certain refined products in the future, management anticipates sufficiently robust demand for the remainder of each refinery’s useful life. Management will continue to review price assumptions as the energy transition progresses and this may result in impairment charges or reversals in the future. Exploration and appraisal intangible assets The energy transition may affect the future development or viability of exploration prospects. A significant proportion of exploration and appraisal intangible assets were written off in 2020 as a result of lower price assumptions and work to develop bp’s new strategy. The recoverability of the remaining intangibles was considered during 2021 and no significant write-offs were identified. These assets will continue to be assessed as the energy transition progresses. See significant judgement: exploration and appraisal intangible assets and Note 7 for further information. Property, plant and equipment – depreciation and expected useful lives The energy transition may curtail the expected useful lives of oil and gas industry assets thereby accelerating depreciation charges. However, the significant majority of bp’s existing upstream oil and natural gas properties are likely to be fully depreciated within the next 10 years and, as outlined in bp's strategy, oil and natural gas production will remain an important part of bp’s business activities over that period. Similarly, for refineries, demand for refined products is expected to remain sufficient to support the remaining useful life of existing assets. Therefore, management does not expect the useful lives of bp’s reported property, plant and equipment to change and do not consider this to be a significant accounting judgement or estimate. Significant capital expenditure is still required for ongoing projects and therefore the useful lives of future capital expenditure may be different. See significant accounting policy: property, plant and equipment for more information. Provisions: decommissioning The energy transition may bring forward the decommissioning of oil and gas industry assets thereby increasing the present value of associated decommissioning provisions. The majority of bp’s existing upstream oil and gas properties are expected to start decommissioning within the next two decades. The group’s expectation to reduce its upstream hydrocarbon production by around 40% by 2030 from its 2019 baseline (see page 17) is expected to be achieved through future active management and high-grading of the portfolio. Any resulting increases or decreases to the weighted average timing of decommissioning will be driven by the profile of assets held in the revised portfolio. Currently, the expected timing of decommissioning expenditures for the upstream oil and gas assets in the group’s portfolio has not materially been brought forward. Management does not expect any reasonable change in the expected timing of decommissioning to have a material effect on the upstream decommissioning provisions, assuming cash flows remain unchanged. Decommissioning cost estimates are based on the known regulatory and external environment. These cost estimates may change in the future, including as a result of the transition to a lower carbon economy. For refineries, decommissioning provisions are generally not recognized as the associated obligations have indeterminate settlement dates, typically driven by the cessation of manufacturing. Management will continue to review facts and circumstances to assess if decommissioning provisions need to be recognized. See significant judgements and estimates: provisions for further information. |
| | |
Judgements and estimates made in assessing the impact of the COVID-19 pandemic and the economic environment In preparing the consolidated financial statements, the following areas involving judgement and estimates were identified as most relevant with regards to the impact of the COVID-19 pandemic and current economic environment. Going concern Forecast liquidity has been assessed under a number of stressed scenarios, including a significant decline in oil prices over the 12-month period. Reverse stress tests performed indicated that the group will continue to operate as a going concern for at least 12 months from the date of approval of the consolidated financial statements even if the Brent price fell to zero. No material uncertainties over going concern or significant judgements or estimates in the assessment were identified. See also Note 28 Financial instruments and financial risk factors – Liquidity risk for further information. Discount rate assumptions The discount rates used for impairment testing and provisions were reassessed during the year in light of changing economic and geopolitical outlooks. The nominal discount rate applied to provisions was reduced during the year to reflect the enduring reduction in US Treasury yields. The principal impact of this rate reduction was a $1.3 billion increase in the decommissioning provision with a corresponding increase in the carrying amount of property, plant and equipment of $1.0 billion. Impairment discount rates and country risk premiums were unchanged due to COVID-19 from those reported in 2020. See significant judgements and estimates: recoverability of asset carrying values and provisions for further information. Pensions and other post-retirement benefits The volatility in the financial markets during 2021 impacted the assumptions used for determining the fair value of plan assets and the present value of defined benefit obligations in the group’s defined benefit pension plans. See significant estimate: pensions and other post-retirement benefits and Note 23 for further information. |
| | | | | | | | | | | | | | |
| | bp Annual Report and Form 20-F 2021 | | 179 |
1. Significant accounting policies, judgements, estimates and assumptions – continued | | |
Impairment of financial assets measured at amortized cost The current economic environment and future credit risk outlook were considered in updating the estimate of expected credit loss allowances on financial assets measured at amortized cost and no significant impact was determined relative to the total expected credit loss allowances recognized as at 31 December 2021. Management does not consider the calculation of expected credit loss allowances to be a significant accounting estimate. See Note 20 and 28 for further information. Income taxes The carrying amounts of the group’s deferred tax assets were reviewed and updated to the extent that there are changes in the probability of sufficient taxable profits being available to utilize the reported deferred tax assets. Management does not consider the measurement of deferred tax assets to be a significant accounting estimate. See significant accounting policy: income taxes and Note 8 for further information. |
Basis of consolidation
The consolidated group financial statements consolidate the financial statements of BP p.l.c. and its subsidiaries drawn up to 31 December each year. Subsidiaries are consolidated from the date of their acquisition, being the date on which the group obtains control, including when control is obtained via potential voting rights, and continue to be consolidated until the date that control ceases.
The financial statements of subsidiaries are prepared for the same reporting year as the parent company, using consistent accounting policies. Intra-group balances and transactions, including unrealized profits arising from intra-group transactions, have been eliminated.
Unrealized losses are eliminated unless the transaction provides evidence of an impairment of the asset transferred. Non-controlling interests represent the equity in subsidiaries that is not attributable, directly or indirectly, to bp shareholders. Included within non-controlling interests are perpetual subordinated hybrid securities issued by subsidiaries and for which the group has the unconditional right to avoid transferring cash or another financial asset to the holders. Profit or loss attributable to bp shareholders is adjusted to reflect the coupon/interest related to these hybrid securities whether or not such distribution has been deferred.
Interests in other entities
Business combinations and goodwill
Business combinations are accounted for using the acquisition method. The identifiable assets acquired and liabilities assumed are recognized at their fair values at the acquisition date.
Goodwill is initially measured as the excess of the aggregate of the consideration transferred, the amount recognized for any non-controlling interest and the acquisition-date fair values of any previously held interest in the acquiree over the fair value of the identifiable assets acquired and liabilities assumed at the acquisition date. The amount recognized for any non-controlling interest is measured at the present ownership's proportionate share in the recognized amounts of the acquiree’s identifiable net assets. At the acquisition date, any goodwill acquired is allocated to each of the cash-generating units, or groups of cash-generating units, expected to benefit from the combination’s synergies. Following initial recognition, goodwill is measured at cost less any accumulated impairment losses. Goodwill arising on business combinations prior to 1 January 2003 is stated at the previous carrying amount under UK generally accepted accounting practice, less subsequent impairments.
Goodwill may arise upon investments in joint ventures and associates, being the surplus of the cost of investment over the group’s share of the net fair value of the identifiable assets and liabilities. Any such goodwill is recorded within the corresponding investment in joint ventures and associates.
Goodwill may also arise upon acquisition of interests in joint operations that meet the definition of a business. The amount of goodwill separately recognized is the excess of the consideration transferred over the group's share of the net fair value of the identifiable assets and liabilities.
Interests in joint arrangements
The results, assets and liabilities of joint ventures are incorporated in these consolidated financial statements using the equity method of accounting as described below.
Certain of the group’s activities, particularly in the oil production & operations and gas & low carbon energy segments, are conducted through joint operations. bp recognizes, on a line-by-line basis in the consolidated financial statements, its share of the assets, liabilities and expenses of these joint operations incurred jointly with the other partners, along with the group’s income from the sale of its share of the output and any liabilities and expenses that the group has incurred in relation to the joint operation.
Interests in associates
The results, assets and liabilities of associates are incorporated in these consolidated financial statements using the equity method of accounting as described below.
| | |
Significant judgements: investments in Rosneft and Aker BP Judgement is required in assessing the level of control or influence over another entity in which the group holds an interest. For bp, the judgements that the group had significant influence over Rosneft Oil Company (Rosneft), a Russian oil and gas company, and expects to continue to have significant influence over Aker BP, a Norwegian oil and gas company, following completion of Aker BP's proposed acquisition of Lundin Energy, are significant. Significant influence is defined in IFRS as the power to participate in the financial and operating policy decisions of the investee but is not control or joint control of those policies. Significant influence is presumed when an entity owns 20% or more of the voting power of the investee. Significant influence is presumed not to be present when an entity owns less than 20% of the voting power of the investee. IFRS identifies several indicators that may provide evidence of significant influence, including representation on the board of directors of the investee and participation in policy-making processes. |
| | | | | | | | | | | | | | |
180 | | bp Annual Report and Form 20-F 2021 | | |
1. Significant accounting policies, judgements, estimates and assumptions – continued | | |
Rosneft At 31 December 2021, bp owned 19.75% of the voting shares of Rosneft. Rosneft’s largest shareholder is Rosneftegaz JSC (Rosneftegaz), which is wholly owned by the Russian government. At 31 December 2021, Rosneftegaz held 40.4% (2020 40.4%) of the voting shares of Rosneft. bp’s group chief executive, Bernard Looney, was approved as a member of the board of directors of Rosneft in June 2020 as one of bp’s two nominated directors. bp’s other nominated director, Bob Dudley, was approved as a member of the Rosneft board in 2013. He was also chairman of the Rosneft board’s Strategic and Sustainable Development Committee during 2021. bp also held the voting rights at general meetings of shareholders conferred by its 19.75% stake in Rosneft. bp’s economic interest in Rosneft at 31 December 2021 was 22.03% (2020 22.03%), which was higher than bp's ownership stake due to transactions by Rosneft in its own shares in previous years. bp's management considers, therefore, that the group has significant influence over Rosneft, as defined by IFRS, as at 31 December 2021. As a consequence of this judgement, bp used the equity method of accounting for its investment and bp's share of Rosneft's oil and natural gas reserves was included in the group's estimated net proved reserves of equity-accounted entities. On 27 February 2022, bp announced it will exit its shareholding in Rosneft. bp's two nominated directors to the Rosneft board stepped down from that date and submitted letters of resignation. As a result, bp’s management considers that the group no longer has significant influence over Rosneft, as defined by IFRS, from that date. Following the loss of significant influence, bp’s equity accounting of its investment ceased from that date and the investment will be accounted for as an investment in an equity instrument measured at fair value, as described under 'Financial assets' below, instead. No share of Rosneft's oil and natural gas reserves will be reported going forward. See Note 37 Events after the reporting period for further information. Aker BP bp owned 27.85% of the voting shares of Aker BP at 31 December 2021 and significant influence was presumed. On completion of Aker BP's acquisition of Lundin Energy, which remains subject to shareholder and regulatory approval, bp expects its interest to be diluted to 15.9% of the voting shares of Aker BP as a result of new Aker BP shares being issued as partial consideration to Lundin Energy shareholders. bp’s group chief financial officer, Murray Auchincloss, has been a member of the Aker BP board since 2017. bp’s other nominated director, Kate Thomson has been a member of the Aker BP board since formation of that company in 2016. She is also a member of the Aker BP board’s Audit and Risk Committee. These memberships are not expected to change following the transaction. bp also holds the voting rights at general meetings of shareholders conferred by its stake in Aker BP. bp's management considers, therefore, that the group will retain significant influence, as defined by IFRS, over Aker BP following the acquisition of Lundin Energy. As a consequence of this judgement, bp has classified $0.6 billion as an asset held for sale, reflecting the highly probable deemed disposal of a part of bp’s equity accounted interest as a result of the transaction. If significant influence was not present following completion, the carrying amount of bp’s entire interest in Aker BP would be classified as an asset held for sale. |
The equity method of accounting
Under the equity method, an investment is carried on the balance sheet at cost plus post-acquisition changes in the group’s share of net assets of the entity, less distributions received and less any impairment in value of the investment. Loans advanced to equity-accounted entities that have the characteristics of equity financing are also included in the investment on the group balance sheet. The group income statement reflects the group’s share of the results after tax of the equity-accounted entity, adjusted to account for depreciation, amortization and any impairment of the equity-accounted entity’s assets based on their fair values at the date of acquisition. The group statement of comprehensive income includes the group’s share of the equity-accounted entity’s other comprehensive income. The group’s share of amounts recognized directly in equity by an equity-accounted entity is recognized in the group’s statement of changes in equity.
Financial statements of equity-accounted entities are prepared for the same reporting year as the group. Where material differences arise in the accounting policies used by the equity-accounted entity and those used by bp, adjustments are made to those financial statements to bring the accounting policies used into line with those of the group.
Unrealized gains on transactions, apart from those that meet the definition of a derivative, between the group and its equity-accounted entities are eliminated to the extent of the group’s interest in the equity-accounted entity.
The group assesses investments in equity-accounted entities for impairment whenever there is objective evidence that the investment is impaired. If any such objective evidence of impairment exists, the carrying amount of the investment is compared with its recoverable amount, being the higher of its fair value less costs of disposal and value in use. If the carrying amount exceeds the recoverable amount, the investment is written down to its recoverable amount.
Segmental reporting
The group’s operating segments are established on the basis of those components of the group that are evaluated regularly by the chief executive officer, bp’s chief operating decision maker, in deciding how to allocate resources and in assessing performance.
The accounting policies of the operating segments are the same as the group’s accounting policies described in this note, except that IFRS requires that the measure of profit or loss disclosed for each operating segment is the measure that is provided regularly to the chief operating decision maker. For bp, this measure of profit or loss is replacement cost profit before interest and tax which reflects the replacement cost of inventories sold in the period and is arrived at by excluding inventory holding gains and losses from profit before interest and tax. Replacement cost profit for the group is not a recognized measure under IFRS. For further information see Note 4. bp changed its segmental reporting from 1 January 2021, see ‘change in segmentation’ below.
| | | | | | | | | | | | | | |
| | bp Annual Report and Form 20-F 2021 | | 181 |
1. Significant accounting policies, judgements, estimates and assumptions – continued
Foreign currency translation
In individual subsidiaries, joint ventures and associates, transactions in foreign currencies are initially recorded in the functional currency of those entities at the spot exchange rate on the date of the transaction. Monetary assets and liabilities denominated in foreign currencies are retranslated into the functional currency at the spot exchange rate on the balance sheet date. Any resulting exchange differences are included in the income statement, unless hedge accounting is applied. Non-monetary items, other than those measured at fair value, are not retranslated subsequent to initial recognition.
In the consolidated financial statements, the assets and liabilities of non-US dollar functional currency subsidiaries, joint ventures, associates, and related goodwill, are translated into US dollars at the spot exchange rate on the balance sheet date. The results and cash flows of non-US dollar functional currency subsidiaries, joint ventures and associates are translated into US dollars using average rates of exchange. In the consolidated financial statements, exchange adjustments arising when the opening net assets and the profits for the year retained by non-US dollar functional currency subsidiaries, joint ventures and associates are translated into US dollars are recognized in a separate component of equity and reported in other comprehensive income. Exchange gains and losses arising on long-term intra-group foreign currency borrowings used to finance the group’s non-US dollar investments are also reported in other comprehensive income if the borrowings form part of the net investment in the subsidiary, joint venture or associate. On disposal or for certain partial disposals of a non-US dollar functional currency subsidiary, joint venture or associate, the related accumulated exchange gains and losses recognized in equity are reclassified from equity to the income statement.
Non-current assets held for sale
Non-current assets and disposal groups classified as held for sale are measured at the lower of carrying amount and fair value less costs to sell.
Significant non-current assets and disposal groups are classified as held for sale if their carrying amounts will be recovered through a sale transaction rather than through continuing use. This condition is regarded as met only when the sale is highly probable and the asset or disposal group is available for immediate sale in its present condition subject only to terms that are usual and customary for sales of such assets. Management must be committed to the sale, which should be expected to qualify for recognition as a completed sale within one year from the date of classification as held for sale, and actions required to complete the plan of sale should indicate that it is unlikely that significant changes to the plan will be made or that the plan will be withdrawn.
Property, plant and equipment and intangible assets are not depreciated or amortized, and equity accounting of associates and joint ventures is ceased once classified as held for sale.
Intangible assets
Intangible assets, other than goodwill, include expenditure on the exploration for and evaluation of oil and natural gas resources, computer software, patents, licences and trademarks and are stated at the amount initially recognized, less accumulated amortization and accumulated impairment losses.
Intangible assets are carried initially at cost unless acquired as part of a business combination. Any such asset is measured at fair value at the date of the business combination and is recognized separately from goodwill if the asset is separable or arises from contractual or other legal rights.
Intangible assets with a finite life, other than capitalized exploration and appraisal costs as described below, are amortized on a straight-line basis over their expected useful lives. For patents, licences and trademarks, expected useful life is the shorter of the duration of the legal agreement and economic useful life, and can range from three to fifteen years. Computer software costs generally have a useful life of three to five years.
The expected useful lives of assets and the amortization method are reviewed on an annual basis and, if necessary, changes in useful lives or the amortization method are accounted for prospectively.
Oil and natural gas exploration and appraisal expenditure
Oil and natural gas exploration and appraisal expenditure is accounted for using the principles of the successful efforts method of accounting as described below.
Licence and property acquisition costs
Exploration licence and leasehold property acquisition costs are capitalized within intangible assets and are reviewed at each reporting date to confirm that there is no indication that the carrying amount exceeds the recoverable amount. This review includes confirming that exploration drilling is still under way or planned or that it has been determined, or work is under way to determine, that the discovery is economically viable based on a range of technical and commercial considerations, and sufficient progress is being made on establishing development plans and timing. If no future activity is planned, the remaining balance of the licence and property acquisition costs is written off. Lower value licences are pooled and amortized on a straight-line basis over the estimated period of exploration. Upon internal approval for development and recognition of proved or sanctioned probable reserves of oil and natural gas, the relevant expenditure is transferred to property, plant and equipment.
Exploration and appraisal expenditure
Geological and geophysical exploration costs are recognized as an expense as incurred. Costs directly associated with an exploration well are initially capitalized as an intangible asset until the drilling of the well is complete and the results have been evaluated. These costs include employee remuneration, materials and fuel used, rig costs and payments made to contractors. If potentially commercial quantities of hydrocarbons are not found, the exploration well costs are written off. If hydrocarbons are found and, subject to further appraisal activity, are likely to be capable of commercial development, the costs continue to be carried as an asset. If it is determined that development will not occur, that is, the efforts are not successful, then the costs are expensed.
Costs directly associated with appraisal activity undertaken to determine the size, characteristics and commercial potential of a reservoir following the initial discovery of hydrocarbons, including the costs of appraisal wells where hydrocarbons were not found, are initially capitalized as an intangible asset. Upon internal approval for development and recognition of proved or sanctioned probable reserves, the relevant expenditure is transferred to property, plant and equipment. If development is not approved and no further activity is expected to occur, then the costs are expensed.
The determination of whether potentially economic oil and natural gas reserves have been discovered by an exploration well is usually made within one year of well completion, but can take longer, depending on the complexity of the geological structure. Exploration wells that discover potentially economic quantities of oil and natural gas and are in areas where major capital expenditure (e.g. an offshore platform or a pipeline) would be required before production could begin, and where the economic viability of that major capital expenditure depends on the successful completion of further exploration or appraisal work in the area, remain capitalized on the balance sheet as long as such work is under way or firmly planned.
| | | | | | | | | | | | | | |
182 | | bp Annual Report and Form 20-F 2021 | | |
1. Significant accounting policies, judgements, estimates and assumptions – continued
| | |
Significant judgement: exploration and appraisal intangible assets Judgement is required to determine whether it is appropriate to continue to carry costs associated with exploration wells and exploratory-type stratigraphic test wells on the balance sheet. This includes costs relating to exploration licences or leasehold property acquisitions. It is not unusual to have such costs remaining suspended on the balance sheet for several years while additional appraisal drilling and seismic work on the potential oil and natural gas field is performed or while the optimum development plans and timing are established. The costs are carried based on the current regulatory and political environment or any known changes to that environment. All such carried costs are subject to regular technical, commercial and management review on at least an annual basis to confirm the continued intent to develop, or otherwise extract value from, the discovery. Where this is no longer the case, the costs are immediately expensed. The carrying amount of capitalized costs are included in Note 7. |
Property, plant and equipment
Property, plant and equipment owned by the group is stated at cost, less accumulated depreciation and accumulated impairment losses. The initial cost of an asset comprises its purchase price or construction cost, any costs directly attributable to bringing the asset into the location and condition necessary for it to be capable of operating in the manner intended by management, the initial estimate of any decommissioning obligation, if applicable, and, for assets that necessarily take a substantial period of time to get ready for their intended use, directly attributable general or specific finance costs. The purchase price or construction cost is the aggregate amount paid and the fair value of any other consideration given to acquire the asset.
Expenditure on major maintenance refits or repairs comprises the cost of replacement assets or parts of assets, inspection costs and overhaul costs. Where an asset or part of an asset that was separately depreciated is replaced and it is probable that future economic benefits associated with the item will flow to the group, the expenditure is capitalized and the carrying amount of the replaced asset is derecognized. Inspection costs associated with major maintenance programmes are capitalized and amortized over the period to the next inspection. Overhaul costs for major maintenance programmes, and all other maintenance costs are expensed as incurred.
Expenditure on the construction, installation and completion of infrastructure facilities such as platforms, pipelines and the drilling of development wells, including service and unsuccessful development or delineation wells, is capitalized within property, plant and equipment and is depreciated from the commencement of production.
Oil and natural gas properties, including certain related pipelines, are depreciated using a unit-of-production method. The cost of producing wells is amortized over proved developed reserves. Licence acquisition, common facilities and future decommissioning costs are amortized over total proved reserves. The unit-of-production rate for the depreciation of common facilities takes into account expenditures incurred to date, together with estimated future capital expenditure expected to be incurred relating to as yet undeveloped reserves expected to be processed through these common facilities. Information on the carrying amounts of the group’s oil and natural gas properties, together with the amounts recognized in the income statement as depreciation, depletion and amortization is contained in Note 11 and Note 4 respectively.
Estimates of oil and natural gas reserves determined in accordance with US Securities and Exchange Commission (SEC) regulations, including the application of prices using 12-month historical price data in assessing the commerciality of technical volumes, are typically used to calculate depreciation, depletion and amortization charges for the group’s oil and gas properties. Therefore, where this approach is adopted, charges are not dependent on management forecasts of future oil and gas prices.
However, for certain oil and natural gas assets, the use of reserves determined in accordance with SEC regulations would result in a charge that is not reflective of the pattern in which the future economic benefits are expected to be consumed. In these limited instances other approaches are applied to determine the reserves base used to calculate depreciation, depletion and amortization, including the use of management’s best estimate of price assumptions as disclosed in Significant judgements and estimates: recoverability of asset carrying values, to determine the commerciality of technical proved reserves.
The impact of changes in estimated proved reserves is dealt with prospectively by amortizing the remaining carrying value of the asset over the expected future production.
The estimation of oil and natural gas reserves and bp’s process to manage reserves bookings is described in Supplementary information on oil and natural gas on page 254, which is unaudited. Details on bp’s proved reserves and production compliance and governance processes are provided on page 348. The 2021 movements in proved reserves are reflected in the tables showing movements in oil and natural gas reserves by region in Supplementary information on oil and natural gas (unaudited) on page 254.
Other property, plant and equipment is depreciated on a straight-line basis over its expected useful life. The typical useful lives of the group’s other property, plant and equipment on initial recognition are as follows:
| | | | | |
Land improvements | 15 to 25 years |
Buildings | 20 to 50 years |
Refineries | 20 to 30 years |
Pipelines | 10 to 50 years |
Service stations | 15 years |
Office equipment | 3 to 10 years |
Fixtures and fittings | 5 to 15 years |
The expected useful lives and depreciation method of property, plant and equipment are reviewed on an annual basis and, if necessary, changes in useful lives or the depreciation method are accounted for prospectively. An item of property, plant and equipment is derecognized upon disposal or when no future economic benefits are expected to arise from the continued use of the asset. Any gain or loss arising on derecognition of the asset (calculated as the difference between the net disposal proceeds and the carrying amount of the item) is included in the income statement in the period in which the item is derecognized.
| | | | | | | | | | | | | | |
| | bp Annual Report and Form 20-F 2021 | | 183 |
1. Significant accounting policies, judgements, estimates and assumptions – continued
Impairment of property, plant and equipment, intangible assets, and goodwill
The group assesses assets or groups of assets, called cash-generating units (CGUs), for impairment whenever events or changes in circumstances indicate that the carrying amount of an asset or CGU may not be recoverable; for example, changes in the group’s business plans, plans to dispose rather than retain assets, changes in the group’s assumptions about commodity prices, low plant utilization, evidence of physical damage or, for oil and gas assets, significant downward revisions of estimated reserves or increases in estimated future development expenditure or decommissioning costs. If any such indication of impairment exists, the group makes an estimate of the asset’s or CGU’s recoverable amount. Individual assets are grouped into CGUs for impairment assessment purposes at the lowest level at which there are identifiable cash flows that are largely independent of the cash flows of other groups of assets. A CGU’s recoverable amount is the higher of its fair value less costs of disposal and its value in use. If it is probable that the value of the CGU will be primarily recovered through a disposal transaction, the expected disposal proceeds are considered in determining the recoverable amount. Where the carrying amount of a CGU exceeds its recoverable amount, the CGU is considered impaired and is written down to its recoverable amount.
The business segment plans, which are approved on an annual basis by senior management, are the primary source of information for the determination of value in use. They contain forecasts for oil and natural gas production, refinery throughputs, sales volumes for various types of refined products (e.g. gasoline and lubricants), revenues, costs and capital expenditure. Carbon taxes and costs of emissions allowances are included in estimates of future cash flows, where applicable, based on the regulatory environment in each jurisdiction in which the group operates. As an initial step in the preparation of these plans, various assumptions regarding market conditions, such as oil prices, natural gas prices, refining margins, refined product margins and cost inflation rates are set by senior management. These assumptions take account of existing prices, global supply-demand equilibrium for oil and natural gas, other macroeconomic factors and historical trends and variability. In assessing value in use, the estimated future cash flows are adjusted for the risks specific to the asset group to the extent that they are not already reflected in the discount rate and are discounted to their present value typically using a pre-tax discount rate that reflects current market assessments of the time value of money.
Fair value less costs of disposal is the price that would be received to sell the asset in an orderly transaction between market participants and does not reflect the effects of factors that may be specific to the group and not applicable to entities in general. In limited circumstances where recent market transactions are not available for reference, discounted cash flow techniques are applied. Where discounted cash flow analyses are used to calculate fair value less costs of disposal, estimates are made about the assumptions market participants would use when pricing the asset, CGU or group of CGUs containing goodwill and the test is performed on a post-tax basis.
An assessment is made at each reporting date as to whether there is any indication that previously recognized impairment losses may no longer exist or may have decreased. If such an indication exists, the recoverable amount is estimated. A previously recognized impairment loss is reversed only if there has been a change in the estimates used to determine the asset’s recoverable amount since the last impairment loss was recognized. If that is the case, the carrying amount of the asset is increased to the lower of its recoverable amount and the carrying amount that would have been determined, net of depreciation, had no impairment loss been recognized for the asset in prior years. Impairment reversals are recognized in profit or loss. After a reversal, the depreciation charge is adjusted in future periods to allocate the asset’s revised carrying amount, less any residual value, on a systematic basis over its remaining useful life.
Goodwill is reviewed for impairment annually or more frequently if events or changes in circumstances indicate the recoverable amount of the group of CGUs to which the goodwill relates should be assessed. In assessing whether goodwill has been impaired, the carrying amount of the group of CGUs to which goodwill has been allocated is compared with its recoverable amount. Where the recoverable amount of the group of CGUs is less than the carrying amount (including goodwill), an impairment loss is recognized. An impairment loss recognized for goodwill is not reversed in a subsequent period.
| | |
Significant judgements and estimates: recoverability of asset carrying values Determination as to whether, and by how much, an asset, CGU, or group of CGUs containing goodwill is impaired involves management estimates on highly uncertain matters such as the effects of inflation and deflation on operating expenses, discount rates, capital expenditure, carbon pricing (where applicable), production profiles, reserves and resources, and future commodity prices, including the outlook for global or regional market supply-and-demand conditions for crude oil, natural gas and refined products. Judgement is required when determining the appropriate grouping of assets into a CGU or the appropriate grouping of CGUs for impairment testing purposes. For example, individual oil and gas properties may form separate CGUs whilst certain oil and gas properties with shared infrastructure may be grouped together to form a single CGU. Alternative groupings of assets or CGUs may result in a different outcome from impairment testing. See Note 13 for details on how these groupings have been determined in relation to the impairment testing of goodwill. As described above, the recoverable amount of an asset is the higher of its value in use and its fair value less costs of disposal. Fair value less costs of disposal may be determined based on expected sales proceeds or similar recent market transaction data. Details of impairment charges and reversals recognized in the income statement are provided in Note 4 and details on the carrying amounts of assets are shown in Note 11, Note 13 and Note 14. The estimates for assumptions made in impairment tests in 2021 relating to discount rates and oil and gas properties are discussed below. Changes in the economic environment including as a result of the energy transition or other facts and circumstances may necessitate revisions to these assumptions and could result in a material change to the carrying values of the group's assets within the next financial year. |
| | | | | | | | | | | | | | |
184 | | bp Annual Report and Form 20-F 2021 | | |
1. Significant accounting policies, judgements, estimates and assumptions – continued
| | |
Discount rates For discounted cash flow calculations, future cash flows are adjusted for risks specific to the CGU. Value-in-use calculations are typically discounted using a pre-tax discount rate based upon the cost of funding the group derived from an established model, adjusted to a pre-tax basis and incorporating a market participant capital structure and country risk premiums. Fair value less costs of disposal discounted cash flow calculations use a post-tax discount rate. The discount rates applied in impairment tests are reassessed each year and, in 2021, the post-tax discount rate was 6% (2020 6%) other than for low carbon energy assets where the risk profile of expected cash flows supported a lower rate of 4%. Where the CGU is located in a country that was judged to be higher risk an additional premium of 1% to 3% was reflected in the post-tax discount rate (2020 1% to 3%). The judgement of classifying a country as higher risk and the applicable premium takes into account various economic and geopolitical factors. The pre-tax discount rate typically ranged from 7% to 15% (2020 7% to 15%) depending on the risk premium and applicable tax rate in the geographic location of the CGU. Oil and natural gas properties For oil and natural gas properties in the oil production & operations and gas & low carbon energy segments, expected future cash flows are estimated using management’s best estimate of future oil and natural gas prices, and production and reserves and certain resources volumes. Forecast cash flows include the impact of all approved emission reduction projects. The estimated future level of production in all impairment tests is based on assumptions about future commodity prices, production and development costs, field decline rates, current fiscal regimes and other factors. In 2021, the group identified oil and gas properties in these segments with carrying amounts totalling $26,341 million (2020 $45,027 million) where the headroom, based on the most recent impairment test performed in the year on those assets, was less than or equal to 20% of the carrying value. A change in the discount rate, reserves, resources or the oil and gas price assumptions in the next financial year may result in a recoverable amount of one or more of these assets above or below the current carrying amount and therefore there is a risk of impairment reversals or charges in that period. Management considers that reasonably possible changes in the discount rate or forecast revenue, arising from a change in oil and natural gas prices and/or production could result in a material change in their carrying amounts within the next financial year, see Sensitivity analyses, below. The recoverability of intangible exploration and appraisal expenditure is covered under Oil and natural gas exploration, appraisal and development expenditure above. Oil and natural gas prices The price assumptions used for value-in-use impairment testing are based on those used for investment appraisal. bp’s carbon emissions cost assumptions and their interrelationship with oil and gas prices are described in 'Judgements and estimates made in assessing the impact of climate change and the transition to a lower carbon economy' on page 178. The investment appraisal price assumptions are recommended by the senior vice president economic & energy insights after considering a range of external price sets, and supply and demand profiles associated with various energy transition scenarios. They are reviewed and approved by management. As a result of the current uncertainty over the pace of transition to lower-carbon supply and demand and the social, political and environmental actions that will be taken to meet the goals of the Paris climate change agreement, the scenarios considered include those where those goals are met as well as those where they are not met. During the year, bp's price assumptions applied in value-in-use impairment testing for Brent oil up to 2030 were increased to reflect near-term supply constraints. bp’s management also expects an acceleration of the pace of transition to a lower carbon economy. As such, the long-term Brent oil assumptions were decreased during the year, reaching $55 per barrel by 2040 and $45 per barrel by 2050 (in 2020 real terms). The price assumptions applied in value-in-use impairment testing for Henry Hub gas were unchanged to those used in 2020 except that the assumption for 2022 was increased to reflect short term market conditions. These price assumptions are derived from the central case investment appraisal assumptions, adjusted where applicable to reflect short-term market conditions (see page 32). A summary of the group’s revised price assumptions for Brent oil and Henry Hub gas, applied in 2021 and 2020, in real 2020 terms, is provided below. The assumptions represent management’s best estimate of future prices at the balance sheet date, which sit within the range of external scenarios considered as appropriate for the purpose. They are considered by bp to be in line with a range of transition paths consistent with the temperature goal of the Paris climate change agreement, of holding the increase in the global average temperature to well below 2°C above pre-industrial levels and pursuing efforts to limit the temperature increase to 1.5°C above pre-industrial levels. However, they do not correspond to any specific Paris-consistent scenario. An inflation rate of 2% (2020 2%) is applied to determine the price assumptions in nominal terms. |
| | | | | | | | | | | | | | | | | | | | |
| 2021 price assumptions | | 2022 | 2025 | 2030 | 2040 | 2050 |
| Brent oil ($/bbl) | | 70 | 60 | 60 | 55 | 45 |
| Henry Hub gas ($/mmBtu) | | 4.00 | 3.00 | 3.00 | 3.00 | 2.75 |
| | | | | | | | | | | | | | | | | | | | |
| 2020 price assumptions | | 2021 | 2025 | 2030 | 2040 | 2050 |
| Brent oil ($/bbl) | | 50 | 50 | 60 | 60 | 50 |
| Henry Hub gas ($/mmBtu) | | 3.00 | 3.00 | 3.00 | 3.00 | 2.75 |
| | | | | | | | | | | | | | |
| | bp Annual Report and Form 20-F 2021 | | 185 |
1. Significant accounting policies, judgements, estimates and assumptions – continued
| | |
The majority of bp’s reserves and resources that support the carrying value of the group’s existing oil and gas properties are expected to be produced over the next 10 years. The oil market continued its rebalancing process in 2021. Brent oil prices averaged $71/bbl in 2021. That is 70% higher than in 2020 and the second highest since 2015. Oil demand rebounded on the back of the economic recovery, supported by the increasing COVID-19 vaccination roll-out and gradual lifting of restrictions. On the supply side, continued active supply management by OPEC+ countries also helped accelerate the rebalancing process. bp's long-term assumption for oil prices is lower than the 2021 price average, based on the judgement that, in the long term, oil demand is likely to fall so that the price levels needed to encourage sufficient investment to meet declining global oil demand is also lower. US gas prices almost doubled in 2021 to $3.9/mmbtu from $2.0/mmbtu in 2020. The higher prices reflect a tighter demand/supply balance for 2021 when compared to 2020. Early in the year, colder weather increased demand and decreased supply resulting in a large draw on storage and therefore the need to replenish it over the summer. Strong global GDP recovery also saw a recovery in LNG exports from the US relative to the shut-ins in 2020. Further, higher coal prices also supported gas prices through competition in the power sector. The level of US gas prices in 2021 is above bp’s long term price assumption based on the judgement of the price level required to incentivize new production. Oil and natural gas reserves In addition to oil and natural gas prices, significant technical and commercial assessments are required to determine the group’s estimated oil and natural gas reserves. Reserves estimates are regularly reviewed and updated. Factors such as the availability of geological and engineering data, reservoir performance data, acquisition and divestment activity and drilling of new wells all impact on the determination of the group’s estimates of its oil and natural gas reserves. bp bases its reserves estimates on the requirement of reasonable certainty with rigorous technical and commercial assessments based on conventional industry practice and regulatory requirements. Reserves assumptions for value-in-use tests reflect the reserves and resources that management currently intend to develop. The recoverable amount of oil and gas properties is determined using a combination of inputs including reserves, resources and production volumes. Risk factors may be applied to reserves and resources which do not meet the criteria to be treated as proved or probable. Sensitivity analyses Management considers discount rates, oil and natural gas prices and production to be the key sources of estimation uncertainty in determining the recoverable amount of upstream oil and gas assets. The sensitivity analyses below, in addition to covering the key sources of estimation uncertainty, also indicate how the energy transition, potential future carbon emissions costs for operational GHG emissions and/or reduced demand for oil and gas may further impact forecast revenue cash inflows to a greater extent than currently anticipated in the group’s value-in-use estimates for oil and gas CGUs, if carbon emissions costs were to be implemented as a deduction against revenue cash flows. The analyses therefore represent a net revenue sensitivity. A change in net revenue from upstream oil and gas properties can arise either due to changes in oil and natural gas prices, carbon emissions costs/carbon prices, changes in oil and natural gas production, or a combination of these. Management tested the impact of a change in net revenue cash flows in value-in-use impairment testing up to a combined effect on net revenue of 20% in all future years. Net revenue reductions of this magnitude in isolation could indicatively lead to a reduction in the carrying amount of bp’s currently held upstream oil and gas properties in the range of $16-17 billion, which is approximately 14-15% of the net book value of property, plant and equipment as at 31 December 2021. If this net revenue reduction was solely due to reductions in oil prices in isolation, it reflects an indicative decrease in the carrying amount of using price assumptions for Brent oil broadly in the middle of the range of prices associated with a pre-publication version (see page 64) of the World Business Council for Sustainable Development (WBCSD) 'family' of scenarios considered to be consistent with limiting global average temperature to 1.5°C above pre-industrial levels. Net revenue increases of this magnitude in isolation could indicatively lead to an increase in the carrying amount of bp’s currently held upstream oil and gas properties in the range of $3-4 billion, which is approximately 3-4% of the net book value of property, plant and equipment as at 31 December 2021. This potential increase in the carrying amount would arise due to reversals of previously recognized impairments and represents approximately half of the total impairment reversal capacity available at 31 December 2021. If this net revenue increase was solely due to increases in oil prices in isolation, it reflects an indicative increase in the carrying amount of using price assumptions for Brent oil broadly at the top end of the range of prices associated with a pre-publication version of the WBCSD 'family' of scenarios considered to be consistent with limiting global average temperature to 1.5°C above pre-industrial levels. These sensitivity analyses do not, however, represent management’s best estimate of any impairment charges or reversals that might be recognized as they do not fully incorporate consequential changes that may arise, such as changes in costs and business plans and phasing of development. For example, costs across the industry are more likely to decrease as oil and natural gas prices fall. The analyses also assume the impact of increases in carbon price on operational GHG emissions are fully absorbed as a decrease in net revenue (and vice versa) rather than reflecting how carbon prices or other carbon emissions costs may ultimately be incorporated by the market. The above sensitivity analyses therefore do not reflect a linear relationship between net revenue and value that can be extrapolated. The interdependency of these inputs and factors plus the diverse characteristics of our upstream oil and gas properties limits the practicability of estimating the probability or extent to which the overall recoverable amount is impacted by changes to the price assumptions or production volumes. Management also tested the impact of a one percentage point change in the discount rate used for value-in-use impairment testing of upstream oil and gas properties. This level of change reflects past experience of a reasonable change in rate that could arise within the next financial year. If the discount rate was one percentage point higher across all tests performed, the net impairment reversal recognized in 2021 would have been approximately $1.3 billion lower. If the discount rate was one percentage point lower, the net impairment reversal recognized would have been approximately $0.6 billion higher. Goodwill Irrespective of whether there is any indication of impairment, bp is required to test annually for impairment of goodwill acquired in business combinations. The group carries goodwill of approximately $12.4 billion on its balance sheet (2020 $12.5 billion), principally relating to the Atlantic Richfield, Burmah Castrol, Devon Energy and Reliance transactions. Of this, $7.6 billion relates to goodwill in the oil production & operations and gas & low carbon energy segments, for which oil and gas price and production assumptions are key sources of estimation uncertainty. Sensitivities and additional information relating to impairment testing of goodwill in these segments are provided in Note 13. |
| | | | | | | | | | | | | | |
186 | | bp Annual Report and Form 20-F 2021 | | |
1. Significant accounting policies, judgements, estimates and assumptions – continued
Inventories
Inventories, other than inventories held for short-term trading purposes, are stated at the lower of cost and net realizable value. Cost is determined by the first-in first-out method and comprises direct purchase costs, cost of production, transportation and manufacturing expenses. Net realizable value is determined by reference to prices existing at the balance sheet date, adjusted where the sale of inventories after the reporting period gives evidence about their net realizable value at the end of the period.
Inventories held for short-term trading purposes are stated at fair value less costs to sell and any changes in fair value are recognized in the income statement.
Supplies are valued at the lower of cost on a weighted-average basis and net realizable value.
Leases
Agreements that convey the right to control the use of an identified asset for a period of time in exchange for consideration are accounted for as leases. The right to control is conveyed if bp has both the right to obtain substantially all of the economic benefits from, and the right to direct the use of, the identified asset throughout the period of use. An asset is identified if it is explicitly or implicitly specified by the agreement and any substitution rights held by the lessor over the asset are not considered substantive.
Agreements that convey the right to control the use of an intangible asset including rights to explore for or use hydrocarbons are not accounted for as leases. See significant accounting policy: intangible assets.
A lease liability is recognized on the balance sheet on the lease commencement date at the present value of future lease payments over the lease term. The discount rate applied is the rate implicit in the lease if readily determinable, otherwise an incremental borrowing rate is used. The incremental borrowing rate is determined based on factors such as the group’s cost of borrowing, lessee legal entity credit risk, currency and lease term. The lease term is the non-cancellable period of a lease together with any periods covered by an extension option that bp is reasonably certain to exercise, or periods covered by a termination option that bp is reasonably certain not to exercise. The future lease payments included in the present value calculation are any fixed payments, payments that vary depending on an index or rate, payments due for the reasonably certain exercise of options and expected residual value guarantee payments. Repayments of principal are presented as financing cash flows and payments of interest are presented as operating cash flows.
Payments that vary based on factors other than an index or a rate such as usage, sales volumes or revenues are not included in the present value calculation and are recognized in the income statement and presented as operating cash flows. The lease liability is recognized on an amortized cost basis with interest expense recognized in the income statement over the lease term, except for where capitalized as exploration, appraisal or development expenditure.
The right-of-use asset is recognized on the balance sheet as property, plant and equipment at a value equivalent to the initial measurement of the lease liability adjusted for lease prepayments, lease incentives, initial direct costs and any restoration obligations. The right-of-use asset is depreciated typically on a straight-line basis over the lease term. The depreciation charge is recognized in the income statement except for where capitalized as exploration, appraisal or development expenditure. Right-of-use assets are assessed for impairment in line with the accounting policy for impairment of property, plant and equipment, intangible assets and goodwill.
Agreements may include both lease and non-lease components. Payments for lease and non-lease components are allocated on a relative stand-alone selling price basis except for leases of retail service stations where the group has elected not to separate non-lease payments from the calculation of the lease liability and right-of-use asset.
If the lease term at commencement of the agreement is less than 12 months, a lease liability and right-of-use asset are not recognized, and a lease expense is recognized in the income statement on a straight-line basis.
If a significant event or change in circumstances, within the control of bp, arises that affects the reasonably certain lease term or there are changes to the lease payments, the present value of the lease liability is remeasured using the revised term and payments, with the right-of-use asset adjusted by an equivalent amount.
Modifications to a lease agreement beyond the original terms and conditions are accounted for as a re-measurement of the lease liability with a corresponding adjustment to the right-of-use asset. Any gain or loss on modification is recognized in the income statement. Modifications that increase the scope of the lease at a price commensurate with the stand-alone selling price are accounted for as a separate new lease.
The group recognizes the full lease liability, rather than its working interest share, for leases entered into on behalf of a joint operation if the group has the primary responsibility for making the lease payments. This may be the case if for example bp, as operator of the joint operation, is the sole signatory to the lease. In such cases, bp’s working interest share of the right-of-use asset is recognized if it is jointly controlled by the group and the other joint operators, and a receivable is recognized for the share of the asset transferred to the other joint operators. If bp is a non-operator, a payable to the operator is recognized if they have the primary responsibility for making the lease payments and bp has joint control over the right-of-use asset, otherwise no balances are recognized.
Financial assets
Financial assets are recognized initially at fair value, normally being the transaction price. In the case of financial assets not measured at fair value through profit or loss, directly attributable transaction costs are also included. The subsequent measurement of financial assets depends on their classification, as set out below. The group derecognizes financial assets when the contractual rights to the cash flows expire or the rights to receive cash flows have been transferred to a third party and either substantially all of the risks and rewards of the asset have been transferred, or substantially all the risks and rewards of the asset have neither been retained nor transferred but control of the asset has been transferred. This includes the derecognition of receivables for which discounting arrangements are entered into.
The group classifies its financial asset debt instruments as measured at amortized cost, fair value through other comprehensive income or fair value through profit or loss. The classification depends on the business model for managing the financial assets and the contractual cash flow characteristics of the financial asset.
Financial assets measured at amortized cost
Financial assets are classified as measured at amortized cost when they are held in a business model the objective of which is to collect contractual cash flows and the contractual cash flows represent solely payments of principal and interest. Such assets are carried at amortized cost using the effective interest method if the time value of money is significant. Gains and losses are recognized in profit or loss when the assets are derecognized or impaired and when interest is recognized using the effective interest method. This category of financial assets includes trade and other receivables.
| | | | | | | | | | | | | | |
| | bp Annual Report and Form 20-F 2021 | | 187 |
1. Significant accounting policies, judgements, estimates and assumptions – continued
Financial assets measured at fair value through other comprehensive income
Financial assets are classified as measured at fair value through other comprehensive income when they are held in a business model the objective of which is both to collect contractual cash flows and sell the financial assets, and the contractual cash flows represent solely payments of principal and interest.
Financial assets measured at fair value through profit or loss
Financial assets are classified as measured at fair value through profit or loss when the asset does not meet the criteria to be measured at amortized cost or fair value through other comprehensive income. Such assets are carried on the balance sheet at fair value with gains or losses recognized in the income statement. Derivatives, other than those designated as effective hedging instruments, are included in this category.
Investments in equity instruments
Investments in equity instruments are subsequently measured at fair value through profit or loss unless an election is made on an instrument-by-instrument basis to recognize fair value gains and losses in other comprehensive income.
Derivatives designated as hedging instruments in an effective hedge
Derivatives designated as hedging instruments in an effective hedge are carried on the balance sheet at fair value. The treatment of gains and losses arising from revaluation is described below in the accounting policy for derivative financial instruments and hedging activities.
Cash equivalents
Cash equivalents are short-term highly liquid investments that are readily convertible to known amounts of cash, are subject to insignificant risk of changes in value and generally have a maturity of three months or less from the date of acquisition. Cash equivalents are classified as financial assets measured at amortized cost or, in the case of certain money market funds, fair value through profit or loss.
Impairment of financial assets measured at amortized cost
The group assesses on a forward-looking basis the expected credit losses associated with financial assets classified as measured at amortized cost at each balance sheet date. Expected credit losses are measured based on the maximum contractual period over which the group is exposed to credit risk. As lifetime expected credit losses are recognized for trade receivables and the tenor of substantially all other in-scope financial assets is less than 12 months there is no significant difference between the measurement of 12-month and lifetime expected credit losses for the group. The measurement of expected credit losses is a function of the probability of default, loss given default and exposure at default. The expected credit loss is estimated as the difference between the asset’s carrying amount and the present value of the future cash flows the group expects to receive discounted at the financial asset’s original effective interest rate. The carrying amount of the asset is adjusted, with the amount of the impairment gain or loss recognized in the income statement.
A financial asset or group of financial assets classified as measured at amortized cost is considered to be credit-impaired if there is reasonable and supportable evidence that one or more events that have a detrimental impact on the estimated future cash flows of the financial asset (or group of financial assets) have occurred. Financial assets are written off where the group has no reasonable expectation of recovering amounts due.
Equity instruments
Instruments are classified as either financial liabilities or as equity in accordance with the substance of the contractual arrangements. Instruments that cannot be settled in the group’s own equity instruments and that include no contractual obligation to deliver cash or another financial asset or to exchange financial assets or financial liabilities with another entity that are potentially unfavourable are classified as equity. Equity instruments issued by the group are recognized at the proceeds received, net of direct issue costs.
Financial liabilities
Financial liabilities are recognized when the group becomes party to the contractual provisions of the instrument. The group derecognizes financial liabilities when the obligation specified in the contract is discharged, cancelled or expired. The measurement of financial liabilities depends on their classification, as follows:
Financial liabilities measured at fair value through profit or loss
Financial liabilities that meet the definition of held for trading are classified as measured at fair value through profit or loss. Such liabilities are carried on the balance sheet at fair value with gains or losses recognized in the income statement. Derivatives, other than those designated as effective hedging instruments, are included in this category.
Derivatives designated as hedging instruments in an effective hedge
Derivatives designated as hedging instruments in an effective hedge are carried on the balance sheet at fair value. The treatment of gains and losses arising from revaluation is described below in the accounting policy for derivative financial instruments and hedging activities.
Financial liabilities measured at amortized cost
All other financial liabilities are initially recognized at fair value, net of directly attributable transaction costs. For interest-bearing loans and borrowings this is typically equivalent to the fair value of the proceeds received, net of issue costs associated with the borrowing.
After initial recognition, other financial liabilities are subsequently measured at amortized cost using the effective interest method. Amortized cost is calculated by taking into account any issue costs and any discount or premium on settlement. Gains and losses arising on the repurchase, settlement or cancellation of liabilities are recognized in interest and other income and finance costs respectively.
This category of financial liabilities includes trade and other payables and finance debt.
| | |
Significant judgement: supplier financing arrangements The group’s trade payables include some supplier arrangements that utilize letter of credit facilities. Judgement is required to assess the payables subject to these arrangements to determine whether they should continue to be classified as trade payables and give rise to operating cash flows or finance debt and financing cash flows. The criteria used in making this assessment include the payment terms for the amount due relative to terms commonly seen in the markets in which bp operates and whether the arrangements significantly change the nature of the liability. Liabilities subject to these arrangements with payment terms of up to approximately 60 days are generally considered to be trade payables and give rise to operating cash flows. See Note 28 - Liquidity risk for further information. |
| | | | | | | | | | | | | | |
188 | | bp Annual Report and Form 20-F 2021 | | |
1. Significant accounting policies, judgements, estimates and assumptions – continued
Financial guarantees
The group issues financial guarantee contracts to make specified payments to reimburse holders for losses incurred because certain associates, joint ventures or third-party entities fail to make payments when due in accordance with the original or modified terms of a debt instrument such as a loan. The liability for a financial guarantee contract is initially measured at fair value and subsequently measured at the higher of the contract’s estimated expected credit loss and the amount initially recognized less, where appropriate, cumulative amortization.
Derivative financial instruments and hedging activities
The group uses derivative financial instruments to manage certain exposures to fluctuations in foreign currency exchange rates, interest rates and commodity prices, as well as for trading purposes. These derivative financial instruments are recognized initially at fair value on the date on which a derivative contract is entered into and subsequently remeasured at fair value. Derivatives are carried as assets when the fair value is positive and as liabilities when the fair value is negative.
Contracts to buy or sell a non-financial item (for example, oil, oil products, gas or power) that can be settled net in cash, with the exception of contracts that were entered into and continue to be held for the purpose of the receipt or delivery of a non-financial item in accordance with the group’s expected purchase, sale or usage requirements, are accounted for as financial instruments. Gains or losses arising from changes in the fair value of derivatives that are not designated as effective hedging instruments are recognized in the income statement.
If, at inception of a contract, the valuation cannot be supported by observable market data, any gain or loss determined by the valuation methodology is not recognized in the income statement but is deferred on the balance sheet and is commonly known as a ‘day-one gain or loss’. This deferred gain or loss is recognized in the income statement over the life of the contract until substantially all the remaining contract term can be valued using observable market data at which point any remaining deferred gain or loss is recognized in the income statement. Changes in valuation subsequent to the initial valuation at inception of a contract are recognized immediately in the income statement.
For the purpose of hedge accounting, hedges are classified as:
•Fair value hedges when hedging exposure to changes in the fair value of a recognized asset or liability.
•Cash flow hedges when hedging exposure to variability in cash flows that is attributable to either a particular risk associated with a recognized asset or liability or a highly probable forecast transaction.
Hedge relationships are formally designated and documented at inception, together with the risk management objective and strategy for undertaking the hedge. The documentation includes identification of the hedging instrument, the hedged item or transaction, the nature of the risk being hedged, the existence at inception of an economic relationship and subsequent measurement of the hedging instrument's effectiveness in offsetting the exposure to changes in the hedged item’s fair value or cash flows attributable to the hedged risk, the hedge ratio and sources of hedge ineffectiveness. Hedges meeting the criteria for hedge accounting are accounted for as follows:
Fair value hedges
The change in fair value of a hedging derivative is recognized in profit or loss. The change in the fair value of the hedged item attributable to the risk being hedged is recorded as part of the carrying value of the hedged item and is also recognized in profit or loss, where it offsets. The group applies fair value hedge accounting when hedging interest rate risk and certain currency risks on fixed rate finance debt.
Fair value hedge accounting is discontinued only when the hedging relationship or a part thereof ceases to meet the qualifying criteria. This includes when the risk management objective changes or when the hedging instrument is sold, terminated or exercised. The accumulated adjustment to the carrying amount of a hedged item at such time is then amortized prospectively to profit or loss as finance interest expense over the hedged item's remaining period to maturity.
Cash flow hedges
The effective portion of the gain or loss on a cash flow hedging instrument is reported in other comprehensive income, while the ineffective portion is recognized in profit or loss. Amounts reported in other comprehensive income are reclassified to the income statement when the hedged transaction affects profit or loss.
Where the hedged item is a highly probably forecast transaction that results in the recognition of a non-financial asset or liability, such as a forecast foreign currency transaction for the purchase of property, plant and equipment, the amounts recognized within other comprehensive income are transferred to the initial carrying amount of the non-financial asset or liability. Where the hedged item is an equity investment, the amounts recognized in other comprehensive income remain in the separate component of equity until the hedged cash flows affect profit or loss or when accounting under the equity method is discontinued. Where the hedged item is recognized directly in profit or loss, the amounts recognized in other comprehensive income are reclassified to production and manufacturing expenses or sales and other operating revenues as appropriate.
Cash flow hedge accounting is discontinued only when the hedging relationship or a part thereof ceases to meet the qualifying criteria. This includes when the designated hedged forecast transaction or part thereof is no longer considered to be highly probable to occur, or when the hedging instrument is sold, terminated or exercised without replacement or rollover. When cash flow hedge accounting is discontinued amounts previously recognized within other comprehensive income remain in equity until the forecast transaction occurs and are reclassified to profit or loss or transferred to the initial carrying amount of a non-financial asset or liability as above. If the forecast transaction is no longer expected to occur, amounts previously recognized within other comprehensive income will be immediately reclassified to profit or loss.
Costs of hedging
The foreign currency basis spread of cross-currency interest rate swaps are excluded from hedge designations and accounted for as costs of hedging. Changes in fair value of the foreign currency basis spread are recognized in other comprehensive income to the extent that they relate to the hedged item. For time-period related hedged items, the amount recognized in other comprehensive income is amortized to profit or loss on a straight line basis over the term of the hedging relationship.
Fair value measurement
Fair value is the price that would be received to sell an asset or paid to transfer a liability in an orderly transaction between market participants. The group categorizes assets and liabilities measured at fair value into one of three levels depending on the ability to observe inputs employed in their measurement. Level 1 inputs are quoted prices in active markets for identical assets or liabilities. Level 2 inputs are inputs that are observable, either directly or indirectly, other than quoted prices included within level 1 for the asset or liability. Level 3 inputs are unobservable inputs for the asset or liability reflecting significant modifications to observable related market data or bp’s assumptions about pricing by market participants.
| | | | | | | | | | | | | | |
| | bp Annual Report and Form 20-F 2021 | | 189 |
1. Significant accounting policies, judgements, estimates and assumptions – continued
| | |
Significant estimate and judgement: derivative financial instruments In some cases the fair values of derivatives are estimated using internal models due to the absence of quoted prices or other observable, market-corroborated data. This primarily applies to the group’s longer-term derivative contracts. The majority of these contracts are valued using models with inputs that include price curves for each of the different products that are built up from available active market pricing data (including volatility and correlation) and modelled using the maximum available external information. Additionally, where limited data exists for certain products, prices are determined using historical and long-term pricing relationships. The use of alternative assumptions or valuation methodologies may result in significantly different values for these derivatives. A reasonably possible change in the price assumptions used in the models relating to index price would not have a material impact on net assets and the Group income statement primarily as a result of offsetting movements between derivative assets and liabilities. For more information, including the carrying amounts of level 3 derivatives, see Note 29. In some cases, judgement is required to determine whether contracts to buy or sell commodities meet the definition of a derivative or to determine appropriate presentation and classification of transactions in certain cases. In particular, contracts to buy and sell LNG are not considered to meet the definition as they are not considered capable of being net settled due to a lack of liquidity in the LNG market and the inability or lack of history of net settlement and so are accounted for on an accruals basis, rather than as a derivative. |
Offsetting of financial assets and liabilities
Financial assets and liabilities are presented gross in the balance sheet unless both of the following criteria are met: the group currently has a legally enforceable right to set off the recognized amounts; and the group intends to either settle on a net basis or realize the asset and settle the liability simultaneously. A right of set off is the group’s legal right to settle an amount payable to a creditor by applying against it an amount receivable from the same counterparty. The relevant legal jurisdiction and laws applicable to the relationships between the parties are considered when assessing whether a current legally enforceable right to set off exists.
Provisions and contingencies
Provisions are recognized when the group has a present legal or constructive obligation as a result of a past event, it is probable that an outflow of resources embodying economic benefits will be required to settle the obligation and a reliable estimate can be made of the amount of the obligation. Where appropriate, the future cash flow estimates are adjusted to reflect risks specific to the liability.
If the effect of the time value of money is material, provisions are determined by discounting the expected future cash flows at a pre-tax risk-free rate that reflects current market assessments of the time value of money. Where discounting is used, the increase in the provision due to the passage of time is recognized within finance costs. Provisions are discounted using a nominal discount rate of 2.0% (2020 2.5%).
Provisions are split between amounts expected to be settled within 12 months of the balance sheet date (current) and amounts expected to be settled later (non-current).
Contingent liabilities are possible obligations whose existence will only be confirmed by future events not wholly within the control of the group, or present obligations where it is not probable that an outflow of resources will be required or the amount of the obligation cannot be measured with sufficient reliability. Contingent liabilities are not recognized in the consolidated financial statements but are disclosed, if material, unless the possibility of an outflow of economic resources is considered remote.
Decommissioning
Liabilities for decommissioning costs are recognized when the group has an obligation to plug and abandon a well, dismantle and remove a facility or an item of plant and to restore the site on which it is located, and when a reliable estimate of that liability can be made. Where an obligation exists for a new facility or item of plant, such as oil and natural gas production or transportation facilities, this liability will be recognized on construction or installation. Similarly, where an obligation exists for a well, this liability is recognized when it is drilled. An obligation for decommissioning may also crystallize during the period of operation of a well, facility or item of plant through a change in legislation or through a decision to terminate operations; an obligation may also arise in cases where an asset has been sold but the subsequent owner is no longer able to fulfil its decommissioning obligations, for example due to bankruptcy. The amount recognized is the present value of the estimated future expenditure determined in accordance with local conditions and requirements. The provision for the costs of decommissioning wells, production facilities and pipelines at the end of their economic lives is estimated using existing technology, at future prices, depending on the expected timing of the activity, and discounted using the nominal discount rate.
An amount equivalent to the decommissioning provision is recognized as part of the corresponding intangible asset (in the case of an exploration or appraisal well) or property, plant and equipment. The decommissioning portion of the property, plant and equipment is subsequently depreciated at the same rate as the rest of the asset. Other than the unwinding of discount on or utilization of the provision, any change in the present value of the estimated expenditure is reflected as an adjustment to the provision and the corresponding asset where that asset is generating or is expected to generate future economic benefits.
Environmental expenditures and liabilities
Environmental expenditures that are required in order for the group to obtain future economic benefits from its assets are capitalized as part of those assets. Expenditures that relate to an existing condition caused by past operations that do not contribute to future earnings are expensed.
Liabilities for environmental costs are recognized when a clean-up is probable and the associated costs can be reliably estimated. Generally, the timing of recognition of these provisions coincides with the commitment to a formal plan of action or, if earlier, on divestment or on closure of inactive sites.
The amount recognized is the best estimate of the expenditure required to settle the obligation. Provisions for environmental liabilities have been estimated using existing technology, at future prices and discounted using a nominal discount rate.
Emissions
Liabilities for emissions are recognized when the cumulative volumes of gases emitted by the group at the end of the reporting period exceed the allowances granted free of charge held for own use or a set baseline for emissions. The provision is measured at the best estimate of the expenditure required to settle the present obligation at the balance sheet date. It is based on the excess of actual emissions over the free allowances held or set baseline in tonnes (or other appropriate quantity) and is valued at the actual cost of any allowances that have been purchased and held for own use on a first-in-first-out (FIFO) basis, and, if insufficient allowances are held, for the remaining requirement on the basis of the spot market price of allowances at the balance sheet date. The cost of allowances purchased to cover a shortfall is recognized separately on the balance sheet as an intangible asset unless the emission allowances acquired or generated by the group are risk-managed by the shipping & trading function, then they are recognized on the balance sheet as inventory.
| | | | | | | | | | | | | | |
190 | | bp Annual Report and Form 20-F 2021 | | |
1. Significant accounting policies, judgements, estimates and assumptions – continued
Restructuring provisions
The reinvent bp programme, expected to reduce headcount by around 10,000 positions, has resulted in recognition of provisions, primarily in the comparative period, where a detailed formal plan exists, and a valid expectation of risk of redundancy has been made to those affected but where the specific outcomes remain uncertain. Where formal redundancy offers have been made, the obligations for those amounts are reported as payables and, if not, as provisions if unpaid at the year-end.
| | |
Significant judgements and estimates: provisions The group holds provisions for the future decommissioning of oil and natural gas production facilities and pipelines at the end of their economic lives. The largest decommissioning obligations facing bp relate to the plugging and abandonment of wells and the removal and disposal of oil and natural gas platforms and pipelines around the world. Most of these decommissioning events are many years in the future and the precise requirements that will have to be met when the removal event occurs are uncertain. Decommissioning technologies and costs are constantly changing, as are political, environmental, safety and public expectations. The timing and amounts of future cash flows are subject to significant uncertainty and estimation is required in determining the amounts of provisions to be recognized. Any changes in the expected future costs are reflected in both the provision and the asset. If oil and natural gas production facilities and pipelines are sold to third parties, judgement is required to assess whether the new owner will be unable to meet their decommissioning obligations, whether bp would then be responsible for decommissioning, and if so the extent of that responsibility. The group has assessed that $0.5 billion of decommissioning provisions should be recognized as at 31 December 2021 (2020 no significant provisions) for assets previously sold to third parties where the sale transferred the decommissioning obligation to the new owner. Decommissioning provisions associated with downstream refineries are generally not recognized, as the potential obligations cannot be measured, given their indeterminate settlement dates. Obligations may arise if refineries cease manufacturing operations and any such obligations would be recognized in the period when sufficient information becomes available to determine potential settlement dates (see Note 32 for further information). The group performs periodic reviews of its downstream refineries for any changes in facts and circumstances including those relating to the energy transition, that might require the recognition of a decommissioning provision. Portfolio strength and flexibility are such that the point of cessation of manufacturing at the group’s operating refineries cannot yet be reliably determined for the purposes of determining a decommissioning provision. The provision for environmental liabilities is estimated based on current legal and constructive requirements, technology, price levels and expected plans for remediation. Actual costs and cash outflows can differ from current estimates because of changes in laws and regulations, public expectations, prices, discovery and analysis of site conditions and changes in clean-up technology. The timing and amount of future expenditures relating to decommissioning and environmental liabilities are reviewed annually. The interest rate used in discounting the cash flows is reviewed quarterly. The nominal interest rate used to determine the balance sheet obligations at the end of 2021 was 2.0% (2020 2.5%), which was based on long-dated US government bonds. The weighted average period over which decommissioning and environmental costs are generally expected to be incurred is estimated to be approximately 17 years (2020 18 years) and 6 years (2020 6 years) respectively. Costs at future prices are determined by applying an inflation rate of 1.5% (2020 1.5%) to decommissioning costs and 2% (2020 2%) for all other provisions. A lower rate is typically applied to decommissioning as certain costs are expected to remain fixed at current or past prices. The estimated phasing of undiscounted cash flows in real terms for upstream decommissioning is approximately $5.3 billion (2020 $3.9 billion) within the next 10 years, $6.9 billion (2020 $7.7 billion) in 10 to 20 years and the remainder of approximately $6.0 billion (2020 $6.0 billion) after 20 years. The timing and amount of decommissioning cash flows are inherently uncertain and therefore the phasing is management’s current best estimate but may not be what will ultimately occur. Further information about the group’s provisions is provided in Note 23. Changes in assumptions in relation to the group's provisions could result in a material change in their carrying amounts within the next financial year. A 0.5 percentage point increase in the nominal discount rate applied could decrease the group’s provision balances by approximately $1.4 billion (2020 $1.2 billion). The pre-tax impact on the group income statement would be a credit of approximately $0.4 billion (2020 $0.3 billion). This level of change reflects past experience of a reasonable change in rate that could arise within the next financial year. The discounting impact on the group's decommissioning provisions for oil and gas properties in the oil productions & operations and gas & low carbon energy segments of a two-year change in the timing of expected future decommissioning expenditures is approximately $0.2 billion (2020 $0.3 billion). Management currently does not consider a change of greater than two years to be reasonably possible in the next financial year. If all expected future decommissioning expenditures were 10% higher, then these decommissioning provisions would increase by approximately $1.6 billion (2020 $1.4 billion) and a pre-tax charge of approximately $0.4 billion (2020 $0.5 billion) would be recognized. As described in Note 32, the group is subject to claims and actions for which no provisions have been recognized. The facts and circumstances relating to particular cases are evaluated regularly in determining whether a provision relating to a specific litigation should be recognized or revised. Accordingly, significant management judgement relating to provisions and contingent liabilities is required, since the outcome of litigation is difficult to predict. |
Employee benefits
Wages, salaries, bonuses, social security contributions, paid annual leave and sick leave are accrued in the period in which the associated services are rendered by employees of the group. Deferred bonus arrangements that have a vesting date more than 12 months after the balance sheet date are valued on an actuarial basis using the projected unit credit method and amortized on a straight-line basis over the service period until the award vests. The accounting policies for share-based payments and for pensions and other post-retirement benefits are described below.
Share-based payments
Equity-settled transactions
The cost of equity-settled transactions with employees is measured by reference to the fair value of the equity instruments on the date on which they are granted and is recognized as an expense over the vesting period, which ends on the date on which the employees become fully entitled to the award. A corresponding credit is recognized within equity. Fair value is determined by using an appropriate, widely used, valuation model. In valuing equity-settled transactions, no account is taken of any vesting conditions, other than conditions linked to the price of the shares of the company (market conditions). Non-vesting conditions, such as the condition that employees contribute to a savings-related plan, are taken into account in the grant-date fair value, and failure to meet a non-vesting condition, where this is within the control of the employee is treated as a cancellation and any remaining .
| | | | | | | | | | | | | | |
| | bp Annual Report and Form 20-F 2021 | | 191 |
1. Significant accounting policies, judgements, estimates and assumptions – continued
unrecognized cost is expensed. For other equity-settled share-based payment transactions, the goods or services received and the corresponding increase in equity are measured at the fair value of the goods or services received unless their fair value cannot be reliably estimated. If the fair value of the goods and services received cannot be reliably estimated, the transaction is measured by reference to the fair value of the equity instruments granted.
Cash-settled transactions
The cost of cash-settled transactions is recognized as an expense over the vesting period, measured by reference to the fair value of the corresponding liability which is recognized on the balance sheet. The liability is remeasured at fair value at each balance sheet date until settlement, with changes in fair value recognized in the income statement.
Pensions and other post-retirement benefits
The cost of providing benefits under the group’s defined benefit plans is determined separately for each plan using the projected unit credit method, which attributes entitlement to benefits to the current period to determine current service cost and to the current and prior periods to determine the present value of the defined benefit obligation. Past service costs, resulting from either a plan amendment or a curtailment (a reduction in future obligations as a result of a material reduction in the plan membership), are recognized immediately when the company becomes committed to a change.
Net interest expense relating to pensions and other post-retirement benefits, which is recognized in the income statement, represents the net change in present value of plan obligations and the value of plan assets resulting from the passage of time, and is determined by applying the discount rate to the present value of the benefit obligation at the start of the year, and to the fair value of plan assets at the start of the year, taking into account expected changes in the obligation or plan assets during the year.
Remeasurements of the defined benefit liability and asset, comprising actuarial gains and losses, and the return on plan assets (excluding amounts included in net interest described above) are recognized within other comprehensive income in the period in which they occur and are not subsequently reclassified to profit and loss.
The defined benefit pension plan surplus or deficit recognized on the balance sheet for each plan comprises the difference between the present value of the defined benefit obligation (using a discount rate based on high quality corporate bonds) and the fair value of plan assets out of which the obligations are to be settled directly. Fair value is based on market price information and, in the case of quoted securities, is the published bid price. Defined benefit pension plan surpluses are only recognized to the extent they are recoverable, either by way of a refund from the plan or reductions in future contributions to the plan.
Contributions to defined contribution plans are recognized in the income statement in the period in which they become payable.
| | |
Significant estimate: pensions and other post-retirement benefits Accounting for defined benefit pensions and other post-retirement benefits involves making significant estimates when measuring the group's pension plan surpluses and deficits. These estimates require assumptions to be made about many uncertainties. Pensions and other post-retirement benefit assumptions are reviewed by management at the end of each year. These assumptions are used to determine the projected benefit obligation at the year end and hence the surpluses and deficits recorded on the group's balance sheet, and pension and other post-retirement benefit expense for the following year. The assumptions that are the most significant to the amounts reported are the discount rate, inflation rate and mortality levels. Assumptions about these variables are based on the environment in each country. The assumptions used vary from year to year, with resultant effects on future net income and net assets. Changes to some of these assumptions, in particular the discount rate and inflation rate, could result in material changes to the carrying amounts of the group's pension and other post-retirement benefit obligations within the next financial year, in particular for the UK, US and Eurozone plans. Any differences between these assumptions and the actual outcome will also affect future net income and net assets. The values ascribed to these assumptions and a sensitivity analysis of the impact of changes in the assumptions on the benefit expense and obligation used are provided in Note 23. |
Income taxes
Income tax expense represents the sum of current tax and deferred tax.
Income tax is recognized in the income statement, except to the extent that it relates to items recognized in other comprehensive income or directly in equity, in which case the related tax is recognized in other comprehensive income or directly in equity.
Current tax is based on the taxable profit for the period. Taxable profit differs from net profit as reported in the income statement because it is determined in accordance with the rules established by the applicable taxation authorities. It therefore excludes items of income or expense that are taxable or deductible in other periods as well as items that are never taxable or deductible. The group’s liability for current tax is calculated using tax rates and laws that have been enacted or substantively enacted by the balance sheet date.
Deferred tax is provided, using the liability method, on temporary differences at the balance sheet date between the tax bases of assets and liabilities and their carrying amounts for financial reporting purposes. Deferred tax liabilities are recognized for all taxable temporary differences except:
•Where the deferred tax liability arises on the initial recognition of goodwill.
•Where the deferred tax liability arises on the initial recognition of an asset or liability in a transaction that is not a business combination, at the time of the transaction, affects neither accounting profit nor taxable profit or loss and, at the time of the transaction, does not give rise to equal taxable and deductible temporary differences.
•In respect of taxable temporary differences associated with investments in subsidiaries and associates and interests in joint arrangements, where the group is able to control the timing of the reversal of the temporary differences and it is probable that the temporary differences will not reverse in the foreseeable future.
Deferred tax assets are recognized for deductible temporary differences, carry-forward of unused tax credits and unused tax losses, to the extent that it is probable that taxable profit will be available against which the deductible temporary differences and the carry-forward of unused tax credits and unused tax losses can be utilized, except where the deferred tax asset relating to the deductible temporary difference arises from the initial recognition of an asset or liability in a transaction that is not a business combination, at the time of the transaction, affects neither accounting profit nor taxable profit or loss and, at the time of the transaction, does not give rise to equal taxable and deductive temporary differences.
| | | | | | | | | | | | | | |
192 | | bp Annual Report and Form 20-F 2021 | | |
1. Significant accounting policies, judgements, estimates and assumptions – continued
In respect of deductible temporary differences associated with investments in subsidiaries and associates and interests in joint arrangements, deferred tax assets are recognized only to the extent that it is probable that the temporary differences will reverse in the foreseeable future and taxable profit will be available against which the temporary differences can be utilized.
The carrying amount of deferred tax assets is reviewed at each balance sheet date and reduced to the extent that it is no longer probable or increased to the extent that it is probable that sufficient taxable profit will be available to allow all or part of the deferred tax asset to be utilized.
Deferred tax assets and liabilities are measured at the tax rates that are expected to apply in the period when the asset is realized or the liability is settled, based on tax rates (and tax laws) that have been enacted or substantively enacted at the balance sheet date. Deferred tax assets and liabilities are not discounted.
Deferred tax assets and liabilities are offset only when there is a legally enforceable right to set off current tax assets against current tax liabilities and when the deferred tax assets and liabilities relate to income taxes levied by the same taxation authority on either the same taxable entity or different taxable entities where there is an intention to settle the current tax assets and liabilities on a net basis or to realize the assets and settle the liabilities simultaneously.
Where tax treatments are uncertain, if it is considered probable that a taxation authority will accept the group's proposed tax treatment, income taxes are recognized consistent with the group's income tax filings. If it is not considered probable, the uncertainty is reflected within the carrying amount of the applicable tax asset or liability using either the most likely amount or an expected value, depending on which method better predicts the resolution of the uncertainty.
The computation of the group’s income tax expense and liability involves the interpretation of applicable tax laws and regulations in many jurisdictions throughout the world. The resolution of tax positions taken by the group, through negotiations with relevant tax authorities or through litigation, can take several years to complete and in some cases it is difficult to predict the ultimate outcome. Therefore, judgement is required to determine whether provisions for income taxes are required and, if so, estimation is required of the amounts that could be payable.
In addition, the group has carry-forward tax losses and tax credits in certain taxing jurisdictions that are available to offset against future taxable profit. However, deferred tax assets are recognized only to the extent that it is probable that taxable profit will be available against which the unused tax losses or tax credits can be utilized. Management judgement is exercised in assessing whether this is the case and estimates are required to be made of the amount of future taxable profits that will be available. Such judgements are inherently impacted by estimates affecting future taxable profits such as oil and natural gas prices and decommissioning expenditure, see significant judgements and estimates: recoverability of asset carrying values and provisions
Management do not assess there to be a significant risk of a material change to the group’s tax provisioning or recognition of deferred tax assets within the next financial year, however the tax position remains inherently uncertain and therefore subject to change. To the extent that actual outcomes differ from management’s estimates, income tax charges or credits, and changes in current and deferred tax assets or liabilities, may arise in future periods. For more information see Note 8 and Note 32.
Judgement is also required when determining whether a particular tax is an income tax or another type of tax (for example a production tax). Accounting for deferred tax is applied to income taxes as described above, but is not applied to other types of taxes; rather such taxes are recognized in the income statement in accordance with the applicable accounting policy such as Provisions and contingencies. No new significant judgements were made in 2021 in this regard.
Customs duties and sales taxes
Customs duties and sales taxes that are passed on or charged to customers are excluded from revenues and expenses. Assets and liabilities are recognized net of the amount of customs duties or sales tax except:
•Customs duties or sales taxes incurred on the purchase of goods and services which are not recoverable from the taxation authority are recognized as part of the cost of acquisition of the asset.
•Receivables and payables are stated with the amount of customs duty or sales tax included.
The net amount of sales tax recoverable from, or payable to, the taxation authority is included within receivables or payables in the balance sheet.
Own equity instruments – treasury shares
The group’s holdings in its own equity instruments are shown as deductions from shareholders’ equity. Treasury shares represent bp shares repurchased and available for specific and limited purposes. For accounting purposes, shares held in Employee Share Ownership Plans (ESOPs) to meet the future requirements of the employee share-based payment plans are treated in the same manner as treasury shares and are, therefore, included in the consolidated financial statements as treasury shares. The cost of treasury shares subsequently sold or reissued is calculated on a weighted-average basis. Consideration, if any, received for the sale of such shares is also recognized in equity. No gain or loss is recognized in the income statement on the purchase, sale, issue or cancellation of equity shares. Shares repurchased under the share buy-back programme which are immediately cancelled are not shown as treasury shares, but are shown as a deduction from the profit and loss account reserve in the group statement of changes in equity.
Revenue and other income
Revenue from contracts with customers is recognized when or as the group satisfies a performance obligation by transferring control of a promised good or service to a customer. The transfer of control of oil, natural gas, natural gas liquids, LNG, petroleum and chemical products, and other items usually coincides with title passing to the customer and the customer taking physical possession. The group principally satisfies its performance obligations at a point in time; the amounts of revenue recognized relating to performance obligations satisfied over time are not significant.
When, or as, a performance obligation is satisfied, the group recognizes as revenue the amount of the transaction price that is allocated to that performance obligation. The transaction price is the amount of consideration to which the group expects to be entitled. The transaction price is allocated to the performance obligations in the contract based on standalone selling prices of the goods or services promised.
Contracts for the sale of commodities are typically priced by reference to quoted prices. Revenue from term commodity contracts is recognized based on the contractual pricing provisions for each delivery. Certain of these contracts have pricing terms based on prices at a point in time after delivery has been made. Revenue from such contracts is initially recognized based on relevant prices at the time of delivery and subsequently adjusted as appropriate. All revenue from these contracts, both that recognized at the time of delivery and that from post-delivery price adjustments, is disclosed as revenue from contracts with customers.
| | | | | | | | | | | | | | |
| | bp Annual Report and Form 20-F 2021 | | 193 |
1. Significant accounting policies, judgements, estimates and assumptions – continued
Sales and purchase of commodities accounted for under IFRS 15 are presented on a gross basis in Revenue from contracts with customers and Purchases respectively. Physically settled derivatives which represent trading or optimization activities are presented net alongside financially settled derivative contracts in Other operating revenues within Sales and other operating income. Certain physically settled sale and purchase derivative contracts which are not part of trading and optimization activities are presented gross within Other operating revenues and Purchases respectively. Changes in the fair value of derivative assets and liabilities prior to physical delivery are also classified as other operating revenues.
Physical exchanges with counterparties in the same line of business in order to facilitate sales to customers are reported net, as are sales and purchases made with a common counterparty, as part of an arrangement similar to a physical exchange.
Where the group acts as agent on behalf of a third party to procure or market energy commodities, any associated fee income is recognized but no purchase or sale is recorded.
Interest income is recognized as the interest accrues (using the effective interest rate, that is, the rate that exactly discounts estimated future cash receipts through the expected life of the financial instrument to the net carrying amount of the financial asset).
Dividend income from investments is recognized when the shareholders’ right to receive the payment is established.
Contract asset and contract liability balances are included within amounts presented for trade receivables and other payables respectively.
Finance costs
Finance costs directly attributable to the acquisition, construction or production of qualifying assets, which are assets that necessarily take a substantial period of time to get ready for their intended use, are added to the cost of those assets until such time as the assets are substantially ready for their intended use. All other finance costs are recognized in the income statement in the period in which they are incurred.
Updates to significant accounting policies
Impact of new International Financial Reporting Standards
bp adopted ‘Interest Rate Benchmark Reform – Phase II' – Amendments to IFRS 9 ‘Financial instruments’, IFRS 16 'Leases' and other IFRSs with effect from 1 January 2021. There are no other new or amended standards or interpretations adopted during the year that have a significant impact on the consolidated financial statements.
‘Interest Rate Benchmark Reform – Phase II’
The replacement of key interest rate benchmarks such as the London Inter-bank Offered Rate (LIBOR) with alternative benchmarks in the US, UK, EU and other territories occurred at the end of 2021 for most benchmarks, with remaining USD LIBOR tenors expected to cease in 2023. bp is primarily exposed to 3 month USD LIBOR that will be available until June 2023.
Amendments to IFRS 9, IFRS 16 and other IFRSs were issued by the IASB in August 2020 to provide practical expedients and reliefs when changes are made to contractual cash flows or hedging relationships because of the transition from Inter-bank Offered Rates to alternative risk-free rates. bp adopted these amendments from 1 January 2021 and they were applied prospectively from that date. See Note 28 for further information.
bp has an internal working group on interest rate benchmark reform to monitor market developments and manage the transition to alternative benchmark rates. The impacts on contracts and arrangements that are linked to interest rate benchmarks, for example, borrowings, leases and derivative contracts, have been assessed and transition plans have either been executed or are being developed. bp is also participating on external committees and task forces dedicated to interest rate benchmark reform.
Impact of new International Financial Reporting Standards - Not yet adopted
The following pronouncements from the IASB have not been adopted by the group in these financial statements as they will only become effective for future financial reporting periods. There are no other standards, amendments or interpretations in issue but not yet adopted that the directors anticipate will have a material effect on the reported income or net assets of the group.
IFRS 17 ' Insurance Contracts'
IFRS 17 'Insurance Contracts' provides a new general model for accounting for contracts where the issuer accepts significant insurance risk from another party and agrees to compensate that party if a future uncertain event adversely affects them. IFRS 17 replaces IFRS 4 'Insurance Contracts' and will be effective for bp for the financial reporting period commencing 1 January 2023. The standard has not yet been endorsed by the UK and the EU. bp's assessment of the impact of IFRS 17 is at an initial stage but it is not expected to have a significant effect on future financial reporting.
Other changes to significant accounting policies
Change in segmentation
During the first quarter of 2021, the group's reportable segments changed consistent with a change in the way that resources are allocated and performance is assessed, from that date, by the chief operating decision maker, who for bp is the chief executive officer. From the first quarter of 2021, the group's reportable segments are gas & low carbon energy, oil production & operations, customers & products, and Rosneft. At 31 December 2020, the group's reportable segments were Upstream, Downstream and Rosneft.
Gas & low carbon energy comprises regions with upstream businesses that predominantly produce natural gas, gas marketing and trading activities and the group's solar, wind and hydrogen businesses. Gas producing regions were previously in the Upstream segment. The group's renewables businesses were previously part of 'Other businesses and corporate'.
Oil production & operations comprises regions with upstream activities that predominantly produce crude oil. These activities were previously in the Upstream segment.
Customers & products comprises the group's customer-focused businesses, spanning convenience and mobility, which includes retail and fuels next-gen offers such as electrification, as well as aviation, midstream and Castrol lubricants. It also includes our oil products businesses, refining & trading. The petrochemicals business is also reported in restated comparative information as part of the customers and products segment up to its sale in December 2020. The customers & products segment is, therefore, substantially unchanged from the former Downstream segment with the exception of the Petrochemicals disposal.
The Rosneft segment was unchanged and continues to include equity-accounted earnings from the group's investment in Rosneft. The group will cease to report Rosneft as a separate segment in the group's financial reporting for 2022. See Note 37 Events after the reporting period.
| | | | | | | | | | | | | | |
194 | | bp Annual Report and Form 20-F 2021 | | |
1. Significant accounting policies, judgements, estimates and assumptions – continued
The segment measure of profit or loss continues to be replacement cost profit or loss before interest and tax, which reflects the replacement cost of supplies by excluding from profit or loss before interest and tax inventory holding gains and losses. See Note 4 for further information.
Comparative information for 2019 and 2020 has been restated in Notes 3, 4 and 13 to reflect the changes in reportable segments. References to segments have also changed in Notes 2, 7, 15 and 27.
Voluntary change in accounting policy - Net presentation of revenues and purchases relating to physically settled derivative contracts from 1 January 2021
bp routinely enters into transactions for the sale and purchase of commodities that are physically settled and meet the definition of a derivative financial instrument. These contracts are within the scope of IFRS 9 and as such, prior to settlement, changes in the fair value of these derivative contracts are presented as gains and losses within other operating revenues. The group previously presented revenues and purchases for such contracts on a gross basis in the income statement upon physical settlement.
These transactions have historically represented a substantial portion of the revenues and purchases reported in the group’s consolidated financial statements. The change in strategic direction of the group supported by organizational changes to implement the strategy from 1 January 2021, resulted in the group determining that the revenue and corresponding purchases relating to such transactions should be presented net, as gains or losses within other operating revenues, from that date. Physically settled derivative contracts were previously presented on a gross basis and included in other operating revenues and purchases; however, under the new accounting policy, such contracts will be presented on a net basis within other operating revenues to the extent that they relate to trading or optimization activities.
Additionally, the group’s trading activity has continued to evolve over time from one of capturing third-party physical trades to provide flow assurance to one with increasing levels of optimization, taking advantage of price volatility and fluctuations in demand and supply, which will continue under the new strategy, further supporting the change in presentation. The new presentation provides reliable and more relevant information for users of the accounts as the group’s revenue recognition is more closely aligned with how management monitors and manages performance of such contracts. Comparative information for sales and other operating revenues and purchases for 2019 and 2020 has been restated as shown in the table below. There is no impact on comparative information for profit before income tax or earnings per share.
The restatements described above have been repeated from the audited consolidated financial statements for the year ended 31 December 2020 on Form 6-K filed with the Securities and Exchange Commission on 31 January 2022 and have been retained to ensure consistency with the consolidated financial statements for the year ended 31 December 2021 filed in the UK.
| | | | | | | | | | | | | | |
| | bp Annual Report and Form 20-F 2021 | | 195 |
1. Significant accounting policies, judgements, estimates and assumptions – continued | | | | | | | | | | | | | | | | | | | | | | | | | | | |
| | | 2020 | 2020 | Impact of net | 2019 | 2019 | Impact of net | | | |
| $ million | | | | Restated | presentation | | Restated | presentation | | | |
| Segment revenues (Note 4) | | | | | | | |
| gas & low carbon energy | | | 18,467 | | 16,275 | | (2,192) | | 28,102 | | 27,045 | | (1,057) | | | | |
| oil production & operations | | | 17,234 | | 17,234 | | — | | 28,702 | | 28,702 | | — | | | | |
| customers & products | | | 162,974 | | 90,744 | | (72,230) | | 250,897 | | 132,864 | | (118,033) | | | | |
| other businesses & corporate | | | 1,666 | | 1,666 | | — | | 1,418 | | 1,418 | | — | | | | |
| | | 200,341 | | 125,919 | | (74,422) | | 309,119 | | 190,029 | | (119,090) | | | | |
| Less: sales and other revenues between segments | | | | | | | | | | | |
| gas & low carbon energy | | | 2,708 | | 2,708 | | — | | 3,097 | | 3,097 | | — | | | | |
| oil production & operations | | | 15,879 | | 15,879 | | — | | 25,870 | | 25,870 | | — | | | | |
| customers & products | | | 158 | | 158 | | — | | 973 | | 973 | | — | | | | |
| other businesses & corporate | | | 1,230 | | 1,230 | | — | | 782 | | 782 | | — | | | | |
| | | 19,975 | | 19,975 | | — | | 30,722 | | 30,722 | | — | | | | |
| External sales and other operating revenues | | | | | | | | | | | |
| gas & low carbon energy | | | 15,759 | | 13,567 | | (2,192) | | 25,005 | | 23,948 | | (1,057) | | | | |
| oil production & operations | | | 1,355 | | 1,355 | | — | | 2,832 | | 2,832 | | — | | | | |
| customers & products | | | 162,816 | | 90,586 | | (72,230) | | 249,924 | | 131,891 | | (118,033) | | | | |
| other businesses & corporate | | | 436 | | 436 | | — | | 636 | | 636 | | — | | | | |
| Total sales and other operating revenues | | | 180,366 | | 105,944 | | (74,422) | | 278,397 | | 159,307 | | (119,090) | | | | |
| Sales and other operating revenues (Note 5) | | | | | | | | | | | |
| Sales and other operating revenues include the following in relation to revenues from contracts with customers: | | | | | | | | | | | |
| Crude oil | | | 5,048 | | 5,048 | | — | | 9,141 | | 9,141 | | — | | | | |
| Oil products | | | 63,564 | | 63,564 | | — | | 102,408 | | 102,408 | | — | | | | |
| Natural gas, LNG and NGLs | | | 12,726 | | 10,762 | | (1,964) | | 18,909 | | 15,156 | | (3,753) | | | | |
| Non-oil products and other revenues from contracts with customers | | | 9,840 | | 9,779 | | (61) | | 12,169 | | 10,838 | | (1,331) | | | | |
| Revenues from contracts with customers | | | 91,178 | | 89,153 | | (2,025) | | 142,627 | | 137,543 | | (5,084) | | | | |
| Other operating revenues | | | 89,188 | | 16,791 | | (72,397) | | 135,770 | | 21,764 | | (114,006) | | | | |
| Total sales and other operating revenues | | | 180,366 | | 105,944 | | (74,422) | | 278,397 | | 159,307 | | (119,090) | | | | |
| | | | | | | | | | | |
| Purchases | | | 132,104 | | 57,682 | | (74,422) | | 209,672 | | 90,582 | | (119,090) | | | | |
| | | | | | | | | | | |
| | | | | | | | | | | |
| | | | | | | | | | | |
| | | | | | | | | | | |
| | | | | | | | | | | |
| | | | | | | | | | | |
| | | | | | | | | | | | | | |
196 | | bp Annual Report and Form 20-F 2021 | | |
2. Non-current assets held for sale
The carrying amount of assets classified as held for sale at 31 December 2021 is $1,652 million (2020 $1,326 million), with associated liabilities of $359 million (2020 $46 million).
oil productions & operations
As announced in August 2021, bp and PetroChina have agreed to establish Basra Energy Company, an incorporated joint venture, intended to own and manage the companies’ interests in the Rumaila field in Iraq. Subject to regulatory and other approvals, the transaction is expected to complete during the first half of 2022. Assets of $1,009 million and associated liabilities of $333 million have been classified as held for sale in the group balance sheet at 31 December 2021.
On 21 December 2021, Aker BP, an associate of bp, announced the proposed acquisition of Lundin Energy for consideration in cash and new Aker BP shares. Subject to regulatory and other approvals, the transaction is expected to complete mid-year 2022. bp currently holds a 27.9% interest in Aker BP. Following the transaction this is expected to become a 15.9% interest in the combined company. $595 million of bp’s investment in AkerBP has therefore been classified as held for sale in the group’s balance sheet.
No transactions have been classified as held for sale during 2021 which were completed by 31 December 2021.
gas & low carbon energy
The assets held for sale balance at 31 December 2020 consists primarily of a 20% participating interest from bp’s 60% participating interest in Block 61 in Oman. As announced on 1 February 2021, bp agreed to sell this interest to PTT Exploration and Production Public Company Limited of Thailand. The sale was approved by Royal Decree on 28 March 2021 and $2.4 billion was received in March 2021.
The total assets and liabilities held for sale at 31 December 2021 and 2020, which are all in gas & low carbon energy and oil productions & operations, are set out in the table below.
| | | | | | | | | | | |
| | | $ million |
| | 2021 | 2020 |
| Property, plant and equipment | | 35 | | 1,099 | |
| Goodwill | | 137 | | 199 | |
| | | |
| Investments in associates | | 632 | | — | |
| | | |
| Inventories | | 152 | | — | |
| | | |
| Trade and other receivables | | 696 | | 28 | |
| Assets classified as held for sale | | 1,652 | | 1,326 | |
| Trade and other payables | | (238) | | (36) | |
| Lease liabilities | | (74) | | — | |
| Provisions | | (47) | | (10) | |
| | | |
| | | |
| Liabilities directly associated with assets classified as held for sale | | (359) | | (46) | |
| | | | | | | | | | | | | | |
| | bp Annual Report and Form 20-F 2021 | | 197 |
3. Disposals and impairment
The following amounts were recognized in the income statement in respect of disposals and impairments.
| | | | | | | | | | | | | | |
| | | | $ million |
| | | 2021 | 2020 | 2019 |
| Gains on sale of businesses and fixed assets | | | | |
| gas & low carbon energy | | 1,034 | | — | | — | |
| oil production & operations | | 869 | | 360 | | 143 | |
| customers & products | | (52) | | 2,320 | | 50 | |
| other businesses & corporate | | 25 | | 194 | | — | |
| | 1,876 | | 2,874 | | 193 | |
| | | | |
| | | | | $ million |
| | | 2021 | 2020 | 2019 |
| Losses on sale of businesses and fixed assets, and closures | | | | |
| gas & low carbon energy | | 1 | | 9 | | 884 | |
| oil production & operations | | 86 | | 375 | | 409 | |
| customers & products | | 142 | | 296 | | 57 | |
| other businesses & corporate | | 1 | | 1 | | 9 | |
| | 230 | | 681 | | 1,359 | |
| Impairment losses | | | | |
| gas & low carbon energy | | 834 | | 6,214 | | 387 | |
| oil production & operations | | 1,617 | | 6,723 | | 6,365 | |
| customers & products | | 962 | | 840 | | 65 | |
| other businesses & corporate | | 63 | | 12 | | 30 | |
| | 3,476 | | 13,789 | | 6,847 | |
| Impairment reversals | | | | |
| gas & low carbon energy | | (2,338) | | (3) | | — | |
| oil production & operations | | (2,479) | | (86) | | (131) | |
| customers & products | | (7) | | — | | — | |
| other businesses & corporate | | (3) | | — | | — | |
| | (4,827) | | (89) | | (131) | |
| Impairment and losses on sale of businesses and fixed assets, and closures | | (1,121) | | 14,381 | | 8,075 | |
Disposals
Disposal proceeds and principal gains and losses on disposals by segment are described below.
| | | | | | | | | | | | | | |
| | | | $ million |
| | 2021 | 2020 | 2019 |
| Proceeds from disposals of fixed assets | | 1,145 | | 491 | | 500 | |
| Proceeds from disposals of businesses, net of cash disposed | | 5,812 | | 4,989 | | 1,701 | |
| | 6,957 | | 5,480 | | 2,201 | |
| By business | | | | |
| gas & low carbon energy | | 2,425 | | 38 | | 565 | |
| oil production & operations | | 3,022 | | 1,157 | | 1,472 | |
| customers & products | | 1,050 | | 3,959 | | 152 | |
| other businesses & corporate | | 460 | | 326 | | 12 | |
| | 6,957 | | 5,480 | | 2,201 | |
Information for 2019 and 2020 has been restated to reflect the changes in reportable segments. For more information see Note 1 Significant accounting policies, judgements, estimates and assumptions - Change in segmentation.
Proceeds from disposals of business in 2021 includes $2,364 million in respect of the disposal of a 20% participating interest in Block 61 in Oman and a further $2,177 million and $872 million in respect of the Alaska and Petrochemicals disposals which concluded in 2020. At 31 December 2021, deferred consideration relating to disposals amounted to $205 million receivable within one year (2020 $1,291 million and 2019 $159 million) and $823 million receivable after one year (2020 $2,402 million and 2019 $125 million). The deferred consideration principally relates to the disposals of our Alaskan business in 2020. In addition, contingent consideration receivable relating to disposals amounted to $1,917 million at 31 December 2021 (2020 $1,999 million and 2019 $598 million). The contingent consideration at 31 December 2021 relates to the prior period disposals of our Alaskan business and certain assets in the North Sea. These amounts of contingent consideration are reported within Other investments on the group balance sheet - see Note 17 for further information.
During the year, the group disposed of a $1,675 million loan note related to the Alaska divestment. As a result of potential partial recourse from the counterparty, the group continues to recognize an asset of $547 million and an associated liability of $598 million, both of which will reduce over time.
Gains and losses on sale of businesses and fixed assets, and closures
gas & low carbon energy
In 2021 gains on disposal of businesses and fixed assets were principally related to a $1,031 million gain on disposal of a 20% participating interest in Block 61 in Oman.
| | | | | | | | | | | | | | |
198 | | bp Annual Report and Form 20-F 2021 | | |
3. Disposals and impairment – continued
In 2019 losses on disposal of businesses and fixed assets were principally in respect of the reclassification of accumulated foreign exchange losses from reserves to the income statement upon the contribution of our Brazilian biofuels business to a new 50:50 joint venture BP Bunge Bioenergia.
oil production & operations
In 2021 gains principally resulted from adjustments to disposals in prior periods. Gains include $171 million from the disposal of a 2.1% interest in Aker BP in the North Sea, $100 million from the disposal of certain exploration assets in Brazil, and $502 million fair value movements in relation to deferred and contingent consideration in relation to prior disposals in Alaska and the North Sea.
In 2020, gains principally resulted from adjustments to disposals in prior periods. Gains include $130 million from the disposal of our Alaska operations and interests and $166 million fair value movements in relation to deferred and contingent consideration in relation to the Alaska disposal and prior disposals in the North Sea. Losses included $134 million fair value movements in relation to deferred and contingent consideration arising from prior period disposals in the North Sea, $120 million in relation to the likely disposal of an exploration asset and $78 million from the disposal of certain properties in the US.
In 2019, losses included $191 million fair value movements in relation to contingent consideration arising from the prior period disposal of the Bruce, Keith and Devenick assets and $171 million in relation to severance costs associated with the divestment of our Alaskan business.
customers & products
In 2020, gains principally resulted from the $2.3 billion gain recognized on the disposal of our Petrochemicals business which completed in December 2020. The gain was adjusted in 2021 as a result of post settlement adjustments. Losses included $229 million in relation to cessation of manufacturing operations at the Kwinana Refinery following the decision to cease fuel production.
other businesses and corporate
In 2020 the gain on disposal of businesses and fixed assets was principally in respect of the sale and leaseback of our St James's Square London headquarters.
Summarized financial information relating to the sale of businesses is shown in the table below.
The principal transaction categorized as a business disposal in 2021 was the sale of a 20% participating interest from bp’s 60% participating interest in Block 61 in Oman. See Note 2 for further information.
The principal transactions categorized as a business disposal in 2020 were the sales of our Petrochemical and Alaskan businesses.
The principal transaction categorized as a business disposal in 2019 was the sale of our interests in the Gulf of Suez oil concessions in Egypt.
| | | | | | | | | | | | | | |
| | | | $ million |
| | | 2021 | 2020 | 2019 |
| | | | |
| Non-current assets | | 1,620 | | 9,092 | | 1,653 | |
| Current assets | | 69 | | 1,539 | | 507 | |
| Non-current liabilities | | (287) | | (1,639) | | (257) | |
| Current liabilities | | (3) | | (782) | | (108) | |
| Total carrying amount of net assets disposed | | 1,399 | | 8,210 | | 1,795 | |
| Recycling of foreign exchange on disposal | | 35 | | (328) | | 880 | |
| Costs on disposal | | (5) | | 13 | | 190 | |
| | 1,429 | | 7,895 | | 2,865 | |
| Gains (losses) on sale of businesses | | 1,632 | | 2,570 | | (1,190) | |
| Total consideration | | 3,061 | | 10,465 | | 1,675 | |
| Non-cash consideration | | (108) | | (219) | | (938) | |
Consideration received (receivable)a | | 2,859 | | (5,257) | | 964 | |
| | | | |
| | | | |
Proceeds from the sale of businesses, net of cash disposedb | | 5,812 | | 4,989 | | 1,701 | |
a In 2019 $633 million relates to deposits received in advance of the disposal of our Alaska business and certain assets in our BPX business.
b Proceeds are stated net of cash and cash equivalents disposed of $2 million (2020 $101 million and 2019 $30 million).
Impairments
Impairment losses and impairment reversals in each segment are described below. For information on significant estimates and judgements made in relation to impairments see Impairment of property, plant and equipment, intangibles and goodwill within Note 1. See also Note 11, and Note 14 for further information on impairments by asset category.
gas & low carbon energy
The 2021 impairment loss of $834 million primarily relates to losses incurred in respect of development assets in the Tortue CGU in Mauritania & Senegal ($819 million) and principally arose as a result of increased forecast future expenditure. The 2021 impairment reversal of $2,338 million primarily relates to reversals in respect of producing assets in the KGD6 CGU in India ($1,229 million) and the Trinidad CGU ($600 million) and principally arose as a result of changes to the group's oil and gas price assumptions and re-assessment of reserves.The recoverable amount of these CGUs on which significant impairment charges or reversals were recognized, based on their value in use, is $7,365 million. The recoverable amount of all CGUs for which impairment charges or reversals were recognized in 2021 in total, based on their value in use, is $17,330 million.
The 2020 impairment loss of $6,214 million primarily relates to losses incurred in respect of producing and development assets in Trinidad ($2,416 million), Mauritania and Senegal ($1,909 million) and India ($1,313 million). Impairment losses were primarily driven by a reduction in bp’s future oil and gas price assumptions and, to a lesser extent, certain technical reserves revisions. The recoverable amount of the impaired CGUs in total was $13,563 million.
The 2019 impairment losses of $387 million related to a number of different assets, with the most significant charges arising in Egypt and Trinidad.
oil production & operations
Impairment losses and reversals in all years relate primarily to producing and midstream assets.
| | | | | | | | | | | | | | |
| | bp Annual Report and Form 20-F 2021 | | 199 |
3. Disposals and impairment – continued
The 2021 impairment loss of $1,617 million principally relates to anticipated portfolio changes ($1,109 million). The 2021 impairment reversals of $2,479 million principally arose as a result of changes to the group’s oil and gas price assumptions and re-assessment of reserves. They include amounts in BPX Energy ($1,356 million) and the North Sea ($950 million). The principal CGU on which a significant impairment reversal was recognized was $982 million for Hawkville in BPX Energy. The recoverable amount of these CGUs on which significant impairment charges or reversals were recognized, based on their value in use, is $6,760 million. The recoverable amount of all CGUs for which impairment charges or reversals were recognized in 2021, based on their value in use, is $16,586 million.
The 2020 impairment loss of $6,723 million primarily relates to losses incurred in respect of producing and development assets in the UK North Sea ($2,796 million), the US ($2,744 million), and Canada ($865 million). Impairment losses were primarily driven by a reduction in bp’s future oil and gas price assumptions and, to a lesser extent, certain technical reserves revisions.
The 2019 impairment losses of $6,365 million related to various assets, with the most significant charges arising in the US. Impairment losses arose primarily as a result of the decision to dispose of certain assets, including $4,703 million in relation to completed and expected disposals in BPX Energy and $1,264 million relating to the expected disposal of our Alaskan business; of these amounts $355 million primarily relates to impairment of associated goodwill.
customers & products
2021 impairment losses of $962 million principally relates to anticipated portfolio changes in the products business ($595 million).
Impairment losses totalling $840 million and $65 million were recognized in 2020 and 2019 respectively. The amount for 2020 principally relates to portfolio changes in the fuels business, including the conversion of Kwinana refinery to an import terminal. None of the impairment charges were individually material.
Other businesses and corporate
Impairment losses totalling $63 million, $12 million, and $30 million were recognized in 2021, 2020 and 2019 respectively.
4. Segmental analysis
During the first quarter of 2021, the group's reportable segments were changed consistent with a change in the way that resources are allocated and performance is assessed from that date, by the chief operating decision maker, who for bp is the chief executive officer. From the first quarter of 2021, the group's reportable segments are gas & low carbon energy, oil production & operations, customers & products, and Rosneft. At 31 December 2020, the group's reportable segments were Upstream, Downstream and Rosneft.
Gas & low carbon energy comprises regions with upstream businesses that predominantly produce natural gas, gas marketing and trading activities and the group's solar, wind and hydrogen businesses. Gas producing regions were previously in the Upstream segment. The group's renewables businesses were previously part of 'Other businesses and corporate'.
Oil production & operations comprises regions with upstream activities that predominantly produce crude oil. These activities were previously in the Upstream segment.
Customers & products comprises the group’s customer-focused businesses, spanning convenience and mobility, which includes fuels retail and next-gen offers such as electrification, as well as aviation, midstream, and Castrol lubricants. It also includes our oil products businesses, refining & trading. The petrochemicals business is reported in restated comparative information as part of the customers and products segment up to its sale in December 2020. The customers & products segment is, therefore, substantially unchanged from the former Downstream segment.
The Rosneft segment was unchanged and continues to include equity-accounted earnings from the group's investment in Rosneft. The group will cease to report Rosneft as a separate segment in the group's financial reporting for 2022. See Note 37 Events after the reporting period.
Other businesses and corporate comprises the group’s shipping and treasury functions, and corporate activities worldwide.
2020 and 2019 have been restated in Notes 4 and 13 to reflect the changes in reportable segments. References to segments have also changed in Notes 2, 7, 15 and 27.
The accounting policies of the operating segments are the same as the group’s accounting policies described in Note 1. However, IFRS requires that the measure of profit or loss disclosed for each operating segment is the measure that is provided regularly to the chief operating decision maker for the purposes of performance assessment and resource allocation. For bp, this measure of profit or loss is replacement cost profit or loss before interest and tax which reflects the replacement cost of supplies by excluding from profit or loss before interest and tax inventory holding gains and lossesa. Replacement cost profit or loss before interest and tax for the group is not a recognized measure under IFRS.
Sales between segments are made at prices that approximate market prices, taking into account the volumes involved. Segment revenues and segment results include transactions between business segments. These transactions and any unrealized profits and losses are eliminated on consolidation, unless unrealized losses provide evidence of an impairment of the asset transferred. Sales to external customers by region are based on the location of the group subsidiary which made the sale. The UK region includes the UK-based international activities of customers & products.
All surpluses and deficits recognized on the group balance sheet in respect of pension and other post-retirement benefit plans are allocated to Other businesses and corporate. However, the periodic expense relating to these plans is allocated to the operating segments based upon the business in which the employees work.
Certain financial information is provided separately for the US as this is an individually material country for bp, and for the UK as this is bp’s country of domicile.
a Inventory holding gains and losses represent the difference between the cost of sales calculated using the replacement cost of inventory and the cost of sales calculated on the first-in first-out (FIFO) method after adjusting for any changes in provisions where the net realizable value of the inventory is lower than its cost. Under the FIFO method, which we use for IFRS reporting, the cost of inventory charged to the income statement is based on its historical cost of purchase or manufacture, rather than its replacement cost. In volatile energy markets, this can have a significant distorting effect on reported income. The amounts disclosed represent the difference between the charge to the income statement for inventory on a FIFO basis (after adjusting for any related movements in net realizable value provisions) and the charge that would have arisen based on the replacement cost of inventory. For this purpose, the replacement cost of inventory is calculated using data from each operation’s production and manufacturing system, either on a monthly basis, or separately for each transaction where the system allows this approach. The amounts disclosed are not separately reflected in the financial statements as a gain or loss. No adjustment is made in respect of the cost of inventories held as part of a trading position and certain other temporary inventory positions.
| | | | | | | | | | | | | | |
200 | | bp Annual Report and Form 20-F 2021 | | |
4. Segmental analysis – continued
| | | | | | | | | | | | | | | | | | | | | | | | | | |
| | | | | | | | $ million |
| | | | | | | | | 2021 |
| By business | | gas & low carbon energy | oil production & operations | customers & products | Rosneft | other
businesses &
corporate | Consolidation adjustment and eliminations | Total
group |
| Segment revenues | | | | | | | | |
| Sales and other operating revenues | | 30,840 | | 24,519 | | 130,095 | | — | | 1,724 | | (29,439) | | 157,739 | |
| Less: sales and other operating revenues between segments | | (4,563) | | (22,408) | | (1,226) | | — | | (1,242) | | 29,439 | | — | |
| Third party sales and other operating revenues | | 26,277 | | 2,111 | | 128,869 | | — | | 482 | | — | | 157,739 | |
| Earnings from joint ventures and associates – after interest and tax | | 426 | | 576 | | 385 | | 2,694 | | (82) | | — | | 3,999 | |
| Segment results | | | | | | | | |
| Replacement cost profit (loss) before interest and taxation | | 2,133 | | 10,501 | | 2,208 | | 2,429 | | (2,777) | | (67) | | 14,427 | |
Inventory holding gains (losses)a | | 33 | | 8 | | 3,355 | | 259 | | — | | — | | 3,655 | |
| Profit (loss) before interest and taxation | | 2,166 | | 10,509 | | 5,563 | | 2,688 | | (2,777) | | (67) | | 18,082 | |
| | | | | | | | |
| Finance costs | | | | | | | | (2,857) | |
| Net finance expense relating to pensions and other post-retirement benefits | | | | | | | | 2 | |
| Profit before taxation | | | | | | | | 15,227 | |
| Other income statement items | | | | | | | | |
| Depreciation, depletion and amortization | | | | | | | | |
| US | | 80 | | 3,174 | | 1,349 | | — | | 94 | | — | | 4,697 | |
| Non-US | | 4,384 | | 3,354 | | 1,651 | | — | | 719 | | — | | 10,108 | |
| Charges for provisions, net of write-back of unused provisions, including change in discount rate | | 173 | | 7 | | 3,063 | | — | | 477 | | — | | 3,720 | |
| Segment assets | | | | | | | | |
| Investments in joint ventures and associates | | 5,224 | | 8,044 | | 3,291 | | 14,354 | | 70 | | — | | 30,983 | |
Additions to non-current assetsb | | 4,963 | | 6,090 | | 3,940 | | — | | 1,007 | | — | | 16,000 | |
a See explanation of inventory holding gains and losses on page 200.
b Includes additions to property, plant and equipment; goodwill; intangible assets; investments in joint ventures; and investments in associates.
| | | | | | | | | | | | | | |
| | bp Annual Report and Form 20-F 2021 | | 201 |
4. Segmental analysis – continued | | | | | | | | | | | | | | | | | | | | | | | | | | |
| | | | | | | | $ million |
| | | | | | | | | 2020 |
| By business | | gas & low carbon energy | oil production & operations | customers & products | Rosneft | other businesses & corporate | Consolidation adjustment and eliminations | Total
group |
| Segment revenues | | | | | | | | |
| Sales and other operating revenues | | 16,275 | | 17,234 | | 90,744 | | — | | 1,666 | | (19,975) | | 105,944 | |
Less: sales and other operating revenues between segments | | (2,708) | | (15,879) | | (158) | | — | | (1,230) | | 19,975 | | — | |
| Third party sales and other operating revenues | | 13,567 | | 1,355 | | 90,586 | | — | | 436 | | — | | 105,944 | |
Earnings from joint ventures and associates – after interest and tax | | (45) | | (327) | | 214 | | (229) | | (16) | | — | | (403) | |
| Segment results | | | | | | | | |
Replacement cost profit (loss) before interest and taxation | | (7,068) | | (14,583) | | 3,418 | | (149) | | (579) | | 89 | | (18,872) | |
Inventory holding gains (losses)a | | 19 | | (2) | | (2,796) | | (89) | | — | | — | | (2,868) | |
| Profit (loss) before interest and taxation | | (7,049) | | (14,585) | | 622 | | (238) | | (579) | | 89 | | (21,740) | |
| | | | | | | | |
| Finance costs | | | | | | | | (3,115) | |
Net finance expense relating to pensions and other post-retirement benefits | | | | | | | | (33) | |
| Profit before taxation | | | | | | | | (24,888) | |
| Other income statement items | | | | | | | | |
| Depreciation, depletion and amortization | | | | | | | | |
| US | | 96 | | 3,700 | | 1,359 | | — | | 39 | | — | | 5,194 | |
| Non-US | | 3,361 | | 4,087 | | 1,631 | | — | | 616 | | — | | 9,695 | |
Charges for provisions, net of write-back of unused provisions, including change in discount rate | | (2) | | 58 | | 1,903 | | — | | 543 | | — | | 2,502 | |
| Segment assets | | | | | | | | |
Investments in joint ventures and associates | | 3,663 | | 8,154 | | 3,671 | | 11,808 | | 41 | | — | | 27,337 | |
Additions to non-current assetsb | | 3,507 | | 5,321 | | 5,359 | | — | | 570 | | — | | 14,757 | |
a See explanation of inventory holding gains and losses on page 200.
b Includes additions to property, plant and equipment; goodwill; intangible assets; investments in joint ventures; and investments in associates.
| | | | | | | | | | | | | | |
202 | | bp Annual Report and Form 20-F 2021 | | |
4. Segmental analysis – continued
| | | | | | | | | | | | | | | | | | | | | | | | | | |
| | | | | | | | $ million |
| | | | | | | | | 2019 |
| By business | | gas & low carbon energy | oil production & operations | customers & products | Rosneft | other businesses & corporate | Consolidation adjustment and eliminations | Total
group |
| Segment revenues | | | | | | | | |
| Sales and other operating revenues | | 27,045 | | 28,702 | | 132,864 | | — | | 1,418 | | (30,722) | | 159,307 | |
Less: sales and other operating revenues between segments | | (3,097) | | (25,870) | | (973) | | — | | (782) | | 30,722 | | — | |
| Third party sales and other operating revenues | | 23,948 | | 2,832 | | 131,891 | | — | | 636 | | — | | 159,307 | |
Earnings from joint ventures and associates – after interest and tax | | 81 | | 518 | | 374 | | 2,295 | | (11) | | — | | 3,257 | |
| Segment results | | | | | | | | |
Replacement cost profit (loss) before interest and taxation | | 2,945 | | 1,049 | | 6,502 | | 2,316 | | (1,848) | | 75 | | 11,039 | |
Inventory holding gains (losses)a | | (6) | | (2) | | 685 | | (10) | | — | | — | | 667 | |
| Profit (loss) before interest and taxation | | 2,939 | | 1,047 | | 7,187 | | 2,306 | | (1,848) | | 75 | | 11,706 | |
| | | | | | | | |
| Finance costs | | | | | | | | (3,489) | |
Net finance expense relating to pensions and other post-retirement benefits | | | | | | | | (63) | |
| Profit before taxation | | | | | | | | 8,154 | |
| Other income statement items | | | | | | | | |
| Depreciation, depletion and amortization | | | | | | | | |
| US | | 79 | | 4,614 | | 1,335 | | — | | 34 | | — | | 6,062 | |
| Non-US | | 5,067 | | 4,552 | | 1,586 | | — | | 513 | | — | | 11,718 | |
Charges for provisions, net of write-back of unused provisions, including change in discount rate | | (9) | | 127 | | 507 | | — | | 560 | | — | | 1,185 | |
| Segment assets | | | | | | | | |
Investments in joint ventures and associates | | 4,695 | | 9,038 | | 3,609 | | 12,927 | | 56 | | — | | 30,325 | |
Additions to non-current assetsb | | 7,609 | | 9,705 | | 4,011 | | — | | 1,288 | | — | | 22,613 | |
a See explanation of inventory holding gains and losses on page 200.
b Includes additions to property, plant and equipment; goodwill; intangible assets; investments in joint ventures; and investments in associates.
| | | | | | | | | | | | | | |
| | | | $ million |
| | | | | 2021 |
| By geographical area | | US | Non-US | Total |
| Revenues | | | | |
Third party sales and other operating revenuesa | | 53,748 | | 103,991 | | 157,739 | |
| Other income statement items | | | | |
| Production and similar taxes | | 108 | | 1,200 | | 1,308 | |
| | | | |
| | | | |
| Non-current assets | | | | |
Non-current assetsb c | | 54,395 | | 108,793 | | 163,188 | |
a Non-US region includes UK $11,248 million
b Non-US region includes UK $19,530 million
c Includes property, plant and equipment; goodwill; intangible assets; investments in joint ventures; investments in associates; and non-current prepayments.
| | | | | | | | | | | | | | |
| | | | $ million |
| | | | | 2020 |
| By geographical area | | US | Non-US | Total |
| Revenues | | | | |
Third party sales and other operating revenuesa | | 27,413 | | 78,531 | | 105,944 | |
| Other income statement items | | | | |
| Production and similar taxes | | 57 | | 638 | | 695 | |
| Non-current assets | | | | |
Non-current assetsb c | | 52,493 | | 108,786 | | 161,279 | |
a Non-US region includes UK $13,836 million.
b Non-US region includes UK $19,583 million.
c Includes property, plant and equipment; goodwill; intangible assets; investments in joint ventures; investments in associates; and non-current prepayments.
| | | | | | | | | | | | | | |
| | bp Annual Report and Form 20-F 2021 | | 203 |
4. Segmental analysis – continued
| | | | | | | | | | | | | | |
| | | | $ million |
| | | | | 2019 |
| By geographical area | | US | Non-US | Total |
| Revenues | | | | |
Third party sales and other operating revenuesa | | 47,951 | | 111,356 | | 159,307 | |
| Other income statement items | | | | |
| Production and similar taxes | | 315 | | 1,232 | | 1,547 | |
| Non-current assets | | | | |
Non-current assetsb c | | 57,757 | | 133,398 | | 191,155 | |
a Non-US region includes UK $17,169 million.
b Non-US region includes UK $22,881 million.
c Includes property, plant and equipment; goodwill; intangible assets; investments in joint ventures; investments in associates; and non-current prepayments.
5. Sales and other operating revenues
| | | | | | | | | | | | | | |
| | | | $ million |
| | 2021 | 2020 | 2019 |
| Crude oil | | 5,483 | | 5,048 | | 9,141 | |
| Oil products | | 101,418 | | 63,564 | | 102,408 | |
| Natural gas, LNG and NGLs | | 24,378 | | 10,762 | | 15,156 | |
| Non-oil products and other revenues from contracts with customers | | 6,082 | | 9,779 | | 10,838 | |
| Revenue from contracts with customers | | 137,361 | | 89,153 | | 137,543 | |
Other operating revenuesa | | 20,378 | | 16,791 | | 21,764 | |
| Total sales and other operating revenues | | 157,739 | | 105,944 | | 159,307 | |
a Principally relates to commodity derivative transactions.
2020 and 2019 amounts have been restated as a result of changes to the presentation of revenues and purchases relating to physically settled derivative contracts effective 1 January 2021. See Note 1 - Voluntary change in accounting policy - Net presentation of revenues and purchases relating to physically settled derivative contracts.
An analysis of third-party sales and other operating revenues by segment and region is provided in Note 4.
The group’s sales to customers of crude oil and oil products were substantially all made by the customers & products segment. The group’s sales to customers of natural gas, LNG and NGLs were made by the gas & low carbon energy segment. A significant majority of the group’s sales of non-oil products and other revenues from contracts with customers were made by the customers & products segment.
6. Income statement analysis
| | | | | | | | | | | | | | |
| | | | $ million |
| | 2021 | 2020 | 2019 |
| Interest and other income | | | | |
| Interest income from | | | | |
| Financial assets measured at amortized cost | | 221 | | 215 | | 371 | |
| Financial assets measured at fair value through profit or loss | | 5 | | 25 | | 49 | |
| Other income | | 355 | | 423 | | 349 | |
| | 581 | | 663 | | 769 | |
Currency exchange losses charged to the income statementa | | 345 | | 38 | | 37 | |
| Expenditure on research and development | | 266 | | 332 | | 364 | |
Costs relating to the Gulf of Mexico oil spill (pre-interest and tax)b | | 70 | | 255 | | 319 | |
| Finance costs | | | | |
| Interest expense on lease liabilities | | 288 | | 337 | | 379 | |
Interest expense on other liabilities measured at amortized costc | | 1,820 | | 2,166 | | 2,410 | |
Capitalized at 2.63% (2020 2.75% and 2019 3.50%)d | | (287) | | (345) | | (374) | |
Losses arising on finance debt risk management activitiese | | 145 | | — | | — | |
| Unwinding of discount on provisions | | 391 | | 437 | | 505 | |
| Unwinding of discount on other payables measured at amortized cost | | 500 | | 520 | | 569 | |
| | 2,857 | | 3,115 | | 3,489 | |
a Excludes exchange gains and losses arising on financial instruments measured at fair value through profit or loss.
b Included within production and manufacturing expenses.
c 2021 includes a loss of $195 million (2020 loss of $158 million) associated with the buyback of finance debt.
d Tax relief on capitalized interest is approximately $66 million (2020 $83 million and 2019 $51 million).
e From 2021 temporary valuation differences associated with the group’s interest rate and foreign currency exchange risk management of finance debt are being presented within finance costs. Previously these were presented within production and manufacturing expenses. Relevant amounts in the comparative periods were not reclassified as the amounts were not material.
| | | | | | | | | | | | | | |
204 | | bp Annual Report and Form 20-F 2021 | | |
7. Exploration for and evaluation of oil and natural gas resources
The following financial information represents the amounts included within the group totals relating to activity associated with the exploration for and evaluation of oil and natural gas resources. All such activity is recorded within the gas & low carbon energy and oil production & operations segments.
For information on significant judgements made in relation to oil and natural gas accounting see Intangible assets in Note 1.
| | | | | | | | | | | | | | |
| | | | $ million |
| | 2021 | 2020 | 2019 |
| Exploration and evaluation costs | | | | |
Exploration expenditure written offa | | 167 | | 9,920 | | 631 | |
Other exploration costs | | 257 | | 360 | | 333 | |
| Exploration expense for the year | | 424 | | 10,280 | | 964 | |
| Impairment losses | | 1 | | 156 | | 2 | |
Intangible assets – exploration and appraisal expenditureb c | | 4,289 | | 4,113 | | 14,091 | |
| Liabilities | | 98 | | 71 | | 73 | |
| Net assets | | 4,191 | | 4,042 | | 14,018 | |
| Cash used in operating activities | | 257 | | 360 | | 333 | |
| Cash used in investing activities | | 260 | | 674 | | 1,215 | |
a 2020 includes $2,643 million in the Gulf of Mexico primarily relating to the Paleogene assets, $2,539 million in Canada primarily relating to Terre de Grace, $2,141 million in Brazil, $952 million in Egypt and $832 million in Angola.
b 2019 includes approximately $2,500 million relating to Canadian oil sands.
c Amount capitalized at 31 December 2021 and 31 December 2020 relates to assets in various regions. The largest of these is approximately $700 million capitalized in the Middle East region (2020 approximately $700 million capitalized in the Middle East Region).
8. Taxation
Tax on profit
| | | | | | | | | | | | | | |
| | | | $ million |
| | | 2021 | 2020 | 2019 |
| Current tax | | | | |
| Charge for the year | | 4,808 | | 2,095 | | 5,316 | |
| Adjustment in respect of prior years | | 138 | | 50 | | (68) | |
| | 4,946 | | 2,145 | | 5,248 | |
| Deferred tax | | | | |
| Origination and reversal of temporary differences in the current year | | 3,366 | | (7,826) | | (1,190) | |
Adjustment in respect of prior yearsa | | (1,572) | | 1,522 | | (94) | |
| | 1,794 | | (6,304) | | (1,284) | |
| Tax charge (credit) on profit or loss | | 6,740 | | (4,159) | | 3,964 | |
a The adjustments in respect of prior years reflect the reassessment of the deferred tax balances for prior periods in light of changes in facts and circumstances during the year; 2021 and 2020 include the impact of the reassessment of deferred tax asset recognition in light of revisions to price assumptions.
In 2021, the total tax charge recognized within other comprehensive income was $1,252 million (2020 $39 million charge and 2019 $227 million charge), primarily comprising the deferred tax impact of the remeasurements of the net pension and other post-retirement benefit liability or asset. See Note 31 for further information.
| | | | | | | | | | | | | | |
| | bp Annual Report and Form 20-F 2021 | | 205 |
8. Taxation – continued
The total tax charge recognized directly in equity was $170 million (2020 $154 million charge and 2019 $37 million charge). 2021 mainly relates to transactions involving non-controlling interests and 2020 principally relates to a non-controlling interest transaction entered into by Rosneft.
Reconciliation of the effective tax rate
The following table provides a reconciliation of the group weighted average statutory corporate income tax rate to the effective tax rate of the group on profit or loss before taxation.
| | | | | | | | | | | | | | |
| | | | $ million |
| | 2021 | 2020 | 2019 |
| Profit (loss) before taxation | | 15,227 | | (24,888) | | 8,154 | |
| Tax charge (credit) on profit or loss | | 6,740 | | (4,159) | | 3,964 | |
| Effective tax rate | | 44% | 17% | 49% |
| | | | |
| | | | % |
Tax rate computed at the weighted average statutory ratea | | 54 | | 31 | | 52 | |
Increase (decrease) resulting from | | | | |
Tax reported in equity-accounted entitiesb c | | (3) | | — | | (4) | |
Adjustments in respect of prior years | | (9) | | (6) | | (2) | |
| Deferred tax not recognized | | 8 | | (3) | | (2) | |
Tax incentives for investment | | (1) | | 1 | | (3) | |
| | | | |
Disposal impactsd | | (4) | | — | | 1 | |
| | | | |
Items not deductible for tax purposes | | 1 | | (3) | | 4 | |
| | | | |
| | | | |
Otherc | | (2) | | (3) | | 3 | |
| Effective tax rate | | 44 | | 17 | | 49 | |
a Calculated based on the statutory corporate income tax rate applicable in the countries in which the group operates, weighted by the profits and losses before tax in the respective countries.
b Includes withholding tax in respect of distributions from equity-accounted entities.
c A minor amendment has been made to 2019 to align with current period presentation. The impact in 2020 is not material.
d 2021 primarily relates to the divestment of a 20% stake in Oman Block 61.
Deferred tax
| | | | | | | | | | | |
| | | $ million |
| Analysis of movements during the year in the net deferred tax (asset) liability | | 2021 | 2020 |
| | | |
| | | |
| | | |
| At 1 January | | (913) | | 5,190 | |
| Exchange adjustments | | 9 | | 55 | |
| Charge (credit) for the year in the income statement | | 1,794 | | (6,304) | |
| Charge for the year in other comprehensive income | | 1,302 | | 48 | |
| Charge for the year in equity | | 170 | | 154 | |
| Acquisitions and disposals | | 8 | | (56) | |
| At 31 December | | 2,370 | | (913) | |
The following table provides an analysis of deferred tax in the income statement and the balance sheet by category of temporary difference:
| | | | | | | | | | | | | | | | | | | | |
| | | | | | $ million |
| | | Income statement | | Balance sheet |
| | | 2021 | 2020 | 2019 | 2021 | 2020 |
| Deferred tax liability | | | | | | |
| Depreciation | | 899 | | (7,295) | | (1,436) | | 16,276 | | 15,361 | |
| Pension plan surpluses | | 105 | | 69 | | (31) | | 3,898 | | 2,691 | |
| Derivative financial instruments | | (33) | | 33 | | 29 | | 24 | | 63 | |
Other taxable temporary differencesa | | 180 | | (32) | | 159 | | 1,782 | | 1,562 | |
| | 1,151 | | (7,225) | | (1,279) | | 21,980 | | 19,677 | |
| Deferred tax asset | | | | | | |
| Depreciation | | (846) | | (849) | | — | | (1,678) | | (849) | |
| Lease liabilities | | (43) | | 286 | | 264 | | (1,128) | | (1,122) | |
| Pension plan and other post-retirement benefit plan deficits | | 119 | | 2 | | 62 | | (1,221) | | (1,548) | |
| Decommissioning, environmental and other provisions | | (744) | | 438 | | (472) | | (7,891) | | (7,155) | |
| Derivative financial instruments | | (9) | | — | | 63 | | (75) | | (25) | |
| Tax credits | | 1,282 | | 310 | | (336) | | (2,359) | | (3,652) | |
| Loss carry forward | | 1,064 | | 543 | | 12 | | (4,202) | | (5,319) | |
| Other deductible temporary differences | | (180) | | 191 | | 402 | | (1,056) | | (920) | |
| | 643 | | 921 | | (5) | | (19,610) | | (20,590) | |
Net deferred tax charge (credit) and net deferred tax (asset) liabilityb | | 1,794 | | (6,304) | | (1,284) | | 2,370 | | (913) | |
Of which – deferred tax liabilities | | | | | 8,780 | | 6,831 | |
– deferred tax assets | | | | | 6,410 | | 7,744 | |
a This category includes deferred tax in respect of temporary differences on unremitted earnings of equity-accounted entities.
b Included within the net deferred tax (asset) liability is a deferred tax asset balance of $3,959 million (2020 $5,471 million) related to the Gulf of Mexico oil spill.
| | | | | | | | | | | | | | |
206 | | bp Annual Report and Form 20-F 2021 | | |
8. Taxation – continued
Of the $6,410 million of deferred tax assets recognized on the group balance sheet at 31 December 2021 (2020 $7,744 million), $6,342 million (2020 $7,659 million) relates to entities that have suffered a loss in either the current or preceding period. This amount is supported by forecasts consistent with bp's future oil and gas price assumptions that indicate sufficient future taxable profits will be available to utilize such assets within any applicable expiry period. For 2021, this mainly includes $2,224 million in the US, $892 million in the UK, $762 million in India and $541 million in Angola (2020 mainly included $3,906 million in the US, $707 million in India, $637 million in Australia and $588 million in Trinidad & Tobago).
A summary of temporary differences, unused tax credits and unused tax losses for which deferred tax has not been recognized is shown in the table below.
| | | | | | | | | | | |
| | | $ billion |
| At 31 December | | 2021 | 2020 |
Unused US state tax lossesa | | 2.5 | | 2.4 | |
Unused tax losses – other jurisdictionsb | | 6.0 | | 6.0 | |
| Unused tax credits | | 28.2 | | 26.9 | |
of which – arising in the UKc | | 24.6 | | 23.0 | |
– arising in the USd | | 3.6 | | 3.9 | |
Deductible temporary differencese | | 49.0 | | 46.1 | |
| Taxable temporary differences associated with investments in subsidiaries and equity-accounted entities | | 0.7 | | 0.8 | |
a For 2021 these losses expire in the period 2022-2041 with applicable tax rates ranging from 3% to 10%.
b The majority of the unused tax losses have no fixed expiry date.
c The UK unused tax credits arise predominantly in overseas branches of UK entities based in jurisdictions with higher statutory corporate income tax rates than the UK. No deferred tax asset has been recognized on these tax credits as they are unlikely to have value in the future; UK taxes on these overseas branches are largely mitigated by double tax relief in respect of overseas tax. These tax credits have no fixed expiry date.
d For 2021 the US unused tax credits expire in the period 2022-2031.
e The majority comprises fixed asset temporary differences in the UK. Substantially all of the temporary differences have no expiry date.
| | | | | | | | | | | | | | |
| | | | $ million |
| Impact of previously unrecognized deferred tax or write-down of deferred tax assets on tax charge | | 2021 | 2020 | 2019 |
| Current tax benefit relating to the utilization of previously unrecognized deferred tax assets | | 331 | | 46 | | 272 | |
| Deferred tax benefit arising from the reversal of a previous write-down of deferred tax assets | | 773 | | 11 | | 96 | |
| Deferred tax benefit relating to the recognition of previously unrecognized deferred tax assets | | 820 | | — | | 364 | |
| Deferred tax expense arising from the write-down of a previously recognized deferred tax asset | | 29 | | 1,622 | | 73 | |
9. Dividends
The quarterly dividend which is expected to be paid on 25 March 2022 in respect of the fourth quarter 2021 is 5.46 cents per ordinary share ($0.3276 per American Depositary Share (ADS)). The corresponding amount in sterling was announced on 15 March 2022.
| | | | | | | | | | | | | | | | | | | | | | | | | | | | | | | | |
| | Pence per share | Cents per share | | | $ million |
| | 2021 | 2020 | 2019 | 2021 | 2020 | 2019 | 2021 | 2020 | 2019 |
| Dividends announced and paid in cash | | | | | | | | | | |
| Preference shares | | | | | | | | 2 | | 1 | | 1 | |
| Ordinary shares | | | | | | | | | | |
| March | | 3.7684 | | 8.1558 | | 7.7382 | | 5.25 | | 10.50 | | 10.25 | | 1,063 | | 2,102 | | 1,435 | |
| June | | 3.7118 | | 8.3421 | | 8.0655 | | 5.25 | | 10.50 | | 10.25 | | 1,062 | | 2,119 | | 1,779 | |
| September | | 3.9529 | | 4.0433 | | 8.3475 | | 5.46 | | 5.25 | | 10.25 | | 1,100 | | 1,059 | | 1,656 | |
| December | | 4.1045 | | 3.9169 | | 7.8250 | | 5.46 | | 5.25 | | 10.25 | | 1,077 | | 1,059 | | 2,075 | |
| | 15.5376 | | 24.4581 | | 31.9762 | | 21.42 | | 31.50 | | 41.00 | | 4,304 | | 6,340 | | 6,946 | |
| Dividend announced, paid in March 2022 | | | | | 5.46 | | | | 1,065 | | | |
The amount of unclaimed dividends recognized as a liability in other payables at 31 December 2021 is $62 million (2020 $50 million).
The details of the scrip dividends issued are shown in the table below. The board decided not to offer a scrip dividend alternative in respect of any dividends announced since the third quarter 2019, including the fourth quarter 2021 dividend expected to be paid on 25 March 2022.
| | | | | | | | | | | | | | |
| | 2021 | 2020 | 2019 |
| Number of shares issued (thousand) | | — | | — | | 208,927 | |
| Value of shares issued ($ million) | | — | | — | | 1,387 | |
The financial statements for the year ended 31 December 2021 do not reflect the dividend announced on 8 February 2022 and which is expected to be paid in March 2022; this will be treated as an appropriation of profit in the year ending 31 December 2022.
| | | | | | | | | | | | | | |
| | bp Annual Report and Form 20-F 2021 | | 207 |
10. Earnings per share
| | | | | | | | | | | | | | |
| | | | Cents per share |
| Per ordinary share | | 2021 | 2020 | 2019 |
| Basic earnings per share | | 37.57 | | (100.42) | | 19.84 | |
| Diluted earnings per share | | 37.33 | | (100.42) | | 19.73 | |
| | | | |
| | | | Dollars per share |
Per American Depositary Share (ADS)a | | 2021 | 2020 | 2019 |
| Basic earnings per share | | 2.25 | | (6.03) | | 1.19 | |
| Diluted earnings per share | | 2.24 | | (6.03) | | 1.18 | |
a One ADS is equivalent to six ordinary shares.
Basic earnings per ordinary share amounts are calculated by dividing the profit for the year attributable to bp ordinary shareholders by the weighted average number of ordinary shares outstanding during the year.
The weighted average number of shares outstanding includes certain shares that will be issuable in the future under employee share-based payment plans and excludes treasury shares, which includes shares held by the Employee Share Ownership Plan trusts (ESOPs).
For the diluted earnings per share calculation, the weighted average number of shares outstanding during the year is adjusted for the average number of shares that are potentially issuable in connection with employee share-based payment plans. If the inclusion of potentially issuable shares would decrease loss per share, the potentially issuable shares are excluded from the weighted average number of shares outstanding used to calculate diluted earnings per share.
| | | | | | | | | | | | | | |
| | | | $ million |
| | | 2021 | 2020 | 2019 |
| Profit attributable to bp shareholders | | 7,565 | | (20,305) | | 4,026 | |
| Less: dividend requirements on preference shares | | 2 | | 1 | | 1 | |
| Profit for the year attributable to bp ordinary shareholders | | 7,563 | | (20,306) | | 4,025 | |
| | | | |
| | | | | Shares thousand |
| | | 2021 | 2020 | 2019 |
| Basic weighted average number of ordinary shares | | 20,128,862 | | 20,221,514 | | 20,284,859 | |
Potential dilutive effect of ordinary shares issuable under employee share-based payment plans | | 131,526 | | — | | 114,811 | |
| Weighted average number of ordinary shares outstanding used to calculate diluted earnings per share | | 20,260,388 | | 20,221,514 | | 20,399,670 | |
| | | | |
| | | | | Shares thousand |
| | | 2021 | 2020 | 2019 |
| Basic weighted average number of ordinary shares – ADS equivalent | | 3,354,810 | | 3,370,252 | | 3,380,809 | |
Potential dilutive effect of ordinary shares (ADS equivalent) issuable under employee share-based payment plans | | 21,921 | | — | | 19,136 | |
| Weighted average number of ordinary shares (ADS equivalent) outstanding used to calculate diluted earnings per share | | 3,376,731 | | 3,370,252 | | 3,399,945 | |
The number of ordinary shares outstanding at 31 December 2021, excluding treasury shares, and including certain shares that will be issuable in the future under employee share-based payment plans was 19,642,221,041. Between 31 December 2021 and 1 March 2022, the latest practicable date before the completion of these financial statements, there was a net decrease of 217,722,532 of ordinary shares primarily as a result of share buy backs.
Employee share-based payment plans
The group operates share and share option plans for directors and certain employees to obtain ordinary shares and ADSs in the company. Information on these plans for directors is shown in the Directors remuneration report on pages 116-141.
The following table shows the number of shares potentially issuable under equity-settled employee share option plans, including the number of options outstanding, the number of options exercisable at the end of each year, and the corresponding weighted average exercise prices. The dilutive effect of these plans at 31 December is also shown.
| | | | | | | | | | | | | | | | | |
| Share options | | | 2021 | | 2020 |
| | Number of optionsa b thousand | Weighted average
exercise price $ | Number of optionsa b thousand | Weighted average
exercise price $ |
| Outstanding | | 590,961 | | 4.26 | | 28,171 | | 3.79 | |
| Exercisable | | 1,080 | | 4.73 | | 1,874 | | 5.02 | |
| Dilutive effect | | 3,588 | | n/a | 2,497 | | n/a |
a Numbers of options shown are ordinary share equivalents (one ADS is equivalent to six ordinary shares).
b At 31 December 2021 the quoted market price of one bp ordinary share was £3.31 (2020 £2.55).
In addition, the group operates a number of equity-settled employee share plans under which share units are granted to the group’s senior leaders and certain other employees. These plans typically have a three-year performance or restricted period during which the units accrue net notional dividends which are treated as having been reinvested. Leaving employment will normally preclude the conversion of units into shares, but special arrangements apply for participants that leave for qualifying reasons. The number of shares that are expected to vest each year under employee share plans are shown in the table below. The dilutive effect of the employee share plans at 31 December is also shown.
| | | | | | | | | | | | | | |
208 | | bp Annual Report and Form 20-F 2021 | | |
10. Earnings per share – continued
| | | | | | | | | | | |
| Share plans | | 2021 | 2020 |
| | Number of sharesa | Number of sharesa |
| Vesting | | thousand | thousand |
| Within one year | | 92,210 | | 87,517 | |
| 1 to 2 years | | 149,077 | | 85,720 | |
| 2 to 3 years | | 179,449 | | 147,097 | |
| 3 to 4 years | | 109,265 | | 749 | |
| Over 4 years | | 928 | | 349 | |
| | 530,929 | | 321,432 | |
| Dilutive effect | | 152,899 | | 104,068 | |
a Numbers of shares shown are ordinary share equivalents (one ADS is equivalent to six ordinary shares).
There has been a net decrease of 15,265,059 in the number of potential ordinary shares relating to employee share-based payment plans between 31 December 2021 and 1 March 2022.
| | | | | | | | | | | | | | |
| | bp Annual Report and Form 20-F 2021 | | 209 |
11. Property, plant and equipment (PP&E)
| | | | | | | | | | | | | | | | | | | | | | | | | | | | | |
| | | | | | | | | $ million |
| | Land and land improvements | Buildings | Oil and gas propertiesa | Plant, machinery and equipment | Fittings, fixtures and office equipment | Transportation | Oil depots, storage tanks and service stations | Total |
| Cost - owned PP&E | | | | | | | | | |
| At 1 January 2021 | | 3,872 | | 1,210 | | 214,323 | | 42,914 | | 2,418 | | 3,049 | | 10,276 | | 278,062 | |
| Exchange adjustments | | (205) | | (19) | | — | | (736) | | (31) | | (16) | | (627) | | (1,634) | |
| Additions | | 68 | | 59 | | 7,931 | | 2,187 | | 171 | | 40 | | 762 | | 11,218 | |
| Acquisitions | | — | | — | | — | | 1 | | — | | — | | — | | 1 | |
| | | | | | | | | |
| Transfers from intangible assets | | — | | — | | 38 | | — | | — | | — | | — | | 38 | |
| Reclassified as assets held for sale | | — | | — | | (7,399) | | — | | — | | — | | — | | (7,399) | |
| Deletions and disposals | | (22) | | (5) | | (6,859) | | (329) | | (327) | | (40) | | (170) | | (7,752) | |
| At 31 December 2021 | | 3,713 | | 1,245 | | 208,034 | | 44,037 | | 2,231 | | 3,033 | | 10,241 | | 272,534 | |
| Depreciation - owned PP&E | | | | | | | | | |
| At 1 January 2021 | | 692 | | 631 | | 140,551 | | 20,031 | | 1,845 | | 2,381 | | 5,786 | | 171,917 | |
| Exchange adjustments | | (29) | | (10) | | — | | (370) | | (21) | | (12) | | (373) | | (815) | |
| Charge for the year | | 48 | | 36 | | 10,193 | | 1,502 | | 158 | | 71 | | 523 | | 12,531 | |
| | | | | | | | | |
| Impairment losses | | 4 | | — | | 2,340 | | 937 | | — | | 12 | | 4 | | 3,297 | |
| Impairment reversals | | — | | (3) | | (4,794) | | — | | — | | (30) | | — | | (4,827) | |
| | | | | | | | | |
| Reclassified as assets held for sale | | — | | — | | (7,399) | | — | | — | | — | | — | | (7,399) | |
| Deletions and disposals | | (9) | | — | | (6,341) | | (259) | | (190) | | (34) | | (157) | | (6,990) | |
| At 31 December 2021 | | 706 | | 654 | | 134,550 | | 21,841 | | 1,792 | | 2,388 | | 5,783 | | 167,714 | |
| Owned PP&E - net book amount at 31 December 2021 | | 3,007 | | 591 | | 73,484 | | 22,196 | | 439 | | 645 | | 4,458 | | 104,820 | |
Right-of-use assets - net book amount at 31 December 2021b | | — | | 1,331 | | 32 | | 617 | | 15 | | 2,513 | | 3,574 | | 8,082 | |
| Total PP&E - net book amount at 31 December 2021 | | 3,007 | | 1,922 | | 73,516 | | 22,813 | | 454 | | 3,158 | | 8,032 | | 112,902 | |
| Cost - owned PP&E | | | | | | | | | |
| At 1 January 2020 | | 3,609 | | 1,422 | | 214,352 | | 46,724 | | 2,532 | | 3,474 | | 8,694 | | 280,807 | |
| Exchange adjustments | | 219 | | 6 | | — | | 801 | | 33 | | 8 | | 603 | | 1,670 | |
| Additions | | 101 | | 63 | | 6,922 | | 1,539 | | 586 | | 49 | | 864 | | 10,124 | |
| Acquisitions | | 89 | | — | | — | | 35 | | 5 | | 9 | | 376 | | 514 | |
| | | | | | | | | |
| Transfers from intangible assets | | — | | — | | 605 | | — | | — | | — | | — | | 605 | |
| Reclassified as assets held for sale | | — | | — | | (1,425) | | — | | — | | — | | — | | (1,425) | |
| Deletions and disposals | | (146) | | (281) | | (6,131) | | (6,185) | | (738) | | (491) | | (261) | | (14,233) | |
| At 31 December 2020 | | 3,872 | | 1,210 | | 214,323 | | 42,914 | | 2,418 | | 3,049 | | 10,276 | | 278,062 | |
| Depreciation - owned PP&E | | | | | | | | | |
| At 1 January 2020 | | 581 | | 697 | | 124,766 | | 21,527 | | 2,006 | | 2,744 | | 4,865 | | 157,186 | |
| Exchange adjustments | | 35 | | 6 | | — | | 424 | | 26 | | 9 | | 379 | | 879 | |
| Charge for the year | | 113 | | 46 | | 10,068 | | 1,312 | | 170 | | 77 | | 740 | | 12,526 | |
| | | | | | | | | |
| Impairment losses | | 8 | | 9 | | 11,705 | | 744 | | 2 | | 4 | | 3 | | 12,475 | |
| Impairment reversals | | — | | (1) | | (83) | | — | | — | | (5) | | — | | (89) | |
| | | | | | | | | |
| Reclassified as assets held for sale | | — | | — | | (326) | | — | | — | | — | | — | | (326) | |
| Deletions and disposals | | (45) | | (126) | | (5,579) | | (3,976) | | (359) | | (448) | | (201) | | (10,734) | |
| At 31 December 2020 | | 692 | | 631 | | 140,551 | | 20,031 | | 1,845 | | 2,381 | | 5,786 | | 171,917 | |
| Owned PP&E - net book amount at 31 December 2020 | | 3,180 | | 579 | | 73,772 | | 22,883 | | 573 | | 668 | | 4,490 | | 106,145 | |
Right-of-use assets - net book amount at 31 December 2020b | | — | | 1,254 | | 77 | | 792 | | 21 | | 2,855 | | 3,692 | | 8,691 | |
| Total PP&E - net book amount at 31 December 2020 | | 3,180 | | 1,833 | | 73,849 | | 23,675 | | 594 | | 3,523 | | 8,182 | | 114,836 | |
| | | | | | | | | |
| Assets under construction included above | | | | | | | | | |
| At 31 December 2021 | | | | | | | | | 19,704 | |
| At 31 December 2020 | | | | | | | | | 17,259 | |
| Depreciation charge for the year on right-of-use assets | | | | | | | | | |
| 2021 | | | 209 | | 27 | | 279 | | 10 | | 844 | | 613 | | 1,982 | |
| 2020 | | | 192 | | 43 | | 637 | | 10 | | 829 | | 579 | | 2,290 | |
a For information on significant estimates and judgements made in relation to the estimation of oil and natural reserves see Property, plant and equipment within Note 1.
b $203 million (2020 $284 million) of drilling rig right-of-use assets and $2,230 million (2020 $2,521 million) of shipping vessel right-of-use assets are included in Plant, machinery and equipment and Transportation respectively.
| | | | | | | | | | | | | | |
210 | | bp Annual Report and Form 20-F 2021 | | |
12. Capital commitments
Authorized future capital expenditure for property, plant and equipment (excluding right-of-use assets) by group companies for which contracts had been signed at 31 December 2021 amounted to $8,208 million (2020 $8,009 million, 2019 $11,382 million). bp has contracted capital commitments amounting to $1,075 million (2020 $1,087 million, 2019 $77 million) in relation to joint ventures and $126 million (2020 $183 million, 2019 $787 million) in relation to associates. bp’s share of contracted capital commitments of joint ventures amounted to $1,383 million (2020 $900 million, 2019 $1,024 million).
13. Goodwill and impairment review of goodwill
| | | | | | | | | | | |
| | | $ million |
| | 2021 | 2020 |
| Cost | | | |
| At 1 January | | 13,093 | | 12,865 | |
| Exchange adjustments | | (91) | | 184 | |
Acquisitions and other additionsa | | 139 | | 632 | |
| Reclassified as assets held for sale | | (137) | | (199) | |
| Deletions and disposals | | (13) | | (389) | |
| At 31 December | | 12,991 | | 13,093 | |
| Impairment losses | | | |
| At 1 January | | 613 | | 997 | |
| Exchange adjustments | | (1) | | 1 | |
| Impairment losses for the year | | 7 | | 1 | |
| Deletions and disposals | | (1) | | (386) | |
| At 31 December | | 618 | | 613 | |
| Net book amount at 31 December | | 12,373 | | 12,480 | |
| Net book amount at 1 January | | 12,480 | | 11,868 | |
a 2020 principally relates to an acquisition in the US Fuels business.
Impairment review of goodwill
| | | | | | | | | | | |
| | | $ million |
| Goodwill at 31 December | | 2021 | 2020 |
| gas & low carbon energy | | 2,147 | | 2,152 | |
| oil production & operations | | 5,464 | | 5,613 | |
| customers & products | | 4,697 | | 4,660 | |
| other businesses & corporate | | 65 | | 55 | |
| | 12,373 | | 12,480 | |
Information for 2019 and 2020 has been restated to reflect the changes in reportable segments. For more information see Note 1 Significant accounting policies, judgements, estimates and assumptions - Change in segmentation.
Goodwill acquired through business combinations has been allocated to groups of cash-generating units (CGUs) that are expected to benefit from the synergies of the acquisition. For oil production & operations goodwill is allocated to CGUs in aggregate at the segment level, for gas & low carbon energy goodwill is allocated to the hydrocarbon CGUs within the segment. For customers and products, goodwill has been allocated to Castrol, US Fuels, European Fuels and Other.
For information on significant estimates and judgements made in relation to impairments see Impairment of property, plant and equipment, intangible assets and goodwill in Note 1.
gas & low carbon energy and oil production & operations
As a result of the change in bp’s reporting segments on 1 January 2021, a review of the level at which goodwill is allocated and monitored for impairment testing purposes was required. Oil and gas properties CGUs were allocated to the new segments based on whether they predominantly produce oil or gas. No individual CGUs were split between the new segments and the existing CGUs remained unchanged. Legacy upstream goodwill was allocated to the two groups of CGUs allocated to the new segments based on the relative aggregate recoverable value of each group. An impairment test was performed on the goodwill balances allocated to the oil production & operations and the gas & low carbon energy segments at 1 January 2021 after the change in segments; no impairment of either goodwill balance was identified as a result thereof.
| | | | | | | | | | | | | | | | | | | | |
| | | $ million | | | $ million |
| | gas & low carbon energy | | oil production & operations |
| | 2021 | 2020 | | 2021 | 2020 |
Goodwill | | 2,147 | | 2,152 | | | 5,464 | | 5,613 | |
Excess of recoverable amount over carrying amount | | 3,991 | | 3,991 | | | 32,438 | | 27,758 | |
The table above shows the carrying amount of goodwill for the segments at the period end and the excess of the recoverable amount, based on a pre-tax value-in-use calculation, over the carrying amount (headroom) at the date of the most recent test. For oil production & operations the increase in headroom relates to movements due to the passage of time.
No impairment of the goodwill balances in either gas & low carbon energy or oil production & operations was recognized during 2021 (2020 $nil million).
| | | | | | | | | | | | | | |
| | bp Annual Report and Form 20-F 2021 | | 211 |
13. Goodwill and impairment review of goodwill – continued
The value in use for relevant CGUs in both gas & low carbon energy and oil production & operations is based on the cash flows expected to be generated by the projected production profiles up to the expected dates of cessation of production of each field, based on appropriately risked estimates of reserves and resources. Midstream and supply and trading activities and equity-accounted entities are generally not included in the impairment reviews of goodwill, as they do not represent part of the grouping of CGUs to which the goodwill balances relate and which are used to monitor the goodwill balances for internal management purposes. Where such activities form part of wider CGUs to which goodwill relates they are reflected in the test. As the production profile and related cash flows can be estimated from bp’s past experience, management believes that the cash flows generated over the estimated life of field is the appropriate basis upon which to assess goodwill and individual assets for impairment in both gas & low carbon energy and oil & production operations. The estimated date of cessation of production depends on the interaction of a number of variables, such as the recoverable quantities of hydrocarbons, the production profile of the hydrocarbons, the cost of the development of the infrastructure necessary to recover the hydrocarbons, production costs, the contractual duration of the production concession and the selling price of the hydrocarbons produced. As each field has specific reservoir characteristics and economic circumstances, the cash flows of each field are computed using appropriate individual economic models and key assumptions agreed by bp management.
Estimated production volumes and cash flows up to the date of cessation of production on a field-by-field basis, including operating and capital expenditure, are derived from the business segment plans. The production profiles used are consistent with the reserve and resource volumes approved as part of bp’s centrally controlled process for the estimation of proved and probable reserves and total resources.
The average production for the purposes of goodwill impairment testing in the gas & low carbon energy segment over the next 15 years is 261 mmboe per year (2020 275 mmboe per year) and in the oil production and operations segment is 604 mmboe per year (2020 602 mmboe per year). Production assumptions used for the goodwill impairment tests in both gas & low carbon energy and oil production & operations reflect management’s best estimate of future production of the existing portfolio at the time of the calculation. The group’s expectation to reduce upstream hydrocarbon production by around 40% by 2030 from its 2019 baseline is expected to be achieved through future active management and high-grading of the portfolio. Changes in upstream production since 2019 will be included in the best estimates however as the specific future changes to the portfolio are not yet known, these best estimates do not include the full extent of the expected upstream production reductions.
The weighted average pre-tax discount rate used in the review for both segments is 11% (2020 11% for both segments).
The most recent reviews for impairment for the oil production & operations and gas & low carbon energy segments were carried out in the fourth quarter. As permitted by IAS 36, the detailed calculations for recoverable amounts performed in 2020 were used as a basis for the 2021 impairment tests. The recoverable amounts, key assumptions and sensitivity calculations for 2021 are prepared using the remaining future cash flows from the 2020 detailed calculations. The headrooms for 2021 do not represent the headrooms that would result if a test was run in either segment based on discounted future cash flows estimated using 2021 data and assumptions.
The key assumptions used in the value-in-use calculations are oil and natural gas prices, production volumes and the discount rate. The value-in-use calculations have been prepared solely for the purposes of determining whether the goodwill balance were impaired. Estimated future cash flows were prepared on the basis of certain assumptions prevailing at the time of the tests. The actual outcomes may differ from the assumptions made. For example, reserves and resources estimates and production forecasts are subject to revision as further technical information becomes available and economic conditions change. Due to economic developments, regulatory change and emissions reduction activity arising from climate concern and other factors, future commodity prices and other assumptions may differ from the forecasts used in the calculations.
Sensitivities to different variables have been estimated using certain simplifying assumptions. For example, lower oil and gas price or production sensitivities do not fully reflect the specific impacts for each contractual arrangement and will not capture all favourable impacts that may arise from cost deflation or savings. A detailed calculation in either segment at any given price or production profile may, therefore, produce a different result.
Adverse changes in input assumptions applied in respect to assets carried at or close to their value in use, primarily being those assets previously impaired, would have a limited effect on goodwill headrooms, instead resulting in a direct impairment of the particular CGU's net book value. Conversely, a reduction in the value in use of those assets carried at a value below their respective values in use would result in an adverse impact on the relevant goodwill headroom. It is estimated that a 33% (2020 28%) reduction in revenue throughout each year of the remaining life of those assets, either as a result of adverse price or production conditions or a combination of each, would cause the recoverable amount to be equal to the carrying amount of goodwill and related net non-current assets of the oil production and operations segment. For gas & low carbon energy a 20% (2020 20%) reduction would have the same result.
It is estimated that no reasonably possible change in the discount rate would cause the recoverable amount to be equal to the carrying amount of goodwill and related net non-current assets of either segment.
customers & products
| | | | | | | | | | | | | | | | | | | | | | | | | | | | | | | | | | | |
| | | | | | | | | | | $ million |
| | | | | | 2021 | | | | | 2020 |
| | Castrol | US Fuels | European Fuels | Other | Total | Castrol | US Fuels | European Fuels | Other | Total |
| Goodwill | | 2,837 | | 606 | | 862 | | 392 | | 4,697 | | 2,865 | | 606 | | 913 | | 276 | | 4,660 | |
Cash flows for each CGU are derived from the business segment plans, which cover a period of up to five years. To determine the value in use for each of the cash-generating units, cash flows for a period of 10 years are discounted and aggregated with a terminal value. It is estimated that no reasonably possible change in the key assumptions used in the US Fuels and European Fuels goodwill impairment assessments would cause the recoverable amount to be equal to the carrying amount of goodwill and related net non-current assets.
Castrol
As permitted by IAS 36, the detailed calculations of Castrol’s recoverable amount performed in the most recent detailed calculation in 2018 was used as the basis for the tests in 2021 as the criteria of IAS 36 were considered satisfied: the headroom was substantial in 2018; there have been no significant changes in the assets and liabilities; and the likelihood that the recoverable amount would be less than the carrying amount is remote.
The key assumptions to which the calculation of value in use for the Castrol unit is most sensitive are operating unit margins, sales volumes, and discount rate. Operating margin and sales volumes assumptions used in the detailed impairment review of goodwill calculation are consistent with the assumptions used in the Castrol unit’s business plan and values assigned to these key assumptions reflect past experience. A pre-tax discount rate of 9% is applied in the test. No reasonably possible change in any of these key assumptions would cause the unit’s recoverable amount to be equal to the carrying amount of goodwill and related net non-current assets. Cash flows beyond the plan period are extrapolated using a nominal 2.8% growth rate.
| | | | | | | | | | | | | | |
212 | | bp Annual Report and Form 20-F 2021 | | |
14. Intangible assets
| | | | | | | | | | | | | | | | | | | | | | | |
| | | | | | | $ million |
| | | | 2021 | | | 2020 |
| | Exploration and appraisal expenditurea | Other intangibles | Total | Exploration and appraisal expenditurea | Other intangibles | Total |
| Cost | | | | | | | |
| At 1 January | | 14,417 | | 5,622 | | 20,039 | | 15,306 | | 4,900 | | 20,206 | |
| Exchange adjustments | | — | | (137) | | (137) | | — | | 138 | | 138 | |
| Acquisitions | | — | | 47 | | 47 | | — | | 318 | | 318 | |
| Additions | | 409 | | 628 | | 1,037 | | 703 | | 645 | | 1,348 | |
| Transfers to property, plant and equipment | | (38) | | — | | (38) | | (605) | | — | | (605) | |
| | | | | | | |
| Deletions and disposals | | (477) | | (8) | | (485) | | (987) | | (379) | | (1,366) | |
| At 31 December | | 14,311 | | 6,152 | | 20,463 | | 14,417 | | 5,622 | | 20,039 | |
| Amortization | | | | | | | |
| At 1 January | | 10,304 | | 3,642 | | 13,946 | | 1,215 | | 3,452 | | 4,667 | |
| Exchange adjustments | | — | | (86) | | (86) | | — | | 93 | | 93 | |
| Exploration expenditure written off | | 167 | | — | | 167 | | 9,920 | | — | | 9,920 | |
| Charge for the year | | — | | 427 | | 427 | | — | | 372 | | 372 | |
| Impairment losses | | 1 | | 15 | | 16 | | 156 | | 9 | | 165 | |
| | | | | | | |
| | | | | | | |
| Deletions and disposals | | (450) | | (8) | | (458) | | (987) | | (284) | | (1,271) | |
| At 31 December | | 10,022 | | 3,990 | | 14,012 | | 10,304 | | 3,642 | | 13,946 | |
| Net book amount at 31 December | | 4,289 | | 2,162 | | 6,451 | | 4,113 | | 1,980 | | 6,093 | |
| Net book amount at 1 January | | 4,113 | | 1,980 | | 6,093 | | 14,091 | | 1,448 | | 15,539 | |
a For further information see Intangible assets within Note 1 and Note 7.
15. Investments in joint ventures
The following table provides aggregated summarized financial information for the group's joint ventures as it relates to the amounts recognized in the group income statement and on the group balance sheet.
| | | | | | | | | | | | | | | | | | | | |
| | | | | | $ million |
| | | Income statement | | Balance sheet |
| | | Earnings from joint ventures
- after interest and tax | | Investments in joint ventures |
| | 2021 | 2020 | 2019 | 2021 | 2020 |
| Pan American Energy Group | | (217) | | (208) | | 97 | | 4,396 | | 4,613 | |
| Other joint ventures | | 760 | | (94) | | 479 | | 5,586 | | 3,749 | |
| | 543 | | (302) | | 576 | | 9,982 | | 8,362 | |
The joint venture that is material to the group at 31 December 2021 is Pan American Energy Group S.L. bp owns a 50% stake in the joint venture.
bp classifies its investment in Pan American Energy Group S.L. as a joint venture because, per the terms of the shareholders' agreement, bp has joint control over Pan American Energy Group S.L.. Pan American Energy Group S.L is based in Argentina and its functional currency is USD.
| | | | | | | | | | | | | | |
| | bp Annual Report and Form 20-F 2021 | | 213 |
15. Investments in joint ventures – continued
The following table provides summarized financial information relating to Pan American Energy Group. This information is presented on a 100% basis and reflects adjustments made by bp to Pan American Energy Group’s own results in applying the equity method of accounting. bp adjusts Pan American Energy Group’s results for the accounting required under IFRS relating to bp’s purchase of its interest in Pan American Energy Group S.L..
The operational and financial information of Pan American Energy Group S.L. is based on preliminary operational and financial results of Pan American Energy Group S.L. for 2021. Actual results may differ from these amounts.
| | | | | | | | | | | | | | |
| | | | $ million |
| | | | Gross amount |
| | 2021 | 2020 | 2019 |
| Sales and other operating revenues | | 4,394 | | 3,505 | | 5,194 | |
| Profit (loss) before interest and taxation | | 806 | | (366) | | 744 | |
| Finance costs | | 262 | | 250 | | 154 | |
Profit (loss) before taxationa | | 544 | | (616) | | 590 | |
Taxationb | | 978 | | (200) | | 396 | |
| Profit (loss) for the year | | (434) | | (416) | | 194 | |
| Other comprehensive income | | — | | — | | — | |
| Total comprehensive income | | (434) | | (416) | | 194 | |
| Non-current assets | | 14,206 | | 13,988 | | |
Current assetsc | | 1,864 | | 1,885 | | |
| Total assets | | 16,070 | | 15,873 | | |
Current liabilitiesd | | 2,034 | | 1,990 | | |
Non-current liabilitiese | | 5,244 | | 4,657 | | |
| Total liabilities | | 7,278 | | 6,647 | | |
| Net assets | | 8,792 | | 9,226 | | |
| Less: non-controlling interests | | — | | — | | |
| | 8,792 | | 9,226 | | |
a Includes depreciation and amortisation of $930 million (2020 $937 million and 2019 $914 million), interest income of $19 million (2020 $18 million and 2019 $42 million) and interest expense of $262 million (2020 $250 million and 2019 $154 million).
b 2021 net income expense includes a deferred tax charge of $415 million related to a change in the income tax rate.
c Includes cash and cash equivalents of $893 million (2020 $848 million).
d Includes current financial liabilities of $767 million (2020 $1,282 million).
e Includes non-current financial liabilities of $2,132 million (2020 $1,861 million).
The group received dividends, net of withholding tax, of $nil from Pan American Energy Group S.L in 2021 (2020 $18 million and 2019 $70 million). A dividend of $18 million was declared in December 2021 and will be paid in March 2022.
The following table provides aggregated summarized financial information relating to the group’s share of joint ventures.
| | | | | | | | | | | | | | | | | | | | | | | | | | | | | | | | |
| | | | | | | | | | $ million |
| | | | | | | | | | bp share |
| | | | 2021 | | | 2020 | | | 2019 |
| | PAEG | Other | Total | PAEG | Other | Total | PAEG | Other | Total |
| Sales and other operating revenues | | 2,197 | | 9,048 | | 11,245 | | 1,753 | | 8,792 | | 10,545 | | 2,597 | | 11,542 | | 14,139 | |
| Profit (loss) before interest and taxation | | 403 | | 927 | | 1,330 | | (183) | | 32 | | (151) | | 372 | | 604 | | 976 | |
| Finance costs | | 131 | | 58 | | 189 | | 125 | | 76 | | 201 | | 77 | | 32 | | 109 | |
| Profit (loss) before taxation | | 272 | | 869 | | 1,141 | | (308) | | (44) | | (352) | | 295 | | 572 | | 867 | |
| Taxation | | 489 | | 107 | | 596 | | (100) | | 49 | | (51) | | 198 | | 91 | | 289 | |
| Non-controlling interest | | — | | 2 | | 2 | | — | | 1 | | 1 | | — | | 2 | | 2 | |
| Profit (loss) for the year | | (217) | | 760 | | 543 | | (208) | | (94) | | (302) | | 97 | | 479 | | 576 | |
| Other comprehensive income | | — | | 5 | | 5 | | — | | (5) | | (5) | | — | | (6) | | (6) | |
| Total comprehensive income | | (217) | | 765 | | 548 | | (208) | | (99) | | (307) | | 97 | | 473 | | 570 | |
| Non-current assets | | 7,103 | | 7,702 | | 14,805 | | 6,994 | | 5,652 | | 12,646 | | | | |
| Current assets | | 932 | | 2,385 | | 3,317 | | 943 | | 2,481 | | 3,424 | | | | |
| Total assets | | 8,035 | | 10,087 | | 18,122 | | 7,937 | | 8,133 | | 16,070 | | | | |
| Current liabilities | | 1,017 | | 1,272 | | 2,289 | | 995 | | 1,649 | | 2,644 | | | | |
| Non-current liabilities | | 2,622 | | 3,219 | | 5,841 | | 2,329 | | 2,694 | | 5,023 | | | | |
| Total liabilities | | 3,639 | | 4,491 | | 8,130 | | 3,324 | | 4,343 | | 7,667 | | | | |
| Net assets | | 4,396 | | 5,596 | | 9,992 | | 4,613 | | 3,790 | | 8,403 | | | | |
| Less: non-controlling interests | | — | | 5 | | 5 | | — | | 39 | | 39 | | | | |
| | 4,396 | | 5,591 | | 9,987 | | 4,613 | | 3,751 | | 8,364 | | | | |
| | | | | | | | | | |
| Group investment in joint ventures | | | | | | | | | | |
| Group share of net assets (as above) | | 4,396 | | 5,591 | | 9,987 | | 4,613 | | 3,751 | | 8,364 | | | | |
| Loans made by group companies to joint ventures | | — | | (5) | | (5) | | — | | (2) | | (2) | | | | |
| | 4,396 | | 5,586 | | 9,982 | | 4,613 | | 3,749 | | 8,362 | | | | |
| | | | | | | | | | | | | | |
214 | | bp Annual Report and Form 20-F 2021 | | |
15. Investments in joint ventures – continued
Transactions between the group and its joint ventures are summarized below.
| | | | | | | | | | | | | | | | | | | | | | | |
| | | | | | | |
| Sales to joint ventures | | | 2021 | | 2020 | | 2019 |
| Product | | Sales | Amount receivable at
31 December | Sales | Amount receivable at
31 December | Sales | Amount receivable at
31 December |
| LNG, crude oil and oil products, natural gas | | 3,923 | | 292 | | 2,974 | | 180 | | 4,884 | | 431 | |
| | | | | | | |
| | | | | | | |
| Purchases from joint ventures | | | 2021 | | 2020 | | 2019 |
| Product | | Purchases | Amount payable at
31 December | Purchases | Amount
payable at
31 December | Purchases | Amount
payable at
31 December |
LNG, crude oil and oil products, natural gas, refinery operating costs, plant processing fees | | 716 | | 93 | | 959 | | 84 | | 1,812 | | 225 | |
In the normal course of business, bp enters into various arm’s length transactions with joint ventures including fixed price commitments to sell and to purchase commodities, forward sale and purchase contracts and agency agreements.
The terms of the outstanding balances receivable from joint ventures are typically 30 to 45 days. The balances are unsecured and will be settled in cash. There are no significant provisions for doubtful debts relating to these balances and no significant expense recognized in the income statement in respect of bad or doubtful debts. Dividends receivable are not included in the table above.
bp's share of impairment reversals recognized by joint ventures in 2021 was $214 million (2020 charges of $433 million) of which $214 million (2020 $336 million) was in the oil production & operations segment.
16. Investments in associates
The following table provides aggregated summarized financial information for the group’s associates as it relates to the amounts recognized in the group income statement and on the group balance sheet.
| | | | | | | | | | | | | | | | | | | | |
| | | | | | $ million |
| | | Income statement | | Balance sheet |
| | | Earnings from associates
- after interest and tax | | Investments in associates |
| | 2021 | 2020 | 2019 | 2021 | 2020 |
| Rosneft | | 2,694 | | (229) | | 2,295 | | 14,354 | | 11,808 | |
| Other associates | | 762 | | 128 | | 386 | | 6,647 | | 7,167 | |
| | 3,456 | | (101) | | 2,681 | | 21,001 | | 18,975 | |
The associate that is material to the group at both 31 December 2021 and 2020 is Rosneft.
bp owns 19.75% of the voting shares of Rosneft which are listed on the MICEX stock exchange in Moscow and its global depository receipts are listed on the London Stock Exchange. Rosneft’s largest shareholder is Rosneftegaz JSC (Rosneftegaz), which is wholly owned by the Russian government. At 31 December 2021, Rosneftegaz held 40.4% (2020 40.4%) of the voting shares of Rosneft.
At 31 December 2021 and 2020 bp classified its investment in Rosneft as an associate because, in management’s judgement, bp had significant influence over Rosneft; see Interests in other entities within Note 1 for further information. The group’s investment in Rosneft is a foreign operation whose functional currency is the Russian rouble. The increase in the group's equity-accounted investment balance for Rosneft at 31 December 2021 compared with 31 December 2020 principally relates to earnings from Rosneft and bp's share of Rosneft’s changes in equity offset by dividends.
bp retains 19.75% of the voting rights at meetings of Rosneft shareholders and will continue to be entitled to dividends based on its current shareholding. bp’s share of profit or loss of Rosneft reflects its economic interest. At 31 December 2021, bp's economic interest was 22.03%.
The value of bp’s 19.75% shareholding in Rosneft based on the quoted market share price of $8.04 per share (2020 $5.64 per share) was $16,827 million at 31 December 2021 (2020 $11,804 million). The value of bp's 22.03% (2020 22.03%) economic interest based on the quoted market share price was $18,773 million at 31 December 2021 (2020 $13,167 million).
See also Note 37 Events after the reporting period.
| | | | | | | | | | | | | | |
| | bp Annual Report and Form 20-F 2021 | | 215 |
16. Investments in associates – continued
The following table provides summarized financial information relating to Rosneft. This information is presented on a 100% basis and reflects adjustments made by bp to Rosneft’s own results in applying the equity method of accounting. bp adjusts Rosneft’s results for the accounting required under IFRS relating to bp’s purchase of its interest in Rosneft and the amortization of the deferred gain relating to the disposal of bp’s interest in TNK-BP.
| | | | | | | | | | | | | | |
| | | | $ million |
| | | | Gross amount |
| | 2021 | 2020 | 2019 |
| Sales and other operating revenues | | 118,755 | | 82,786 | | 134,046 | |
| Profit before interest and taxation | | 18,537 | | 1,270 | | 17,473 | |
| Finance costs | | 1,357 | | 1,742 | | 1,281 | |
| Profit (loss) before taxation | | 17,180 | | (472) | | 16,192 | |
| Taxation | | 3,209 | | 208 | | 3,058 | |
| Non-controlling interests | | 1,743 | | 482 | | 1,514 | |
| Profit (loss) for the year | | 12,228 | | (1,162) | | 11,620 | |
| Other comprehensive income | | 54 | | 1,653 | | 572 | |
| Total comprehensive income | | 12,282 | | 491 | | 12,192 | |
| Non-current assets | | 155,898 | | 175,978 | | |
| Current assets | | 45,790 | | 42,459 | | |
| Total assets | | 201,688 | | 218,437 | | |
| Current liabilities | | 47,061 | | 49,781 | | |
| Non-current liabilities | | 78,117 | | 96,727 | | |
| Total liabilities | | 125,178 | | 146,508 | | |
| Net assets | | 76,510 | | 71,929 | | |
| Less: non-controlling interests | | 11,357 | | 10,897 | | |
| | 65,153 | | 61,032 | | |
The group received dividends, net of withholding tax, of $640 million from Rosneft in 2021 (2020 $480 million and 2019 $785 million).
Summarized financial information for the group’s share of associates is shown below.
| | | | | | | | | | | | | | | | | | | | | | | | | | | | | | | | |
| | | | | | | | | | $ million |
| | | | | | | | | | bp share |
| | | | 2021 | | | 2020 | | | 2019 |
| | Rosneft | Other | Total | Rosneft | Other | Total | Rosnefta | Other | Total |
| Sales and other operating revenues | | 26,163 | | 10,005 | | 36,168 | | 17,535 | | 5,946 | | 23,481 | | 26,474 | | 7,934 | | 34,408 | |
| Profit before interest and taxation | | 4,084 | | 1,602 | | 5,686 | | 295 | | 276 | | 571 | | 3,451 | | 788 | | 4,239 | |
| Finance costs | | 299 | | 73 | | 372 | | 372 | | 80 | | 452 | | 253 | | 87 | | 340 | |
| Profit (loss) before taxation | | 3,785 | | 1,529 | | 5,314 | | (77) | | 196 | | 119 | | 3,198 | | 701 | | 3,899 | |
| Taxation | | 707 | | 767 | | 1,474 | | 51 | | 67 | | 118 | | 604 | | 315 | | 919 | |
| Non-controlling interests | | 384 | | — | | 384 | | 101 | | 1 | | 102 | | 299 | | — | | 299 | |
| Profit (loss) for the year | | 2,694 | | 762 | | 3,456 | | (229) | | 128 | | (101) | | 2,295 | | 386 | | 2,681 | |
| Other comprehensive income | | 12 | | 27 | | 39 | | 336 | | (19) | | 317 | | 113 | | (25) | | 88 | |
| Total comprehensive income | | 2,706 | | 789 | | 3,495 | | 107 | | 109 | | 216 | | 2,408 | | 361 | | 2,769 | |
| Non-current assets | | 34,346 | | 9,259 | | 43,605 | | 33,754 | | 11,449 | | 45,203 | | | | |
| Current assets | | 10,088 | | 2,418 | | 12,506 | | 8,238 | | 1,749 | | 9,987 | | | | |
| Total assets | | 44,434 | | 11,677 | | 56,111 | | 41,992 | | 13,198 | | 55,190 | | | | |
| Current liabilities | | 10,368 | | 1,876 | | 12,244 | | 9,535 | | 1,346 | | 10,881 | | | | |
| Non-current liabilities | | 17,210 | | 3,298 | | 20,508 | | 18,558 | | 4,709 | | 23,267 | | | | |
| Total liabilities | | 27,578 | | 5,174 | | 32,752 | | 28,093 | | 6,055 | | 34,148 | | | | |
| Net assets | | 16,856 | | 6,503 | | 23,359 | | 13,899 | | 7,143 | | 21,042 | | | | |
| Less: non-controlling interests | | 2,502 | | — | | 2,502 | | 2,091 | | — | | 2,091 | | | | |
| | 14,354 | | 6,503 | | 20,857 | | 11,808 | | 7,143 | | 18,951 | | | | |
| Group investment in associates | | | | | | | | | | |
| Group share of net assets (as above) | | 14,354 | | 6,503 | | 20,857 | | 11,808 | | 7,143 | | 18,951 | | | | |
| Loans made by group companies to associates | | — | | 144 | | 144 | | — | | 24 | | 24 | | | | |
| | 14,354 | | 6,647 | | 21,001 | | 11,808 | | 7,167 | | 18,975 | | | | |
a In 2014-2019, Rosneft adopted hedge accounting in relation to a portion of highly probable future export revenue denominated in US dollars. Foreign exchange gains and losses arising on the retranslation of borrowings denominated in currencies other than the Russian rouble and designated as hedging instruments were recognized initially in other comprehensive income, and were reclassified to the income statement as the hedged revenue was recognized.
| | | | | | | | | | | | | | |
216 | | bp Annual Report and Form 20-F 2021 | | |
16. Investments in associates – continued
Transactions between the group and its associates are summarized below.
| | | | | | | | | | | | | | | | | | | | | | | |
| | | | | | | $ million |
| Sales to associates | | | 2021 | | 2020 | | 2019 |
| Product | | Sales | Amount receivable at
31 December | Sales | Amount receivable at
31 December | Sales | Amount receivable at
31 December |
LNG, crude oil and oil products, natural gas | | 852 | | 201 | | 855 | | 169 | | 1,544 | | 243 | |
| | | | | | | |
| | | | | | | $ million |
| Purchases from associates | | | 2021 | | 2020 | | 2019 |
| Product | | Purchases | Amount payable at
31 December | Purchases | Amount
payable at
31 December | Purchases | Amount
payable at
31 December |
Crude oil and oil products, natural gas, transportation tariff | | 7,683 | | 2,072 | | 4,926 | | 1,280 | | 9,503 | | 1,641 | |
In the normal course of business, bp enters into various arm’s length transactions with associates including fixed price commitments to sell and to purchase commodities, forward sale and purchase contracts and agency agreements.
The terms of the outstanding balances receivable from associates are typically 30 to 45 days. The balances are unsecured and will be settled in cash. There are no significant provisions for doubtful debts relating to these balances and no significant expense recognized in the income statement in respect of bad or doubtful debts. Dividends receivable are not included in the table above.
The majority of purchases from associates relate to crude oil and oil products transactions with Rosneft. Sales to associates are related to various entities.
bp has commitments amounting to $9,930 million (2020 $10,777 million), primarily in relation to contracts with its associates for the purchase of transportation capacity. For information on capital commitments in relation to associates see Note 12.
bp's share of impairment charges taken by associates in 2021 was $291 million (2020 $414 million).
17. Other investments
| | | | | | | | | | | | | | | | | |
| | | | | $ million |
| | | 2021 | | 2020 |
| | Current | Non-current | Current | Non-current |
Equity investmentsa | | — | | 717 | | — | | 913 | |
| Contingent consideration | | 237 | | 1,680 | | 317 | | 1,682 | |
| Other | | 43 | | 147 | | 16 | | 151 | |
| | 280 | | 2,544 | | 333 | | 2,746 | |
a The majority of equity investments are unlisted.
Contingent consideration relates to amounts arising on disposals which are financial assets classified as measured at fair value through profit or loss. The fair value is determined using an estimate of discounted future cash flows that are expected to be received and is considered a level 3 valuation under the fair value hierarchy. Future cash flows are estimated based on inputs including oil and natural gas prices, production volumes and operating costs related to the disposed operations. The discount rate used is based on a risk-free rate adjusted for asset-specific risks. The contingent consideration principally relates to the disposal of our Alaskan business.
18. Inventories
| | | | | | | | | | | |
| | | $ million |
| | 2021 | 2020 |
| Crude oil | | 3,259 | | 4,498 | |
| Natural gas | | 474 | | 265 | |
| Emissions allowances | | 290 | | 1,297 | |
| Refined petroleum and petrochemical products | | 6,638 | | 8,791 | |
| | 10,661 | | 14,851 | |
| Trading inventories | | 11,525 | | 292 | |
| | 22,186 | | 15,143 | |
| Supplies | | 1,525 | | 1,730 | |
| | 23,711 | | 16,873 | |
| Cost of inventories expensed in the income statement | | 92,923 | | 57,682 | |
The inventory valuation at 31 December 2021 is stated net of a provision of $432 million (2020 $584 million) to write down inventories to their net realizable value, of which $64 million (2020 $216 million) relates to hydrocarbon inventories. The net credit to the income statement in the year in respect of inventory net realizable value provisions was $153 million (2020 $17 million credit), of which $151 million credit (2020 $71 million credit) related to hydrocarbon inventories.
As a result of the changes in strategic direction of the group and the evolution of the trading strategy set out in Note 1, from 1 January 2021, certain inventory, totalling $11.4 billion as at 31 December 2021, is now treated as trading inventory and is valued at fair value whereas the equivalent inventory was previously valued at the lower of cost or net realisable value in prior periods. Trading inventories are valued using quoted benchmark prices adjusted as appropriate for location and quality differentials. They are predominantly categorized within level 2 of the fair value hierarchy.
| | | | | | | | | | | | | | |
| | bp Annual Report and Form 20-F 2021 | | 217 |
19. Trade and other receivables
| | | | | | | | | | | | | | | | | |
| | | | | $ million |
| | | 2021 | | 2020 |
| | Current | Non-current | Current | Non-current |
| Financial assets | | | | | |
| Trade receivables | | 22,307 | | 17 | | 12,926 | | 19 | |
| Amounts receivable from joint ventures and associates | | 404 | | 89 | | 339 | | 10 | |
Receivables related to disposalsa | | 205 | | 823 | | 1,291 | | 2,402 | |
| Other receivables | | 2,874 | | 472 | | 2,628 | | 637 | |
| | 25,790 | | 1,401 | | 17,184 | | 3,068 | |
| Non-financial assets | | | | | |
Sales taxes and production taxes | | 1,131 | | 474 | | 557 | | 504 | |
Other receivablesb | | 218 | | 818 | | 207 | | 779 | |
| | 1,349 | | 1,292 | | 764 | | 1,283 | |
| | 27,139 | | 2,693 | | 17,948 | | 4,351 | |
a For further information see Note 3 - Disposals and Impairment.
b Includes Gulf of Mexico oil spill trust fund reimbursement asset of $1 million (2020 $32 million).
In both 2021 and 2020 the group entered into non-recourse arrangements to discount certain receivables in support of supply and trading activities and the management of credit risk.
Trade and other receivables, other than certain receivables related to disposals, are predominantly non-interest bearing. See Note 28 for further information.
20. Valuation and qualifying accounts
| | | | | | | | | | | | | | | | | | | | | | | |
| | | | | | | $ million |
| | | 2021 | | 2020 | | 2019 |
| | Trade and other receivables | Fixed asset
investments | Trade and other receivables | Fixed asset
investments | Trade and other receivables | Fixed asset
investments |
| At 1 January | | 555 | | 186 | | 509 | | 249 | | 416 | | 235 | |
| Charged to costs and expenses | | 136 | | 3 | | 214 | | 103 | | 206 | | 28 | |
Charged to other accountsa | | (11) | | — | | 2 | | — | | (2) | | — | |
| Deductions | | (96) | | (20) | | (170) | | (166) | | (111) | | (14) | |
| At 31 December | | 584 | | 169 | | 555 | | 186 | | 509 | | 249 | |
| | | | | | | |
| | | | | | | |
| | | | | | | |
| | | | | | | |
| | | | | | | |
| | | | | | | |
| | | | | | | |
| | | | | | | |
| | | | | | | |
| | | | | | | |
| | | | | | | |
| | | | | | | |
| | | | | | | |
| | | | | | | |
| | | | | | | |
| | | | | | | |
| | | | | | | |
| | | | | | | |
| | | | | | | |
| | | | | | | |
| | | | | | | |
| | | | | | | |
a Principally exchange adjustments.
Valuation and qualifying accounts relating to trade and other receivables comprise expected credit loss allowances. The expected credit loss allowance comprises $456 million (2020 $456 million, 2019 $414 million) relating to receivables that were credit-impaired at the end of the year and $128 million (2020 $99 million, 2019 $95 million) relating to receivables that were not credit-impaired at the end of the year. Whilst credit risk has decreased since 31 December 2020, there has also been a significant increase in the group's trade and other receivables balance. Therefore, the total expected credit loss allowances recognized as at 31 December 2021 have not significantly changed during the year.
Valuation and qualifying accounts relating to fixed asset investments comprise impairment provisions for investments in equity-accounted entities.
Valuation and qualifying accounts are deducted in the balance sheet from the assets to which they apply. For further information on the group's credit risk management policies and how the group recognizes and measures expected losses see Note 28.
21. Trade and other payables
| | | | | | | | | | | | | | | | | |
| | | | | $ million |
| | | 2021 | | 2020 |
| | Current | Non-current | Current | Non-current |
| Financial liabilities | | | | | |
| Trade payables | | 37,327 | | — | | 23,157 | | — | |
| Amounts payable to joint ventures and associates | | 2,165 | | — | | 1,364 | | — | |
| Payables for capital expenditure and acquisitions | | 2,063 | | 764 | | 2,297 | | 1,033 | |
| Payables related to the Gulf of Mexico oil spill | | 1,276 | | 9,154 | | 1,399 | | 9,988 | |
| Other payables | | 5,736 | | 175 | | 5,041 | | 681 | |
| | 48,567 | | 10,093 | | 33,258 | | 11,702 | |
| Non-financial liabilities | | | | | |
| Sales taxes, customs duties, production taxes and social security | | 2,708 | | 77 | | 2,103 | | 73 | |
| Other payables | | 1,336 | | 397 | | 653 | | 337 | |
| | 4,044 | | 474 | | 2,756 | | 410 | |
| | 52,611 | | 10,567 | | 36,014 | | 12,112 | |
| | | | | | | | | | | | | | |
218 | | bp Annual Report and Form 20-F 2021 | | |
21. Trade and other payables – continued
Materially all of bp's trade payables have payment terms in the range of 30 to 60 days and give rise to operating cash flows.
Trade and other payables, other than those relating to the Gulf of Mexico oil spill, are predominantly interest free. See Note 28 (c) for further information.
Payables related to the Gulf of Mexico oil spill include amounts payable under the 2016 consent decree and settlement agreement with the United States and five Gulf coast states, including amounts payable for natural resource damages, state claims and Clean Water Act penalties. On a discounted basis the amounts included in payables related to the Gulf of Mexico oil spill for these elements of the agreements are $4,499 million payable over 11 years, $2,423 million payable over 12 years and $3,310 million payable over 11 years respectively at 31 December 2021. Reported within net cash provided by operating activities in the group cash flow statement is a net cash outflow of $1,484 million (2020 outflow of $1,786 million, 2019 outflow of $2,694 million) related to the Gulf of Mexico oil spill, which includes payments made in relation to these agreements. For full details of these agreements, see bp Annual Report and Form 20-F 2015 - Legal Proceedings.
Payables related to the Gulf of Mexico oil spill at 31 December 2021 also include amounts payable for settled economic loss and property damage claims which are payable over a period of up to six years.
22. Provisions
| | | | | | | | | | | | | | | | | | | | | | | |
| | | | | | | $ million |
| | Decommissioning | Environmental | Litigation and claims | Emissions | Other | Total |
| At 1 January 2021 | | 14,476 | | 1,629 | | 910 | | 1,669 | | 2,277 | | 20,961 | |
| Exchange adjustments | | (25) | | (10) | | (4) | | (39) | | (76) | | (154) | |
| | | | | | | |
Increase (decrease) in existing provisionsa | | 1,231 | | 363 | | 226 | | 2,900 | | 623 | | 5,343 | |
Write-back of unused provisionsa | | (18) | | (55) | | (90) | | (23) | | (304) | | (490) | |
Unwinding of discounta | | 331 | | 36 | | 14 | | — | | 10 | | 391 | |
| Change in discount rate | | 1,252 | | 41 | | 33 | | — | | 6 | | 1,332 | |
| Utilization | | (72) | | (259) | | (188) | | (754) | | (642) | | (1,915) | |
| Reclassified to other payables | | (257) | | — | | (67) | | — | | (16) | | (340) | |
| Reclassified as liabilities directly associated with assets held for sale | | — | | — | | — | | — | | (47) | | (47) | |
| Deletions | | (253) | | — | | — | | — | | — | | (253) | |
| At 31 December 2021 | | 16,665 | | 1,745 | | 834 | | 3,753 | | 1,831 | | 24,828 | |
| Of which – current | | 609 | | 277 | | 112 | | 3,481 | | 777 | | 5,256 | |
| – non-current | | 16,056 | | 1,468 | | 722 | | 272 | | 1,054 | | 19,572 | |
| | | | | | | |
a Recognized in the Group income statement
The decommissioning provision comprises the future cost of decommissioning oil and natural gas wells, facilities and related pipelines. The environmental provision includes provisions for costs related to the control, abatement, clean-up or elimination of environmental pollution relating to soil, groundwater, surface water and sediment contamination. The litigation and claims category includes provisions for matters related to, for example, commercial disputes, product liability, and allegations of exposures of third parties to toxic substances. Emissions provisions primarily relate to obligations under the U.S. Environmental Protection Agency Renewable Fuel Standard Program and are driven by the amount of the obligations outstanding and current price of the related credits. The provision will principally be settled through allowances already held as inventory in the group balance sheet.
For information on significant estimates and judgements made in relation to provisions, see Provisions and contingencies within Note 1.
Gulf of Mexico oil spill
The group has recognized certain assets, payables and provisions and incurs certain residual costs relating to the Gulf of Mexico oil spill that occurred in 2010. For further information see Notes 6, 8, 19, 21, 28, 32. The litigation and claims provision presented in the table above includes the latest estimate for the remaining costs associated with the Gulf of Mexico oil spill. The amounts payable may differ from the amount provided and the timing of payments is uncertain.
23. Pensions and other post-retirement benefits
Most group companies have pension plans, the forms and benefits of which vary with conditions and practices in the countries concerned. Pension benefits may be provided through defined contribution plans (money purchase schemes) or defined benefit plans (final salary and other types of schemes with committed pension benefit payments). For defined contribution plans, retirement benefits are determined by the value of funds arising from contributions paid in respect of each employee. For defined benefit plans, retirement benefits are based on such factors as an employee’s pensionable salary and length of service. Defined benefit plans may be funded or unfunded. The assets of funded plans are generally held in separately administered trusts.
For information on significant estimates and judgements made in relation to accounting for these plans see Pensions and other post-retirement benefits in Note 1.
The pension obligation in the UK consists primarily of a funded final salary pension plan under which retired employees draw the majority of their benefit as an annuity. This pension plan is governed by a corporate trustee whose board is composed of four member-nominated directors, four company-nominated directors, one independent director and one independent chairman nominated by the company. The trustee board is required by law to act in the best interests of the plan participants and is responsible for setting certain policies, such as investment policies of the plan. This plan was closed to new joiners in 2010 and was closed to future accrual on 30 June 2021 resulting in a curtailment gain of $0.3 billion being recognized in
| | | | | | | | | | | | | | |
| | bp Annual Report and Form 20-F 2021 | | 219 |
23. Pensions and other post-retirement benefits – continued
the income statement during the year. For active members of the plan at 30 June 2021, benefit payables are now linked to salary as at that date, rather than salary on retirement. Employees in the UK are eligible for membership of a defined contribution plan.
In the US, all pension benefits now accrue under a cash balance formula. Benefits previously accrued under final salary formulas are legally protected. Retiring US employees typically take their pension benefit in the form of a lump sum payment upon retirement. The plan is funded and its assets are overseen by a fiduciary Investment Committee. During 2021 the committee was composed of seven bp employees appointed by the president of bp Corporation North America Inc. (the appointing officer). The Investment Committee is required by law to act in the best interests of the plan participants and is responsible for setting certain policies, such as the investment policies of the plan. US employees are also eligible to participate in a defined contribution (401k) plan in which employee contributions are matched with company contributions.
In the US, group companies also provide post-retirement healthcare to eligible retired employees and their dependants (and, in certain legacy cases, life insurance coverage); the entitlement to these benefits is based on the employee remaining in service until a specified age and completion of a minimum period of service.
In the Eurozone, there are defined benefit pension plans in Germany, France, the Netherlands and other countries. In Germany and France, the majority of the pensions are unfunded. In Germany, the group’s largest Eurozone plan, employees receive a pension and also have a choice to supplement their core pension through salary sacrifice. For employees who joined since 2002, the core pension benefit is a career average plan with retirement benefits based on such factors as an employee’s pensionable salary and length of service. The returns on the notional contributions made by both the company and employees are based on the interest rate which is set out in German tax law. Retired German employees take their pension benefit typically in the form of an annuity. The German plans are governed by legal agreements between bp and the works council or between bp and the trade union.
The level of contributions to funded defined benefit plans is the amount needed to provide adequate funds to meet pension obligations as they fall due. During 2021 the aggregate level of contributions was $274 million (2020 $325 million and 2019 $349 million). The aggregate level of contributions in 2022 is expected to be approximately $200 million, and includes contributions in all countries that we expect to be required to make contributions by law or under contractual agreements, as well as an allowance for discretionary funding.
For the primary UK plan there is a funding agreement between the group and the trustee. On a three year cycle a schedule of contributions is agreed covering the next five years. The schedule of contributions is next scheduled to be updated after the 31 December 2023 formal actuarial valuation. No contractually committed funding was due at 31 December 2021. The closure of the defined benefit plan to future accrual and the consequent lower service cost reduces the plan's expected future funding volatility.
The surplus relating to the primary UK pension plan is recognized on the balance sheet on the basis that the company is entitled to a refund of any remaining assets once all members have left the plan.
Minimum pension funding in the US is determined by legislation and is supplemented by discretionary contributions. No contributions were made into the primary US pension plan in 2021 and no statutory funding requirement is expected in the next 12 months.
The surplus relating to the primary US fund is recognized on the balance sheet on the basis that economic benefit can be gained from the surplus through a reduction in future contributions.
There was no minimum funding requirement for the US plan, and no significant minimum funding requirements in other countries at 31 December 2021.
The obligation and cost of providing pensions and other post-retirement benefits is assessed annually using the projected unit credit method. The date of the most recent actuarial review was 31 December 2021. The UK plans are subject to a formal actuarial valuation every three years; valuations are required more frequently in many other countries.The most recent formal actuarial valuation of the UK pension plans was as at 31 December 2020. A valuation of the US plan and largest Eurozone plans are carried out annually.
The material financial assumptions used to estimate the benefit obligations of the various plans are set out below. The assumptions are reviewed by management at the end of each year and are used to evaluate the accrued benefit obligation at 31 December and pension expense for the following year.
| | | | | | | | | | | | | | | | | | | | | | | | | | | | | | | | |
| | | | | | | | | | % |
Financial assumptions used to determine benefit obligationa | | | | UK | | | US | | | Eurozone |
| 2021 | 2020 | 2019 | 2021 | 2020 | 2019 | 2021 | 2020 | 2019 |
| Discount rate for plan liabilities | | 1.8 | | 1.4 | | 2.1 | | 2.7 | | 2.2 | | 3.1 | | 1.3 | | 1.0 | | 1.3 | |
Rate of increase for pensions in payment | | 3.2 | | 2.8 | | 2.7 | | — | | — | | — | | 1.4 | | 1.3 | | 1.5 | |
| Rate of increase in deferred pensions | | 3.2 | | 2.8 | | 2.7 | | — | | — | | — | | 0.4 | | 0.5 | | 0.5 | |
| Inflation for plan liabilities | | 3.3 | | 2.9 | | 2.7 | | 2.1 | | 1.7 | | 1.5 | | 1.6 | | 1.5 | | 1.7 | |
| | | | | | | | | | | % |
| Financial assumptions used to determine benefit expense | | | | UK | | | US | | | Eurozone |
| 2021 | 2020 | 2019 | 2021 | 2020 | 2019 | 2021 | 2020 | 2019 |
| Discount rate for plan service cost | | 1.5 | | 2.1 | | 3.0 | | 2.4 | | 3.2 | | 4.2 | | 1.4 | | 1.8 | | 2.5 | |
Discount rate for plan other finance expenseb | | 1.7 | | 2.1 | | 2.9 | | 2.2 | | 3.1 | | 4.1 | | 1.0 | | 1.3 | | 2.0 | |
| Inflation for plan service cost | | 2.8 | | 2.6 | | 3.1 | | 1.7 | | 1.5 | | 1.5 | | 1.5 | | 1.7 | | 1.7 | |
a Salary growth is no longer a material financial assumption for the Group following the closure of the primary pension plan to future accrual. The rate of increase in salaries for the UK was 3.6% and 3.4% in 2020 and 2019 respectively.
b The discount rate for plan other finance expense was 1.4% for the primary UK plan for the period before the plan closed to future accrual on 30th June 2021 and 1.9% thereafter.
The discount rate assumptions are based on third-party AA corporate bond indices and for our largest plans in the UK, US and the Eurozone we use yields that reflect the maturity profile of the expected benefit payments. The inflation rate assumptions for our UK and US plans are based on the difference between the yields on index-linked and fixed-interest long-term government bonds. In other countries, including the Eurozone, we use this approach, or advice from the local actuary depending on the information available. The inflation assumptions are used to determine the rate of increase for pensions in payment and the rate of increase in deferred pensions where there is such an increase.
| | | | | | | | | | | | | | |
220 | | bp Annual Report and Form 20-F 2021 | | |
23. Pensions and other post-retirement benefits – continued
In addition to the financial assumptions, we regularly review the demographic and mortality assumptions. The mortality assumptions reflect best practice in the countries in which we provide pensions and have been chosen with regard to applicable published tables adjusted where appropriate to reflect the experience of the group and an extrapolation of past longevity improvements into the future. bp’s most substantial pension liabilities are in the UK, the US and the Eurozone where our mortality assumptions are as follows:
| | | | | | | | | | | | | | | | | | | | | | | | | | | | | | | | |
| | | | | | | | | | Years |
| Mortality assumptions | | | | UK | | | US | | | Eurozone |
| | 2021 | 2020 | 2019 | 2021 | 2020 | 2019 | 2021 | 2020 | 2019 |
Life expectancy at age 60 for a male currently aged 60 | | 26.9 | | 26.9 | | 27.3 | | 24.9 | | 24.7 | | 24.9 | | 25.8 | | 25.7 | | 25.7 | |
Life expectancy at age 60 for a male currently aged 40 | | 28.4 | | 28.4 | | 28.9 | | 26.6 | | 26.4 | | 26.7 | | 28.3 | | 28.2 | | 28.3 | |
Life expectancy at age 60 for a female currently aged 60 | | 28.9 | | 28.8 | | 28.7 | | 27.9 | | 27.7 | | 28.0 | | 29.1 | | 29.0 | | 29.1 | |
Life expectancy at age 60 for a female currently aged 40 | | 30.5 | | 30.4 | | 30.5 | | 29.4 | | 29.2 | | 29.7 | | 31.2 | | 31.2 | | 31.2 | |
Pension plan assets are generally held in trusts, the primary objective of which is to accumulate assets sufficient to meet the obligations of the plans. The assets of the trusts are invested in a manner consistent with fiduciary obligations and principles that reflect current practices in portfolio management.
A significant proportion of the assets are held in equities, which are expected to generate a higher level of return over the long term, with an acceptable level of risk. In order to provide reasonable assurance that no single security or type of security has an unwarranted impact on the total portfolio, the investment portfolios are highly diversified.
The trustee’s long-term investment objective for the primary UK plan as it matures is to invest in assets whose value changes in the same way as the plan liabilities, in order to reduce the level of funding risk. To move towards this objective, the UK plan uses a liability driven investment (LDI) approach for part of the portfolio, investing primarily in government bonds to achieve this matching effect for the most significant plan liability assumptions of interest rate and inflation rate. This is partly funded by short-term sale and repurchase agreements, whereby the plan borrows money using existing bonds as security and which will be bought back at a specified price at an agreed future date. The funds raised are used to invest in further bonds to increase the proportion of assets which match the plan liabilities. The borrowings are shown separately in the analysis of pension plan assets in the table below.
For the primary UK pension plan there is an agreement with the trustee to increase the proportion of assets with liability matching characteristics over time primarily by reducing the proportion of plan assets held as equities and increasing the proportion held as bonds. This agreement is not impacted by the closure of the plan to future accrual. There is a similar agreement in place for the primary US plan. During 2021, the UK and the US plans switched 5% and 13% of plan assets respectively from equities to bonds (2020 11% and nil% respectively).
The current asset allocation policy for the major plans at 31 December 2021 was as follows:
| | | | | | | | | | | |
| | UK | US |
| Asset category | | % | % |
| Total equity (including private equity) | | 12 | | 27 | |
| Bonds/cash (including LDI) | | 81 | | 73 | |
| Property/real estate | | 7 | | — | |
The amounts invested under the LDI programme by the primary UK pension plan as at 31 December 2021 were $7,399 million (2020 $4,217 million) of government-issued nominal bonds and $24,516 million (2020 $24,576 million) of index-linked bonds.
Some of the group’s pension plans in the Eurozone and other countries use derivative financial instruments as part of their asset mix to manage the level of risk. The fair value of these instruments is included in other assets in the table below.
The group’s main pension plans do not invest directly in either securities or property/real estate of the company or of any subsidiary.
The fair values of the various categories of assets held by the defined benefit plans at 31 December are presented in the table below, including the effects of derivative financial instruments. Movements in the fair value of plan assets during the year are shown in detail in the table on page 223.
| | | | | | | | | | | | | | |
| | bp Annual Report and Form 20-F 2021 | | 221 |
23. Pensions and other post-retirement benefits – continued
| | | | | | | | | | | | | | | | | | | | |
| | | | | | $ million |
| | | UKa | USb | Eurozone | Other | Total |
| Fair value of pension plan assets | | | | | | |
| At 31 December 2021 | | | | | | |
Listed equities – developed markets | | 2,964 | | 340 | | 473 | | 290 | | 4,067 | |
– emerging markets | | 252 | | 45 | | 67 | | 76 | | 440 | |
Private equityc | | 3,233 | | 1,537 | | — | | 3 | | 4,773 | |
Government issued nominal bondsd | | 7,491 | | 2,606 | | 974 | | 432 | | 11,503 | |
Government issued index-linked bondsd | | 24,516 | | — | | 100 | | — | | 24,616 | |
Corporate bondsd | | 10,128 | | 2,475 | | 689 | | 498 | | 13,790 | |
Propertye | | 2,714 | | — | | 110 | | 22 | | 2,846 | |
| Cash | | 1,136 | | 116 | | 54 | | 69 | | 1,375 | |
| Other | | 1,133 | | 54 | | 70 | | 22 | | 1,279 | |
Debt (repurchase agreements) used to fund liability driven investments | | (10,723) | | — | | — | | — | | (10,723) | |
| | 42,844 | | 7,173 | | 2,537 | | 1,412 | | 53,966 | |
| At 31 December 2020 | | | | | | |
| Listed equities – developed markets | | 5,008 | | 1,112 | | 542 | | 318 | | 6,980 | |
– emerging markets | | 418 | | 115 | | 68 | | 70 | | 671 | |
Private equityc | | 2,899 | | 1,604 | | — | | 4 | | 4,507 | |
Government issued nominal bondsd | | 4,303 | | 1,839 | | 1,111 | | 616 | | 7,869 | |
Government issued index-linked bondsd | | 24,576 | | — | | 107 | | — | | 24,683 | |
Corporate bondsd | | 8,906 | | 2,398 | | 587 | | 279 | | 12,170 | |
Propertye | | 2,553 | | — | | 110 | | 28 | | 2,691 | |
| Cash | | 1,392 | | 267 | | 51 | | 163 | | 1,873 | |
| Other | | 795 | | 131 | | 104 | | 30 | | 1,060 | |
Debt (repurchase agreements) used to fund liability driven investments | | (9,387) | | — | | — | | — | | (9,387) | |
| | 41,463 | | 7,466 | | 2,680 | | 1,508 | | 53,117 | |
| At 31 December 2019 | | | | | | |
| Listed equities – developed markets | | 6,285 | | 1,290 | | 495 | | 371 | | 8,441 | |
– emerging markets | | 1,096 | | 124 | | 61 | | 64 | | 1,345 | |
Private equityc | | 2,675 | | 1,474 | | — | | 3 | | 4,152 | |
Government issued nominal bondsd | | 4,884 | | 2,100 | | 959 | | 572 | | 8,515 | |
Government issued index-linked bondsd | | 19,462 | | — | | 100 | | — | | 19,562 | |
Corporate bondsd | | 6,132 | | 2,304 | | 569 | | 256 | | 9,261 | |
Propertye | | 2,507 | | — | | 96 | | 27 | | 2,630 | |
| Cash | | 426 | | 289 | | 33 | | 93 | | 841 | |
| Other | | 98 | | 74 | | 30 | | 26 | | 228 | |
| Debt (repurchase agreements) used to fund liability driven investments | | (7,436) | | — | | — | | — | | (7,436) | |
| | 36,129 | | 7,655 | | 2,343 | | 1,412 | | 47,539 | |
a Bonds held by the UK pension plans are denominated in sterling. Property held by the UK pension plans is in the United Kingdom.
b Bonds held by the US pension plans are denominated in US dollars.
c Private equity is valued at fair value based on the most recent transaction price or third-party net asset, revenue or earnings based valuations that generally result in the use of significant unobservable inputs.
d Bonds held by pension plans are valued using quoted prices in active markets.
e Properties are valued based on an analysis of recent market transactions supported by market knowledge derived from third-party professional valuers that generally result in the use of significant unobservable inputs.
| | | | | | | | | | | | | | |
222 | | bp Annual Report and Form 20-F 2021 | | |
23. Pensions and other post-retirement benefits – continued
| | | | | | | | | | | | | | | | | | | | |
| | | | | | $ million |
| | | | | | 2021 |
| | UK | US | Eurozone | Other | Total |
Analysis of the amount charged to profit or loss | | | | | | |
Current service costa | | 154 | | 246 | | 105 | | 31 | | 536 | |
Past service costb | | (302) | | — | | (27) | | 2 | | (327) | |
Settlementb | | — | | — | | (4) | | (1) | | (5) | |
| Operating charge (credit) relating to defined benefit plans | | (148) | | 246 | | 74 | | 32 | | 204 | |
| Payments to defined contribution plans | | 76 | | 136 | | 7 | | 36 | | 255 | |
| Total operating charge (credit) | | (72) | | 382 | | 81 | | 68 | | 459 | |
Interest income on plan assetsa | | (684) | | (150) | | (30) | | (40) | | (904) | |
| Interest on plan liabilities | | 559 | | 209 | | 78 | | 56 | | 902 | |
| Other finance (income) expense | | (125) | | 59 | | 48 | | 16 | | (2) | |
Analysis of the amount recognized in other comprehensive income | | | | | | |
| Actual asset return less interest income on plan assets | | 2,440 | | 749 | | 12 | | 25 | | 3,226 | |
Change in financial assumptions underlying the present value of the plan liabilities | | (100) | | 777 | | 233 | | 97 | | 1,007 | |
Change in demographic assumptions underlying the present value of the plan liabilities | | 66 | | (41) | | (15) | | 1 | | 11 | |
| Experience gains and losses arising on the plan liabilities | | 7 | | 173 | | (11) | | 3 | | 172 | |
| Remeasurements recognized in other comprehensive income | | 2,413 | | 1,658 | | 219 | | 126 | | 4,416 | |
| Movements in benefit obligation during the year | | | | | | |
| Benefit obligation at 1 January | | 34,171 | | 10,187 | | 8,161 | | 1,895 | | 54,414 | |
| Exchange adjustments | | (255) | | — | | (623) | | (51) | | (929) | |
| Operating charge relating to defined benefit plans | | (148) | | 246 | | 74 | | 32 | | 204 | |
| Interest cost | | 559 | | 209 | | 78 | | 56 | | 902 | |
Contributions by plan participantsc | | 18 | | — | | 2 | | 6 | | 26 | |
Benefit payments (funded plans)d | | (1,530) | | (1,192) | | (87) | | (164) | | (2,973) | |
Benefit payments (unfunded plans)d | | (8) | | (268) | | (288) | | (21) | | (585) | |
| | | | | | |
| Disposals | | — | | — | | (2) | | — | | (2) | |
| Remeasurements | | 27 | | (909) | | (207) | | (101) | | (1,190) | |
Benefit obligation at 31 Decembera e | | 32,834 | | 8,273 | | 7,108 | | 1,652 | | 49,867 | |
| Movements in fair value of plan assets during the year | | | | | | |
| Fair value of plan assets at 1 January | | 41,463 | | 7,466 | | 2,680 | | 1,508 | | 53,117 | |
| Exchange adjustments | | (365) | | — | | (214) | | (28) | | (607) | |
Interest income on plan assetsa f | | 684 | | 150 | | 30 | | 40 | | 904 | |
Contributions by plan participantsc | | 18 | | — | | 2 | | 6 | | 26 | |
| Contributions by employers (funded plans) | | 134 | | — | | 115 | | 25 | | 274 | |
Benefit payments (funded plans)d | | (1,530) | | (1,192) | | (87) | | (164) | | (2,973) | |
| | | | | | |
| Disposals | | — | | — | | (1) | | — | | (1) | |
Remeasurementsf | | 2,440 | | 749 | | 12 | | 25 | | 3,226 | |
Fair value of plan assets at 31 Decemberg | | 42,844 | | 7,173 | | 2,537 | | 1,412 | | 53,966 | |
| Surplus (deficit) at 31 December | | 10,010 | | (1,100) | | (4,571) | | (240) | | 4,099 | |
| Represented by | | | | | | |
| Asset recognized | | 10,280 | | 1,410 | | 155 | | 74 | | 11,919 | |
| Liability recognized | | (270) | | (2,510) | | (4,726) | | (314) | | (7,820) | |
| | 10,010 | | (1,100) | | (4,571) | | (240) | | 4,099 | |
| The surplus (deficit) may be analysed between funded and unfunded plans as follows | | | | | | |
| Funded | | 10,280 | | 1,410 | | 94 | | 30 | | 11,814 | |
| Unfunded | | (270) | | (2,510) | | (4,665) | | (270) | | (7,715) | |
| | 10,010 | | (1,100) | | (4,571) | | (240) | | 4,099 | |
| The defined benefit obligation may be analysed between funded and unfunded plans as follows | | | | | | |
| Funded | | (32,564) | | (5,763) | | (2,443) | | (1,382) | | (42,152) | |
| Unfunded | | (270) | | (2,510) | | (4,665) | | (270) | | (7,715) | |
| | (32,834) | | (8,273) | | (7,108) | | (1,652) | | (49,867) | |
a The costs of managing plan investments are offset against the investment return, the costs of administering pension plan benefits are generally included in current service cost and the costs of administering other post-retirement benefit plans are included in the benefit obligation.
b The past service credit in the UK represents curtailment gains arising from the closure of the primary pension plan in the UK to future accrual. Past service credits and settlements in the Eurozone include $18 million of curtailments and settlements due to restructuring initiatives. Remaining past service cost and settlements represent charges for special termination benefits reflecting the increased liability arising as a result of early retirements.
c Most of the contributions made by plan participants into UK pension plans were made under salary sacrifice.
d The benefit payments amount shown above comprises $3,416 million benefits and $93 million settlements, plus $49 million of plan expenses incurred in the administration of the benefit.
e The benefit obligation for the US is made up of $6,164 million for pension liabilities and $2,109 million for other post-retirement benefit liabilities (which are unfunded and are primarily retiree medical liabilities). The benefit obligation for the Eurozone includes $4,405 million for pension liabilities in Germany which is largely unfunded.
f The actual return on plan assets is made up of the sum of the interest income on plan assets and the remeasurement of plan assets as disclosed above.
g The fair value of plan assets includes borrowings related to the LDI programme as described on page 221.
| | | | | | | | | | | | | | |
| | bp Annual Report and Form 20-F 2021 | | 223 |
23. Pensions and other post-retirement benefits – continued
| | | | | | | | | | | | | | | | | | | | |
| | | | | | $ million |
| | | | | | 2020 |
| | UK | US | Eurozone | Other | Total |
| Analysis of the amount charged to profit or loss | | | | | | |
Current service costa | | 250 | | 292 | | 103 | | 38 | | 683 | |
Past service costb | | (48) | | (66) | | 12 | | (20) | | (122) | |
Settlementb | | — | | (23) | | 10 | | (1) | | (14) | |
| Operating charge relating to defined benefit plans | | 202 | | 203 | | 125 | | 17 | | 547 | |
| Payments to defined contribution plans | | 49 | | 183 | | 2 | | 38 | | 272 | |
| Total operating charge | | 251 | | 386 | | 127 | | 55 | | 819 | |
Interest income on plan assetsa | | (725) | | (210) | | (33) | | (40) | | (1,008) | |
| Interest on plan liabilities | | 596 | | 289 | | 97 | | 59 | | 1,041 | |
| Other finance (income) expense | | (129) | | 79 | | 64 | | 19 | | 33 | |
| Analysis of the amount recognized in other comprehensive income | | | | | | |
| Actual asset return less interest income on plan assets | | 4,108 | | 1,041 | | 104 | | 38 | | 5,291 | |
Change in financial assumptions underlying the present value of the plan liabilities | | (4,207) | | (1,178) | | (143) | | (42) | | (5,570) | |
Change in demographic assumptions underlying the present value of the plan liabilities | | 585 | | 29 | | 56 | | (4) | | 666 | |
| Experience gains and losses arising on the plan liabilities | | 54 | | (101) | | (178) | | 8 | | (217) | |
| Remeasurements recognized in other comprehensive income | | 540 | | (209) | | (161) | | — | | 170 | |
| Movements in benefit obligation during the year | | | | | | |
| Benefit obligation at 1 January | | 29,780 | | 10,119 | | 7,353 | | 1,826 | | 49,078 | |
| Exchange adjustments | | 1,303 | | — | | 720 | | 64 | | 2,087 | |
| Operating charge relating to defined benefit plans | | 202 | | 203 | | 125 | | 17 | | 547 | |
| Interest cost | | 596 | | 289 | | 97 | | 59 | | 1,041 | |
Contributions by plan participantsc | | 21 | | — | | 2 | | 11 | | 34 | |
Benefit payments (funded plans)d | | (1,291) | | (1,441) | | (81) | | (86) | | (2,899) | |
Benefit payments (unfunded plans)d | | (8) | | (197) | | (265) | | (34) | | (504) | |
| Reclassified as assets held for sale | | — | | (1) | | (55) | | — | | (56) | |
| Disposals | | — | | (35) | | — | | — | | (35) | |
| Remeasurements | | 3,568 | | 1,250 | | 265 | | 38 | | 5,121 | |
Benefit obligation at 31 Decembera e | | 34,171 | | 10,187 | | 8,161 | | 1,895 | | 54,414 | |
| Movements in fair value of plan assets during the year | | | | | | |
| Fair value of plan assets at 1 January | | 36,129 | | 7,655 | | 2,343 | | 1,412 | | 47,539 | |
| Exchange adjustments | | 1,582 | | — | | 235 | | 64 | | 1,881 | |
Interest income on plan assetsa f | | 725 | | 210 | | 33 | | 40 | | 1,008 | |
Contributions by plan participantsc | | 21 | | — | | 2 | | 11 | | 34 | |
| Contributions by employers (funded plans) | | 189 | | 8 | | 99 | | 29 | | 325 | |
Benefit payments (funded plans)d | | (1,291) | | (1,441) | | (81) | | (86) | | (2,899) | |
| Reclassified as assets held for sale | | — | | (7) | | (55) | | — | | (62) | |
Remeasurementsf | | 4,108 | | 1,041 | | 104 | | 38 | | 5,291 | |
Fair value of plan assets at 31 Decemberg | | 41,463 | | 7,466 | | 2,680 | | 1,508 | | 53,117 | |
| Surplus (deficit) at 31 December | | 7,292 | | (2,721) | | (5,481) | | (387) | | (1,297) | |
| Represented by | | | | | | |
| Asset recognized | | 7,567 | | 269 | | 59 | | 62 | | 7,957 | |
| Liability recognized | | (275) | | (2,990) | | (5,540) | | (449) | | (9,254) | |
| | 7,292 | | (2,721) | | (5,481) | | (387) | | (1,297) | |
| The surplus (deficit) may be analysed between funded and unfunded plans as follows | | | | | | |
| Funded | | 7,564 | | 269 | | (109) | | (58) | | 7,666 | |
| Unfunded | | (272) | | (2,990) | | (5,372) | | (329) | | (8,963) | |
| | 7,292 | | (2,721) | | (5,481) | | (387) | | (1,297) | |
| The defined benefit obligation may be analysed between funded and unfunded plans as follows | | | | | | |
| Funded | | (33,899) | | (7,197) | | (2,789) | | (1,566) | | (45,451) | |
| Unfunded | | (272) | | (2,990) | | (5,372) | | (329) | | (8,963) | |
| | (34,171) | | (10,187) | | (8,161) | | (1,895) | | (54,414) | |
a The costs of managing plan investments are offset against the investment return, the costs of administering pension plan benefits are generally included in current service cost and the costs of administering other post-retirement benefit plans are included in the benefit obligation.
b Past service credits represent curtailment gains arising from restructuring programmes in the UK, US and other countries, whilst past service costs and settlements in the Eurozone represent charges for special termination benefits reflecting the increased liability arising as a result of early retirements. Settlement costs in the US resulted from a pension risk transfer to an external carrier for a group of small benefit retirees.
c Most of the contributions made by plan participants into UK pension plans were made under salary sacrifice.
d The benefit payments amount shown above comprises $2,935 million benefits and $428 million settlements, plus $40 million of plan expenses incurred in the administration of the benefit.
e The benefit obligation for the US is made up of $7,728 million for pension liabilities and $2,459 million for other post-retirement benefit liabilities (which are unfunded and are primarily retiree medical liabilities). The benefit obligation for the Eurozone includes $5,060 million for pension liabilities in Germany which is largely unfunded.
f The actual return on plan assets is made up of the sum of the interest income on plan assets and the remeasurement of plan assets as disclosed above.
g The fair value of plan assets includes borrowings related to the LDI programme as described on page 221.
| | | | | | | | | | | | | | |
224 | | bp Annual Report and Form 20-F 2021 | | |
23. Pensions and other post-retirement benefits – continued
| | | | | | | | | | | | | | | | | | | | |
| | | | | | $ million |
| | | | | | | 2019 |
| | | UK | US | Eurozone | Other | Total |
Analysis of the amount charged to profit or loss | | | | | | |
Current service costa | | 227 | | 263 | | 81 | | 38 | | 609 | |
Past service costb | | 2 | | — | | 5 | | (1) | | 6 | |
| Settlement | | — | | (13) | | 8 | | — | | (5) | |
| Operating charge relating to defined benefit plans | | 229 | | 250 | | 94 | | 37 | | 610 | |
| Payments to defined contribution plans | | 42 | | 188 | | 7 | | 38 | | 275 | |
| Total operating charge | | 271 | | 438 | | 101 | | 75 | | 885 | |
Interest income on plan assetsa | | (909) | | (285) | | (43) | | (46) | | (1,283) | |
| Interest on plan liabilities | | 757 | | 387 | | 133 | | 69 | | 1,346 | |
| Other finance (income) expense | | (152) | | 102 | | 90 | | 23 | | 63 | |
| Analysis of the amount recognized in other comprehensive income | | | | | | |
| Actual asset return less interest income on plan assets | | 2,945 | | 1,079 | | 220 | | 97 | | 4,341 | |
Change in financial assumptions underlying the present value of the plan liabilities | | (2,294) | | (1,036) | | (748) | | (92) | | (4,170) | |
Change in demographic assumptions underlying the present value of the plan liabilities | | 136 | | 91 | | 3 | | (4) | | 226 | |
| Experience gains and losses arising on the plan liabilities | | (57) | | (22) | | 6 | | 4 | | (69) | |
| Remeasurements recognized in other comprehensive income | | 730 | | 112 | | (519) | | 5 | | 328 | |
a The costs of managing plan investments are offset against the investment return, the costs of administering pension plan benefits are generally included in current service cost and the costs of administering other post-retirement benefit plans are included in the benefit obligation.
b Past service costs and settlements have arisen from restructuring programmes and represent charges for special termination benefits reflecting the increased liability arising as a result of early retirements. Settlements in the US are the result of a buy-out transaction for the pensions of a group of low value annuitants.
Sensitivity analysis
The discount rate, inflation and the mortality assumptions all have a significant effect on the amounts reported. A one-percentage point change, in isolation, in certain assumptions as at 31 December 2021 for the group’s pensions and other post-retirement benefit expense would have had the effects shown in the tables below. The effects shown for the expense in 2022 comprise the total of current service cost and net finance income or expense.
| | | | | | | | | | | | | | | | | | | | | | | |
| | | | | | | $ million |
| | | | | | | One percentage point |
| | UK | US | Eurozone |
| | | Increase | Decrease | Increase | Decrease | Increase | Decrease |
Discount ratea | | | | | | | |
| Effect on expense in 2022 | | (248) | | 159 | | (57) | | 50 | | (3) | | (6) | |
| Effect on obligation at 31 December 2021 | | (5,143) | | 6,788 | | (951) | | 1,171 | | (980) | | 1,238 | |
Inflation rateb | | | | | | | |
| Effect on expense in 2022 | | 74 | | (71) | | 10 | | (8) | | 32 | | (26) | |
| Effect on obligation at 31 December 2021 | | 4,062 | | (3,912) | | 60 | | (51) | | 880 | | (748) | |
a The amounts presented reflect that the discount rate is used to determine the asset interest income as well as the interest cost on the obligation.
b The amounts presented reflect the total impact of an inflation rate change on the assumptions for rate of increase in salaries, pensions in payment and deferred pensions.
| | | | | | | | | | | | | | |
| | | | $ million |
| | | | One year increase |
| | UK | US | Eurozone |
| Longevity | | | | |
| Effect on expense in 2022 | | 25 | | 4 | | 7 | |
| Effect on obligation at 31 December 2021 | | 1,402 | | 119 | | 291 | |
Estimated future benefit payments and the weighted average duration of defined benefit obligations
The expected benefit payments, which reflect expected future service, as appropriate, but exclude plan expenses, up until 2031 and the weighted average duration of the defined benefit obligations at 31 December 2021 are as follows:
| | | | | | | | | | | | | | | | | | | | |
| | | | | | $ million |
| Estimated future benefit payments | | UK | US | Eurozone | Other | Total |
| 2022 | | 1,100 | | 683 | | 328 | | 97 | | 2,208 | |
| 2023 | | 1,141 | | 546 | | 319 | | 91 | | 2,097 | |
| 2024 | | 1,163 | | 529 | | 312 | | 92 | | 2,096 | |
| 2025 | | 1,164 | | 527 | | 312 | | 92 | | 2,095 | |
| 2026 | | 1,185 | | 523 | | 299 | | 93 | | 2,100 | |
| 2027-2031 | | 6,184 | | 2,501 | | 1,397 | | 476 | | 10,558 | |
| | | | | | | Years |
| Weighted average duration | | 17.9 | 12.7 | 15.9 | 12.5 | |
| | | | | | | | | | | | | | |
| | bp Annual Report and Form 20-F 2021 | | 225 |
24. Cash and cash equivalents
| | | | | | | | | | | |
| | | $ million |
| | 2021 | 2020 |
| Cash | | 9,101 | | 6,235 | |
| Triparty repos and term bank deposits | | 15,655 | | 17,368 | |
| Cash equivalents (excluding triparty repos and term bank deposits) | | 5,925 | | 7,508 | |
| | 30,681 | | 31,111 | |
Cash and cash equivalents comprise cash in hand; current balances with banks and similar institutions; deposits of three months or less with banks and similar institutions; money market funds and commercial paper. The carrying amounts of cash, triparty repos and term bank deposits approximate their fair values. Substantially all of the other cash equivalents are categorized within level 1 of the fair value hierarchy.
Cash and cash equivalents at 31 December 2021 includes $4,740 million (2020 $1,917 million) that is restricted. The restricted cash balances include amounts required to cover initial margin on trading exchanges and certain cash balances which are subject to exchange controls.
The group holds $4,668 million (2020 $3,890 million) of cash and cash equivalents outside the UK and it is not expected that any significant tax will arise on repatriation.
25. Finance debt
| | | | | | | | | | | | | | | | | | | | | | | |
| | | | | | | $ million |
| | | | 2021 | | | 2020 |
| | Current | Non-current | Total | Current | Non-current | Total |
| Borrowings | | 5,557 | | 55,619 | | 61,176 | | 9,359 | | 63,305 | | 72,664 | |
The main elements of current borrowings are the current portion of long-term borrowings that is due to be repaid in the next 12 months of $3,366 million (2020 $8,122 million) and issued commercial paper of $2,163 million (2020 $1,004 million). Finance debt does not include accrued interest of $484 million (2020 $678 million), which is reported within other payables. As part of actively managing its debt portfolio, during the year the group bought back $11.0 billion (2020 $4.0 billion) equivalent of finance debt primarily consisting of US dollar, euro and sterling bonds. Derivatives associated with non-US dollar debt bought back were also terminated. These transactions have no significant impact on net debt and gearing.
The following table shows the weighted-average interest rates achieved through a combination of borrowings and derivative financial instruments entered into to manage interest rate and currency exposures.
| | | | | | | | | | | | | | | | | | | | | | | |
| | | Fixed rate debt | Floating rate debt | Total |
| | Weighted
average
interest
rate
% | Weighted
average
time for
which rate
is fixed
Years | Amount
$ million | Weighted
average
interest
rate
% | Amount
$ million | Amount
$ million |
| | | | | | | 2021 |
| US dollar | | 3 | | 12 | 35,891 | | 2 | | 25,074 | | 60,965 | |
| Other currencies | | 6 | | 9 | 188 | | 1 | | 23 | | 211 | |
| | | | 36,079 | | | 25,097 | | 61,176 | |
| | | | | | | |
| | | | | | | 2020 |
| US dollar | | 3 | | 8 | 39,452 | | 2 | | 32,891 | | 72,343 | |
| Other currencies | | 6 | | 9 | 178 | | 5 | | 143 | | 321 | |
| | | | 39,630 | | | 33,034 | | 72,664 | |
Fair values
The estimated fair value of finance debt is shown in the table below together with the carrying amount as reflected in the balance sheet.
Long-term borrowings in the table below include the portion of debt that matures in the 12 months from 31 December 2021, whereas in the group balance sheet the amount is reported within current finance debt.
The carrying amount of the group’s short-term borrowings, comprising mainly of commercial paper, approximates their fair value. The fair values of the significant majority of the group’s long-term borrowings are determined using quoted prices in active markets, and so fall within level 1 of the fair value hierarchy. Where quoted prices are not available, quoted prices for similar instruments in active markets are used and such measurements are therefore categorized in level 2 of the fair value hierarchy.
| | | | | | | | | | | | | | | | | |
| | | | | $ million |
| | | 2021 | | 2020 |
| | Fair value | Carrying
amount | Fair value | Carrying
amount |
| Short-term borrowings | | 2,191 | | 2,191 | | 1,237 | | 1,237 | |
| Long-term borrowings | | 60,755 | | 58,985 | | 74,855 | | 71,427 | |
| Total finance debt | | 62,946 | | 61,176 | | 76,092 | | 72,664 | |
| | | | | | | | | | | | | | |
226 | | bp Annual Report and Form 20-F 2021 | | |
26. Capital disclosures and net debt
The group defines capital as total equity plus net debt. We maintain our financial framework to support the pursuit of value growth for shareholders, while ensuring a secure financial base.
The group monitors capital on basis of gearing, that is, the ratio of net debt to net debt plus equity. Net debt is calculated as finance debt, as shown in the balance sheet, plus the fair value of associated derivative financial instruments that are used to hedge foreign exchange and interest rate risks relating to finance debt for which hedge accounting is applied, less cash and cash equivalents. Net debt and gearing are non-GAAP measures. bp believes these measures provide useful information to investors. Net debt enables investors to see the economic effect of finance debt, related hedges and cash and cash equivalents in total. Gearing enables investors to see how significant net debt is relative to total equity. The derivatives are reported on the balance sheet within the headings ‘Derivative financial instruments’. All components of equity are included in the denominator of the calculation.
At 31 December 2021, gearing was 25.3% (2020 31.3%).
| | | | | | | | | | | |
| | | $ million |
| At 31 December | | 2021 | 2020 |
| Finance debt | | 61,176 | | 72,664 | |
Less: fair value asset (liability) of hedges related to finance debta | | (118) | | 2,612 | |
| | 61,294 | | 70,052 | |
| Less: cash and cash equivalents | | 30,681 | | 31,111 | |
| Net debt | | 30,613 | | 38,941 | |
| Total equity | | 90,439 | | 85,568 | |
| Gearing | | 25.3 | % | 31.3 | % |
a Derivative financial instruments entered into for the purpose of managing interest rate and foreign currency exchange risk associated with net debt with a fair value liability position of $166 million (2020 liability of $236 million) are not included in the calculation of net debt shown above as hedge accounting was not applied for these instruments.
An analysis of changes in liabilities arising from financing activities is provided below.
| | | | | | | | | | | | | | | | | | | | |
| | | | | | $ million |
| | Finance
debt | Currency swapsa | Lease liabilities | Net partner payable for leases entered into on behalf of joint operations | Total liabilities arising from financing activities |
| At 1 January 2021 | | 72,664 | | (2,965) | | 9,262 | | 267 | | 79,228 | |
| Exchange adjustments | | (185) | | — | | (215) | | — | | (400) | |
| Net financing cash flow | | (8,575) | | (126) | | (2,082) | | (40) | | (10,823) | |
| Fair value (gains) losses | | (2,578) | | 3,562 | | — | | — | | 984 | |
| New and remeasured leases/joint operation payables | | — | | — | | 1,767 | | 23 | | 1,790 | |
| Other movements | | (150) | | 10 | | (121) | | — | | (261) | |
| At 31 December 2021 | | 61,176 | | 481 | | 8,611 | | 250 | | 70,518 | |
| | | | | | |
| At 1 January 2020 | | 67,724 | | 918 | | 9,722 | | 290 | | 78,654 | |
| Exchange adjustments | | 349 | | — | | 181 | | 4 | | 534 | |
| Net financing cash flow | | 1,589 | | (226) | | (2,442) | | (40) | | (1,119) | |
| Fair value (gains) losses | | 2,612 | | (3,734) | | — | | — | | (1,122) | |
| New and remeasured leases/joint operations payables | | — | | — | | 1,579 | | 20 | | 1,599 | |
| Other movements | | 390 | | 77 | | 222 | | (7) | | 682 | |
| At 31 December 2020 | | 72,664 | | (2,965) | | 9,262 | | 267 | | 79,228 | |
a Currency swaps include cross currency interest rate swaps.
The finance debt and currency swap balances above do not include accrued interest, which is reported within other receivables and other payables on the balance sheet and for which the associated cash flows are presented as operating cash flows in the group cash flow statement. The currency swaps are reported on the balance sheet within the headings 'Derivative financial instruments' and are subsets of both derivatives held for trading and derivatives designated in fair value hedge relationships as detailed in Note 29. When hedge accounting is applied to these derivatives they are included in the calculation of net debt shown above.
| | | | | | | | | | | | | | |
| | bp Annual Report and Form 20-F 2021 | | 227 |
27. Leases
The group leases a number of assets as part of its activities. This primarily includes drilling rigs in the oil production & operations and gas & low carbon energy segments and retail service stations, oil depots and storage tanks in the customer & products segment as well as office accommodation and vessel charters across the group. The weighted-average remaining lease term for the total lease portfolio is around 8 years (2020 8 years). Some leases have payments that vary with market interest or inflation rates. Certain leases contain residual value guarantees, which may be triggered in certain circumstances such as if market values have significantly declined at the conclusion of the lease.
The table below shows the timing of the undiscounted cash outflows for the lease liabilities included on the balance sheet.
| | | | | | | | | | | |
| | | $ million |
| | 2021 | 2020 |
| Undiscounted lease liability cash flows due: | | | |
| Within 1 year | | 1,949 | | 2,262 | |
| 1 to 2 years | | 1,631 | | 1,672 | |
| 2 to 3 years | | 1,207 | | 1,340 | |
| 3 to 4 years | | 1,005 | | 1,025 | |
| 4 to 5 years | | 682 | | 878 | |
| 5 to 10 years | | 2,089 | | 2,192 | |
| Over 10 years | | 1,462 | | 1,515 | |
| | 10,025 | | 10,884 | |
| Impact of discounting | | (1,414) | | (1,622) | |
| Lease liabilities at 31 December | | 8,611 | | 9,262 | |
| Of which – current | | 1,747 | | 1,933 | |
– non-current | | 6,864 | | 7,329 | |
The group may enter into lease arrangements a number of years before taking control of the underlying asset due to construction lead times or to secure future operational requirements. The total undiscounted amount for future commitments for leases not yet commenced as at 31 December 2021 is $4,996 million (2020 $5,309 million). The majority of this future commitment relates to the floating LNG vessel to service the Greater Tortue Ahmeyim project from 2023.
| | | | | | | | | | | |
| | | $ million |
| | 2021 | 2020 |
Total cash outflow for amounts included in lease liabilitiesa | | 2,372 | | 2,779 | |
Expense for variable payments not included in the lease liabilitya | | 37 | | 41 | |
Short-term lease expensea | | 409 | | 621 | |
| Additions to right-of-use assets in the period | | 1,807 | | 1,714 | |
| (Loss) gain on sale and leaseback transactions | | (1) | | 187 | |
a The cash outflows for amounts not included in lease liabilities approximate the income statement expenses disclosed above.
An analysis of right-of-use assets and depreciation is provided in Note 11. An analysis of lease interest expense is provided in Note 6.
28. Financial instruments and financial risk factors
The accounting classification of each category of financial instruments and their carrying amounts are set out below.
| | | | | | | | | | | | | | | | | | | | | | | |
| | | | | | | $ million |
| At 31 December 2021 | | Note | | Measured at amortized cost | Mandatorily measured at fair value through profit or loss | Derivative hedging instruments | Total carrying
amount |
| Financial assets | | | | | | | |
| Other investments | | 17 | | | — | | 2,824 | | — | | 2,824 | |
| Loans | | | | 1,045 | | 232 | | — | | 1,277 | |
| Trade and other receivables | | 19 | | | 27,191 | | — | | — | | 27,191 | |
| Derivative financial instruments | | 29 | | | — | | 12,402 | | 348 | | 12,750 | |
| Cash and cash equivalents | | 24 | | | 27,107 | | 3,574 | | — | | 30,681 | |
| Financial liabilities | | | | | | | |
| Trade and other payables | | 21 | | | (58,660) | | — | | — | | (58,660) | |
| Derivative financial instruments | | 29 | | | — | | (13,456) | | (465) | | (13,921) | |
| Accruals | | | | (6,606) | | — | | — | | (6,606) | |
| Lease liabilities | | 27 | | | (8,611) | | — | | — | | (8,611) | |
| Finance debt | | 25 | | | (61,176) | | — | | — | | (61,176) | |
| | | | (79,710) | | 5,576 | | (117) | | (74,251) | |
| | | | | | | | | | | | | | |
228 | | bp Annual Report and Form 20-F 2021 | | |
28. Financial instruments and financial risk factors – continued
| | | | | | | | | | | | | | | | | | | | | | | |
| | | | | | | $ million |
| At 31 December 2020 | | Note | | Measured at amortized cost | Mandatorily measured at fair value through profit or loss | Derivative hedging instruments | Total carrying
amount |
| Financial assets | | | | | | | |
| Other investments | | 17 | | | — | | 3,079 | | — | | 3,079 | |
| Loans | | | | 929 | | 369 | | — | | 1,298 | |
| Trade and other receivables | | 19 | | | 20,252 | | — | | — | | 20,252 | |
| Derivative financial instruments | | 29 | | | — | | 10,049 | | 2,698 | | 12,747 | |
| Cash and cash equivalents | | 24 | | | 24,905 | | 6,206 | | — | | 31,111 | |
| Financial liabilities | | | | | | | |
| Trade and other payables | | 21 | | | (44,960) | | — | | — | | (44,960) | |
| Derivative financial instruments | | 29 | | | — | | (8,320) | | (82) | | (8,402) | |
| Accruals | | | | (5,502) | | — | | — | | (5,502) | |
| Lease liabilities | | 27 | | | (9,262) | | — | | — | | (9,262) | |
| Finance debt | | 25 | | | (72,664) | | — | | — | | (72,664) | |
| | | | (86,302) | | 11,383 | | 2,616 | | (72,303) | |
The fair value of finance debt is shown in Note 25. For all other financial instruments within the scope of IFRS 9, the carrying amount is either the fair value, or approximates the fair value.
Information on gains and losses on derivative financial assets and financial liabilities classified as measured at fair value through profit or loss is provided in the derivative gains and losses section of Note 29. Fair value gains and losses related to other assets and liabilities classified as measured at fair value through profit or loss totalled a net gain of $627 million (2020 net gain of $367 million). Dividend income of $11 million (2020 $17 million) from investments in equity instruments classified as measured at fair value through profit or loss is presented within other income - see Note 6.
Interest income and expenses arising on financial instruments are disclosed in Note 6.
Financial risk factors
The group is exposed to a number of different financial risks arising from natural business exposures as well as its use of financial instruments including market risks relating to commodity prices; foreign currency exchange rates and interest rates; credit risk; and liquidity risk.
The group financial risk committee (GFRC) advises the chief financial officer (CFO) who oversees the management of these risks. The GFRC is chaired by the CFO and consists of a group of senior managers including the EVP trading and shipping and SVPs treasury, tax, accounting reporting control and planning & performance management. The purpose of the committee is to advise on financial risks and the appropriate financial risk governance framework for the group. The committee provides assurance to the CFO and the chief executive officer (CEO), and via the CEO to the board, that the group’s financial risk-taking activity is governed by appropriate policies and procedures and that financial risks are identified, measured and managed in accordance with group policies and group risk appetite.
The group’s trading activities in the oil, natural gas, LNG and power markets are managed within the trading and shipping business. Treasury holds foreign exchange and interest-rate products in the financial markets to hedge group exposures related to debt and hybrid bond issuance; the compliance, control and risk management processes for these activities are managed within the treasury business. All other foreign exchange and interest rate activities within financial markets are performed within the trading and shipping business and are also underpinned by the compliance, control and risk management infrastructure common to the activities of bp’s trading and shipping business. All derivative activity is carried out by specialist teams that have the appropriate skills, experience and supervision. These teams are subject to close financial and management control.
The trading and shipping business maintains formal governance processes that provide oversight of market risk, credit risk and operational risk associated with trading activity. A policy and risk committee approves value-at-risk delegations, reviews incidents and validates risk-related policies, methodologies and procedures. A commitments committee approves the trading of new products, instruments and strategies and material commitments.
In addition, the trading and shipping business undertakes derivative activity for risk management purposes under a control framework as described more fully below.
(a) Market risk
Market risk is the risk or uncertainty arising from possible market price movements and their impact on the future performance of a business. The primary commodity price risks that the group is exposed to include oil, natural gas and power prices that could adversely affect the value of the group’s financial assets, liabilities or expected future cash flows. The group enters into derivatives in a well-established entrepreneurial trading operation. In addition, the group has developed a control framework aimed at managing the volatility inherent in certain of its natural business exposures. In accordance with the control framework the group enters into various transactions using derivatives for risk management purposes.
The major components of market risk are commodity price risk, foreign currency exchange risk and interest rate risk, each of which is discussed below.
(i) Commodity price risk
The group’s trading and shipping business is responsible for delivering value across the overall crude, oil products, gas, LNG and power supply chains. As such, it routinely enters into spot and term physical commodity contracts in addition to optimising physical storage, pipeline and transportation capacity. These activities expose the group to commodity price risk which is managed by entering into oil and natural gas and power swaps, options and futures.
The group measures market risk exposure arising from its trading positions in liquid periods using value-at-risk techniques based on Monte Carlo simulation models. These techniques make a statistical assessment of the market risk arising from possible future changes in market prices over a one-day holding period within a 95% confidence level. Trading activity occurring in liquid periods is subject to value-at-risk and other limits for each trading activity and the aggregate of all trading activity. The calculation of potential changes in value within the liquid period considers positions, historical price movements and the correlation of these price movements. Models are regularly reviewed against actual fair value movements to ensure integrity is
| | | | | | | | | | | | | | |
| | bp Annual Report and Form 20-F 2021 | | 229 |
28. Financial instruments and financial risk factors – continued
maintained. The value-at-risk measure is supplemented by stress testing and scenario analysis through simulating the financial impact of certain physical, economic and geo-political scenarios. The value-at-risk measure in respect of the aggregated trading positions in liquid periods at 31 December 2021 was $100 million (2020 $40 million) whereas the average value-at-risk measure for the period was $64 million (2020 $56 million). This measure incorporates the effect of diversification reflecting the offsetting risks across the trading portfolio. Alternative measures are used to monitor exposures which are outside of liquid periods and for which value-at-risk techniques are not appropriate.
(ii) Foreign currency exchange risk
Since bp has global operations, fluctuations in foreign currency exchange rates can have a significant effect on the group’s reported results and future expenditure commitments. The effects of most exchange rate fluctuations are absorbed in business operating results through changing cost competitiveness, lags in market adjustment to movements in rates and translation differences accounted for on specific transactions. For this reason, the total effect of exchange rate fluctuations is not identifiable separately in the group’s reported results. The main underlying economic currency of the group’s cash flows is the US dollar. This is because bp’s major product, oil, is priced internationally in US dollars. bp’s foreign currency exchange management policy is to limit economic and material transactional exposures arising from currency movements against the US dollar. The group co-ordinates the handling of foreign currency exchange risks centrally, by netting off naturally-occurring opposite exposures wherever possible and then managing any material residual foreign currency exchange risks.
Most of the group’s borrowings are in US dollars or are hedged with respect to the US dollar. At 31 December 2021, the total foreign currency borrowings not swapped into US dollars amounted to $211 million (2020 $321 million). The group also has in issue perpetual subordinated hybrid bonds in euro, sterling and US dollars. Whilst the contractual terms of these instruments allow the group to defer coupon payments and the repayment of principal indefinitely, the group has chosen to manage the foreign currency exposure relating to the non-US dollar hybrid bonds to their respective first call periods.
The group manages the net residual foreign currency exposures by constantly reviewing the foreign currency economic value at risk and aims to manage such risk to keep the 12-month foreign currency value at risk below $400 million. At no point over the past three years did the value at risk exceed the maximum risk limit. A continuous assessment is made in respect of the group’s foreign currency exposures to capture hedging requirements.
During the year, hedge accounting was applied to foreign currency exposure to highly probable forecast capital expenditure commitments. The group fixes the US dollar cost of non-US dollar supplies by using currency forwards for the highly probable forecast capital expenditure. At 31 December 2021 the most significant open contracts in place were for $55 million sterling (2020 $124 million sterling).
Where the group enters into foreign currency exchange contracts for entrepreneurial trading purposes the activity is controlled using trading value-at-risk techniques as explained in (i) commodity price risk above.
(iii) Interest rate risk
bp is also exposed to interest rate risk from the possibility that changes in interest rates will affect future cash flows or the fair values of its financial instruments, principally finance debt. While the group issues debt and hybrid bonds in a variety of currencies based on market opportunities, it uses derivatives to swap the economic exposure to a floating rate basis, mainly to US dollar floating, but in certain defined circumstances maintains a US dollar fixed rate exposure for a proportion of debt. The proportion of floating rate debt net of interest rate swaps at 31 December 2021 was 41% of total finance debt outstanding (2020 45%). The weighted average interest rate on finance debt at 31 December 2021 was 3% (2020 3%) and the weighted average maturity of fixed rate debt was twelve years (2020 eight years).
The group’s earnings are sensitive to changes in interest rates on the element of the group’s finance debt that has been swapped to floating rates. If the interest rates applicable to these floating rate instruments were to have changed by one percentage point on 1 January 2022, it is estimated that the group’s finance costs for 2022 would change by approximately $251 million (2020 $330 million).
bp is exposed to benchmark interest rate components; primarily 3 month USD LIBOR. From 31 December 2021 some USD LIBOR tenors, and all EUR, GBP and CHF LIBOR tenors ceased to be published. The remaining USD LIBOR tenors, including 3 month USD LIBOR, will continue to be published until June 2023.
In October 2020 the International Swaps and Derivatives Association (ISDA) published its fallback protocol containing clauses to amend derivative contracts on the cessation of LIBOR should an entity and its counterparties adhere to the protocol. The protocol’s pricing mechanism is at fair market value and bp has signed up to the protocol as this removes transition uncertainty for any interest rate and cross-currency interest rate swap contracts of the group. Market participants have been encouraged by regulators to switch to the new risk free rates to increase market activity and liquidity as they move away from LIBOR. bp continues to monitor regulatory and market developments over the course of the transition.
During 2021, bp's internal working group for IBOR reform has continued to monitor market developments and manage transition to alternative benchmark rates. The working group has identified financial instruments that are linked to existing interest rate benchmarks, primarily, borrowings and derivative contracts. Financial instruments and relevant agreements exposed to EUR, GBP and CHF have transitioned to alternative benchmarks at 31 December 2021. As at 31 December 2021 finance debt with a carrying value of $2,062 million and derivatives with a nominal value of $24,088 million are exposed to USD LIBOR and are expected to transition to alternative benchmark rates. The derivatives comprise relevant derivative contracts hedging finance debt and hybrid bonds all of which are covered by the ISDA fallback protocol. For finance debt, negotiations with relevant counterparties are ongoing and transition is expected before the end of June 2023. Any derivatives not actively transitioned before the end of June 2023 will be transitioned through the ISDA protocol. New contracts are being executed based on the new risk free rates. The working group continues to implement the relevant IT and operational requirements needed. bp continues to participate in external committees and task forces dedicated to interest rate benchmark reform.
(b) Credit risk
Credit risk is the risk that a customer or counterparty to a financial instrument will fail to perform or fail to pay amounts due causing financial loss to the group and arises from cash and cash equivalents, derivative financial instruments and deposits with financial institutions and principally from credit exposures to customers relating to outstanding receivables. Credit exposure also exists in relation to guarantees issued by group companies under which the outstanding exposure incremental to that recognized on the balance sheet at 31 December 2021 was $1,407 million (2020 $1,405 million) in respect of liabilities of joint ventures and associates and $694 million (2020 $661 million) in respect of liabilities of other third parties. Maturity dates vary, and guarantees will terminate on payment and/or cancellation of the obligation. In general, a payment under the guarantee contract would be triggered by failure of the guaranteed party to fulfil its obligation covered by the guarantee.
| | | | | | | | | | | | | | |
230 | | bp Annual Report and Form 20-F 2021 | | |
28. Financial instruments and financial risk factors – continued
The group has a credit policy, approved by the CFO that is designed to ensure that consistent processes are in place throughout the group to measure and control credit risk. Credit risk is considered as part of the risk-reward balance of doing business. On entering into any business contract the extent to which the arrangement exposes the group to credit risk is considered. Key requirements of the policy include segregation of credit approval authorities from any sales, marketing or trading teams authorized to incur credit risk; the establishment of credit systems and processes to ensure that all counterparty exposure is rated and that all counterparty exposure and limits can be monitored and reported; and the timely identification and reporting of any non-approved credit exposures and credit losses. While each segment is responsible for its own credit risk management and reporting consistent with group policy, treasury holds group-wide credit risk authority and oversight responsibility for exposure to banks and financial institutions.
For the purposes of financial reporting the group calculates expected loss allowances based on the maximum contractual period over which the group is exposed to credit risk. Lifetime expected credit losses are recognized for trade receivables and the credit risk associated with the significant majority of financial assets measured at amortized cost is considered to be low. Since the tenor of substantially all of the group's in-scope financial assets is less than 12 months there is no significant difference between the measurement of 12-month and lifetime expected credit losses. Expected loss allowances for financial guarantee contracts are typically lower than their initial fair value less, where appropriate, amortization. Financial assets are considered to be credit-impaired when there is reasonable and supportable evidence that one or more events that have a detrimental impact on the estimated future cash flows of the financial asset have occurred. This includes observable data concerning significant financial difficulty of the counterparty; a breach of contract; concession being granted to the counterparty for economic or contractual reasons relating to the counterparty’s financial difficulty, that would not otherwise be considered; it becoming probable that the counterparty will enter bankruptcy or other financial re-organization or an active market for the financial asset disappearing because of financial difficulties. The group also applies a rebuttable presumption that an asset is credit-impaired when contractual payments are more than 30 days past due. Where the group has no reasonable expectation of recovering a financial asset in its entirety or a portion thereof, for example where all legal avenues for collection of amounts due have been exhausted, the financial asset (or relevant portion) is written off.
The measurement of expected credit losses is a function of the probability of default, loss given default (i.e. the magnitude of the loss after recovery if there is a default) and the exposure at default (i.e. the asset's carrying amount). The group allocates a credit risk rating to exposures based on data that is determined to be predictive of the risk of loss, including but not limited to external ratings. Probabilities of default derived from historical, current and future-looking market data are assigned by credit risk rating with a loss given default based on historical experience and relevant market and academic research applied by exposure type. Experienced credit judgement is applied to ensure probabilities of default are reflective of the credit risk associated with the group's exposures. Credit enhancements that would reduce the group's credit losses in the event of default are reflected in the calculation when they are considered integral to the related asset.
The maximum credit exposure associated with financial assets is equal to the carrying amount. The group does not aim to remove credit risk entirely but expects to experience a certain level of credit losses. As at 31 December 2021, the group had in place credit enhancements designed to mitigate approximately $9.5 billion (2020 $5.4 billion) of credit risk of which approximately $7.5 billion (2020 $4.9 billion) related to assets in the scope of IFRS 9's impairment requirements. Credit enhancements include standby and documentary letters of credit, bank guarantees, insurance and liens which are typically taken out with financial institutions who have investment grade credit ratings, or are liens over assets held by the counterparty of the related receivables. Reports are regularly prepared and presented to the GFRC that cover the group’s overall credit exposure and expected loss trends, exposure by segment, and overall quality of the portfolio.
Management information used to monitor credit risk, which reflects the impact of credit enhancements, indicates that the risk profile of financial assets which are subject to review for impairment under IFRS 9 is as set out below.
| | | | | | | | | | | |
| | | % |
| As at 31 December | | 2021 | 2020 |
| AAA to AA- | | 14 | % | 11 | % |
| A+ to A- | | 46 | % | 59 | % |
| BBB+ to BBB- | | 14 | % | 8 | % |
| BB+ to BB- | | 8 | % | 6 | % |
| B+ to B- | | 16 | % | 13 | % |
| CCC+ and below | | 2 | % | 3 | % |
Movements in the impairment provision for trade and other receivables are shown in Note 20.
| | | | | | | | | | | | | | |
| | bp Annual Report and Form 20-F 2021 | | 231 |
28. Financial instruments and financial risk factors – continued
Financial instruments subject to offsetting, enforceable master netting arrangements and similar agreements
The following table shows the amounts recognized for financial assets and liabilities which are subject to offsetting arrangements on a gross basis, and the amounts offset in the balance sheet.
Amounts which cannot be offset under IFRS, but which could be settled net under the terms of master netting agreements if certain conditions arise, and collateral received or pledged, are also presented in the table to show the total net exposure of the group.
| | | | | | | | | | | | | | | | | | | | | | | |
| | | | | | | $ million |
| | Gross amounts of recognized financial assets (liabilities) | Amounts
set off | Net amounts
presented on
the balance
sheet | Related amounts not set off
in the balance sheet | Net amount |
| At 31 December 2021 | | Master
netting
arrangements | Cash
collateral
(received)
pledged |
| Derivative assets | | 20,519 | | (7,769) | | 12,750 | | (3,104) | | (414) | | 9,232 | |
| Derivative liabilities | | (21,683) | | 7,769 | | (13,914) | | 3,104 | | — | | (10,810) | |
| Trade and other receivables | | 17,105 | | (8,104) | | 9,001 | | (1,038) | | (249) | | 7,714 | |
| Trade and other payables | | (19,279) | | 8,104 | | (11,175) | | 1,038 | | — | | (10,137) | |
| At 31 December 2020 | | | | | | | |
| Derivative assets | | 14,765 | | (2,019) | | 12,746 | | (2,075) | | (386) | | 10,285 | |
| Derivative liabilities | | (10,414) | | 2,019 | | (8,395) | | 2,075 | | — | | (6,320) | |
Trade and other receivablesa | | 7,772 | | (3,679) | | 4,093 | | (823) | | (122) | | 3,148 | |
Trade and other payablesa | | (8,836) | | 3,679 | | (5,157) | | 823 | | — | | (4,334) | |
a Certain comparative amounts have been amended to align with balance sheet presentation.
(c) Liquidity risk
Liquidity risk is the risk that suitable sources of funding for the group’s business activities may not be available. The group’s liquidity is managed centrally with operating units forecasting their cash and currency requirements to the central treasury function. Unless restricted by local regulations, generally subsidiaries pool their cash surpluses to the treasury function, which will then arrange to fund other subsidiaries’ requirements, or invest any net surplus in the market or arrange for necessary external borrowings, while managing the group’s overall net currency positions.
The group benefits from open credit provided by suppliers who generally sell on five to 60-day payment terms in accordance with industry norms. bp utilizes various arrangements in order to manage its working capital and reduce volatility in cash flow. This includes discounting of receivables and, in the supply and trading businesses, managing inventory, collateral and supplier payment terms within a maximum of 60 days.
It is normal practice in the oil and gas supply and trading business for customers and suppliers to utilize letter of credit (LC) facilities to mitigate credit and non-performance risk. Consequently, LCs facilitate active trading in a global market where credit and performance risk can be significant. In common with the industry, bp routinely provides LCs to some of its suppliers.
The group has committed LC facilities totalling $12,575 million (2020 $11,325 million), allowing LCs to be issued for a maximum 24-month duration. There were also uncommitted secured LC facilities in place at 31 December 2021 for $4,290 million (2020 $3,460 million), which are secured against inventories or receivables when utilized. The facilities are held with over 26 international banks. The uncommitted LC facilities can only be terminated by either party giving a stipulated termination notice to the other.
In certain circumstances, the supplier has the option to request accelerated payment from the LC provider in order to further reduce their exposure. bp’s payments are made to the provider of the LC rather than the supplier according to the original contractual payment terms. At 31 December 2021, $9,154 million (2020 $5,250 million) of the group’s trade payables subject to these arrangements were payable to LC providers, with no material exposure to any individual provider. If these facilities were not available, this could result in renegotiation of payment terms with suppliers such that settlement periods were shorter.
Standard & Poor’s Ratings long-term credit rating for bp is A- (stable) and Moody’s Investors Service rating is A2 (stable) and the Fitch Ratings' long-term credit rating is A (stable).
During 2021, $6 billion (2020 $14 billion) of long-term taxable bonds were issued with terms ranging from twenty to forty years. In addition the group issued perpetual hybrid bonds with a US dollar equivalent value of $0.9 billion (2020 $11.9 billion). Commercial paper is issued at competitive rates to meet short-term borrowing requirements as and when needed.
As a further liquidity measure, the group continues to maintain suitable levels of cash and cash equivalents, amounting to $30.7 billion at 31 December 2021 (2020 $31.1 billion), primarily invested with highly rated banks or money market funds and readily accessible at immediate and short notice. At 31 December 2021, the group had substantial amounts of undrawn borrowing facilities available, consisting of an undrawn committed $8.0 billion (2020 $10.0 billion) credit facility and $4.0 billion (2020 $7.6 billion) of standby facilities. As at 31 December 2021 the credit facility and standby facilities were available for two and four years respectively. The facilities are with 27 international banks and borrowings under them would be at pre-agreed rates. In February 2022 these facilities were extended for a further year.
For further information on the group's sources and uses of cash see Liquidity and capital resources on page 342.
The group manages liquidity risk associated with derivative contracts, other than derivative hedging instruments, based on the expected maturities of both derivative assets and liabilities as indicated in Note 29. Management does not currently anticipate any cash flows, other than noted below, that could be of a significantly different amount or could occur earlier than the expected maturity analysis provided.
| | | | | | | | | | | | | | |
232 | | bp Annual Report and Form 20-F 2021 | | |
28. Financial instruments and financial risk factors – continued
The table below shows the timing of undiscounted cash outflows relating to finance debt, trade and other payables and accruals. As part of actively managing the group’s debt portfolio it is possible that cash flows in relation to finance debt could be accelerated from the profile provided.
| | | | | | | | | | | | | | | | | | | | | | | | | | | | | |
| | | | | | | | | $ million |
| | | | | 2021 | | | | 2020 |
| | Trade and other payablesa | Accruals | Finance
debt | Interest on finance debt | Trade and other payablesa | Accruals | Finance
debt | Interest on finance debt |
| Within one year | | 48,497 | | 5,638 | | 5,370 | | 1,497 | | 33,290 | | 4,650 | | 9,119 | | 1,778 | |
| 1 to 2 years | | 1,627 | | 209 | | 4,425 | | 1,341 | | 1,728 | | 157 | | 6,292 | | 1,477 | |
| 2 to 3 years | | 1,346 | | 108 | | 5,953 | | 1,204 | | 1,590 | | 184 | | 7,031 | | 1,305 | |
| 3 to 4 years | | 1,328 | | 144 | | 5,958 | | 1,047 | | 1,332 | | 87 | | 8,047 | | 1,110 | |
| 4 to 5 years | | 1,146 | | 56 | | 5,504 | | 896 | | 1,335 | | 217 | | 6,652 | | 919 | |
| 5 to 10 years | | 5,695 | | 218 | | 16,483 | | 2,705 | | 4,570 | | 108 | | 22,156 | | 2,408 | |
| Over 10 years | | 1,699 | | 233 | | 14,744 | | 1,699 | | 4,419 | | 99 | | 10,008 | | 1,037 | |
| | 61,338 | | 6,606 | | 58,437 | | 10,389 | | 48,264 | | 5,502 | | 69,305 | | 10,034 | |
a 2021 includes $13,170 million (2020 $14,569 million) in relation to the Gulf of Mexico oil spill, of which $11,883 million (2020 $13,160 million) matures in greater than one year.
The table below shows the timing of cash outflows for derivative financial instruments entered into for the purpose of managing interest rate and foreign currency exchange risk, whether or not hedge accounting is applied, based upon contractual payment dates. As part of actively managing the group’s debt portfolio it is possible that cash flows in relation to associated derivatives could be accelerated from the profile provided. The amounts reflect the gross settlement amount where the pay leg of a derivative will be settled separately from the receive leg, as in the case of cross-currency swaps hedging non-US dollar finance debt or hybrid bonds. The swaps are with high investment-grade counterparties and therefore the settlement-day risk exposure is considered to be negligible. Not shown in the table are the gross settlement amounts (inflows) for the receive leg of derivatives that are settled separately from the pay leg, which amount to $27,048 million at 31 December 2021 (2020 $33,704 million) to be received on the same day as the related cash outflows.
| | | | | | | | | | | |
| | | $ million |
| Cash outflows for derivative financial instruments at 31 December | | 2021 | 2020 |
| Within one year | | 1,497 | | 2,384 | |
| 1 to 2 years | | 1,492 | | 1,976 | |
| 2 to 3 years | | 2,531 | | 2,017 | |
| 3 to 4 years | | 2,053 | | 3,074 | |
| 4 to 5 years | | 5,575 | | 2,582 | |
| 5 to 10 years | | 8,618 | | 15,263 | |
| Over 10 years | | 5,365 | | 4,483 | |
| | | 27,131 | | 31,779 | |
For further information on our derivative financial instruments, see Note 29.
29. Derivative financial instruments
In the normal course of business the group enters into derivative financial instruments (derivatives) to manage its normal business exposures in relation to commodity prices, foreign currency exchange rates and interest rates, including management of the balance between floating rate and fixed rate debt, consistent with risk management policies and objectives. An outline of the group’s financial risks and the objectives and policies pursued in relation to those risks is set out in Note 28. Additionally, the group has a well-established entrepreneurial trading operation that is undertaken in conjunction with these activities using a similar range of contracts.
For information on significant estimates and judgements made in relation to the valuation of derivatives see Derivative financial instruments within Note 1.
The fair values of derivative financial instruments at 31 December are set out below.
Exchange traded derivatives are valued using closing prices provided by the exchange as at the balance sheet date. These derivatives are categorized within level 1 of the fair value hierarchy. Exchange traded derivatives are typically considered settled through the (normally daily) payment or receipt of variation margin.
Over-the-counter (OTC) financial swaps, forwards and physical commodity sale and purchase contracts are generally valued using readily available information in the public markets and quotations provided by brokers and price index developers. These quotes are corroborated with market data and are categorized within level 2 of the fair value hierarchy.
In certain less liquid markets, or for longer-term contracts, forward prices are not as readily available. In these circumstances, OTC financial swaps and physical commodity sale and purchase contracts are valued using internally developed methodologies that consider historical relationships between various commodities, and that result in management’s best estimate of fair value. These contracts are categorized within level 3 of the fair value hierarchy.
| | | | | | | | | | | | | | |
| | bp Annual Report and Form 20-F 2021 | | 233 |
29. Derivative financial instruments – continued
Financial OTC and physical commodity options are valued using industry standard models that consider various assumptions, including quoted forward prices for commodities, time value, volatility factors, and contractual prices for the underlying instruments, as well as other relevant economic factors. The degree to which these inputs are observable in the forward markets determines whether the option is categorized within level 2 or level 3 of the fair value hierarchy.
| | | | | | | | | | | | | | | | | |
| | | | | $ million |
| | | 2021 | | 2020 |
| | Fair value
asset | Fair value
liability | Fair value
asset | Fair value
liability |
| Derivatives held for trading | | | | | |
| Currency derivatives | | 272 | | (643) | | 858 | | (694) | |
| Oil price derivatives | | 2,192 | | (1,567) | | 1,519 | | (1,093) | |
| Natural gas price derivatives | | 6,823 | | (8,273) | | 6,406 | | (5,489) | |
| Power price derivatives | | 3,105 | | (2,966) | | 1,258 | | (1,037) | |
| Other derivatives | | 10 | | — | | 7 | | — | |
| | 12,402 | | (13,449) | | 10,048 | | (8,313) | |
| Embedded derivatives | | | | | |
| | | | | |
| Other embedded derivatives | | — | | (7) | | 1 | | (7) | |
| | — | | (7) | | 1 | | (7) | |
| Cash flow hedges | | | | | |
| Currency forwards | | 1 | | — | | 4 | | — | |
| | | | | |
Gas price futures | | — | | — | | — | | — | |
| | 1 | | — | | 4 | | — | |
| Fair value hedges | | | | | |
| Currency swaps | | 326 | | (465) | | 2,614 | | (82) | |
| Interest rate swaps | | 21 | | — | | 80 | | — | |
| | 347 | | (465) | | 2,694 | | (82) | |
| | 12,750 | | (13,921) | | 12,747 | | (8,402) | |
| Of which – current | | 5,744 | | (7,565) | | 2,992 | | (2,998) | |
– non-current | | 7,006 | | (6,356) | | 9,755 | | (5,404) | |
Derivatives held for trading
The group maintains active trading positions in a variety of derivatives. The contracts may be entered into for risk management purposes, to satisfy supply requirements or for entrepreneurial trading. Certain contracts are classified as held for trading, regardless of their original business objective, and are recognized at fair value with changes in fair value recognized in the income statement. Trading activities are undertaken by using a range of contract types in combination to create incremental gains by arbitraging prices between markets, locations and time periods. The net of these exposures is monitored using market value-at-risk techniques as described in Note 28.
The following tables show further information on the fair value of derivatives and other financial instruments held for trading purposes.
Derivative assets held for trading have the following fair values and maturities.
| | | | | | | | | | | | | | | | | | | | | | | | | | |
| | | | | | | | $ million |
| | | | | | | | 2021 |
| | Less than
1 year | 1-2 years | 2-3 years | 3-4 years | 4-5 years | Over
5 years | Total |
| Currency derivatives | | 168 | | 52 | | 1 | | 1 | | — | | 50 | | 272 | |
| Oil price derivatives | | 1,544 | | 429 | | 167 | | 47 | | 4 | | 1 | | 2,192 | |
| Natural gas price derivatives | | 2,678 | | 847 | | 547 | | 456 | | 368 | | 1,927 | | 6,823 | |
| Power price derivatives | | 1,322 | | 553 | | 285 | | 174 | | 124 | | 647 | | 3,105 | |
| Other derivatives | | — | | 7 | | — | | — | | — | | 3 | | 10 | |
| | 5,712 | | 1,888 | | 1,000 | | 678 | | 496 | | 2,628 | | 12,402 | |
| | | | | | | | |
| | | | | | | | $ million |
| | | | | | | | 2020 |
| | Less than
1 year | 1-2 years | 2-3 years | 3-4 years | 4-5 years | Over
5 years | Total |
| Currency derivatives | | 153 | | 9 | | 3 | | 2 | | 2 | | 689 | | 858 | |
| Oil price derivatives | | 1,159 | | 197 | | 90 | | 63 | | 7 | | 3 | | 1,519 | |
| Natural gas price derivatives | | 1,210 | | 731 | | 596 | | 525 | | 476 | | 2,868 | | 6,406 | |
| Power price derivatives | | 425 | | 223 | | 161 | | 107 | | 76 | | 266 | | 1,258 | |
| Other derivatives | | — | | — | | 7 | | — | | — | | — | | 7 | |
| | 2,947 | | 1,160 | | 857 | | 697 | | 561 | | 3,826 | | 10,048 | |
| | | | | | | | | | | | | | |
234 | | bp Annual Report and Form 20-F 2021 | | |
29. Derivative financial instruments – continued
Derivative liabilities held for trading have the following fair values and maturities.
| | | | | | | | | | | | | | | | | | | | | | | | | | |
| | | | | | | | $ million |
| | | | | | | | 2021 |
| | Less than
1 year | 1-2 years | 2-3 years | 3-4 years | 4-5 years | Over
5 years | Total |
| Currency derivatives | | (191) | | (2) | | (13) | | (5) | | (173) | | (259) | | (643) | |
| Oil price derivatives | | (1,340) | | (179) | | (39) | | (7) | | (2) | | — | | (1,567) | |
| Natural gas price derivatives | | (4,551) | | (1,053) | | (460) | | (351) | | (282) | | (1,576) | | (8,273) | |
| Power price derivatives | | (1,485) | | (601) | | (211) | | (135) | | (92) | | (442) | | (2,966) | |
| | (7,567) | | (1,835) | | (723) | | (498) | | (549) | | (2,277) | | (13,449) | |
| | | | | | | | |
| | | | | | | | $ million |
| | | | | | | | 2020 |
| | Less than
1 year | 1-2 years | 2-3 years | 3-4 years | 4-5 years | Over
5 years | Total |
| Currency derivatives | | (502) | | (117) | | (11) | | (1) | | — | | (63) | | (694) | |
| Oil price derivatives | | (1,000) | | (83) | | (9) | | (1) | | — | | — | | (1,093) | |
| Natural gas price derivatives | | (1,095) | | (595) | | (479) | | (422) | | (348) | | (2,550) | | (5,489) | |
| Power price derivatives | | (345) | | (184) | | (126) | | (81) | | (68) | | (233) | | (1,037) | |
| | (2,942) | | (979) | | (625) | | (505) | | (416) | | (2,846) | | (8,313) | |
The following table shows the fair value of derivative assets and derivative liabilities held for trading, analysed by maturity period and by methodology of fair value estimation. This information is presented on a gross basis, that is, before netting by counterparty.
| | | | | | | | | | | | | | | | | | | | | | | | | | |
| | | | | | | | $ million |
| | | | | | | | 2021 |
| | Less than
1 year | 1-2 years | 2-3 years | 3-4 years | 4-5 years | Over
5 years | Total |
| Fair value of derivative assets | | | | | | | | |
| Level 1 | | 63 | | 25 | | 4 | | 6 | | 1 | | — | | 99 | |
| Level 2 | | 11,418 | | 1,957 | | 631 | | 298 | | 139 | | 102 | | 14,545 | |
| Level 3 | | 888 | | 600 | | 510 | | 416 | | 382 | | 2,731 | | 5,527 | |
| | 12,369 | | 2,582 | | 1,145 | | 720 | | 522 | | 2,833 | | 20,171 | |
| Less: netting by counterparty | | (6,657) | | (694) | | (145) | | (42) | | (26) | | (205) | | (7,769) | |
| | 5,712 | | 1,888 | | 1,000 | | 678 | | 496 | | 2,628 | | 12,402 | |
| Fair value of derivative liabilities | | | | | | | | |
| Level 1 | | (57) | | (28) | | (4) | | (8) | | (2) | | — | | (99) | |
| Level 2 | | (13,646) | | (2,189) | | (575) | | (251) | | (305) | | (216) | | (17,182) | |
| Level 3 | | (521) | | (312) | | (289) | | (281) | | (268) | | (2,266) | | (3,937) | |
| | (14,224) | | (2,529) | | (868) | | (540) | | (575) | | (2,482) | | (21,218) | |
| Less: netting by counterparty | | 6,657 | | 694 | | 145 | | 42 | | 26 | | 205 | | 7,769 | |
| | (7,567) | | (1,835) | | (723) | | (498) | | (549) | | (2,277) | | (13,449) | |
| Net fair value | | (1,855) | | 53 | | 277 | | 180 | | (53) | | 351 | | (1,047) | |
| | | | | | | | |
| | | | | | | | | $ million |
| | | | | | | | | 2020 |
| | Less than
1 year | 1-2 years | 2-3 years | 3-4 years | 4-5 years | Over
5 years | Total |
| Fair value of derivative assets | | | | | | | | |
| Level 1 | | 48 | | 9 | | 15 | | 3 | | 5 | | 1 | | 81 | |
| Level 2 | | 3,342 | | 858 | | 367 | | 212 | | 100 | | 709 | | 5,588 | |
| Level 3 | | 739 | | 546 | | 552 | | 520 | | 493 | | 3,548 | | 6,398 | |
| | 4,129 | | 1,413 | | 934 | | 735 | | 598 | | 4,258 | | 12,067 | |
| Less: netting by counterparty | | (1,182) | | (253) | | (77) | | (38) | | (37) | | (432) | | (2,019) | |
| | 2,947 | | 1,160 | | 857 | | 697 | | 561 | | 3,826 | | 10,048 | |
| Fair value of derivative liabilities | | | | | | | | |
| Level 1 | | (55) | | (9) | | (13) | | (3) | | (5) | | (1) | | (86) | |
| Level 2 | | (3,577) | | (809) | | (263) | | (136) | | (41) | | (79) | | (4,905) | |
| Level 3 | | (492) | | (414) | | (426) | | (404) | | (407) | | (3,198) | | (5,341) | |
| | (4,124) | | (1,232) | | (702) | | (543) | | (453) | | (3,278) | | (10,332) | |
| Less: netting by counterparty | | 1,182 | | 253 | | 77 | | 38 | | 37 | | 432 | | 2,019 | |
| | (2,942) | | (979) | | (625) | | (505) | | (416) | | (2,846) | | (8,313) | |
| Net fair value | | 5 | | 181 | | 232 | | 192 | | 145 | | 980 | | 1,735 | |
| | | | | | | | | | | | | | |
| | bp Annual Report and Form 20-F 2021 | | 235 |
29. Derivative financial instruments – continued
Level 3 derivatives
The following table shows the changes during the year in the net fair value of derivatives held for trading purposes within level 3 of the fair value hierarchy.
| | | | | | | | | | | | | | | | | | | | | | | |
| | | | | | | $ million |
| | Oil
price | Natural gas
price | Power
price | Currency | Other | Total |
| Fair value contracts at 1 January 2021 | | 191 | | 147 | | (173) | | 5 | | 6 | | 176 | |
| Gains (losses) recognized in the income statement | | 302 | | 410 | | 407 | | (159) | | 1 | | 961 | |
| | | | | | | |
| Purchases | | — | | — | | — | | — | | 3 | | 3 | |
| Settlements | | (248) | | (33) | | (115) | | — | | — | | (396) | |
| Transfers out of level 3 | | (46) | | 10 | | (79) | | — | | — | | (115) | |
| Net fair value of contracts at 31 December 2021 | | 199 | | 534 | | 40 | | (154) | | 10 | | 629 | |
| Deferred day-one gains (losses) | | | | | | | 961 | |
| Derivative asset (liability) | | | | | | | 1,590 | |
| | | | | | | |
| | | | | | | $ million |
| | Oil
price | Natural gas
price | Power
price | Currency | Other | Total |
| Fair value contracts at 1 January 2020 | | 71 | | 28 | | (125) | | — | | 110 | | 84 | |
| Gains (losses) recognized in the income statement | | 250 | | 184 | | 162 | | 5 | | (71) | | 530 | |
| | | | | | | |
| Sales | | — | | — | | — | | — | | (32) | | (32) | |
| Settlements | | (135) | | (22) | | (189) | | — | | — | | (346) | |
| Transfers out of level 3 | | 5 | | (43) | | (21) | | — | | (1) | | (60) | |
| Net fair value of contracts at 31 December 2020 | | 191 | | 147 | | (173) | | 5 | | 6 | | 176 | |
| Deferred day-one gains (losses) | | | | | | | 881 | |
| Derivative asset (liability) | | | | | | | 1,057 | |
The amount recognized in the income statement for the year relating to level 3 held-for-trading derivatives still held at 31 December 2021 was a $755 million gain (2020 $315 million gain related to derivatives still held at 31 December 2020).
Derivative gains and losses
The group enters into derivative contracts including futures, options, swaps and certain forward sales and forward purchases contracts, relating to both currency and commodity trading activities. Gains or losses arise on contracts entered into for risk management purposes, optimization activity and entrepreneurial trading. They also arise on certain contracts that are for normal procurement or sales activity for the group but that are required to be fair valued under accounting standards. These gains and losses are included within sales and other operating revenues in the income statement. Also included within this line item are gains and losses on inventory held for trading purposes. The total amount relating to all these items was a net gain of $4,466 million. This number does not include gains and losses on the change in value of contracts which are not recognized under IFRS such as transportation and storage contracts, but does include the associated financially settled contracts. The net amounts for actual gains and losses relating to these derivative contracts and all related items therefore differ significantly from the amounts disclosed above.
The group also enters into derivative contracts relating to foreign currency risk management activities including contracts that the group has entered into to manage the foreign currency exposure relating to the non-US dollar hybrid bonds to their respective first call periods. The change in the unrealized value of these contracts was a net loss of $775 million (2020 $829 million net gain and 2019 $160 million net gain). Where the derivative is economically hedging finance debt, gains and losses on such derivative contracts are included within finance costs in 2021 and in production and manufacturing expenses in previous periods. Where the derivative is managing non-US hybrid bond exposure gains and loss are included within production and manufacturing expenses. Where these gains and losses arise on derivatives hedging finance debt they are largely offset by opposing net foreign exchange differences on retranslation of the associated non-US dollar debt. The net amounts for actual gains and losses relating to these derivative contracts and all related items therefore differ significantly from the amounts disclosed above.
Cash flow hedges
(i) Foreign currency risk of highly probable forecast capital expenditure
At 31 December 2021, the group held currency forwards designated as hedging instruments in cash flow hedge relationships of highly probable forecast non-US dollar capital expenditure. Note 28 outlines the group’s approach to foreign currency exchange risk management. When the highly probable forecast capital expenditure designated as a hedged item occurs, a non-financial asset is recognized and is presented within the fixed asset section of the balance sheet.
The group claims hedge accounting only for the spot value of the currency exposure in line with the strategy to fix the volatility in the spot exchange rate element. The fair value on the instrument attributable to forward points and foreign currency basis spreads is taken immediately to the income statement.
The group applies hedge accounting where there is an economic relationship between the hedged item and hedging instrument. The existence of an economic relationship is determined at inception and prospectively by comparing the critical terms of the hedging instrument and those of the hedged item. The group enters into hedging derivatives that match the currency and notional of the hedged items on a 1:1 hedge ratio basis. The hedge ratio is determined by comparing the notional amount of the derivative with the notional designated on the forecast transaction. The group determines the extent to which it hedges highly probable forecast capital expenditures on a project by project basis.
The group has identified the following sources of ineffectiveness, which are not expected to be material:
•counterparty's credit risk, the group mitigates counterparty credit risk by entering into derivative transactions with high credit quality counterparties; and
| | | | | | | | | | | | | | |
236 | | bp Annual Report and Form 20-F 2021 | | |
29. Derivative financial instruments – continued
•differences in settlement timing between the derivative and hedged items. The latter impacts the discount factor used in the calculation of the hedge ineffectiveness. The group mitigates differences in timing between the derivatives and hedged items by applying a rolling strategy and by hedging currency pairs from stable economies. The group's cash flow hedge designations are highly effective as the sources of ineffectiveness identified are expected to result in minimal hedge ineffectiveness.
The group has not designated any net positions as hedged items in cash flow hedges of foreign currency risk.
(ii) Commodity price risk of highly probable forecast sales
During the period the group held Henry Hub NYMEX futures designated as hedging instruments in cash flow hedge relationships of certain highly probable forecast future sales. Henry Hub NYMEX futures are subject to daily settlement, where their fair value at the end of each day is required to be cash settled, such that the carrying amount of these hedging instruments within continuing hedge relationships is always zero at the end of each day.
The group is exposed to the variability in the gas price, but only applied hedge accounting to the risk of Henry Hub price movements for a percentage of future gas sales from its BPX Energy business.
The group applied hedge accounting in relation to these highly probable future sales where there was an economic relationship between the hedged item and hedging instrument. The existence of an economic relationship was determined at inception and prospectively by comparing the critical terms of the hedging instrument and those of the hedged item. The group entered into hedging derivatives that matched the notional amounts of the hedged items on a 1:1 hedge ratio basis. The hedge ratio was determined by comparing the notional amount of the derivative with the notional amount designated on the forecast transaction.
The hedge was highly effective due to the price index of the hedging instruments matching the price index of the hedged item. The group did not designate any net positions as hedged items in cash flow hedges of commodity price risk.
The tables below summarize the change in the fair value of hedging instruments and the hedged item used to calculate ineffectiveness in the period.
| | | | | | | | | | | | | | |
| | | | $ million |
| | Change in fair value of hedging instrument used to calculate ineffectiveness | Change in fair value of hedged item used to calculate ineffectiveness | Hedge ineffectiveness recognized in profit or (loss) |
| At 31 December 2021 | | | | |
| Cash flow hedges | | | | |
| Foreign exchange risk | | | | |
| Highly probable forecast capital expenditure | | (1) | | 1 | | — | |
| Commodity price risk | | | | |
| Highly probable forecast sales | | (430) | | 430 | | — | |
| | | | |
| At 31 December 2020 | | | | |
| Cash flow hedges | | | | |
| Foreign exchange risk | | | | |
| Highly probable forecast capital expenditure | | 4 | | (4) | | — | |
| Commodity price risk | | | | |
| Highly probable forecast sales | | 78 | | (78) | | — | |
The tables below summarize the carrying amount and nominal amount of the derivatives designated as hedging instruments in cash flow hedge relationships.
| | | | | | | | | | | | | | | | | |
| | | | | |
| | Carrying amount of hedging instrument | Nominal amounts of hedging instruments |
| | Assets | Liabilities |
| At 31 December 2021 | | $ million | $ million | $ million | mmBtu |
| Cash flow hedges | | | | | |
| Foreign exchange risk | | | | | |
| Highly probable forecast capital expenditure | | 1 | | — | | 55 | | |
| Commodity price risk | | | | | |
| Highly probable forecast sales | | — | | — | | | (420) | |
| | | | | |
| At 31 December 2020 | | | | | |
| Cash flow hedges | | | | | |
| Foreign exchange risk | | | | | |
| Highly probable forecast capital expenditure | | 4 | | — | | 162 | | |
| Commodity price risk | | | | | |
| Highly probable forecast sales | | — | | — | | | (175) | |
All hedging instruments are presented within derivative financial instruments on the group balance sheet.
| | | | | | | | | | | | | | |
| | bp Annual Report and Form 20-F 2021 | | 237 |
29. Derivative financial instruments – continued
All of the nominal amount of hedging instruments at 31 December 2021 and 2020 relating to highly probably forecast capital expenditure matures within 12 months of the relevant balance sheet date. Of the nominal amount of hedging instruments at 31 December 2021 relating to highly probably forecast sales 245 mmBtu (2020 135 mmBtu) matures within 12 months and 175 mmBtu (2020 40 mmBtu) within one to two years.
The table below summarizes the weighted average exchange rates and the weighted average sales price in relation to the derivatives designated as hedging instruments in cash flow hedge relationships at 31 December.
| | | | | | | | | | | | | | | | | | | |
| | Weighted average price/rate |
| | 2021 | 2020 | |
| At 31 December | | Forecast capital expenditure | | Forecast sales | Forecast capital expenditure | Forecast sales | |
| Sterling/US dollar | | 1.33 | | | | 1.35 | | | |
| | | | | | | |
| | | | | | | |
| | | | | | | |
| Korean won/US dollar | | — | | | | 1,174.47 | | | |
| | | | | | | |
| Henry Hub $/mmBtu | | | | 3.24 | | | 2.88 | | |
Fair value hedges
At 31 December 2021, the group held interest rate and cross-currency interest rate swap contracts as fair value hedges of the interest rate risk and foreign currency risk arising from group fixed rate debt issuances. Note 28 outlines the group’s approach to interest rate and foreign currency exchange risk management. The interest rate swaps are used to convert US dollar denominated fixed rate borrowings into floating rate debt. The cross-currency interest rate swaps are used to convert sterling, euro, Swiss franc, Canadian dollar and Norwegian krone denominated fixed rate borrowings into US dollar floating rate debt. The group manages all risks derived from debt issuance, such as credit risk, however, the group applies hedge accounting only to certain components of interest rate and foreign currency risk in order to minimize hedge ineffectiveness. The interest rate and foreign currency exposures are identified and hedged on an instrument-by-instrument basis. For interest rate exposures, the group designates as a fair value hedge the benchmark interest rate component only. This is an observable and reliably measurable component of interest rate risk.
All of the fair value hedge accounting relationships currently in place are directly affected by interest rate benchmark reform. The group's swaps which reference interest rates are primarily exposed to 3 month USD LIBOR. For all of the swaps that reference Inter-Bank Offered Rates (IBORs), ISDA fallback clauses to amend derivatives on the cessation of LIBOR are already available as bp and its counterparties have adhered to the protocol. The nominal amounts of the applicable hedging instruments represent the extent of the risk exposure bp manages for financial derivatives designated in fair value hedge relationships that is directly affected by the interest rate benchmark reform. These are disclosed in the table below. The interest rate benchmark reform does not change the risk management strategy for fair value hedges.
Uncertainty around the method and timing of transition from IBORs to alternative risk-free rates (RfRs) may impact the assessment of whether hedge accounting can be applied to certain hedging relationships. However, the temporary reliefs provided by IFRS 9 allow bp to assume that in the event that significant uncertainty around the reform arises:
•the interest rate benchmark component of fair value hedges only needs to be assessed as separately identifiable at initial designation; and
•the interest rate benchmark is not altered for the purposes of assessing the economic relationship between the hedged item and the hedging instrument for fair value hedges.
The reliefs above will continue to apply until the uncertainty arising from the interest benchmark reform with respect to the timing and amount of the underlying cash flows to which the group is exposed ends. The group expects this uncertainty to continue until either the ISDA fallback clauses are activated in June 2023 or the contracts that reference IBORs are modified replacing the IBOR benchmark rate with a risk free rate. The group's assumption is that any modifications to swaps will meet the 'economically equivalent' criteria with contractual changes restricted to only those changes necessary to replace the benchmark rate with a risk free rate.
At 31 December 2021 the reliefs apply and bp continues to monitor regulatory and market developments as it manages the contractual transition.
For foreign currency exposures, the group excludes from the designation the foreign currency basis spread component implicit in the cross-currency interest rate swaps. This is separately calculated at hedge designation, is recognized in other comprehensive income over the life of the hedge and amortized to the income statement on a straight-line basis, in accordance with the group’s policy on costs of hedging.
The group applies hedge accounting where there is an economic relationship between the hedged item and the hedging instrument. The existence of an economic relationship is determined initially by comparing the critical terms of the hedging instrument and those of the hedged item and it is prospectively assessed using linear regression analysis. The group issues fixed rate debt and enters into interest rate and cross-currency interest rate swaps with critical terms that match those of the debt and on a 1:1 hedge ratio basis. The hedge ratio is determined by comparing the notional amount of the derivative with the notional amount of the debt. The hedge relationship is designated for the full term and notional value of the debt. Both the hedging instrument and the hedged item are expected to be held to maturity.
The group has identified the following sources of ineffectiveness, which are not expected to be material:
•derivative counterparty’s credit risk which is not offset by the hedged item. This risk is mitigated by entering into derivative transactions only with high credit quality counterparties; and
•sensitivity to interest rate between the hedged item and the derivatives. This is driven by differences in payment frequencies between the instrument and the bond.
| | | | | | | | | | | | | | |
238 | | bp Annual Report and Form 20-F 2021 | | |
29. Derivative financial instruments – continued
The tables below summarize the change in the fair value of hedging instruments and the hedged item used to calculate ineffectiveness in the period. The signage convention for changes in fair value presented in this table is consistent with that presented in Note 26.
| | | | | | | | | | | | | | |
| | | | $ million |
| | Change in fair value of hedging instrument used to calculate ineffectiveness | Change in fair value of hedged item used to calculate ineffectiveness | Hedge ineffectiveness recognized in profit or (loss) |
| At 31 December 2021 | |
| Fair value hedges | | | | |
| Interest rate risk on finance debt | | 54 | | (54) | | — | |
| Interest rate and foreign currency risk on finance debt | | 2,565 | | (2,460) | | (105) | |
| | | | |
| At 31 December 2020 | | | | |
| Fair value hedges | | | | |
| Interest rate risk on finance debt | | (258) | | 258 | | — | |
| Interest rate and foreign currency risk on finance debt | | (2,743) | | 2,549 | | 194 | |
The tables below summarize the carrying amount of the derivatives designated as hedging instruments in fair value hedge relationships at 31 December.
| | | | | | | | | | | | | | | |
| | | | | $ million |
| | Carrying amount of hedging instrument | | Nominal amounts of hedging instruments |
| At 31 December 2021 | | Assets | Liabilities |
| Fair value hedges | | | | | |
| Interest rate risk on finance debt | | 21 | | — | | | 1,102 | |
| Interest rate and foreign currency risk on finance debt | | 326 | | (465) | | | 18,880 | |
| | | | | |
| At 31 December 2020 | | | | | |
| Fair value hedges | | | | | |
| Interest rate risk on finance debt | | 80 | | — | | | 4,104 | |
| Interest rate and foreign currency risk on finance debt | | 2,614 | | (82) | | | 23,313 | |
All hedging instruments are presented within derivative financial instruments on the group balance sheet. In 2021 ineffectiveness arising on fair value hedges is included within finance costs in the income statement. In 2020 ineffectiveness arising on fair value hedges was included within the production and manufacturing expenses section of the income statement.
The tables below summarize the profile by tenor of the nominal amount of the derivatives designated as hedging instruments in fair value hedge relationships at 31 December.
| | | | | | | | | | | | | | | | | | | | | | | | | | | | | | |
| | | | | | | | | | $ million |
| At 31 December 2021 | | | Less than 1 year | 1-2 years | 2-3 years | 3-4 years | 4-5 years | 5-10 years | Over 10 years | Total |
| Fair value hedges | | | | | | | | | | |
| Interest rate risk on finance debt | | | 713 | | — | | 219 | | — | | 170 | | — | | — | | 1,102 | |
| Interest rate and foreign currency risk on finance debt | | | 715 | | 1,426 | | 2,377 | | 2,114 | | 2,400 | | 4,471 | | 5,377 | | 18,880 | |
| | | | | | | | | | |
| At 31 December 2020 | | | | | | | | | | |
| Fair value hedges | | | | | | | | | | |
| Interest rate risk on finance debt | | | 2,705 | | 996 | | — | | 227 | | — | | 176 | | — | | 4,104 | |
| Interest rate and foreign currency risk on finance debt | | | 737 | | 1,056 | | 2,039 | | 3,175 | | 2,804 | | 8,587 | | 4,915 | | 23,313 | |
The table below summarizes the weighted average floating interest rate and the weighted average exchange rates in relation to the derivatives designated as hedging instruments in fair value hedge relationships at 31 December.
| | | | | | | | | | | | | | | | | |
| At 31 December | | | 2021 | | 2020 |
| | Interest rate swaps | Cross-currency interest rate swaps | Interest rate swaps | Cross-currency interest rate swaps |
| Interest rate | | 0.31 | % | 1.91 | % | 0.58 | % | 1.88 | % |
| Sterling/US dollar | | | 1.36 | | 1.33 |
| Euro/US dollar | | | 1.13 | | 1.14 |
| Canadian dollar/US dollar | | | 0.78 | | 0.78 |
| | | | | | | | | | | | | | |
| | bp Annual Report and Form 20-F 2021 | | 239 |
29. Derivative financial instruments – continued
The tables below summarize the carrying amount, and the accumulated fair value adjustments included within the carrying amount, of the hedged items designated in fair value hedge relationships at 31 December.
| | | | | | | | | | | | | | | | | | | | | |
| | | | | | $ million | |
| | Carrying amount of hedged item | Accumulated fair value adjustment included in the carrying amount of hedged items | |
| At 31 December 2021 | | Assets | Liabilities | Assets | Liabilities | Discontinued hedges |
| Fair value hedges | | | | | | | |
| Interest rate risk on finance debt | | — | | (1,170) | | — | | (22) | | (524) | | |
| Interest rate and foreign currency risk on finance debt | | — | | (18,837) | | — | | (94) | | — | | |
| | | | | | | |
| At 31 December 2020 | | | | | | | |
| Fair value hedges | | | | | | | |
| Interest rate risk on finance debt | | — | | (4,196) | | — | | (81) | | (775) | | |
| Interest rate and foreign currency risk on finance debt | | — | | (23,253) | | — | | (938) | | — | | |
| | | | | | | |
The hedged item for all fair value hedges is presented within finance debt on the group balance sheet.
Movement in reserves related to hedge accounting
The table below provides a reconciliation of the cash flow hedge and costs of hedging reserves on a pre-tax basis by risk category. The signage convention of this table is consistent with that presented in Note 31.
| | | | | | | | | | | | | | | | | | | | | | | |
| | | | | | | | | $ million |
| | Cash flow hedge reserve | | | Costs of hedging reserve | |
| | Highly probable forecast capital expenditure | | Highly probable forecast sales | Purchase of equitya | | | Interest rate and foreign currency risk on finance debt | Total |
| At 1 January 2021 | | 12 | | | 41 | | (651) | | | | (106) | | (704) | |
Recognized in other comprehensive income | | | | | | | | | |
Cash flow hedges marked to market | | 1 | | | (430) | | — | | | | — | | (429) | |
Cash flow hedges reclassified to the income statement - hedged item affected profit or loss | | — | | | 255 | | — | | | | — | | 255 | |
| | | | | | | | | |
| Costs of hedging marked to market | | — | | | — | | — | | | | (105) | | (105) | |
| Costs of hedging reclassified to the income statement | | — | | | — | | — | | | | 21 | | 21 | |
| | 1 | | | (175) | | — | | | | (84) | | (258) | |
Cash flow hedges transferred to the balance sheet | | (10) | | | — | | — | | | | — | | (10) | |
| | | | | | | | | |
| At 31 December 2021 | | 3 | | | (134) | | (651) | | | | (190) | | (972) | |
| | | | | | | | | |
| | | | | | | | | $ million |
| | Cash flow hedge reserve | | | Costs of hedging reserve | |
| | Highly probable forecast capital expenditure | | Highly probable forecast sales | Purchase of equitya | | | Interest rate and foreign currency risk on finance debt | Total |
| At 1 January 2020 | | (1) | | | — | | (651) | | | | (170) | | (822) | |
Recognized in other comprehensive income | | | | | | | | | |
Cash flow hedges marked to market | | 7 | | | 78 | | — | | | | — | | 85 | |
Cash flow hedges reclassified to the income statement - hedged item affected profit or loss | | — | | | (37) | | — | | | | — | | (37) | |
| | | | | | | | | |
| Costs of hedging marked to market | | — | | | — | | — | | | | 42 | | 42 | |
| Costs of hedging reclassified to the income statement | | — | | | — | | — | | | | 22 | | 22 | |
| | 7 | | | 41 | | — | | | | 64 | | 112 | |
Cash flow hedges transferred to the balance sheet | | 6 | | | — | | — | | | | — | | 6 | |
| | | | | | | | | |
| At 31 December 2020 | | 12 | | | 41 | | (651) | | | | (106) | | (704) | |
| | | | | | | | | |
| | | | | | | | | |
a See Note 31 for further information on the cash flow hedge reserve relating to the purchase of equity.
Substantially all of the cash flow hedge reserve balances and all of the amounts reclassified from the cash flow hedge reserve into profit or loss during the year relate to continuing hedge relationships. Amounts deferred in the cash flow hedge reserve that have been reclassified to profit or loss are presented in sales and other operating revenues in the income statement.
Costs of hedging relates to the foreign currency basis spreads of hedging instruments used to hedge the group's interest rate and foreign currency risk on debt which is a time-period related item.
| | | | | | | | | | | | | | |
240 | | bp Annual Report and Form 20-F 2021 | | |
30. Called-up share capital
The allotted, called up and fully paid share capital at 31 December was as follows:
| | | | | | | | | | | | | | | | | | | | | | | |
| | | 2021 | | 2020 | | 2019 |
| Issued | | Shares
thousand | $ million | Shares
thousand | $ million | Shares
thousand | $ million |
8% cumulative first preference shares of £1 eacha | | 7,233 | | 12 | | 7,233 | | 12 | | 7,233 | | 12 | |
9% cumulative second preference shares of £1 eacha | | 5,473 | | 9 | | 5,473 | | 9 | | 5,473 | | 9 | |
| | | 21 | | | 21 | | | 21 | |
Ordinary shares of 25 cents each | | | | | | | |
| At 1 January | | 21,449,782 | | 5,362 | | 21,535,840 | | 5,383 | | 21,525,464 | | 5,381 | |
Issue of new shares for the scrip dividend programme | | — | | — | | — | | — | | 208,927 | | 52 | |
Issue of new shares for employee share-based payment plans | | 35,001 | | 9 | | 34,000 | | 9 | | 37,400 | | 9 | |
| | | | | | | |
| Repurchase of ordinary share capital | | (706,701) | | (177) | | (120,058) | | (30) | | (235,951) | | (59) | |
| At 31 December | | 20,778,082 | | 5,194 | | 21,449,782 | | 5,362 | | 21,535,840 | | 5,383 | |
| | | 5,215 | | | 5,383 | | | 5,404 | |
a The nominal amount of 8% cumulative first preference shares and 9% cumulative second preference shares that can be in issue at any time shall not exceed £10,000,000 for each class of preference shares.
Voting on substantive resolutions tabled at a general meeting is on a poll. On a poll, shareholders present in person or by proxy have two votes for every £5 in nominal amount of the first and second preference shares held and one vote for every ordinary share held. On a show-of-hands vote on other resolutions (procedural matters) at a general meeting, shareholders present in person or by proxy have one vote each.
In the event of the winding up of the company, preference shareholders would be entitled to a sum equal to the capital paid up on the preference shares, plus an amount in respect of accrued and unpaid dividends and a premium equal to the higher of (i) 10% of the capital paid up on the preference shares and (ii) the excess of the average market price of such shares on the London Stock Exchange during the previous six months over par value.
During 2021 the company repurchased 707 million ordinary shares for a total consideration of $3,151 million, including transaction costs of $17 million, as part of the share repurchase programme announced on 27 April 2021. All shares purchased were for cancellation. The repurchased shares represented 3.4% of ordinary share capital. The number of shares in issue is reduced when shares are repurchased. As of 1 March 2022, the latest practicable date before the completion of these financial statements, 288 million further ordinary shares were repurchased for cancellation for a total cost of $1,535 million, including transaction costs of $8 million.
Treasury sharesa
| | | | | | | | | | | | | | | | | | | | | | | |
| | | 2021 | | 2020 | | 2019 |
| | Shares
thousand | Nominal value
$ million | Shares
thousand | Nominal value
$ million | Shares
thousand | Nominal value
$ million |
| At 1 January | | 1,187,650 | | 296 | | 1,296,856 | | 323 | | 1,426,265 | | 356 | |
Purchases for settlement of employee share plans | | 1,432 | | — | | — | | — | | 1,118 | | — | |
Issue of new shares for employee share-based payment plans | | 35,096 | | 9 | | 34,116 | | 9 | | 37,400 | | 9 | |
Shares re-issued for employee share-based payment plans | | (86,721) | | (22) | | (143,322) | | (36) | | (167,927) | | (42) | |
| At 31 December | | 1,137,457 | | 283 | | 1,187,650 | | 296 | | 1,296,856 | | 323 | |
| Of which – shares held in treasury by bp | | 1,037,201 | | 259 | | 1,105,157 | | 275 | | 1,163,077 | | 290 | |
– shares held in ESOP trusts | | 100,256 | | 24 | | 82,491 | | 21 | | 133,707 | | 33 | |
– shares held by bp’s US share plan administratorb | | — | | — | | 2 | | — | | 72 | | — | |
a See Note 31 for definition of treasury shares.
b Held in the form of ADSs to meet the requirements of employee share-based payment plans in the US.
For each year presented, the balance at 1 January represents the maximum number of shares held in treasury by bp during the year, representing 5.2% (2020 5.4% and 2019 5.9%) of the called-up ordinary share capital of the company.
During 2021, the movement in shares held in treasury by bp represented less than 0.3% (2020 less than 0.3% and 2019 less than 0.5%) of the ordinary share capital of the company.
| | | | | | | | | | | | | | |
| | bp Annual Report and Form 20-F 2021 | | 241 |
31. Capital and reserves
| | | | | | | | | | | | | | | | | | | | |
| | | | | | |
| | Share
capital | Share
premium
account | Capital
redemption
reserve | Merger
reserve | Total share capital
and capital
reserves |
|
| At 1 January 2021 | | 5,383 | | 12,584 | | 1,528 | | 27,206 | | 46,701 | |
| Profit (loss) for the year | | — | | — | | — | | — | | — | |
| Items that may be reclassified subsequently to profit or loss | | | | | | |
| Currency translation differences (including reclassifications) | | — | | — | | — | | — | | — | |
| | | | | | |
| | | | | | |
| | | | | | |
| | | | | | |
| | | | | | |
| Cash flow hedges and costs of hedging (including reclassifications) | | — | | — | | — | | — | | — | |
Share of items relating to equity-accounted entities, net of taxa | | — | | — | | — | | — | | — | |
| Other | | — | | — | | — | | — | | — | |
| Items that will not be reclassified to profit or loss | | | | | | |
| Remeasurements of the net pension and other post-retirement benefit liability or asset | | — | | — | | — | | — | | — | |
| Cash flow hedges that will subsequently be transferred to the balance sheet | | — | | — | | — | | — | | — | |
| | | | | | |
| Total comprehensive income | | — | | — | | — | | — | | — | |
| Dividends | | — | | — | | — | | — | | — | |
| | | | | | |
| Cash flow hedges transferred to the balance sheet, net of tax | | — | | — | | — | | — | | — | |
| | | | | | |
| Repurchases of ordinary share capital | | (177) | | — | | 177 | | — | | — | |
Share-based payments, net of taxb | | 9 | | 161 | | — | | — | | 170 | |
| Share of equity-accounted entities’ changes in equity, net of tax | | — | | — | | — | | — | | — | |
| Issue of perpetual hybrid bonds | | — | | — | | — | | — | | — | |
| | | | | | |
| Payments on perpetual hybrid bonds | | — | | — | | — | | — | | — | |
| | | | | | |
| Tax on issue of perpetual hybrid bonds | | — | | — | | — | | — | | — | |
Transactions involving non-controlling interests, net of taxd | | — | | — | | — | | — | | — | |
| At 31 December 2021 | | 5,215 | | 12,745 | | 1,705 | | 27,206 | | 46,871 | |
| | | | | | |
| | | | | | |
| At 1 January 2020 | | 5,404 | | 12,417 | | 1,498 | | 27,206 | | 46,525 | |
| Profit (loss) for the year | | — | | — | | — | | — | | — | |
| Items that may be reclassified subsequently to profit or loss | | | | | | |
| Currency translation differences (including reclassifications) | | — | | — | | — | | — | | — | |
| Cash flow hedges and costs of hedging (including reclassifications) | | — | | — | | — | | — | | — | |
Share of items relating to equity-accounted entities, net of taxa | | — | | — | | — | | — | | — | |
| Other | | — | | — | | — | | — | | — | |
| Items that will not be reclassified to profit or loss | | | | | | |
| Remeasurements of the net pension and other post-retirement benefit liability or asset | | — | | — | | — | | — | | — | |
| Cash flow hedges that will subsequently be transferred to the balance sheet | | — | | — | | — | | — | | — | |
| Total comprehensive income | | — | | — | | — | | — | | — | |
| Dividends | | — | | — | | — | | — | | — | |
| Cash flow hedges transferred to the balance sheet, net of tax | | — | | — | | — | | — | | — | |
| Repurchases of ordinary share capital | | (30) | | — | | 30 | | — | | — | |
Share-based payments, net of taxb | | 9 | | 167 | | — | | — | | 176 | |
Share of equity-accounted entities’ changes in equity, net of taxc | | — | | — | | — | | — | | — | |
| Issue of perpetual hybrid bonds | | — | | — | | — | | — | | — | |
| | | | | | |
| Payments on perpetual hybrid bonds | | — | | — | | — | | — | | — | |
| | | | | | |
| Tax on issue of perpetual hybrid bonds | | — | | — | | — | | — | | — | |
Transactions involving non-controlling interests, net of taxd | | — | | — | | — | | — | | — | |
| At 31 December 2020 | | 5,383 | | 12,584 | | 1,528 | | 27,206 | | 46,701 | |
a Principally foreign exchange effects relating to the Russian rouble.
b Movements in treasury shares relate to employee share-based payment plans.
c Principally relates to a non-controlling interest transaction entered into by Rosneft.
d 2021 principally relates to the sale of 49% interest in a controlled affiliate holding certain refined product and crude logistics assets onshore US and the buy-out of the non-controlling interest in the Thorntons fuels and convenience retail business. 2020 principally relates to the sale of interests in our UK and New Zealand retail property portfolio, for which proceeds of $0.5 billion and $0.2 billion were received respectively.
| | | | | | | | | | | | | | |
242 | | bp Annual Report and Form 20-F 2021 | | |
31. Capital and reserves – continued
| | | | | | | | | | | | | | | | | | | | | | | | | | | | | | |
| | | | | | | | | | $ million |
Treasury
shares | Foreign
currency
translation
reserve | | Cash flow
hedges | Costs of hedging | Total
fair value
reserves | Profit and
loss
account | bp
shareholders’
equity | Non-controlling interests | Total equity |
| Hybrid bonds | Other interest |
| (13,224) | | (8,719) | | | (708) | | (100) | | (808) | | 47,300 | | 71,250 | | 12,076 | | 2,242 | | 85,568 | |
| — | | — | | | — | | — | | — | | 7,565 | | 7,565 | | 507 | | 415 | | 8,487 | |
| | | | | | | | | | |
| — | | (846) | | | — | | — | | — | | — | | (846) | | — | | (24) | | (870) | |
| | | | | | | | | | |
| | | | | | | | | | |
| | | | | | | | | | |
| | | | | | | | | | |
| | | | | | | | | | |
| — | | — | | | (134) | | (76) | | (210) | | — | | (210) | | — | | — | | (210) | |
| — | | — | | | — | | — | | — | | 44 | | 44 | | — | | — | | 44 | |
| — | | — | | | — | | — | | — | | 1 | | 1 | | — | | — | | 1 | |
| | | | | | | | | | |
| — | | — | | | — | | — | | — | | 3,099 | | 3,099 | | — | | — | | 3,099 | |
| — | | — | | | 1 | | — | | 1 | | — | | 1 | | — | | — | | 1 | |
| | | | | | | | | | |
| — | | (846) | | | (133) | | (76) | | (209) | | 10,709 | | 9,654 | | 507 | | 391 | | 10,552 | |
| — | | — | | | — | | — | | — | | (4,316) | | (4,316) | | — | | (311) | | (4,627) | |
| | | | | | | | | | |
| — | | — | | | (10) | | — | | (10) | | — | | (10) | | — | | — | | (10) | |
| | | | | | | | | | |
| — | | — | | | — | | — | | — | | (3,151) | | (3,151) | | — | | — | | (3,151) | |
| 600 | | — | | | — | | — | | — | | (138) | | 632 | | — | | — | | 632 | |
| — | | — | | | — | | — | | — | | 556 | | 556 | | — | | — | | 556 | |
| — | | — | | | — | | — | | — | | (26) | | (26) | | 950 | | — | | 924 | |
| | | | | | | | | | |
| — | | (7) | | | — | | — | | — | | — | | (7) | | (492) | | — | | (499) | |
| | | | | | | | | | |
| — | | — | | | — | | — | | — | | — | | — | | — | | — | | — | |
| — | | — | | | — | | — | | — | | 881 | | 881 | | — | | (387) | | 494 | |
| (12,624) | | (9,572) | | | (851) | | (176) | | (1,027) | | 51,815 | | 75,463 | | 13,041 | | 1,935 | | 90,439 | |
| | | | | | | | | | |
| | | | | | | | | | |
| (14,412) | | (6,495) | | | (752) | | (160) | | (912) | | 73,706 | | 98,412 | | — | | 2,296 | | 100,708 | |
| — | | — | | | — | | — | | — | | (20,305) | | (20,305) | | 256 | | (680) | | (20,729) | |
| | | | | | | | | | |
| — | | (2,224) | | | — | | — | | — | | — | | (2,224) | | — | | 37 | | (2,187) | |
| — | | — | | | 31 | | 60 | | 91 | | — | | 91 | | — | | — | | 91 | |
| — | | — | | | — | | — | | — | | 312 | | 312 | | — | | — | | 312 | |
| — | | — | | | — | | — | | — | | 71 | | 71 | | — | | — | | 71 | |
| | | | | | | | | | |
| — | | — | | | — | | — | | — | | 65 | | 65 | | — | | — | | 65 | |
| — | | — | | | 7 | | — | | 7 | | — | | 7 | | — | | — | | 7 | |
| — | | (2,224) | | | 38 | | 60 | | 98 | | (19,857) | | (21,983) | | 256 | | (643) | | (22,370) | |
| — | | — | | | — | | — | | — | | (6,367) | | (6,367) | | — | | (238) | | (6,605) | |
| — | | — | | | 6 | | — | | 6 | | — | | 6 | | — | | — | | 6 | |
| — | | — | | | — | | — | | — | | (776) | | (776) | | — | | — | | (776) | |
| 1,188 | | — | | | — | | — | | — | | (638) | | 726 | | — | | — | | 726 | |
| — | | — | | | — | | — | | — | | 1,341 | | 1,341 | | — | | — | | 1,341 | |
| — | | — | | | — | | — | | — | | (48) | | (48) | | 11,909 | | — | | 11,861 | |
| | | | | | | | | | |
| — | | — | | | — | | — | | — | | — | | — | | (89) | | — | | (89) | |
| | | | | | | | | | |
| — | | — | | | — | | — | | — | | 3 | | 3 | | — | | — | | 3 | |
| — | | — | | | — | | — | | — | | (64) | | (64) | | — | | 827 | | 763 | |
| (13,224) | | (8,719) | | | (708) | | (100) | | (808) | | 47,300 | | 71,250 | | 12,076 | | 2,242 | | 85,568 | |
| | | | | | | | | | | | | | |
| | bp Annual Report and Form 20-F 2021 | | 243 |
31. Capital and reserves – continued
| | | | | | | | | | | | | | | | | | | | |
| | | | | | |
| | Share
capital | Share
premium
account | Capital
redemption
reserve | Merger
reserve | Total share capital
and capital
reserves |
|
| | | | | | |
| At 31 December 2018 | | 5,402 | | 12,305 | | 1,439 | | 27,206 | | 46,352 | |
| Adjustment on adoption of IFRS 16, net of tax | | — | | — | | — | | — | | — | |
| At 1 January 2019 | | 5,402 | | 12,305 | | 1,439 | | 27,206 | | 46,352 | |
| Profit (loss) for the year | | — | | — | | — | | — | | — | |
| Items that may be reclassified subsequently to profit or loss | | | | | | |
| Currency translation differences (including reclassifications) | | — | | — | | — | | — | | — | |
| Cash flow hedges and costs of hedging (including reclassifications) | | — | | — | | — | | — | | — | |
Share of items relating to equity-accounted entities, net of taxa | | — | | — | | — | | — | | — | |
| Other | | — | | — | | — | | — | | — | |
| Items that will not be reclassified to profit or loss | | | | | | |
| Remeasurements of the net pension and other post-retirement benefit liability or asset | | — | | — | | — | | — | | — | |
| Cash flow hedges that will subsequently be transferred to the balance sheet | | — | | — | | — | | — | | — | |
| Total comprehensive income | | — | | — | | — | | — | | — | |
| Dividends | | 52 | | (52) | | — | | — | | — | |
| Cash flow hedges transferred to the balance sheet, net of tax | | — | | — | | — | | — | | — | |
| Repurchases of ordinary share capital | | (59) | | — | | 59 | | — | | — | |
Share-based payments, net of taxb | | 9 | | 164 | | — | | — | | 173 | |
| Share of equity-accounted entities’ changes in equity, net of tax | | — | | — | | — | | — | | — | |
Transactions involving non-controlling interests, net of taxc | | — | | — | | — | | — | | — | |
| At 31 December 2019 | | 5,404 | | 12,417 | | 1,498 | | 27,206 | | 46,525 | |
a Principally foreign exchange effects relating to the Russian rouble.
b Movements in treasury shares relate to employee share-based payment plans.
c Principally relates to the sale of a 49% interest in bp's retail property portfolio in Australia.
| | | | | | | | | | | | | | |
244 | | bp Annual Report and Form 20-F 2021 | | |
31. Capital and reserves – continued
| | | | | | | | | | | | | | | | | | | | | | | | | | | | | | |
| | | | | | | | | | $ million |
Treasury
shares | Foreign
currency
translation
reserve | | Cash flow
hedges | Costs of hedging | Total
fair value
reserves | Profit and
loss
account | bp
shareholders’
equity | Non-controlling interests | Total equity |
| Hybrid bonds | Other interest |
| | | | | | | | | | |
| (15,767) | | (8,902) | | | (777) | | (210) | | (987) | | 78,748 | | 99,444 | | — | | 2,104 | | 101,548 | |
| — | | — | | | — | | — | | — | | (329) | | (329) | | — | | (1) | | (330) | |
| (15,767) | | (8,902) | | | (777) | | (210) | | (987) | | 78,419 | | 99,115 | | — | | 2,103 | | 101,218 | |
| — | | — | | | — | | — | | — | | 4,026 | | 4,026 | | — | | 164 | | 4,190 | |
| | | | | | | | | | |
| — | | 2,407 | | | — | | — | | — | | — | | 2,407 | | — | | 9 | | 2,416 | |
| — | | — | | | 5 | | 50 | | 55 | | — | | 55 | | — | | — | | 55 | |
| — | | — | | | — | | — | | — | | 82 | | 82 | | — | | — | | 82 | |
| — | | — | | | — | | — | | — | | (64) | | (64) | | — | | — | | (64) | |
| | | | | | | | | | |
| — | | — | | | — | | — | | — | | 171 | | 171 | | — | | — | | 171 | |
| — | | — | | | (3) | | — | | (3) | | — | | (3) | | — | | — | | (3) | |
| — | | 2,407 | | | 2 | | 50 | | 52 | | 4,215 | | 6,674 | | — | | 173 | | 6,847 | |
| — | | — | | | — | | — | | — | | (6,929) | | (6,929) | | — | | (213) | | (7,142) | |
| — | | — | | | 23 | | — | | 23 | | — | | 23 | | — | | — | | 23 | |
| — | | — | | | — | | — | | — | | (1,511) | | (1,511) | | — | | — | | (1,511) | |
| 1,355 | | — | | | — | | — | | — | | (809) | | 719 | | — | | — | | 719 | |
| — | | — | | | — | | — | | — | | 5 | | 5 | | — | | — | | 5 | |
| — | | — | | | — | | — | | — | | 316 | | 316 | | — | | 233 | | 549 | |
| (14,412) | | (6,495) | | | (752) | | (160) | | (912) | | 73,706 | | 98,412 | | — | | 2,296 | | 100,708 | |
.
| | | | | | | | | | | | | | |
| | bp Annual Report and Form 20-F 2021 | | 245 |
31. Capital and reserves – continued
Share capital
The balance on the share capital account represents the aggregate nominal value of all ordinary and preference shares in issue, including treasury shares.
Share premium account
The balance on the share premium account represents the amounts received in excess of the nominal value of the ordinary and preference shares.
Capital redemption reserve
The balance on the capital redemption reserve represents the aggregate nominal value of all the ordinary shares repurchased and cancelled.
Merger reserve
The balance on the merger reserve represents the fair value of the consideration given in excess of the nominal value of the ordinary shares issued in an acquisition made by the issue of shares.
Treasury shares
Treasury shares represent bp shares repurchased and available for specific and limited purposes. For accounting purposes shares held in Employee Share Ownership Plans (ESOPs) and bp’s US share plan administrator to meet the future requirements of the employee share-based payment plans are treated in the same manner as treasury shares and are, therefore, included in the financial statements as treasury shares. The ESOPs are funded by the group and have waived their rights to dividends in respect of such shares held for future awards. Until such time as the shares held by the ESOPs vest unconditionally to employees, the amount paid for those shares is shown as a reduction in shareholders’ equity. Assets and liabilities of the ESOPs are recognized as assets and liabilities of the group.
Foreign currency translation reserve
The foreign currency translation reserve records exchange differences arising from the translation of the financial statements of foreign operations. Upon disposal of foreign operations, the related accumulated exchange differences are reclassified to the income statement. It includes approximately $11 billion loss relating to the investment in Rosneft which is now expected to be reclassified to the income statement in 2022. See Note 37 Events after the reporting period.
Cash flow hedges
This reserve records the portion of the gain or loss on a hedging instrument in a cash flow hedge that is determined to be an effective hedge. It includes $651 million relating to the acquisition of an 18.5% interest in Rosneft in 2013 which is now expected to be reclassified to the income statement in 2022. See Note 37 Events after the reporting period. For further information on the accounting for cash flow hedges see Note 1 - Derivative financial instruments and hedging activities.
Costs of hedging
This reserve records the change in fair value of the foreign currency basis spread of financial instruments to which cost of hedge accounting has been applied. The accumulated amount relates to time-period related hedged items and is amortized to profit or loss over the term of the hedging relationship. For further information on the accounting for costs of hedging see Note 1 - Derivative financial instruments and hedging activities.
Profit and loss account
The balance held on this reserve is the accumulated retained profits of the group.
Non-controlling interests
Non-controlling interests represent the equity in subsidiaries that is not attributable, directly or indirectly, to bp shareholders. Included within non-controlling interests are perpetual subordinated hybrid bonds issued by BP Capital Markets PLC, a group subsidiary, on 17 June 2020 in euro, sterling and US dollars for a US dollar equivalent amount of $11.9 billion. The hybrid bonds include redemption options exercisable at the group’s discretion from June 2025 to March 2030 (the first ‘call date’), on specified dates thereafter, or in the event of specific circumstances (such as a change in IFRS or tax regime) as set out in the individual terms of each issue. Coupons are fixed for an initial period up to dates from September 2025 to June 2030 at rates of 3.25% to 4.875% and reset to rates determined by the contractual terms of each instrument on certain dates thereafter. The contractual terms of the hybrid bonds allow the group to defer coupon payments and the repayment of principal indefinitely, however their terms and conditions stipulate that any deferred payments must be made in the event of an announcement of an ordinary share or parity equity dividend distribution or certain share repurchases or redemptions. Payments made to and profit attributed to these hybrid bond holders in the year totalled $499 million (2020 $89 million) and $497 million (2020 $256 million) respectively. The accumulated non-controlling interest at the end of the year was $12,081 million (2020 $12,076 million).
Non-controlling interests also includes perpetual subordinated hybrid securities issued during 2021 by a group subsidiary, of $950 million. The proceeds from this issuance were specifically earmarked to fund the forward purchase and leaseback of an under-construction floating, production, storage, and offloading vessel (FPSO) to be used on one of the group’s major projects. The contractual terms of these instruments allow the group to defer interest payments and repayment of principle indefinitely however their terms and conditions stipulate that the group must purchase them on the occurrence of certain events, all within the group’s control, including the declaration or payment of a BP p.l.c. distribution after mid-May 2026. The accumulated non-controlling interest at the end of the year was $960 million, including $10 million of profit attributable to holders.
As the group has the unconditional right to avoid transferring cash or another financial asset in relation to these hybrid bonds and securities, they are classified as equity instruments and reported within non-controlling interests in the consolidated financial statements.
| | | | | | | | | | | | | | |
246 | | bp Annual Report and Form 20-F 2021 | | |
31. Capital and reserves – continued
The pre-tax amounts of each component of other comprehensive income, and the related amounts of tax, are shown in the table below.
| | | | | | | | | | | | | | |
| | | | $ million |
| | | | 2021 |
| | Pre-tax | Tax | Net of tax |
| Items that may be reclassified subsequently to profit or loss | | | | |
| Currency translation differences (including reclassifications) | | (885) | | 15 | | (870) | |
| | | | |
| Cash flow hedges (including reclassifications) | | (175) | | 41 | | (134) | |
| Costs of hedging (including reclassifications) | | (84) | | 8 | | (76) | |
| Share of items relating to equity-accounted entities, net of tax | | 44 | | — | | 44 | |
| Other | | — | | 1 | | 1 | |
| Items that will not be reclassified to profit or loss | | | | |
| Remeasurements of the net pension and other post-retirement benefit liability or asset | | 4,416 | | (1,317) | | 3,099 | |
| Cash flow hedges that will subsequently be transferred to the balance sheet | | 1 | | — | | 1 | |
| | | | |
| | | | |
| Other comprehensive income | | 3,317 | | (1,252) | | 2,065 | |
| | | | |
| | | | $ million |
| | | | 2020 |
| | Pre-tax | Tax | Net of tax |
| Items that may be reclassified subsequently to profit or loss | | | | |
| Currency translation differences (including reclassifications) | | (2,196) | | 9 | | (2,187) | |
| Cash flow hedges (including reclassifications) | | 41 | | (10) | | 31 | |
| Costs of hedging (including reclassifications) | | 64 | | (4) | | 60 | |
| Share of items relating to equity-accounted entities, net of tax | | 312 | | — | | 312 | |
| Other | | — | | 71 | | 71 | |
| Items that will not be reclassified to profit or loss | | | | |
| Remeasurements of the net pension and other post-retirement benefit liability or asset | | 170 | | (105) | | 65 | |
| Cash flow hedges that will subsequently be transferred to the balance sheet | | 7 | | — | | 7 | |
| Other comprehensive income | | (1,602) | | (39) | | (1,641) | |
| | | | |
| | | | $ million |
| | | | 2019 |
| | Pre-tax | Tax | Net of tax |
| Items that may be reclassified subsequently to profit or loss | | | | |
| Currency translation differences (including reclassifications) | | 2,418 | | (2) | | 2,416 | |
| Cash flow hedges (including reclassifications) | | 6 | | (1) | | 5 | |
| Costs of hedging (including reclassifications) | | 53 | | (3) | | 50 | |
| Share of items relating to equity-accounted entities, net of tax | | 82 | | — | | 82 | |
| Other | | — | | (64) | | (64) | |
| Items that will not be reclassified to profit or loss | | | | |
| Remeasurements of the net pension and other post-retirement benefit liability or asset | | 328 | | (157) | | 171 | |
| Cash flow hedges that will subsequently be transferred to the balance sheet | | (3) | | — | | (3) | |
| Other comprehensive income | | 2,884 | | (227) | | 2,657 | |
32. Contingent liabilities and legal proceedings
Contingent liabilities
There were contingent liabilities at 31 December 2021 in respect of guarantees and indemnities entered into as part of the ordinary course of the group’s business. No material losses are likely to arise from such contingent liabilities. Further information on financial guarantees is included in Note 28.
In the normal course of the group’s business, bp group entities are subject to legal and regulatory proceedings arising out of current and past operations, including matters related to commercial disputes, product liability, antitrust, commodities trading, premises-liability claims, consumer protection, general health, safety, climate change and environmental claims and allegations of exposures of third parties to toxic substances, such as lead pigment in paint, asbestos and other chemicals. The amounts claimed could be significant and could be material to the group’s results of operations, financial position or liquidity. While it is difficult to predict the ultimate outcome in some cases, bp expects that the impact of current legal and regulatory proceedings on the group‘s results of operations, liquidity or financial position will not be material.
The group files tax returns in many jurisdictions across the world. Various tax authorities are currently examining these returns, which contain matters that could be subject to differing interpretations of applicable tax laws and regulations. The resolution of tax positions through negotiations with relevant tax authorities, or through litigation, can take several years to complete and the amounts could be significant and could, in aggregate, be material to the group’s results of operations, financial position or liquidity. While it is difficult to predict the ultimate outcome in some cases, bp does not expect there to be any material impact upon the group‘s results of operations, financial position or liquidity.
| | | | | | | | | | | | | | |
| | bp Annual Report and Form 20-F 2021 | | 247 |
32. Contingent liabilities and legal proceedings – continued
The group is subject to numerous national and local health, safety and environmental laws and regulations concerning its products, operations and other activities. These laws and regulations may require the group to take future action to remediate the effects on the environment of prior disposal or release of chemicals or petroleum substances by the group or other parties. Such contingencies may exist for various sites including refineries, chemical plants, oil fields, commodities extraction sites, service stations, terminals and waste disposal sites. In addition, the group may have obligations relating to prior asset sales or closed facilities. The ultimate requirement for remediation and its costs are inherently difficult to estimate. However, the estimated cost of environmental obligations has been provided in these accounts in accordance with the group‘s accounting policies. While the amounts of future possible costs that are not provided for could be significant and material to the group‘s results of operations in the period in which they are recognized, it is not possible to estimate the amounts involved. bp does not expect these costs to have a material impact on the group’s results of operations, financial position or liquidity.
If production and manufacturing facilities and pipelines are sold to third parties and the subsequent owner is unable to meet their decommissioning obligations it is possible that, in certain circumstances, bp could be partially or wholly responsible for decommissioning. The group estimates that for production facilities, approximately $13 billion of associated decommissioning obligations were previously transferred to third parties. While the amounts associated with decommissioning provisions reverting to the group could be material, bp is not currently aware of any such material cases that have a greater than remote chance of reverting to the group. In one current case the owner of facilities has agreed to relinquish all of its assets to the U.S. government upon liquidation to resolve the outstanding liability. It is considered possible that certain decommissioning costs associated with some of these facilities in relation to assets previously disposed may in the future revert to bp; however, no provision has been recognized as no present obligation exists at the balance sheet date. Should the obligation revert, it is not expected to have a material impact on the group's financial position. Furthermore, as described in Provisions and contingencies within Note 1, decommissioning provisions associated with customers & products facilities are not generally recognized as the potential obligations cannot be measured given their indeterminate settlement dates.
By their nature, it is not practicable to estimate the potential financial impact or possible timing of the above contingencies as there are significant uncertainties that are dependent on various factors that are not within the group’s control.
Contingent liabilities related to the Gulf of Mexico oil spill
For information on legal proceedings relating to the Deepwater Horizon oil spill, see Legal proceedings below. Any outstanding Deepwater Horizon related claims are not expected to have a material impact on the group's financial performance.
Legal proceedings
Proceedings relating to the Deepwater Horizon oil spill
Introduction
BP Exploration & Production Inc. (BPXP) was lease operator of Mississippi Canyon, Block 252 in the Gulf of Mexico, where the semi-submersible rig Deepwater Horizon was deployed at the time of the 20 April 2010 explosion and fire and resulting oil spill (the Incident). Lawsuits and claims arising from the Incident were brought principally in US federal and state courts. The remaining proceedings arising from the Incident are discussed below.
Economic and Property Damages Settlement
Following orders issued by United States District Court for the Eastern District of Louisiana on 22 January 2021, the claims administrator pursuant to the settlement programme which was established by the Economic and Property Damages Settlement has completed post-closure administrative wind down activities and the administration website has been closed.
Medical Benefits Class Action Settlement
In 2012 the Medical Benefits Class Action Settlement (Medical Settlement) was entered into with the plaintiffs steering committee. It involves payments to qualifying class members based on a matrix for certain Specified Physical Conditions (SPCs), as well as a 21-year Periodic Medical Consultation Program (PMCP) for qualifying class members. All SPC claims have been determined by the medical claims administrator. In total, 27,603 claims (comprising 22,833 SPC claims and 4,770 PMCP claims) have been approved for compensation totalling approximately $67 million and 9,624 claims have been denied.
The Medical Settlement also includes an exclusive remedy provision regarding class members pursuing exposure-based personal injury claims for later-manifested physical conditions (LMPCs). In order to seek compensation from bp for an LMPC, class members must file a notice with the medical claims administrator within four years after the date of first diagnosis of the LMPC. As of 31 December 2021, there were 199 pending lawsuits brought by class members claiming LMPCs.
Other civil complaints – economic loss
All but one of the economic loss and property damage claims from individuals and businesses that either opted out of the EPD Settlement and/or were excluded from that settlement have been settled or dismissed.
One appeal remains pending before the Fifth Circuit by a plaintiff whose economic loss claims were dismissed by an August 2021 order from the federal district court in New Orleans that granted bp’s motion for summary judgment.
Other civil complaints – personal injury
The vast majority of post-explosion clean-up, medical monitoring and personal injury claims from individuals that either opted out of the Medical Settlement and/or were excluded from that settlement have been dismissed.
In early April 2021, the federal district court in New Orleans severed nearly all of the remaining post-explosion clean-up, medical monitoring and personal injury cases from the consolidated multi-district proceedings. Of those severed cases, 19 are pending before other federal courts in Gulf Coast States, and the remaining 777 cases have been re-allotted among the judges of the federal district court in the Eastern District of Louisiana. 9 post-explosion clean-up, medical monitoring and personal injury cases will remain in the consolidated multi-district proceedings until plaintiffs have complied with the court’s pre-trial orders, after which they will be severed from the consolidated multi-district proceedings.
| | | | | | | | | | | | | | |
248 | | bp Annual Report and Form 20-F 2021 | | |
32. Contingent liabilities and legal proceedings – continued
Non-US government lawsuits
On 18 October 2012, a group of Mexican fishermen filed a class action complaint in a Mexican Federal District Court located in Mexico City against BP America Production Company (BPAPC) and other bp subsidiaries, seeking to recover for alleged environmental and economic harm in Mexico as a result of the Incident. On 27 June 2018, bp answered the complaint by seeking dismissal on various grounds including that no oil reached Mexican waters or land and there was no economic or environmental harm in Mexico. There has been no subsequent material development in these proceedings.
On 3 December 2015 and 29 March 2016, Acciones Colectivas de Sinaloa (ACS) filed two class actions (which have since been consolidated) in a Mexican Federal District Court on behalf of any person or entity harmed by the Incident, including several coastal Mexican states and municipalities against BPXP, BPAPC, and other purported bp subsidiaries. In these class actions, plaintiffs seek an order requiring the bp defendants to repair the damage to the Gulf of Mexico, to pay penalties, and to compensate plaintiffs for damage to property, to health and for economic loss. BPXP and BPAPC opposed class certification and sought dismissal, principally on the basis that no oil reached Mexican waters or land and there was no economic or environmental harm in Mexico. The court certified the class on 25 September 2019 and bp appealed that decision including by way of constitutional challenge. That challenge was denied on 8 October 2020 and on 18 January 2021, bp’s appeal of that ruling was also denied. On 27 December 2019, the court issued an order on class notification procedures. On 2 January 2020, ACS moved for reconsideration of the order on class notification procedures, which was denied on 26 October 2021. On 22 November 2021, ACS filed a constitutional challenge to the notice ruling. A decision on the constitutional challenge is pending.
These legal actions remain at a relatively early stage and while it is not possible to predict the outcome, bp believes that it has valid defences, and it intends to defend such actions vigorously.
Other legal proceedings
FERC and CFTC matters
Following an investigation by the US Federal Energy Regulatory Commission (FERC) and the US Commodity Futures Trading Commission (CFTC) of several bp entities, the Administrative Law Judge of the FERC ruled on 13 August 2015 that bp manipulated the market by selling next-day, fixed price natural gas at Houston Ship Channel in 2008 in order to suppress the Gas Daily index and benefit its financial position. On 11 July 2016 the FERC issued an Order affirming the initial decision and directing bp to pay a civil penalty of $20.16 million and to disgorge $207,169 in unjust profits. On 10 August 2016, bp filed a request for rehearing with the FERC. On 17 December 2020, the FERC denied the rehearing request, sustaining the prior decision and ordering payment of the penalty and disgorgement amounts. bp has complied with the order but strongly disagrees with the FERC’s decision and filed an appeal with the US Court of Appeals. Oral arguments were heard by the Fifth Circuit in early 2022 and a decision is expected later this year.
Lead paint matters
Since 1987, Atlantic Richfield Company (Atlantic Richfield), a subsidiary« of bp, has been named as a co-defendant in numerous lawsuits brought in the US alleging injury to persons and property caused by lead pigment in paint. The majority of the lawsuits have been abandoned or dismissed against Atlantic Richfield. Atlantic Richfield is named in these lawsuits as alleged successor to International Smelting and Refining and another company that manufactured lead pigment during the period 1920-1946. The plaintiffs include individuals and governmental entities. Several of the lawsuits purport to be class actions. The lawsuits seek various remedies including compensation to lead-poisoned children, cost to find and remove lead paint from buildings, medical monitoring and screening programmes, public warning and education of lead hazards, reimbursement of government healthcare costs and special education for lead-poisoned citizens and punitive damages. No lawsuit against Atlantic Richfield has been settled nor has Atlantic Richfield been subject to a final adverse judgment in any proceeding. The amounts claimed and, if such suits were successful, the costs of implementing the remedies sought in the various cases could be substantial. While it is not possible to predict the outcome of these legal actions, Atlantic Richfield believes that it has valid defences. It intends to defend such actions vigorously and believes that the incurrence of liability is remote. Consequently, bp believes that the impact of these lawsuits on the group’s results, financial position or liquidity will not be material.
Climate change
BP p.l.c., BP America Inc. and BP Products North America Inc. are co-defendants with other oil and gas companies in multiple lawsuits brought in various state and federal courts on behalf of various governmental and private parties. The lawsuits generally assert claims under a variety of legal theories seeking to hold the defendant companies responsible for impacts allegedly caused by and/or relating to climate change. Underlying many of the legal theories are allegations regarding deceptive communication and disinformation to the public. The lawsuits seek remedies including payment of money and other forms of equitable relief. If such suits were successful, the cost of the remedies sought in the various cases could be substantial. All of these lawsuits remain at relatively early stages and while it is not possible to predict the outcome of these legal actions, bp believes that it has valid defences, and it intends to defend such actions vigorously.
Louisiana Coastal restoration
Six coastal parishes and the State of Louisiana have filed over 40 separate lawsuits in state courts in Louisiana against various oil and gas companies seeking damages for coastal erosion. bp entities are defendants in 17 of these cases. The lawsuits allege that the defendants' historical operations in oil fields within the Louisiana onshore coastal zone failed to comply with state permits and/or were conducted without the required coastal use permits. The plaintiffs seek unspecified statutory penalties and damages, including the costs of restoring coastal wetlands allegedly impacted by oil field operations.
In addition, four private landowners have filed separate claims in the state courts in Jefferson and Plaquemines Parishes of Louisiana for restoration damages related to alleged impacts to their marshlands associated with historic oil field operations. bp entities are defendants in two of these private landowner cases.
All of these lawsuits remain at relatively early stages and while it is not possible to predict the outcome of these legal actions, bp believes that it has valid defences, and it intends to defend such actions vigorously.
| | | | | | | | | | | | | | |
| | bp Annual Report and Form 20-F 2021 | | 249 |
33. Remuneration of senior management and non-executive directors
Remuneration of directors
| | | | | | | | | | | | | | |
| | | | $ million |
| | 2021 | 2020 | 2019 |
| Total for all directors | | | | |
| Emoluments | | 9 | | 6 | | 9 | |
Amounts received under incentive schemesa | | 4 | | 14 | | 20 | |
| Total | | 13 | | 20 | | 29 | |
a Excludes amounts relating to past directors.
Emoluments
These amounts comprise fees paid to the non-executive chair and the non-executive directors and, for executive directors, salary and benefits earned during the relevant financial year, plus cash bonuses awarded for the year.
Further information
Full details of individual directors’ remuneration are given in the Directors’ remuneration report on page 116. See also Related-party transactions on page 361.
Remuneration of directors and senior management
| | | | | | | | | | | | | | |
| | | | $ million |
| | 2021 | 2020 | 2019 |
| Total for all senior management and non-executive directors | | | | |
| Short-term employee benefits | | 30 | | 17 | | 30 | |
| Pensions and other post-retirement benefits | | 1 | | 2 | | 2 | |
| Share-based payments | | 32 | | 52 | | 32 | |
| Termination benefits | | – | 8 | | — | |
| Total | | 63 | | 79 | | 64 | |
Senior management comprises members of the leadership team, see pages 88-89 for further information.
Short-term employee benefits
These amounts comprise fees and benefits paid to the non-executive chair and non-executive directors, as well as salary, benefits and cash bonuses for senior management. Deferred annual bonus awards, to be settled in shares, are included in share-based payments.
Pensions and other post-retirement benefits
The amounts represent the estimated cost to the group of providing pensions and other post-retirement benefits to senior management in respect of the current year of service measured in accordance with IAS 19 ‘Employee Benefits’.
Share-based payments
This is the cost to the group of senior management’s participation in share-based payment plans, as measured by the fair value of options and shares granted, accounted for in accordance with IFRS 2 ‘Share-based Payments’.
Termination benefits
Termination benefits include compensation to senior management for loss of office.
| | | | | | | | | | | | | | |
250 | | bp Annual Report and Form 20-F 2021 | | |
34. Employee costs and numbers
| | | | | | | | | | | | | | |
| | | | $ million |
| Employee costs | | 2021 | 2020 | 2019 |
Wages and salariesa | | 6,934 | | 7,600 | | 7,497 | |
| Social security costs | | 733 | | 729 | | 733 | |
Share-based paymentsb | | 733 | | 728 | | 694 | |
| Pension and other post-retirement benefit costs | | 457 | | 852 | | 948 | |
| | 8,857 | | 9,909 | | 9,872 | |
| | | | | | | | | | | | | | | | | | | | | | | | | | | | | | | | |
| | | | 2021 | | | 2020 | | | 2019 |
Average number of employeesc d | | US | Non-US | Total | US | Non-US | Total | US | Non-US | Total |
| gas & low carbon energy | | 400 | | 3,400 | | 3,800 | | | | | | | |
| oil production & operations | | 3,100 | | 6,000 | | 9,100 | | | | | | | |
customers & productse | | 6,200 | | 35,800 | | 42,000 | | | | | | | |
other businesses and corporatef | | 1,400 | | 7,700 | | 9,100 | | | | | | | |
| | 11,100 | | 52,900 | | 64,000 | | 12,400 | | 55,700 | | 68,100 | | 13,600 | | 58,900 | | 72,500 | |
a Includes termination costs of $74 million (2020 $1,237 million and 2019 $182 million).
b The group provides certain employees with shares and share options as part of their remuneration packages. The majority of these share-based payment arrangements are equity-settled.
c Reported to the nearest 100.
d Information for 2021 has been presented to reflect the changes in reportable segments. For more information see Note 1 Significant accounting policies, judgements, estimates and assumptions - Change in segmentation. Comparative data for these new reportable segments for 2020 and 2019 is not available.
e Includes 21,300 (2020 19,100 and 2019 18,100) service station staff.
f Includes 0 (2020 0 and 2019 2,500) agricultural, operational and seasonal workers in Brazil.
The reduction in the average number of employees in 2021 compared to 2020 is principally a result of the reinvent bp programme.
35. Auditor’s remuneration
| | | | | | | | | | | | | | |
| | | | $ million |
| Fees | | 2021 | 2020 | 2019 |
The audit of the company annual accountsa | | 37 | | 30 | | 32 | |
| The audit of accounts of subsidiaries of the company | | 15 | | 11 | | 11 | |
| Total audit | | 52 | | 41 | | 43 | |
Audit-related assurance servicesb | | 5 | | 11 | | 4 | |
| Total audit and audit-related assurance services | | 57 | | 52 | | 47 | |
| | | | |
| | | | |
| | | | |
| Non-audit and other assurance services | | — | | 1 | | 1 | |
| | | | |
| Services relating to bp pension plans | | 1 | | 1 | | 1 | |
| | 58 | | 54 | | 49 | |
a Fees in respect of the audit of the accounts of BP p.l.c. including the group’s consolidated financial statements.
b Includes interim reviews and audit of internal control over financial reporting and non-statutory audit services. 2020 fees include audit fees relating to the Petrochemicals disposal.
With effect from 2018, following a competitive tender process, Deloitte LLP (Deloitte) was appointed as auditor of the Company, replacing Ernst & Young LLP (EY).
2021 includes $1.0 million of additional fees for 2020. 2020 includes $0.5 million of additional fees for 2019. 2019 includes $3.6 million of additional fees for 2018. Auditor's remuneration is included in the income statement within distribution and administration expenses.
Tax services (in relation to income tax, indirect tax compliance, employee tax services and tax advisory services) were $nil in all periods presented.
The audit committee has established pre-approval policies and procedures for the engagement of Deloitte to render audit and certain assurance and other services. The audit fees payable to Deloitte were considered as part of the audit tender process in 2016 and challenged by the audit committee through comparison with the audit pricing proposals of the other bidding firms. Changes in audit fees subsequent to the audit tender, including matters relevant to the 2021 audit, have been reviewed and challenged by the Audit Committee, before being approved. Deloitte performed further assurance services that were not prohibited by regulatory or other professional requirements and were pre-approved by the Committee. Deloitte is engaged for these services when its expertise and experience of bp are important. Most of this work is of an audit-related or assurance nature.
Under SEC regulations, the remuneration of the auditor of $58 million (2020 $54 million and 2019 $49 million) is required to be presented as follows: audit $52 million (2020 $41 million and 2019 $43 million); other audit-related $5 million (2020 $11 million and 2019 $4 million); tax $nil (2020 $nil and 2019 $nil); and all other fees $1 million (2020 $2 million and 2019 $2 million).
| | | | | | | | | | | | | | |
| | bp Annual Report and Form 20-F 2021 | | 251 |
36. Subsidiaries, joint arrangements and associates
The more important subsidiaries, joint arrangements and associates of the group at 31 December 2021 and the group percentage of ordinary share capital (to nearest whole number) are set out below. The group's share of the assets and liabilities of the more important unincorporated joint arrangements are held by subsidiaries listed in the table below. Those subsidiaries held directly by the parent company are marked with an asterisk (*), the percentage owned being that of the group unless otherwise indicated. A complete list of undertakings of the group is included in Note 14 in the parent company financial statements of BP p.l.c. which are filed with the Registrar of Companies in the UK, along with the group’s annual report.
| | | | | | | | | | | | | | | | | |
| Subsidiaries | | % | Country of
incorporation | | Principal activities |
| International | | | | | |
| BP Corporate Holdings Limited | | 100 | | England & Wales | | Investment holding |
| BP Exploration Operating Company Limited | | 100 | | England & Wales | | Exploration and production |
| *BP Global Investments Limited | | 100 | | England & Wales | | Investment holding |
| *BP International Limited | | 100 | | England & Wales | | Integrated oil operations |
| BP Oil International Limited | | 100 | | England & Wales | | Integrated oil operations |
| *Burmah Castrol PLC | | 100 | | Scotland | | Lubricants |
| Angola | | | | | |
| BP Exploration (Angola) Limited | | 100 | | England & Wales | | Exploration and production |
| Azerbaijan | | | | | |
| BP Exploration (Caspian Sea) Limited | | 100 | | England & Wales | | Exploration and production |
| BP Exploration (Azerbaijan) Limited | | 100 | | England & Wales | | Exploration and production |
| Canada | | | | | |
| *BP Holdings Canada Limited | | 100 | | England & Wales | | Investment holding |
| Egypt | | | | | |
| BP Exploration (Delta) Limited | | 100 | | England & Wales | | Exploration and production |
| Germany | | | | | |
| BP Europa SE | | 100 | | Germany | | Refining and marketing |
| India | | | | | |
| BP Exploration (Alpha) Limited | | 100 | | England & Wales | | Exploration and production |
| Trinidad & Tobago | | | | | |
| BP Trinidad and Tobago LLC | | 70 | | US | | Exploration and production |
| UK | | | | | |
| BP Capital Markets p.l.c. | | 100 | | England & Wales | | Finance |
| US | | | | | |
| *BP Holdings North America Limited | | 100 | | England & Wales | | Investment holding |
| Atlantic Richfield Company | | 100 | | US | | Exploration and production, refining and marketing |
| BP America Inc. | | 100 | | US | |
| BP America Production Company | | 100 | | US | |
| BP Company North America Inc. | | 100 | | US | |
| BP Corporation North America Inc. | | 100 | | US | |
| | | | |
| BP Products North America Inc. | | 100 | | US | |
| The Standard Oil Company | | 100 | | US | |
| BP Capital Markets America Inc. | | 100 | | US | | Finance |
| | | | | |
| Joint arrangements | | % | Country of
incorporation | | Principal activities |
| Argentina | | | | | |
| Pan American Energy Group S.L. | | 50 | | Spain | | Integrated oil operations |
| | | | | |
| Associates | | % | Country of
incorporation | | Principal activities |
| Russia | | | | | |
Rosneft Oil Companya | | 19.75 | | Russia | | Integrated oil operations |
a See Note 37 Events after the reporting period.
| | | | | | | | | | | | | | |
252 | | bp Annual Report and Form 20-F 2021 | | |
37. Events after the reporting period
On 27 February 2022, following the military action in Ukraine, bp announced that bp it will exit its 19.75% shareholding in Rosneft Oil Company (Rosneft) a Russian oil and gas company. As of 27 February 2022, bp chief executive officer Bernard Looney also stepped down from the board of Rosneft with immediate effect and has submitted a letter of resignation as did the other Rosneft director nominated by bp, former bp group chief executive Bob Dudley.
As a result of bp’s nominated directors stepping down from the Rosneft board, bp has determined that as of 27 February 2022, the group no longer has significant influence over Rosneft taking into account the criteria set out in IAS 28 Investments in Associates and Joint Ventures, bp will therefore no longer equity account for its interest in Rosneft as of that date, treating the investment prospectively as a financial asset measured at fair value within ‘Other investments’ until the shareholding is derecognized.
Additionally, in response to sanctions imposed on Russia by a number of countries, Russia has implemented new counter-sanctions including restrictions on the divestment from Russian assets by foreign investors and a reported temporary prohibition on registrars and depositories from making payments on Russian securities in favour of foreign investors. Further details including confirmation of the precise terms or application of these counter-sanctions are not yet known.
The discontinuation of equity accounting combined with the market impact on Russian assets that has arisen following the military action in Ukraine will have a material effect on the group’s first quarter 2022 interim financial statements including on the carrying amount of bp’s investment in Rosneft, which at 31 December 2021 stood at approximately $14 billion. In addition, foreign exchange losses and other cumulative charges to other comprehensive income will be taken to the income statement. At 31 December 2021, these amounts stood at approximately $11 billion. The change in accounting treatment also means that bp will no longer recognize a share in Rosneft’s net income, production and reserves from 27 February 2022. The group will cease to report Rosneft as a separate segment in the group’s financial reporting for 2022.
Also, as of 27 February 2022, bp decided to exit its other businesses with Rosneft within Russia, the carrying value of which stood at $1.4 billion at 31 December 2021. The associated impacts will also be reflected in the group’s first quarter 2022 interim financial statements.
| | | | | | | | | | | | | | |
| | bp Annual Report and Form 20-F 2021 | | 253 |
Supplementary information on oil and natural gas (unaudited)
The regional analysis presented below is on a continent basis, with separate disclosure for countries that contain 15% or more of the total proved reserves (for subsidiaries plus equity-accounted entitiesa), in accordance with SEC and FASB requirements.
Oil and gas reserves – certain definitions
Unless the context indicates otherwise, the following terms have the meanings shown below:
Proved oil and gas reserves
Proved oil and gas reserves are those quantities of oil and gas, which, by analysis of geoscience and engineering data, can be estimated with reasonable certainty to be economically producible – from a given date forward, from known reservoirs, and under existing economic conditions, operating methods, and government regulations – prior to the time at which contracts providing the right to operate expire, unless evidence indicates that renewal is reasonably certain, regardless of whether deterministic or probabilistic methods are used for the estimation. The project to extract the hydrocarbons must have commenced or the operator must be reasonably certain that it will commence the project within a reasonable time.
(i)The area of the reservoir considered as proved includes:
(A) The area identified by drilling and limited by fluid contacts, if any; and
(B) Adjacent undrilled portions of the reservoir that can, with reasonable certainty, be judged to be continuous with it and to contain economically producible oil or gas on the basis of available geoscience and engineering data.
(ii)In the absence of data on fluid contacts, proved quantities in a reservoir are limited by the lowest known hydrocarbons as seen in a well penetration unless geoscience, engineering, or performance data and reliable technology establishes a lower contact with reasonable certainty.
(iii)Where direct observation from well penetrations has defined a highest known oil elevation and the potential exists for an associated gas cap, proved oil reserves may be assigned in the structurally higher portions of the reservoir only if geoscience, engineering, or performance data and reliable technology establish the higher contact with reasonable certainty.
(iv)Reserves which can be produced economically through application of improved recovery techniques (including, but not limited to, fluid injection) are included in the proved classification when:
(A) Successful testing by a pilot project in an area of the reservoir with properties no more favourable than in the reservoir as a whole, the operation of an installed programme in the reservoir or an analogous reservoir, or other evidence using reliable technology establishes the reasonable certainty of the engineering analysis on which the project or programme was based; and
(B) The project has been approved for development by all necessary parties and entities, including governmental entities.
(v)Existing economic conditions include prices and costs at which economic producibility from a reservoir is to be determined. The price shall be the average price during the 12-month period prior to the ending date of the period covered by the report, determined as an unweighted arithmetic average of the first-day-of-the-month price for each month within such period, unless prices are defined by contractual arrangements, excluding escalations based upon future conditions.
Undeveloped oil and gas reserves
Undeveloped oil and gas reserves are reserves of any category that are expected to be recovered from new wells on undrilled acreage, or from existing wells where a relatively major expenditure is required for recompletion.
(i)Reserves on undrilled acreage shall be limited to those directly offsetting development spacing areas that are reasonably certain of production when drilled, unless evidence using reliable technology exists that establishes reasonable certainty of economic producibility at greater distances.
(ii)Undrilled locations can be classified as having undeveloped reserves only if a development plan has been adopted indicating that they are scheduled to be drilled within five years, unless the specific circumstances, justify a longer time.
(iii)Under no circumstances shall estimates for undeveloped reserves be attributable to any acreage for which an application of fluid injection or other improved recovery technique is contemplated, unless such techniques have been proved effective by actual projects in the same reservoir or an analogous reservoir, or by other evidence using reliable technology establishing reasonable certainty.
Developed oil and gas reserves
Developed oil and gas reserves are reserves of any category that can be expected to be recovered:
(i)Through existing wells with existing equipment and operating methods or in which the cost of the required equipment is relatively minor compared to the cost of a new well; and
(ii)Through installed extraction equipment and infrastructure operational at the time of the reserves estimate if the extraction is by means not involving a well.
For details on bp’s proved reserves and production compliance and governance processes, see pages 348-353.
a See Note 37 Events after the reporting period.
| | | | | | | | | | | | | | |
254 | | bp Annual Report and Form 20-F 2021 | | |
Oil and natural gas exploration and production activities
| | | | | | | | | | | | | | | | | | | | | | | | | | | | | | | | | | | |
| | | | | | | | | | | $ million |
| | | | | | | | | | | 2021 |
| | Europe | North
America | South
America | Africa | Asia | Australasia | Total |
| | UK | Rest of
Europe | US | Rest of
North
America | | | Russia | Rest of
Asia | | |
| Subsidiaries | | | | | | | | | | | |
Capitalized costs at 31 Decembera b | | | | | | | | | |
| Gross capitalized costs | | | | | | | | | | | |
| Proved properties | | 30,285 | | — | | 62,157 | | 3,385 | | 16,351 | | 51,157 | | | 45,767 | | 6,641 | | 215,743 | |
| Unproved properties | | 363 | | — | | 2,888 | | 2,650 | | 2,517 | | 3,553 | | | 1,690 | | 650 | | 14,311 | |
| | 30,648 | | — | | 65,045 | | 6,035 | | 18,868 | | 54,710 | | — | | 47,457 | | 7,291 | | 230,054 | |
| Accumulated depreciation | | 21,293 | | — | | 34,151 | | 5,008 | | 14,393 | | 46,187 | | | 26,607 | | 4,617 | | 152,256 | |
| Net capitalized costs | | 9,355 | | — | | 30,894 | | 1,027 | | 4,475 | | 8,523 | | — | | 20,850 | | 2,674 | | 77,798 | |
| | | | | | | | | | | |
Costs incurred for the year ended 31 Decembera b | | | | | | | | |
| Acquisition of properties | | | | | | | | | | | |
| Proved | | — | | — | | 81 | | — | | — | | — | | — | | — | | — | | 81 | |
| Unproved | | — | | — | | 18 | | — | | — | | — | | — | | — | | — | | 18 | |
| | — | | — | | 99 | | — | | — | | — | | | — | | — | | 99 | |
Exploration and appraisal costsc | | 28 | | — | | 138 | | 88 | | 90 | | 85 | | — | | 159 | | 18 | | 606 | |
Developmentd | | 262 | | — | | 2,541 | | (50) | | 586 | | 1,246 | | — | | 1,849 | | 162 | | 6,596 | |
| Total costs | | 290 | | — | | 2,778 | | 38 | | 676 | | 1,331 | | — | | 2,008 | | 180 | | 7,301 | |
| | | | | | | | | | | |
Results of operations for the year ended 31 Decembera | | | | | | | | |
Sales and other operating revenuese | | | | | | | | | | | |
| Third parties | | 182 | | — | | 1,700 | | 384 | | 1,330 | | 2,934 | | 2 | | 2,469 | | 994 | | 9,995 | |
| Sales between businesses | | 3,204 | | — | | 9,034 | | 1 | | 321 | | 2,172 | | — | | 7,064 | | 743 | | 22,539 | |
| | 3,386 | | — | | 10,734 | | 385 | | 1,651 | | 5,106 | | 2 | | 9,533 | | 1,737 | | 32,534 | |
| Exploration expenditure | | 76 | | — | | 78 | | 90 | | 29 | | 84 | | — | | 52 | | 15 | | 424 | |
| Production costs | | 653 | | — | | 1,953 | | 121 | | 371 | | 781 | | — | | 967 | | 121 | | 4,967 | |
| Production taxes | | (35) | | — | | 108 | | — | | 266 | | — | | — | | 918 | | 51 | | 1,308 | |
Other costs (income)f | | 170 | | (2) | | 2,506 | | 35 | | 50 | | 121 | | 37 | | (12) | | 139 | | 3,044 | |
Depreciation, depletion and amortization | | 1,260 | | — | | 3,153 | | 83 | | 524 | | 2,897 | | 2 | | 2,190 | | 332 | | 10,441 | |
Net impairments and (gains) losses on sale of businesses and fixed assets | | (755) | | (124) | | (1,599) | | 1,075 | | (693) | | 750 | | — | | (2,762) | | (1) | | (4,109) | |
| | 1,369 | | (126) | | 6,199 | | 1,404 | | 547 | | 4,633 | | 39 | | 1,353 | | 657 | | 16,075 | |
Profit (loss) before taxationg | | 2,017 | | 126 | | 4,535 | | (1,019) | | 1,104 | | 473 | | (37) | | 8,180 | | 1,080 | | 16,459 | |
| Allocable taxes | | 302 | | 1 | | 1,127 | | 171 | | 696 | | 363 | | — | | 3,055 | | 404 | | 6,119 | |
| Results of operations | | 1,715 | | 125 | | 3,408 | | (1,190) | | 408 | | 110 | | (37) | | 5,125 | | 676 | | 10,340 | |
| | | | | | | | | | | |
| | | | |
| | | | | | | | | | | |
| | | | | | | | | | | |
| | | | | | | | | | | |
| | | | | | | | | | | |
a These tables contain information relating to oil and natural gas exploration and production activities of subsidiaries, which includes bp's share of oil and natural gas exploration and production activities of joint operations. They do not include any costs relating to the Gulf of Mexico oil spill. Amounts relating to the management and ownership of crude oil and natural gas pipelines, LNG liquefaction and transportation operations are excluded. In addition, bp's midstream activities of marketing and trading of natural gas, power and NGLs in the US, Canada, UK, Asia and Europe are excluded. The most significant midstream pipeline interests include the South Caucasus Pipeline, the Baku-Tbilisi-Ceyhan pipeline, the Trans Adriatic Pipeline and the Trans Anatolian Pipeline. Major LNG activities are located in Trinidad, Indonesia and Australia.
b Costs of decommissioning are included in capitalized costs at 31 December but are excluded from costs incurred for the year.
c Includes exploration and appraisal drilling expenditures, which are capitalized within intangible assets, and geological and geophysical exploration costs, which are charged to income as incurred.
d Development costs in Rest of North America are negative due to a true-up of prior period spend.
e Presented net of transportation costs, purchases and sales taxes.
f Includes property taxes and other government take. The UK region includes a $213-million gain which is offset by corresponding charges primarily in the US region, relating to the group self-insurance programme.
g Excludes the unwinding of the discount on provisions and payables amounting to $325-million which is included in finance costs in the group income statement.
| | | | | | | | | | | | | | |
| | bp Annual Report and Form 20-F 2021 | | 255 |
Oil and natural gas exploration and production activities – continued
| | | | | | | | | | | | | | | | | | | | | | | | | | | | | | | | | | | |
| | | | | | | | | | | $ million |
| | | | | | | | | | | 2021 |
| | Europe | North
America | South
America | Africa | Asia | Australasia | Total |
| | UK | Rest of
Europe | US | Rest of
North
America | | | Russiaa | Rest of
Asia | | |
| Equity-accounted entities (bp share) | | | | | | | | | |
Capitalized costs at 31 Decemberb c | | | | | | | | | |
| Gross capitalized costs | | | | | | | | | | | |
| Proved properties | | — | | 2,507 | | — | | — | | 11,287 | | — | | 24,172 | | — | | — | | 37,966 | |
| Unproved properties | | — | | 383 | | — | | — | | 98 | | — | | 4,362 | | — | | — | | 4,843 | |
| | — | | 2,890 | | — | | — | | 11,385 | | — | | 28,534 | | — | | — | | 42,809 | |
| Accumulated depreciation | | — | | 1,267 | | — | | — | | 5,894 | | — | | 7,389 | | — | | — | | 14,550 | |
| Net capitalized costs | | — | | 1,623 | | — | | — | | 5,491 | | — | | 21,145 | | — | | — | | 28,259 | |
| | | | | | | | | | | |
Costs incurred for the year ended 31 Decemberb d e | | | | | | | |
Acquisition of propertiesc | | | | | | | | | | | |
| Proved | | — | | — | | — | | — | | — | | — | | — | | — | | — | | — | |
| Unproved | | — | | — | | — | | — | | — | | — | | 75 | | — | | — | | 75 | |
| | — | | — | | — | | — | | — | | — | | 75 | | — | | — | | 75 | |
Exploration and appraisal costsd | | — | | 60 | | — | | — | | 8 | | — | | 196 | | — | | — | | 264 | |
| Development | | — | | 430 | | — | | — | | 539 | | — | | 2,677 | | — | | — | | 3,646 | |
| Total costs | | — | | 490 | | — | | — | | 547 | | — | | 2,948 | | — | | — | | 3,985 | |
| | | | | | | | | | | |
Results of operations for the year ended 31 Decemberb | | | | | | | |
Sales and other operating revenuesf | | | | | | | | | | | |
| Third parties | | — | | 1,677 | | — | | — | | 1,637 | | — | | — | | — | | — | | 3,314 | |
| Sales between businesses | | — | | — | | — | | — | | — | | — | | 17,120 | | — | | — | | 17,120 | |
| | — | | 1,677 | | — | | — | | 1,637 | | — | | 17,120 | | — | | — | | 20,434 | |
| Exploration expenditure | | — | | 105 | | — | | — | | 3 | | — | | 50 | | — | | — | | 158 | |
| Production costs | | — | | 222 | | — | | — | | 487 | | — | | 1,335 | | — | | — | | 2,044 | |
| Production taxes | | — | | — | | — | | — | | 308 | | — | | 9,291 | | — | | — | | 9,599 | |
| Other costs (income) | | — | | 26 | | — | | — | | 34 | | — | | 293 | | — | | — | | 353 | |
| Depreciation, depletion and amortization | | — | | 347 | | — | | — | | 404 | | — | | 1,633 | | — | | — | | 2,384 | |
Net impairments and losses on sale of businesses and fixed assets | | — | | 108 | | — | | — | | (32) | | — | | 191 | | — | | — | | 267 | |
| | — | | 808 | | — | | — | | 1,204 | | — | | 12,793 | | — | | — | | 14,805 | |
| Profit (loss) before taxation | | — | | 869 | | — | | — | | 433 | | — | | 4,327 | | — | | — | | 5,629 | |
| Allocable taxes | | — | | 599 | | — | | — | | 684 | | — | | 852 | | — | | — | | 2,135 | |
| Results of operations | | — | | 270 | | — | | — | | (251) | | — | | 3,475 | | — | | — | | 3,494 | |
| | | | | | | | | | | |
|
| | | | | | | | | | | |
| | | | | | | | | | | |
| | | | | | | | | | | |
a Amounts reported for Russia in this table include bp’s share of Rosneft’s worldwide activities, including insignificant amounts outside Russia. See Note 37 Events after the reporting period.
b These tables contain information relating to oil and natural gas exploration and production activities of equity-accounted entities. Amounts relating to the management and ownership of crude oil and natural gas pipelines, LNG liquefaction, transportation operations as well as downstream and other activities are excluded.
c Costs of decommissioning are included in capitalized costs at 31 December but are excluded from costs incurred for the year.
d Includes exploration and appraisal drilling expenditures, which are capitalized within intangible assets, and geological and geophysical exploration costs, which are charged to income as incurred.
e The amounts shown reflect bp’s share of equity-accounted entities’ costs incurred, and not the costs incurred by bp in acquiring an interest in equity-accounted entities.
f Presented net of sales tax.
| | | | | | | | | | | | | | |
256 | | bp Annual Report and Form 20-F 2021 | | |
Oil and natural gas exploration and production activities – continued
| | | | | | | | | | | | | | | | | | | | | | | | | | | | | | | | | | | |
| | | | | | | | | | | $ million |
| | | | | | | | | | | 2020 |
| | Europe | North
America | South
America | Africa | Asia | Australasia | Total |
| | UK | Rest of
Europe | US | Rest of
North
America | | | Russia | Rest of
Asia | | |
| Subsidiaries | | | | | | | | | | | |
Capitalized costs at 31 Decembera b | | | | | | | | | |
| Gross capitalized costs | | | | | | | | | | | |
| Proved properties | | 31,729 | | — | | 63,803 | | 3,431 | | 15,526 | | 49,736 | | — | | 44,031 | | 6,409 | | 214,665 | |
| Unproved properties | | 410 | | — | | 3,102 | | 2,644 | | 2,477 | | 3,560 | | — | | 1,584 | | 640 | | 14,417 | |
| | 32,139 | | — | | 66,905 | | 6,075 | | 18,003 | | 53,296 | | — | | 45,615 | | 7,049 | | 229,082 | |
| Accumulated depreciation | | 22,501 | | — | | 37,176 | | 3,852 | | 14,488 | | 42,575 | | — | | 26,246 | | 4,282 | | 151,120 | |
| Net capitalized costs | | 9,638 | | — | | 29,729 | | 2,223 | | 3,515 | | 10,721 | | — | | 19,369 | | 2,767 | | 77,962 | |
| | | | | | | | | | | |
Costs incurred for the year ended 31 Decembera b | | | | | | |
| Acquisition of properties | | | | | | | | | | | |
| Proved | | — | | — | | 1 | | — | | — | | — | | — | | — | | — | | 1 | |
| Unproved | | — | | — | | 25 | | 2 | | (1) | | — | | — | | 16 | | — | | 42 | |
| | — | | — | | 26 | | 2 | | (1) | | — | | — | | 16 | | — | | 43 | |
Exploration and appraisal costsc | | 86 | | — | | 233 | | 127 | | 69 | | 168 | | 1 | | 265 | | 43 | | 992 | |
| Development | | 365 | | — | | 2,966 | | 9 | | 451 | | 1,507 | | — | | 2,222 | | 130 | | 7,650 | |
| Total costs | | 451 | | — | | 3,225 | | 138 | | 519 | | 1,675 | | 1 | | 2,503 | | 173 | | 8,685 | |
| | | | | | | | | | | |
Results of operations for the year ended 31 Decembera | | | | | | |
Sales and other operating revenuesd | | | | | | | | | | | |
| Third parties | | 36 | | — | | 687 | | 113 | | 813 | | 1,553 | | 2 | | 1,378 | | 610 | | 5,192 | |
| Sales between businesses | | 1,759 | | — | | 6,274 | | — | | 53 | | 1,641 | | — | | 4,805 | | 277 | | 14,809 | |
| | 1,795 | | — | | 6,961 | | 113 | | 866 | | 3,194 | | 2 | | 6,183 | | 887 | | 20,001 | |
| Exploration expenditure | | 93 | | — | | 2,724 | | 2,579 | | 2,185 | | 2,289 | | 1 | | 367 | | 42 | | 10,280 | |
| Production costs | | 636 | | — | | 2,058 | | 102 | | 421 | | 817 | | — | | 875 | | 114 | | 5,023 | |
| Production taxes | | (22) | | — | | 57 | | — | | 140 | | — | | — | | 508 | | 12 | | 695 | |
Other costs (income)e | | (130) | | 1 | | 1,633 | | 301 | | 117 | | 157 | | 44 | | 97 | | 113 | | 2,333 | |
Depreciation, depletion and amortization | | 1,370 | | — | | 3,655 | | 93 | | 678 | | 2,459 | | 2 | | 1,994 | | 335 | | 10,586 | |
Net impairments and (gains) losses on sale of businesses and fixed assets | | 2,712 | | 5 | | 1,716 | | 866 | | 2,693 | | 2,042 | | — | | 1,839 | | — | | 11,873 | |
| | 4,659 | | 6 | | 11,843 | | 3,941 | | 6,234 | | 7,764 | | 47 | | 5,680 | | 616 | | 40,790 | |
Profit (loss) before taxationf | | (2,864) | | (6) | | (4,882) | | (3,828) | | (5,368) | | (4,570) | | (45) | | 503 | | 271 | | (20,789) | |
| Allocable taxes | | (1,344) | | — | | (1,125) | | (682) | | (1,802) | | (308) | | 1 | | 1,923 | | 91 | | (3,246) | |
| Results of operations | | (1,520) | | (6) | | (3,757) | | (3,146) | | (3,566) | | (4,262) | | (46) | | (1,420) | | 180 | | (17,543) | |
| | | | | | | | | | | |
| | | | |
| | | | | | | | | | | |
| | | | | | | | | | | |
| | | | | | | | | | | |
| | | | | | | | | | | |
a These tables contain information relating to oil and natural gas exploration and production activities of subsidiaries, which includes bp's share of oil and natural gas exploration and production activities of joint operations. They do not include any costs relating to the Gulf of Mexico oil spill. Amounts relating to the management and ownership of crude oil and natural gas pipelines, LNG liquefaction and transportation operations are excluded. In addition, bp's midstream activities of marketing and trading of natural gas, power and NGLs in the US, Canada, UK, Asia and Europe are excluded. The most significant midstream pipeline interests include the South Caucasus Pipeline and the Baku-Tbilisi-Ceyhan pipeline, the Trans Adriatic Pipeline and the Trans Anatolian Pipeline. Major LNG activities are located in Trinidad, Indonesia and Australia.
b Costs of decommissioning are included in capitalized costs at 31 December but are excluded from costs incurred for the year.
c Includes exploration and appraisal drilling expenditures, which are capitalized within intangible assets, and geological and geophysical exploration costs, which are charged to income as incurred.
d Presented net of transportation costs, purchases and sales taxes.
e Includes property taxes and other government take. The UK region includes a $330-million gain which is offset by corresponding charges primarily in the US region, relating to the group self-insurance programme.
f Excludes the unwinding of the discount on provisions and payables amounting to $369 million which is included in finance costs in the group income statement.
| | | | | | | | | | | | | | |
| | bp Annual Report and Form 20-F 2021 | | 257 |
Oil and natural gas exploration and production activities – continued
| | | | | | | | | | | | | | | | | | | | | | | | | | | | | | | | | | | |
| | | $ million |
| | | | | | | | | | | 2020 |
| | Europe | North
America | South
America | Africa | Asia | Australasia | Total |
| | UK | Rest of
Europe | US | Rest of
North
America | | | Russiaa | Rest of
Asia | | |
| Equity-accounted entities (bp share) | | | | | | | | | |
Capitalized costs at 31 Decemberb c | | | | | | | | | |
| Gross capitalized costs | | | | | | | | | | | |
| Proved properties | | — | | 4,457 | | — | | — | | 10,690 | | — | | 24,963 | | — | | — | | 40,110 | |
| Unproved properties | | — | | 806 | | — | | — | | 108 | | — | | 4,627 | | — | | — | | 5,541 | |
| | — | | 5,263 | | — | | — | | 10,798 | | — | | 29,590 | | — | | — | | 45,651 | |
| Accumulated depreciation | | — | | 1,592 | | — | | — | | 5,490 | | — | | 7,693 | | — | | — | | 14,775 | |
| Net capitalized costs | | — | | 3,671 | | — | | — | | 5,308 | | — | | 21,897 | | — | | — | | 30,876 | |
| | | | | | | | | | | |
Costs incurred for the year ended 31 Decemberb d e | | | | | |
Acquisition of propertiesc | | | | | | | | | | | |
| Proved | | — | | — | | — | | — | | — | | — | | 82 | | — | | — | | 82 | |
| Unproved | | — | | — | | — | | — | | — | | — | | 3,714 | | — | | — | | 3,714 | |
| | — | | — | | — | | — | | — | | — | | 3,796 | | — | | — | | 3,796 | |
Exploration and appraisal costsd | | — | | 46 | | — | | — | | 15 | | — | | 315 | | — | | — | | 376 | |
| Development | | — | | 404 | | — | | — | | 393 | | — | | 2,594 | | — | | — | | 3,391 | |
| Total costs | | — | | 450 | | — | | — | | 408 | | — | | 6,705 | | — | | — | | 7,563 | |
| | | | | | | | | | | |
Results of operations for the year ended 31 Decemberb | | | | | |
Sales and other operating revenuesf | | | | | | | | | | | |
| Third parties | | — | | 860 | | — | | — | | 1,110 | | — | | — | | — | | — | | 1,970 | |
| Sales between businesses | | — | | — | | — | | — | | — | | — | | 9,344 | | — | | — | | 9,344 | |
| | — | | 860 | | — | | — | | 1,110 | | — | | 9,344 | | — | | — | | 11,314 | |
| Exploration expenditure | | — | | 50 | | — | | — | | — | | — | | 109 | | — | | — | | 159 | |
| Production costs | | — | | 188 | | — | | — | | 486 | | — | | 1,387 | | — | | — | | 2,061 | |
| Production taxes | | — | | — | | — | | — | | 216 | | — | | 4,418 | | — | | — | | 4,634 | |
| Other costs (income) | | — | | 3 | | — | | — | | 5 | | — | | 236 | | — | | — | | 244 | |
Depreciation, depletion and amortization | | — | | 412 | | — | | — | | 411 | | — | | 1,532 | | — | | — | | 2,355 | |
Net impairments and losses on sale of businesses and fixed assets | | — | | 119 | | — | | — | | 108 | | — | | 294 | | — | | — | | 521 | |
| | — | | 772 | | — | | — | | 1,226 | | — | | 7,976 | | — | | — | | 9,974 | |
| Profit (loss) before taxation | | — | | 88 | | — | | — | | (116) | | — | | 1,368 | | — | | — | | 1,340 | |
| Allocable taxes | | — | | 15 | | — | | — | | (41) | | — | | 226 | | — | | — | | 200 | |
| Results of operations | | — | | 73 | | — | | — | | (75) | | — | | 1,142 | | — | | — | | 1,140 | |
| | | | | | | | | | | |
|
| | | | | | | | | | | |
| | | | | | | | | | | |
| | | | | | | | | | | |
a Amounts reported for Russia in this table include bp’s share of Rosneft’s worldwide activities, including insignificant amounts outside Russia.
b These tables contain information relating to oil and natural gas exploration and production activities of equity-accounted entities. Amounts relating to the management and ownership of crude oil and natural gas pipelines, LNG liquefaction, transportation operations as well as downstream and other activities are excluded.
c Costs of decommissioning are included in capitalized costs at 31 December but are excluded from costs incurred for the year.
d Includes exploration and appraisal drilling expenditures, which are capitalized within intangible assets, and geological and geophysical exploration costs, which are charged to income as incurred.
e The amounts shown reflect bp’s share of equity-accounted entities’ costs incurred, and not the costs incurred by bp in acquiring an interest in equity-accounted entities.
f Presented net of sales tax.
| | | | | | | | | | | | | | |
258 | | bp Annual Report and Form 20-F 2021 | | |
Oil and natural gas exploration and production activities – continued
| | | | | | | | | | | | | | | | | | | | | | | | | | | | | | | | | | | |
| | | $ million |
| | | | | | | | | | | 2019 |
| | Europe | North
America | South
America | Africa | Asia | Australasia | Total |
| | UK | Rest of
Europe | US | Rest of
North
America | | | Russia | Rest of
Asia | | |
| Subsidiaries | | | | | | | | | | | |
Capitalized costs at 31 Decembera b | | | | | | | | | |
| Gross capitalized costs | | | | | | | | | | | |
| Proved properties | | 31,655 | | — | | 67,319 | | 3,421 | | 15,194 | | 48,150 | | — | | 42,629 | | 6,300 | | 214,668 | |
| Unproved properties | | 425 | | — | | 3,106 | | 2,547 | | 3,262 | | 3,495 | | — | | 1,865 | | 606 | | 15,306 | |
| | 32,080 | | — | | 70,425 | | 5,968 | | 18,456 | | 51,645 | | — | | 44,494 | | 6,906 | | 229,974 | |
| Accumulated depreciation | | 18,481 | | — | | 35,379 | | 409 | | 9,922 | | 35,572 | | — | | 22,481 | | 3,924 | | 126,168 | |
| Net capitalized costs | | 13,599 | | — | | 35,046 | | 5,559 | | 8,534 | | 16,073 | | — | | 22,013 | | 2,982 | | 103,806 | |
| | | | | | | | | | | |
Costs incurred for the year ended 31 Decembera b | | | | | | | |
| Acquisition of properties | | | | | | | | | | | |
| Proved | | 2 | | — | | 5 | | — | | — | | — | | — | | 188 | | — | | 195 | |
| Unproved | | 13 | | — | | 50 | | 1 | | 220 | | 18 | | — | | — | | — | | 302 | |
| | 15 | | — | | 55 | | 1 | | 220 | | 18 | | — | | 188 | | — | | 497 | |
Exploration and appraisal costsc | | 128 | | — | | 271 | | 15 | | 220 | | 417 | | 2 | | 171 | | 61 | | 1,285 | |
| Development | | 717 | | — | | 4,047 | | 33 | | 737 | | 2,530 | | — | | 2,614 | | 137 | | 10,815 | |
| Total costs | | 860 | | — | | 4,373 | | 49 | | 1,177 | | 2,965 | | 2 | | 2,973 | | 198 | | 12,597 | |
| | | | | | | | | | | |
Results of operations for the year ended 31 Decembera | | | | | |
Sales and other operating revenuesd | | | | | | | | | | | |
| Third parties | | 229 | | — | | 1,780 | | 274 | | 1,620 | | 2,736 | | 2 | | 1,588 | | 1,142 | | 9,371 | |
| Sales between businesses | | 2,345 | | — | | 10,785 | | 1 | | 142 | | 2,815 | | — | | 7,596 | | 554 | | 24,238 | |
| | 2,574 | | — | | 12,565 | | 275 | | 1,762 | | 5,551 | | 2 | | 9,184 | | 1,696 | | 33,609 | |
| Exploration expenditure | | 157 | | — | | 233 | | 13 | | 124 | | 222 | | 2 | | 187 | | 26 | | 964 | |
| Production costs | | 607 | | — | | 2,742 | | 118 | | 437 | | 1,045 | | — | | 961 | | 131 | | 6,041 | |
| Production taxes | | (75) | | — | | 315 | | — | | 293 | | — | | — | | 951 | | 63 | | 1,547 | |
Other costs (income)e | | (308) | | — | | 2,527 | | 67 | | 92 | | 33 | | 42 | | (124) | | 153 | | 2,482 | |
Depreciation, depletion and amortization | | 1,383 | | — | | 4,456 | | 118 | | 1,056 | | 3,806 | | 2 | | 2,384 | | 297 | | 13,502 | |
Net impairments and (gains) losses on sale of businesses and fixed assets | | 483 | | (10) | | 5,726 | | (1) | | 160 | | 151 | | — | | 1 | | — | | 6,510 | |
| | 2,247 | | (10) | | 15,999 | | 315 | | 2,162 | | 5,257 | | 46 | | 4,360 | | 670 | | 31,046 | |
Profit (loss) before taxationf | | 327 | | 10 | | (3,434) | | (40) | | (400) | | 294 | | (44) | | 4,824 | | 1,026 | | 2,563 | |
| Allocable taxes | | (141) | | — | | (776) | | (76) | | (234) | | 593 | | (8) | | 3,078 | | 392 | | 2,828 | |
| Results of operations | | 468 | | 10 | | (2,658) | | 36 | | (166) | | (299) | | (36) | | 1,746 | | 634 | | (265) | |
| | | | | | | | | | | |
|
| | | | | | | | | | | |
| | | | | | | | | | | |
| | | | | | | | | | | |
| | | | | | | | | | | |
a These tables contain information relating to oil and natural gas exploration and production activities of subsidiaries, which includes bp's share of oil and natural gas exploration and production activities of joint operations. They do not include any costs relating to the Gulf of Mexico oil spill. Amounts relating to the management and ownership of crude oil and natural gas pipelines, LNG liquefaction and transportation operations are excluded. In addition, bp's midstream activities of marketing and trading of natural gas, power and NGLs in the US, Canada, UK, Asia and Europe are excluded. The most significant midstream pipeline interests include the Trans-Alaska Pipeline System, the South Caucasus Pipeline and the Baku-Tbilisi-Ceyhan pipeline. Major LNG activities are located in Trinidad, Indonesia and Australia.
b Costs of decommissioning are included in capitalized costs at 31 December but are excluded from costs incurred for the year.
c Includes exploration and appraisal drilling expenditures, which are capitalized within intangible assets, and geological and geophysical exploration costs, which are charged to income as incurred.
d Presented net of transportation costs, purchases and sales taxes.
e Includes property taxes and other government take. The UK region includes a $361-million gain which is offset by corresponding charges primarily in the US region, relating to the group self-insurance programme.
f Excludes the unwinding of the discount on provisions and payables amounting to $439 million which is included in finance costs in the group income statement.
| | | | | | | | | | | | | | |
| | bp Annual Report and Form 20-F 2021 | | 259 |
Oil and natural gas exploration and production activities – continued
| | | | | | | | | | | | | | | | | | | | | | | | | | | | | | | | | | | |
| | | $ million |
| | | | | | | | | | | 2019 |
| | Europe | North
America | South
America | Africa | Asia | Australasia | Total |
| | UK | Rest of
Europe | US | Rest of
North
America | | | Russiaa | Rest of
Asia | | |
| Equity-accounted entities (bp share) | | | | | | | | | |
Capitalized costs at 31 Decemberb c | | | | | | | | | |
| Gross capitalized costs | | | | | | | | | | | |
| Proved properties | | — | | 4,078 | | — | | — | | 10,376 | | — | | 28,179 | | — | | — | | 42,633 | |
| Unproved properties | | — | | 768 | | — | | — | | 93 | | — | | 1,097 | | — | | — | | 1,958 | |
| | — | | 4,846 | | — | | — | | 10,469 | | — | | 29,276 | | — | | — | | 44,591 | |
| Accumulated depreciation | | — | | 1,046 | | — | | — | | 5,078 | | — | | 8,477 | | — | | — | | 14,601 | |
| Net capitalized costs | | — | | 3,800 | | — | | — | | 5,391 | | — | | 20,799 | | — | | — | | 29,990 | |
| | | | | | | | | | | |
Costs incurred for the year ended 31 Decemberb d e | | | | | | |
Acquisition of propertiesc | | | | | | | | | | | |
| Proved | | — | | — | | — | | — | | — | | — | | — | | — | | — | | — | |
| Unproved | | — | | — | | — | | — | | — | | — | | 58 | | — | | — | | 58 | |
| | — | | — | | — | | — | | — | | — | | 58 | | — | | — | | 58 | |
Exploration and appraisal costsd | | — | | 120 | | — | | — | | 19 | | — | | 177 | | — | | — | | 316 | |
| Development | | — | | 640 | | — | | — | | 675 | | — | | 2,908 | | — | | — | | 4,223 | |
| Total costs | | — | | 760 | | — | | — | | 694 | | — | | 3,143 | | — | | — | | 4,597 | |
| | | | | | | | | | | |
Results of operations for the year ended 31 Decemberb | | | | | | |
Sales and other operating revenuesf | | | | | | | | | | | |
| Third parties | | — | | 1,002 | | — | | — | | 1,621 | | — | | — | | — | | — | | 2,623 | |
| Sales between businesses | | — | | — | | — | | — | | — | | — | | 15,012 | | — | | — | | 15,012 | |
| | | — | | 1,002 | | — | | — | | 1,621 | | — | | 15,012 | | — | | — | | 17,635 | |
| Exploration expenditure | | — | | 92 | | — | | — | | 43 | | — | | 73 | | — | | — | | 208 | |
| Production costs | | — | | 216 | | — | | — | | 465 | | — | | 1,386 | | — | | — | | 2,067 | |
| Production taxes | | — | | — | | — | | — | | 343 | | — | | 7,413 | | — | | — | | 7,756 | |
| Other costs (income) | | — | | 59 | | — | | — | | 16 | | — | | 346 | | — | | — | | 421 | |
Depreciation, depletion and amortization | | — | | 323 | | — | | — | | 414 | | — | | 1,657 | | — | | — | | 2,394 | |
Net impairments and losses on sale of businesses and fixed assets | | — | | — | | — | | — | | (42) | | — | | 46 | | — | | — | | 4 | |
| | | — | | 690 | | — | | — | | 1,239 | | — | | 10,921 | | — | | — | | 12,850 | |
| Profit (loss) before taxation | | — | | 312 | | — | | — | | 382 | | — | | 4,091 | | — | | — | | 4,785 | |
| Allocable taxes | | — | | 229 | | — | | — | | 245 | | — | | 811 | | — | | — | | 1,285 | |
| Results of operations | | — | | 83 | | — | | — | | 137 | | — | | 3,280 | | — | | — | | 3,500 | |
| | | | | | | | | | | |
|
| | | | | | | | | | | |
| | | | | | | | | | | |
| | | | | | | | | | | |
a Amounts reported for Russia in this table include bp’s share of Rosneft’s worldwide activities, including insignificant amounts outside Russia. The amounts reported have been amended to exclude the corresponding amounts for their equity-accounted entities.
b These tables contain information relating to oil and natural gas exploration and production activities of equity-accounted entities. Amounts relating to the management and ownership of crude oil and natural gas pipelines, LNG liquefaction, transportation operations as well as downstream and other activities are excluded.
c Costs of decommissioning are included in capitalized costs at 31 December but are excluded from costs incurred for the year.
d Includes exploration and appraisal drilling expenditures, which are capitalized within intangible assets, and geological and geophysical exploration costs, which are charged to income as incurred.
e The amounts shown reflect bp’s share of equity-accounted entities’ costs incurred, and not the costs incurred by bp in acquiring an interest in equity-accounted entities.
f Presented net of sales taxes.
| | | | | | | | | | | | | | |
260 | | bp Annual Report and Form 20-F 2021 | | |
Movements in estimated net proved reserves
| | | | | | | | | | | | | | | | | | | | | | | | | | | | | | | | | | | |
| | | | | | | | | | million barrels |
Crude oila b | | | | | | | | | | 2021 |
| | Europe | North
America | South
America | Africa | Asia | Australasia | Total |
| | UK | Rest of
Europe | USc | Rest of
North
America | | | Russia | Rest of
Asia | | |
| Subsidiaries | | | | | | | | | | | |
| At 1 January | | | | | | | | | | | |
| Developed | | 162 | | — | | 697 | | 37 | | 8 | | 116 | | — | | 1,100 | | 34 | | 2,154 | |
| Undeveloped | | 148 | | — | | 742 | | 195 | | 9 | | 21 | | — | | 547 | | 5 | | 1,666 | |
| | 309 | | — | | 1,438 | | 232 | | 16 | | 137 | | — | | 1,647 | | 38 | | 3,819 | |
| Changes attributable to | | | | | | | | | | | |
| Revisions of previous estimates | | — | | — | | (46) | | (32) | | (3) | | 32 | | — | | (121) | | (1) | | (171) | |
| Improved recovery | | — | | — | | 29 | | — | | — | | 2 | | — | | — | | — | | 32 | |
| Purchases of reserves-in-place | | — | | — | | — | | — | | — | | — | | — | | — | | — | | — | |
| Discoveries and extensions | | — | | — | | 2 | | — | | — | | — | | — | | 5 | | — | | 7 | |
| Production | | (30) | | — | | (113) | | (9) | | (2) | | (41) | | — | | (116) | | (5) | | (315) | |
| Sales of reserves-in-place | | (1) | | — | | (5) | | | | | — | | (36) | | — | | (41) | |
| | (30) | | — | | (132) | | (41) | | (5) | | (7) | | — | | (268) | | (6) | | (489) | |
At 31 Decemberc | | | | | | | | | | | |
| Developed | | 178 | | — | | 705 | | 24 | | 5 | | 117 | | — | | 930 | | 28 | | 1,987 | |
| Undeveloped | | 101 | | — | | 601 | | 167 | | 7 | | 14 | | — | | 449 | | 4 | | 1,343 | |
| | 279 | | — | | 1,306 | | 191 | | 12 | | 131 | | — | | 1,379 | | 33 | | 3,330 | |
Equity-accounted entities (bp share)d | | | | | | | | |
| At 1 January | | | | | | | | | | | |
| Developed | | — | | 112 | | — | | 5 | | 275 | | 2 | | 3,123 | | — | | — | | 3,517 | |
| Undeveloped | | — | | 24 | | — | | 21 | | 237 | | — | | 2,493 | | — | | — | | 2,776 | |
| | — | | 136 | | — | | 26 | | 512 | | 3 | | 5,615 | | 1 | | — | | 6,293 | |
| Changes attributable to | | | | | | | | | | | |
| Revisions of previous estimates | | — | | 9 | | — | | (5) | | (4) | | 1 | | 166 | | 1 | | — | | 168 | |
| Improved recovery | | — | | 1 | | — | | — | | — | | — | | — | | — | | — | | 1 | |
| Purchases of reserves-in-place | | — | | — | | — | | — | | 13 | | — | | — | | — | | — | | 13 | |
| Discoveries and extensions | | — | | 1 | | — | | 2 | | 25 | | — | | 238 | | — | | — | | 266 | |
| Production | | — | | (18) | | — | | (1) | | (19) | | — | | (323) | | — | | — | | (361) | |
| Sales of reserves-in-place | | — | | (9) | | — | | — | | — | | — | | (111) | | — | | — | | (119) | |
| | — | | (15) | | — | | (4) | | 15 | | — | | (30) | | 1 | | — | | (33) | |
At 31 Decembere f | | | | | | | | | | | |
| Developed | | — | | 100 | | — | | 10 | | 275 | | 3 | | 3,045 | | 1 | | — | | 3,434 | |
| Undeveloped | | — | | 21 | | — | | 12 | | 253 | | — | | 2,540 | | 1 | | — | | 2,826 | |
| | — | | 121 | | — | | 22 | | 527 | | 3 | | 5,585 | | 1 | | — | | 6,260 | |
| Total subsidiaries and equity-accounted entities (bp share) | | | | | | | |
| At 1 January | | | | | | | | | | | |
| Developed | | 162 | | 112 | | 697 | | 42 | | 283 | | 119 | | 3,123 | | 1,100 | | 34 | | 5,671 | |
| Undeveloped | | 148 | | 24 | | 742 | | 215 | | 246 | | 22 | | 2,493 | | 548 | | 5 | | 4,441 | |
| | 309 | | 136 | | 1,438 | | 258 | | 529 | | 140 | | 5,615 | | 1,648 | | 38 | | 10,112 | |
| At 31 December | | | | | | | | | | | |
| Developed | | 178 | | 100 | | 705 | | 34 | | 280 | | 119 | | 3,045 | | 931 | | 28 | | 5,421 | |
| Undeveloped | | 101 | | 21 | | 601 | | 179 | | 259 | | 14 | | 2,540 | | 450 | | 4 | | 4,169 | |
| | 279 | | 121 | | 1,306 | | 213 | | 539 | | 134 | | 5,585 | | 1,381 | | 33 | | 9,590 | |
a Crude oil includes condensate and bitumen. Proved reserves exclude royalties due to others, whether payable in cash or in kind, where the royalty owner has a direct interest in the underlying production and the option and ability to make lifting and sales arrangements independently.
b Because of rounding, some totals may not exactly agree with the sum of their component parts.
c Includes 4 million barrels of crude oil in respect of the 30% non-controlling interest in BP Trinidad and Tobago LLC.
d Volumes of equity-accounted entities include volumes of equity-accounted investments of those entities.
e Includes 393 million barrels of crude oil in respect of the 7.16% non-controlling interest in Rosneft, including 22 mmbbl held through bp's interests in Russia other than Rosneft.
f Total proved crude oil reserves held as part of our equity interest in Rosneft is 5,490 million barrels, comprising 1 million barrels in Iraq and less than 1 million barrels each in Egypt, Vietnam, and Canada, and 5,487 million barrels in Russia.
| | | | | | | | | | | | | | |
| | bp Annual Report and Form 20-F 2021 | | 261 |
Movements in estimated net proved reserves – continued
| | | | | | | | | | | | | | | | | | | | | | | | | | | | | | | | | | | |
| | | | | | | | | | million barrels |
Natural gas liquidsa b | | | | | | | | | | 2021 |
| | Europe | North
America | South
America | Africa | Asia | Australasia | Total |
| | UK | Rest of
Europe | USc | Rest of
North
America | | | Russia | Rest of
Asia | | |
| Subsidiaries | | | | | | | | | | | |
| At 1 January | | | | | | | | | | | |
| Developed | | 7 | | — | | 115 | | — | | 2 | | 13 | | — | | — | | 2 | | 139 | |
| Undeveloped | | — | | — | | 218 | | — | | 19 | | 1 | | — | | — | | — | | 237 | |
| | 7 | | — | | 333 | | — | | 21 | | 14 | | — | | — | | 2 | | 376 | |
| Changes attributable to | | | | | | | | | | | |
| Revisions of previous estimates | | 5 | | — | | (1) | | — | | 1 | | (1) | | — | | — | | — | | 4 | |
| Improved recovery | | — | | — | | 25 | | — | | — | | — | | — | | — | | — | | 25 | |
| Purchases of reserves-in-place | | — | | — | | — | | — | | — | | — | | — | | — | | — | | — | |
| Discoveries and extensions | | — | | — | | — | | — | | — | | — | | — | | — | | — | | — | |
Productionc | | (2) | | — | | (25) | | — | | (1) | | (3) | | — | | — | | (1) | | (32) | |
| Sales of reserves-in-place | | (1) | | — | | (4) | | — | | — | | — | | — | | — | | — | | (5) | |
| | 2 | | — | | (5) | | — | | — | | (4) | | — | | — | | — | | (8) | |
At 31 Decemberd | | | | | | | | | | | |
| Developed | | 8 | | — | | 132 | | — | | 2 | | 9 | | — | | — | | 2 | | 153 | |
| Undeveloped | | — | | — | | 195 | | — | | 19 | | 1 | | — | | — | | — | | 215 | |
| | 9 | | — | | 328 | | — | | 21 | | 10 | | — | | — | | 2 | | 368 | |
Equity-accounted entities (bp share)e | | | | | | | | |
| At 1 January | | | | | | | | | | | |
| Developed | | — | | 6 | | — | | — | | 2 | | 12 | | 108 | | — | | — | | 129 | |
| Undeveloped | | — | | 1 | | — | | — | | — | | — | | 43 | | — | | — | | 44 | |
| | — | | 7 | | — | | — | | 2 | | 12 | | 151 | | — | | — | | 172 | |
| Changes attributable to | | | | | | | | | | | |
| Revisions of previous estimates | | — | | — | | — | | — | | — | | 6 | | (9) | | — | | — | | (2) | |
| Improved recovery | | — | | — | | — | | — | | — | | — | | — | | — | | — | | — | |
| Purchases of reserves-in-place | | — | | — | | — | | — | | — | | — | | — | | — | | — | | — | |
| Discoveries and extensions | | — | | — | | — | | — | | — | | — | | — | | — | | — | | — | |
| Production | | — | | (1) | | — | | — | | — | | (1) | | (1) | | — | | — | | (4) | |
| Sales of reserves-in-place | | — | | — | | — | | — | | — | | — | | — | | — | | — | | — | |
| | — | | (1) | | — | | — | | — | | 5 | | (10) | | — | | — | | (7) | |
At 31 Decemberf g | | | | | | | | | | | |
| Developed | | — | | 6 | | — | | — | | 2 | | 17 | | 100 | | — | | — | | 125 | |
| Undeveloped | | — | | — | | — | | — | | — | | — | | 41 | | — | | — | | 41 | |
| | — | | 6 | | — | | — | | 2 | | 17 | | 140 | | — | | — | | 166 | |
| Total subsidiaries and equity-accounted entities (bp share) | | | | | | | |
| At 1 January | | | | | | | | | | | |
| Developed | | 7 | | 6 | | 115 | | — | | 4 | | 25 | | 108 | | — | | 2 | | 268 | |
| Undeveloped | | — | | 1 | | 218 | | — | | 19 | | 1 | | 43 | | — | | — | | 281 | |
| | 7 | | 7 | | 333 | | — | | 23 | | 26 | | 151 | | — | | 2 | | 549 | |
| At 31 December | | | | | | | | | | | |
| Developed | | 8 | | 6 | | 132 | | — | | 4 | | 26 | | 100 | | — | | 2 | | 278 | |
| Undeveloped | | — | | — | | 195 | | — | | 19 | | 1 | | 41 | | — | | — | | 256 | |
| | 9 | | 6 | | 328 | | — | | 22 | | 27 | | 140 | | — | | 2 | | 534 | |
a Proved reserves exclude royalties due to others, whether payable in cash or in kind, where the royalty owner has a direct interest in the underlying production and the option and ability to make lifting and sales arrangements independently.
b Because of rounding, some totals may not exactly agree with the sum of their component parts.
c Excludes NGLs from processing plants in which an interest is held of 3 thousand barrels per day for equity-accounted entities.
d Includes 6 million barrels of NGL in respect of the 30% non-controlling interest in BP Trinidad and Tobago LLC.
e Volumes of equity-accounted entities include volumes of equity-accounted investments of those entities.
f Includes 3 million barrels of NGLs in respect of the 2.3% non-controlling interest in Rosneft.
g Total proved NGL reserves held as part of our equity interest in Rosneft is 140 million barrels, comprising less than 1 million barrels in Canada and 140 million barrels in Russia.
| | | | | | | | | | | | | | |
262 | | bp Annual Report and Form 20-F 2021 | | |
Movements in estimated net proved reserves – continued
| | | | | | | | | | | | | | | | | | | | | | | | | | | | | | | | | | | |
| | | | | | | | | | million barrels |
Total liquidsa b | | | | | | | | | | | 2021 |
| | Europe | North
America | South
America | Africa | Asia | Australasia | Total |
| | UK | Rest of
Europe | USc | Rest of
North
America | | | Russia | Rest of
Asia | | |
| Subsidiaries | | | | | | | | | | | |
| At 1 January | | | | | | | | | | | |
| Developed | | 168 | | — | | 812 | | 37 | | 10 | | 129 | | — | | 1,100 | | 36 | | 2,293 | |
| Undeveloped | | 148 | | — | | 959 | | 195 | | 27 | | 22 | | — | | 547 | | 5 | | 1,903 | |
| | 316 | | — | | 1,771 | | 232 | | 37 | | 151 | | — | | 1,647 | | 41 | | 4,196 | |
| Changes attributable to | | | | | | | | | | | |
| Revisions of previous estimates | | 5 | | — | | (47) | | (32) | | (2) | | 31 | | — | | (121) | | (1) | | (167) | |
| Improved recovery | | — | | — | | 54 | | — | | — | | 2 | | — | | — | | — | | 57 | |
| Purchases of reserves-in-place | | — | | — | | — | | — | | — | | — | | — | | — | | — | | — | |
| Discoveries and extensions | | — | | — | | 2 | | — | | — | | — | | — | | 5 | | — | | 7 | |
Productionc | | (32) | | — | | (138) | | (9) | | (3) | | (44) | | — | | (116) | | (5) | | (348) | |
| Sales of reserves-in-place | | (1) | | — | | (9) | | — | | — | | — | | — | | (36) | | — | | (46) | |
| | (29) | | — | | (137) | | (41) | | (5) | | (11) | | — | | (268) | | (6) | | (497) | |
At 31 Decemberd | | | | | | | | | | | |
| Developed | | 187 | | — | | 837 | | 24 | | 7 | | 125 | | — | | 930 | | 30 | | 2,141 | |
| Undeveloped | | 101 | | — | | 796 | | 167 | | 25 | | 15 | | — | | 449 | | 4 | | 1,558 | |
| | 288 | | — | | 1,634 | | 191 | | 32 | | 140 | | — | | 1,379 | | 34 | | 3,699 | |
Equity-accounted entities (bp share)e | | | | | | | | |
| At 1 January | | | | | | | | | | | |
| Developed | | — | | 118 | | — | | 5 | | 277 | | 15 | | 3,231 | | — | | — | | 3,645 | |
| Undeveloped | | — | | 25 | | — | | 21 | | 237 | | — | | 2,535 | | — | | — | | 2,819 | |
| | — | | 143 | | — | | 26 | | 514 | | 15 | | 5,766 | | 1 | | — | | 6,465 | |
| Changes attributable to | | | | | | | | | | | |
| Revisions of previous estimates | | — | | 10 | | — | | (5) | | (4) | | 7 | | 157 | | 1 | | — | | 166 | |
| Improved recovery | | — | | 1 | | — | | — | | — | | — | | — | | — | | — | | 1 | |
| Purchases of reserves-in-place | | — | | — | | — | | — | | 13 | | — | | — | | — | | — | | 13 | |
| Discoveries and extensions | | — | | 1 | | — | | 2 | | 25 | | — | | 238 | | — | | — | | 266 | |
| Production | | — | | (19) | | — | | (1) | | (19) | | (1) | | (325) | | — | | — | | (365) | |
| Sales of reserves-in-place | | — | | (9) | | — | | — | | — | | — | | (111) | | — | | — | | (120) | |
| | — | | (16) | | — | | (4) | | 15 | | 5 | | (40) | | 1 | | — | | (39) | |
At 31 Decemberf g | | | | | | | | | | | |
| Developed | | — | | 106 | | — | | 10 | | 276 | | 20 | | 3,145 | | 1 | | — | | 3,558 | |
| Undeveloped | | — | | 21 | | — | | 12 | | 253 | | — | | 2,581 | | 1 | | — | | 2,867 | |
| | — | | 127 | | — | | 22 | | 529 | | 20 | | 5,726 | | 1 | | — | | 6,425 | |
| Total subsidiaries and equity-accounted entities (bp share) | | | | | | | |
| At 1 January | | | | | | | | | | | |
| Developed | | 168 | | 118 | | 812 | | 42 | | 287 | | 144 | | 3,231 | | 1,100 | | 36 | | 5,938 | |
| Undeveloped | | 148 | | 25 | | 959 | | 215 | | 265 | | 23 | | 2,535 | | 548 | | 5 | | 4,722 | |
| | 316 | | 143 | | 1,771 | | 258 | | 552 | | 166 | | 5,766 | | 1,648 | | 41 | | 10,661 | |
| At 31 December | | | | | | | | | | | |
| Developed | | 187 | | 106 | | 837 | | 34 | | 284 | | 146 | | 3,145 | | 931 | | 30 | | 5,699 | |
| Undeveloped | | 101 | | 21 | | 796 | | 179 | | 278 | | 15 | | 2,581 | | 450 | | 4 | | 4,425 | |
| | 288 | | 127 | | 1,634 | | 213 | | 561 | | 161 | | 5,726 | | 1,381 | | 34 | | 10,124 | |
a Proved reserves exclude royalties due to others, whether payable in cash or in kind, where the royalty owner has a direct interest in the underlying production and the option and ability to make lifting and sales arrangements independently.
b Because of rounding, some totals may not exactly agree with the sum of their component parts.
c Excludes NGLs from processing plants in which an interest is held of 3 thousand barrels per day for equity-accounted entities.
d Also includes 10 million barrels in respect of the 30% non-controlling interest in BP Trinidad and Tobago LLC.
e Volumes of equity-accounted entities include volumes of equity-accounted investments of those entities.
f Includes 396 million barrels of liquids in respect of the non-controlling interest in Rosneft, including 22 mmboe held through bp’s interests in Russia other than Rosneft.
g Total proved liquid reserves held as part of our equity interest in Rosneft is 5,630 million barrels, comprising 1 million barrels in Iraq, less than 1 million barrels each in Canada, Egypt and Vietnam and 5,628 million barrels in Russia.
| | | | | | | | | | | | | | |
| | bp Annual Report and Form 20-F 2021 | | 263 |
Movements in estimated net proved reserves – continued
| | | | | | | | | | | | | | | | | | | | | | | | | | | | | | | | | | | |
| | | | | | | | | | billion cubic feet |
Natural gasa b | | | | | | | | | | 2021 |
| | Europe | North
America | South
America | Africa | Asia | Australasia | Total |
| | UK | Rest of
Europe | US | Rest of
North
America | | | Russia | Rest of
Asia | | |
| Subsidiaries | | | | | | | | | | | |
| At 1 January | | | | | | | | | | | |
| Developed | | 306 | | — | | 1,921 | | — | | 1,567 | | 1,382 | | — | | 3,883 | | 2,058 | | 11,118 | |
| Undeveloped | | 51 | | — | | 3,423 | | — | | 1,964 | | 158 | | — | | 3,641 | | 1,029 | | 10,267 | |
| | 358 | | — | | 5,344 | | — | | 3,531 | | 1,541 | | — | | 7,524 | | 3,087 | | 21,385 | |
| Changes attributable to | | | | | | | | | | | |
| Revisions of previous estimates | | 254 | | — | | 717 | | 1 | | (767) | | 537 | | — | | (66) | | (285) | | 390 | |
| Improved recovery | | — | | — | | 247 | | — | | — | | — | | — | | — | | — | | 247 | |
| Purchases of reserves-in-place | | — | | — | | — | | — | | — | | — | | — | | — | | — | | — | |
| Discoveries and extensions | | — | | — | | 1 | | — | | — | | 25 | | — | | 116 | | — | | 142 | |
Productionc | | (103) | | — | | (445) | | (1) | | (465) | | (516) | | — | | (489) | | (279) | | (2,297) | |
| Sales of reserves-in-place | | (7) | | — | | (60) | | — | | — | | — | | — | | (1,298) | | — | | (1,365) | |
| | 143 | | — | | 461 | | — | | (1,232) | | 46 | | — | | (1,736) | | (564) | | (2,883) | |
At 31 Decemberd | | | | | | | | | | | |
| Developed | | 455 | | — | | 2,401 | | — | | 1,152 | | 1,433 | | — | | 3,266 | | 1,584 | | 10,291 | |
| Undeveloped | | 45 | | — | | 3,404 | | — | | 1,147 | | 154 | | — | | 2,522 | | 939 | | 8,211 | |
| | 501 | | — | | 5,805 | | — | | 2,299 | | 1,587 | | — | | 5,788 | | 2,523 | | 18,502 | |
Equity-accounted entities (bp share)e | | | | | | | | | | | |
| At 1 January | | | | | | | | | | | |
| Developed | | — | | 141 | | — | | 2 | | 965 | | 600 | | 11,373 | | 7 | | — | | 13,088 | |
| Undeveloped | | — | | 21 | | — | | 6 | | 513 | | 142 | | 7,312 | | — | | — | | 7,994 | |
| | — | | 162 | | — | | 8 | | 1,478 | | 741 | | 18,685 | | 7 | | — | | 21,082 | |
| Changes attributable to | | | | | | | | | | | |
| Revisions of previous estimates | | — | | 8 | | — | | (2) | | (115) | | 152 | | 422 | | — | | — | | 467 | |
| Improved recovery | | — | | 4 | | — | | — | | — | | — | | — | | — | | — | | 4 | |
| Purchases of reserves-in-place | | — | | — | | — | | — | | 3 | | — | | — | | — | | — | | 3 | |
| Discoveries and extensions | | — | | 1 | | — | | 1 | | 222 | | — | | 151 | | — | | — | | 375 | |
Productionc | | — | | (25) | | — | | — | | (124) | | (72) | | (478) | | (3) | | — | | (702) | |
| Sales of reserves-in-place | | — | | (9) | | — | | — | | — | | — | | (102) | | (4) | | — | | (115) | |
| | — | | (22) | | — | | (1) | | (13) | | 80 | | (7) | | (7) | | — | | 31 | |
At 31 Decemberf g | | | | | | | | | | | |
| Developed | | — | | 130 | | — | | 4 | | 929 | | 689 | | 11,399 | | — | | — | | 13,149 | |
| Undeveloped | | — | | 11 | | — | | 4 | | 536 | | 133 | | 7,279 | | — | | — | | 7,964 | |
| | — | | 140 | | — | | 8 | | 1,465 | | 822 | | 18,678 | | — | | — | | 21,113 | |
| Total subsidiaries and equity-accounted entities (bp share) | | | | |
| At 1 January | | | | | | | | | | | |
| Developed | | 306 | | 141 | | 1,921 | | 2 | | 2,532 | | 1,982 | | 11,373 | | 3,890 | | 2,058 | | 24,206 | |
| Undeveloped | | 51 | | 21 | | 3,423 | | 6 | | 2,477 | | 300 | | 7,312 | | 3,641 | | 1,029 | | 18,260 | |
| | 358 | | 162 | | 5,344 | | 8 | | 5,009 | | 2,282 | | 18,685 | | 7,531 | | 3,087 | | 42,467 | |
| At 31 December | | | | | | | | | | | |
| Developed | | 455 | | 130 | | 2,401 | | 4 | | 2,081 | | 2,121 | | 11,399 | | 3,266 | | 1,584 | | 23,440 | |
| Undeveloped | | 45 | | 11 | | 3,404 | | 4 | | 1,683 | | 287 | | 7,279 | | 2,522 | | 939 | | 16,174 | |
| | 501 | | 140 | | 5,805 | | 8 | | 3,764 | | 2,408 | | 18,678 | | 5,788 | | 2,523 | | 39,615 | |
a Proved reserves exclude royalties due to others, whether payable in cash or in kind, where the royalty owner has a direct interest in the underlying production and the option and ability to make lifting and sales arrangements independently.
b Because of rounding, some totals may not exactly agree with the sum of their component parts.
c Includes 135 billion cubic feet of natural gas consumed in operations, 83 billion cubic feet in subsidiaries, 52 billion cubic feet in equity-accounted entities.
d Includes 690 billion cubic feet of natural gas in respect of the 30% non-controlling interest in BP Trinidad and Tobago LLC.
e Volumes of equity-accounted entities include volumes of equity-accounted investments of those entities.
f Includes 1,656 billion cubic feet of natural gas in respect of the 10.20% non-controlling interest in Rosneft including 621 billion cubic feet held through bp’s interests in Russia other than Rosneft.
g Total proved gas reserves held as part of our equity interest in Rosneft is 16,233 billion cubic feet, comprising less than 1billion cubic feet in Vietnam and Canada, 376 billion cubic feet in Egypt and 15,857 billion cubic feet in Russia.
| | | | | | | | | | | | | | |
264 | | bp Annual Report and Form 20-F 2021 | | |
Movements in estimated net proved reserves – continued
| | | | | | | | | | | | | | | | | | | | | | | | | | | | | | | | | | | |
| | | million barrels of oil equivalentc |
Total hydrocarbonsa b | | | | | | | | | | | 2021 |
| | Europe | North
America | South
America | Africa | Asia | Australasia | Total |
| | UK | Rest of
Europe | USf | Rest of
North
America | | | Russia | Rest of
Asia | | |
| Subsidiaries | | | | | | | | | | | |
| At 1 January | | | | | | | | | | | |
| Developed | | 221 | | — | | 1,143 | | 37 | | 280 | | 367 | | — | | 1,770 | | 391 | | 4,210 | |
| Undeveloped | | 157 | | — | | 1,549 | | 195 | | 366 | | 50 | | — | | 1,175 | | 182 | | 3,673 | |
| | 378 | | — | | 2,692 | | 232 | | 646 | | 417 | | — | | 2,945 | | 573 | | 7,883 | |
| Changes attributable to | | | | | | | | | | | |
| Revisions of previous estimates | | 49 | | — | | 77 | | (32) | | (134) | | 123 | | — | | (132) | | (50) | | (100) | |
| Improved recovery | | — | | — | | 97 | | — | | — | | 2 | | — | | — | | — | | 99 | |
| Purchases of reserves-in-place | | — | | — | | — | | — | | — | | — | | — | | — | | — | | — | |
| Discoveries and extensions | | — | | — | | 2 | | — | | — | | 4 | | — | | 25 | | — | | 31 | |
Productiond e | | (50) | | — | | (214) | | (9) | | (83) | | (133) | | — | | (200) | | (54) | | (744) | |
| Sales of reserves-in-place | | (3) | | — | | (19) | | — | | — | | — | | — | | (260) | | — | | (282) | |
| | (4) | | — | | (58) | | (41) | | (217) | | (3) | | — | | (567) | | (104) | | (994) | |
At 31 Decemberf | | | | | | | | | | | |
| Developed | | 265 | | — | | 1,251 | | 24 | | 206 | | 372 | | — | | 1,494 | | 303 | | 3,915 | |
| Undeveloped | | 109 | | — | | 1,383 | | 167 | | 223 | | 41 | | — | | 884 | | 166 | | 2,973 | |
| | 374 | | — | | 2,634 | | 191 | | 429 | | 414 | | — | | 2,377 | | 469 | | 6,889 | |
Equity-accounted entities (bp share)g | | | | | | | | | | | |
| At 1 January | | | | | | | | | | | |
| Developed | | — | | 142 | | — | | 5 | | 443 | | 118 | | 5,192 | | 1 | | — | | 5,902 | |
| Undeveloped | | — | | 29 | | — | | 22 | | 326 | | 25 | | 3,796 | | — | | — | | 4,198 | |
| | — | | 171 | | — | | 27 | | 769 | | 143 | | 8,988 | | 2 | | — | | 10,100 | |
| Changes attributable to | | | | | | | | | | | |
| Revisions of previous estimates | | — | | 11 | | — | | (5) | | (24) | | 33 | | 230 | | 1 | | — | | 246 | |
| Improved recovery | | — | | 1 | | — | | — | | — | | — | | — | | — | | — | | 1 | |
| Purchases of reserves-in-place | | — | | — | | — | | — | | 14 | | — | | — | | — | | — | | 14 | |
| Discoveries and extensions | | — | | 1 | | — | | 2 | | 63 | | — | | 264 | | — | | — | | 330 | |
Productione | | — | | (23) | | — | | (1) | | (41) | | (14) | | (407) | | — | | — | | (486) | |
| Sales of reserves-in-place | | — | | (11) | | — | | — | | — | | — | | (128) | | (1) | | — | | (139) | |
| | — | | (20) | | — | | (4) | | 12 | | 19 | | (42) | | — | | — | | (34) | |
At 31 Decemberh i | | | | | | | | | | | |
| Developed | | — | | 128 | | — | | 11 | | 437 | | 139 | | 5,110 | | 1 | | — | | 5,825 | |
| Undeveloped | | — | | 23 | | — | | 12 | | 345 | | 23 | | 3,836 | | 1 | | — | | 4,240 | |
| | — | | 151 | | — | | 23 | | 782 | | 162 | | 8,946 | | 1 | | — | | 10,065 | |
| Total subsidiaries and equity-accounted entities (bp share) | | | | | | | |
| At 1 January | | | | | | | | | | | |
| Developed | | 221 | | 142 | | 1,143 | | 43 | | 724 | | 485 | | 5,192 | | 1,771 | | 391 | | 10,112 | |
| Undeveloped | | 157 | | 29 | | 1,549 | | 217 | | 692 | | 74 | | 3,796 | | 1,175 | | 182 | | 7,871 | |
| | 378 | | 171 | | 2,692 | | 259 | | 1,415 | | 560 | | 8,988 | | 2,946 | | 573 | | 17,982 | |
| At 31 December | | | | | | | | | | | |
| Developed | | 265 | | 128 | | 1,251 | | 35 | | 642 | | 511 | | 5,110 | | 1,494 | | 303 | | 9,740 | |
| Undeveloped | | 109 | | 23 | | 1,383 | | 179 | | 568 | | 65 | | 3,836 | | 884 | | 166 | | 7,214 | |
| | 374 | | 151 | | 2,634 | | 214 | | 1,210 | | 576 | | 8,946 | | 2,379 | | 469 | | 16,954 | |
a Proved reserves exclude royalties due to others, whether payable in cash or in kind, where the royalty owner has a direct interest in the underlying production and the option and ability to make lifting and sales arrangements independently.
b Because of rounding, some totals may not exactly agree with the sum of their component parts.
c 5.8 billion cubic feet of natural gas = 1 million barrels of oil equivalent.
d Excludes NGLs from processing plants in which an interest is held of 3 thousand barrels per day for equity-accounted entities.
e Includes 23 million barrels of oil equivalent of natural gas consumed in operations, 14 million barrels of oil equivalent in subsidiaries, 9 million barrels of oil equivalent in equity-accounted entities.
f Includes 130 million barrels of oil equivalent in respect of the 30% non-controlling interest in BP Trinidad and Tobago LLC.
g Volumes of equity-accounted entities include volumes of equity-accounted investments of those entities.
h Includes 682 million barrels of oil equivalent in respect of the 8.09% non-controlling interest in Rosneft, including 129mmboe held through bp’s interests in Russia other than Rosneft.
i Total proved reserves held as part of our equity interest in Rosneft is 8,429 million barrels of oil equivalent, comprising less than 1 million barrels of oil equivalent in Canada and Vietnam, 1million barrels of oil equivalent in Iraq, 65 million barrels of oil equivalent in Egypt and 8,362 million barrels of oil equivalent in Russia.
| | | | | | | | | | | | | | |
| | bp Annual Report and Form 20-F 2021 | | 265 |
Movements in estimated net proved reserves – continued
| | | | | | | | | | | | | | | | | | | | | | | | | | | | | | | | | | | |
| | | | | | | | | | million barrels |
Crude oila b | | | | | | | | | | 2020 |
| | Europe | North
America | South
America | Africa | Asia | Australasia | Total |
| | UK | Rest of
Europe | US | Rest of
North
America | | | Russia | Rest of Asiac | | |
| Subsidiaries | | | | | | | | | | | |
| At 1 January | | | | | | | | | | | |
| Developed | | 206 | | — | | 1,063 | | 40 | | 7 | | 156 | | — | | 1,074 | | 26 | | 2,572 | |
| Undeveloped | | 200 | | — | | 842 | | 179 | | 5 | | 40 | | — | | 525 | | 4 | | 1,794 | |
| | 406 | | — | | 1,905 | | 218 | | 12 | | 196 | | — | | 1,599 | | 30 | | 4,367 | |
| Changes attributable to | | | | | | | | | | | |
| Revisions of previous estimates | | (62) | | — | | (17) | | 22 | | — | | (17) | | — | | 175 | | 14 | | 114 | |
| Improved recovery | | — | | — | | 24 | | — | | — | | 3 | | — | | — | | — | | 27 | |
| Purchases of reserves-in-place | | — | | — | | — | | — | | — | | — | | — | | — | | — | | — | |
| Discoveries and extensions | | — | | — | | 2 | | — | | 5 | | — | | — | | 11 | | — | | 18 | |
| Production | | (35) | | — | | (125) | | (8) | | — | | (44) | | — | | (137) | | (5) | | (355) | |
| Sales of reserves-in-place | | — | | — | | (351) | | — | | — | | — | | — | | — | | — | | (351) | |
| | (97) | | — | | (467) | | 14 | | 5 | | (58) | | — | | 48 | | 8 | | (547) | |
At 31 Decemberd | | | | | | | | | | | |
| Developed | | 162 | | — | | 697 | | 37 | | 8 | | 116 | | — | | 1,100 | | 34 | | 2,154 | |
| Undeveloped | | 148 | | — | | 742 | | 195 | | 9 | | 21 | | — | | 547 | | 5 | | 1,666 | |
| | 309 | | — | | 1,438 | | 232 | | 16 | | 137 | | — | | 1,647 | | 38 | | 3,819 | |
Equity-accounted entities (bp share)e | | | | | | | | | | | |
| At 1 January | | | | | | | | | | | |
| Developed | | — | | 115 | | — | | — | | 291 | | 2 | | 3,159 | | — | | — | | 3,567 | |
| Undeveloped | | — | | 35 | | — | | 20 | | 257 | | — | | 2,535 | | — | | — | | 2,847 | |
| | — | | 150 | | — | | 20 | | 548 | | 2 | | 5,695 | | — | | — | | 6,414 | |
| Changes attributable to | | | | | | | | | | | |
| Revisions of previous estimates | | — | | (5) | | — | | 6 | | 2 | | 1 | | 31 | | — | | — | | 35 | |
| Improved recovery | | — | | 10 | | — | | — | | — | | — | | — | | — | | — | | 10 | |
| Purchases of reserves-in-place | | — | | — | | — | | — | | 1 | | — | | 643 | | — | | — | | 644 | |
| Discoveries and extensions | | — | | — | | — | | — | | 17 | | | 238 | | — | | — | | 255 | |
| Production | | — | | (18) | | — | | — | | (21) | | — | | (330) | | — | | — | | (369) | |
| Sales of reserves-in-place | | — | | — | | — | | — | | (35) | | | (662) | | — | | — | | (697) | |
| | — | | (14) | | — | | 6 | | (36) | | 1 | | (79) | | — | | — | | (122) | |
At 31 Decemberf g | | | | | | | | | | | |
| Developed | | — | | 112 | | — | | 5 | | 275 | | 2 | | 3,123 | | — | | — | | 3,517 | |
| Undeveloped | | — | | 24 | | — | | 21 | | 237 | | — | | 2,493 | | — | | — | | 2,776 | |
| | — | | 136 | | — | | 26 | | 512 | | 3 | | 5,615 | | 1 | | — | | 6,293 | |
| Total subsidiaries and equity-accounted entities (bp share) | | | | | | | |
| At 1 January | | | | | | | | | | | |
| Developed | | 206 | | 115 | | 1,063 | | 40 | | 298 | | 158 | | 3,159 | | 1,074 | | 26 | | 6,140 | |
| Undeveloped | | 200 | | 35 | | 842 | | 198 | | 262 | | 40 | | 2,535 | | 525 | | 4 | | 4,642 | |
| | 406 | | 150 | | 1,905 | | 238 | | 560 | | 198 | | 5,695 | | 1,599 | | 30 | | 10,781 | |
| At 31 December | | | | | | | | | | | |
| Developed | | 162 | | 112 | | 697 | | 42 | | 283 | | 119 | | 3,123 | | 1,100 | | 34 | | 5,671 | |
| Undeveloped | | 148 | | 24 | | 742 | | 215 | | 246 | | 22 | | 2,493 | | 548 | | 5 | | 4,441 | |
| | 309 | | 136 | | 1,438 | | 258 | | 529 | | 140 | | 5,615 | | 1,648 | | 38 | | 10,112 | |
a Crude oil includes condensate and bitumen. Proved reserves exclude royalties due to others, whether payable in cash or in kind, where the royalty owner has a direct interest in the underlying production and the option and ability to make lifting and sales arrangements independently.
b Because of rounding, some totals may not exactly agree with the sum of their component parts.
c Includes 37 million barrels of crude oil associated with Assets Held for Sale in Oman.
d Includes 5 million barrels of crude oil in respect of the 30% non-controlling interest in BP Trinidad and Tobago LLC.
e Volumes of equity-accounted entities include volumes of equity-accounted investments of those entities.
f Includes 393 million barrels of crude oil in respect of the 7.09% non-controlling interest in Rosneft, including 18.53 mmbbl held through bp's interests in Russia other than Rosneft.
g Total proved crude oil reserves held as part of our equity interest in Rosneft is 5,533 million barrels, comprising less than 1 million barrels each in Egypt, Vietnam, Iraq and Canada, 0 million barrels in Venezuela and 5,531 million barrels in Russia.
| | | | | | | | | | | | | | |
266 | | bp Annual Report and Form 20-F 2021 | | |
Movements in estimated net proved reserves – continued
| | | | | | | | | | | | | | | | | | | | | | | | | | | | | | | | | | | |
| | | | | | | | | | million barrels |
Natural gas liquidsa b | | | | | | | | | | 2020 |
| | Europe | North
America | South
America | Africa | Asia | Australasia | Total |
| | UK | Rest of
Europe | US | Rest of
North
America | | | Russia | Rest of Asiac | | |
| Subsidiaries | | | | | | | | | | | |
| At 1 January | | | | | | | | | | | |
| Developed | | 8 | | — | | 229 | | — | | 2 | | 12 | | — | | — | | 4 | | 255 | |
| Undeveloped | | 5 | | — | | 250 | | — | | 21 | | 4 | | — | | — | | — | | 280 | |
| | 13 | | — | | 479 | | — | | 23 | | 16 | | — | | — | | 4 | | 535 | |
| Changes attributable to | | | | | | | | | | | |
| Revisions of previous estimates | | (5) | | — | | (22) | | — | | — | | 1 | | — | | — | | (1) | | (26) | |
| Improved recovery | | — | | — | | 1 | | — | | — | | — | | — | | — | | — | | 1 | |
| Purchases of reserves-in-place | | — | | — | | — | | — | | — | | — | | — | | — | | — | | — | |
| Discoveries and extensions | | — | | — | | — | | — | | — | | — | | — | | — | | — | | — | |
Productiond | | (2) | | — | | (31) | | — | | (3) | | (3) | | — | | — | | (1) | | (39) | |
| Sales of reserves-in-place | | — | | — | | (94) | | — | | — | | — | | — | | — | | — | | (94) | |
| | (7) | | — | | (146) | | — | | (2) | | (2) | | — | | — | | (2) | | (159) | |
At 31 Decembere | | | | | | | | | | | |
| Developed | | 7 | | — | | 115 | | — | | 2 | | 13 | | — | | — | | 2 | | 139 | |
| Undeveloped | | — | | — | | 218 | | — | | 19 | | 1 | | — | | — | | — | | 237 | |
| | 7 | | — | | 333 | | — | | 21 | | 14 | | — | | — | | 2 | | 376 | |
Equity-accounted entities (bp share)f | | | | | | | | | | | |
| At 1 January | | | | | | | | | | | |
| Developed | | — | | 5 | | — | | — | | 2 | | 11 | | 89 | | — | | — | | 107 | |
| Undeveloped | | — | | 3 | | — | | — | | — | | — | | 52 | | — | | — | | 55 | |
| | — | | 7 | | — | | — | | 2 | | 11 | | 141 | | — | | — | | 162 | |
| Changes attributable to | | | | | | | | | | | |
| Revisions of previous estimates | | — | | 1 | | — | | — | | — | | 3 | | 9 | | — | | — | | 12 | |
| Improved recovery | | — | | — | | — | | — | | — | | — | | — | | — | | — | | — | |
| Purchases of reserves-in-place | | — | | — | | — | | — | | — | | — | | 16 | | — | | — | | 16 | |
| Discoveries and extensions | | — | | — | | — | | — | | — | | — | | — | | — | | — | | — | |
Productiond | | — | | (1) | | — | | — | | — | | (2) | | (2) | | — | | — | | (5) | |
| Sales of reserves-in-place | | — | | — | | — | | — | | — | | — | | (14) | | — | | — | | (14) | |
| | — | | — | | — | | — | | — | | 1 | | 10 | | — | | — | | 10 | |
At 31 Decemberg h | | | | | | | | | | | |
| Developed | | — | | 6 | | — | | — | | 2 | | 12 | | 108 | | — | | — | | 129 | |
| Undeveloped | | — | | 1 | | — | | — | | — | | — | | 43 | | — | | — | | 44 | |
| | — | | 7 | | — | | — | | 2 | | 12 | | 151 | | — | | — | | 172 | |
| Total subsidiaries and equity-accounted entities (bp share) | | | | | | | |
| At 1 January | | | | | | | | | | | |
| Developed | | 8 | | 5 | | 229 | | — | | 4 | | 23 | | 89 | | — | | 4 | | 363 | |
| Undeveloped | | 5 | | 3 | | 250 | | — | | 21 | | 4 | | 52 | | — | | — | | 334 | |
| | 13 | | 7 | | 479 | | — | | 25 | | 27 | | 141 | | — | | 4 | | 697 | |
| At 31 December | | | | | | | | | | | |
| Developed | | 7 | | 6 | | 115 | | — | | 4 | | 25 | | 108 | | — | | 2 | | 268 | |
| Undeveloped | | — | | 1 | | 218 | | — | | 19 | | 1 | | 43 | | — | | — | | 281 | |
| | 7 | | 7 | | 333 | | — | | 23 | | 26 | | 151 | | — | | 2 | | 549 | |
a Proved reserves exclude royalties due to others, whether payable in cash or in kind, where the royalty owner has a direct interest in the underlying production and the option and ability to make lifting and sales arrangements independently.
b Because of rounding, some totals may not exactly agree with the sum of their component parts.
c Includes 0 million barrels of NGL associated with Assets Held for Sale in Oman.
d Excludes NGLs from processing plants in which an interest is held of less than 1 thousand barrels per day for subsidiaries and 3 thousand barrels per day for equity-accounted entities.
e Includes 6 million barrels of NGL in respect of the 30% non-controlling interest in BP Trinidad and Tobago LLC.
f Volumes of equity-accounted entities include volumes of equity-accounted investments of those entities.
g Includes 12 million barrels of NGLs in respect of the 7.99% non-controlling interest in Rosneft.
h Total proved NGL reserves held as part of our equity interest in Rosneft is 151 million barrels, comprising less than 1 million barrels each in Egypt, Venezuela, Vietnam and Canada, and 151 million barrels in Russia.
| | | | | | | | | | | | | | |
| | bp Annual Report and Form 20-F 2021 | | 267 |
Movements in estimated net proved reserves – continued
| | | | | | | | | | | | | | | | | | | | | | | | | | | | | | | | | | | |
| | million barrels |
Total liquidsa b | | | | | | | | | | 2020 |
| | Europe | North
America | South
America | Africa | Asia | Australasia | Total |
| | UK | Rest of
Europe | US | Rest of
North
America | | | Russia | Rest of Asiac | | |
| Subsidiaries | | | | | | | | | | | |
| At 1 January | | | | | | | | | | | |
| Developed | | 214 | | — | | 1,292 | | 40 | | 9 | | 168 | | — | | 1,074 | | 30 | | 2,828 | |
| Undeveloped | | 205 | | — | | 1,092 | | 179 | | 26 | | 43 | | — | | 525 | | 4 | | 2,074 | |
| | 420 | | — | | 2,384 | | 218 | | 35 | | 211 | | — | | 1,599 | | 34 | | 4,902 | |
| Changes attributable to | | | | | | | | | | | |
| Revisions of previous estimates | | (67) | | — | | (40) | | 22 | | 1 | | (16) | | — | | 175 | | 13 | | 87 | |
| Improved recovery | | — | | — | | 25 | | — | | — | | 3 | | — | | — | | — | | 28 | |
| Purchases of reserves-in-place | | — | | — | | — | | — | | — | | — | | — | | — | | — | | — | |
| Discoveries and extensions | | — | | — | | 2 | | — | | 5 | | — | | — | | 11 | | — | | 18 | |
Productiond | | (37) | | — | | (155) | | (8) | | (3) | | (47) | | — | | (137) | | (6) | | (394) | |
| Sales of reserves-in-place | | — | | — | | (445) | | — | | — | | — | | — | | — | | — | | (445) | |
| | (104) | | — | | (613) | | 14 | | 2 | | (60) | | — | | 48 | | 6 | | (706) | |
At 31 Decembere | | | | | | | | | | | |
| Developed | | 168 | | — | | 812 | | 37 | | 10 | | 129 | | — | | 1,100 | | 36 | | 2,293 | |
| Undeveloped | | 148 | | — | | 959 | | 195 | | 27 | | 22 | | — | | 547 | | 5 | | 1,903 | |
| | 316 | | — | | 1,771 | | 232 | | 37 | | 151 | | — | | 1,647 | | 41 | | 4,196 | |
Equity-accounted entities (bp share)f | | | | | | | | | | | |
| At 1 January | | | | | | | | | | | |
| Developed | | — | | 120 | | — | | — | | 293 | | 13 | | 3,248 | | — | | — | | 3,675 | |
| Undeveloped | | — | | 37 | | — | | 20 | | 257 | | — | | 2,588 | | — | | — | | 2,902 | |
| | — | | 157 | | — | | 20 | | 550 | | 13 | | 5,836 | | — | | — | | 6,576 | |
| Changes attributable to | | | | | | | | | | | |
| Revisions of previous estimates | | — | | (4) | | — | | 6 | | 2 | | 4 | | 39 | | — | | — | | 47 | |
| Improved recovery | | — | | 10 | | — | | — | | — | | — | | — | | — | | — | | 10 | |
| Purchases of reserves-in-place | | — | | — | | — | | — | | 1 | | — | | 660 | | — | | — | | 661 | |
| Discoveries and extensions | | — | | — | | — | | | 17 | | | 238 | | — | | — | | 255 | |
Productiond | | — | | (19) | | — | | — | | (21) | | (2) | | (331) | | — | | — | | (374) | |
| Sales of reserves-in-place | | — | | (1) | | — | | — | | (35) | | | (675) | | — | | — | | (711) | |
| | — | | (14) | | — | | 6 | | (36) | | 2 | | (70) | | — | | — | | (112) | |
At 31 Decemberg h | | | | | | | | | | | |
| Developed | | — | | 118 | | — | | 5 | | 277 | | 15 | | 3,231 | | — | | — | | 3,645 | |
| Undeveloped | | — | | 25 | | — | | 21 | | 237 | | — | | 2,535 | | — | | — | | 2,819 | |
| | — | | 143 | | — | | 26 | | 514 | | 15 | | 5,766 | | 1 | | — | | 6,465 | |
| Total subsidiaries and equity-accounted entities (bp share) | | | | | | | |
| At 1 January | | | | | | | | | | | |
| Developed | | 214 | | 120 | | 1,292 | | 40 | | 302 | | 181 | | 3,248 | | 1,074 | | 30 | | 6,502 | |
| Undeveloped | | 205 | | 37 | | 1,092 | | 198 | | 283 | | 43 | | 2,588 | | 525 | | 4 | | 4,976 | |
| | 420 | | 157 | | 2,384 | | 238 | | 585 | | 224 | | 5,836 | | 1,599 | | 34 | | 11,478 | |
| At 31 December | | | | | | | | | | | |
| Developed | | 168 | | 118 | | 812 | | 42 | | 287 | | 144 | | 3,231 | | 1,100 | | 36 | | 5,938 | |
| Undeveloped | | 148 | | 25 | | 959 | | 215 | | 265 | | 23 | | 2,535 | | 548 | | 5 | | 4,722 | |
| | 316 | | 143 | | 1,771 | | 258 | | 552 | | 166 | | 5,766 | | 1,648 | | 41 | | 10,661 | |
a Proved reserves exclude royalties due to others, whether payable in cash or in kind, where the royalty owner has a direct interest in the underlying production and the option and ability to make lifting and sales arrangements independently.
b Because of rounding, some totals may not exactly agree with the sum of their component parts.
c Includes 37 million barrels associated with Assets Held for Sale in Oman.
d Excludes NGLs from processing plants in which an interest is held of less than 1 thousand barrels per day for subsidiaries and 3 thousand barrels per day for equity-accounted entities.
e Also includes 11 million barrels in respect of the 30% non-controlling interest in BP Trinidad and Tobago LLC.
f Volumes of equity-accounted entities include volumes of equity-accounted investments of those entities.
g Includes 405 million barrels of liquids in respect of the non-controlling interest in Rosneft, including 19 mmboe held through bp’s interests in Russia other than Rosneft.
h Total proved liquid reserves held as part of our equity interest in Rosneft is 5,683 million barrels, comprising 0 million barrels in Venezuela, less than 1 million barrels each in Iraq, Canada, Egypt and Vietnam and 5,682 million barrels in Russia.
| | | | | | | | | | | | | | |
268 | | bp Annual Report and Form 20-F 2021 | | |
Movements in estimated net proved reserves – continued
| | | | | | | | | | | | | | | | | | | | | | | | | | | | | | | | | | | |
| | | | | | | | | | billion cubic feet |
Natural gasa b | | | | | | | | | | 2020 |
| | Europe | North
America | South
America | Africa | Asia | Australasia | Total |
| | UK | Rest of
Europe | US | Rest of
North
America | | | Russia | Rest of Asiac | | |
| Subsidiaries | | | | | | | | | | | |
| At 1 January | | | | | | | | | | | |
| Developed | | 493 | | — | | 6,330 | | — | | 2,192 | | 1,163 | | — | | 3,667 | | 2,256 | | 16,101 | |
| Undeveloped | | 207 | | — | | 2,127 | | — | | 2,235 | | 742 | | — | | 3,401 | | 1,132 | | 9,844 | |
| | 700 | | — | | 8,458 | | — | | 4,427 | | 1,905 | | — | | 7,068 | | 3,389 | | 25,946 | |
| Changes attributable to | | | | | | | | | | | |
| Revisions of previous estimates | | (252) | | — | | 580 | | 1 | | (362) | | (26) | | — | | 570 | | (9) | | 503 | |
| Improved recovery | | 1 | | — | | 545 | | — | | — | | — | | — | | — | | — | | 546 | |
| Purchases of reserves-in-place | | — | | — | | — | | — | | — | | — | | — | | — | | — | | — | |
| Discoveries and extensions | | — | | — | | 1 | | — | | 93 | | 28 | | — | | 263 | | — | | 386 | |
Productiond | | (92) | | — | | (603) | | (1) | | (627) | | (367) | | — | | (376) | | (293) | | (2,358) | |
| Sales of reserves-in-place | | — | | — | | (3,636) | | — | | — | | — | | — | | — | | — | | (3,636) | |
| | (342) | | — | | (3,114) | | — | | (896) | | (364) | | — | | 457 | | (301) | | (4,561) | |
At 31 Decembere | | | | | | | | | | | |
| Developed | | 306 | | — | | 1,921 | | — | | 1,567 | | 1,382 | | — | | 3,883 | | 2,058 | | 11,118 | |
| Undeveloped | | 51 | | — | | 3,423 | | — | | 1,964 | | 158 | | — | | 3,641 | | 1,029 | | 10,267 | |
| | 358 | | — | | 5,344 | | — | | 3,531 | | 1,541 | | — | | 7,524 | | 3,087 | | 21,385 | |
Equity-accounted entities (bp share)f | | | | | | | | | | | |
| At 1 January | | | | | | | | | | | |
| Developed | | — | | 108 | | — | | — | | 1,130 | | 508 | | 9,324 | | 10 | | — | | 11,080 | |
| Undeveloped | | — | | 56 | | — | | 6 | | 447 | | — | | 8,067 | | — | | — | | 8,576 | |
| | — | | 164 | | — | | 6 | | 1,577 | | 508 | | 17,391 | | 10 | | — | | 19,656 | |
| Changes attributable to | | | | | | | | | | | |
| Revisions of previous estimates | | — | | 29 | | — | | 2 | | (86) | | 285 | | 1,022 | | — | | — | | 1,251 | |
| Improved recovery | | — | | 8 | | — | | — | | — | | — | | — | | — | | — | | 8 | |
| Purchases of reserves-in-place | | — | | — | | — | | — | | — | | 18 | | 1,681 | | 1 | | — | | 1,701 | |
| Discoveries and extensions | | — | | — | | — | | — | | 139 | | — | | 422 | | — | | — | | 561 | |
Productiond | | — | | (35) | | — | | — | | (124) | | (69) | | (470) | | (5) | | — | | (703) | |
| Sales of reserves-in-place | | — | | (3) | | — | | — | | (28) | | — | | (1,361) | | — | | — | | (1,393) | |
| | — | | (2) | | — | | 2 | | (99) | | 234 | | 1,294 | | (4) | | — | | 1,426 | |
At 31 Decemberg h | | | | | | | | | | | |
| Developed | | — | | 141 | | — | | 2 | | 965 | | 600 | | 11,373 | | 7 | | — | | 13,088 | |
| Undeveloped | | — | | 21 | | — | | 6 | | 513 | | 142 | | 7,312 | | — | | — | | 7,994 | |
| | — | | 162 | | — | | 8 | | 1,478 | | 741 | | 18,685 | | 7 | | — | | 21,082 | |
| Total subsidiaries and equity-accounted entities (bp share) | | | | | | | |
| At 1 January | | | | | | | | | | | |
| Developed | | 493 | | 108 | | 6,330 | | — | | 3,323 | | 1,670 | | 9,324 | | 3,677 | | 2,256 | | 27,181 | |
| Undeveloped | | 207 | | 56 | | 2,127 | | 6 | | 2,682 | | 742 | | 8,067 | | 3,401 | | 1,132 | | 18,421 | |
| | 700 | | 164 | | 8,458 | | 6 | | 6,004 | | 2,413 | | 17,391 | | 7,078 | | 3,389 | | 45,601 | |
| At 31 December | | | | | | | | | | | |
| Developed | | 306 | | 141 | | 1,921 | | 2 | | 2,532 | | 1,982 | | 11,373 | | 3,890 | | 2,058 | | 24,206 | |
| Undeveloped | | 51 | | 21 | | 3,423 | | 6 | | 2,477 | | 300 | | 7,312 | | 3,641 | | 1,029 | | 18,260 | |
| | 358 | | 162 | | 5,344 | | 8 | | 5,009 | | 2,282 | | 18,685 | | 7,531 | | 3,087 | | 42,467 | |
a Proved reserves exclude royalties due to others, whether payable in cash or in kind, where the royalty owner has a direct interest in the underlying production and the option and ability to make lifting and sales arrangements independently.
b Because of rounding, some totals may not exactly agree with the sum of their component parts.
c Includes 1,316 billion cubic feet of natural gas associated with Assets Held for Sale in Oman.
d Includes 158 billion cubic feet of natural gas consumed in operations, 103 billion cubic feet in subsidiaries, 55 billion cubic feet in equity-accounted entities.
e Includes 1,059 billion cubic feet of natural gas in respect of the 30% non-controlling interest in BP Trinidad and Tobago LLC.
f Volumes of equity-accounted entities include volumes of equity-accounted investments of those entities.
g Includes 1,640 billion cubic feet of natural gas in respect of the 10.01% non-controlling interest in Rosneft including 614 billion cubic feet held through bp’s interests in Russia other than Rosneft.
h Total proved gas reserves held as part of our equity interest in Rosneft is 16,324 billion cubic feet, comprising 0 billion cubic feet in Venezuela, 7 billion cubic feet in Vietnam, 420 billion cubic feet in Egypt and 15,897 billion cubic feet in Russia.
| | | | | | | | | | | | | | |
| | bp Annual Report and Form 20-F 2021 | | 269 |
Movements in estimated net proved reserves – continued
| | | | | | | | | | | | | | | | | | | | | | | | | | | | | | | | | | | |
| | | | | | | | | million barrels of oil equivalentc |
Total hydrocarbonsa b | | | | | | | | | | 2020 |
| | Europe | North
America | South
America | Africa | Asia | Australasia | Total |
| | UK | Rest of
Europe | USd | Rest of
North
America | | | Russia | Rest of Asiad | | |
| Subsidiaries | | | | | | | | | | | |
| At 1 January | | | | | | | | | | | |
| Developed | | 300 | | — | | 2,384 | | 40 | | 387 | | 369 | | — | | 1,707 | | 419 | | 5,604 | |
| Undeveloped | | 241 | | — | | 1,459 | | 179 | | 411 | | 171 | | — | | 1,111 | | 199 | | 3,771 | |
| | 540 | | — | | 3,842 | | 218 | | 798 | | 540 | | — | | 2,818 | | 618 | | 9,375 | |
| Changes attributable to | | | | | | | | | | | |
| Revisions of previous estimates | | (110) | | — | | 60 | | 22 | | (62) | | (21) | | — | | 273 | | 11 | | 174 | |
| Improved recovery | | — | | — | | 118 | | — | | — | | 3 | | — | | — | | — | | 122 | |
| Purchases of reserves-in-place | | — | | — | | — | | — | | — | | — | | — | | — | | — | | — | |
| Discoveries and extensions | | — | | — | | 3 | | — | | 21 | | 5 | | — | | 56 | | — | | 84 | |
Productione f | | (53) | | — | | (259) | | (8) | | (111) | | (110) | | — | | (202) | | (57) | | (800) | |
| Sales of reserves-in-place | | — | | — | | (1,072) | | — | | — | | — | | — | | — | | — | | (1,072) | |
| | (163) | | — | | (1,150) | | 14 | | (152) | | (123) | | — | | 127 | | (46) | | (1,492) | |
At 31 Decemberg | | | | | | | | | | | |
| Developed | | 221 | | — | | 1,143 | | 37 | | 280 | | 367 | | — | | 1,770 | | 391 | | 4,210 | |
| Undeveloped | | 157 | | — | | 1,549 | | 195 | | 366 | | 50 | | — | | 1,175 | | 182 | | 3,673 | |
| | 378 | | — | | 2,692 | | 232 | | 646 | | 417 | | — | | 2,945 | | 573 | | 7,883 | |
Equity-accounted entities (bp share)h | | | | | | | | | | | |
| At 1 January | | | | | | | | | | | |
| Developed | | — | | 139 | | — | | — | | 488 | | 100 | | 4,856 | | 2 | | — | | 5,585 | |
| Undeveloped | | — | | 47 | | — | | 21 | | 334 | | — | | 3,978 | | — | | — | | 4,381 | |
| | — | | 186 | | — | | 21 | | 822 | | 100 | | 8,834 | | 2 | | — | | 9,965 | |
| Changes attributable to | | | | | | | | | | | |
| Revisions of previous estimates | | — | | 1 | | — | | 7 | | (13) | | 53 | | 216 | | — | | — | | 263 | |
| Improved recovery | | — | | 11 | | — | | — | | — | | — | | — | | — | | — | | 11 | |
| Purchases of reserves-in-place | | — | | — | | — | | — | | 1 | | 3 | | 949 | | — | | — | | 954 | |
| Discoveries and extensions | | — | | — | | — | | — | | 41 | | — | | 311 | | — | | — | | 352 | |
Productione | | — | | (25) | | — | | — | | (42) | | (14) | | (412) | | (1) | | — | | (495) | |
| Sales of reserves-in-place | | — | | (1) | | — | | — | | (40) | | — | | (910) | | — | | — | | (951) | |
| | — | | (15) | | — | | 7 | | (53) | | 42 | | 153 | | — | | — | | 134 | |
At 31 Decemberi j | | | | | | | | | | | |
| Developed | | — | | 142 | | — | | 5 | | 443 | | 118 | | 5,192 | | 1 | | — | | 5,902 | |
| Undeveloped | | — | | 29 | | — | | 22 | | 326 | | 25 | | 3,796 | | — | | — | | 4,198 | |
| | — | | 171 | | — | | 27 | | 769 | | 143 | | 8,988 | | 2 | | — | | 10,100 | |
| Total subsidiaries and equity-accounted entities (bp share) | | | | | | | |
| At 1 January | | | | | | | | | | | |
| Developed | | 300 | | 139 | | 2,384 | | 40 | | 875 | | 469 | | 4,856 | | 1,708 | | 419 | | 11,189 | |
| Undeveloped | | 241 | | 47 | | 1,459 | | 199 | | 746 | | 171 | | 3,978 | | 1,112 | | 199 | | 8,152 | |
| | 540 | | 186 | | 3,842 | | 239 | | 1,621 | | 640 | | 8,834 | | 2,820 | | 618 | | 19,341 | |
| At 31 December | | | | | | | | | | | |
| Developed | | 221 | | 142 | | 1,143 | | 43 | | 724 | | 485 | | 5,192 | | 1,771 | | 391 | | 10,112 | |
| Undeveloped | | 157 | | 29 | | 1,549 | | 217 | | 692 | | 74 | | 3,796 | | 1,175 | | 182 | | 7,871 | |
| | 378 | | 171 | | 2,692 | | 259 | | 1,415 | | 560 | | 8,988 | | 2,946 | | 573 | | 17,982 | |
a Proved reserves exclude royalties due to others, whether payable in cash or in kind, where the royalty owner has a direct interest in the underlying production and the option and ability to make lifting and sales arrangements independently.
b Because of rounding, some totals may not exactly agree with the sum of their component parts.
c 5.8 billion cubic feet of natural gas = 1 million barrels of oil equivalent.
d Includes 264 million barrels of oil equivalent associated with Assets Held for Sale in Oman.
e Excludes NGLs from processing plants in which an interest is held of less than 1 thousand barrels per day for subsidiaries and 3 thousand barrels per day for equity-accounted entities.
f Includes 27 million barrels of oil equivalent of natural gas consumed in operations, 18 million barrels of oil equivalent in subsidiaries, 10 million barrels of oil equivalent in equity-accounted entities.
g Includes 194 million barrels of oil equivalent in respect of the 30% non-controlling interest in BP Trinidad and Tobago LLC.
h Volumes of equity-accounted entities include volumes of equity-accounted investments of those entities.
i Includes 687 million barrels of oil equivalent in respect of the non-controlling interest in Rosneft, including 124 mmboe held through bp’s interests in Russia other than Rosneft.
j Total proved reserves held as part of our equity interest in Rosneft is 8,498 million barrels of oil equivalent, comprising less than 1 million barrels of oil equivalent in Iraq and Canada, 0 million barrels of oil equivalent in Venezuela, 1 million barrels of oil equivalent in Vietnam, 73 million barrels of oil equivalent in Egypt and 8,423 million barrels of oil equivalent in Russia.
| | | | | | | | | | | | | | |
270 | | bp Annual Report and Form 20-F 2021 | | |
Movements in estimated net proved reserves – continued
| | | | | | | | | | | | | | | | | | | | | | | | | | | | | | | | | | | |
| | | | | | | | | | | million barrels |
Crude oila b | | | | | | | | | | 2019 |
| | Europe | North
America | South
America | Africa | Asia | Australasia | Total |
| | UK | Rest of
Europe | USc d | Rest of
North
America | | | Russia | Rest of
Asia | | |
| Subsidiaries | | | | | | | | | | | |
| At 1 January | | | | | | | | | | | |
| Developed | | 223 | | — | | 962 | | 43 | | 8 | | 223 | | — | | 1,126 | | 30 | | 2,615 | |
| Undeveloped | | 243 | | — | | 802 | | 190 | | 5 | | 36 | | — | | 482 | | 5 | | 1,763 | |
| | | 466 | | — | | 1,764 | | 234 | | 14 | | 259 | | — | | 1,608 | | 34 | | 4,378 | |
| Changes attributable to | | | | | | | | | | | |
| Revisions of previous estimates | | (23) | | — | | 72 | | (8) | | 1 | | 39 | | — | | 104 | | 2 | | 187 | |
| Improved recovery | | — | | — | | 189 | | 1 | | — | | — | | — | | — | | — | | 191 | |
| Purchases of reserves-in-place | | — | | — | | — | | — | | — | | — | | — | | 1 | | — | | 1 | |
| Discoveries and extensions | | — | | — | | 34 | | — | | — | | — | | — | | 11 | | — | | 45 | |
| Production | | (36) | | — | | (143) | | (9) | | (3) | | (57) | | — | | (125) | | (6) | | (378) | |
| Sales of reserves-in-place | | — | | — | | (12) | | — | | — | | (45) | | — | | — | | — | | (57) | |
| | | (59) | | — | | 141 | | (16) | | (2) | | (63) | | — | | (9) | | (4) | | (12) | |
At 31 Decembere | | | | | | | | | | | |
| Developed | | 206 | | — | | 1,063 | | 40 | | 7 | | 156 | | — | | 1,074 | | 26 | | 2,572 | |
| Undeveloped | | 200 | | — | | 842 | | 179 | | 5 | | 40 | | — | | 525 | | 4 | | 1,794 | |
| | | 406 | | — | | 1,905 | | 218 | | 12 | | 196 | | — | | 1,599 | | 30 | | 4,367 | |
Equity-accounted entities (bp share)f | | | | | | | | |
| At 1 January | | | | | | | | | | | |
| Developed | | — | | 57 | | — | | — | | 293 | | 1 | | 3,190 | | — | | — | | 3,541 | |
| Undeveloped | | — | | 100 | | — | | 19 | | 259 | | — | | 2,414 | | — | | — | | 2,792 | |
| | | — | | 157 | | — | | 19 | | 552 | | 1 | | 5,604 | | — | | — | | 6,333 | |
| Changes attributable to | | | | | | | | | | | |
| Revisions of previous estimates | | — | | 2 | | — | | 1 | | (13) | | 1 | | 158 | | — | | — | | 147 | |
| Improved recovery | | — | | 4 | | — | | — | | — | | — | | — | | — | | — | | 4 | |
| Purchases of reserves-in-place | | — | | — | | — | | — | | — | | — | | 7 | | — | | — | | 7 | |
| Discoveries and extensions | | — | | — | | — | | — | | 33 | | — | | 277 | | — | | — | | 310 | |
| Production | | — | | (13) | | — | | — | | (24) | | — | | (345) | | — | | — | | (382) | |
| Sales of reserves-in-place | | — | | — | | — | | — | | — | | — | | (6) | | — | | — | | (6) | |
| | | — | | (7) | | — | | 1 | | (4) | | 1 | | 91 | | — | | — | | 81 | |
At 31 Decemberg h | | | | | | | | | | | |
| Developed | | — | | 115 | | — | | — | | 291 | | 2 | | 3,159 | | — | | — | | 3,567 | |
| Undeveloped | | — | | 35 | | — | | 20 | | 257 | | — | | 2,535 | | — | | — | | 2,847 | |
| | | — | | 150 | | — | | 20 | | 548 | | 2 | | 5,695 | | — | | — | | 6,415 | |
| Total subsidiaries and equity-accounted entities (bp share) | | | | | | | |
| At 1 January | | | | | | | | | | | |
| Developed | | 223 | | 57 | | 962 | | 43 | | 302 | | 224 | | 3,190 | | 1,126 | | 30 | | 6,156 | |
| Undeveloped | | 243 | | 100 | | 802 | | 209 | | 264 | | 36 | | 2,414 | | 482 | | 5 | | 4,555 | |
| | | 466 | | 157 | | 1,764 | | 253 | | 566 | | 260 | | 5,604 | | 1,608 | | 34 | | 10,711 | |
| At 31 December | | | | | | | | | | | |
| Developed | | 206 | | 115 | | 1,063 | | 40 | | 298 | | 158 | | 3,159 | | 1,074 | | 26 | | 6,140 | |
| Undeveloped | | 200 | | 35 | | 842 | | 198 | | 262 | | 40 | | 2,535 | | 525 | | 4 | | 4,642 | |
| | | 406 | | 150 | | 1,905 | | 238 | | 560 | | 198 | | 5,695 | | 1,599 | | 30 | | 10,781 | |
a Crude oil includes condensate and bitumen. Proved reserves exclude royalties due to others, whether payable in cash or in kind, where the royalty owner has a direct interest in the underlying production and the option and ability to make lifting and sales arrangements independently.
b Because of rounding, some totals may not exactly agree with the sum of their component parts.
c Proved reserves in the Prudhoe Bay field in Alaska include an estimated 4.5 million barrels upon which a net profits royalty will be payable over the life of the field under the terms of the BP Prudhoe Bay Royalty Trust.
d Includes 362 million barrels of crude oil associated with Assets Held for Sale in the USA.
e Includes 4 million barrels of crude oil in respect of the 30% non-controlling interest in BP Trinidad and Tobago LLC.
f Volumes of equity-accounted entities include volumes of equity-accounted investments of those entities.
g Includes 346 million barrels of crude oil in respect of the 6.17% non-controlling interest in Rosneft, including 26 mmbbl held through bp’s interests in Russia other than Rosneft.
h Total proved crude oil reserves held as part of our equity interest in Rosneft is 5,604 million barrels, comprising less than 1 million barrels in Egypt, Vietnam, Iraq and Canada, 35 million barrels in Venezuela and 5,568 million barrels in Russia.
| | | | | | | | | | | | | | |
| | bp Annual Report and Form 20-F 2021 | | 271 |
Movements in estimated net proved reserves – continued
| | | | | | | | | | | | | | | | | | | | | | | | | | | | | | | | | | | |
| | | | | | | | | | million barrels |
Natural gas liquidsa b | | | | | | | | | | 2019 |
| | Europe | North
America | South
America | Africa | Asia | Australasia | Total |
| | UK | Rest of
Europe | USc | Rest of
North
America | | | Russia | Rest of
Asia | | |
| Subsidiaries | | | | | | | | | | | |
| At 1 January | | | | | | | | | | | |
| Developed | | 8 | | — | | 266 | | — | | 2 | | 14 | | — | | — | | 5 | | 295 | |
| Undeveloped | | 6 | | — | | 246 | | — | | 25 | | 4 | | — | | — | | — | | 280 | |
| | 14 | | — | | 511 | | — | | 27 | | 18 | | — | | — | | 5 | | 576 | |
| Changes attributable to | | | | | | | | | | | |
| Revisions of previous estimates | | — | | — | | (46) | | — | | (1) | | — | | — | | — | | — | | (47) | |
| Improved recovery | | 1 | | — | | 62 | | — | | — | | — | | — | | — | | — | | 63 | |
| Purchases of reserves-in-place | | — | | — | | — | | — | | — | | — | | — | | — | | — | | — | |
| Discoveries and extensions | | — | | — | | 1 | | — | | — | | — | | — | | — | | — | | 1 | |
Productiond | | (1) | | — | | (33) | | — | | (3) | | (3) | | — | | — | | (1) | | (41) | |
| Sales of reserves-in-place | | — | | — | | (17) | | — | | — | | — | | — | | — | | — | | (17) | |
| | (1) | | — | | (32) | | — | | (4) | | (3) | | — | | — | | (1) | | (41) | |
At 31 Decembere | | | | | | | | | | | |
| Developed | | 8 | | — | | 229 | | — | | 2 | | 12 | | — | | — | | 4 | | 255 | |
| Undeveloped | | 5 | | — | | 250 | | — | | 21 | | 4 | | — | | — | | — | | 280 | |
| | | 13 | | — | | 479 | | — | | 23 | | 16 | | — | | — | | 4 | | 535 | |
Equity-accounted entities (bp share)f | | | | | | | | | | | |
| At 1 January | | | | | | | | | | | |
| Developed | | — | | 4 | | — | | — | | — | | 7 | | 103 | | — | | — | | 114 | |
| Undeveloped | | — | | 3 | | — | | — | | — | | — | | 51 | | — | | — | | 54 | |
| | | — | | 7 | | — | | — | | — | | 7 | | 154 | | — | | — | | 169 | |
| Changes attributable to | | | | | | | | | | | |
| Revisions of previous estimates | | — | | — | | — | | — | | 3 | | 5 | | (11) | | — | | — | | (3) | |
| Improved recovery | | — | | 1 | | — | | — | | — | | — | | — | | — | | — | | 1 | |
| Purchases of reserves-in-place | | — | | — | | — | | — | | — | | — | | — | | — | | — | | — | |
| Discoveries and extensions | | — | | — | | — | | — | | — | | — | | — | | — | | — | | — | |
| Production | | — | | (1) | | — | | — | | — | | (2) | | (2) | | — | | — | | (4) | |
| Sales of reserves-in-place | | — | | — | | — | | — | | — | | — | | — | | — | | — | | — | |
| | | — | | — | | — | | — | | 2 | | 4 | | (13) | | — | | — | | (7) | |
At 31 Decemberg h | | | | | | | | | | | |
| Developed | | — | | 5 | | — | | — | | 2 | | 11 | | 89 | | — | | — | | 107 | |
| Undeveloped | | — | | 3 | | — | | — | | — | | — | | 52 | | — | | — | | 55 | |
| | | — | | 7 | | — | | — | | 2 | | 11 | | 141 | | — | | — | | 162 | |
| Total subsidiaries and equity-accounted entities (bp share) | | | | | | | |
| At 1 January | | | | | | | | | | | |
| Developed | | 8 | | 4 | | 266 | | — | | 2 | | 22 | | 103 | | — | | 5 | | 409 | |
| Undeveloped | | 6 | | 3 | | 246 | | — | | 25 | | 4 | | 51 | | — | | — | | 335 | |
| | | 14 | | 7 | | 511 | | — | | 27 | | 26 | | 154 | | — | | 5 | | 744 | |
| At 31 December | | | | | | | | | | | |
| Developed | | 8 | | 5 | | 229 | | — | | 4 | | 23 | | 89 | | — | | 4 | | 363 | |
| Undeveloped | | 5 | | 3 | | 250 | | — | | 21 | | 4 | | 52 | | — | | — | | 334 | |
| | | 13 | | 7 | | 479 | | — | | 25 | | 27 | | 141 | | — | | 4 | | 697 | |
a Proved reserves exclude royalties due to others, whether payable in cash or in kind, where the royalty owner has a direct interest in the underlying production and the option and ability to make lifting and sales arrangements independently.
b Because of rounding, some totals may not exactly agree with the sum of their component parts.
c Includes 94 million barrels of NGL associated with Assets Held for Sale in the USA.
d Excludes NGLs from processing plants in which an interest is held of less than 1 thousand barrels per day for subsidiaries and 3 thousand barrels per day for equity-accounted entities.
e Includes 7 million barrels of NGL in respect of the 30% non-controlling interest in BP Trinidad and Tobago LLC.
f Volumes of equity-accounted entities include volumes of equity-accounted investments of those entities.
g Includes 11 million barrels of NGLs in respect of the 7.90% non-controlling interest in Rosneft.
h Total proved NGL reserves held as part of our equity interest in Rosneft is 141 million barrels, comprising less than 1 million barrels in Egypt, Venezuela, Vietnam and Canada, and 141 million barrels in Russia.
| | | | | | | | | | | | | | |
272 | | bp Annual Report and Form 20-F 2021 | | |
Movements in estimated net proved reserves – continued
| | | | | | | | | | | | | | | | | | | | | | | | | | | | | | | | | | | |
| | | | | | | | | | million barrels |
Total liquidsa b | | | | | | | | | | | 2019 |
| | Europe | North
America | South
America | Africa | Asia | Australasia | Total |
| | UK | Rest of
Europe | USc d | Rest of
North
America | | | Russia | Rest of
Asia | | |
| Subsidiaries | | | | | | | | | | | |
| At 1 January | | | | | | | | | | | |
| Developed | | 231 | | — | | 1,228 | | 43 | | 10 | | 237 | | — | | 1,126 | | 35 | | 2,910 | |
| Undeveloped | | 249 | | — | | 1,048 | | 190 | | 30 | | 40 | | — | | 482 | | 5 | | 2,044 | |
| | 480 | | — | | 2,276 | | 234 | | 41 | | 277 | | — | | 1,608 | | 39 | | 4,954 | |
| Changes attributable to | | | | | | | | | | | |
| Revisions of previous estimates | | (24) | | — | | 26 | | (8) | | — | | 40 | | — | | 104 | | 2 | | 140 | |
| Improved recovery | | 1 | | — | | 252 | | 1 | | — | | — | | — | | — | | — | | 254 | |
| Purchases of reserves-in-place | | — | | — | | — | | — | | — | | — | | — | | 1 | | — | | 1 | |
| Discoveries and extensions | | — | | — | | 35 | | — | | — | | — | | — | | 11 | | — | | 46 | |
Productione | | (38) | | — | | (176) | | (9) | | (6) | | (60) | | — | | (125) | | (7) | | (420) | |
| Sales of reserves-in-place | | — | | — | | (28) | | — | | — | | (45) | | — | | — | | — | | (74) | |
| | (60) | | — | | 109 | | (16) | | (6) | | (65) | | — | | (9) | | (5) | | (52) | |
At 31 Decemberf | | | | | | | | | | | |
| Developed | | 214 | | — | | 1,292 | | 40 | | 9 | | 168 | | — | | 1,074 | | 30 | | 2,828 | |
| Undeveloped | | 205 | | — | | 1,092 | | 179 | | 26 | | 43 | | — | | 525 | | 4 | | 2,074 | |
| | 420 | | — | | 2,384 | | 218 | | 35 | | 212 | | — | | 1,599 | | 34 | | 4,902 | |
Equity-accounted entities (bp share)g | | | | | | | | |
| At 1 January | | | | | | | | | | | |
| Developed | | — | | 60 | | — | | — | | 293 | | 8 | | 3,293 | | — | | — | | 3,655 | |
| Undeveloped | | — | | 104 | | — | | 19 | | 259 | | — | | 2,465 | | — | | — | | 2,846 | |
| | — | | 164 | | — | | 19 | | 552 | | 8 | | 5,758 | | — | | — | | 6,502 | |
| Changes attributable to | | | | | | | | | | | |
| Revisions of previous estimates | | — | | 2 | | — | | 1 | | (11) | | 7 | | 146 | | — | | — | | 145 | |
| Improved recovery | | — | | 5 | | — | | — | | — | | — | | — | | — | | — | | 5 | |
| Purchases of reserves-in-place | | — | | — | | — | | — | | — | | — | | 7 | | — | | — | | 7 | |
| Discoveries and extensions | | — | | — | | — | | — | | 33 | | — | | 277 | | — | | — | | 310 | |
| Production | | — | | (14) | | — | | — | | (24) | | (2) | | (346) | | — | | — | | (386) | |
| Sales of reserves-in-place | | — | | — | | — | | — | | — | | — | | (6) | | — | | — | | (6) | |
| | — | | (7) | | — | | 1 | | (1) | | 5 | | 78 | | — | | — | | 75 | |
At 31 Decemberh i | | | | | | | | | | | |
| Developed | | — | | 120 | | — | | — | | 293 | | 13 | | 3,248 | | — | | — | | 3,675 | |
| Undeveloped | | — | | 37 | | — | | 20 | | 257 | | — | | 2,588 | | — | | — | | 2,902 | |
| | | — | | 157 | | — | | 20 | | 550 | | 13 | | 5,836 | | — | | — | | 6,576 | |
| Total subsidiaries and equity-accounted entities (bp share) | | | | | | | |
| At 1 January | | | | | | | | | | | |
| Developed | | 231 | | 60 | | 1,228 | | 44 | | 303 | | 245 | | 3,293 | | 1,126 | | 35 | | 6,565 | |
| Undeveloped | | 249 | | 104 | | 1,048 | | 209 | | 289 | | 40 | | 2,465 | | 482 | | 5 | | 4,890 | |
| | | 480 | | 164 | | 2,276 | | 253 | | 593 | | 285 | | 5,758 | | 1,608 | | 39 | | 11,456 | |
| At 31 December | | | | | | | | | | | |
| Developed | | 214 | | 120 | | 1,292 | | 40 | | 302 | | 181 | | 3,248 | | 1,074 | | 30 | | 6,502 | |
| Undeveloped | | 205 | | 37 | | 1,092 | | 198 | | 283 | | 43 | | 2,588 | | 525 | | 4 | | 4,976 | |
| | | 420 | | 157 | | 2,384 | | 238 | | 585 | | 224 | | 5,836 | | 1,599 | | 34 | | 11,478 | |
a Proved reserves exclude royalties due to others, whether payable in cash or in kind, where the royalty owner has a direct interest in the underlying production and the option and ability to make lifting and sales arrangements independently.
b Because of rounding, some totals may not exactly agree with the sum of their component parts.
c Proved reserves in the Prudhoe Bay field in Alaska include an estimated 4.5 million barrels of oil equivalent upon which a net profits royalty will be payable, over the life of the field under the terms of the BP Prudhoe Bay Royalty Trust.
d Includes 456 million barrels associated with Assets Held for Sale in the USA.
e Excludes NGLs from processing plants in which an interest is held of less than 1 thousand barrels per day for subsidiaries and 3 thousand barrels per day for equity-accounted entities.
f Also includes 11 million barrels in respect of the 30% non-controlling interest in BP Trinidad and Tobago LLC.
g Volumes of equity-accounted entities include volumes of equity-accounted investments of those entities.
h Includes 357 million barrels in respect of the non-controlling interest in Rosneft, including 26 mmboe held through bp’s interests in Russia other than Rosneft.
i Total proved liquid reserves held as part of our equity interest in Rosneft is 5,745 million barrels, comprising, 35 million barrels in Venezuela, less than 1 million barrels in Iraq, Canada, Egypt and Vietnam and 5,709 million barrels in Russia.
| | | | | | | | | | | | | | |
| | bp Annual Report and Form 20-F 2021 | | 273 |
Movements in estimated net proved reserves – continued
| | | | | | | | | | | | | | | | | | | | | | | | | | | | | | | | | | | |
| | | | | | | | | | billion cubic feet |
Natural gasa b | | | | | | | | | | 2019 |
| | Europe | North
America | South
America | Africa | Asia | Australasia | Total |
| | UK | Rest of
Europe | USc | Rest of
North
America | | | Russia | Rest of
Asia | | |
| Subsidiaries | | | | | | | | | | | |
| At 1 January | | | | | | | | | | | |
| Developed | | 439 | | — | | 6,270 | | — | | 2,168 | | 1,313 | | — | | 3,599 | | 2,630 | | 16,420 | |
| Undeveloped | | 343 | | — | | 5,056 | | — | | 3,073 | | 1,067 | | — | | 3,218 | | 1,179 | | 13,936 | |
| | 782 | | — | | 11,326 | | — | | 5,241 | | 2,380 | | — | | 6,817 | | 3,809 | | 30,355 | |
| Changes attributable to | | | | | | | | | | | |
| Revisions of previous estimates | | (34) | | — | | (1,877) | | 1 | | (263) | | (4) | | — | | 285 | | (129) | | (2,022) | |
| Improved recovery | | 9 | | — | | 307 | | — | | — | | — | | — | | — | | — | | 315 | |
| Purchases of reserves-in-place | | — | | — | | — | | — | | — | | — | | — | | 50 | | — | | 50 | |
| Discoveries and extensions | | — | | — | | 11 | | — | | 178 | | — | | — | | 299 | | — | | 488 | |
Productiond | | (57) | | — | | (923) | | (1) | | (729) | | (450) | | — | | (383) | | (291) | | (2,834) | |
| Sales of reserves-in-place | | — | | — | | (386) | | — | | — | | (21) | | — | | — | | — | | (406) | |
| | (82) | | — | | (2,869) | | — | | (814) | | (475) | | — | | 251 | | (420) | | (4,410) | |
At 31 Decembere | | | | | | | | | | | |
| Developed | | 493 | | — | | 6,330 | | — | | 2,192 | | 1,163 | | — | | 3,667 | | 2,256 | | 16,101 | |
| Undeveloped | | 207 | | — | | 2,127 | | — | | 2,235 | | 742 | | — | | 3,401 | | 1,132 | | 9,844 | |
| | | 700 | | — | | 8,458 | | — | | 4,427 | | 1,905 | | — | | 7,068 | | 3,389 | | 25,946 | |
Equity-accounted entities (bp share)f | | | | | | | | | | | |
| At 1 January | | | | | | | | | | | |
| Developed | | — | | 107 | | — | | — | | 1,207 | | 391 | | 7,798 | | 12 | | — | | 9,515 | |
| Undeveloped | | — | | 55 | | — | | 4 | | 446 | | 143 | | 8,719 | | 4 | | — | | 9,369 | |
| | | — | | 161 | | — | | 4 | | 1,653 | | 534 | | 16,517 | | 15 | | — | | 18,884 | |
| Changes attributable to | | | | | | | | | | | |
| Revisions of previous estimates | | — | | 9 | | — | | 3 | | (120) | | 38 | | 789 | | — | | — | | 718 | |
| Improved recovery | | — | | 15 | | — | | — | | — | | — | | — | | — | | — | | 15 | |
| Purchases of reserves-in-place | | — | | — | | — | | — | | — | | — | | — | | — | | — | | — | |
| Discoveries and extensions | | — | | — | | — | | — | | 180 | | — | | 534 | | — | | — | | 714 | |
Productiond | | — | | (22) | | — | | — | | (135) | | (65) | | (448) | | (5) | | — | | (676) | |
| Sales of reserves-in-place | | — | | — | | — | | — | | — | | — | | — | | — | | — | | — | |
| | — | | 2 | | — | | 3 | | (75) | | (27) | | 874 | | (5) | | — | | 772 | |
At 31 Decemberg h | | | | | | | | | | | |
| Developed | | — | | 108 | | — | | — | | 1,130 | | 507 | | 9,324 | | 10 | | — | | 11,079 | |
| Undeveloped | | — | | 56 | | — | | 6 | | 447 | | — | | 8,067 | | — | | — | | 8,576 | |
| | — | | 164 | | — | | 6 | | 1,577 | | 507 | | 17,391 | | 10 | | — | | 19,656 | |
| Total subsidiaries and equity-accounted entities (bp share) | | | | | | | |
| At 1 January | | | | | | | | | | | |
| Developed | | 439 | | 107 | | 6,270 | | — | | 3,375 | | 1,704 | | 7,798 | | 3,610 | | 2,630 | | 25,934 | |
| Undeveloped | | 343 | | 55 | | 5,056 | | 4 | | 3,519 | | 1,210 | | 8,719 | | 3,221 | | 1,179 | | 23,305 | |
| | 782 | | 161 | | 11,326 | | 4 | | 6,894 | | 2,914 | | 16,517 | | 6,832 | | 3,809 | | 49,239 | |
| At 31 December | | | | | | | | | | | |
| Developed | | 493 | | 108 | | 6,330 | | — | | 3,323 | | 1,670 | | 9,324 | | 3,677 | | 2,256 | | 27,181 | |
| Undeveloped | | 207 | | 56 | | 2,127 | | 6 | | 2,682 | | 742 | | 8,067 | | 3,401 | | 1,132 | | 18,421 | |
| | 700 | | 164 | | 8,458 | | 6 | | 6,004 | | 2,412 | | 17,391 | | 7,078 | | 3,389 | | 45,601 | |
a Proved reserves exclude royalties due to others, whether payable in cash or in kind, where the royalty owner has a direct interest in the underlying production and the option and ability to make lifting and sales arrangements independently.
b Because of rounding, some totals may not exactly agree with the sum of their component parts.
c Includes 3,054 billion cubic feet of natural gas associated with Assets Held for Sale in the USA.
d Includes 188 billion cubic feet of natural gas consumed in operations, 146 billion cubic feet in subsidiaries, 42 billion cubic feet in equity-accounted entities.
e Includes 1,330 billion cubic feet of natural gas in respect of the 30% non-controlling interest in BP Trinidad and Tobago LLC.
f Volumes of equity-accounted entities include volumes of equity-accounted investments of those entities.
g Includes 1,433 billion cubic feet of natural gas in respect of the 9.72% non-controlling interest in Rosneft including 569 billion cubic feet held through bp’s interests in Russia other than Rosneft.
h Total proved gas reserves held as part of our equity interest in Rosneft is 14,705 billion cubic feet, comprising 28 billion cubic feet in Venezuela, 10 billion cubic feet in Vietnam, 171 billion cubic feet in Egypt and 14,495 billion cubic feet in Russia.
| | | | | | | | | | | | | | |
274 | | bp Annual Report and Form 20-F 2021 | | |
Movements in estimated net proved reserves – continued
| | | | | | | | | | | | | | | | | | | | | | | | | | | | | | | | | | | |
| | | | | | | | | million barrels of oil equivalentc |
Total hydrocarbonsa b | | | | | | | | | | 2019 |
| | Europe | North
America | South
America | Africa | Asia | Australasia | Total |
| | UK | Rest of
Europe | USd e | Rest of
North
America | | | Russia | Rest of
Asia | | |
| Subsidiaries | | | | | | | | | | | |
| At 1 January | | | | | | | | | | | |
| Developed | | 307 | | — | | 2,309 | | 43 | | 384 | | 464 | | — | | 1,746 | | 488 | | 5,741 | |
| Undeveloped | | 308 | | — | | 1,919 | | 190 | | 560 | | 224 | | — | | 1,037 | | 208 | | 4,447 | |
| | 615 | | — | | 4,228 | | 234 | | 944 | | 687 | | — | | 2,783 | | 696 | | 10,188 | |
| Changes attributable to | | | | | | | | | | | |
| Revisions of previous estimates | | (29) | | — | | (297) | | (8) | | (45) | | 39 | | — | | 153 | | (21) | | (208) | |
| Improved recovery | | 3 | | — | | 305 | | 1 | | — | | — | | — | | — | | — | | 309 | |
| Purchases of reserves-in-place | | — | | — | | — | | — | | — | | — | | — | | 10 | | — | | 10 | |
| Discoveries and extensions | | — | | — | | 36 | | — | | 31 | | — | | — | | 63 | | — | | 130 | |
Productionf g | | (48) | | — | | (335) | | (9) | | (131) | | (137) | | — | | (191) | | (57) | | (908) | |
| Sales of reserves-in-place | | — | | — | | (95) | | — | | — | | (49) | | — | | — | | — | | (144) | |
| | (74) | | — | | (386) | | (16) | | (146) | | (147) | | — | | 35 | | (78) | | (813) | |
At 31 Decemberh | | | | | | | | | | | |
| Developed | | 300 | | — | | 2,384 | | 40 | | 387 | | 369 | | — | | 1,707 | | 419 | | 5,604 | |
| Undeveloped | | 241 | | — | | 1,459 | | 179 | | 411 | | 171 | | — | | 1,111 | | 199 | | 3,771 | |
| | 540 | | — | | 3,842 | | 218 | | 798 | | 540 | | — | | 2,818 | | 618 | | 9,375 | |
Equity-accounted entities (bp share)i | | | | | | | | | | | |
| At 1 January | | | | | | | | | | | |
| Developed | | — | | 79 | | — | | — | | 501 | | 76 | | 4,638 | | 2 | | — | | 5,296 | |
| Undeveloped | | — | | 113 | | — | | 20 | | 336 | | 25 | | 3,968 | | 1 | | — | | 4,462 | |
| | — | | 192 | | — | | 20 | | 837 | | 101 | | 8,605 | | 3 | | — | | 9,757 | |
| Changes attributable to | | | | | | | | | | | |
| Revisions of previous estimates | | — | | 4 | | — | | 1 | | (31) | | 13 | | 282 | | — | | — | | 269 | |
| Improved recovery | | — | | 7 | | — | | — | | — | | — | | — | | — | | — | | 7 | |
| Purchases of reserves-in-place | | — | | — | | — | | — | | — | | — | | 7 | | — | | — | | 7 | |
| Discoveries and extensions | | — | | — | | — | | — | | 64 | | — | | 369 | | — | | — | | 434 | |
Productionf | | — | | (17) | | — | | — | | (47) | | (13) | | (424) | | (1) | | — | | (503) | |
| Sales of reserves-in-place | | — | | — | | — | | — | | — | | — | | (6) | | — | | — | | (6) | |
| | — | | (6) | | — | | 1 | | (14) | | — | | 229 | | (1) | | — | | 208 | |
At 31 Decemberj k | | | | | | | | | | | |
| Developed | | — | | 139 | | — | | — | | 488 | | 100 | | 4,856 | | 2 | | — | | 5,585 | |
| Undeveloped | | — | | 47 | | — | | 21 | | 334 | | — | | 3,978 | | — | | — | | 4,381 | |
| | — | | 186 | | — | | 21 | | 822 | | 100 | | 8,834 | | 2 | | — | | 9,965 | |
| Total subsidiaries and equity-accounted entities (bp share) | | | | | | | |
| At 1 January | | | | | | | | | | | |
| Developed | | 307 | | 79 | | 2,309 | | 44 | | 885 | | 539 | | 4,638 | | 1,749 | | 488 | | 11,037 | |
| Undeveloped | | 308 | | 113 | | 1,919 | | 210 | | 896 | | 249 | | 3,968 | | 1,037 | | 208 | | 8,908 | |
| | 615 | | 192 | | 4,228 | | 253 | | 1,781 | | 788 | | 8,605 | | 2,786 | | 696 | | 19,945 | |
| At 31 December | | | | | | | | | | | |
| Developed | | 300 | | 139 | | 2,384 | | 40 | | 875 | | 469 | | 4,856 | | 1,708 | | 419 | | 11,189 | |
| Undeveloped | | 241 | | 47 | | 1,459 | | 199 | | 746 | | 171 | | 3,978 | | 1,112 | | 199 | | 8,152 | |
| | 540 | | 186 | | 3,842 | | 239 | | 1,621 | | 640 | | 8,834 | | 2,820 | | 618 | | 19,341 | |
a Proved reserves exclude royalties due to others, whether payable in cash or in kind, where the royalty owner has a direct interest in the underlying production and the option and ability to make lifting and sales arrangements independently.
b Because of rounding, some totals may not exactly agree with the sum of their component parts.
c 5.8 billion cubic feet of natural gas = 1 million barrels of oil equivalent.
d Proved reserves in the Prudhoe Bay field in Alaska include an estimated 4.5 million barrels of oil equivalent upon which a net profits royalty will be payable, over the life of the field under the terms of the BP Prudhoe Bay Royalty Trust.
e Includes 982 million barrels of oil equivalent associated with Assets Held for Sale in the USA.
f Excludes NGLs from processing plants in which an interest is held of less than 1 thousand barrels per day for subsidiaries and 3 thousand barrels per day for equity-accounted entities.
g Includes 32 million barrels of oil equivalent of natural gas consumed in operations, 25 million barrels of oil equivalent in subsidiaries, 7 million barrels of oil equivalent in equity-accounted entities.
h Includes 240 million barrels of oil equivalent in respect of the 30% non-controlling interest in BP Trinidad and Tobago LLC.
i Volumes of equity-accounted entities include volumes of equity-accounted investments of those entities.
j Includes 603 million barrels of oil equivalent in respect of the non-controlling interest in Rosneft, including 124 mmboe held through bp’s interests in Russia other than Rosneft.
k Total proved reserves held as part of our equity interest in Rosneft is 8,281 million barrels of oil equivalent, comprising less than 1 million barrels of oil equivalent in Iraq and Canada, 40 million barrels of oil equivalent in Venezuela, 2 million barrels of oil equivalent in Vietnam, 30 million barrels of oil equivalent in Egypt and 8,208 million barrels of oil equivalent in Russia.
| | | | | | | | | | | | | | |
| | bp Annual Report and Form 20-F 2021 | | 275 |
Standardized measure of discounted future net cash flows and changes therein relating to proved oil and gas reserves
The following tables set out the standardized measure of discounted future net cash flows, and changes therein, relating to crude oil and natural gas production from the group’s estimated proved reserves. This information is prepared in compliance with FASB Oil and Gas Disclosures requirements.
Future net cash flows have been prepared on the basis of certain assumptions which may or may not be realized. These include the timing of future production, the estimation of crude oil and natural gas reserves and the application of average crude oil and natural gas prices and exchange rates from the previous 12 months. Furthermore, both proved reserves estimates and production forecasts are subject to revision as further technical information becomes available and economic conditions change. bp cautions against relying on the information presented because of the highly arbitrary nature of the assumptions on which it is based and its lack of comparability with the historical cost information presented in the financial statements.
| | | | | | | | | | | | | | | | | | | | | | | | | | | | | | | | | | | |
| | | | | | | | | | | $ million |
| | | | | | | | | | | 2021 |
| | Europe | North
America | South
America | Africa | Asia | Australasia | Total |
| | UK | Rest of
Europe | US | Rest of
North
America | | | Russia | Rest of
Asia | | |
| At 31 December | | | | | | | | | | | |
| Subsidiaries | | | | | | | | | | | |
Future cash inflowsa | | 25,600 | | — | | 108,600 | | 8,400 | | 10,300 | | 17,100 | | — | | 126,800 | | 20,400 | | 317,200 | |
Future production costb | | 13,400 | | — | | 33,900 | | 3,700 | | 4,300 | | 4,800 | | — | | 46,100 | | 6,400 | | 112,600 | |
Future development costb | | 1,100 | | — | | 12,600 | | 1,100 | | 1,300 | | 1,100 | | — | | 12,400 | | 2,100 | | 31,700 | |
Future taxationc | | 4,300 | | — | | 10,100 | | 500 | | 1,400 | | 2,900 | | — | | 44,100 | | 4,100 | | 67,400 | |
| Future net cash flows | | 6,800 | | — | | 52,000 | | 3,100 | | 3,300 | | 8,300 | | — | | 24,200 | | 7,800 | | 105,500 | |
10% annual discountd | | 2,100 | | — | | 21,600 | | 1,700 | | 600 | | 1,400 | | — | | 8,300 | | 2,900 | | 38,600 | |
Standardized measure of discounted future net cash flowse | | 4,700 | | — | | 30,400 | | 1,400 | | 2,700 | | 6,900 | | — | | 15,900 | | 4,900 | | 66,900 | |
Equity-accounted entities (bp share)f | | | | | | | | | | | |
Future cash inflowsa | | — | | 10,500 | | — | | — | | 40,100 | | — | | 370,000 | | — | | — | | 420,600 | |
Future production costb | | — | | 3,400 | | — | | — | | 16,600 | | — | | 254,000 | | — | | — | | 274,000 | |
Future development costb | | — | | 400 | | — | | — | | 3,900 | | — | | 24,300 | | — | | — | | 28,600 | |
Future taxationc | | — | | 5,100 | | — | | — | | 6,100 | | — | | 15,600 | | — | | — | | 26,800 | |
| Future net cash flows | | — | | 1,600 | | — | | — | | 13,500 | | — | | 76,100 | | — | | — | | 91,200 | |
10% annual discountd | | — | | 400 | | — | | — | | 7,800 | | — | | 45,200 | | — | | — | | 53,400 | |
Standardized measure of discounted future net cash flowsg h | | — | | 1,200 | | — | | — | | 5,700 | | — | | 30,900 | | — | | — | | 37,800 | |
| Total subsidiaries and equity-accounted entities |
Standardized measure of discounted future net cash flowsi | | 4,700 | | 1,200 | | 30,400 | | 1,400 | | 8,400 | | 6,900 | | 30,900 | | 15,900 | | 4,900 | | 104,700 | |
The following are the principal sources of change in the standardized measure of discounted future net cash flows:
| | | | | | | | | | | | | | |
| | | | $ million |
| | Subsidiaries | Equity-accounted
entities (bp share) | Total subsidiaries and
equity-accounted
entities |
| Sales and transfers of oil and gas produced, net of production costs | | (12,200) | | (7,700) | | (19,900) | |
| Development costs for the current year as estimated in previous year | | 5,800 | | 3,600 | | 9,400 | |
| Extensions, discoveries and improved recovery, less related costs | | 1,700 | | 2,400 | | 4,100 | |
| Net changes in prices and production cost | | 71,900 | | 29,700 | | 101,600 | |
| Revisions of previous reserves estimates | | (8,800) | | 1,000 | | (7,800) | |
| Net change in taxation | | (17,900) | | (7,200) | | (25,100) | |
| Future development costs | | (3,200) | | (5,300) | | (8,500) | |
| Net change in purchase and sales of reserves-in-place | | (3,100) | | (600) | | (3,700) | |
| Addition of 10% annual discount | | 3,000 | | 2,000 | | 5,000 | |
Total change in the standardized measure during the yearj | | 37,200 | | 17,900 | | 55,100 | |
a The marker prices used were Brent $69.23/bbl, Henry Hub $3.61/mmBtu.
b Production costs, which include production taxes, and development costs relating to future production of proved reserves are based on the continuation of existing economic conditions. Future decommissioning costs are included.
c Taxation is computed with reference to appropriate year-end statutory corporate income tax rates.
d Future net cash flows from oil and natural gas production are discounted at 10% regardless of the group assessment of the risk associated with its producing activities.
e Non-controlling interests in BP Trinidad and Tobago LLC amounted to $820 million.
f The standardized measure of discounted future net cash flows of equity-accounted entities includes standardized measure of discounted future net cash flows of equity-accounted investments of those entities.
g Non-controlling interests in Rosneft amounted to $2,422 million in Russia. See Note 37 Events after the reporting period.
h No equity-accounted future cash flows in Africa because proved reserves are received as a result of contractual arrangements, with no associated costs.
i Includes future net cash flows for assets held for sale at 31 December 2021.
j Total change in the standardized measure during the year includes the effect of exchange rate movements. Exchange rate effects arising from the translation of our share of Rosneft changes to US dollars are included within ‘Net changes in prices and production cost’.
| | | | | | | | | | | | | | |
276 | | bp Annual Report and Form 20-F 2021 | | |
Standardized measure of discounted future net cash flows and changes therein relating to proved oil and gas reserves – continued
| | | | | | | | | | | | | | | | | | | | | | | | | | | | | | | | | | | |
| | | | | | | | | | | $ million |
| | | | | | | | | | | 2020 |
| | Europe | North
America | South
America | Africa | Asia | Australasia | Total |
| | UK | Rest of
Europe | US | Rest of
North
America | | | Russia | Rest of
Asia | | |
| At 31 December | | | | | | | | | | | |
| Subsidiaries | | | | | | | | | | | |
Future cash inflowsa | | 13,900 | | — | | 64,400 | | 4,100 | | 6,700 | | 12,600 | | — | | 93,500 | | 15,900 | | 211,100 | |
Future production costb | | 10,000 | | — | | 28,200 | | 3,400 | | 3,600 | | 4,200 | | — | | 45,300 | | 5,400 | | 100,100 | |
Future development costb | | 800 | | — | | 12,700 | | 1,200 | | 1,700 | | 1,100 | | — | | 13,300 | | 1,900 | | 32,700 | |
Future taxationc | | 1,200 | | — | | 1,100 | | — | | 500 | | 1,800 | | — | | 26,100 | | 2,600 | | 33,300 | |
| Future net cash flows | | 1,900 | | — | | 22,400 | | (500) | | 900 | | 5,500 | | — | | 8,800 | | 6,000 | | 45,000 | |
10% annual discountd | | 500 | | — | | 9,200 | | (200) | | 200 | | 1,100 | | — | | 2,000 | | 2,500 | | 15,300 | |
Standardized measure of discounted future net cash flowse f | | 1,400 | | — | | 13,200 | | (300) | | 700 | | 4,400 | | — | | 6,800 | | 3,500 | | 29,700 | |
Equity-accounted entities (bp share)g | | | | | | | | |
Future cash inflowsa | | — | | 6,300 | | — | | — | | 25,100 | | — | | 214,800 | | — | | — | | 246,200 | |
Future production costb | | — | | 3,100 | | — | | — | | 13,000 | | — | | 145,700 | | — | | — | | 161,800 | |
Future development costb | | — | | 500 | | — | | — | | 3,300 | | — | | 20,800 | | — | | — | | 24,600 | |
Future taxationc | | — | | 2,200 | | — | | — | | 1,700 | | — | | 8,000 | | — | | — | | 11,900 | |
| Future net cash flows | | — | | 500 | | — | | — | | 7,100 | | — | | 40,300 | | — | | — | | 47,900 | |
10% annual discountd | | — | | 100 | | — | | — | | 4,400 | | — | | 23,500 | | — | | — | | 28,000 | |
Standardized measure of discounted future net cash flowsh i | | — | | 400 | | — | | — | | 2,700 | | — | | 16,800 | | — | | — | | 19,900 | |
| Total subsidiaries and equity-accounted entities | | | | | | | |
Standardized measure of discounted future net cash flowsj | | 1,400 | | 400 | | 13,200 | | (300) | | 3,400 | | 4,400 | | 16,800 | | 6,800 | | 3,500 | | 49,600 | |
The following are the principal sources of change in the standardized measure of discounted future net cash flows:
| | | | | | | | | | | | | | |
| | | | $ million |
| | Subsidiaries | Equity-accounted
entities (bp share) | Total subsidiaries and equity-accounted entities |
| Sales and transfers of oil and gas produced, net of production costs | | (21,200) | | (6,000) | | (27,200) | |
| Development costs for the current year as estimated in previous year | | 8,700 | | 4,100 | | 12,800 | |
| Extensions, discoveries and improved recovery, less related costs | | 1,100 | | 1,400 | | 2,500 | |
| Net changes in prices and production cost | | (51,600) | | (19,200) | | (70,800) | |
| Revisions of previous reserves estimates | | 6,900 | | 400 | | 7,300 | |
| Net change in taxation | | 22,900 | | 4,600 | | 27,500 | |
| Future development costs | | 100 | | (2,700) | | (2,600) | |
| Net change in purchase and sales of reserves-in-place | | (6,200) | | — | | (6,200) | |
| Addition of 10% annual discount | | 6,300 | | 3,400 | | 9,700 | |
Total change in the standardized measure during the yeark | | (33,000) | | (14,000) | | (47,000) | |
a The marker prices used were Brent $41.31/bbl, Henry Hub $1.94/mmBtu.
b Production costs, which include production taxes, and development costs relating to future production of proved reserves are based on the continuation of existing economic conditions. Future decommissioning costs are included.
c Taxation is computed with reference to appropriate year-end statutory corporate income tax rates.
d Future net cash flows from oil and natural gas production are discounted at 10% regardless of the group assessment of the risk associated with its producing activities.
e In certain situations, revenues and costs are included in the standardized measure of discounted future net cash flows valuation and excluded from the determination of proved reserves and vice versa. This can result in the standardized measure of discounted future net cash flows being negative.
f Non-controlling interests in BP Trinidad and Tobago LLC amounted to $200 million.
g The standardized measure of discounted future net cash flows of equity-accounted entities includes standardized measure of discounted future net cash flows of equity-accounted investments of those entities.
h Non-controlling interests in Rosneft amounted to $1,600 million in Russia.
i No equity-accounted future cash flows in Africa because proved reserves are received as a result of contractual arrangements, with no associated costs.
i Includes future net cash flows for assets held for sale at 31 December 2020.
k Total change in the standardized measure during the year includes the effect of exchange rate movements. Exchange rate effects arising from the translation of our share of Rosneft changes to US dollars are included within ‘Net changes in prices and production cost’.
| | | | | | | | | | | | | | |
| | bp Annual Report and Form 20-F 2021 | | 277 |
Standardized measure of discounted future net cash flows and changes therein relating to proved oil and gas reserves – continued
| | | | | | | | | | | | | | | | | | | | | | | | | | | | | | | | | | | |
| | | | | | | | | | | $ million |
| | | | | | | | | | | 2019 |
| | Europe | North
America | South
America | Africa | Asia | Australasia | Total |
| | UK | Rest of
Europe | US | Rest of
North
America | | | Russia | Rest of
Asia | | |
| At 31 December | | | | | | | | | | | |
| Subsidiaries | | | | | | | | | | | |
Future cash inflowsa | | 28,600 | | — | | 135,900 | | 7,400 | | 11,500 | | 21,200 | | — | | 135,800 | | 24,000 | | 364,400 | |
Future production costb | | 13,700 | | — | | 59,200 | | 3,400 | | 5,700 | | 6,700 | | — | | 53,200 | | 6,100 | | 148,000 | |
Future development costb | | 1,700 | | — | | 16,400 | | 1,200 | | 2,000 | | 1,300 | | — | | 16,700 | | 2,700 | | 42,000 | |
Future taxationc | | 5,200 | | — | | 8,700 | | 200 | | 1,300 | | 3,300 | | — | | 46,000 | | 5,300 | | 70,000 | |
| Future net cash flows | | 8,000 | | — | | 51,600 | | 2,600 | | 2,500 | | 9,900 | | — | | 19,900 | | 9,900 | | 104,400 | |
10% annual discountd | | 2,700 | | — | | 23,100 | | 1,400 | | 600 | | 2,300 | | — | | 7,200 | | 4,400 | | 41,700 | |
Standardized measure of discounted future net cash flowse f | | 5,300 | | — | | 28,500 | | 1,200 | | 1,900 | | 7,600 | | — | | 12,700 | | 5,500 | | 62,700 | |
Equity-accounted entities (bp share)g | | | | | | | | |
Future cash inflowsa | | — | | 10,300 | | — | | — | | 36,800 | | — | | 322,000 | | — | | — | | 369,100 | |
Future production costb | | — | | 3,500 | | — | | — | | 14,900 | | — | | 222,600 | | — | | — | | 241,000 | |
Future development costb | | — | | 700 | | — | | — | | 3,900 | | — | | 21,800 | | — | | — | | 26,400 | |
Future taxationc | | — | | 4,700 | | — | | — | | 4,100 | | — | | 13,300 | | — | | — | | 22,100 | |
| Future net cash flows | | — | | 1,400 | | — | | — | | 13,900 | | — | | 64,300 | | — | | — | | 79,600 | |
10% annual discountd | | — | | 400 | | — | | — | | 8,200 | | — | | 37,100 | | — | | — | | 45,700 | |
Standardized measure of discounted future net cash flowsh i | | — | | 1,000 | | — | | — | | 5,700 | | — | | 27,200 | | — | | — | | 33,900 | |
| Total subsidiaries and equity-accounted entities | | | | | | | |
Standardized measure of discounted future net cash flowsj | | 5,300 | | 1,000 | | 28,500 | | 1,200 | | 7,600 | | 7,600 | | 27,200 | | 12,700 | | 5,500 | | 96,600 | |
The following are the principal sources of change in the standardized measure of discounted future net cash flows:
| | | | | | | | | | | | | | |
| | | | $ million |
| | Subsidiaries | Equity-accounted
entities (bp share) | Total subsidiaries and
equity-accounted
entities |
| Sales and transfers of oil and gas produced, net of production costs | | (27,400) | | (8,400) | | (35,800) | |
| Development costs for the current year as estimated in previous year | | 9,200 | | 4,100 | | 13,300 | |
| Extensions, discoveries and improved recovery, less related costs | | 3,800 | | 2,600 | | 6,400 | |
| Net changes in prices and production cost | | (28,100) | | (8,200) | | (36,300) | |
| Revisions of previous reserves estimates | | 300 | | 1,100 | | 1,400 | |
| Net change in taxation | | 16,600 | | 2,400 | | 19,000 | |
| Future development costs | | (1,500) | | (4,300) | | (5,800) | |
| Net change in purchase and sales of reserves-in-place | | (1,400) | | — | | (1,400) | |
| Addition of 10% annual discount | | 8,300 | | 4,100 | | 12,400 | |
Total change in the standardized measure during the yeark | | (20,200) | | (6,600) | | (26,800) | |
a The marker prices used were Brent $62.74/bbl, Henry Hub $2.58/mmBtu.
b Production costs, which include production taxes, and development costs relating to future production of proved reserves are based on the continuation of existing economic conditions. Future decommissioning costs are included.
c Taxation is computed with reference to appropriate year-end statutory corporate income tax rates.
d Future net cash flows from oil and natural gas production are discounted at 10% regardless of the group assessment of the risk associated with its producing activities.
e In certain situations, revenues and costs are included in the standardized measure of discounted future net cash flows valuation and excluded from the determination of proved reserves and vice versa. This can result in the standardized measure of discounted future net cash flows being negative.
f Non-controlling interests in BP Trinidad and Tobago LLC amounted to $600 million.
g The standardized measure of discounted future net cash flows of equity-accounted entities includes standardized measure of discounted future net cash flows of equity-accounted investments of those entities.
h Non-controlling interests in Rosneft amounted to $2,100 million in Russia.
i No equity-accounted future cash flows in Africa because proved reserves are received as a result of contractual arrangements, with no associated costs.
j Includes future net cash flows for assets held for sale at 31 December 2019.
k Total change in the standardized measure during the year includes the effect of exchange rate movements. Exchange rate effects arising from the translation of our share of Rosneft changes to US dollars are included within ‘Net changes in prices and production cost’.
| | | | | | | | | | | | | | |
278 | | bp Annual Report and Form 20-F 2021 | | |
Operational and statistical information
The following tables present operational and statistical information related to production, drilling, productive wells and acreage. Figures include amounts attributable to assets held for sale.
Crude oil and natural gas production
The following table shows crude oil, natural gas liquids and natural gas production for the years ended 31 December 2021, 2020 and 2019.
Production for the yeara b
| | | | | | | | | | | | | | | | | | | | | | | | | | | | | | | | | | | |
| | Europe | North
America | South
America | Africa | Asia | Australasia | Total |
| | UK | Rest of
Europe | US | Rest of
North
America | | | Russiac | Rest of
Asia | | |
Subsidiariesd | | | | | | | | | | | |
Crude oile | | | | | | | | | | thousand barrels per day |
| 2021 | | 82 | | — | | 308 | | 25 | | 5 | | 110 | | — | | 318 | | 13 | | 860 | |
| 2020 | | 96 | | — | | 345 | | 22 | | 7 | | 123 | | — | | 375 | | 15 | | 983 | |
| 2019 | | 100 | | — | | 400 | | 24 | | 7 | | 156 | | — | | 343 | | 17 | | 1,046 | |
| Natural gas liquids | | | thousand barrels per day |
| 2021 | | 5 | | — | | 70 | | — | | 4 | | 7 | | — | | — | | 2 | | 88 | |
| 2020 | | 5 | | — | | 79 | | — | | 7 | | 8 | | — | | — | | 2 | | 101 | |
| 2019 | | 3 | | — | | 81 | | — | | 9 | | 8 | | — | | — | | 2 | | 104 | |
Natural gasf | | | million cubic feet per day |
| 2021 | | 236 | | — | | 1,197 | | 2 | | 1,260 | | 1,332 | | — | | 1,279 | | 760 | | 6,067 | |
| 2020 | | 221 | | — | | 1,561 | | 2 | | 1,695 | | 923 | | — | | 966 | | 795 | | 6,163 | |
| 2019 | | 129 | | — | | 2,358 | | 2 | | 1,977 | | 1,138 | | — | | 976 | | 786 | | 7,366 | |
| Equity-accounted entities (bp share) | | | | | | | | | | | |
Crude oile | | | thousand barrels per day |
| 2021 | | — | | 48 | | — | | — | | 55 | | 1 | | 887 | | — | | — | | 991 | |
| 2020 | | — | | 50 | | — | | — | | 54 | | 1 | | 903 | | — | | — | | 1,009 | |
| 2019 | | — | | 35 | | — | | — | | 56 | | 1 | | 955 | | — | | — | | 1,047 | |
| Natural gas liquids | | | thousand barrels per day |
| 2021 | | — | | 3 | | — | | — | | 1 | | 6 | | 3 | | — | | — | | 12 | |
| 2020 | | — | | 3 | | — | | — | | 1 | | 7 | | 3 | | — | | — | | 14 | |
| 2019 | | — | | 2 | | — | | — | | 1 | | 8 | | 3 | | — | | — | | 14 | |
Natural gasf | | | million cubic feet per day |
| 2021 | | — | | 66 | | — | | — | | 284 | | 77 | | 1,423 | | — | | — | | 1,849 | |
| 2020 | | — | | 61 | | — | | — | | 286 | | 92 | | 1,327 | | — | | — | | 1,765 | |
| 2019 | | — | | 56 | | — | | — | | 314 | | 87 | | 1,279 | | — | | — | | 1,736 | |
a Production excludes royalties due to others, whether payable in cash or in kind, where the royalty owner has a direct interest in the underlying production and the option and ability to make lifting and sales arrangements independently.
b Because of rounding, some totals may not exactly agree with the sum of their component parts.
c Amounts reported for Russia include bp’s share of Rosneft worldwide activities, including insignificant amounts outside Russia.
d All of the oil and liquid production from Canada is bitumen.
e Crude oil includes condensate.
f Natural gas production excludes gas consumed in operations.
| | | | | | | | | | | | | | |
| | bp Annual Report and Form 20-F 2021 | | 279 |
Operational and statistical information – continued
Productive oil and gas wells and acreage
The following tables show the number of gross and net productive oil and natural gas wells and total gross and net developed and undeveloped oil and natural gas acreage in which the group and its equity-accounted entities had interests as at 31 December 2021. A ‘gross’ well or acre is one in which a whole or fractional working interest is owned, while the number of ‘net’ wells or acres is the sum of the whole or fractional working interests in gross wells or acres. Productive wells are producing wells and wells capable of production. Developed acreage is the acreage within the boundary of a field, on which development wells have been drilled, which could produce the reserves; while undeveloped acres are those on which wells have not been drilled or completed to a point that would permit the production of commercial quantities, whether or not such acres contain proved reserves.
| | | | | | | | | | | | | | | | | | | | | | | | | | | | | | | | | | | | | | |
| | | Europe | North
America | South
America | Africa | Asia | Australasia | Totalb |
| | | UK | Rest of
Europe | US | Rest of
North
America | | | Russiaa | Rest of
Asia | | |
| Number of productive wells at 31 December 2021 | | | | | | | |
Oil wellsc | – gross | | 106 | | 92 | | 1,441 | | 178 | | 5,125 | | 297 | | 58,704 | | 2,275 | | 12 | | 68,230 | |
| – net | | 59 | | 26 | | 791 | | 50 | | 2,526 | | 63 | | 13,030 | | 506 | | 2 | | 17,053 | |
Gas wellsd | – gross | | 35 | | 3 | | 4,305 | | 237 | | 1,135 | | 233 | | 435 | | 149 | | 86 | | 6,618 | |
| – net | | 6 | | 1 | | 2,365 | | 117 | | 413 | | 97 | | 99 | | 54 | | 17 | | 3,171 | |
| Oil and natural gas acreage at 31 December 2021 | | | | | | thousands of acres |
| Developed | – gross | | 68 | | 64 | | 3,167 | | 147 | | 1,293 | | 1,025 | | 7,605 | | 1,313 | | 181 | | 14,863 | |
| – net | | 38 | | 18 | | 1,869 | | 64 | | 360 | | 379 | | 1,489 | | 269 | | 44 | | 4,529 | |
Undevelopede | – gross | | 2,154 | | 140 | | 4,241 | | 15,595 | | 21,565 | | 30,997 | | 436,104 | | 10,306 | | 7,491 | | 528,592 | |
| – net | | 1,171 | | 39 | | 3,248 | | 8,539 | | 7,833 | | 17,839 | | 91,408 | | 2,543 | | 3,234 | | 135,854 | |
a Based on information received from Rosneft as at 31 December 2021.
b Because of rounding, some totals may not exactly agree with the sum of their component parts.
c Includes approximately 5821 gross (1261 net) multiple completion wells (more than one formation producing into the same well bore).
d Includes approximately 161 gross (135 net) multiple completion wells. If one of the multiple completions in a well is an oil completion, the well is classified as an oil well.
e Undeveloped acreage includes leases and concessions.
Net oil and gas wells completed or abandoned
The following table shows the number of net productive and dry exploratory and development oil and natural gas wells completed or abandoned in the years indicated by the group and its equity-accounted entities. Productive wells include wells in which hydrocarbons were encountered and the drilling or completion of which, in the case of exploratory wells, has been suspended pending further drilling or evaluation. A dry well is one found to be incapable of producing hydrocarbons in sufficient quantities to justify completion.
| | | | | | | | | | | | | | | | | | | | | | | | | | | | | | | | | | | |
| | Europe | North
America | South
America | Africa | Asia | Australasia | Totala |
| | UK | Rest of
Europe | US | Rest of
North
America | | | Russia | Rest of
Asia | | |
| 2021 | | | | | | | | | | | |
| Exploratory | | | | | | | | | | | |
Productive | | — | | — | | 0.2 | | — | | 1.1 | | 1.4 | | 16.3 | | 1.2 | | — | | 20.2 | |
Dry | | — | | — | | 0.6 | | — | | — | | 1.4 | | — | | 0.3 | | 0.4 | | 2.7 | |
| Development | | | | | | | | | | | |
Productive | | 2.4 | | 0.6 | | 107.2 | | 0.8 | | 69.4 | | 2.5 | | 285.2 | | 27.3 | | 1.3 | | 496.6 | |
Dry | | — | | 0.1 | | 7.3 | | — | | 0.7 | | — | | — | | 0.1 | | — | | 8.2 | |
| 2020 | | | | | | | | | | | |
| Exploratory | | | | | | | | | | | |
Productive | | — | | — | | 1.1 | | 0.8 | | — | | 0.6 | | 14.3 | | 0.4 | | — | | 17.2 | |
Dry | | — | | — | | 1.8 | | — | | — | | — | | — | | 0.2 | | — | | 2.0 | |
| Development | | | | | | | | | | | |
Productive | | 5.3 | | 3.1 | | 114.6 | | 0.4 | | 61.7 | | 4.4 | | 199.1 | | 40.3 | | 2.0 | | 430.9 | |
Dry | | — | | — | | 3.0 | | — | | 1.0 | | — | | — | | 0.6 | | — | | 4.6 | |
| 2019 | | | | | | | | | | | |
| Exploratory | | | | | | | | | | | |
Productive | | — | | 0.2 | | 0.8 | | 0.8 | | 3.5 | | 2.3 | | 11.6 | | 5.2 | | — | | 24.4 | |
Dry | | 1.0 | | 0.3 | | 1.6 | | 0.5 | | 1.1 | | 0.3 | | 0.5 | | 0.4 | | 0.2 | | 5.9 | |
| Development | | | | | | | | | | | |
Productive | | 1.7 | | 2.4 | | 193.0 | | 0.2 | | 110.7 | | 6.0 | | 230.8 | | 49.6 | | 0.4 | | 594.8 | |
Dry | | — | | 0.3 | | 10.0 | | — | | 0.6 | | — | | — | | 1.0 | | — | | 11.9 | |
a Because of rounding, some totals may not exactly agree with the sum of their component parts.
| | | | | | | | | | | | | | |
280 | | bp Annual Report and Form 20-F 2021 | | |
Operational and statistical information – continued
Drilling and production activities in progress
The following table shows the number of exploratory and development oil and natural gas wells in the process of being drilled by the group and its equity-accounted entities as of 31 December 2021. Suspended development wells and long-term suspended exploratory wells are also included in the table.
| | | | | | | | | | | | | | | | | | | | | | | | | | | | | | | | | | | |
| | Europe | North
America | South
America | Africa | Asia | Australasia | Totala |
| | UK | Rest of
Europe | US | Rest of
North
America | | | Russia | Rest of
Asia | | |
| At 31 December 2021 | | | | | | | | | | | |
| Exploratory | | | | | | | | | | | |
Gross | | — | | — | | 3.0 | | 1.0 | | — | | — | | — | | 6.0 | | — | | 10.0 | |
Net | | — | | — | | 2.3 | | 0.4 | | — | | — | | — | | 0.9 | | — | | 3.6 | |
| Development | | | | | | | | | | | |
Gross | | 3.0 | | 3.5 | | 181.0 | | 6.0 | | 21.0 | | 15.0 | | — | | 160.0 | | 3.0 | | 392.5 | |
Net | | 1.5 | | 1.0 | | 106.7 | | 3.0 | | 5.6 | | 3.6 | | — | | 22.8 | | 1.0 | | 145.0 | |
a Because of rounding, some totals may not exactly agree with the sum of their component parts.
| | | | | | | | | | | | | | |
| | bp Annual Report and Form 20-F 2021 | | 281 |
Pages 282-336 have been removed as they do not form part of bp's Annual Report on Form 20-F as filed with the SEC.
| | | | | | | | | | | | | | |
282 | | bp Annual Report and Form 20-F 2021 | | |
| | | | | | | | | | | | | | |
| | | | |
| Additional disclosures | | |
| | | | |
| | | |
| | | |
| | | |
| | | |
| | | |
| | | |
| | | |
| | | |
| | | |
| | | |
| | | |
| | | |
| | | |
| | | |
| | | |
| Principal accountant’s fees and services | | |
| | | |
| | | |
| | | |
| | | | |
| | | | |
| | | | |
| | | | |
| | | | |
| | | | |
| | | | |
| | | | |
| | | | |
| | | | |
| | | | |
| | | | |
| | | | |
| | | | |
| | | | |
| | | | |
| | | | |
| | | | |
| | | | | | | | | | | | | | |
| | bp Annual Report and Form 20-F 2021 | | 337 |
Additional information
Capital expenditure«a
| | | | | | | | | | | | | | |
| | | | $ million |
| | 2021 | 2020 | 2019 |
| Capital expenditure | | | | |
Organic capital expenditure« | | 11,779 | | 12,034 | | 15,238 | |
Inorganic capital expenditureb« | | 1,069 | | 2,021 | | 4,183 | |
| | 12,848 | | 14,055 | | 19,421 | |
| | | | |
| | | | |
| | | | |
| Capital expenditure by segment | | | | |
gas & low carbon energya | | 4,741 | | 4,608 | | 5,690 | |
| oil production & operations | | 4,838 | | 5,829 | | 10,358 | |
| customers & products | | 2,872 | | 3,315 | | 3,065 | |
| other business & corporate | | 397 | | 303 | | 308 | |
| | 12,848 | | 14,055 | | 19,421 | |
| Capital expenditure by geographical area | | | | |
| US | | 4,858 | | 4,482 | | 8,441 | |
| Non-US | | 7,990 | | 9,573 | | 10,980 | |
| | 12,848 | | 14,055 | | 19,421 | |
aComparative information for 2020 and 2019 has been restated to reflect the changes in reportable segments. For more information see Financial statements – Note 1 Basis of preparation – Change in segmentation.
b2021 includes the final payment of $712 million in respect of the strategic partnership with Equinor. 2020 includes a $500 million deposit in respect of the strategic partnership with Equinor and $1 billion relating to an investment in a 49% interest in the group's Indian fuels and mobility venture with Reliance Industries. On 31 October 2018, bp acquired from BHP Billiton Petroleum (North America) Inc. 100% of the issued share capital of Petrohawk Energy Corporation, a wholly owned subsidiary of BHP that holds a portfolio of unconventional onshore US oil and gas assets. The entire consideration payable of $10,268 million, after customary closing adjustments, was paid in instalments between July 2018 and April 2019. The amount presented as inorganic capital expenditure includes $3,480 million for 2019 relating to this transaction. 2020 and 2019 include amounts relating to the 25-year extension to our ACG production-sharing agreement« in Azerbaijan.
| | | | | | | | | | | | | | |
338 | | bp Annual Report and Form 20-F 2021 | | |
Adjusting itemsa
Adjusting items are items that bp discloses separately because it considers such disclosures to be meaningful and relevant to investors. They are items that management considers to be important to period-on-period analysis of the group's results and are disclosed in order to enable investors to better understand and evaluate the group’s reported financial performance. An analysis of adjusting items is shown in the table below.
| | | | | | | | | | | | | | |
| | | | $ million |
| | 2021 | 2020 | 2019 |
| gas & low carbon energy | | | | |
Gain on sale of businesses and fixed assetsb | | 1,034 | | — | | (1) | |
Net impairment and losses on sale of businesses and fixed assetsb | | 1,503 | | (6,220) | | (1,271) | |
| Environmental and other provisions | | — | | — | | — | |
Restructuring, integration and rationalization costsc | | (33) | | (127) | | (1) | |
Fair value accounting effectsd e« | | (7,662) | | (738) | | 714 | |
Otherf | | (237) | | (672) | | 56 | |
| | (5,395) | | (7,757) | | (503) | |
| oil production & operations | | | | |
Gain on sale of businesses and fixed assetsb | | 869 | | 360 | | 143 | |
Net impairment and losses on sale of businesses and fixed assetsb | | 776 | | (7,012) | | (6,643) | |
Environmental and other provisionsg | | (1,144) | | (2) | | (32) | |
Restructuring, integration and rationalization costsc | | (92) | | (278) | | (90) | |
Fair value accounting effectse | | — | | — | | (8) | |
Otherf h | | (200) | | (1,763) | | 14 | |
| | 209 | | (8,695) | | (6,616) | |
| customers & products | | | | |
Gain on sale of businesses and fixed assetsb | | (52) | | 2,320 | | 50 | |
Net impairment and losses on sale of businesses and fixed assetsb | | (1,097) | | (1,136) | | (122) | |
| Environmental and other provisions | | (111) | | (33) | | (78) | |
Restructuring, integration and rationalization costsc | | (11) | | (633) | | 85 | |
Fair value accounting effectse | | 436 | | (149) | | 160 | |
Otheri | | (209) | | (39) | | (12) | |
| | (1,044) | | 330 | | 83 | |
| Rosneft | | | | |
| | | | |
| | | | |
| | | | |
| | | | |
| | | | |
| Other | | (291) | | (205) | | (103) | |
| | (291) | (205) | (103) |
| other businesses and corporate | | | | |
Gain on sale of businesses and fixed assetsb | | — | | 194 | | — | |
Net impairment and losses on sale of businesses and fixed assetsb | | (59) | | (1) | | (38) | |
Environmental and other provisionsj | | (281) | | (177) | | (231) | |
Restructuring, integration and rationalization costsc | | (113) | | (258) | | 8 | |
Fair value accounting effectse | | (849) | | 675 | | — | |
| Gulf of Mexico oil spill response | | (70) | | (255) | | (319) | |
Otherk | | (22) | | 125 | | (33) | |
| | (1,394) | 303 | (613) |
| Total before interest and taxation | | (7,915) | | (16,024) | | (7,752) | |
Finance costsk l | | (782) | | (625) | | (511) | |
| Total before taxation | | (8,697) | | (16,649) | | (8,263) | |
| | | | |
| | | | |
Total taxationm | | 621 | | 4,235 | | 1,788 | |
| Total after taxation | | (8,076) | | (12,414) | | (6,475) | |
aPrior to 2021 adjusting items were reported under two different headings – non-operating items and fair value accounting effects. Comparative information for 2020 and 2019 has been restated to reflect the changes in reportable segments. For more information see Financial statements – Note 1 Basis of preparation – Change in segmentation.
bSee Financial statements – Note 3 for further information.
cRestructuring charges are classified as adjusting items where they relate to an announced major group restructuring. A major group restructuring is a restructuring programme affecting more than one of the group’s operating segments that is expected to result in charges of more than $1 billion over a defined period. 2021 and 2020 include recognized provisions for the reinvent bp restructuring costs that were formalized in 2020. The process is largely complete with the significant majority of restructuring charges booked by 30 June 2021.
dUnder IFRS bp marks-to-market the derivative financial instruments used to risk-manage LNG contracts, but does not mark-to-market the physical LNG contracts themselves, resulting in a mismatch in accounting treatment. The fair value accounting effect removes this mismatch, and the underlying result reflects how bp risk-manages its LNG contracts.
eFor further information, including the nature of fair value accounting effects reported in each segment, see page 381.
f2020 includes exploration write-offs of $673 million in gas and low carbon energy relating to fair value ascribed to certain licences as part of the accounting at the time of acquisition of gas and low carbon energy assets in India and the impairment of certain intangible assets in Mauritania and Senegal and $1,301 million in oil production & operations relating to fair value ascribed to certain licences as part of the accounting at the time of acquisition of oil production & operations assets in Brazil and the Gulf of Mexico.
g2021 includes adjustments relating to the change in discount rate on retained decommissioning provisions and the recognition of a decommissioning provision in relation to certain assets previously sold to a third party where the decommissioning obligation transferred may revert to bp due to the financial condition of the current owner.
h2021 includes a $415 million charge relating to a remeasurement of deferred tax balances in our equity-accounted entity in Argentina following income tax rate changes partially offset by impairment reversals in equity-accounted entities.
i2021 includes amounts arising in relation to the amendment of the timing of recognition of certain customer incentives in our customers business.
jAll periods primarily reflect charges due to the annual update of environmental provisions, including asbestos-related provisions for past operations, together with updates of non-Gulf of Mexico oil spill related legal provisions.
kFrom 2021 bp is presenting temporary valuation differences associated with the group’s interest rate and foreign currency exchange risk management of finance debt as an adjusting item within finance costs. These amounts represent: (i) the impact of ineffectiveness and the amortization of cross currency basis resulting from the application of fair value hedge accounting; and (ii) the net
| | | | | | | | | | | | | | |
| | bp Annual Report and Form 20-F 2021 | | 339 |
impact of foreign currency exchange movements on finance debt and associated derivatives where hedge accounting is not applied. In 2020 these amounts were presented within production and manufacturing expenses and as an 'other' adjusting item in the other business & corporate segment. Relevant amounts in the comparative periods presented were not material.
lAll periods presented include the unwinding of discounting effects relating to Gulf of Mexico oil spill payables. 2021 and 2020 also includes the income statement impact associated with the buyback of finance debt. See Financial statements – Note 25 for further information.
m 2021 and 2020 include certain foreign exchange effects on tax as adjusting items. These amounts represent the impact of: (i) foreign exchange on deferred tax balances arising from the conversion of local currency tax base amounts into functional currency, and (ii) taxable gains and losses from the retranslation of US dollar-denominated intra-group loans to local currency. Relevant amounts in 2019 were not material.
Non-GAAP information on fair value accounting effects
The impacts of fair value accounting effects, relative to management’s internal measure of performance are set out below. Further information on fair value accounting effects is provided on page 381.
| | | | | | | | | | | | | | |
| | | | $ million |
| | 2021 | 2020 | 2019 |
| gas & low carbon energy | | | | |
| Unrecognized (gains) losses brought forward from previous period | | (485) | | 253 | | (463) | |
| Favourable (adverse) impact relative to management’s measure of performance | | (7,662) | | (738) | | 714 | |
| Exchange translation gains (losses) on fair value accounting effects | | (2) | | — | | 2 | |
| Unrecognized (gains) losses carried forward | | (8,149) | | (485) | | 253 | |
| oil production & operations | | | | |
| Unrecognized (gains) losses brought forward from previous period | | — | | — | | 8 | |
| Favourable (adverse) impact relative to management’s measure of performance | | — | | — | | (8) | |
| | | | |
| Unrecognized (gains) losses carried forward | | — | | — | | — | |
| customers & products | | | | |
| Unrecognized (gains) losses brought forward from previous period | | (45) | | 104 | | (56) | |
| Favourable (adverse) impact relative to management’s measure of performance | | 436 | | (149) | | 160 | |
| | | | |
| Unrecognized (gains) losses carried forward | | 391 | | (45) | | 104 | |
| other businesses & corporate | | | | |
| Unrecognized (gains) losses brought forward from previous period | | 675 | | — | — |
Favourable (adverse) impact relative to management’s measure of performancea | | (849) | | 675 | | — | |
| | | | |
| Unrecognized (gains) losses carried forward | | (174) | | 675 | | — | |
| Favourable (adverse) impact relative to management’s measure of performance – by region | | | | |
| gas & low carbon energy | | | | |
| US | | (92) | | 198 | | (171) | |
| Non-US | | (7,570) | | (936) | | 885 | |
| | (7,662) | | (738) | | 714 | |
| oil production & operations | | | | |
| US | | — | | — | | (8) | |
| Non-US | | — | | — | | — | |
| | — | | — | | (8) | |
| customers & products | | | | |
| US | | 105 | | 27 | | 148 | |
| Non-US | | 331 | | (176) | | 12 | |
| | 436 | | (149) | | 160 | |
| other businesses & corporate | | | | |
| US | | — | | — | | — | |
| Non-US | | (849) | | 675 | | — | |
| | (849) | | 675 | | — | |
| | (8,075) | | (212) | | 866 | |
| Taxation credit (charge) | | 862 | | (11) | | (155) | |
| | (7,213) | | (223) | | 711 | |
a From 2020 fair value accounting effects include changes in the fair value of derivatives entered into by the group to manage currency exposure and interest rate risks relating to hybrid bonds to their respective first call periods. For further information see page 381.
| | | | | | | | | | | | | | |
340 | | bp Annual Report and Form 20-F 2021 | | |
Net debt including leases
Net debt including leases« is shown in the table below.
| | | | | | | | | | | |
| | | $ million |
| At 31 December | | 2021 | 2020 |
Net debt« | | 30,613 | | 38,941 | |
| Lease liabilities | | 8,611 | | 9,262 | |
Net partner (receivable) payable for leases entered into on behalf of joint operations« | | 187 | | (7) | |
| Net debt including leases | | 39,411 | | 48,196 | |
| Total equity | | 90,439 | | 85,568 | |
Gearing including leases« | | 30.4% | 36.0% |
Surplus cash flow« components
| | | | | | | | |
| | $ million |
| | 2021 |
| Sources: | | |
| Net cash provided by operating activities | | 23,612 | |
| Cash provided from investing activities | | 7,154 | |
| Receipts relating to transactions involving non-controlling interests | | 683 | |
| | 31,449 | |
| | |
| Uses: | | |
| Lease liability payments | | (2,082) | |
| Payments on perpetual hybrid bonds | | (538) | |
Dividends paid – bp shareholders | | (4,304) | |
– non-controlling interests | | (311) | |
| Total capital expenditure | | (12,848) | |
| Net repurchase of shares relating to employee share schemes | | (500) | |
| Payments relating to transactions involving non-controlling interests | | (560) | |
| Currency translation differences relating to cash and cash equivalents | | (269) | |
| | (21,412) | |
| | | | | | | | | | | | | | |
| | bp Annual Report and Form 20-F 2021 | | 341 |
Liquidity and capital resources
Financial framework
bp has a resilient financial framework that, taken together with our strategy, creates a compelling investor proposition offering committed distributions, profitable growth and sustainable value. The framework comprises a coherent approach to capital allocation, a resilient balance sheet, a disciplined approach to investment allocation and a relentless focus on executing bp’s business plan.
bp’s approach to capital allocation leads to a clear set of priorities – funding our resilient dividend as the first priority, deleveraging the balance sheet, investment in low carbon« and convenience and mobility to advance our energy transition strategy, investment in resilient hydrocarbons to generate sustainable cash flow, and then returning surplus cash« as share buybacks. In a period of low prices, the group has the flexibility to reduce cash costs and to reduce or defer capital investment, as appropriate.
Our shareholder distribution policy reflects these priorities for the uses of cash alongside an ongoing consideration of factors, including changes in the environment, the underlying performance of the business, the outlook for the group financial framework, and other market factors which may vary quarter to quarter.
Net debt« at 31 December 2021 was $30.6 billion and is expected to reduce in line with the receipt of divestment proceeds and the growth in operating cash flow«. As at 31 December 2021 our target of $25 billion of divestment and other proceeds between the second half of 2020 and 2025 was underpinned by agreed or completed transactions of around $15.5 billion with almost $12.8 billion of proceeds received.
We expect operating cash flow to cover capital expenditure« and the dividend. Capital expenditure in 2021 was $12.8 billion, the lower end of our initial range of $13-15 billion. bp now expects capital expenditure of $14-15 billion in 2022 and continues to expect a range of $14-16 billion per annum through 2025. Looking out across 2022-25, bp's cash balancing point is expected to average around $40 per barrel (assuming an average refining marker margin of around $11 and Henry Hub gas price at $3) in 2020 real terms.
In 2021, the return on average capital employed« was 13.3%a at an average of $71 per barrel. The return on average capital employed is targeted to grow to 12-14% by 2025 at $50 to 60 per barrel in 2020 real terms, and assuming bp planning assumptions, as we continue to execute our strategy. This is supported by an expected growth on adjusted EBIDA per share compound annual growth rate« across the same period and subject to the same price and planning assumptions.
a Nearest equivalent GAAP measures: Numerator – Profit attributable to bp shareholders $7.6 billion; Denominator – Total equity $90.4 billion.
Dividends and other distributions to shareholders
The dividend is determined in US dollars, the economic currency of bp, and the dividend level is reviewed by the board each quarter. The quarterly dividend was increased from 5.25 to 5.46 cents per ordinary share per quarter in the second quarter of 2021.
The total dividend distributed to bp shareholders in 2021 was $4.3 billion (2020 $6.4 billion). This dividend was all paid in cash as shareholders no longer have the option to receive a scrip dividend in place of receiving cash.
Included in the distribution policy is a commitment that, subject to maintaining a strong investment grade credit rating, at least 60% of surplus cash will be distributed to shareholders through share buybacks. In 2021 bp executed $3.2 billion of share buybacks (2020 $0.8 billion), including fees and stamp duty. Since 1 January 2022 a further $500 million shares have been repurchased to offset the expected full year dilution from the vesting of awards under employee share schemes in 2022 and an additional $1.0 billion shares have been repurchased up to 1 March 2022, both including fees and stamp duty. On average, based on bp's current forecasts, at around $60 per barrel Brent and subject to the board's discretion each quarter, bp continues to expect to be able to deliver buybacks of around $4.0 billion per annum and have the capacity for an annual increase in the dividend per ordinary share of around 4% through to 2025.
Financing the group’s activities
The group’s principal commodities, oil and gas, are priced internationally in US dollars. Group policy has generally been to minimize economic exposure to currency movements by financing operations with US dollar debt. Where debt and hybrid bonds are issued in other currencies, they are generally swapped back to US dollars using derivative contracts, or else hedged by maintaining offsetting cash positions in the same currency. Cash balances of the group are mainly held in US dollars or swapped to US dollars and holdings are well diversified to reduce concentration risk. The group is not, therefore, exposed to significant currency risk regarding its cash or borrowings. Also see Risk factors on page 76 for further information on risks associated with prices and markets and Financial statements – Note 28.
The group’s finance debt at 31 December 2021 amounted to $61.2 billion (2020 $72.7 billion). Of the total finance debt, $5.6 billion is classified as short term at the end of 2021 (2020 $9.4 billion). See Financial statements – Note 25 for more information on the short-term balance. Net debt« was $30.6 billion at the end of 2021, a decrease of $8.3 billion from the 2020 year-end position of $38.9 billion. BP p.l.c. fully and unconditionally guarantees securities issued by BP Capital Markets p.l.c. and BP Capital Markets America Inc., which are 100%-owned finance subsidiaries of BP p.l.c.
During 2020 a group subsidiary issued perpetual subordinated hybrid bonds in EUR, GBP and USD for a USD equivalent amount of $11.9 billion. During 2021, a different group subsidiary issued perpetual subordinated hybrid capital securities of $1.0 billion to fund one of the group’s major projects. As the group has the unconditional right to avoid transfer of cash or another financial asset in relation to these hybrid bonds, they are classified as equity instruments and reported within non-controlling interest.
The ratio of finance debt to finance debt plus total equity at 31 December 2021 was 41.5% (2020 45.9%). Gearing was 25.3% at the end of 2021 (2020 31.3%). See Financial statements – Note 26 for finance debt, which is the nearest equivalent measure on an IFRS basis, and for further information on net debt.
Cash and cash equivalents of $30.7 billion at 31 December 2021 (2020 $31.1 billion) are included in net debt. We manage our cash position so that the group has adequate cover to respond to potential short-term market liquidity, short term price environment volatility and expect to maintain a robust cash position.
The group also has an undrawn committed $8 billion credit facility and undrawn committed bank facilities of $4 billion (see Financial statements – Note 28 for more information).
We believe that the group's resilient balance sheet and strong investment grade credit rating will allow the group to meet its known contractual and other obligations in both the short and long-term with the group having sufficient working capital, taking into account the amounts of undrawn borrowings facilities, access to capital markets, levels of cash and cash equivalents and its ongoing ability to generate cash through operations. This belief is subject to a degree of uncertainty that can be expected to increase looking out over time and, accordingly, that future outcomes cannot be guaranteed or predicted with certainty.
bp utilizes various arrangements in order to manage its working capital including discounting of receivables and, in the supply and trading business, the active management of supplier payment terms, inventory and collateral.
Standard & Poor’s Ratings’ long-term credit rating for BP p.l.c. is A- (stable), the Moody’s Investors Service rating is A2 (stable) and the Fitch Ratings’ long-term credit rating is A (stable).
The group’s sources of funding, its access to capital markets and maintaining a strong cash position are described in Financial statements – Note 24 and Note 28. Further information on the management of liquidity risk and credit risk, and the maturity profile and fixed/floating rate characteristics of the group’s debt are also provided in Financial statements – Note 25 and Note 28.
The information above contains forward-looking statements, which by their nature involve risk and uncertainty because they relate to events and depend on circumstances that will or may occur in the future and are outside the control of bp. You are urged to read the Cautionary statement on page 364 and
| | | | | | | | | | | | | | |
342 | | bp Annual Report and Form 20-F 2021 | | |
Risk factors on page 76, which describe the risks and uncertainties that may cause actual results and developments to differ materially from those expressed or implied by these forward-looking statements.
Off-balance sheet arrangements
At 31 December 2021, the group’s share of third-party finance debt of equity-accounted entities was $20.5 billion (2020 $19.9 billion). These amounts are not reflected in the group’s debt on the balance sheet. The group has issued third-party guarantees under which amounts outstanding, incremental to amounts recognized on the balance sheet, at 31 December 2021 were $1,407 million (2020 $1,405 million) in respect of liabilities of joint ventures« and associates« and $694 million (2020 $661 million) in respect of liabilities of other third parties. Of these amounts, $1,407 million (2020 $1,393 million) of the joint ventures and associates guarantees relate to borrowings and for other third-party guarantees, $594 million (2020 $568 million) relate to guarantees of borrowings.
Contractual obligations
The following table summarizes the group’s capital expenditure commitments for property, plant and equipment at 31 December 2021 and the proportion of that expenditure for which contracts have been placed.
| | | | | | | | | | | | | | | | | | | | |
| | | | $ million | | | | | | |
| | | Payments due by period | | | | | |
| Capital expenditure | | Less than 1 year | More than 1 year | Total | | | | | | |
| Committed | | 10,064 | | 7,875 | | 17,939 | | | | | | | |
| of which is contracted | | 5,442 | | 2,766 | | 8,208 | | | | | | | |
Capital expenditure is considered to be committed when the project has received the appropriate level of internal management approval. For joint operations«, the net bp share is included in the amounts above.
In addition, at 31 December 2021, the group had committed to capital expenditure relating to investments in equity-accounted entities amounting to $4,152 million. Contracts were in place for $1,201 million of this total.
The following table summarizes the group’s principal contractual obligations at 31 December 2021, distinguishing between those for which a liability is recognized on the balance sheet and those for which no liability is recognized. See Financial framework above for bp’s approach to capital allocation and Financial the group’s activities above for bp's plan and ability to generate and obtain cash in the short and long term. Also see Financial statements – Note 22 for more information on provisions, Note 23 on pensions and other post-retirement benefits, Note 25 on borrowings, Note 27 on leases, Note 28 and Note 29 on derivatives and financial instruments.
| | | | | | | | | | | | | | | | | | | | |
| | | | $ million | | | | | | |
| | | Payments due by period | | | | | |
| Expected payments by period under contractual obligations | | Less than 1 year | More than 1 year | Total | | | | | | |
| Balance sheet obligations | | | | | | | | | | |
Borrowingsa | | 6,867 | | 64,698 | | 71,565 | | | | | | | |
Lease liabilitiesb | | 1,949 | | 8,076 | | 10,025 | | | | | | | |
Decommissioning liabilitiesc | | 615 | | 23,182 | | 23,797 | | | | | | | |
Environmental liabilitiesc | | 273 | | 1,659 | | 1,932 | | | | | | | |
Gulf of Mexico oil spill liabilitiesd | | 1,287 | | 11,883 | | 13,170 | | | | | | | |
Pensions and other post-retirement benefitse | | 822 | | 13,208 | | 14,030 | | | | | | | |
| | 11,813 | | 122,706 | | 134,519 | | | | | | | |
| Off-balance sheet obligations | | | | | | | | | | |
Unconditional purchase obligationsf | | | | | | | | | | |
| Crude oil and oil products | | 46,470 | | 7,006 | | 53,476 | | | | | | | |
| Natural gas and LNG | | 18,655 | | 32,411 | | 51,066 | | | | | | | |
| Chemicals and other refinery feedstocks | | 120 | | 515 | | 635 | | | | | | | |
| Power | | 3,391 | | 2,693 | | 6,084 | | | | | | | |
| Utilities | | 154 | | 685 | | 839 | | | | | | | |
| Transportation | | 1,889 | | 16,312 | | 18,201 | | | | | | | |
| Use of facilities and services | | 2,534 | | 15,583 | | 18,117 | | | | | | | |
| | 73,213 | | 75,205 | | 148,418 | | | | | | | |
| Total | | 85,026 | | 197,911 | | 282,937 | | | | | | | |
a Expected payments include interest totalling $10,389 million (less than 1 year $1,497 million, more than 1 year $8,892 million).
b Expected payments include interest totalling $1,414 million (less than 1 year $236 million, more than 1 year $1,178 million).
c The amounts presented are undiscounted.
d The amounts presented are undiscounted. Gulf of Mexico oil spill liabilities are included in the group balance sheet, on a discounted basis, within other payables. See Financial statements – Note 21 for further information.
e Represents the expected future contributions to funded pension plans and payments by the group for unfunded pension plans and the expected future payments for other post-retirement benefits.
f Represents any agreement to purchase goods or services that is enforceable and legally binding and that specifies all significant terms (such as fixed or minimum purchase volumes, timing of purchase and pricing provisions). Agreements that do not specify all significant terms, or that are not enforceable, are excluded. The amounts shown include arrangements to secure long-term access to supplies of crude oil, natural gas, feedstocks and pipeline systems. In addition, the amounts shown for 2022 include purchase commitments existing at 31 December 2021 entered into principally to meet the group’s short-term manufacturing and marketing requirements. The price risk associated with these crude oil, natural gas and power contracts is discussed in Financial statements – Note 28.
Commitments for the delivery of oil and gas
We sell crude oil, natural gas and liquefied natural gas under a variety of contractual obligations. Some of these contracts specify the delivery of fixed and determinable quantities. For the period from 2022 to 2024 worldwide, we are contractually committed to deliver approximately 231 million barrels of oil, 8,800 billion cubic feet of natural gas, and 60 million tonnes of liquefied natural gas. The commitments principally relate to group subsidiaries« based in Egypt, Oman, Singapore, Trinidad & Tobago and United States. We expect to fulfil these delivery commitments with production from our proved developed reserves and supplies from existing contracts, supplemented by market purchases as necessary.
| | | | | | | | | | | | | | |
| | bp Annual Report and Form 20-F 2021 | | 343 |
Oil and gas disclosures for the group
Analysis by region
Our oil and gas operations are set out below by geographical area, with associated significant events for 2021. bp’s percentage working interest in oil and gas assets is shown in brackets. Working interest is the cost-bearing ownership share of an oil or gas lease. Consequently, the percentages disclosed for certain agreements do not necessarily reflect the percentage interests in proved reserves, production or revenue. See page 48 for more information on Rosneft.
In addition to exploration, development and production activities, our oil production & operations (OP&O) and gas businesses also include certain midstream and liquefied natural gas (LNG) supply activities. Midstream activities involve the ownership and management of crude oil and natural gas pipelines, processing facilities and export terminals, LNG processing facilities and transportation, and our natural gas liquids (NGLs) processing business.
Our upstream LNG activities are located in Abu Dhabi, Angola, Australia, Indonesia and Trinidad. In 2021 our production was 10 million tonnes of LNG from these assets, of which two million tonnes were marketed through trading & shipping, which supplements equity production with merchant third party volumes to build a global trading portfolio. The LNG is marketed through contractual rights to access import terminal capacity in the liquid markets of Europe, UK and US, and relationships to market directly to end user customers or trading entities. LNG is supplied to all major LNG demand centres for example Argentina, Baltic Coast, Brazil, Caribbean, China, Croatia, Mediterranean and North West Europe, India, Israel, Japan, Singapore, South Korea, Taiwan, Thailand, Turkey and the UK.
Europe
bp is active in the North Sea and the Norwegian Sea. In 2021 bp’s production came from three key areas: the Shetland area comprising the Clair, Foinaven, and Schiehallion fields; the central area comprising the Andrew area, Culzean, Vorlich, ETAP and Shearwater fields; and Norway, through our equity accounted 28% interest in Aker BP as at 31 December 2021.
•Production through the Petrojarl Foinaven FPSO vessel was suspended in April due to the vessel reaching the end of its design life. The vessel will be taken off station and the subsea infrastructure preserved while evaluation of future options for the Foinaven field takes place.
•In May bp announced its intent to retain its interests in the Andrew area, which had previously been marketed for sale. Subsequently, in January 2022, bp acquired JX Nippon’s interests in the Andrew area, comprising their 27.39% interest in the Andrew field, their 30% interest in Farragon and their 22.94% interest in Kinnoull.
•On 11 November bp sold 7,718,571 shares, representing a 2.1% stake in Aker BP ASA, for a total of $273 million. Following the sale, bp now holds a 27.85% interest, Aker holds 37.14% and the portion of shares available to public investors has increased to 35%.
•On 30 November bp completed the divestment of its non-operated interest in the Shearwater asset located in the UK North Sea to Shell.
•On 21 December Aker BP announced its proposed acquisition of the oil and gas business of Lundin Energy, through a statutory merger. Following completion of the merger, which is subject to approvals, bp is expected to own 15.9% of the enlarged entity (Aker 21.2%, Nemesia S.á.r.l 14.4%, other Aker BP and Lundin Energy shareholders 48.6%).
•In December bp reached an agreement to purchase RockRose Energy’s 28% interest in Foinaven, and their 47% interest in East Foinaven with completion expected in the first half of 2022.
North America
Our upstream activities in North America are located in four areas: deepwater Gulf of Mexico, the Lower 48 states, Canada and Mexico.
bp has around 205 lease blocks in the Gulf of Mexico and operates four production hubs.
•On 12 April, bp announced the safe arrival in Texas US of the Argos floating production platform, a major milestone for the Mad Dog 2
project in the deepwater Gulf of Mexico (bp 60.5% and operator). bp expects the Mad Dog Phase 2 project to start up in the second half of 2022.
•On 13 April, bp announced an oil discovery in a high-quality Miocene reservoir at the Puma West prospect in the deepwater Gulf of Mexico (bp 50% and operator). Evaluation is ongoing.
•On 23 June, bp announced the start-up of the Manuel project in the deepwater Gulf of Mexico (bp 50% and operator). Manuel includes a new subsea production system for two new wells tied into the Na Kika platform.
•On 28 September, bp announced the start-up of its Thunder Horse South Expansion Phase 2 project in the deepwater Gulf of Mexico (bp 75% and operator).
•bp was the apparent high bidder on 46 leases in Gulf of Mexico Lease Sale 257 held in November. In January 2022 the lease sale was annulled by a federal judge on the basis that climate change impacts were not accounted for. bp will work to evaluate options with stakeholders.
•In February 2022, bp announced the safe and successful start-up of the Herschel Expansion project in the Gulf of Mexico. Phase 1 of the project comprises development of a new subsea production system and the first of up to three wells tied to the Na Kika platform (bp 50% and operator).
See also Financial Statements – Note 1 for further information on exploration leases.
bpx energy, bp's onshore oil and gas business in the Lower 48 states, has significant operated and non-operated activities across Louisiana and Texas producing natural gas, oil, NGLs and condensate, with primary focus on developing unconventional resources in Texas. It had a 1.5 billion boe proved reserve base at 31 December 2021, predominantly in unconventional reservoirs (tight gas«, shale gas and shale oil). bpx energy's core assets span 1.5 million net developed acres with 1,900 operated gross wells at 31 December 2021, and daily net production around 296mboe/d.
bpx energy operated as a separate business in 2021 while remaining part of the OP&O segment. With its own governance, systems and processes, it is structured to increase competitive performance through swift decision making and innovation, while maintaining bp’s commitment to safe, reliable and compliant operations.
bp’s onshore US crude oil and product pipelines and related transportation assets were included in the Customers and Products segment in 2021.
In Canada bp is focused on pursuing offshore exploration opportunities and its Sunrise Oil Sands operations. We have offshore exploration licences in Nova Scotia, Newfoundland and Labrador and the Canadian Beaufort Sea. In addition to Sunrise Oil Sands we hold an interest in the Terre de Grace partnership. In-situ steam-assisted gravity drainage (SAGD) technology is utilized in our existing oil sands operations, which uses the injection of steam into the reservoir to warm the bitumen so that it can flow to the surface through producing wells.
•The order issued by the government of Canada in 2019 prohibiting any work or activity authorized under the Canada Oil and Gas Operations Act on frontier lands that are situated in Canadian Arctic offshore waters has been extended until 31 December 2022.
•In January 2022 bp agreed to sell its interest in the Pike oil sands asset and oil and gas assets located in the Kirby and Leismer fields. The transaction completed at the end of that month.
In Mexico, during 2021 we held interests in two exploration joint operations in the Salina Basin with Equinor and Total, Block 1 (bp 33% and operator) and Block 3 (bp 33%), and in one exploration joint operation in the Sureste Basin with Total, QPI Mexico and Hokchi Energy, a subsidiary of Pan American Energy Group (PAEG), Block 34 (bp 42.5% and operator). In addition, bp also holds an interest in two other blocks through Hokchi Energy (operator).
•During the year, bp resigned as operator of Block 1 and signed a novation agreement to transfer its working interest to Total who will take over as operator. Regulatory approval for both processes was received in early 2022.
| | | | | | | | | | | | | | |
344 | | bp Annual Report and Form 20-F 2021 | | |
•In Block 3, Equinor as operator has filed a relinquishment on behalf of the JV. The process is pending regulatory approval.
South America
bp has oil and gas activities in Argentina, Brazil and Trinidad & Tobago and through PAEG, in Argentina, Bolivia and Uruguay.
In Argentina bp and Total are partners on a 50/50 basis in two offshore exploration concessions. Total is the operator.
In Brazil bp has interests in 10 exploration concessions across three basins.
•On 5 April, bp signed an agreement to transfer its participating interests in six blocks located in Foz do Amazonas basin off northern Brazil to Petróleo Brasileiro S.A. (Petrobras). Regulatory approval for the transaction was received in September.
•In June, the regulatory authorities approved the transfer of bp’s participating interests in the Itaipu and Wahoo concessions to PetroRio and the $100 million agreed sale price was received during the year. A further $67.5 million receivable is due in 2022.
•Also in June Petrobras as the operator of BM-POT-16 issued a relinquishment notice to the regulatory authorities, which is subject to approval.
•In December the regulatory authorities approved bp’s transfer to Petrobras of its participating interests in BM-POT-17 (POT-M-853 and 855 - Pitu) and fully executed the contract amendment in January 2022.
•In January 2021, Petrobras as the operator of Peroba issued a relinquishment notice to the regulatory authorities which was approved in January 2022.
•In the Alto de Cabo Frio Central and Dois Irmãos blocks in the Campos/ Santos basin, Petrobras and partners commenced drilling campaigns in the first quarter of 2022.
PAEG, a joint venture that is owned by bp (50%) and Bridas Corporation (50%), has activities mainly in Argentina and as noted above Mexico, but is also present in Uruguay and Bolivia.
In Trinidad & Tobago bp holds interests in exploration and production licences and production-sharing contracts (PSCs) covering 1.6 million acres offshore of the east and north-east coast. Facilities include 15 offshore platforms and two onshore processing facilities. Production comprises gas and associated liquids.
bp also holds interests in the Atlantic LNG facility. The total gross capacity of the four LNG trains making up the facility is approximately 15 million tonnes per annum. bp’s shareholding averages 39% across the three companies which own the facility. During 2021 we sold gas to trains 2 and 3 and processed gas in train 4. Most of the LNG produced from bp gas supplied to trains 2, 3 and 4 is sold to third parties under long- term contracts.
•The Cassia Compression project facilities were installed in the third quarter of 2021. This new compression platform is bridge linked to the Cassia B processing platform providing lowered wellhead pressures to fields served by the Cassia hub. Cassia Compression is expected to start up in 2022.
•On 20 September, bp Trinidad and Tobago (bpTT) announced that the Matapal subsea gas development safely achieved first gas seven months ahead of schedule and under budget. Matapal is bpTT’s second subsea development. It is comprised of three wells that tie back to the existing Juniper platform, helping minimize development costs and the associated carbon footprint. Matapal is located approximately 80km off the south-east coast of Trinidad.
•At the end of 2020, Atlantic Train 1 entered into an agreement with the National Gas Company of Trinidad and Tobago to fund the operating cost of Train 1 to December 2021. This was terminated in August 2021. In the absence of any gas supply arrangements, Train 1 is now conducting technical work to plan for decommissioning.
•The Mento new field development which is a 50/50 joint venture with EOG (operator) was sanctioned in 4Q 2021. The operator is targeting start-up in 2024.
•In the BHP operated Deepwater Block 14 (bp 30%) the Calypso appraisal drilling programme ended in December with both Bongos-3 and Bongos-4 wells encountering hydrocarbons. The well results are currently under evaluation.
•bp is operator of the Manakin Block which was discovered in 1998 and is a cross border reservoir field with the Venezuelan reservoir, Cocuina. Manakin declared commerciality in January 2018 however cross border discussions have not progressed due to the US sanctions.
Africa
bp’s upstream activities in Africa are located in Algeria, Angola, Côte d'Ivoire, Egypt, the Gambia, Libya, Mauritania, São Tomé & Príncipe and Senegal.
In Algeria bp, Sonatrach and Equinor are partners in the In Salah (bp 33.15%) and In Amenas (bp 45.89%) non-operated joint ventures that supply gas and liquids to the domestic and European markets.
In Angola, bp owns an interest in five major deepwater offshore licences. It is operator of two of these, Blocks 18 and 31, which are producing. In addition we have an equity interest in the Angola LNG plant (bp 13.6%).
•On 6 May, bp confirmed the start of production from the Zinia Phase 2 project in Block 17, Angola (bp 15.84%).
•On 25 November, bp announced the start-up of production from its Platina project in Block 18 (bp 46% and operator).
•On 3 December bp confirmed the start-up of production at the CLOV Phase 2 project in Block 17 (bp 15.84%).
•In Block 31 an infill drilling programme, which was sanctioned in 2020, is expected to start production in 2022 (bp 26.67%).
•In Block 15, during 2021 an infill drilling programme was sanctioned that is expected to start production in 2022 (bp 24%).
•In March 2022, bp and Eni signed an agreement to form a new 50:50 independent company, Azule Energy, a bp and Eni company, through the combination of the two companies’ Angolan businesses. The agreement follows the memorandum of understanding between the companies agreed in May 2021. The creation of Azule Energy will be subject to customary governmental and other approvals, with the aim of completing the transaction in the second half of 2022.
In Côte d’Ivoire, bp had interests in five offshore oil blocks with Kosmos Energy (KE) under agreements with the government of Côte d'Ivoire and the state oil company Société Nationale d'Operations Pétrolières de la Côte d'Ivoire (PETROCI) (bp 45%).
•Following the completion of the Minimum Work Obligations, the partners decided not to proceed to the next exploration phase and bp relinquished its interests in the five offshore blocks.
In Egypt, bp's business is primarily focused in exploration and production. bp's investments in the country include West Nile Delta, Atoll and Zohr. Through its joint ventures with Egyptian Natural Gas Holding Company (EGAS), Egyptian General Petroleum Corporation (EGPC), International Egyptian Oil Company (IEOC) - Eni, the Pharaonic Petroleum Company (PhPC) and through collaboration with Belayim Petroleum Company (Petrobel), bp Egypt now produces almost 60% of Egypt's total gas supply.
•On 26 April bp announced the start-up of gas production from the Raven field, the third stage of the West Nile Delta development off the Mediterranean coast in Egypt (bp 82.75% and operator).Raven follows the Taurus/Libra and Giza/Fayoum projects, which started production in 2017 and 2019 respectively. It produces gas and condensate to a new onshore processing facility, alongside the existing West Nile Delta onshore processing plant.
•On 10 January 2022 bp and its partner Eni were awarded the new exploration block EGY-MED-E5 in Egypt following a successful bidding round organized by EGAS. The block is located in the Eastern Mediterranean Sea.
In the Gambia, bp had a 90% interest in offshore block A1 with the state oil company, Gambia National Petroleum Corporation.
•Following a strategic review of its activities in 2020, bp decided not to proceed with the drilling of an exploration well which was a Minimum
| | | | | | | | | | | | | | |
| | bp Annual Report and Form 20-F 2021 | | 345 |
Work Obligation and in 2021, bp paid the associated penalty and relinquished its interest in the block.
In Libya, bp partners with the Libyan Investment Authority (LIA) in an exploration and production sharing agreement (EPSA) to explore acreage in the onshore Ghadames and offshore Sirt basins (bp 85%). bp wrote off all balances associated with the Libya EPSA in 2015.
•LIA and Eni continue to work with the NOC towards Eni acquiring a 42.5% interest in the bp-operated EPSA in Libya. On completion, Eni would become operator of the EPSA. The companies are continuing to work together to finalize and complete all agreements.
In Mauritania and Senegal, bp has a 62% participating interest in the C8 and C12 exploration blocks in Mauritania and a 60% participating interest in the Cayar Offshore Profond exploration block in Senegal. In 2021, the Cayar Offshore Profond exploration licence was extended by three years to July 2024. Also in 2021, we relinquished our interest in block C13 in Mauritania in June and in Saint Louis Offshore Profond block in Senegal in July; however we still retain the Exploitation licence in the Saint Louis Offshore Profond block (pertinent to the Senegal portion of the GTA (Greater Tortue Ahmeyim) Unit cross-border development). Together the remaining blocks cover approximately 13,544 square kilometres.
•The GTA Project (bp 56%) continues to progress with Phase 1 where 15 out of 21 caissons were installed at the offshore hub at the end of 2021.
•In 2021, an impairment charge of $819 million was recognized in respect of certain assets in the region due to increased future expenditure.
In São Tomé & Príncipe, bp is operator in two offshore blocks under PSAs with Shell and the state company Agencia Nacional do Petroleo (bp 50%).
Asia
bp has activities in Abu Dhabi, Azerbaijan, China, India, Indonesia, Iraq, Kuwait, Oman and Russia.
In China we have a 30% equity stake in the Guangdong LNG regasification terminal and trunkline project (GDLNG) with a total storage capacity of 640,000 cubic metres. bp also has 0.6 million tons per annum of regasification capacity at GDLNG for up to 12 years starting from the beginning of 2021. bp imports LNG from our global portfolio and delivers regasified natural gas via the terminal to power plant and city gas customers in Guangdong province under long term sales contracts.
In Azerbaijan, bp operates two PSAs, Azeri-Chirag-Gunashli (ACG) (bp 30.37%) and Shah Deniz (bp 29.99%) and also holds a number of other exploration leases.
•The SAX01 exploration well on the Shafag-Asiman offshore block reached its target depth in March 2021 with gas-condensate resources encountered (bp 50% and operator). Evaluation will be ongoing throughout 2022.
•On 6 July bp confirmed commencement of production from the East South flank of Shah Deniz 2.
•On 29 September, bp announced it had agreed to sell a 25% participating interest in the Shallow Water Absheron Peninsula (SWAP) exploration project in the Azerbaijan sector of the Caspian Sea to LUKOIL. The transaction, with an effective date of 1 July 2021, was completed on 22 October 2021, following which the participating interests are: SOCAR Oil Affiliate 50%, bp 25% (operator), and LUKOIL 25%.
•During the year the first SWAP exploration well in the Northeast prospective area was drilled and was subsequently confirmed as a dry hole. Drilling of the first well on the West prospective area commenced in December.
•In December 2021 bp entered into an agreement to purchase from Petronas a 1.16% interest in the bp-operated Shah Deniz field and South Caucasus Pipeline Company (SCPC) for $168 million. This is the result of bp exercising pre-emption rights following Petronas’s announcement of intent to sell its interest. The transaction completed in February 2022 and as a result, bp now holds a 29.99% interest in Shah Deniz and SCPC.
•Naftiran Intertrade Co Ltd (NICO), a subsidiary of the National Iranian Oil Company, holds a 10% interest in the Shah Deniz joint venture. For information on the exclusion of this project from EU and US trade sanctions, or exemptions from such trade sanctions in relation to this project, see International trade sanctions on page 360.
bp holds a 30.1% interest in and operates the Baku-Tbilisi-Ceyhan oil pipeline. The 1,768-kilometre pipeline transports oil from the bp-operated ACG oilfield and gas condensate from the Shah Deniz gas field in the Caspian Sea, along with other third-party oil, to the eastern Mediterranean port of Ceyhan. The pipeline has a capacity of 1mmboe/d, with an average throughput in 2021 of 547mboe/d.
bp (as operator of Azerbaijan International Operating Company and the Georgian Pipeline Company for Georgian section) also operates the Western Route Export Pipeline that transports ACG oil to Supsa on the Black Sea coast of Georgia, with an average throughput of 85mboe/d in 2021.
bp holds a 29.99% interest in and operates certain parts of the 693 kilometre South Caucasus Pipeline. The pipeline takes gas from the Shah Deniz field in Azerbaijan through Georgia to the Turkish border and has a capacity of 440mboe/d (including expansion), with average throughput in 2021 of 299mboe/d.
bp also holds a 12% interest in the Trans Anatolian Natural Gas Pipeline (TANAP). The pipeline takes gas from the Shah Deniz field to the Turkish border and transports it to Eskisehir in Turkey and to the Greek border where it connects with the Trans Adriatic Pipeline (TAP). The current capacity of TANAP is 275mboe/d and the average throughput in 2021 was 230mboe/d. bp has a 20% interest in TAP, that takes gas through Greece and Albania into Italy. The current capacity of TAP is 167mboe/d and the total average throughout in 2021 was 136mboe/d.
In Oman bp operates Block 61, the largest tight gas« development in the Middle East (bp 40%), bp also has 50% interest in Block 77 with ENI (operator) in which an exploration well is expected to be drilled in 2023.
•On 1 February 2021 bp announced that it had agreed to sell a 20% participating interest in Block 61 to PTT Exploration and Production Public Company Limited (PTTEP) of Thailand for a total consideration of $2.6 billion. The Royal Decree approving this sale was received on 28 March 2021. bp remains the operator of the block with a 40% interest.
•In Block 61, upon completion of Phase 2, the Ghazeer field was brought online in June 2021 adding an incremental 500mmscfd, bringing total field production to 1.5bcfd. This represents one third of Oman’s gas production.
In Abu Dhabi, bp holds a 10% interest in the ADNOC Onshore concession. We also have a 10% equity shareholding in ADNOC LNG and a 10% shareholding in the shipping company NGSCO. ADNOC LNG supplied approximately 6.02 million tonnes of LNG (0.79bcfe/d regasified) in 2021. Our interest in the ADNOC Onshore concession expires at the end of 2054.
In 2016 bp signed an enhanced technical service agreement for south and east Kuwait conventional oilfields, which includes the Burgan field, with Kuwait Oil Company. Delivery of the 2020-2021 plan was above target performance and implementation of the 2021-22 plan is underway.
In India we have a participating interest in two oil and gas PSAs (KG D6 33.33% and NEC25 33.33%), and one oil and gas block under a Revenue Sharing Contract (KG-UDWHP-2018/1 40%), all operated by Reliance Industries Limited (RIL). We also have a 50% stake in India Gas Solutions Private Limited, a joint venture with RIL, for the sourcing and marketing of gas in India.
•On 26 April bp and RIL announced the start of production from the Satellites Cluster gas field in block KG D6 off the east coast of India. The Satellites Cluster is the second of the three KG D6 developments to come onstream, following the start-up of R Cluster in December 2020. The third KG D6 development, MJ, is expected to come onstream by the end of 2022.
•During the year, impairment reversals of $1,229 million were recognized in respect of certain assets in India, primarily as a result of changes to the group's oil and gas price assumptions.
| | | | | | | | | | | | | | |
346 | | bp Annual Report and Form 20-F 2021 | | |
In Indonesia bp holds a 30% working interest in the Andaman II PSC exploration block (operated by Harbour Energy), located offshore North Sumatra. The first exploration well is planned to be drilled in 2022.
In Iraq bp holds a 47.6% participating interest and is the lead contractor in the Rumaila technical service contract in southern Iraq. The technical services contract runs to December 2034. Rumaila is one of the world’s largest oil fields, comprising five producing reservoirs.
•During 2021, bp and PetroChina (PC) established Basra Energy Company Limited (BECL) and agreed to contribute their Rumaila interests into BECL. BECL is an incorporated joint venture (IJV) company intended to own and manage bp and PC interests at Rumaila. The Government of Iraq approved the transfer, and the transaction is expected to complete during 2022, subject to relevant approvals.
Russia
In Russia in addition to its interest in Rosneft as detailed on page 48, bp holds a 20% interest in Taas-Yuryakh Neftegazodobycha (Taas) together with Rosneft (50.1%) and a consortium comprising Oil India Limited, Indian Oil Corporation Limited and Bharat PetroResources Limited (29.9%). Taas is developing the Srednebotuobinskoye oil and gas condensate field in East Siberia. Also with Rosneft, we hold a 49% interest in Kharampurneftegaz LLC (Kharampur) to develop subsoil resources within the Kharampurskoe and Festivalnoye licence areas in Yamalo-Nenets. Rosneft (51%) and bp (49%) jointly own Yermak Neftegaz LLC (Yermak), which conducts onshore exploration in the West Siberian and Yenisei-Khatanga basins and currently holds six exploration and production licences.
•During the year bp received $158 million of dividends net of withholding taxes and $18 million of distribution of paid in capital from Taas.
•During the third quarter Yermak secured access to two new licence blocks, Khoshgortyeganskiy and Kharayeganskiy, in the established West Siberia basin.
•On 15 November Rosneft announced that Yermak discovered a material new gas condensate field in the Taymyr Peninsula.
On 27 February 2022, bp announced that it will exit its shareholding in Rosneft and its other businesses with Rosneft within Russia. Those other businesses include the three joint ventures described above.
Australasia
bp has activities in Australia and Eastern Indonesia.
In Australia bp is one of seven participants in the North West Shelf (NWS) venture, which has been producing LNG, pipeline gas, condensate, LPG and oil since the 1980s. Six partners (including bp) hold an equal 16.67% interest in the gas infrastructure and an equal 15.78% interest in the gas and condensate reserves, with a seventh partner owning the remaining 5.32%. bp also has a 16.67% interest in some of the NWS oil reserves and related infrastructure. The NWS venture is one of the largest LNG export projects in the region, with five LNG trains in operation and supplies domestic gas into the Western Australia market. bp’s net share of the capacity of NWS LNG trains 1-5 is 2.7 million tonnes of LNG per year.
bp is also one of five participants in the Browse LNG venture (operated by Woodside) and holds a 17.33% interest.
•The Browse joint venture participants continue to progress the development of Browse by connecting it via a 900km pipeline to the NWS Venture's Karratha Gas Plant. The final investment decision is expected in 2024.
In Papua Barat, Eastern Indonesia, bp operates the Tangguh LNG plant (bp 40.22%). The asset currently comprises 16 producing wells, two offshore platforms, two pipelines and an LNG plant with two production trains. It has a total capacity of 7.6 million tonnes of LNG per annum. Tangguh supplies LNG to customers in Indonesia, Mexico, China, South Korea, and Japan through a combination of long, medium and short-term contracts.
The Tangguh expansion project comprises a third LNG processing train, two offshore platforms, eight new production wells, an expanded LNG loading facility, and supporting infrastructure. The project will add 3.8 million tonnes per annum (mtpa) of production capacity to the existing
facility, bringing total plant capacity to 11.4mtpa. We expect first gas from the project in 2023.
| | | | | | | | | | | | | | |
| | bp Annual Report and Form 20-F 2021 | | 347 |
Oil and natural gas
Resource progression
bp manages its hydrocarbon resources in three major categories: prospect inventory, contingent resources and reserves. When a discovery is made, volumes usually transfer from the prospect inventory to the contingent resources category. The contingent resources move through various sub-categories as their technical and commercial maturity increases through appraisal activity.
At the point of final investment decision, most proved reserves will be categorized as proved undeveloped (PUD). Volumes will subsequently be recategorized from PUD to proved developed (PD) as a consequence of development activity. When part of a well’s proved reserves depends on a later phase of activity, only that portion of proved reserves associated with existing, available facilities and infrastructure moves to PD. The first PD bookings will typically occur at the point of first oil or gas production. Major development projects typically take one to five years from the time of initial booking of PUD to the start of production. Changes to proved reserves bookings may be made due to analysis of new or existing data concerning production, reservoir performance, commercial factors and additional reservoir development activity.
Volumes can also be added or removed from our portfolio through acquisition or divestment of properties and projects. When we dispose of an interest in a property or project, the volumes associated with our adopted plan of development for which we have a final investment decision will be removed from our proved reserves upon completion of the transaction. When we acquire an interest in a property or project, the volumes associated with the existing development and any committed projects will be added to our proved reserves if bp has made a final investment decision and they satisfy the SEC’s criteria for attribution of proved status. Following the acquisition, additional volumes may be progressed to proved reserves from non-proved reserves or contingent resources.
Non-proved reserves and contingent resources in a field will only be recategorized as proved reserves when all the criteria for attribution of proved status have been met and the volumes are included in the business plan and scheduled for development, typically within five years. bp will only book proved reserves where development is scheduled to commence after more than five years, if these proved reserves satisfy the SEC’s criteria for attribution of proved status and bp management has reasonable certainty that these proved reserves will be produced.
At the end of 2021 bp had material volumes of proved undeveloped reserves held for more than five years in Russia, Gulf of Mexico, Azerbaijan, Trinidad, Canada, the North Sea and Indonesia. These are part of ongoing infrastructure-led development activities for which bp has a historical track record of completing comparable projects in these countries. We have no proved undeveloped reserves held for more than five years in our onshore US developments.
In each case the volumes are being progressed as part of an adopted development plan where there are physical limits to the development timing such as infrastructure limitations, contractual limits including gas delivery commitments, late life compression and the complex nature of working in remote locations, or where there are significant commitments on delivery to the relevant authority.
Over the past five years, bp has annually progressed a weighted average 16% (17% for 2020 five-year average) of our group proved undeveloped reserves (including the impact of disposals and price acceleration effects in PSAs) to proved developed reserves. This equates to a turnover time of six years.
Proved reserves as estimated at the end of 2021 meet bp’s criteria for project sanctioning and SEC tests for proved reserves. We have not halted or changed our commitment to proceed with any material project to which proved undeveloped reserves have been attributed.
In 2021 we progressed 899 mmboe of proved undeveloped reserves (446 mmboe for our subsidiaries« alone) to proved developed reserves through ongoing investment in our subsidiaries’ and equity-accounted entities’ upstream development activities. Total development expenditure, excluding midstream activities, was $11,041 million in 2021 ($6,596 million for subsidiaries and $3,646 million for equity-accounted
entities). The major areas with progressed volumes in 2021 were Russia, US, Middle East, Azerbaijan and Trinidad. Revisions of previous estimates for proved undeveloped reserves are due to changes relating to field performance, well results or changes in commercial conditions including price impacts. The following tables describe the changes to our proved undeveloped reserves position through the year for our subsidiaries and equity-accounted entities and for our subsidiaries alone.
| | | | | |
| volumes in mmboea |
Subsidiaries and equity-accounted entitiesb | Group |
| Proved undeveloped reserves at 1 January 2021 | 7,871 | |
| Revisions of previous estimates | (85) | |
| Improved recovery | 101 | |
| Discoveries and extensions | 362 | |
| Purchases | 12 | |
| Sales | (204) | |
| Total in year proved undeveloped reserves changes | 186 | |
| Proved developed reserves reclassified as undeveloped | 56 | |
| Progressed to proved developed reserves by development activities (e.g. drilling/completion) | (899) | |
| Proved undeveloped reserves at 31 December 2021 | 7,214 | |
| | | | | |
| Subsidiaries only | volumes in mmboea |
| Proved undeveloped reserves at 1 January 2021 | 3,673 | |
| Revisions of previous estimates | (287) | |
| Improved recovery | 99 | |
| Discoveries and extensions | 31 | |
| Purchases | — | |
| Sales | (147) | |
| Total in year proved undeveloped reserves changes | (303) | |
| Proved developed reserves reclassified as undeveloped | 49 | |
| Progressed to proved developed reserves by development activities (e.g. drilling/completion) | (446) | |
| Proved undeveloped reserves at 31 December 2021 | 2,973 | |
aBecause of rounding, some totals may not agree exactly with the sum of their component parts.
bIncludes bp's share of Rosneft and bp's Russia joint ventures' proved undeveloped reserves. On 27 February 2022, bp announced that it will exit its shareholding in Rosneft and its other businesses with Rosneft within Russia.
bp bases its proved reserves estimates on the requirement of reasonable certainty with rigorous technical and commercial assessments based on conventional industry practice and regulatory requirements. bp only applies technologies that have been field tested and have been demonstrated to provide reasonably certain results with consistency and repeatability in the formation being evaluated or in an analogous formation. bp applies high-resolution seismic data for the identification of reservoir extent and fluid contacts only where there is an overwhelming track record of success in its local application. In certain cases bp uses numerical simulation as part of a holistic assessment of recovery factor for its fields, where these simulations have been field tested and have been demonstrated to provide reasonably certain results with consistency and repeatability in the formation being evaluated or in an analogous formation. In certain deepwater fields bp has booked proved reserves before production flow tests are conducted, in part because of the significant safety, cost and environmental implications of conducting these tests. The industry has made substantial technological improvements in understanding, measuring and delineating reservoir properties without the need for flow tests. To determine reasonable certainty of commercial recovery, bp employs a general method of reserves assessment that relies on the integration of three types of data:
•well data used to assess the local characteristics and conditions of reservoirs and fluids
•field scale seismic data to allow the interpolation and extrapolation of these characteristics outside the immediate area of the local well control
•data from relevant analogous fields.
Well data includes appraisal wells or sidetrack holes, full logging suites, core data and fluid samples. bp considers the integration of this data in certain cases to be superior to a flow test in providing understanding of
| | | | | | | | | | | | | | |
348 | | bp Annual Report and Form 20-F 2021 | | |
overall reservoir performance. The collection of data from logs, cores, wireline formation testers, pressures and fluid samples calibrated to each other and to the seismic data can allow reservoir properties to be determined over a greater volume than the localized volume of investigation associated with a short-term flow test. There is a strong track record of proved reserves recorded using these methods, validated by actual production levels.
Governance
bp’s centrally controlled process for proved reserves estimation approval forms part of a holistic and integrated system of internal control. It consists of the following elements:
•Accountabilities of certain officers of the group to ensure that there is review and approval of proved reserves bookings independent of the operating business and that there are effective controls in the approval process and verification that the proved reserves estimates and the related financial impacts are reported in a timely manner.
•Capital allocation processes, whereby delegated authority is exercised to commit to capital projects that are consistent with the delivery of the group’s business plan. A formal review process exists to ensure that both technical and commercial criteria are met prior to the commitment of capital to projects.
•Internal audit, whose role is to consider whether the group’s system of internal control is adequately designed and operating effectively to respond appropriately to the risks that are significant to bp.
•Approval hierarchy, whereby proved reserves changes above certain threshold volumes require immediate review and all proved reserves require annual central authorization and have scheduled periodic reviews. The frequency of periodic review ensures that 100% of the bp proved reserves base undergoes central review every three years.
bp’s vice president of reserves is the individual primarily responsible for overseeing the preparation of the reserves estimate. He has more than 28 years of diversified industry experience in reserves estimation with the past 3 years managing the governance and compliance. He is a past Chairman of the Society of Petroleum Engineers (Russia & Caspian) and a member of the United Nations Economic Commission for Europe Expert Group on Resource Management.
No specific portion of compensation bonuses for senior management is directly related to proved reserves targets. Additions to proved reserves is one of several indicators by which the performance of the gas & low carbon and oil production & operations segments is assessed by the remuneration committee for the purposes of determining compensation bonuses for the executive directors. Other indicators include a number of financial and operational measures.
bp’s variable pay programme for the other senior managers in the gas & low carbon and oil production & operations segments is based on individual performance contracts. Individual performance contracts are based on agreed items from the business performance plan, one of which, if chosen, could relate to proved reserves.
Compliance
International Financial Reporting Standards (IFRS) do not provide specific guidance on reserves disclosures. bp estimates proved reserves in accordance with SEC Rule 4-10 (a) of Regulation S-X and relevant Compliance and Disclosure Interpretations (C&DI) and Staff Accounting Bulletins as issued by the SEC staff.
By their nature, there is always risk involved in the ultimate development and production of proved reserves including, but not limited to: final regulatory approval; the installation of new or additional infrastructure, as well as changes in oil and gas prices; changes in operating and development costs; and the continued availability of additional development capital. All the group’s proved reserves held in subsidiaries and equity-accounted entities are estimated by the group’s petroleum engineers or by independent petroleum engineering consulting firms and then assured by the group’s petroleum engineers.
DeGolyer & MacNaughton (D&M), an independent petroleum engineering consulting firm, has estimated the net proved crude oil, condensate, natural gas liquids (NGLs) and natural gas reserves, as of 31 December 2021, of certain properties held or controlled by Rosneft as part of our
equity-accounted proved reserves. The properties evaluated by D&M account for 100% of Rosneft’s net proved reserves as of 31 December 2021. The net proved reserves estimates prepared by D&M were prepared in accordance with the reserves definitions of Rule 4-10(a)(1)-(32) of Regulation S-X. All reserves estimates involve some degree of uncertainty. bp has filed D&M’s independent report on its reserves estimates as an exhibit to this Annual Report on Form 20-F filed with the SEC.
Netherland, Sewell & Associates (NSAI), an independent petroleum engineering consulting firm, has estimated the net proved crude oil, condensate, natural gas liquids (NGLs) and natural gas reserves, as of 31 December 2021, of certain properties owned by bp in the US Lower 48. The properties evaluated by NSAI account for 100% of bp’s net proved reserves in the US Lower 48 as of 31 December 2021. The net proved reserves estimates prepared by NSAI were prepared in accordance with the reserves definitions of Rule 4-10(a)(1)-(32) of Regulation S-X. All reserves estimates involve some degree of uncertainty. bp has filed NSAI’s independent report on its reserves estimates as an exhibit to this Annual Report on Form 20-F filed with the SEC.
Our proved reserves are associated with both concessions (tax and royalty arrangements) and agreements where the group is exposed to the upstream risks and rewards of ownership, but where our entitlement to the hydrocarbons is calculated using a more complex formula, such as with PSAs. In a concession, the consortium of which we are a part is entitled to the proved reserves that can be produced over the licence period, which may be the life of the field. In a PSA, we are entitled to recover volumes that equate to costs incurred to develop and produce the proved reserves and an agreed share of the remaining volumes or the economic equivalent. As part of our entitlement is driven by the monetary amount of costs to be recovered, price fluctuations will have an impact on both production volumes and reserves.
We disclose our share of proved reserves held in equity-accounted entities (joint ventures« and associates«), although we do not control these entities or the assets held by such entities. The disclosures include bp's share of proved reserves held by Rosneft and bp's Russia joint ventures. bp announced on 27 February 2022 that it intends to exit its shareholding in Rosneft and its other businesses with Rosneft within Russia including these Russian joint ventures.
bp’s estimated net proved reserves and proved reserves replacement
94% of our total proved reserves of subsidiaries at 31 December 2021 were held through joint operations« (92% in 2020), and 35% of the proved reserves were held through such joint operations where we were not the operator (31% in 2020).
Estimated net proved reserves of crude oil at 31 December 2021a b c
| | | | | | | | | | | |
| | million barrels |
| Developed | Undeveloped | Total |
| UK | 178 | | 101 | | 279 | |
| | | |
| US | 705 | | 601 | | 1,306 | |
Rest of North Americad | 24 | | 167 | | 191 | |
South Americae | 5 | | 7 | | 12 | |
| Africa | 117 | | 14 | | 131 | |
| Rest of Asia | 930 | | 449 | | 1,379 | |
| Australasia | 28 | | 4 | | 33 | |
| Subsidiaries | 1,987 | | 1,343 | | 3,330 | |
| Equity-accounted entities | 3,434 | | 2,826 | | 6,260 | |
| Total | 5,421 | | 4,169 | | 9,590 | |
| | | | | | | | | | | | | | |
| | bp Annual Report and Form 20-F 2021 | | 349 |
Estimated net proved reserves of natural gas liquids at 31 December 2021a b
| | | | | | | | | | | |
| | million barrels |
| Developed | Undeveloped | Total |
| UK | 8 | | — | | 9 | |
| | | |
| US | 132 | | 195 | | 328 | |
| Rest of North America | — | | — | | — | |
| South America | 2 | | 19 | | 21 | |
| Africa | 9 | | 1 | | 10 | |
| Rest of Asia | — | | — | | — | |
| Australasia | 2 | | — | | 2 | |
| Subsidiaries | 153 | | 215 | | 368 | |
| Equity-accounted entities | 125 | | 41 | | 166 | |
| Total | 278 | | 256 | | 534 | |
Estimated net proved reserves of liquids«
| | | | | | | | | | | |
| | million barrels |
| Developed | Undeveloped | Total |
Subsidiariese | 2,141 | | 1,558 | | 3,699 | |
Equity-accounted entitiesf | 3,558 | | 2,867 | | 6,425 | |
| Total | 5,699 | | 4,425 | | 10,124 | |
Estimated net proved reserves of natural gas at 31 December 2021a b
| | | | | | | | | | | |
| billion cubic feet |
| Developed | Undeveloped | Total |
| UK | 455 | | 45 | | 501 | |
| | | |
| US | 2,401 | | 3,404 | | 5,805 | |
| Rest of North America | — | | — | | — | |
South Americag | 1,152 | | 1,147 | | 2,299 | |
| Africa | 1,433 | | 154 | | 1,587 | |
| Rest of Asia | 3,266 | | 2,522 | | 5,788 | |
| Australasia | 1,584 | | 939 | | 2,523 | |
| Subsidiaries | 10,291 | | 8,211 | | 18,502 | |
Equity-accounted entitiesh | 13,149 | | 7,964 | | 21,113 | |
| Total | 23,440 | | 16,174 | | 39,615 | |
Estimated net proved reserves on an oil equivalent basis
| | | | | | | | | | | |
| million barrels of oil equivalent |
| Developed | Undeveloped | Total |
| Subsidiaries | 3,915 | | 2,973 | | 6,889 | |
| Equity-accounted entities | 5,825 | | 4,240 | | 10,065 | |
Totali | 9,740 | | 7,214 | | 16,954 | |
aProved reserves exclude royalties due to others, whether payable in cash or in kind, where the royalty owner has a direct interest in the underlying production and the option and ability to make lifting and sales arrangements independently, and include non-controlling interests in consolidated operations. We disclose our share of reserves held in joint ventures and associates that are accounted for by the equity method although we do not control these entities or the assets held by such entities.
bThe 2021 marker prices used were Brent $69.23/bbl (2020 $41.31/bbl and 2019 $62.74/bbl) and Henry Hub $3.61/mmBtu (2020 $1.94/mmBtu and 2019 $2.58/mmBtu).
cIncludes condensate.
dAll of the reserves in Canada are bitumen.
eIncludes 10 million barrels of liquids in respect of the 30% non-controlling interest in BP Trinidad and Tobago LLC.
fIncludes 396 million barrels in respect of the non-controlling interest in Rosneft, including 22 mmboe held through bp’s interests in Russia other than Rosneft.
gIncludes 690 billion cubic feet of natural gas in respect of the 30% non-controlling interest in BP Trinidad and Tobago LLC.
hIncludes 1,656 billion cubic feet of natural gas in respect of the 10.20% non-controlling interest in Rosneft including 621 billion cubic feet held through bp’s interests in Russia other than Rosneft.
iIncludes proved reserves associated with our shareholding in Rosneft and our Russia joint ventures of 9,013 billion barrels of oil equivalent (9,062 billion barrels at year end 2020).
Because of rounding, some totals may not agree exactly with the sum of their component parts.
Proved reserves replacement
Total hydrocarbon proved reserves at 31 December 2021, on an oil equivalent basis including equity-accounted entities, decreased by 6% compared with 31 December 2020. Natural gas represented about 40% (46% for subsidiaries and 36% for equity-accounted entities) of these reserves. The change includes a net decrease from acquisitions and disposals of 408mmboe (decrease of 282mmboe within our subsidiaries and decrease of 126mmboe within our equity-accounted entities). Acquisition and divestment activity occurred in our equity-accounted entities in the Southern Cone, the North Sea and Russia, and divestment activity in our subsidiaries in the US, the Middle East and the North Sea.
The proved reserves replacement ratio« is the extent to which production is replaced by proved reserves additions. This ratio is expressed in oil equivalent terms and includes changes resulting from revisions to previous estimates, improved recovery, and extensions and discoveries. For 2021, the proved reserves replacement ratio excluding acquisitions and disposals was 50% (78% in 2020 and 67% in 2019) for subsidiaries and equity-accounted entities, 4% for subsidiaries alone and 119% for equity-accounted entities alone. There was a net increase (55mmboe) of reserves due to higher gas and oil prices within the US, North Sea and Angola partly offset by decreases related to price in some of our PSAs in Iraq, Azerbaijan and Canada.
In 2021 net additions to the group’s proved reserves (excluding production and sales and purchases of reserves-in-place) amounted to 609mmboe (31mmboe for subsidiaries and 578mmboe for equity-accounted entities), through revisions to previous estimates including price, improved recovery from, and extensions to, existing fields and discoveries of new fields. The subsidiary additions were through improved recovery from, and extensions to, existing fields and discoveries of new fields where they represented a mixture of proved developed and proved undeveloped reserves. Volumes added in 2021 principally resulted from the application of conventional technologies and extensions of field size by development drilling. The principal proved reserves additions in our subsidiaries by region were in the US, North Africa, Middle East, the North Sea, Angola and India. The principal reserves additions in our equity-accounted entities were in Rosneft and Pan American Energy Group.
13% of our proved reserves are associated with PSAs. The countries in which we produced under PSAs in 2021 were Algeria, Angola, Azerbaijan, Egypt, India, Indonesia, Mexico and Oman. In addition, the technical service contract (TSC) governing our investment in the Rumaila field in Iraq functions as a PSA.
The group holds no licences due to expire within the next three years that would have a significant impact on bp’s reserves or production.
For further information on our reserves see page 261.
| | | | | | | | | | | | | | |
350 | | bp Annual Report and Form 20-F 2021 | | |
bp’s net production by country – crude oila and natural gas liquids
| | | | | | | | | | | | | | | | | | | | | | | |
| | | | | thousand barrels per day |
| | | | | bp net share of productionb |
| | | Crude oil | | | | Natural gas liquids |
| 2021 | 2020 | 2019 | | 2021 | 2020 | 2019 |
| | | | | | | |
| Subsidiaries | | | | | | | |
UKcd | 82 | | 96 | | 100 | | | 5 | | 5 | | 3 | |
| | | | | | | |
| | | | | | | |
| Total Europe | 82 | | 96 | | 100 | | | 5 | | 5 | | 3 | |
Alaskad | — | | 38 | | 71 | | | — | | — | | — | |
Lower 48 onshored | 69 | | 72 | | 66 | | | 48 | | 59 | | 58 | |
Gulf of Mexico deepwaterd | 239 | | 235 | | 263 | | | 22 | | 20 | | 24 | |
| Total US | 308 | | 345 | | 400 | | | 70 | | 79 | | 81 | |
Canadae | 25 | | 22 | | 24 | | | — | | — | | — | |
| Total Rest of North America | 25 | | 22 | | 24 | | | — | | — | | — | |
| Total North America | 333 | | 367 | | 424 | | | 70 | | 79 | | 81 | |
| Trinidad & Tobago | 5 | | 7 | | 7 | | | 4 | | 7 | | 9 | |
| Total South America | 5 | | 7 | | 7 | | | 4 | | 7 | | 9 | |
| Angola | 80 | | 108 | | 115 | | | — | | — | | — | |
Egyptd | 23 | | 9 | | 34 | | | — | | — | | — | |
| Algeria | 6 | | 6 | | 7 | | | 7 | | 8 | | 8 | |
| Total Africa | 110 | | 123 | | 156 | | | 7 | | 8 | | 8 | |
| Abu Dhabi | 171 | | 158 | | 180 | | | — | | — | | — | |
| Azerbaijan | 77 | | 97 | | 79 | | | — | | — | | — | |
| | | | | | | |
| Iraq | 43 | | 100 | | 64 | | | — | | — | | — | |
| | | | | | | |
Omand | 26 | | 21 | | 20 | | | — | | — | | — | |
| Total Rest of Asia | 318 | | 375 | | 343 | | | — | | — | | — | |
| Total Asia | 318 | | 375 | | 343 | | | — | | — | | — | |
| Australia | 11 | | 13 | | 15 | | | 2 | | 2 | | 2 | |
| Eastern Indonesia | 2 | | 2 | | 2 | | | — | | — | | — | |
| Total Australasia | 13 | | 15 | | 17 | | | 2 | | 2 | | 2 | |
| Total subsidiaries | 860 | | 983 | | 1,046 | | | 88 | | 101 | | 104 | |
| Equity-accounted entities (bp share) | | | | | | | |
Rosneftf (Russia, Egypt) | 857 | | 873 | | 920 | | | 3 | | 3 | | 3 | |
| | | | | | | |
| Argentina | 50 | | 52 | | 54 | | | 1 | | 1 | | 1 | |
| Mexico | 3 | | — | | — | | | — | | — | | — | |
| Bolivia | 2 | | 2 | | 2 | | | — | | — | | — | |
| Egypt | — | | — | | — | | | 3 | | 2 | | 3 | |
| Norway | 48 | | 50 | | 35 | | | 3 | | 3 | | 2 | |
| Russia | 30 | | 30 | | 35 | | | — | | — | | — | |
| Angola | 1 | | 1 | | 1 | | | 3 | | 5 | | 5 | |
| | | | | | | |
| Total equity-accounted entities | 991 | | 1,009 | | 1,047 | | | 12 | | 14 | | 14 | |
Total subsidiaries and equity-accounted entitiesg | 1,851 | | 1,991 | | 2,093 | | | 100 | | 115 | | 118 | |
a Includes condensate.b Production excludes royalties due to others whether payable in cash or in kind where the royalty owner has a direct interest in the underlying production and the option and ability to make lifting and sales arrangements independently.
c Volumes relate to six bp-operated fields within ETAP. bp has no interests in the remaining three ETAP fields, which are operated by Shell.
d In 2021, bp disposed 20% of its interest in Block 61 in Oman, its interest in Shearwater in the UK North Sea, and certain Lower 48 onshore interests in the US. In 2020, bp disposed of its Alaska interests and certain Lower 48 onshore interests in the US. In 2019, bp completed the sale of its interest in the Gulf of Suez Petroleum Company (GUPCO) in Egypt and certain US assets in Lower 48 onshore and disposed of its interests in the Gulf of Mexico Santiago and Santa Cruz wells.
e All of the production from Canada in Subsidiaries is bitumen.
f Includes production in respect of the non-controlling interest in Rosneft, including production held through bp’s interests in Russia other than Rosneft.
g Includes 3 net mboe/d of NGLs from processing plants in which bp has an interest (2020 3mboe/d and 2019 3mboe/d).
Because of rounding, some totals may not agree exactly with the sum of their component parts.
| | | | | | | | | | | | | | |
| | bp Annual Report and Form 20-F 2021 | | 351 |
bp’s net production by country – natural gas
| | | | | | | | | | | |
| million cubic feet per day |
| bp net share of productiona |
| 2021 | 2020 | 2019 |
| Subsidiaries | | | |
UKb | 236 | | 221 | | 129 | |
| | | |
| | | |
| Total Europe | 236 | | 221 | | 129 | |
Lower 48 onshoreb | 1,043 | | 1,405 | | 2,175 | |
Gulf of Mexico deepwaterb | 154 | | 154 | | 179 | |
Alaskab | — | | 3 | | 4 | |
| Total US | 1,197 | | 1,561 | | 2,358 | |
| Canada | 2 | | 2 | | 2 | |
| Total Rest of North America | 2 | | 2 | | 2 | |
| Total North America | 1,199 | | 1,563 | | 2,361 | |
| Trinidad & Tobago | 1,260 | | 1,695 | | 1,977 | |
| Total South America | 1,260 | | 1,695 | | 1,977 | |
Egyptb | 1,206 | | 782 | | 952 | |
| Algeria | 126 | | 141 | | 186 | |
| Total Africa | 1,332 | | 923 | | 1,138 | |
| | | |
| Azerbaijan | 539 | | 413 | | 367 | |
| | | |
| India | 169 | | 2 | | 15 | |
Omanb | 571 | | 550 | | 594 | |
| Total Rest of Asia | 1,279 | | 966 | | 976 | |
| Total Asia | 1,279 | | 966 | | 976 | |
| Australia | 332 | | 396 | | 411 | |
| Eastern Indonesia | 429 | | 399 | | 375 | |
| Total Australasia | 760 | | 795 | | 786 | |
Total subsidiariesc | 6,067 | | 6,163 | | 7,366 | |
| Equity-accounted entities (bp share) | | | |
Rosneftd (Russia, Canada, Egypt, Vietnam) | 1,380 | | 1,286 | | 1,279 | |
| Argentina | 223 | | 230 | | 250 | |
| Bolivia | 60 | | 56 | | 64 | |
| Mexico | 1 | | — | | — | |
| Norway | 66 | | 61 | | 56 | |
| Russia | 42 | | 41 | | — | |
| Angola | 77 | | 92 | | 87 | |
| | | |
Total equity-accounted entitiesc | 1,849 | | 1,765 | | 1,736 | |
| Total subsidiaries and equity-accounted entities | 7,915 | | 7,929 | | 9,102 | |
a Production excludes royalties due to others whether payable in cash or in kind where the royalty owner has a direct interest in the underlying production and the option and ability to make lifting and sales arrangements independently.
b In 2021,bp disposed 20% of its interest in Block 61 in Oman, its interest in Shearwater in the UK North Sea, and certain Lower 48 onshore interests in the US. In 2020, bp disposed of its Alaska interests and certain Lower 48 onshore interests in the US. In 2019, bp completed the sale of its interest in the Gulf of Suez Petroleum Company (GUPCO) in Egypt and certain US assets in Lower 48 onshore and disposed of its interests in the Gulf of Mexico Santiago and Santa Cruz wells.
c Natural gas production volumes exclude gas consumed in operations within the lease boundaries of the producing field, but the related reserves are included in the group’s reserves.
d Includes production in respect of the non-controlling interest in Rosneft, including production held through bp’s interests in Russia other than Rosneft.
Because of rounding, some totals may not agree exactly with the sum of their component parts.
| | | | | | | | | | | | | | |
352 | | bp Annual Report and Form 20-F 2021 | | |
The following tables provide additional data and disclosures in relation to our oil and gas operations.
Average sales price per unit of production (realizations«)a
| | | | | | | | | | | | | | | | | | | | | | | | | | | | | | | | | | | |
| | | | | | | | | | $ per unit of production |
| | Europe | North
America | South
America | Africa | Asia | Australasia | Total
group
average |
| | UK | Rest of
Europe | US | Rest of
North
America | | | Russiab | Rest of
Asia | | |
| Subsidiaries | | | | | | | | | | | |
| 2021 | | | | | | | | | | | |
Crude oilc | | 71.99 | | — | | 62.58 | | 52.49 | | 67.62 | | 68.98 | | — | | 67.94 | | 61.46 | | 65.81 | |
| Natural gas liquids | | 52.07 | | — | | 26.85 | | — | | 32.81 | | 51.01 | | — | | — | | 40.98 | | 30.89 | |
| Gas | | 17.06 | | — | | 3.68 | | 2.63 | | 4.06 | | 4.36 | | — | | 5.66 | | 7.25 | | 5.30 | |
| 2020 | | | | | | | | | | | |
Crude oilc | | 42.70 | | — | | 38.14 | | 26.70 | | 42.27 | | 41.60 | | — | | 37.76 | | 33.21 | | 38.46 | |
| Natural gas liquids | | 25.31 | | — | | 10.22 | | — | | 16.49 | | 25.39 | | — | | — | | 24.73 | | 12.91 | |
| Gas | | 3.13 | | — | | 1.30 | | 1.70 | | 1.86 | | 3.89 | | — | | 3.91 | | 4.66 | | 2.75 | |
| 2019 | | | | | | | | | | | |
Crude oilc | | 65.44 | | — | | 59.19 | | 40.92 | | 63.30 | | 63.75 | | — | | 64.39 | | 59.65 | | 61.56 | |
| Natural gas liquids | | 29.58 | | — | | 14.67 | | — | | 25.86 | | 31.89 | | — | | — | | 38.11 | | 18.23 | |
| Gas | | 4.01 | | — | | 1.93 | | 0.75 | | 2.78 | | 4.59 | | — | | 3.99 | | 6.86 | | 3.39 | |
Equity-accounted entitiesd | | | | | | | | | | | |
| 2021 | | | | | | | | | | | |
Crude oilc | | — | | 69.23 | | — | | — | | 62.62 | | — | | 61.98 | | — | | — | | 62.60 | |
Natural gas liquidse | | — | | — | | — | | — | | 42.47 | | — | | N/A | — | | — | | 42.47 | |
| Gas | | — | | 15.26 | | — | | — | | 3.44 | | — | | 1.69 | | — | | — | | 2.49 | |
| 2020 | | | | | | | | | | | |
Crude oilc | | — | | 40.00 | | — | | — | | 40.41 | | — | | 35.10 | | — | | — | | 35.94 | |
Natural gas liquidse | | — | | — | | — | | — | | 15.93 | | — | | N/A | — | | — | | 15.93 | |
| Gas | | — | | 3.76 | | — | | — | | 2.88 | | — | | 1.51 | | — | | — | | 1.85 | |
| 2019 | | | | | | | | | | | |
Crude oilc | | — | | 64.75 | | — | | — | | 56.85 | | — | | 56.52 | | — | | — | | 56.96 | |
Natural gas liquidse | | — | | — | | — | | — | | 18.14 | | — | | N/A | — | | — | | 18.14 | |
| Gas | | — | | 5.01 | | — | | — | | 3.98 | | — | | 1.83 | | — | | — | | 2.38 | |
Average production cost per unit of productionf
| | | | | | | | | | | | | | | | | | | | | | | | | | | | | | | | | | | |
| | | | | | | | | | $ per unit of production |
| | Europe | North
America | South
America | Africa | Asia | Australasia | Total
group
average |
| | UK | Rest of
Europe | US | Rest of
North
America | | | Russiac | Rest of
Asia | |
| Subsidiaries | | | | | | | | | | | |
| 2021 | | 13.97 | | — | | 9.17 | | 13.18 | | 4.49 | | 6.17 | | — | | 4.92 | | 2.27 | | 6.82 | |
| 2020 | | 12.49 | | — | | 8.11 | | 12.46 | | 3.76 | | 7.71 | | — | | 4.41 | | 2.02 | | 6.39 | |
| 2019 | | 13.22 | | — | | 8.46 | | 13.36 | | 3.36 | | 7.95 | | — | | 5.15 | | 2.33 | | 6.84 | |
| Equity-accounted entities | | | | | | | | | | | |
| 2021 | | — | | 9.75 | | — | | — | | 11.21 | | — | | 2.76 | | — | | — | | 3.82 | |
| 2020 | | — | | 8.14 | | — | | — | | 12.71 | | — | | 3.54 | | — | | — | | 4.55 | |
| 2019 | | — | | 12.51 | | — | | — | | 11.50 | | — | | 3.45 | | — | | — | | 4.50 | |
a Units of production are barrels for liquids and thousands of cubic feet for gas. Realizations include transfers between businesses, except in the case of Russia.
b An amendment has been made to 2019 to align with the disclosures for oil and natural gas exploration and production activities.
c Includes condensate.
d In certain countries it is common for equity-accounted entities’ agreements to include pricing clauses that require selling a significant portion of the entitled production to local governments or markets at discounted prices.
e Natural gas liquids for Russia are included in crude oil.
f Units of production are barrels for liquids and thousands of cubic feet for gas. Amounts do not include ad valorem and severance taxes.
| | | | | | | | | | | | | | |
| | bp Annual Report and Form 20-F 2021 | | 353 |
Additional information for customers & products
Reconciliation of customers & products RC profit before interest and tax to underlying RC profit before interest and tax to adjusted EBITDA« by business
| | | | | | | | | | | | | | |
| | | | $ million |
| | 2021 | 2020 | 2019 |
| RC profit before interest and tax for customers & products | | 2,208 | | 3,418 | | 6,502 | |
Less: Adjusting items gains (charges) | | (1,044) | | 330 | | 83 | |
| Underlying RC profit before interest and tax for customers & products | | 3,252 | | 3,088 | | 6,419 | |
| By business: | | | | |
| customers – convenience & mobility | | 3,052 | | 2,883 | | 3,790 | |
| Castrol – included in customers | | 1,037 | | 818 | | 1,258 | |
| products – refining & trading | | 200 | | (28) | | 2,227 | |
| petrochemicals | | — | | 233 | | 402 | |
| | | | |
| Add back: Depreciation, depletion and amortization | | 3,000 | | 2,990 | | 2,921 | |
| By business: | | | | |
| customers – convenience & mobility | | 1,306 | | 1,200 | | 1,113 | |
| Castrol – included in customers | | 150 | | 161 | | 144 | |
| products – refining & trading | | 1,694 | | 1,686 | | 1,603 | |
| petrochemicals | | — | | 104 | | 205 | |
| | | | |
| Adjusted EBITDA for customers & products | | 6,252 | | 6,078 | | 9,340 | |
| By business: | | | | |
| customers – convenience & mobility | | 4,358 | | 4,083 | | 4,903 | |
| Castrol – included in customers | | 1,187 | | 979 | | 1,402 | |
| products – refining & trading | | 1,894 | | 1,658 | | 3,830 | |
| petrochemicals | | — | | 337 | | 607 | |
Sales volume
| | | | | | | | | | | | | | |
| | | | thousand barrels per day |
| | 2021 | 2020 | 2019 |
Marketing salesa | | 2,439 | 2,275 | 2,727 |
Trading/supply salesbc | | 393 | 416 | 460 |
| Total refined product sales | | 2,832 | 2,691 | 3,187 |
Crude oilcd | | 249 | 295 | 271 |
| Total | | 3,081 | 2,986 | 3,458 |
a Marketing sales include branded and unbranded sales of refined fuel products and lubricants to business-to-business and business-to-consumer customers, including service station dealers, jobbers, airlines, small and large resellers such as hypermarkets, and the military.
b Trading/supply sales are fuel sales to large unbranded resellers and other oil companies.
c Comparative information for 2020 and 2019 have been restated for the changes to presentation of revenues and purchases relating to physically settled derivative contracts effective 1 January 2021. For more information see Note 1 Basis of preparation - Voluntary change in accounting policy.
d Crude oil sales relate to third-party transactions executed primarily by trading and shipping. In addition, reported crude oil sales in 2021 includes 50 thousand barrels per day (2020 44 thousand barrels per day) relating to volumes sold directly by the gas & low carbon energy and oil production & operations segments.
In the table above, volumes of crude oil and refined product trading/supply sales are presented on a basis consistent with income statement presentation following the changes described in Note 1 Basis of preparation - Voluntary change in accounting policy. These figures do not correspond to actual volumes of physically traded energy products and are not intended for use in assessing emissions volumes or carbon intensity. Marketing volumes shown represent physically delivered transactions regardless of income statement presentation of such transactions.
Reconciliation of customers & products RC profit before interest and tax to gross margin for convenience, retail fuels and electrification
| | | | | | | | | | | | | | |
| | | | $ million |
| | 2021 | 2020 | 2019 |
| RC profit before interest and tax for customers & products | | 2,208 | | 3,418 | | 6,502 | |
| Subtract RC profit (loss) before interest and tax for refining & trading and petrochemicals | | (468) | | 1,169 | | 2,703 | |
| | 2,676 | | 2,249 | | 3,799 | |
| Net (favourable) adverse impact of adjusting items for convenience & mobility | | 376 | | 634 | | (9) | |
| Underlying RC profit before interest and tax for convenience & mobility | | 3,052 | | 2,883 | | 3,790 | |
| Subtract underlying RC profit for Castrol | | 1,037 | | 818 | | 1,258 | |
| Add back convenience & mobility (excluding Castrol) depreciation, depletion and amortization | | 1,156 | | 1,039 | | 969 | |
| Add back convenience & mobility (excluding Castrol) production and manufacturing, distribution and administration expenses and adjusted for aviation, B2B and midstream gross margin | | 2,486 | | 1,961 | | 1,767 | |
| Subtract earnings from equity-accounted entities in convenience & mobility (excluding Castrol) | | 330 | | 228 | | 293 | |
| Gross margin for convenience, retail fuels and electrification | | 5,327 | | 4,837 | | 4,975 | |
| Of which: | | | | |
| Convenience and electrification | | 1,548 | | 1,335 | | 1,260 | |
| Retail fuels | | 3,779 | | 3,502 | | 3,715 | |
| | | | |
Margin share from convenience & electrification« | | 29.1% | 27.6% | 25.3% |
Retail sitesa
| | | | | | | | | | | | | | |
| | | | Number of bp-branded retail sites |
| | 2021 | 2020 | 2019 |
| US | | 7,450 | 7,250 | 7,200 |
| Europe | | 8,250 | 8,250 | 8,250 |
| Rest of the world | | 4,800 | 4,800 | 3,450 |
| Total | | 20,500 | 20,300 | 18,900 |
a Reported to the nearest 50. Includes sites operated by dealers, jobbers, franchisees, brand licensees or JV partners, under the bp brand. These may move to and from the bp brand as their fuel supply agreement or brand licence agreement expires and are renegotiated in the normal course of business. Retail sites are primarily branded bp, ARCO, Amoco, Aral and Thorntons, and also include sites in India through our Jio-bp JV.
| | | | | | | | | | | | | | |
354 | | bp Annual Report and Form 20-F 2021 | | |
Refinery throughputsa b
| | | | | | | | | | | | | | |
| | | | thousand barrels per day |
| | 2021 | 2020 | 2019 |
| US | | 719 | 693 | 737 |
| Europe | | 787 | 742 | 787 |
| Rest of the world | | 88 | 192 | 225 |
| Total | | 1,594 | 1,627 | 1,749 |
| | | | |
| | | | % |
Refining availability« | | 94.8 | 96.0 | 94.9 |
a This does not include bp’s interest in Pan American Energy Group.
b Refinery throughputs reflect crude oil and other feedstock volumes.
Refinery capacity
The following tablea summarizes bp group’s interests in refineries and average daily crude distillation capacities as at 31 December 2021.
| | | | | | | | | | | | | | | | | |
| | | | Crude distillation capacitiesb |
| Fuels value chain | Country | Refinery | | Group interestc (%) | bp share
thousand barrels
per day |
| US | | | | | |
| US North West | US | Cherry Point | | 100.0 | 251 |
| US East of Rockies | | Whiting | | 100.0 | 440 |
| | | Toledo | | 50.0 | 80 |
| | | | | | 771 |
| Europe | | | | | |
| | | | | |
| Rhine | Germany | Gelsenkirchen | | 100.0 | 265 |
| | Lingen | | 100.0 | 97 |
| Netherlands | Rotterdam | | 100.0 | 394 |
| Iberia | Spain | Castellón | | 100.0 | 110 |
| | | | | | 866 |
Rest of worldd | | | | | |
| New Zealand | New Zealand | Whangareiefg | | 10.1 | 24 |
| Southern Africa | South Africa | Durbaneh | | 50.0 | 90 |
| | | | | 114 |
| Total bp share of capacity at 31 December 2021 | | | 1,751 | |
a This does not include bp’s interest in Pan American Energy Group.
b Crude distillation capacity is gross rated capacity, which is defined as the highest average sustained unit rate for a consecutive 30-day period under normal operational conditions.
c bp share of equity, which is not the same as bp share of processing entitlements.
d Kwinana refinery ceased operations in February 2021.
e Indicates refineries not operated by bp.
f Reflects bp share of processing entitlement, which is not the same as bp share of equity.
g Refining NZ announced plans to cease fuel production at their Whangerei Refinery and convert it to an import terminal from April 2022.
h SAPREF shareholders announced that refinery operations will be paused for an indefinite period from end March 2022.
Additional information for Rosneft
About Rosneft
Rosneft is the largest oil company in Russia and in 2021 was one of the largest publicly traded oil companies in the world based on hydrocarbon production volume. It has a major resource base of hydrocarbons onshore and offshore, with assets in all of Russia’s key hydrocarbon regions and abroad. bp's share of Rosneft hydrocarbon production was 1,098mboe/d in 2021 and in 2020. Rosneft is the leading Russian refining company based on throughput. It owns and operates 13 refineries in Russia and holds stakes in three refineries in Germany, one in India and one in Belarus. Rosneft refinery throughput in 2021 was 2,153mb/d, compared with 2,103mb/d in 2020. Downstream operations include jet fuel, bunkering, bitumen and lubricants, and Rosneft also owns and operates over 3,000 retail service stations in Russia and abroad.
| | | | | | | | | | | | | | |
| | bp Annual Report and Form 20-F 2021 | | 355 |
Environmental expenditure
| | | | | | | | | | | | | | |
| | | | $ million |
| | 2021 | 2020 | 2019 |
| | | | |
| Operating expenditure | | 362 | | 531 | | 511 | |
| Capital expenditure | | 222 | | 241 | | 468 | |
| Clean-ups | | 17 | | 29 | | 23 | |
| Additions to environmental remediation provision | | 363 | | 297 | | 272 | |
| Increase (decrease) in decommissioning provision | | 1,231 | | (686) | | 1,045 | |
Operating and capital expenditure on the prevention, control, treatment or elimination of air and water emissions and solid waste is often not incurred as a separately identifiable transaction. Instead, it forms part of a larger transaction that includes, for example, normal operations and maintenance expenditure. The figures for environmental operating and capital expenditure in the table are therefore estimates, based on the definitions and guidelines of the American Petroleum Institute.
Environmental operating expenditure of $362 million in 2021 (2020 $531 million) showed an overall decrease of 32%, largely due to the Alaska disposal, decreased expenditure in BP Products North America and the Shipping businesses.
Environmental capital expenditure of $222 million in 2021 was slightly lower overall (2020 $241 million) with reduction in expenditure for BP Products North America and the Alaska disposal, balanced out by an increase in expenditure for BPX Energy.
Clean-up costs were $17 million in 2021 (2020 $29 million) representing oil spill clean-up costs and other associated remediation and disposal costs. The reduction compared to 2020 results largely from the Alaska disposal and decreased expenditure in BP Products North America, Amoco Environment Services and Remediation Management.
In addition to operating and capital expenditure, we also establish provisions for future environmental remediation work. Expenditure against such provisions normally occurs in subsequent periods and is not included in environmental operating expenditure reported for such periods.
Provisions for environmental remediation are made when a clean-up is probable and the amount of the obligation can be reliably estimated. Generally, this coincides with the commitment to a formal plan of action or, if earlier, on divestment or on closure of inactive sites.
The extent and cost of future environmental restoration, remediation and abatement programmes are inherently difficult to estimate. They often depend on the extent of contamination, and the associated impact and timing of the corrective actions required, technological feasibility and bp’s share of liability. Though the costs of future programmes could be significant and may be material to the results of operations in the period in which they are recognized, it is not expected that such costs will be material to the group’s overall results of operations or financial position.
Additions to our environmental remediation provision were similar to prior years and also reflects scope reassessments of the remediation plans of a number of our sites in the US. The charge for environmental remediation provisions in 2021 included $33 million in respect of provisions for new sites (2020 $8 million and 2019 $9 million).
In addition, we make provisions on installation of our oil and gas producing assets and related pipelines to meet the cost of eventual decommissioning. On installation of an oil or natural gas production facility, a provision is established that represents the discounted value of the expected future cost of decommissioning the asset.
In 2021, the net increase in the decommissioning provision was due to recognition of additional provisions, a change in the discount rate, and a change in cost estimate assumptions.
We undertake periodic reviews of existing provisions. These reviews take account of revised cost assumptions, changes in decommissioning requirements and any technological developments.
Provisions for environmental remediation and decommissioning are usually established on a discounted basis, as required by IAS 37 ‘Provisions, Contingent Liabilities and Contingent Assets’.
Further details of decommissioning and environmental provisions appear in Financial statements – Note 22.
Regulation of the group’s business
Our businesses and operations are subject to the laws and regulations applicable in each country, state or other regional or local area in which they occur. These cover virtually all aspects of bp’s activities and include matters such as the acquisition of rights to develop and operate projects, production rates, royalties, environmental, health and safety protection, fuel specifications and transportation, trading, pricing, anti-trust, export, taxes, and foreign exchange.
Oil and gas contractual and regulatory framework
The terms and conditions of the leases, licences and contracts under which our upstream oil and gas interests are held vary from country to country. These leases, licences and contracts are generally granted by or entered into with a government entity or state-owned or controlled company and are sometimes entered into with private property owners. Arrangements with governmental or state entities usually take the form of licences or production-sharing agreements« (PSAs), although arrangements with private entities and the US government entities are usually by lease.
Licences (or concessions) give the holder the right to explore for, develop and produce a commercial discovery. Under a licence, the holder bears the risk of exploration, development and production activities and provides the financing for these operations. In principle, the licence holder is entitled to all production, minus any royalties that are payable in kind. A licence holder is generally required to pay production taxes or royalties, which may be in cash or in kind.
In certain countries, separate licences are required for exploration and production activities, and in some cases production licences are limited to only a portion of the area covered by the original exploration licence.
PSAs entered into with a government entity or state-owned or controlled company generally require bp (alone or with other contracting companies) to provide all the financing and bear the risk of exploration and production activities in exchange for a share of the production remaining after royalties, if any. Less typically, bp may explore for, develop and produce hydrocarbons under a service agreement with the host entity in exchange for reimbursement of costs and/or a fee paid in cash rather than production.
bp frequently conducts its exploration and production activities in joint arrangements« or co-ownership arrangements with other international oil companies, state-owned or controlled companies and/or private companies. Conventionally, all costs, benefits, rights, obligations, liabilities and risks incurred in carrying out joint arrangement or co-ownership operations under a lease, licence or PSA are shared among the joint arrangement or co-owning parties according to agreed ownership interests which are set-out in a joint operating agreement. To the extent that any liabilities arise, whether to governments or third parties, or as between the joint arrangement parties or co-owners themselves, each joint arrangement party or co-owner will generally be liable under the terms of a joint operating agreement to meet these in proportion to its ownership interest. Any agreed allocation of liability amongst the joint arrangement parties is however often different to the position under the relevant licence, lease or PSA which may provide for joint and several liability of the joint arrangement parties including for decommissioning obligations. In many upstream operations, a party (known as the operator) will be appointed (pursuant to a joint operating agreement) to carry out day to-day operations on behalf of the joint arrangement or co-ownership. The operator is typically one of the joint arrangement parties or a co-owner and will carry out its duties either through its own staff, or by contracting out various elements to third-party contractors or service providers. bp acts as operator on behalf of joint arrangements and co-ownerships in a number of countries.
Frequently, work (including drilling and related activities) will be contracted out to third-party service providers. The relevant contract will specify the work, the remuneration, and typically the risk allocation between the parties. Depending on the service to be provided, the contract may also contain provisions allocating risks and
| | | | | | | | | | | | | | |
356 | | bp Annual Report and Form 20-F 2021 | | |
liabilities associated with pollution and environmental damage, damage to a well or hydrocarbon reservoirs and for claims from third parties or other losses. The allocation of those risks vary among contracts and are determined through negotiation between the parties.
In general, bp incurs income tax on income generated from production activities (whether under a licence or PSA). In addition, depending on the area, bp’s production activities may be subject to a range of other taxes, levies and assessments, including special petroleum taxes and revenue taxes. The taxes imposed on oil and gas production profits and activities may be substantially higher than those imposed on other activities, for example in Abu Dhabi, Angola, Egypt, Norway, the UK, the US, Russia and Trinidad & Tobago.
bp is closely studying the Organisation for Economic Co-operation and Development’s two pillar solution to address the tax challenges arising from the digitalisation of the economy. The Pillar Two model rules were published on 20 December 2021, with legislation currently expected to be substantively enacted during 2022 and applicable from 2023. The tax accounting impact will be considered when the relevant legislation is published.
Low carbon energy - renewables contractual and regulatory framework
The majority of our interests in renewable assets are held indirectly through incorporated joint ventures or special purpose entities (in either case, a Project Company). The renewables contractual and regulatory framework and the rights granted in relation to a renewable asset significantly vary from country to country. In some countries, the regulatory framework is still under development or subject to significant change as the renewable industry evolves.
In general terms our rights to a renewable asset are usually held by the Project Company through a package of assets that together form the renewable project owned by such Project Company, including:
•one or more leases, easements, or licences over land or seabed granted by a public or private individual or entity that grant the Project Company rights to develop, build and operate the renewable asset in such areas of land or seabed;
•one or more generation licences that grant the Project Company the right to produce and sell the electricity to the market;
•an interconnection agreement that grants the Project Company the right to connect the power project into the grid;
•an offtake agreement which, depending on the country’s electricity market, is entered into with a utility company, a corporate buyer or a public entity; and
•potentially, a subsidy mechanism in the form of a feed in tariff, contract for difference, hedging mechanism or renewable energy certificate to support the development of the project.
The risk allocation between the developer/generator and the host government or private entity has not been standardized in the industry. However, in general terms the Project Company bears the risk of the development, construction and operation of the renewable energy project and provides the financing for these operations and profit from the revenue generated through the offtake agreement and/or subsidy mechanism (if available).
Sustainable finance
In 2020, elements of the EU Taxonomy Regulation entered into force and became part of UK law pursuant to the European Union (Withdrawal) Act of 2018. Whilst details of the EU Taxonomy Regulation are still being considered, it establishes a classification system for determining whether an economic activity is environmentally sustainable for the purposes of guiding investors in financial products which are marketed as promoting environmental objectives. Although the UK government has expressed its intention to retain the overall taxonomy framework and objectives as set forth in the EU Taxonomy Regulation, it is not yet clear to what extent UK law will align with elements of the EU Taxonomy Regulation that do not form part of retained EU law, including the disclosure requirements for large corporate firms. bp may in the future be required to comply with the
Taxonomy Regulation or any parallel or similar legislation which may come into force in the UK.
Greenhouse gas regulation
In December 2015, nearly 200 nations at the United Nations climate change conference in Paris (COP21) agreed to the Paris Agreement which aims to hold the increase in the global average temperature to well below 2°C above pre-industrial levels and to pursue efforts to limit the temperature increase to 1.5°C above pre-industrial levels. Signatories aim to reach global peaking of greenhouse gas (GHG) emissions as soon as possible and to undertake rapid reductions thereafter, so as to achieve a balance between human caused emissions and removals by sinks of GHGs in the second half of this century. The Paris Agreement commits all signatories to submit Nationally Determined Contributions (NDCs) (i.e. pledges or plans of climate action) and pursue domestic measures aimed at achieving the objectives of their NDCs. Signatories are required to submit revised NDCs every five years, and the revised NDC’s are expected to be more ambitious with each revision. Global assessments of progress will occur every five years, starting in 2023.
Agreement of rules which could enable international carbon trading to assist in meeting NDCs was adopted at the UNFCCC COP26 in Glasgow, Scotland in November 2021. More stringent national and regional measures relating to the transition to a lower carbon economy, such as the UK's 2050 net zero carbon emissions commitment, can be expected in the future. These measures could increase bp’s production costs for certain products, increase compliance and litigation costs, increase demand for competing energy alternatives or products with lower-carbon intensity, and affect the sales and specifications of many of bp’s products. Further, such measures could lead to constraints on production and supply and access to new reserves, particularly due to the long term nature of many of bp’s projects. Certain current and announced GHG measures and developments potentially affecting bp’s businesses in various markets in which bp operates are summarized below. For information on steps that bp is taking in relation to climate change issues and for details of bp’s GHG reporting, see Sustainability – Net zero aims on page 51.
United States
In the US, bp's operations are affected by GHG regulation in a number of ways. The federal Clean Air Act (CAA), for example, regulates air emissions, permitting, fuel specifications and other aspects of our production, refining, distribution and marketing activities.
The administration of US President Barack Obama had proposed regulating emissions from new, modified, and reconstructed facilities in the oil and gas sector. In August 2020 the administration of US President Donald Trump’s final policy rule eliminating federal regulation of methane emissions in oil and gas production was invalidated by the US Congress. Under the current administration of US President Joseph Biden, the EPA has issued proposed “Standards of Performance for New, Reconstructed, and Modified Sources and Emissions Guidelines for Existing Sources: Oil and Natural Gas Sector Climate Review” which are in the public comment period. These regulations would require significant reductions in methane emissions from oil and gas production at new and existing facilities.
Other EPA GHG and environmental regulations affect electricity generation practices and prices and have an impact on the market for fuels used to generate electricity and on renewable energy installations. These regulations are in flux due to changes in approach between presidential administrations, as well as lawsuits challenging those regulations. The Supreme Court is expected to consider aspects of the regulatory authority granted to EPA under the Clean Air Act in a pending case, West Virginia v. EPA, which may limit EPA’s ability to regulate GHG emissions.
The Energy Policy Act of 2005 and the Energy Independence and Security Act of 2007 impose the Renewable Fuel Standard (RFS), requiring transportation fuel sold in the United States to contain a minimum volume of renewable fuels. In the latest regulatory action, on December 7, 2021, EPA proposed a package of actions setting biofuel volumes for the RFS
| | | | | | | | | | | | | | |
| | bp Annual Report and Form 20-F 2021 | | 357 |
program for years 2020, 2021, and 2022, and introducing regulatory changes intended to enhance the program’s objectives. In addition, certain state initiatives impose carbon-intensity reduction requirements on transportation fuels sold in those states (e.g., in California, Oregon, and soon to be promulgated regulations in Washington).
The GHG Mandatory Reporting Rule, requires operators of certain facilities and producers and importers/exporters of petroleum products to file annual GHG emissions reports with EPA quantifying direct emissions from affected facilities, as well as volumes of petroleum products, certain natural gas liquids and GHG products and notional GHG emissions as if these products were fully combusted.
A number of states, municipalities and regional organizations continue to advance climate initiatives that affect our US operations. For example, California extended its Low Carbon Fuel Standard (LCFS) to 2030 with a 20% reduction in carbon intensity required by that time. The State of Washington enacted a state-wide carbon cap and invest legislation and a Clean Fuel Standard (similar to California’s LCFS) in 2021.
Our US businesses are subject to increased GHG and other environmental requirements and regulatory uncertainty, including that the current or any future US administration could revise or revoke current or prior administration programs, as well as the possibility of increased expenditures in having to comply with numerous diverse and non-uniform regulatory initiatives at the state and local level.
US fuel markets are affected by EPA regulation of light, medium and heavy duty vehicle emissions (both fuel economy and tailpipe standards) as well as for non-road engines and vehicles and certain large GHG stationary emission sources. The state of California also imposes Low Emission Vehicle (LEV) and Zero Emission Vehicle (ZEV) standards on vehicle manufacturers, and a number of other states, as allowed by CAA authority, have adopted California’s standards. These regulations may impact bp’s product mix and demand for particular products in those states. In August 2020, California also entered into agreements with several carmakers to meet more demanding emissions standards in California.
In December 2021, the Biden administration revised the fuel economy and tailpipe carbon dioxide emissions standards for passenger cars and light trucks covering model years (MY) 2023 through 2026 that the Trump administration had previously rolled back. The revised standards are more stringent through MY 2026 than the August 2020 agreements California reached with several carmakers. EPA is also restoring California’s Clean Air Act waiver allowing it to set its own GHG automotive tailpipe standards and for other states to adopt those standards, and the Department of Transportation repealed the Trump administration’s rule pre-empting state GHG standards.
In January 2020, EPA solicited comment on a proposed rulemaking known as the Cleaner Trucks Initiative. The rule would, among other things, establish new emission standards for oxides of nitrogen (NOx) and other pollutants for highway heavy-duty engines and the Biden administration is expected to modify and continue this proposed rulemaking. California has also adopted a “Heavy-Duty Low NOx Omnibus Regulation” which will require manufacturers to comply with stricter emissions standards and at least one state has opted into those California standards. The rule is being phased in, with the first phase effective in 2024. bp continues to monitor these rules for implications for fuels. These and other EPA initiatives to reduce GHG emissions may have a significant effect on the production, sale and profitability of many of bp’s products in the US.
European Union energy and climate legislation
•The EU and its member states have adopted various targets and measures seeking to reduce GHG emissions and promote renewables. These include the EU Emissions Trading Scheme (EU ETS); the Renewable Energy Directive (RED) – including an obligation on transport fuel suppliers to increase the share of renewables of their fuel supply; and CO2 targets for the sales of new vehicles which are expected to accelerate the decarbonisation of the transport sector and impact fuel demand.
•The EU has adopted a goal of achieving climate neutrality by 2050 as part of the European Green Deal and, subsequently, a 55% GHG
reduction target by 2030 compared to 1990 levels. To achieve this target, the European Commission proposed a set of measures in 2021 – as part of the so called ‘Fit for 55’ and ‘gas decarbonisation’ packages. Pending agreement by member states and the European Parliament, this would lead to increased ambition levels across various EU legislative instruments and initiatives, including higher shares of renewables across all sectors, a reduced number of GHG emission allowances under the EU ETS, and potentially a target of zero gramme of CO2 per km for new passenger cars by 2035. New measures, if adopted, would be expected to increase the supply and demand of renewable fuel and energy, extend emissions trading to the maritime sector and emissions from road transport and heating fuels. The European Commission also proposed measures to reduce methane emissions.
•Some EU member states have adopted national targets above and beyond current EU climate goals, such as Germany, with a climate neutrality target by 2045 and a national emissions trading system for transport and heating fuels.
Other
•In December 2020 the UK Government announced a targeted reduction in the UK’s GHG emissions of at least 68% by 2030, compared to 1990 levels.
•The UK Emissions Trading System (UK ETS) launched on 1 January 2021 following the end of the Brexit transition period and the UK’s participation in the EU ETS. It seeks to provide a carbon pricing mechanism as a tool for helping achieve the UK's net zero target and covers the same GHGs and sectors as the EU ETS. bp’s North Sea operations are subject to the UK ETS.
•China is operating emission trading pilot programmes in a number of cities and provinces. One of bp's subsidiaries in China is participating in these programmes. China launched its national emissions trading market (National ETS), initially covering the power sector only, politically in 2017. On 31 December 2020, China promulgated the national regulation on National ETS which became effective on 1 February 2021, when the National ETS was officially launched. The National ETS is intended to be an essential tool for China to fulfil its commitment to reach peak emissions by 2030 and carbon neutrality by 2060. For now, the National ETS participants are limited to the key emission entities identified by each provincial-level government authority and approved by Ministry for Ecology and Environment of China. bp is not participating the National ETS.
•In September 2021, China announced at the United Nations General Assembly that China would not build new coal-fired power projects abroad. In October 2021, ahead of the start of COP26, China issued a working guidance for carbon dioxide peak and carbon neutrality which sets out specific targets and measures for both reaching peak emissions and carbon neutrality, and an action plan for carbon dioxide peak before 2030 which sets out the main objectives for the next decade to achieve peak carbon emissions by 2030.
Other environmental regulation
In addition to GHG regulations referred to above, climate change programmes and regulation of unconventional oil and gas extraction under a number of environmental laws may have a significant effect on the production, sale and profitability of many of bp’s products.
Environmental laws also require bp to remediate and restore areas affected by the release of hazardous substances or hydrocarbons associated with our operations or properties. These laws may apply to sites that bp currently owns or operates, sites that it previously owned or operated, or sites used for the disposal of its and other parties’ waste. See Financial Statements – Note 22 for information on provisions for environmental restoration and remediation.
A number of pending or anticipated governmental proceedings against certain bp group companies under environmental laws could result in monetary or other sanctions. Group companies are also subject to environmental claims for personal injury and property damage alleging the release of, or exposure to, hazardous substances. The costs associated with future environmental remediation obligations, governmental proceedings and claims could be significant and may be material to the results of operations in the
| | | | | | | | | | | | | | |
358 | | bp Annual Report and Form 20-F 2021 | | |
period in which they are recognized. We cannot accurately predict the effects of future developments, such as stricter environmental laws and regulations or enforcement policies, or future events at our facilities on the group, and there can be no assurance that material liabilities and costs will not be incurred in the future. For a discussion of the group’s environmental expenditure, see page 356 and for a discussion of legal proceedings, see page 248.
Significant health, safety and environmental legislation and regulation in the US and the EU affecting our businesses and profitability, in addition to those referred to above, include the following:
United States
•The Clean Water Act regulates wastewater and other effluent discharges from bp’s facilities, and bp is required to obtain discharge permits, install control equipment and implement operational controls and preventative measures.
•The Resource Conservation and Recovery Act regulates the generation, storage, transportation and disposal of wastes associated with our operations and can require corrective action at locations where such wastes have been disposed of or released. bp has incurred, or is likely to incur, liability under RCRA or similar state laws in connection with sites bp operates or previously operated.
•The Comprehensive Environmental Response, Compensation, and Liability Act (CERCLA) can, in certain circumstances, impose the entire cost of investigation and remediation on a party who owned or operated a site contaminated with a hazardous substance, or who arranged for disposal of a hazardous substance at a site. bp has incurred, or is likely to incur, liability under CERCLA or similar state laws, including costs attributed to insolvent or unidentified parties. bp is also subject to claims for remediation costs and natural resource damages under CERCLA and other federal and state laws.
•The Emergency Planning and Community Right-to-Know Act requires reporting on the storage, use and releases of certain quantities of listed hazardous substances to designated government agencies.
•The Toxic Substances Control Act (TSCA) regulates bp’s manufacture, import, export, sale and use of chemical substances and products. In addition, EPA has revised processes and procedures for prioritisation of existing chemicals for risk evaluation, assessment and management. Agency actions and announcements are monitored regularly to identify developments with potential impacts on chemical substances important to bp products and operations.
•The Occupational Safety and Health Act imposes workplace safety and health requirements on bp operations along with significant process safety management obligations, requiring continuous evaluation and improvement of operational practices to enhance safety and reduce workplace emissions at gas processing, refining and other regulated facilities. On November 5, 2021, the Occupational Safety and Health Administration published an emergency temporary standard (ETS) requiring employers with more than 100 employees to require employees either to get fully vaccinated or to test weekly for COVID-19. The vaccine-or-test requirement was scheduled to come into force February 9, 2022, but on January 13, 2022 the U.S. Supreme Court stayed the ETS pending further review by a lower court. The ultimate outcome of the litigation regarding the validity of the ETS is uncertain. Also, in many states there has been an evolving range of executive orders and state and local statutes mandating COVID-19 response measures that may impact bp personnel and operations.
•The Oil Pollution Act 1990 (OPA) imposes operational requirements, liability standards and other obligations governing the transportation of petroleum products in US waters. States may impose additional obligations. Alaska and the West Coast states currently have the most demanding state requirements.
•The Outer Continental Shelf Land Act, the Mineral Leasing Act and other statutes give the Department of Interior (DOI) and the BLM authority to regulate operations and air emissions, including equipment and testing, on offshore and onshore operations on federal lands subject to DOI authority.
•The Endangered Species Act (ESA) and Marine Mammal Protection Act protect certain species’ habitats from adverse human impacts by restricting operations or development at certain times and in certain places. In 2020, the US Fish and Wildlife Service published two rules impacting habitat designations under the ESA, but in October 2021, the Biden administration proposed to rescind those rules. If the Biden administration proposed rules are finalized, they could expand the geographic areas subject to habitat protections.
European Union
•The Industrial Emissions Directive (IED) 2010 provides the framework for granting permits for major industrial sites. It lays down rules on integrated prevention and control of air, water and soil pollution arising from industrial activities. As part of the IED framework, additional emission limit values are informed by sector specific and cross-sector Best Available Technology (BAT) Conclusions. These include the BAT Conclusions for the refining sector, for large combustion plants as well as common wastewater and waste gas treatment and management systems in the chemical sector. These may require bp to further reduce its emissions, particularly its air and water emissions.
•The EU Registration, Evaluation Authorization and Restriction of Chemicals (REACH) Regulation 2006 requires registration of chemical substances manufactured in or imported into the EU, together with the submission of relevant hazard and risk data. REACH affects our manufacturing or trading/import operations in the EU. bp maintains compliance by checking whether imports are covered by the registrations of non-EU suppliers’ representatives, preparing and submitting registration dossiers to cover new manufactured and imported substances, and updating previously submitted registrations as required. Some substances registered previously, including substances supplied to us by third parties for our use, are now subject to evaluation and review for potential authorization or restriction procedures, and possible banning, by the European Chemicals Agency and EU member state authorities. In addition, bp’s facilities and operations in several EU countries continue to undergo REACH compliance inspections by the competent authority for the respective EU member state. An amendment to the Annex of the Regulation on classification, labelling and packaging of substances and mixture (CLP Regulation) requires harmonized notification of information on hazardous materials (certain lubricant and fuel formations) to EU member state poison centres. The uniform notification rules applied as of January 2020 for consumer products, from 2021 for professional and will apply from 2024 for industrial uses. Following the end of the Brexit transition period in the UK, REACH formed part of retained EU law and the UK introduced a parallel UK REACH regime which applies in Great Britain only with REACH continuing to apply in Northern Ireland. Although UK REACH contains equivalent requirements to REACH, future developments are uncertain.
•The EU Offshore Safety Directive was adopted in 2013. Its purpose is to introduce a harmonized regime aimed at reducing the potential environmental, health and safety impacts of the offshore oil and gas industry throughout EU waters. The Directive has been implemented in the UK primarily through the Offshore Installations (Offshore Safety Directive) (Safety Case etc.) Regulations 2015.
•The Water Framework Directive (WFD) published in 2000 aims to protect the quantity and quality of ground and surface waters of the EU member states. The implementation in the EU member states is still ongoing, planned to be finalised by 2027. Future proceedings on the determination of pollutants/priority substances as well as environmental quality standards in line with the WFD may require additional compliance efforts and increased costs for managing freshwater withdrawals and discharges from bp’s EU operations.
United Kingdom
Following the UK’s exit from the European Union, operative EU laws were retained in UK law by the European Union (Withdrawal) Act 2018. The vast majority of environment related statutory instruments passed by the UK Government in anticipation of Brexit made no substantive changes to the current EU underlying regime, but rather sought to make the amendments required to allow their continued operation after the end of the transition period on 31 December 2020. The UK Government’s 2021 Environment Act and 25 Year Plan will be central to the UK’s
| | | | | | | | | | | | | | |
| | bp Annual Report and Form 20-F 2021 | | 359 |
environmental regime going forward but further changes are as yet uncertain. The Environment Act comprises various key parts including governance, waste and resource efficiency, air quality and environmental recall, water, nature and biodiversity and conservation covenants. The governance parts include a comprehensive framework for legally-binding environmental improvement targets; establish a framework for future policy statements on environmental principles to protect the environment by making environmental considerations a key part of policy development process across government; and establish the Office for Environmental Protection. Not all parts of the Act are yet in force and key details such as the final environment improvement targets have not yet been announced.
Other countries and regions
Regulations governing the discharge of treated water have also been developed in countries outside of the US and EU. This includes regulations in Trinidad and Angola which impacts bp’s production operations in those countries. In Trinidad, bp commissioned a new waste water treatment plant in 2020 to meet consent levels agreed with the regulators to apply water discharge rules arising from the Certificate of Environmental Clearance (CEC) Regulations 2001 and associated Water Pollution Rules 2007. In Angola, bp has upgraded produced water treatment systems to meet revised oil in water limits for produced water discharge under Executive Decree ED 97-14.
The Abidjan Convention, along with the Additional Protocol published in 2012, sets environmental quality standards for the discharge of chemicals to the marine environment. Mauritania and Senegal are both signatories to the Abidjan Convention. bp is currently constructing the offshore facilities to include produced water management systems to meet the environmental quality standards for our future gas operations in Mauritania and Senegal.
Environmental maritime regulations
bp’s shipping operations are subject to extensive national and international regulations governing operations, training, pollution prevention, liability, and insurance. These include:
•Liability and spill prevention and planning requirements governing, among others, tankers, barges, and offshore facilities are imposed by OPA in US waters. OPA also mandates a levy on imported and domestically produced oil to fund oil spill responses. Some states, including Alaska, Washington, Oregon and California, impose additional liability for oil spills. Outside US territorial waters, bp shipping tankers are subject to international pollution prevention, liability, spill response and preparedness regulations developed through the UN’s International Maritime Organization (IMO), including the International Convention on Civil Liability for Oil Pollution Damage, the International Convention for the Prevention of Pollution from Ships (MARPOL), the International Convention on Oil Pollution, Preparedness, Response and Co-operation, and the International Convention on Civil Liability for Bunker Oil Pollution Damage. In April 2010, the Hazardous and Noxious Substance (HNS) Protocol 2010 was adopted to address issues that have inhibited ratification of the International Convention on Liability and Compensation for Damage in Connection with the Carriage of Hazardous and Noxious Substances by Sea 1996. As at 31 December 2021, the HNS Convention had not entered into force.
•A global sulphur cap of 0.5% applies to marine fuel under MARPOL. In order to comply, ships either need to consume low sulphur marine fuels, operate on alternative low sulphur fuels such as LNG or implement approved abatement technology to enable them to meet the low sulphur emissions requirements while continuing to use higher sulphur fuel. This global cap does not alter the lower limits that apply in the sulphur oxides Emissions Control Areas established by the IMO.
•From 2023 all vessels over 400 gross tonnage will be subject to IMO requirements as to energy efficiency design (EEXI) and the carbon intensity of operations (CII).
•Under proposed EU legislation (pending approval by the European Parliament) maritime transport will be brought within the ambit of the EU ETS from 2023, applicable to all vessels over 5000 gross tonnage calling at EU ports regardless of a vessel’s flag.
•The Convention for the Protection of the Marine Environment of the North-East Atlantic (OSPAR), aims to protect the marine
environment of the North-East Atlantic. The OSPAR 2012 Recommendation and Guideline for the implementation of a risk-based approach to the management of produced water discharges from offshore installations in the North Sea supports a key goal of working towards eliminating harmful discharges. In 2020 the International Association of Oil and Gas Producers issued a report “Oil And Gas Risk Based Assessment of Offshore Produced Water Discharges” which presents industry good practice and aims to broaden the understanding and acceptance of Risk Based Assessment (RBA) techniques internationally and improve consistency in the application of assumptions, levels of conservatism, and selection of risk endpoints.
To meet its financial responsibility requirements, BP Shipping maintains marine oil pollution liability insurance in respect of its operated ships to a maximum limit of $1 billion for each occurrence through mutual insurance associations (P&I Clubs), although there can be no assurance that a spill would necessarily be adequately covered by insurance or that liabilities would not exceed insurance recoveries.
International trade sanctions
During the period covered by this report, non-US subsidiaries«, or other non-US entities of bp, conducted limited activities in, or with persons from, certain countries identified by the US Department of State as State Sponsors of Terrorism or otherwise subject to US, EU and UK sanctions (Sanctioned Countries). Sanctions restrictions continue to be insignificant to the group’s financial condition and results of operations. bp monitors its activities with Sanctioned Countries, persons from Sanctioned Countries and individuals and companies subject to US, EU and UK sanctions and seeks to comply with applicable sanctions laws and regulations.
bp has a 28.83% interest in and operates the Shah Deniz field in Azerbaijan (Shah Deniz), has a 28.83% interest in and performs some operations for a related gas pipeline entity, South Caucasus Pipeline Company Limited (SCPC), and has a 23% non-operating interest in a related gas marketing entity, Azerbaijan Gas Supply Company Limited (AGSC). Naftiran Intertrade Co. Limited and NICO SPV Limited (collectively, NICO) have a 10% non-operating interest in each of Shah Deniz and SCPC and an 8% non-operating interest in AGSC. Shah Deniz, SCPC and AGSC continue in operation as they were excluded from the application of US sanctions and fall within the exception for certain natural gas projects under Section 603 of the Iran Threat Reduction and Syria Human Rights Act of 2012 (ITRA).
On 3 December 2018 bp entered into an agreement with, among others, SOCAR and NICO pursuant to which SOCAR pays to BP Exploration (Shah Deniz) Limited (BPXSD), as the Shah Deniz operator, compensation for NICO’s waiver of its right to lift its share of Shah Deniz condensate. Such amounts are used to cover cash calls to NICO in respect of operating costs due from NICO to BPXSD. On 26 October 2020, OFAC issued an amended licence in relation to these arrangements.
Following the imposition in 2011 of further US and EU sanctions against Syria, bp terminated all sales of crude oil and petroleum products into Syria, though bp continues to supply aviation fuel to non-governmental Syrian resellers outside of Syria.
bp has a joint arrangement in Cuba which imports, manufactures, markets and sells lubricants.
During 2014, the US and the EU imposed sanctions on certain sectors of the Russian economy (energy, finance and defence/military) and on certain individuals and entities, including Rosneft. These sectoral sanctions include restrictions on the provision of financial assistance, technical assistance, and services in relation to exploration and production activity in deep water, shale, and offshore Arctic.
Additional US sanctions have been imposed since 2014, broadening the scope of US sanctions on Russia-related activity to include certain international deep water, shale, and offshore Arctic projects as well as the provision of goods and services for Russian energy export pipelines.
In response to Russia’s military action in Ukraine in 2022, the US, EU, UK and many other countries have imposed broad economic and trade sanctions. The scope of these sanctions has evolved at pace and continues to do so across various jurisdictions including restrictions on dealing with designated individuals and entities; restrictions on the
| | | | | | | | | | | | | | |
360 | | bp Annual Report and Form 20-F 2021 | | |
Russian financial sector; blocking economic activity in the Luhansk and Donetsk regions of Ukraine; and imposing export controls limiting the export of a wide range of goods and technical assistance to Russia. In the US, President Biden has issued an Executive Order prohibiting: the importation into the US of crude oil, LNG and various other hydrocarbon products of Russian origin; new investment in the Russian energy sector by US persons; and designates certain participatory actions by US persons or persons within the US in transactions which are prohibited.
On 15 March 2022, the EU issued further sanctions prohibiting dealings with entities established in Russia and specifically designated certain Russian entities within the relevant EU regulation. Rosneft is one of the specifically designated entities. Limited exemptions apply to these prohibitions including in respect of transactions which are necessary for the purchase, import or transport of fossil fuels (including oil and gas) and other commodities into the EU, and transactions relating to energy projects outside of Russia in which a sanctioned entity is a minority shareholder.
The EU has also prohibited certain investments, financing and participation in the Russian energy sector. This includes prohibiting the acquisition of any new, or the extension of any existing, participation in any legal entity or body, whether established in Russian or any non-EU country which operates in the Russian energy sector and the provision of credit or certain other financing to such entities. The creation of new joint ventures with such entities is also prohibited. Derogations from these prohibitions may be sought if an activity is necessary for ensuring critical energy supply to the EU or it exclusively concerns a legal entity operating in the Russian energy sector and which is owned by an EU legal entity.
In response, Russia has implemented new counter-sanctions including restrictions on the divestment from Russian assets by foreign investors and a temporary prohibition on registrars and depositories from making payment of dividends and interest on Russian securities in favour of foreign investors. Further details including confirmation of the precise terms or application of these counter-sanctions are not yet known.
The situation is fast moving and bp continues to monitor the impact of sanctions and other international restrictions on our current business activities, income and investment in Russia.
bp maintains bank accounts and has registered and paid required fees to maintain registrations of patents and trademarks in certain Sanctioned Countries.
bp has equity interests in non-operated joint arrangements« with air fuel sellers, resellers, and fuel delivery services around the world.
From time to time, the joint arrangement operator or other partners may sell or deliver fuel to airlines from Sanctioned Countries or flights to Sanctioned Countries, without bp's involvement.
bp has no control over the activities non-controlled associates« may undertake in Sanctioned Countries or with persons from Sanctioned Countries.
Disclosure pursuant to ITRA Section 219
To our knowledge, none of bp’s activities, transactions or dealings are required to be disclosed pursuant to ITRA Section 219, with the following possible exception.
On 17 July 2018, BP Iran Limited terminated its lease of an office in Tehran. The office had been used for administrative activities. In 2021, taxes with an aggregate US dollar equivalent value of approximately $1,600 were paid from a bp trust account held with Tadvin Co. to Iranian public entities. No gross revenues or net profits were attributable to these activities.
Material contracts
On 4 April 2016 the district court approved the Consent Decree among BP Exploration & Production Inc., BP Corporation North America Inc., BP p.l.c., the United States and the states of Alabama, Florida, Louisiana, Mississippi and Texas (the Gulf states) which fully and finally resolved any and all natural resource damages (NRD) claims of the United States, the Gulf states, and their respective natural resource trustees and all Clean
Water Act (CWA) penalty claims, and certain other claims of the United States and the Gulf states.
Concurrently, the definitive Settlement Agreement that bp entered into with the Gulf states (Settlement Agreement) with respect to State claims for economic, property and other losses became effective.
bp has filed the Consent Decree and the Settlement Agreement as exhibits to its Annual Report on Form 20-F 2020 filed with the SEC. For further details of the Consent Decree and the Settlement Agreement, see Legal proceedings in bp Annual Report and Form 20-F 2015.
Property, plant and equipment
bp has freehold and leasehold interests in real estate and other tangible assets in numerous countries, but no individual property is significant to the group as a whole. For more on the significant subsidiaries« of the group at 31 December 2021 and the group percentage of ordinary share capital see Financial statements – Note 36. For information on significant joint ventures« and associates« of the group see Financial statements – Notes 15 and 16.
Related-party transactions
Transactions between the group and its significant joint ventures and associates are summarized in Financial statements – Note 15 and Note 16. In the ordinary course of its business, the group enters into transactions with various organizations with which some of its directors or executive officers are associated. Except as described in this report, the group did not have any material transactions or transactions of an unusual nature with, and did not make loans to, related parties in the period commencing 1 January 2022 to 1 March 2022.
Corporate governance practices
In the US, bp ADSs are listed on the New York Stock Exchange (NYSE). The significant differences between bp’s corporate governance practices as a UK company and those required by NYSE listing standards for US companies are listed as follows:
Independence
As set out on page 92, bp has adopted separate terms of reference for the board and each of its committees as part of its corporate governance framework. The terms of reference for the board and each of its committees were last updated with effect from 3 December 2021. The terms of reference reflect the UK Corporate Governance Code approach to corporate governance. As such, the way in which bp makes determinations of directors' independence djffers from the NYSE approach.
bp’s corporate governance framework requires that all non-executive directors be determined by the board to be ‘independent in character and judgement and free from any business or other relationship which could materially interfere with the exercise of their judgement’. The bp board has determined that, in its judgement, all of the non-executive directors are independent. In doing so, however, the board did not explicitly take into consideration the independence requirements outlined in the NYSE’s listing standards.
Committees
bp has a number of board committees that are broadly comparable in purpose and composition to those required by NYSE rules for domestic US companies. For instance, bp has a remuneration (rather than a compensation) committee. bp also has an audit committee, which NYSE rules require for both US companies and foreign private issuers. These committees are composed solely of non-executive directors whom the board has determined to be independent, in the manner described above.
Each committee operates under its own terms of reference together with a set of terms applicable to all the committees (see the board committee reports on pages 104-115 and 116).
Under US securities law and the listing standards of the NYSE, bp is required to have an audit committee that satisfies the requirements of Rule 10A-3 under the Exchange Act and Section 303A.06 of the NYSE Listed Company Manual. bp’s audit committee complies with these requirements. The bp audit committee does not have direct responsibility
| | | | | | | | | | | | | | |
| | bp Annual Report and Form 20-F 2021 | | 361 |
for the appointment, reappointment or removal of the independent auditors. Instead, it follows the UK Companies Act 2006 and the UK Corporate Governance code 2018 by making recommendations to the board on these matters for it to put forward for shareholder approval at the AGM.
One of the NYSE’s additional requirements for the audit committee states that at least one member of the audit committee is to have ‘accounting or related financial management expertise’. The board determined that Tushar Morzaria possesses such expertise and also possesses the financial and audit committee experiences set forth in both the UK Corporate Governance Code and SEC rules (see Audit committee report on page 107). Mr Morzaria is the audit committee financial expert as defined in Item 16A of Form 20-F.
Shareholder approval of equity compensation plans
The NYSE rules for US companies require that shareholders must be given the opportunity to vote on all equity-compensation plans and material revisions to those plans. bp complies with UK requirements that are similar to the NYSE rules. The board, however, does not explicitly take into consideration the NYSE’s detailed definition of what are considered ‘material revisions’.
Code of ethics
The NYSE rules require that US companies adopt and disclose a code of business conduct and ethics for directors, officers and employees. bp has adopted a code of conduct, which applies to all employees and members of the board. In addition, bp has adopted a code of ethics for senior financial officers as required by the SEC. bp considers that these codes and policies address the matters specified in the NYSE rules for US companies. During 2021, the board adopted a diversity policy, which requires it to encourage a diverse and inclusive working environment in the boardroom, where everyone is accepted, valued and receives fair treatment according to their different needs and situations without discrimination or prejudice.
Code of ethics
The company has adopted a code of ethics for its chief executive officer, chief financial officer, svp accounting reporting control (group controller and chief accounting officer) and svp internal audit (group head of audit) whose roles are equivalent to the SEC roles as required by the provisions of Section 406 of the Sarbanes-Oxley Act of 2002 and the rules issued by the SEC. There have been no waivers from the code of ethics relating to any officers. A copy of the code of ethics can be found at bp.com/codeofethics
bp also has a code of conduct, which is applicable to all employees, officers and members of the board. This was updated (and published) in February 2020.
Controls and procedures
Evaluation of disclosure controls and procedures
The company maintains ‘disclosure controls and procedures’, as such term is defined in Exchange Act Rule 13a-15(e), that are designed to ensure that information required to be disclosed in reports the company files or submits under the Exchange Act is recorded, processed, summarized and reported within the time periods specified in the Securities and Exchange Commission rules and forms, and that such information is accumulated and communicated to management, including the company’s group chief executive and chief financial officer, as appropriate, to allow timely decisions regarding required disclosure.
In designing and evaluating our disclosure controls and procedures, our management, including the group chief executive and chief financial officer, recognize that any controls and procedures, no matter how well designed and operated, can provide only reasonable, not absolute, assurance that the objectives of the disclosure controls and procedures are met. Because of the inherent limitations in all control systems, no evaluation of controls can provide absolute assurance that all control issues and instances of fraud within the company, if any, have been detected. Further, in the design and evaluation of our disclosure controls and procedures our management necessarily was required to apply its judgement in evaluating the costs and benefits of possible control and
procedure design options. Also, we have investments in unconsolidated entities. As we do not control these entities, our disclosure controls and procedures with respect to such entities are necessarily substantially more limited than those we maintain with respect to our consolidated subsidiaries«. Because of the inherent limitations in a cost-effective control system, misstatements due to error or fraud may occur and not be detected. The company’s disclosure controls and procedures have been designed to meet, and management believes that they meet, reasonable assurance standards.
The company’s management, with the participation of the company’s group chief executive and chief financial officer, has evaluated the effectiveness of the company’s disclosure controls and procedures pursuant to Exchange Act Rule 13a-15(b) as of the end of the period covered by this annual report. Based on that evaluation, the group chief executive and chief financial officer have concluded that the company’s disclosure controls and procedures were effective at a reasonable assurance level.
Management’s report on internal control over financial reporting
Management of bp is responsible for establishing and maintaining adequate internal control over financial reporting. bp’s internal control over financial reporting is a process designed under the supervision of the principal executive and financial officers to provide reasonable assurance regarding the reliability of financial reporting and the preparation of bp’s financial statements for external reporting purposes in accordance with IFRS.
As of the end of the 2021 fiscal year, management conducted an assessment of the effectiveness of internal control over financial reporting in accordance with the criteria in the UK Financial Reporting Council’s Guidance on Risk Management, Internal Control and Related Financial and Business Reporting relating to internal control over financial reporting. Based on this assessment, management has determined that bp’s internal control over financial reporting as of 31 December 2021 was effective.
The company’s internal control over financial reporting includes policies and procedures that pertain to the maintenance of records that, in reasonable detail, accurately and fairly reflect transactions and dispositions of assets; provide reasonable assurances that transactions are recorded as necessary to permit preparation of financial statements in accordance with IFRS and that receipts and expenditures are being made only in accordance with authorizations of management and the directors of bp; and provide reasonable assurance regarding prevention or timely detection of unauthorized acquisition, use or disposition of bp’s assets that could have a material effect on our financial statements. bp’s internal control over financial reporting as of 31 December 2021 has been audited by Deloitte LLP, an independent registered public accounting firm, as stated in their report appearing on page 172 of bp Annual Report and Form 20-F 2021.
Changes in internal control over financial reporting
There were no changes in the group’s internal control over financial reporting that occurred during the period covered by the Form 20-F that have materially affected or are reasonably likely to materially affect our internal control over financial reporting.
Principal accountant's fees and services
The audit committee has established policies and procedures for the engagement of the independent registered public accounting firm, Deloitte LLP, to render audit and certain assurance services. The policies provide for pre-approval by the audit committee of specifically defined audit, audit-related, non-audit and other services that are not prohibited by regulatory or other professional requirements. Deloitte is engaged for these services when its expertise and experience of bp are important. Most of this work is of an audit nature. The committee regularly reviews the policy, including in 2020, when it was updated to reflect changes resulting from the FRC Ethical Standard (December 2019).
Under the policy, pre-approval is given for specific services within the following categories: i) audit-related services, such those required by law
| | | | | | | | | | | | | | |
362 | | bp Annual Report and Form 20-F 2021 | | |
or where the auditor is best placed to undertake such work on similar terms, ii) non-audit services required by law, such as reporting required by a regulatory authority, and iii) other services, such as additional assurance or updates on applicable law and accounting standards. bp operates a two-tier system for audit and non-audit services. For audit related services, the audit committee has a pre-approved aggregate level, within which specific work may be approved by management. Non-audit services are pre-approved for management to authorize per individual engagement, but above a defined level must be approved by the chairman of the audit committee or the full committee. The audit committee has delegated to the chairman of the audit committee authority to approve permitted services provided that the chairman reports any decisions to the committee at its next scheduled meeting. Any proposed service not included in the approved service list must be approved in advance by the audit committee chairman and reported to the committee, or approved by the full audit committee in advance of commencement of the engagement.
The audit committee evaluates the performance of the auditor each year. The audit fees payable to Deloitte are reviewed by the committee in the context of other global companies for cost effectiveness. The committee keeps under review the scope and results of audit work and the independence and objectivity of the auditor. External regulation and bp policy requires the auditor to rotate its lead audit partner every five years. See Financial statements – Note 35 and Audit committee report on page 107 for details of fees for services provided by the auditor.
Directors’ report information
This section of bp Annual Report and Form 20-F 2021 forms part of, and includes certain disclosures which are required by law to be included in, the Directors’ report.
Indemnity provisions
In accordance with BP’s Articles of Association, on appointment each director is granted an indemnity from the company in respect of liabilities incurred as a result of their office, to the extent permitted by law. These indemnities were in force throughout the financial year and at the date of this report. In respect of those liabilities for which directors may not be indemnified, the company maintained a directors’ and officers’ liability insurance policy throughout 2021. During the year, a review of the terms and scope of the policy was undertaken as part of the annual renewal. Although their defence costs may be met, neither the company’s indemnity nor insurance provides cover in the event that the director is proved to have acted fraudulently or dishonestly. Certain subsidiaries« are trustees of the group’s pension schemes. Each director of these subsidiaries is granted an indemnity from the company in respect of liabilities incurred as a result of such a subsidiary’s activities as a trustee of the pension scheme, to the extent permitted by law. These indemnities were in force throughout the financial year and at the date of this report.
Financial risk management objectives and policies
The disclosures in relation to financial risk management objectives and policies, including the policy for hedging, are included in How we manage risk on pages 73-75, Liquidity and capital resources on page 342 and Financial statements – Notes 28 and 29.
Exposure to price risk, credit risk, liquidity risk and cash flow risk
The disclosures in relation to exposure to price risk, credit risk, liquidity risk and cash flow risk are included in Financial statements – Note 28.
Important events since the end of the financial year
Disclosures of the particulars of the important events affecting bp which have occurred since the end of the financial year are included in the Strategic report as well as in other places in the Directors’ report. In relation to bp's interests in Russia, disclosures are provided throughout this bp Annual Report and Form 20-F including pages 3, 48, 49 and 253.
Likely future developments in the business
An indication of the likely future developments in the business of the company is included in the Strategic report.
Research and development
Indications of our activities in the field of research and development are provided throughout the Strategic report and the Directors’ report including examples on pages 14 (developing low carbon, CCS enabled hydrogen in the UK), 15 (innovation across the business), and 60 (impact on technology). See also pages 13 and 204 for our expenditure on research and development.
Branches
As a global group our interests and activities are held or operated through subsidiaries, branches, joint arrangements« or associates« established in – and subject to the laws and regulations of – many different jurisdictions.
Employees
Disclosures in respect of how the directors have engaged with employees and had regard to their interests are included in How the board has engaged with shareholders, the workforce and other stakeholders on pages 94 to 96 and section 172 statement on pages 80 and 97.
The disclosures concerning policies in relation to the employment of disabled persons and employee involvement are included in Sustainability – our people on pages 71 and 72.
Employee share schemes
Certain shares held as a result of participation in some employee share plans carry voting rights. Voting rights in respect of such shares are exercisable via a nominee. Dividend waivers are in place in respect of unallocated shares held in employee share plan trusts.
Suppliers, customers and others
Disclosures in respect of how the directors have engaged with suppliers, customers and others in business relationships with the company are included in How the board has engaged with shareholders, the workforce and other stakeholders on page 93 and section 172 statement on pages 80 and 97.
Change of control provisions
On 5 October 2015, the United States lodged with the district court in MDL 2179 a proposed Consent Decree between the United States, the Gulf states, BP Exploration & Production Inc., BP Corporation North America Inc. and BP p.l.c., to fully and finally resolve any and all natural resource damages claims of the United States, the Gulf states and their respective natural resource trustees and all Clean Water Act penalty claims, and certain other claims of the United States and the Gulf states. Concurrently, bp entered into a definitive Settlement Agreement with the five Gulf states (Settlement Agreement) with respect to state claims for economic, property and other losses. On 4 April 2016, the district court approved the Consent Decree, at which time the Consent Decree and Settlement Agreement became effective. The federal government and the Gulf states may jointly elect to accelerate the payments under the Consent Decree in the event of a change of control or insolvency of BP p.l.c., and the Gulf states individually have similar acceleration rights under the Settlement Agreement. For further details of the Consent Decree and the Settlement Agreement, see Legal proceedings in BP Annual Report and Form 20-F 2015.
Greenhouse gas emissions, energy consumption and energy efficiency
Disclosures in relation to greenhouse gas emissions, energy consumption and energy efficiency are included in Sustainability – on page 53.
| | | | | | | | | | | | | | |
| | bp Annual Report and Form 20-F 2021 | | 363 |
Disclosures required under Listing Rule 9.8.4R
The information required to be disclosed by Listing Rule 9.8.4R can be located as set out below:
| | | | | |
| Information required | Page |
| (1) Amount of interest capitalized | 204 | |
| (2) – (4) | Not applicable |
| (5), (6) Waiver of director emoluments | 132 |
| (7) – (11) | Not applicable |
| (12), (13) Dividend waivers | 363 | |
| (14) | Not applicable |
Cautionary statement
In order to utilize the ‘safe harbor’ provisions of the United States Private Securities Litigation Reform Act of 1995 (the ‘PSLRA’) and the general doctrine of cautionary statements, bp is providing the following cautionary statement.
This document contains certain forecasts, projections and forward-looking statements - that is, statements related to future, not past, events and circumstances - with respect to the financial condition, results of operations and businesses of bp and certain of the plans and objectives of bp with respect to these items. These statements may generally, but not always, be identified by the use of words such as ‘will’, ‘expects’, ‘is expected to’, ‘aims’, ‘should’, ‘may’, ‘objective’, ‘is likely to’, ‘intends’, ‘believes’, ‘anticipates’, ‘plans’, ‘we see’ or similar expressions. In particular, among other statements, (i) certain statements in the Chairman’s letter (pages 4-5), the chief executive officer’s letter (pages 6-7), the Strategic report (inside cover and pages 1-80), Additional disclosures (pages 337-365) and Shareholder information (pages 367-376), including but not limited to statements under the headings ‘Energy Outlook’, ‘Our strategy and business model’, ‘Our strategic focus areas’, ‘Our financial frame and investor proposition’, ‘2022 guidance’ and ‘Consistency with the Paris goals’ and including but not limited to statements regarding: plans and expectations relating to operating cash flow, capital expenditure (including total capital expenditure, organic capital expenditure and inorganic capital expenditure) and allocation of capital expenditure, financial frame, deleveraging bp’s balance sheet, working capital and operating cash flows, liquidity, capital discipline, future shareholder distributions, allocation of capital to bp’s energy transition strategy, amount or timing of payments related to divestment proceeds, net debt, gearing and future dividend payments and share buybacks; bp’s plans and expectations regarding its oil and gas business, expectations regarding earnings from bp’s convenience and mobility business; bp’s aim to reduce oil and gas production by 20% against a 2019 baseline by 2025; bp’s aim to install more than 100,000 EV charge points globally by 2030; bp’s aim to double adjusted EBITDA by 2030, while sustaining returns of 15 to 20%; bp’s aim to increase the proportion of capital expenditure in transition growth businesses to more than 40% by 2025 and to around 50% by 2030, and bp’s expectation that the capital employed in those businesses will rise from over 20% in 2025 to around 40% by 2030, with associated returns of $9-10 billion adjusted EBITDA in 2030; bp’s aim to grow convenience gross margin at around 7% per annum; bp’s aims regarding hydrogen, including the aim to capture a 10% share in core markets by 2030; bp’s target of having developed renewables of 20GW to final investment decision by 2025 and aim to increase this to 50GW by 2030; bp’s ambition regarding climate change, sustainability and greenhouse gas emissions, including its aims of being a net zero company by 2050 or sooner, its aims regarding Scope 1, Scope 2 and Scope 3 emissions, its expectations that its Scope 1 and 2 emissions from its operations will be 50% lower in 2030 than in 2019; expectations for the energy transition and the carbon content of bp’s oil and gas production; expectations that bp’s net production of oil, natural gas and natural gas liquids in 2030 will be reduced by at least 1 million barrels of oil equivalent per day compared with 2019; expectations that bp’s oil refining throughput will fall to around 1.2mmb/d by 2030, with biofuels production to triple over the same period; and its aim to increase production of biogas 20-fold by 2030; expectations regarding the global economy and urbanization; expectations regarding clean hydrogen
production capacity and investment; expectations regarding medium and long-term oil and gas prices and price volatility, the consistency of pricing assumptions with scenarios that are consistent with the Paris goals and bp’s resilience to Paris-consistent pathways; expectations regarding world energy demand, including the growth in relative demand for renewables, oil and gas, and the proportional growth of renewables; expectations regarding bp’s short-, medium- and long-term targets and aims for emissions and carbon intensity of bp’s production and marketed products, and statements regarding the resilience of bp’s strategy and portfolio across multiple climate scenarios and the uncertainties in the energy transition; expectations relating to the effects of Russia’s 2022 invasion of Ukraine, including economic and financial consequences; plans and expectations regarding bp’s exit of its shareholding in Rosneft and other investments in Russia; plans and expectations regarding bp’s level of investment in energy sources and technologies other than oil and gas resources and reserves, including plans to increase low carbon investment to at least $3-4 billion per year by 2025 and to at least $5 billion per year by 2030; plans and expectations regarding bp’s five aims to get bp to net zero, including the 2025 targets, the 2030 aims and the aims to be net zero across its entire operations on an absolute basis by 2050 or sooner, net zero on an absolute basis across the carbon in its upstream oil and gas production by 2050 or sooner, and net zero on the carbon intensity of the energy products sold by 2050 or sooner, the aim to install methane measurement at all existing major oil and gas processing sites by 2023, publish the data, and then drive a 50% reduction in methane intensity of operations, and the aim to increase the proportion of investment bp makes into its non-oil and gas businesses; plans and expectations regarding bp’s five aims to get the world to net zero carbon emissions, including the aim to more actively advocate for policies that support net zero, including carbon pricing, the aim to incentivize bp’s global workforce to deliver on these aims and mobilize them to become advocates for net zero, the aim to set new expectations for relationships with trade associations around the globe, the aim to be recognized as an industry leader for the transparency of its reporting, and the aim to launch a new team to create integrated clean energy and mobility solutions; plans and expectations with respect to the percentage of capital expenditure that will be in convenience and mobility and low-carbon energy; expectations that the pace of transition to a lower carbon economy and energy system could accelerate; plans and expectations regarding the blue hydrogen production facility in Teesside expectations regarding future legislative or regulatory action related to greenhouse gases, including emissions disclosure, emissions trading, and fuel-specific regulations, and their impact on bp; expectations regarding pensions and other post-retirement benefits, including contributions; expectations regarding payments under contractual obligations and sales commitments; plans and expectations regarding bp’s workforce, including bp’s targets regarding diversity, inclusion and equality; plans for incentivising bp’s global workforce; expectations regarding bp’s ability to prevent, respond to and recover from cyberattacks or hostile actions; plans and projections regarding oil and gas reserves, including the turnover time of proved undeveloped reserves to proved developed reserves and volume of turnover; expectations regarding the costs of environmental restoration, remediation and abatement programmes; plans and expectations that bp will not undertake exploration activity in new countries; expectations regarding contingent liabilities and their impact on bp; expectations regarding the future value of assets; expectations with respect to reserves bookings from new discoveries; plans and expectations with regard to the supply and trading function, the fuels and the lubricants businesses; plans and expectations relating to biofuel production and other decarbonization aims; plans and expectations regarding sales commitments of bp and its equity-accounted entities; expectations regarding underlying production and capital investment; expectations with respect to ROACE and underlying replacement cost profit before interest, tax, depreciation and amortisation; plans and expectations regarding investments in resilient hydrocarbons; plans and expectations regarding investment, development, and production levels and the timing thereof with respect to projects and partnerships in Angola, Australia, Azerbaijan, Brazil, China, Egypt, the Gambia, India, Indonesia, Iraq, Mexico, Norway, Russia, Turkey, Oman, the UK North Sea, the Gulf of Mexico, and the continental United States; expectations regarding future government action, regulations and policy, their impact on bp’s business and plans regarding compliance with such regulations; expectations regarding legal and trial proceedings, court decisions,
| | | | | | | | | | | | | | |
364 | | bp Annual Report and Form 20-F 2021 | | |
potential investigations and civil actions by regulators, government entities and/ or other entities or parties, and the timing and potential impact of such proceedings and bp’s intentions in respect thereof; plans and expectations regarding relationships with governments, customers, partners, suppliers, communities and key stakeholders; plans and expectations for bp’s Jio-bp joint venture with Reliance, including the expectation for the existing network of 1,400 Reliance fuel stations to be rebranded to Jio-bp over the coming months; plans and expectations to deliver 2022 financial targets; expectations regarding customer touchpoints, number of strategic convenience sites, number of retail sites in growth markets, Castrol sales and other operating revenues, number of electric vehicle charge points, margin share from convenience and electrification, Upstream unit production costs, Upstream production, bp-operated hydrocarbon plant reliability, refining throughout, bp-operated refining availability, bioenergy production, LNG portfolio and projects, developed renewables to final investment decision, and traded electricity; expectations regarding oil prices; expectations regarding upstream reported and underlying production excluding Rosneft, total capital expenditure, depreciation, depletion and amortization charges, divestments and other proceeds, Gulf of Mexico oil spill payments (pre-tax), other businesses and corporate underlying annual charge, and the effective tax rate and the underlying effective tax rate; plans and expectations regarding the effectiveness of the group’s foreign currency exchange risk management; expectations regarding bp’s partnership with Equinor for offshore wind in the US; expectations regarding bp’s stake in Aker BP; expectations for oil supply and demand to move back into balance through 2022, with lower levels of spare capacity price volatility likely; expectations that demand for refined products will remain strong over the remaining useful life of existing assets; expectations that the majority of bp’s Upstream oil and gas properties will start decommissioning within the next two decades; expectations that the majority of bp’s reserves and resources that support the carrying value of the group’s existing oil and gas properties are expected to be produced over the next 10 years; expectations regarding level and volatility of other businesses and corporate charges for 2022; plans and expectations regarding bp’s in-scope projects’ impact on biodiversity; expectations regarding bp’s impact on air emissions and water use and management, including bp’s aim to become water positive by 2035; expectations regarding fulfillment of existing delivery commitments for oil and gas; plans and expectations that the Thunder Horse South Expansion Phase 2 and the Manuel projects will deliver around 400mboe/d of oil and gas production by the mid-2020s; plans and expectations regarding the aim of zero routine flaring, private investment in new energy infrastructure relating to the Bighorn solar project, and the 9GW of solar development projects spanning 12 states; plans and expectations regarding the green hydrogen plant at bp’s Rotterdam refinery in the Netherlands, the continued partnership with Marks & Spencer, and the offshore wind leases in partnership with Energie Baden-Württemberg (EnBW); expectations that the Mad Dog Phase 2 project will start up in the second quarter of 2022; expectations that the Cassia Compression project will start up in 2022; expectations that the Tangguh expansion project will add 3.8 million tonnes per annum (mtpa) of production capacity to the existing facility, and that first gas from the project will be in 2023; plans and expectations regarding bp’s offshore wind projects and lease options; plans and expectations regarding bp Ventures, Launchpad and Lightsource bp; and (ii) certain statements in Corporate governance (pages 81-115) and the Directors’ remuneration report (pages 116-141) with regard to: the anticipated future composition of the board of directors and the effects thereof; the board’s goals and areas of focus, including changes to KPIs and those goals stemming from the board’s annual evaluation; plans and expectations regarding directors’ share ownership and remuneration; plans regarding the governance and remuneration processes; and goals, activities and areas of focus of board committees, are all forward looking in nature. By their nature, forward-looking statements involve risk and uncertainty because they relate to events and depend on circumstances that will or may occur in the future and are outside the control of bp. Actual results or outcomes, including the fair value of bp’s Rosneft shareholding, may differ materially from those expressed in such statements, depending on a variety of factors, including: the specific factors identified in the discussions accompanying such forward looking statements; the effects of bp exiting its shareholding in Rosneft and other investments in Russia; the effects of the COVID-19 pandemic and uncertainties about its impact and duration;
the receipt of relevant third party and/or regulatory approvals; the timing and level of maintenance and/or turnaround activity; the timing and volume of refinery additions and outages; the timing of bringing new projects onstream; the timing, quantum and nature of certain acquisitions and divestments; future levels of industry product supply, demand and pricing, including supply growth in North America; OPEC+ quota restrictions; production-sharing agreements effects; operational and safety problems; potential lapses in product quality; economic and financial market conditions generally or in various countries and regions; political stability and economic growth in relevant areas of the world; changes in laws and governmental regulations and policies, including related to climate change; changes in social attitudes and customer preferences; regulatory or legal actions including the types of enforcement action pursued and the nature of remedies sought or imposed; the actions of prosecutors, regulatory authorities and courts; delays in the processes for resolving claims; amounts ultimately determined to be payable and the timing of payments relating to the Gulf of Mexico oil spill; exchange rate fluctuations; development and use of new technology; recruitment and retention of a skilled workforce; the success or otherwise of partnering; the actions of competitors, trading partners, contractors, subcontractors, creditors, rating agencies and others; bp’s access to future credit resources; business disruption and crisis management; the impact on bp’s reputation of ethical misconduct and noncompliance with regulatory obligations; trading losses; major uninsured losses; the possibility that international sanctions or other steps taken by governmental authorities or any other relevant persons may impact Rosneft's business or outlook, bp’s ability to sell its interests in Rosneft, or the price for which bp could sell such interests; the possibility that actions of any competent authorities or any other relevant persons may impact bp's interests in Russia, or otherwise limit bp's ability to sell its interests in Rosneft, or the price for which it could sell such interests; the possibility that bp will achieve a sale price for its interests in Rosneft and its other Russian interests that is significantly below the net book value of those assets, including as a result of the timing and circumstances of bp’s exit; decisions by Rosneft’s management and board of directors; the actions of contractors; natural disasters and adverse weather conditions; changes in public expectations and other changes to business conditions; public health situations (including an outbreak of an epidemic or pandemic); wars and acts of terrorism; cyberattacks or sabotage; and other factors discussed elsewhere in this report including under Risk factors (pages 76-79). In addition to factors set forth elsewhere in this report, those set out above are important factors, although not exhaustive, that may cause actual results and developments to differ materially from those expressed or implied by these forward-looking statements.
Statements regarding competitive position
Statements referring to bp’s competitive position are based on the company’s belief and, in some cases, rely on a range of sources, including investment analysts’ reports, independent market studies and bp’s internal assessments of market share based on publicly available information about the financial results and performance of market participants.
| | | | | | | | | | | | | | |
| | bp Annual Report and Form 20-F 2021 | | 365 |
THIS PAGE HAS BEEN LEFT BLANK INTENTIONALLY
| | | | | | | | | | | | | | |
366 | | bp Annual Report and Form 20-F 2021 | | |
| | | | | | | | | | | | | | |
| | | | |
| Shareholder information | | |
| | | | |
| | | |
| | | |
| | | |
| | | |
| | | |
| | | |
| | | |
| | | |
| | | |
| | | |
| | | |
| 2022 Shareholder calendar | | |
| | | | |
| | | | |
| | | | |
| | | | |
| | | | |
| | | | |
| | | | |
| | | | |
| | | | |
| | | | |
| | | | |
| | | | |
| | | | |
| | | | |
| | | | |
| | | | |
| | | | |
| | | | |
| | | | |
| | | | |
| | | | |
| | | | |
| | | | |
| | | | |
| | | | |
| | | | |
| | | | |
| | | | |
| | | | |
| | | | |
| | | | |
| | | | | | | | | | | | | | |
| | bp Annual Report and Form 20-F 2021 | | 367 |
Share prices and listings
Markets and market prices
The primary market for the company’s ordinary shares (trading symbol ‘BP.’), 8% cumulative first preference shares (trading symbol ‘BP.A’) and 9% cumulative second preference shares (trading symbol ‘BP.B’) is the London Stock Exchange (LSE). The company’s ordinary shares are a constituent element of the Financial Times Stock Exchange 100 Index.
In the US, the company’s securities are listed and traded on the New York Stock Exchange (NYSE) in the form of ADSs (trading symbol ‘BP’), for which JPMorgan Chase Bank, N.A. is the depositary (the Depositary) and transfer agent. The Depositary’s principal office is 383 Madison Avenue, Floor 11, New York, NY, 10179, US. Each ADS represents six ordinary shares. ADSs are evidenced by American depositary receipts (ADRs), which may be issued in either certificated or book entry form.
The company’s ordinary shares are also traded in the form of a global depositary certificate representing the company’s ordinary shares on the Frankfurt, Hamburg and Dusseldorf Stock Exchanges.
On 1 March 2022, 783,059,034 ADSs (equivalent to approximately 4,698,354,204 ordinary shares or some 24.13% of the total issued share capital, excluding shares held in treasury) were outstanding and were held by approximately 69,487 ADS holders. Of these, about 68,677 had registered addresses in the US at that date. One of the registered holders of ADSs represents approximately 1,202,389 underlying holders.
On 1 March 2022, there were approximately 218,411 ordinary shareholders. Of these shareholders, around 1,524 had registered addresses in the US and held a total of some 4,490,916 ordinary shares.
Since a number of the ordinary shares and ADSs were held by brokers and other nominees, the number of holders in the US may not be representative of the number of beneficial holders or their respective country of residence.
Dividends
The company’s current policy is to pay interim dividends on a quarterly basis on its ordinary shares.
Its policy is also to announce dividends for ordinary shares in US dollars and state an equivalent sterling dividend. Dividends on the company's ordinary shares will be paid in sterling and on the company's ADSs in US dollars. The rate of exchange used to determine the sterling amount equivalent is the average of the market exchange rates in London over the three business days prior to the sterling equivalent announcement date. The directors may choose to declare dividends in any currency provided that a sterling equivalent is announced. It is not the company’s intention to change its current policy of announcing dividends on ordinary shares in US dollars.
Information regarding dividends announced and paid by the company on ordinary shares and preference shares is provided in the consolidated Financial statements – Note 9.
A Scrip Dividend Programme (Scrip Programme) was approved by shareholders in 2010 and was renewed for a further three years at the 2021 AGM. It enabled the company's ordinary shareholders and ADS holders to elect to receive dividends by way of new fully paid ordinary shares (or ADSs in the case of ADS holders) instead of cash. The operation of the Scrip Programme is always subject to the directors’ decision to make the Scrip Programme offer available in respect of any particular dividend.
The company announced on 29 October 2019 and as part of all subsequent quarterly results announcements made since, that the board had suspended the Scrip Programme in respect of those quarterly dividends. The company does not expect to offer a scrip election for the foreseeable future. Ordinary shareholders and ADS holders (subject to certain exceptions) may be able to participate in dividend reinvestment plans. Any decisions with respect to future dividends will be made by the board of BP p.l.c. following the end of each quarter.
Future dividends will be dependent on future earnings, the financial condition of the group, the Risk factors set out on page 76 and other matters that may affect the business of the group set out in Our strategy on page 12 and in Liquidity and capital resources on page 342.
The following table shows dividends announced and paid by the company per ADS for the past five years.
| | | | | | | | | | | | | | | | | | | | |
Dividends per ADSa | March | June | September | December | Total |
| | | | | | |
| | | | | | |
| | | | | | |
| | | | | | |
| | | | | | |
| | | | | | |
| 2017 | UK pence | 48.95 | | 46.54 | | 45.73 | | 44.66 | | 185.88 | |
| US cents | 60 | | 60 | | 60 | | 60 | | 240 | |
| 2018 | UK pence | 43.01 | | 44.66 | | 47.58 | | 48.15 | | 183.40 | |
| US cents | 60 | | 60 | | 61.50 | | 61.50 | | 243 | |
| 2019 | UK pence | 46.43 | | 48.39 | | 50.09 | | 46.95 | | 191.86 | |
| US cents | 61.50 | | 61.50 | | 61.50 | | 61.50 | | 246 | |
| 2020 | UK pence | 48.94 | | 50.05 | | 24.26 | | 23.50 | | 146.75 | |
| US cents | 63.00 | | 63.00 | | 31.50 | | 31.50 | | 189 | |
| 2021 | UK pence | 22.61 | | 22.27 | | 23.72 | | 24.63 | | 92.23 | |
| US cents | 31.50 | | 31.50 | | 32.76 | | 32.76 | | 129 | |
a Dividends announced and paid by the company on ordinary and preference shares are provided in the consolidated Financial statements – Note 9.
There are currently no UK foreign exchange controls or restrictions on remittances of dividends on the ordinary shares or on the conduct of the company’s operations, other than restrictions applicable to certain countries and persons subject to EU economic sanctions or those sanctions adopted by the UK government which implement resolutions of the Security Council of the United Nations.
Shareholder taxation information
This section describes the material US federal income tax and UK taxation consequences of owning ordinary shares or ADSs to a US holder who holds the ordinary shares or ADSs as capital assets for tax purposes. This section does not discuss tax consequences arising under the Medicare contribution tax on net investment income or the alternative minimum tax. It also does not apply inter alia to members of special classes of holders some of which may be subject to other rules, including: tax-exempt entities, life insurance companies, dealers in securities, traders in securities that elect a mark-to-market method of accounting for securities holdings, holders that, directly or indirectly, hold 10% or more of the company’s shares (as measured by voting power or value), holders that hold the shares or ADSs as part of a straddle or a hedging or conversion transaction, holders that purchase or sell the shares or ADSs as part of a wash sale for US federal income tax purposes, or holders whose functional currency is not the US dollar. In addition, if a partnership holds the shares or ADSs, the US federal income tax treatment of a partner will generally depend on the status of the partner and the tax treatment of the partnership and may not be described fully below.
A US holder is any beneficial owner of ordinary shares or ADSs that is for US federal income tax purposes (1) a citizen or resident of the US, (2) a US domestic corporation, (3) an estate whose income is subject to US federal income taxation regardless of its source, or (4) a trust if a US court can exercise primary supervision over the trust’s administration and one or more US persons are authorized to control all substantial decisions of the trust.
This section is based on the tax laws of the United States, including the Internal Revenue Code of 1986, as amended, its legislative history, existing and proposed US Treasury regulations thereunder, published rulings and court decisions, and the taxation laws of the UK, all as currently in effect, as well as the income tax convention between the US and the UK that entered into force on 31 March 2003 (the ‘Treaty’). These laws are subject to change, possibly on a retroactive basis. This section further assumes that each obligation under the terms of the deposit agreement relating to bp ADSs and any related agreement will be performed in accordance with its terms.
For purposes of the Treaty and the estate and gift tax Convention (the ‘Estate Tax Convention’) and for US federal income tax and UK taxation purposes, a holder of ADRs evidencing ADSs will be treated as the owner of the company’s ordinary shares represented by those ADRs. Exchanges of ordinary shares for ADRs and ADRs for ordinary shares generally will
| | | | | | | | | | | | | | |
368 | | bp Annual Report and Form 20-F 2021 | | « See Glossary |
not be subject to US federal income tax or to UK taxation other than stamp duty or stamp duty reserve tax, as described below.
Investors should consult their own tax adviser regarding the US federal, state and local, UK and other tax consequences of owning and disposing of ordinary shares and ADSs in their particular circumstances, and in particular whether they are eligible for the benefits of the Treaty in respect of their investment in the shares or ADSs.
Taxation of dividends
UK taxation
Under current UK taxation law, no withholding tax will be deducted from dividends paid by the company, including dividends paid to US holders. A shareholder that is a company resident for tax purposes in the UK or trading in the UK through a permanent establishment generally will not be taxable in the UK on a dividend it receives from the company. A shareholder who is an individual resident for tax purposes in the UK is subject to UK tax on dividends received from the company, including dividends received under the dividend reinvestment plan (DRIP) for ordinary shareholders, that are in excess of the annual dividend allowance.
For 2021/22 the dividend allowance is £2,000 which means there is no UK tax due on the first £2,000 of dividends received. Dividends above this level are subject to tax at 7.5% for basic tax payers, 32.5% for higher rate tax payers and 38.1% for additional rate tax payers.
Although the first £2,000 of dividend income is not subject to UK income tax, it does not reduce the total income for tax purposes. Dividends within the dividend allowance still count towards basic or higher rate bands, and may therefore affect the rate of tax paid on dividends received in excess of the £2,000 allowance. For instance, if an individual has an annual gross salary of £50,000 and also receives a dividend of £12,000 they will be subject to the following scenario. The individual's personal allowance and the basic rate tax band will be used up by the gross salary. The remaining part of the salary and the whole of the dividend will be subject to tax at the higher rate, although the dividend allowance will reduce the amount of dividend subject to tax. The dividend of £12,000 will be reduced by the dividend allowance of £2,000 leaving taxable dividend income of £10,000. The dividend will be taxed at 32.5% so that the total tax payable on the dividends is £3,250.
How the shareholder pays the tax arising on the dividend income depends on the amount of dividend income and salary they receive in the tax year. If less than £2,000 they will not need to report anything or pay any tax. If between £2,000 and £10,000, the shareholder can pay what they owe by: contacting the HMRC helpline; asking HMRC to change their tax code – the tax will be taken from their wages or pension or through completion of the ‘Dividends’ section of their self-assessment tax return, where one is already being filed. If over £10,000 they will be required to file a self-assessment tax return and should complete the ‘Dividends’ section with details of the amounts received.
US federal income taxation
A US holder is subject to US federal income taxation on the gross amount of any dividend paid by the company (including dividends paid but reinvested received under the Global Invest Direct (GID) Dividend Reinvestment Plan for ADS holders) out of its current or accumulated earnings and profits (as determined for US federal income tax purposes). Dividends paid to a non-corporate US holder that constitute qualified dividend income will be taxable to the holder at a preferential rate, provided that the holder has a holding period in the ordinary shares or ADSs of more than 60 days during the 121-day period beginning 60 days before the ex-dividend date and meets other holding period requirements. Dividends paid by the company with respect to the ordinary shares or ADSs will generally be qualified dividend income.
For US federal income tax purposes, a dividend must be included in income when the US holder, in the case of ordinary shares, or the Depositary, in the case of ADSs, actually or constructively receives the dividend and will not be eligible for the dividends-received deduction generally allowed to US corporations in respect of dividends received from other US corporations. US ADS holders should consult their own tax adviser regarding the US tax treatment of the dividend fee in respect of dividends. Dividends will be income from sources outside the US and
generally will be ‘passive category income’ for purposes of computing a US holder’s foreign tax credit limitation.
As noted above in UK taxation, a US holder will not be subject to UK withholding tax. Accordingly, the receipt of a dividend will not entitle the US holder to a foreign tax credit.
The amount of the dividend distribution on the ordinary shares that is paid in pounds sterling will be the US dollar value of the pounds sterling payments made, determined at the spot pounds sterling/US dollar rate on the date the dividend is distributed, regardless of whether the payment is, in fact, converted into US dollars. Generally, any gain or loss resulting from currency exchange fluctuations during the period from the date the pounds sterling dividend payment is distributed to the date the payment is converted into US dollars will be treated as ordinary income or loss and will not be eligible for the preferential tax rate on qualified dividend income. The gain or loss generally will be income or loss from sources within the US for foreign tax credit limitation purposes.
Distributions in excess of the company’s earnings and profits, as determined for US federal income tax purposes, will be treated as a return of capital to the extent of the US holder’s basis in the ordinary shares or ADSs and thereafter as capital gain, subject to taxation as described in Taxation of capital gains – US federal income taxation section below.
In addition, the taxation of dividends may be subject to the rules for passive foreign investment companies (PFIC), described below under ‘Taxation of capital gains – US federal income taxation’. Distributions made by a PFIC do not constitute qualified dividend income and are not eligible for the preferential tax rate applicable to such income.
Taxation of capital gains
UK taxation
A US holder may be liable for both UK and US tax in respect of a gain on the disposal of ordinary shares or ADSs if the US holder is (1) resident for tax purposes in the United Kingdom at the date of disposal, (2) if he or she has left the UK for a period not exceeding five complete tax years between the year of departure from and the year of return to the UK and acquired the shares before leaving the UK and was resident in the UK in the previous four out of seven tax years before the year of departure, (3) a US domestic corporation resident in the UK by reason of its business being managed or controlled in the UK or (4) a citizen of the US that carries on a trade or profession or vocation in the UK through a branch or agency or a corporation that carries on a trade, profession or vocation in the UK, through a permanent establishment, and that has used, held, or acquired the ordinary shares or ADSs for the purposes of such trade, profession or vocation of such branch, agency or permanent establishment. However, such persons may be entitled to a tax credit against their US federal income tax liability for the amount of UK capital gains tax or UK corporation tax on chargeable gains (as the case may be) that is paid in respect of such gain.
Under the Treaty, capital gains on dispositions of ordinary shares or ADSs generally will be subject to tax only in the jurisdiction of residence of the relevant holder as determined under both the laws of the UK and the US and as required by the terms of the Treaty.
Under the Treaty, individuals who are residents of either the UK or the US and who have been residents of the other jurisdiction (the US or the UK, as the case may be) at any time during the six years immediately preceding the relevant disposal of ordinary shares or ADSs may be subject to tax with respect to capital gains arising from a disposition of ordinary shares or ADSs of the company not only in the jurisdiction of which the holder is resident at the time of the disposition but also in the other jurisdiction.
For gains on or after 23 June 2010, the UK Capital Gains Tax rate will be dependent on the level of an individual’s taxable income. Where total taxable income and gains after all allowable deductions are less than the upper limit of the basic rate income tax band of £37,700 (for 2021/22), the rate of Capital Gains Tax will be 10%. For gains (and any parts of gains) above that limit the rate will be 20%.
From 6 April 2008, entitlement to the annual exemption is based on an individual’s circumstances (taking into account Domicile status, remittance basis of taxation and number of years in the UK). For
| | | | | | | | | | | | | | |
« See Glossary | | bp Annual Report and Form 20-F 2021 | | 369 |
individuals who are entitled to the exemption for 2021/22, this has been set at £12,300. Corporation tax on chargeable gains is levied at 19 per cent for companies from 1 April 2017.
US federal income taxation
A US holder who sells or otherwise disposes of ordinary shares or ADSs will recognize a capital gain or loss for US federal income tax purposes equal to the difference between the US dollar value of the amount realized on the disposition and the US holder’s tax basis, determined in US dollars, in the ordinary shares or ADSs. Any such capital gain or loss generally will be long-term gain or loss, subject to tax at a preferential rate for a non-corporate US holder, if the US holder’s holding period for such ordinary shares or ADSs exceeds one year. The tax basis of shares acquired through reinvested dividends under the GID Dividend Reinvestment Plan for ADS holders) is equal to the fair market value of the stock on the investment date. The holding period for shares acquired under the plan begins the day after the applicable investment date.
Gain or loss from the sale or other disposition of ordinary shares or ADSs will generally be income or loss from sources within the US for foreign tax credit limitation purposes. The deductibility of capital losses is subject to limitations.
We do not believe that ordinary shares or ADSs will be treated as stock of a passive foreign investment company (PFIC) for US federal income tax purposes, but this conclusion is a factual determination that is made annually and thus is subject to change. If we are treated as a PFIC, unless a US holder elects to be taxed annually on a mark-to-market basis with respect to ordinary shares or ADSs, any gain realized on the sale or other disposition of ordinary shares or ADSs would in general not be treated as capital gain. Instead, a US holder would be treated as if he or she had realized such gain rateably over the holding period for ordinary shares or ADSs and would be taxed at the highest tax rate in effect for each such year to which the gain was allocated, in addition to which an interest charge in respect of the tax attributable to each such year would apply. Certain ‘excess distributions’ would be similarly treated if we were treated as a PFIC.
Additional tax considerations
Scrip Programme
Until the publication of the 2019 third quarter results, the company had an optional Scrip Programme, wherein holders of bp ordinary shares or ADSs could elect to receive any dividends in the form of new fully paid ordinary shares or ADSs of the company instead of cash. Please consult your tax adviser for the consequences to you.
UK inheritance tax
The Estate Tax Convention applies to inheritance tax. ADSs held by an individual who is domiciled for the purposes of the Estate Tax Convention in the US and is not for the purposes of the Estate Tax Convention a national of the UK will not be subject to UK inheritance tax on the individual’s death or on transfer during the individual’s lifetime unless, among other things, the ADSs are part of the business property of a permanent establishment situated in the UK used for the performance of independent personal services. In the exceptional case where ADSs are subject to both inheritance tax and US federal gift or estate tax, the Estate Tax Convention generally provides for tax payable in the US to be credited against tax payable in the UK or for tax paid in the UK to be credited against tax payable in the US, based on priority rules set forth in the Estate Tax Convention.
UK stamp duty and stamp duty reserve tax
The statements below relate to what is understood to be the current practice of HM Revenue & Customs in the UK under existing law.
Provided that any instrument of transfer is not executed in the UK and remains at all times outside the UK and the transfer does not relate to any matter or thing done or to be done in the UK, no UK stamp duty is payable on the acquisition or transfer of ADSs. Neither will an agreement to transfer ADSs in the form of ADRs give rise to a liability to stamp duty reserve tax.
Purchases of ordinary shares, as opposed to ADSs, through the CREST system of paperless share transfers will be subject to stamp duty reserve tax at 0.5%. The charge will arise as soon as there is an agreement for the transfer of the shares (or, in the case of a conditional agreement,
when the condition is fulfilled). The stamp duty reserve tax will apply to agreements to transfer ordinary shares even if the agreement is made outside the UK between two non-residents. Purchases of ordinary shares outside the CREST system are subject either to stamp duty at a rate of £5 per £1,000 (or part, unless the stamp duty is less than £5, when no stamp duty is charged), or stamp duty reserve tax at 0.5%. Stamp duty and stamp duty reserve tax are generally the liability of the purchaser.
A subsequent transfer of ordinary shares to the Depositary’s nominee will give rise to further stamp duty at the rate of £1.50 per £100 (or part) or stamp duty reserve tax at the rate of 1.5% of the value of the ordinary shares at the time of the transfer. For ADR holders electing to receive ADSs instead of cash, after the 2012 first quarter dividend payment, HM Revenue & Customs no longer seeks to impose 1.5% stamp duty reserve tax on issues of UK shares and securities to non-EU clearance services and depositary receipt systems.
Major shareholders
The disclosure of certain major and significant shareholdings in the share capital of the company is governed by the Companies Act 2006, the UK Financial Conduct Authority’s Disclosure Guidance and Transparency Rules (DTR) and the US Securities Exchange Act of 1934.
Register of members holding bp ordinary shares as at 31 December 2021
| | | | | | | | | | | |
| Range of holdings | Number of ordinary
shareholders | Percentage of total
ordinary shareholders | Percentage of total ordinary share capital
excluding shares
held in treasury |
1-200 | 52,023 | | 23.65 | | 0.01 | |
201-1,000 | 73,188 | | 33.27 | | 0.21 | |
1,001-10,000 | 82,898 | | 37.69 | | 1.34 | |
10,001-100,000 | 10,314 | | 4.69 | | 1.09 | |
100,001-1,000,000 | 874 | | 0.40 | | 1.59 | |
Over 1,000,000a | 662 | | 0.30 | | 95.76 | |
Totals | 219,959 | | 100.00 | | 100.00 | |
a Includes JPMorgan Chase Bank, N.A. holding 25.07% of the total ordinary issued share capital (excluding shares held in treasury) as the approved depositary for ADSs, a breakdown of which is shown in the table below.
Register of holders of American depositary shares (ADSs) as at 31 December 2021a
| | | | | | | | | | | |
| Range of holdings | Number of
ADS holders | Percentage of
total ADS holders | Percentage of
total ADSs |
| 1-200 | 41,436 | | 59.13 | | 0.22 | |
| 201-1,000 | 18,565 | | 26.49 | | 0.86 | |
| 1,001-10,000 | 9,678 | | 13.81 | | 2.43 | |
| 10,001-100,000 | 386 | | 0.55 | | 0.62 | |
| 100,001-1,000,000 | 5 | | 0.01 | | 0.08 | |
Over 1,000,000b | 2 | | 0.00 | | 95.79 | |
| Totals | 70,072 | | 100.00 | | 100.00 | |
a One ADS represents six 25 cent ordinary shares.
b One holder of ADSs represents 1,275,954 approx. underlying shareholders.
As at 31 December 2021 there were also 1,185 preference shareholders. Preference shareholders represented 0.43% and ordinary shareholders represented 99.57% of the total issued nominal share capital of the company (excluding shares held in treasury) as at that date.
As at 31 December 2021, the company had received three notifications from Norges Bank pursuant to DTR5. The most recent of which was on 15 October 2021 disclosing a holding of 606,126,525 ordinary shares amounting to 3.03% of the voting rights attached to the issued share capital of the company.
The company did not receive any notifications pursuant to DTR5 between 1 January 2022 and 1 March 2022. Information provided to the company pursuant to DTR 5 is published on a Regulatory Information Service and on the company's website, www.bp.com.
Under the US Securities Exchange Act of 1934 bp is aware of the following interests as at 1 March 2022:
| | | | | | | | | | | | | | |
370 | | bp Annual Report and Form 20-F 2021 | | « See Glossary |
| | | | | | | | |
Holder | Holding of ordinary shares | Percentage of ordinary share capital excluding shares held in treasury |
JPMorgan Chase Bank N.A., depositary for ADSs, through its nominee Guaranty Nominees Limited | 4,698,354,205 | | 24.11 | |
| BlackRock, Inc. | 1,713,058,875 | | 8.79 | |
| The Vanguard Group, Inc | 808,082,417 | | 4.15 | |
| Norges Bank | 624,742,914 | | 3.21 | |
The company’s major shareholders do not have different voting rights.
The company has also been notified of the following interests in preference shares as at 1 March 2022:
| | | | | | | | |
| Holder | Holding of 8%
cumulative first
preference shares | Percentage
of class |
| The National Farmers Union Mutual Insurance Society Limited | 945,000 | | 13.07 | |
| Interactive Investor Share Dealing Services | 771,727 | | 10.67 | |
| Hargreaves Lansdown Asset Management Limited | 720,420 | | 9.96 | |
| M & G Investment Management Ltd. | 528,150 | | 7.30 | |
| Barclays, Plc | 511,071 | | 7.06 | |
| Canaccord Genuity Group Inc. | 448,585 | | 6.20 | |
| Halifax Share Dealing Services | 413,221 | | 5.71 | |
| | | | | | | | |
| Holder | Holding of 9%
cumulative second
preference shares | Percentage
of class |
| The National Farmers Union Mutual Insurance Society Limited | 987,000 | | 18.03 | |
| M & G Investment Management Ltd. | 644,450 | | 11.77 | |
| Safra Group | 385,000 | | 7.03 | |
| Interactive Investor Share Dealing Services | 345,180 | | 6.31 | |
| Canaccord Genuity Group Inc. | 334,941 | | 6.12 | |
As at 1 March 2022, the total preference shares in issue comprised only 0.43% of the company’s total issued nominal share capital (excluding shares held in treasury), the rest being ordinary shares.
Annual general meeting
The 2022 AGM is scheduled to be held on Thursday 12 May 2022 at 1:00pm. A separate notice convening the meeting is distributed to shareholders, which includes an explanation of the items of business to be considered at the meeting.
All resolutions for which notice has been given will be decided on a poll. Deloitte LLP have expressed their willingness to continue in office as auditors and a resolution for their reappointment is included in the Notice of bp Annual General Meeting 2022.
Memorandum and Articles of Association
The following summarizes certain provisions of the company’s Memorandum and Articles of Association and applicable English law. This summary is qualified in its entirety by reference to the UK Companies Act 2006 (the Act) and the company’s Memorandum and Articles of Association. The Memorandum and Articles of Association are available online at bp.com/usefuldocs.
The company’s Articles of Association may be amended by a special resolution at a general meeting of the shareholders. At the annual general meeting (AGM) held on 21 May 2018 shareholders voted to adopt new
Articles of Association to reflect developments in market practice and to provide clarification and additional flexibility where necessary or appropriate.
Objects and purposes
BP p.l.c. is a public company limited by shares and registered in England and Wales with the registered number 102498. The provisions regulating the operations of the company, known as its ‘objects’, were historically stated in a company’s memorandum. The Act abolished the need to have object provisions and so at the AGM held on 15 April 2010 shareholders approved the removal of its objects clause together with all other provisions of its Memorandum that, by virtue of the Act, are treated as forming part of the company’s Articles of Association.
Directors and secretary
The business and affairs of the company shall be managed by the directors. The company’s Articles of Association provide that any person may be appointed by the existing directors or by the shareholders in a general meeting either as a replacement for another director or as an additional director. Any person appointed by the directors will hold office only until the next general meeting, notice of which is first given after their appointment and will then be eligible for re-election by the shareholders. A director may be removed by the company as provided for by applicable law and shall vacate office in certain circumstances as set out in the Articles of Association. In addition, the company may, by special resolution, remove a director before the expiration of his/her period of office and, subject to the Articles of Association, may by ordinary resolution appoint another person to be a director instead. There is no requirement for a director to retire on reaching any age.
The Articles of Association place a general prohibition on a director voting in respect of any contract or arrangement in which the director has a material interest other than by virtue of such director’s interest in shares in the company. However, in the absence of some other material interest not indicated below, a director is entitled to vote and to be counted in a quorum for the purpose of any vote relating to a resolution concerning the following matters:
•The giving of security or indemnity with respect to any money lent or obligation taken by the director at the request or benefit of the company or any of its subsidiary undertakings.
•The giving of security or indemnity to a third party with respect to any debt or obligation of the company or any of its subsidiary undertakings for which the director has assumed responsibility.
•Any proposal in which the director is interested, concerning the underwriting of company securities or debentures or the giving of any security to a third party for a debt or obligation of the company or any of its subsidiary undertakings.
•Any proposal concerning any other company in which the director is interested, directly or indirectly (whether as an officer or shareholder or otherwise) provided that the director and persons connected with such director are not the holder or holders of 1% or more of the voting interest in the shares of such company.
•Any proposal concerning the purchase or maintenance of any insurance policy under which the director may benefit.
•Any proposal concerning the giving to the director of any other indemnity which is on substantially the same terms as indemnities given or to be given to all of the other directors or to the funding by the company of his expenditure on defending proceedings or the doing by the company of anything to enable the director to avoid incurring such expenditure where all other directors have been given or are to be given substantially the same arrangements.
•Any proposal concerning an arrangement for the benefit of the employees and directors or former employees and former directors of the company or any of its subsidiary undertakings, including but without being limited to a retirement benefits scheme and an employees’ share scheme, which does not accord to any director any privilege or advantage not generally accorded to the employees or former employees to whom the arrangement relates.
The Act requires a director of a company who is in any way interested in a contract or proposed contract with the company to declare the nature of
| | | | | | | | | | | | | | |
« See Glossary | | bp Annual Report and Form 20-F 2021 | | 371 |
the director’s interest at a meeting of the directors of the company. The definition of ‘interest’ includes the interests of spouses, children, companies and trusts. The Act also requires that a director must avoid a situation where a director has, or could have, a direct or indirect interest that conflicts, or possibly may conflict, with the company’s interests. The Act allows directors of public companies to authorize such conflicts where appropriate, if a company’s Articles of Association so permit. The company’s Articles of Association permit the authorization of such conflicts. The directors may exercise all the powers of the company to borrow money, except that the amount remaining undischarged of all moneys borrowed by the company shall not, without approval of the shareholders, exceed two times the amount paid up on the share capital plus the aggregate of the amount of the capital and revenue reserves of the company and its subsidiary undertakings incorporated in the United Kingdom. Variation of the borrowing power of the board may only be affected by amending the Articles of Association.
Remuneration of non-executive directors shall be determined in the aggregate by resolution of the shareholders. Remuneration of executive directors is determined by the remuneration committee. This committee is made up of non-executive directors only. There is no requirement of share ownership for a director’s qualification.
The Articles of Association provide entitlement to the directors’ pensions and death and disability benefits to the directors’ relations and dependants respectively.
The circumstances in which a director’s office will automatically terminate include, amongst others: when a director ceases to hold an executive office of the company and the directors resolve that they should cease to be a director; if a medical practitioner provides an opinion that a director has become incapable of acting as a director and may remain so incapable for more than a further three months and the directors resolve that they should cease to be a director; and if all of the other directors vote in favour of a resolution stating that the person should cease to be a director.
The company secretary has express powers to delegate any of the powers or discretions conferred on him or her.
Dividend rights; other rights to share in company profits; capital calls
Shareholders of the company may, by resolution, declare dividends but no such dividend may be declared in excess of the amount recommended by the directors. The directors may also pay interim dividends without obtaining shareholder approval. No dividend may be paid other than out of profits available for distribution, as determined under IFRS and the Act. Dividends on ordinary shares are payable only after payment of dividends on bp preference shares. Any dividend unclaimed after a period of 10 years from the date of declaration of such dividend shall be forfeited and reverts to bp. If the company exercises its right to forfeit shares and sells shares belonging to an untraced shareholder then any entitlement to claim dividends or other monies unclaimed in respect of those shares will be for a period of twelve months after the sale. The company may take such steps as the directors decide are appropriate in the circumstances to trace the member entitled and the sale may be made at such time and on such terms as the directors may decide.
The directors have the power to declare and pay dividends in any currency provided that a sterling equivalent is announced. It is not the company’s intention to change its current policy of paying dividends in US dollars. At the company’s AGM held on 15 April 2010, shareholders approved the introduction of a Scrip Dividend Programme (Scrip Programme) and to include provisions in the Articles of Association to enable the company to operate the Scrip Programme. The Scrip Programme was renewed at the company’s AGM held on 12 May 2021 for a further three years. The Scrip Programme enables ordinary shareholders and bp ADS holders to elect to receive new fully paid ordinary shares (or bp ADSs in the case of bp ADS holders) instead of cash. The operation of the Scrip Programme is always subject to the directors’ decision to make the scrip offer available in respect of any particular dividend. Should the directors decide not to offer the scrip in respect of any particular dividend, cash will automatically be paid instead. The directors may determine in relation to any scrip dividend plan or programme how the costs of the programme will be met, the minimum number of ordinary shares required in order to be able to participate in the programme and any arrangements to deal with legal and practical difficulties in any particular territory.
Apart from shareholders’ rights to share in bp’s profits by dividend (if any is declared or announced), the Articles of Association provide that the directors may set aside:
•A special reserve fund out of the balance of profits each year to make up any deficit of cumulative dividend on the bp preference shares.
•A general reserve out of the balance of profits each year, which shall be applicable for any purpose to which the profits of the company may properly be applied. This may include capitalization of such sum, pursuant to an ordinary shareholders’ resolution, and distribution to shareholders as if it were distributed by way of a dividend on the ordinary shares or in paying up in full unissued ordinary shares for allotment and distribution as bonus shares.
Any such sums so deposited may be distributed in accordance with the manner of distribution of dividends as described above.
Holders of shares are not subject to calls on capital by the company, provided that the amounts required to be paid on issue have been paid off. All shares are fully paid.
Share transfers and share certificates
The directors may permit transfers to be effected other than by an instrument in writing. Share certificates will not be required to be issued by the company if they are not required by law.
The company may charge an administrative fee in the event that a shareholder wishes to replace two or more certificates representing shares with a single certificate or wishes to surrender a single certificate and replace it with two or more certificates. All certificates are sent at the member’s risk.
Voting rights
The Articles of Association of the company provide that voting on resolutions at a shareholders’ meeting will be decided on a poll other than resolutions of a procedural nature, which may be decided on a show of hands. If voting is on a poll, every shareholder who is present in person or by proxy has one vote for every ordinary share held and two votes for every £5 in nominal amount of bp preference shares held. If voting is on a show of hands, each shareholder who is present at the meeting in person or whose duly appointed proxy is present in person will have one vote, regardless of the number of shares held, unless a poll is requested.
Shareholders do not have cumulative voting rights.
For the purposes of determining which persons are entitled to attend or vote at a shareholders’ meeting and how many votes such persons may cast, the company may specify in the notice of the meeting a time, not more than 48 hours before the time of the meeting, by which a person who holds shares in registered form must be entered on the company’s register of members in order to have the right to attend or vote at the meeting or to appoint a proxy to do so.
Holders on record of ordinary shares may appoint a proxy, including a beneficial owner of those shares, to attend, speak and vote on their behalf at any shareholders’ meeting, provided that a duly completed proxy form is received not less than 48 hours (or such shorter time as the directors may determine) before the time of the meeting or adjourned meeting or, where the poll is to be taken after the date of the meeting, not less than 24 hours (or such shorter time as the directors may determine) before the time of the poll.
Record holders of bp ADSs are also entitled to attend, speak and vote at any shareholders’ meeting of the company by the appointment by the approved depositary, JPMorgan Chase Bank N.A., of them as proxies in respect of the ordinary shares represented by their ADSs. Each such proxy may also appoint a proxy. Alternatively, holders of bp ADSs are entitled to vote by supplying their voting instructions to the depositary, who will vote the ordinary shares represented by their ADSs in accordance with their instructions.
Proxies may be delivered electronically.
Corporations who are members of the company may appoint one or more persons to act as their representative or representatives at any shareholders’ meeting provided that the company may require a corporate representative to produce a certified copy of the resolution appointing them before they are permitted to exercise their powers.
| | | | | | | | | | | | | | |
372 | | bp Annual Report and Form 20-F 2021 | | « See Glossary |
Matters are transacted at shareholders’ meetings by the proposing and passing of resolutions, of which there are two types: ordinary or special.
An ordinary resolution requires the affirmative vote of a majority of the votes of those persons voting at a meeting at which there is a quorum. A special resolution requires the affirmative vote of not less than three quarters of the persons voting at a meeting at which there is a quorum. Any AGM requires 21 clear days’ notice. The notice period for any other general meeting is 14 clear days subject to the company obtaining annual shareholder approval, failing which, a 21 clear day notice period will apply.
Liquidation rights; redemption provisions
In the event of a liquidation of bp, after payment of all liabilities and applicable deductions under UK laws and subject to the payment of secured creditors, the holders of bp preference shares would be entitled to the sum of (1) the capital paid up on such shares plus, (2) accrued and unpaid dividends and (3) a premium equal to the higher of (a) 10% of the capital paid up on the bp preference shares and (b) the excess of the average market price over par value of such shares on the LSE during the previous six months. The remaining assets (if any) would be divided pro rata among the holders of ordinary shares.
Without prejudice to any special rights previously conferred on the holders of any class of shares, bp may issue any share with such preferred, deferred or other special rights, or subject to such restrictions as the shareholders by resolution determine (or, in the absence of any such resolutions, by determination of the directors), and may issue shares that are to be or may be redeemed.
Variation of rights
The rights attached to any class of shares may be varied with the consent in writing of holders of 75% of the shares of that class or on the adoption of a special resolution passed at a separate meeting of the holders of the shares of that class. At every such separate meeting, all of the provisions of the Articles of Association relating to proceedings at a general meeting apply, except that the quorum with respect to a meeting to change the rights attached to the preference shares is 10% or more of the shares of that class, and the quorum to change the rights attached to the ordinary shares is one third or more of the shares of that class.
Shareholders’ meetings and notices
Shareholders must provide bp with a postal or electronic address in the UK to be entitled to receive notice of shareholders’ meetings. Holders of bp ADSs are entitled to receive notices under the terms of the deposit agreement relating to bp ADSs. The substance and timing of notices are described above under the heading Voting rights.
Under the Act, the AGM of shareholders must be held once every year, within each six month period beginning with the day following the company’s accounting reference date. All general meetings shall be held at a time and place determined by the directors. If any shareholders’ meeting is adjourned for lack of quorum, notice of the time and place of the adjourned meeting may be given in any lawful manner, including electronically. Powers exist for action to be taken either before or at the meeting by authorized officers to ensure its orderly conduct and safety of those attending.
The directors have power to convene a general meeting which is a hybrid meeting, that is to provide facilities for shareholders to attend a meeting which is being held at a physical place by electronic means as well (but not to convene a purely electronic meeting).
The provisions of the Articles of Association in relation to satellite meetings permit facilities being provided by electronic means to allow those persons at each place to participate in the meeting.
Limitations on voting and shareholding
There are no limitations, either under the laws of the UK or under the company’s Articles of Association, restricting the right of non-resident or foreign owners to hold or vote bp ordinary or preference shares in the company other than limitations that would generally apply to all of the shareholders and limitations applicable to certain countries and persons subject to EU economic sanctions or those sanctions adopted by the UK government which implement resolutions of the Security Council of the United Nations.
Disclosure of interests in shares
The Act permits a public company to give notice to any person whom the company believes to be or, at any time during the three years prior to the issue of the notice, to have been interested in its voting shares requiring them to disclose certain information with respect to those interests. Failure to supply the information required may lead to disenfranchisement of the relevant shares and a prohibition on their transfer and receipt of dividends and other payments in respect of those shares and any new shares in the company issued in respect of those shares. In this context the term ‘interest’ is widely defined and will generally include an interest of any kind whatsoever in voting shares, including any interest of a holder of bp ADSs.
Called-up share capital
Details of the allotted, called-up and fully-paid share capital at 31 December 2021 are set out in Financial statements – Note 30. In accordance with institutional investor guidelines, the company deems it appropriate to grant authority to the directors to allot shares and other securities and to disapply pre-emption rights by way of shareholders' resolutions at each AGM in place of authority granted by virtue of the company's Articles of Association. At the AGM on 12 May 2021, authorization was given to the directors to allot shares in the company and to grant rights to subscribe for, or to convert any security into, shares in the company up to an aggregate nominal amount as set out in the Notice of Annual General Meeting 2021. These authorities were given for the period until the next AGM in 2022 or 12 August 2022, whichever is the earlier. These authorities are renewed annually at the AGM.
Company records and service of notice
In relation to notices not covered by the Act, the reference to notice by advertisement in a national newspaper also includes advertisements via other means such as a public announcement.
| | | | | | | | | | | | | | |
« See Glossary | | bp Annual Report and Form 20-F 2021 | | 373 |
Purchases of equity securities by the issuer and affiliated purchasers
In April 2021, having reached its net debt target of $35 billion, the company began a series of share buyback programmes, announcing to purchase around $4.15 billion of shares from surplus cash flow generated in 2021. In addition, to reduce the issued share capital of the company to offset the expected full-year dilution from the vesting of awards under employee share schemes two programmes were announced to purchase around $1.0 billion of shares. All shares purchased were cancelled.
Authorization for the company to make market purchases (as defined in section 693(4) of the Companies Act 2006) of ordinary shares with a nominal value of $0.25 each in the company was renewed at the company’s 2021 AGM covering the period until the date of the company's 2022 AGM or 12 August 2022, whichever is earlier. The maximum number of ordinary shares to be purchased under this authority will not exceed 2,034,722,012 ordinary shares. The shares purchased will be cancelled.
The following table provides details of ordinary share purchases made (1) under the five buyback programmes and (2) by the Employee Share Ownership Plans (ESOPs) and other purchases of ordinary shares and ADSs made to satisfy the requirements of certain employee share-based payment plans.
| | | | | | | | | | | | | | | | | | | | |
| | Total number of shares purchaseda | Average price
paid per share
$ | Number of shares purchased by ESOPs or for certain employee share-based plansb | Number of shares purchased under buyback programmesc | Maximum approximate dollar value of shares yet to be purchased under the programmes
$ million |
| 2021 | | | | | | |
| January 11 | | 285,552 | 3.98 | | 285,552 | | Nil | N/A |
| February | | Nil | | | | N/A |
| March | | Nil | | | | N/A |
| April 28 - April 30 | | 36,983,000 | 4.26 | | Nil | 36,983,000 | N/A |
| May 4 - May 20 | | 78,260,150 | 4.37 | | Nil | 78,260,150 | N/A |
| June | | Nil | | | | N/A |
| July | | Nil | | | | N/A |
| August 3 - August 27 | | 118,953,102 | 4.18 | | Nil | 118,953,102 | N/A |
| September 1 - September 24 | | 101,865,903 | 4.21 | | Nil | 101,865,903 | N/A |
| October 4 - October 29 | | 91,100,000 | 4.90 | | Nil | 91,100,000 | N/A |
| November 1 - November 30 | | 190,945,626 | 4.59 | | Nil | 190,945,626 | N/A |
| December 1 - December 23 | | 89,738,847 | 4.53 | | 1,146,085 | | 88,592,762 | N/A |
| 2022 | | | | | | |
| January 10 - January 31 | | 84,820,029 | | 5.24 | | Nil | 84,820,029 | | N/A |
| February 1 - February 28 | | 194,389,664 | | 5.39 | | Nil | 194,389,664 | | N/A |
| March (to March 1) | | 9,000,000 | | 4.84 | | Nil | 9,000,000 | | N/A |
a All share purchases were of ordinary shares of 25 cents each and/or ADSs (each representing six ordinary shares) and were on/open market transactions.
b Transactions represent the purchases of ADSs made to satisfy requirements of certain employee share-based payment plans.
c The company announced the first programme on 28 April 2021 for a period up to and including 30 June 2021. The company announced a second programme on 3 August 2021 for a period up to and including 1 November 2021. The company announced the third programme on 2 November 2021 and a fourth on 10 January 2022. The third and fourth programmes were completed in February 2022. The company announced a fifth programme on 8 February 2022 for a period up to and including April 2022. At the AGM on 12 May 2021, authorization was given to the company to repurchase up to 2,034,722,012 ordinary shares, for the period ending on the date of the AGM in 2022 or 12 August 2022, whichever is the earlier. This authorization is renewed annually at the AGM. The total number of ordinary shares repurchased during 2021 and 2022 under the 28 April 2021, 3 August 2021, 2 November 2021, 10 January 2022 and 8 February 2022 share buyback programmes up to and including 1 March 2022 was 994,910,236 at a cost of $4,685 million (including fees and stamp duty) representing 5.04% of the company’s issued share capital excluding shares held in treasury on 31 December 2021. All ordinary shares repurchased in 2021 and 2022 under the programmes were cancelled in order to reduce the company’s issued share capital.
| | | | | | | | | | | | | | |
374 | | bp Annual Report and Form 20-F 2021 | | « See Glossary |
Fees and charges payable by ADS holders
The Depositary collects fees for delivery and surrender of ADSs directly from investors depositing shares or surrendering ADSs for the purpose of withdrawal or from intermediaries acting for them. The Depositary collects fees for making distributions to investors by deducting those fees from the amounts distributed or by selling a portion of the distributable property to pay the fees.
The charges of the Depositary payable by investors are as follows:
| | | | | | | | |
| Type of service | Depositary actions | Fee |
| Depositing or substituting the underlying shares | Issuance of ADSs against the deposit of shares, including deposits and issuances in respect of: •Share distributions, stock splits, rights, merger. •Exchange of securities or other transactions or event or other distribution affecting the ADSs or deposited securities. | $5.00 per 100 ADSs (or portion thereof) evidenced by the new ADSs delivered. |
| Selling or exercising rights | Distribution or sale of securities, the fee being an amount equal to the fee for the execution and delivery of ADSs that would have been charged as a result of the deposit of such securities. | $5.00 per 100 ADSs (or portion thereof). |
| Withdrawing an underlying share | Acceptance of ADSs surrendered for withdrawal of deposited securities. | $5.00 for each 100 ADSs (or portion thereof) evidenced by the ADSs surrendered. |
| Expenses of the Depositary | Expenses incurred on behalf of holders in connection with: •Stock transfer or other taxes and governmental charges. •Delivery by cable, telex, electronic and facsimile transmission. •Transfer or registration fees, if applicable, for the registration of transfers of underlying shares. •Expenses of the Depositary in connection with the conversion of foreign currency into US dollars (which are paid out of such foreign currency). | Expenses payable are subject to agreement between the company and the Depositary by billing holders or by deducting charges from one or more cash dividends or other cash distributions. |
| Dividend fees | ADS holders who receive a cash dividend are charged a fee which bp uses to offset the costs associated with administering the ADS programme. | The Deposit Agreement provides that a fee of $0.05 or less per ADS can be charged. The current fee is $0.02 per bp ADS per calendar year (equivalent to $0.005 per bp ADS per quarter per cash distribution). |
| Global Invest Direct (GID) Plan | New investors and existing ADS holders can buy, sell or reinvest dividends into further bp ADSs by enrolling in bp’s GID Plan, sponsored and administered by the Depositary. | Cost per transaction is $2.00 for recurring, $2.00 for one-time automatic investments, and $5.00 for investment made by check. Dividend reinvestment is 5% of the dividend amount up to a maximum of $5.00. Purchase trading commission is $0.12 per share. |
Fees and payments made by the Depositary to the issuer
The Depositary has agreed to reimburse certain company expenses related to the company’s ADS programme and incurred by the company in connection with the ADS programme arising during the year ended 31 December 2021. The Depositary reimbursed to the company, or paid amounts on the company’s behalf to third parties, or waived its fees and expenses, of $16,757,773.36 for the year ended 31 December 2021.
The table below sets out the types of expenses that the Depositary has agreed to reimburse and the fees it has agreed to waive for standard costs associated with the administration of the ADS programme relating to the year ended 31 December 2021.
| | | | | |
Category of expense reimbursed,
waived or paid directly to third parties | Amount reimbursed, waived or paid directly to third parties for the year ended 31 December 2021
|
| Fees for delivery and surrender of bp ADSs | 273,037.81 | |
Dividend feesa | 16,484,735.55 | |
| Total | $ 16,757,773.36 |
a Dividend fees are charged to ADS holders who receive a cash distribution, which bp uses to offset the costs associated with administering the ADS programme.
Under certain circumstances, including removal of the Depositary or termination of the ADS programme by the company, the company is required to repay the Depositary certain amounts reimbursed and/or
expenses paid to or on behalf of the company during the 12-month period prior to notice of removal or termination.
Documents on display
The bp Annual Report and Form 20-F 2021 is available online at bp.com/annualreport. To obtain a hard copy of bp’s complete audited financial statements, free of charge, UK based shareholders should contact bp Distribution Services by calling +44 (0) 870 241 3269 or by emailing bpdistributionservices@bp.com. If based in the US or Canada shareholders should contact Issuer Direct by calling +1 888 301 2505 or by emailing bpreports@issuerdirect.com.
The company is subject to the information requirements of the US Securities Exchange Act of 1934 applicable to foreign private issuers. In accordance with these requirements, the company files its Annual Report and Form 20-F and other related documents with the SEC. The SEC maintains an internet site at www.sec.gov that contains reports and other information regarding issuers, including bp, that file electronically with the SEC. bp's SEC filings are also available at bp.com/sec. bp discloses in this report (see Corporate governance practices (Form 20-F Item 16G) on page 361) significant ways (if any) in which its corporate governance practices differ from those mandated for US companies under NYSE listing standards.
| | | | | | | | | | | | | | |
« See Glossary | | bp Annual Report and Form 20-F 2021 | | 375 |
Shareholding administration
If you have any queries about the administration of shareholdings, such as change of address, change of ownership, dividend payment options or to change the way you receive your company documents (such as the bp Annual Report and Form 20-F and Notice of bp Annual General Meeting) please contact the bp Registrar or the bp ADS Depositary.
Holders of American Depositary Receipts may request to inspect the books of the depositary and the listing of receipt holders by contacting the bp ADS depositary.
Ordinary and preference shareholders
The bp Registrar, Link Group, Central Square,
29 Wellington Street,
Leeds, LS1 4DL
Freephone in the UK 0800 701107
From outside the UK +44 (0)371 277 1014
bp share centre www.mybpshares.com
ADS holders
bp Shareowner Services
PO Box 64504, St Paul, MN 55164-0504, US
Toll-free in US and Canada +1 877 638 5672
From outside the US and Canada +1 651 306 4383
2022 shareholder calendara
| | | | | |
| 25 Mar 2022 | Fourth quarter interim dividend payment for 2021 |
| 3 May 2022 | First quarter results announced |
| 12 May 2022 | Annual general meeting |
| 13 May 2022 | Record date (to be eligible for the first quarter interim dividend) |
| 24 Jun 2022 | First quarter interim dividend payment for 2022 |
| 1 July 2022 | 8% and 9% preference shares record date |
| 1 Aug 2022 | 8% and 9% preference shares dividend payment |
| 2 Aug 2022 | Second quarter results announced |
| 12 Aug 2022 | Record date (to be eligible for the second quarter interim dividend) |
| 23 Sep 2022 | Second quarter interim dividend payment for 2022 |
| 1 Nov 2022 | Third quarter results announced |
| 11 Nov 2022 | Record date (to be eligible for the third quarter interim dividend) |
| 16 Dec 2022 | Third quarter interim dividend payment for 2022 |
a All future dates are provisional and may be subject to change. For the full calendar see bp.com/financialcalendar.
| | | | | | | | | | | | | | |
376 | | bp Annual Report and Form 20-F 2021 | | « See Glossary |
Glossary
Abbreviations
ADR
American depositary receipt.
ADS
American depositary share. 1 ADS = 6 ordinary shares.
Barrel (bbl)
159 litres, 42 US gallons.
bcf
Billion cubic feet.
bcfe
Billion cubic feet equivalent.
boe
Barrels of oil equivalent.
EJ/yr
Exajoules per year
EVP
Executive vice president.
FPSO
Floating production, storage and offloading.
GAAP
Generally accepted accounting practice.
Gas
Natural gas.
gCO2e/MJ
Grams of carbon dioxide equivalent per megajoule of energy.
GHG
Greenhouse gas.
GRI
Global Reporting Initiative.
GtCO2
Gigatonnes of carbon dioxide.
GW
Gigawatt.
GWh
Gigawatt hour.
HSSE
Health, safety, security and environment.
IFRS
International Financial Reporting Standards.
Kb/d
Thousand barrels per day.
KPIs
Key performance indicators.
kt
Thousand tonnes.
LNG
Liquefied natural gas.
LPG
Liquefied petroleum gas.
mb/d
Thousand barrels per day.
Mbbl
Million barrels.
mboe/d
Thousand barrels of oil equivalent per day.
MW
Megawatt.
mmb/d
Million barrels per day.
mmboe/d
Million barrels of oil equivalent per day.
mmBtu
Million British thermal units.
mmcf/d
Million cubic feet per day.
Mt
Million tonnes.
MtCO2e
Million tonnes of CO2 equivalent.
Mtpa
Million tonnes per annum.
MWe
Megawatt electrical.
MWp
Megawatt peak.
NGLs
Natural gas liquids.
PSA
Production-sharing agreement.
PTA
Purified terephthalic acid.
RC
Replacement cost.
SEC
The United States Securities and Exchange Commission.
TWh
Terawatt hour.
SVP
Senior vice president.
Definitions
Unless the context indicates otherwise, the definitions for the following glossary terms are given below.
Non-GAAP measures are sometimes referred to as alternative performance measures.
CA100+ resolution glossary
CA100+ resolution
The CA100+ resolution means the special resolution requisitioned by Climate Action 100+ and passed at bp’s 2019 Annual General Meeting, the text of which is set out below.
Special resolution: Climate Action 100+ shareholder resolution on climate change disclosures.
That in order to promote the long-term success of the company, given the recognized risks and opportunities associated with climate change, we as shareholders direct the company to include in its strategic report and/or other corporate reports, as appropriate, for the year ending 2019 onwards, a description of its strategy which the board considers, in good faith, to be consistent with the goals of Articles 2.1(a)(1) and 4.1(2) of the Paris Agreement (3) (the ‘Paris goals’), as well as:
| | | | | | | | | | | | | | |
| | bp Annual Report and Form 20-F 2021 | | 377 |
(1)Capital expenditure: how the company evaluates the consistency of each new material capex investment, including in the exploration, acquisition or development of oil and gas resources and reserves and other energy sources and technologies, with (a) the Paris goals and separately (b) a range of other outcomes relevant to its strategy.
(2) Metrics and targets: the company’s principal metrics and relevant targets or goals over the short, medium and/or long term, consistent with the Paris goals, together with disclosure of:
a. The anticipated levels of investment in (i) oil and gas resources and reserves; and (ii) other energy sources and technologies.
b. The company’s targets to promote reductions in its operational greenhouse gas emissions, to be reviewed in line with changing protocols and other relevant factors.
c. The estimated carbon intensity of the company’s energy products and progress on carbon intensity over time.
d. Any linkage between the above targets and executive remuneration.
(3) Progress reporting: an annual review of progress against (1) and (2) above.
Such disclosure and reporting to include the criteria and summaries of the methodology and core assumptions used, and to omit commercially confidential or competitively sensitive information and be prepared at reasonable cost; and provided that nothing in this resolution shall limit the company’s powers to set and vary its strategy, or associated targets or metrics, or to take any action which it believes in good faith, would best promote the long-term success of the company.
The Paris goals
(1) Article 2.1(a) of the Paris Agreement states the goal of ‘Holding the increase in the global average temperature to well below 2°C above pre-industrial levels and pursuing efforts to limit the temperature increase to 1.5°C above pre-industrial levels, recognizing that this would significantly reduce the risks and impacts of climate change’.
(2) Article 4.1 of the Paris Agreement: In order to achieve the long-term temperature goal set out in Article 2, parties aim to reach global peaking of greenhouse gas emissions as soon as possible, recognizing that peaking will take longer for developing country parties, and to undertake rapid reductions thereafter in accordance with best available science, so as to achieve a balance between anthropogenic emissions by sources and removals by sinks of greenhouse gases in the second half of this century, on the basis of equity, and in the context of sustainable development and efforts to eradicate poverty.
(3) U.N. Framework Convention on Climate Change Conference of Parties, Twenty-First Session, Adoption of the Paris Agreement, U.N. Doc. FCCC/CP/2015/L.9/Rev.1 (Dec. 12, 2015).
New material capex investment
For the purposes of the 2021 evaluation discussed on pages 32-36, ‘new material capex investment’ means a decision taken by the resource commitment meeting (RCM) in 2021 to incur inorganic or organic investments greater than $250 million that relate to a new project or asset, extending an existing project or asset, or acquiring or increasing a share in a project, asset or entity.
There were three investments that met the above criteria in 2021.
Material capex evaluation: Paris-consistency quantitative tests.
For the purposes of evaluating material capex investments for consistency with the Paris goals, two quantitative tests were applied, see page 36.
Operational carbon intensity (CI)
The annual average operational GHG emissions (TeCO2e/unit), divided by the relevant unit of output:
•per thousand barrels of oil equivalent in upstream
•per utilized equivalent distillation capacity in refining
•per thousand tonnes of petrochemicals production.
Net zero aims and ambition glossary
Energy product
An energy product is a product that is used by an ultimate end user to satisfy an energy demand. In the case of fuels, to burn them to release their calorific content, and in the case of electricity to provide work or heat. A refined product such as a lubricant base stock does not count as an energy product as it is not used to provide energy in its use phase. Crude oil does not count as an energy product except in the rare cases where it is used by an end user to satisfy energy demand.
Emissions from the carbon in our upstream oil and gas production
Estimated CO2 emissions from the combustion of upstream production of crude oil, natural gas and natural gas liquids (NGLs) based on bp’s net share of production, excluding bp’s share of Rosneft production and assuming that all produced volumes undergo full stoichiometric combustion to CO2.
Methane intensity
Methane intensity refers to the amount of methane emissions from bp’s operated upstream oil and gas assets as a percentage of the total gas that goes to market from those operations. Our methodology is aligned with the Oil and Gas Climate Initiative’s (OGCI).
Net zero
References to global net zero in the phrase, 'to help the world get to net zero', means achieving '...a balance between anthropogenic emissions by sources and removals by sinks of greenhouse gases...on the basis of equity, and in the context of sustainable development and efforts to eradicate poverty', as set out in Article 4(1) of the Paris Agreement.
References to net zero for bp in the context of our ambition and aims 1, 2 and 3 mean achieving a balance between (a) the relevant Scope 1 and 2 emissions (for aim 1), Scope 3 emissions (for aim 2) or product lifecycle emissions (for aim 3) and (b) the aggregate of applicable deductions from qualifying activities such as sinks under our methodology at the applicable time.
Net zero« operations
bp’s aim to reach net zero operational greenhouse gas (CO2 and methane) emissions by 2050 or sooner, on a gross operational control basis, in accordance with bp’s aim 1 which relates to our reported Scope 1 and 2 emissions. Any interim target or aim in respect of bp’s aim 1 is defined in terms of absolute reductions relative to the baseline year of 2019.
Net zero« production
bp’s aim to reach net zero CO2 emissions, in accordance with bp’s aim 2, from the carbon in our upstream oil and gas production, in respect of the estimated CO2 emissions from the combustion of upstream production of crude oil, natural gas and natural gas liquids (based on bp’s net share of production, excluding bp’s share of Rosneft production and assuming that all produced volumes undergo full stoichiometric combustion to CO2). Aim 2 is bp’s Scope 3 aim and relates to Scope 3 category 11 emissions. Any interim target or aim in respect of bp’s aim 2 is defined in terms of absolute reductions relative to the baseline year of 2019.
Net zero« sales
bp’s aim to reach net zero for the carbon intensity of the energy products we sell«, in accordance with bp’s aim 3. Any interim target or aim in respect of bp’s aim 3 is defined in terms of reductions in the carbon intensity of the energy products we sell (in grams CO2e/MJ) relative to the baseline year of 2019. (Work is ongoing to confirm an assured baseline for this aim to incorporate the inclusion of physically traded energy products).
Physically traded energy product
For the purposes of aim 3, this includes trades in energy products« which are physically settled in circumstances where bp considers their inclusion to be consistent with the intent of the aim. It therefore excludes, for example, financial trades, and physical trades where the purpose or effect is that the volumes traded net off against each other.
| | | | | | | | | | | | | | |
378 | | bp Annual Report and Form 20-F 2021 | | |
Sustainable emissions reductions (SER)
SERs result from actions or interventions that have led to ongoing reductions in Scope 1 (direct) and/or Scope 2 (indirect) greenhouse gas (GHG) emissions (carbon dioxide and methane) such that GHG emissions would have been higher in the reporting year if the intervention had not taken place. SERs must meet three criteria: a specific intervention that has reduced GHG emissions, the reduction must be quantifiable and the reduction is expected to be ongoing. Reductions are reportable for a 12-month period from the start of the intervention/action.
Adjusted EBIDA
Adjusted EBIDA is a non-GAAP measure and is defined as profit or loss for the period, adjusting for finance costs and net finance expense relating to pensions and other post-retirement benefits and taxation, inventory holding gains or losses before tax, adjusting items« before interest and tax, and taxation on an underlying RC basis, and adding back depreciation, depletion and amortization (pre-tax) and exploration expenditure written-off (net of adjusting items, pre-tax). bp believes that adjusted EBIDA is a useful measure for investors because it is a measure closely tracked by management to evaluate bp’s operating performance and to make financial, strategic and operating decisions and because it may help investors to understand and evaluate, in the same manner as management, the underlying trends in bp’s operational performance on a comparable basis, period on period. The nearest equivalent measure on an IFRS basis is profit or loss for the period. A reconciliation of profit or loss for the period to adjusted EBIDA is provided on page 387.
Adjusted EBIDA per share compound annual growth rate (CAGR)
Non-GAAP measure. Adjusted EBIDA per share is calculated based on the shares in issue at period end.
Adjusted EBITDA
Adjusted EBITDA is a non-GAAP measure presented for bp's operating segments and is defined as replacement cost (RC) profit before interest and tax, excluding net adjusting items, adding back depreciation, depletion and amortization and exploration write-offs (net of adjusting items). Adjusted EBITDA by business is a further analysis of adjusted EBITDA for the customers & products businesses. bp believes it is helpful to disclose adjusted EBITDA by operating segment and by business because it reflects how the segments measure underlying business delivery. The nearest equivalent measure on an IFRS basis for the segment is RC profit or loss before interest and tax, which is bp's measure of profit or loss that is required to be disclosed for each operating segment under IFRS. A reconciliation to GAAP information is provided on pages 354 and 388.
Adjusted EBITDA for the group is defined as profit or loss for the period before finance costs and net finance expense relating to pensions and other post-retirement benefits, adjusting for inventory holding gains or losses before tax, adjusting items before interest and tax, and adding back depreciation, depletion and amortization (pre-tax) and exploration expenditure written-off (net of adjusting items, pre-tax). The nearest equivalent measure on an IFRS basis for the group is profit or loss for the period.
We are unable to present reconciliations of forward-looking information for adjusted EBITDA for the group, strategic themes or transition growth businesses, because without unreasonable efforts, we are unable to forecast accurately certain adjusting items required to calculate a meaningful comparable GAAP forward-looking financial measure. These items include inventory holding gains or losses, adjusting items and exploration expenditure written off that are difficult to predict in advance in order to include in a GAAP estimate.
Adjusting items
Adjusting items are items that bp discloses separately because it considers such disclosures to be meaningful and relevant to investors. They are items that management considers to be important to period-on-period analysis of the group's results and are disclosed in order to enable investors to better understand and evaluate the group’s reported financial performance. Adjusting items include gains and losses on the sale of businesses and fixed assets, impairments, environmental and other provisions, restructuring, integration and rationalization costs, fair value accounting effects, costs relating to the Gulf of Mexico oil spill and other
items. Adjusting items within equity-accounted earnings are reported net of incremental income tax reported by the equity-accounted entity. Adjusting items are used as a reconciling adjustment to derive underlying RC profit or loss and related underlying measures which are non-GAAP measures. An analysis of adjusting items by segment and type is shown on page 339. Prior to 2021 adjusting items were reported under two different headings – non-operating items and fair value accounting effects.
Associate
An entity over which the group has significant influence and that is neither a subsidiary nor a joint arrangement of the group. Significant influence is the power to participate in the financial and operating policy decisions of the investee but is not control or joint control over those policies.
Bioenergy production
Bioenergy production is average thousands of barrels of biofuel production per day during the period covered, net to bp. This includes equivalent ethanol production, bp Bunge biopower for grid export, biogas and refining co-processing and standalone hydrogenated vegetable oil (HVO).
Bio-refinery
A facility that is dedicated to processing biological materials (including waste oil and crop waste) to produce biofuels such as bio-diesel and sustainable aviation fuel, which may be blended to customer specifications with other components such as hydrocarbons at co-located or adjacent terminals and tanks.
Blue hydrogen
Hydrogen produced by reforming of natural gas or gasification of coal, with CO2 captured and stored (CCS).
Capital employed
Non-GAAP measure. It is defined as total equity plus finance debt.
Capital expenditure
Total cash capital expenditure as stated in the group cash flow statement. Capital expenditure for the operating segments and customers & products businesses is presented on the same basis.
Carbon intensity of the energy products we sell
The weighted average GHG (CO2, methane, N2O) emissions per unit of energy delivered (in grams CO2e/MJ) estimated in respect of marketed sales of energy products« and sales of physically traded energy products«. GHG emissions are estimated on a lifecycle basis covering production extraction, transportation, processing, distribution and use of the relevant products (assuming, where the energy product is a fuel for combustion, full stoichiometric combustion of the product to CO2).
Cash balance point
Cash balance point is defined as the implied Brent oil price for the quarter that would cause the sum of operating cash flow excluding Gulf of Mexico oil spill payments (assuming actual refining marker margins and Henry Hub gas prices for the quarter) and proceeds from loan repayments to equate to the sum of total cash capital expenditure, lease liability payments, dividend paid, and payments on perpetual hybrid bonds.
Cash costs
Cash costs is a non-GAAP measure and is defined as production and manufacturing expenses plus distribution and administration expenses and excludes costs that are classified as adjusting items and costs that are variable, primarily with volumes (such as freight costs). It also includes exploration geological and geophysical costs, which are included in the exploration expenses line in the group income statement. Management believes that cash costs is a performance measure that provides investors with useful information regarding the company’s financial performance because it considers these expenses to be the principal operating and overhead expenses that are most directly under their control although they also include certain foreign exchange and commodity price effects.
Castrol sales and other operating revenues
Castrol sales and other operating revenues, are sales and other operating revenues generated by our Castrol business.
Commodity trading contracts
bp participates in regional and global commodity trading markets in order to manage, transact and hedge the crude oil, refined products and natural
| | | | | | | | | | | | | | |
| | bp Annual Report and Form 20-F 2021 | | 379 |
gas that the group either produces or consumes in its manufacturing operations. The range of contracts the group enters into in its commodity trading operations is described below. Using these contracts, in combination with rights to access storage and transportation capacity, allows the group to access advantageous pricing differences between locations, time periods and grades.
Exchange-traded commodity derivatives
Contracts that are typically in the form of futures and options traded on a recognized exchange, such as Nymex and ICE. Such contracts are traded in standard specifications for the main marker crude oils, such as Brent and West Texas Intermediate; the main product grades, such as gasoline and gasoil; and for natural gas and power. Gains and losses, otherwise referred to as variation margin, are generally settled on a daily basis with the relevant exchange. These contracts are used for the trading and risk management of crude oil, refined products, and natural gas and power. Realized and unrealized gains and losses on exchange-traded commodity derivatives are included in sales and other operating revenues for accounting purposes.
Over-the-counter (OTC) contracts
Contracts that are typically in the form of forwards, swaps and options. Some of these contracts are traded bilaterally between counterparties or through brokers, others may be cleared by a central clearing counterparty. These contracts can be used both for trading and risk management activities. Realized and unrealized gains and losses on OTC contracts are included in sales and other operating revenues for accounting purposes. Many grades of crude oil bought and sold use standard contracts including US domestic light sweet crude oil, commonly referred to as West Texas Intermediate, and a standard North Sea crude blend – Brent, Forties, Oseberg and Ekofisk (BFOE). Forward contracts are used in connection with the purchase of crude oil supplies for refineries and for marketing and sales of the group’s oil production and refined products. The contracts typically contain standard delivery and settlement terms. These transactions call for physical delivery of oil with consequent operational and price risk. However, various means exist and are used from time to time, to settle obligations under the contracts in cash rather than through physical delivery. Physically settled BFOE contracts delivered by cargo additionally specify a standard volume and tolerance.
Gas and power OTC markets are highly developed in North America and the UK, where commodities can be bought and sold for delivery in future periods. These contracts are negotiated between two parties to purchase and sell gas and power at a specified price, with delivery and settlement at a future date. Typically, the contracts specify delivery terms for the underlying commodity. Some of these transactions are not settled physically as they can be net settled by transacting offsetting sale or purchase contracts for the same location and delivery period. The contracts contain standard terms such as delivery point, pricing mechanism, settlement terms and specification of the commodity. Typically, volume, price and term (e.g. daily, monthly and balance of month) are the main variable contract terms.
Swaps are typically contractual obligations to exchange cash flows between two parties. A typical swap transaction usually references a floating price and a fixed price with the net difference of the cash flows being settled. Options give the holder the right, but not the obligation, to buy or sell crude, oil products, natural gas or power at a specified price on or before a specific future date. Amounts under these derivative financial instruments are settled at expiry. Typically, netting agreements are used to limit credit exposure and support liquidity.
Spot and term contracts
Spot contracts are contracts to purchase or sell a commodity at the market price prevailing on or around the delivery date when title to the inventory is taken. Term contracts are contracts to purchase or sell a commodity at regular intervals over an agreed term. Though spot and term contracts may have a standard form, there is no offsetting mechanism in place. As such, these transactions result in physical delivery with operational and price risk. Spot and term contracts typically relate to purchases of crude for a refinery, products for marketing, or third-party natural gas, or sales of the group’s oil production, oil products or gas production to third parties. For accounting purposes, spot and term sales are included in sales and other operating revenues when title
passes. Similarly, spot and term purchases are included in purchases for accounting purposes.
Consolidation adjustment – UPII
Unrealized profit in inventory arising on inter-segment transactions.
Convenience gross margin
Non-GAAP measure. Convenience gross margin is calculated as RC profit before interest and tax for the customers & products segment, excluding RC profit before interest and tax for the refining & trading and petrochemicals businesses, and adjusting items« (as defined above) for the convenience & mobility business to derive underlying RC profit before interest and tax for the convenience & mobility business; subtracting underlying RC profit before interest and tax for the Castrol business; adding back depreciation, depletion and amortization, production and manufacturing, distribution and administration expenses for convenience & mobility (excluding Castrol); subtracting earnings from equity-accounted entities in the convenience & mobility business (excluding Castrol) and gross margin for the retail fuels, next-gen (such as electrification), aviation, B2B and midstream businesses.
Convenience, retail fuels and electrification gross margin
Non-GAAP measure. Convenience, retail fuels and electrification gross margin is calculated as RC profit before interest and tax for the customers & products segment, excluding RC profit before interest and tax for the refining & trading and petrochemicals businesses, and adjusting items« (as defined above) for the convenience & mobility business to derive underlying RC profit before interest and tax for the convenience & mobility business; subtracting underlying RC profit before interest and tax for the Castrol business; adding back depreciation, depletion and amortization, production and manufacturing, distribution and administration expenses for convenience & mobility (excluding Castrol); subtracting earnings from equity-accounted entities in the convenience & mobility business (excluding Castrol) and gross margin for aviation, B2B and midstream businesses. Margin share for convenience and electrification is the ratio of convenience and electrification gross margin to total gross margin for convenience, retail fuels and electrification.
bp believes it is helpful to disclose the margin share from convenience and electrification because this measure may help investors to understand and evaluate, in the same way as management, our progress against our strategic objectives of convenience growth and scaling up our next-gen mobility solutions (such as electrification). The nearest GAAP measures of the numerator and denominator are RC profit before interest and tax for the customers & products segment. A reconciliation to GAAP information is provided on page 354.
We are unable to present forward-looking information of the nearest GAAP measures of the numerator and denominator for margin share for convenience and electrification, because without unreasonable efforts, we are unable to forecast accurately certain adjusting items required to calculate a meaningful comparable GAAP forward-looking financial measure. These items include inventory holding gains or losses, that is difficult to predict in advance in order to include in a GAAP estimate.
Cumulative cash costs reductions
Non-GAAP measure. See cash costs definition above. Cumulative cash cost reductions in 2021 compared to 2019, as applicable to the directors’ remuneration performance measure, are further defined as 2021 exit rate, less agreed portfolio changes and costs in direct support of growth and costs in direct support of growth compared to 2019 baseline.
Customer touchpoints
Customer touchpoints are the number of retail customer transactions per day on bp forecourts globally. These include transactions involving fuel and/or convenience across all channels of trade.
Developed renewables to final investment decision (FID)
Total generating capacity for assets developed to FID by all entities where bp has an equity share (proportionate to equity share). If asset is subsequently sold bp will continue to record capacity as developed to FID. If bp equity share increases developed capacity to FID will increase proportionately to share increase for any assets where bp held equity at the point of FID.
Divestment proceeds
Disposal proceeds as per the group cash flow statement.
| | | | | | | | | | | | | | |
380 | | bp Annual Report and Form 20-F 2021 | | |
Dividend yield
Sum of the four quarterly dividends announced in respect of the year as a percentage of the year-end share price.
Effective tax rate (ETR) on replacement cost (RC) profit or loss
Non-GAAP measure. The ETR on RC profit or loss is calculated by dividing taxation on a RC basis by RC profit or loss before tax. Taxation on a RC basis for the group is calculated as taxation as stated on the group income statement adjusted for taxation on inventory holding gains and losses. Information on RC profit or loss is provided below. bp believes it is helpful to disclose the ETR on RC profit or loss because this measure excludes the impact of price changes on the replacement of inventories and allows for more meaningful comparisons between reporting periods. The nearest equivalent measure on an IFRS basis is the ETR on profit or loss for the period. A reconciliation to GAAP information is provided on page 386.
Electric vehicle charge points / EV charge points
Defined as the number of connectors on a charging device, operated by either bp or a bp joint venture.
Fair value accounting effects
Non-GAAP adjustments to our IFRS profit or loss. They reflect the difference between the way bp manages the economic exposure and internally measures performance of certain activities and the way those activities are measured under IFRS. Fair value accounting effects are included within adjusting items. They relate to certain of the group's commodity, interest rate and currency risk exposures as detailed below. Other than as noted below, the fair value accounting effects described are reported in both the gas & low carbon energy and customer & products segments.
bp uses derivative instruments to manage the economic exposure relating to inventories above normal operating requirements of crude oil, natural gas and petroleum products. Under IFRS, these inventories are recorded at historical cost. The related derivative instruments, however, are required to be recorded at fair value with gains and losses recognized in the income statement. This is because hedge accounting is either not permitted or not followed, principally due to the impracticality of effectiveness-testing requirements. Therefore, measurement differences in relation to recognition of gains and losses occur. Gains and losses on these inventories, other than net realizable value provisions, are not recognized until the commodity is sold in a subsequent accounting period. Gains and losses on the related derivative commodity contracts are recognized in the income statement, from the time the derivative commodity contract is entered into, on a fair value basis using forward prices consistent with the contract maturity.
bp enters into physical commodity contracts to meet certain business requirements, such as the purchase of crude for a refinery or the sale of bp’s gas production. Under IFRS these physical contracts are treated as derivatives and are required to be fair valued when they are managed as part of a larger portfolio of similar transactions. Gains and losses arising are recognized in the income statement from the time the derivative commodity contract is entered into.
IFRS require that inventory held for trading is recorded at its fair value using period-end spot prices, whereas any related derivative commodity instruments are required to be recorded at values based on forward prices consistent with the contract maturity. Depending on market conditions, these forward prices can be either higher or lower than spot prices, resulting in measurement differences.
bp enters into contracts for pipelines and other transportation, storage capacity, oil and gas processing, liquefied natural gas (LNG) and certain gas and power contracts that, under IFRS, are recorded on an accruals basis. These contracts are risk-managed using a variety of derivative instruments that are fair valued under IFRS. This results in measurement differences in relation to recognition of gains and losses.
The way that bp manages the economic exposures described above, and measures performance internally, differs from the way these activities are measured under IFRS. bp calculates this difference for consolidated entities by comparing the IFRS result with management’s internal measure of performance. Under management’s internal measure of performance the inventory, transportation and capacity contracts in question are valued based on fair value using relevant forward prices prevailing at the end of the period. The fair values of derivative
instruments used to risk manage certain oil, gas, power and other contracts, are deferred to match with the underlying exposure and the commodity contracts for business requirements are accounted for on an accruals basis. We believe that disclosing management’s estimate of this difference provides useful information for investors because it enables investors to see the economic effect of these activities as a whole.
Fair value accounting effects also include changes in the fair value of the near-term portions of LNG contracts that fall within bp’s risk management framework. LNG contracts are not considered derivatives, because there is insufficient market liquidity, and they are therefore accrual accounted under IFRS. However, oil and natural gas derivative financial instruments (used to risk manage the near-term portions of the LNG contracts) are fair valued under IFRS. The fair value accounting effect, which is reported in the gas and low carbon energy segment, reduces the measurement differences between that of the derivative financial instruments used to risk manage the LNG contracts and the measurement of the LNG contracts themselves, which therefore gives a better representation of performance in each period.
In addition, from 2020 fair value accounting effects include changes in the fair value of derivatives entered into by the group to manage currency exposure and interest rate risks relating to hybrid bonds to their respective first call periods. The hybrid bonds which were issued on 17 June 2020 are classified as equity instruments and were recorded in the balance sheet at that date at their USD equivalent issued value. Under IFRS these equity instruments are not remeasured from period to period, and do not qualify for application of hedge accounting. The derivative instruments relating to the hybrid bonds, however, are required to be recorded at fair value with mark to market gains and losses recognized in the income statement. Therefore, measurement differences in relation to the recognition of gains and losses occur. The fair value accounting effect, which is reported in the other businesses & corporate segment, eliminates the fair value gains and losses of these derivative financial instruments that are recognized in the income statement. We believe that this gives a better representation of performance, by more appropriately reflecting the economic effect of these risk management activities, in each period.
Finance debt ratio
Finance debt ratio is defined as the ratio of finance debt to the total of finance debt plus total equity.
Free cash flow
Operating cash flow less net cash used in investing activities and lease liability payments included in financing activities, as presented in the group cash flow statement. Free cash flow excluding Deepwater Horizon costs, as applicable to the directors’ remuneration performance measure, is defined as free cash flow excluding post-tax operating cash flows relating to the Gulf of Mexico oil spill, adjusting for other proceeds reported within financing activities in the group cash flow statement and movements in lease creditor.
Gearing and net debt
Non-GAAP measures. Net debt is calculated as finance debt, as shown in the balance sheet, plus the fair value of associated derivative financial instruments that are used to hedge foreign currency exchange and interest rate risks relating to finance debt, for which hedge accounting is applied, less cash and cash equivalents. Net debt does not include accrued interest, which is reported within other receivables and other payables on the balance sheet and for which the associated cash flows are presented as operating cash flows in the group cash flow statement. Gearing is defined as the ratio of net debt to the total of net debt plus total equity. bp believes these measures provide useful information to investors. Net debt enables investors to see the economic effect of finance debt, related hedges and cash and cash equivalents in total. Gearing enables investors to see how significant net debt is relative to total equity. The derivatives are reported on the balance sheet within the headings ‘Derivative financial instruments’. See Financial statements – Note 26 for information on finance debt, which is the nearest equivalent measure to net debt on an IFRS basis. The nearest equivalent GAAP measure to gearing on an IFRS basis is finance debt ratio.
We are unable to present reconciliations of forward-looking information for net debt or gearing to finance debt and total equity, because without unreasonable efforts, we are unable to forecast accurately certain
| | | | | | | | | | | | | | |
| | bp Annual Report and Form 20-F 2021 | | 381 |
adjusting items required to present a meaningful comparable GAAP forward-looking financial measure. These items include fair value asset (liability) of hedges related to finance debt and cash and cash equivalents, that are difficult to predict in advance in order to include in a GAAP estimate.
Gearing including leases and net debt including leases
Non-GAAP measure. Net debt including leases is calculated as net debt plus lease liabilities, less the net amount of partner receivables and payables relating to leases entered into on behalf of joint operations. Gearing including leases is defined as the ratio of net debt including leases to the total of net debt including leases plus total equity. bp believes these measures provide useful information to investors as they enable investors to understand the impact of the group’s lease portfolio on net debt and gearing. See Financial statements – Note 26 for information on finance debt, which is the nearest equivalent measure to net debt including leases on an IFRS basis. The nearest equivalent GAAP measure to gearing including leases on an IFRS basis is finance debt ratio. A reconciliation to GAAP information is provided on page 341.
Green hydrogen
Hydrogen produced by electrolysis of water using renewable power.
Grey hydrogen
Produced via natural gas or coal without CCUS.
Hydrocarbons
Liquids and natural gas. Natural gas is converted to oil equivalent at 5.8 billion cubic feet = 1 million barrels.
Inorganic capital expenditure
A subset of capital expenditure on a cash basis and is a non-GAAP measure. Inorganic capital expenditure comprises consideration in business combinations and certain other significant investments made by the group. It is reported on a cash basis. bp believes that this measure provides useful information as it allows investors to understand how bp’s management invests funds in projects which expand the group’s activities through acquisition. The nearest equivalent measure on an IFRS basis is capital expenditure on a cash basis. Further information and a reconciliation to GAAP information is provided on page 338.
Inventory holding gains and losses
Inventory holding gains and losses are non-GAAP adjustments to our IFRS profit (loss) and represent:
a.the difference between the cost of sales calculated using the replacement cost of inventory and the cost of sales calculated on the first-in first-out (FIFO) method after adjusting for any changes in provisions where the net realizable value of the inventory is lower than its cost. Under the FIFO method, which we use for IFRS reporting of inventories other than for trading inventories, the cost of inventory charged to the income statement is based on its historical cost of purchase or manufacture, rather than its replacement cost. In volatile energy markets, this can have a significant distorting effect on reported income. The amounts disclosed as inventory holding gains and losses represent the difference between the charge to the income statement for inventory on a FIFO basis (after adjusting for any related movements in net realizable value provisions) and the charge that would have arisen based on the replacement cost of inventory. For this purpose, the replacement cost of inventory is calculated using data from each operation’s production and manufacturing system, either on a monthly basis, or separately for each transaction where the system allows this approach; and
b.an adjustment relating to certain trading inventories that are not price risk managed which relate to a minimum inventory volume that is required to be held to maintain underlying business activities. This adjustment represents the movement in fair value of the inventories due to prices, on a grade by grade basis, during the period. This is calculated from each operation’s inventory management system on a monthly basis using the discrete monthly movement in market prices for these inventories.
The amounts disclosed are not separately reflected in the financial statements as a gain or loss. No adjustment is made in respect of the cost of inventories held as part of a trading position and certain other temporary inventory positions that are price risk-managed. See Replacement cost (RC) profit or loss definition below.
Joint arrangement
An arrangement in which two or more parties have joint control.
Joint control
Contractually agreed sharing of control over an arrangement, which exists only when decisions about the relevant activities require the unanimous consent of the parties sharing control.
Joint operation
A joint arrangement whereby the parties that have joint control of the arrangement have rights to the assets, and obligations for the liabilities, relating to the arrangement.
Joint venture
A joint arrangement whereby the parties that have joint control of the arrangement have rights to the net assets of the arrangement.
Liquids
Comprises crude oil, condensate and natural gas liquids. For the oil production & operations segment, it also includes bitumen.
LNG portfolio
LNG portfolio refers to bp group’s LNG equity production plus additional long-term merchant LNG volumes.
LNG train
An LNG train is a processing facility used to liquefy and purify natural gas in the formation of LNG.
Low carbon energy / low carbon technologies
Low carbon (renewable) electricity; bio-energy; electrification; future mobility solutions; carbon capture, use and storage (CCUS); blue or green hydrogen«; and trading in low carbon products. Note that, while there is some overlap, these terms do not mean the same as bp’s strategic focus area of low carbon energy or our low carbon energy sub-segment, reported within the gas & low carbon energy segment.
Low carbon investment / investment in low carbon energy / investment in low carbon
Capital expenditure on low carbon energy« or technologies with investment on low carbon energy or technologies through bp ventures and Launchpad.
Low carbon and other energy transition activities
Low carbon energy / technologies as described above, together with convenience; integrated gas and power; bp ventures and Launchpad.
Major projects
Have a bp net investment of at least $250 million, or are considered to be of strategic importance to bp or of a high degree of complexity.
Margin share for convenience and electrification
Non-GAAP measure. Margin share for convenience and electrification is the ratio of convenience and electrification gross margin to total gross margin for convenience, retail fuels and electrification. See Convenience, retail fuels and electrification gross margin definition above.
Operating cash flow
Net cash provided by (used in) operating activities as stated in the group cash flow statement. When used in the context of a segment rather than the group, the terms refer to the segment’s share thereof.
Operating management system (OMS)
bp’s OMS helps us manage risks in our operating activities by setting out bp’s principles for good operating practice. It brings together bp requirements on health, safety, security, the environment, social responsibility and operational reliability, as well as related issues, such as maintenance, contractor relations and organizational learning, into a common management system.
| | | | | | | | | | | | | | |
382 | | bp Annual Report and Form 20-F 2021 | | |
Organic capital expenditure
Non-GAAP measure. Organic capital expenditure comprises capital expenditure on a cash basis less inorganic capital expenditure. bp believes that this measure provides useful information as it allows investors to understand how bp’s management invests funds in developing and maintaining the group’s assets. The nearest equivalent measure on an IFRS basis is capital expenditure on a cash basis. An analysis of organic capital expenditure by segment and region, and a reconciliation to GAAP information is provided on page 338.
We are unable to present reconciliations of forward-looking information for organic capital expenditure to total cash capital expenditure, because without unreasonable efforts, we are unable to forecast accurately the adjusting item, inorganic capital expenditure, that is difficult to predict in advance in order to derive the nearest GAAP estimate.
Production-sharing agreement / contract (PSA / PSC)
An arrangement through which an oil and gas company bears the risks and costs of exploration, development and production. In return, if exploration is successful, the oil company receives entitlement to variable physical volumes of hydrocarbons, representing recovery of the costs incurred and a stipulated share of the production remaining after such cost recovery.
Rapid/Rapid charging
Rapid charging includes electric vehicle charging of greater or equal to 50kW and less than 150kW.
Realizations
Realizations are the result of dividing revenue generated from hydrocarbon sales, excluding revenue generated from purchases made for resale and royalty volumes, by revenue generating hydrocarbon production volumes. Revenue generating hydrocarbon production reflects the bp share of production as adjusted for any production which does not generate revenue. Adjustments may include losses due to shrinkage, amounts consumed during processing, and contractual or regulatory host committed volumes such as royalties. For the gas & low carbon energy and oil production & operations segments, realizations include transfers between businesses.
Refining availability
Represents Solomon Associates’ operational availability for bp-operated refineries, which is defined as the percentage of the year that a unit is available for processing after subtracting the annualized time lost due to turnaround activity and all planned mechanical, process and regulatory downtime.
Refining marker margin (RMM)
The average of regional indicator margins weighted for bp’s crude refining capacity in each region. Each regional marker margin is based on product yields and a marker crude oil deemed appropriate for the region. The regional indicator margins may not be representative of the margins achieved by bp in any period because of bp’s particular refinery configurations and crude and product slate.
Replacement cost (RC) profit or loss / RC profit or loss attributable to bp shareholders
Reflects the replacement cost of inventories sold in the period and is calculated as profit or loss attributable to bp shareholders, adjusting for inventory holding gains and losses (net of tax). RC profit or loss for the group is not a recognized GAAP measure. bp believes this measure is useful to illustrate to investors the fact that crude oil and product prices can vary significantly from period to period and that the impact on our reported result under IFRS can be significant. Inventory holding gains and losses vary from period to period due to changes in prices as well as changes in underlying inventory levels. In order for investors to understand the operating performance of the group excluding the impact of price changes on the replacement of inventories, and to make comparisons of operating performance between reporting periods, bp’s management believes it is helpful to disclose this measure. The nearest equivalent measure on an IFRS basis is profit or loss attributable to bp shareholders. See Financial statements – Note 4. A reconciliation to GAAP information is provided on page 386.
Renewables pipeline
Renewable projects satisfying the criteria below until the point they can be considered developed to FID :
Site based projects that have obtained land exclusivity rights, or for PPA based projects an offer has been made to the counterparty, or for auction projects pre-qualification criteria has been met, or for acquisition projects post a binding offer has been accepted.
Reserves replacement ratio
The extent to which the year’s production has been replaced by proved reserves added to our reserve base. The ratio is expressed in oil-equivalent terms and includes changes resulting from discoveries, improved recovery and extensions and revisions to previous estimates, but excludes changes resulting from acquisitions and disposals.
Retail sites
Retail sites include sites operated by dealers, jobbers, franchisees or brand licensees or joint venture (JV) partners, under the bp brand. These may move to and from the bp brand as their fuel supply agreement or brand licence agreement expires and are renegotiated in the normal course of business. Retail sites are primarily branded bp, ARCO, Amoco, Aral and Thorntons, and also includes sites in India through our Jio-bp JV.
Retail sites in growth markets
These are retail sites that are either bp branded or co-branded with our partners in China, Mexico and Indonesia and also include sites in India through our Jio-bp JV.
Return on average capital employed
Non-GAAP measure. Return on average capital employed (ROACE) is defined as underlying replacement cost profit, which is defined as profit or loss attributable to bp shareholders adjusted for inventory holding gains and losses, adjusting items and related taxation on inventory holding gains and losses and adjusting items total taxation, after adding back non-controlling interest and interest expense net of tax, divided by the average of the beginning and ending balances of total equity plus finance debt, excluding cash and cash equivalents and goodwill as presented on the group balance sheet over the periods presented. Interest expense is finance costs as presented on the group income statement, excluding lease interest and the unwinding of the discount on provisions and other payables before tax. bp believes it is helpful to disclose the ROACE because this measure gives an indication of the company's capital efficiency. The nearest GAAP measures of the numerator and denominator are profit or loss for the period attributable to bp shareholders and total equity respectively. The reconciliation of the numerator and denominator is provided on page 387.
We are unable to present forward-looking information of the nearest GAAP measures of the numerator and denominator for ROACE, because without unreasonable efforts, we are unable to forecast accurately certain adjusting items required to calculate a meaningful comparable GAAP forward-looking financial measure. These items include inventory holding gains or losses and interest net of tax, that are difficult to predict in advance in order to include in a GAAP estimate.
Strategic convenience sites
Strategic convenience sites are retail sites, within the bp portfolio, which sell bp-branded vehicle energy and carry one of the strategic convenience brands (e.g. M&S, Thorntons, Rewe to Go). To be considered a strategic convenience brand the convenience offer should have a demonstrable level of differentiation in the market in which it operates. Strategic convenience site count includes sites under a pilot phase, but exclude sites in growth markets.
Subsidiary
An entity that is controlled by the bp group. Control of an investee exists when an investor is exposed, or has rights, to variable returns from its involvement with the investee and has the ability to affect those returns through its power over the investee.
Surplus cash flow
Surplus cash flow is a non-GAAP measure and refers to the net surplus of sources of cash over uses of cash, after reaching the $35 billion net debt target. Sources of cash include net cash provided by operating activities, cash provided from investing activities and cash receipts relating to transactions involving non-controlling interests. Uses of cash include lease
| | | | | | | | | | | | | | |
| | bp Annual Report and Form 20-F 2021 | | 383 |
liability payments, payments on perpetual hybrid bond, dividends paid, cash capital expenditure, the cash cost of share buybacks to offset the dilution from vesting of awards under employee share schemes, cash payments relating to transactions involving non-controlling interests and currency translation differences relating to cash and cash equivalents as presented on the condensed group cash flow statement. The components of our sources of cash and uses of cash are provided on page 341.
Technical service contract (TSC)
Technical service contract is an arrangement through which an oil and gas company bears the risks and costs of exploration, development and production. In return, the oil and gas company receives entitlement to variable physical volumes of hydrocarbons, representing recovery of the costs incurred and a profit margin which reflects incremental production added to the oilfield.
Tier 1 and tier 2 process safety events
Tier 1 events are losses of primary containment from a process of greatest consequence – causing harm to a member of the workforce, damage to equipment from a fire or explosion, a community impact or exceeding defined quantities. Tier 2 events are those of lesser consequence. These represent reported incidents occurring within bp’s operational HSSE reporting boundary. That boundary includes bp’s own operated facilities and certain other locations or situations.
Tight oil and gas
Natural oil and gas reservoirs locked in hard sandstone rocks with low permeability, making the underground formation extremely tight.
Traded electricity
Traded electricity refers to sales data for physically delivered electricity.
Transition and low carbon investments
Capital expenditure on low carbon or other energy transition activities«.
UK National Balancing Point
A virtual trading location for sale, purchase and exchange of UK natural gas. It is the pricing and delivery point for the Intercontinental Exchange natural gas futures contract.
Ultra fast/Ultra-fast charging
Electric vehicle charging of greater than or equal to 150kW.
Unconventionals
Resources found in geographic accumulations over a large area, that usually present additional challenges to development such as low permeability or high viscosity. Examples include shale gas and oil, coalbed methane, gas hydrates and natural bitumen deposits. These typically require specialized extraction technology such as hydraulic fracturing or steam injection.
Underlying effective tax rate (ETR)
Non-GAAP measure. The underlying ETR is calculated by dividing taxation on an underlying replacement cost (RC) basis by underlying RC profit or loss before tax. Taxation on an underlying RC basis for the group is calculated as taxation as stated on the group income statement adjusted for taxation on inventory holding gains and losses and adjusting items total taxation. Information on underlying RC profit or loss is provided below. Taxation on an underlying RC basis presented for the operating segments is calculated through an allocation of taxation on an underlying RC basis to each segment. bp believes it is helpful to disclose the underlying ETR because this measure may help investors to understand and evaluate, in the same manner as management, the underlying trends in bp’s operational performance on a comparable basis, period on period. Taxation on an underlying RC basis and underlying ETR are non-GAAP measures. The nearest equivalent measure on an IFRS basis is the ETR on profit or loss for the period.
We are unable to present reconciliations of forward-looking information for underlying ETR to ETR on profit or loss for the period, because without unreasonable efforts, we are unable to forecast accurately certain adjusting items required to present a meaningful comparable GAAP forward-looking financial measure. These items include the taxation on inventory holding gains and losses and adjusting items, that are difficult to predict in advance in order to include in a GAAP estimate. A reconciliation to GAAP information is provided on page 386.
Underlying production
Production after adjusting for acquisitions and divestments and entitlement impacts in our production-sharing agreements (PSAs). 2021 underlying production, when compared with 2020, is production after adjusting for acquisitions and divestments, curtailments, and entitlement impacts in our production-sharing agreements/contracts and technical service contract.
Underlying replacement cost (RC) profit or loss / underlying RC profit or loss attributable to bp shareholders
Non-GAAP measure. RC profit or loss« (as defined above) after excluding net adjusting items and related taxation. See page 339 for additional information on the adjusting items that are used to arrive at underlying RC profit or loss in order to enable a full understanding of the items and their financial impact. Underlying RC profit or loss before interest and tax for the operating segments or customers & products businesses is calculated as RC profit or loss (as defined above) including profit or loss attributable to non-controlling interests before interest and tax for the operating segments and excluding net adjusting items for the respective operating segment or business.
bp believes that underlying RC profit or loss is a useful measure for investors because it is a measure closely tracked by management to evaluate bp’s operating performance and to make financial, strategic and operating decisions and because it may help investors to understand and evaluate, in the same manner as management, the underlying trends in bp’s operational performance on a comparable basis, period on period, by adjusting for the effects of these adjusting items. The nearest equivalent measure on an IFRS basis for the group is profit or loss attributable to bp shareholders. The nearest equivalent measure on an IFRS basis for segments and businesses is RC profit or loss before interest and taxation. A reconciliation to GAAP information is provided on page 386 for the group and pages 41-50 for the segments.
Underlying replacement cost (RC) profit or loss per share
Non-GAAP measure. Earnings per share is defined Financial statements – Note 10. Underlying RC profit or loss per ordinary share is calculated using the same denominator as earnings per share as defined in the consolidated financial statements. The numerator used is underlying RC profit or loss attributable to bp shareholders rather than profit or loss attributable to bp shareholders. Underlying RC profit or loss per ADS is calculated as outlined above for underlying RC profit or loss per share except the denominator is adjusted to reflect one ADS equivalent to six ordinary shares. bp believes it is helpful to disclose the underlying RC profit or loss per share and per ADS because these measures may help investors to understand and evaluate, in the same manner as management, the underlying trends in bp’s operational performance on a comparable basis, period on period. The nearest equivalent measure on an IFRS basis is basic earnings per share based on profit or loss for the period attributable to bp shareholders. A reconciliation to GAAP information is provided on page 386.
upstream
upstream includes oil and natural gas field development and production within the gas & low carbon energy and oil production & operations segments. References to upstream exclude Rosneft.
upstream / hydrocarbon plant reliability
bp-operated upstream plant reliability is calculated taking 100% less the ratio of total unplanned plant deferrals divided by installed production capacity, excluding non-operated assets and bpx energy. Unplanned plant deferrals are associated with the topside plant and where applicable the subsea equipment (excluding wells and reservoir). Unplanned plant deferrals include breakdowns, which does not include Gulf of Mexico weather related downtime.
upstream unit production costs
upstream unit production costs are calculated as production costs divided by units of production. Production costs do not include ad valorem and severance taxes. Units of production are barrels for liquids and thousands of cubic feet for gas. Amounts disclosed are for bp subsidiaries only and do not include bp’s share of equity-accounted entities.
West Texas Intermediate (WTI)
A light sweet crude oil, priced at Cushing, Oklahoma, which serves as a benchmark price for purchases of oil in the US.
| | | | | | | | | | | | | | |
384 | | bp Annual Report and Form 20-F 2021 | | |
Working capital
Movements in inventories and other current and non-current assets and liabilities as stated in the group cash flow statement.
Trade marks
Trade marks of the bp group appear throughout this report. They include:
Aral, Aral pulse, BP, bp pulse, Castrol, Castrol ON, Amoco, Thorntons
Trade marks:
Amazon Web Services – a trademark of amazon.com, inc
REWE to Go – a registered trade mark of REWE.
| | | | | | | | | | | | | | |
| | bp Annual Report and Form 20-F 2021 | | 385 |
Non-GAAP measures reconciliations
Reconciliation of profit or loss for the period to underlying RC profit or loss«
| | | | | | | | | | | | | | | | | | | | |
| | $ million |
| | 2021 | 2020 | 2019 | 2018 | 2017 |
| Profit (loss) for the year attributable to bp shareholders | | 7,565 | | (20,305) | | 4,026 | | 9,383 | | 3,389 | |
Inventory holding (gains) losses«, before tax | | (3,655) | | 2,868 | | (667) | | 801 | | (853) | |
| Taxation charge (credit) on inventory holding gains and losses | | 829 | | (667) | | 156 | | (198) | | 225 | |
RC profit (loss)« for the year | | 4,739 | | (18,104) | | 3,515 | | 9,986 | | 2,761 | |
Net (favourable) adverse impact of adjusting items«, before tax | | 8,697 | | 16,649 | | 8,263 | | 3,380 | | 3,730 | |
| Taxation charge (credit) on adjusting items and certain foreign exchange impacts on the group’s tax charge for the period | | (621) | | (4,235) | | (1,788) | | (643) | | (325) | |
Underlying RC profit or loss for the year | | 12,815 | | (5,690) | | 9,990 | | 12,723 | | 6,166 | |
| | | | | | |
| | | | | | |
| | | | | | |
| | | | | | |
| | | | | | |
| | | | | | |
| | | | | | |
| | | | | | |
| | | | | | |
| | | | | | |
| | | | | | |
| | | | | | |
| | | | | | |
| | | | | | |
| | | | | | |
| | | | | | |
| | | | | | |
| | | | | | |
| | | | | | |
| | | | | | |
| | | | | | |
| | |
| | | | | | |
| | | | | | |
Reconciliation of basic earnings per ordinary share to underlying RC profit per share«
| | | | | | | | | | | | | | | | |
| | Per ordinary share – cents |
| | 2021 | 2020 | 2019 | | |
Profit (loss) for the yeara | | 37.57 | | (100.42) | | 19.84 | | | |
Inventory holding (gains) losses«, before tax | | (18.16) | | 14.18 | | (3.29) | | | |
| Taxation charge (credit) on inventory holding gains and losses | | 4.12 | | (3.29) | | 0.77 | | | |
| | 23.53 | | (89.53) | | 17.32 | | | |
Net (favourable) adverse impact of adjusting items«, before tax | | 43.21 | | 82.33 | | 40.73 | | | |
| Taxation charge (credit) on adjusting items | | (3.09) | | (20.94) | | (8.81) | | | |
| Underlying RC profit for the year | | 63.65 | | (28.14) | | 49.24 | | | |
a Profit attributable to bp shareholders.
Reconciliation of effective tax rate (ETR) to ETR on RC profit or loss and underlying ETR«
Taxation (charge) credit
| | | | | | | | | | | | | | | | |
| | $ million |
| | 2021 | 2020 | 2019 | | |
| Taxation on profit or loss for the year | | (6,740) | | 4,159 | | (3,964) | | | |
| Adjusted for taxation on inventory holding gains and losses | | (829) | | 667 | | (156) | | | |
| Taxation on a RC profit or loss basis | | (5,911) | | 3,492 | | (3,808) | | | |
| Adjusted for taxation on adjusting items and certain foreign exchange impacts on the group’s tax charge for the period | | 621 | | 4,235 | | 1,788 | | | |
| | | | | | |
| Taxation on an underlying RC basis | | (6,532) | | (743) | | (5,596) | | | |
| | | | | | |
| | | | | | |
Effective tax rate
| | | | | | | | | | | | | | | | |
| | % |
| | 2021 | 2020 | 2019 | | |
| ETR on profit or loss for the year | | 44 | | 17 | | 49 | | | |
| Adjusted for inventory holding gains and losses | | 7 | | (1) | | 2 | | | |
| ETR on RC profit or loss | | 51 | | 16 | | 51 | | | |
| Adjusted for adjusting items and certain foreign exchange impacts on the group’s tax charge for the period | | (19) | | (30) | | (15) | | | |
| | | | | | |
| Underlying ETR | | 32 | | (14) | | 36 | | | |
| | | | | | |
| | | | | | |
| | | | | | | | | | | | | | |
386 | | bp Annual Report and Form 20-F 2021 | | « See Glossary |
Return on average capital employed (ROACE)«
| | | | | | | | | | | | | | | | | | | | |
| | | $ million |
| | 2021 | 2020 | 2019 | 2018 | 2017 |
| Profit (loss) for the year attributable to bp shareholders | | 7,565 | | (20,305) | | 4,026 | | 9,383 | | 3,389 | |
Inventory holding (gains) losses«, net of tax | | (2,826) | | 2,201 | | (511) | | 603 | | (628) | |
Adjusting items«, after taxation | | 8,076 | | 12,414 | | 6,475 | | 2,737 | | 3,405 | |
| Underlying RC profit | | 12,815 | | (5,690) | | 9,990 | | 12,723 | | 6,166 | |
| | | | | | |
Interest expensea | | 1,322 | | 1,808 | | 2,032 | | 1,779 | | 1,421 | |
Taxation on interest expenseb | | (195) | | (406) | | (288) | | (196) | | (497) | |
| Non-controlling interests (NCI) | | 922 | | (424) | | 164 | | 195 | | 79 | |
| | 14,864 | | (4,712) | | 11,898 | | 14,501 | | 7,169 | |
| Total equity | | 90,439 | | 85,568 | | 100,708 | | 101,548 | | 100,404 | |
| Finance debt | | 61,176 | | 72,664 | | 67,724 | | 65,132 | | 62,574 | |
| Capital employed (2021 average $154,924 million) | | 151,615 | | 158,232 | | 168,432 | | 166,680 | | 162,978 | |
| Less: Goodwill | | 12,373 | | 12,480 | | 11,868 | | 12,204 | | 11,551 | |
| Cash and cash equivalents | | 30,681 | | 31,111 | | 22,472 | | 22,468 | | 25,586 | |
| | 108,561 | | 114,641 | | 134,092 | | 132,008 | | 125,841 | |
| Average capital employed excluding goodwill and cash and cash equivalents | | 111,601 | | 124,367 | | 133,050 | | 128,925 | | 122,836 | |
| ROACE | | 13.3 | % | (3.8) | % | 8.9 | % | 11.2 | % | 5.8 | % |
aFinance costs, as reported in the Group income statement, were $2,857 million (2020 $3,115 million, 2019 $3,489 million, 2018 $2,528 million, 2017 $2,074 million). Interest expense is finance costs excluding lease interest of $306 million (2020 $350 million, 2019 $383 million), unwinding of discount on provisions and other payables of $890 million (2020 $957 million, 2019 $1,074 million, 2018 $749 million, 2017 $653 million) and for 2021 other adjusting items related to finance costs of $339 million. For 2018 and 2017, pre-IFRS 16 implementation, interest expense includes lease interest $51 million and $57 million respectively.
bNotional tax at an assumed 35% in 2017.
Adjusted EBIDA«
| | | | | | | | | | | | | | |
| | | | $ million |
| | 2021 | 2020 | 2019 |
| Profit (loss) for the period | | 8,487 | | (20,729) | | 4,190 | |
| Finance costs | | 2,857 | | 3,115 | | 3,489 | |
| Net finance (income) expense relating to pensions and other post-retirement benefits | | (2) | | 33 | | 63 | |
| Taxation | | 6,740 | | (4,159) | | 3,964 | |
| Profit (loss) before interest and tax | | 18,082 | | (21,740) | | 11,706 | |
| Inventory holding (gains) losses, before tax | | (3,655) | | 2,868 | | (667) | |
| | 14,427 | | (18,872) | | 11,039 | |
| Net (favourable) adverse impact of adjusting items, before interest and tax | | 7,915 | | 16,024 | | 7,752 | |
| | 22,342 | | (2,848) | | 18,791 | |
Taxation on an underlying RC basisa | | (6,532) | | (743) | | (5,596) | |
| | 15,810 | | (3,591) | | 13,195 | |
| Add back: | | | | |
| Depreciation, depletion and amortization | | 14,805 | | 14,889 | | 17,780 | |
Exploration expenditure written off, net of adjusting itemsb | | 168 | | 7,946 | | 631 | |
| Adjusted EBIDA | | 30,783 | | 19,244 | | 31,606 | |
aA definition for taxation on an underlying RC basis is included under Underlying ETR in the glossary on page 384.
bThere are no adjusting items in 2021 and 2019. For 2020, exploration expenditure written off was $9,920 million, of which adjusting items were $1,974 million.
| | | | | | | | | | | | | | |
« See Glossary | | bp Annual Report and Form 20-F 2021 | | 387 |
Reconciliation of RC profit before interest and tax to adjusted EBITDA«
| | | | | | | | | | | | | | |
| | | | $ million |
| | 2021 | 2020 | 2019 |
| gas and low carbon energy | | | | |
| RC profit (loss) before interest and tax | | 2,133 | | (7,068) | | 2,945 | |
Less: Net favourable (adverse) impact of adjusting items« | | (5,395) | | (7,757) | | (503) | |
Underlying RC profit (loss) before interest and tax« | | 7,528 | | 689 | | 3,448 | |
| Add back: Depreciation, depletion and amortization | | 4,464 | | 3,457 | | 5,146 | |
Exploration write-offs, net of adjusting itemsa | | 43 | | 1,068 | | 340 | |
| Adjusted EBITDA | | 12,035 | | 5,214 | | 8,934 | |
| | | | |
| oil production & operations | | | | |
| RC profit (loss) before interest and tax | | 10,501 | | (14,583) | | 1,049 | |
| Less: Net favourable (adverse) impact of adjusting items | | 209 | | (8,695) | | (6,616) | |
| Underlying RC profit (loss) before interest and tax | | 10,292 | | (5,888) | | 7,665 | |
| Add back: Depreciation, depletion and amortization | | 6,528 | | 7,787 | | 9,166 | |
Exploration write-offs, net of adjusting itemsb | | 125 | | 6,878 | | 291 | |
| Adjusted EBITDA | | 16,945 | | 8,777 | | 17,122 | |
a2020 excludes a write-off of $673 million which has been classified within the ‘other’ category of adjusting items.
b2020 excludes a write-off of $1,301 million which has been classified within the ‘other’ category of adjusting items.
The Directors’ report on pages 81-115, 116 (in respect of the remuneration committee report shown in grey only), 254-281 and 337-388 was approved by the board and signed on its behalf by Ben J. S. Mathews, company secretary on 18 March 2022.
BP p.l.c.
Registered in England and Wales No. 102498
| | | | | | | | | | | | | | |
388 | | bp Annual Report and Form 20-F 2021 | | « See Glossary |
Signatures
The registrant hereby certifies that it meets all of the requirements for filing on Form 20-F and that it has duly caused and authorized the undersigned to sign this annual report on its behalf.
BP p.l.c.
(Registrant)
/s/ Ben J. S. Mathews
Company secretary
18 March 2022
| | | | | | | | | | | | | | |
| | bp Annual Report and Form 20-F 2021 | | 389 |
Cross reference to Form 20-F
| | | | | | | | | | | | | | | | | | | | |
| | | | | | Page |
Item 1. | | | | Identity of Directors, Senior Management and Advisors | | n/a |
Item 2. | | | | Offer Statistics and Expected Timetable | | n/a |
Item 3. | | | | Key Information | | |
| | A. | | [Reserved] | | n/a |
| | B. | | Capitalization and indebtedness | | n/a |
| | C. | | Reasons for the offer and use of proceeds | | n/a |
| | D. | | Risk factors | | 76-79 |
Item 4. | | | | Information on the Company | | |
| | A. | | History and development of the company | | 3, 36, 37-50, 198-200, 205, 211, 213-217, 344-355, 371, 391 |
| | B. | | Business overview | | 3, 8-11, 12-17, 19, 23, 29, 37-50, 200-204, 344-352, 354-355, 356-360, 365 |
| | C. | | Organizational structure | | 252, 391 |
| | D. | | Property, plants and equipment | | 26, 46-50, 210-211, 279-281, 343, 344-355, 361 |
Item 4A. | | | | Unresolved Staff Comments | | None |
Item 5. | | | | Operating and Financial Review and Prospects | | |
| | A. | | Operating results | | 3, 8-11, 12-15, 19, 23, 29, 37-50, 213-217, 226, 228-241, 355, 360-361 |
| | B. | | Liquidity and capital resources | | 176-177, 211, 226-227, 228-241, 342-343 |
| | C. | | Research and development, patent and licenses | | 204, 363 |
| | D. | | Trend information | | 3, 8-17, 19, 23, 29, 37-50, 342-355 |
| | E. | | Critical Accounting Estimates | | n/a |
| | | | | | |
| | | | | | |
Item 6. | | | | Directors, Senior Management and Employees | | |
| | A. | | Directors and senior management | | 84-89 |
| | B. | | Compensation | | 116-141, 219-225, 250-251 |
| | C. | | Board practices | | 84-87, 107-113, 116-117 |
| | D. | | Employees | | 71-72, 251 |
| | E. | | Share ownership | | 72, 116-141, 219-225, 250 |
Item 7. | | | | Major Shareholders and Related Party Transactions | | |
| | A. | | Major shareholders | | 370-371 |
| | B. | | Related party transactions | | 213-217, 361 |
| | C. | | Interests of experts and counsel | | n/a |
Item 8. | | | | Financial Information | | |
| | A. | | Consolidated statements and other financial information | | 166-281, 368 |
| | B. | | Significant changes | | 253 |
Item 9. | | | | The Offer and Listing | | |
| | A. | | Offer and listing details | | 368 |
| | B. | | Plan of distribution | | n/a |
| | C. | | Markets | | 368 |
| | D. | | Selling shareholders | | n/a |
| | E. | | Dilution | | n/a |
| | F. | | Expenses of the issue | | n/a |
Item 10. | | | | Additional Information | | |
| | A. | | Share capital | | n/a |
| | B. | | Memorandum and articles of association | | 371-373 |
| | C. | | Material contracts | | 361 |
| | D. | | Exchange controls | | 368 |
| | E. | | Taxation | | 368-370 |
| | F. | | Dividends and paying agents | | n/a |
| | G. | | Statements by experts | | n/a |
| | H. | | Documents on display | | 375 |
| | I. | | Subsidiary information | | n/a |
Item 11. | | | | Quantitative and Qualitative Disclosures about Market Risk | | 228-233 |
Item 12. | | | | Description of securities other than equity securities | | |
| | A. | | Debt Securities | | n/a |
| | B. | | Warrants and Rights | | n/a |
| | C. | | Other Securities | | n/a |
| | D. | | American Depositary Shares | | 375 |
Item 13. | | | | Defaults, Dividend Arrearages and Delinquencies | | None |
Item 14. | | | | Material Modifications to the Rights of Security Holders and Use of Proceeds | | None |
Item 15. | | | | Controls and Procedures | | 172, 362 |
Item 16A. | | | | Audit Committee Financial Expert | | 86, 107 |
Item 16B. | | | | Code of Ethics | | 362 |
Item 16C. | | | | Principal Accountant Fees and Services | | 110-111, 251, 362-363 |
Item 16D. | | | | Exemptions from the Listing Standards for Audit Committees | | n/a |
Item 16E. | | | | Purchases of Equity Securities by the Issuer and Affiliated Purchasers | | 374 |
Item 16F. | | | | Change in Registrant’s Certifying Accountant | | n/a |
Item 16G. | | | | Corporate Governance | | 361-362 |
Item 17. | | | | Financial Statements | | n/a |
Item 18. | | | | Financial Statements | | 172-281 |
Item 19. | | | | Exhibits | | 391 |
| | | | | | | | | | | | | | |
390 | | bp Annual Report and Form 20-F 2021 | | |
Information about this report
This document constitutes the Annual Report and Accounts in accordance with UK requirements and the Annual Report on Form 20-F in accordance with the US Securities Exchange Act of 1934, for BP p.l.c. for the year ended 31 December 2021. A cross reference to Form 20-F requirements is included on page 390.
This document contains the Strategic report on the inside front cover and pages 1-80 and the Directors’ report on pages 81-115, 116 (in part only), 254-281 and 337-388. The Strategic report and the Directors’ report together include the management report required by DTR 4.1 of the UK Financial Conduct Authority’s Disclosure Guidance and Transparency Rules. The Directors’ remuneration report is on pages 116-141. The consolidated financial statements of the group are on pages 145-253 and the corresponding reports of the auditor are on pages 166-172.
bp Annual Report and Form 20-F 2021 may be downloaded from bp.com/annualreport. No material on the bp website, other than the items identified as bp Annual Report and Form 20-F 2021, forms any part of this document. References in this document to other documents on the bp website, such as bp Energy Outlook, bp Net zero ambition report, bp Sustainability Report and bp Statistical Review of World Energy are included as an aid to their location and are not incorporated by reference into this document.
BP p.l.c. is the parent company of the bp group of companies. The company was incorporated in 1909 in England and Wales and changed its name to BP p.l.c. in 2001. Where we refer to the company, we mean BP p.l.c. The company and each of its subsidiaries« are separate legal entities. Unless otherwise stated or the context otherwise requires, the term “BP” or "bp" and terms such as “we”, “us” and “our” are used in this report for convenience to refer to one or more of the members of the bp group instead of identifying a particular entity or entities. Information in this document reflects 100% of the assets and operations of the company and its subsidiaries that were consolidated at the date or for the periods indicated, including non-controlling interests.
The company’s primary share listing is the London Stock Exchange. In the US, the company’s securities are traded on the New York Stock Exchange (NYSE) in the form of ADSs (see page 368 for more details) and in Germany in the form of a global depositary certificate representing bp ordinary shares traded on the Frankfurt, Hamburg and Dusseldorf Stock Exchanges.
The term ‘shareholder’ in this report means, unless the context otherwise requires, investors in the equity capital of BP p.l.c., both direct and indirect. As the company's shares, in the form of ADSs, are listed on the NYSE, an Annual Report on Form 20-F is filed with the SEC. Ordinary shares are ordinary fully paid shares in BP p.l.c. of 25 cents each. Preference shares are cumulative first preference shares and cumulative second preference shares in BP p.l.c. of £1 each.
| | | | | |
Registered office and our worldwide headquarters: BP p.l.c. 1 St James’s Square London SW1Y 4PD UK Tel +44 (0)20 7496 4000 | Our agent in the US:
BP America Inc. 501 Westlake Park Boulevard Houston, Texas 77079 US Tel +1 281 366 2000 |
Registered in England and Wales No. 102498.
London Stock Exchange symbol ‘BP.’ |
Exhibits
The following documents are filed in the Securities and Exchange Commission (SEC) EDGAR system, as part of this Annual Report on Form 20-F, and can be viewed on the SEC’s website.
| | | | | | | | |
| | Memorandum and Articles of Association of BP p.l.c.***† |
| | Description of rights of each class of securities registered under Section 12 of the Securities Exchange Act of 1934† |
| | The BP Executive Directors’ Incentive Plan**† |
| | Director’s Service Agreement for B Looney****† |
| | Director’s Service Contract for M Auchincloss*****† |
| | The BP Share Award Plan 2015***† |
| | Subsidiaries (included as Note 36 to the Financial Statements) |
| | Code of Ethics*† |
| | Rule 13a – 14(a) Certifications† |
| | Rule 13a – 14(b) Certifications#† |
| | Consent of DeGolyer and MacNaughton† |
| | Report of DeGolyer and MacNaughton† |
| | Consent of Netherland, Sewell & Associates† |
| | Report of Netherland, Sewell & Associates† |
| | Consent Decree***† |
| | Gulf states Settlement Agreement***† |
| | |
| | Consent of Deloitte LLP† |
| | Guaranteed Securities† |
| Exhibit 101 | | Inline XBRL data files |
| Exhibit 104 | | Cover page interactive data file (formatted as Inline XBRL and contained in Exhibit 101) |
| | | | | | | | |
* | | Incorporated by reference to the company’s Annual Report on Form 20-F for the year ended 31 December 2009. |
| | |
| | |
| | |
** | | Incorporated by reference to the company’s Annual Report on Form 20-F for the year ended 31 December 2014. |
*** | | Incorporated by reference to the company’s Annual Report on Form 20-F for the year ended 31 December 2015. |
**** | | Incorporated by reference to the company’s Annual Report on Form 20-F for the year ended 31 December 2019. |
***** | | Incorporated by reference to the company’s Annual Report on Form 20-F for the year ended 31 December 2020. |
# | | Furnished only. |
† | | Included only in the annual report filed in the Securities and Exchange Commission EDGAR system. |
| | |
The total amount of long-term securities of BP p.l.c. and its subsidiaries under any one instrument does not exceed 10% of their total assets on a consolidated basis.
The company agrees to furnish copies of any or all such instruments to the SEC on request.
Paper: Nautilus Super White is a premium ecological paper. It is made from 100% post-consumer waste recycled paper and is FSC® (Forest Stewardship Council®) certified. The paper also holds the EU Ecolabel certification. The manufacturing mill also holds ISO 14001 environmental certification. Printed in the UK by Pureprint Group.
| | | | | | | | | | | | | | |
« See Glossary | | bp Annual Report and Form 20-F 2021 | | 391 |

© BP p.l.c. 2022 bp’s corporate reporting suite includes information about our financial and operating performance, sustainability performance and also on global energy trends and projections. Find out more online bp.com bp Annual Report and Form 20-F 2021 Details of our financial and operating performance in print and online. bp.com bp Sustainability Report 2021 Details of our sustainability performance with additional information online. bp.com/sustainability bp Net zero from ambition to action focuses on bp’s net zero ambition: why we believe it’s consistent with the Paris goals, our planned actions to deliver this decade and our progress to date. bp.com/netzeroreport bp Energy Outlook 2022 Provides our projections of future energy trends and factors that could affect them out to 2040. bp.com/energyoutlook bp Statistical Review of World Energy 2021 An objective review of key global energy trends. bp.com/statisticalreview Group databook 2019-2021 Three-year financial and operating data in PDF and Excel format. bp.com/financial-disclosure Copies You can order bp’s printed publications free of charge from bp.com/printedcopies US and Canada Issuer Direct Toll-free: +1 888 301 2505 bpreports@issuerdirect.com UK and rest of world bp Distribution Services Tel: +44 (0) 800 037 2172 bpdistributionservices@bp.com Feedback Your feedback is important to us. You can contact the corporate reporting team at corporatereporting@bp.com