Exhibit 99.1
|
|
NEWS |

Hardinge Inc. One Hardinge Drive, Elmira, N.Y. 14902
|
For more information contact: |
|
|
|
|
|
Company: |
Investor Relations: |
|
Edward J. Gaio |
Deborah K. Pawlowski, Kei Advisors LLC |
|
Chief Financial Officer |
Phone: (716) 843-3908 |
|
Phone: (607) 378-4207 |
Email: dpawlowski@keiadvisors.com |
Hardinge Inc. Reports Earnings of $4.0 million
for the Third Quarter of 2012
ELMIRA, N.Y., November 8, 2012 — Hardinge Inc. (NASDAQ: HDNG), a leading international provider of advanced metal-cutting solutions, reported financial results for its third quarter 2012.
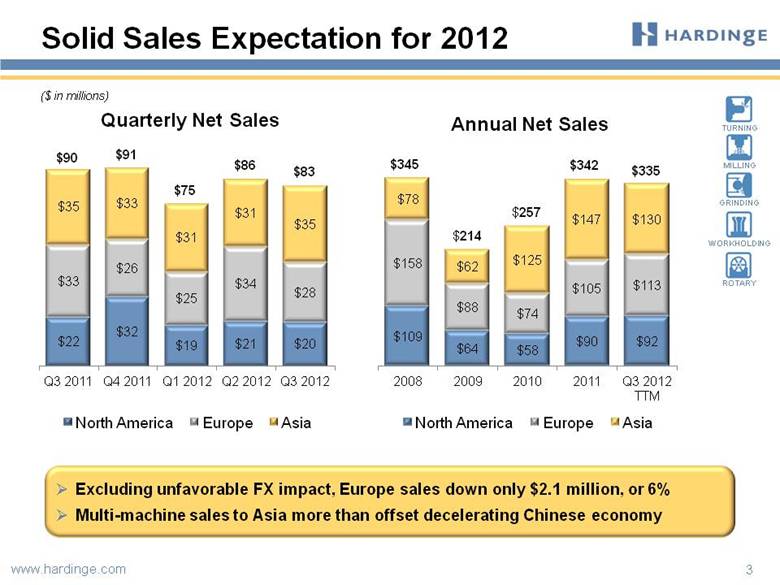
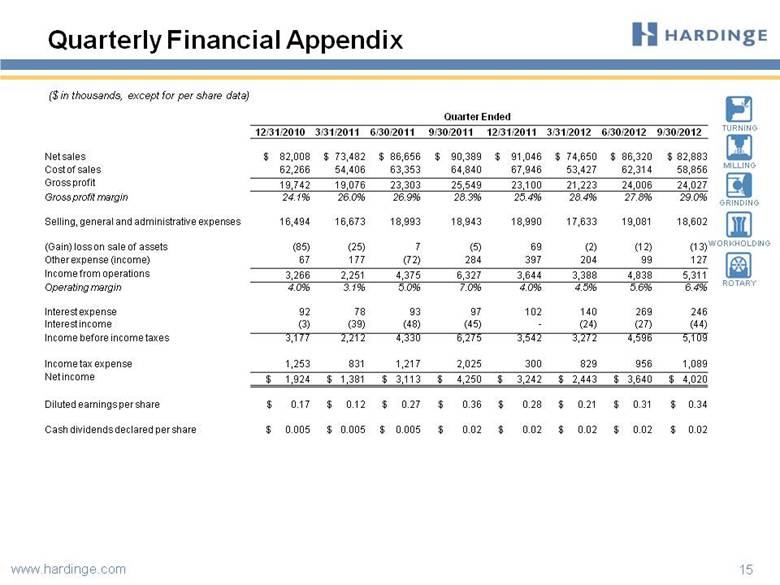
Net sales (“sales”) were $82.9 million in the third quarter of 2012, down $7.5 million, or 8%, from sales of $90.4 million in the prior-year’s third quarter. Compared with the prior-year quarter, foreign currency translation negatively impacted third quarter 2012 sales by approximately $3.6 million. Excluding the impact of foreign currency translation, sales decreased $3.9 million, or 4%. When compared with the trailing second quarter of 2012, sales were down $3.4 million, or 4%, during the third quarter 2012.
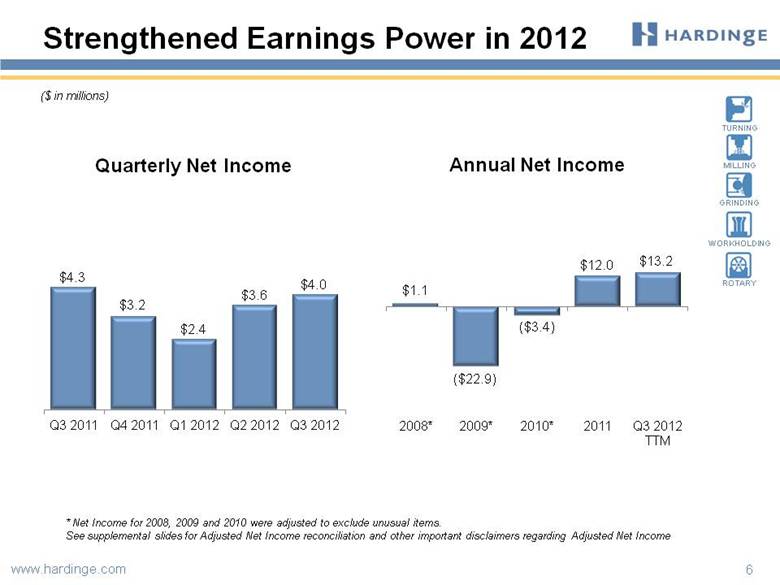
Net income for the third quarter decreased to $4.0 million, down $0.2 million when compared with the prior year’s third quarter. Compared with the trailing second quarter of 2012, net income grew $0.4 million, or 10%. On a per diluted share basis, earnings were $0.34 in the third quarter of 2012 compared with $0.36 in the same period in the prior year and $0.31 in the trailing second quarter of 2012.
Richard L. Simons, Chairman, President and Chief Executive Officer, commented, “We are pleased that our results for the quarter came in as we had expected with $4.0 million of net income and generation of over $5 million of cash from operations.”
Sales by Region
|
|
|
Quarter Ended |
| |||||||||||||
|
Sales to |
|
September 30, |
|
September 30, |
|
June 30, |
| |||||||||
|
Customers in |
|
2012 |
|
% of Total |
|
2011 |
|
% Change |
|
2012 |
|
% Change |
| |||
|
North America |
|
$ |
20,161 |
|
24 |
% |
$ |
22,480 |
|
(10 |
)% |
$ |
20,735 |
|
(3 |
)% |
|
Europe |
|
27,445 |
|
33 |
% |
33,293 |
|
(18 |
)% |
34,028 |
|
(19 |
)% | |||
|
Asia |
|
35,277 |
|
43 |
% |
34,616 |
|
2 |
% |
31,557 |
|
12 |
% | |||
|
Total |
|
$ |
82,883 |
|
100 |
% |
$ |
90,389 |
|
(8 |
)% |
$ |
86,320 |
|
(4 |
)% |
The economic uncertainty and apparent recession in Europe impacted sales in that region, yet when excluding the negative foreign currency translation impact of $3.7 million, sales in Europe were down
-MORE-
$2.2 million, or 7%. In Asia, approximately $9 million of incremental multi-machine sales offset the effects of the decelerating economy in China.
Fluctuations in Hardinge’s sales in total and among geographic locations and industries can vary from quarter-to-quarter based on the timing and magnitude of orders and projects. Hardinge does not believe that such quarter-to-quarter fluctuations are necessarily indicative of larger business trends. Rather, the Company believes that such business trends can be discerned from the Company’s performance during a longer period of time, such as a trailing twelve-month period.
Operating Performance
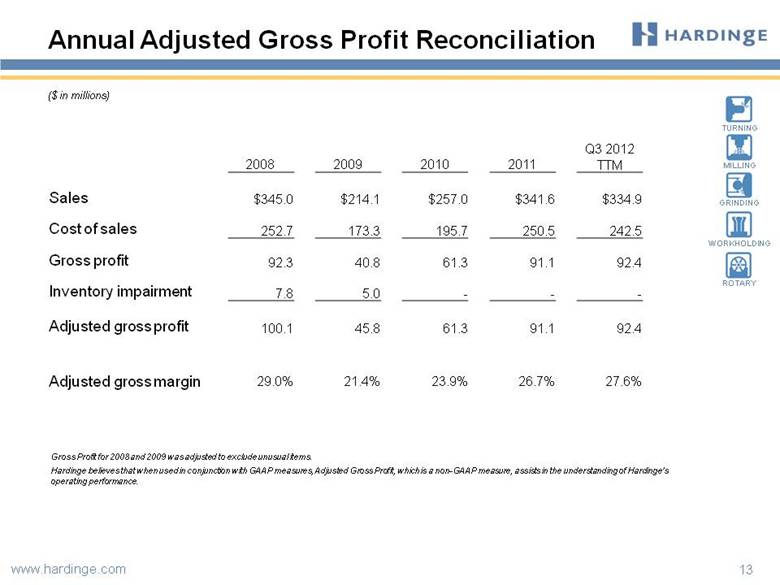
Gross profit was $24.0 million, or 29.0% of sales, in the 2012 third quarter compared with $25.5 million, or 28.3% of sales, in the same period of the prior year, and gross profit of $24.0 million, or 27.8% of sales, in the trailing second quarter of 2012. Changes in gross profit when compared with the prior-year period were primarily the result of the lower sales volume this year.
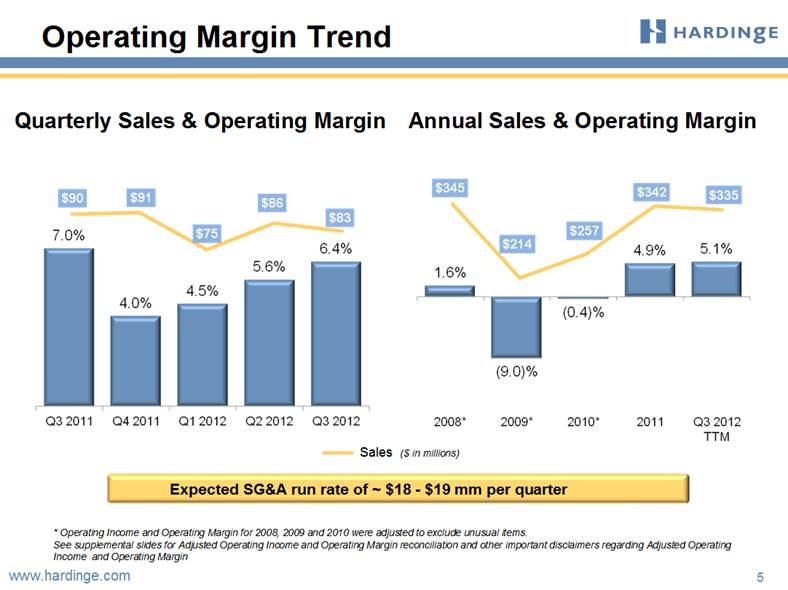
Selling, general and administrative (“SG&A”) expenses in the 2012 third quarter were down by $0.3 million to $18.6 million, or 22.4% of sales, in the 2012 third quarter compared with $18.9 million, or 21.0% of sales, in the prior year’s third quarter. Compared with the trailing second quarter of 2012, SG&A as a percent of sales increased by 0.3 points primarily due to costs associated with participating in the 2012 International Manufacturing Technology Show.
Income from operations in the third quarter of 2012 was $5.3 million, down 16% from $6.3 million during the prior year’s third quarter. As a percentage of sales, income from operations was 6.4%, a 0.6 point decrease over the same period of the prior year. Operating margin improved 0.8 points over the trailing second quarter.
Year to Date 2012 review
For the nine-month period ended September 30, 2012, net sales were $243.9 million, down by $6.7 million or 3% from the corresponding period in 2011. Foreign currency translation negatively impacted sales in the first nine months of 2012 by approximately $4.8 million when compared with the prior-year period. Gross profit for the first nine months of 2012 improved $1.3 million to $69.3 million when compared to the same period in the prior year. As a percentage of sales, gross profit margin expanded 1.30 points which was primarily due to more favorable pricing and product mix compared with the prior-year period. Selling, general and administrative expense for the first nine months was up $0.7 million, or 1%, to $55.3 million.
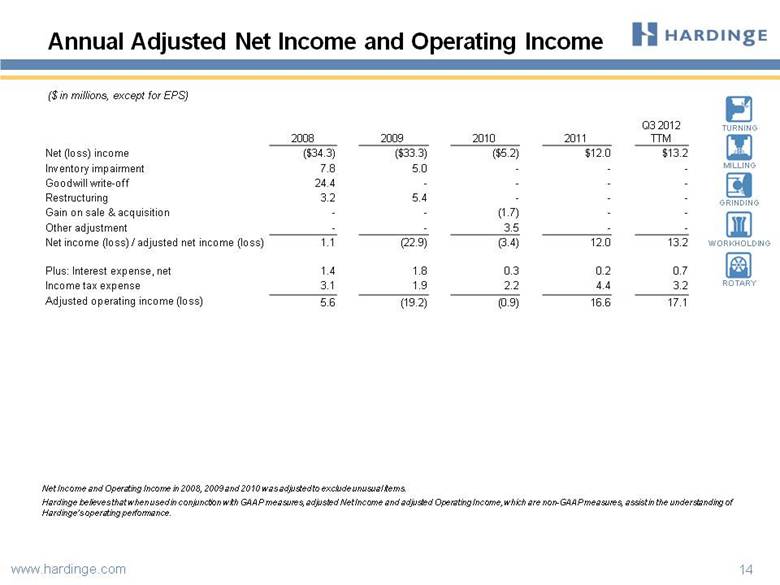
Income from operations was $13.5 million in the first nine months of 2012, up 5% over the prior-year period. Operating margin expanded 0.4 points to 5.6% for the first nine months of 2012. Net income was up 16% to $10.1 million for the first nine months of 2012 compared with $8.7 million for the first nine months of 2011. Earnings per diluted share grew 15% to $0.86 in the first nine months of 2012 from $0.75 for the same period last year.
Strong Balance Sheet
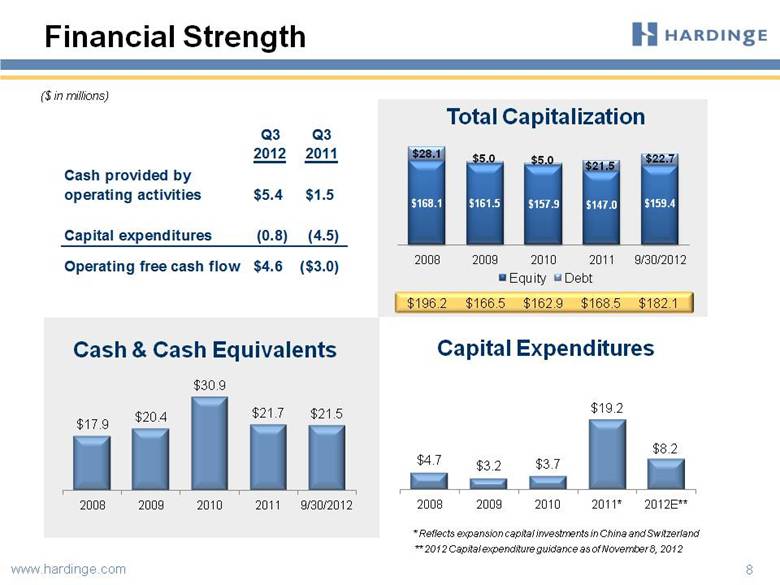
Cash and cash equivalents at September 30, 2012 were $21.5 million compared with $21.7 million at December 31, 2011. Capital expenditures in the third quarter of 2012 were $0.8 million and were $6.2 million in the first nine months of 2012. Capital expenditures for the 2012 fourth quarter are expected to be approximately $2.0 million which includes general maintenance expenditures and finalizing the purchase and installation of machinery in the Company’s newly completed facilities in Switzerland and China. Cash provided by operations in the third quarter was $5.4 million.
Net Orders by Region
|
|
|
Quarter Ended |
| |||||||||||||
|
Orders from |
|
September 30, |
|
September 30, |
|
June 30, |
| |||||||||
|
Customers in |
|
2012 |
|
% of Total |
|
2011 |
|
% Change |
|
2012 |
|
% Change |
| |||
|
North America |
|
$ |
20,913 |
|
30 |
% |
$ |
20,167 |
|
4 |
% |
$ |
19,960 |
|
5 |
% |
|
Europe |
|
23,756 |
|
35 |
% |
29,735 |
|
(20 |
)% |
32,489 |
|
(27 |
)% | |||
|
Asia |
|
23,690 |
|
35 |
% |
31,572 |
|
(25 |
)% |
27,893 |
|
(15 |
)% | |||
|
Total |
|
$ |
68,359 |
|
100 |
% |
$ |
81,474 |
|
(16 |
)% |
$ |
80,342 |
|
(15 |
)% |
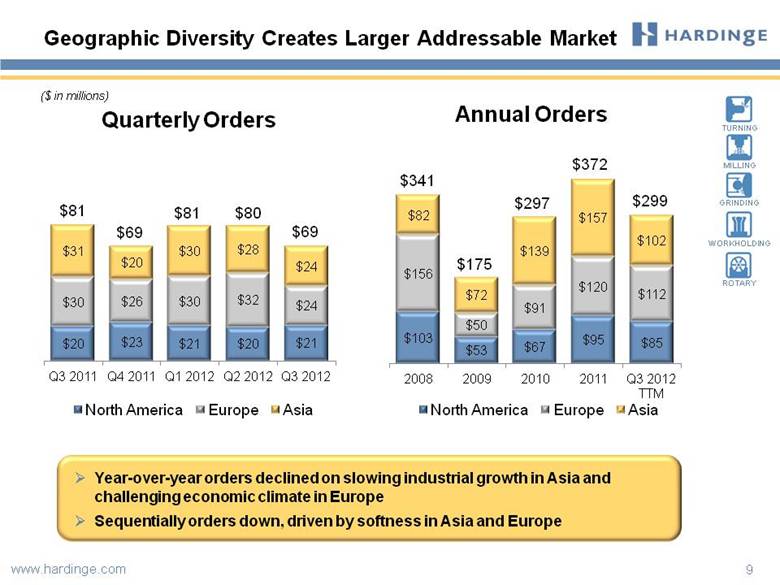
Net orders (“orders”) during the quarter were $68.4 million, a decrease of $13.1 million, or 16%, when compared with the third quarter of 2011, which includes $2.8 million related to unfavorable foreign currency translation. Excluding the foreign currency impact, orders decreased $10.3 million, or 13%. Declines were in Asia where industrial activity growth is decelerating and Europe, where the economic conditions continue to negatively impact demand. Sequentially, orders were down 15% from the trailing second quarter of 2012, which was attributable to reductions in orders received from Europe and Asia. The Company’s order backlog at the end of the quarter was $127 million.
Outlook
Mr. Simons noted, “We continue to focus on providing the marketplace with machine tool products to meet the increasingly complex needs of our customers. Uncertainty surrounding the global economic environment has created a low level of clarity for the near-term future of machine tool demand. We expect that 2012 will finish with fourth quarter sales similar to what we reported today. Looking forward to 2013, we are expecting lower sales levels for the first half of the year as a result of our recent order run rate. We will continue to focus on operating and cash management efficiencies throughout this period of uncertainty.”
“We plan to continue to invest in new product development, cost reduction initiatives, and productivity improvements and expect to be in a solid position to react quickly when the market recovery occurs,” added Mr. Simons.
Webcast and Conference Call
Hardinge will host a conference call and webcast today at 11:00 a.m. Eastern Time. During the conference call and webcast, Richard L. Simons, Chairman, President and CEO, and Edward J. Gaio, Vice President and CFO, will review the financial and operating results for the quarter, as well as the Company’s strategy and outlook. A question and answer session will follow the formal discussion. Their review will be accompanied by a slide presentation which will be available on Hardinge’s website at www.hardinge.com.
The conference call can be accessed by dialing (201) 689-8560. The listen-only audio webcast can be monitored at www.hardinge.com.
A telephonic replay will be available from 2:00 p.m. ET the day of the call through Thursday, November 15, 2012. To listen to the archived call, dial (858) 384-5517 and enter conference ID number 401276. Alternatively, the archive can be heard on the Company’s website at www.hardinge.com. A transcript will also be posted to the website, once available.
About Hardinge
Hardinge is a leading global designer and manufacturer of high precision, computer-controlled machine tool solutions developed for critical, hard to machine metal parts. The Company’s strategy is to leverage its global brand strength to further penetrate global market opportunities where customers
will benefit from the technologically advanced, high quality, reliable equipment Hardinge produces. With approximately 75% of its sales outside the U.S., Hardinge serves the worldwide metal working market. Hardinge’s machine tool solutions can also be found in a broad base of industries to include aerospace, agricultural, automotive, construction, consumer products, defense, energy, medical, technology and transportation.
Hardinge applies its engineering design and manufacturing expertise in high performance machining centers, high-end cylindrical and jig grinding machines, SUPER-PRECISION® and precision CNC lathes and technologically advanced workholding accessories. Hardinge has manufacturing operations in China, Switzerland, Taiwan, the United Kingdom and the United States.
The Company regularly posts information on its website: http://www.hardinge.com
Safe Harbor Statement
This news release contains forward-looking statements (within the meaning of Section 27A of the Securities Act of 1933, as amended, and Section 21E of the Securities Exchange Act of 1934, as amended). Such statements are based on management’s current expectations that involve risks and uncertainties. Any statements that are not statements of historical fact or that are about future events may be deemed to be forward-looking statements. For example, words such as “may,” “will,” “should,” “estimates,” “predicts,” “potential,” “continue,” “strategy,” “believes,” “anticipates,” “plans,” “expects,” “intends,” and similar expressions are intended to identify forward-looking statements. The Company’s actual results or outcomes and the timing of certain events may differ significantly from those discussed in any forward-looking statements. The Company undertakes no obligation to publicly update any forward-looking statement, whether as a result of new information, future events, or otherwise.
FINANCIAL TABLES FOLLOW.
HARDINGE INC. AND SUBSIDIARIES
Consolidated statements of operations
(in thousands except per share data)
|
|
|
Quarter Ended |
|
Year to Date Ended |
| ||||||||
|
|
|
September 30, |
|
September 30, |
| ||||||||
|
|
|
2012 |
|
2011 |
|
2012 |
|
2011 |
| ||||
|
|
|
(unaudited) |
|
(unaudited) |
| ||||||||
|
Net sales |
|
$ |
82,883 |
|
$ |
90,389 |
|
$ |
243,853 |
|
$ |
250,527 |
|
|
Cost of sales |
|
58,856 |
|
64,840 |
|
174,597 |
|
182,599 |
| ||||
|
Gross profit |
|
24,027 |
|
25,549 |
|
69,256 |
|
67,928 |
| ||||
|
Gross profit margin |
|
29.0 |
% |
28.3 |
% |
28.4 |
% |
27.1 |
% | ||||
|
|
|
|
|
|
|
|
|
|
| ||||
|
Selling, general and administrative expenses |
|
18,602 |
|
18,943 |
|
55,316 |
|
54,609 |
| ||||
|
Gain on sale of assets |
|
(13 |
) |
(5 |
) |
(27 |
) |
(23 |
) | ||||
|
Other expense |
|
127 |
|
284 |
|
430 |
|
389 |
| ||||
|
Income from operations |
|
5,311 |
|
6,327 |
|
13,537 |
|
12,953 |
| ||||
|
Operating margin |
|
6.4 |
% |
7.0 |
% |
5.6 |
% |
5.2 |
% | ||||
|
|
|
|
|
|
|
|
|
|
| ||||
|
Interest expense |
|
246 |
|
97 |
|
655 |
|
268 |
| ||||
|
Interest income |
|
(44 |
) |
(45 |
) |
(95 |
) |
(132 |
) | ||||
|
Income before income taxes |
|
5,109 |
|
6,275 |
|
12,977 |
|
12,817 |
| ||||
|
|
|
|
|
|
|
|
|
|
| ||||
|
Income tax expense |
|
1,089 |
|
2,025 |
|
2,874 |
|
4,073 |
| ||||
|
Net income |
|
$ |
4,020 |
|
$ |
4,250 |
|
$ |
10,103 |
|
$ |
8,744 |
|
|
|
|
|
|
|
|
|
|
|
| ||||
|
Basic earnings per share |
|
$ |
0.35 |
|
$ |
0.37 |
|
$ |
0.87 |
|
$ |
0.75 |
|
|
|
|
|
|
|
|
|
|
|
| ||||
|
Diluted earnings per share |
|
$ |
0.34 |
|
$ |
0.36 |
|
$ |
0.86 |
|
$ |
0.75 |
|
|
|
|
|
|
|
|
|
|
|
| ||||
|
Cash dividends declared per share |
|
$ |
0.02 |
|
$ |
0.02 |
|
$ |
0.06 |
|
$ |
0.03 |
|
|
|
|
|
|
|
|
|
|
|
| ||||
|
Weighted avg. shares outstanding: Basic |
|
11,567 |
|
11,467 |
|
11,551 |
|
11,461 |
| ||||
|
Weighted avg. shares outstanding: Diluted |
|
11,656 |
|
11,533 |
|
11,638 |
|
11,527 |
| ||||
HARDINGE INC. AND SUBSIDIARIES
Consolidated Balance Sheets
(in thousands except share and per share data)
|
|
|
September 30, |
|
December 31, |
| ||
|
|
|
2012 |
|
2011 |
| ||
|
|
|
(unaudited) |
|
|
| ||
|
Assets |
|
|
|
|
| ||
|
Cash and cash equivalents |
|
$ |
21,507 |
|
$ |
21,736 |
|
|
Restricted cash |
|
5,088 |
|
4,575 |
| ||
|
Accounts receivable, net |
|
50,391 |
|
65,909 |
| ||
|
Inventories, net |
|
134,501 |
|
122,782 |
| ||
|
Other current assets |
|
15,198 |
|
13,338 |
| ||
|
Total current assets |
|
226,685 |
|
228,340 |
| ||
|
|
|
|
|
|
| ||
|
Property, plant and equipment, net |
|
70,168 |
|
68,204 |
| ||
|
Intangible assets, net |
|
12,503 |
|
12,765 |
| ||
|
Other non-current assets |
|
1,665 |
|
2,360 |
| ||
|
Total non-current assets |
|
84,336 |
|
83,329 |
| ||
|
Total assets |
|
$ |
311,021 |
|
$ |
311,669 |
|
|
|
|
|
|
|
| ||
|
Liabilities and shareholders’ equity |
|
|
|
|
| ||
|
Accounts payable |
|
$ |
32,203 |
|
$ |
36,952 |
|
|
Notes payable to bank |
|
14,150 |
|
12,969 |
| ||
|
Accrued expenses |
|
28,278 |
|
25,103 |
| ||
|
Customer deposits |
|
14,767 |
|
18,881 |
| ||
|
Accrued income taxes |
|
2,517 |
|
3,480 |
| ||
|
Deferred income taxes |
|
2,677 |
|
2,556 |
| ||
|
Current portion of long-term debt |
|
2,842 |
|
1,548 |
| ||
|
Total current liabilities |
|
97,434 |
|
101,489 |
| ||
|
|
|
|
|
|
| ||
|
Long-term debt |
|
5,674 |
|
7,020 |
| ||
|
Pension and postretirement liabilities |
|
41,381 |
|
49,310 |
| ||
|
Deferred income taxes |
|
3,071 |
|
2,391 |
| ||
|
Other liabilities |
|
4,102 |
|
4,436 |
| ||
|
Total non-current liabilities |
|
54,228 |
|
63,157 |
| ||
|
|
|
|
|
|
| ||
|
Common stock ($0.01 par value, 12,472,992 issued) |
|
125 |
|
125 |
| ||
|
Additional paid-in capital |
|
114,340 |
|
114,369 |
| ||
|
Retained earnings |
|
74,442 |
|
65,041 |
| ||
|
Treasury shares (782,717 shares at September 30, 2012 and 813,980 shares at December 31, 2011) |
|
(9,934 |
) |
(10,379 |
) | ||
|
Accumulated other comprehensive loss |
|
(19,614 |
) |
(22,133 |
) | ||
|
Total shareholders’ equity |
|
159,359 |
|
147,023 |
| ||
|
Total liabilities and shareholders’ equity |
|
$ |
311,021 |
|
$ |
311,669 |
|
HARDINGE INC. AND SUBSIDIARIES
CONSOLIDATED STATEMENTS OF CASH FLOWS
(in thousands)
|
|
|
Quarter Ended |
|
YTD Ended |
| ||||||||
|
|
|
2012 |
|
2011 |
|
2012 |
|
2011 |
| ||||
|
Operating activities |
|
|
|
|
|
|
|
|
| ||||
|
Net income |
|
$ |
4,020 |
|
$ |
4,250 |
|
$ |
10,103 |
|
$ |
8,744 |
|
|
Adjustments to reconcile net income to net cash used in operating activities: |
|
|
|
|
|
|
|
|
| ||||
|
Depreciation and amortization |
|
1,795 |
|
1,989 |
|
5,453 |
|
5,885 |
| ||||
|
Debt issuance amortization |
|
10 |
|
26 |
|
42 |
|
78 |
| ||||
|
Provision for deferred income taxes |
|
(149 |
) |
861 |
|
852 |
|
(411 |
) | ||||
|
Gain on sale of assets |
|
(13 |
) |
(5 |
) |
(27 |
) |
(23 |
) | ||||
|
Unrealized intercompany foreign currency transaction loss (gain) |
|
223 |
|
(1,147 |
) |
513 |
|
(748 |
) | ||||
|
Changes in operating assets and liabilities: |
|
|
|
|
|
|
|
|
| ||||
|
Accounts receivable |
|
4,541 |
|
2,315 |
|
16,226 |
|
(11,362 |
) | ||||
|
Inventories |
|
371 |
|
(8,248 |
) |
(10,215 |
) |
(20,485 |
) | ||||
|
Other assets |
|
(417 |
) |
(129 |
) |
(957 |
) |
(2,700 |
) | ||||
|
Accounts payable |
|
(2,513 |
) |
1,694 |
|
(5,419 |
) |
6,051 |
| ||||
|
Customer deposits |
|
(1,808 |
) |
(1,799 |
) |
(4,207 |
) |
4,209 |
| ||||
|
Accrued expenses |
|
(560 |
) |
1,873 |
|
(6,292 |
) |
2,190 |
| ||||
|
Accrued postretirement benefits |
|
(129 |
) |
(136 |
) |
(387 |
) |
(423 |
) | ||||
|
Net cash provided by (used in) operating activities |
|
5,371 |
|
1,544 |
|
5,685 |
|
(8,995 |
) | ||||
|
|
|
|
|
|
|
|
|
|
| ||||
|
Investing activities |
|
|
|
|
|
|
|
|
| ||||
|
Capital expenditures |
|
(803 |
) |
(4,518 |
) |
(6,167 |
) |
(13,520 |
) | ||||
|
Proceeds on sale of assets |
|
18 |
|
44 |
|
40 |
|
908 |
| ||||
|
Net cash used in investing activities |
|
(785 |
) |
(4,474 |
) |
(6,127 |
) |
(12,612 |
) | ||||
|
|
|
|
|
|
|
|
|
|
| ||||
|
Financing activities |
|
|
|
|
|
|
|
|
| ||||
|
Proceeds from short-term notes payable to bank |
|
969 |
|
4,951 |
|
827 |
|
10,943 |
| ||||
|
(Repayments of) proceeds from long-term debt |
|
(150 |
) |
1,461 |
|
(140 |
) |
1,152 |
| ||||
|
Dividends paid |
|
(233 |
) |
(233 |
) |
(698 |
) |
(349 |
) | ||||
|
Other financing activities |
|
(1 |
) |
(5 |
) |
8 |
|
42 |
| ||||
|
Net cash provided by (used in) financing activities |
|
585 |
|
6,174 |
|
(3 |
) |
11,788 |
| ||||
|
|
|
|
|
|
|
|
|
|
| ||||
|
Effect of exchange rate changes on cash |
|
187 |
|
(684 |
) |
216 |
|
135 |
| ||||
|
Net increase (decrease) in cash |
|
5,358 |
|
2,560 |
|
(229 |
) |
(9,684 |
) | ||||
|
Cash and cash equivalents at beginning of period |
|
16,149 |
|
18,701 |
|
21,736 |
|
30,945 |
| ||||
|
Cash and cash equivalents at end of period |
|
$ |
21,507 |
|
$ |
21,261 |
|
$ |
21,507 |
|
$ |
21,261 |
|
###