| |
SUMMARY | |
PRJPX | |
March 1, 2016 | |
T. Rowe Price Japan Fund | |
A fund seeking long-term growth of capital through investments in common stocks of companies located (or with primary operations) in Japan. | |
Before you invest, you may want to review the fund’s prospectus,
which contains more information about the fund and its risks. You can find the fund’s prospectus
and other information about the fund online at troweprice.com/prospectus. You can also get this information at no cost by calling
The Securities and Exchange Commission has not approved or disapproved these securities or passed upon the adequacy of this prospectus. Any representation to the contrary is a criminal offense. | |
| |


Summary | 1 |
Investment Objective
The fund seeks long-term growth of capital through investments in common stocks of companies located (or with primary operations) in Japan.
Fees and Expenses
This table describes the fees and expenses that you may pay if you buy and hold shares of the fund.
Fees and Expenses of the Fund
Shareholder fees (fees paid directly from your investment) | |
Maximum sales charge (load) imposed on | NONE |
Maximum deferred sales charge (load) | NONE |
Redemption fee (as a percentage of amount redeemed on shares held for 90 days or less) | 2.00% |
Maximum account fee | $20a |
Annual fund operating expenses | |
Management fees | 0.79% |
Distribution and service (12b-1) fees | 0.00% |
Other expenses | 0.26% |
Total annual fund operating expenses | 1.05% |
a Subject to certain exceptions, accounts with a balance of less than $10,000 are charged an annual $20 fee.
Example This example is intended to help you compare the cost of investing in the fund with the cost of investing in other mutual funds. The example assumes that you invest $10,000 in the fund for the time periods indicated and then redeem all of your shares at the end of those periods. The example also assumes that your investment has a 5% return each year and that the fund’s operating expenses remain the same. Although your actual costs may be higher or lower, based on these assumptions your costs would be:
1 year | 3 years | 5 years | 10 years |
$107 | $334 | $579 | $1,283 |
Portfolio Turnover The fund pays transaction costs, such as commissions, when it buys and sells securities (or “turns over” its portfolio). A higher portfolio turnover rate may indicate higher transaction costs and may result in higher taxes when fund shares are held in a taxable account. These costs, which are not reflected in annual fund operating expenses or in the example, affect the fund’s performance. During the most recent fiscal year, the fund’s portfolio turnover rate was 54.7% of the average value of its portfolio.
T. Rowe Price | 2 |
Investments, Risks, and Performance
Principal Investment Strategies The fund will normally invest at least 80% of its net assets (including any borrowings for investment purposes) in companies located (or with primary operations) in Japan. For purposes of determining whether the fund invests at least 80% of its net assets in Japanese companies, the fund relies on the country assigned to a security by MSCI, Inc. or another unaffiliated data provider. The fund may purchase the stocks of companies of any size and expects to make its investments across a wide range of Japanese industries and companies. While the adviser invests with an awareness of the outlook for industry sectors within the country, the adviser’s decision-making process focuses on bottom-up stock selection.
Security selection reflects a growth style. The fund relies on a global team of investment analysts dedicated to in-depth fundamental research in an effort to identify companies capable of achieving and sustaining above-average, long-term earnings growth. The adviser seeks to purchase stocks of companies at reasonable prices in relation to present or anticipated earnings, cash flow, or book value.
In selecting investments, the fund generally favors companies with one or more of the following characteristics:
· leading or improving market position;
· attractive business niche;
· attractive or improving franchise or industry position;
· seasoned management;
· stable or improving earnings and/or cash flow; and
· sound or improving balance sheet.
The fund may sell securities for a variety of reasons, such as to secure gains, limit losses, or redeploy assets into more promising opportunities.
Principal Risks As with any mutual fund, there is no guarantee that the fund will achieve its objective. The fund’s share price fluctuates, which means you could lose money by investing in the fund. The principal risks of investing in this fund are summarized as follows:
Active management risk The fund is subject to the risk that the investment adviser’s judgments about the attractiveness, value, or potential appreciation of the fund’s investments may prove to be incorrect. If the investments selected and strategies employed by the fund fail to produce the intended results, the fund could underperform in comparison to other funds with similar objectives and investment strategies.
Risks of stock investing Stocks generally fluctuate in value more than bonds and may decline significantly over short time periods. There is a chance that stock prices overall will decline because stock markets tend to move in cycles, with periods of rising and falling prices. The value of a stock in which the fund invests may decline
Summary | 3 |
due to general weakness in the stock market, or because of factors that affect a particular company or industry.
International investing risk Investing in the securities of non-U.S. issuers involves special risks not typically associated with investing in U.S. issuers. International securities tend to be more volatile and less liquid than investments in U.S. securities and may lose value because of adverse local, political, social, or economic developments overseas, or due to changes in the exchange rates between foreign currencies and the U.S. dollar. In addition, international investments are subject to settlement practices and regulatory and financial reporting standards that differ from those of the U.S.
Geographic concentration risk Because the fund concentrates its investments in a particular country, the fund’s performance is closely tied to the social, political, and economic conditions of that country. As a result, the fund is likely to be more volatile than more geographically diverse international funds.
In the past, at times, the Japanese economy has been negatively affected by government intervention and protectionism, an unstable financial services sector, a heavy reliance on international trade, and natural disasters. Some of these factors, as well as other adverse political developments, increases in government debt, and changes to fiscal, monetary, or trade policies, may affect Japanese markets and significantly harm the fund’s performance.
Investment style risk Different investment styles tend to shift in and out of favor depending on market conditions and investor sentiment. The fund’s growth approach to investing could cause it to underperform when compared to other stock funds that employ a different investment style. Growth stocks tend to be more volatile than certain other types of stocks, and their prices may fluctuate more dramatically than the overall stock market. A stock with growth characteristics can have sharp price declines due to decreases in current or expected earnings and may lack dividends that can help cushion its share price in a declining market.
Market capitalization risk Because the fund may invest in companies of any size, its share price could be more volatile than a fund that invests only in large companies. Small- and medium-sized companies often have less experienced management, narrower product lines, more limited financial resources, and less publicly available information than larger companies. Larger companies may not be able to attain the high growth rates of successful smaller companies, especially during strong economic periods, and they may be less capable of responding quickly to competitive challenges and industry changes.
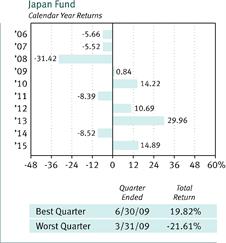
Performance The bar chart showing calendar year returns and the average annual total returns table provide some indications of the risks of investing in the fund by showing how much returns can differ from year to year and how the fund’s average annual returns for certain periods compare with the returns of a relevant broad-based market index, as well as with the returns of other comparative indexes that have
T. Rowe Price | 4 |
investment characteristics similar to those of the fund. The fund’s performance information represents only past performance (before and after taxes) and is not necessarily an indication of future results.
The fund can also experience short-term performance swings, as shown by the best and worst calendar quarter returns during the years depicted.
In addition, the average annual total returns table shows hypothetical after-tax returns to demonstrate how taxes paid by a shareholder may influence returns. After-tax returns are calculated using the historical highest individual federal marginal income tax rates and do not reflect the impact of state and local taxes. Actual after-tax returns depend on an investor’s tax situation and may differ from those shown. After-tax returns shown are not relevant to investors who hold their fund shares through tax-deferred arrangements, such as a 401(k) account or individual retirement account. In some cases, the figure shown for “returns after taxes on distributions and sale of fund shares” may be higher than the figure shown for “returns before taxes” because the calculations assume the investor received a tax deduction for any loss incurred on the sale of shares.
Summary | 5 |
Average Annual Total Returns | ||||||||||||
|
|
| Periods ended |
| ||||||||
| December 31, 2015 |
| ||||||||||
| 1 Year | 5 Years | 10 Years |
| ||||||||
| Japan Fund |
| ||||||||||
| Returns before taxes | 14.89 | % | 6.73 | % | -0.25 | % |
| ||||
| Returns after taxes on distributions | 14.74 |
|
| 6.54 |
|
| -0.35 |
|
|
| |
| Returns after taxes on distributions |
|
|
|
|
|
|
|
|
|
| |
| and sale of fund shares | 8.80 |
|
| 5.39 |
|
| -0.10 |
|
|
| |
| TOPIX Index (reflects no deduction for fees, expenses, or taxes) | 11.69 |
|
| 5.23 |
|
| 1.05 |
|
|
| |
| MSCI Japan Index (reflects no deduction for fees, expenses, or taxes) | 9.90 |
|
| 4.61 |
|
| 1.08 |
|
|
| |
| Lipper Japanese Funds Average | 12.03 |
|
| 5.95 |
|
| 0.63 |
|
|
| |
Updated performance information is available through troweprice.com or may be obtained by calling 1-800-225-5132.
Management
Investment Adviser T. Rowe Price Associates, Inc. (T. Rowe Price)
Investment Sub-adviser T. Rowe Price International Ltd (T. Rowe Price International)
Portfolio Manager | Title | Managed Fund Since | Joined Investment |
Archibald Ciganer | Chairman of Investment Advisory Committee | 2013 | 2007 |
Purchase and Sale of Fund Shares
The fund requires a $1,000 minimum initial investment and a $100 minimum subsequent investment for individual retirement accounts, small business retirement plan accounts, and Uniform Gifts to Minors Act or Uniform Transfers to Minors Act accounts. For all other accounts, the fund generally requires a $2,500 minimum initial investment and a $100 minimum subsequent investment. The investment minimums may be modified for financial intermediaries that submit orders on behalf of their customers.
You may purchase, redeem, or exchange fund shares by accessing your account online at troweprice.com, by calling 1-800-225-5132, or by written request. If you hold shares through a financial intermediary, you must purchase, redeem, and exchange shares through your intermediary.
T. Rowe Price | 6 |
Tax Information
Any dividends or capital gains are declared and paid annually, usually in December. Redemptions or exchanges of fund shares and distributions by the fund, whether or not you reinvest these amounts in additional fund shares, may be taxed as ordinary income or capital gains unless you invest through a tax-deferred account (although you may be taxed upon withdrawal from such account).
Payments to Broker-Dealers and Other Financial Intermediaries
If you purchase shares of the fund through a broker-dealer or other financial intermediary (such as a bank), the fund and its related companies may pay the intermediary for the sale of fund shares and related services. These payments may create a conflict of interest by influencing the broker-dealer or other intermediary and your salesperson to recommend the fund over another investment. Ask your salesperson or visit your financial intermediary’s website for more information.
T. Rowe Price
Associates, Inc. | F62-045 3/1/16 |