Item 1: Report to Shareholders
 |
| Emerging Markets Bond Fund | June 30, 2005 |
The views and opinions in this report were current as of June 30, 2005. They are not guarantees of performance or investment results and should not be taken as investment advice. Investment decisions reflect a variety of factors, and the managers reserve the right to change their views about individual stocks, sectors, and the markets at any time. As a result, the views expressed should not be relied upon as a forecast of the fund’s future investment intent. The report is certified under the Sarbanes-Oxley Act of 2002, which requires mutual funds and other public companies to affirm that, to the best of their knowledge, the information in their financial reports is fairly and accurately stated in all material respects.
REPORTS ON THE WEB
Sign up for our E-mail Program, and you can begin to receive updated fund reports and prospectuses online rather than through the mail. Log in to your account at troweprice.com for more information.
Fellow Shareholders
A stronger U.S. dollar took its toll on developed countries’ bond markets in the first half of 2005. Emerging markets bonds, however, posted strong results, extending their solid performance from the second half of 2004. With the Federal Reserve continuing its policy of “measured” increases, short-term yields in the U.S. climbed, but long-term yields were actually lower in June than they were a year earlier when the Fed began the current round of tightening. Meanwhile, bond yields in Europe fell as evidence of slowing growth began to accumulate and the euro’s value eroded. Concerns that Japan’s economic recovery stalled in the first quarter of 2005 caused Japanese bond yields to decline. Political stability, strong economic growth, and low inflation generally boosted emerging market bond returns.
| PERFORMANCE COMPARISON | ||
| Periods Ended 6/30/05 | 6 Months | 12 Months |
| International Bond Fund | -5.69% | 7.06% |
| International Bond Fund– | ||
| Advisor Class | -5.76 | 6.89 |
| Lehman Brothers Global | ||
| Aggregate ex-U.S. Dollar | ||
| Bond Index | -5.61 | 8.09 |
| JP Morgan Global Government | ||
| Bond Broad Index, | ||
| Non-U.S. Dollar | -5.49 | 8.39 |
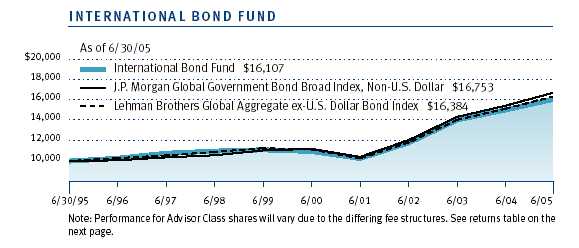
For the period ended June 30, 2005, the International Bond Fund posted a six-month return of -5.69% and a 12-month gain of 7.06%. For the half year, the fund performed in line with the J.P. Morgan Global Government Bond Broad Index, Non-U.S. Dollar and the Lehman Brothers Global Aggregate ex-U.S. Dollar Bond Index. For the 12-month period, the fund lagged both benchmarks. (Performance for the fund’s Advisor Class shares, which have a different fee structure, was similar.)
| PERFORMANCE COMPARISON | ||
| Periods Ended 6/30/05 | 6 Months | 12 Months |
| Emerging Markets Bond Fund | 8.61% | 25.83% |
| JP Morgan Emerging | ||
| Markets Bond Index Global | 5.11 | 20.17 |
Beginning with this report, we are changing the International Bond Fund’s benchmark from the J.P. Morgan Global Government Bond Broad Index, Non-U.S. Dollar to the Lehman Brothers Global Aggregate ex-U.S. Dollar Bond Index. Since its 1986 inception, the International Bond Fund has been comparing its performance to that of a government-only benchmark. The advent of the euro in 1999 developed a liquid and dynamic euro credit market in which your fund participates. While similar to the previous benchmark in terms of credit quality, duration, and currency composition, the new Lehman benchmark (composed of 65% government, 14% corporate, 13% agency, and 8% mortgage-related bonds) more accurately reflects the fund’s current investment opportunities. Comparison tables in this report contain both benchmarks, but future reports will use only the Lehman index.
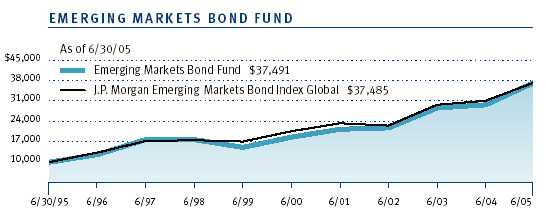
The Emerging Markets Bond Fund handily outperformed its benchmark, the J.P. Morgan Emerging Markets Bond Index Global. For the six months the fund returned 8.61%, compared to 5.11% for the benchmark, and for the 12-month period, the fund posted a gain of 25.83%, compared to the benchmark’s 20.17% increase.
MARKET ENVIRONMENT
| DEVELOPED MARKETS PERFORMANCE | ||
| In Local | In U.S. | |
| 6 Months Ended 6/30/05 | Currency | Dollars |
| Australia | 3.41% | 0.55% |
| France | 5.17 | -6.33 |
| Germany | 5.16 | -6.33 |
| Italy | 5.37 | -6.15 |
| Japan | 1.95 | -5.72 |
| Spain | 5.41 | -6.11 |
| United Kingdom | 4.91 | -2.05 |
| Source: JP Morgan | ||
In the U.S., the Fed raised the overnight federal funds target rate in four measured increments to 3.25%, which, in turn, boosted short-term rates. Contrary to conventional expectations, long-term rates did not follow, resulting in a flatter yield curve. (The yield curve is a graphic depiction of the relationship between interest rates and maturity dates for a set of similar securities. Please see the glossary for a more detailed definition.) Despite the growing U.S. trade and federal budget deficits, the dollar, which had declined against the euro and the yen in 2004, showed remarkable strength in the first half of 2005, appreciating about 12% against the euro and 8% versus the yen. Strong economic growth and higher interest rates in the U.S. supported the dollar, and the French and Dutch rejection of the European Union’s constitution hurt the euro’s value. Although oil prices climbed to more than $60 a barrel, inflation remained benign. When credit agencies downgraded GM and Ford in May, there was an immediate flight to quality, but as time passed the market absorbed the rating change with little lasting effect. Global credit quality improved in investment-grade and speculative issues, with upgrades strongly outpacing downgrades in Europe, Latin America, and Asia. Credit spreads tightened, and investors in search of higher yields began to bid up lower-quality issues.
Slowing economies in Germany, France, and Italy pushed European bond yields lower across the yield curve. Fragile domestic demand, record-level unemployment rates, and slowing export growth hurt consumer and business sentiment. By June, the markets were anticipating that the region’s weak economy would force the European Central Bank to cut rates.
Expectations that higher oil prices, a strong yen, and a global slowdown could cut short Japan’s export-oriented recovery helped Japan’s fixed-income markets. The Bank of Japan’s zero interest rate policy remained unchanged. Despite these concerns, Japan’s economy showed signs—improving employment and consumption trends—that the recovery would be sustainable. Businesses hired more workers, some companies resumed paying bonuses, and consumer incomes rose. The nation’s unemployment fell to 4.4% in April, its lowest level since 1998, and the economy expanded at an annualized pace of more than 5%, adjusted for deflation.
| EMERGING MARKETS PERFORMANCE | |
| In U.S. | |
| 6 Months Ended 6/30/05 | Dollars |
| JP Morgan Emerging Markets | |
| Bond Index Global | 5.11% |
| Brady Indexes (by issuer): * | |
| Argentina | -5.93 |
| Brazil | 4.55 |
| Mexico | 5.03 |
| Russia | 10.20 |
| Venezuela | 3.48 |
| * Brady bonds are restructured debt (obligations) of many | |
| emerging market countries that enable these nations to repay | |
| loans while they implement economic reforms. The bonds are | |
| denominated in U.S. dollars and have extended maturities | |
| and lower interest rates. | |
| Source: JP Morgan | |
Although most of the world’s fixed-income markets posted positive returns in local currencies, the strong dollar meant that returns for dollar-based investors were generally negative. Despite months of record-setting U.S. trade and budget deficits, higher short-term interest rates and relatively strong economic growth supported the dollar. By contrast, the euro remains weak due to the continent’s slowing growth and the E.U.’s temporarily fragile political situation. Although the dollar has appreciated against the yen, the Japanese currency was stronger against the euro.
Emerging market bonds remained buoyant thanks to investors seeking higher yields and the improved creditworthiness of many developing countries, but the difference in interest rates paid on emerging market credits and U.S. Treasuries continued to narrow. Credit markets in Turkey, which is applying for E.U. membership, suffered a slight setback prior to the E.U. constitution vote, but recovered within two months. Faced with a scandal involving the country’s ruling political party, Brazil’s financial markets appeared to take the country’s political turbulence in stride. Despite the headlines, spreads between Brazilian issues and U.S. Treasuries were close to year-end levels. Russian debt traded well on strong fundamentals and benefited from credit upgrades on a number of large companies. The Dominican Republic and Russian bonds generated the highest returns for the first half of 2005, and Argentina and Lebanon were the worst performers.
INTERNATIONAL BOND FUND
| PORTFOLIO CHARACTERISTICS | ||
| Periods Ended | 12/31/04 | 6/30/05 |
| International Bond Fund | ||
| 30-Day Standardized | ||
| Yield to Maturity | 2.18% | 2.28% |
| International Bond Fund– | ||
| Advisor Class | ||
| 30-Day Standardized | ||
| Yield to Maturity | 2.02 | 2.15 |
| Weighted Average | ||
| Maturity (years) | 7.0 | 8.7 |
| Weighted Average Effective | ||
| Duration (years) | 5.1 | 5.0 |
| Average Quality* | AA+ | AA+ |
| AAA | 58.9% | 63.0% |
| AA | 34.3 | 24.9 |
| A | 6.8 | 8.2 |
| BBB | 0.0 | 0.9 |
| BB and Below | 0.0 | 3.0 |
|
* Source: Standard & Poor’s; if Standard & Poor’s does not rate
|
||
|
a security, then Moody’s Investors Service is used as a sec–
|
||
|
ondary source.
|
||
As mentioned earlier, the strong dollar was the predominant negative influence affecting international fixed-income market performance and your fund’s returns. Within the bond markets, the largest detractor was our lighter exposure to Japanese bonds, which performed well during the last six months. Currency selection added the most value to returns relative to our index, particularly an overweight position in the Turkish lira. The country’s improving economic environment lifted its currency relative to the euro. The fund also benefited from its exposure to the strong-performing Mexican peso and Brazilian real. The largest currency detractor was an overweight in the Swedish krona, which underperformed the euro.
Our duration is shorter than the benchmark’s. (A shorter duration typically means lower interest rate sensitivity.) The portfolio’s duration ended the period at 5.0 years, virtually the same as it was six months ago and nearly a year shorter than the index. Relative to the index, we are underweight Japanese government bonds, which we think are expensive in light of the country’s improving economy. We are also underweight government bonds in the euro region, and we are favoring longer-term issues. Outside of major markets, we have searched for relative value opportunities. We recently initiated a position in Sweden, and we have sought opportunities in the emerging markets of Turkey, Mexico, Brazil, and Serbia. Solid economic growth and free-market reforms have made these countries much more attractive to fixed-income investors.
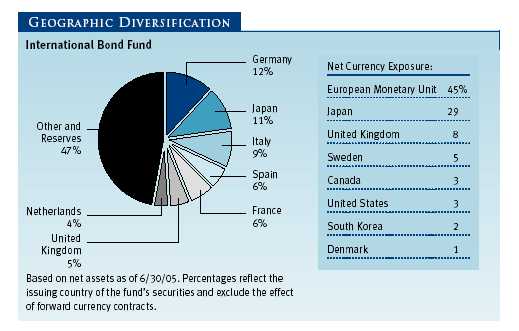
We have maintained an overweight position in the Mexican government bonds. We are underweight in the shorter-maturity European government bonds in favor of the longer-term securities. After benefiting from our heavier Polish bond allocation last year, we reduced our position on valuation concerns. We are still underweight in the Japanese government market, which appears to be expensive relative to the improving economy.
The fund’s credit quality remained high. More than 87% of our holdings were rated AA or higher. We have a healthy balance in cash or cash equivalents to take advantage of any increase in short-term rates.
EMERGING MARKETS BOND FUND
Emerging market bonds continued to post solid results. The Fed’s tightening policy has raised short-term rates but had little impact on long-term rates. As a result, those fixed-income investors seeking higher yields sought out emerging market bonds.
| PORTFOLIO CHARACTERISTICS | ||
| Periods Ended | 12/31/04 | 6/30/05 |
| Weighted Average | ||
| Maturity (years) | 12.1 | 15.1 |
| Weighted Average | ||
| Effective Duration (years) | 5.5 | 6.7 |
| Average Quality* | BB+ | BB |
| A and Above | 5.5% | 4.9% |
| BBB | 12.7 | 18.4 |
| BB | 55.8 | 46.4 |
| B and Below | 18.4 | 26.5 |
| Not Rated | 7.6 | 3.8 |
| * Source: Standard & Poor’s; if Standard & Poor’s does not rate | ||
| a security, then Moody’s Investors Service is used as a sec- | ||
| ondary source. | ||
Although emerging fixed-income markets experienced some volatility during the first half, the favorable global macroeconomic climate helped to lower emerging market yields by the end of the period. Steady global economic growth coupled with low rates of inflation provided a good environment for emerging market issues. Over the last six months, the portfolio’s weighted average maturity increased to 15.1 years from 12.1 years, and the duration—a measure of a portfolio’s sensitivity to interest rate changes—rose to 6.7 years from 5.5 years. The portfolio maintained its preference for higher-quality issues. About 70% of our holdings had investment-grade credit ratings of BB or better.
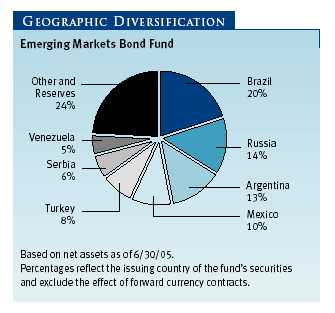
Brazil remained our largest position. The country’s bonds outperformed the benchmark despite a political scandal that resulted in the resignation of a cabinet official. The uproar quieted down rather quickly because investors were more focused on Brazil’s much-improved fiscal condition. For the third straight year, Brazil will have a current account surplus, projected to be $10 billion this year, and trade surplus of $34 billion. The potential for rate cuts in the second half of the year also helped reassure fixed-income investors. With upgrades from several rating agencies, Russian debt performed well. Argentina closed the books on its 2001 default by completing a $100 billion debt exchange and had its debt upgraded.
In the past six months, we increased our allocations to Argentina, the Philippines, Jamaica, and Panama. We trimmed our holdings in Mexico, Turkey, Venezuela, South Africa, Malaysia, and Indonesia.
OUTLOOK
Although bond valuations remain expensive in developed markets, they are likely to decline moderately in an environment of steady Federal Reserve tightening. Despite worries about a soft patch earlier this year, the U.S. economic recovery is strong and inflation is benign. We expect the difference between short- and long-term rates to narrow. Expectations for European economic growth have edged lower. As a result, the European Central Bank is unlikely to raise rates, and the market has priced in that probability. Given stronger U.S. economic growth and increasing differences between U.S. and European interest rates, we expect European government bonds to outperform Treasuries and the euro to remain weak relative to the dollar. Although the Japanese economy shows signs of recovery, the country’s prolonged deflationary cycle continues, which means the Bank of Japan is likely to continue its zero interest rate policy. We expect Japanese bond prices to decline as yields rise.
China’s decision to peg the yuan to a basket of currencies should result in a steady appreciation of Asian currencies versus the U.S. dollar. Given Europe’s slower growth and higher U.S. interest rates, the dollar should remain strong against the euro.
Continued measured Fed tightening and favorable supply/demand dynamics should support emerging market bonds through the second half of the year. A number of countries have already made significant progress on this year’s financing requirements, and they are turning their attention to prefinancing 2006 requirements to avoid some of the uncertainties related to their election cycles. However, as growth trends decelerate from peak levels in a number of developing countries, their interest rate cycles may diverge from the Fed’s. Longer term, strong global economic growth, responsible fiscal policies, and improving political conditions in many emerging markets have combined to produce a general upgrading of formerly speculative issues. We expect this trend to continue and believe that emerging markets will remain a fertile ground for investors.
Respectfully submitted,

Ian Kelson
President of the International Fixed Income Division and chairman of the
International Bond Fund’s Investment Advisory Committee

Michael Conelius
Chairman of the Investment Advisory Committee for the
Emerging Markets Bond Fund
July 20, 2005
The committee chairmen have day-to-day responsibility for the portfolios and work with committee members in developing and executing the funds’ investment programs.
RISKS OF INTERNATIONAL BOND INVESTING
Funds that invest overseas generally carry more risk than funds that invest strictly in U.S. assets, including unpredictable changes in currency values. Investments in emerging markets are subject to abrupt and severe price declines and should be regarded as speculative. The economic and political structures of developing nations, in most cases, do not compare favorably with the U.S. or other developed countries in terms of wealth and stability, and their financial markets often lack liquidity. Some countries also have legacies of hyperinflation, currency devaluations, and governmental interference in markets.
International investments are subject to currency risk, a decline in the value of a foreign currency versus the U.S. dollar, which reduces the dollar value of securities denominated in that currency. The overall impact on a fund’s holdings can be significant and long-lasting depending on the currencies represented in the portfolio, how each one appreciates or depreciates in relation to the U.S. dollar, and whether currency positions are hedged. Further, exchange rate movements are unpredictable and it is not possible to effectively hedge the currency risks of many developing countries.
Bonds are subject to interest rate risk, the decline in bond prices that usually accompanies a rise in interest rates, and credit risk, the chance that any fund holding could have its credit rating downgraded, or that a bond issuer will default (fail to make timely payments of interest or principal), potentially reducing the fund’s income level and share price.
GLOSSARY
Average maturity: For a bond fund, this is the weighted average of the stated maturity dates of the portfolio’s securities. In general, the longer the average maturity, the greater the fund’s sensitivity to interest rate changes, which can mean greater price fluctuation. A shorter average maturity usually means less interest rate sensitivity, and consequently, a less volatile portfolio.
Basis point: One one-hundredth of one percentage point, or 0.01% .
Duration: A measure of a bond or bond fund’s sensitivity to changes in interest rates. For example, a fund with a duration of six years would fall about 6% in response to a one-percentage-point rise in rates, and vice versa.
J.P. Morgan Emerging Markets Bond Index Global: Tracks U.S.-dollar government bonds of 31 foreign countries.
J.P. Morgan Global Government Bond Broad Index, Non-U.S. Dollar: Tracks government bonds in 12 international markets.
Lehman Brothers Global Aggregate ex-U.S. Dollar Bond Index: Tracks an international basket of bonds that contains 65% government, 14% corporate, 13% agency, and 8% mortgage-related bonds.
Yield curve: A graphic depiction of the relationship between yields and maturity dates for a set of similar securities, such as Treasuries or municipal securities. Securities with longer maturities usually have a higher yield. If short-term securities offer a higher yield, then the curve is said to be “inverted.” If short- and long-term bonds are offering equivalent yields, then the curve is said to be “flat.”
| PORTFOLIO HIGHLIGHTS | ||
| |
||
| PRICE AND YIELD | ||
| International Bond Fund | ||
| International | ||
| International | Bond Fund– | |
| Period Ended 6/30/05 | Bond Fund | Advisor Class |
| Price Per Share | $ 9.79 | $ 9.78 |
| Dividends Per Share | ||
| For 6 months | 0.13 | 0.10 |
| For 12 months | 0.26 | 0.24 |
| Capital Gains Per Share | ||
| For 6 months | 0.17 | 0.17 |
| For 12 months | 0.55 | 0.55 |
| 30-Day Dividend Yield * | 2.74% | 2.61% |
| 30-Day Standardized Yield to Maturity | 2.28 | 2.15 |
| Emerging Markets Bond Fund | ||
| Periods Ended | 12/31/04 | 6/30/05 |
| Price Per Share | $13.26 | $13.92 |
| Dividends Per Share | ||
| For 6 months | 0.42 | 0.46 |
| For 12 months | 0.79 | 0.88 |
| Capital Gains Per Share | ||
| For 6 months | – | – |
| For 12 months | – | – |
| 30-Day Dividend Yield * | 6.37% | 7.05% |
| 30-Day Standardized Yield to Maturity | 5.86 | 6.66 |
|
* Dividends earned for the last 30 days of each period indicated are annualized and divided by the fund’s
|
||
|
net asset value at the end of the period.
|
|
|
| GROWTH OF $10,000 |
This chart shows the value of a hypothetical $10,000 investment in the fund over the past 10 fiscal year periods or since inception (for funds lacking 10-year records). The result is compared with benchmarks, which may include a broad-based market index and a peer group average or index. Market indexes do not include expenses, which are deducted from fund returns as well as mutual fund averages and indexes.
| AVERAGE ANNUAL COMPOUND TOTAL RETURN |
This table shows how the fund and its benchmarks would have performed if their actual (or cumulative) returns for the periods shown had been earned at a constant rate.
| Since | ||||
| Inception | ||||
| Periods Ended 6/30/05 | 1 Year | 5 Years | 10 Years | 3/31/00 |
| International Bond Fund | 7.06% | 8.01% | 4.88% | – |
| International Bond Fund–Advisor Class | 6.89 | 7.78 | – | 7.16% |
| Lehman Brothers Global Aggregate | ||||
| ex-U.S. Dollar Bond Index | 8.09 | 8.01 | 5.06 | 7.49 |
| J.P. Morgan Global Government Bond | ||||
| Broad Index, Non-U.S. Dollar | 8.39 | 8.38 | 5.30 | 7.84 |
|
Current performance may be higher or lower than the quoted past performance, which can-
|
||||
|
not guarantee future results. Share price, principal value, and return will vary, and you may
|
||||
|
have a gain or loss when you sell your shares. For the most recent month-end performance
|
||||
|
information, please visit our Web site (troweprice.com) or contact a T. Rowe Price repre-
|
||||
|
sentative at 1-800-225-5132. The performance information does not reflect the deduction
|
||||
|
of the fund’s 2% redemption fee. If it did, the performance would be lower.
|
||||
|
Average annual total return figures include changes in principal value, reinvested dividends, and capital
|
||||
|
gain distributions. Returns do not reflect taxes that the shareholder may pay on fund distributions or
|
||||
|
the redemption of fund shares. When assessing performance, investors should consider both short- and
|
||||
|
long-term returns.
|
|
|
|
|
| GROWTH OF $10,000 |
This chart shows the value of a hypothetical $10,000 investment in the fund over the past 10 fiscal year periods or since inception (for funds lacking 10-year records). The result is compared with benchmarks, which may include a broad-based market index and a peer group average or index. Market indexes do not include expenses, which are deducted from fund returns as well as mutual fund averages and indexes.
| AVERAGE ANNUAL COMPOUND TOTAL RETURN |
This table shows how the fund and its benchmark would have performed if their actual (or cumulative) returns for the periods shown had been earned at a constant rate.
| Periods Ended 6/30/05 | 1 Year | 5 Years | 10 Years |
| Emerging Markets Bond Fund | 25.83% | 14.98% | 14.13% |
| J.P. Morgan Emerging | |||
| Markets Bond Index Global | 20.17 | 12.60 | 14.13 |
|
Current performance may be higher or lower than the quoted past performance, which can-
|
|||
|
not guarantee future results. Share price, principal value, and return will vary, and you may
|
|||
|
have a gain or loss when you sell your shares. For the most recent month-end performance
|
|||
|
information, please visit our Web site (troweprice.com) or contact a T. Rowe Price repre-
|
|||
|
sentative at 1-800-225-5132. The fund charges a redemption fee of 2% on shares held
|
|||
|
three months or less. The performance information does not reflect the deduction of the
|
|||
|
redemption fee. If it did, the performance would be lower.
|
|||
|
Average annual total return figures include changes in principal value, reinvested dividends, and capital
|
|||
|
gain distributions. Returns do not reflect taxes that the shareholder may pay on fund distributions or
|
|||
|
the redemption of fund shares. When assessing performance, investors should consider both short- and
|
|||
|
long-term returns.
|
|
|
|
| FUND EXPENSE EXAMPLE |
As a mutual fund shareholder, you may incur two types of costs: (1) transaction costs such as redemption fees or sales loads and (2) ongoing costs, including management fees, distribution and service (12b-1) fees, and other fund expenses. The following example is intended to help you understand your ongoing costs (in dollars) of investing in the fund and to compare these costs with the ongoing costs of investing in other mutual funds. The example is based on an investment of $1,000 invested at the beginning of the most recent six-month period and held for the entire period.
Please note that the International Bond Fund has two share classes: The original share class (“investor class”) charges no distribution and service (12b-1) fee. Advisor Class shares are offered only through unaffiliated brokers and other financial intermediaries and charge a 0.25% 12b-1 fee. Each share class is presented separately in the table.
Actual Expenses
The first line of the following table (“Actual”) provides information about actual account values and expenses based on the fund’s actual returns. You may use the information in this line, together with your account balance, to estimate the expenses that you paid over the period. Simply divide your account value by $1,000 (for example, an $8,600 account value divided by $1,000 = 8.6), then multiply the result by the number in the first line under the heading “Expenses Paid During Period” to estimate the expenses you paid on your account during this period.
Hypothetical Example for Comparison Purposes
The information on the second line of the table (?Hypothetical?) is based on hypothetical account values and expenses derived from the fund’s actual expense ratio and an assumed 5% per year rate of return before expenses (not the fund’s actual return). You may compare the ongoing costs of investing in the fund with other funds by contrasting this 5% hypothetical example and the 5% hypothetical examples that appear in the shareholder reports of the other funds. The hypothetical account values and expenses may not be used to estimate the actual ending account balance or expenses you paid for the period.
Note: T. Rowe Price charges an annual small-account maintenance fee of $10, generally for accounts with less than $2,000 ($500 for UGMA/UTMA). The fee is waived for any investor whose T. Rowe Price mutual fund accounts total $25,000 or more, accounts employing automatic investing, and IRAs and other retirement plan accounts that utilize a prototype plan sponsored by T. Rowe Price (although a separate custodial or administrative fee may apply to such accounts). This fee is not included in the accompanying table. If you are subject to the fee, keep it in mind when you are estimating the ongoing expenses of investing in the fund and when comparing the expenses of this fund with other funds.
You should also be aware that the expenses shown in the table highlight only your ongoing costs and do not reflect any transaction costs, such as redemption fees or sales loads. Therefore, the second line of the table is useful in comparing ongoing costs only and will not help you determine the relative total costs of owning different funds. To the extent a fund charges transaction costs, however, the total cost of owning that fund is higher.
| T. ROWE PRICE INTERNATIONAL BOND FUND | |||
| |
|||
| Beginning | Ending | Expenses Paid | |
| Account Value | Account Value | During Period* | |
| 1/1/05 | 6/30/05 | 1/1/05 to 6/30/05 | |
| Investor Class | |||
| Actual | $1,000.00 | $ 943.10 | $4.19 |
| Hypothetical (assumes 5% | |||
| return before expenses) | 1,000.00 | 1,020.48 | 4.36 |
| Advisor Class | |||
| Actual | 1,000.00 | 942.40 | 4.91 |
| Hypothetical (assumes 5% | |||
| return before expenses) | 1,000.00 | 1,019.74 | 5.11 |
|
* Expenses are equal to the fund’s annualized expense ratio for the six-month period, multiplied by the
|
|||
|
average account value over the period, multiplied by the number of days in the most recent fiscal half
|
|||
|
year (181) divided by the days in the year (365) to reflect the half-year period. The annualized expense
|
|||
|
ratio of the Investor Class was 0.87%, the Advisor Class was 1.02%.
|
|||
| T. ROWE PRICE EMERGING MARKETS BOND FUND | |||
| |
|||
| Beginning | Ending | Expenses Paid | |
| Account Value | Account Value | During Period* | |
| 1/1/05 | 6/30/05 | 1/1/05 to 6/30/05 | |
| Actual | $1,000.00 | $1,086.10 | $5.48 |
| Hypothetical (assumes 5% | |||
| return before expenses) | 1,000.00 | 1,019.54 | 5.31 |
|
* Expenses are equal to the fund’s annualized expense ratio for the six-month period (1.06%), multi-
|
|||
|
plied by the average account value over the period, multiplied by the number of days in the most
|
|||
|
recent fiscal half year (181) divided by the days in the year (365) to reflect the half-year period.
|
|||
|
ratio of the Investor Class was 0.87%, the Advisor Class was 1.02%.
|
|||
Unaudited
| FINANCIAL HIGHLIGHTS | For a share outstanding throughout each period | |||||||||||
| 6 Months | Year | |||||||||||
| Ended | Ended | |||||||||||
| 6/30/05** | 12/31/04 | 12/31/03 | 12/31/02 | 12/31/01 | 12/31/00 | |||||||
| NET ASSET VALUE | ||||||||||||
| Beginning of period | $ | 13.26 | $ | 12.30 | $ | 10.41 | $ | 10.32 | $ | 10.54 | $ | 10.11 |
|
|
||||||||||||
| Investment activities | ||||||||||||
| Net investment income (loss) | 0.60 | 0.79 | 0.75 | 0.83 | 1.19 | 1.17 | ||||||
| Net realized and unrealized | ||||||||||||
| gain (loss) | 0.52 | 0.96 | 1.89 | 0.11 | (0.25) | 0.31 | ||||||
|
|
||||||||||||
| Total from investment | ||||||||||||
| activities | 1.12 | 1.75 | 2.64 | 0.94 | 0.94 | 1.48 | ||||||
|
|
||||||||||||
| Distributions | ||||||||||||
| Net investment income | (0.46) | (0.79) | (0.75) | (0.85) | (1.16) | (1.05) | ||||||
|
|
||||||||||||
| NET ASSET VALUE | ||||||||||||
| End of period | $ | 13.92 | $ | 13.26 | $ | 12.30 | $ | 10.41 | $ | 10.32 | $ | 10.54 |
|
|
||||||||||||
| Ratios/Supplemental Data | ||||||||||||
| Total return^ | 8.61% | 14.83% | 26.05% | 9.52% | 9.35% | 15.20% | ||||||
| Ratio of total expenses | ||||||||||||
| to average net assets | 1.06%† | 1.08% | 1.10% | 1.14% | 1.16% | 1.21% | ||||||
| Ratio of net investment | ||||||||||||
| income (loss) to | ||||||||||||
| average net assets | 9.01%† | 6.30% | 6.50% | 8.14% | 11.37% | 11.23% | ||||||
| Portfolio turnover rate | 58.8%† | 71.3% | 68.6% | 51.4% | 75.5% | 69.5% | ||||||
| Net assets, end of period | ||||||||||||
| (in thousands) | $ | 360,034 | $ | 277,855 | $ | 252,285 | $ | 211,099 | $ | 155,563 | $ | 163,937 |
| ^ | Total return reflects the rate that an investor would have earned on an investment in the fund during each period, |
| assuming reinvestment of all distributions and payment of no redemption or account fees. | |
| ** | Per share amounts calculated using average shares outstanding method. |
| † | Annualized |
The accompanying notes are an integral part of these financial statements.
Unaudited
| PORTFOLIO OF INVESTMENTS (1) | Par/Shares | Value |
| (Cost and value in $ 000s) | ||
| ARGENTINA 12.6% | ||
| Government Bonds 12.6% | ||
| City of Buenos Aires, FRN, 6.65%, 6/10/09 (ITL) ‡ | 910,000,000 | 523 |
| City of Buenos Aires, VR, 7.875%, 4/11/11 (USD) | 4,342,000 | 4,261 |
| City of Buenos Aires, 9.50%, 5/28/08 | 6,180,000 | 2,441 |
| Republic of Argentina, 5.83%, 12/31/33 | 3,693,139 | 1,338 |
| Republic of Argentina, 8.28%, 12/31/33 (USD) §^ | 7,392,748 | 6,814 |
| Republic of Argentina, FRN, 0.63%, 12/31/38 | 33,708,542 | 4,564 |
| Republic of Argentina, FRN, 1.20%, 12/31/38 (EUR) | 1,355,099 | 590 |
| Republic of Argentina, FRN, 1.33%, 12/31/38 (USD) ^ | 11,867,464 | 4,251 |
| Republic of Argentina, BODEN, FRN, 3.01%, 8/3/12 (USD) | 23,250,000 | 20,750 |
| Total Argentina (Cost $40,188) | 45,532 | |
| BOSNIA & HERZEGOVINA 0.3% | ||
| Government Bonds 0.3% | ||
| Bosnia & Herzegovina, VR, 3.50%, 12/11/17 (DEM) ‡ | 1,980,000 | 1,040 |
| Total Bosnia & Herzegovina (Cost $678) | 1,040 | |
| BRAZIL 20.2% | ||
| Government Bonds 20.2% | ||
| Federative Republic of Brazil, Zero Coupon, 1/1/06 | 1,000,000 | 387 |
| Republic of Brazil (Bearer shares), FRN, 4.25%, 4/15/09 (USD) | 307,692 | 302 |
| Republic of Brazil (Registered shares), FRN, 4.25%, 4/15/09 (USD) | 2,769,231 | 2,717 |
| Republic of Brazil, DCB, FRN, 4.313%, 4/15/12 (USD) | 1,152,918 | 1,110 |
| Republic of Brazil, Class C, 8.00%, 4/15/14 (USD) § | 25,168,253 | 25,774 |
| Republic of Brazil, 8.75%, 2/4/25 (USD) | 10,950,000 | 11,287 |
| Republic of Brazil, 8.875%, 10/14/19 (USD) | 2,450,000 | 2,601 |
| Republic of Brazil, 10.125%, 5/15/27 (USD) § | 12,750,000 | 14,761 |
| Republic of Brazil, 11.00%, 8/17/40 (USD) § | 7,125,000 | 8,564 |
| Republic of Brazil, 14.50%, 10/15/09 (USD) § | 4,000,000 | 5,210 |
| Total Brazil (Cost $67,627) | 72,713 | |
| COLOMBIA 2.6% | ||
| Government Bonds 2.6% | ||
| Republic of Colombia, 9.75%, 4/9/11 (USD) | 531,509 | 607 |
| Republic of Colombia, 10.00%, 1/23/12 (USD) §++ | 2,500,000 | 2,919 |
| Republic of Colombia, 10.375%, 1/28/33 (USD) § | 1,000,000 | 1,195 |
| Republic of Colombia, 10.50%, 7/9/10 (USD) § | 1,000,000 | 1,190 |
| Republic of Colombia, 10.75%, 1/15/13 (USD) § | 1,900,000 | 2,318 |
| Republic of Colombia, 11.75%, 2/25/20 (USD) | 1,000,000 | 1,315 |
| Total Colombia (Cost $8,870) | 9,544 | |
| EL SALVADOR 0.4% | ||
| Government Bonds 0.4% | ||
| Republic of El Salvador, 7.625%, 9/21/34 (USD) § | 1,000,000 | 1,095 |
| Republic of El Salvador, 8.25%, 4/10/32 (USD) | 300,000 | 321 |
| Total El Salvador (Cost $1,284) | 1,416 | |
| GABON 0.4% | ||
| Government Bonds 0.4% | ||
| Gabon Loans, FRN, 2.025%, 6/1/08 (USD) * | 2,463,399 | 1,404 |
| Total Gabon (Cost $2,464) | 1,404 | |
| IRAQ 0.4% | ||
| Government Bonds 0.4% | ||
| Republic of Iraq, Zero Coupon, 10/23/49 (USD) ** | 5,000,000 | 1,450 |
| Total Iraq (Cost $1,444) | 1,450 | |
| IVORY COAST 0.1% | ||
| Government Bonds 0.1% | ||
| Republic of Ivory Coast, PDI, STEP, 1.90%, 3/29/18 (FRF) ‡* | 12,350,000 | 410 |
| Total Ivory Coast (Cost $1,074) | 410 | |
| JAMAICA 4.1% | ||
| Government Bonds 4.1% | ||
| Government of Jamaica, 9.00%, 6/2/15 (USD) | 5,000,000 | 5,100 |
| Government of Jamaica, 10.625%, 6/20/17 (USD) | 8,675,000 | 9,542 |
| Total Jamaica (Cost $14,493) | 14,642 | |
| LEBANON 0.3% | ||
| Government Bonds 0.3% | ||
| Lebanese Republic, 7.75%, 9/7/12 (USD) | 1,000,000 | 985 |
| Total Lebanon (Cost $1,000) | 985 | |
| MEXICO 9.6% | ||
| Government Bonds 5.8% | ||
| United Mexican States, 6.375%, 1/16/13 (USD) | 5,600,000 | 6,012 |
| United Mexican States, 8.00%, 12/19/13 | 34,890,000 | 2,984 |
| United Mexican States, 8.125%, 12/30/19 (USD) | 8,075,000 | 9,940 |
| United Mexican States, 11.50%, 5/15/26 (USD) | 1,300,000 | 2,093 |
| 21,029 | ||
| Corporate Bonds 3.8% | ||
| Pemex Project Funding Master Trust, 6.625%, 6/15/35 § | 5,000,000 | 4,962 |
| Pemex Project Funding Master Trust, 7.75%, 9/28/49 (USD) § | 8,250,000 | 8,508 |
| 13,470 | ||
| Warrants 0.0% | ||
| United Mexican States, Series C (USD) ** | 2,000,000 | 14 |
| United Mexican States, Series E (USD) ** | 2,000,000 | 51 |
| 65 | ||
| Total Mexico (Cost $32,524) | 34,564 | |
| NORTH KOREA 0.2% | ||
| Government Bonds 0.2% | ||
| North Korea Debt Corporation, Zero Coupon, 3/12/10 (CHF) ** | 4,000,000 | 498 |
| North Korea Debt Corporation, Zero Coupon, 3/12/10 (DEM) ‡** | 2,000,000 | 314 |
| Total North Korea (Cost $475) | 812 | |
| PANAMA 1.3% | ||
| Government Bonds 1.3% | ||
| Republic of Panama, 9.375%, 1/16/23 (USD) | 2,941,000 | 3,639 |
| Republic of Panama, 9.625%, 2/8/11 (USD) | 1,000,000 | 1,195 |
| Total Panama (Cost $4,398) | 4,834 | |
| PERU 1.0% | ||
| Government Bonds 1.0% | ||
| Republic of Peru, STEP, 5.00%, 3/7/17 (USD) | 3,315,000 | 3,179 |
| Republic of Peru, 8.75%, 11/21/33 (USD) | 500,000 | 566 |
| Total Peru (Cost $3,393) | 3,745 | |
| PHILIPPINES 4.8% | ||
| Government Bonds 4.8% | ||
| Republic of Philippines, 9.50%, 2/2/30 (USD) | 7,975,000 | 8,164 |
| Republic of Philippines, 9.875%, 1/15/19 (USD) § | 3,100,000 | 3,360 |
| Republic of Philippines, 10.625%, 3/16/25 (USD) § | 5,000,000 | 5,609 |
| Total Philippines (Cost $16,596) | 17,133 | |
| RUSSIA 13.8% | ||
| Government Bonds 9.7% | ||
| Russian Federation, FRN, 5.00%, 3/31/30 (USD) | 31,206,817 | 34,971 |
| 34,971 | ||
| Corporate Bonds 4.1% | ||
| Aries Vermogensverwaltung, 9.60%, 10/25/14 (USD) | 11,250,000 | 14,650 |
| 14,650 | ||
| Total Russia (Cost $40,598) | 49,621 | |
| SERBIA 6.3% | ||
| Government Bonds 6.3% | ||
| Republic of Serbia, VR, 3.75%, 11/1/24 (USD) | 26,280,240 | 22,667 |
| Total Serbia (Cost $22,872) | 22,667 | |
| TURKEY 8.0% | ||
| Government Bonds 8.0% | ||
| Republic of Turkey, 7.375%, 2/5/25 (USD) | 2,000,000 | 1,980 |
| Republic of Turkey, 8.00%, 2/14/34 (USD) | 1,500,000 | 1,560 |
| Republic of Turkey, 11.75%, 6/15/10 (USD) | 1,000,000 | 1,245 |
| Republic of Turkey, 11.875%, 1/15/30 (USD) § | 10,500,000 | 15,186 |
| Republic of Turkey, 20.00%, 10/17/07 | 10,900,000 | 8,771 |
| Total Turkey (Cost $26,965) | 28,742 | |
| UKRAINE 1.0% | ||
| Government Bonds 1.0% | ||
| Government of Ukraine, 7.65%, 6/11/13 (USD) § | 3,250,000 | 3,591 |
| Total Ukraine (Cost $3,318) | 3,591 | |
| URUGUAY 0.4% | ||
| Government Bonds 0.4% | ||
| Republic of Uruguay, 9.25%, 5/17/17 (USD) | 1,200,000 | 1,296 |
| Total Uruguay (Cost $1,200) | 1,296 | |
| VENEZUELA 5.2% | ||
| Government Bonds 5.1% | ||
| Republic of Venezeula, 8.50%, 10/8/14 (USD) § | 1,000,000 | 1,041 |
| Republic of Venezuela, 9.25%, 9/15/27 (USD) § | 6,000,000 | 6,300 |
| Republic of Venezuela, 13.625%, 8/15/18 (USD) | 5,250,000 | 7,090 |
| Republic of Venezuela, FRN, 4.15%, 4/20/11 (USD) | 4,300,000 | 3,956 |
| 18,387 | ||
| Warrants 0.1% | ||
| Republic of Venezuela (USD) ** | 7,140 | 171 |
| 171 | ||
| Total Venezuela (Cost $16,429) | 18,558 | |
| VIETNAM 3.0% | ||
| Government Bonds 3.0% | ||
| Republic of Vietnam, FRN, 4.063%, 3/12/28 (USD) | 4,750,000 | 4,513 |
| Republic of Vietnam, FRN, 4.086%, 3/14/16 (USD) § | 6,456,522 | 6,311 |
| Total Vietnam (Cost $9,469) | 10,824 | |
| SHORT-TERM INVESTMENTS 2.4% | ||
| Money Market Funds 2.4% | ||
| T. Rowe Price Reserve Investment Fund, 3.14% #† | 8,541,745 | 8,542 |
| Total Short-Term Investments (Cost $8,542) | 8,542 | |
| FORWARD CURRENCY EXCHANGE CONTRACTS 0.1% | |||
| Unrealized Gain (Loss) on Forward Currency Exchange Contracts (2) | 481 | ||
| Total Forward Currency Exchange Contracts | 481 | ||
| FUTURES CONTRACTS 0.0% | |||
| Variation margin receivable (payable) on open futures contracts (3) | (65) | ||
| Total Futures Contracts | (65) | ||
| SECURITIES LENDING COLLATERAL 25.5% | |||
| Money Market Pooled Account 25.5% | |||
| Investment in money market pooled account managed by JP | |||
| Morgan Chase Bank, London, 3.198% # | 91,904,356 | 91,904 | |
| Total Securities Lending Collateral (Cost $91,904) | 91,904 | ||
| Total Investments in Securities | |||
| 124.0% of Net Assets (Cost $417,805) | $ | 446,385 | |
| (1) | Denominated in currency of country of | CHF | Swiss franc |
| incorporation unless otherwise noted | DCB | Debt Conversion Bond | |
| # | Seven-day yield | DEM | German mark |
| * | In default with respect to payment of | EUR | Euro |
| interest. | FRF | French franc | |
| ** | Non-income producing | FRN | Floating-Rate Note |
| § | All or a portion of this security is on loan at | GBP | British pound |
| June 30, 2005 - See Note 2 | ITL | Italian lira | |
| ‡ | Security is denominated in legacy currency | PDI | Past Due Interest Bond |
| indicated and trades in Euro | STEP | Stepped coupon bond for which the | |
| ^ | When-issued security | coupon rate of interest will adjust on speci- | |
| ++ | All or a portion of this security is pledged to | fied future date(s) | |
| cover margin requirements on futures con- | USD | U.S. dollar | |
| tracts at June 30, 2005 | VR | Variable Rate; rate shown is effective rate | |
| † | Affiliated company – See Note 5 | at period-end | |
| BRL | Brazilian real |
| (2) Open Forward Currency Exchange Contracts at June 30, 2005 were as follows: | |||||||
| Amounts in (000s) | |||||||
| Unrealized | |||||||
| Counterparty | Settlement | Receive | Deliver | Gain (Loss) | |||
| Chase Manhattan | 3/16/06 | BRL | 3,023 | USD | 970 | $ | 200 |
| Credit Suisse | 5/2/06 | BRL | 2,878 | USD | 1,000 | 98 | |
| UBS | 8/19/05 | USD | 3,958 | EUR | 3,123 | 174 | |
| State Street | 8/19/05 | USD | 1,009 | GBP | 551 | 23 | |
| Chase Manhattan | 8/19/05 | GBP | 551 | USD | 1,000 | (14) | |
| Net unrealized gain (loss) on open | |||||||
| forward currency exchange contracts | $ | 481 | |||||
| (3) Open Futures Contracts at June 30, 2005 were as follows: | |||||||
| ($ 000s) | |||||||
| Contract | Unrealized | ||||||
| Expiration | Value | Gain (Loss) | |||||
| Short, 104 U.S. Treasury Bond contracts, | |||||||
| $150 par of 10.00% Republic of Colombia | |||||||
| pledged as initial margin | 9/05 | $ | (12,350) | $ | (267) | ||
| Net payments (receipts) of variation | |||||||
| margin to date | 202 | ||||||
| Variation margin receivable (payable) | |||||||
| on open futures contracts | $ | (65) | |||||
The accompanying notes are an integral part of these financial statements.
Unaudited
| STATEMENT OF ASSETS AND LIABILITIES | ||
| (In thousands except shares and per share amounts) | ||
| Assets | ||
| Investments in securities, at value | ||
| Affiliated companies (cost $8,542) | $ | 8,542 |
| Non-affiliated companies (cost $409,263) | 437,843 | |
|
|
||
| Total investments in securities | 446,385 | |
| Foreign currency (cost $1) | 1 | |
| Dividends and interest receivable | 6,660 | |
| Receivable for investment securities sold | 6,379 | |
| Receivable for shares sold | 791 | |
| Other assets | 877 | |
|
|
||
| Total assets | 461,093 | |
|
|
||
| Liabilities | ||
| Investment management fees payable | 219 | |
| Payable for investment securities purchased | 6,413 | |
| Payable for shares redeemed | 1,190 | |
| Obligation to return securities lending collateral | 91,904 | |
| Due to affiliates | 28 | |
| Other liabilities | 1,305 | |
|
|
||
| Total liabilities | 101,059 | |
|
|
||
| NET ASSETS | $ | 360,034 |
|
|
||
| Net Assets Consist of: | ||
| Undistributed net investment income (loss) | $ | 3,235 |
| Undistributed net realized gain (loss) | 19,347 | |
| Net unrealized gain (loss) | 28,337 | |
| Paid-in-capital applicable to 25,863,676 shares of | ||
| $0.01 par value capital stock outstanding; | ||
| 2,000,000,000 shares of the Corporation authorized | 309,115 | |
|
|
||
| NET ASSETS | $ | 360,034 |
|
|
||
| NET ASSET VALUE PER SHARE | $ | 13.92 |
|
|
||
The accompanying notes are an integral part of these financial statements.
Unaudited
| STATEMENT OF OPERATIONS | ||
| ($ 000s) | ||
| 6 Months | ||
| Ended | ||
| 6/30/05 | ||
| Investment Income (Loss) | ||
| Income | ||
| Interest | $ | 15,277 |
| Securities lending | 320 | |
| Dividend | 195 | |
|
|
||
| Total income | 15,792 | |
|
|
||
| Expenses | ||
| Investment management | 1,193 | |
| Shareholder servicing | 274 | |
| Custody and accounting | 122 | |
| Prospectus and shareholder reports | 30 | |
| Registration | 26 | |
| Legal and audit | 10 | |
| Directors | 3 | |
| Proxy and annual meeting | 2 | |
| Miscellaneous | 4 | |
|
|
||
| Total expenses | 1,664 | |
|
|
||
| Net investment income (loss) | 14,128 | |
|
|
||
| Realized and Unrealized Gain (Loss) | ||
| Net realized gain (loss) | ||
| Securities | 21,490 | |
| Futures | (396) | |
| Foreign currency transactions | 66 | |
|
|
||
| Net realized gain (loss) | 21,160 | |
|
|
||
| Change in net unrealized gain (loss) | ||
| Securities | (8,859) | |
| Futures | (267) | |
| Other assets and liabilities | ||
| denominated in foreign currencies | 699 | |
|
|
||
| Change in net unrealized gain (loss) | (8,427) | |
|
|
||
| Net realized and unrealized gain (loss) | 12,733 | |
|
|
||
| INCREASE (DECREASE) IN NET | ||
| ASSETS FROM OPERATIONS | $ | 26,861 |
|
|
||
The accompanying notes are an integral part of these financial statements.
Unaudited
| STATEMENT OF CHANGES IN NET ASSETS | ||||
| ($ 000s) | ||||
| 6 Months | Year | |||
| Ended | Ended | |||
| 6/30/05 | 12/31/04 | |||
| Increase (Decrease) in Net Assets | ||||
| Operations | ||||
| Net investment income (loss) | $ | 14,128 | $ | 15,607 |
| Net realized gain (loss) | 21,160 | 11,967 | ||
| Change in net unrealized gain (loss) | (8,427) | 6,409 | ||
|
|
||||
| Increase (decrease) in net assets from operations | 26,861 | 33,983 | ||
|
|
||||
| Distributions to shareholders | ||||
| Net investment income | (10,980) | (15,617) | ||
|
|
||||
| Capital share transactions * | ||||
| Shares sold | 79,802 | 66,109 | ||
| Distributions reinvested | 9,253 | 13,264 | ||
| Shares redeemed | (22,859) | (72,210) | ||
| Redemption fees received | 102 | 41 | ||
|
|
||||
| Increase (decrease) in net assets from capital | ||||
| share transactions | 66,298 | 7,204 | ||
|
|
||||
| Net Assets | ||||
| Increase (decrease) during period | 82,179 | 25,570 | ||
| Beginning of period | 277,855 | 252,285 | ||
|
|
||||
| End of period | $ | 360,034 | $ | 277,855 |
|
|
||||
| (Including undistributed net investment income | ||||
| of $3,235 at 6/30/05 and $87 at 12/31/04) | ||||
| *Share information | ||||
| Shares sold | 5,930 | 5,274 | ||
| Distributions reinvested | 684 | 1,068 | ||
| Shares redeemed | (1,697) | (5,904) | ||
|
|
||||
| Increase (decrease) in shares outstanding | 4,917 | 438 | ||
The accompanying notes are an integral part of these financial statements.
Unaudited
| NOTES TO FINANCIAL STATEMENTS |
NOTE 1 - SIGNIFICANT ACCOUNTING POLICIES
T. Rowe Price International Funds, Inc. (the corporation) is registered under the Investment Company Act of 1940 (the 1940 Act). The Emerging Markets Bond Fund (the fund), a nondiversified, open-end management investment company, is one portfolio established by the corporation. The fund commenced operations on December 30, 1994. The fund seeks to provide high income and capital appreciation.
The accompanying financial statements were prepared in accordance with accounting principles generally accepted in the United States of America, which require the use of estimates made by fund management. Fund management believes that estimates and security valuations are appropriate; however actual results may differ from those estimates, and the security valuations reflected in the financial statements may differ from the value the fund receives upon sale of the securities.
Valuation The fund values its investments and computes its net asset value per share at the close of the New York Stock Exchange (NYSE), normally 4 p.m. ET, each day that the NYSE is open for business. Debt securities are generally traded in the over-the-counter market. Securities with original maturities of one year or more are valued at prices furnished by dealers who make markets in such securities or by an independent pricing service, which considers yield or price of bonds of comparable quality, coupon, maturity, and type, as well as prices quoted by dealers who make markets in such securities. Securities with original maturities of less than one year are stated at fair value, which is determined by using a matrix system that establishes a value for each security based on bid-side money market yields.
Equity securities listed or regularly traded on a securities exchange or in the over-the-counter market are valued at the last quoted sale price or, for certain markets, the official closing price at the time the valuations are made, except for OTC Bulletin Board securities, which are valued at the mean of the latest bid and asked prices. A security that is listed or traded on more than one exchange is valued at the quotation on the exchange determined to be the primary market for such security. Listed securities not traded on a particular day are valued at the mean of the latest bid and asked prices for domestic securities and the last quoted sale price for international securities.
Investments in mutual funds are valued at the mutual fund’s closing net asset value per share on the day of valuation. Financial futures contracts are valued at closing settlement prices. Forward currency exchange contracts are valued using the prevailing forward exchange rate.
Other investments, including restricted securities, and those for which the above valuation procedures are inappropriate or are deemed not to reflect fair value are stated at fair value as determined in good faith by the T. Rowe Price Valuation Committee, established by the fund’s Board of Directors.
Most foreign markets close before the close of trading on the NYSE. If the fund determines that developments between the close of a foreign market and the close of the NYSE will, in its judgment, materially affect the value of some or all of its portfolio securities, which in turn will affect the fund’s share price, the fund will adjust the previous closing prices to reflect the fair value of the securities as of the close of the NYSE, as determined in good faith by the T. Rowe Price Valuation Committee, established by the fund’s Board of Directors. A fund may also fair value securities in other situations, such as when a particular foreign market is closed but the fund is open. In deciding whether to make fair value adjustments, the fund reviews a variety of factors, including developments in foreign markets, the performance of U.S. securities markets, and the performance of instruments trading in U.S. markets that represent foreign securities and baskets of foreign securities. The fund uses outside pricing services to provide it with closing market prices and information used for adjusting those prices. The fund cannot predict when and how often it will use closing prices and when it will adjust those prices to reflect fair value. As a means of evaluating its fair value process, the fund routinely compares closing market prices, the next day’s opening prices in the same markets, and adjusted prices.
Currency Translation Assets, including investments, and liabilities denominated in foreign currencies are translated into U.S. dollar values each day at the prevailing exchange rate, using the mean of the bid and asked prices of such currencies against U.S. dollars as quoted by a major bank. Purchases and sales of securities, income, and expenses are translated into U.S. dollars at the prevailing exchange rate on the date of the transaction. The effect of changes in foreign currency exchange rates on realized and unrealized security gains and losses is reflected as a component of security gains and losses.
Credits The fund earns credits on temporarily uninvested cash balances at the custodian that reduce the fund’s custody charges. Custody expense in the accompanying financial statements is presented before reduction for credits.
Redemption Fees A 2% fee is assessed on redemptions of fund shares held less than 90 days/3 months to deter short-term trading and protect the interests of long-term shareholders. Redemption fees are withheld from proceeds that shareholders receive from the sale or exchange of fund shares. The fees are paid to the fund, and are recorded as an increase to paid-in capital. The fees may cause the redemption price per share to differ from the net asset value per share.
Investment Transactions, Investment Income, and Distributions Income and expenses are recorded on the accrual basis. Premiums and discounts on debt securities are amortized for financial reporting purposes. Dividends received from mutual fund investments are reflected as dividend income; capital gain distributions are reflected as realized gain/loss. Dividend income and capital gain distributions are recorded on the ex-dividend date. Investment transactions are accounted for on the trade date. Realized gains and losses are reported on the identified cost basis. Payments (“variation margin”) made or received to settle the daily fluctuations in the value of futures contracts are recorded as unrealized gains or losses until the contracts are closed. Unsettled variation margin on futures contracts is included in investments in securities, and unrealized gains and losses on futures contracts are included in the change in net unrealized gain or loss in the accompanying financial statements. Unrealized gains and losses on forward currency exchange contracts are included in investments in securities, and in the change in net unrealized gain or loss in the accompanying financial statements. Paydown gains and losses are recorded as an adjustment to interest income. Distributions to shareholders are recorded on the ex-dividend date. Income distributions are declared on a daily basis and paid monthly. Capital gain distributions, if any, are declared and paid by the fund, typically on an annual basis.
NOTE 2 - INVESTMENT TRANSACTIONS
Consistent with its investment objective, the fund engages in the following practices to manage exposure to certain risks or enhance performance. The investment objective, policies, program, and risk factors of the fund are described more fully in the fund’s prospectus and Statement of Additional Information.
Emerging Markets At June 30, 2005, approximately 96% of the fund’s net assets were invested in securities of companies located in emerging markets or denominated in or linked to the currencies of emerging market countries. Future economic or political developments could adversely affect the liquidity or value, or both, of such securities.
Noninvestment-Grade Debt Securities At June 30, 2005, approximately 72% of the fund’s net assets were invested in noninvestment-grade debt securities, commonly referred to as “high-yield” or “junk” bonds. A real or perceived economic downturn or higher interest rates could adversely affect the liquidity or value, or both, of such securities because such events could lessen the ability of issuers to make principal and interest payments.
Restricted Securities The fund may invest in securities that are subject to legal or contractual restrictions on resale. Although certain of these securities may be readily sold, for example, under Rule 144A, others may be illiquid, their sale may involve substantial delays and additional costs, and prompt sale at an acceptable price may be difficult.
Forward Currency Exchange Contracts During the six months ended June 30, 2005, the fund was a party to forward currency exchange contracts under which it is obligated to exchange currencies at specified future dates and exchange rates. Risks arise from the possible inability of counterparties to meet the terms of their agreements and from movements in currency values.
Futures Contracts During the six months ended June 30, 2005, the fund was a party to futures contracts, which provide for the future sale by one party and purchase by another of a specified amount of a specific financial instrument at an agreed upon price, date, time, and place. Risks arise from possible illiquidity of the futures market and from movements in security values and/or currency values.
Securities Lending The fund lends its securities to approved brokers to earn additional income. It receives as collateral cash and U.S. government securities valued at 102% to 105% of the value of the securities on loan. Cash collateral is invested in a money market pooled account managed by the fund’s lending agent in accordance with investment guidelines approved by fund management. Collateral is maintained over the life of the loan in an amount not less than the value of loaned securities, as determined at the close of fund business each day; any additional collateral required due to changes in security values is delivered to the fund the next business day. Although risk is mitigated by the collateral, the fund could experience a delay in recovering its securities and a possible loss of income or value if the borrower fails to return the securities. Securities lending revenue recognized by the fund consists of earnings on invested collateral and borrowing fees, net of any rebates to the borrower and compensation to the lending agent. At June 30, 2005, the value of loaned securities was $87,378,000; aggregate collateral consisted of $91,904,000 in the money market pooled account
Other Purchases and sales of portfolio securities, other than short-term securities, aggregated $127,977,000 and $88,987,000, respectively, for the six months ended June 30, 2005.
NOTE 3 - FEDERAL INCOME TAXES
No provision for federal income taxes is required since the fund intends to continue to qualify as a regulated investment company under Subchapter M of the Internal Revenue Code and distribute to shareholders all of its taxable income and gains. Federal income tax regulations differ from generally accepted accounting principles; therefore, distributions determined in accordance with tax regulations may differ in amount or character from net investment income and realized gains for financial reporting purposes. Financial reporting records are adjusted for permanent book/tax differences to reflect tax character. Financial records are not adjusted for temporary differences. The amount and character of tax-basis distributions and composition of net assets are finalized at fiscal year-end; accordingly, tax-basis balances have not been determined as of June 30, 2005.
At June 30, 2005, the cost of investments for federal income tax purposes was $417,805,000. Net unrealized gain aggregated $28,337,000 at period-end, of which $30,659,000 related to appreciated investments and $2,322,000 related to depreciated investments.
NOTE 4 - FOREIGN TAXES
The fund is subject to a tax on net profits imposed by Turkey. The tax is payable annually and is computed on aggregate interest income, net realized gains, and, in the case of debt securities issued by the Turkish government, any net increase in unrealized gains during the year. Realized and unrealized losses in excess of current year income and gains may be carried forward for five years to offset future income and gains. The tax expense on interest is accrued as a reduction of income and the tax expense or benefit on gains is included with realized and/or unrealized gain/loss on securities in the accompanying financial statements. At June 30, 2005, the fund had Turkish taxes payable in the amount of $89,000 and no capital loss carryforwards.
NOTE 5 - RELATED PARTY TRANSACTIONS
The fund is managed by T. Rowe Price International, Inc. (the manager), a wholly owned subsidiary of T. Rowe Price Associates, Inc. (Price Associates), which is wholly owned by T. Rowe Price Group, Inc. The investment management agreement between the fund and the manager provides for an annual investment management fee, which is computed daily and paid monthly. The fee consists of an individual fund fee, equal to 0.45% of the fund’s average daily net assets, and a group fee. The group fee rate is calculated based on the combined net assets of certain mutual funds sponsored by Price Associates (the group) applied to a graduated fee schedule, with rates ranging from 0.48% for the first $1 billion of assets to 0.29% for assets in excess of $160 billion. Prior to May 1, 2005, the maximum group fee rate in the graduated fee schedule had been 0.295% for assets in excess of $120 billion. The fund’s group fee is determined by applying the group fee rate to the fund’s average daily net assets. At June 30, 2005, the effective annual group fee rate was 0.31%.
In addition, the fund has entered into service agreements with Price Associates and two wholly owned subsidiaries of Price Associates (collectively, Price). Price Associates computes the daily share price and maintains the financial records of the fund. T. Rowe Price Services, Inc., provides shareholder and administrative services in its capacity as the fund’s transfer and dividend disbursing agent. T. Rowe Price Retirement Plan Services, Inc., provides subaccounting and recordkeeping services for certain retirement accounts invested in the fund. For the six months ended June 30, 2005, expenses incurred pursuant to these service agreements were $63,000 for Price Associates, $114,000 for T. Rowe Price Services, Inc., and $8,000 for T. Rowe Price Retirement Plan Services, Inc. The total amount payable at period end pursuant to these service agreements is reflected as due to affiliates in the accompanying financial statements.
The fund is also one of several mutual funds sponsored by Price Associates (underlying Price funds) in which the T. Rowe Price Spectrum Funds (Spectrum Funds) may invest. The Spectrum Funds do not invest in the underlying Price funds for the purpose of exercising management or control. Pursuant to a special servicing agreement, expenses associated with the operation of the Spectrum Funds are borne by each underlying Price fund to the extent of estimated savings to it and in proportion to the average daily value of its shares owned by the Spectrum Funds. Expenses allocated under this agreement are reflected as shareholder servicing expense in the accompanying financial statements. For the six months ended June 30, 2005, the fund was allocated $87,000 of Spectrum Funds’ expenses, of which $57,000 related to services provided by Price. The amount payable at period end pursuant to this agreement is reflected as a component of due to affiliates in the accompanying financial statements. At June 30, 2005, approximately 26.9% of the outstanding shares of the fund were held by the Spectrum Funds.
The fund may invest in the T. Rowe Price Reserve Investment Fund and the T. Rowe Price Government Reserve Investment Fund (collectively, the T. Rowe Price Reserve Funds), open-end management investment companies managed by Price Associates and affiliates of the fund. The T. Rowe Price Reserve Funds are offered as cash management options to mutual funds, trusts, and other accounts managed by Price Associates and/or its affiliates, and are not available for direct purchase by members of the public. The T. Rowe Price Reserve Funds pay no investment management fees. During the six months ended June 30, 2005, dividend income from the T. Rowe Price Reserve Funds totaled $194,000, and the value of shares of the T. Rowe Price Reserve Funds held at June 30, 2005 and December 31, 2004 was $8,542,000 and $8,007,000, respectively.
As of June 30, 2005, T. Rowe Price Group, Inc. and/or its wholly owned subsidiaries owned 119,458 shares of the fund, representing less than 1% of the fund’s net assets.
| INFORMATION ON PROXY VOTING POLICIES, PROCEDURES, AND RECORDS |
A description of the policies and procedures used by T. Rowe Price funds and portfolios to determine how to vote proxies relating to portfolio securities is available in each fund’s Statement of Additional Information, which you may request by calling 1-800-225-5132 or by accessing the SEC’s Web site, www.sec.gov. The description of our proxy voting policies and procedures is also available on our Web site, www.troweprice.com. To access it, click on the words “Company Info” at the top of our homepage for individual investors. Then, in the window that appears, click on the “Proxy Voting Policy” navigation button in the top left corner.
Each fund’s most recent annual proxy voting record is available on our Web site and through the SEC’s Web site. To access it through our Web site, follow the directions above, then click on the words “Proxy Voting Record” at the bottom of the Proxy Voting Policy page.
| HOW TO OBTAIN QUARTERLY PORTFOLIO HOLDINGS |
The fund files a complete schedule of portfolio holdings with the Securities and Exchange Commission for the first and third quarters of each fiscal year on Form N-Q. The fund’s Form N-Q is available electronically on the SEC’s Web site (www.sec.gov); hard copies may be reviewed and copied at the SEC’s Public Reference Room, 450 Fifth St. N.W., Washington, DC 20549. For more information on the Public Reference Room, call 1-800-SEC-0330.
| APPROVAL OF INVESTMENT MANAGEMENT AGREEMENT |
On March 2, 2005, the fund’s Board of Directors unanimously approved the investment advisory contract (“Contract”) between the fund and its investment manager, T. Rowe Price Associates, Inc. (“Manager”). The Board considered a variety of factors in connection with its review of the Contract, also taking into account information provided by the Manager during the course of the year, as discussed below:
Services Provided by the Manager
The Board considered the nature, quality, and extent of the services provided to the fund by the Manager. These services included, but were not limited to, management of the fund’s portfolio and a variety of activities related to
portfolio management. The Board also reviewed the background and experience of the Manager’s senior management team and investment personnel involved in the management of the fund. The Board had previously conducted a detailed review of the
organization, structure, and investment teams of the Manager at a meeting held in October 2004. The Board concluded that it was satisfied with the nature, quality, and extent of the services provided by the Manager.
Investment Performance of the Fund
The Board reviewed the fund’s average annual total return over the 1-, 3-, 5-, and 10-year periods as well as the fund’s year-by-year returns and compared these returns to previously agreed upon comparable performance measures
and market data, including those supplied by Lipper and Morningstar, which are independent providers of mutual fund data. On the basis of this evaluation and the Board’s ongoing review of investment results, the Board concluded that the
fund’s performance was satisfactory.
Costs, Benefits, Profits, and Economies of Scale
The Board reviewed detailed information regarding the revenues received by the Manager under the Contract and other benefits that the Manager (and its affiliates) may have realized from its relationship with the fund, including research
received under “soft dollar” agreements. The Board also received information on the estimated costs incurred and profits realized by the Manager and its affiliates from advising T. Rowe Price mutual funds, as well as estimates of the gross
profits realized from managing the fund in particular. The Board concluded that the Manager’s profits were reasonable in light of the services provided to the fund. The Board also considered whether the fund or other funds benefit under the fee
levels set forth in the Contract from any economies of scale realized by the Manager. Under the Contract, the fund pays a fee to the Manager composed of two components—a group fee rate based on the aggregate assets of certain T. Rowe Price
mutual funds (including the fund) that declines at certain asset levels, and an individual fund fee rate that is assessed on the assets of the fund. The Board concluded that an additional breakpoint should be added to the group fee component of the
fees paid by the fund under the Contract at a level of $160 billion. The Board further concluded that, with this change, the advisory fee structure for the fund continued to provide for a reasonable sharing of benefits from any economies of
scale with the fund’s investors.
The Board reviewed the fund’s management fee rate, operating expenses, and total expense ratio and compared them to fees and expenses of other comparable funds based on information and data supplied by Lipper. The information provided to the Board indicated that the fund’s management fee rate was above the median for comparable funds. The information also indicated that the fund’s expense ratio was generally below the median for comparable funds. The Board also reviewed the fee schedules for comparable privately managed accounts of the Manager and its affiliates. Management informed the Board that the Manager’s responsibilities for privately managed accounts are more limited than its responsibilities for the fund and other T. Rowe Price mutual funds that it or its affiliates advise. On the basis of the information provided, the Board concluded that the fees paid by the fund under the Contract were reasonable.
Approval of the Contract
As noted, the Board approved the continuation of the Contract as amended to add an additional breakpoint to the group fee rate. No single factor was considered in isolation or to be determinative to the decision. Rather, the Board
concluded, in light of a weighting and balancing of all factors considered, that it was in the best interests of the fund to approve the continuation of the Contract, including the fees to be charged for services thereunder.
A code of ethics, as defined in Item 2 of Form N-CSR, applicable to its principal executive officer, principal financial officer, principal accounting officer or controller, or persons performing similar functions is filed as an exhibit to the registrant’s annual Form N-CSR. No substantive amendments were approved or waivers were granted to this code of ethics during the registrant’s most recent fiscal half-year.
Item 3. Audit Committee Financial Expert.
Disclosure required in registrant’s annual Form N-CSR.
Item 4. Principal Accountant Fees and Services.
Disclosure required in registrant’s annual Form N-CSR.
Item 5. Audit Committee of Listed Registrants.
Not applicable.
Item 6. Schedule of Investments.
Not applicable. The complete schedule of investments is included in Item 1 of this Form N-CSR.
Item 7. Disclosure of Proxy Voting Policies and Procedures for Closed-End Management Investment Companies.
Not applicable.
Item 8. Portfolio Managers of Closed-End Management Investment Companies.
Not applicable.
Item 9. Purchases of Equity Securities by Closed-End Management Investment Company and Affiliated Purchasers.
Not applicable.
Item 10. Submission of Matters to a Vote of Security Holders.
Not applicable.
Item 11. Controls and Procedures.
(a) The registrant’s principal executive officer and principal financial officer have evaluated the registrant’s disclosure controls and procedures within 90 days of this filing and have concluded that the registrant’s disclosure controls and procedures were effective, as of that date, in ensuring that information required to be disclosed by the registrant in this Form N-CSR was recorded, processed, summarized, and reported timely.
(b) The registrant’s principal executive officer and principal financial officer are aware of no change in the registrant’s internal control over financial reporting that occurred during the registrant’s second fiscal quarter covered by this report that has materially affected, or is reasonably likely to materially affect, the registrant’s internal control over financial reporting.
Item 12. Exhibits.
(a)(1) The registrant’s code of ethics pursuant to Item 2 of Form N-CSR is filed with the registrant’s annual Form N-CSR.
(2) Separate certifications by the registrant's principal executive officer and principal financial officer, pursuant to Section 302 of the Sarbanes-Oxley Act of 2002 and required by Rule 30a-2(a) under the Investment Company Act of 1940, are attached.
(3) Written solicitation to repurchase securities issued by closed-end companies: not applicable.
(b) A certification by the registrant's principal executive officer and principal financial officer, pursuant to Section 906 of the Sarbanes-Oxley Act of 2002 and required by Rule 30a-2(b) under the Investment Company Act of 1940, is attached.
| SIGNATURES | |
| Pursuant to the requirements of the Securities Exchange Act of 1934 and the Investment | |
| Company Act of 1940, the registrant has duly caused this report to be signed on its behalf by the | |
| undersigned, thereunto duly authorized. | |
| T. Rowe Price International Funds, Inc. | |
| By | /s/ James S. Riepe |
| James S. Riepe | |
| Principal Executive Officer | |
| Date | August 18, 2005 |
| Pursuant to the requirements of the Securities Exchange Act of 1934 and the Investment | |
| Company Act of 1940, this report has been signed below by the following persons on behalf of | |
| the registrant and in the capacities and on the dates indicated. | |
| By | /s/ James S. Riepe |
| James S. Riepe | |
| Principal Executive Officer | |
| Date | August 18, 2005 |
| By | /s/ Joseph A. Carrier |
| Joseph A. Carrier | |
| Principal Financial Officer | |
| Date | August 18, 2005 |