FEDERAL NATIONAL MORTGAGE ASSOCIATION FANNIE MAE000031052212/312024Q2FALSEX1xbrli:sharesiso4217:USDiso4217:USDxbrli:sharesxbrli:pureutr:Mfnm:segment00003105222024-01-012024-06-3000003105222024-07-1200003105222024-06-3000003105222023-12-310000310522us-gaap:VariableInterestEntityPrimaryBeneficiaryMember2024-06-300000310522us-gaap:VariableInterestEntityPrimaryBeneficiaryMember2023-12-310000310522srt:ParentCompanyMember2024-06-300000310522srt:ParentCompanyMember2023-12-3100003105222024-04-012024-06-3000003105222023-04-012023-06-3000003105222023-01-012023-06-300000310522srt:ParentCompanyMember2024-01-012024-06-300000310522srt:ParentCompanyMember2023-01-012023-06-300000310522us-gaap:VariableInterestEntityPrimaryBeneficiaryMember2024-01-012024-06-300000310522us-gaap:VariableInterestEntityPrimaryBeneficiaryMember2023-01-012023-06-3000003105222022-12-3100003105222023-06-300000310522fnm:SeniorPreferredStockMember2024-03-310000310522us-gaap:PreferredStockMember2024-03-310000310522us-gaap:CommonStockMember2024-03-310000310522us-gaap:RetainedEarningsMember2024-03-310000310522us-gaap:AccumulatedOtherComprehensiveIncomeMember2024-03-310000310522us-gaap:TreasuryStockCommonMember2024-03-3100003105222024-03-310000310522us-gaap:RetainedEarningsMember2024-04-012024-06-300000310522us-gaap:AccumulatedOtherComprehensiveIncomeMember2024-04-012024-06-300000310522fnm:SeniorPreferredStockMember2024-06-300000310522us-gaap:PreferredStockMember2024-06-300000310522us-gaap:CommonStockMember2024-06-300000310522us-gaap:RetainedEarningsMember2024-06-300000310522us-gaap:AccumulatedOtherComprehensiveIncomeMember2024-06-300000310522us-gaap:TreasuryStockCommonMember2024-06-300000310522fnm:SeniorPreferredStockMember2023-12-310000310522us-gaap:PreferredStockMember2023-12-310000310522us-gaap:CommonStockMember2023-12-310000310522us-gaap:RetainedEarningsMember2023-12-310000310522us-gaap:AccumulatedOtherComprehensiveIncomeMember2023-12-310000310522us-gaap:TreasuryStockCommonMember2023-12-310000310522us-gaap:RetainedEarningsMember2024-01-012024-06-300000310522us-gaap:AccumulatedOtherComprehensiveIncomeMember2024-01-012024-06-300000310522fnm:SeniorPreferredStockMember2023-03-310000310522us-gaap:PreferredStockMember2023-03-310000310522us-gaap:CommonStockMember2023-03-310000310522us-gaap:RetainedEarningsMember2023-03-310000310522us-gaap:AccumulatedOtherComprehensiveIncomeMember2023-03-310000310522us-gaap:TreasuryStockCommonMember2023-03-3100003105222023-03-310000310522us-gaap:RetainedEarningsMember2023-04-012023-06-300000310522us-gaap:AccumulatedOtherComprehensiveIncomeMember2023-04-012023-06-300000310522fnm:SeniorPreferredStockMember2023-06-300000310522us-gaap:PreferredStockMember2023-06-300000310522us-gaap:CommonStockMember2023-06-300000310522us-gaap:RetainedEarningsMember2023-06-300000310522us-gaap:AccumulatedOtherComprehensiveIncomeMember2023-06-300000310522us-gaap:TreasuryStockCommonMember2023-06-300000310522fnm:SeniorPreferredStockMember2022-12-310000310522us-gaap:PreferredStockMember2022-12-310000310522us-gaap:CommonStockMember2022-12-310000310522us-gaap:RetainedEarningsMember2022-12-310000310522us-gaap:AccumulatedOtherComprehensiveIncomeMember2022-12-310000310522us-gaap:TreasuryStockCommonMember2022-12-310000310522us-gaap:RetainedEarningsMember2023-01-012023-06-300000310522us-gaap:AccumulatedOtherComprehensiveIncomeMember2023-01-012023-06-300000310522fnm:Series20082SeniorPreferredStockMember2008-09-012008-09-300000310522fnm:UsTreasuryMemberus-gaap:RelatedPartyMember2024-06-3000003105222024-01-012024-03-310000310522srt:ScenarioForecastMember2024-09-300000310522fnm:UsTreasuryMember2024-06-300000310522fnm:CommonSecuritizationSolutionsAndFreddieMacMemberus-gaap:RelatedPartyMember2023-04-012023-06-300000310522fnm:CommonSecuritizationSolutionsAndFreddieMacMemberus-gaap:RelatedPartyMember2024-04-012024-06-300000310522fnm:CommonSecuritizationSolutionsAndFreddieMacMemberus-gaap:RelatedPartyMember2024-01-012024-06-300000310522fnm:CommonSecuritizationSolutionsAndFreddieMacMemberus-gaap:RelatedPartyMember2023-01-012023-06-300000310522fnm:UsTreasuryMemberfnm:SingleFamilyGuarantyFeeTemporaryPayrollTaxCutContinuationActOf2011Memberus-gaap:RelatedPartyMember2024-04-012024-06-300000310522fnm:UsTreasuryMemberfnm:SingleFamilyGuarantyFeeTemporaryPayrollTaxCutContinuationActOf2011Memberus-gaap:RelatedPartyMember2023-04-012023-06-300000310522fnm:UsTreasuryMemberfnm:SingleFamilyGuarantyFeeTemporaryPayrollTaxCutContinuationActOf2011Memberus-gaap:RelatedPartyMember2024-01-012024-06-300000310522fnm:UsTreasuryMemberfnm:SingleFamilyGuarantyFeeTemporaryPayrollTaxCutContinuationActOf2011Memberus-gaap:RelatedPartyMember2023-01-012023-06-300000310522fnm:UsTreasuryMemberfnm:SingleFamilyGuarantyFeeTemporaryPayrollTaxCutContinuationActOf2011Memberus-gaap:RelatedPartyMember2024-06-300000310522fnm:UsTreasuryMemberus-gaap:RelatedPartyMemberfnm:TreasuryCapitalManagementFundMember2024-04-012024-06-300000310522fnm:UsTreasuryMemberus-gaap:RelatedPartyMemberfnm:TreasuryCapitalManagementFundMember2023-04-012023-06-300000310522fnm:UsTreasuryMemberus-gaap:RelatedPartyMemberfnm:TreasuryCapitalManagementFundMember2024-01-012024-06-300000310522fnm:UsTreasuryMemberus-gaap:RelatedPartyMemberfnm:TreasuryCapitalManagementFundMember2023-01-012023-06-300000310522fnm:UsTreasuryMemberus-gaap:RelatedPartyMemberfnm:TreasuryCapitalManagementFundMember2024-06-300000310522us-gaap:RelatedPartyMemberfnm:FederalHousingFinanceAgencyMember2024-04-012024-06-300000310522us-gaap:RelatedPartyMemberfnm:FederalHousingFinanceAgencyMember2023-04-012023-06-300000310522us-gaap:RelatedPartyMemberfnm:FederalHousingFinanceAgencyMember2024-01-012024-06-300000310522us-gaap:RelatedPartyMemberfnm:FederalHousingFinanceAgencyMember2023-01-012023-06-300000310522us-gaap:RelatedPartyMemberfnm:FederalHousingFinanceAgencyMember2024-06-300000310522fnm:USTreasuryAndFreddieMacMemberus-gaap:RelatedPartyMember2024-04-012024-06-300000310522fnm:USTreasuryAndFreddieMacMemberus-gaap:RelatedPartyMember2023-04-012023-06-300000310522fnm:USTreasuryAndFreddieMacMemberus-gaap:RelatedPartyMember2024-01-012024-06-300000310522fnm:USTreasuryAndFreddieMacMemberus-gaap:RelatedPartyMember2023-01-012023-06-300000310522fnm:USTreasuryAndFreddieMacMemberus-gaap:RelatedPartyMember2024-06-300000310522fnm:CommonSecuritizationSolutionsAndFreddieMacMemberus-gaap:RelatedPartyMember2024-06-300000310522us-gaap:VariableInterestEntityNotPrimaryBeneficiaryMemberus-gaap:MortgageBackedSecuritiesMember2024-06-300000310522us-gaap:VariableInterestEntityNotPrimaryBeneficiaryMemberus-gaap:MortgageBackedSecuritiesMember2023-12-310000310522us-gaap:VariableInterestEntityNotPrimaryBeneficiaryMembersrt:PartnershipInterestMember2024-06-300000310522us-gaap:VariableInterestEntityNotPrimaryBeneficiaryMembersrt:PartnershipInterestMember2023-12-310000310522us-gaap:VariableInterestEntityNotPrimaryBeneficiaryMemberus-gaap:DebtSecuritiesMember2024-06-300000310522us-gaap:VariableInterestEntityNotPrimaryBeneficiaryMemberus-gaap:DebtSecuritiesMember2023-12-310000310522us-gaap:VariableInterestEntityNotPrimaryBeneficiaryMembersrt:MultifamilyMember2024-06-300000310522us-gaap:VariableInterestEntityNotPrimaryBeneficiaryMemberfnm:SingleClassMBSREMICMegasMember2024-06-300000310522us-gaap:VariableInterestEntityNotPrimaryBeneficiaryMemberfnm:SingleClassMBSREMICMegasMember2023-12-310000310522us-gaap:VariableInterestEntityNotPrimaryBeneficiaryMember2024-04-012024-06-300000310522us-gaap:VariableInterestEntityNotPrimaryBeneficiaryMember2023-04-012023-06-300000310522us-gaap:VariableInterestEntityNotPrimaryBeneficiaryMember2024-01-012024-06-300000310522us-gaap:VariableInterestEntityNotPrimaryBeneficiaryMember2023-01-012023-06-300000310522srt:SingleFamilyMember2024-06-300000310522srt:SingleFamilyMember2023-12-310000310522srt:MultifamilyMember2024-06-300000310522srt:MultifamilyMember2023-12-310000310522fnm:MortgageLoansMember2024-06-300000310522fnm:MortgageLoansMember2023-12-310000310522srt:SingleFamilyMember2024-04-012024-06-300000310522srt:SingleFamilyMember2023-04-012023-06-300000310522srt:SingleFamilyMember2024-01-012024-06-300000310522srt:SingleFamilyMember2023-01-012023-06-300000310522srt:MultifamilyMember2024-04-012024-06-300000310522srt:MultifamilyMember2023-04-012023-06-300000310522srt:MultifamilyMember2024-01-012024-06-300000310522srt:MultifamilyMember2023-01-012023-06-300000310522srt:SingleFamilyMember2024-01-012024-06-300000310522srt:SingleFamilyMember2024-04-012024-06-300000310522srt:SingleFamilyMember2023-04-012023-06-300000310522srt:SingleFamilyMemberus-gaap:FixedRateResidentialMortgageMemberus-gaap:FinancingReceivables30To59DaysPastDueMember2024-06-300000310522srt:SingleFamilyMemberus-gaap:FinancingReceivables60To89DaysPastDueMemberus-gaap:FixedRateResidentialMortgageMember2024-06-300000310522srt:SingleFamilyMemberus-gaap:FinancingReceivablesEqualToGreaterThan90DaysPastDueMemberus-gaap:FixedRateResidentialMortgageMember2024-06-300000310522srt:SingleFamilyMemberus-gaap:FinancialAssetPastDueMemberus-gaap:FixedRateResidentialMortgageMember2024-06-300000310522srt:SingleFamilyMemberus-gaap:FixedRateResidentialMortgageMemberus-gaap:FinancialAssetNotPastDueMember2024-06-300000310522srt:SingleFamilyMemberus-gaap:FixedRateResidentialMortgageMember2024-06-300000310522srt:SingleFamilyMemberfnm:FixedRateResidentialMortgage15YearMemberus-gaap:FinancingReceivables30To59DaysPastDueMember2024-06-300000310522srt:SingleFamilyMemberus-gaap:FinancingReceivables60To89DaysPastDueMemberfnm:FixedRateResidentialMortgage15YearMember2024-06-300000310522srt:SingleFamilyMemberus-gaap:FinancingReceivablesEqualToGreaterThan90DaysPastDueMemberfnm:FixedRateResidentialMortgage15YearMember2024-06-300000310522srt:SingleFamilyMemberfnm:FixedRateResidentialMortgage15YearMemberus-gaap:FinancialAssetPastDueMember2024-06-300000310522srt:SingleFamilyMemberfnm:FixedRateResidentialMortgage15YearMemberus-gaap:FinancialAssetNotPastDueMember2024-06-300000310522srt:SingleFamilyMemberfnm:FixedRateResidentialMortgage15YearMember2024-06-300000310522us-gaap:AdjustableRateResidentialMortgageMembersrt:SingleFamilyMemberus-gaap:FinancingReceivables30To59DaysPastDueMember2024-06-300000310522us-gaap:AdjustableRateResidentialMortgageMembersrt:SingleFamilyMemberus-gaap:FinancingReceivables60To89DaysPastDueMember2024-06-300000310522us-gaap:AdjustableRateResidentialMortgageMembersrt:SingleFamilyMemberus-gaap:FinancingReceivablesEqualToGreaterThan90DaysPastDueMember2024-06-300000310522us-gaap:AdjustableRateResidentialMortgageMembersrt:SingleFamilyMemberus-gaap:FinancialAssetPastDueMember2024-06-300000310522us-gaap:AdjustableRateResidentialMortgageMembersrt:SingleFamilyMemberus-gaap:FinancialAssetNotPastDueMember2024-06-300000310522us-gaap:AdjustableRateResidentialMortgageMembersrt:SingleFamilyMember2024-06-300000310522fnm:OtherMortgageLoanMembersrt:SingleFamilyMemberus-gaap:FinancingReceivables30To59DaysPastDueMember2024-06-300000310522fnm:OtherMortgageLoanMembersrt:SingleFamilyMemberus-gaap:FinancingReceivables60To89DaysPastDueMember2024-06-300000310522fnm:OtherMortgageLoanMembersrt:SingleFamilyMemberus-gaap:FinancingReceivablesEqualToGreaterThan90DaysPastDueMember2024-06-300000310522fnm:OtherMortgageLoanMembersrt:SingleFamilyMemberus-gaap:FinancialAssetPastDueMember2024-06-300000310522fnm:OtherMortgageLoanMembersrt:SingleFamilyMemberus-gaap:FinancialAssetNotPastDueMember2024-06-300000310522fnm:OtherMortgageLoanMembersrt:SingleFamilyMember2024-06-300000310522srt:SingleFamilyMemberus-gaap:FinancingReceivables30To59DaysPastDueMember2024-06-300000310522srt:SingleFamilyMemberus-gaap:FinancingReceivables60To89DaysPastDueMember2024-06-300000310522srt:SingleFamilyMemberus-gaap:FinancingReceivablesEqualToGreaterThan90DaysPastDueMember2024-06-300000310522srt:SingleFamilyMemberus-gaap:FinancialAssetPastDueMember2024-06-300000310522srt:SingleFamilyMemberus-gaap:FinancialAssetNotPastDueMember2024-06-300000310522srt:MultifamilyMemberus-gaap:FinancingReceivables30To59DaysPastDueMember2024-06-300000310522us-gaap:FinancingReceivablesEqualToGreaterThan90DaysPastDueMembersrt:MultifamilyMember2024-06-300000310522srt:MultifamilyMemberus-gaap:FinancialAssetPastDueMember2024-06-300000310522srt:MultifamilyMemberus-gaap:FinancialAssetNotPastDueMember2024-06-300000310522us-gaap:FinancingReceivables30To59DaysPastDueMember2024-06-300000310522us-gaap:FinancingReceivables60To89DaysPastDueMember2024-06-300000310522us-gaap:FinancingReceivablesEqualToGreaterThan90DaysPastDueMember2024-06-300000310522us-gaap:FinancialAssetPastDueMember2024-06-300000310522us-gaap:FinancialAssetNotPastDueMember2024-06-300000310522srt:SingleFamilyMemberus-gaap:FixedRateResidentialMortgageMemberus-gaap:FinancingReceivables30To59DaysPastDueMember2023-12-310000310522srt:SingleFamilyMemberus-gaap:FinancingReceivables60To89DaysPastDueMemberus-gaap:FixedRateResidentialMortgageMember2023-12-310000310522srt:SingleFamilyMemberus-gaap:FinancingReceivablesEqualToGreaterThan90DaysPastDueMemberus-gaap:FixedRateResidentialMortgageMember2023-12-310000310522srt:SingleFamilyMemberus-gaap:FinancialAssetPastDueMemberus-gaap:FixedRateResidentialMortgageMember2023-12-310000310522srt:SingleFamilyMemberus-gaap:FixedRateResidentialMortgageMemberus-gaap:FinancialAssetNotPastDueMember2023-12-310000310522srt:SingleFamilyMemberus-gaap:FixedRateResidentialMortgageMember2023-12-310000310522srt:SingleFamilyMemberfnm:FixedRateResidentialMortgage15YearMemberus-gaap:FinancingReceivables30To59DaysPastDueMember2023-12-310000310522srt:SingleFamilyMemberus-gaap:FinancingReceivables60To89DaysPastDueMemberfnm:FixedRateResidentialMortgage15YearMember2023-12-310000310522srt:SingleFamilyMemberus-gaap:FinancingReceivablesEqualToGreaterThan90DaysPastDueMemberfnm:FixedRateResidentialMortgage15YearMember2023-12-310000310522srt:SingleFamilyMemberfnm:FixedRateResidentialMortgage15YearMemberus-gaap:FinancialAssetPastDueMember2023-12-310000310522srt:SingleFamilyMemberfnm:FixedRateResidentialMortgage15YearMemberus-gaap:FinancialAssetNotPastDueMember2023-12-310000310522srt:SingleFamilyMemberfnm:FixedRateResidentialMortgage15YearMember2023-12-310000310522us-gaap:AdjustableRateResidentialMortgageMembersrt:SingleFamilyMemberus-gaap:FinancingReceivables30To59DaysPastDueMember2023-12-310000310522us-gaap:AdjustableRateResidentialMortgageMembersrt:SingleFamilyMemberus-gaap:FinancingReceivables60To89DaysPastDueMember2023-12-310000310522us-gaap:AdjustableRateResidentialMortgageMembersrt:SingleFamilyMemberus-gaap:FinancingReceivablesEqualToGreaterThan90DaysPastDueMember2023-12-310000310522us-gaap:AdjustableRateResidentialMortgageMembersrt:SingleFamilyMemberus-gaap:FinancialAssetPastDueMember2023-12-310000310522us-gaap:AdjustableRateResidentialMortgageMembersrt:SingleFamilyMemberus-gaap:FinancialAssetNotPastDueMember2023-12-310000310522us-gaap:AdjustableRateResidentialMortgageMembersrt:SingleFamilyMember2023-12-310000310522fnm:OtherMortgageLoanMembersrt:SingleFamilyMemberus-gaap:FinancingReceivables30To59DaysPastDueMember2023-12-310000310522fnm:OtherMortgageLoanMembersrt:SingleFamilyMemberus-gaap:FinancingReceivables60To89DaysPastDueMember2023-12-310000310522fnm:OtherMortgageLoanMembersrt:SingleFamilyMemberus-gaap:FinancingReceivablesEqualToGreaterThan90DaysPastDueMember2023-12-310000310522fnm:OtherMortgageLoanMembersrt:SingleFamilyMemberus-gaap:FinancialAssetPastDueMember2023-12-310000310522fnm:OtherMortgageLoanMembersrt:SingleFamilyMemberus-gaap:FinancialAssetNotPastDueMember2023-12-310000310522fnm:OtherMortgageLoanMembersrt:SingleFamilyMember2023-12-310000310522srt:SingleFamilyMemberus-gaap:FinancingReceivables30To59DaysPastDueMember2023-12-310000310522srt:SingleFamilyMemberus-gaap:FinancingReceivables60To89DaysPastDueMember2023-12-310000310522srt:SingleFamilyMemberus-gaap:FinancingReceivablesEqualToGreaterThan90DaysPastDueMember2023-12-310000310522srt:SingleFamilyMemberus-gaap:FinancialAssetPastDueMember2023-12-310000310522srt:SingleFamilyMemberus-gaap:FinancialAssetNotPastDueMember2023-12-310000310522srt:MultifamilyMemberus-gaap:FinancingReceivables30To59DaysPastDueMember2023-12-310000310522us-gaap:FinancingReceivablesEqualToGreaterThan90DaysPastDueMembersrt:MultifamilyMember2023-12-310000310522srt:MultifamilyMemberus-gaap:FinancialAssetPastDueMember2023-12-310000310522srt:MultifamilyMemberus-gaap:FinancialAssetNotPastDueMember2023-12-310000310522us-gaap:FinancingReceivables30To59DaysPastDueMember2023-12-310000310522us-gaap:FinancingReceivables60To89DaysPastDueMember2023-12-310000310522us-gaap:FinancingReceivablesEqualToGreaterThan90DaysPastDueMember2023-12-310000310522us-gaap:FinancialAssetPastDueMember2023-12-310000310522us-gaap:FinancialAssetNotPastDueMember2023-12-310000310522srt:SingleFamilyMembersrt:MinimumMember2024-01-012024-06-300000310522srt:MultifamilyMembersrt:MinimumMember2024-01-012024-06-300000310522srt:MultifamilyMembersrt:MaximumMember2024-01-012024-06-300000310522srt:SingleFamilyMemberfnm:EstimatedMarkToMarketLoanToValueRatioLessThanOrEqualTo80PercentMemberus-gaap:FixedRateResidentialMortgageMember2024-06-300000310522srt:SingleFamilyMemberfnm:EstimatedMarkToMarketLoanToValueRatioGreaterThan80PercentAndLessThanOrEqualTo90PercentMemberus-gaap:FixedRateResidentialMortgageMember2024-06-300000310522srt:SingleFamilyMemberfnm:EstimatedMarkToMarketLoanToValueRatioGreaterThan90PercentAndLessThanOrEqualTo100PercentMemberus-gaap:FixedRateResidentialMortgageMember2024-06-300000310522fnm:EstimatedMarkToMarketLoanToValueRatioGreaterThan100PercentLoansRecordedInvestmentMembersrt:SingleFamilyMemberus-gaap:FixedRateResidentialMortgageMember2024-06-300000310522srt:SingleFamilyMemberus-gaap:FixedRateResidentialMortgageMember2024-01-012024-06-300000310522srt:SingleFamilyMemberfnm:EstimatedMarkToMarketLoanToValueRatioLessThanOrEqualTo80PercentMemberfnm:FixedRateResidentialMortgage15YearMember2024-06-300000310522srt:SingleFamilyMemberfnm:FixedRateResidentialMortgage15YearMemberfnm:EstimatedMarkToMarketLoanToValueRatioGreaterThan80PercentAndLessThanOrEqualTo90PercentMember2024-06-300000310522srt:SingleFamilyMemberfnm:FixedRateResidentialMortgage15YearMemberfnm:EstimatedMarkToMarketLoanToValueRatioGreaterThan90PercentAndLessThanOrEqualTo100PercentMember2024-06-300000310522fnm:EstimatedMarkToMarketLoanToValueRatioGreaterThan100PercentLoansRecordedInvestmentMembersrt:SingleFamilyMemberfnm:FixedRateResidentialMortgage15YearMember2024-06-300000310522srt:SingleFamilyMemberfnm:FixedRateResidentialMortgage15YearMember2024-01-012024-06-300000310522us-gaap:AdjustableRateResidentialMortgageMembersrt:SingleFamilyMemberfnm:EstimatedMarkToMarketLoanToValueRatioLessThanOrEqualTo80PercentMember2024-06-300000310522us-gaap:AdjustableRateResidentialMortgageMembersrt:SingleFamilyMemberfnm:EstimatedMarkToMarketLoanToValueRatioGreaterThan80PercentAndLessThanOrEqualTo90PercentMember2024-06-300000310522us-gaap:AdjustableRateResidentialMortgageMembersrt:SingleFamilyMemberfnm:EstimatedMarkToMarketLoanToValueRatioGreaterThan90PercentAndLessThanOrEqualTo100PercentMember2024-06-300000310522fnm:EstimatedMarkToMarketLoanToValueRatioGreaterThan100PercentLoansRecordedInvestmentMemberus-gaap:AdjustableRateResidentialMortgageMembersrt:SingleFamilyMember2024-06-300000310522us-gaap:AdjustableRateResidentialMortgageMembersrt:SingleFamilyMember2024-01-012024-06-300000310522fnm:OtherMortgageLoanMembersrt:SingleFamilyMemberfnm:EstimatedMarkToMarketLoanToValueRatioLessThanOrEqualTo80PercentMember2024-06-300000310522fnm:OtherMortgageLoanMembersrt:SingleFamilyMemberfnm:EstimatedMarkToMarketLoanToValueRatioGreaterThan80PercentAndLessThanOrEqualTo90PercentMember2024-06-300000310522fnm:OtherMortgageLoanMembersrt:SingleFamilyMemberfnm:EstimatedMarkToMarketLoanToValueRatioGreaterThan90PercentAndLessThanOrEqualTo100PercentMember2024-06-300000310522fnm:OtherMortgageLoanMemberfnm:EstimatedMarkToMarketLoanToValueRatioGreaterThan100PercentLoansRecordedInvestmentMembersrt:SingleFamilyMember2024-06-300000310522fnm:OtherMortgageLoanMembersrt:SingleFamilyMember2024-01-012024-06-300000310522srt:SingleFamilyMemberfnm:EstimatedMarkToMarketLoanToValueRatioLessThanOrEqualTo80PercentMember2024-06-300000310522srt:SingleFamilyMemberfnm:EstimatedMarkToMarketLoanToValueRatioGreaterThan80PercentAndLessThanOrEqualTo90PercentMember2024-06-300000310522srt:SingleFamilyMemberfnm:EstimatedMarkToMarketLoanToValueRatioGreaterThan90PercentAndLessThanOrEqualTo100PercentMember2024-06-300000310522fnm:EstimatedMarkToMarketLoanToValueRatioGreaterThan100PercentLoansRecordedInvestmentMembersrt:SingleFamilyMember2024-06-300000310522srt:SingleFamilyMemberfnm:EstimatedMarkToMarketLoanToValueRatioLessThanOrEqualTo80PercentMemberus-gaap:FixedRateResidentialMortgageMember2023-12-310000310522srt:SingleFamilyMemberfnm:EstimatedMarkToMarketLoanToValueRatioGreaterThan80PercentAndLessThanOrEqualTo90PercentMemberus-gaap:FixedRateResidentialMortgageMember2023-12-310000310522srt:SingleFamilyMemberfnm:EstimatedMarkToMarketLoanToValueRatioGreaterThan90PercentAndLessThanOrEqualTo100PercentMemberus-gaap:FixedRateResidentialMortgageMember2023-12-310000310522fnm:EstimatedMarkToMarketLoanToValueRatioGreaterThan100PercentLoansRecordedInvestmentMembersrt:SingleFamilyMemberus-gaap:FixedRateResidentialMortgageMember2023-12-310000310522srt:SingleFamilyMemberus-gaap:FixedRateResidentialMortgageMember2023-01-012023-12-310000310522srt:SingleFamilyMemberfnm:EstimatedMarkToMarketLoanToValueRatioLessThanOrEqualTo80PercentMemberfnm:FixedRateResidentialMortgage15YearMember2023-12-310000310522srt:SingleFamilyMemberfnm:FixedRateResidentialMortgage15YearMemberfnm:EstimatedMarkToMarketLoanToValueRatioGreaterThan80PercentAndLessThanOrEqualTo90PercentMember2023-12-310000310522srt:SingleFamilyMemberfnm:FixedRateResidentialMortgage15YearMemberfnm:EstimatedMarkToMarketLoanToValueRatioGreaterThan90PercentAndLessThanOrEqualTo100PercentMember2023-12-310000310522fnm:EstimatedMarkToMarketLoanToValueRatioGreaterThan100PercentLoansRecordedInvestmentMembersrt:SingleFamilyMemberfnm:FixedRateResidentialMortgage15YearMember2023-12-310000310522srt:SingleFamilyMemberfnm:FixedRateResidentialMortgage15YearMember2023-01-012023-12-310000310522us-gaap:AdjustableRateResidentialMortgageMembersrt:SingleFamilyMemberfnm:EstimatedMarkToMarketLoanToValueRatioLessThanOrEqualTo80PercentMember2023-12-310000310522us-gaap:AdjustableRateResidentialMortgageMembersrt:SingleFamilyMemberfnm:EstimatedMarkToMarketLoanToValueRatioGreaterThan80PercentAndLessThanOrEqualTo90PercentMember2023-12-310000310522us-gaap:AdjustableRateResidentialMortgageMembersrt:SingleFamilyMemberfnm:EstimatedMarkToMarketLoanToValueRatioGreaterThan90PercentAndLessThanOrEqualTo100PercentMember2023-12-310000310522fnm:EstimatedMarkToMarketLoanToValueRatioGreaterThan100PercentLoansRecordedInvestmentMemberus-gaap:AdjustableRateResidentialMortgageMembersrt:SingleFamilyMember2023-12-310000310522us-gaap:AdjustableRateResidentialMortgageMembersrt:SingleFamilyMember2023-01-012023-12-310000310522fnm:OtherMortgageLoanMembersrt:SingleFamilyMemberfnm:EstimatedMarkToMarketLoanToValueRatioLessThanOrEqualTo80PercentMember2023-12-310000310522fnm:OtherMortgageLoanMembersrt:SingleFamilyMemberfnm:EstimatedMarkToMarketLoanToValueRatioGreaterThan80PercentAndLessThanOrEqualTo90PercentMember2023-12-310000310522fnm:OtherMortgageLoanMembersrt:SingleFamilyMemberfnm:EstimatedMarkToMarketLoanToValueRatioGreaterThan90PercentAndLessThanOrEqualTo100PercentMember2023-12-310000310522fnm:OtherMortgageLoanMemberfnm:EstimatedMarkToMarketLoanToValueRatioGreaterThan100PercentLoansRecordedInvestmentMembersrt:SingleFamilyMember2023-12-310000310522fnm:OtherMortgageLoanMembersrt:SingleFamilyMember2023-01-012023-12-310000310522srt:SingleFamilyMemberfnm:EstimatedMarkToMarketLoanToValueRatioLessThanOrEqualTo80PercentMember2023-12-310000310522srt:SingleFamilyMemberfnm:EstimatedMarkToMarketLoanToValueRatioGreaterThan80PercentAndLessThanOrEqualTo90PercentMember2023-12-310000310522srt:SingleFamilyMemberfnm:EstimatedMarkToMarketLoanToValueRatioGreaterThan90PercentAndLessThanOrEqualTo100PercentMember2023-12-310000310522fnm:EstimatedMarkToMarketLoanToValueRatioGreaterThan100PercentLoansRecordedInvestmentMembersrt:SingleFamilyMember2023-12-310000310522srt:SingleFamilyMember2023-01-012023-12-310000310522srt:SingleFamilyMemberus-gaap:UsGovernmentAgencyInsuredLoansMember2024-06-300000310522srt:SingleFamilyMemberus-gaap:UsGovernmentAgencyInsuredLoansMember2023-12-310000310522srt:SingleFamilyMemberus-gaap:UsGovernmentAgencyInsuredLoansMember2024-04-012024-06-300000310522srt:SingleFamilyMemberus-gaap:UsGovernmentAgencyInsuredLoansMember2023-01-012023-12-310000310522us-gaap:PassMembersrt:MultifamilyMember2024-06-300000310522us-gaap:SpecialMentionMembersrt:MultifamilyMember2024-06-300000310522srt:MultifamilyMemberus-gaap:SubstandardMember2024-06-300000310522us-gaap:DoubtfulMembersrt:MultifamilyMember2024-06-300000310522srt:MultifamilyMember2024-06-300000310522us-gaap:UnlikelyToBeCollectedFinancingReceivableMembersrt:MultifamilyMember2024-06-300000310522us-gaap:PassMembersrt:MultifamilyMember2023-12-310000310522us-gaap:SpecialMentionMembersrt:MultifamilyMember2023-12-310000310522srt:MultifamilyMemberus-gaap:SubstandardMember2023-12-310000310522us-gaap:DoubtfulMembersrt:MultifamilyMember2023-12-310000310522srt:MultifamilyMember2023-12-310000310522us-gaap:UnlikelyToBeCollectedFinancingReceivableMembersrt:MultifamilyMember2023-12-310000310522srt:MultifamilyMemberus-gaap:SubstandardMemberfnm:SeniorHousingMember2024-06-300000310522srt:MultifamilyMemberus-gaap:SubstandardMemberfnm:SeniorHousingMember2023-12-310000310522fnm:ForbearancePlanMembersrt:SingleFamilyMemberus-gaap:FixedRateResidentialMortgageMember2024-04-012024-06-300000310522us-gaap:PaymentDeferralMembersrt:SingleFamilyMemberus-gaap:FixedRateResidentialMortgageMember2024-04-012024-06-300000310522fnm:TrialModificationAndRepaymentPlansMembersrt:SingleFamilyMemberus-gaap:FixedRateResidentialMortgageMember2024-04-012024-06-300000310522srt:SingleFamilyMemberus-gaap:FixedRateResidentialMortgageMemberfnm:PaymentDeferralAndExtendedMaturityMember2024-04-012024-06-300000310522srt:SingleFamilyMemberus-gaap:FixedRateResidentialMortgageMemberfnm:PaymentDeferralExtendedMaturityAndContractualInterestRateReductionMember2024-04-012024-06-300000310522srt:SingleFamilyMemberus-gaap:FixedRateResidentialMortgageMember2024-04-012024-06-300000310522fnm:ForbearancePlanMembersrt:SingleFamilyMemberfnm:FixedRateResidentialMortgage15YearMember2024-04-012024-06-300000310522us-gaap:PaymentDeferralMembersrt:SingleFamilyMemberfnm:FixedRateResidentialMortgage15YearMember2024-04-012024-06-300000310522fnm:TrialModificationAndRepaymentPlansMembersrt:SingleFamilyMemberfnm:FixedRateResidentialMortgage15YearMember2024-04-012024-06-300000310522srt:SingleFamilyMemberfnm:FixedRateResidentialMortgage15YearMemberfnm:PaymentDeferralAndExtendedMaturityMember2024-04-012024-06-300000310522srt:SingleFamilyMemberfnm:FixedRateResidentialMortgage15YearMemberfnm:PaymentDeferralExtendedMaturityAndContractualInterestRateReductionMember2024-04-012024-06-300000310522srt:SingleFamilyMemberfnm:FixedRateResidentialMortgage15YearMember2024-04-012024-06-300000310522fnm:ForbearancePlanMemberus-gaap:AdjustableRateResidentialMortgageMembersrt:SingleFamilyMember2024-04-012024-06-300000310522us-gaap:AdjustableRateResidentialMortgageMemberus-gaap:PaymentDeferralMembersrt:SingleFamilyMember2024-04-012024-06-300000310522fnm:TrialModificationAndRepaymentPlansMemberus-gaap:AdjustableRateResidentialMortgageMembersrt:SingleFamilyMember2024-04-012024-06-300000310522us-gaap:AdjustableRateResidentialMortgageMembersrt:SingleFamilyMemberfnm:PaymentDeferralAndExtendedMaturityMember2024-04-012024-06-300000310522us-gaap:AdjustableRateResidentialMortgageMembersrt:SingleFamilyMemberfnm:PaymentDeferralExtendedMaturityAndContractualInterestRateReductionMember2024-04-012024-06-300000310522us-gaap:AdjustableRateResidentialMortgageMembersrt:SingleFamilyMember2024-04-012024-06-300000310522fnm:ForbearancePlanMemberfnm:OtherMortgageLoanMembersrt:SingleFamilyMember2024-04-012024-06-300000310522fnm:OtherMortgageLoanMemberus-gaap:PaymentDeferralMembersrt:SingleFamilyMember2024-04-012024-06-300000310522fnm:OtherMortgageLoanMemberfnm:TrialModificationAndRepaymentPlansMembersrt:SingleFamilyMember2024-04-012024-06-300000310522fnm:OtherMortgageLoanMembersrt:SingleFamilyMemberfnm:PaymentDeferralAndExtendedMaturityMember2024-04-012024-06-300000310522fnm:OtherMortgageLoanMembersrt:SingleFamilyMemberfnm:PaymentDeferralExtendedMaturityAndContractualInterestRateReductionMember2024-04-012024-06-300000310522fnm:OtherMortgageLoanMembersrt:SingleFamilyMember2024-04-012024-06-300000310522fnm:ForbearancePlanMembersrt:SingleFamilyMember2024-04-012024-06-300000310522us-gaap:PaymentDeferralMembersrt:SingleFamilyMember2024-04-012024-06-300000310522fnm:TrialModificationAndRepaymentPlansMembersrt:SingleFamilyMember2024-04-012024-06-300000310522srt:SingleFamilyMemberfnm:PaymentDeferralAndExtendedMaturityMember2024-04-012024-06-300000310522srt:SingleFamilyMemberfnm:PaymentDeferralExtendedMaturityAndContractualInterestRateReductionMember2024-04-012024-06-300000310522fnm:ForbearancePlanMembersrt:MultifamilyMember2024-04-012024-06-300000310522us-gaap:PaymentDeferralMembersrt:MultifamilyMember2024-04-012024-06-300000310522fnm:TrialModificationAndRepaymentPlansMembersrt:MultifamilyMember2024-04-012024-06-300000310522srt:MultifamilyMemberfnm:PaymentDeferralAndExtendedMaturityMember2024-04-012024-06-300000310522srt:MultifamilyMemberfnm:PaymentDeferralExtendedMaturityAndContractualInterestRateReductionMember2024-04-012024-06-300000310522fnm:ForbearancePlanMember2024-04-012024-06-300000310522us-gaap:PaymentDeferralMember2024-04-012024-06-300000310522fnm:TrialModificationAndRepaymentPlansMember2024-04-012024-06-300000310522fnm:PaymentDeferralAndExtendedMaturityMember2024-04-012024-06-300000310522fnm:PaymentDeferralExtendedMaturityAndContractualInterestRateReductionMember2024-04-012024-06-300000310522fnm:ForbearancePlanMembersrt:SingleFamilyMemberus-gaap:FixedRateResidentialMortgageMember2024-01-012024-06-300000310522us-gaap:PaymentDeferralMembersrt:SingleFamilyMemberus-gaap:FixedRateResidentialMortgageMember2024-01-012024-06-300000310522fnm:TrialModificationAndRepaymentPlansMembersrt:SingleFamilyMemberus-gaap:FixedRateResidentialMortgageMember2024-01-012024-06-300000310522srt:SingleFamilyMemberus-gaap:FixedRateResidentialMortgageMemberfnm:PaymentDeferralAndExtendedMaturityMember2024-01-012024-06-300000310522srt:SingleFamilyMemberus-gaap:FixedRateResidentialMortgageMemberfnm:PaymentDeferralExtendedMaturityAndContractualInterestRateReductionMember2024-01-012024-06-300000310522fnm:ForbearancePlanMembersrt:SingleFamilyMemberfnm:FixedRateResidentialMortgage15YearMember2024-01-012024-06-300000310522us-gaap:PaymentDeferralMembersrt:SingleFamilyMemberfnm:FixedRateResidentialMortgage15YearMember2024-01-012024-06-300000310522fnm:TrialModificationAndRepaymentPlansMembersrt:SingleFamilyMemberfnm:FixedRateResidentialMortgage15YearMember2024-01-012024-06-300000310522srt:SingleFamilyMemberfnm:FixedRateResidentialMortgage15YearMemberfnm:PaymentDeferralAndExtendedMaturityMember2024-01-012024-06-300000310522srt:SingleFamilyMemberfnm:FixedRateResidentialMortgage15YearMemberfnm:PaymentDeferralExtendedMaturityAndContractualInterestRateReductionMember2024-01-012024-06-300000310522fnm:ForbearancePlanMemberus-gaap:AdjustableRateResidentialMortgageMembersrt:SingleFamilyMember2024-01-012024-06-300000310522us-gaap:AdjustableRateResidentialMortgageMemberus-gaap:PaymentDeferralMembersrt:SingleFamilyMember2024-01-012024-06-300000310522fnm:TrialModificationAndRepaymentPlansMemberus-gaap:AdjustableRateResidentialMortgageMembersrt:SingleFamilyMember2024-01-012024-06-300000310522us-gaap:AdjustableRateResidentialMortgageMembersrt:SingleFamilyMemberfnm:PaymentDeferralAndExtendedMaturityMember2024-01-012024-06-300000310522us-gaap:AdjustableRateResidentialMortgageMembersrt:SingleFamilyMemberfnm:PaymentDeferralExtendedMaturityAndContractualInterestRateReductionMember2024-01-012024-06-300000310522fnm:ForbearancePlanMemberfnm:OtherMortgageLoanMembersrt:SingleFamilyMember2024-01-012024-06-300000310522fnm:OtherMortgageLoanMemberus-gaap:PaymentDeferralMembersrt:SingleFamilyMember2024-01-012024-06-300000310522fnm:OtherMortgageLoanMemberfnm:TrialModificationAndRepaymentPlansMembersrt:SingleFamilyMember2024-01-012024-06-300000310522fnm:OtherMortgageLoanMembersrt:SingleFamilyMemberfnm:PaymentDeferralAndExtendedMaturityMember2024-01-012024-06-300000310522fnm:OtherMortgageLoanMembersrt:SingleFamilyMemberfnm:PaymentDeferralExtendedMaturityAndContractualInterestRateReductionMember2024-01-012024-06-300000310522fnm:ForbearancePlanMembersrt:SingleFamilyMember2024-01-012024-06-300000310522us-gaap:PaymentDeferralMembersrt:SingleFamilyMember2024-01-012024-06-300000310522fnm:TrialModificationAndRepaymentPlansMembersrt:SingleFamilyMember2024-01-012024-06-300000310522srt:SingleFamilyMemberfnm:PaymentDeferralAndExtendedMaturityMember2024-01-012024-06-300000310522srt:SingleFamilyMemberfnm:PaymentDeferralExtendedMaturityAndContractualInterestRateReductionMember2024-01-012024-06-300000310522fnm:ForbearancePlanMembersrt:MultifamilyMember2024-01-012024-06-300000310522us-gaap:PaymentDeferralMembersrt:MultifamilyMember2024-01-012024-06-300000310522fnm:TrialModificationAndRepaymentPlansMembersrt:MultifamilyMember2024-01-012024-06-300000310522srt:MultifamilyMemberfnm:PaymentDeferralAndExtendedMaturityMember2024-01-012024-06-300000310522srt:MultifamilyMemberfnm:PaymentDeferralExtendedMaturityAndContractualInterestRateReductionMember2024-01-012024-06-300000310522fnm:ForbearancePlanMember2024-01-012024-06-300000310522us-gaap:PaymentDeferralMember2024-01-012024-06-300000310522fnm:TrialModificationAndRepaymentPlansMember2024-01-012024-06-300000310522fnm:PaymentDeferralAndExtendedMaturityMember2024-01-012024-06-300000310522fnm:PaymentDeferralExtendedMaturityAndContractualInterestRateReductionMember2024-01-012024-06-300000310522fnm:ForbearancePlanMembersrt:SingleFamilyMemberus-gaap:FixedRateResidentialMortgageMember2023-04-012023-06-300000310522us-gaap:PaymentDeferralMembersrt:SingleFamilyMemberus-gaap:FixedRateResidentialMortgageMember2023-04-012023-06-300000310522fnm:TrialModificationAndRepaymentPlansMembersrt:SingleFamilyMemberus-gaap:FixedRateResidentialMortgageMember2023-04-012023-06-300000310522srt:SingleFamilyMemberus-gaap:FixedRateResidentialMortgageMemberfnm:PaymentDeferralAndExtendedMaturityMember2023-04-012023-06-300000310522srt:SingleFamilyMemberus-gaap:FixedRateResidentialMortgageMemberfnm:PaymentDeferralExtendedMaturityAndContractualInterestRateReductionMember2023-04-012023-06-300000310522srt:SingleFamilyMemberus-gaap:FixedRateResidentialMortgageMember2023-04-012023-06-300000310522fnm:ForbearancePlanMembersrt:SingleFamilyMemberfnm:FixedRateResidentialMortgage15YearMember2023-04-012023-06-300000310522us-gaap:PaymentDeferralMembersrt:SingleFamilyMemberfnm:FixedRateResidentialMortgage15YearMember2023-04-012023-06-300000310522fnm:TrialModificationAndRepaymentPlansMembersrt:SingleFamilyMemberfnm:FixedRateResidentialMortgage15YearMember2023-04-012023-06-300000310522srt:SingleFamilyMemberfnm:FixedRateResidentialMortgage15YearMemberfnm:PaymentDeferralAndExtendedMaturityMember2023-04-012023-06-300000310522srt:SingleFamilyMemberfnm:FixedRateResidentialMortgage15YearMemberfnm:PaymentDeferralExtendedMaturityAndContractualInterestRateReductionMember2023-04-012023-06-300000310522srt:SingleFamilyMemberfnm:FixedRateResidentialMortgage15YearMember2023-04-012023-06-300000310522fnm:ForbearancePlanMemberus-gaap:AdjustableRateResidentialMortgageMembersrt:SingleFamilyMember2023-04-012023-06-300000310522us-gaap:AdjustableRateResidentialMortgageMemberus-gaap:PaymentDeferralMembersrt:SingleFamilyMember2023-04-012023-06-300000310522fnm:TrialModificationAndRepaymentPlansMemberus-gaap:AdjustableRateResidentialMortgageMembersrt:SingleFamilyMember2023-04-012023-06-300000310522us-gaap:AdjustableRateResidentialMortgageMembersrt:SingleFamilyMemberfnm:PaymentDeferralAndExtendedMaturityMember2023-04-012023-06-300000310522us-gaap:AdjustableRateResidentialMortgageMembersrt:SingleFamilyMemberfnm:PaymentDeferralExtendedMaturityAndContractualInterestRateReductionMember2023-04-012023-06-300000310522us-gaap:AdjustableRateResidentialMortgageMembersrt:SingleFamilyMember2023-04-012023-06-300000310522fnm:ForbearancePlanMemberfnm:OtherMortgageLoanMembersrt:SingleFamilyMember2023-04-012023-06-300000310522fnm:OtherMortgageLoanMemberus-gaap:PaymentDeferralMembersrt:SingleFamilyMember2023-04-012023-06-300000310522fnm:OtherMortgageLoanMemberfnm:TrialModificationAndRepaymentPlansMembersrt:SingleFamilyMember2023-04-012023-06-300000310522fnm:OtherMortgageLoanMembersrt:SingleFamilyMemberfnm:PaymentDeferralAndExtendedMaturityMember2023-04-012023-06-300000310522fnm:OtherMortgageLoanMembersrt:SingleFamilyMemberfnm:PaymentDeferralExtendedMaturityAndContractualInterestRateReductionMember2023-04-012023-06-300000310522fnm:OtherMortgageLoanMembersrt:SingleFamilyMember2023-04-012023-06-300000310522fnm:ForbearancePlanMembersrt:SingleFamilyMember2023-04-012023-06-300000310522us-gaap:PaymentDeferralMembersrt:SingleFamilyMember2023-04-012023-06-300000310522fnm:TrialModificationAndRepaymentPlansMembersrt:SingleFamilyMember2023-04-012023-06-300000310522srt:SingleFamilyMemberfnm:PaymentDeferralAndExtendedMaturityMember2023-04-012023-06-300000310522srt:SingleFamilyMemberfnm:PaymentDeferralExtendedMaturityAndContractualInterestRateReductionMember2023-04-012023-06-300000310522fnm:ForbearancePlanMembersrt:MultifamilyMember2023-04-012023-06-300000310522us-gaap:PaymentDeferralMembersrt:MultifamilyMember2023-04-012023-06-300000310522fnm:TrialModificationAndRepaymentPlansMembersrt:MultifamilyMember2023-04-012023-06-300000310522srt:MultifamilyMemberfnm:PaymentDeferralAndExtendedMaturityMember2023-04-012023-06-300000310522srt:MultifamilyMemberfnm:PaymentDeferralExtendedMaturityAndContractualInterestRateReductionMember2023-04-012023-06-300000310522fnm:ForbearancePlanMember2023-04-012023-06-300000310522us-gaap:PaymentDeferralMember2023-04-012023-06-300000310522fnm:TrialModificationAndRepaymentPlansMember2023-04-012023-06-300000310522fnm:PaymentDeferralAndExtendedMaturityMember2023-04-012023-06-300000310522fnm:PaymentDeferralExtendedMaturityAndContractualInterestRateReductionMember2023-04-012023-06-300000310522fnm:ForbearancePlanMembersrt:SingleFamilyMemberus-gaap:FixedRateResidentialMortgageMember2023-01-012023-06-300000310522us-gaap:PaymentDeferralMembersrt:SingleFamilyMemberus-gaap:FixedRateResidentialMortgageMember2023-01-012023-06-300000310522fnm:TrialModificationAndRepaymentPlansMembersrt:SingleFamilyMemberus-gaap:FixedRateResidentialMortgageMember2023-01-012023-06-300000310522srt:SingleFamilyMemberus-gaap:FixedRateResidentialMortgageMemberfnm:PaymentDeferralAndExtendedMaturityMember2023-01-012023-06-300000310522srt:SingleFamilyMemberus-gaap:FixedRateResidentialMortgageMemberfnm:PaymentDeferralExtendedMaturityAndContractualInterestRateReductionMember2023-01-012023-06-300000310522srt:SingleFamilyMemberus-gaap:FixedRateResidentialMortgageMember2023-01-012023-06-300000310522fnm:ForbearancePlanMembersrt:SingleFamilyMemberfnm:FixedRateResidentialMortgage15YearMember2023-01-012023-06-300000310522us-gaap:PaymentDeferralMembersrt:SingleFamilyMemberfnm:FixedRateResidentialMortgage15YearMember2023-01-012023-06-300000310522fnm:TrialModificationAndRepaymentPlansMembersrt:SingleFamilyMemberfnm:FixedRateResidentialMortgage15YearMember2023-01-012023-06-300000310522srt:SingleFamilyMemberfnm:FixedRateResidentialMortgage15YearMemberfnm:PaymentDeferralAndExtendedMaturityMember2023-01-012023-06-300000310522srt:SingleFamilyMemberfnm:FixedRateResidentialMortgage15YearMemberfnm:PaymentDeferralExtendedMaturityAndContractualInterestRateReductionMember2023-01-012023-06-300000310522srt:SingleFamilyMemberfnm:FixedRateResidentialMortgage15YearMember2023-01-012023-06-300000310522fnm:ForbearancePlanMemberus-gaap:AdjustableRateResidentialMortgageMembersrt:SingleFamilyMember2023-01-012023-06-300000310522us-gaap:AdjustableRateResidentialMortgageMemberus-gaap:PaymentDeferralMembersrt:SingleFamilyMember2023-01-012023-06-300000310522fnm:TrialModificationAndRepaymentPlansMemberus-gaap:AdjustableRateResidentialMortgageMembersrt:SingleFamilyMember2023-01-012023-06-300000310522us-gaap:AdjustableRateResidentialMortgageMembersrt:SingleFamilyMemberfnm:PaymentDeferralAndExtendedMaturityMember2023-01-012023-06-300000310522us-gaap:AdjustableRateResidentialMortgageMembersrt:SingleFamilyMemberfnm:PaymentDeferralExtendedMaturityAndContractualInterestRateReductionMember2023-01-012023-06-300000310522us-gaap:AdjustableRateResidentialMortgageMembersrt:SingleFamilyMember2023-01-012023-06-300000310522fnm:ForbearancePlanMemberfnm:OtherMortgageLoanMembersrt:SingleFamilyMember2023-01-012023-06-300000310522fnm:OtherMortgageLoanMemberus-gaap:PaymentDeferralMembersrt:SingleFamilyMember2023-01-012023-06-300000310522fnm:OtherMortgageLoanMemberfnm:TrialModificationAndRepaymentPlansMembersrt:SingleFamilyMember2023-01-012023-06-300000310522fnm:OtherMortgageLoanMembersrt:SingleFamilyMemberfnm:PaymentDeferralAndExtendedMaturityMember2023-01-012023-06-300000310522fnm:OtherMortgageLoanMembersrt:SingleFamilyMemberfnm:PaymentDeferralExtendedMaturityAndContractualInterestRateReductionMember2023-01-012023-06-300000310522fnm:OtherMortgageLoanMembersrt:SingleFamilyMember2023-01-012023-06-300000310522fnm:ForbearancePlanMembersrt:SingleFamilyMember2023-01-012023-06-300000310522us-gaap:PaymentDeferralMembersrt:SingleFamilyMember2023-01-012023-06-300000310522fnm:TrialModificationAndRepaymentPlansMembersrt:SingleFamilyMember2023-01-012023-06-300000310522srt:SingleFamilyMemberfnm:PaymentDeferralAndExtendedMaturityMember2023-01-012023-06-300000310522srt:SingleFamilyMemberfnm:PaymentDeferralExtendedMaturityAndContractualInterestRateReductionMember2023-01-012023-06-300000310522fnm:ForbearancePlanMembersrt:MultifamilyMember2023-01-012023-06-300000310522us-gaap:PaymentDeferralMembersrt:MultifamilyMember2023-01-012023-06-300000310522fnm:TrialModificationAndRepaymentPlansMembersrt:MultifamilyMember2023-01-012023-06-300000310522srt:MultifamilyMemberfnm:PaymentDeferralAndExtendedMaturityMember2023-01-012023-06-300000310522srt:MultifamilyMemberfnm:PaymentDeferralExtendedMaturityAndContractualInterestRateReductionMember2023-01-012023-06-300000310522fnm:ForbearancePlanMember2023-01-012023-06-300000310522us-gaap:PaymentDeferralMember2023-01-012023-06-300000310522fnm:TrialModificationAndRepaymentPlansMember2023-01-012023-06-300000310522fnm:PaymentDeferralAndExtendedMaturityMember2023-01-012023-06-300000310522fnm:PaymentDeferralExtendedMaturityAndContractualInterestRateReductionMember2023-01-012023-06-300000310522fnm:ForbearanceAndRepaymentPlansAndTrialModificationMembersrt:SingleFamilyMemberus-gaap:FixedRateResidentialMortgageMemberus-gaap:FinancingReceivables30To59DaysPastDueMember2024-01-012024-06-300000310522fnm:ForbearanceAndRepaymentPlansAndTrialModificationMembersrt:SingleFamilyMemberus-gaap:FinancingReceivables60To89DaysPastDueMemberus-gaap:FixedRateResidentialMortgageMember2024-01-012024-06-300000310522fnm:ForbearanceAndRepaymentPlansAndTrialModificationMembersrt:SingleFamilyMemberus-gaap:FinancingReceivablesEqualToGreaterThan90DaysPastDueMemberus-gaap:FixedRateResidentialMortgageMember2024-01-012024-06-300000310522fnm:ForbearanceAndRepaymentPlansAndTrialModificationMembersrt:SingleFamilyMemberus-gaap:FinancialAssetPastDueMemberus-gaap:FixedRateResidentialMortgageMember2024-01-012024-06-300000310522fnm:ForbearanceAndRepaymentPlansAndTrialModificationMembersrt:SingleFamilyMemberus-gaap:FixedRateResidentialMortgageMemberus-gaap:FinancialAssetNotPastDueMember2024-01-012024-06-300000310522fnm:ForbearanceAndRepaymentPlansAndTrialModificationMembersrt:SingleFamilyMemberus-gaap:FixedRateResidentialMortgageMember2024-01-012024-06-300000310522fnm:ForbearanceAndRepaymentPlansAndTrialModificationMembersrt:SingleFamilyMemberfnm:FixedRateResidentialMortgage15YearMemberus-gaap:FinancingReceivables30To59DaysPastDueMember2024-01-012024-06-300000310522fnm:ForbearanceAndRepaymentPlansAndTrialModificationMembersrt:SingleFamilyMemberus-gaap:FinancingReceivables60To89DaysPastDueMemberfnm:FixedRateResidentialMortgage15YearMember2024-01-012024-06-300000310522fnm:ForbearanceAndRepaymentPlansAndTrialModificationMembersrt:SingleFamilyMemberus-gaap:FinancingReceivablesEqualToGreaterThan90DaysPastDueMemberfnm:FixedRateResidentialMortgage15YearMember2024-01-012024-06-300000310522fnm:ForbearanceAndRepaymentPlansAndTrialModificationMembersrt:SingleFamilyMemberfnm:FixedRateResidentialMortgage15YearMemberus-gaap:FinancialAssetPastDueMember2024-01-012024-06-300000310522fnm:ForbearanceAndRepaymentPlansAndTrialModificationMembersrt:SingleFamilyMemberfnm:FixedRateResidentialMortgage15YearMemberus-gaap:FinancialAssetNotPastDueMember2024-01-012024-06-300000310522fnm:ForbearanceAndRepaymentPlansAndTrialModificationMembersrt:SingleFamilyMemberfnm:FixedRateResidentialMortgage15YearMember2024-01-012024-06-300000310522us-gaap:AdjustableRateResidentialMortgageMemberfnm:ForbearanceAndRepaymentPlansAndTrialModificationMembersrt:SingleFamilyMemberus-gaap:FinancingReceivables30To59DaysPastDueMember2024-01-012024-06-300000310522us-gaap:AdjustableRateResidentialMortgageMemberfnm:ForbearanceAndRepaymentPlansAndTrialModificationMembersrt:SingleFamilyMemberus-gaap:FinancingReceivables60To89DaysPastDueMember2024-01-012024-06-300000310522us-gaap:AdjustableRateResidentialMortgageMemberfnm:ForbearanceAndRepaymentPlansAndTrialModificationMembersrt:SingleFamilyMemberus-gaap:FinancingReceivablesEqualToGreaterThan90DaysPastDueMember2024-01-012024-06-300000310522us-gaap:AdjustableRateResidentialMortgageMemberfnm:ForbearanceAndRepaymentPlansAndTrialModificationMembersrt:SingleFamilyMemberus-gaap:FinancialAssetPastDueMember2024-01-012024-06-300000310522us-gaap:AdjustableRateResidentialMortgageMemberfnm:ForbearanceAndRepaymentPlansAndTrialModificationMembersrt:SingleFamilyMemberus-gaap:FinancialAssetNotPastDueMember2024-01-012024-06-300000310522us-gaap:AdjustableRateResidentialMortgageMemberfnm:ForbearanceAndRepaymentPlansAndTrialModificationMembersrt:SingleFamilyMember2024-01-012024-06-300000310522fnm:OtherMortgageLoanMemberfnm:ForbearanceAndRepaymentPlansAndTrialModificationMembersrt:SingleFamilyMemberus-gaap:FinancingReceivables30To59DaysPastDueMember2024-01-012024-06-300000310522fnm:OtherMortgageLoanMemberfnm:ForbearanceAndRepaymentPlansAndTrialModificationMembersrt:SingleFamilyMemberus-gaap:FinancingReceivables60To89DaysPastDueMember2024-01-012024-06-300000310522fnm:OtherMortgageLoanMemberfnm:ForbearanceAndRepaymentPlansAndTrialModificationMembersrt:SingleFamilyMemberus-gaap:FinancingReceivablesEqualToGreaterThan90DaysPastDueMember2024-01-012024-06-300000310522fnm:OtherMortgageLoanMemberfnm:ForbearanceAndRepaymentPlansAndTrialModificationMembersrt:SingleFamilyMemberus-gaap:FinancialAssetPastDueMember2024-01-012024-06-300000310522fnm:OtherMortgageLoanMemberfnm:ForbearanceAndRepaymentPlansAndTrialModificationMembersrt:SingleFamilyMemberus-gaap:FinancialAssetNotPastDueMember2024-01-012024-06-300000310522fnm:OtherMortgageLoanMemberfnm:ForbearanceAndRepaymentPlansAndTrialModificationMembersrt:SingleFamilyMember2024-01-012024-06-300000310522fnm:ForbearanceAndRepaymentPlansAndTrialModificationMembersrt:SingleFamilyMemberus-gaap:FinancingReceivables30To59DaysPastDueMember2024-01-012024-06-300000310522fnm:ForbearanceAndRepaymentPlansAndTrialModificationMembersrt:SingleFamilyMemberus-gaap:FinancingReceivables60To89DaysPastDueMember2024-01-012024-06-300000310522fnm:ForbearanceAndRepaymentPlansAndTrialModificationMembersrt:SingleFamilyMemberus-gaap:FinancingReceivablesEqualToGreaterThan90DaysPastDueMember2024-01-012024-06-300000310522fnm:ForbearanceAndRepaymentPlansAndTrialModificationMembersrt:SingleFamilyMemberus-gaap:FinancialAssetPastDueMember2024-01-012024-06-300000310522fnm:ForbearanceAndRepaymentPlansAndTrialModificationMembersrt:SingleFamilyMemberus-gaap:FinancialAssetNotPastDueMember2024-01-012024-06-300000310522fnm:ForbearanceAndRepaymentPlansAndTrialModificationMembersrt:SingleFamilyMember2024-01-012024-06-300000310522fnm:ForbearanceAndRepaymentPlansAndTrialModificationMembersrt:MultifamilyMemberus-gaap:FinancingReceivables30To59DaysPastDueMember2024-01-012024-06-300000310522fnm:ForbearanceAndRepaymentPlansAndTrialModificationMemberus-gaap:FinancingReceivablesEqualToGreaterThan90DaysPastDueMembersrt:MultifamilyMember2024-01-012024-06-300000310522fnm:ForbearanceAndRepaymentPlansAndTrialModificationMembersrt:MultifamilyMemberus-gaap:FinancialAssetPastDueMember2024-01-012024-06-300000310522fnm:ForbearanceAndRepaymentPlansAndTrialModificationMembersrt:MultifamilyMemberus-gaap:FinancialAssetNotPastDueMember2024-01-012024-06-300000310522fnm:ForbearanceAndRepaymentPlansAndTrialModificationMembersrt:MultifamilyMember2024-01-012024-06-300000310522fnm:ForbearanceAndRepaymentPlansAndTrialModificationMemberus-gaap:FinancingReceivables30To59DaysPastDueMember2024-01-012024-06-300000310522fnm:ForbearanceAndRepaymentPlansAndTrialModificationMemberus-gaap:FinancingReceivables60To89DaysPastDueMember2024-01-012024-06-300000310522fnm:ForbearanceAndRepaymentPlansAndTrialModificationMemberus-gaap:FinancingReceivablesEqualToGreaterThan90DaysPastDueMember2024-01-012024-06-300000310522fnm:ForbearanceAndRepaymentPlansAndTrialModificationMemberus-gaap:FinancialAssetPastDueMember2024-01-012024-06-300000310522fnm:ForbearanceAndRepaymentPlansAndTrialModificationMemberus-gaap:FinancialAssetNotPastDueMember2024-01-012024-06-300000310522fnm:ForbearanceAndRepaymentPlansAndTrialModificationMember2024-01-012024-06-300000310522fnm:ForbearanceAndRepaymentPlansAndTrialModificationMembersrt:SingleFamilyMemberus-gaap:FixedRateResidentialMortgageMemberus-gaap:FinancingReceivables30To59DaysPastDueMember2023-01-012023-06-300000310522fnm:ForbearanceAndRepaymentPlansAndTrialModificationMembersrt:SingleFamilyMemberus-gaap:FinancingReceivables60To89DaysPastDueMemberus-gaap:FixedRateResidentialMortgageMember2023-01-012023-06-300000310522fnm:ForbearanceAndRepaymentPlansAndTrialModificationMembersrt:SingleFamilyMemberus-gaap:FinancingReceivablesEqualToGreaterThan90DaysPastDueMemberus-gaap:FixedRateResidentialMortgageMember2023-01-012023-06-300000310522fnm:ForbearanceAndRepaymentPlansAndTrialModificationMembersrt:SingleFamilyMemberus-gaap:FinancialAssetPastDueMemberus-gaap:FixedRateResidentialMortgageMember2023-01-012023-06-300000310522fnm:ForbearanceAndRepaymentPlansAndTrialModificationMembersrt:SingleFamilyMemberus-gaap:FixedRateResidentialMortgageMemberus-gaap:FinancialAssetNotPastDueMember2023-01-012023-06-300000310522fnm:ForbearanceAndRepaymentPlansAndTrialModificationMembersrt:SingleFamilyMemberus-gaap:FixedRateResidentialMortgageMember2023-01-012023-06-300000310522fnm:ForbearanceAndRepaymentPlansAndTrialModificationMembersrt:SingleFamilyMemberfnm:FixedRateResidentialMortgage15YearMemberus-gaap:FinancingReceivables30To59DaysPastDueMember2023-01-012023-06-300000310522fnm:ForbearanceAndRepaymentPlansAndTrialModificationMembersrt:SingleFamilyMemberus-gaap:FinancingReceivables60To89DaysPastDueMemberfnm:FixedRateResidentialMortgage15YearMember2023-01-012023-06-300000310522fnm:ForbearanceAndRepaymentPlansAndTrialModificationMembersrt:SingleFamilyMemberus-gaap:FinancingReceivablesEqualToGreaterThan90DaysPastDueMemberfnm:FixedRateResidentialMortgage15YearMember2023-01-012023-06-300000310522fnm:ForbearanceAndRepaymentPlansAndTrialModificationMembersrt:SingleFamilyMemberfnm:FixedRateResidentialMortgage15YearMemberus-gaap:FinancialAssetPastDueMember2023-01-012023-06-300000310522fnm:ForbearanceAndRepaymentPlansAndTrialModificationMembersrt:SingleFamilyMemberfnm:FixedRateResidentialMortgage15YearMemberus-gaap:FinancialAssetNotPastDueMember2023-01-012023-06-300000310522fnm:ForbearanceAndRepaymentPlansAndTrialModificationMembersrt:SingleFamilyMemberfnm:FixedRateResidentialMortgage15YearMember2023-01-012023-06-300000310522us-gaap:AdjustableRateResidentialMortgageMemberfnm:ForbearanceAndRepaymentPlansAndTrialModificationMembersrt:SingleFamilyMemberus-gaap:FinancingReceivables30To59DaysPastDueMember2023-01-012023-06-300000310522us-gaap:AdjustableRateResidentialMortgageMemberfnm:ForbearanceAndRepaymentPlansAndTrialModificationMembersrt:SingleFamilyMemberus-gaap:FinancingReceivables60To89DaysPastDueMember2023-01-012023-06-300000310522us-gaap:AdjustableRateResidentialMortgageMemberfnm:ForbearanceAndRepaymentPlansAndTrialModificationMembersrt:SingleFamilyMemberus-gaap:FinancingReceivablesEqualToGreaterThan90DaysPastDueMember2023-01-012023-06-300000310522us-gaap:AdjustableRateResidentialMortgageMemberfnm:ForbearanceAndRepaymentPlansAndTrialModificationMembersrt:SingleFamilyMemberus-gaap:FinancialAssetPastDueMember2023-01-012023-06-300000310522us-gaap:AdjustableRateResidentialMortgageMemberfnm:ForbearanceAndRepaymentPlansAndTrialModificationMembersrt:SingleFamilyMemberus-gaap:FinancialAssetNotPastDueMember2023-01-012023-06-300000310522us-gaap:AdjustableRateResidentialMortgageMemberfnm:ForbearanceAndRepaymentPlansAndTrialModificationMembersrt:SingleFamilyMember2023-01-012023-06-300000310522fnm:OtherMortgageLoanMemberfnm:ForbearanceAndRepaymentPlansAndTrialModificationMembersrt:SingleFamilyMemberus-gaap:FinancingReceivables30To59DaysPastDueMember2023-01-012023-06-300000310522fnm:OtherMortgageLoanMemberfnm:ForbearanceAndRepaymentPlansAndTrialModificationMembersrt:SingleFamilyMemberus-gaap:FinancingReceivables60To89DaysPastDueMember2023-01-012023-06-300000310522fnm:OtherMortgageLoanMemberfnm:ForbearanceAndRepaymentPlansAndTrialModificationMembersrt:SingleFamilyMemberus-gaap:FinancingReceivablesEqualToGreaterThan90DaysPastDueMember2023-01-012023-06-300000310522fnm:OtherMortgageLoanMemberfnm:ForbearanceAndRepaymentPlansAndTrialModificationMembersrt:SingleFamilyMemberus-gaap:FinancialAssetPastDueMember2023-01-012023-06-300000310522fnm:OtherMortgageLoanMemberfnm:ForbearanceAndRepaymentPlansAndTrialModificationMembersrt:SingleFamilyMemberus-gaap:FinancialAssetNotPastDueMember2023-01-012023-06-300000310522fnm:OtherMortgageLoanMemberfnm:ForbearanceAndRepaymentPlansAndTrialModificationMembersrt:SingleFamilyMember2023-01-012023-06-300000310522fnm:ForbearanceAndRepaymentPlansAndTrialModificationMembersrt:SingleFamilyMemberus-gaap:FinancingReceivables30To59DaysPastDueMember2023-01-012023-06-300000310522fnm:ForbearanceAndRepaymentPlansAndTrialModificationMembersrt:SingleFamilyMemberus-gaap:FinancingReceivables60To89DaysPastDueMember2023-01-012023-06-300000310522fnm:ForbearanceAndRepaymentPlansAndTrialModificationMembersrt:SingleFamilyMemberus-gaap:FinancingReceivablesEqualToGreaterThan90DaysPastDueMember2023-01-012023-06-300000310522fnm:ForbearanceAndRepaymentPlansAndTrialModificationMembersrt:SingleFamilyMemberus-gaap:FinancialAssetPastDueMember2023-01-012023-06-300000310522fnm:ForbearanceAndRepaymentPlansAndTrialModificationMembersrt:SingleFamilyMemberus-gaap:FinancialAssetNotPastDueMember2023-01-012023-06-300000310522fnm:ForbearanceAndRepaymentPlansAndTrialModificationMembersrt:SingleFamilyMember2023-01-012023-06-300000310522fnm:ForbearanceAndRepaymentPlansAndTrialModificationMembersrt:MultifamilyMemberus-gaap:FinancingReceivables30To59DaysPastDueMember2023-01-012023-06-300000310522fnm:ForbearanceAndRepaymentPlansAndTrialModificationMemberus-gaap:FinancingReceivablesEqualToGreaterThan90DaysPastDueMembersrt:MultifamilyMember2023-01-012023-06-300000310522fnm:ForbearanceAndRepaymentPlansAndTrialModificationMembersrt:MultifamilyMemberus-gaap:FinancialAssetPastDueMember2023-01-012023-06-300000310522fnm:ForbearanceAndRepaymentPlansAndTrialModificationMembersrt:MultifamilyMemberus-gaap:FinancialAssetNotPastDueMember2023-01-012023-06-300000310522fnm:ForbearanceAndRepaymentPlansAndTrialModificationMembersrt:MultifamilyMember2023-01-012023-06-300000310522fnm:ForbearanceAndRepaymentPlansAndTrialModificationMemberus-gaap:FinancingReceivables30To59DaysPastDueMember2023-01-012023-06-300000310522fnm:ForbearanceAndRepaymentPlansAndTrialModificationMemberus-gaap:FinancingReceivables60To89DaysPastDueMember2023-01-012023-06-300000310522fnm:ForbearanceAndRepaymentPlansAndTrialModificationMemberus-gaap:FinancingReceivablesEqualToGreaterThan90DaysPastDueMember2023-01-012023-06-300000310522fnm:ForbearanceAndRepaymentPlansAndTrialModificationMemberus-gaap:FinancialAssetPastDueMember2023-01-012023-06-300000310522fnm:ForbearanceAndRepaymentPlansAndTrialModificationMemberus-gaap:FinancialAssetNotPastDueMember2023-01-012023-06-300000310522fnm:ForbearanceAndRepaymentPlansAndTrialModificationMember2023-01-012023-06-300000310522srt:SingleFamilyMemberus-gaap:FixedRateResidentialMortgageMember2024-03-310000310522srt:SingleFamilyMemberfnm:FixedRateResidentialMortgage15YearMember2024-03-310000310522us-gaap:AdjustableRateResidentialMortgageMembersrt:SingleFamilyMember2024-03-310000310522fnm:OtherMortgageLoanMembersrt:SingleFamilyMember2024-03-310000310522srt:SingleFamilyMember2024-03-310000310522srt:MultifamilyMember2024-03-310000310522srt:SingleFamilyMemberus-gaap:FixedRateResidentialMortgageMember2023-06-300000310522srt:SingleFamilyMemberus-gaap:FixedRateResidentialMortgageMember2023-03-310000310522srt:SingleFamilyMemberus-gaap:FixedRateResidentialMortgageMember2022-12-310000310522srt:SingleFamilyMemberfnm:FixedRateResidentialMortgage15YearMember2023-06-300000310522srt:SingleFamilyMemberfnm:FixedRateResidentialMortgage15YearMember2023-03-310000310522srt:SingleFamilyMemberfnm:FixedRateResidentialMortgage15YearMember2022-12-310000310522us-gaap:AdjustableRateResidentialMortgageMembersrt:SingleFamilyMember2023-06-300000310522us-gaap:AdjustableRateResidentialMortgageMembersrt:SingleFamilyMember2023-03-310000310522us-gaap:AdjustableRateResidentialMortgageMembersrt:SingleFamilyMember2022-12-310000310522fnm:OtherMortgageLoanMembersrt:SingleFamilyMember2023-06-300000310522fnm:OtherMortgageLoanMembersrt:SingleFamilyMember2023-03-310000310522fnm:OtherMortgageLoanMembersrt:SingleFamilyMember2022-12-310000310522srt:SingleFamilyMember2023-06-300000310522srt:SingleFamilyMember2023-03-310000310522srt:SingleFamilyMember2022-12-310000310522srt:MultifamilyMember2023-06-300000310522srt:MultifamilyMember2023-03-310000310522srt:MultifamilyMember2022-12-310000310522srt:SingleFamilyMember2024-03-310000310522srt:SingleFamilyMember2023-03-310000310522srt:SingleFamilyMember2023-12-310000310522srt:SingleFamilyMember2022-12-310000310522srt:SingleFamilyMember2023-01-012023-06-300000310522srt:SingleFamilyMember2024-06-300000310522srt:SingleFamilyMember2023-06-300000310522srt:MultifamilyMember2024-03-310000310522srt:MultifamilyMember2023-03-310000310522srt:MultifamilyMember2023-12-310000310522srt:MultifamilyMember2022-12-310000310522srt:MultifamilyMember2024-04-012024-06-300000310522srt:MultifamilyMember2023-04-012023-06-300000310522srt:MultifamilyMember2024-01-012024-06-300000310522srt:MultifamilyMember2023-01-012023-06-300000310522srt:MultifamilyMember2024-06-300000310522srt:MultifamilyMember2023-06-300000310522us-gaap:AdjustableRateLoansMembersrt:MultifamilyMember2024-04-012024-06-300000310522us-gaap:AdjustableRateLoansMembersrt:MultifamilyMember2024-06-300000310522us-gaap:AdjustableRateLoansMembersrt:MultifamilyMember2024-01-012024-06-300000310522us-gaap:MortgageBackedSecuritiesMemberus-gaap:VariableInterestEntityPrimaryBeneficiaryMember2024-06-300000310522us-gaap:MortgageBackedSecuritiesMemberus-gaap:VariableInterestEntityPrimaryBeneficiaryMember2023-12-310000310522us-gaap:MortgageBackedSecuritiesMember2024-06-300000310522us-gaap:MortgageBackedSecuritiesMember2023-12-310000310522fnm:NonmortgagerelatedsecuritiesMemberus-gaap:AssetPledgedAsCollateralMember2024-06-300000310522fnm:NonmortgagerelatedsecuritiesMemberus-gaap:AssetPledgedAsCollateralMember2023-12-310000310522fnm:NonmortgagerelatedsecuritiesMember2024-06-300000310522fnm:NonmortgagerelatedsecuritiesMember2023-12-310000310522us-gaap:MortgageBackedSecuritiesIssuedByUSGovernmentSponsoredEnterprisesMember2024-06-300000310522us-gaap:MortgageBackedSecuritiesOtherMember2024-06-300000310522us-gaap:MortgageBackedSecuritiesIssuedByUSGovernmentSponsoredEnterprisesMember2023-12-310000310522us-gaap:MortgageBackedSecuritiesOtherMember2023-12-310000310522us-gaap:VariableInterestEntityNotPrimaryBeneficiaryMemberus-gaap:MortgageBackedSecuritiesIssuedByUSGovernmentSponsoredEnterprisesMember2024-06-300000310522us-gaap:VariableInterestEntityNotPrimaryBeneficiaryMemberus-gaap:MortgageBackedSecuritiesIssuedByUSGovernmentSponsoredEnterprisesMember2023-12-310000310522us-gaap:VariableInterestEntityNotPrimaryBeneficiaryMemberfnm:NonconsolidatedFannieMaesecuritiesMember2024-06-300000310522us-gaap:VariableInterestEntityNotPrimaryBeneficiaryMemberfnm:NonconsolidatedFannieMaesecuritiesMember2023-12-310000310522us-gaap:VariableInterestEntityNotPrimaryBeneficiaryMemberus-gaap:GuaranteeTypeOtherMember2024-06-300000310522us-gaap:VariableInterestEntityNotPrimaryBeneficiaryMemberus-gaap:GuaranteeTypeOtherMember2023-12-310000310522fnm:SeniorFixedBenchmarkNotesAndBondsMembersrt:ParentCompanyMember2024-06-300000310522fnm:SeniorFixedBenchmarkNotesAndBondsMembersrt:ParentCompanyMember2023-12-310000310522fnm:SeniorFixedMediumTermNotesMembersrt:ParentCompanyMember2024-06-300000310522fnm:SeniorFixedMediumTermNotesMembersrt:ParentCompanyMember2023-12-310000310522srt:ParentCompanyMemberfnm:SeniorFixedOtherDebtMember2024-06-300000310522srt:ParentCompanyMemberfnm:SeniorFixedOtherDebtMember2023-12-310000310522fnm:SeniorFixedDebtMembersrt:ParentCompanyMember2024-06-300000310522fnm:SeniorFixedDebtMembersrt:ParentCompanyMember2023-12-310000310522fnm:SeniorFloatingMediumTermNotesMembersrt:ParentCompanyMember2024-06-300000310522fnm:SeniorFloatingMediumTermNotesMembersrt:ParentCompanyMember2023-12-310000310522fnm:SeniorFloatingConnecticutAvenueSecurityMembersrt:ParentCompanyMember2024-06-300000310522fnm:SeniorFloatingConnecticutAvenueSecurityMembersrt:ParentCompanyMember2023-12-310000310522srt:ParentCompanyMemberfnm:SeniorFloatingOtherDebtMember2024-06-300000310522srt:ParentCompanyMemberfnm:SeniorFloatingOtherDebtMember2023-12-310000310522srt:ParentCompanyMemberfnm:SeniorFloatingDebtMember2024-06-300000310522srt:ParentCompanyMemberfnm:SeniorFloatingDebtMember2023-12-310000310522fnm:SeniorFixedMediumTermNotesMembersrt:MinimumMembersrt:ParentCompanyMember2024-01-012024-06-300000310522fnm:SeniorFixedMediumTermNotesMembersrt:MaximumMembersrt:ParentCompanyMember2024-01-012024-06-300000310522srt:ParentCompanyMemberfnm:SeniorFixedOtherDebtMember2024-01-012024-06-300000310522fnm:PayFixedSwapMemberus-gaap:DesignatedAsHedgingInstrumentMember2024-06-300000310522fnm:PayFixedSwapMemberus-gaap:DesignatedAsHedgingInstrumentMember2023-12-310000310522us-gaap:DesignatedAsHedgingInstrumentMemberfnm:ReceiveFixedSwapMember2024-06-300000310522us-gaap:DesignatedAsHedgingInstrumentMemberfnm:ReceiveFixedSwapMember2023-12-310000310522fnm:TotalRiskManagementDerivativesPortfolioMemberus-gaap:DesignatedAsHedgingInstrumentMember2024-06-300000310522fnm:TotalRiskManagementDerivativesPortfolioMemberus-gaap:DesignatedAsHedgingInstrumentMember2023-12-310000310522fnm:PayFixedSwapMemberus-gaap:NondesignatedMember2024-06-300000310522fnm:PayFixedSwapMemberus-gaap:NondesignatedMember2023-12-310000310522fnm:ReceiveFixedSwapMemberus-gaap:NondesignatedMember2024-06-300000310522fnm:ReceiveFixedSwapMemberus-gaap:NondesignatedMember2023-12-310000310522us-gaap:BasisSwapMemberus-gaap:NondesignatedMember2024-06-300000310522us-gaap:BasisSwapMemberus-gaap:NondesignatedMember2023-12-310000310522us-gaap:NondesignatedMemberus-gaap:CurrencySwapMember2024-06-300000310522us-gaap:NondesignatedMemberus-gaap:CurrencySwapMember2023-12-310000310522fnm:PayFixedSwaptionMemberus-gaap:NondesignatedMember2024-06-300000310522fnm:PayFixedSwaptionMemberus-gaap:NondesignatedMember2023-12-310000310522us-gaap:NondesignatedMemberfnm:ReceiveFixedSwaptionMember2024-06-300000310522us-gaap:NondesignatedMemberfnm:ReceiveFixedSwaptionMember2023-12-310000310522us-gaap:NondesignatedMemberus-gaap:FutureMember2024-06-300000310522us-gaap:NondesignatedMemberus-gaap:FutureMember2023-12-310000310522fnm:TotalRiskManagementDerivativesPortfolioMemberus-gaap:NondesignatedMember2024-06-300000310522fnm:TotalRiskManagementDerivativesPortfolioMemberus-gaap:NondesignatedMember2023-12-310000310522fnm:TotalRiskManagementDerivativesPortfolioMember2024-06-300000310522fnm:TotalRiskManagementDerivativesPortfolioMember2023-12-310000310522fnm:MortgageCommitmentsToPurchaseWholeLoansMember2024-06-300000310522fnm:MortgageCommitmentsToPurchaseWholeLoansMember2023-12-310000310522fnm:ForwardContractsToPurchaseMortgageRelatedSecuritiesMember2024-06-300000310522fnm:ForwardContractsToPurchaseMortgageRelatedSecuritiesMember2023-12-310000310522fnm:ForwardContractsToSellMortgageRelatedSecuritiesMember2024-06-300000310522fnm:ForwardContractsToSellMortgageRelatedSecuritiesMember2023-12-310000310522fnm:MortgageCommitmentDerivativesMember2024-06-300000310522fnm:MortgageCommitmentDerivativesMember2023-12-310000310522us-gaap:OtherContractMember2024-06-300000310522us-gaap:OtherContractMember2023-12-310000310522fnm:PayFixedSwapMember2024-04-012024-06-300000310522fnm:PayFixedSwapMember2023-04-012023-06-300000310522fnm:PayFixedSwapMember2024-01-012024-06-300000310522fnm:PayFixedSwapMember2023-01-012023-06-300000310522fnm:ReceiveFixedSwapMember2024-04-012024-06-300000310522fnm:ReceiveFixedSwapMember2023-04-012023-06-300000310522fnm:ReceiveFixedSwapMember2024-01-012024-06-300000310522fnm:ReceiveFixedSwapMember2023-01-012023-06-300000310522us-gaap:BasisSwapMember2024-04-012024-06-300000310522us-gaap:BasisSwapMember2023-04-012023-06-300000310522us-gaap:BasisSwapMember2024-01-012024-06-300000310522us-gaap:BasisSwapMember2023-01-012023-06-300000310522us-gaap:CurrencySwapMember2024-04-012024-06-300000310522us-gaap:CurrencySwapMember2023-04-012023-06-300000310522us-gaap:CurrencySwapMember2024-01-012024-06-300000310522us-gaap:CurrencySwapMember2023-01-012023-06-300000310522fnm:PayFixedSwaptionMember2024-04-012024-06-300000310522fnm:PayFixedSwaptionMember2023-04-012023-06-300000310522fnm:PayFixedSwaptionMember2024-01-012024-06-300000310522fnm:PayFixedSwaptionMember2023-01-012023-06-300000310522fnm:ReceiveFixedSwaptionMember2024-04-012024-06-300000310522fnm:ReceiveFixedSwaptionMember2023-04-012023-06-300000310522fnm:ReceiveFixedSwaptionMember2024-01-012024-06-300000310522fnm:ReceiveFixedSwaptionMember2023-01-012023-06-300000310522us-gaap:FutureMember2024-04-012024-06-300000310522us-gaap:FutureMember2023-04-012023-06-300000310522us-gaap:FutureMember2024-01-012024-06-300000310522us-gaap:FutureMember2023-01-012023-06-300000310522us-gaap:InterestRateContractMember2024-04-012024-06-300000310522us-gaap:InterestRateContractMember2023-04-012023-06-300000310522us-gaap:InterestRateContractMember2024-01-012024-06-300000310522us-gaap:InterestRateContractMember2023-01-012023-06-300000310522fnm:MortgageCommitmentDerivativesMember2024-04-012024-06-300000310522fnm:MortgageCommitmentDerivativesMember2023-04-012023-06-300000310522fnm:MortgageCommitmentDerivativesMember2024-01-012024-06-300000310522fnm:MortgageCommitmentDerivativesMember2023-01-012023-06-300000310522us-gaap:OtherContractMember2024-04-012024-06-300000310522us-gaap:OtherContractMember2023-04-012023-06-300000310522us-gaap:OtherContractMember2024-01-012024-06-300000310522us-gaap:OtherContractMember2023-01-012023-06-300000310522fnm:InterestRateRiskOnHeldForInvestmentMortgageLoanMemberus-gaap:InterestIncomeMember2024-04-012024-06-300000310522fnm:InterestRateRiskOnHeldForInvestmentMortgageLoanMemberus-gaap:InterestIncomeMember2023-04-012023-06-300000310522fnm:InterestRateRiskOnHeldForInvestmentMortgageLoanMemberus-gaap:InterestIncomeMember2024-01-012024-06-300000310522fnm:InterestRateRiskOnHeldForInvestmentMortgageLoanMemberus-gaap:InterestIncomeMember2023-01-012023-06-300000310522us-gaap:InterestExpenseMemberfnm:InterestRateRiskOnDebtMember2024-04-012024-06-300000310522us-gaap:InterestExpenseMemberfnm:InterestRateRiskOnDebtMember2023-04-012023-06-300000310522us-gaap:InterestExpenseMemberfnm:InterestRateRiskOnDebtMember2024-01-012024-06-300000310522us-gaap:InterestExpenseMemberfnm:InterestRateRiskOnDebtMember2023-01-012023-06-300000310522us-gaap:OverTheCounterMemberus-gaap:InterestRateContractMember2024-06-300000310522us-gaap:OverTheCounterMemberus-gaap:InterestRateContractMember2023-12-310000310522us-gaap:OperatingSegmentsMemberfnm:SingleFamilySegmentMember2024-04-012024-06-300000310522fnm:MultifamilySegmentMemberus-gaap:OperatingSegmentsMember2024-04-012024-06-300000310522us-gaap:OperatingSegmentsMemberfnm:SingleFamilySegmentMember2023-04-012023-06-300000310522fnm:MultifamilySegmentMemberus-gaap:OperatingSegmentsMember2023-04-012023-06-300000310522fnm:UsTreasuryMemberus-gaap:OperatingSegmentsMemberfnm:SingleFamilySegmentMemberus-gaap:RelatedPartyMember2024-04-012024-06-300000310522fnm:UsTreasuryMemberfnm:MultifamilySegmentMemberus-gaap:OperatingSegmentsMemberus-gaap:RelatedPartyMember2024-04-012024-06-300000310522fnm:UsTreasuryMemberus-gaap:RelatedPartyMember2024-04-012024-06-300000310522fnm:UsTreasuryMemberus-gaap:OperatingSegmentsMemberfnm:SingleFamilySegmentMemberus-gaap:RelatedPartyMember2023-04-012023-06-300000310522fnm:UsTreasuryMemberfnm:MultifamilySegmentMemberus-gaap:OperatingSegmentsMemberus-gaap:RelatedPartyMember2023-04-012023-06-300000310522fnm:UsTreasuryMemberus-gaap:RelatedPartyMember2023-04-012023-06-300000310522us-gaap:OperatingSegmentsMemberfnm:SingleFamilySegmentMember2024-01-012024-06-300000310522fnm:MultifamilySegmentMemberus-gaap:OperatingSegmentsMember2024-01-012024-06-300000310522us-gaap:OperatingSegmentsMemberfnm:SingleFamilySegmentMember2023-01-012023-06-300000310522fnm:MultifamilySegmentMemberus-gaap:OperatingSegmentsMember2023-01-012023-06-300000310522fnm:UsTreasuryMemberus-gaap:OperatingSegmentsMemberfnm:SingleFamilySegmentMemberus-gaap:RelatedPartyMember2024-01-012024-06-300000310522fnm:UsTreasuryMemberfnm:MultifamilySegmentMemberus-gaap:OperatingSegmentsMemberus-gaap:RelatedPartyMember2024-01-012024-06-300000310522fnm:UsTreasuryMemberus-gaap:RelatedPartyMember2024-01-012024-06-300000310522fnm:UsTreasuryMemberus-gaap:OperatingSegmentsMemberfnm:SingleFamilySegmentMemberus-gaap:RelatedPartyMember2023-01-012023-06-300000310522fnm:UsTreasuryMemberfnm:MultifamilySegmentMemberus-gaap:OperatingSegmentsMemberus-gaap:RelatedPartyMember2023-01-012023-06-300000310522fnm:UsTreasuryMemberus-gaap:RelatedPartyMember2023-01-012023-06-300000310522srt:SingleFamilyMemberfnm:GuarantyBookOfBusinessMember2024-06-300000310522srt:SingleFamilyMemberfnm:GuarantyBookOfBusinessMember2023-12-310000310522srt:SingleFamilyMemberfnm:GuarantyBookOfBusinessMemberfnm:OriginalLoanToValueRatio8001To90Member2024-06-300000310522srt:SingleFamilyMemberfnm:GuarantyBookOfBusinessMemberfnm:OriginalLoanToValueRatio8001To90Member2023-12-310000310522srt:SingleFamilyMemberfnm:OriginalLoanToValueRatio9001To100Memberfnm:GuarantyBookOfBusinessMember2024-06-300000310522srt:SingleFamilyMemberfnm:OriginalLoanToValueRatio9001To100Memberfnm:GuarantyBookOfBusinessMember2023-12-310000310522srt:SingleFamilyMemberfnm:EstimatedMarkToMarketLoanToValueRatioGreaterThanOneHundredPercentMemberfnm:GuarantyBookOfBusinessMember2024-06-300000310522srt:SingleFamilyMemberfnm:EstimatedMarkToMarketLoanToValueRatioGreaterThanOneHundredPercentMemberfnm:GuarantyBookOfBusinessMember2023-12-310000310522stpr:CAsrt:SingleFamilyMemberfnm:GuarantyBookOfBusinessMember2024-06-300000310522stpr:CAsrt:SingleFamilyMemberfnm:GuarantyBookOfBusinessMember2023-12-310000310522srt:SingleFamilyMemberfnm:GuarantyBookOfBusinessMemberstpr:TX2024-06-300000310522srt:SingleFamilyMemberfnm:GuarantyBookOfBusinessMemberstpr:TX2023-12-310000310522stpr:FLsrt:SingleFamilyMemberfnm:GuarantyBookOfBusinessMember2024-06-300000310522stpr:FLsrt:SingleFamilyMemberfnm:GuarantyBookOfBusinessMember2023-12-310000310522srt:SingleFamilyMemberfnm:GuarantyBookOfBusinessMemberstpr:NY2024-06-300000310522srt:SingleFamilyMemberfnm:GuarantyBookOfBusinessMemberstpr:NY2023-12-310000310522stpr:ILsrt:SingleFamilyMemberfnm:GuarantyBookOfBusinessMember2024-06-300000310522stpr:ILsrt:SingleFamilyMemberfnm:GuarantyBookOfBusinessMember2023-12-310000310522fnm:OtherStatesMembersrt:SingleFamilyMemberfnm:GuarantyBookOfBusinessMember2024-06-300000310522fnm:OtherStatesMembersrt:SingleFamilyMemberfnm:GuarantyBookOfBusinessMember2023-12-310000310522srt:SingleFamilyMemberfnm:GuarantyBookOfBusinessMemberfnm:Vintages2008AndPriorMember2024-06-300000310522srt:SingleFamilyMemberfnm:GuarantyBookOfBusinessMemberfnm:Vintages2008AndPriorMember2023-12-310000310522srt:SingleFamilyMemberfnm:GuarantyBookOfBusinessMemberfnm:Vintages2009toCurrentYearMember2024-06-300000310522srt:SingleFamilyMemberfnm:GuarantyBookOfBusinessMemberfnm:Vintages2009toCurrentYearMember2023-12-310000310522srt:SingleFamilyMembersrt:MinimumMember2023-01-012023-12-310000310522srt:MultifamilyMemberfnm:GuarantyBookOfBusinessMember2024-06-300000310522srt:MultifamilyMemberfnm:GuarantyBookOfBusinessMember2023-12-310000310522fnm:OriginalLoanToValueRatioGreaterThanEightyPercentMembersrt:MultifamilyMemberfnm:GuarantyBookOfBusinessMember2024-06-300000310522fnm:OriginalLoanToValueRatioGreaterThanEightyPercentMembersrt:MultifamilyMemberfnm:GuarantyBookOfBusinessMember2023-12-310000310522srt:MultifamilyMemberfnm:GuarantyBookOfBusinessMemberfnm:OriginalLoanToValueRatioLessThanOrEqualToEightyPercentMember2024-06-300000310522srt:MultifamilyMemberfnm:GuarantyBookOfBusinessMemberfnm:OriginalLoanToValueRatioLessThanOrEqualToEightyPercentMember2023-12-310000310522fnm:CurrentDebtServiceCoverageRatioLessThanOneHundredPercentMembersrt:MultifamilyMemberfnm:GuarantyBookOfBusinessMember2024-06-300000310522fnm:CurrentDebtServiceCoverageRatioLessThanOneHundredPercentMembersrt:MultifamilyMemberfnm:GuarantyBookOfBusinessMember2023-12-310000310522fnm:MortgageGuarantyInsuranceCorp.Membersrt:SingleFamilyMemberfnm:GuarantyBookOfBusinessMemberfnm:InsuranceServiceProviderConcentrationRiskMember2024-01-012024-06-300000310522fnm:MortgageGuarantyInsuranceCorp.Membersrt:SingleFamilyMemberfnm:GuarantyBookOfBusinessMemberfnm:InsuranceServiceProviderConcentrationRiskMember2023-01-012023-12-310000310522srt:SingleFamilyMemberfnm:RadianGuarantyIncMemberfnm:GuarantyBookOfBusinessMemberfnm:InsuranceServiceProviderConcentrationRiskMember2024-01-012024-06-300000310522srt:SingleFamilyMemberfnm:RadianGuarantyIncMemberfnm:GuarantyBookOfBusinessMemberfnm:InsuranceServiceProviderConcentrationRiskMember2023-01-012023-12-310000310522fnm:ArchCapitalGroupLtd.Membersrt:SingleFamilyMemberfnm:GuarantyBookOfBusinessMemberfnm:InsuranceServiceProviderConcentrationRiskMember2024-01-012024-06-300000310522fnm:ArchCapitalGroupLtd.Membersrt:SingleFamilyMemberfnm:GuarantyBookOfBusinessMemberfnm:InsuranceServiceProviderConcentrationRiskMember2023-01-012023-12-310000310522srt:SingleFamilyMemberfnm:GuarantyBookOfBusinessMemberfnm:InsuranceServiceProviderConcentrationRiskMemberfnm:GenworthMortgageInsuranceCorp.Member2024-01-012024-06-300000310522srt:SingleFamilyMemberfnm:GuarantyBookOfBusinessMemberfnm:InsuranceServiceProviderConcentrationRiskMemberfnm:GenworthMortgageInsuranceCorp.Member2023-01-012023-12-310000310522srt:SingleFamilyMemberfnm:EssentGuarantyIncMemberfnm:GuarantyBookOfBusinessMemberfnm:InsuranceServiceProviderConcentrationRiskMember2024-01-012024-06-300000310522srt:SingleFamilyMemberfnm:EssentGuarantyIncMemberfnm:GuarantyBookOfBusinessMemberfnm:InsuranceServiceProviderConcentrationRiskMember2023-01-012023-12-310000310522fnm:NationalMortgageInsuranceCorporationMembersrt:SingleFamilyMemberfnm:GuarantyBookOfBusinessMemberfnm:InsuranceServiceProviderConcentrationRiskMember2024-01-012024-06-300000310522fnm:NationalMortgageInsuranceCorporationMembersrt:SingleFamilyMemberfnm:GuarantyBookOfBusinessMemberfnm:InsuranceServiceProviderConcentrationRiskMember2023-01-012023-12-310000310522srt:SingleFamilyMemberfnm:GuarantyBookOfBusinessMemberfnm:InsuranceServiceProviderConcentrationRiskMember2024-01-012024-06-300000310522srt:SingleFamilyMemberfnm:GuarantyBookOfBusinessMemberfnm:InsuranceServiceProviderConcentrationRiskMember2023-01-012023-12-310000310522srt:SingleFamilyMemberfnm:GuarantyBookOfBusinessMemberfnm:InsuranceServiceProviderConcentrationRiskMemberfnm:OtherCounterpartyMember2024-01-012024-06-300000310522srt:SingleFamilyMemberfnm:GuarantyBookOfBusinessMemberfnm:InsuranceServiceProviderConcentrationRiskMemberfnm:OtherCounterpartyMember2023-01-012023-12-310000310522us-gaap:CreditConcentrationRiskMembersrt:SingleFamilyMemberfnm:OtherTopServicersMemberfnm:GuarantyBookOfBusinessMemberfnm:DepositoryServicerMember2024-01-012024-06-300000310522us-gaap:CreditConcentrationRiskMembersrt:SingleFamilyMemberfnm:OtherTopServicersMemberfnm:GuarantyBookOfBusinessMemberfnm:DepositoryServicerMember2023-01-012023-12-310000310522us-gaap:CreditConcentrationRiskMemberfnm:NonDepositoryServicerMembersrt:SingleFamilyMemberfnm:GuarantyBookOfBusinessMemberfnm:GroupOfLargestMortgageServicersIncludingAffiliatesMember2024-01-012024-06-300000310522us-gaap:CreditConcentrationRiskMemberfnm:NonDepositoryServicerMembersrt:SingleFamilyMemberfnm:GuarantyBookOfBusinessMemberfnm:GroupOfLargestMortgageServicersIncludingAffiliatesMember2023-01-012023-12-310000310522us-gaap:CreditConcentrationRiskMembersrt:SingleFamilyMemberfnm:GuarantyBookOfBusinessMemberfnm:GroupOfLargestMortgageServicersIncludingAffiliatesMember2024-01-012024-06-300000310522us-gaap:CreditConcentrationRiskMembersrt:SingleFamilyMemberfnm:GuarantyBookOfBusinessMemberfnm:GroupOfLargestMortgageServicersIncludingAffiliatesMember2023-01-012023-12-310000310522us-gaap:CreditConcentrationRiskMembersrt:SingleFamilyMemberfnm:GuarantyBookOfBusinessMemberfnm:DepositoryServicerMember2024-01-012024-06-300000310522us-gaap:CreditConcentrationRiskMemberfnm:NonDepositoryServicerMembersrt:SingleFamilyMemberfnm:GuarantyBookOfBusinessMember2024-01-012024-06-300000310522us-gaap:CreditConcentrationRiskMembersrt:SingleFamilyMemberfnm:GuarantyBookOfBusinessMemberfnm:DepositoryServicerMember2023-01-012023-12-310000310522us-gaap:CreditConcentrationRiskMemberfnm:NonDepositoryServicerMembersrt:SingleFamilyMemberfnm:GuarantyBookOfBusinessMember2023-01-012023-12-310000310522us-gaap:CreditConcentrationRiskMembersrt:MultifamilyMemberfnm:WalkerDunlopLLCMemberfnm:GuarantyBookOfBusinessMember2023-01-012023-12-310000310522us-gaap:CreditConcentrationRiskMembersrt:MultifamilyMemberfnm:WalkerDunlopLLCMemberfnm:GuarantyBookOfBusinessMember2024-01-012024-06-300000310522us-gaap:CreditConcentrationRiskMembersrt:MultifamilyMemberfnm:WellsFargoBankN.A.Memberfnm:GuarantyBookOfBusinessMember2023-01-012023-12-310000310522us-gaap:CreditConcentrationRiskMembersrt:MultifamilyMemberfnm:WellsFargoBankN.A.Memberfnm:GuarantyBookOfBusinessMember2024-01-012024-06-300000310522us-gaap:CreditConcentrationRiskMemberfnm:OtherTopServicersMembersrt:MultifamilyMemberfnm:GuarantyBookOfBusinessMemberfnm:DepositoryServicerMember2024-01-012024-06-300000310522us-gaap:CreditConcentrationRiskMemberfnm:OtherTopServicersMembersrt:MultifamilyMemberfnm:GuarantyBookOfBusinessMemberfnm:DepositoryServicerMember2023-01-012023-12-310000310522us-gaap:CreditConcentrationRiskMemberfnm:NonDepositoryServicerMembersrt:MultifamilyMemberfnm:GuarantyBookOfBusinessMemberfnm:GroupOfLargestMortgageServicersIncludingAffiliatesMember2024-01-012024-06-300000310522us-gaap:CreditConcentrationRiskMemberfnm:NonDepositoryServicerMembersrt:MultifamilyMemberfnm:GuarantyBookOfBusinessMemberfnm:GroupOfLargestMortgageServicersIncludingAffiliatesMember2023-01-012023-12-310000310522us-gaap:CreditConcentrationRiskMembersrt:MultifamilyMemberfnm:GuarantyBookOfBusinessMemberfnm:GroupOfLargestMortgageServicersIncludingAffiliatesMember2024-01-012024-06-300000310522us-gaap:CreditConcentrationRiskMembersrt:MultifamilyMemberfnm:GuarantyBookOfBusinessMemberfnm:GroupOfLargestMortgageServicersIncludingAffiliatesMember2023-01-012023-12-310000310522us-gaap:CreditConcentrationRiskMembersrt:MultifamilyMemberfnm:GuarantyBookOfBusinessMemberfnm:DepositoryServicerMember2023-01-012023-12-310000310522us-gaap:CreditConcentrationRiskMembersrt:MultifamilyMemberfnm:GuarantyBookOfBusinessMemberfnm:DepositoryServicerMember2024-01-012024-06-300000310522us-gaap:CreditConcentrationRiskMemberfnm:NonDepositoryServicerMembersrt:MultifamilyMemberfnm:GuarantyBookOfBusinessMember2024-01-012024-06-300000310522us-gaap:CreditConcentrationRiskMemberfnm:NonDepositoryServicerMembersrt:MultifamilyMemberfnm:GuarantyBookOfBusinessMember2023-01-012023-12-310000310522us-gaap:InterestRateContractMemberus-gaap:ExchangeClearedMember2024-06-300000310522us-gaap:InterestRateContractMemberus-gaap:ExchangeClearedMember2023-12-310000310522us-gaap:AssetPledgedAsCollateralWithRightMember2024-06-300000310522us-gaap:AssetPledgedAsCollateralWithRightMember2023-12-310000310522us-gaap:CashAndCashEquivalentsMember2024-06-300000310522us-gaap:CashAndCashEquivalentsMember2023-12-310000310522fnm:RestrictedCashAndCashEquivalentMember2024-06-300000310522fnm:RestrictedCashAndCashEquivalentMember2023-12-310000310522us-gaap:FairValueMeasurementsRecurringMemberus-gaap:MortgageBackedSecuritiesMemberus-gaap:FairValueInputsLevel1Member2024-06-300000310522us-gaap:FairValueMeasurementsRecurringMemberus-gaap:MortgageBackedSecuritiesMemberus-gaap:FairValueInputsLevel2Member2024-06-300000310522us-gaap:FairValueMeasurementsRecurringMemberus-gaap:MortgageBackedSecuritiesMemberus-gaap:FairValueInputsLevel3Member2024-06-300000310522us-gaap:FairValueMeasurementsRecurringMemberus-gaap:MortgageBackedSecuritiesMember2024-06-300000310522us-gaap:FairValueMeasurementsRecurringMemberus-gaap:FairValueInputsLevel1Memberfnm:NonmortgagerelatedsecuritiesMember2024-06-300000310522us-gaap:FairValueMeasurementsRecurringMemberus-gaap:FairValueInputsLevel2Memberfnm:NonmortgagerelatedsecuritiesMember2024-06-300000310522us-gaap:FairValueMeasurementsRecurringMemberus-gaap:FairValueInputsLevel3Memberfnm:NonmortgagerelatedsecuritiesMember2024-06-300000310522us-gaap:FairValueMeasurementsRecurringMemberfnm:NonmortgagerelatedsecuritiesMember2024-06-300000310522us-gaap:FairValueMeasurementsRecurringMemberus-gaap:FairValueInputsLevel1Member2024-06-300000310522us-gaap:FairValueMeasurementsRecurringMemberus-gaap:FairValueInputsLevel2Member2024-06-300000310522us-gaap:FairValueMeasurementsRecurringMemberus-gaap:FairValueInputsLevel3Member2024-06-300000310522us-gaap:FairValueMeasurementsRecurringMember2024-06-300000310522us-gaap:MortgageBackedSecuritiesIssuedByUSGovernmentSponsoredEnterprisesMemberus-gaap:FairValueMeasurementsRecurringMemberus-gaap:FairValueInputsLevel1Member2024-06-300000310522us-gaap:MortgageBackedSecuritiesIssuedByUSGovernmentSponsoredEnterprisesMemberus-gaap:FairValueMeasurementsRecurringMemberus-gaap:FairValueInputsLevel2Member2024-06-300000310522us-gaap:MortgageBackedSecuritiesIssuedByUSGovernmentSponsoredEnterprisesMemberus-gaap:FairValueMeasurementsRecurringMemberus-gaap:FairValueInputsLevel3Member2024-06-300000310522us-gaap:MortgageBackedSecuritiesIssuedByUSGovernmentSponsoredEnterprisesMemberus-gaap:FairValueMeasurementsRecurringMember2024-06-300000310522us-gaap:FairValueMeasurementsRecurringMemberus-gaap:FairValueInputsLevel1Memberus-gaap:MortgageBackedSecuritiesOtherMember2024-06-300000310522us-gaap:FairValueMeasurementsRecurringMemberus-gaap:MortgageBackedSecuritiesOtherMemberus-gaap:FairValueInputsLevel2Member2024-06-300000310522us-gaap:FairValueMeasurementsRecurringMemberus-gaap:MortgageBackedSecuritiesOtherMemberus-gaap:FairValueInputsLevel3Member2024-06-300000310522us-gaap:FairValueMeasurementsRecurringMemberus-gaap:MortgageBackedSecuritiesOtherMember2024-06-300000310522us-gaap:FairValueMeasurementsRecurringMemberus-gaap:FairValueInputsLevel1Membersrt:ParentCompanyMember2024-06-300000310522us-gaap:FairValueMeasurementsRecurringMemberus-gaap:FairValueInputsLevel2Membersrt:ParentCompanyMember2024-06-300000310522us-gaap:FairValueMeasurementsRecurringMembersrt:ParentCompanyMemberus-gaap:FairValueInputsLevel3Member2024-06-300000310522us-gaap:FairValueMeasurementsRecurringMembersrt:ParentCompanyMember2024-06-300000310522us-gaap:FairValueMeasurementsRecurringMemberus-gaap:FairValueInputsLevel1Memberus-gaap:VariableInterestEntityPrimaryBeneficiaryMember2024-06-300000310522us-gaap:FairValueMeasurementsRecurringMemberus-gaap:VariableInterestEntityPrimaryBeneficiaryMemberus-gaap:FairValueInputsLevel2Member2024-06-300000310522us-gaap:FairValueMeasurementsRecurringMemberus-gaap:VariableInterestEntityPrimaryBeneficiaryMemberus-gaap:FairValueInputsLevel3Member2024-06-300000310522us-gaap:FairValueMeasurementsRecurringMemberus-gaap:VariableInterestEntityPrimaryBeneficiaryMember2024-06-300000310522us-gaap:FairValueMeasurementsRecurringMemberus-gaap:MortgageBackedSecuritiesMemberus-gaap:FairValueInputsLevel1Member2023-12-310000310522us-gaap:FairValueMeasurementsRecurringMemberus-gaap:MortgageBackedSecuritiesMemberus-gaap:FairValueInputsLevel2Member2023-12-310000310522us-gaap:FairValueMeasurementsRecurringMemberus-gaap:MortgageBackedSecuritiesMemberus-gaap:FairValueInputsLevel3Member2023-12-310000310522us-gaap:FairValueMeasurementsRecurringMemberus-gaap:MortgageBackedSecuritiesMember2023-12-310000310522us-gaap:FairValueMeasurementsRecurringMemberus-gaap:FairValueInputsLevel1Memberfnm:NonmortgagerelatedsecuritiesMember2023-12-310000310522us-gaap:FairValueMeasurementsRecurringMemberus-gaap:FairValueInputsLevel2Memberfnm:NonmortgagerelatedsecuritiesMember2023-12-310000310522us-gaap:FairValueMeasurementsRecurringMemberus-gaap:FairValueInputsLevel3Memberfnm:NonmortgagerelatedsecuritiesMember2023-12-310000310522us-gaap:FairValueMeasurementsRecurringMemberfnm:NonmortgagerelatedsecuritiesMember2023-12-310000310522us-gaap:FairValueMeasurementsRecurringMemberus-gaap:FairValueInputsLevel1Member2023-12-310000310522us-gaap:FairValueMeasurementsRecurringMemberus-gaap:FairValueInputsLevel2Member2023-12-310000310522us-gaap:FairValueMeasurementsRecurringMemberus-gaap:FairValueInputsLevel3Member2023-12-310000310522us-gaap:FairValueMeasurementsRecurringMember2023-12-310000310522us-gaap:MortgageBackedSecuritiesIssuedByUSGovernmentSponsoredEnterprisesMemberus-gaap:FairValueMeasurementsRecurringMemberus-gaap:FairValueInputsLevel1Member2023-12-310000310522us-gaap:MortgageBackedSecuritiesIssuedByUSGovernmentSponsoredEnterprisesMemberus-gaap:FairValueMeasurementsRecurringMemberus-gaap:FairValueInputsLevel2Member2023-12-310000310522us-gaap:MortgageBackedSecuritiesIssuedByUSGovernmentSponsoredEnterprisesMemberus-gaap:FairValueMeasurementsRecurringMemberus-gaap:FairValueInputsLevel3Member2023-12-310000310522us-gaap:MortgageBackedSecuritiesIssuedByUSGovernmentSponsoredEnterprisesMemberus-gaap:FairValueMeasurementsRecurringMember2023-12-310000310522us-gaap:FairValueMeasurementsRecurringMemberus-gaap:FairValueInputsLevel1Memberus-gaap:MortgageBackedSecuritiesOtherMember2023-12-310000310522us-gaap:FairValueMeasurementsRecurringMemberus-gaap:MortgageBackedSecuritiesOtherMemberus-gaap:FairValueInputsLevel2Member2023-12-310000310522us-gaap:FairValueMeasurementsRecurringMemberus-gaap:MortgageBackedSecuritiesOtherMemberus-gaap:FairValueInputsLevel3Member2023-12-310000310522us-gaap:FairValueMeasurementsRecurringMemberus-gaap:MortgageBackedSecuritiesOtherMember2023-12-310000310522us-gaap:FairValueMeasurementsRecurringMemberus-gaap:FairValueInputsLevel1Membersrt:ParentCompanyMember2023-12-310000310522us-gaap:FairValueMeasurementsRecurringMemberus-gaap:FairValueInputsLevel2Membersrt:ParentCompanyMember2023-12-310000310522us-gaap:FairValueMeasurementsRecurringMembersrt:ParentCompanyMemberus-gaap:FairValueInputsLevel3Member2023-12-310000310522us-gaap:FairValueMeasurementsRecurringMembersrt:ParentCompanyMember2023-12-310000310522us-gaap:FairValueMeasurementsRecurringMemberus-gaap:FairValueInputsLevel1Memberus-gaap:VariableInterestEntityPrimaryBeneficiaryMember2023-12-310000310522us-gaap:FairValueMeasurementsRecurringMemberus-gaap:VariableInterestEntityPrimaryBeneficiaryMemberus-gaap:FairValueInputsLevel2Member2023-12-310000310522us-gaap:FairValueMeasurementsRecurringMemberus-gaap:VariableInterestEntityPrimaryBeneficiaryMemberus-gaap:FairValueInputsLevel3Member2023-12-310000310522us-gaap:FairValueMeasurementsRecurringMemberus-gaap:VariableInterestEntityPrimaryBeneficiaryMember2023-12-310000310522us-gaap:MortgageBackedSecuritiesMemberus-gaap:TradingAssetsExcludingDebtAndEquitySecuritiesMember2024-03-310000310522us-gaap:MortgageBackedSecuritiesMemberus-gaap:TradingAssetsExcludingDebtAndEquitySecuritiesMember2024-04-012024-06-300000310522us-gaap:MortgageBackedSecuritiesMemberus-gaap:TradingAssetsExcludingDebtAndEquitySecuritiesMember2024-06-300000310522us-gaap:MortgageBackedSecuritiesIssuedByUSGovernmentSponsoredEnterprisesMemberus-gaap:DebtSecuritiesMember2024-03-310000310522us-gaap:MortgageBackedSecuritiesIssuedByUSGovernmentSponsoredEnterprisesMemberus-gaap:DebtSecuritiesMember2024-04-012024-06-300000310522us-gaap:MortgageBackedSecuritiesIssuedByUSGovernmentSponsoredEnterprisesMemberus-gaap:DebtSecuritiesMember2024-06-300000310522us-gaap:DebtSecuritiesMemberus-gaap:MortgageBackedSecuritiesOtherMember2024-03-310000310522us-gaap:DebtSecuritiesMemberus-gaap:MortgageBackedSecuritiesOtherMember2024-04-012024-06-300000310522us-gaap:DebtSecuritiesMemberus-gaap:MortgageBackedSecuritiesOtherMember2024-06-300000310522us-gaap:DebtSecuritiesMember2024-03-310000310522us-gaap:DebtSecuritiesMember2024-04-012024-06-300000310522us-gaap:DebtSecuritiesMember2024-06-300000310522us-gaap:MortgagesMember2024-03-310000310522us-gaap:MortgagesMember2024-04-012024-06-300000310522us-gaap:MortgagesMember2024-06-300000310522us-gaap:DerivativeMember2024-03-310000310522us-gaap:DerivativeMember2024-04-012024-06-300000310522us-gaap:DerivativeMember2024-06-300000310522us-gaap:LongTermDebtMembersrt:ParentCompanyMember2024-03-310000310522us-gaap:LongTermDebtMembersrt:ParentCompanyMember2024-04-012024-06-300000310522us-gaap:LongTermDebtMembersrt:ParentCompanyMember2024-06-300000310522us-gaap:VariableInterestEntityPrimaryBeneficiaryMemberus-gaap:LongTermDebtMember2024-03-310000310522us-gaap:VariableInterestEntityPrimaryBeneficiaryMemberus-gaap:LongTermDebtMember2024-04-012024-06-300000310522us-gaap:VariableInterestEntityPrimaryBeneficiaryMemberus-gaap:LongTermDebtMember2024-06-300000310522us-gaap:LongTermDebtMember2024-03-310000310522us-gaap:LongTermDebtMember2024-04-012024-06-300000310522us-gaap:LongTermDebtMember2024-06-300000310522us-gaap:MortgageBackedSecuritiesMemberus-gaap:TradingAssetsExcludingDebtAndEquitySecuritiesMember2023-12-310000310522us-gaap:MortgageBackedSecuritiesMemberus-gaap:TradingAssetsExcludingDebtAndEquitySecuritiesMember2024-01-012024-06-300000310522us-gaap:MortgageBackedSecuritiesIssuedByUSGovernmentSponsoredEnterprisesMemberus-gaap:DebtSecuritiesMember2023-12-310000310522us-gaap:MortgageBackedSecuritiesIssuedByUSGovernmentSponsoredEnterprisesMemberus-gaap:DebtSecuritiesMember2024-01-012024-06-300000310522us-gaap:DebtSecuritiesMemberus-gaap:MortgageBackedSecuritiesOtherMember2023-12-310000310522us-gaap:DebtSecuritiesMemberus-gaap:MortgageBackedSecuritiesOtherMember2024-01-012024-06-300000310522us-gaap:DebtSecuritiesMember2023-12-310000310522us-gaap:DebtSecuritiesMember2024-01-012024-06-300000310522us-gaap:MortgagesMember2023-12-310000310522us-gaap:MortgagesMember2024-01-012024-06-300000310522us-gaap:DerivativeMember2023-12-310000310522us-gaap:DerivativeMember2024-01-012024-06-300000310522us-gaap:LongTermDebtMembersrt:ParentCompanyMember2023-12-310000310522us-gaap:LongTermDebtMembersrt:ParentCompanyMember2024-01-012024-06-300000310522us-gaap:VariableInterestEntityPrimaryBeneficiaryMemberus-gaap:LongTermDebtMember2023-12-310000310522us-gaap:VariableInterestEntityPrimaryBeneficiaryMemberus-gaap:LongTermDebtMember2024-01-012024-06-300000310522us-gaap:LongTermDebtMember2023-12-310000310522us-gaap:LongTermDebtMember2024-01-012024-06-300000310522us-gaap:MortgageBackedSecuritiesMemberus-gaap:TradingAssetsExcludingDebtAndEquitySecuritiesMember2023-03-310000310522us-gaap:MortgageBackedSecuritiesMemberus-gaap:TradingAssetsExcludingDebtAndEquitySecuritiesMember2023-04-012023-06-300000310522us-gaap:MortgageBackedSecuritiesMemberus-gaap:TradingAssetsExcludingDebtAndEquitySecuritiesMember2023-06-300000310522us-gaap:MortgageBackedSecuritiesIssuedByUSGovernmentSponsoredEnterprisesMemberus-gaap:DebtSecuritiesMember2023-03-310000310522us-gaap:MortgageBackedSecuritiesIssuedByUSGovernmentSponsoredEnterprisesMemberus-gaap:DebtSecuritiesMember2023-04-012023-06-300000310522us-gaap:MortgageBackedSecuritiesIssuedByUSGovernmentSponsoredEnterprisesMemberus-gaap:DebtSecuritiesMember2023-06-300000310522us-gaap:DebtSecuritiesMemberus-gaap:MortgageBackedSecuritiesOtherMember2023-03-310000310522us-gaap:DebtSecuritiesMemberus-gaap:MortgageBackedSecuritiesOtherMember2023-04-012023-06-300000310522us-gaap:DebtSecuritiesMemberus-gaap:MortgageBackedSecuritiesOtherMember2023-06-300000310522us-gaap:DebtSecuritiesMember2023-03-310000310522us-gaap:DebtSecuritiesMember2023-04-012023-06-300000310522us-gaap:DebtSecuritiesMember2023-06-300000310522us-gaap:MortgagesMember2023-03-310000310522us-gaap:MortgagesMember2023-04-012023-06-300000310522us-gaap:MortgagesMember2023-06-300000310522us-gaap:DerivativeMember2023-03-310000310522us-gaap:DerivativeMember2023-04-012023-06-300000310522us-gaap:DerivativeMember2023-06-300000310522us-gaap:LongTermDebtMembersrt:ParentCompanyMember2023-03-310000310522us-gaap:LongTermDebtMembersrt:ParentCompanyMember2023-04-012023-06-300000310522us-gaap:LongTermDebtMembersrt:ParentCompanyMember2023-06-300000310522us-gaap:VariableInterestEntityPrimaryBeneficiaryMemberus-gaap:LongTermDebtMember2023-03-310000310522us-gaap:VariableInterestEntityPrimaryBeneficiaryMemberus-gaap:LongTermDebtMember2023-04-012023-06-300000310522us-gaap:VariableInterestEntityPrimaryBeneficiaryMemberus-gaap:LongTermDebtMember2023-06-300000310522us-gaap:LongTermDebtMember2023-03-310000310522us-gaap:LongTermDebtMember2023-04-012023-06-300000310522us-gaap:LongTermDebtMember2023-06-300000310522us-gaap:MortgageBackedSecuritiesMemberus-gaap:TradingAssetsExcludingDebtAndEquitySecuritiesMember2022-12-310000310522us-gaap:MortgageBackedSecuritiesMemberus-gaap:TradingAssetsExcludingDebtAndEquitySecuritiesMember2023-01-012023-06-300000310522us-gaap:MortgageBackedSecuritiesIssuedByUSGovernmentSponsoredEnterprisesMemberus-gaap:DebtSecuritiesMember2022-12-310000310522us-gaap:MortgageBackedSecuritiesIssuedByUSGovernmentSponsoredEnterprisesMemberus-gaap:DebtSecuritiesMember2023-01-012023-06-300000310522us-gaap:DebtSecuritiesMemberus-gaap:MortgageBackedSecuritiesOtherMember2022-12-310000310522us-gaap:DebtSecuritiesMemberus-gaap:MortgageBackedSecuritiesOtherMember2023-01-012023-06-300000310522us-gaap:DebtSecuritiesMember2022-12-310000310522us-gaap:DebtSecuritiesMember2023-01-012023-06-300000310522us-gaap:MortgagesMember2022-12-310000310522us-gaap:MortgagesMember2023-01-012023-06-300000310522us-gaap:DerivativeMember2022-12-310000310522us-gaap:DerivativeMember2023-01-012023-06-300000310522us-gaap:LongTermDebtMembersrt:ParentCompanyMember2022-12-310000310522us-gaap:LongTermDebtMembersrt:ParentCompanyMember2023-01-012023-06-300000310522us-gaap:VariableInterestEntityPrimaryBeneficiaryMemberus-gaap:LongTermDebtMember2022-12-310000310522us-gaap:VariableInterestEntityPrimaryBeneficiaryMemberus-gaap:LongTermDebtMember2023-01-012023-06-300000310522us-gaap:LongTermDebtMember2022-12-310000310522us-gaap:LongTermDebtMember2023-01-012023-06-300000310522us-gaap:FairValueMeasurementsRecurringMemberus-gaap:MortgageBackedSecuritiesMemberfnm:OtherValuationTechniqueMemberus-gaap:FairValueInputsLevel3Member2024-06-300000310522us-gaap:USGovernmentCorporationsAndAgenciesSecuritiesMemberus-gaap:FairValueMeasurementsRecurringMemberfnm:ConsensusWithoutInputsMemberus-gaap:FairValueInputsLevel3Member2024-06-300000310522fnm:DiscountedCashFlowWithInputsMemberus-gaap:FairValueMeasurementsRecurringMemberus-gaap:MortgageBackedSecuritiesOtherMemberus-gaap:FairValueInputsLevel3Member2024-06-300000310522us-gaap:MeasurementInputDefaultRateMemberfnm:DiscountedCashFlowWithInputsMemberus-gaap:FairValueMeasurementsRecurringMembersrt:MinimumMemberus-gaap:MortgageBackedSecuritiesOtherMemberus-gaap:FairValueInputsLevel3Member2024-06-300000310522us-gaap:MeasurementInputDefaultRateMemberfnm:DiscountedCashFlowWithInputsMemberus-gaap:FairValueMeasurementsRecurringMembersrt:MaximumMemberus-gaap:MortgageBackedSecuritiesOtherMemberus-gaap:FairValueInputsLevel3Member2024-06-300000310522us-gaap:MeasurementInputDefaultRateMemberfnm:DiscountedCashFlowWithInputsMemberus-gaap:FairValueMeasurementsRecurringMembersrt:WeightedAverageMemberus-gaap:MortgageBackedSecuritiesOtherMemberus-gaap:FairValueInputsLevel3Member2024-06-300000310522us-gaap:FairValueMeasurementsRecurringMemberfnm:SingleVendorWithInputsMemberus-gaap:MortgageBackedSecuritiesOtherMemberus-gaap:FairValueInputsLevel3Member2024-06-300000310522us-gaap:FairValueMeasurementsRecurringMemberfnm:OtherValuationTechniqueMemberus-gaap:MortgageBackedSecuritiesOtherMemberus-gaap:FairValueInputsLevel3Member2024-06-300000310522us-gaap:FairValueMeasurementsRecurringMemberfnm:DealerMarkMemberus-gaap:FairValueInputsLevel3Member2024-06-300000310522fnm:DiscountedCashFlowWithInputsMemberus-gaap:FairValueMeasurementsRecurringMemberus-gaap:FairValueInputsLevel3Member2024-06-300000310522us-gaap:FairValueMeasurementsRecurringMemberus-gaap:MortgageBackedSecuritiesMemberfnm:OtherValuationTechniqueMemberus-gaap:FairValueInputsLevel3Member2023-12-310000310522us-gaap:USGovernmentCorporationsAndAgenciesSecuritiesMemberus-gaap:FairValueMeasurementsRecurringMemberfnm:ConsensusWithoutInputsMemberus-gaap:FairValueInputsLevel3Member2023-12-310000310522fnm:DiscountedCashFlowWithInputsMemberus-gaap:FairValueMeasurementsRecurringMemberus-gaap:MortgageBackedSecuritiesOtherMemberus-gaap:FairValueInputsLevel3Member2023-12-310000310522us-gaap:MeasurementInputDefaultRateMemberfnm:DiscountedCashFlowWithInputsMemberus-gaap:FairValueMeasurementsRecurringMembersrt:MinimumMemberus-gaap:MortgageBackedSecuritiesOtherMemberus-gaap:FairValueInputsLevel3Member2023-12-310000310522us-gaap:MeasurementInputDefaultRateMemberfnm:DiscountedCashFlowWithInputsMemberus-gaap:FairValueMeasurementsRecurringMembersrt:MaximumMemberus-gaap:MortgageBackedSecuritiesOtherMemberus-gaap:FairValueInputsLevel3Member2023-12-310000310522us-gaap:MeasurementInputDefaultRateMemberfnm:DiscountedCashFlowWithInputsMemberus-gaap:FairValueMeasurementsRecurringMembersrt:WeightedAverageMemberus-gaap:MortgageBackedSecuritiesOtherMemberus-gaap:FairValueInputsLevel3Member2023-12-310000310522us-gaap:FairValueMeasurementsRecurringMemberfnm:SingleVendorWithInputsMemberus-gaap:MortgageBackedSecuritiesOtherMemberus-gaap:FairValueInputsLevel3Member2023-12-310000310522us-gaap:FairValueMeasurementsRecurringMemberfnm:OtherValuationTechniqueMemberus-gaap:MortgageBackedSecuritiesOtherMemberus-gaap:FairValueInputsLevel3Member2023-12-310000310522us-gaap:FairValueMeasurementsRecurringMemberfnm:DealerMarkMemberus-gaap:FairValueInputsLevel3Member2023-12-310000310522fnm:DiscountedCashFlowWithInputsMemberus-gaap:FairValueMeasurementsRecurringMemberus-gaap:FairValueInputsLevel3Member2023-12-310000310522us-gaap:FairValueInputsLevel1Memberus-gaap:FairValueMeasurementsNonrecurringMember2023-12-310000310522us-gaap:FairValueInputsLevel1Memberus-gaap:FairValueMeasurementsNonrecurringMember2024-06-300000310522us-gaap:FairValueMeasurementsNonrecurringMemberus-gaap:FairValueInputsLevel2Member2024-06-300000310522us-gaap:FairValueMeasurementsNonrecurringMemberus-gaap:FairValueInputsLevel2Member2023-12-310000310522us-gaap:FairValueMeasurementsNonrecurringMemberus-gaap:FairValueInputsLevel3Member2023-12-310000310522us-gaap:FairValueMeasurementsNonrecurringMemberus-gaap:FairValueInputsLevel3Member2024-06-300000310522fnm:ConsensusWithoutInputsMemberus-gaap:FairValueMeasurementsNonrecurringMemberus-gaap:FairValueInputsLevel3Member2024-06-300000310522fnm:ConsensusWithoutInputsMemberus-gaap:FairValueMeasurementsNonrecurringMemberus-gaap:FairValueInputsLevel3Member2023-12-310000310522us-gaap:FairValueMeasurementsNonrecurringMemberfnm:SingleFamilySegmentMemberus-gaap:FairValueInputsLevel3Memberfnm:InternalModelMember2024-06-300000310522us-gaap:FairValueMeasurementsNonrecurringMemberfnm:SingleFamilySegmentMemberus-gaap:FairValueInputsLevel3Memberfnm:InternalModelMember2023-12-310000310522fnm:AppraisalsMemberfnm:MultifamilySegmentMemberus-gaap:FairValueMeasurementsNonrecurringMemberus-gaap:FairValueInputsLevel3Member2024-06-300000310522fnm:AppraisalsMemberfnm:MultifamilySegmentMemberus-gaap:FairValueMeasurementsNonrecurringMemberus-gaap:FairValueInputsLevel3Member2023-12-310000310522fnm:MultifamilySegmentMemberus-gaap:FairValueMeasurementsNonrecurringMemberfnm:BrokerPriceOpinionMemberus-gaap:FairValueInputsLevel3Member2024-06-300000310522fnm:MultifamilySegmentMemberus-gaap:FairValueMeasurementsNonrecurringMemberfnm:BrokerPriceOpinionMemberus-gaap:FairValueInputsLevel3Member2023-12-310000310522fnm:MultifamilySegmentMemberus-gaap:FairValueMeasurementsNonrecurringMemberus-gaap:FairValueInputsLevel3Memberfnm:InternalModelMember2024-06-300000310522fnm:MultifamilySegmentMemberus-gaap:FairValueMeasurementsNonrecurringMemberus-gaap:FairValueInputsLevel3Memberfnm:InternalModelMember2023-12-310000310522fnm:MultifamilySegmentMemberus-gaap:FairValueMeasurementsNonrecurringMemberus-gaap:FairValueInputsLevel3Member2024-06-300000310522fnm:MultifamilySegmentMemberus-gaap:FairValueMeasurementsNonrecurringMemberus-gaap:FairValueInputsLevel3Member2023-12-310000310522us-gaap:FairValueMeasurementsNonrecurringMemberfnm:AcceptedOffersMemberfnm:SingleFamilySegmentMemberus-gaap:FairValueInputsLevel3Member2024-06-300000310522us-gaap:FairValueMeasurementsNonrecurringMemberfnm:AcceptedOffersMemberfnm:SingleFamilySegmentMemberus-gaap:FairValueInputsLevel3Member2023-12-310000310522fnm:AppraisalsMemberus-gaap:FairValueMeasurementsNonrecurringMemberfnm:SingleFamilySegmentMemberus-gaap:FairValueInputsLevel3Member2024-06-300000310522fnm:AppraisalsMemberus-gaap:FairValueMeasurementsNonrecurringMemberfnm:SingleFamilySegmentMemberus-gaap:FairValueInputsLevel3Member2023-12-310000310522us-gaap:FairValueMeasurementsNonrecurringMemberfnm:WalkForwardsMemberfnm:SingleFamilySegmentMemberus-gaap:FairValueInputsLevel3Member2024-06-300000310522us-gaap:FairValueMeasurementsNonrecurringMemberfnm:WalkForwardsMemberfnm:SingleFamilySegmentMemberus-gaap:FairValueInputsLevel3Member2023-12-310000310522fnm:OtherValuationTechniqueMemberus-gaap:FairValueMeasurementsNonrecurringMemberfnm:SingleFamilySegmentMemberus-gaap:FairValueInputsLevel3Member2024-06-300000310522fnm:OtherValuationTechniqueMemberus-gaap:FairValueMeasurementsNonrecurringMemberfnm:SingleFamilySegmentMemberus-gaap:FairValueInputsLevel3Member2023-12-310000310522us-gaap:FairValueMeasurementsNonrecurringMemberfnm:SingleFamilySegmentMemberus-gaap:FairValueInputsLevel3Member2024-06-300000310522us-gaap:FairValueMeasurementsNonrecurringMemberfnm:SingleFamilySegmentMemberus-gaap:FairValueInputsLevel3Member2023-12-310000310522fnm:OtherValuationTechniqueMemberfnm:MultifamilySegmentMemberus-gaap:FairValueMeasurementsNonrecurringMemberus-gaap:FairValueInputsLevel3Member2024-06-300000310522fnm:OtherValuationTechniqueMemberfnm:MultifamilySegmentMemberus-gaap:FairValueMeasurementsNonrecurringMemberus-gaap:FairValueInputsLevel3Member2023-12-310000310522us-gaap:CarryingReportedAmountFairValueDisclosureMember2024-06-300000310522us-gaap:FairValueInputsLevel1Member2024-06-300000310522us-gaap:FairValueInputsLevel2Member2024-06-300000310522us-gaap:FairValueInputsLevel3Member2024-06-300000310522us-gaap:EstimateOfFairValueFairValueDisclosureMember2024-06-300000310522us-gaap:FairValueDisclosureItemAmountsDomain2024-06-300000310522us-gaap:CarryingReportedAmountFairValueDisclosureMembersrt:ParentCompanyMember2024-06-300000310522us-gaap:FairValueInputsLevel1Membersrt:ParentCompanyMember2024-06-300000310522us-gaap:FairValueInputsLevel2Membersrt:ParentCompanyMember2024-06-300000310522srt:ParentCompanyMemberus-gaap:FairValueInputsLevel3Member2024-06-300000310522srt:ParentCompanyMemberus-gaap:EstimateOfFairValueFairValueDisclosureMember2024-06-300000310522us-gaap:VariableInterestEntityPrimaryBeneficiaryMemberus-gaap:CarryingReportedAmountFairValueDisclosureMember2024-06-300000310522us-gaap:FairValueInputsLevel1Memberus-gaap:VariableInterestEntityPrimaryBeneficiaryMember2024-06-300000310522us-gaap:VariableInterestEntityPrimaryBeneficiaryMemberus-gaap:FairValueInputsLevel2Member2024-06-300000310522us-gaap:VariableInterestEntityPrimaryBeneficiaryMemberus-gaap:FairValueInputsLevel3Member2024-06-300000310522us-gaap:VariableInterestEntityPrimaryBeneficiaryMemberus-gaap:EstimateOfFairValueFairValueDisclosureMember2024-06-300000310522us-gaap:CarryingReportedAmountFairValueDisclosureMember2023-12-310000310522us-gaap:FairValueInputsLevel1Member2023-12-310000310522us-gaap:FairValueInputsLevel2Member2023-12-310000310522us-gaap:FairValueInputsLevel3Member2023-12-310000310522us-gaap:EstimateOfFairValueFairValueDisclosureMember2023-12-310000310522us-gaap:FairValueDisclosureItemAmountsDomain2023-12-310000310522us-gaap:CarryingReportedAmountFairValueDisclosureMembersrt:ParentCompanyMember2023-12-310000310522us-gaap:FairValueInputsLevel1Membersrt:ParentCompanyMember2023-12-310000310522us-gaap:FairValueInputsLevel2Membersrt:ParentCompanyMember2023-12-310000310522srt:ParentCompanyMemberus-gaap:FairValueInputsLevel3Member2023-12-310000310522srt:ParentCompanyMemberus-gaap:EstimateOfFairValueFairValueDisclosureMember2023-12-310000310522us-gaap:VariableInterestEntityPrimaryBeneficiaryMemberus-gaap:CarryingReportedAmountFairValueDisclosureMember2023-12-310000310522us-gaap:FairValueInputsLevel1Memberus-gaap:VariableInterestEntityPrimaryBeneficiaryMember2023-12-310000310522us-gaap:VariableInterestEntityPrimaryBeneficiaryMemberus-gaap:FairValueInputsLevel2Member2023-12-310000310522us-gaap:VariableInterestEntityPrimaryBeneficiaryMemberus-gaap:FairValueInputsLevel3Member2023-12-310000310522us-gaap:VariableInterestEntityPrimaryBeneficiaryMemberus-gaap:EstimateOfFairValueFairValueDisclosureMember2023-12-310000310522us-gaap:LoansReceivableMember2024-06-300000310522us-gaap:LoansReceivableMember2023-12-310000310522us-gaap:LoansReceivableMember2024-04-012024-06-300000310522us-gaap:LoansReceivableMember2024-01-012024-06-300000310522us-gaap:LoansReceivableMember2023-04-012023-06-300000310522us-gaap:LoansReceivableMember2023-01-012023-06-300000310522fnm:SeniorPreferredStockPurchaseAgreementsLitigationMember2023-08-142023-08-140000310522us-gaap:JudicialRulingMember2024-03-202024-03-200000310522fnm:SeniorPreferredStockPurchaseAgreementsLitigationMember2024-03-202024-03-200000310522fnm:SeniorPreferredStockPurchaseAgreementsLitigationMember2023-01-012023-12-310000310522fnm:SeniorPreferredStockPurchaseAgreementsLitigationMember2024-04-012024-06-300000310522fnm:SeniorPreferredStockPurchaseAgreementsLitigationMember2024-01-012024-06-30
UNITED STATES SECURITIES AND EXCHANGE COMMISSION
Washington, D.C. 20549
Form 10-Q
☑ QUARTERLY REPORT PURSUANT TO SECTION 13 OR 15(d) OF THE SECURITIES EXCHANGE ACT OF 1934
For the quarterly period ended June 30, 2024
OR
☐ TRANSITION REPORT PURSUANT TO SECTION 13 OR 15(d) OF THE SECURITIES EXCHANGE ACT OF 1934
For the transition period from to
Commission file number: 0-50231
Federal National Mortgage Association
(Exact name of registrant as specified in its charter)
Fannie Mae
| | | | | | | | | | | | | | | | | | | | | | | | | | | | | |
Federally chartered corporation | 52-0883107 | | 1100 15th Street, NW
| | 800 | | 232-6643 |
| | | Washington, | DC | 20005 | | | | |
(State or other jurisdiction of incorporation or organization) | (I.R.S. Employer Identification No.) | | (Address of principal executive offices, including zip code) | | (Registrant’s telephone number, including area code) |
Securities registered pursuant to Section 12(b) of the Act:
| | | | | | | | |
| Title of each class | Trading Symbol(s) | Name of each exchange on which registered |
| None | N/A | N/A |
Indicate by check mark whether the registrant (1) has filed all reports required to be filed by Section 13 or 15(d) of the Securities Exchange Act of 1934 during the preceding 12 months (or for such shorter period that the registrant was required to file such reports), and (2) has been subject to such filing requirements for the past 90 days. Yes ☑ No ☐
Indicate by check mark whether the registrant has submitted electronically every Interactive Data File required to be submitted pursuant to Rule 405 of Regulation S-T (§ 232.405 of this chapter) during the preceding 12 months (or for such shorter period that the registrant was required to submit such files). Yes ☑ No ☐
Indicate by check mark whether the registrant is a large accelerated filer, an accelerated filer, a non-accelerated filer, a smaller reporting company, or an emerging growth company. See the definitions of “large accelerated filer,” “accelerated filer,” “smaller reporting company,” and “emerging growth company” in Rule 12b-2 of the Exchange Act.
| | | | | | | | | | | | | | |
| Large accelerated filer | ☐ | | Accelerated filer | ☑ |
| Non-accelerated filer | ☐ | | Smaller reporting company | ☐ |
| | | Emerging growth company | ☐ |
If an emerging growth company, indicate by check mark if the registrant has elected not to use the extended transition period for complying with any new or revised financial accounting standards provided pursuant to Section 13(a) of the Exchange Act. ☐
Indicate by check mark whether the registrant is a shell company (as defined in Rule 12b-2 of the Exchange Act). Yes☐ No ☑
As of July 12, 2024, there were 1,158,087,567 shares of common stock of the registrant outstanding.
| | | | | | | | |
| TABLE OF CONTENTS |
| | Page |
| PART I—Financial Information | |
| Item 1. | | |
| | |
| | |
| | |
| | |
| | |
| | |
| | |
| | |
| | |
| | |
| | |
| | |
| | |
| | |
| | |
| | |
| | |
| | |
| | |
| Item 2. | | |
| About Fannie Mae | |
| Executive Summary | |
| | |
| Key Market Economic Indicators | |
| Consolidated Results of Operations | |
| | |
| | |
| | |
| | |
| | |
| Single-Family Mortgage Market | |
| Single-Family Mortgage-Related Securities Issuances Share | |
| Single-Family Business Metrics | |
| Single-Family Business Financial Results | |
| Single-Family Mortgage Credit Risk Management | |
| | |
| Multifamily Mortgage Market | |
| Multifamily Business Metrics | |
| Multifamily Business Financial Results | |
| Multifamily Mortgage Credit Risk Management | |
| Consolidated Credit Ratios and Select Credit Information | |
| | |
| | |
| | |
| | |
| Market Risk Management, including Interest-Rate Risk Management | |
| Critical Accounting Estimates | |
| | |
| | |
| Item 3. | | |
| | | | | | | | |
| Fannie Mae Second Quarter 2024 Form 10-Q | i |
| | | | | | | | |
| Item 4. | | |
| PART II—Other Information | |
| Item 1. | | |
| Item 1A. | | |
| Item 2. | | |
| Item 3. | | |
| Item 4. | | |
| Item 5. | | |
| Item 6. | | |
| | | | | | | | |
| Fannie Mae Second Quarter 2024 Form 10-Q | ii |
PART I—FINANCIAL INFORMATION
Item 2. Management’s Discussion and Analysis of Financial Condition and Results of Operations
You should read this Management’s Discussion and Analysis of Financial Condition and Results of Operations (“MD&A”) in conjunction with our unaudited condensed consolidated financial statements and related notes in this report and the more detailed information in our annual report on Form 10-K for the year ended December 31, 2023 (“2023 Form 10-K”). You can find a “Glossary of Terms Used in This Report” in MD&A in our 2023 Form 10-K.
This report includes forward-looking statements based on management’s current expectations that are subject to significant uncertainties. Future events and our results may differ materially from those reflected in our forward-looking statements due to a variety of factors, including those discussed in “Forward-Looking Statements” and elsewhere in this report and in “Risk Factors” and elsewhere in our 2023 Form 10-K.
About Fannie Mae
Fannie Mae is a leading source of financing for residential mortgages in the United States. We provided $167.6 billion in liquidity to the mortgage market in the first half of 2024, which enabled the financing of approximately 610,000 home purchases, refinancings, and rental units.
We are a government-sponsored, stockholder-owned corporation, chartered by Congress to provide liquidity and stability to the U.S. housing market and to promote access to mortgage credit. We primarily do this by buying residential mortgage loans that are originated by lenders. We place these loans into trusts and issue guaranteed mortgage-backed securities (“MBS” or “Fannie Mae MBS”) that global investors buy from us. We do not originate mortgage loans or lend money directly to borrowers.
We support both single-family and multifamily housing. Our Single-Family business provides financing for properties that have four or fewer residential units. Our Multifamily business provides financing for residential buildings with five or more units. As of March 31, 2024 (the latest date for which information is available), Fannie Mae owned or guaranteed an estimated 1 in 4 single-family mortgage loans in the United States and an estimated 21% of multifamily mortgage debt outstanding in the United States.
We provide a guaranty on the MBS that we issue. If a borrower fails to make a payment on a mortgage loan that is included in a Fannie Mae MBS, we pay the shortfall amount to the MBS investor. In exchange for providing this guaranty, we receive a guaranty fee. Guaranty fees are the primary source of our revenues.
Because we assume the credit risk for mortgage loans in our MBS, our earnings are affected by the credit performance of these loans. Credit risk management is therefore key to our business and financial results. To help manage our mortgage credit risk exposure, and in response to capital requirements, we transfer some of our credit risk exposure to third parties through credit risk transfer transactions and mortgage insurance. For a discussion of how we manage credit risk, see “MD&A—Single-Family Business—Single-Family Mortgage Credit Risk Management” and “MD&A—Multifamily Business—Multifamily Mortgage Credit Risk Management” in this report and in our 2023 Form 10-K.
We are in conservatorship, with the Federal Housing Finance Agency (“FHFA”) as our conservator. During conservatorship, our Board has no fiduciary duties to the company or its stockholders, as they owe their fiduciary duties of care and loyalty solely to FHFA as conservator. Conservatorship and our agreements with the U.S. Department of the Treasury (“Treasury”) significantly restrict our business activities and stockholder rights. For more information about the impact of conservatorship and these agreements on our business, stockholders, and our uncertain future, see “Business—Conservatorship and Treasury Agreements” and “Risk Factors—GSE and Conservatorship Risk” in our 2023 Form 10-K.
| | | | | | | | |
| Fannie Mae Second Quarter 2024 Form 10-Q | 1 |
Executive Summary
Please read this summary together with our MD&A, our condensed consolidated financial statements as of June 30, 2024 and the accompanying notes.
Overview of Financial Results
Summary of Financial Results
Quarterly Results
•Net revenues increased $231 million in the second quarter of 2024 compared with the second quarter of 2023.
•Net income decreased $510 million in the second quarter of 2024 compared with the second quarter of 2023, primarily driven by a decrease in benefit for credit losses on single-family mortgage loans partially offset by an increase in net interest income.
Year-to-Date Results
•Net revenues increased $477 million in the first half of 2024 compared with the first half of 2023.
•Net income increased $38 million in the first half of 2024 compared with the first half of 2023, primarily driven by an increase in net interest income and an increase in fair value gains, partially offset by a decrease in benefit for credit losses on single-family mortgage loans.
•Net worth increased to $86.5 billion as of June 30, 2024 from $77.7 billion as of December 31, 2023.
For more information on the drivers of our financial results, see “Consolidated Results of Operations.”
Legislation and Regulation
The information in this section updates and supplements information regarding legislative, regulatory, conservatorship and other matters affecting our business set forth in “Business—Conservatorship and Treasury Agreements” and “Business—Legislation and Regulation” in our 2023 Form 10-K, as well as in “MD&A—Legislation and Regulation” in our Form 10-Q for the quarter ended March 31, 2024 (“First Quarter 2024 Form 10-Q”). Also see “Risk Factors” in our 2023 Form 10-K for discussions of risks relating to legislative and regulatory matters.
Multifamily Tenant Protections
In July 2024, FHFA established a new tenant protection policy that will be applicable to multifamily properties financed with mortgages backed by Fannie Mae and Freddie Mac. Under the policy, beginning February 28, 2025, covered multifamily borrowers who receive financing from Fannie Mae or Freddie Mac will be required to provide tenants: (1) a 30-day notice of a rent increase, (2) a 30-day notice of a lease term’s expiration, and (3) a minimum 5-day grace period for late rent payments.
| | | | | | | | |
| Fannie Mae Second Quarter 2024 Form 10-Q | 2 |
| | | | | | | | |
| MD&A | Legislation and Regulation |
Quality Control Standards for Automated Valuation Models Final Rule
In July 2024, FHFA and five other federal regulatory agencies issued a final rule to implement the quality control standards mandated by the Dodd-Frank Wall Street Reform and Consumer Protection Act for the use of automated valuation models (referred to as “AVMs”) by mortgage originators and secondary market issuers in determining the collateral worth of a mortgage secured by a consumer’s principal dwelling. Under the final rule, institutions that engage in certain credit decisions or securitization determinations must adopt policies, practices, procedures and control systems to: ensure that AVMs used in these transactions to determine the value of mortgage collateral adhere to quality control standards designed to ensure a high level of confidence in the estimates produced by AVMs; protect against the manipulation of data; seek to avoid conflicts of interest; require random sample testing and reviews; and comply with applicable nondiscrimination laws. The rule will become effective on the first day of the calendar quarter following the date that is 12 months after the date the rule is published in the Federal Register.
| | | | | | | | |
| Fannie Mae Second Quarter 2024 Form 10-Q | 3 |
| | | | | | | | |
| MD&A | Key Market Economic Indicators |
Key Market Economic Indicators
In “MD&A—Key Market Economic Indicators” in our 2023 Form 10-K, we discuss how varying macroeconomic conditions can influence our financial results across different business and economic environments, and we provide forecasts and expectations with respect to some of these macroeconomic conditions. Below we provide an update to these forecasts and expectations, as well as updates to certain macroeconomic information. Our forecasts and expectations are based on many assumptions, subject to many uncertainties and may change, perhaps substantially, from our current forecasts and expectations. See “Risk Factors” in our 2023 Form 10-K and “Forward-Looking Statements” in this report for a discussion of factors that could cause actual results to differ materially from our current forecasts and expectations.
Interest Rates
Selected Benchmark Interest Rates
(1)Refers to the U.S. weekly average fixed-rate mortgage rate according to Freddie Mac’s Primary Mortgage Market Survey®. These rates are reported using the latest available data for a given period.
(2)According to Bloomberg.
(3)Refers to the daily rate per the Federal Reserve Bank of New York.
The average 30-year fixed-rate mortgage rate at the end of the second quarter of 2024 increased slightly compared to the end of the first quarter of 2024 and the end of the fourth quarter of 2023.
Home Prices
Single-Family Quarterly Home Price Growth Rate(1)
(1)Calculated internally using property data on loans purchased by Fannie Mae, Freddie Mac and other third-party home sales data. Fannie Mae’s home price index is a weighted repeat-transactions index, measuring average price changes in repeat sales on the same properties. Fannie Mae’s home price index excludes prices on properties sold in foreclosure. Fannie Mae’s home price growth rates represent estimates based on non-seasonally adjusted preliminary data and are subject to change as additional data becomes available.
Home prices on a national basis grew by an estimated 5.2% in the first half of 2024. We forecast national home price growth of 6.1% for the full year of 2024. We expect regional variation in the timing and rate of home price changes.
| | | | | | | | |
| Fannie Mae Second Quarter 2024 Form 10-Q | 4 |
| | | | | | | | |
| MD&A | Key Market Economic Indicators |
Housing Activity
New Housing Starts(1)
(1)According to the U.S. Census Bureau and subject to revision.
Single-family housing starts decreased modestly in the second quarter of 2024 compared to the first quarter of 2024. We expect single-family housing starts to increase in 2024 overall compared to 2023 due to elevated demand for new single-family housing.
For further discussion on housing activity, see “Single-Family Business—Single-Family Mortgage Market” and “Multifamily Business—Multifamily Mortgage Market.”
Economic Activity
GDP and Unemployment Rate
(1)Real GDP growth (decline) is based on the quarterly series calculated by the Bureau of Economic Analysis and is subject to revision.
(2)According to the U.S. Bureau of Labor Statistics and subject to revision.
U.S. gross domestic product (“GDP”) increased in the first half of 2024. We expect that GDP will continue to grow in the second half of 2024, but at a slower pace than in 2023. The unemployment rate increased in the first half of 2024, and we expect it to continue to increase modestly in the second half of 2024. We expect our economic outlook will be influenced by a number of factors that are subject to change, such as the persistence of inflationary pressures, changes in monetary policy and the risk of financial market disruptions.
See “Risk Factors—Market and Industry Risk” and “Risk Factors—Credit Risk” in our 2023 Form 10-K for further discussion of risks to our business and financial results associated with interest rates, home prices, housing activity, and economic conditions.
| | | | | | | | |
| Fannie Mae Second Quarter 2024 Form 10-Q | 5 |
| | | | | | | | |
| MD&A | Consolidated Results of Operations |
Consolidated Results of Operations
This section discusses our condensed consolidated results of operations and should be read together with our condensed consolidated financial statements and the accompanying notes.
| | | | | | | | | | | | | | | | | | | | | | | | | | | | | | | | | | | | | | | |
Summary of Condensed Consolidated Results of Operations | |
| | For the Three Months Ended June 30, | | | | For the Six Months Ended June 30, | | | |
| | | | | | | |
| | 2024 | | 2023 | | Variance | | 2024 | | 2023 | | Variance | |
| | (Dollars in millions) | |
| Net interest income | | $ | 7,268 | | | $ | 7,035 | | | $ | 233 | | | $ | 14,291 | | | $ | 13,821 | | | $ | 470 | | |
Fee and other income(1) | | 68 | | | 70 | | | (2) | | | 140 | | | 133 | | | 7 | | |
| Net revenues | | 7,336 | | | 7,105 | | | 231 | | | 14,431 | | | 13,954 | | | 477 | | |
| Investment gains (losses), net | | (62) | | | 25 | | | (87) | | | (40) | | | (42) | | | 2 | | |
| Fair value gains (losses), net | | 447 | | | 404 | | | 43 | | | 927 | | | 608 | | | 319 | | |
| Administrative expenses | | (939) | | | (864) | | | (75) | | | (1,868) | | | (1,732) | | | (136) | | |
| Benefit (provision) for credit losses | | 300 | | | 1,266 | | | (966) | | | 480 | | | 1,134 | | | (654) | | |
TCCA fees(2) | | (859) | | | (856) | | | (3) | | | (1,719) | | | (1,711) | | | (8) | | |
Credit enhancement expense(3) | | (405) | | | (384) | | | (21) | | | (824) | | | (725) | | | (99) | | |
Change in expected credit enhancement recoveries(4) | | 37 | | | (160) | | | 197 | | | 100 | | | (40) | | | 140 | | |
Other expenses, net(5) | | (251) | | | (257) | | | 6 | | | (450) | | | (387) | | | (63) | | |
| Income before federal income taxes | | 5,604 | | | 6,279 | | | (675) | | | 11,037 | | | 11,059 | | | (22) | | |
| Provision for federal income taxes | | (1,120) | | | (1,285) | | | 165 | | | (2,233) | | | (2,293) | | | 60 | | |
| Net income | | $ | 4,484 | | | $ | 4,994 | | | $ | (510) | | | $ | 8,804 | | | $ | 8,766 | | | $ | 38 | | |
| Total comprehensive income | | $ | 4,477 | | | $ | 4,995 | | | $ | (518) | | | $ | 8,801 | | | $ | 8,767 | | | $ | 34 | | |
(1)Single-family fee and other income consists primarily of compensation for engaging in structured transactions and providing other lender services. Multifamily fee and other income consists of fees associated with certain Multifamily business activities such as credit enhancements for tax-exempt multifamily housing revenue bonds.
(2)TCCA fees refers to the expense recognized as a result of the 10 basis point increase in guaranty fees on all single-family mortgages delivered to us on or after April 1, 2012 pursuant to the Temporary Payroll Tax Cut Continuation Act of 2011 and as extended by the Infrastructure Investment and Jobs Act, which we pay to Treasury.
(3)Consists of costs associated with our freestanding credit enhancements, which primarily include our Connecticut Avenue Securities® (“CAS”) and Credit Insurance Risk TransferTM (“CIRTTM”) programs, enterprise-paid mortgage insurance and certain lender risk-sharing programs.
(4)Includes estimated changes in benefits, as well as any realized amounts, from our freestanding credit enhancements.
(5)Includes debt extinguishment gains and losses, expenses associated with legal claims, foreclosed property income (expense), gains and losses from partnership investments, housing trust fund expenses, loan subservicing costs, and servicer fees paid in connection with certain loss mitigation activities.
Net Interest Income
Overview
Our primary source of net interest income is guaranty fees we receive for assuming the credit risk on mortgage loans underlying Fannie Mae MBS held by third parties in our guaranty book of business. We also recognize net interest income on the difference between interest income earned on the assets in our retained mortgage portfolio and our corporate liquidity portfolio (collectively, our “portfolios”) and the interest expense associated with our funding debt. In addition, income or expense from hedge accounting is a component of our net interest income. See “MD&A—Consolidated Results of Operations—Net Interest Income” in our 2023 Form 10-K for a description of the components of our single-family and multifamily guaranty fees and the components of our net interest income from our guaranty book of business, portfolios, and hedge accounting.
| | | | | | | | |
| Fannie Mae Second Quarter 2024 Form 10-Q | 6 |
| | | | | | | | |
| MD&A | Consolidated Results of Operations |
Components of Net Interest Income
The table below displays the components of our net interest income from our guaranty book of business, from our portfolios, as well as from hedge accounting.
| | | | | | | | | | | | | | | | | | | | | | | | | | | | | | | | | | | | | | |
| Components of Net Interest Income |
| | For the Three Months Ended June 30, | | | | For the Six Months Ended June 30, | | |
| | 2024 | | 2023 | | Variance | | 2024 | | 2023 | | Variance |
| | (Dollars in millions) |
Net interest income from guaranty book of business: | | | | | | | | | | | | |
Base guaranty fee income(1) | | $ | 4,108 | | | $ | 4,025 | | | $ | 83 | | | $ | 8,198 | | | $ | 8,017 | | | $ | 181 | |
Base guaranty fee income related to TCCA(2) | | 859 | | | 856 | | | 3 | | | 1,719 | | | 1,711 | | | 8 | |
Net deferred guaranty fee income(3) | | 867 | | | 888 | | | (21) | | | 1,644 | | | 1,669 | | | (25) | |
Total net interest income from guaranty book of business | | 5,834 | | | 5,769 | | | 65 | | | 11,561 | | | 11,397 | | | 164 | |
Net interest income from portfolios(4) | | 1,646 | | | 1,568 | | | 78 | | | 3,193 | | | 2,958 | | | 235 | |
Income (expense) from hedge accounting(5) | | (212) | | | (302) | | | 90 | | | (463) | | | (534) | | | 71 | |
Total net interest income | | $ | 7,268 | | | $ | 7,035 | | | $ | 233 | | | $ | 14,291 | | | $ | 13,821 | | | $ | 470 | |
(1)Excludes revenues generated by the 10 basis point guaranty fee increase we implemented pursuant to the TCCA, the incremental revenue from which is paid to Treasury and not retained by us.
(2)Represents revenues generated by the 10 basis point guaranty fee increase we implemented pursuant to the TCCA, the incremental revenue from which is paid to Treasury and not retained by us.
(3)Excludes the amortization of cost basis adjustments resulting from hedge accounting, which is included in income (expense) from hedge accounting.
(4)Includes interest income from assets held in our retained mortgage portfolio and our corporate liquidity portfolio, as well as other assets used to support lender liquidity. Also includes interest expense on our funding debt, including outstanding CAS debt.
(5)For more information about our hedge accounting program, see “Note 9, Derivative Instruments.”
Net interest income increased in the second quarter of 2024 compared with the second quarter of 2023, primarily as a result of lower expense from hedge accounting, higher base guaranty fee income and higher net interest income from portfolios.
•Lower expense from hedge accounting. We had lower expense from hedge accounting in the second quarter of 2024 compared with the second quarter of 2023, primarily driven by lower interest expense on derivatives in hedging relationships in the second quarter of 2024 than in the second quarter of 2023.
•Higher base guaranty fee income. Higher average charged guaranty fees on our single-family guaranty book of business was the primary driver of the increase in base guaranty fee income in the second quarter of 2024 compared with the second quarter of 2023.
•Higher net interest income from portfolios. Higher net interest income from portfolios in the second quarter of 2024 compared with the second quarter of 2023 was primarily driven by higher interest rates in the second quarter of 2024 than in the second quarter of 2023 on securities in our corporate liquidity portfolio, primarily securities purchased under agreements to resell. See “Liquidity and Capital Management—Liquidity Management—Corporate Liquidity Portfolio” for more information about our corporate liquidity portfolio.
Net interest income increased in the first half of 2024 compared with the first half of 2023, primarily as a result of higher net interest income from portfolios and higher base guaranty fee income.
•Higher net interest income from portfolios. Higher net interest income from portfolios in the first half of 2024 compared with the first half of 2023 was primarily driven by slightly higher interest rates in the first half of 2024 than in the first half of 2023 on securities in our corporate liquidity portfolio, primarily securities purchased under agreements to resell. This was partially offset by higher interest expense on funding debt, also as a result of higher interest rates.
•Higher base guaranty fee income. Higher average charged guaranty fees on our single-family guaranty book of business was the primary driver of the increase in base guaranty fee income in the first half of 2024 compared with the first half of 2023.
| | | | | | | | |
| Fannie Mae Second Quarter 2024 Form 10-Q | 7 |
| | | | | | | | |
| MD&A | Consolidated Results of Operations |
Analysis of Unamortized Deferred Guaranty Fees
The following charts present information about the interest rates of the loans in our single-family conventional guaranty book of business as well as information about our deferred guaranty fees.
As shown in the chart below (on the left), nearly all of our single-family conventional guaranty book of business as of June 30, 2024 had an interest rate lower than the average 30-year fixed-rate mortgage rate. Per Freddie Mac’s Primary Mortgage Market Survey®, as of June 27, 2024, the U.S. weekly average interest rate for a single-family 30-year fixed-rate mortgage was 6.86%. Accordingly, even if interest rates decline meaningfully, most of the borrowers whose mortgage loans are in our single-family conventional guaranty book of business still would not be incentivized to refinance.
The other chart below (on the right) presents guaranty fees that will be amortized into deferred guaranty fee income in future periods, which we refer to as “unamortized deferred guaranty fees,” as described in “MD&A—Consolidated Results of Operations—Net Interest Income—Analysis of Unamortized Deferred Guaranty Fees” in our 2023 Form 10-K.
| | | | | | |
Interest Rates of Single-Family Conventional Guaranty Book of Business Compared with Average 30-Year Fixed-Rate Mortgage Rate | Unamortized Deferred Guaranty Fees(1) | |
| As of June 30, 2024 | (Dollars in billions) | |
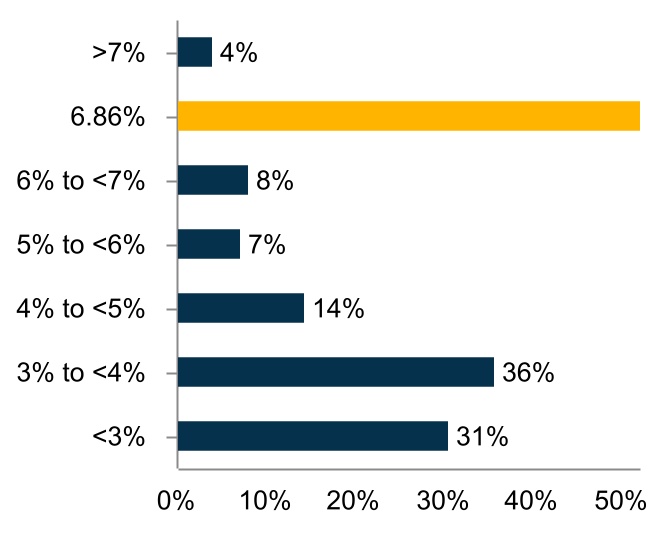
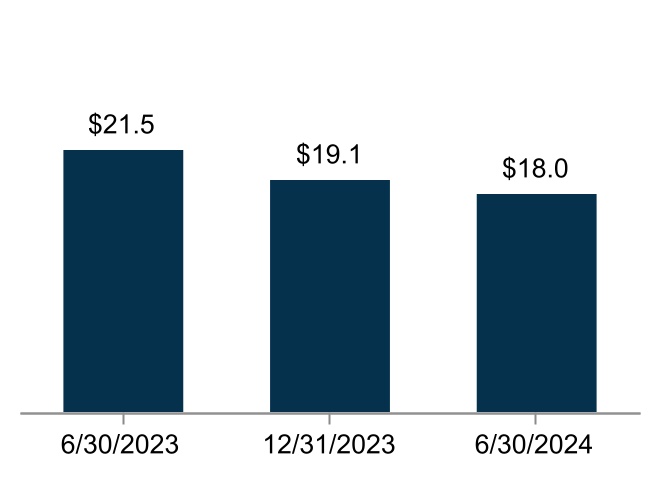
| | | | | | | | | | | | | | | | | |
| — | | Represents the average 30-year fixed-rate mortgage rate as of June 27, 2024, according to Freddie Mac’s Primary Mortgage Market Survey®, the last published rate for the quarter ending June 30, 2024. | (1) | | | Represents the net unamortized cost basis adjustments (consisting of premiums and discounts on single-family and multifamily mortgage loans and debt of consolidated trusts) that will be recognized through deferred guaranty fee income over the remaining contractual life of the mortgage loans or debt. Although we are in a net premium position for both mortgage loans and debt of consolidated trusts, we have a greater amount of premiums with respect to debt of consolidated trusts. Primarily as a result of the upfront fees we charge, the net amortization of these cost basis adjustments will result in income. |
| | | |
| — | | Represents the percentage of single-family conventional guaranty book of business by select interest rate band based on the current interest rate of the mortgage loans. | | |
| | | | | | | | |
| Fannie Mae Second Quarter 2024 Form 10-Q | 8 |
| | | | | | | | |
| MD&A | Consolidated Results of Operations |
Analysis of Net Interest Income
The table below displays an analysis of our net interest income, average balances and related yields earned on assets and incurred on liabilities. For most components of the average balances, we use a daily weighted average of unpaid principal balance net of unamortized cost basis adjustments. When daily average balance information is not available, such as for mortgage loans, we use monthly averages.
| | | | | | | | | | | | | | | | | | | | | | | | | | | | | | | | | | | | | | |
Analysis of Net Interest Income and Yield(1) |
| | For the Three Months Ended June 30, |
| | 2024 | | 2023 |
| | Average Balance | | Interest Income/ (Expense) | | Average Rates Earned/Paid | | Average Balance | | Interest Income/ (Expense) | | Average Rates Earned/Paid |
| | (Dollars in millions) |
Interest-earning assets: | | | | | | | | | | | | |
Cash and cash equivalents(2) | | $ | 46,802 | | | $ | 633 | | | 5.41 | % | | $ | 63,956 | | | $ | 807 | | | 5.05 | % |
Securities purchased under agreements to resell | | 50,898 | | | 693 | | | 5.45 | | | 41,131 | | | 524 | | | 5.10 | |
Investments in securities(3) | | 51,974 | | | 282 | | | 2.17 | | | 53,965 | | | 294 | | | 2.18 | |
| Mortgage loans: | | | | | | | | | | | | |
Mortgage loans of Fannie Mae | | 50,041 | | | 568 | | | 4.54 | | | 51,961 | | | 611 | | | 4.70 | |
Mortgage loans of consolidated trusts | | 4,086,295 | | | 35,049 | | | 3.43 | | | 4,075,543 | | | 32,044 | | | 3.15 | |
Total mortgage loans(4) | | 4,136,336 | | | 35,617 | | | 3.44 | | | 4,127,504 | | | 32,655 | | | 3.16 | |
Advances to lenders | | 2,962 | | | 50 | | | 6.75 | | | 3,798 | | | 60 | | | 6.32 | |
Total interest-earning assets | | $ | 4,288,972 | | | $ | 37,275 | | | 3.48 | % | | $ | 4,290,354 | | | $ | 34,340 | | | 3.20 | % |
Interest-bearing liabilities: | | | | | | | | | | | | |
Short-term funding debt | | $ | 9,996 | | | $ | (130) | | | 5.20 | % | | $ | 14,841 | | | $ | (183) | | | 4.93 | % |
Long-term funding debt | | 101,671 | | | (921) | | | 3.62 | | | 119,572 | | | (936) | | | 3.13 | |
CAS debt | | 2,431 | | | (69) | | | 11.35 | | | 4,319 | | | (109) | | | 10.09 | |
Total debt of Fannie Mae | | 114,098 | | | (1,120) | | | 3.93 | | | 138,732 | | | (1,228) | | | 3.54 | |
Debt securities of consolidated trusts held by third parties | | 4,083,048 | | | (28,887) | | | 2.83 | | | 4,078,979 | | | (26,077) | | | 2.56 | |
Total interest-bearing liabilities | | $ | 4,197,146 | | | $ | (30,007) | | | 2.86 | % | | $ | 4,217,711 | | | $ | (27,305) | | | 2.59 | % |
Net interest income/net interest yield | | | | $ | 7,268 | | | 0.68 | % | | | | $ | 7,035 | | | 0.66 | % |
| | | | | | | | |
| Fannie Mae Second Quarter 2024 Form 10-Q | 9 |
| | | | | | | | |
| MD&A | Consolidated Results of Operations |
| | | | | | | | | | | | | | | | | | | | | | | | | | | | | | | | | | | | | | |
| | For the Six Months Ended June 30, |
| | 2024 | | 2023 |
| | Average Balance | | Interest Income/ (Expense) | | Average Rates Earned/Paid | | Average Balance | | Interest Income/ (Expense) | | Average Rates Earned/Paid |
| | (Dollars in millions) |
| Interest-earning assets: | | | | | | | | | | | | |
Cash and cash equivalents(2) | | $ | 46,408 | | | $ | 1,254 | | | 5.40 | % | | $ | 62,780 | | | $ | 1,504 | | | 4.79 | % |
| Securities purchased under agreements to resell | | 48,240 | | | 1,315 | | | 5.45 | | | 38,951 | | | 942 | | | 4.81 | |
Investments in securities(3) | | 52,930 | | | 582 | | | 2.20 | | | 54,102 | | | 578 | | | 2.14 | |
| Mortgage loans: | | | | | | | | | | | | |
| Mortgage loans of Fannie Mae | | 50,396 | | | 1,135 | | | 4.50 | | | 52,251 | | | 1,218 | | | 4.66 | |
| Mortgage loans of consolidated trusts | | 4,089,520 | | | 69,698 | | | 3.41 | | | 4,074,813 | | | 63,574 | | | 3.12 | |
Total mortgage loans(4) | | 4,139,916 | | | 70,833 | | | 3.42 | | | 4,127,064 | | | 64,792 | | | 3.14 | |
| Advances to lenders | | 2,658 | | | 89 | | | 6.70 | | | 3,082 | | | 94 | | | 6.07 | |
| Total interest-earning assets | | $ | 4,290,152 | | | $ | 74,073 | | | 3.45 | % | | $ | 4,285,979 | | | $ | 67,910 | | | 3.17 | % |
| Interest-bearing liabilities: | | | | | | | | | | | | |
| Short-term funding debt | | $ | 12,496 | | | $ | (325) | | | 5.20 | % | | $ | 12,733 | | | $ | (302) | | | 4.72 | % |
| Long-term funding debt | | 102,213 | | | (1,840) | | | 3.60 | | | 119,016 | | | (1,744) | | | 2.93 | |
| CAS debt | | 2,536 | | | (143) | | | 11.28 | | | 4,727 | | | (232) | | | 9.82 | |
| Total debt of Fannie Mae | | 117,245 | | | (2,308) | | | 3.94 | | | 136,476 | | | (2,278) | | | 3.34 | |
| Debt securities of consolidated trusts held by third parties | | 4,085,866 | | | (57,474) | | | 2.81 | | | 4,078,066 | | | (51,811) | | | 2.54 | |
| Total interest-bearing liabilities | | $ | 4,203,111 | | | $ | (59,782) | | | 2.84 | % | | $ | 4,214,542 | | | $ | (54,089) | | | 2.57 | % |
| Net interest income/net interest yield | | | | $ | 14,291 | | | 0.67 | % | | | | $ | 13,821 | | | 0.64 | % |
(1) Includes the effects of discounts, premiums and other cost basis adjustments, including basis adjustments related to hedge accounting.
(2) Prior to March 31, 2024, “Cash and cash equivalents” were previously reported within “Investments in securities.” Prior periods have been updated to conform to the current period presentation. Cash equivalents are composed of overnight reverse repurchase agreements and U.S. Treasuries, if any, that have a maturity at the date of acquisition of three months or less.
(3) Consists of U.S. Treasuries not classified as cash equivalents and mortgage-related securities.
(4) Average balance includes mortgage loans on nonaccrual status. Interest income includes loan fees of $699 million and $1.4 billion, respectively, for the second quarter of 2024 and first half of 2024, compared with $746 million and $1.4 billion, respectively, for the second quarter of 2023 and first half of 2023. Loan fees primarily consist of yield maintenance revenue we recognized on the prepayment of multifamily mortgage loans and the amortization of upfront cash fees exchanged when we acquire the mortgage loan.
| | | | | | | | |
| Fannie Mae Second Quarter 2024 Form 10-Q | 10 |
| | | | | | | | |
| MD&A | Consolidated Results of Operations |
Fair Value Gains (Losses), Net
The estimated fair value of our derivatives, trading securities and other financial instruments carried at fair value may fluctuate substantially from period to period because of changes in interest rates, the yield curve, mortgage and credit spreads and implied volatility, as well as activity related to these financial instruments.
The table below displays the components of our fair value gains and losses.
| | | | | | | | | | | | | | | | | | | | | | | | | | |
| Fair Value Gains (Losses), Net |
| | For the Three Months Ended June 30, | | For the Six Months Ended June 30, |
| | 2024 | | 2023 | | 2024 | | 2023 |
| | (Dollars in millions) |
Risk management derivatives fair value gains (losses) attributable to: | | | | | | | | |
Net contractual interest income (expense) on interest-rate swaps(1) | | $ | (288) | | | $ | (394) | | | $ | (588) | | | $ | (775) | |
| Net change in fair value during the period | | 396 | | | 505 | | | 1,029 | | | 692 | |
| | | | | | | | |
| | | | | | | | |
Impact of hedge accounting(2) | | 109 | | | 637 | | | 256 | | | 622 | |
| Risk management derivatives fair value gains (losses), net | | 217 | | | 748 | | | 697 | | | 539 | |
| Mortgage commitment derivatives fair value gains (losses), net | | 94 | | | 198 | | | 301 | | | 84 | |
| Credit enhancement derivatives fair value gains (losses), net | | 1 | | | 29 | | | (14) | | | 14 | |
| Total derivatives fair value gains (losses), net | | 312 | | | 975 | | | 984 | | | 637 | |
| Trading securities gains (losses), net | | 121 | | | (723) | | | (140) | | | 23 | |
| Long-term debt fair value gains (losses), net | | 17 | | | 219 | | | 128 | | | (50) | |
Other, net(3) | | (3) | | | (67) | | | (45) | | | (2) | |
| Fair value gains (losses), net | | $ | 447 | | | $ | 404 | | | $ | 927 | | | $ | 608 | |
(1)“Net contractual interest income (expense) on interest-rate swaps” is primarily impacted by changes in interest rates and changes in the composition of our interest-rate swaps portfolio.
(2)The “Impact of hedge accounting” reflected in this table shows the net gain or loss from swaps in hedging relationships plus any accrued interest during the applicable periods that are recognized in “Net interest income.”
(3)Consists primarily of fair value gains and losses on mortgage loans held at fair value.
Fair value gains, net in the second quarter and first half of 2024 were primarily driven by rising interest rates, which drove gains on risk management derivatives and mortgage commitment derivatives. Also contributing to fair value gains, net in the second quarter of 2024 were fair value gains on trading securities, which were primarily driven by our holdings of U.S. Treasury securities moving closer to maturity, which resulted in the reversal of previously recognized fair value losses.
Fair value gains, net in the second quarter of 2023 were primarily driven by gains on:
•risk management derivatives due to rising interest rates; and
•long-term debt of consolidated trusts held at fair value due to rising interest rates and widening of the secondary spread, which is the spread between the 30-year MBS current coupon yield and 10-year U.S. Treasury rate.
These gains were partially offset by losses on trading securities, primarily driven by rising interest rates, which resulted in losses on fixed-rate securities as prices fell.
Fair value gains, net in the first half of 2023 were primarily driven by rising interest rates, which drove gains on risk management derivatives.
| | | | | | | | |
| Fannie Mae Second Quarter 2024 Form 10-Q | 11 |
| | | | | | | | |
| MD&A | Consolidated Results of Operations |
Benefit (Provision) for Credit Losses
The table below provides a quantitative analysis of the drivers of our single-family and multifamily benefit or provision for credit losses and the change in expected credit enhancement recoveries. Many of the drivers that contribute to our benefit or provision for credit losses overlap or are interdependent. The components shown below are based on internal allocation estimates. The benefit or provision for credit losses includes our benefit or provision for loan losses, accrued interest receivable losses, our guaranty loss reserves, and credit losses on our available-for-sale (“AFS”) debt securities. For purposes of this attribution table, credit losses on AFS securities are excluded.
| | | | | | | | | | | | | | | | | | | | | | | | | | |
Components of Benefit (Provision) for Credit Losses and Change in Expected Credit Enhancement Recoveries |
| | For the Three Months Ended June 30, | | For the Six Months Ended June 30, |
| | 2024 | | 2023 | | 2024 | | 2023 |
| | (Dollars in millions) |
Single-family benefit (provision) for credit losses: | | | | | | | | |
Changes in loan activity(1) | | $ | (205) | | | $ | (390) | | | $ | (441) | | | $ | (740) | |
Redesignation of loans from held for investment (“HFI”) to held for sale (“HFS”) | | (14) | | | — | | | (35) | | | — | |
Actual and forecasted home prices | | 606 | | | 1,724 | | | 1,326 | | | 2,104 | |
Actual and projected interest rates | | (56) | | | (146) | | | (233) | | | (24) | |
Other(2) | | 217 | | | 230 | | | 266 | | | 125 | |
Single-family benefit (provision) for credit losses | | 548 | | | 1,418 | | | 883 | | | 1,465 | |
Multifamily benefit (provision) for credit losses: | | | | | | | | |
Changes in loan activity(1) | | (100) | | | (74) | | | (166) | | | (84) | |
Actual and projected interest rates | | (37) | | | (65) | | | (101) | | | 8 | |
Actual and projected economic data(3) | | (154) | | | (121) | | | (71) | | | (303) | |
Other | | 43 | | | 108 | | | (65) | | | 48 | |
Multifamily benefit (provision) for credit losses | | (248) | | | (152) | | | (403) | | | (331) | |
Total benefit (provision) for credit losses | | $ | 300 | | | $ | 1,266 | | | $ | 480 | | | $ | 1,134 | |
| | | | | | | | |
Change in expected credit enhancement recoveries:(4) | | | | | | | | |
Single-family | | $ | (47) | | | $ | (223) | | | $ | (89) | | | $ | (128) | |
Multifamily | | 84 | | | 63 | | | 189 | | | 88 | |
Change in expected credit enhancement recoveries | | $ | 37 | | | $ | (160) | | | $ | 100 | | | $ | (40) | |
| | | | | | | | |
(1)Primarily consists of loan acquisitions, liquidations, changes in loan delinquencies and write-offs of amounts determined to be uncollectible. For multifamily, “Changes in loan activity” also includes changes in the allowance due to loan delinquencies and the impact of changes in debt service coverage ratios (“DSCRs”) based on updated property financial information, which is used to assess loan credit quality.
(2)Includes provision for allowance on accrued interest receivable and impacts of model enhancements. Also includes any benefit or provision for our guaranty loss reserves that are not separately included in the other components. Beginning with the period ended March 31, 2024, also includes the release of economic concessions related to loans previously designated as troubled debt restructurings (“TDRs”) that received loss mitigation arrangements during the period. Prior periods have been updated to conform to the current period presentation.
(3)Primarily consists of changes attributed to projected property net operating income, actual and projected property values, and labor market forecasts.
(4)Beginning with the period ended December 31, 2023, “Change in expected credit enhancement recoveries” as presented in this table includes activity associated with both active and inactive loans. Previously, this presentation only included active loans. Prior periods have been updated to conform to the current period presentation.
| | | | | | | | |
| Fannie Mae Second Quarter 2024 Form 10-Q | 12 |
| | | | | | | | |
| MD&A | Consolidated Results of Operations |
Single-Family Benefit (Provision) for Credit Losses
Our single-family benefit for credit losses in the second quarter and first half of 2024 was primarily driven by a benefit from actual and forecasted home price growth, partially offset by a provision from changes in loan activity, as described below:
•Benefit from actual and forecasted home price growth. During the second quarter and first half of 2024, actual home prices appreciated more than originally projected and our forecast of future home prices also improved. Higher home prices decrease the likelihood that loans will default and reduce the amount of losses on loans that do default, which impacts our estimate of losses and ultimately reduces our loss reserves and provision for credit losses. See “Key Market Economic Indicators” in our 2023 Form 10-K for additional information about how home prices affect our credit loss estimates. See “Key Market Economic Indicators” in this report for a discussion of home price growth and our home price forecast. Also see “Critical Accounting Estimates” in this report for more information about our home price forecast.
•Provision from changes in loan activity. This includes provision on newly acquired loans and was primarily driven by the credit risk profile of our single-family acquisitions for the second quarter and first half of 2024, which primarily consisted of purchase loans. Purchase loans generally have higher origination loan-to-value (“LTV”) ratios than refinance loans; therefore, purchase loans have a higher estimated risk of default and loss severity in the allowance than refinance loans and a correspondingly higher credit loss provision at the time of acquisition.
Our single-family benefit for credit losses in the second quarter of 2023 and first half of 2023 was primarily driven by a benefit from actual and forecasted home price growth, partially offset by a provision from changes in loan activity, as described in more detail below:
•Benefit from actual and forecasted home price growth. During the second quarter and first half of 2023, we observed strong actual home price appreciation. In addition, our updated 2023 home price forecast changed from our prior estimate, resulting in a shift to positive home price appreciation for the year.
•Provision from changes in loan activity. This includes provision on newly acquired loans and was primarily driven by the credit risk profile of our single-family acquisitions for the second quarter and first half of 2023, as described in our quarterly report on Form 10-Q for the quarter ended June 30, 2023.
Multifamily Benefit (Provision) for Credit Losses
Our multifamily provision for credit losses in the second quarter of 2024 was primarily driven by continued declines in estimated actual and near-term projected multifamily property values and the impact of new 30-day loan delinquencies in our multifamily guaranty book of business, including provision attributable to a portfolio of approximately $600 million of adjustable-rate conventional loans that we anticipate will become seriously delinquent in the near term.
Our multifamily provision for credit losses in the first half of 2024 was primarily driven by declines in estimated actual and near-term projected multifamily property values, the impact of new 30-day loan delinquencies in our multifamily guaranty book of business, and increases in actual and projected interest rates. Provision related to estimated actual and near-term projected multifamily property values, along with the impact of offsetting factors, is presented in “actual and projected economic data” in the table above. Provision related to changes in loan delinquencies is presented in “changes in loan activity” in the table above.
Our multifamily provision for credit losses for the second quarter and first half of 2023 was primarily driven by decreases in estimated multifamily property values. This resulted in higher estimated LTV ratios on the loans in our multifamily guaranty book of business, which increased our estimate of expected credit losses on these loans. This provision is included in the “actual and projected economic data” line item in the table above.
| | | | | | | | |
| Fannie Mae Second Quarter 2024 Form 10-Q | 13 |
| | | | | | | | |
| MD&A | Consolidated Balance Sheet Analysis |
Consolidated Balance Sheet Analysis
This section discusses our condensed consolidated balance sheets and should be read together with our condensed consolidated financial statements and the accompanying notes.
| | | | | | | | | | | | | | | | | | | | |
| Summary of Condensed Consolidated Balance Sheets |
| | As of | | |
| | June 30, 2024 | | December 31, 2023 | | Variance |
| | (Dollars in millions) |
Assets | | | | | | |
Cash and cash equivalents | | $ | 41,911 | | | $ | 35,817 | | | $ | 6,094 | |
| Restricted cash and cash equivalents | | 36,402 | | | 32,889 | | | 3,513 | |
Securities purchased under agreements to resell | | 27,650 | | | 30,700 | | | (3,050) | |
| Investments in securities, at fair value | | 49,899 | | | 53,116 | | | (3,217) | |
| Mortgage loans: | | | | | | |
| Of Fannie Mae | | 49,832 | | | 50,325 | | | (493) | |
| Of consolidated trusts | | 4,087,408 | | | 4,094,036 | | | (6,628) | |
| Allowance for loan losses | | (8,026) | | | (8,730) | | | 704 | |
| Mortgage loans, net of allowance for loan losses | | 4,129,214 | | | 4,135,631 | | | (6,417) | |
| Deferred tax assets, net | | 11,036 | | | 11,681 | | | (645) | |
| Other assets | | 27,781 | | | 25,603 | | | 2,178 | |
| Total assets | | $ | 4,323,893 | | | $ | 4,325,437 | | | $ | (1,544) | |
| Liabilities and equity | | | | | | |
| Debt: | | | | | | |
| Of Fannie Mae | | $ | 118,543 | | | $ | 124,065 | | | $ | (5,522) | |
| Of consolidated trusts | | 4,094,421 | | | 4,098,653 | | | (4,232) | |
| Other liabilities | | 24,446 | | | 25,037 | | | (591) | |
| Total liabilities | | 4,237,410 | | | 4,247,755 | | | (10,345) | |
| Fannie Mae stockholders’ equity: | | | | | | |
| Senior preferred stock | | 120,836 | | | 120,836 | | | — | |
| Other net deficit | | (34,353) | | | (43,154) | | | 8,801 | |
| Total equity | | 86,483 | | | 77,682 | | | 8,801 | |
| Total liabilities and equity | | $ | 4,323,893 | | | $ | 4,325,437 | | | $ | (1,544) | |
| | | | | | |
Cash and Cash Equivalents
Cash and cash equivalents increased from December 31, 2023 to June 30, 2024 primarily driven by funds being invested in overnight reverse repurchase agreements rather than funds being invested in securities purchased under agreements to resell, and the continued accumulation of earnings retained from our operations, partially offset by redemptions of funding debt outpacing issuances. See “Liquidity and Capital Management—Liquidity Management—Cash Flows” for additional information on our cash activity in the first half of 2024.
Mortgage Loans, Net of Allowance
The mortgage loans reported in our condensed consolidated balance sheets are classified as either HFS or HFI and include loans owned by Fannie Mae and loans held in consolidated trusts.
Mortgage loans, net of allowance for loan losses decreased from December 31, 2023 to June 30, 2024, driven primarily by loan paydowns, liquidations and sales outpacing acquisitions during the first half of 2024.
For additional information on our mortgage loans, see “Note 4, Mortgage Loans,” and for additional information on changes in our allowance for loan losses, see “Note 5, Allowance for Loan Losses.”
Debt
The decrease in debt of Fannie Mae from December 31, 2023 to June 30, 2024 was due to redemptions outpacing new issuances. The decrease in debt of consolidated trusts from December 31, 2023 to June 30, 2024 was primarily driven
| | | | | | | | |
| Fannie Mae Second Quarter 2024 Form 10-Q | 14 |
| | | | | | | | |
| MD&A | Consolidated Balance Sheet Analysis |
by liquidations of Fannie Mae MBS outpacing issuances. See “Liquidity and Capital Management—Liquidity Management—Debt Funding” for a summary of activity in debt of Fannie Mae and information on our outstanding short-term and long-term debt. Also see “Note 8, Short-Term and Long-Term Debt” for additional information on our total outstanding debt.
Stockholders’ Equity
Our stockholders’ equity (also referred to as our net worth) increased to $86.5 billion as of June 30, 2024, compared with $77.7 billion as of December 31, 2023, due to the $8.8 billion in comprehensive income recognized during the first half of 2024.
Retained Mortgage Portfolio
We use our retained mortgage portfolio primarily to provide liquidity to the mortgage market through portfolio securitization transactions and to support our loss mitigation activities.
Our retained mortgage portfolio consists of mortgage loans and mortgage-related securities that we own, including Fannie Mae MBS and non-Fannie Mae mortgage-related securities. Assets held by consolidated MBS trusts that back mortgage-related securities owned by third parties are not included in our retained mortgage portfolio.
We separate the instruments within our retained mortgage portfolio into three categories based on each instrument’s use:
•Lender liquidity, which includes balances related to our portfolio securitization activity, supports our efforts to provide liquidity to the single-family and multifamily mortgage markets.
•Loss mitigation supports our loss mitigation efforts through the purchase of delinquent loans from our MBS trusts.
•Other represents assets that we previously purchased for investment purposes.
The table below displays the components of our retained mortgage portfolio. Based on the nature of the asset, these balances are included in either “Investments in securities, at fair value” or “Mortgage loans, net of allowance for loan losses” in our “Summary of Condensed Consolidated Balance Sheets” table above.
| | | | | | | | | | | | | | |
Retained Mortgage Portfolio |
| | As of |
| | June 30, 2024 | | December 31, 2023 |
| | (Dollars in millions) |
| Lender liquidity: | | | | |
Agency securities(1) | | $ | 26,311 | | | $ | 27,823 | |
| Mortgage loans | | 8,250 | | | 7,101 | |
| Total lender liquidity | | 34,561 | | | 34,924 | |
Loss mitigation mortgage loans(2) | | 38,382 | | | 38,634 | |
| Other: | | | | |
Reverse mortgage loans and securities(3) | | 4,413 | | | 5,953 | |
Other mortgage loans and securities(4) | | 2,721 | | | 3,683 | |
| | | | |
| | | | |
| | | | |
| | | | |
| Total other | | 7,134 | | | 9,636 | |
| Total retained mortgage portfolio | | $ | 80,077 | | | $ | 83,194 | |
| | | | |
| Retained mortgage portfolio by segment: | | | | |
| Single-family mortgage loans and mortgage-related securities | | $ | 75,311 | | | $ | 77,357 | |
| Multifamily mortgage loans and mortgage-related securities | | $ | 4,766 | | | $ | 5,837 | |
(1)Consists of Fannie Mae, Freddie Mac and Ginnie Mae mortgage-related securities, including Freddie Mac securities guaranteed by Fannie Mae. Excludes Fannie Mae and Ginnie Mae reverse mortgage securities and Fannie Mae-wrapped private-label securities.
(2)Includes single-family loans on nonaccrual status of $9.0 billion and $8.1 billion as of June 30, 2024 and December 31, 2023, respectively. Also includes multifamily loans on nonaccrual status of $2.2 billion and $2.0 billion as of June 30, 2024 and December 31, 2023, respectively.
(3)Includes Fannie Mae and Ginnie Mae reverse mortgage securities. We stopped acquiring newly originated reverse mortgage loans in 2010.
| | | | | | | | |
| Fannie Mae Second Quarter 2024 Form 10-Q | 15 |
| | | | | | | | |
| MD&A | Retained Mortgage Portfolio |
(4) Other mortgage loans primarily includes multifamily loans on accrual status and single-family loans that are not included in the loss mitigation or lender liquidity categories. Other mortgage securities primarily includes private-label securities and mortgage revenue bonds.
The amount of mortgage assets that we may own is capped at $225 billion under the terms of our senior preferred stock purchase agreement with Treasury. In addition, we are currently required to cap our mortgage assets at $202.5 billion per instructions from FHFA. We include 10% of the notional value of the interest-only securities we hold in calculating the size of the retained mortgage portfolio for the purpose of determining compliance with the senior preferred stock purchase agreement mortgage assets cap and associated FHFA instructions. As of June 30, 2024, 10% of the notional value of our interest-only securities was $1.7 billion, which is not included in the table above.
Under the terms of our MBS trust documents, we have the option or, in some instances, the obligation, to purchase mortgage loans that meet specific criteria from an MBS trust. The purchase price for these loans is the unpaid principal balance of the loans plus accrued interest. If a delinquent loan remains in a single-family MBS trust, the servicer is responsible for advancing the borrower’s missed scheduled principal and interest payments to the MBS holders for up to four months, after which time we must make these missed payments. In addition, we must reimburse servicers for advanced principal and interest payments.
In support of our loss mitigation strategies, we purchased $6.3 billion of loans from our single-family MBS trusts in the first half of 2024, the substantial majority of which were delinquent, compared with $4.5 billion of loans purchased from single-family MBS trusts in the first half of 2023.
Guaranty Book of Business
Our “guaranty book of business” consists of:
•Fannie Mae MBS outstanding, excluding the portions of any structured securities we issue that are backed by Freddie Mac securities;
•mortgage loans of Fannie Mae held in our retained mortgage portfolio; and
•other credit enhancements that we provide on mortgage assets.
“Total Fannie Mae guarantees” consists of:
•our guaranty book of business; and
•the portions of any structured securities we issue that are backed by Freddie Mac securities.
We and Freddie Mac issue single-family uniform mortgage-backed securities, or “UMBS.” We use the term “Fannie Mae MBS” or “our MBS” to refer to any type of mortgage-backed security that we issue, including UMBS®, Supers®, Real Estate Mortgage Investment Conduit securities (“REMICs”) and other types of single-family or multifamily mortgage-backed securities.
Some Fannie Mae MBS that we issue are backed in whole or in part by Freddie Mac securities. When we resecuritize Freddie Mac securities into Fannie Mae-issued structured securities, such as Supers and REMICs, our guaranty of principal and interest extends to the underlying Freddie Mac securities. However, Freddie Mac continues to guarantee the payment of principal and interest on the underlying Freddie Mac securities that we have resecuritized. References to our single-family guaranty book of business exclude Freddie Mac-acquired mortgage loans underlying Freddie Mac securities that we have resecuritized.
Our issuance of structured securities backed in whole or in part by Freddie Mac securities creates additional off-balance sheet exposure. Our guaranty extends to the underlying Freddie Mac security included in the structured security, but we do not have control over the Freddie Mac mortgage loan securitizations. Because we do not have the power to direct matters (primarily the servicing of mortgage loans) that impact the credit risk to which we are exposed, which constitute control of these securitization trusts, we do not consolidate these trusts in our condensed consolidated balance sheet, giving rise to off-balance sheet exposure. See “Liquidity and Capital Management—Liquidity Management—Off-Balance Sheet Arrangements” and “Note 7, Financial Guarantees” for information regarding our maximum exposure to loss on unconsolidated Fannie Mae MBS and Freddie Mac securities.
| | | | | | | | |
| Fannie Mae Second Quarter 2024 Form 10-Q | 16 |
| | | | | | | | |
| MD&A | Guaranty Book of Business |
The table below displays the composition of our guaranty book of business based on unpaid principal balance.
| | | | | | | | | | | | | | | | | | | | | | | | | | | | | | | | | | | | | | |
Composition of Fannie Mae Guaranty Book of Business |
| | As of |
| | June 30, 2024 | | December 31, 2023 |
| | Single-Family | | Multifamily | | Total | | Single-Family | | Multifamily | | Total |
| | (Dollars in millions) |
Conventional guaranty book of business(1) | | $ | 3,639,052 | | | $ | 481,647 | | | $ | 4,120,699 | | | $ | 3,647,344 | | | $ | 471,812 | | | $ | 4,119,156 | |
Government guaranty book of business(2) | | 6,554 | | | 494 | | | 7,048 | | | 7,901 | | | 520 | | | 8,421 | |
| Guaranty book of business | | 3,645,606 | | | 482,141 | | | 4,127,747 | | | 3,655,245 | | | 472,332 | | | 4,127,577 | |
Freddie Mac securities guaranteed by Fannie Mae(3) | | 208,283 | | | — | | | 208,283 | | | 215,605 | | | — | | | 215,605 | |
| Total Fannie Mae guarantees | | $ | 3,853,889 | | | $ | 482,141 | | | $ | 4,336,030 | | | $ | 3,870,850 | | | $ | 472,332 | | | $ | 4,343,182 | |
(1)Refers to mortgage loans and mortgage-related securities that are not guaranteed or insured, in whole or in part, by the U.S. government.
(2)Refers to mortgage loans and mortgage-related securities guaranteed or insured, in whole or in part, by the U.S. government.
(3)Consists of off-balance sheet arrangements of approximately (i) $173.3 billion and $179.6 billion in unpaid principal balance of Freddie Mac-issued UMBS backing Fannie Mae-issued Supers as of June 30, 2024 and December 31, 2023, respectively; and (ii) $35.0 billion and $36.0 billion in unpaid principal balance of Freddie Mac securities backing Fannie Mae-issued REMICs as of June 30, 2024 and December 31, 2023, respectively. See “Liquidity and Capital Management—Liquidity Management—Off-Balance Sheet Arrangements” for more information regarding our maximum exposure to loss on consolidated Fannie Mae MBS and Freddie Mac securities.
New Business and Affordable Housing Allocations
The Federal Housing Enterprises Financial Safety and Soundness Act of 1992, as amended (the “GSE Act”), requires us to set aside each year an amount equal to 4.2 basis points of the unpaid principal balance of our new business purchases and to pay this amount to specified U.S. Department of Housing and Urban Development (“HUD”) and Treasury funds in support of affordable housing. In March 2024, we paid $155 million to the funds based on our new business purchases in 2023. For the first half of 2024, we recognized an expense of $70 million related to this obligation based on $167.6 billion in new business purchases during the period. We expect to pay this amount to the funds in 2025, plus additional amounts to be accrued based on our new business purchases in the second half of 2024.
Business Segments
We have two reportable business segments: Single-Family and Multifamily. The chart below displays net revenues and net income for each of our business segments for the first half of 2024 compared with the first half of 2023. Net revenues consist of net interest income and fee and other income.
Business Segment Net Revenues and Net Income
(Dollars in billions)
In the following sections, we describe each segment’s business metrics, financial results and credit performance.
| | | | | | | | |
| Fannie Mae Second Quarter 2024 Form 10-Q | 17 |
| | | | | | | | |
| MD&A | Single-Family Business | Single-Family Mortgage Market |
Single-Family Business
This section supplements and updates information regarding our Single-Family business segment in our 2023 Form 10-K. See “MD&A—Single-Family Business” in our 2023 Form 10-K for additional information regarding the primary business activities, lenders, investors and competition of our Single-Family business.
Single-Family Mortgage Market
Housing activity decreased in the second quarter of 2024 compared with the first quarter of 2024. Total existing home sales averaged 4.05 million units annualized in the second quarter of 2024, compared with 4.20 million units in the first quarter of 2024, according to data from the National Association of REALTORS®. According to the U.S. Census Bureau, new single-family home sales averaged an annualized rate of approximately 656,000 units in the second quarter of 2024, compared with approximately 663,000 units in the first quarter of 2024.
The average 30-year fixed mortgage rate was 6.86% as of June 27, 2024, compared with 6.79% as of March 28, 2024, and averaged 7.00% in the second quarter of 2024, compared with 6.75% in the first quarter of 2024, according to Freddie Mac’s Primary Mortgage Market Survey®.
Single-family mortgage market originations increased modestly from an estimated $421 billion in the second quarter of 2023 to an estimated $451 billion in the second quarter of 2024. According to the July forecast from our Economic and Strategic Research Group, total originations in the U.S. single-family mortgage market in 2024 are forecasted to increase from 2023 levels by approximately 16%, from an estimated $1.47 trillion in 2023 to $1.70 trillion in 2024, and the amount of refinance originations in the U.S. single-family mortgage market are forecasted to increase from an estimated $248 billion in 2023 to $346 billion in 2024. Our Economic and Strategic Research Group’s July forecast is based on data available as of July 11, 2024. See “Key Market Economic Indicators” in our 2023 Form 10-K for additional discussion of how housing activity can affect our financial results and the uncertainties that may affect our forecasts and expectations.
| | | | | | | | |
| Fannie Mae Second Quarter 2024 Form 10-Q | 18 |
| | | | | | | | |
| MD&A | Single-Family Business | Single-Family Mortgage-Related Securities Issuances Share |
Single-Family Mortgage-Related Securities Issuances Share
Our single-family Fannie Mae MBS issuances were $85.0 billion for the second quarter of 2024, compared with $91.6 billion for the second quarter of 2023. Based on the latest data available, the charts below display our estimated share of single-family mortgage-related securities issuances as compared with that of our primary competitors for the issuance of single-family mortgage-related securities for the periods indicated.
Single-Family Mortgage-Related Securities Issuances Share
| | | | | | | | | | | | | | | | | | | | | | | |
| | | Ginnie Mae | | | | Private-label securities |
| | | | | | | |
| | | Fannie Mae | | | | Freddie Mac |
| | | | | | | |
For several quarters, we have faced increased competition for the acquisition of single-family mortgage assets, which has impacted our share of single-family loan acquisitions and, in turn, our share of single-family mortgage-related securities issuances.
Our market share is impacted by different variables such as our pricing of single-family loans and the competitive market environment. Decisions regarding the pricing and acquisition of single-family loans incorporate different, and sometimes competing, factors, as discussed in “MD&A—Single-Family Business—Single-Family Mortgage-Related Securities Issuances Share” in our First Quarter 2024 Form 10-Q. For a discussion of factors that affect or could affect our business, our competitive environment, demand for our MBS, or the liquidity and market value of our MBS, as well as the risks associated with our conservatorship, our capital requirements relative to that of our primary competitor, our housing goals, the UMBS market and the performance of our MBS, see “Business—Conservatorship and Treasury Agreements,” “Business—Legislation and Regulation,” “Risk Factors” and “MD&A—Single-Family Business—Single-Family Competition” in our 2023 Form 10-K.
| | | | | | | | |
| Fannie Mae Second Quarter 2024 Form 10-Q | 19 |
| | | | | | | | |
| MD&A | Single-Family Business | Single-Family Business Metrics |
Single-Family Business Metrics
Select Business Metrics
The charts below display our average charged guaranty fees, net of TCCA fees, on our single-family conventional guaranty book of business and on new single-family conventional loan acquisitions, along with our average single-family conventional guaranty book of business and our single-family conventional loan acquisitions for the periods presented.
Select Single-Family Business Metrics(1)
(Dollars in billions)
| | | | | | | | | | | | | | | | | | | | |
| | Average charged guaranty fee on single-family conventional guaranty book of business, net of TCCA fees(2) | | | | Average single-family conventional guaranty book of business(3) |
| | | | |
| | | | |
| | Average charged guaranty fee on new single-family conventional acquisitions, net of TCCA fees(2) | | | | Single-family conventional acquisitions |
| | | | |
(1) For information reported in this “Single-Family Business” section, our single-family conventional guaranty book of business is measured using the unpaid principal balance of our mortgage loans underlying Fannie Mae MBS outstanding. By contrast, the single-family conventional guaranty book of business presented in the “Composition of Fannie Mae Guaranty Book of Business” table in the “Guaranty Book of Business” section is based on the unpaid principal balance of the Fannie Mae MBS outstanding, rather than the unpaid principal balance of the underlying mortgage loans. These amounts differ primarily as a result of payments we receive on underlying loans that have not yet been paid to the MBS holders or instances where we have advanced missed borrower payments on mortgage loans to make required distributions to related MBS holders. As measured for purposes of the information reported in this section, our single-family conventional guaranty book of business was $3,624.0 billion as of June 30, 2024 and $3,636.7 billion as of December 31, 2023.
(2) Excludes the impact of a 10 basis point guaranty fee increase implemented pursuant to the TCCA, the incremental revenue from which is paid to Treasury and not retained by us.
(3) Our single-family conventional guaranty book of business primarily consists of single-family conventional mortgage loans underlying Fannie Mae MBS outstanding. It also includes single-family conventional mortgage loans of Fannie Mae held in our retained mortgage portfolio, and other credit enhancements that we provide on single-family conventional mortgage assets. Our single-family conventional guaranty book of business does not include: (a) mortgage loans guaranteed or insured, in whole or in part, by the U.S. government; (b) Freddie Mac-acquired mortgage loans underlying Freddie Mac-issued UMBS that we have resecuritized; or (c) non-Fannie Mae single-family mortgage-related securities held in our retained mortgage portfolio for which we do not provide a guaranty. Our average single-family conventional guaranty book of business is based on quarter-end balances.
Our single-family conventional loan acquisition volumes remained near historically low levels in the second quarter of 2024. Due to continued high interest rates in the second quarter of 2024, few borrowers could benefit from refinancing, resulting in low refinance volumes. In addition, housing affordability constraints and limited supply continued to put downward pressure on the volume of purchase loans we acquired.
Average charged guaranty fee on newly acquired conventional single-family loans is a metric management uses to measure the amount we earn as compensation for the credit risk we manage and to assess our return. Average charged guaranty fee represents, on an annualized basis, the average of the base guaranty fees charged during the period for our single-family conventional guaranty arrangements, which we receive monthly over the life of the loan, plus the recognition of any upfront cash payments, including loan-level price adjustments, based on an estimated average life at the time of acquisition.
Our average charged guaranty fee on newly acquired conventional single-family loans, net of TCCA fees, decreased in the second quarter of 2024 compared with the second quarter of 2023, primarily as a result of a shift in product mix and an improvement in credit profile.
| | | | | | | | |
| Fannie Mae Second Quarter 2024 Form 10-Q | 20 |
| | | | | | | | |
| MD&A | Single-Family Business | Single-Family Business Financial Results |
Single-Family Business Financial Results
This section provides a discussion of the primary components of net income for our Single-Family Business. This information complements the discussion of financial results in “Consolidated Results of Operations.”
| | | | | | | | | | | | | | | | | | | | | | | | | | | | | | | | | | | | | | |
Single-Family Business Financial Results(1) |
| | For the Three Months Ended June 30, | | | | For the Six Months Ended June 30, | | |
| | 2024 | | 2023 | | Variance | | 2024 | | 2023 | | Variance |
| | (Dollars in millions) |
Net interest income(2) | | $ | 6,096 | | | $ | 5,917 | | | $ | 179 | | | $ | 11,970 | | | $ | 11,589 | | | $ | 381 | |
| Fee and other income | | 51 | | | 52 | | | (1) | | | 106 | | | 100 | | | 6 | |
| Net revenues | | 6,147 | | | 5,969 | | | 178 | | | 12,076 | | | 11,689 | | | 387 | |
| Investment gains (losses), net | | (70) | | | 27 | | | (97) | | | (57) | | | (44) | | | (13) | |
| Fair value gains (losses), net | | 454 | | | 460 | | | (6) | | | 938 | | | 626 | | | 312 | |
| Administrative expenses | | (784) | | | (718) | | | (66) | | | (1,561) | | | (1,438) | | | (123) | |
| Benefit (provision) for credit losses | | 548 | | | 1,418 | | | (870) | | | 883 | | | 1,465 | | | (582) | |
TCCA fees(2) | | (859) | | | (856) | | | (3) | | | (1,719) | | | (1,711) | | | (8) | |
| Credit enhancement expense | | (333) | | | (327) | | | (6) | | | (686) | | | (614) | | | (72) | |
Change in expected credit enhancement recoveries(3) | | (47) | | | (223) | | | 176 | | | (89) | | | (128) | | | 39 | |
Other expenses, net(4) | | (218) | | | (203) | | | (15) | | | (394) | | | (319) | | | (75) | |
| Income before federal income taxes | | 4,838 | | | 5,547 | | | (709) | | | 9,391 | | | 9,526 | | | (135) | |
| Provision for federal income taxes | | (983) | | | (1,153) | | | 170 | | | (1,929) | | | (2,000) | | | 71 | |
| Net income | | $ | 3,855 | | | $ | 4,394 | | | $ | (539) | | | $ | 7,462 | | | $ | 7,526 | | | $ | (64) | |
(1)See “Note 10, Segment Reporting” for information about our segment allocation methodology.
(2)Reflects the impact of a 10 basis point guaranty fee increase implemented pursuant to the TCCA, the incremental revenue from which is paid to Treasury. The resulting revenue is included in “Net interest income” and the expense is recognized as “TCCA fees.”
(3)Includes estimated changes in benefits, as well as any realized amounts, from our single-family freestanding credit enhancements, which primarily relate to our CAS and CIRT programs.
(4)Includes debt extinguishment gains and losses, expenses associated with legal claims, foreclosed property income (expense), gains and losses from partnership investments, housing trust fund expenses, loan subservicing costs, and servicer fees paid in connection with certain loss mitigation activities.
Net Interest Income
The increase in single-family net interest income for the second quarter of 2024 compared with the second quarter of 2023 was primarily as a result of lower expense from hedge accounting, higher base guaranty fee income and higher net interest income from portfolios.
The increase in single-family net interest income for the first half of 2024 compared with the first half of 2023 was primarily as a result of higher net interest income from portfolios and higher base guaranty fee income.
The drivers of net interest income for the Single-Family segment are consistent with the drivers of net interest income in our condensed consolidated statements of operations and comprehensive income. See “Consolidated Results of Operations—Net Interest Income” for more information on the factors that impact our single-family net interest income.
Fair Value Gains (Losses), Net
Fair value gains, net in the second quarter and first half of 2024 were primarily driven by rising interest rates, which drove gains on risk management derivatives and mortgage commitment derivatives. Also contributing to fair value gains, net in the second quarter of 2024 were fair value gains on trading securities.
Fair value gains, net in the second quarter of 2023 were primarily driven by gains on risk management derivatives and long-term debt of consolidated trusts held at fair value, partially offset by losses on trading securities.
Fair value gains, net in the first half of 2023 were primarily driven by gains on risk management derivatives.
The drivers of fair value gains and losses for the Single-Family segment are consistent with the drivers of fair value gains and losses in our condensed consolidated statements of operations and comprehensive income, which we discuss in “Consolidated Results of Operations—Fair Value Gains (Losses), Net.”
| | | | | | | | |
| Fannie Mae Second Quarter 2024 Form 10-Q | 21 |
| | | | | | | | |
| MD&A | Single-Family Business | Single-Family Business Financial Results |
Benefit (Provision) for Credit Losses
See “Consolidated Results of Operations—Benefit (Provision) for Credit Losses” for a discussion of our single-family benefit for credit losses.
Single-Family Mortgage Credit Risk Management
This section updates our discussion of single-family mortgage credit risk management in our 2023 Form 10-K. For additional information on our single-family acquisition and servicing policies, underwriting and servicing standards, quality control process, repurchase requests, and representation and warranty framework, see “MD&A—Single-Family Business—Single-Family Mortgage Credit Risk Management” in our 2023 Form 10-K.
Single-Family Acquisition and Servicing Policies and Underwriting and Servicing Standards
Desktop Underwriter Update
As part of our comprehensive risk management approach, we periodically update our proprietary automated underwriting system, Desktop Underwriter® (“DU®”), to reflect changes to our underwriting and eligibility guidelines. In March 2024, we implemented updates to DU to allow lenders to use a single 12-month asset verification report in the DU validation service to identify recurring deposits in the applicant’s digital bank statement data to automatically validate income and employment, as well as assets, in one step. The same report also can be used to identify and consider the applicant’s positive rent payment and cash flow history. We believe this update may help lenders improve operational efficiency and lower costs, as well as potentially increase the number of borrowers that receive an approve/eligible recommendation in DU by assessing eligibility through rent payment identification and cash flow assessment. We will continue to closely monitor loan acquisitions and market conditions and, as appropriate, make changes to DU, including its eligibility criteria, so that the loans we acquire are consistent with our risk appetite and mission.
New Credit Score Models and Credit Report Requirements
Fannie Mae uses credit scores to establish a minimum credit threshold for mortgage lending, provide a foundation for risk-based pricing, and support disclosures to investors. We currently use the “classic FICO® Score” from Fair Isaac Corporation as our credit score model, which FHFA has approved.
In October 2022, FHFA announced the validation and approval of two new credit score models for use by Fannie Mae and Freddie Mac: the FICO® Score 10 T credit score model and the VantageScore® 4.0 credit score model. Once implemented, lenders will be required to deliver both FICO Score 10 T and VantageScore 4.0 credit scores with each loan sold to us when available, replacing the classic FICO Score model. FHFA also announced in October 2022 that Fannie Mae and Freddie Mac will work toward changing the requirement that lenders provide credit reports from all three nationwide consumer reporting agencies. Instead, we will require lenders to provide credit reports from at least two of the three nationwide consumer reporting agencies (referred to as the new bi-merge credit reporting requirements).
In February 2024, FHFA announced updates regarding the implementation of the new credit score requirements for loans acquired by Fannie Mae and Freddie Mac, as well as the new bi-merge credit reporting requirements. FHFA announced that the implementation dates for both new requirements would be aligned and expected to occur in the fourth quarter of 2025. FHFA also announced that, to better support market participants with this transition, Fannie Mae and Freddie Mac would accelerate the publication of VantageScore 4.0 historical data to early in the third quarter of 2024, and in July 2024 this historical data was made available. The FHFA Director stated that synchronizing bi-merge credit reporting with the implementation of the new credit score model requirements will reduce complexity for market participants.
| | | | | | | | |
| Fannie Mae Second Quarter 2024 Form 10-Q | 22 |
| | | | | | | | |
| MD&A | Single-Family Business | Single-Family Mortgage Credit Risk Management |
Single-Family Guaranty Book Diversification and Monitoring
The following table displays our single-family conventional business volumes and our single-family conventional guaranty book of business, based on certain key risk characteristics that we use to evaluate the risk profile and credit quality of our single-family loans. For a description of the key risk characteristics of our single-family conventional guaranty book of business, see “MD&A—Single-Family Business—Single-Family Mortgage Credit Risk Management—Single-Family Guaranty Book Diversification and Monitoring—Overview” in our 2023 Form 10-K.
We provide additional information on the credit characteristics of our single-family loans in quarterly financial supplements, which we furnish to the Securities and Exchange Commission (the “SEC”) with current reports on Form 8-K and make available on our website. Information in our quarterly financial supplements is not incorporated by reference into this report.
| | | | | | | | |
| Fannie Mae Second Quarter 2024 Form 10-Q | 23 |
| | | | | | | | |
| MD&A | Single-Family Business | Single-Family Mortgage Credit Risk Management |
| | | | | | | | | | | | | | | | | | | | | | | | | | | | | | | | | | | | | | | | | | | |
Key Risk Characteristics of Single-Family Conventional Business Volume and Guaranty Book of Business(1) |
| | Percent of Single-Family Conventional Business Volume at Acquisition(2) | | | Percent of Single-Family Conventional Guaranty Book of Business(3) As of |
| | For the Three Months Ended June 30, | | For the Six Months Ended June 30, | | |
| | 2024 | | 2023 | | 2024 | | 2023 | | | June 30, 2024 | | | December 31, 2023 | |
Original LTV ratio:(4) | | | | | | | | | | | | | | | |
| <= 60% | | 17 | | % | 16 | | % | 17 | | % | 16 | | % | | 25 | | % | | 25 | | % |
| 60.01% to 70% | | 10 | | | 10 | | | 10 | | | 10 | | | | 14 | | | | 14 | | |
| 70.01% to 80% | | 33 | | | 33 | | | 33 | | | 33 | | | | 33 | | | | 33 | | |
| 80.01% to 90% | | 15 | | | 15 | | | 16 | | | 16 | | | | 11 | | | | 11 | | |
| 90.01% to 95% | | 18 | | | 19 | | | 17 | | | 19 | | | | 12 | | | | 12 | | |
| 95.01% to 100% | | 7 | | | 7 | | | 7 | | | 6 | | | | 4 | | | | 4 | | |
| Greater than 100% | | — | | | — | | | — | | | — | | | | 1 | | | | 1 | | |
| Total | | 100 | | % | 100 | | % | 100 | | % | 100 | | % | | 100 | | % | | 100 | | % |
Weighted average | | 78 | | % | 78 | | % | 78 | | % | 78 | | % | | 73 | | % | | 73 | | % |
| Average loan amount | | $ | 332,720 | | | $ | 317,748 | | | $ | 329,836 | | | $ | 316,117 | | | | $ | 208,482 | | | | $ | 207,883 | | |
| Loan count (in thousands) | | 258 | | | 281 | | 449 | | | 496 | | | 17,383 | | | | 17,494 | | |
Estimated mark-to-market LTV ratio:(5) | | | | | | | | | | | | | | | |
| <= 60% | | | | | | | | | | | 70 | | % | | 68 | | % |
| 60.01% to 70% | | | | | | | | | | | 13 | | | | 14 | | |
| 70.01% to 80% | | | | | | | | | | | 9 | | | | 10 | | |
| 80.01% to 90% | | | | | | | | | | | 6 | | | | 5 | | |
| 90.01% to 100% | | | | | | | | | | | 2 | | | | 3 | | |
| Greater than 100% | | | | | | | | | | | * | | | * | |
| Total | | | | | | | | | | | 100 | | % | | 100 | | % |
Weighted average | | | | | | | | | | | 50 | | % | | 51 | | % |
FICO credit score at origination:(6) | | | | | | | | | | | | | | | |
| < 620 | | * | % | * | % | * | % | * | % | | * | % | | * | % |
| 620 to < 660 | | 2 | | | 2 | | | 2 | | | 3 | | | | 4 | | | | 4 | | |
| 660 to < 680 | | 3 | | | 3 | | | 3 | | | 3 | | | | 4 | | | | 4 | | |
| 680 to < 700 | | 5 | | | 5 | | | 5 | | | 6 | | | | 6 | | | | 6 | | |
| 700 to < 740 | | 18 | | | 20 | | | 18 | | | 21 | | | | 19 | | | | 20 | | |
| >= 740 | | 72 | | | 70 | | | 72 | | | 67 | | | | 67 | | | | 66 | | |
| Total | | 100 | | % | 100 | | % | 100 | | % | 100 | | % | | 100 | | % | | 100 | | % |
| Weighted average | | 759 | | | 756 | | | 758 | | | 753 | | | | 753 | | | | 753 | | |
Debt-to-income (“DTI”) ratio at origination:(7) | | | | | | | | | | | | | | | |
| <= 43% | | 63 | | % | 66 | | % | 63 | | % | 65 | | % | | 74 | | % | | 75 | | % |
| 43.01% to 45% | | 10 | | | 10 | | | 10 | | | 10 | | | | 9 | | | | 9 | | |
| Greater than 45% | | 27 | | | 24 | | | 27 | | | 25 | | | | 17 | | | | 16 | | |
| Total | | 100 | | % | 100 | | % | 100 | | % | 100 | | % | | 100 | | % | | 100 | | % |
| Weighted average | | 38 | | % | 38 | | % | 38 | | % | 38 | | % | | 35 | | % | | 35 | | % |
| | | | | | | | |
| Fannie Mae Second Quarter 2024 Form 10-Q | 24 |
| | | | | | | | |
| MD&A | Single-Family Business | Single-Family Mortgage Credit Risk Management |
| | | | | | | | | | | | | | | | | | | | | | | | | | | | | | | | | | | | | | | | | | | |
| | Percent of Single-Family Conventional Business Volume at Acquisition(2) | | | Percent of Single-Family Conventional Guaranty Book of Business(3) As of |
| | For the Three Months Ended June 30, | | For the Six Months Ended June 30, | | |
| | 2024 | | 2023 | | 2024 | | 2023 | | | June 30, 2024 | | | December 31, 2023 | |
| Product type: | | | | | | | | | | | | | | | |
Fixed-rate:(8) | | | | | | | | | | | | | | | |
| Long-term | | 96 | | % | 95 | | % | 96 | | % | 95 | | % | | 88 | | % | | 87 | | % |
| Intermediate-term | | 3 | | | 4 | | | 3 | | | 4 | | | | 11 | | | | 12 | | |
Total fixed-rate | | 99 | | | 99 | | | 99 | | | 99 | | | | 99 | | | | 99 | | |
| Adjustable-rate | | 1 | | | 1 | | | 1 | | | 1 | | | | 1 | | | | 1 | | |
| Total | | 100 | | % | 100 | | % | 100 | | % | 100 | | % | | 100 | | % | | 100 | | % |
Number of property units: | | | | | | | | | | | | | | | |
| 1 unit | | 97 | | % | 98 | | % | 97 | | % | 98 | | % | | 98 | | % | | 98 | | % |
| 2-4 units | | 3 | | | 2 | | | 3 | | | 2 | | | | 2 | | | | 2 | | |
| Total | | 100 | | % | 100 | | % | 100 | | % | 100 | | % | | 100 | | % | | 100 | | % |
| Property type: | | | | | | | | | | | | | | | |
| Single-family homes | | 91 | | % | 91 | | % | 91 | | % | 91 | | % | | 91 | | % | | 91 | | % |
| Condo/Co-op | | 9 | | | 9 | | | 9 | | | 9 | | | | 9 | | | | 9 | | |
| Total | | 100 | | % | 100 | | % | 100 | | % | 100 | | % | | 100 | | % | | 100 | | % |
| Occupancy type: | | | | | | | | | | | | | | | |
| Primary residence | | 93 | | % | 92 | | % | 93 | | % | 92 | | % | | 91 | | % | | 91 | | % |
| Second/vacation home | | 2 | | | 2 | | | 2 | | | 2 | | | | 3 | | | | 3 | | |
| Investor | | 5 | | | 6 | | | 5 | | | 6 | | | | 6 | | | | 6 | | |
| Total | | 100 | | % | 100 | | % | 100 | | % | 100 | | % | | 100 | | % | | 100 | | % |
Loan purpose: | | | | | | | | | | | | | | | |
| Purchase | | 87 | | % | 86 | | % | 86 | | % | 85 | | % | | 46 | | % | | 45 | | % |
| Cash-out refinance | | 9 | | | 10 | | | 9 | | | 10 | | | | 20 | | | | 20 | | |
| Other refinance | | 4 | | | 4 | | | 5 | | | 5 | | | | 34 | | | | 35 | | |
| Total | | 100 | | % | 100 | | % | 100 | | % | 100 | | % | | 100 | | % | | 100 | | % |
Geographic concentration:(9) | | | | | | | | | | | | | | | |
| Midwest | | 15 | | % | 14 | | % | 15 | | % | 13 | | % | | 14 | | % | | 14 | | % |
| Northeast | | 14 | | | 12 | | | 14 | | | 12 | | | | 16 | | | | 16 | | |
| Southeast | | 28 | | | 30 | | | 27 | | | 29 | | | | 23 | | | | 23 | | |
| Southwest | | 23 | | | 24 | | | 23 | | | 25 | | | | 19 | | | | 19 | | |
| West | | 20 | | | 20 | | | 21 | | | 21 | | | | 28 | | | | 28 | | |
| Total | | 100 | | % | 100 | | % | 100 | | % | 100 | | % | | 100 | | % | | 100 | | % |
| Origination year: | | | | | | | | | | | | | | | |
| 2018 and prior | | | | | | | | | | | 20 | | % | | 21 | | % |
| 2019 | | | | | | | | | | | 4 | | | | 4 | | |
| 2020 | | | | | | | | | | | 23 | | | | 24 | | |
| 2021 | | | | | | | | | | | 29 | | | | 30 | | |
| 2022 | | | | | | | | | | | 13 | | | | 13 | | |
| 2023 | | | | | | | | | | | 8 | | | | 8 | | |
| 2024 | | | | | | | | | | | 3 | | | | — | | |
| Total | | | | | | | | | | | 100 | | % | | 100 | | % |
* Represents less than 0.5% of single-family conventional business volume or guaranty book of business.
| | | | | | | | |
| Fannie Mae Second Quarter 2024 Form 10-Q | 25 |
| | | | | | | | |
| MD&A | Single-Family Business | Single-Family Mortgage Credit Risk Management |
(1)Second-lien mortgage loans held by third parties are not reflected in the original LTV or the estimated mark-to-market LTV ratios in this table.
(2)Calculated based on the unpaid principal balance of single-family loans for each category at time of acquisition.
(3)Calculated based on the aggregate unpaid principal balance of single-family loans for each category divided by the aggregate unpaid principal balance of loans in our single-family conventional guaranty book of business as of the end of each period.
(4)The original LTV ratio generally is based on the original unpaid principal balance of the loan divided by the appraised property value reported to us at the time of acquisition of the loan. Excludes loans for which this information is not readily available.
(5)The aggregate estimated mark-to-market LTV ratio is based on the unpaid principal balance of the loan as of the end of each reported period divided by the estimated current value of the property, which we calculate using an internal valuation model that estimates periodic changes in home value. Excludes loans for which this information is not readily available.
(6)Loans with unavailable FICO credit scores represent less than 0.5% of single-family conventional business volume or guaranty book of business, and therefore are not presented separately in this table.
(7)Excludes loans for which this information is not readily available.
(8)Long-term fixed-rate consists of mortgage loans with maturities greater than 15 years, while intermediate-term fixed-rate loans have maturities equal to or less than 15 years.
(9)Midwest consists of IL, IN, IA, MI, MN, NE, ND, OH, SD and WI. Northeast consists of CT, DE, ME, MA, NH, NJ, NY, PA, PR, RI, VT and VI. Southeast consists of AL, DC, FL, GA, KY, MD, MS, NC, SC, TN, VA and WV. Southwest consists of AZ, AR, CO, KS, LA, MO, NM, OK, TX and UT. West consists of AK, CA, GU, HI, ID, MT, NV, OR, WA and WY.
The share of our loan acquisitions with DTI ratios above 45% increased to 27% in the second quarter of 2024 compared with 24% in the second quarter of 2023. This increase was partially driven by the higher share of home purchase acquisitions, which tend to have a higher share of volume with DTI ratios above 45% than refinance loan acquisitions.
For a discussion of factors that may impact the volume and credit characteristics of loans we acquire in the future, see “MD&A—Single-Family Business—Single-Family Mortgage Credit Risk Management—Single-Family Guaranty Book Diversification and Monitoring” in our 2023 Form 10-K. In this section of our 2023 Form 10-K, we also provide more information on the credit characteristics of loans in our single-family conventional guaranty book of business, including high-balance loans and adjustable-rate mortgages.
Single-Family Credit Enhancement and Transfer of Mortgage Credit Risk
Our charter generally requires credit enhancement on any single-family conventional mortgage loan that we purchase or securitize if it has an LTV ratio over 80% at the time of purchase. We generally achieve this through primary mortgage insurance. We also enter into various other types of transactions in which we transfer mortgage credit risk to third parties.
Our approved monoline mortgage insurers’ financial ability and willingness to pay claims is an important determinant of our overall credit risk exposure. For a discussion of our exposure to and management of the counterparty credit risk associated with the providers of these credit enhancements, see “MD&A—Risk Management—Institutional Counterparty Credit Risk Management” and “Note 14, Concentrations of Credit Risk” in our 2023 Form 10-K and “Note 11, Concentrations of Credit Risk” in this report. Also see “Risk Factors—Credit Risk” in our 2023 Form 10-K.
| | | | | | | | |
| Fannie Mae Second Quarter 2024 Form 10-Q | 26 |
| | | | | | | | |
| MD&A | Single-Family Business | Single-Family Mortgage Credit Risk Management |
The table below displays information about loans in our single-family conventional guaranty book of business covered by one or more forms of credit enhancement, including mortgage insurance or a credit risk transfer transaction. For a description of primary mortgage insurance and the other types of credit enhancements specified in the table, see “MD&A—Single-Family Business—Single-Family Mortgage Credit Risk Management—Single-Family Credit Enhancement and Transfer of Mortgage Credit Risk” in our 2023 Form 10-K.
| | | | | | | | | | | | | | | | | | | | | | | | | | |
Single-Family Loans with Credit Enhancement |
| | As of |
| | June 30, 2024 | | December 31, 2023 |
| | Unpaid Principal Balance | | Percentage of Single-Family Conventional Guaranty Book of Business | | Unpaid Principal Balance | | Percentage of Single-Family Conventional Guaranty Book of Business |
| (Dollars in billions) |
Primary mortgage insurance and other | | $ | 760 | | | 21 | % | | $ | 763 | | | 21 | % |
Connecticut Avenue Securities | | 870 | | | 24 | | | 843 | | | 24 | |
| Credit Insurance Risk Transfer | | 432 | | | 12 | | | 399 | | | 11 | |
Lender risk-sharing | | 47 | | | 1 | | | 52 | | | 1 | |
Less: Loans covered by multiple credit enhancements | | (422) | | | (11) | | | (411) | | | (12) | |
Total single-family loans with credit enhancement | | $ | 1,687 | | | 47 | % | | $ | 1,646 | | | 45 | % |
Transfer of Mortgage Credit Risk
In addition to primary mortgage insurance, our Single-Family business has developed other risk-sharing capabilities to transfer portions of our single-family mortgage credit risk to the private market. Our credit risk transfer transactions are generally designed to transfer a portion of the losses we expect would be incurred in an economic downturn or a stressed credit environment. Generally, loss reimbursement payments are received after the underlying property has been liquidated and all applicable proceeds, including private mortgage insurance benefits, have been applied to reduce the loss. As described in “MD&A—Single-Family Business—Single-Family Mortgage Credit Risk Management—Single-Family Credit Enhancement and Transfer of Mortgage Credit Risk—Credit Risk Transfer Transactions” in our 2023 Form 10-K, our two primary single-family credit risk transfer programs are Connecticut Avenue Securities® (“CAS”) and Credit Insurance Risk Transfer™ (“CIRT™”).
In the first half of 2024, we transferred a portion of the mortgage credit risk on single-family mortgage loans with an unpaid principal balance of $133.9 billion at the time of the transactions. When engaging in credit risk transfer transactions, we consider their cost, the resulting capital relief, and the overall credit risk transfer capacity of the market. The cost of our credit risk transfer transactions is impacted by macroeconomic and housing market sentiment, as well as the demand and capacity of the investors and reinsurers that support these transactions. Capacity considers both the total aggregate amount of outstanding coverage as well as the volume of new issuances available in the market. In response to these factors, we may choose to adjust the amount of first loss retained by Fannie Mae as a way to manage costs or market capacity when structuring our credit risk transfer transactions.
| | | | | | | | |
| Fannie Mae Second Quarter 2024 Form 10-Q | 27 |
| | | | | | | | |
| MD&A | Single-Family Business | Single-Family Mortgage Credit Risk Management |
The table below displays the aggregate mortgage credit risk transferred to third parties and retained by Fannie Mae pursuant to our single-family credit risk transfer transactions. The table does not include the credit risk transferred on single-family transactions that were cancelled or terminated through June 30, 2024. The following table also excludes coverage obtained through primary mortgage insurance.
| | | | | | | | | | | | | | | | | | | | | | | | | | | | | | | | | | | | | | | | | | | | | | | | | | |
|
Outstanding as of June 30, 2024 |
| (Dollars in billions) |
| Senior | | Fannie Mae(1) $1,294 | | Outstanding Reference Pool(5) $1,361
|
|
| | | | | | | | | |
| Mezzanine | | Fannie Mae(1) $5
| | CIRT(2) $15
| | CAS(2)(3) $13
| | Lender Risk-Sharing(2)(4) $3
| |
| | | |
| | | | | | | | | |
| First Loss | | Fannie Mae(1) $19
| | CAS(2)(6) $10
| | Lender Risk-Sharing(2)(4) $2
| |
| | |
(1)Credit risk retained by Fannie Mae in CAS, CIRT and lender risk-sharing transactions. Also includes credit risk retained in CAS Credit Linked-Note transactions, which are similar to CAS REMICs except they allow us to obtain credit protection on reference pools containing seasoned loans such as Refi PlusTM loans. Tranche sizes vary across programs.
(2)Credit risk transferred to third parties. Tranche sizes vary across programs.
(3)For CAS transactions, “senior” includes the A-H tranche balances, which we retain, while “mezzanine” includes the A-1, M-1 and M-2 tranche balances, portions of which we sell. In May 2024, we created and began selling a portion of the A-1 tranches, which are senior to the M-1, M-2 and B tranches and subordinate to the A-H tranches for the allocation of losses.
(4)Represents customized lender-risk sharing transactions. In most transactions, lenders invest directly in a portion of the credit risk on mortgage loans they originate and/or service.
(5)For CIRT and some lender risk-sharing transactions, “Reference Pool” reflects a pool of covered loans. For CAS and some lender risk-sharing transactions, represents outstanding reference pools, not the outstanding unpaid principal balance of the underlying loans. The outstanding unpaid principal balance for all loans covered by credit risk transfer programs, including all loans on which risk has been transferred in lender risk-sharing transactions, was $1,349 billion as of June 30, 2024.
(6)For CAS transactions, “First Loss” represents all B tranche balances. In recent deals we have retained certain subordinated class B tranche(s) that absorb losses before the remaining class B tranches.
The risk in force of these transactions, which refers to the maximum amount of losses that could be absorbed by credit risk transfer investors, was approximately $43 billion as of June 30, 2024, compared with approximately $42 billion as of December 31, 2023.
The table below displays information about the credit enhancement recovery receivables we have recognized within “Other assets” in our condensed consolidated balance sheets. The decrease in our single-family freestanding credit enhancement receivables as of June 30, 2024 compared with December 31, 2023, was primarily the result of a decrease in our estimate of credit losses in the first half of 2024. As our estimate of credit losses decreases, so does the benefit we expect to receive from our freestanding credit enhancements.
| | | | | | | | | | | | | | |
Single-Family Credit Enhancement Receivables |
| | As of |
| | June 30, 2024 | | December 31, 2023 |
| | (Dollars in millions) |
| Freestanding credit enhancement receivables | | $ | 162 | | | $ | 253 | |
Primary mortgage insurance receivables, net of allowance(1) | | 61 | | | 54 | |
(1)Amount is net of a valuation allowance of $401 million as of June 30, 2024 and $417 million as of December 31, 2023. The vast majority of this valuation allowance related to deferred payment obligations associated with unpaid claim amounts for which collectability is uncertain.
| | | | | | | | |
| Fannie Mae Second Quarter 2024 Form 10-Q | 28 |
| | | | | | | | |
| MD&A | Single-Family Business | Single-Family Mortgage Credit Risk Management |
The table below displays the approximate cash paid or transferred to investors and counterparties for credit risk transfer transactions. The cash represents the portion of the guaranty fee paid to investors as compensation for taking on a share of the credit risk.
| | | | | | | | | | | | | | |
Credit Risk Transfer Transactions |
| | For the Six Months Ended June 30, |
| | 2024 | | 2023 |
| | (Dollars in millions) |
Cash paid or transferred for: | | | | |
CAS transactions(1) | | $ | 458 | | | $ | 450 | |
| CIRT transactions | | 209 | | | 198 | |
| Lender risk-sharing transactions | | 76 | | | 68 | |
(1)Consists of cash paid for interest expense net of LIBOR or SOFR, as applicable, on outstanding CAS debt and amounts paid for both CAS REMIC® and CAS Credit-linked notes transactions.
Cash paid or transferred to counterparties for CIRT transactions includes cancellation fees paid on certain CIRT transactions where we determined that the cost of these deals exceeded the expected remaining benefit. The table excludes cash paid upon the repurchase of certain CAS notes. In the first half of 2024, we paid $61 million in purchase premiums in connection with our repurchase of $807 million in outstanding CAS notes.
The table below displays the primary characteristics of loans in our single-family conventional guaranty book of business without credit enhancement.
| | | | | | | | | | | | | | | | | | | | | | | | | | |
Single-Family Loans Currently without Credit Enhancement |
| | As of |
| | June 30, 2024 | | December 31, 2023 |
| | Unpaid Principal Balance | | Percentage of Single-Family Conventional Guaranty Book of Business | | Unpaid Principal Balance | | Percentage of Single-Family Conventional Guaranty Book of Business |
| | (Dollars in billions) |
Low LTV ratio or short-term(1) | | $ | 1,078 | | | 30 | % | | $ | 1,112 | | | 31 | % |
Pre-credit risk transfer program inception(2) | | 225 | | | 6 | | | 236 | | | 6 | |
Recently acquired(3) | | 144 | | | 4 | | | 180 | | | 5 | |
Other(4) | | 747 | | | 20 | | | 730 | | | 20 | |
| Less: Loans in multiple categories | | (257) | | | (7) | | | (267) | | | (7) | |
| Total single-family loans currently without credit enhancement | | $ | 1,937 | | | 53 | % | | $ | 1,991 | | | 55 | % |
(1)Represents loans with an LTV ratio less than or equal to 60% or loans with an original maturity of 20 years or less.
(2)Represents loans that were acquired before the inception of our credit risk transfer programs. Also includes Refi PlusTM loans.
(3)Represents loans that were recently acquired and have not been included in a reference pool.
(4)Includes adjustable-rate mortgage loans, loans with a combined LTV ratio greater than 97%, non-Refi Plus loans acquired after the inception of our credit risk transfer programs that became 30 or more days delinquent prior to inclusion in a credit risk transfer transaction, and loans that were delinquent as of June 30, 2024 or December 31, 2023. Also includes loans that were previously included in a credit risk transfer transaction but subsequently had the coverage canceled.
Single-Family Problem Loan Management
Our problem loan management strategies focus primarily on reducing defaults to avoid losses that would otherwise occur and pursuing foreclosure alternatives to mitigate the severity of the losses we incur. See “MD&A—Single-Family Business—Single-Family Mortgage Credit Risk Management—Single-Family Problem Loan Management” in our 2023 Form 10-K for a discussion of delinquency statistics on our problem loans, efforts undertaken to manage our problem loans, metrics regarding our loan workout activities, real estate owned (“REO”) management and other single-family credit-related information. The discussion below updates some of that information. We also provide ongoing credit performance information on loans underlying single-family Fannie Mae MBS and loans covered by single-family credit risk transfer transactions. For loans backing Fannie Mae MBS, see the “Forbearance and Delinquency Dashboard” available in the MBS section of our Data Dynamics® tool, which is available at www.fanniemae.com/datadynamics. For loans covered by credit risk transfer transactions, see the “Deal Performance Data” report available in the CAS and
| | | | | | | | |
| Fannie Mae Second Quarter 2024 Form 10-Q | 29 |
| | | | | | | | |
| MD&A | Single-Family Business | Single-Family Mortgage Credit Risk Management |
CIRT sections of the tool. Information on our website is not incorporated into this report. Information in Data Dynamics may differ from similar measures presented in our financial statements and other public disclosures for a variety of reasons, including as a result of variations in the loan population covered, timing differences in reporting and other factors.
Delinquency
The tables below display the delinquency status of loans and changes in the volume of seriously delinquent loans in our single-family conventional guaranty book of business based on the number of loans. Single-family seriously delinquent loans are loans that are 90 days or more past due or in the foreclosure process. Our single-family serious delinquency rate is expressed as a percentage of our single-family conventional guaranty book of business based on loan count. Management monitors the single-family serious delinquency rate as an indicator of potential future credit losses and loss mitigation activities. Serious delinquency rates are reflective of our performance in assessing and managing credit risk associated with single-family loans in our guaranty book of business. Typically, higher serious delinquency rates result in a higher allowance for loan losses.
| | | | | | | | | | | | | | | | | | | | |
Delinquency Status and Activity of Single-Family Conventional Loans |
| | As of |
| | June 30, 2024 | | December 31, 2023 | | June 30, 2023 |
| Delinquency status: | | | | | | |
| 30 to 59 days delinquent | | 1.07 | % | | 1.06 | % | | 0.84 | % |
| 60 to 89 days delinquent | | 0.24 | | | 0.26 | | | 0.21 | |
| Seriously delinquent (“SDQ”): | | 0.48 | | | 0.55 | | | 0.55 | |
Percentage of SDQ loans that have been delinquent for more than 180 days | | 48 | | | 47 | | | 54 | |
Percentage of SDQ loans that have been delinquent for more than two years | | 8 | | | 10 | | | 15 | |
| | | | | | | | | | | | | | |
| | For the Six Months Ended June 30, |
| | 2024 | | 2023 |
| Single-family SDQ loans (number of loans): | | | | |
| Beginning balance | | 96,479 | | | 114,960 | |
| Additions | | 82,285 | | | 81,064 | |
| Removals: | | | | |
| Modifications and other loan workouts | | (39,739) | | | (43,047) | |
| Liquidations and sales | | (15,231) | | | (15,506) | |
| Cured or less than 90 days delinquent | | (39,492) | | | (41,671) | |
| Total removals | | (94,462) | | | (100,224) | |
| Ending balance | | 84,302 | | | 95,800 | |
Our single-family serious delinquency rate as of June 30, 2024 remained near historically low levels. Given our expectation of slower economic growth, we expect the credit performance of the loans in our single-family guaranty book of business may decline compared to recent performance, which could lead to higher delinquencies or an increase in our single-family serious delinquency rate. For information about factors that affect our single-family serious delinquency rate, see “MD&A—Single-Family Business—Single-Family Mortgage Credit Risk Management—Single-Family Problem Loan Management” in our 2023 Form 10-K.
| | | | | | | | |
| Fannie Mae Second Quarter 2024 Form 10-Q | 30 |
| | | | | | | | |
| MD&A | Single-Family Business | Single-Family Mortgage Credit Risk Management |
The table below displays the serious delinquency rates for, and the percentage of our seriously delinquent single-family conventional loans represented by, the specified loan categories. Percentage of book amounts represent the unpaid principal balance of loans for each category divided by the unpaid principal balance of our total single-family conventional guaranty book of business. The reported categories are not mutually exclusive.
| | | | | | | | | | | | | | | | | | | | | | | | | | | | | | | | | | | | | | | | | | | | | | | | | | | | | | | | |
Single-Family Conventional Seriously Delinquent Loan Concentration Analysis |
| As of |
| June 30, 2024 | December 31, 2023 | June 30, 2023 |
| | Percentage of Book Outstanding | | Percentage of Seriously Delinquent Loans(1) | | Serious Delinquency Rate | | Percentage of Book Outstanding | | Percentage of Seriously Delinquent Loans(1) | | Serious Delinquency Rate | | Percentage of Book Outstanding | | Percentage of Seriously Delinquent Loans(1) | | Serious Delinquency Rate |
States: | | | | | | | | | | | | | | | | | | |
| California | | 19 | % | | 10 | % | | 0.37 | % | | 19 | % | | 10 | % | | 0.42 | % | | 19 | % | | 10 | % | | 0.41 | % |
| Texas | | 7 | | | 9 | | | 0.57 | | | 7 | | | 9 | | | 0.64 | | | 7 | | | 8 | | | 0.60 | |
| Florida | | 6 | | | 9 | | | 0.63 | | | 6 | | | 9 | | | 0.73 | | | 6 | | | 9 | | | 0.71 | |
| New York | | 5 | | | 7 | | | 0.79 | | | 5 | | | 6 | | | 0.92 | | | 5 | | | 7 | | | 0.96 | |
| Illinois | | 3 | | | 5 | | | 0.65 | | | 3 | | | 5 | | | 0.70 | | | 3 | | | 5 | | | 0.71 | |
| All other states | | 60 | | | 60 | | | 0.45 | | | 60 | | | 61 | | | 0.52 | | | 60 | | | 61 | | | 0.51 | |
Vintages: | | | | | | | | | | | | | | | | | | |
| 2008 and prior | | 2 | | | 17 | | | 1.76 | | | 2 | | | 18 | | | 2.07 | | | 2 | | | 22 | | | 2.62 | |
| 2009-2024 | | 98 | | | 83 | | | 0.42 | | | 98 | | | 82 | | | 0.47 | | | 98 | | | 78 | | | 0.45 | |
Estimated mark-to-market LTV ratio: | | | | | | | | | | | | | | | | | | |
| <= 60% | | 70 | | | 71 | | | 0.43 | | | 68 | | | 69 | | | 0.49 | | | 68 | | | 72 | | | 0.50 | |
| 60.01% to 70% | | 13 | | | 14 | | | 0.75 | | | 14 | | | 15 | | | 0.80 | | | 15 | | | 14 | | | 0.72 | |
| 70.01% to 80% | | 9 | | | 8 | | | 0.68 | | | 10 | | | 9 | | | 0.77 | | | 10 | | | 8 | | | 0.67 | |
| 80.01% to 90% | | 6 | | | 5 | | | 0.77 | | | 5 | | | 5 | | | 0.81 | | | 5 | | | 4 | | | 0.68 | |
| 90.01% to 100% | | 2 | | | 2 | | | 0.57 | | | 3 | | | 2 | | | 0.59 | | | 2 | | | 2 | | | 0.54 | |
| Greater than 100% | | * | | * | | 3.34 | | | * | | * | | 2.05 | | | * | | * | | 4.00 | |
Credit enhanced:(2) | | | | | | | | | | | | | | | | | | |
Primary MI & other(3) | | 21 | | | 33 | | | 0.97 | | | 21 | | | 33 | | | 1.08 | | | 21 | | | 31 | | | 1.01 | |
Credit risk transfer(4) | | 37 | | | 30 | | | 0.47 | | | 36 | | | 30 | | | 0.54 | | | 34 | | | 28 | | | 0.51 | |
| Non-credit enhanced | | 53 | | | 51 | | | 0.40 | | | 55 | | | 52 | | | 0.46 | | | 56 | | | 54 | | | 0.47 | |
*Represents less than 0.5% of single-family conventional guaranty book of business.
(1)Calculated based on the number of single-family loans that were seriously delinquent for each category divided by the total number of single-family conventional loans that were seriously delinquent.
(2)The credit-enhanced categories are not mutually exclusive. A loan with primary mortgage insurance that is also covered by a credit risk transfer transaction will be included in both the “Primary MI & other” category and the “Credit risk transfer” category. As a result, the “Credit enhanced” and “Non-credit enhanced” categories do not sum to 100%. The total percentage of our single-family conventional guaranty book of business with some form of credit enhancement as of June 30, 2024 was 47%.
(3)Refers to loans included in an agreement used to reduce credit risk by requiring primary mortgage insurance, collateral, letters of credit, corporate guarantees, or other agreements to provide an entity with some assurance that it will be compensated to some degree in the event of a financial loss. Excludes loans covered by credit risk transfer transactions unless such loans are also covered by primary mortgage insurance.
(4)Refers to loans included in reference pools for credit risk transfer transactions, including loans in these transactions that are also covered by primary mortgage insurance. For CAS and some lender risk-sharing transactions, this represents the outstanding unpaid principal balance of the underlying loans on the single-family mortgage credit book, not the outstanding reference pool, as of the specified date. Loans included in our credit risk transfer transactions have all been acquired since 2009.
Forbearance Plans and Loan Workouts
As a part of our credit risk management efforts, we offer several types of loss mitigation options to help homeowners stay in their home or to otherwise avoid foreclosure. Loss mitigation options can consist of a forbearance plan or a loan workout. Our loan workouts reflect additional types of home retention solutions that help reinstate loans to current status, including repayment plans, payment deferrals, and loan modifications. Our loan workouts also include foreclosure alternatives, such as short sales and deeds-in-lieu of foreclosure.
| | | | | | | | |
| Fannie Mae Second Quarter 2024 Form 10-Q | 31 |
| | | | | | | | |
| MD&A | Single-Family Business | Single-Family Mortgage Credit Risk Management |
As of June 30, 2024, the unpaid principal balance of single-family loans in forbearance was $5.2 billion, or 0.1% of our single-family conventional guaranty book of business, compared with $6.9 billion, or 0.2% of our single-family conventional guaranty book of business, as of December 31, 2023.
The chart below displays the unpaid principal balance of our completed single-family loan workouts by type, as well as the number of loan workouts, for the first half of 2023 compared with the first half of 2024. This table does not include loans in an active forbearance arrangement, trial modifications, and repayment plans that have been initiated but not completed.
Completed Loan Workout Activity
(Dollars in billions)
(1)There were approximately 18,300 loans and 16,300 loans in a trial modification period that was not yet complete as of June 30, 2024 and 2023, respectively.
(2)Other was $370 million and $237 million for the first half of 2024 and the first half of 2023, respectively. Other includes repayment plans and foreclosure alternatives. Repayment plans reflect only those plans associated with loans that were 60 days or more delinquent.
| | | | | | | | |
| Fannie Mae Second Quarter 2024 Form 10-Q | 32 |
| | | | | | | | |
| MD&A | Single-Family Business | Single-Family Mortgage Credit Risk Management |
REO Management
If a loan defaults, we may acquire the property through foreclosure or a deed-in-lieu of foreclosure. The table below displays our REO activity by region. Regional REO acquisition trends generally follow a pattern that is similar to, but lags, that of regional delinquency trends.
| | | | | | | | | | | | | | | | | | | | |
| Single-Family REO Properties |
| | | For the Six Months Ended June 30, |
| | 2024 | | 2023 |
| Single-family REO properties (number of properties): | | | | | | |
Beginning of period inventory of single-family REO properties(1) | | 8,403 | | | | 8,779 | | |
Acquisitions by geographic area:(2) | | | | | | |
| Midwest | | 505 | | | | 624 | | |
| Northeast | | 288 | | | | 479 | | |
| Southeast | | 379 | | | | 524 | | |
| Southwest | | 334 | | | | 400 | | |
| West | | 167 | | | | 190 | | |
Total REO acquisitions(1) | | 1,673 | | | | 2,217 | | |
| Dispositions of REO | | (2,897) | | | | (2,381) | | |
End of period inventory of single-family REO properties(1) | | 7,179 | | | | 8,615 | | |
| Carrying value of single-family REO properties (dollars in millions) | | $ | 1,229 | | | | $ | 1,332 | | |
Single-family foreclosure rate(3) | | 0.02 | | % | | 0.03 | | % |
REO net sales price to unpaid principal balance(4) | | 142 | | % | | 126 | | % |
REO net sales price to unpaid principal balance and costs to repair(5) | | 92 | | % | | 97 | | % |
Short sales net sales price to unpaid principal balance(6) | | 90 | | % | | 91 | | % |
(1)Comprised of held-for sale and held-for-use properties, which are reported in our condensed consolidated balance sheets as a component of “Other assets.”
(2)See footnote 9 to the “Key Risk Characteristics of Single-Family Conventional Business Volume and Guaranty Book of Business” table for states included in each geographic region.
(3)Estimated based on the annualized total number of properties acquired through foreclosure or deeds-in-lieu of foreclosure as a percentage of the total number of loans in our single-family conventional guaranty book of business as of the end of each period.
(4)Calculated as the amount of sale proceeds received on disposition of REO properties during the respective periods, excluding those subject to repurchase requests made to our sellers or servicers, divided by the aggregate unpaid principal balance of the related loans at the time of foreclosure. Net sales price represents the contract sales price less selling costs for the property and other charges paid by the seller at closing, and excludes the costs associated with any property repairs.
(5)Calculated as the amount of sale proceeds received on disposition of REO properties during the respective periods, excluding those subject to repurchase requests made to our sellers or servicers, divided by the aggregate unpaid principal balance of the related loans at the time of foreclosure and costs to repair the property. Net sales price represents the contract sales price less selling costs for the property and other charges paid by the seller at closing.
(6)Calculated as the amount of sale proceeds received on properties sold in short sale transactions during the respective periods divided by the aggregate unpaid principal balance of the related loans. Net sales price includes borrower relocation incentive payments and subordinate lien(s) negotiated payoffs.
Our REO net sales price to unpaid principal balance and costs to repair decreased to 92% for the first half of 2024 compared to 97% for the first half of 2023, primarily driven by increased costs we have incurred to repair the condition of properties.
Single-Family Credit Loss Performance Metrics and Loan Sale Performance
The single-family credit loss performance metrics and loan sale performance measures below present information about losses or gains we realized on our single-family loans during the periods presented. For the purposes of our single-family credit loss performance metrics, credit losses or gains represent write-offs net of recoveries and foreclosed property income or expense. The amount of these losses or gains in a given period is driven by foreclosures, pre-foreclosure sales, post-foreclosure REO activity, mortgage loan redesignations, and other events that trigger write-offs and recoveries. The single-family credit loss metrics we present are not defined terms and may not be calculated in the same manner as similarly titled measures reported by other companies. Management uses these measures to evaluate the effectiveness of our single-family credit risk management strategies in conjunction with leading indicators such as
| | | | | | | | |
| Fannie Mae Second Quarter 2024 Form 10-Q | 33 |
| | | | | | | | |
| MD&A | Single-Family Business | Single-Family Mortgage Credit Risk Management |
serious delinquency and forbearance rates, which are potential indicators of future realized single-family credit losses. We believe these measures provide useful information about our single-family credit performance and the factors that impact it.
The table below displays the components of our single-family credit loss performance metrics. Because sales of nonperforming and reperforming loans are a part of our credit loss mitigation strategy, we also provide information in the table below on our loan sale performance through the “Gains (losses) on sales and other valuation adjustments” line item.
| | | | | | | | | | | | | | | | | | | | | | | | | | |
Single-Family Credit Loss Performance Metrics and Loan Sale Performance |
| | For the Three Months Ended June 30, | | For the Six Months Ended June 30, |
| | 2024 | | 2023 | | 2024 | | 2023 |
| | (Dollars in millions) |
Write-offs | | $ | (125) | | | $ | (55) | | | $ | (222) | | | $ | (99) | |
Recoveries | | 100 | | | 29 | | | 159 | | | 107 | |
Foreclosed property income (expense) | | (113) | | | (22) | | | (192) | | | (33) | |
Credit gains (losses) | | (138) | | | (48) | | | (255) | | | (25) | |
Write-offs on the redesignation of mortgage loans from HFI to HFS(1) | | (18) | | | — | | | (38) | | | — | |
| Net credit gains (losses) and write-offs on redesignations | | (156) | | | (48) | | | (293) | | | (25) | |
Gains (losses) on sales and other valuation adjustments(2) | | (30) | | | 23 | | | (16) | | | (49) | |
| Net credit gains (losses), write-offs on redesignations and gains (losses) on sales and other valuation adjustments | | $ | (186) | | | $ | (25) | | | $ | (309) | | | $ | (74) | |
| | | | | | | | |
Credit gain (loss) ratio (in bps)(3) | | (1.5) | | | (0.5) | | | (1.4) | | | (0.1) | |
Net credit gains (losses), write-offs on redesignations and gains (losses) on sales and other valuation adjustments ratio (in bps)(4) | | (2.1) | | | (0.3) | | | (1.7) | | | (0.4) | |
(1)Consists of the lower of cost or fair value adjustment at time of redesignation.
(2)Consists of gains or losses realized on the sales of nonperforming and reperforming mortgage loans during the period and temporary lower-of-cost-or-market adjustments on HFS loans, which are recognized in “Investment gains (losses), net” in our condensed consolidated statements of operations and comprehensive income.
(3)Calculated based on the annualized amount of “Credit gains (losses)” divided by the average single-family conventional guaranty book of business during the period.
(4)Calculated based on the annualized amount of “Net credit gains (losses), write-offs on redesignations and gains (losses) on sales and other valuation adjustments” divided by the average single-family conventional guaranty book of business during the period.
The primary drivers of our net credit losses, write-offs on redesignations and losses on sales and other valuation adjustments in the second quarter and first half of 2024 were write-offs on loans for which collectability was no longer reasonably assured as well as foreclosed property expense due to increased repairs on the REO properties we acquired.
| | | | | | | | |
| Fannie Mae Second Quarter 2024 Form 10-Q | 34 |
| | | | | | | | |
| MD&A | Multifamily Business |
Multifamily Business
This section supplements and updates information regarding our Multifamily business segment in our 2023 Form 10-K. See “MD&A—Multifamily Business” in our 2023 Form 10-K for additional information regarding the primary business activities, lenders, investors and competition of our Multifamily business.
Multifamily Mortgage Market
Multifamily market fundamentals, which include factors such as vacancy rates and rent growth, improved during the second quarter of 2024, due to an increase in demand and despite elevated levels of new supply entering various markets across the country. Although the national vacancy rate is estimated to have remained steady, rent growth increased.
•Vacancy rates. Based on preliminary third-party data, we estimate that the national multifamily vacancy rate for institutional investment-type apartment properties remained steady at 6.0% as of June 30, 2024, the same as of March 31, 2024, but up from 5.8% as of June 30, 2023. The estimated average national multifamily vacancy rate over the last 15 years is approximately 5.8%.
•Rents. Based on preliminary third-party data, we estimate that effective rents increased approximately 1.0% during the second quarter of 2024, compared to an increase of 0.3% during the first quarter of 2024, and an increase of 1.0% during the second quarter of 2023.
Vacancy rates and rents are important to loan performance because multifamily loans are generally repaid from the cash flows generated by the underlying property. Several years of low vacancy rates and rising rents helped to increase property values in most metropolitan areas, but that trend reversed starting in early 2023. Based on preliminary multifamily property sales data, transaction volumes for the first half of 2024 remained well below average levels. Available data suggests that multifamily property capitalization rates, the indicated rate of return on investment of a commercial property, remained steady at 5.7% in the second quarter of 2024 and are estimated to have increased by approximately 40 basis points compared with 5.3% in the second quarter of 2023.
Multifamily construction remains elevated. There were more than 1 million rental units underway as of June 30, 2024. Based on recent historical trends, we expect between 500,000 and 550,000 units will be completed in 2024.
We believe vacancy levels could rise later this year to 6.25%, due to elevated new construction completions. We believe that this new supply will also keep rent growth subdued in the second half of 2024, and 2024 rent growth at below-average levels, in the 1.0% to 1.5% range, especially as many renters are also dealing with higher levels of consumer debt.
During the last several quarters, higher interest rates and investor yield requirements have reduced multifamily property sales transactions and placed downward pressure on multifamily property valuations. According to data from the MSCI Real Assets Commercial Property Price Index, multifamily property values declined nearly 20% from the peak in July 2022 to June 2024. We believe that with continued high interest rates, elevated new supply completions, and higher-than-average vacancy rates, multifamily sales activity will remain subdued in the near term, which could result in additional declines in multifamily property values over the short term. Over the longer term, however, we expect sales and valuations will improve due to expected improvements in multifamily housing market fundamentals stemming from positive demographic trends and ongoing job growth.
| | | | | | | | |
| Fannie Mae Second Quarter 2024 Form 10-Q | 35 |
| | | | | | | | |
| MD&A | Multifamily Business | Multifamily Business Metrics |
Multifamily Business Metrics
Multifamily New Business Volume
Through the secondary mortgage market, we support rental housing for the workforce population, for senior citizens and students, and for households with the greatest economic need. Over 95% of the multifamily units we financed in the second quarter of 2024 that were potentially eligible for housing goals credit were affordable to those earning at or below 120% of the median income in their area, providing support for both workforce housing and affordable housing. See “MD&A—Multifamily Business—Multifamily Primary Business Activities—Multifamily Activities Supporting Affordable Rental Housing” in our 2023 Form 10-K for additional information about how we support the U.S. multifamily housing market, including a description of our equity investments in low income housing tax credit (“LIHTC”) projects.
Multifamily New Business Volume
(Dollars in billions)
(1)Reflects unpaid principal balance of multifamily Fannie Mae MBS issued, multifamily loans purchased, and credit enhancements provided on multifamily mortgage assets during the period.
(2)Reflects new units financed by first liens; excludes second liens on units for which we had financed the first lien, as well as manufactured housing rentals. Second liens and manufactured housing rentals are included in unpaid principal balance.
Multifamily business volumes declined in the first half of 2024 compared with the first half of 2023, reflecting low overall multifamily market volumes and increased competition. For 2024, FHFA has capped our multifamily loan purchases at $70 billion. FHFA requires that a minimum of 50% of our 2024 multifamily loan purchases must be mission-driven, focused on specified affordable and underserved market segments. For 2024, FHFA has exempted from the volume cap loans financing workforce housing properties meeting specified criteria that preserve long-term affordability for the properties.
| | | | | | | | |
| Fannie Mae Second Quarter 2024 Form 10-Q | 36 |
| | | | | | | | |
| MD&A | Multifamily Business | Multifamily Business Metrics |
Multifamily Guaranty Book of Business and Average Charged Guaranty Fee
The chart below displays the unpaid principal balance and average charged guaranty fee related to our multifamily guaranty book of business.
Multifamily Guaranty Book of Business and Charged Fee(1)
(Dollars in billions)
(1)For information reported in this “Multifamily Business” section, our multifamily guaranty book of business is measured using the unpaid principal balance of mortgage loans underlying Fannie Mae MBS. By contrast, the multifamily guaranty book of business presented in the “Composition of Fannie Mae Guaranty Book of Business” table in the “Guaranty Book of Business” section is based on the unpaid principal balance of Fannie Mae MBS outstanding. These amounts differ primarily as a result of payments we receive on underlying loans that have not yet been paid to the MBS holders.
(2)Our multifamily guaranty book of business primarily consists of multifamily mortgage loans underlying Fannie Mae MBS outstanding, multifamily mortgage loans of Fannie Mae held in our retained mortgage portfolio, and other credit enhancements that we provide on multifamily mortgage assets. It does not include non-Fannie Mae multifamily mortgage-related securities held in our retained mortgage portfolio for which we do not provide a guaranty.
Our multifamily guaranty book of business grew to $480.1 billion as of June 30, 2024, a 6% increase from June 30, 2023, driven by our acquisitions combined with low prepayment volumes due to the high interest rate environment.
Our average charged guaranty fee represents the return we earn as compensation for the credit risk we assume on our multifamily guaranty book of business. The average charged guaranty fee on our multifamily guaranty book of business decreased as of June 30, 2024 compared with June 30, 2023 due to lower average charged fees on our acquisitions for the second half of 2023 and the first half of 2024 as compared with the existing loans in our multifamily guaranty book of business. Our guaranty fee is impacted by the rate at which loans in our book of business turn over as well as the guaranty fees we charge on new business volumes, which are set at the time we acquire the loans. Our multifamily guaranty fee pricing is based on the individual credit risk characteristics of the loans we acquire and the overall composition of our multifamily guaranty book of business. Our multifamily guaranty fee pricing is also influenced by external forces, such as the availability and cost of other sources of liquidity, our mission-related goals, the FHFA volume cap, interest rates, and MBS spreads.
| | | | | | | | |
| Fannie Mae Second Quarter 2024 Form 10-Q | 37 |
| | | | | | | | |
| MD&A | Multifamily Business | Multifamily Business Financial Results |
Multifamily Business Financial Results
This section provides a discussion of the primary components of net income for our Multifamily Business.
| | | | | | | | | | | | | | | | | | | | | | | | | | | | | | | | | | | | | | |
Multifamily Business Financial Results(1) |
| | For the Three Months Ended June 30, | | | | For the Six Months Ended June 30, | | |
| | 2024 | | 2023 | | Variance | | 2024 | | 2023 | | Variance |
| | (Dollars in millions) |
| Net interest income | | $ | 1,172 | | | $ | 1,118 | | | $ | 54 | | | $ | 2,321 | | | $ | 2,232 | | | $ | 89 | |
| Fee and other income | | 17 | | | 18 | | | (1) | | | 34 | | | 33 | | | 1 | |
| Net revenues | | 1,189 | | | 1,136 | | | 53 | | | 2,355 | | | 2,265 | | | 90 | |
| Fair value gains (losses), net | | (7) | | | (56) | | | 49 | | | (11) | | | (18) | | | 7 | |
| Administrative expenses | | (155) | | | (146) | | | (9) | | | (307) | | | (294) | | | (13) | |
| Benefit (provision) for credit losses | | (248) | | | (152) | | | (96) | | | (403) | | | (331) | | | (72) | |
Credit enhancement expense(2) | | (72) | | | (57) | | | (15) | | | (138) | | | (111) | | | (27) | |
Change in expected credit enhancement recoveries(3) | | 84 | | | 63 | | | 21 | | | 189 | | | 88 | | | 101 | |
Other expenses, net(4) | | (25) | | | (56) | | | 31 | | | (39) | | | (66) | | | 27 | |
| Income before federal income taxes | | 766 | | | 732 | | | 34 | | | 1,646 | | | 1,533 | | | 113 | |
| Provision for federal income taxes | | (137) | | | (132) | | | (5) | | | (304) | | | (293) | | | (11) | |
| Net income | | $ | 629 | | | $ | 600 | | | $ | 29 | | | $ | 1,342 | | | $ | 1,240 | | | $ | 102 | |
(1)See “Note 10, Segment Reporting” for information about our segment allocation methodology.
(2)Primarily consists of costs associated with our Multifamily CIRTTM (“MCIRTTM”) and Multifamily Connecticut Avenue Securities® (“MCASTM”) programs as well as amortization expense for certain lender risk-sharing programs.
(3)Consists of change in benefits recognized from our freestanding credit enhancements that primarily relate to our Delegated Underwriting and Servicing (“DUS®”) lender risk-sharing.
(4)Includes investment gains or losses, expenses associated with legal claims, foreclosed property income (expense), gains or losses from partnership investments, debt extinguishment gains or losses, and other income or expenses.
Net Interest Income
Net interest income increased in the second quarter and first half of 2024 compared with the second quarter and first half of 2023 due to higher guaranty fee income as a result of an increase in the size of our multifamily guaranty book of business, partially offset by lower average charged guaranty fees and lower yield maintenance income from fewer prepayments.
Benefit (Provision) for Credit Losses
See “Consolidated Results of Operations—Benefit (Provision) for Credit Losses” for a discussion of our multifamily provision for credit losses.
Change in Expected Credit Enhancement Recoveries
Change in expected credit enhancement recoveries in the first half of 2024 was primarily driven by a provision for credit losses. As a result of our risk-sharing arrangements, the increase in our multifamily provision for credit losses increased our multifamily credit enhancement receivable.
Multifamily Mortgage Credit Risk Management
This section supplements and updates our discussion of multifamily mortgage credit risk management in our 2023 Form 10-K in “MD&A—Multifamily Business—Multifamily Mortgage Credit Risk Management.” For additional information on the primary components of our strategy for managing multifamily credit risk, the factors that influence the credit risk profile of our multifamily guaranty book of business, our multifamily acquisition policy and underwriting standards, our multifamily guaranty book diversification and monitoring, and our front-end credit risk sharing, see “MD&A—Multifamily Business—Multifamily Mortgage Credit Risk Management” in our 2023 Form 10-K.
| | | | | | | | |
| Fannie Mae Second Quarter 2024 Form 10-Q | 38 |
| | | | | | | | |
| MD&A | Multifamily Business | Multifamily Mortgage Credit Risk Management |
Multifamily Guaranty Book Diversification and Monitoring
As part of our ongoing credit risk management process, we and our lenders monitor the performance and risk characteristics of our multifamily loans and the underlying properties on an ongoing basis throughout the loan term at the asset and portfolio level. We generally require lenders to provide quarterly and/or annual financial updates for multifamily loans. We closely monitor loans that are higher risk, including loans with an estimated current debt service coverage ratio (“DSCR”) below 1.0, as that is an indicator of heightened default risk. We also monitor property condition, through physical site inspections at loan origination, ongoing review of servicer-submitted property inspection reports through the life of the loan, and additional third-party inspection requirements for some higher risk transactions. When concerns arise, we have a dedicated team that actively engages with our lenders and borrowers to seek remediation of the identified issues. Failure to perform repairs may result in a default under the loan documents.
In response to recent instances of multifamily lending transactions in which one or more of the parties involved engaged in mortgage fraud or possible mortgage fraud, we are reviewing our standards and requirements. We have implemented changes to reinforce and clarify our requirements for sellers and servicers, including specifying certain high-risk activities that require their oversight. We continue to examine recent instances of actual and potential mortgage fraud and consider additional ways to reduce the risk from fraudulent practices. See “Risk Factors—Credit Risk” in our 2023 Form 10-K for a discussion of risks related to mortgage fraud.
We manage our exposure to interest-rate risk and monitor changes in interest rates, which can impact multiple aspects of our multifamily loans. We remained in a higher interest-rate environment in the first half of 2024. High interest rates may reduce the ability of multifamily borrowers to refinance their loans, which often have balloon balances at maturity. We provide information on the maturity schedule of our multifamily loans in “MD&A—Multifamily Business—Multifamily Mortgage Credit Risk Management—Multifamily Maturity Information” in our 2023 Form 10-K and in quarterly financial supplements, which we furnish to the SEC with current reports on Form 8-K and make available on our website.
Additionally, in a high interest-rate environment, multifamily borrowers with adjustable-rate mortgages will have higher monthly payments, which may lower their DSCRs. We generally require multifamily borrowers with adjustable-rate mortgages to purchase and maintain interest rate caps for the life of the loan to protect against large movements in rates as well as maintain escrows at our servicers to reserve for the cost of replacing these caps. Purchasing or replacing required interest rate caps, especially those with longer terms and/or lower capped interest rates, becomes more expensive as interest rates rise. These costs, which have been elevated since mid-2022, combined with the higher monthly payments, have added pressure to borrowers’ ability to make payments and contributed to our elevated multifamily serious delinquency rate and criticized loan population. In the recent high interest rate environment, most multifamily borrowers with adjustable-rate mortgages have been receiving payments from their interest rate cap providers, which helps to defray the higher cost of debt service and escrow payments. We actively monitor these interest-rate related risks as part of our risk management process.
We also monitor for risks manifesting within specific property types. A property type we continue to monitor closely is seniors housing, which in Fannie Mae’s book of business is primarily comprised of independent living and assisted living facilities, some of which may have a limited capacity devoted to memory care. Seniors housing loans constituted 3% of our multifamily guaranty book of business as of June 30, 2024, based on unpaid principal balance, of which 31% were adjustable-rate mortgages. We continue to monitor seniors housing loans in our multifamily guaranty book of business closely and actively manage loans that may be at risk of further deterioration or default.
The following table displays our multifamily business volumes and our multifamily guaranty book of business, based on certain key risk characteristics that we use to evaluate the risk profile and credit quality of our multifamily loans. For information on our multifamily acquisition policy and underwriting standards, see “MD&A—Multifamily Business—Multifamily Mortgage Credit Risk Management—Multifamily Acquisition Policy and Underwriting Standards” in our 2023 Form 10-K.
| | | | | | | | |
| Fannie Mae Second Quarter 2024 Form 10-Q | 39 |
| | | | | | | | |
| MD&A | Multifamily Business | Multifamily Mortgage Credit Risk Management |
We provide additional information on the credit characteristics of our multifamily loans in quarterly financial supplements, which we furnish to the SEC with current reports on Form 8-K and make available on our website. Information in our quarterly financial supplements is not incorporated by reference into this report.
| | | | | | | | | | | | | | | | | | | | | | | | | | | | | | | | | | | | | | | | | |
| Key Risk Characteristics of Multifamily Business Volume and Guaranty Book of Business |
| | Multifamily Business Volume at Acquisition(1) | |
Multifamily Guaranty Book of Business(2) As of | |
| | For the Three Months Ended June 30, | | For the Six Months Ended June 30, | | |
| | 2024 | | 2023 | | 2024 | | 2023 | | June 30, 2024 | | December 31, 2023 | |
| LTV ratio: | | | | | | | | | | | | | |
| Weighted-average original LTV ratio | | 62 | | % | 61 | | % | 62 | | % | 60 | | % | 63 | | % | 63 | | % |
| DSCR: | | | | | | | | | | | | | |
Weighted-average DSCR(1) | | 1.5 | | | 1.6 | | | 1.6 | | | 1.6 | | | 2.0 | | | 2.0 | | |
Current DSCR below 1.0(1) | | N/A | | N/A | | N/A | | N/A | | 5 | | % | 4 | | % |
| Loan amount and count: | | | | | | | | | | | | | |
| Average loan amount (in millions) | | $ | 17 | | | $ | 18 | | | $ | 18 | | | $ | 18 | | | $ | 16 | | | $ | 16 | | |
| Loan count | | 531 | | | 847 | | | 1,083 | | | 1,393 | | | 29,275 | | | 28,926 | | |
| Interest rate type: | | | | | | | | | | | | | |
| Fixed interest rate | | 100 | | % | 100 | | % | 100 | | % | 100 | | % | 92 | | % | 91 | | % |
| Adjustable interest rate | | — | | | * | | — | | | * | | 8 | | | 9 | | |
| Total | | 100 | | % | 100 | | % | 100 | | % | 100 | | % | 100 | | % | 100 | | % |
| Amortization type: | | | | | | | | | | | | | |
| Full interest-only | | 54 | | % | 55 | | % | 53 | | % | 60 | | % | 42 | | % | 42 | | % |
Partial interest-only(2) | | 39 | | | 39 | | | 39 | | | 34 | | | 46 | | | 46 | | |
| Fully amortizing | | 7 | | | 6 | | | 8 | | | 6 | | | 12 | | | 12 | | |
| Total | | 100 | | % | 100 | | % | 100 | | % | 100 | | % | 100 | | % | 100 | | % |
| Asset class type: | | | | | | | | | | | | | |
| Conventional/co-op | | 88 | | % | 93 | | % | 91 | | % | 94 | | % | 89 | | % | 89 | | % |
Seniors housing(3) | | 9 | | | 1 | | | 5 | | | 1 | | | 3 | | | 3 | | |
| Student housing | | * | | * | | * | | * | | 3 | | | 3 | | |
| Manufactured housing | | 3 | | | 6 | | | 4 | | | 5 | | | 5 | | | 5 | | |
| Total | | 100 | | % | 100 | | % | 100 | | % | 100 | | % | 100 | | % | 100 | | % |
Affordable(4) | | 19 | | % | 11 | | % | 15 | | % | 11 | | % | 12 | | % | 12 | | % |
Small balance loans(5) | | 40 | | % | 40 | | % | 42 | | % | 40 | | % | 48 | | % | 48 | | % |
Geographic concentration:(6) | | | | | | | | | | | | | |
| Midwest | | 9 | | % | 14 | | % | 11 | | % | 14 | | % | 12 | | % | 12 | | % |
| Northeast | | 13 | | | 11 | | | 14 | | | 10 | | | 15 | | | 15 | | |
| Southeast | | 34 | | | 31 | | | 32 | | | 34 | | | 27 | | | 27 | | |
| Southwest | | 28 | | | 25 | | | 26 | | | 23 | | | 22 | | | 22 | | |
| West | | 16 | | | 19 | | | 17 | | | 19 | | | 24 | | | 24 | | |
| Total | | 100 | | % | 100 | | % | 100 | | % | 100 | | % | 100 | | % | 100 | | % |
* Represents less than 0.5% of multifamily business volume or guaranty book of business.
(1)For our business volumes, the DSCR is calculated using the actual debt service payments for the loan. For our book of business, our estimates of current DSCRs are based on the latest available income information covering a 12 month period, from quarterly and annual statements for these properties including the related debt service. When an annual statement is the latest statement available, it is used. When operating statement information is not available, the underwritten DSCR is used. Co-op loans are excluded from this metric.
(2)Consists of mortgage loans that were underwritten with an interest-only term, regardless of whether the loan is currently in its interest-only period.
(3)Seniors housing acquisitions in the first half of 2024 represent refinances of existing loans in our multifamily guaranty book of business.
| | | | | | | | |
| Fannie Mae Second Quarter 2024 Form 10-Q | 40 |
| | | | | | | | |
| MD&A | Multifamily Business | Multifamily Mortgage Credit Risk Management |
(4)Represents Multifamily Affordable Housing (“MAH”) loans, which are defined as financing for properties that are under an agreement that provides long-term affordability, such as properties with rent subsidies or income restrictions. MAH loans are included within the asset class categories referenced above.
(5)Small balance loans refer to multifamily loans with an original unpaid principal balance of up to $9 million nationwide. We changed our definition of small multifamily loans in the third quarter of 2023 to increase the loan amounts from up to $6 million nationwide to up to $9 million nationwide. The updated definition has been applied to all loans in the current multifamily guaranty book of business, including loans that were acquired under previous small loan definitions. Small balance loans are included within the asset class categories referenced above. We present this metric based on loan count rather than unpaid principal balance.
(6)Midwest consists of IL, IN, IA, MI, MN, NE, ND, OH, SD and WI. Northeast consists of CT, DE, ME, MA, NH, NJ, NY, PA, PR, RI, VT and VI. Southeast consists of AL, DC, FL, GA, KY, MD, MS, NC, SC, TN, VA and WV. Southwest consists of AZ, AR, CO, KS, LA, MO, NM, OK, TX and UT. West consists of AK, CA, GU, HI, ID, MT, NV, OR, WA and WY.
Transfer of Multifamily Mortgage Credit Risk
Front-End Credit Risk Sharing
We primarily transfer credit risk on the multifamily loans we guarantee through our Delegated Underwriting and Servicing (“DUS®”) program, which delegates to DUS lenders the ability to underwrite and service multifamily loans, in accordance with our standards and requirements. See “MD&A—Multifamily Business—Multifamily Mortgage Credit Risk Management—Transfer of Multifamily Mortgage Credit Risk” in our 2023 Form 10-K for a description of our DUS program.
Loans serviced by DUS lenders and their affiliates represented substantially all of our multifamily guaranty book of business as of June 30, 2024 and December 31, 2023. Our DUS model typically results in our lenders assuming approximately one-third of the credit risk on our multifamily loans, either on a pro-rated or tiered basis. In certain situations, lenders assume less than one-third of the credit risk. We establish lender-specific loss-sharing limits for individual transactions based on loan size, lender financial performance, and lender creditworthiness, among other factors. When loss sharing is reduced on a loan, the servicing fee paid to the lender is reduced and our guaranty fee is increased to reflect the lower credit risk retained by the lender.
Non-DUS lenders, which represent a small portion of our multifamily guaranty book of business, typically share or absorb losses based on a negotiated percentage of the loan or the pool balance.
Back-End Credit Risk Sharing
Our back-end MCAS and MCIRT credit risk transfer programs transfer a portion of the credit risk associated with a reference pool of multifamily mortgage loans to insurers, reinsurers, or investors. During the first half of 2024, we entered into one new multifamily credit risk transfer transaction, transferring multifamily mortgage credit risk through an MCIRT transaction. When engaging in credit risk transfer transactions, we consider their cost, the resulting capital relief, and the overall credit risk appetite of the market. The cost of our credit risk transfer transactions is impacted by macroeconomic conditions and housing market sentiment, as well as the demand and capacity of the investors and reinsurers that support these transactions.
The table below displays the total unpaid principal balance of multifamily loans and the percentage of our multifamily guaranty book of business, based on unpaid principal balance, that is covered by a back-end credit risk transfer transaction. The table does not reflect front-end lender risk-sharing arrangements, as only a small portion of our multifamily guaranty book of business is not covered by these arrangements.
| | | | | | | | | | | | | | | | | | | | | | | | | | |
| Multifamily Loans in Back-End Credit Risk Transfer Transactions |
| | As of |
| | June 30, 2024 | | December 31, 2023 |
| | Unpaid Principal Balance | | Percentage of Multifamily Guaranty Book of Business | | Unpaid Principal Balance | | Percentage of Multifamily Guaranty Book of Business |
| | (Dollars in millions) |
| MCIRT | | $ | 99,190 | | | 21 | % | | $ | 89,517 | | | 19 | % |
| MCAS | | 48,198 | | | 10 | | | 48,476 | | | 10 | |
| Total | | $ | 147,388 | | | 31 | % | | $ | 137,993 | | | 29 | % |
| | | | | | | | |
| Fannie Mae Second Quarter 2024 Form 10-Q | 41 |
| | | | | | | | |
| MD&A | Multifamily Business | Multifamily Mortgage Credit Risk Management |
Multifamily Problem Loan Management
Credit Performance Statistics on Multifamily Problem Loans
The percentage of criticized loans in our multifamily guaranty book of business decreased as of June 30, 2024 compared with December 31, 2023, due to improving financial performance reflected in their latest operating statements and active management of the criticized loan population, both primarily related to seniors housing loans. However, our criticized loan population remains elevated, largely driven by properties financed with adjustable-rate mortgages. The criticized loans category substantially consists of loans classified as “Substandard” and also includes loans classified as “Special Mention” or “Doubtful.” Substandard loans are loans that have a well-defined weakness that could impact their timely full repayment. While the majority of the substandard loans in our multifamily guaranty book of business are currently making timely payments, we continue to monitor the performance of our substandard loan population. For more information on our credit quality indicators, including our population of substandard loans, see “Note 4, Mortgage Loans.”
Our multifamily serious delinquency rate decreased to 0.44% as of June 30, 2024, compared with 0.46% as of December 31, 2023. Approximately half of our seriously delinquent multifamily loan population as of June 30, 2024 was comprised of seniors housing loans. Our multifamily serious delinquency rate consists of multifamily loans that were 60 days or more past due based on unpaid principal balance, expressed as a percentage of our multifamily guaranty book of business. We expect our multifamily serious delinquency rate to increase in the near term due to a portfolio of approximately $600 million of adjustable-rate conventional loans that we anticipate will become seriously delinquent.
Management monitors the multifamily serious delinquency rate as an indicator of potential future credit losses and loss mitigation activities. Serious delinquency rates are reflective of our performance in assessing and managing credit risk associated with multifamily loans in our guaranty book of business. Typically, higher serious delinquency rates result in a higher allowance for loan losses. The percentage of loans in our multifamily guaranty book of business that were 180 days or more delinquent was 0.36% as of June 30, 2024, compared with 0.29% as of December 31, 2023.
In addition to the credit performance information on our multifamily loans provided in this report, we provide additional information about the performance of our multifamily loans that back MBS and whole loan REMICs in the “Data Collections” section of our DUS Disclose® tool, available at www.fanniemae.com/dusdisclose. Information on our website is not incorporated into this report. Information in Data Collections may differ from similar measures presented in our financial statements and other public disclosures for a variety of reasons, including as a result of variations in the loan population covered, timing differences in reporting and other factors.
Multifamily REO Management
As of June 30, 2024, we held 96 multifamily REO properties with a carrying value of $540 million, compared with 61 properties with a carrying value of $378 million as of December 31, 2023. The increase in foreclosure activity was primarily driven by properties included in a specific seniors housing portfolio that had write-offs during 2023. A majority of properties in this portfolio have completed the foreclosure or sale process as of June 30, 2024; however, we expect the foreclosure process to take longer for properties in the portfolio that are located in certain judicial foreclosure states with historically long foreclosure timelines.
Multifamily Credit Loss Performance Metrics
The amount of multifamily credit losses or gains we realize in a given period is driven by foreclosures, pre-foreclosure sales, post-foreclosure REO activity and other events that trigger write-offs and recoveries. Our multifamily credit loss performance metrics are not defined terms and may not be calculated in the same manner as similarly titled measures reported by other companies. For the purposes of our multifamily credit loss performance metrics, credit losses or gains represent write-offs net of recoveries and foreclosed property income or expense. We believe our multifamily credit losses, and our multifamily credit losses net of freestanding loss-sharing arrangements, provide useful information about our multifamily credit performance because they display our multifamily credit losses in the context of our multifamily guaranty book of business, including changes to the benefit we expect to receive from loss-sharing arrangements. Management views multifamily credit losses, net of freestanding loss-sharing arrangements, as a key metric related to our multifamily business model and our strategy to share multifamily credit risk.
| | | | | | | | |
| Fannie Mae Second Quarter 2024 Form 10-Q | 42 |
| | | | | | | | |
| MD&A | Multifamily Business | Multifamily Mortgage Credit Risk Management |
The table below displays the components of our multifamily credit loss performance metrics, as well as our multifamily initial write-off severity rate and write-off loan count.
| | | | | | | | | | | | | | | | | | | | | | | | | | | | | | | | | | | | | | |
| Multifamily Credit Loss Performance Metrics |
| | For the Three Months Ended June 30, | | For the Six Months Ended June 30, | |
| | 2024 | | 2023 | | 2024 | | 2023 |
| | (Dollars in millions) |
Write-offs(1) | | $ | (38) | | | | $ | (17) | | | | $ | (171) | | | | $ | (254) | | |
Recoveries | | 12 | | | | 1 | | | | 33 | | | | 10 | | |
Foreclosed property income (expense) | | (25) | | | | (36) | | | | (45) | | | | (40) | | |
Credit gains (losses) | | (51) | | | | (52) | | | | (183) | | | | (284) | | |
Change in expected benefits from freestanding loss-sharing arrangements(2) | | 16 | | | | 23 | | | | 53 | | | | 31 | | |
Credit gains (losses), net of freestanding loss-sharing arrangements | | $ | (35) | | | | $ | (29) | | | | $ | (130) | | | | $ | (253) | | |
| | | | | | | | | | | | |
Credit gain (loss) ratio (in bps)(3) | | (4.3) | | | | (4.6) | | | | (7.7) | | | | (12.7) | | |
Credit gain (loss) ratio, net of freestanding loss-sharing arrangements (in bps)(2)(3) | | (2.9) | | | | (2.6) | | | | (5.5) | | | | (11.3) | | |
Multifamily initial write-off severity rate on liquidated loans(4)(5) | | 3.8 | | % | | 69.1 | | % | | 26.9 | | % | | 13.2 | | % |
Multifamily write-off loan count on liquidated loans(6) | | 4 | | | | 4 | | | | 11 | | | | 6 | | |
(1)Represents write-offs when a loan is determined to be uncollectible prior to a liquidation event, which includes foreclosure, a deed-in-lieu of foreclosure or a short-sale (collectively a “liquidation event”), as well as write-offs at liquidation. Write-offs associated with non-REO sales are net of loss sharing.
(2)Represents changes to the benefit we expect to receive only from write-offs as a result of certain freestanding loss-sharing arrangements, primarily multifamily DUS lender risk-sharing transactions. Changes to the expected benefits we will receive are recorded in “Change in expected credit enhancement recoveries” in our condensed consolidated statements of operations and comprehensive income.
(3)Calculated based on the annualized amount of “Credit gains (losses)” and “Credit gains (losses), net of freestanding loss-sharing arrangements,” divided by the average multifamily guaranty book of business during the period.
(4)Rate is calculated as the initial write-off amount divided by the average defaulted unpaid principal balance.
(5)Based on write-offs associated with a liquidation event. The rate excludes any costs, gains or losses associated with REO after initial acquisition through final disposition. The rate also excludes write-offs when a loan is determined to be uncollectible prior to a liquidation event. Write-offs are net of lender loss-sharing agreements.
(6)Represents the number of loans that experienced write-offs associated with a liquidation event during the period.
Our multifamily credit losses decreased in the first half of 2024 compared with the first half of 2023 primarily as a result of fewer write-offs. Our multifamily credit losses in the first half of 2023 were primarily driven by write-offs on a seniors housing portfolio during the first quarter of 2023.
| | | | | | | | |
| Fannie Mae Second Quarter 2024 Form 10-Q | 43 |
| | | | | | | | |
| MD&A | Consolidated Credit Ratios and Select Credit Information |
Consolidated Credit Ratios and Select Credit Information
The table below displays select credit ratios on our single-family conventional guaranty book of business and our multifamily guaranty book of business, as well as the inputs used in calculating these ratios.
| | | | | | | | | | | | | | | | | | | | | | | | | | | | | | | | | | | | | | | | | | | | | | | | | | | | | | | | |
| Consolidated Credit Ratios and Select Credit Information |
| | As of |
| | June 30, 2024 | | December 31, 2023 |
| | Single-family | | Multifamily | | Consolidated Total | | Single-family | | Multifamily | | Consolidated Total |
| | (Dollars in millions) |
| Credit loss reserves as a percentage of: | | | | | | | | | | | | | | | | | | |
| Guaranty book of business | | 0.16 | | % | | 0.49 | | % | | 0.20 | | % | | 0.18 | | % | | 0.44 | | % | | 0.21 | | % |
| Nonaccrual loans at amortized cost | | 24.17 | | | | 126.84 | | | | 31.56 | | | | 28.50 | | | | 109.21 | | | | 34.51 | | |
| | | | | | | | | | | | | | | | | | |
| Nonaccrual loans as a percentage of: | | | | | | | | | | | | | | | | | | |
| Guaranty book of business | | 0.65 | | % | | 0.38 | | % | | 0.62 | | % | | 0.65 | | % | | 0.40 | | % | | 0.62 | | % |
| | | | | | | | | | | | | | | | | | |
| Select financial information used in calculating credit ratios: | | |
Credit loss reserves(1) | | $ | (5,724) | | | | $ | (2,330) | | | | $ | (8,054) | | | | $ | (6,696) | | | | $ | (2,064) | | | | $ | (8,760) | | |
Guaranty book of business(2) | | 3,624,007 | | | | 480,081 | | | | 4,104,088 | | | | 3,636,735 | | | | 470,398 | | | | 4,107,133 | | |
| Nonaccrual loans at amortized cost | | 23,683 | | | | 1,837 | | | | 25,520 | | | | 23,497 | | | | 1,890 | | | | 25,387 | | |
| | | | | | | | | | | | | | | | | | |
| Components of credit loss reserves: | | | | | | | | | | | | | | | | | | |
| Allowance for loan losses | | $ | (5,703) | | | | $ | (2,323) | | | | $ | (8,026) | | | | $ | (6,671) | | | | $ | (2,059) | | | | $ | (8,730) | | |
| Allowance for accrued interest receivable | | (21) | | | | — | | | | (21) | | | | (25) | | | | — | | | | (25) | | |
Reserve for guaranty losses(3) | | — | | | | (7) | | | | (7) | | | | — | | | | (5) | | | | (5) | | |
Total credit loss reserves(1) | | $ | (5,724) | | | | $ | (2,330) | | | | $ | (8,054) | | | | $ | (6,696) | | | | $ | (2,064) | | | | $ | (8,760) | | |
(1)Our multifamily credit loss reserves exclude the expected benefit of freestanding credit enhancements on multifamily loans of $776 million as of June 30, 2024 and $599 million as of December 31, 2023, which are recorded in “Other assets” in our condensed consolidated balance sheets.
(2)Guaranty book of business is as of period end. For single-family represents the conventional guaranty book of business.
(3)Reserve for guaranty losses is recorded in “Other liabilities” in our condensed consolidated balance sheets.
Our single-family credit loss reserves decreased as of June 30, 2024 compared with December 31, 2023 primarily as a result of a benefit for credit losses, which reduced our single-family allowance for loan losses. Our multifamily credit loss reserves increased as of June 30, 2024 compared with December 31, 2023 primarily as a result of a provision for credit losses, which increased our multifamily allowance for loan losses. See “Consolidated Results of Operations—Benefit (Provision) for Credit Losses” for more information on our single-family benefit for credit losses and our multifamily provision for credit losses.
| | | | | | | | |
| Fannie Mae Second Quarter 2024 Form 10-Q | 44 |
| | | | | | | | |
| MD&A | Consolidated Credit Ratios and Select Credit Information |
| | | | | | | | | | | | | | | | | | | | | | | | | | | | | | | | | | | | | | | | | |
| Consolidated Write-off Ratio and Select Credit Information | | | |
| | For the Three Months Ended June 30, | | | |
| | 2024 | | 2023 | | | |
| | Single-family | | Multifamily | | Total | | Single-family | | Multifamily | | Total | | | |
| | (Dollars in millions) | | | |
| Select credit ratio: | | | | | | | | | | | | | | | |
| Write-offs, net of recoveries annualized, as a percentage of the average guaranty book of business (in bps) | | 0.5 | | | 2.2 | | | 0.7 | | | 0.3 | | 1.4 | | | 0.4 | | | |
| | | | | | | | | | | | | | | |
| Select financial information used in calculating credit ratio: | | |
Write-offs(1) | | $ | 143 | | | $ | 38 | | | $ | 181 | | | $ | 55 | | | $ | 17 | | | $ | 72 | | | | |
| Recoveries | | (100) | | | (12) | | | (112) | | | (29) | | | (1) | | | (30) | | | | |
| Write-offs, net of recoveries | | $ | 43 | | | $ | 26 | | | $ | 69 | | | $ | 26 | | | $ | 16 | | | $ | 42 | | | | |
Average guaranty book of business(2) | | $ | 3,624,820 | | | $ | 478,506 | | | $ | 4,103,326 | | | $ | 3,630,397 | | | $ | 450,067 | | | $ | 4,080,464 | | | | |
| | | | | | | | | | | | | | | |
| | For the Six Months Ended June 30, | | | |
| | 2024 | | 2023 | | | |
| | Single-family | | Multifamily | | Total | | Single-family | | Multifamily | | Total | | | |
| | (Dollars in millions) | | | |
| Select credit ratio: | | | | | | | | | | | | | | | |
| Write-offs, net of recoveries annualized, as a percentage of the average guaranty book of business (in bps) | | 0.6 | | | 5.8 | | | 1.2 | | | * | | 10.9 | | | 1.2 | | | |
| | | | | | | | | | | | | | | |
| Select financial information used in calculating credit ratio: | | |
Write-offs(1) | | $ | 260 | | | $ | 171 | | | $ | 431 | | | $ | 99 | | | $ | 254 | | | $ | 353 | | | | |
| Recoveries | | (159) | | | (33) | | | (192) | | | (107) | | | (10) | | | (117) | | | | |
| Write-offs, net of recoveries | | $ | 101 | | | $ | 138 | | | $ | 239 | | | $ | (8) | | | $ | 244 | | | $ | 236 | | | | |
Average guaranty book of business(2) | | $ | 3,628,792 | | | $ | 475,803 | | | $ | 4,104,595 | | | $ | 3,632,010 | | | $ | 446,853 | | | $ | 4,078,863 | | | | |
* Represents credit ratio of less than 0.05 bps.
(1)Represents write-offs when a loan is determined to be uncollectible. For single-family, also includes any write-offs upon the redesignation of mortgage loans from HFI to HFS.
(2)Average guaranty book of business is based on quarter-end balances.
Liquidity and Capital Management
Liquidity Management
This section supplements and updates information regarding liquidity management in our 2023 Form 10-K. See “MD&A—Liquidity and Capital Management—Liquidity Management” in our 2023 Form 10-K for additional information, including discussions of our primary sources and uses of funds, our liquidity and funding risk management practices and contingency planning, our liquidity requirements, factors that influence our debt funding activity, factors that may impact our access to or the cost of our debt funding and factors that could adversely affect our liquidity and funding. As of June 30, 2024, we were in compliance with all four components of the liquidity requirements outlined in our 2023 Form 10-K. Also see “Risk Factors—Liquidity and Funding Risk” in our 2023 Form 10-K for a discussion of liquidity and funding risks.
| | | | | | | | |
| Fannie Mae Second Quarter 2024 Form 10-Q | 45 |
| | | | | | | | |
| MD&A | Liquidity and Capital Management |
Debt Funding
The unpaid principal balance of our aggregate indebtedness was $122.8 billion as of June 30, 2024. Pursuant to the terms of the senior preferred stock purchase agreement with Treasury, we are prohibited from issuing debt without the prior consent of Treasury if it would result in our aggregate indebtedness exceeding our outstanding debt limit, currently set to $270 billion. The calculation of our indebtedness for purposes of complying with our debt limit reflects the unpaid principal balance and excludes debt basis adjustments and debt of consolidated trusts.
Outstanding Debt
Total outstanding debt of Fannie Mae includes short-term and long-term debt and excludes debt of consolidated trusts. Short-term debt of Fannie Mae consists of borrowings with an original contractual maturity of one year or less and, therefore, does not include the current portion of long-term debt. Long-term debt of Fannie Mae consists of borrowings with an original contractual maturity of greater than one year.
The following chart and table display information on our outstanding short-term and long-term debt based on original contractual maturity.
Debt of Fannie Mae(1)
(Dollars in billions)
(1)Outstanding debt balance consists of the unpaid principal balance, premiums and discounts, fair value adjustments, hedge-related basis adjustments and other cost basis adjustments. Reported amounts include net discount unamortized cost basis adjustments and fair value adjustments of $4.2 billion and $4.0 billion as of June 30, 2024 and December 31, 2023, respectively.
| | | | | | | | | | | | | | | | | |
| Selected Debt Information |
| | | As of |
| | | June 30, 2024 | | December 31, 2023 |
| | | (Dollars in billions) |
Selected Weighted-Average Interest Rates(1) | | | | | |
| Interest rate on short-term debt | | | 5.30 | % | | 5.13 | % |
Interest rate on long-term debt, including portion maturing within one year | | | 2.88 | | | 2.63 | |
| Interest rate on callable debt | | | 2.62 | | | 2.41 | |
| Selected Maturity Data | | | | | |
Weighted-average maturity of debt maturing within one year (in days) | | | 149 | | | 135 | |
Weighted-average maturity of debt maturing in more than one year (in months) | | | 45 | | | 46 | |
| Other Data | | | | | |
Outstanding callable debt(2) | | | $ | 42.9 | | | $ | 43.8 | |
Connecticut Avenue Securities debt(3) | | | 2.3 | | | 2.8 | |
| | | | | | | | |
| Fannie Mae Second Quarter 2024 Form 10-Q | 46 |
| | | | | | | | |
| MD&A | Liquidity and Capital Management |
(1)Excludes the effects of fair value adjustments and hedge-related basis adjustments.
(2)Includes short-term callable debt of $1.5 billion and $2.6 billion as of June 30, 2024 and December 31, 2023, respectively.
(3)Represents CAS debt issued prior to November 2018. See “MD&A—Single-Family Business—Single-Family Mortgage Credit Risk Management—Single-Family Credit Enhancement and Transfer of Mortgage Credit Risk—Credit Risk Transfer Transactions” in our 2023 Form 10-K for information regarding our Connecticut Avenue Securities®.
We intend to repay our short-term and long-term debt obligations as they become due primarily through cash from business operations, the sale of assets in our corporate liquidity portfolio and the issuance of additional debt securities.
For information on the maturity profile of our outstanding long-term debt, see “Note 8, Short-Term and Long-Term Debt” in this report and in our 2023 Form 10-K.
Debt Funding Activity
The table below displays activity in debt of Fannie Mae. This activity excludes the debt of consolidated trusts and intraday borrowing. The reported amounts of debt issued and paid off during each period represent the face amount of the debt at issuance and redemption.
| | | | | | | | | | | | | | | | | | | | | | | |
| Activity in Debt of Fannie Mae |
| For the Three Months Ended June 30, | | For the Six Months Ended June 30, |
| |
| 2024 | | 2023 | | 2024 | | 2023 |
| (Dollars in millions) |
| Issued during the period: | | | | | | | |
| Short-term: | | | | | | | |
| Amount | $ | 61,657 | | | $ | 56,045 | | | $ | 141,158 | | | $ | 111,151 | |
| Weighted-average interest rate | 5.30 | % | | 4.68 | % | | 5.29 | % | | 4.53 | % |
| Long-term: | | | | | | | |
| Amount | $ | 5,865 | | | $ | 3,093 | | | $ | 9,857 | | | $ | 5,961 | |
| Weighted-average interest rate | 5.29 | % | | 5.28 | % | | 5.14 | % | | 5.33 | % |
| Total issued: | | | | | | | |
| Amount | $ | 67,522 | | | $ | 59,138 | | | $ | 151,015 | | | $ | 117,112 | |
| Weighted-average interest rate | 5.30 | % | | 4.71 | % | | 5.28 | % | | 4.57 | % |
Paid off during the period:(1) | | | | | | | |
| Short-term: | | | | | | | |
| Amount | $ | 63,895 | | | $ | 54,405 | | | $ | 146,459 | | | $ | 105,711 | |
| Weighted-average interest rate | 4.80 | % | | 4.14 | % | | 4.75 | % | | 4.07 | % |
Long-term:(2) | | | | | | | |
| Amount | $ | 3,543 | | | $ | 5,782 | | | $ | 9,958 | | | $ | 7,887 | |
| Weighted-average interest rate | 4.02 | % | | 2.45 | % | | 3.54 | % | | 2.55 | % |
| Total paid off: | | | | | | | |
| Amount | $ | 67,438 | | | $ | 60,187 | | | $ | 156,417 | | | $ | 113,598 | |
| Weighted-average interest rate | 4.76 | % | | 3.98 | % | | 4.67 | % | | 3.96 | % |
(1)Consists of all payments on debt, including regularly scheduled principal payments, payments at maturity, payments resulting from calls and payments for any other repurchases. Repurchases of debt and early retirements of zero-coupon debt are reported at original face value, which does not equal the amount of actual cash payment.
(2)Includes credit risk-sharing securities issued as CAS debt prior to November 2018. For information on our credit risk transfer transactions, see “MD&A—Single-Family Business—Single-Family Mortgage Credit Risk Management—Single-Family Credit Enhancement and Transfer of Mortgage Credit Risk—Credit Risk Transfer Transactions” in our 2023 Form 10-K.
| | | | | | | | |
| Fannie Mae Second Quarter 2024 Form 10-Q | 47 |
| | | | | | | | |
| MD&A | Liquidity and Capital Management |
Corporate Liquidity Portfolio
The chart below displays information on the composition of our corporate liquidity portfolio. The balance and composition of our corporate liquidity portfolio fluctuates as a result of changes in our cash flows, liquidity in the fixed-income markets, and our liquidity risk management framework and practices.
| | | | | | | | |
| | U.S. Treasury securities |
| | |
| | Securities purchased under agreements to resell |
| | |
| | Cash and cash equivalents(1) |
(1) Cash equivalents are composed of overnight reverse repurchase agreements and U.S. Treasuries, if any, that have a maturity at the date of acquisition of three months or less.
Off-Balance Sheet Arrangements
We enter into certain business arrangements to facilitate our statutory purpose of providing liquidity to the secondary mortgage market and to reduce our exposure to interest rate fluctuations. Some of these arrangements are not recorded in our condensed consolidated balance sheets or may be recorded in amounts different from the full contract or notional amount of the transaction, depending on the nature or structure of, and the accounting required to be applied to, the arrangement. These arrangements are commonly referred to as “off-balance sheet arrangements” and expose us to potential losses in excess of the amounts recorded in our condensed consolidated balance sheets.
Our off-balance sheet arrangements result primarily from the following:
•our guaranty of mortgage loan securitization and resecuritization transactions over which we have no control, which are reflected in our unconsolidated Fannie Mae MBS net of any beneficial ownership interest we retain, and other financial guarantees that we do not control;
•liquidity support transactions; and
•partnership interests.
The total amount of our off-balance sheet exposure related to unconsolidated Fannie Mae MBS net of any beneficial interest that we retain, and other financial guarantees was $219.9 billion as of June 30, 2024 and $227.5 billion as of December 31, 2023. The majority of the other financial guarantees consists of Freddie Mac securities backing Fannie Mae structured securities. See “Guaranty Book of Business” and “Note 7, Financial Guarantees” for more information regarding our maximum exposure to loss on unconsolidated Fannie Mae MBS and Freddie Mac securities.
Our total outstanding liquidity commitments to advance funds for securities backed by multifamily housing revenue bonds totaled $4.4 billion as of June 30, 2024 and $4.5 billion as of December 31, 2023. These commitments require us to advance funds to third parties that enable them to repurchase tendered bonds or securities that are unable to be remarketed.
We have investments in various limited partnerships and similar legal entities, which consist of LIHTC investments, community investments and investments in other entities. When we do not have a controlling financial interest in those entities, our condensed consolidated balance sheets reflect only our investment rather than the full amount of the partnership’s assets and liabilities. See “Note 3, Consolidations and Transfers of Financial Assets—Unconsolidated VIEs” for information regarding our investments in limited partnerships and similar legal entities.
| | | | | | | | |
| Fannie Mae Second Quarter 2024 Form 10-Q | 48 |
| | | | | | | | |
| MD&A | Liquidity and Capital Management |
Cash Flows
Six Months Ended June 30, 2024. Cash, cash equivalents and restricted cash and cash equivalents increased from $68.7 billion as of December 31, 2023 to $78.3 billion as of June 30, 2024. The increase was primarily driven by cash inflows from (1) proceeds from repayments of loans, (2) the sale of Fannie Mae MBS to third parties, and (3) investments in securities purchased under agreements to resell.
Partially offsetting these cash inflows were cash outflows from (1) payments on outstanding debt of consolidated trusts, (2) purchases of loans held for investment, and (3) advances to lenders.
Six Months Ended June 30, 2023. Cash, cash equivalents and restricted cash and cash equivalents decreased from $87.8 billion as of December 31, 2022 to $79.4 billion as of June 30, 2023. The decrease was primarily driven by cash outflows from (1) payments on outstanding debt of consolidated trusts, (2) purchases of loans held for investment, and (3) advances to lenders.
Partially offsetting these cash outflows were cash inflows from (1) proceeds from repayments and sales of loans, (2) the sale of Fannie Mae MBS to third parties, and (3) the issuances of funding debt, which outpaced redemptions.
Credit Ratings
As of June 30, 2024, our credit ratings issued by the three major credit rating agencies have not changed since December 31, 2023. For information on these credit ratings, see “MD&A—Liquidity and Capital Management—Liquidity Management—Credit Ratings” in our 2023 Form 10-K.
Capital Management
Capital Requirements
FHFA published a final rule in November 2023 amending several provisions of the enterprise regulatory capital framework, with most of the amendments becoming effective in April 2024. For a description of our capital requirements under the enterprise regulatory capital framework, including the amended provisions, see “Business—Legislation and Regulation—Capital Requirements” in our 2023 Form 10-K. Although the enterprise regulatory capital framework went into effect in February 2021, we are not required to hold capital according to the framework’s requirements until the date of termination of our conservatorship, or such later date as may be ordered by FHFA.
The table below sets forth information about our capital requirements under the standardized approach of the enterprise regulatory capital framework. Available capital under the enterprise regulatory capital framework excludes the stated value of the senior preferred stock ($120.8 billion) and other specified amounts in the table below. As a result of these exclusions, we had a deficit in available capital as of June 30, 2024, despite having a positive net worth under accounting principles generally accepted in the United States of America (“GAAP”).
We had a $229 billion shortfall of our available capital (deficit) to the adjusted total capital requirement (including buffers) of $184 billion under the standardized approach of the enterprise regulatory capital framework as of June 30, 2024. Our capital shortfall declined by $14 billion from December 31, 2023 to June 30, 2024, primarily as a result of the increase in our retained earnings during the first half of 2024 and the impact of the amendments to the enterprise regulatory capital framework that became effective in April 2024.
| | | | | | | | |
| Fannie Mae Second Quarter 2024 Form 10-Q | 49 |
| | | | | | | | |
| MD&A | Liquidity and Capital Management |
| | | | | | | | | | | | | | | | | | | | |
Capital Metrics under the Enterprise Regulatory Capital Framework as of June 30, 2024(1) |
| (Dollars in billions) |
| Adjusted total assets | | $ | 4,439 | | | Stress capital buffer | | $ | 34 | |
| Risk-weighted assets (standardized approach): | | | | Stability capital buffer | | 48 | |
| Credit risk | | $ | 1,165 | | | Countercyclical capital buffer | | — | |
| Market risk | | 27 | | | Prescribed capital conservation buffer amount | | $ | 82 | |
| Operational risk | | 83 | | | |
| Total risk-weighted assets | | $ | 1,275 | | | | | |
| | | | | | | | | | | | | | | | | | | | | | | | | | | | | | | | | | | | | | |
| | Minimum Capital Ratio Requirement | | Minimum Capital Requirement | | Applicable Buffers(2) | | Total Capital Requirement (including Buffers) | | Available Capital (Deficit)(3) | | Capital Shortfall(4) |
| Risk-based capital: | | | | | | | | | | | |
| Total capital (statutory)(5) | 8.0 | % | | $ | 102 | | | N/A | | $ | 102 | | | $ | (26) | | | $ | (128) | |
| Common equity tier 1 capital | 4.5 | | | 57 | | | $ | 82 | | | 139 | | | (65) | | | (204) | |
| Tier 1 capital | 6.0 | | | 77 | | | 82 | | | 159 | | | (45) | | | (204) | |
| Adjusted total capital | 8.0 | | | 102 | | | 82 | | | 184 | | | (45) | | | (229) | |
| Leverage capital: | | | | | | | | | | | |
| Core capital (statutory)(6) | 2.5 | | | 111 | | | N/A | | 111 | | | (34) | | | (145) | |
| Tier 1 capital | 2.5 | | | 111 | | | 24 | | | 135 | | | (45) | | | (180) | |
| | | | | | | | | | | | |
| | | | | | | | | | | | | | | | | | | | |
Capital Metrics under the Enterprise Regulatory Capital Framework as of December 31, 2023(1) |
| (Dollars in billions) |
| Adjusted total assets | | $ | 4,552 | | | Stress capital buffer | | $ | 34 | |
| Risk-weighted assets (standardized approach): | | | | Stability capital buffer | | 45 | |
| Credit risk | | $ | 1,241 | | | Countercyclical capital buffer | | — | |
| Market risk | | 31 | | | Prescribed capital conservation buffer amount | | $ | 79 | |
| Operational risk | | 85 | | | |
| Total risk-weighted assets | | $ | 1,357 | | | | | |
| | | | | | |
| | | | | | | | | | | | | | | | | | | | | | | | | | | | | | | | | | | | | | |
| | Minimum Capital Ratio Requirement | | Minimum Capital Requirement | | Applicable Buffers(2) | | Total Capital Requirement (including Buffers) | | Available Capital (Deficit)(3) | | Capital Shortfall(4) |
| Risk-based capital: | | | | | | | | | | | |
| Total capital (statutory)(5) | 8.0 | % | | $ | 109 | | | N/A | | $ | 109 | | | $ | (34) | | | $ | (143) | |
| Common equity tier 1 capital | 4.5 | | | 61 | | | $ | 79 | | | 140 | | | (74) | | | (214) | |
| Tier 1 capital | 6.0 | | | 81 | | | 79 | | | 160 | | | (55) | | | (215) | |
| Adjusted total capital | 8.0 | | | 109 | | | 79 | | | 188 | | | (55) | | | (243) | |
| Leverage capital: | | | | | | | | | | | |
| Core capital (statutory)(6) | 2.5 | | | 114 | | | N/A | | 114 | | | (43) | | | (157) | |
| Tier 1 capital | 2.5 | | | 114 | | | 23 | | | 137 | | | (55) | | | (192) | |
| | | | | | | | | | | | |
(1)Ratios are calculated as a percentage of risk-weighted assets for risk-based capital metrics and as a percentage of adjusted total assets for leverage capital metrics.
(2)The prescribed capital buffers represent the amount of capital we are required to hold above the minimum risk-based and leverage capital requirements. The applicable buffer for risk-based common equity tier 1 capital, tier 1 capital, and adjusted total capital is the prescribed capital conservation buffer amount, or PCCBA, which is composed of a stress capital buffer, a stability capital buffer, and a countercyclical capital buffer. The PCCBA must be comprised entirely of common equity tier one capital. The applicable buffer for leverage tier 1 capital is
| | | | | | | | |
| Fannie Mae Second Quarter 2024 Form 10-Q | 50 |
| | | | | | | | |
| MD&A | Liquidity and Capital Management |
the prescribed leverage buffer amount, or PLBA. The stress capital buffer and countercyclical capital buffer are each calculated by multiplying prescribed factors by adjusted total assets as of the last day of the previous calendar quarter. The stability capital buffer is based on our share of mortgage debt outstanding. The prescribed leverage buffer for June 30, 2024 and December 31, 2023 was set at 50% of the June 30, 2024 and December 31, 2023 stability capital buffer, respectively.
(3)Available capital (deficit) for all line items excludes the stated value of the senior preferred stock ($120.8 billion). Available capital (deficit) for all line items except total capital and core capital also deducts a portion of deferred tax assets. Deferred tax assets arising from temporary differences between GAAP and tax requirements are deducted from capital to the extent they exceed 10% of common equity. As of June 30, 2024 and December 31, 2023, this resulted in the full deduction of deferred tax assets ($11.0 billion and $11.7 billion, respectively) from our available capital (deficit). Available capital (deficit) for common equity tier 1 capital also excludes the value of the perpetual, noncumulative preferred stock ($19.1 billion) as of June 30, 2024 and December 31, 2023.
(4)Our capital shortfall consists of the difference between the applicable capital requirement (including buffers) and the applicable available capital (deficit).
(5)The sum of (a) core capital (see definition in footnote 6 below); and (b) a general allowance for foreclosure losses, which (i) shall include an allowance for portfolio mortgage losses, an allowance for non-reimbursable foreclosure costs on government claims, and an allowance for liabilities reflected on the balance sheet for estimated foreclosure losses on mortgage-backed securities; and (ii) shall not include any reserves made or held against specific assets; and (c) any other amounts from sources of funds available to absorb losses that the Director of FHFA by regulation determines are appropriate to include in determining total capital.
(6)The sum of (a) the stated value of our outstanding common stock (common stock less treasury stock); (b) the stated value of our outstanding perpetual, noncumulative preferred stock; (c) our paid-in capital; and (d) our retained earnings (accumulated deficit). Core capital does not include: (a) accumulated other comprehensive income or (b) senior preferred stock.
At June 30, 2024, our maximum payout ratio under the enterprise regulatory capital framework was 0%. See “Note 15, Regulatory Capital Requirements” for information on our capital ratios as of June 30, 2024 and December 31, 2023 under the enterprise regulatory capital framework.
The table below presents certain components of our regulatory capital. | | | | | | | | | | | | | | | | | | | | |
| Regulatory Capital Components | | |
| | | | As of |
| | June 30, 2024 | | December 31, 2023 |
| | | | (Dollars in millions) |
| Total equity | | $ | 86,483 | | | $ | 77,682 | |
| Less: | | | | |
| Senior preferred stock | | 120,836 | | | 120,836 | |
| Preferred stock | | 19,130 | | | 19,130 | |
| Common equity | | (53,483) | | | (62,284) | |
| Less: deferred tax assets arising from temporary differences that exceed 10% of common equity tier 1 capital and other regulatory adjustments | | 11,036 | | | 11,681 | |
| Common equity tier 1 capital (deficit) | | (64,519) | | | (73,965) | |
| Add: perpetual, noncumulative preferred stock | | 19,130 | | | 19,130 | |
| Tier 1 capital (deficit) | | (45,389) | | | (54,835) | |
| Tier 2 capital adjustments | | — | | | — | |
| Adjusted total capital (deficit) | | $ | (45,389) | | | $ | (54,835) | |
The table below presents certain components of our core capital.
| | | | | | | | | | | | | | | | | | | | |
| Statutory Capital Components | | |
| | As of |
| | | | June 30, 2024 | | December 31, 2023 |
| | | | (Dollars in millions) |
| Total equity | | $ | 86,483 | | | $ | 77,682 | |
| Less: | | | | |
| Senior preferred stock | | 120,836 | | | 120,836 | |
| Accumulated other comprehensive income (loss), net of taxes | | 29 | | | 32 | |
| Core capital (deficit) | | $ | (34,382) | | | $ | (43,186) | |
| Less: general allowance for foreclosure losses | | (8,227) | | | (8,934) | |
| Total capital (deficit) | | $ | (26,155) | | | $ | (34,252) | |
| | | | | | | | |
| Fannie Mae Second Quarter 2024 Form 10-Q | 51 |
| | | | | | | | |
| MD&A | Liquidity and Capital Management |
Capital Activity
Under the terms governing the senior preferred stock, no dividends were payable to Treasury for the second quarter of 2024 and none are payable for the third quarter of 2024.
Under the terms governing the senior preferred stock, through and including the capital reserve end date, any increase in our net worth during a fiscal quarter results in an increase of the same amount in the aggregate liquidation preference of the senior preferred stock in the following quarter. The capital reserve end date is defined as the last day of the second consecutive fiscal quarter during which we have had and maintained capital equal to, or in excess of, all of the capital requirements and buffers under the enterprise regulatory capital framework.
As a result of these terms governing the senior preferred stock, the aggregate liquidation preference of the senior preferred stock increased to $203.5 billion as of June 30, 2024 from $199.2 billion as of March 31, 2024, due to the $4.3 billion increase in our net worth in the first quarter of 2024. The aggregate liquidation preference of the senior preferred stock will further increase to $208.0 billion as of September 30, 2024, due to the $4.5 billion increase in our net worth in the second quarter of 2024. See “Business—Conservatorship and Treasury Agreements—Treasury Agreements” in our 2023 Form 10-K for more information on the terms of our senior preferred stock, including how the aggregate liquidation preference is determined.
Increases in our net worth improve our capital position and our ability to absorb losses; however, increases in our net worth also increase the aggregate liquidation preference of the senior preferred stock by the same amount until the capital reserve end date as discussed above.
Treasury Funding Commitment
Treasury made a commitment under the senior preferred stock purchase agreement to provide funding to us under certain circumstances if we have a net worth deficit. As of June 30, 2024, the remaining amount of Treasury’s funding commitment to us was $113.9 billion. See “Note 2, Conservatorship, Senior Preferred Stock Purchase Agreement and Related Matters” in our 2023 Form 10-K for more information on Treasury’s funding commitment under the senior preferred stock purchase agreement.
Risk Management
Our business activities expose us to the following major categories of risk: credit risk (including mortgage credit risk and institutional counterparty credit risk), market risk (including interest-rate risk), liquidity and funding risk, operational risk (including cyber/information security risk and third-party risk) and model risk, as well as strategic risk, compliance risk and reputational risk. We are also exposed to climate risk, which we view as a cross-cutting risk that can impact a variety of our existing risk categories, particularly credit risk. See “MD&A—Risk Management” in our 2023 Form 10-K for a discussion of our management of these risks. This section supplements and updates that discussion but does not address all of the risk management categories described in our 2023 Form 10-K.
Market Risk Management, including Interest-Rate Risk Management
We are subject to market risk, which includes interest-rate risk and spread risk. These risks arise primarily from our mortgage asset investments. Interest-rate risk is the risk that movements in interest rates will adversely affect the value of our assets or liabilities or our future earnings or capital. Spread risk is the risk from changes in an instrument’s value that relate to factors other than changes in interest rates. We do not currently actively manage or hedge, on an economic basis, our spread risk, or the interest-rate risk arising from cost basis adjustments and float income associated with mortgage assets held by our consolidated MBS trusts. See “MD&A—Risk Management—Market Risk Management, including Interest-Rate Risk Management” and “Risk Factors—Market and Industry Risk” in our 2023 Form 10-K for additional information, including our sources of interest-rate risk exposure, business risks posed by changes in interest rates, and our strategy for managing interest-rate risk. For additional information on the impact of interest-rate risk on our earnings, see “Earnings Exposure to Interest-Rate Risk” below.
| | | | | | | | |
| Fannie Mae Second Quarter 2024 Form 10-Q | 52 |
| | | | | | | | |
| MD&A | Risk Management | Market Risk Management, including Interest-Rate Risk Management |
Measurement of Interest-Rate Risk
The table below displays the pre-tax market value sensitivity of our net portfolio to changes in the level of interest rates and the slope of the applicable yield curve as measured on the last day of each period presented. We collectively define our net portfolio as: our retained mortgage portfolio assets; our corporate liquidity portfolio; outstanding debt of Fannie Mae used to fund the retained mortgage portfolio assets and corporate liquidity portfolio; mortgage commitments; and risk management derivatives. The table below also provides the daily average, minimum, maximum and standard deviation values for duration gap and for the most adverse market value impact on the net portfolio to changes in the level of interest rates and the slope of the applicable yield curve for the three months ended June 30, 2024 and 2023. Our practice is to allow interest rates to go below zero in the downward shock models unless otherwise prevented through contractual floors.
For information on how we measure our interest-rate risk, see “MD&A—Risk Management—Market Risk Management, including Interest-Rate Risk Management” in our 2023 Form 10-K.
| | | | | | | | | | | | | | | | | | | | | | | |
| Interest-Rate Sensitivity of Net Portfolio to Changes in Interest-Rate Level and Slope of Yield Curve |
| As of(1)(2) |
| June 30, 2024 | | December 31, 2023 |
| (Dollars in millions) |
| Rate level shock: | | | | | | | |
| -100 basis points | | $ | 68 | | | | | $ | 53 | | |
| -50 basis points | | 32 | | | | | 39 | | |
| +50 basis points | | (29) | | | | | (47) | | |
| +100 basis points | | (50) | | | | | (93) | | |
| Rate slope shock: | | | | | | | |
| -25 basis points (flattening) | | (5) | | | | | (7) | | |
| +25 basis points (steepening) | | 2 | | | | | 5 | | |
| | | | | | | | | | | | | | | | | | | | | | | | | | | | | | | | | | | | | | | | | | | | | | | | | | | | | | | | | | | | | | |
| | For the Three Months Ended June 30,(1)(3) |
| | 2024 | | 2023 |
| | Duration Gap | | Rate Slope Shock 25 bps | | Rate Level Shock 50 bps | | Duration Gap | | Rate Slope Shock 25 bps | | Rate Level Shock 50 bps |
| | | | Market Value Sensitivity | | | | Market Value Sensitivity |
| | (In years) | | (Dollars in millions) | | (In years) | | (Dollars in millions) |
| Average | | 0.03 | | | $ | (9) | | | | | $ | (24) | | | | 0.01 | | | $ | (9) | | | | | $ | (16) | | |
| Minimum | | — | | | (14) | | | | | (56) | | | | (0.02) | | | (15) | | | | | (48) | | |
| Maximum | | 0.07 | | | (4) | | | | | (3) | | | | 0.03 | | | (4) | | | | | (5) | | |
| Standard deviation | | 0.01 | | | 3 | | | | | 12 | | | | 0.01 | | | 3 | | | | | 9 | | |
| | | | | | | | | | | | | | | | | | | | |
(1)Computed based on changes in SOFR interest-rates swap curve. Changes in the level of interest rates assume a parallel shift in all maturities of the SOFR interest-rate swap curve. Changes in the slope of the yield curve assume a constant 7-year rate, a shift of 16.7 basis points for the 1-year rate (and shorter tenors) and an opposite shift of 8.3 basis points for the 30-year rate. Rate shocks for remaining maturity points are interpolated.
(2)Measured on the last business day of each period presented.
(3)Computed based on daily values during the period presented.
The market value sensitivity of our net portfolio varies across a range of interest-rate shocks depending upon the duration and convexity profile of our net portfolio. The market value sensitivity of the net portfolio is measured by quantifying the change in the present value of the cash flows of our financial assets and liabilities that would result from an instantaneous shock to interest rates, assuming spreads are held constant.
| | | | | | | | |
| Fannie Mae Second Quarter 2024 Form 10-Q | 53 |
| | | | | | | | |
| MD&A | Risk Management | Market Risk Management, including Interest-Rate Risk Management |
We use derivatives to help manage the residual interest-rate risk exposure between the assets and liabilities in our net portfolio. Derivatives have enabled us to keep our economic interest-rate risk exposure at consistently low levels in a wide range of interest-rate environments. The table below displays an example of how derivatives impacted the net market value exposure for a 50 basis point parallel interest-rate shock. For additional information on our derivative positions, see “Note 9, Derivative Instruments” in our 2023 Form 10-K and in this report.
| | | | | | | | | | | | | | | | | | | | | | | | | | |
| Derivative Impact on Interest-Rate Risk (50 Basis Points) |
| | As of(1) |
| | June 30, 2024 | | December 31, 2023 |
| | (Dollars in millions) |
| Before derivatives | | | $ | (390) | | | | | $ | (449) | | |
| After derivatives | | | (29) | | | | | (47) | | |
| Effect of derivatives | | | 361 | | | | | 402 | | |
(1)Measured on the last business day of each period presented.
Earnings Exposure to Interest-Rate Risk
While we manage the interest-rate risk of our net portfolio with the objective of remaining neutral to movements in interest rates and volatility on an economic basis, our earnings can experience volatility due to interest-rate changes and differing accounting treatments that apply to certain financial instruments on our balance sheet. Specifically, we have exposure to earnings volatility that is driven by changes in interest rates in two primary areas: our net portfolio and our consolidated MBS trusts. The exposure in the net portfolio is primarily driven by changes in the fair value of risk management derivatives, mortgage commitments, and certain assets, primarily securities, that are carried at fair value. The exposure related to our consolidated MBS trusts relates to changes in our credit loss reserves and to the amortization of cost basis adjustments resulting from changes in interest rates.
We apply fair value hedge accounting to address some of the exposure to interest rates, particularly the earnings volatility related to changes in benchmark interest rates. Our hedge accounting program is specifically designed to address the volatility of our financial results associated with changes in fair value related to changes in these benchmark interest rates. As such, earnings variability driven by other factors, such as spreads or changes in cost basis amortization recognized in net interest income, remains. In addition, our ability to effectively reduce earnings volatility is dependent upon the volume and type of interest-rate swaps available for hedging, which is driven by our interest-rate risk management strategy discussed above and in our 2023 Form 10-K. As our range of available interest-rate swaps varies over time, our ability to reduce earnings volatility through hedge accounting may vary as well. When the shape of the yield curve shifts significantly from period to period, hedge accounting may be less effective. In our current program, we establish new hedging relationships each business day to provide flexibility in our overall risk management strategy.
See “Note 1, Summary of Significant Accounting Policies” in our 2023 Form 10-K and “Note 9, Derivative Instruments” in this report for additional information on our fair value hedge accounting policy and related disclosures.
Critical Accounting Estimates
The preparation of financial statements in accordance with GAAP requires management to make a number of judgments, estimates and assumptions that affect the reported amount of assets, liabilities, income and expenses in our condensed consolidated financial statements. Understanding our accounting policies and the extent to which we use management judgment and estimates in applying these policies is integral to understanding our financial statements. We describe our most significant accounting policies in “Note 1, Summary of Significant Accounting Policies” in this report and in our 2023 Form 10-K.
We evaluate our critical accounting estimates and judgments required by our policies on an ongoing basis and update them as necessary based on changing conditions. Management has discussed any significant changes in judgments and assumptions in applying our critical accounting estimates with the Audit Committee of our Board of Directors. See “Risk Factors—General Risk” in our 2023 Form 10-K for a discussion of the risks associated with the need for management to make judgments and estimates in applying our accounting policies and methods. We have identified one of our accounting estimates, allowance for loan losses, as critical because it involves significant judgments and assumptions about highly complex and inherently uncertain matters, and the use of reasonably different judgments and assumptions could have a material impact on our reported results of operations or financial condition.
| | | | | | | | |
| Fannie Mae Second Quarter 2024 Form 10-Q | 54 |
| | | | | | | | |
| MD&A | Critical Accounting Estimates |
Allowance for Loan Losses
The allowance for loan losses is an estimate of single-family and multifamily HFI loan receivables that we expect will not be collected related to loans held by Fannie Mae or by consolidated Fannie Mae MBS trusts. The expected credit losses are deducted from the amortized cost basis of HFI loans to present the net amount expected to be received.
The allowance for loan losses involves substantial judgment on a number of matters including the development and weighting of macroeconomic forecasts, the reversion period applied, the assessment of similar risk characteristics, which determines the historic loss experience used to derive probability of loan default, the valuation of collateral, which includes judgments about the property condition at the time of foreclosure, and the determination of a loan’s remaining expected life. Our most significant judgments involved in estimating our allowance for loan losses relate to the modeled macroeconomic data used to develop reasonable and supportable forecasts for key economic drivers, which are subject to significant inherent uncertainty. Most notably, for single-family, the model uses forecasted single-family home prices as well as a range of possible future interest rate environments. For multifamily, the model uses forecasted rental income and property valuations over the remaining life of each mortgage loan. In developing a reasonable and supportable forecast, the model simulates multiple paths of interest rates, rental income and property values based on current market conditions.
Quantitative Component
We use a discounted cash flow method to measure expected credit losses on our single-family mortgage loans and an undiscounted loss method to measure expected credit losses on our multifamily mortgage loans.
Our modeled loan performance is based on our historical experience of loans with similar risk characteristics adjusted to reflect current conditions and reasonable and supportable forecasts. Our historical loss experience and our loan loss estimates capture the possibility of a multitude of events, including remote events that could result in credit losses on loans that are considered low risk. Our credit loss models, including the macroeconomic forecast data used as key inputs, are subject to our model oversight and review processes as well as other established governance and controls.
Qualitative Component
Our process for measuring expected credit losses is complex and involves significant management judgment, including a reliance on historical loss information and current economic forecasts that may not be representative of credit losses we ultimately realize. Management adjustments may be necessary to take into consideration external factors and current macroeconomic events that have occurred but are not yet reflected in the data used to derive the model outputs. Qualitative factors and events not previously observed by the models through historical loss experience may also be considered, as well as the uncertainty of their impact on credit loss estimates.
Macroeconomic Variables and Sensitivities
Our benefit or provision for credit losses can vary substantially from period to period based on forecasted macroeconomic drivers; primarily home prices and interest rates related to our single-family book of business, which for the purposes of macroeconomic model inputs, we have determined are the most significant judgments used in our estimation of credit losses. We develop regional forecasts for single-family home prices using a multi-path simulation that captures home price projections over a five-year period, which is the period for which we can develop reasonable and supportable forecasts. After the five-year period, the home price forecast reverts to a historical long-term growth rate. Additionally, our model projects the range of possible interest rate scenarios over the life of the loan. This process captures multiple possible outcomes of what could be more or less favorable economic environments for the borrower, and therefore will increase or decrease the likelihood of default or prepayment depending on the environment in each path of the simulation.
| | | | | | | | |
Fannie Mae Second Quarter 2024 Form 10-Q | 55 |
| | | | | | | | |
| MD&A | Critical Accounting Estimates |
The table below provides information about our most significant key macroeconomic inputs used in determining our single-family allowance for loan losses: forecasted home price growth rates and interest rates. Although the model consumes a wide range of possible regional home price forecasts and interest rate scenarios that take into account inherent uncertainty, the forecasts below represent the mean path of those simulations used in determining the allowance for each quarter through the six months ended June 30, 2024, and for each quarter during the year ended December 31, 2023, and how those forecasts have changed between periods of estimate. Below we present our home price growth and interest rate estimates used in our estimate of expected credit losses. Our forecasts include estimates for periods beyond 2026 that are not presented in the table below.
| | | | | | | | | | | | | | | | | | | |
Select Single-Family Macroeconomic Model Inputs(1) | | | | | | | |
| | | | | | | |
Forecasted home price growth (decline) rate by period of estimate:(2) | | | | | | | |
| For the Full Year ending December 31, | | |
| 2024 | | 2025 | | 2026 | | |
| | | | | | | |
| | | | | | | |
| Second Quarter 2024 | 6.6 | % | | 3.0 | % | | 0.8 | % | | |
| First Quarter 2024 | 4.8 | | | 1.5 | | | * | | |
| | | | | | | |
| For the Full Year ending December 31, | | |
| 2023 | | 2024 | | 2025 | | |
| Fourth Quarter 2023 | 7.1 | % | | 3.2 | % | | 0.3 | % | | |
| Third Quarter 2023 | 6.7 | | | 2.8 | | | (0.4) | | | |
| Second Quarter 2023 | 3.9 | | | (0.7) | | | (1.5) | | | |
| First Quarter 2023 | (1.2) | | | (2.2) | | | (1.1) | | | |
| | | | | | | |
Forecasted 30-year mortgage interest rates by period of estimate:(3) | | | | | | | |
| Through the end of December 31, | | For the Full Year ending
December 31, | | |
| 2024 | | 2025 | | 2026 | | |
| | | | | | | |
| | | | | | | |
| Second Quarter 2024 | 7.0 | % | | 6.6 | % | | 6.4 | % | | |
| First Quarter 2024 | 6.8 | | | 6.4 | | | 6.2 | | | |
| | | | | | | |
| Through the end of December 31, | | For the Full Year ending
December 31, | | |
| 2023 | | 2024 | | 2025 | | |
| Fourth Quarter 2023 | 6.8 | % | | 6.4 | % | | 6.0 | % | | |
| Third Quarter 2023 | 7.5 | | | 7.2 | | | 6.8 | | | |
| Second Quarter 2023 | 6.7 | | | 6.0 | | | 5.8 | | | |
| First Quarter 2023 | 6.2 | | | 5.7 | | | 5.5 | | | |
* Represents less than 0.05% of home price growth (decline).
(1)These forecasts are provided here solely for the purpose of providing insight into our credit loss model. Forecasts for future periods are subject to significant uncertainty, which increases for periods that are further in the future. We provide our most recent forecasts for certain macroeconomic and housing market conditions in “Key Market Economic Indicators.” In addition, each month our Economic & Strategic Research group provides its forecast of economic and housing market conditions, which are available in the “About Us/Research and Insights” section of our website, www.fanniemae.com. Information on our website is not incorporated into this report.
(2)These estimates are based on our national home price index, which is calculated differently from the S&P/Case-Shiller U.S. National Home Price Index and therefore results in different percentages for comparable growth. We periodically update our home price growth estimates and forecasts as new data become available. As a result, the forecast data in this table may also differ from the forecasted home price growth rate presented in “Key Market Economic Indicators,” because that section reflects our most recent forecast as of the filing date of this report, while this table reflects the quantitative forecast data we used in our model to estimate credit losses for the periods shown. Management continues to monitor macroeconomic updates to our inputs in our credit loss model from the time they are approved as part of our established governance process to ensure the reasonableness of the inputs used to calculate estimated credit losses. The forecast data excludes the impact of any qualitative adjustments.
(3)Forecasted 30-year interest rates represent the mean of possible future interest rate environments that are simulated by our interest rate model and used in the estimation of credit losses. Forecasts through the end of December 31, 2024 and 2023 represent the average
| | | | | | | | |
Fannie Mae Second Quarter 2024 Form 10-Q | 56 |
| | | | | | | | |
| MD&A | Critical Accounting Estimates |
forecasted rate from the quarter-end through the calendar year end of December 31st. The fourth quarter of 2023 interest rate represents the 30-year interest rate as of December 31, 2023. This table reflects the forecasted interest rate data we used in estimating credit losses for the periods shown and does not reflect changes in interest rates that occurred after the forecast date.
It is difficult to estimate how potential changes in any one factor or input might affect the overall credit loss estimates, because management considers a wide variety of factors and inputs in estimating the allowance for loan losses. Changes in the factors and inputs considered may not occur at the same rate and may not be consistent across all geographies or loan types, and changes in factors and inputs may be directionally inconsistent, such that improvement in one factor or input may offset deterioration in others. Changes in our assumptions and forecasts of economic conditions could significantly affect our estimate of expected credit losses and lead to significant changes in the estimate from one reporting period to the next.
As noted above, our allowance for loan losses is sensitive to changes in home prices and interest rate changes. To consider the impact of a hypothetical change in home prices, assuming a positive one-percentage point change in the home price growth rate for the first twelve months of the forecast, on a normalized basis, with all other factors held constant, the single-family allowance for loan losses as of June 30, 2024 would decrease by approximately 3%. Conversely, assuming a negative one-percentage point change in the home price growth rate for the first twelve months of the forecast, on a normalized basis, the single-family allowance for loan losses would increase by approximately 3%.
To consider the impact of a hypothetical change in 30-year interest rates, assuming a 50-basis point increase in estimated 30-year interest rates, with all other factors held constant, the single-family allowance for loan losses as of June 30, 2024 would increase by approximately 3%. Conversely, assuming a 50-basis point decrease in 30-year interest rates, the single-family allowance for loan losses would decrease by approximately 4%.
These sensitivity analyses are hypothetical and are provided solely for the purpose of providing insight into our credit loss model inputs. In addition, sensitivities for home price and interest rate changes are non-linear. As a result, changes in these estimates are not incrementally proportional. The purpose of this analysis is to provide an indication of the impact of home price appreciation and 30-year interest rates on the estimate of the allowance for credit losses. For example, it is not intended to imply management’s expectation of future changes in our forecasts or any other variables that may change as a result.
We provide more detailed information on our accounting for the allowance for loan losses in “Note 1, Summary of Significant Accounting Policies” in our 2023 Form 10-K. See “Note 5, Allowance for Loan Losses” for additional information about our current period benefit for loan losses.
See “Key Market Economic Indicators” in our 2023 Form 10-K for additional information about how home prices can affect our credit loss estimates. See “Key Market Economic Indicators” in this report for a discussion of home price growth rates and our home price forecast. Also see “Consolidated Results of Operations—Benefit (Provision) for Credit Losses” in this report for information on how our home price forecast impacted our single-family benefit for credit losses.
Impact of Future Adoption of New Accounting Guidance
We identify and discuss the expected impact on our condensed consolidated financial statements of recently issued accounting guidance in “Note 1, Summary of Significant Accounting Policies.”
Forward-Looking Statements
This report includes statements that constitute forward-looking statements within the meaning of Section 21E of the Securities Exchange Act of 1934 (the “Exchange Act”). In addition, we and our senior management may from time to time make forward-looking statements in our other filings with the SEC, our other publicly available written statements, and orally to analysts, investors, the news media and others. Forward-looking statements often include words such as “expect,” “anticipate,” “intend,” “plan,” “believe,” “seek,” “estimate,” “forecast,” “project,” “would,” “should,” “could,” “likely,” “may,” “will” or similar words. Examples of forward-looking statements in this report include, among others, statements relating to our beliefs and expectations regarding the following matters:
•economic, mortgage market and housing market conditions (including expectations regarding economic growth, home price growth, unemployment rates, loan origination volumes and interest rates), the factors that will affect those conditions, and the impact of those conditions on our business and financial results;
•the impact of hedge accounting on the volatility of our financial results;
•the future aggregate liquidation preference of our senior preferred stock;
•our future dividend payments on the senior preferred stock;
| | | | | | | | |
Fannie Mae Second Quarter 2024 Form 10-Q | 57 |
| | | | | | | | |
| MD&A | Forward-Looking Statements |
•our business plans and strategies, and their impact;
•the credit performance of the loans in our guaranty book of business (including future loan delinquencies and foreclosures) and the factors that will affect such performance;
•the effects of our credit risk transfer transactions, as well as the factors that will affect our engagement in future credit risk transfer transactions;
•how we intend to repay our debt obligations;
•the impact of the adoption of new accounting guidance;
•our payments to HUD and Treasury funds under the GSE Act;
•legal and regulatory proceedings; and
•the risks to our business.
Forward-looking statements reflect our management’s current expectations, forecasts or predictions of future conditions, events or results based on various assumptions and management’s estimates of trends and economic conditions in the markets in which we are active and that otherwise impact our business plans. Forward-looking statements are not guarantees of future performance. By their nature, forward-looking statements are subject to significant risks and uncertainties and changes in circumstances. Our actual results and financial condition may differ, possibly materially, from the anticipated results and financial condition indicated in these forward-looking statements.
There are a number of factors that could cause actual conditions, events or results to differ materially from those described in our forward-looking statements, including, among others, the following:
•factors that will affect future economic conditions, including the persistence of inflationary pressures and the risk of financial market disruptions;
•growth, deterioration and the overall health and stability of the U.S. economy, including GDP, unemployment rates, personal income, inflation and other indicators thereof;
•the timing and level of, as well as regional variation in, home price changes;
•the volume of mortgage originations;
•the size and our share of the U.S. mortgage market and the factors that affect them, including population growth and household formation;
•changes in fiscal or monetary policy of the U.S. or other countries, and the impact of such changes on domestic and international financial markets;
•domestic, regional and global political risks and uncertainties, including the impact of conflict in the Middle East, the Russian war in Ukraine, and tensions between China and Taiwan;
•the impact of stress in the banking sector on the financial condition and business activities of our counterparties, including stress on regional banks and on banks with significant exposure to commercial real estate;
•future interest rates and credit spreads;
•developments that may be difficult to predict, including: market conditions that result in changes in our deferred guaranty fee income or changes in net interest income from our portfolios; fluctuations in the estimated fair value of our derivatives and other financial instruments that we mark to market through our earnings; and developments that affect our loss reserves, such as changes in interest rates, home prices or accounting standards;
•disruptions or instability in the housing and credit markets;
•changes in the demand for Fannie Mae MBS, our debt securities or our credit risk transfer securities, in general or from one or more major groups of investors;
•constraints on our entry into new credit risk transfer transactions;
•a decrease in our credit ratings;
•limitations on our ability to access the debt capital markets;
•the size, composition, quality and performance of our guaranty book of business and retained mortgage portfolio;
•how long loans in our guaranty book of business remain outstanding;
| | | | | | | | |
Fannie Mae Second Quarter 2024 Form 10-Q | 58 |
| | | | | | | | |
| MD&A | Forward-Looking Statements |
•our and our competitors’ future guaranty fee pricing and the impact of that pricing on our competitive environment and guaranty fee revenues;
•the competitive environment in which we operate, including the impact of legislative, regulatory or other developments on levels of competition in our industry and other factors affecting our market share;
•significant challenges we face in retaining and hiring qualified executives and other employees;
•our conservatorship, including any changes to or termination (by receivership or otherwise) of the conservatorship and its effect on our business;
•the investment by Treasury, including the impact of past or potential future changes to the terms of the senior preferred stock purchase agreement, and their effect on our business, including restrictions imposed on us by the terms of the senior preferred stock purchase agreement, the senior preferred stock, and the warrant, as well as the extent that these or other restrictions on our business and activities are applied to us through other mechanisms even if we cease to be subject to these agreements and instruments;
•uncertainty regarding our future, our exit from conservatorship, our ability to raise or earn the capital needed to meet our capital requirements, and our ability to achieve long-term return targets;
•the impact of the enterprise regulatory capital framework, as well as future legislative and regulatory requirements or changes, governmental initiatives, or executive orders affecting us, such as the enactment of housing finance reform legislation, including changes that limit our business activities or our footprint, impose new mandates on us, or affect our ability to change our pricing;
•the possibility that changes in leadership at FHFA or the Administration may result in changes that affect our company or our business;
•actions we may be required to take by FHFA, in its role as our conservator or as our regulator, such as changes in the type of business we do, or actions relating to UMBS or our resecuritization of Freddie Mac-issued securities;
•limitations on our business imposed by FHFA, in its role as our conservator or as our regulator;
•adverse effects from activities we undertake to support the mortgage market and help borrowers, renters, lenders and servicers, including actions we may take to reach additional underserved borrowers or address barriers to sustainable housing opportunities and advance equity in housing finance;
•our reliance on Common Securitization Solutions, LLC (“CSS”), a limited liability company we own jointly with Freddie Mac, and the common securitization platform CSS operates for a majority of our single-family securitization activities; provisions in the CSS limited liability company agreement that permit FHFA to add members to the CSS Board of Managers, which may limit the ability of Fannie Mae and Freddie Mac to control decisions of the Board; and changes FHFA may require in our relationship with or in our support of CSS;
•actions by FHFA, Treasury, the Federal Reserve, the Office of the Comptroller of the Currency (“OCC”), the Federal Deposit Insurance Corporation (“FDIC”), the Commodity Futures Trading Commission (“CFTC”), HUD, the Consumer Financial Protection Bureau (“CFPB”), the SEC or other regulators, Congress, the Executive Branch, or state or local governments that affect our business;
•changes in the structure and regulation of the financial services industry;
•a default by the United States government on its obligations;
•a shutdown of the United States government;
•the potential impact of a change in the corporate income tax rate, which we expect would affect our net income in the quarter of enactment;
•significant changes in forbearance, modification and foreclosure activity;
•the volume and pace of any future nonperforming and reperforming loan sales and their impact on our financial results and serious delinquency rates;
•changes in borrower behavior;
•actions we may take to mitigate losses, and the effectiveness of our loss mitigation strategies, management of our REO inventory and pursuit of contractual remedies;
•natural disasters, environmental disasters, terrorist attacks, widespread health emergencies or pandemics, infrastructure failures, or other disruptive or catastrophic events;
| | | | | | | | |
Fannie Mae Second Quarter 2024 Form 10-Q | 59 |
| | | | | | | | |
| MD&A | Forward-Looking Statements |
•severe weather events, fires, floods or other climate change events or impacts, including those for which we may be uninsured or under-insured or that may affect our counterparties or the hazard insurers insuring properties underlying our guaranty book of business, and other risks resulting from climate change and efforts to address climate change and related risks;
•defaults by one or more of our counterparties or by the hazard insurers insuring properties underlying our guaranty book of business;
•resolution or settlement agreements we may enter into with our counterparties;
•our need to rely on third parties to fully achieve some of our corporate objectives, including our reliance on mortgage servicers;
•the effectiveness of our risk management processes and related controls;
•the effectiveness of our business resiliency plans and systems;
•the stability and adequacy of the systems and infrastructure that impact our operations, including ours and those of CSS, our other counterparties and other third parties;
•the impact of interdependence between the single-family mortgage securitization programs of Fannie Mae and Freddie Mac in connection with UMBS;
•operational control weaknesses;
•our reliance on models and future updates we make to our models, including the data and assumptions used by these models;
•cyber attacks or other information security breaches or threats impacting us or the third parties with which we do business;
•changes in GAAP, guidance by the Financial Accounting Standards Board (“FASB”) and changes to our accounting policies;
•changes in the fair value of our assets and liabilities; and
•the other factors described in “Risk Factors” in our 2023 Form 10-K.
Readers are cautioned not to unduly rely on the forward-looking statements we make and to place these forward-looking statements into proper context by carefully considering the factors identified above and those discussed in “Risk Factors” in our 2023 Form 10-K. These forward-looking statements are representative only as of the date they are made, and we undertake no obligation to update any forward-looking statement as a result of new information, future events or otherwise, except as required under the federal securities laws.
| | | | | | | | |
Fannie Mae Second Quarter 2024 Form 10-Q | 60 |
| | | | | | | | |
| Financial Statements | Condensed Consolidated Balance Sheets |
Item 1. Financial Statements
FANNIE MAE
(In conservatorship)
Condensed Consolidated Balance Sheets — (Unaudited)
(Dollars in millions)
| | | | | | | | | | | | | | | | | | | | | | | | | | | |
| | As of |
| | June 30, 2024 | | December 31, 2023 |
| | |
| ASSETS | | | | | | | | | |
| Cash and cash equivalents | | | | $ | 41,911 | | | | | $ | 35,817 | | |
Restricted cash and cash equivalents (includes $29,789 and $25,836, respectively, related to consolidated trusts) | | | | 36,402 | | | | | 32,889 | | |
| Securities purchased under agreements to resell | | | | 27,650 | | | | | 30,700 | | |
| Investments in securities, at fair value | | | | 49,899 | | | | | 53,116 | | |
| Mortgage loans: | | | | | | | | | |
Loans held for sale, at lower of cost or fair value | | | | 646 | | | | | 2,149 | | |
| Loans held for investment, at amortized cost: | | | | | | | | | |
| Of Fannie Mae | | | | 49,196 | | | | | 48,199 | | |
Of consolidated trusts | | | | 4,087,398 | | | | | 4,094,013 | | |
Total loans held for investment (includes $3,194 and $3,315, respectively, at fair value) | | | | 4,136,594 | | | | | 4,142,212 | | |
| Allowance for loan losses | | | | (8,026) | | | | | (8,730) | | |
| Total loans held for investment, net of allowance | | | | 4,128,568 | | | | | 4,133,482 | | |
| Total mortgage loans | | | | 4,129,214 | | | | | 4,135,631 | | |
| Advances to lenders | | | | 1,856 | | | | | 1,389 | | |
| Deferred tax assets, net | | | | 11,036 | | | | | 11,681 | | |
Accrued interest receivable, net (includes $10,654 and $10,132 related to consolidated trusts) | | | | 11,156 | | | | | 10,724 | | |
| Other assets | | | | 14,769 | | | | | 13,490 | | |
| Total assets | | | | $ | 4,323,893 | | | | | $ | 4,325,437 | | |
| LIABILITIES AND EQUITY | | | | | | | | | |
| Liabilities: | | | | | | | | | |
Accrued interest payable (includes $10,524 and $10,212, respectively, related to consolidated trusts) | | | | $ | 11,176 | | | | | $ | 10,931 | | |
| Debt: | | | | | | | | | |
Of Fannie Mae (includes $544 and $761, respectively, at fair value) | | | | 118,543 | | | | | 124,065 | | |
Of consolidated trusts (includes $13,239 and $14,343, respectively, at fair value) | | | | 4,094,421 | | | | | 4,098,653 | | |
Other liabilities (includes $1,673 and $1,713, respectively, related to consolidated trusts) | | | | 13,270 | | | | | 14,106 | | |
| Total liabilities | | | | 4,237,410 | | | | | 4,247,755 | | |
| Commitments and contingencies (Note 14) | | | | — | | | | | — | | |
| Fannie Mae stockholders’ equity: | | | | | | | | | |
Senior preferred stock (liquidation preference of $203,505 and $195,224, respectively) | | | | 120,836 | | | | | 120,836 | | |
Preferred stock, 700,000,000 shares are authorized—555,374,922 shares issued and outstanding | | | | 19,130 | | | | | 19,130 | | |
Common stock, no par value, no maximum authorization—1,308,762,703 shares issued and 1,158,087,567 shares outstanding | | | | 687 | | | | | 687 | | |
| Accumulated deficit | | | | (46,799) | | | | | (55,603) | | |
| Accumulated other comprehensive income | | | | 29 | | | | | 32 | | |
Treasury stock, at cost, 150,675,136 shares | | | | (7,400) | | | | | (7,400) | | |
Total stockholders’ equity | | | | 86,483 | | | | | 77,682 | | |
| Total liabilities and equity | | | | $ | 4,323,893 | | | | | $ | 4,325,437 | | |
See Notes to Condensed Consolidated Financial Statements
| | | | | | | | |
| Fannie Mae (In conservatorship) Second Quarter 2024 Form 10-Q | 61 |
| | | | | | | | |
| Financial Statements | Condensed Consolidated Statements of Operations and Comprehensive Income |
FANNIE MAE
(In conservatorship)
Condensed Consolidated Statements of Operations and Comprehensive Income — (Unaudited)
(Dollars and shares in millions, except per share amounts)
| | | | | | | | | | | | | | | | | | | | | | | | | | | | | | | |
| | For the Three Months Ended June 30, | | | | For the Six Months Ended June 30, |
| | | | |
| | 2024 | | | | 2023 | | | | 2024 | | | 2023 |
| Interest income: | | | | | | | | | | | | | |
| Investments in securities | | $ | 915 | | | | | $ | 1,101 | | | | | $ | 1,836 | | | | $ | 2,082 | |
| Mortgage loans | | 35,617 | | | | | 32,655 | | | | | 70,833 | | | | 64,792 | |
| Other | | 743 | | | | | 584 | | | | | 1,404 | | | | 1,036 | |
| Total interest income | | 37,275 | | | | | 34,340 | | | | | 74,073 | | | | 67,910 | |
| Interest expense: | | | | | | | | | | | | | |
Short-term debt | | (130) | | | | | (183) | | | | | (325) | | | | (302) | |
| Long-term debt | | (29,877) | | | | | (27,122) | | | | | (59,457) | | | | (53,787) | |
| Total interest expense | | (30,007) | | | | | (27,305) | | | | | (59,782) | | | | (54,089) | |
| Net interest income | | 7,268 | | | | | 7,035 | | | | | 14,291 | | | | 13,821 | |
| Benefit (provision) for credit losses | | 300 | | | | | 1,266 | | | | | 480 | | | | 1,134 | |
| Net interest income after benefit (provision) for credit losses | | 7,568 | | | | | 8,301 | | | | | 14,771 | | | | 14,955 | |
| Investment gains (losses), net | | (62) | | | | | 25 | | | | | (40) | | | | (42) | |
| Fair value gains (losses), net | | 447 | | | | | 404 | | | | | 927 | | | | 608 | |
| Fee and other income | | 68 | | | | | 70 | | | | | 140 | | | | 133 | |
| Non-interest income | | 453 | | | | | 499 | | | | | 1,027 | | | | 699 | |
| Administrative expenses: | | | | | | | | | | | | | |
| Salaries and employee benefits | | (496) | | | | | (467) | | | | | (1,007) | | | | (947) | |
| Professional services | | (218) | | | | | (192) | | | | | (419) | | | | (376) | |
| Other administrative expenses | | (225) | | | | | (205) | | | | | (442) | | | | (409) | |
| Total administrative expenses | | (939) | | | | | (864) | | | | | (1,868) | | | | (1,732) | |
| TCCA fees | | (859) | | | | | (856) | | | | | (1,719) | | | | (1,711) | |
| Credit enhancement expense | | (405) | | | | | (384) | | | | | (824) | | | | (725) | |
| Change in expected credit enhancement recoveries | | 37 | | | | | (160) | | | | | 100 | | | | (40) | |
| Other expenses, net | | (251) | | | | | (257) | | | | | (450) | | | | (387) | |
| Total expenses | | (2,417) | | | | | (2,521) | | | | | (4,761) | | | | (4,595) | |
| Income before federal income taxes | | 5,604 | | | | | 6,279 | | | | | 11,037 | | | | 11,059 | |
| Provision for federal income taxes | | (1,120) | | | | | (1,285) | | | | | (2,233) | | | | (2,293) | |
| Net income | | 4,484 | | | | | 4,994 | | | | | 8,804 | | | | 8,766 | |
| Other comprehensive income (loss) | | (7) | | | | | 1 | | | | | (3) | | | | 1 | |
| Total comprehensive income | | $ | 4,477 | | | | | $ | 4,995 | | | | | $ | 8,801 | | | | $ | 8,767 | |
| Net income | | $ | 4,484 | | | | | $ | 4,994 | | | | | $ | 8,804 | | | | $ | 8,766 | |
Dividends distributed or amounts attributable to senior preferred stock | | (4,477) | | | | | (4,995) | | | | | (8,801) | | | | (8,767) | |
| Net income (loss) attributable to common stockholders | | $ | 7 | | | | | $ | (1) | | | | | $ | 3 | | | | $ | (1) | |
| Earnings per share: | | | | | | | | | | | | | |
| Basic | | $ | 0.00 | | | | | $ | 0.00 | | | | | $ | 0.00 | | | | $ | 0.00 | |
| Diluted | | 0.00 | | | | | 0.00 | | | | | 0.00 | | | | 0.00 | |
| Weighted-average common shares outstanding: | | | | | | | | | | | | | |
| Basic | | 5,867 | | | | | 5,867 | | | | | 5,867 | | | | 5,867 | |
| Diluted | | 5,893 | | | | | 5,867 | | | | | 5,893 | | | | 5,867 | |
See Notes to Condensed Consolidated Financial Statements
| | | | | | | | |
| Fannie Mae (In conservatorship) Second Quarter 2024 Form 10-Q | 62 |
| | | | | | | | |
| Financial Statements | Condensed Consolidated Statements of Cash Flows |
FANNIE MAE
(In conservatorship)
Condensed Consolidated Statements of Cash Flows — (Unaudited)
(Dollars in millions)
| | | | | | | | | | | | | | | | | | | | | | | |
| For the Six Months Ended June 30, |
| 2024 | | 2023 |
| Net cash provided by (used in) operating activities | | $ | 8,622 | | | | | $ | 6,245 | | |
| Cash flows provided by (used in) investing activities: | | | | | | | |
| Mortgage loans acquired held for investment: | | | | | | | |
| Purchases | | (64,066) | | | | | (61,064) | | |
| Proceeds from sales | | 1,952 | | | | | 1,540 | | |
Proceeds from repayments | | 168,189 | | | | | 168,975 | | |
| Advances to lenders | | (39,996) | | | | | (53,273) | | |
| Proceeds from disposition of acquired property, preforeclosure sales and insurance proceeds | | 2,143 | | | | | 3,139 | | |
Net change in federal funds sold and securities purchased under agreements to resell | | 3,050 | | | | | (18,485) | | |
| Other, net | | (739) | | | | | (1,162) | | |
| Net cash provided by (used in) investing activities | | 70,533 | | | | | 39,670 | | |
| Cash flows provided by (used in) financing activities: | | | | | | | |
| Proceeds from issuance of debt of Fannie Mae | | 242,960 | | | | | 206,879 | | |
| Payments to redeem debt of Fannie Mae | | (248,397) | | | | | (203,515) | | |
| Proceeds from issuance of debt of consolidated trusts | | 105,591 | | | | | 109,556 | | |
| Payments to redeem debt of consolidated trusts | | (169,702) | | | | | (167,241) | | |
| | | | | | | |
| Net cash provided by (used in) financing activities | | (69,548) | | | | | (54,321) | | |
| Net increase (decrease) in cash, cash equivalents and restricted cash and cash equivalents | | 9,607 | | | | | (8,406) | | |
| Cash, cash equivalents and restricted cash and cash equivalents at beginning of period | | 68,706 | | | | | 87,841 | | |
| Cash, cash equivalents and restricted cash and cash equivalents at end of period | | $ | 78,313 | | | | | $ | 79,435 | | |
| Cash paid during the period for: | | | | | | | |
| Interest | | $ | 63,302 | | | | | $ | 54,887 | | |
| Income taxes | | 1,450 | | | | | 1,300 | | |
See Notes to Condensed Consolidated Financial Statements
| | | | | | | | |
| Fannie Mae (In conservatorship) Second Quarter 2024 Form 10-Q | 63 |
| | | | | | | | |
| Financial Statements | Condensed Consolidated Statements of Changes in Equity |
FANNIE MAE
(In conservatorship)
Condensed Consolidated Statements of Changes in
Equity — (Unaudited)
(Dollars and shares in millions)
| | | | | | | | | | | | | | | | | | | | | | | | | | | | | | | | | | | | | | | | | | | | | | | | | | | | | | | | | | | | | | | | |
| | Fannie Mae Stockholders’ Equity |
| | Shares Outstanding | | Senior
Preferred Stock | | Preferred
Stock | | Common
Stock | |
Accumulated
Deficit | | Accumulated
Other
Comprehensive
Income | | Treasury
Stock | | | | Total
Equity |
| Senior
Preferred | | Preferred | | Common | |
| Balance as of March 31, 2024 | | 1 | | | 556 | | | 1,158 | | | $ | 120,836 | | | $ | 19,130 | | | $ | 687 | | | $ | (51,283) | | | $ | 36 | | | $ | (7,400) | | | | | $ | 82,006 | |
| | | | | | | | | | | | | | | | | | | | | | |
| Comprehensive income: | | | | | | | | | | | | | | | | | | | | | | |
| Net income | | — | | | — | | | — | | | — | | | — | | | — | | | 4,484 | | | — | | | — | | | | | 4,484 | |
| Other comprehensive income, net of tax effect: | | | | | | | | | | | | | | | | | | | | | | |
Changes in net unrealized gains (losses) on available-for-sale securities (net of taxes of $2) | | — | | | — | | | — | | | — | | | — | | | — | | | — | | | (7) | | | — | | | | | (7) | |
Reclassification adjustment for gains included in net income (net of taxes of $0) | | — | | | — | | | — | | | — | | | — | | | — | | | — | | | 1 | | | — | | | | | 1 | |
Other (net of taxes of $1) | | — | | | — | | | — | | | — | | | — | | | — | | | — | | | (1) | | | — | | | | | (1) | |
| Total comprehensive income | | | | | | | | | | | | | | | | | | | | | | 4,477 | |
| Balance as of June 30, 2024 | | 1 | | | 556 | | | 1,158 | | | $ | 120,836 | | | $ | 19,130 | | | $ | 687 | | | $ | (46,799) | | | $ | 29 | | | $ | (7,400) | | | | | $ | 86,483 | |
| | | | | | | | | | | | | | | | | | | | | | | | | | | | | | | | | | | | | | | | | | | | | | | | | | | | | | | | | | | | | | | | |
| | Fannie Mae Stockholders’ Equity |
| | Shares Outstanding | | Senior
Preferred Stock | | Preferred
Stock | | Common
Stock | |
Accumulated
Deficit | | Accumulated
Other
Comprehensive
Income | | Treasury
Stock | | | | Total
Equity |
| Senior
Preferred | | Preferred | | Common | |
| Balance as of December 31, 2023 | | 1 | | | 556 | | | 1,158 | | | $ | 120,836 | | | $ | 19,130 | | | $ | 687 | | | $ | (55,603) | | | $ | 32 | | | $ | (7,400) | | | | | $ | 77,682 | |
| | | | | | | | | | | | | | | | | | | | | | |
| Comprehensive income: | | | | | | | | | | | | | | | | | | | | | | |
| Net income | | — | | | — | | | — | | | — | | | — | | | — | | | 8,804 | | | — | | | — | | | | | 8,804 | |
| Other comprehensive income, net of tax effect: | | | | | | | | | | | | | | | | | | | | | | |
Changes in net unrealized gains (losses) on available-for-sale securities (net of taxes of $0) | | — | | | — | | | — | | | — | | | — | | | — | | | — | | | (1) | | | — | | | | | (1) | |
Reclassification adjustment for gains included in net income (net of taxes of $0) | | — | | | — | | | — | | | — | | | — | | | — | | | — | | | 1 | | | — | | | | | 1 | |
Other (net of taxes of $1) | | — | | | — | | | — | | | — | | | — | | | — | | | — | | | (3) | | | — | | | | | (3) | |
| Total comprehensive income | | | | | | | | | | | | | | | | | | | | | | 8,801 | |
| Balance as of June 30, 2024 | | 1 | | | 556 | | | 1,158 | | | $ | 120,836 | | | $ | 19,130 | | | $ | 687 | | | $ | (46,799) | | | $ | 29 | | | $ | (7,400) | | | | | $ | 86,483 | |
| | | | | | | | |
| Fannie Mae (In conservatorship) Second Quarter 2024 Form 10-Q | 64 |
| | | | | | | | |
| Financial Statements | Condensed Consolidated Statements of Changes in Equity |
| | | | | | | | | | | | | | | | | | | | | | | | | | | | | | | | | | | | | | | | | | | | | | | | | | | | | | | | | | | | | | | | |
| | Fannie Mae Stockholders’ Equity |
| | Shares Outstanding | | Senior
Preferred Stock | | Preferred
Stock | | Common
Stock | |
Accumulated
Deficit | | Accumulated
Other
Comprehensive
Income | | Treasury
Stock | | | | Total
Equity |
| Senior
Preferred | | Preferred | | Common | |
| Balance as of March 31, 2023 | | 1 | | | 556 | | | 1,158 | | | $ | 120,836 | | | $ | 19,130 | | | $ | 687 | | | $ | (69,239) | | | $ | 35 | | | $ | (7,400) | | | | | $ | 64,049 | |
| | | | | | | | | | | | | | | | | | | | | | |
| Comprehensive income: | | | | | | | | | | | | | | | | | | | | | | |
| Net income | | — | | | — | | | — | | | — | | | — | | | — | | | 4,994 | | | — | | | — | | | | | 4,994 | |
| Other comprehensive income, net of tax effect: | | | | | | | | | | | | | | | | | | | | | | |
Changes in net unrealized gains (losses) on available-for-sale securities (net of taxes of $1) | | — | | | — | | | — | | | — | | | — | | | — | | | — | | | 2 | | | — | | | | | 2 | |
| | | | | | | | | | | | | | | | | | | | | | |
Other (net of taxes of $1) | | — | | | — | | | — | | | — | | | — | | | — | | | — | | | (1) | | | — | | | | | (1) | |
| Total comprehensive income | | | | | | | | | | | | | | | | | | | | | | 4,995 | |
| Balance as of June 30, 2023 | | 1 | | | 556 | | | 1,158 | | | $ | 120,836 | | | $ | 19,130 | | | $ | 687 | | | $ | (64,245) | | | $ | 36 | | | $ | (7,400) | | | | | $ | 69,044 | |
| | | | | | | | | | | | | | | | | | | | | | | | | | | | | | | | | | | | | | | | | | | | | | | | | | | | | | | | | | | | | | | | |
| | Fannie Mae Stockholders’ Equity |
| | Shares Outstanding | | Senior
Preferred Stock | | Preferred
Stock | | Common
Stock | |
Accumulated
Deficit | | Accumulated
Other
Comprehensive
Income | | Treasury
Stock | | | | Total
Equity |
| Senior
Preferred | | Preferred | | Common | |
| Balance as of December 31, 2022 | | 1 | | | 556 | | | 1,158 | | | $ | 120,836 | | | $ | 19,130 | | | $ | 687 | | | $ | (73,011) | | | $ | 35 | | | $ | (7,400) | | | | | $ | 60,277 | |
| | | | | | | | | | | | | | | | | | | | | | |
| Comprehensive income: | | | | | | | | | | | | | | | | | | | | | | |
| Net income | | — | | | — | | | — | | | — | | | — | | | — | | | 8,766 | | | — | | | — | | | | | 8,766 | |
| Other comprehensive income, net of tax effect: | | | | | | | | | | | | | | | | | | | | | | |
Changes in net unrealized gains (losses) on available-for-sale securities (net of taxes of $1) | | — | | | — | | | — | | | — | | | — | | | — | | | — | | | 4 | | | — | | | | | 4 | |
| | | | | | | | | | | | | | | | | | | | | | |
Other (net of taxes of $1) | | — | | | — | | | — | | | — | | | — | | | — | | | — | | | (3) | | | — | | | | | (3) | |
| Total comprehensive income | | | | | | | | | | | | | | | | | | | | | | 8,767 | |
| Balance as of June 30, 2023 | | 1 | | | 556 | | | 1,158 | | | $ | 120,836 | | | $ | 19,130 | | | $ | 687 | | | $ | (64,245) | | | $ | 36 | | | $ | (7,400) | | | | | $ | 69,044 | |
See Notes to Condensed Consolidated Financial Statements
| | | | | | | | |
| Fannie Mae (In conservatorship) Second Quarter 2024 Form 10-Q | 65 |
| | | | | | | | |
| Notes to Condensed Consolidated Financial Statements | Summary of Significant Accounting Policies |
FANNIE MAE
(In conservatorship)
Notes to Condensed Consolidated Financial Statements
(Unaudited)
1. Summary of Significant Accounting Policies
Fannie Mae is a leading source of financing for residential mortgages in the United States. We are a government-sponsored, stockholder-owned corporation, chartered by Congress to provide liquidity and stability to the U.S. housing market and to promote access to mortgage credit. We primarily do this by buying residential mortgage loans that are originated by lenders. We place these loans into trusts and issue guaranteed mortgage-backed securities (“MBS”) that global investors buy from us. We do not originate mortgage loans or lend money directly to borrowers.
We are currently operating under conservatorship, with the Federal Housing Finance Agency (“FHFA”) acting as conservator. See “Note 2, Conservatorship, Senior Preferred Stock Purchase Agreement and Related Matters” below and in our annual report on Form 10-K for the year ended December 31, 2023 (“2023 Form 10-K”) for information on our conservatorship, the senior preferred stock purchase agreement, the impact of U.S. government support of our business, and related party relationships.
Basis of Presentation
The accompanying unaudited interim condensed consolidated financial statements have been prepared in accordance with accounting principles generally accepted in the United States of America (“GAAP”) for interim financial information. Accordingly, they do not include all of the information and note disclosures required by GAAP for complete consolidated financial statements and therefore should be read in conjunction with our audited consolidated financial statements and related notes included in our 2023 Form 10-K. In the opinion of management, our unaudited interim condensed consolidated financial statements contain all adjustments, which include only normal recurring adjustments, necessary for a fair presentation of our results. The nature of our business is such that the results of any interim period are not necessarily indicative of results for a full year. The accompanying condensed consolidated financial statements include our accounts as well as the accounts of other entities in which we have a controlling financial interest. All intercompany balances and transactions have been eliminated. To conform to our current-period presentation, we have reclassified certain amounts reported in our prior period consolidated financial statements.
Use of Estimates
Preparing condensed consolidated financial statements in accordance with GAAP requires management to make estimates and assumptions that affect our reported amounts of assets and liabilities and disclosure of contingent assets and liabilities as of the dates of our condensed consolidated financial statements, as well as our reported amounts of revenues and expenses during the reporting periods. Management has made significant estimates in a variety of areas including, but not limited to, the allowance for loan losses. Actual results could be different from these estimates.
Earnings per Share
Earnings per share (“EPS”) is presented for basic and diluted EPS. We include the shares of common stock that would be issuable upon full exercise of the common stock warrant in the weighted average shares outstanding for the computation of both basic and diluted earnings per share. Weighted average common shares include 4.7 billion shares for the periods ended June 30, 2024 and 2023 that would have been issued upon the full exercise of the warrant issued to Treasury from the date the warrant was issued through June 30, 2024 and 2023.
For the calculation of diluted EPS, the weighted average shares outstanding is increased to include the number of additional common shares that would have been outstanding if the dilutive potential common shares had been issued. For the three and six months ended June 30, 2024, our diluted EPS weighted-average shares outstanding includes 26 million shares issuable upon the conversion of convertible preferred stock. For the three and six months ended June 30, 2023, convertible preferred stock is not included in the calculation because it would have an anti-dilutive effect due to the net losses attributable to common stockholders recognized in those periods.
| | | | | | | | |
| Fannie Mae (In conservatorship) Second Quarter 2024 Form 10-Q | 66 |
| | | | | | | | |
| Notes to Condensed Consolidated Financial Statements | Summary of Significant Accounting Policies |
Foreclosed Property
We present foreclosed property in “Other assets” in our condensed consolidated balance sheets. We held $1.8 billion of acquired property as of June 30, 2024 and December 31, 2023.
New Accounting Guidance
Segment Reporting
On November 27, 2023, the Financial Accounting Standards Board (“FASB”) issued Accounting Standards Update (“ASU”) 2023-07, Segment Reporting (Topic 280), Improvements to Reportable Segment Disclosures. The ASU enhances disclosure of an entity’s reportable segments by requiring additional information about significant segment expenses, interim disclosures of certain segment information that previously were only required on an annual basis and other detailed segment-related disclosures. The ASU applies to all public entities that are required to report segment information and is effective starting in annual periods beginning after December 15, 2023 and interim periods beginning after December 15, 2024. The ASU is required to be adopted retrospectively to all prior periods presented in the financial statements. The adoption of this guidance is not expected to have a material impact on our financial statements.
Income Taxes
On December 14, 2023, the FASB issued ASU 2023-09, Income Taxes (Topic 740): Improvements to Income Tax Disclosures, which enhances the required disclosures primarily related to the income tax rate reconciliation and income taxes paid. The ASU requires an entity’s income tax rate reconciliation to provide additional information for reconciling items meeting a quantitative threshold, and to disclose certain selected categories within the income tax rate reconciliation. The ASU also requires entities to disclose the amount of income taxes paid, disaggregated by federal, state and foreign taxes. The ASU is effective for annual periods beginning after December 15, 2024, though early adoption is permitted. The adoption of this guidance is not expected to have a material impact on our financial statements.
2. Conservatorship, Senior Preferred Stock Purchase Agreement and Related Matters
Conservatorship
We are currently operating under conservatorship, with FHFA acting as conservator. The conservatorship and related matters significantly affect our management, business activities, financial condition and results of operations.
Senior Preferred Stock Purchase Agreement
FHFA, as conservator, entered into a senior preferred stock purchase agreement with the U.S. Department of the Treasury (“Treasury”) on our behalf in September 2008. In connection with that agreement, we issued Treasury one million shares of Variable Liquidation Preference Senior Preferred Stock, Series 2008-2, which we refer to as the “senior preferred stock,” and a warrant to purchase shares equal to 79.9% of our common stock, on a fully diluted basis, for a nominal price. This agreement also provides funding to us under certain circumstances if we have a net worth deficit. Pursuant to the senior preferred stock purchase agreement, we have received a total of $119.8 billion from Treasury as of June 30, 2024, and the amount of remaining funding available to us under the agreement is $113.9 billion. We have not received any funding from Treasury under this commitment since the first quarter of 2018. We had a positive net worth of $86.5 billion as of June 30, 2024.
The dividend provisions of the senior preferred stock permit us to retain increases in our net worth until our net worth exceeds the amount of adjusted total capital necessary for us to meet the capital requirements and buffers under the enterprise regulatory capital framework established by FHFA. As a result of our conservatorship status and the terms of the senior preferred stock, no amounts would be available to distribute as dividends to common or preferred stockholders (other than to Treasury as the holder of the senior preferred stock).
The aggregate liquidation preference of the senior preferred stock increased to $203.5 billion as of June 30, 2024 from $199.2 billion as of March 31, 2024, due to the $4.3 billion increase in our net worth in the first quarter of 2024. The aggregate liquidation preference of the senior preferred stock will further increase to $208.0 billion as of September 30, 2024, due to the $4.5 billion increase in our net worth in the second quarter of 2024.
| | | | | | | | |
| Fannie Mae (In conservatorship) Second Quarter 2024 Form 10-Q | 67 |
| | | | | | | | |
| Notes to Condensed Consolidated Financial Statements | Conservatorship, Senior Preferred Stock Purchase Agreement and Related Matters |
Impact of U.S. Government Support
We continue to rely on support from Treasury to eliminate any net worth deficits we may experience in the future, which would otherwise trigger our being placed into receivership. We are not aware of any plans of FHFA (1) to fundamentally change our business model, or (2) to reduce the aggregate amount available to or held by the company under our equity structure, which includes the senior preferred stock agreement. Based on consideration of all the relevant conditions and events affecting our operations, including our reliance on the U.S. government, we continue to operate as a going concern and in accordance with FHFA’s provision of authority.
Related Parties
Because Treasury holds a warrant to purchase shares of Fannie Mae common stock equal to 79.9% of the total number of shares of Fannie Mae common stock, we and Treasury are deemed related parties. As of June 30, 2024, Treasury held an investment in our senior preferred stock with an aggregate liquidation preference of $203.5 billion.
FHFA’s control of both Fannie Mae and Freddie Mac has caused Fannie Mae, FHFA and Freddie Mac to be deemed related parties. Additionally, Fannie Mae and Freddie Mac jointly own Common Securitization Solutions, LLC (“CSS”), a limited liability company created to operate a common securitization platform; as a result, CSS is deemed a related party. CSS operates as a separate company from us and Freddie Mac, with all funding and limited administrative support services and other resources provided to it by us and Freddie Mac.
In the ordinary course of business, Fannie Mae may purchase and sell securities issued by Treasury and Freddie Mac in the capital markets. Some of the structured securities we issue are backed in whole or in part by Freddie Mac securities. Fannie Mae and Freddie Mac each have agreed to indemnify the other party for losses caused by: its failure to meet its payment or other specified obligations under the trust agreements pursuant to which the underlying resecuritized securities were issued; its failure to meet its obligations under the customer services agreement; its violations of laws; or with respect to material misstatements or omissions in offering documents, ongoing disclosures and materials relating to the underlying resecuritized securities. We also make regular income tax payments to and receive tax refunds from the Internal Revenue Service (“IRS”), a bureau of Treasury.
The following table provides the income statement impact of our related party transactions for the periods presented in addition to the associated liability at period end. The associated liability represents amounts accrued with respect to the related party transactions that have not yet been paid to the applicable related parties. In addition to the impact described in the table below, our investment in CSS, which is accounted for using the equity method, is classified as “Other assets” in our condensed consolidated balance sheets. We contributed $16 million to CSS for the three months ended June 30, 2024 and 2023. We contributed $38 million and $42 million for the six months ended June 30, 2024 and 2023, respectively.
| | | | | | | | | | | | | | | | | | | | | | | | | | | | | | | | | | | | | | | | | | | | |
| Related Party | | Activity | | Income Statement Classification | | For the Three Months Ended June 30, | | For the Six Months Ended June 30, | | Other Liabilities as of June 30, 2024 |
| | | 2024 | | 2023 | | 2024 | | 2023 | |
| | | | | | (Dollars in millions) |
| Treasury | | TCCA fees | | TCCA fees(1) | | $ | 859 | | | $ | 856 | | | $ | 1,719 | | | $ | 1,711 | | | $ | 859 | |
| Treasury | | Treasury’s Capital Magnet Fund | | Other expenses, net | | 14 | | | 16 | | | 25 | | | 27 | | 25 | |
| FHFA | | FHFA regulatory assessment fees | | Other administrative expenses | | 40 | | | 40 | | | 80 | | | 79 | | — | |
Treasury &
Freddie Mac | | Making Home Affordable Program reimbursements | | Administrative expenses | | — | | | 3 | | | — | | | 6 | | | — | |
CSS &
Freddie Mac | | Net operating losses associated with our investment in CSS | | Other expenses, net | | 16 | | | 16 | | | 38 | | | 42 | | — | |
(1)Consists of the portion of our single-family guaranty fees that is paid to Treasury pursuant to the TCCA. The resulting fee revenue and expense are recorded in “Interest income: Mortgage loans” and “TCCA fees,” respectively, in our condensed consolidated statements of operations and comprehensive income.
| | | | | | | | |
| Fannie Mae (In conservatorship) Second Quarter 2024 Form 10-Q | 68 |
| | | | | | | | |
| Notes to Condensed Consolidated Financial Statements | Consolidations and Transfers of Financial Assets |
3. Consolidations and Transfers of Financial Assets
We have interests in various entities that are considered to be variable interest entities (“VIEs”). The primary types of VIEs are securitization and resecuritization trusts, limited partnerships and special purpose vehicles (“SPVs”). Variable interests from Freddie Mac and other issuers may include a guaranty that reduces our exposure to credit risk when we hold them as investments or resecuritize them in a resecuritization trust that issues MBS that are backed by our guaranty. We consolidate the substantial majority of our single-class securitization trusts because our role as guarantor and master servicer provides us with the power to direct activities (primarily the servicing of mortgage loans) that impact the credit risk to which we are exposed. In contrast, we do not consolidate single-class securitization trusts when other organizations have the power to direct these activities unless we have the unilateral ability to dissolve the trust. We also do not consolidate our resecuritization trusts unless we have the unilateral ability to dissolve the trust. We may include securities issued by Freddie Mac in some of our resecuritization trusts. The mortgage loans that serve as collateral for Freddie Mac-issued securities are not held in trusts that are consolidated by Fannie Mae.
Unconsolidated VIEs
We do not consolidate VIEs when we are not deemed to be the primary beneficiary. The following table displays the carrying amount and classification of our assets and liabilities that relate to our involvement with unconsolidated securitization and resecuritization trusts. | | | | | | | | | | | | | | |
| | As of |
| | June 30, 2024 | | December 31, 2023 |
| | (Dollars in millions) |
| Assets and liabilities recorded in our condensed consolidated balance sheets related to unconsolidated mortgage-backed trusts: | | | | |
| | | | |
| | | | |
| | | | |
| | | | |
| | | | |
| | | | |
| | | | |
| | | | |
| | | | |
| Investments in securities, at fair value | | $ | 1,415 | | | $ | 4,863 | |
| Other assets | | 35 | | | 37 | |
Other liabilities | | (40) | | | (42) | |
Net carrying amount | | $ | 1,410 | | | $ | 4,858 | |
Our maximum exposure to loss generally represents the greater of our carrying amount related to our involvement with unconsolidated securitization and resecuritization trusts or the unpaid principal balance of the assets covered by our guaranty. Our involvement in unconsolidated resecuritization trusts may give rise to additional exposure to loss depending on the type of resecuritization trust. Fannie Mae resecuritization trusts that are backed entirely by Fannie Mae MBS are not consolidated and do not give rise to any additional exposure to loss as we already consolidate the underlying collateral. In contrast, Fannie Mae resecuritization trusts that are backed in whole or in part by Freddie Mac securities may increase our exposure to loss to the extent that we are providing a guaranty for the timely payment and interest on the underlying Freddie Mac securities that we have not previously guaranteed. Our maximum exposure to loss for these unconsolidated trusts is measured by the amount of Freddie Mac securities that are held in these resecuritization trusts.
Our maximum exposure to loss related to unconsolidated securitization and resecuritization trusts, which includes but is not limited to our exposure to these Freddie Mac securities, was approximately $212 billion and $223 billion as of June 30, 2024 and December 31, 2023, respectively. The total assets of our unconsolidated securitization and resecuritization trusts were approximately $212 billion and $273 billion as of June 30, 2024 and December 31, 2023, respectively.
The maximum exposure to loss for our unconsolidated limited partnerships and similar legal entities, which consist of LIHTC investments, community investments and investments in other entities, was $580 million and the related net carrying value was $580 million as of June 30, 2024. As of December 31, 2023, the maximum exposure to loss was $530 million and the related net carrying value was $528 million. The total assets of these limited partnership investments was $5.9 billion and $5.8 billion as of June 30, 2024 and December 31, 2023, respectively.
The maximum exposure to loss related to our involvement with unconsolidated SPVs that transfer credit risk represents the unpaid principal balance and accrued interest payable of obligations issued by our Connecticut Avenue Securities® (“CAS”) and Multifamily Connecticut Avenue Securities® (“MCASTM”) SPVs. The maximum exposure to loss related to these unconsolidated SPVs was $22.8 billion and $21.4 billion as of June 30, 2024 and December 31, 2023, respectively. The total assets related to these unconsolidated SPVs were $22.8 billion and $21.4 billion as of June 30, 2024 and December 31, 2023, respectively.
| | | | | | | | |
| Fannie Mae (In conservatorship) Second Quarter 2024 Form 10-Q | 69 |
| | | | | | | | |
| Notes to Condensed Consolidated Financial Statements | Consolidations and Transfers of Financial Assets |
As our lending relationship does not provide us with a controlling financial interest in the borrower entity for loans in our multifamily loan portfolio, we do not consolidate these borrowers regardless of their status as either a VIE or a voting interest entity. We have excluded these entities from our VIE disclosures. As of June 30, 2024, the unpaid principal balance of our multifamily loan portfolio was $470.9 billion. However, the disclosures we have provided in “Note 4, Mortgage Loans,” “Note 5, Allowance for Loan Losses” and “Note 7, Financial Guarantees” with respect to this population are consistent with the FASB’s stated objectives for the disclosures related to unconsolidated VIEs.
Transfers of Financial Assets and Portfolio Securitizations
We issue Fannie Mae MBS through portfolio securitization transactions by transferring pools of mortgage loans or mortgage-related securities to one or more trusts or special purpose entities. For the three months ended June 30, 2024 and 2023, the unpaid principal balance of portfolio securitizations was $35.5 billion and $36.9 billion, respectively. For the six months ended June 30, 2024 and 2023, the unpaid principal balance of portfolio securitizations was $66.7 billion and $65.2 billion, respectively. The substantial majority of these portfolio securitization transactions generally do not qualify for sale treatment. Portfolio securitization trusts that do qualify for sale treatment primarily consist of loans that are guaranteed or insured, in whole or in part, by the U.S. government.
We retain interests from the transfer and sale of mortgage-related securities to unconsolidated single-class and multi-class portfolio securitization trusts. As of June 30, 2024, the unpaid principal balance of retained interests was $699 million and its related fair value was $1.1 billion. As of December 31, 2023, the unpaid principal balance of retained interests was $821 million and its related fair value was $1.3 billion. For the three months ended June 30, 2024 and 2023, the principal, interest and other fees received on retained interests was $63 million and $70 million, respectively. For the six months ended June 30, 2024 and 2023, the principal, interest and other fees received on retained interests was $127 million and $148 million, respectively.
4. Mortgage Loans
We own single-family mortgage loans, which are secured by four or fewer residential dwelling units, and multifamily mortgage loans, which are secured by five or more residential dwelling units. We classify these loans as either held for investment (“HFI”) or held for sale (“HFS”). Unless otherwise noted, within “Note 4, Mortgage Loans,” we report the amortized cost of HFI loans for which we have not elected the fair value option at the unpaid principal balance, net of unamortized premiums and discounts, hedge-related basis adjustments, other cost basis adjustments, and accrued interest receivable. Within our condensed consolidated balance sheets, we present accrued interest receivable, net separately from the amortized cost of our loans held for investment. We report the carrying value of HFS loans at the lower of cost or fair value and record valuation changes in “Investment gains (losses), net” in our condensed consolidated statements of operations and comprehensive income.
Within our single-family mortgage loan disclosures below, we display loans by class of financing receivable type. Financing receivable classes used for disclosure consist of: “20- and 30-year or more, amortizing fixed-rate,” “15-year or less, amortizing fixed-rate,” “Adjustable-rate,” and “Other.” The “Other” class primarily consists of reverse mortgage loans, interest-only loans, negative-amortizing loans and second liens.
The following table displays the carrying value of our mortgage loans and allowance for loan losses.
| | | | | | | | | | | | | | |
| | As of |
| | June 30, 2024 | | December 31, 2023 |
| | (Dollars in millions) |
Single-family | | $ | 3,627,376 | | | $ | 3,641,385 | |
Multifamily | | 470,928 | | | 461,247 | |
Total unpaid principal balance of mortgage loans | | 4,098,304 | | | 4,102,632 | |
Cost basis and fair value adjustments, net | | 38,936 | | | 41,729 | |
Allowance for loan losses for HFI loans | | (8,026) | | | (8,730) | |
Total mortgage loans(1) | | $ | 4,129,214 | | | $ | 4,135,631 | |
(1)Excludes $10.8 billion and $10.4 billion of accrued interest receivable as of June 30, 2024 and December 31, 2023, respectively.
| | | | | | | | |
| Fannie Mae (In conservatorship) Second Quarter 2024 Form 10-Q | 70 |
| | | | | | | | |
| Notes to Condensed Consolidated Financial Statements | Mortgage Loans |
The following table displays information about our purchase of HFI loans, redesignation of loans and the sales of mortgage loans during the period.
| | | | | | | | | | | | | | | | | | | | | | | | | | |
| | For the Three Months Ended June 30, | | For the Six Months Ended June 30, |
| | |
| | 2024 | | 2023 | | 2024 | | 2023 |
| (Dollars in millions) |
| Purchase of HFI loans: | | | | | | | | |
| Single-family unpaid principal balance | | $ | 85,776 | | | $ | 89,175 | | | $ | 148,066 | | | $ | 156,642 | |
| Multifamily unpaid principal balance | | 9,271 | | | 15,111 | | | 19,339 | | | 25,346 | |
| | | | | | | | |
Single-family loans redesignated from HFI to HFS: | | | | | | | | |
Amortized cost | | $ | 216 | | | $ | — | | | $ | 452 | | | $ | — | |
Lower of cost or fair value adjustment at time of redesignation(1) | | (18) | | | — | | | (38) | | | — | |
Allowance reversed at time of redesignation | | 4 | | | — | | | 3 | | | — | |
| | | | | | | | |
| | | | | | | | |
| | | | | | | | |
| | | | | | | | |
Single-family loans sold: | | | | | | | | |
Unpaid principal balance | | $ | 1,832 | | | $ | — | | | $ | 2,331 | | | $ | 1,842 | |
Realized gains (losses), net | | 8 | | | — | | | 13 | | | 17 | |
(1)Consists of the write-off against the allowance at the time of redesignation.
The amortized cost of single-family mortgage loans for which formal foreclosure proceedings were in process was $4.4 billion as of June 30, 2024 and $4.6 billion as of December 31, 2023. As a result of our various loss mitigation and foreclosure prevention efforts, we expect that a portion of the loans in the process of formal foreclosure proceedings will not ultimately foreclose.
| | | | | | | | |
| Fannie Mae (In conservatorship) Second Quarter 2024 Form 10-Q | 71 |
| | | | | | | | |
| Notes to Condensed Consolidated Financial Statements | Mortgage Loans |
Aging Analysis
The following tables display an aging analysis of the total amortized cost of our HFI mortgage loans by portfolio segment and class of financing receivable, excluding loans for which we have elected the fair value option.
| | | | | | | | | | | | | | | | | | | | | | | | | | | | | | | | | | | | | | | | | | | | | | | | | | | | | | | | | | | | |
| | | As of June 30, 2024 | | | | | | | | | | |
| | 30 - 59 Days Delinquent | | 60 - 89 Days Delinquent | | Seriously Delinquent(1) | | Total Delinquent | | Current | | Total | | Loans 90 Days or More Delinquent and Accruing Interest | | Nonaccrual Loans with No Allowance | | | | | | | | | | |
| | | (Dollars in millions) | | | | | | | | | | |
Single-family: | | | | | | | | | | | | | | | | | | | | | | | | | | |
20- and 30-year or more, amortizing fixed-rate | | $ | 33,669 | | | $ | 7,696 | | | $ | 16,600 | | | $ | 57,965 | | | $ | 3,168,651 | | | $ | 3,226,616 | | | $ | 568 | | | $ | 3,128 | | | | | | | | | | | |
15-year or less, amortizing fixed-rate | | 1,775 | | | 288 | | | 546 | | | 2,609 | | | 395,554 | | | 398,163 | | | 34 | | | 188 | | | | | | | | | | | |
Adjustable-rate | | 176 | | | 38 | | | 90 | | | 304 | | | 25,619 | | | 25,923 | | | 3 | | | 15 | | | | | | | | | | | |
Other(2) | | 583 | | | 161 | | | 431 | | | 1,175 | | | 21,484 | | | 22,659 | | | 37 | | | 179 | | | | | | | | | | | |
Total single-family | | 36,203 | | | 8,183 | | | 17,667 | | | 62,053 | | | 3,611,308 | | | 3,673,361 | | | 642 | | | 3,510 | | | | | | | | | | | |
Multifamily(3) | | 935 | | | N/A | | 1,564 | | | 2,499 | | | 468,367 | | | 470,866 | | | 106 | | | 551 | | | | | | | | | | | |
Total | | $ | 37,138 | | | $ | 8,183 | | | $ | 19,231 | | | $ | 64,552 | | | $ | 4,079,675 | | | $ | 4,144,227 | | | $ | 748 | | | $ | 4,061 | | | | | | | | | | | |
| | | | | | | | | | | | | | | | | | | | | | | | | | | | | | | | | | | | | | | | | | | | | | | | | | | |
| | | As of December 31, 2023 |
| | 30 - 59 Days Delinquent | | 60 - 89 Days Delinquent | | Seriously Delinquent(1) | | Total Delinquent | | Current | | Total | | Loans 90 Days or More Delinquent and Accruing Interest | | Nonaccrual Loans with No Allowance | |
| | | (Dollars in millions) |
Single-family: | | | | | | | | | | | | | | | | | |
20- and 30-year or more, amortizing fixed-rate | | $ | 33,119 | | | $ | 8,093 | | | $ | 18,659 | | | $ | 59,871 | | | $ | 3,148,171 | | | $ | 3,208,042 | | | $ | 1,371 | | | $ | 3,457 | | |
15-year or less, amortizing fixed-rate | | 1,846 | | | 319 | | | 650 | | | 2,815 | | | 425,598 | | | 428,413 | | | 74 | | | 176 | | |
Adjustable-rate | | 184 | | | 42 | | | 100 | | | 326 | | | 26,032 | | | 26,358 | | | 11 | | | 21 | | |
Other(2) | | 586 | | | 171 | | | 562 | | | 1,319 | | | 23,772 | | | 25,091 | | | 148 | | | 228 | | |
Total single-family | | 35,735 | | | 8,625 | | | 19,971 | | | 64,331 | | | 3,623,573 | | | 3,687,904 | | | 1,604 | | | 3,882 | | |
Multifamily(3) | | 449 | | | N/A | | 1,699 | | | 2,148 | | | 459,206 | | | 461,354 | | | 171 | | | 594 | | |
Total | | $ | 36,184 | | | $ | 8,625 | | | $ | 21,670 | | | $ | 66,479 | | | $ | 4,082,779 | | | $ | 4,149,258 | | | $ | 1,775 | | | $ | 4,476 | | |
(1)Single-family seriously delinquent loans are loans that are 90 days or more past due or in the foreclosure process. Multifamily seriously delinquent loans are loans that are 60 days or more past due.
(2)Reverse mortgage loans included in “Other” are not aged due to their nature and are included in the current column.
(3)Multifamily loans 60-89 days delinquent are included in the seriously delinquent column.
Credit Quality Indicators and Write-offs by Year of Origination
The estimated mark-to-market loan-to-value (“LTV”) ratio is a primary factor we consider when estimating our allowance for loan losses for single-family loans. As LTV ratios increase, the borrower’s equity in the home decreases, which may
| | | | | | | | |
| Fannie Mae (In conservatorship) Second Quarter 2024 Form 10-Q | 72 |
| | | | | | | | |
| Notes to Condensed Consolidated Financial Statements | Mortgage Loans |
negatively affect the borrower’s ability to refinance or to sell the property for an amount at or above the outstanding balance of the loan.
The following tables display information about the credit quality of our single-family HFI loans, based on total amortized cost. The tables below also include current year write-offs of our single-family HFI mortgage loans by class of financing receivable and year of origination, excluding loans for which we have elected the fair value option.
| | | | | | | | | | | | | | | | | | | | | | | | | | | | | | | | | | | | | | | | | | | | |
| | | Credit Quality Indicators as of June 30, 2024 and Write-offs for the Six Months Ended June 30, 2024, by Year of Origination(1) |
| | 2024 | | 2023 | | 2022 | | 2021 | | 2020 | | Prior | | Total |
| | | (Dollars in millions) |
Estimated mark-to-market LTV ratio:(2) | | | | | | | | | | | | | | |
20- and 30-year or more, amortizing fixed-rate: | | | | | | | | | | | | | | |
Less than or equal to 80% | | $ | 70,150 | | | $ | 173,891 | | | $ | 334,255 | | | $ | 881,378 | | | $ | 742,596 | | | $ | 748,745 | | | $ | 2,951,015 | |
Greater than 80% and less than or equal to 90% | | 19,486 | | | 71,484 | | | 80,974 | | | 18,851 | | | 2,194 | | | 1,498 | | | 194,487 | |
Greater than 90% and less than or equal to 100% | | 29,344 | | | 32,819 | | | 15,542 | | | 1,653 | | | 193 | | | 206 | | | 79,757 | |
Greater than 100% | | — | | | 145 | | | 908 | | | 112 | | | 38 | | | 154 | | | 1,357 | |
Total 20- and 30-year or more, amortizing fixed-rate | | 118,980 | | | 278,339 | | | 431,679 | | | 901,994 | | | 745,021 | | | 750,603 | | | 3,226,616 | |
Current-year 20- and 30-year or more,
amortizing fixed-rate write-offs | | $ | — | | | $ | 15 | | | $ | 54 | | | $ | 45 | | | $ | 16 | | | $ | 72 | | | $ | 202 | |
15-year or less, amortizing fixed-rate: | | | | | | | | | | | | | | |
Less than or equal to 80% | | 2,960 | | | 7,189 | | | 33,391 | | | 155,353 | | | 109,935 | | | 88,223 | | | 397,051 | |
Greater than 80% and less than or equal to 90% | | 187 | | | 430 | | | 255 | | | 18 | | | 1 | | | 1 | | | 892 | |
Greater than 90% and less than or equal to 100% | | 135 | | | 65 | | | 18 | | | 1 | | | — | | | — | | | 219 | |
Greater than 100% | | — | | | — | | | — | | | — | | | — | | | 1 | | | 1 | |
Total 15-year or less, amortizing fixed-rate | | 3,282 | | | 7,684 | | | 33,664 | | | 155,372 | | | 109,936 | | | 88,225 | | | 398,163 | |
Current-year 15-year or less, amortizing
fixed-rate write-offs | | — | | | — | | | 1 | | | 1 | | | — | | | 2 | | | 4 | |
Adjustable-rate: | | | | | | | | | | | | | | |
Less than or equal to 80% | | 821 | | | 1,924 | | | 4,610 | | | 5,709 | | | 1,566 | | | 9,274 | | | 23,904 | |
Greater than 80% and less than or equal to 90% | | 185 | | | 533 | | | 806 | | | 37 | | | 5 | | | 2 | | | 1,568 | |
Greater than 90% and less than or equal to 100% | | 109 | | | 162 | | | 155 | | | 5 | | | 1 | | | 1 | | | 433 | |
Greater than 100% | | — | | | 1 | | | 17 | | | — | | | — | | | — | | | 18 | |
Total adjustable-rate | | 1,115 | | | 2,620 | | | 5,588 | | | 5,751 | | | 1,572 | | | 9,277 | | | 25,923 | |
| Current-year adjustable-rate write-offs | | — | | | — | | | — | | | — | | | — | | | 1 | | | 1 | |
Other: | | | | | | | | | | | | | | |
Less than or equal to 80% | | — | | | — | | | — | | | — | | | — | | | 18,270 | | | 18,270 | |
Greater than 80% and less than or equal to 90% | | — | | | — | | | — | | | — | | | — | | | 64 | | | 64 | |
Greater than 90% and less than or equal to 100% | | — | | | — | | | — | | | — | | | — | | | 32 | | | 32 | |
Greater than 100% | | — | | | — | | | — | | | — | | | — | | | 29 | | | 29 | |
Total other | | — | | | — | | | — | | | — | | | — | | | 18,395 | | | 18,395 | |
| Current-year other write-offs | | — | | | — | | | — | | | — | | | — | | | 10 | | | 10 | |
| | | | | | | | | | | | | | |
Total for all classes by LTV ratio:(2) | | | | | | | | | | | | | | |
Less than or equal to 80% | | $ | 73,931 | | | $ | 183,004 | | | $ | 372,256 | | | $ | 1,042,440 | | | $ | 854,097 | | | $ | 864,512 | | | $ | 3,390,240 | |
Greater than 80% and less than or equal to 90% | | 19,858 | | | 72,447 | | | 82,035 | | | 18,906 | | | 2,200 | | | 1,565 | | | 197,011 | |
Greater than 90% and less than or equal to 100% | | 29,588 | | | 33,046 | | | 15,715 | | | 1,659 | | | 194 | | | 239 | | | 80,441 | |
Greater than 100% | | — | | | 146 | | | 925 | | | 112 | | | 38 | | | 184 | | | 1,405 | |
Total | | $ | 123,377 | | | $ | 288,643 | | | $ | 470,931 | | | $ | 1,063,117 | | | $ | 856,529 | | | $ | 866,500 | | | $ | 3,669,097 | |
| Total current-year write-offs | | $ | — | | | $ | 15 | | | $ | 55 | | | $ | 46 | | | $ | 16 | | | $ | 85 | | | $ | 217 | |
| | | | | | | | |
| Fannie Mae (In conservatorship) Second Quarter 2024 Form 10-Q | 73 |
| | | | | | | | |
| Notes to Condensed Consolidated Financial Statements | Mortgage Loans |
| | | | | | | | | | | | | | | | | | | | | | | | | | | | | | | | | | | | | | | | | | | | |
| | Credit Quality Indicators as of December 31, 2023 and Write-offs for the Year Ended December 31, 2023, by Year of Origination(1) |
| | 2023 | | 2022 | | 2021 | | 2020 | | 2019 | | Prior | | Total |
| | (Dollars in millions) |
Estimated mark-to-market LTV ratio:(2) | | | | | | | | | | | | | | |
20- and 30-year or more, amortizing fixed-rate: | | | | | | | | | | | | | | |
Less than or equal to 80% | | $ | 148,641 | | | $ | 314,384 | | | $ | 889,434 | | | $ | 767,596 | | | $ | 136,654 | | | $ | 648,964 | | | $ | 2,905,673 | |
Greater than 80% and less than or equal to 90% | | 57,686 | | | 95,509 | | | 38,790 | | | 3,424 | | | 804 | | | 1,082 | | | 197,295 | |
Greater than 90% and less than or equal to 100% | | 61,658 | | | 35,602 | | | 4,002 | | | 363 | | | 71 | | | 189 | | | 101,885 | |
Greater than 100% | | 1,000 | | | 1,764 | | | 189 | | | 47 | | | 17 | | | 172 | | | 3,189 | |
Total 20- and 30-year or more, amortizing fixed-rate | | 268,985 | | | 447,259 | | | 932,415 | | | 771,430 | | | 137,546 | | | 650,407 | | | 3,208,042 | |
Current-year 20- and 30-year or more,
amortizing fixed-rate write-offs | | $ | 2 | | | $ | 35 | | | $ | 53 | | | $ | 45 | | | $ | 108 | | | $ | 560 | | | $ | 803 | |
15-year or less, amortizing fixed-rate: | | | | | | | | | | | | | | |
Less than or equal to 80% | | 7,110 | | | 35,224 | | | 165,294 | | | 117,795 | | | 17,162 | | | 84,222 | | | 426,807 | |
Greater than 80% and less than or equal to 90% | | 581 | | | 647 | | | 52 | | | 2 | | | — | | | 1 | | | 1,283 | |
Greater than 90% and less than or equal to 100% | | 259 | | | 58 | | | 1 | | | — | | | — | | | 1 | | | 319 | |
Greater than 100% | | 1 | | | 2 | | | — | | | — | | | — | | | 1 | | | 4 | |
Total 15-year or less, amortizing fixed-rate | | 7,951 | | | 35,931 | | | 165,347 | | | 117,797 | | | 17,162 | | | 84,225 | | | 428,413 | |
Current-year 15-year or less, amortizing
fixed-rate write-offs | | — | | | — | | | 1 | | | 1 | | | 1 | | | 5 | | | 8 | |
Adjustable-rate: | | | | | | | | | | | | | | |
Less than or equal to 80% | | 1,566 | | | 4,452 | | | 5,945 | | | 1,654 | | | 710 | | | 9,716 | | | 24,043 | |
Greater than 80% and less than or equal to 90% | | 499 | | | 1,030 | | | 90 | | | 6 | | | 2 | | | 3 | | | 1,630 | |
Greater than 90% and less than or equal to 100% | | 299 | | | 330 | | | 11 | | | — | | | — | | | 1 | | | 641 | |
Greater than 100% | | 14 | | | 29 | | | 1 | | | — | | | — | | | — | | | 44 | |
Total adjustable-rate | | 2,378 | | | 5,841 | | | 6,047 | | | 1,660 | | | 712 | | | 9,720 | | | 26,358 | |
| Current-year adjustable-rate write-offs | | — | | | 1 | | | — | | | — | | | — | | | 2 | | | 3 | |
Other: | | | | | | | | | | | | | | |
Less than or equal to 80% | | — | | | — | | | — | | | — | | | 27 | | | 19,418 | | | 19,445 | |
Greater than 80% and less than or equal to 90% | | — | | | — | | | — | | | — | | | — | | | 81 | | | 81 | |
Greater than 90% and less than or equal to 100% | | — | | | — | | | — | | | — | | | — | | | 39 | | | 39 | |
Greater than 100% | | — | | | — | | | — | | | — | | | — | | | 35 | | | 35 | |
Total other | | — | | | — | | | — | | | — | | | 27 | | | 19,573 | | | 19,600 | |
| Current-year other write-offs | | — | | | — | | | — | | | — | | | — | | | 52 | | | 52 | |
Total for all classes by LTV ratio:(2) | | | | | | | | | | | | | | |
Less than or equal to 80% | | $ | 157,317 | | | $ | 354,060 | | | $ | 1,060,673 | | | $ | 887,045 | | | $ | 154,553 | | | $ | 762,320 | | | $ | 3,375,968 | |
Greater than 80% and less than or equal to 90% | | 58,766 | | | 97,186 | | | 38,932 | | | 3,432 | | | 806 | | | 1,167 | | | 200,289 | |
Greater than 90% and less than or equal to 100% | | 62,216 | | | 35,990 | | | 4,014 | | | 363 | | | 71 | | | 230 | | | 102,884 | |
Greater than 100% | | 1,015 | | | 1,795 | | | 190 | | | 47 | | | 17 | | | 208 | | | 3,272 | |
Total | | $ | 279,314 | | | $ | 489,031 | | | $ | 1,103,809 | | | $ | 890,887 | | | $ | 155,447 | | | $ | 763,925 | | | $ | 3,682,413 | |
| Total current-year write-offs | | $ | 2 | | | $ | 36 | | | $ | 54 | | | $ | 46 | | | $ | 109 | | | $ | 619 | | | $ | 866 | |
(1)Excludes amortized cost of $4.3 billion and $5.5 billion as of June 30, 2024 and December 31, 2023, respectively, of mortgage loans guaranteed or insured, in whole or in part, by the U.S. government or one of its agencies, which represents primarily reverse mortgages for which we do not calculate an estimated mark-to-market LTV ratio. For the three months ended June 30, 2024 and year ended December 31, 2023, it also excludes write-offs of $39 million and $7 million, respectively, of mortgage loans guaranteed or insured, in whole or in part, by the U.S. government or one of its agencies. Year of loan origination may not be the same as the period in which we subsequently acquired the loan.
(2)The aggregate estimated mark-to-market LTV ratio is based on the unpaid principal balance of the loan divided by the estimated current value of the property as of the end of each reported period, which we calculate using an internal valuation model that estimates periodic changes in home value.
| | | | | | | | |
| Fannie Mae (In conservatorship) Second Quarter 2024 Form 10-Q | 74 |
| | | | | | | | |
| Notes to Condensed Consolidated Financial Statements | Mortgage Loans |
The following tables display the total amortized cost of our multifamily HFI loans by year of origination and credit-risk rating, excluding loans for which we have elected the fair value option. Property rental income and property valuations are key inputs to our internally assigned credit risk ratings. The tables below also include current year write-offs of our multifamily HFI mortgage loans by year of origination, excluding loans for which we have elected the fair value option.
| | | | | | | | | | | | | | | | | | | | | | | | | | | | | | | | | | | | | | | | | | | | |
| | Credit Quality Indicators as of June 30, 2024 and Write-offs for the Six Months Ended June 30, 2024, by Year of Origination(1) |
| | 2024 | | 2023 | | 2022 | | 2021 | | 2020 | | Prior | | Total |
| | (Dollars in millions) |
Internally assigned credit risk rating: | | | | | | | | | | | | | | |
Pass(2) | | $ | 15,261 | | | $ | 53,341 | | | $ | 50,617 | | | $ | 60,102 | | | $ | 72,560 | | | $ | 186,999 | | | $ | 438,880 | |
Special mention(3) | | 19 | | | — | | | 13 | | | 419 | | | 14 | | | 98 | | | 563 | |
Substandard(4) | | — | | | 772 | | | 9,520 | | | 3,583 | | | 2,530 | | | 15,006 | | | 31,411 | |
Doubtful(5) | | — | | | — | | | 12 | | | — | | | — | | | — | | | 12 | |
Total | | $ | 15,280 | | | $ | 54,113 | | | $ | 60,162 | | | $ | 64,104 | | | $ | 75,104 | | | $ | 202,103 | | | $ | 470,866 | |
| Current-year write-offs | | $ | — | | | $ | 29 | | | $ | 27 | | | $ | 11 | | | $ | 16 | | | $ | 88 | | | $ | 171 | |
| | | | | | | | | | | | | | | | | | | | | | | | | | | | | | | | | | | | | | | | | | | | |
| | Credit Quality Indicators as of December 31, 2023 and Write-offs for the Year Ended December 31, 2023, by Year of Origination(1) |
| | 2023 | | 2022 | | 2021 | | 2020 | | 2019 | | Prior | | Total |
| | (Dollars in millions) |
Internally assigned credit risk rating: | | | | | | | | | | | | | | |
Pass(2) | | $ | 49,944 | | | $ | 51,380 | | | $ | 60,563 | | | $ | 72,791 | | | $ | 56,901 | | | $ | 136,860 | | | $ | 428,439 | |
Special mention(3) | | 4 | | | 11 | | | 181 | | | 32 | | | 46 | | | 130 | | | 404 | |
Substandard(4) | | 521 | | | 9,517 | | | 3,654 | | | 2,703 | | | 3,893 | | | 12,188 | | | 32,476 | |
Doubtful(5) | | 25 | | | — | | | — | | | — | | | 10 | | | — | | | 35 | |
Total | | $ | 50,494 | | | $ | 60,908 | | | $ | 64,398 | | | $ | 75,526 | | | $ | 60,850 | | | $ | 149,178 | | | $ | 461,354 | |
| Current-year write-offs | | $ | — | | | $ | 3 | | | $ | 4 | | | $ | 6 | | | $ | 23 | | | $ | 365 | | | $ | 401 | |
(1)Year of loan origination may not be the same as the period in which we subsequently acquired the loan.
(2)A loan categorized as “Pass” is current or adequately protected by the current financial strength and debt service capability of the borrower.
(3)“Special mention” refers to loans that are otherwise performing but have potential weaknesses that, if left uncorrected, may result in deterioration in the borrower’s ability to repay in full.
(4)Loans classified as “Substandard” have a well-defined weakness that jeopardizes the timely full repayment. We had seniors housing loans with an amortized cost of $5.1 billion and $6.9 billion as of June 30, 2024 and December 31, 2023, respectively, classified as substandard.
(5)“Doubtful” refers to a loan with a weakness that makes collection or liquidation in full highly questionable and improbable based on existing conditions and values.
Loss Mitigation Options for Borrowers Experiencing Financial Difficulty
As part of our loss mitigation activities, we offer several types of loan restructurings to assist borrowers who experience financial difficulties. We do not typically offer principal forgiveness to our single-family or multifamily borrowers.
For single-family borrowers, we may offer loan restructurings that are only in the form of a payment delay (e.g., a forbearance plan, a repayment plan, or a payment deferral). We may also offer loan modifications that contractually change the terms of the loan, generally after the successful completion of a three to four month trial period. Single-family loan modifications may result in the capitalization of past due amounts (a form of payment delay), an interest rate reduction, a term extension, a principal forbearance (which is another form of payment delay), or a combination thereof. During the trial period, the borrower makes reduced payments that are an estimate of the anticipated modified payment amount. Additionally, during the trial period, the mortgage loan is not contractually modified such that the loan continues to be reported as past due and the trial period is considered a form of payment delay with respect to the original contractual terms of the loan. See “Note 4, Mortgage Loans” in our 2023 Form 10-K for additional information about our single-family loss mitigation options.
| | | | | | | | |
| Fannie Mae (In conservatorship) Second Quarter 2024 Form 10-Q | 75 |
| | | | | | | | |
| Notes to Condensed Consolidated Financial Statements | Mortgage Loans |
For multifamily borrowers, loan restructurings include short-term forbearance plans and loan modification programs, which primarily result in term extensions of up to one year with no change to the loan’s interest rate. In certain cases, we may make more significant modifications of terms for borrowers experiencing financial difficulty, such as reducing the interest rate, converting to interest-only payments, extending the maturity for longer than one year, providing principal forbearance, or some combination of these terms. In some instances when a loan is restructured, we may require additional collateral, which may take the form of a guaranty from another entity, to further mitigate the risk of nonperformance.
Below we provide disclosures relating to loan restructurings where borrowers were experiencing financial difficulty, including restructurings that resulted in an insignificant payment delay. The disclosures exclude loans classified as HFS and those for which we have elected the fair value option. See “Note 1, Summary of Significant Accounting Policies” in our 2023 Form 10-K for additional information on our accounting policies for single-family and multifamily loans that have been restructured.
Restructurings for Borrowers Experiencing Financial Difficulty
The following tables display the amortized cost of HFI mortgage loans that were restructured, during the periods indicated, presented by portfolio segment and class of financing receivable.
| | | | | | | | | | | | | | | | | | | | | | | | | | | | | | | | | | | | | | | | | | | | | | | | |
| | For the Three Months Ended June 30, 2024 |
| | Payment Delay (Only) | | | | | | | | | | | | |
| | Forbearance Plan | | Payment Deferral | | Trial Modification and Repayment Plans | | | Payment Delay and Term Extension(1) | | Payment Delay, Term Extension, Interest Rate Reduction, and Other(1) | | | Total | | Percentage of Total by Financing Class(2) |
| | (Dollars in millions) |
| Single-family: | | | | | | | | | | | | | | | | | | |
| 20- and 30-year or more, amortizing fixed-rate | | $ | 4,905 | | | $ | 2,733 | | | $ | 4,498 | | | | $ | 2,438 | | | | $ | 32 | | | | | $ | 14,606 | | | * % |
| 15-year or less, amortizing fixed-rate | | 195 | | | 84 | | | 162 | | | | 1 | | | | — | | | | | 442 | | | * |
| Adjustable-rate | | 25 | | | 12 | | | 15 | | | | — | | | | — | | | | | 52 | | | * |
| Other | | 25 | | | 38 | | | 56 | | | | 28 | | | | 12 | | | | | 159 | | | 1 |
| Total single-family | | 5,150 | | | 2,867 | | | 4,731 | | | | 2,467 | | | | 44 | | | | | 15,259 | | | * |
| Multifamily | | 29 | | | — | | | — | | | | — | | | | 57 | | | | | 86 | | | * |
Total(3) | | $ | 5,179 | | | $ | 2,867 | | | $ | 4,731 | | | | $ | 2,467 | | | | $ | 101 | | | | | $ | 15,345 | | | * |
| | | | | | | | |
| Fannie Mae (In conservatorship) Second Quarter 2024 Form 10-Q | 76 |
| | | | | | | | |
| Notes to Condensed Consolidated Financial Statements | Mortgage Loans |
| | | | | | | | | | | | | | | | | | | | | | | | | | | | | | | | | | | | | | | | | | | | | | | | |
| | For the Six Months Ended June 30, 2024 |
| | Payment Delay (Only) | | | | | | | | | | | | |
| | Forbearance Plan | | Payment Deferral | | Trial Modification and Repayment Plans | | | Payment Delay and Term Extension(1) | | Payment Delay, Term Extension, Interest Rate Reduction, and Other(1) | | | Total | | Percentage of Total by Financing Class(2) |
| | (Dollars in millions) |
| Single-family: | | | | | | | | | | | | | | | | | | |
| 20- and 30-year or more, amortizing fixed-rate | | $ | 6,698 | | | $ | 6,155 | | | $ | 6,626 | | | | $ | 4,605 | | | | $ | 62 | | | | | $ | 24,146 | | | 1 | % |
| 15-year or less, amortizing fixed-rate | | 271 | | | 199 | | | 235 | | | | 2 | | | | 1 | | | | | 708 | | | * |
| Adjustable-rate | | 36 | | | 29 | | | 22 | | | | — | | | | 2 | | | | | 89 | | | * |
| Other | | 38 | | | 82 | | | 92 | | | | 55 | | | | 23 | | | | | 290 | | | 1 |
| Total single-family | | 7,043 | | | 6,465 | | | 6,975 | | | | 4,662 | | | | 88 | | | | | 25,233 | | | 1 |
| Multifamily | | 31 | | | — | | | — | | | | — | | | | 62 | | | | | 93 | | | * |
Total(3) | | $ | 7,074 | | | $ | 6,465 | | | $ | 6,975 | | | | $ | 4,662 | | | | $ | 150 | | | | | $ | 25,326 | | | 1 |
| | | | | | | | | | | | | | | | | | | | | | | | | | | | | | | | | | | | | | | | | | | | | | | | |
| | For the Three Months Ended June 30, 2023 |
| | Payment Delay (Only) | | | | | | | | | | | | |
| | Forbearance Plan | | Payment Deferral | | Trial Modification and Repayment Plans | | | Payment Delay and Term Extension(1) | | Payment Delay, Term Extension and Interest Rate Reduction(1) | | | Total | | Percentage of Total by Financing Class(2) |
| | (Dollars in millions) |
| Single-family: | | | | | | | | | | | | | | | | | | |
| 20- and 30-year or more, amortizing fixed-rate | | $ | 8,107 | | | $ | 2,689 | | | $ | 3,444 | | | | $ | 1,746 | | | | $ | 80 | | | | | $ | 16,066 | | | 1 | % |
| 15-year or less, amortizing fixed-rate | | 339 | | | 116 | | | 132 | | | | 1 | | | | — | | | | | 588 | | | * |
| Adjustable-rate | | 46 | | | 10 | | | 12 | | | | — | | | | 1 | | | | | 69 | | | * |
| Other | | 89 | | | 36 | | | 86 | | | | 35 | | | | 17 | | | | | 263 | | | 1 | |
| Total single-family | | 8,581 | | | 2,851 | | | 3,674 | | | | 1,782 | | | | 98 | | | | | 16,986 | | | * |
| Multifamily | | 423 | | | — | | | — | | | | — | | | | 525 | | | | | 948 | | | * |
Total(3) | | $ | 9,004 | | | $ | 2,851 | | | $ | 3,674 | | | | $ | 1,782 | | | | $ | 623 | | | | | $ | 17,934 | | | * |
| | | | | | | | |
| Fannie Mae (In conservatorship) Second Quarter 2024 Form 10-Q | 77 |
| | | | | | | | |
| Notes to Condensed Consolidated Financial Statements | Mortgage Loans |
| | | | | | | | | | | | | | | | | | | | | | | | | | | | | | | | | | | | | | | | | | | | | | | | |
| | For the Six Months Ended June 30, 2023 |
| | Payment Delay (Only) | | | | | | | | | | | | |
| | Forbearance Plan | | Payment Deferral | | Trial Modification and Repayment Plans | | | Payment Delay and Term Extension(1) | | Payment Delay, Term Extension and Interest Rate Reduction(1) | | | Total | | Percentage of Total by Financing Class(2) |
| | (Dollars in millions) |
| Single-family: | | | | | | | | | | | | | | | | | | |
| 20- and 30-year or more, amortizing fixed-rate | | $ | 10,410 | | | $ | 6,207 | | | $ | 5,202 | | | | $ | 3,487 | | | | $ | 338 | | | | | $ | 25,644 | | | 1 | % |
| 15-year or less, amortizing fixed-rate | | 451 | | | 264 | | | 203 | | | | 1 | | | | — | | | | | 919 | | | * |
| Adjustable-rate | | 55 | | | 27 | | | 18 | | | | — | | | | 2 | | | | | 102 | | | * |
| Other | | 137 | | | 84 | | | 134 | | | | 69 | | | | 45 | | | | | 469 | | | 2 | |
| Total single-family | | 11,053 | | | 6,582 | | | 5,557 | | | | 3,557 | | | | 385 | | | | | 27,134 | | | 1 | |
| Multifamily | | 784 | | | — | | | — | | | | — | | | | 534 | | | | | 1,318 | | | * |
Total(3) | | $ | 11,837 | | | $ | 6,582 | | | $ | 5,557 | | | | $ | 3,557 | | | | $ | 919 | | | | | $ | 28,452 | | | 1 |
* Represents less than 0.5% of total by financing class.
(1) Represents loans that received a contractual modification.
(2) Based on the amortized cost basis as of period end, divided by the period-end amortized cost basis of the corresponding class of financing receivable.
(3) Excludes loans that were the subject of loss mitigation activity during the period that paid off, repurchased or sold prior to period end. Also excludes loans that liquidated either through foreclosure, deed-in-lieu of foreclosure, or a short sale. Loans may move from one category to another, as a result of the restructuring(s) they received during the period.
Our estimate of future credit losses uses a lifetime methodology, derived from modeled loan performance based on extensive historical experience of loans with similar risk characteristics, adjusted to reflect current conditions and reasonable and supportable forecasts. The historical loss experience used in our single-family and multifamily credit loss models includes the impact of the loss mitigation options provided to borrowers experiencing financial difficulty, and also includes the impact of projected loss severities as a result of a loan default.
| | | | | | | | |
| Fannie Mae (In conservatorship) Second Quarter 2024 Form 10-Q | 78 |
| | | | | | | | |
| Notes to Condensed Consolidated Financial Statements | Mortgage Loans |
The following table summarizes the financial impacts of loan modifications and payment deferrals made to single-family HFI loans presented by class of financing receivable. We discuss the qualitative impacts of forbearance plans, repayment plans, and trial modifications earlier in this footnote. As a result, those loss mitigation options are excluded from the table below.
| | | | | | | | | | | | | | | | | | | | | | | | | | | | | | | | | | | | | | | | | | |
| | For the Three Months Ended June 30, |
| | 2024 | | 2023 |
| | Weighted-Average Interest Rate Reduction | | | | Weighted-Average Term Extension (in Months) | | | | Average Amount Capitalized as a Result of a Payment Delay(1) | | Weighted-
Average
Interest Rate
Reduction | | Weighted-
Average
Term
Extension
(in Months) | | Average Amount Capitalized as a Result of a Payment Delay(1) |
Loan by class of financing receivable:(2) | | | | | | | | | | | | | | | | |
| 20- and 30-year or more, amortizing fixed-rate | | 0.74 | % | | | | 160 | | | | | $ | 13,518 | | | 1.15 | % | | 172 | | | $ | 16,661 | |
| 15-year or less, amortizing fixed-rate | | 2.72 | | | | | 87 | | | | | 10,601 | | | 2.50 | | | 79 | | | 14,819 | |
Adjustable-rate | | — | | | | | — | | | | | 10,062 | | | 1.61 | | | — | | | 14,450 | |
Other | | 0.52 | | | | | 143 | | | | | 18,995 | | | 1.34 | | | 172 | | | 21,304 | |
| | | | | | | | | | | | | | | | | | | | | | | | | | | | | | | | | | | | | | | | | | |
| | For the Six Months Ended June 30, |
| | 2024 | | 2023 |
| | Weighted-Average Interest Rate Reduction | | | | Weighted-Average Term Extension (in Months) | | | | Average Amount Capitalized as a Result of a Payment Delay(1) | | Weighted-
Average
Interest Rate
Reduction | | Weighted-
Average
Term
Extension
(in Months) | | Average Amount Capitalized as a Result of a Payment Delay(1) |
Loan by class of financing receivable:(2) | | | | | | | | | | | | | | | | |
| 20- and 30-year or more, amortizing fixed-rate | | 0.87 | % | | | | 161 | | | | | $ | 13,675 | | | 1.09 | % | | 173 | | | $ | 16,864 | |
| 15-year or less, amortizing fixed-rate | | 2.00 | | | | | 85 | | | | | 12,450 | | | 1.83 | | | 73 | | | 14,636 | |
Adjustable-rate | | 2.00 | | | | | — | | | | | 11,822 | | | 1.76 | | | — | | | 15,228 | |
Other | | 0.82 | | | | | 157 | | | | | 17,970 | | | 1.48 | | | 179 | | | 20,715 | |
(1) Represents the average amount of delinquency-related amounts that were capitalized as part of the loan balance. Amounts are in whole dollars.
(2) Excludes the financial effects of modifications for loans that were paid off or otherwise liquidated as of period-end.
The following tables display the amortized cost of HFI loans that defaulted during the period and had received a completed modification or payment deferral in the twelve months prior to the payment default. For purposes of this disclosure, we define loans that had a payment default as single-family loans with completed modifications that are two or more months delinquent during the period; or multifamily loans with completed modifications that are one or more months delinquent during the period. For loans that receive a forbearance plan, repayment plan or trial modification, these loss mitigation options generally remain in default until the loan is no longer delinquent as a result of the payment of all past-due amounts or as a result of a loan modification or payment deferral. Therefore, forbearance plans, repayment plans and trial modifications are not included in default tables below.
| | | | | | | | |
| Fannie Mae (In conservatorship) Second Quarter 2024 Form 10-Q | 79 |
| | | | | | | | |
| Notes to Condensed Consolidated Financial Statements | Mortgage Loans |
| | | | | | | | | | | | | | | | | | | | | | | | | | | | | | |
| | For the Three Months Ended June 30, 2024 |
| | Payment Delay as a Result of a Payment Deferral (Only) | | Payment Delay and Term Extension | | Payment Delay, Term Extension, Interest Rate Reduction and Other | | | Total |
| (Dollars in millions) |
| Single-family: | | | | | | | | | | | | |
| 20- and 30-year or more, amortizing fixed-rate | | $ | 1,178 | | | | $ | 625 | | | | $ | 9 | | | | | $ | 1,812 | |
| 15-year or less, amortizing fixed-rate | | 31 | | | | — | | | | — | | | | | 31 | |
| Adjustable-rate | | 3 | | | | — | | | | 1 | | | | | 4 | |
| Other | | 16 | | | | 8 | | | | 5 | | | | | 29 | |
| Total single-family | | 1,228 | | | | 633 | | | | 15 | | | | | 1,876 | |
| Multifamily | | — | | | | — | | | | 13 | | | | | 13 | |
Total loans that subsequently defaulted(1)(2) | | $ | 1,228 | | | | $ | 633 | | | | $ | 28 | | | | | $ | 1,889 | |
| | | | | | | | | | | | |
| | |
| | | | | | | | | |
| |
| | | | | | | | | | | | |
| | | | | | | | | | | | |
| | | | | | | | | | | | |
| | | | | | | | | | | | |
| | | | | | | | | | | | |
| | | | | | | | | | | | |
| | | | | | | | | | | | |
| | | | | | | | | | | | |
| | | | | | | | | | | | |
| |
| | | | | | | | | |
| |
| | | | | | | | | | | | |
| | | | | | | | | | | | |
| | | | | | | | | | | | |
| | | | | | | | | | | | |
| | | | | | | | | | | | |
| | | | | | | | | | | | |
| | | | | | | | | | | | |
| | | | | | | | | | | | |
| | | | | | | | | | | | | | | | | | | | | | | | | | | | | | |
| | For the Six Months Ended June 30, 2024 |
| | Payment Delay as a Result of a Payment Deferral (Only) | | Payment Delay and Term Extension | | Payment Delay, Term Extension, Interest Rate Reduction and Other | | | Total |
| (Dollars in millions) |
| Single-family: | | | | | | | | | | | | |
| 20- and 30-year or more, amortizing fixed-rate | | $ | 1,727 | | | | $ | 925 | | | | $ | 18 | | | | | $ | 2,670 | |
| 15-year or less, amortizing fixed-rate | | 51 | | | | — | | | | — | | | | | 51 | |
| Adjustable-rate | | 5 | | | | — | | | | 2 | | | | | 7 | |
| Other | | 23 | | | | 11 | | | | 8 | | | | | 42 | |
| Total single-family | | 1,806 | | | | 936 | | | | 28 | | | | | 2,770 | |
| Multifamily | | — | | | | — | | | | 18 | | | | | 18 | |
Total loans that subsequently defaulted(1)(2) | | $ | 1,806 | | | | $ | 936 | | | | $ | 46 | | | | | $ | 2,788 | |
| | | | | | | | | | | | |
| | |
| | | | | | | | | |
| |
| | | | | | | | | | | | |
| | | | | | | | | | | | |
| | | | | | | | | | | | |
| | | | | | | | | | | | |
| | | | | | | | | | | | |
| | | | | | | | | | | | |
| | | | | | | | | | | | |
| | | | | | | | | | | | |
| | | | | | | | | | | | |
| |
| | | | | | | | | |
| |
| | | | | | | | | | | | |
| | | | | | | | | | | | |
| | | | | | | | | | | | |
| | | | | | | | | | | | |
| | | | | | | | | | | | |
| | | | | | | | | | | | |
| | | | | | | | | | | | |
| | | | | | | | | | | | |
| | | | | | | | | | | | | | | | | | | | | | | | | | | | | | |
| | For the Three Months Ended June 30, 2023 |
| | Payment Delay as a Result of a Payment Deferral (Only) | | Payment Delay and Term Extension | | Payment Delay, Term Extension and Interest Rate Reduction | | | Total |
| | (Dollars in millions) |
| Single-family: | | | | | | | | | | | | |
| 20- and 30-year or more, amortizing fixed-rate | | $ | 819 | | | | $ | 327 | | | | $ | 197 | | | | | $ | 1,343 | |
| 15-year or less, amortizing fixed-rate | | 27 | | | | — | | | | — | | | | | 27 | |
| Adjustable-rate | | 2 | | | | — | | | | 2 | | | | | 4 | |
| Other | | 11 | | | | 7 | | | | 10 | | | | | 28 | |
| Total single-family | | 859 | | | | 334 | | | | 209 | | | | | 1,402 | |
| Multifamily | | — | | | | — | | | | 1 | | | | | 1 | |
Total loans that subsequently defaulted(1)(2) | | $ | 859 | | | | $ | 334 | | | | $ | 210 | | | | | $ | 1,403 | |
| | | | | | | | |
| Fannie Mae (In conservatorship) Second Quarter 2024 Form 10-Q | 80 |
| | | | | | | | |
| Notes to Condensed Consolidated Financial Statements | Mortgage Loans |
| | | | | | | | | | | | | | | | | | | | | | | | | | | | | | |
| | For the Six Months Ended June 30, 2023 |
| | Payment Delay as a Result of a Payment Deferral (Only) | | Payment Delay and Term Extension | | Payment Delay, Term Extension and Interest Rate Reduction | | | Total |
| | (Dollars in millions) |
| Single-family: | | | | | | | | | | | | |
| 20- and 30-year or more, amortizing fixed-rate | | $ | 1,290 | | | | $ | 446 | | | | $ | 385 | | | | | $ | 2,121 | |
| 15-year or less, amortizing fixed-rate | | 44 | | | | — | | | | 1 | | | | | 45 | |
| Adjustable-rate | | 3 | | | | — | | | | 2 | | | | | 5 | |
| Other | | 18 | | | | 11 | | | | 19 | | | | | 48 | |
| Total single-family | | 1,355 | | | | 457 | | | | 407 | | | | | 2,219 | |
| Multifamily | | — | | | | — | | | | 1 | | | | | 1 | |
Total loans that subsequently defaulted(1)(2) | | $ | 1,355 | | | | $ | 457 | | | | $ | 408 | | | | | $ | 2,220 | |
(1) Represents amortized cost as of period end. Excludes loans that liquidated either through foreclosure, deed-in-lieu of foreclosure, or a short sale.
(2) The substantial majority of loans that received a completed modification or a payment deferral during for the three months ended June 30, 2024 did not default during the second quarter of 2024. The substantial majority of loans that received a completed modification or a payment deferral during the three months ended June 30, 2023 did not default during the second quarter of 2023.
The following tables display an aging analysis of HFI mortgage loans that were restructured during the twelve months prior to June 30, 2024 and June 30, 2023, respectively, presented by portfolio segment and class of financing receivable.
| | | | | | | | | | | | | | | | | | | | | | | | | | | | | | | | | | | | | | |
|
| | As of June 30, 2024(1) |
| | 30-59 Days Delinquent | | 60-89 Days Delinquent(2) | | Seriously Delinquent | | Total Delinquent | | Current | | Total |
| | (Dollars in millions) |
| Single-family: | | | | | | | | | | | | |
| 20- and 30-year or more, amortizing fixed-rate | | $ | 3,970 | | | $ | 2,359 | | | $ | 10,681 | | | $ | 17,010 | | | $ | 12,933 | | | $ | 29,943 | |
| 15-year or less, amortizing fixed-rate | | 116 | | | 63 | | | 348 | | | 527 | | | 403 | | | 930 | |
| Adjustable-rate | | 11 | | | 10 | | | 45 | | | 66 | | | 43 | | | 109 | |
| Other | | 60 | | | 36 | | | 124 | | | 220 | | | 180 | | | 400 | |
| Total single-family loans modified | | 4,157 | | | 2,468 | | | 11,198 | | | 17,823 | | | 13,559 | | | 31,382 | |
| Multifamily | | — | | | N/A | | 361 | | | 361 | | | 883 | | | 1,244 | |
Total loans restructured(3) | | $ | 4,157 | | | $ | 2,468 | | | $ | 11,559 | | | $ | 18,184 | | | $ | 14,442 | | | $ | 32,626 | |
| | | | | | | | |
| Fannie Mae (In conservatorship) Second Quarter 2024 Form 10-Q | 81 |
| | | | | | | | |
| Notes to Condensed Consolidated Financial Statements | Mortgage Loans |
| | | | | | | | | | | | | | | | | | | | | | | | | | | | | | | | | | | | | | |
|
| | As of June 30, 2023(1) |
| | 30-59 Days Delinquent | | 60-89 Days Delinquent(2) | | Seriously Delinquent | | Total Delinquent | | Current | | Total |
| | (Dollars in millions) |
| Single-family: | | | | | | | | | | | | |
| 20- and 30-year or more, amortizing fixed-rate | | $ | 3,442 | | | $ | 2,227 | | | $ | 12,035 | | | $ | 17,704 | | | $ | 18,060 | | | $ | 35,764 | |
| 15-year or less, amortizing fixed-rate | | 114 | | | 82 | | | 447 | | | 643 | | | 639 | | | 1,282 | |
| Adjustable-rate | | 14 | | | 9 | | | 59 | | | 82 | | | 66 | | | 148 | |
| Other | | 82 | | | 43 | | | 251 | | | 376 | | | 400 | | | 776 | |
| Total single-family loans modified | | 3,652 | | | 2,361 | | | 12,792 | | | 18,805 | | | 19,165 | | | 37,970 | |
| Multifamily | | — | | | N/A | | 380 | | | 380 | | | 969 | | | 1,349 | |
Total loans restructured(3) | | $ | 3,652 | | | $ | 2,361 | | | $ | 13,172 | | | $ | 19,185 | | | $ | 20,134 | | | $ | 39,319 | |
(1) The substantial majority of loans that received a completed modification or a payment deferral during the second quarter of 2024 were not delinquent as of June 30, 2024. The substantial majority of loans that received a completed modification or a payment deferral during the second quarter of 2023 were not delinquent as of June 30, 2023.
(2) Multifamily loans 60-89 days delinquent are included in the seriously delinquent column.
(3) Represents the amortized cost basis as of period end.
Nonaccrual Loans
We recognize interest income on an accrual basis except when we believe the collection of principal and interest is not reasonably assured. This generally occurs when a single-family loan is three or more months past due and a multifamily loan is two or more months past due according to its contractual terms. A loan is reported as past due if a full payment of principal and interest is not received within one month of its due date. When a loan is placed on nonaccrual status based on delinquency status, interest previously accrued but not collected on the loan is reversed through interest income.
Cost basis adjustments on HFI loans are amortized into interest income over the contractual life of the loan using the effective interest method. Cost basis adjustments on the loan are not amortized into income while a loan is on nonaccrual status. We have elected not to measure an allowance for credit losses on accrued interest receivable balances as we have a nonaccrual policy to ensure the timely reversal of unpaid accrued interest.
For single-family loans, we recognize any contractual interest payments received on the loan while on nonaccrual status as interest income on a cash basis. For multifamily loans, we account for interest income on a cost recovery basis and we apply any payment received while on nonaccrual status to reduce the amortized cost of the loan. Thus, we do not recognize any interest income on a multifamily loan placed on nonaccrual status until the amortized cost of the loan has been reduced to zero.
A nonaccrual loan is returned to accrual status when the full collection of principal and interest is reasonably assured. We generally determine that the full collection of principal and interest is reasonably assured when the loan returns to current payment status. If a loan is restructured for a borrower experiencing financial difficulty, we require a performance period of up to 6 months before we return the loan to accrual status. Upon a loan’s return to accrual status, we resume the recognition of interest income on an accrual basis and the amortization of cost basis adjustments, if any, into interest income. If interest is capitalized pursuant to a restructuring, any capitalized interest that had not been previously recognized as interest income or that had been reversed through interest income when the loan was placed on nonaccrual status is recorded as a discount to the loan and amortized into interest income over the remaining contractual life of the loan.
| | | | | | | | |
| Fannie Mae (In conservatorship) Second Quarter 2024 Form 10-Q | 82 |
| | | | | | | | |
| Notes to Condensed Consolidated Financial Statements | Mortgage Loans |
The table below displays the accrued interest receivable written off through the reversal of interest income for nonaccrual loans.
| | | | | | | | | | | | | | | | | | |
| | | | For the Three Months Ended June 30, |
| | | | | | 2024 | | 2023 |
| (Dollars in millions) |
| Accrued interest receivable written off through the reversal of interest income: | | | | | | | | |
| Single-family | | | | | | $ | 97 | | | $ | 74 | |
| Multifamily | | | | | | 4 | | | 33 | |
| | | | | | | | | | | | | | | | | | |
| | | | For the Six Months Ended June 30, |
| | | | | | 2024 | | 2023 |
| (Dollars in millions) |
| Accrued interest receivable written off through the reversal of interest income: | | | | | | | | |
| Single-family | | | | | | $ | 179 | | | $ | 153 | |
| Multifamily | | | | | | 6 | | | 35 | |
The tables below include the amortized cost of and interest income recognized on our HFI single-family and multifamily loans on nonaccrual status by class, excluding loans for which we have elected the fair value option.
| | | | | | | | | | | | | | | | | | | | | | | | | | | | | | | | |
| | As of | | For the Three Months Ended June 30, 2024 | | For the Six Months Ended June 30, 2024 |
| | June 30, 2024 | | March 31, 2024 | | December 31, 2023 | | |
| | Amortized Cost(1) | | Total Interest Income Recognized(2) |
|
| (Dollars in millions) |
Single-family: | | | | | | | | | | |
20- and 30-year or more, amortizing fixed-rate | | $ | 22,183 | | | $ | 22,712 | | | $ | 21,971 | | | $ | 45 | | | $ | 124 | |
15-year or less, amortizing fixed-rate | | 704 | | | 734 | | | 727 | | | 1 | | | 3 | |
Adjustable-rate | | 117 | | | 115 | | | 109 | | | — | | | 1 | |
Other | | 496 | | | 480 | | | 508 | | | 2 | | | 4 | |
Total single-family | | 23,500 | | | 24,041 | | | 23,315 | | | 48 | | | 132 | |
Multifamily | | 1,836 | | | 1,812 | | | 1,890 | | | 24 | | | 26 | |
Total nonaccrual loans | | $ | 25,336 | | | $ | 25,853 | | | $ | 25,205 | | | $ | 72 | | | $ | 158 | |
| | | | | | | | | | | | | | | | | | | | | | | | | | | | | | | | |
| | As of | | For the Three Months Ended June 30, 2023 | | For the Six Months Ended June 30, 2023 |
| | June 30, 2023 | | March 31, 2023 | | December 31, 2022 | | |
| | Amortized Cost(1) | | Total Interest Income Recognized(2) |
|
| (Dollars in millions) |
Single-family: | | | | | | | | | | |
20- and 30-year or more, amortizing fixed-rate | | $ | 17,051 | | | $ | 14,172 | | | $ | 9,447 | | | $ | 15 | | | $ | 79 | |
15-year or less, amortizing fixed-rate | | 565 | | | 429 | | | 200 | | | — | | | 1 | |
Adjustable-rate | | 85 | | | 75 | | | 53 | | | — | | | — | |
Other | | 573 | | | 601 | | | 617 | | | 2 | | | 4 | |
Total single-family | | 18,274 | | | 15,277 | | | 10,317 | | | 17 | | | 84 | |
Multifamily | | 1,448 | | | 1,541 | | | 2,200 | | | 2 | | | 10 | |
Total nonaccrual loans | | $ | 19,722 | | | $ | 16,818 | | | $ | 12,517 | | | $ | 19 | | | $ | 94 | |
(1)Amortized cost is presented net of any write-offs, which are recognized when a loan balance is deemed uncollectible.
| | | | | | | | |
| Fannie Mae (In conservatorship) Second Quarter 2024 Form 10-Q | 83 |
| | | | | | | | |
| Notes to Condensed Consolidated Financial Statements | Mortgage Loans |
(2)Interest income recognized includes amortization of any deferred cost basis adjustments while the loan is performing and that is not reversed when the loan is placed on nonaccrual status. For single-family, interest income recognized includes payments received on nonaccrual loans held as of period end.
5. Allowance for Loan Losses
We maintain an allowance for loan losses for HFI loans held by Fannie Mae and by consolidated Fannie Mae MBS trusts, excluding loans for which we have elected the fair value option. When calculating our allowance for loan losses, we consider the unpaid principal balance, net of unamortized premiums and discounts, and other cost basis adjustments of HFI loans at the balance sheet date. We record write-offs as a reduction to our allowance for loan losses at the point of foreclosure, completion of a short sale, upon the redesignation of nonperforming and reperforming loans from HFI to HFS or when a loan is determined to be uncollectible.
The following table displays changes in our allowance for single-family loans, multifamily loans and total allowance for loan losses. The benefit or provision for loan losses excludes provision for accrued interest receivable losses, guaranty loss reserves and credit losses on available-for-sale (“AFS”) debt securities. Cumulatively, these amounts are recognized as “Benefit (provision) for credit losses” in our condensed consolidated statements of operations and comprehensive income.
| | | | | | | | | | | | | | | | | | | | | | | | | | |
| | For the Three Months Ended June 30, | | For the Six Months Ended June 30, |
| | 2024 | | 2023 | | 2024 | | 2023 |
| | (Dollars in millions) |
Single-family allowance for loan losses: | | | | | | | | |
Beginning balance | | $ | (6,275) | | | $ | (9,479) | | | $ | (6,671) | | | $ | (9,443) | |
Benefit (provision) for loan losses | | 530 | | | 1,399 | | | 869 | | | 1,403 | |
Write-offs | | 141 | | | 53 | | | 256 | | | 95 | |
Recoveries | | (99) | | | (27) | | | (157) | | | (103) | |
Other | | — | | | 64 | | | — | | | 58 | |
Ending balance | | $ | (5,703) | | | $ | (7,990) | | | $ | (5,703) | | | $ | (7,990) | |
Multifamily allowance for loan losses: | | | | | | | | |
Beginning balance | | $ | (2,104) | | | $ | (1,856) | | | $ | (2,059) | | | $ | (1,904) | |
Benefit (provision) for loan losses | | (245) | | | (152) | | | (402) | | | (332) | |
Write-offs | | 38 | | | 17 | | | 171 | | | 254 | |
Recoveries | | (12) | | | (1) | | | (33) | | | (10) | |
| | | | | | | | |
Ending balance | | $ | (2,323) | | | $ | (1,992) | | | $ | (2,323) | | | $ | (1,992) | |
Total allowance for loan losses: | | | | | | | | |
Beginning balance | | $ | (8,379) | | | $ | (11,335) | | | $ | (8,730) | | | $ | (11,347) | |
Benefit (provision) for loan losses | | 285 | | | 1,247 | | | 467 | | | 1,071 | |
Write-offs | | 179 | | | 70 | | | 427 | | | 349 | |
Recoveries | | (111) | | | (28) | | | (190) | | | (113) | |
Other | | — | | | 64 | | | — | | | 58 | |
Ending balance | | $ | (8,026) | | | $ | (9,982) | | | $ | (8,026) | | | $ | (9,982) | |
Our benefit (provision) for loan losses can vary substantially from period to period based on a number of factors, such as changes in actual and forecasted home prices or property valuations, fluctuations in actual and forecasted interest rates, borrower payment behavior, events such as natural disasters or pandemics, the type, volume and effectiveness of our loss mitigation activities, including forbearances and loan modifications, the volume of foreclosures completed, and the volume and pricing of loans redesignated from HFI to HFS. Our benefit or provision can also be impacted by updates to the models, assumptions, and data used in determining our allowance for loan losses.
Our single-family benefit for loan losses for the three and six months ended June 30, 2024 was primarily driven by a benefit from actual and forecasted home price growth, partially offset by a provision from changes in loan activity, as described below:
•Benefit from actual and forecasted home price growth. During the three and six months ended June 30, 2024, actual home prices appreciated more than originally projected and our forecast of future home prices also
| | | | | | | | |
| Fannie Mae (In conservatorship) Second Quarter 2024 Form 10-Q | 84 |
| | | | | | | | |
| Notes to Condensed Consolidated Financial Statements | Allowance for Loan Losses |
improved. Higher home prices decrease the likelihood that loans will default and reduce the amount of losses on loans that do default, which impacts our estimate of losses and ultimately reduces our loss reserves and provision for loan losses.
•Provision from changes in loan activity. This includes provision on newly acquired loans and was primarily driven by the credit risk profile of our single-family acquisitions for the three and six months ended June 30, 2024, which primarily consisted of purchase loans. Purchase loans generally have higher origination LTV ratios than refinance loans; therefore, purchase loans have a higher estimated risk of default and loss severity in the allowance than refinance loans and a correspondingly higher loan loss provision at the time of acquisition.
Our single-family benefit for loan losses for the three and six months ended June 30, 2023 was primarily driven by a benefit from actual and forecasted home price growth, partially offset by a provision from changes in loan activity, as described in more detail below:
•Benefit from actual and forecasted home price growth. During the three and six months ended June 30, 2023, we observed strong actual home price appreciation. In addition, our updated 2023 home price forecast changed from our prior estimate, resulting in a shift to positive home price appreciation for the year.
•Provision from changes in loan activity. This includes provision on newly acquired loans and was primarily driven by the credit risk profile of our single-family acquisitions for the three and six months ended June 30, 2023, as described in our quarterly report on Form 10-Q for the quarter ended June 30, 2023.
Our multifamily provision for loan losses for the three months ended June 30, 2024 was primarily driven by continued declines in estimated actual and near-term projected multifamily property values and the impact of new 30-day loan delinquencies in our multifamily guaranty book of business, including provision attributable to a portfolio of approximately $600 million of adjustable-rate conventional loans.
Our multifamily provision for loan losses for the six months ended June 30, 2024 was primarily driven by declines in estimated actual and near-term projected multifamily property values, the impact of new 30-day loan delinquencies in our multifamily guaranty book of business, and increases in actual and projected interest rates.
Our multifamily provision for loan losses for the three and six months ended June 30, 2023 was primarily driven by decreases in estimated multifamily property values. This resulted in higher estimated LTV ratios on the loans in our multifamily guaranty book of business, which increased our estimate of expected credit losses on these loans.
Multifamily write-offs for the six months ended June 30, 2023 were due to the write-off of a seniors housing portfolio in the first quarter of 2023.
6. Investments in Securities
Trading Securities
Trading securities are recorded at fair value with subsequent changes in fair value recorded as “Fair value gains (losses), net” in our condensed consolidated statements of operations and comprehensive income. The following table displays our investments in trading securities.
| | | | | | | | | | | | | | |
| | As of |
| | June 30, 2024 | | December 31, 2023 |
| | (Dollars in millions) |
| | | | |
| | | | |
| | | | |
| | | | |
Mortgage-related securities (includes $327 million and $364 million, respectively, related to consolidated trusts) | | $ | 1,327 | | | $ | 4,770 | |
| | | | |
| | | | |
| | | | |
Non-mortgage-related securities (includes $8.7 billion and $5.7 billion, respectively, pledged as collateral)(1) | | 48,065 | | | 47,782 | |
| Total trading securities | | $ | 49,392 | | | $ | 52,552 | |
(1)Primarily includes U.S. Treasury securities.
| | | | | | | | |
| Fannie Mae (In conservatorship) Second Quarter 2024 Form 10-Q | 85 |
| | | | | | | | |
| Notes to Condensed Consolidated Financial Statements | Investments in Securities |
The following table displays information about our net trading gains (losses).
| | | | | | | | | | | | | | | | | | | | | | | | | | |
| | For the Three Months Ended June 30, | | For the Six Months Ended June 30, |
| | 2024 | | 2023 | | 2024 | | 2023 |
| | (Dollars in millions) |
Net trading gains (losses) | | $ | 121 | | | $ | (723) | | | $ | (140) | | | $ | 23 | |
Net trading gains (losses) recognized in the period related to securities still held at period end | | 105 | | | (731) | | | (157) | | | 60 | |
Available-for-Sale Securities
We record AFS securities at fair value with unrealized gains and losses, recorded net of tax, as a component of “Other comprehensive income (loss)” and we recognize realized gains and losses from the sale of AFS securities in “Investment gains (losses), net” in our condensed consolidated statements of operations and comprehensive income. We define the amortized cost basis of our AFS securities as unpaid principal balance, net of unamortized premiums and discounts, and other cost basis adjustments. We record an allowance for credit losses for AFS securities that reflects the impairment for credit losses, which are limited to the amount that fair value is less than the amortized cost. Impairment due to non-credit losses are recorded as unrealized losses within “Other comprehensive income (loss).”
The following tables display the amortized cost, allowance for credit losses, gross unrealized gains and losses in accumulated other comprehensive income (loss) (“AOCI”), and fair value by major security type for AFS securities.
| | | | | | | | | | | | | | | | | | | | | | | | | | | | | | | | |
| | As of June 30, 2024 |
| | Total Amortized Cost | | Allowance for Credit Losses | | Gross Unrealized Gains in AOCI | | Gross Unrealized Losses in AOCI | | Total Fair Value |
| | | | | | | | | | |
| | (Dollars in millions) |
| Agency securities | | $ | 384 | | | $ | — | | | $ | 1 | | | $ | (29) | | | $ | 356 | |
| | | | | | | | | | |
| | | | | | | | | | |
| | | | | | | | | | |
| | | | | | | | | | |
| | | | | | | | | | |
| Other mortgage-related securities | | 143 | | | (2) | | | 10 | | | — | | | 151 | |
| Total | | $ | 527 | | | $ | (2) | | | $ | 11 | | | $ | (29) | | | $ | 507 | |
| | | | | | | | | | | | | | | | | | | | | | | | | | | | | | | | |
| | As of December 31, 2023 |
| | Total Amortized Cost | | Allowance for Credit Losses | | Gross Unrealized Gains in AOCI | | Gross Unrealized Losses in AOCI | | Total Fair Value |
| | (Dollars in millions) |
| Agency securities | | $ | 405 | | | $ | — | | | $ | 1 | | | $ | (29) | | | $ | 377 | |
| | | | | | | | | | |
| | | | | | | | | | |
| | | | | | | | | | |
| | | | | | | | | | |
| Other mortgage-related securities | | 179 | | | (2) | | | 10 | | | — | | | 187 | |
| Total | | $ | 584 | | | $ | (2) | | | $ | 11 | | | $ | (29) | | | $ | 564 | |
Agency securities consist of securities issued by us, Freddie Mac, or Ginnie Mae. The principal and interest on these securities are guaranteed by the issuing agency. We believe that the guaranty provided by the issuing agency, the support provided to the agencies by the U.S. government, the importance of the agencies to the liquidity and stability in the secondary mortgage market, and the long history of zero credit losses on agency mortgage-related securities are all indicators that there are currently no credit losses on these securities, even if the security is in an unrealized loss position. In addition, we generally hold these securities that are in an unrealized loss position to recovery. As a result, unless we intend to sell the security, we do not recognize an allowance for credit losses on agency mortgage-related securities.
| | | | | | | | |
| Fannie Mae (In conservatorship) Second Quarter 2024 Form 10-Q | 86 |
| | | | | | | | |
| Notes to Condensed Consolidated Financial Statements | Investments in Securities |
The following table displays additional information regarding gross unrealized losses and fair value by major security type for AFS securities in an unrealized loss position, excluding allowance for credit losses.
| | | | | | | | | | | | | | | | | | | | | | | | | | | | | | | | | | | | | | | | | | | | | | | | | | | | | | | | | | | | | | | | | | | | | | | |
| As of |
| June 30, 2024 | | December 31, 2023 |
| Less Than 12 Consecutive Months | | 12 Consecutive Months or Longer | | Less Than 12 Consecutive Months | | 12 Consecutive Months or Longer |
| Gross Unrealized Losses in AOCI | | Fair Value | | Gross Unrealized Losses in AOCI | | Fair Value | | Gross Unrealized Losses in AOCI | | Fair Value | | Gross Unrealized Losses in AOCI | | Fair Value |
| (Dollars in millions) |
| Agency securities | | $ | (1) | | | | $ | 41 | | | | $ | (28) | | | | $ | 238 | | | | $ | (3) | | | | $ | 66 | | | | $ | (26) | | | | $ | 238 | |
| Other mortgage-related securities | | — | | | | 3 | | | | — | | | | — | | | | — | | | | — | | | | — | | | | — | |
| | | | | | | | | | | | | | | | | | | | | | | |
| Total | | $ | (1) | | | | $ | 44 | | | | $ | (28) | | | | $ | 238 | | | | $ | (3) | | | | $ | 66 | | | | $ | (26) | | | | $ | 238 | |
There were no sales of AFS securities in the first half of 2024 or the first half of 2023. As a result, no gross realized gains (losses) or proceeds from sales were recognized in either period.
We held no securities classified as held-to-maturity as of June 30, 2024 or December 31, 2023.
7. Financial Guarantees
We recognize a guaranty obligation for our obligation to stand ready to perform on our guarantees to unconsolidated trusts and other guaranty arrangements. These off-balance sheet guarantees expose us to credit losses primarily relating to the unpaid principal balance of our unconsolidated Fannie Mae MBS and other financial guarantees. The maximum remaining contractual term of our guarantees is 29 years; however, the actual term of each guaranty may be significantly less than the contractual term based on the prepayment characteristics of the related mortgage loans. We measure our guaranty reserve for estimated credit losses for off-balance sheet exposures over the contractual period for which they are exposed to the credit risk, unless that obligation is unconditionally cancellable by the issuer.
As the guarantor of structured securities backed in whole or in part by Freddie Mac-issued securities, we extend our guaranty to the underlying Freddie Mac securities in our resecuritization trusts. However, Freddie Mac continues to guarantee the payment of principal and interest on the underlying Freddie Mac securities that we have resecuritized. When we began issuing UMBS, we entered into an indemnification agreement under which Freddie Mac agreed to indemnify us for losses caused by its failure to meet its payment or other specified obligations under the trust agreements pursuant to which the underlying resecuritized securities were issued. As a result, and due to the funding commitment available to Freddie Mac through its senior preferred stock purchase agreement with Treasury, we have concluded that the associated credit risk is negligible. Accordingly, we exclude from the following table Freddie Mac securities backing unconsolidated Fannie Mae-issued structured securities of $208.3 billion and $215.6 billion as of June 30, 2024 and December 31, 2023, respectively.
The following table displays our off-balance sheet maximum exposure, guaranty obligation recognized in our condensed consolidated balance sheets and the potential maximum recovery from third parties through available credit enhancements and recourse related to our financial guarantees.
| | | | | | | | | | | | | | | | | | | | | | | | | | | | | | | | | | | | | | |
| | As of |
| | June 30, 2024 | | December 31, 2023 |
| | Maximum Exposure | | Guaranty Obligation | | Maximum Recovery(1) | | Maximum Exposure | | Guaranty Obligation | | Maximum Recovery(1) |
| | (Dollars in millions) |
| Unconsolidated Fannie Mae MBS | | $ | 2,628 | | | $ | 14 | | | $ | 2,569 | | | $ | 2,778 | | | $ | 14 | | | $ | 2,713 | |
Other guaranty arrangements(2) | | 9,009 | | | 61 | | | 1,942 | | | 9,154 | | | 65 | | | 1,967 | |
| Total | | $ | 11,637 | | | $ | 75 | | | $ | 4,511 | | | $ | 11,932 | | | $ | 79 | | | $ | 4,680 | |
(1)Recoverability of such credit enhancements and recourse is subject to, among other factors, the ability of our mortgage insurers and the U.S. government, as a financial guarantor, to meet their obligations to us. For information on our mortgage insurers, see “Note 11, Concentrations of Credit Risk.”
(2)Primarily consists of credit enhancements and long-term standby commitments.
| | | | | | | | |
| Fannie Mae (In conservatorship) Second Quarter 2024 Form 10-Q | 87 |
| | | | | | | | |
| Notes to Condensed Consolidated Financial Statements | Short-Term and Long-Term Debt |
8. Short-Term and Long-Term Debt
Short-Term Debt
The following table displays our outstanding short-term debt (debt with an original contractual maturity of one year or less) and weighted-average interest rates of this debt.
| | | | | | | | | | | | | | | | | | | | | | | | | | |
| | As of |
| | | June 30, 2024 | | December 31, 2023 |
| | Outstanding | | Weighted- Average Interest Rate(1) | | Outstanding | | Weighted- Average Interest Rate(1) |
| | (Dollars in millions) |
| | | | | | | | |
Short-term debt of Fannie Mae | | $ | 12,008 | | | 5.30 | % | | $ | 17,314 | | | 5.13 | % |
(1)Includes the effects of discounts, premiums and other cost basis adjustments.
Long-Term Debt
Long-term debt represents debt with an original contractual maturity of greater than one year. The following table displays our outstanding long-term debt.
| | | | | | | | | | | | | | | | | | | | | | | | | | | | | | | | | | | |
| As of |
| June 30, 2024 | | December 31, 2023 |
| Maturities | | Outstanding(1) | | Weighted- Average Interest Rate(2) | | Maturities | | Outstanding(1) | | Weighted- Average Interest Rate(2) |
| (Dollars in millions) |
| Senior fixed: | | | | | | | | | | | |
| Benchmark notes and bonds | 2024 - 2030 | | $ | 52,653 | | | 2.90 | % | | 2024 - 2030 | | $ | 54,727 | | | 2.79 | % |
Medium-term notes(3) | 2024 - 2034 | | 41,567 | | | 1.95 | | | 2024 - 2031 | | 42,217 | | | 1.58 | |
Other(4) | 2024 - 2038 | | 6,741 | | | 4.13 | | | 2024 - 2038 | | 6,787 | | | 3.98 | |
| Total senior fixed | | | 100,961 | | | 2.61 | | | | | 103,731 | | | 2.40 | |
| Senior floating: | | | | | | | | | | | |
Medium-term notes(3) | 2026 | | 2,999 | | | 5.45 | | | N/A | | — | | | — | |
Connecticut Avenue Securities(5) | 2024 - 2031 | | 2,305 | | | 11.36 | | | 2024 - 2031 | | 2,752 | | | 11.12 | |
Other(6) | 2037 | | 270 | | | 8.81 | | | 2037 | | 268 | | | 8.79 | |
| Total senior floating | | | 5,574 | | | 8.05 | | | | | 3,020 | | | 10.92 | |
| | | | | | | | | | | |
| | | | | | | | | | | |
Total long-term debt of Fannie Mae(7) | | | 106,535 | | | 2.88 | | | | | 106,751 | | | 2.63 | |
| Debt of consolidated trusts | 2024 - 2063 | | 4,094,421 | | | 2.84 | | | 2024 - 2062 | | 4,098,653 | | | 2.56 | |
| Total long-term debt | | | $ | 4,200,956 | | | 2.84 | % | | | | $ | 4,205,404 | | | 2.57 | % |
(1)Outstanding debt balance consists of the unpaid principal balance, premiums and discounts, fair value adjustments, hedge-related basis adjustments, and other cost basis adjustments.
(2)Excludes the effects of fair value adjustments and hedge-related basis adjustments.
(3)Includes long-term debt with an original contractual maturity of greater than 1 year and up to 10 years, excluding zero-coupon debt.
(4)Includes other long-term debt with an original contractual maturity of greater than 10 years and foreign exchange bonds.
(5)Consists of CAS debt issued prior to November 2018, a portion of which is reported at fair value.
(6)Consists of structured debt instruments that are reported at fair value.
(7)Includes unamortized discounts and premiums, fair value adjustments, hedge-related cost basis adjustments, and other cost basis adjustments in a net discount position of $4.1 billion and $4.0 billion as of June 30, 2024 and December 31, 2023, respectively.
| | | | | | | | |
| Fannie Mae (In conservatorship) Second Quarter 2024 Form 10-Q | 88 |
| | | | | | | | |
| Notes to Condensed Consolidated Financial Statements | Derivative Instruments |
9. Derivative Instruments
Derivative instruments are an integral part of our strategy in managing interest-rate risk. Derivative instruments may be privately-negotiated, bilateral contracts or they may be listed and traded on an exchange. We refer to our derivative transactions made pursuant to bilateral contracts as our over-the-counter (“OTC”) derivative transactions and our derivative transactions accepted for clearing by a derivatives clearing organization as our cleared derivative transactions. We typically do not settle the notional amount of our risk management derivatives; rather, notional amounts provide the basis for calculating actual payments or settlement amounts. The derivative contracts we use for interest-rate risk management purposes consist primarily of interest-rate swaps and interest-rate options. See “Note 9, Derivative Instruments” in our 2023 Form 10-K for additional information on interest-rate risk management.
We account for certain forms of credit risk transfer transactions as derivatives. In our credit risk transfer transactions, a portion of the credit risk associated with losses on a reference pool of mortgage loans is transferred to a third party. We enter into derivative transactions that are associated with some of our credit risk transfer transactions, whereby we manage investment risk to guarantee that certain unconsolidated VIEs have sufficient cash flows to pay their contractual obligations.
We enter into forward purchase and sale commitments that lock in the future delivery of mortgage loans and mortgage-related securities at a fixed price or yield. Certain commitments to purchase mortgage loans and purchase or sell mortgage-related securities meet the criteria of a derivative. We typically settle the notional amount of our mortgage commitments that are accounted for as derivatives.
We recognize all derivatives as either assets or liabilities in our condensed consolidated balance sheets at their fair value on a trade date basis. Fair value amounts, which are (1) netted to the extent a legal right of offset exists and is enforceable by law at the counterparty level and (2) inclusive of the right or obligation associated with the cash collateral posted or received, are recorded in “Other assets” or “Other liabilities” in our condensed consolidated balance sheets. See “Note 13, Fair Value” for additional information on derivatives recorded at fair value. We present cash flows from derivatives as operating activities in our condensed consolidated statements of cash flows.
Fair Value Hedge Accounting
Pursuant to our fair value hedge accounting program, we may designate certain interest-rate swaps as hedging instruments in hedges of the change in fair value attributable to the designated benchmark interest rate for certain closed pools of fixed-rate, single-family mortgage loans or our funding debt. For hedged items in qualifying fair value hedging relationships, changes in fair value attributable to the designated risk are recognized as a basis adjustment to the hedged item. We also report changes in the fair value of the derivative hedging instrument in the same condensed consolidated statements of operations and comprehensive income line item used to recognize the earnings effect of the hedged item’s basis adjustment. The objective of our fair value hedges is to reduce GAAP earnings volatility related to changes in benchmark interest rates.
| | | | | | | | |
| Fannie Mae (In conservatorship) Second Quarter 2024 Form 10-Q | 89 |
| | | | | | | | |
| Notes to Condensed Consolidated Financial Statements | Derivative Instruments |
Notional and Fair Value Position of our Derivatives
The following table displays the notional amount and estimated fair value of our asset and liability derivative instruments, including derivative instruments designated as hedges.
| | | | | | | | | | | | | | | | | | | | | | | | | | | | | | | | | | | | | | | | | | | | | | | |
| | As of June 30, 2024 | | As of December 31, 2023 | | | | | | |
| | Notional Amount | | Estimated Fair Value | | Notional Amount | | Estimated Fair Value | | | | | | |
| | | Asset Derivatives | | | Liability Derivatives | | | Asset Derivatives | | | | Liability Derivatives | | | | | | |
| | (Dollars in millions) | | | | | | |
Risk management derivatives designated as hedging instruments: | | | | | | | | | | | | | | | | | | | | | |
Swaps:(1) | | | | | | | | | | | | | | | | | | | | | |
| Pay-fixed | | $ | 14,310 | | | $ | — | | | | $ | — | | | $ | 9,954 | | | $ | — | | | | | $ | — | | | | | | | |
| Receive-fixed | | 18,930 | | | — | | | | — | | | 28,587 | | | — | | | | | — | | | | | | | |
| | | | | | | | | | | | | | | | | | | | | |
Total risk management derivatives designated as hedging instruments | | 33,240 | | | — | | | | — | | | 38,541 | | | — | | | | | — | | | | | | | |
Risk management derivatives not designated as hedging instruments: | | | | | | | | | | | | | | | | | | | | | |
Swaps:(1) | | | | | | | | | | | | | | | | | | | | | |
| Pay-fixed | | 127,685 | | | — | | | | — | | | 136,648 | | | — | | | | | — | | | | | | | |
| Receive-fixed | | 118,023 | | | 60 | | | | (2,858) | | | 115,288 | | | 76 | | | | | (3,085) | | | | | | | |
| Basis | | 250 | | | 43 | | | | — | | | 250 | | | 44 | | | | | — | | | | | | | |
| Foreign currency | | 314 | | | — | | | | (77) | | | 316 | | | — | | | | | (66) | | | | | | | |
Swaptions:(1) | | | | | | | | | | | | | | | | | | | | | |
| Pay-fixed | | 7,006 | | | 248 | | | | (22) | | | 5,816 | | | 195 | | | | | (12) | | | | | | | |
| Receive-fixed | | 5,116 | | | 25 | | | | (70) | | | 2,666 | | | 13 | | | | | (60) | | | | | | | |
Futures(1) | | 140 | | | — | | | | — | | | 32 | | | — | | | | | — | | | | | | | |
| Total risk management derivatives not designated as hedging instruments | | 258,534 | | | 376 | | | | (3,027) | | | 261,016 | | | 328 | | | | | (3,223) | | | | | | | |
| | | | | | | | | | | | | | | | | | | | | |
| | | | | | | | | | | | | | | | | | | | | |
Netting adjustment(2) | | — | | | (290) | | | | 3,026 | | | — | | | (283) | | | | | 3,200 | | | | | | | |
Total risk management derivatives portfolio | | 291,774 | | | 86 | | | | (1) | | | 299,557 | | | 45 | | | | | (23) | | | | | | | |
| Mortgage commitment derivatives: | | | | | | | | | | | | | | | | | | | | | |
Mortgage commitments to purchase whole loans | | 4,633 | | | 4 | | | | (7) | | | 2,734 | | | 14 | | | | | — | | | | | | | |
Forward contracts to purchase mortgage-related securities | | 25,675 | | | 23 | | | | (39) | | | 14,264 | | | 98 | | | | | (2) | | | | | | | |
Forward contracts to sell mortgage-related securities | | 59,767 | | | 39 | | | | (19) | | | 43,942 | | | — | | | | | (102) | | | | | | | |
Total mortgage commitment derivatives | | 90,075 | | | 66 | | | | (65) | | | 60,940 | | | 112 | | | | | (104) | | | | | | | |
| Credit enhancement derivatives | | 28,755 | | | 67 | | | | (15) | | | 27,624 | | | 45 | | | | | (13) | | | | | | | |
| Derivatives at fair value | | $ | 410,604 | | | $ | 219 | | | | $ | (81) | | | $ | 388,121 | | | $ | 202 | | | | | $ | (140) | | | | | | | |
(1)Centrally cleared derivatives have no ascribable fair value because the positions are settled daily.
(2)The netting adjustment represents the effect of the legal right to offset under legally enforceable master netting arrangements to settle with the same counterparty on a net basis, including cash collateral posted and received. Cash collateral posted was $2.7 billion and $2.9 billion as of June 30, 2024 and December 31, 2023, respectively. Cash collateral received was $3 million and $5 million as of June 30, 2024 and December 31, 2023, respectively.
| | | | | | | | |
| Fannie Mae (In conservatorship) Second Quarter 2024 Form 10-Q | 90 |
| | | | | | | | |
| Notes to Condensed Consolidated Financial Statements | Derivative Instruments |
We record all gains and losses, including accrued interest, on derivatives while they are not in a qualifying designated hedging relationship in “Fair value gains (losses), net” in our condensed consolidated statements of operations and comprehensive income. The following table displays, by type of derivative instrument, the fair value gains and losses, net on our derivatives.
| | | | | | | | | | | | | | | | | | | | | | | | | | |
| | | | | | | | |
| | For the Three Months Ended June 30, | | For the Six Months Ended June 30, |
| | 2024 | | 2023 | | 2024 | | 2023 |
| | (Dollars in millions) |
| Risk management derivatives: | | | | | | | | |
| Swaps: | | | | | | | | |
| Pay-fixed | | $ | 237 | | | $ | 1,858 | | | $ | 1,599 | | | $ | 268 | |
| Receive-fixed | | 209 | | | (1,010) | | | (487) | | | 562 | |
| Basis | | (4) | | | 15 | | | (3) | | | 28 | |
| Foreign currency | | (3) | | | 2 | | | (11) | | | 10 | |
| Swaptions: | | | | | | | | |
| Pay-fixed | | 21 | | | 12 | | | 44 | | | (21) | |
| Receive-fixed | | 7 | | | (2) | | | 3 | | | (3) | |
| Futures | | 1 | | | 1 | | | 2 | | | 1 | |
| Net contractual interest income (expense) on interest-rate swaps | | (251) | | | (128) | | | (450) | | | (306) | |
| Total risk management derivatives fair value gains (losses), net | | 217 | | | 748 | | | 697 | | | 539 | |
| Mortgage commitment derivatives fair value gains (losses), net | | 94 | | | 198 | | | 301 | | | 84 | |
| Credit enhancement derivatives fair value gains (losses), net | | 1 | | | 29 | | | (14) | | | 14 | |
| Total derivatives fair value gains (losses), net | | $ | 312 | | | $ | 975 | | | $ | 984 | | | $ | 637 | |
| | | | | | | | |
| Fannie Mae (In conservatorship) Second Quarter 2024 Form 10-Q | 91 |
| | | | | | | | |
| Notes to Condensed Consolidated Financial Statements | Derivative Instruments |
Effect of Fair Value Hedge Accounting
The following table displays the effect of fair value hedge accounting on our condensed consolidated statements of operations and comprehensive income, including gains and losses recognized on fair value hedging relationships.
| | | | | | | | | | | | | | | | | | | | | | | | | | | | | | | | | | | | | | | | | | | | | | | | | | |
| | | | | | | | | | | | | | | | |
| | For the Three Months Ended June 30, | | For the Six Months Ended June 30, |
| | 2024 | | 2023 | | 2024 | | 2023 |
| | Interest Income: Mortgage Loans | | Interest Expense: Long-Term Debt | | Interest Income: Mortgage Loans | | Interest Expense: Long-Term Debt | | Interest Income: Mortgage Loans | | Interest Expense: Long-Term Debt | | Interest Income: Mortgage Loans | | Interest Expense: Long-Term Debt |
| | (Dollars in millions) |
Total amounts presented in our condensed consolidated statements of operations and comprehensive income | | $ | 35,617 | | | $ | (29,877) | | | $ | 32,655 | | | $ | (27,122) | | | $ | 70,833 | | | $ | (59,457) | | | $ | 64,792 | | | $ | (53,787) | |
| | | | | | | | | | | | | | | | |
Gains (losses) from fair value hedging relationships: | | | | | | | | | | | | | | | | |
Mortgage loans HFI and related interest-rate contracts: | | | | | | | | | | | | | | | | |
Hedged items | | $ | (28) | | | $ | — | | | $ | (144) | | | $ | — | | | $ | (362) | | | $ | — | | | $ | 33 | | | $ | — | |
Discontinued hedge related basis adjustment amortization | | 18 | | | — | | | 9 | | | — | | | 26 | | | — | | | 20 | | | — | |
| | | | | | | | | | | | | | | | |
| | | | | | | | | | | | | | | | |
Derivatives designated as hedging instruments | | 6 | | | — | | | 132 | | | — | | | 315 | | | — | | | (82) | | | — | |
Interest accruals on hedging instruments | | 76 | | | — | | | 27 | | | — | | | 142 | | | — | | | 53 | | | — | |
Debt of Fannie Mae and related interest-rate contracts: | | | | | | | | | | | | | | | | |
Hedged items | | — | | | 129 | | | — | | | 669 | | | — | | | 557 | | | — | | | 430 | |
Discontinued hedge-related basis adjustment amortization | | — | | | (222) | | | — | | | (199) | | | — | | | (428) | | | — | | | (395) | |
Derivatives designated as hedging instruments | | — | | | (78) | | | — | | | (503) | | | — | | | (433) | | | — | | | (71) | |
Interest accruals on derivative hedging instruments | | — | | | (113) | | | — | | | (293) | | | — | | | (280) | | | — | | | (522) | |
Total effect of fair value hedges | | $ | 72 | | | $ | (284) | | | $ | 24 | | | $ | (326) | | | $ | 121 | | | $ | (584) | | | $ | 24 | | | $ | (558) | |
| | | | | | | | |
| Fannie Mae (In conservatorship) Second Quarter 2024 Form 10-Q | 92 |
| | | | | | | | |
| Notes to Condensed Consolidated Financial Statements | Derivative Instruments |
Hedged Items in Fair Value Hedging Relationships
The following table displays the carrying amounts of the hedged items that have been in qualifying fair value hedges recorded in our condensed consolidated balance sheets, including the hedged item’s cumulative basis adjustments and the closed portfolio balances under the portfolio layer method. The hedged item carrying amounts and total basis adjustments include both open and discontinued hedges. The amortized cost and designated UPB consists only of open hedges as of June 30, 2024 and December 31, 2023.
| | | | | | | | | | | | | | | | | | | | | | | | | | | | | | | | |
| | As of June 30, 2024 |
| | Carrying Amount Assets (Liabilities) | | Cumulative Amount of Fair Value Hedging Basis Adjustments Included in the Carrying Amount | | Closed Portfolio of Mortgage Loans Under Portfolio Layer Method |
| | | Total Basis Adjustments(1)(2) | | Remaining Adjustments - Discontinued Hedge | | Total Amortized Cost | | Designated UPB |
| | (Dollars in millions) |
Mortgage loans HFI | | $ | 854,132 | | | $ | (510) | | | $ | (510) | | | $ | 497,361 | | | $ | 13,602 | |
| | | | | | | | | | |
| Debt of Fannie Mae | | (56,889) | | | 3,880 | | | 3,880 | | | N/A | | N/A |
| | | | | | | | | | | | | | | | | | | | | | | | | | | | | | | | |
| | As of December 31, 2023 |
| | Carrying Amount Assets (Liabilities) | | Cumulative Amount of Fair Value Hedging Basis Adjustments Included in the Carrying Amount | | Closed Portfolio of Mortgage Loans Under Portfolio Layer Method |
| | | Total Basis Adjustments(1)(2) | | Remaining Adjustments - Discontinued Hedge | | Total Amortized Cost | | Designated UPB |
| | (Dollars in millions) |
Mortgage loans HFI | | $ | 449,137 | | | $ | (174) | | | $ | (174) | | | $ | 218,419 | | | $ | 9,955 | |
| | | | | | | | | | |
| Debt of Fannie Mae | | (59,462) | | | 3,751 | | | 3,751 | | | N/A | | N/A |
(1) No basis adjustment associated with open hedges, as all hedges are designated at the close of business with a one-day term.
(2) Based on the unamortized balance of the hedge-related cost basis.
Derivative Counterparty Credit Exposure
Our derivative counterparty credit exposure relates principally to interest-rate derivative contracts. We are exposed to the risk that a counterparty in a derivative transaction will default on payments due to us, which may require us to seek a replacement derivative from a different counterparty. This replacement may be at a higher cost, or we may be unable to find a suitable replacement. We manage our derivative counterparty credit exposure relating to our risk management derivative transactions mainly through enforceable master netting arrangements, which allow us to net derivative assets and liabilities with the same counterparty or clearing organization and clearing member. For our OTC derivative transactions, we require counterparties to post collateral, which may include cash, U.S. Treasury securities, agency debt and agency mortgage-related securities. See “Note 12, Netting Arrangements” for information on our rights to offset assets and liabilities as of June 30, 2024 and December 31, 2023.
For certain OTC derivatives, the amount of collateral we pledge to counterparties related to our derivative instruments is determined after considering our credit ratings. Currently, our long-term senior debt is rated AA+ or above by S&P Global Ratings and Moody's Investors Service. If our long-term senior debt credit ratings were downgraded to established thresholds in our OTC derivative contracts, which range from A3/A- to Baa2/BBB or below, we would be required to provide additional collateral to certain counterparties. The aggregate fair value of our OTC derivative instruments with credit-risk-related contingent features that were in a net liability position was $1.7 billion and $1.8 billion, for which we posted collateral of $1.4 billion and $1.6 billion as of June 30, 2024 and December 31, 2023, respectively. If our credit ratings were downgraded to Baa2/BBB or below, the maximum additional collateral we would have been required to post to our counterparties as of June 30, 2024 and December 31, 2023 would have been $815 million and $798 million, respectively.
| | | | | | | | |
| Fannie Mae (In conservatorship) Second Quarter 2024 Form 10-Q | 93 |
| | | | | | | | |
| Notes to Condensed Consolidated Financial Statements | Segment Reporting |
10. Segment Reporting
We have two reportable business segments, which are based on the type of business activities each perform: Single-Family and Multifamily. Results of our two business segments are intended to reflect each segment as if it were a stand-alone business. The sum of the results for our two business segments equals our condensed consolidated results of operations. For additional information related to our business segments, including basis of organization and other segment activities, see “Note 11, Segment Reporting” in our 2023 Form 10-K.
Segment Allocations and Results
The majority of our revenues and expenses are directly associated with each respective business segment and are included in determining its operating results. Those revenues and expenses that are not directly attributable to a particular business segment are allocated based on the size of each segment’s guaranty book of business. As a result, the sum of each income statement line item for the two reportable segments is equal to that same income statement line item for the consolidated entity.
The substantial majority of the gains and losses associated with our risk management derivatives, including the impact of hedge accounting, are allocated to our Single-Family business segment. In the current period, there were no significant changes to our segment allocation methodology.
| | | | | | | | |
| Fannie Mae (In conservatorship) Second Quarter 2024 Form 10-Q | 94 |
| | | | | | | | |
| Notes to Condensed Consolidated Financial Statements | Segment Reporting |
The following table displays our segment results.
| | | | | | | | | | | | | | | | | | | | | | | | | | | | | | | | | | | | | | | | | |
| | For the Three Months Ended June 30, | | | |
| | 2024 | | 2023 | | | |
| | Single-Family | | Multifamily | | Total | | Single-Family | | Multifamily | | Total | | | |
| | (Dollars in millions) | | | |
Net interest income(1) | | $ | 6,096 | | | $ | 1,172 | | | $ | 7,268 | | | $ | 5,917 | | | $ | 1,118 | | | $ | 7,035 | | | | |
Fee and other income(2) | | 51 | | | 17 | | | 68 | | | 52 | | | 18 | | | 70 | | | | |
| Net revenues | | 6,147 | | | 1,189 | | | 7,336 | | | 5,969 | | | 1,136 | | | 7,105 | | | | |
Investment gains (losses), net(3) | | (70) | | | 8 | | | (62) | | | 27 | | | (2) | | | 25 | | | | |
Fair value gains (losses), net(4) | | 454 | | | (7) | | | 447 | | | 460 | | | (56) | | | 404 | | | | |
| Administrative expenses | | (784) | | | (155) | | | (939) | | | (718) | | | (146) | | | (864) | | | | |
Benefit (provision) for credit losses(5) | | 548 | | | (248) | | | 300 | | | 1,418 | | | (152) | | | 1,266 | | | | |
TCCA fees(6) | | (859) | | | — | | | (859) | | | (856) | | | — | | | (856) | | | | |
Credit enhancement expense(7) | | (333) | | | (72) | | | (405) | | | (327) | | | (57) | | | (384) | | | | |
Change in expected credit enhancement recoveries(8) | | (47) | | | 84 | | | 37 | | | (223) | | | 63 | | | (160) | | | | |
Other expenses, net(9) | | (218) | | | (33) | | | (251) | | | (203) | | | (54) | | | (257) | | | | |
| Income before federal income taxes | | 4,838 | | | 766 | | | 5,604 | | | 5,547 | | | 732 | | | 6,279 | | | | |
| Provision for federal income taxes | | (983) | | | (137) | | | (1,120) | | | (1,153) | | | (132) | | | (1,285) | | | | |
Net income | | $ | 3,855 | | | $ | 629 | | | $ | 4,484 | | | $ | 4,394 | | | $ | 600 | | | $ | 4,994 | | | | |
| | | | | | | | | | | | | | | |
| | | | | | | | | | | | | | | |
| | For the Six Months Ended June 30, | | | |
| | 2024 | | 2023 | | | |
| | Single-Family | | Multifamily | | Total | | Single-Family | | Multifamily | | Total | | | |
| | (Dollars in millions) | | | |
Net interest income(1) | | $ | 11,970 | | | $ | 2,321 | | | $ | 14,291 | | | $ | 11,589 | | | $ | 2,232 | | | $ | 13,821 | | | | |
Fee and other income(2) | | 106 | | | 34 | | | 140 | | | 100 | | | 33 | | | 133 | | | | |
| Net revenues | | 12,076 | | | 2,355 | | | 14,431 | | | 11,689 | | | 2,265 | | | 13,954 | | | | |
Investment gains (losses), net(3) | | (57) | | | 17 | | | (40) | | | (44) | | | 2 | | | (42) | | | | |
Fair value gains (losses), net(4) | | 938 | | | (11) | | | 927 | | | 626 | | | (18) | | | 608 | | | | |
| Administrative expenses | | (1,561) | | | (307) | | | (1,868) | | | (1,438) | | | (294) | | | (1,732) | | | | |
Benefit (provision) for credit losses(5) | | 883 | | | (403) | | | 480 | | | 1,465 | | | (331) | | | 1,134 | | | | |
TCCA fees(6) | | (1,719) | | | — | | | (1,719) | | | (1,711) | | | — | | | (1,711) | | | | |
Credit enhancement expense(7) | | (686) | | | (138) | | | (824) | | | (614) | | | (111) | | | (725) | | | | |
Change in expected credit enhancement recoveries(8) | | (89) | | | 189 | | | 100 | | | (128) | | | 88 | | | (40) | | | | |
Other expenses, net(9) | | (394) | | | (56) | | | (450) | | | (319) | | | (68) | | | (387) | | | | |
| Income before federal income taxes | | 9,391 | | | 1,646 | | | 11,037 | | | 9,526 | | | 1,533 | | | 11,059 | | | | |
| Provision for federal income taxes | | (1,929) | | | (304) | | | (2,233) | | | (2,000) | | | (293) | | | (2,293) | | | | |
Net income | | $ | 7,462 | | | $ | 1,342 | | | $ | 8,804 | | | $ | 7,526 | | | $ | 1,240 | | | $ | 8,766 | | | | |
(1)Net interest income primarily consists of guaranty fees received as compensation for assuming the credit risk on loans underlying Fannie Mae MBS held by third parties for the respective business segment, and the difference between the interest income earned on the respective business segment’s assets in our retained mortgage portfolio and our corporate liquidity portfolio and the interest expense associated with the debt funding those assets. Revenues from single-family guaranty fees include revenues generated by the 10 basis point increase in guaranty fees pursuant to the TCCA, the incremental revenue from which is paid to Treasury and not retained by us. Also includes yield maintenance revenue we recognized on the prepayment of multifamily loans.
(2)Single-family fee and other income primarily consists of compensation for engaging in structured transactions and providing other lender services. Multifamily fee and other income consists of fees associated with certain Multifamily business activities, such as credit enhancements for tax-exempt multifamily housing revenue bonds.
| | | | | | | | |
| Fannie Mae (In conservatorship) Second Quarter 2024 Form 10-Q | 95 |
| | | | | | | | |
| Notes to Condensed Consolidated Financial Statements | Segment Reporting |
(3)Single-family investment gains and losses primarily consist of gains and losses on the sale of mortgage assets. Multifamily investment gains and losses primarily consist of gains and losses on resecuritization activity.
(4)Single-family fair value gains and losses primarily consist of fair value gains and losses on risk management and mortgage commitment derivatives, trading securities, fair value option debt, and other financial instruments associated with our single-family guaranty book of business. Multifamily fair value gains and losses primarily consist of fair value gains and losses on MBS commitment derivatives, trading securities and other financial instruments associated with our multifamily guaranty book of business.
(5)Benefit (provision) for credit losses is based on loans underlying the segment’s guaranty book of business.
(6)Consists of the portion of our single-family guaranty fees that is paid to Treasury pursuant to the TCCA.
(7)Single-family credit enhancement expense consists of costs associated with our freestanding credit enhancements, which include primarily costs associated with our Credit Insurance Risk TransferTM (“CIRTTM”), Connecticut Avenue Securities® (“CAS”) and enterprise-paid mortgage insurance programs. Multifamily credit enhancement expense primarily consists of costs associated with our Multifamily CIRTTM (“MCIRTTM”) and Multifamily CAS (“MCASTM”) programs as well as amortization expense for certain lender risk-sharing programs. Excludes CAS transactions accounted for as debt instruments and credit risk transfer programs accounted for as derivative instruments.
(8)Consists of change in benefits recognized from our freestanding credit enhancements, primarily from our CAS and CIRT programs as well as certain lender risk-sharing arrangements, including our multifamily Delegated Underwriting and Servicing (“DUS®”) program.
(9)Includes debt extinguishment gains and losses, expenses associated with legal claims, foreclosed property income (expense), gains and losses from partnership investments, housing trust fund expenses, loan subservicing costs, and servicer fees paid in connection with certain loss mitigation activities.
11. Concentrations of Credit Risk
Risk Characteristics of our Guaranty Book of Business
One of the measures by which management gauges our credit risk is the delinquency status of the mortgage loans in our guaranty book of business.
For single-family and multifamily loans, management uses this information, in conjunction with housing market data, other economic data, our capital requirements and our mission objectives, to help inform changes to our pricing and our eligibility and underwriting criteria. Management also uses this data together with other credit risk measures to identify key trends that guide the development of our loss mitigation strategies.
We report the delinquency status of our single-family and multifamily guaranty book of business below.
Single-Family Credit Risk Characteristics
For single-family loans, management monitors the serious delinquency rate, which is the percentage of single-family loans, based on number of loans, that are 90 days or more past due or in the foreclosure process, and loans that have higher risk characteristics, such as high mark-to-market LTV ratios.
The following tables display the delinquency status and serious delinquency rates for specified loan categories of our single-family conventional guaranty book of business.
| | | | | | | | | | | | | | | | | | | | | | | | | | | | | | | | | | | |
| As of |
| June 30, 2024 | | December 31, 2023 |
| 30 Days Delinquent | | 60 Days Delinquent | | Seriously Delinquent(1) | | 30 Days Delinquent | | 60 Days Delinquent | | Seriously Delinquent(1) |
| Percentage of single-family conventional guaranty book of business based on UPB | 0.99 | % | | 0.23 | % | | 0.50 | % | | 0.98 | % | | 0.24 | % | | 0.56 | % |
| Percentage of single-family conventional loans based on loan count | 1.07 | | | 0.24 | | | 0.48 | | | 1.06 | | | 0.26 | | | 0.55 | |
| | | | | | | | |
| Fannie Mae (In conservatorship) Second Quarter 2024 Form 10-Q | 96 |
| | | | | | | | |
| Notes to Condensed Consolidated Financial Statements | Concentrations of Credit Risk |
| | | | | | | | | | | | | | | | | | | | | | | |
| As of |
| June 30, 2024 | | December 31, 2023 |
| Percentage of Single-Family Conventional Guaranty Book of Business Based on UPB | | Serious Delinquency Rate(1) | | Percentage of Single-Family Conventional Guaranty Book of Business Based on UPB | | Serious Delinquency Rate(1) |
| Estimated mark-to-market LTV ratio: | | | | | | | |
| 80.01% to 90% | 6 | % | | 0.77 | % | | 5 | % | | 0.81 | % |
| 90.01% to 100% | 2 | | | 0.57 | | | 3 | | | 0.59 | |
| Greater than 100% | * | | 3.34 | | | * | | 2.05 | |
| Geographical distribution: | | | | | | | |
| California | 19 | | | 0.37 | | | 19 | | | 0.42 | |
| Texas | 7 | | | 0.57 | | | 7 | | | 0.64 | |
| Florida | 6 | | | 0.63 | | | 6 | | | 0.73 | |
| New York | 5 | | | 0.79 | | | 5 | | | 0.92 | |
| Illinois | 3 | | | 0.65 | | | 3 | | | 0.70 | |
| All other states | 60 | | | 0.45 | | | 60 | | | 0.52 | |
| Vintages: | | | | | | | |
| 2008 and prior | 2 | | | 1.76 | | | 2 | | | 2.07 | |
| 2009-2024 | 98 | | | 0.42 | | | 98 | | | 0.47 | |
| | | | | | | |
| | | | | | | |
| | | | | | | |
* Represents less than 0.5% of single-family conventional guaranty book of business.
(1)Based on loan count, consists of single-family conventional loans that were 90 days or more past due or in the foreclosure process as of June 30, 2024 or December 31, 2023.
Multifamily Credit Risk Characteristics
For multifamily loans, management monitors the serious delinquency rate, which is the percentage of multifamily loans, based on unpaid principal balance, that are 60 days or more past due, and loans with other higher risk characteristics to determine the overall credit quality of our multifamily book of business. Higher risk characteristics include, but are not limited to, current debt service coverage ratio (“DSCR”) below 1.0 and original LTV ratio greater than 80%. We stratify multifamily loans into different internal risk categories based on the credit risk inherent in each individual loan.
The following tables display the delinquency status and serious delinquency rates for specified loan categories of our multifamily guaranty book of business.
| | | | | | | | | | | | | | | | | | | | | | | |
| As of |
| June 30, 2024(1) | | December 31, 2023(1) |
| 30 Days Delinquent | | Seriously Delinquent(2) | | 30 Days Delinquent | | Seriously Delinquent(2) |
| Percentage of multifamily guaranty book of business | 0.19 | % | | 0.44 | % | | 0.10 | % | | 0.46 | % |
| | | | | | | | | | | | | | | | | | | | | | | |
| As of |
| June 30, 2024 | | December 31, 2023 |
| Percentage of Multifamily Guaranty Book of Business(1) | | Serious Delinquency Rate(2)(3) | | Percentage of Multifamily Guaranty Book of Business(1) | | Serious Delinquency Rate(2)(3) |
| Original LTV ratio: | | | | | | | |
| Greater than 80% | 1 | % | | 0.13 | % | | 1 | % | | 0.13 | % |
| Less than or equal to 80% | 99 | | | 0.45 | | | 99 | | | 0.46 | |
Current DSCR below 1.0(4) | 5 | | | 5.01 | | | 4 | | | 7.04 | |
(1)Calculated based on the aggregate unpaid principal balance of multifamily loans for each category divided by the aggregate unpaid principal balance of loans in our multifamily guaranty book of business.
(2)Consists of multifamily loans that were 60 days or more past due as of the dates indicated.
| | | | | | | | |
| Fannie Mae (In conservatorship) Second Quarter 2024 Form 10-Q | 97 |
| | | | | | | | |
| Notes to Condensed Consolidated Financial Statements | Concentrations of Credit Risk |
(3)Calculated based on the unpaid principal balance of multifamily loans that were seriously delinquent divided by the aggregate unpaid principal balance of multifamily loans for each category included in our multifamily guaranty book of business.
(4)Our estimates of current DSCRs are based on the latest available income information covering a 12 month period, from quarterly and annual statements for these properties including the related debt service.
Other Concentrations
Mortgage Insurers. Mortgage insurance “risk in force” refers to our maximum potential loss recovery under the applicable mortgage insurance policies in force and is generally based on the loan-level insurance coverage percentage and, if applicable, any aggregate pool loss limit, as specified in the policy.
The following table displays our total mortgage insurance risk in force by primary and pool insurance, as well as the total risk-in-force mortgage insurance coverage as a percentage of the single-family conventional guaranty book of business.
| | | | | | | | | | | | | | | | | | | | | | | | | | |
| | As of |
| | June 30, 2024 | | December 31, 2023 |
| | Risk in Force | | Percentage of Single-Family Conventional Guaranty Book of Business | | Risk in Force | | Percentage of Single-Family Conventional Guaranty Book of Business |
| | (Dollars in millions) |
| Mortgage insurance risk in force: | | | | | | | | |
| Primary mortgage insurance | | $ | 199,645 | | | | | $ | 200,023 | | | |
| Pool mortgage insurance | | 85 | | | | | 98 | | | |
| Total mortgage insurance risk in force | | $ | 199,730 | | | 6% | | $ | 200,121 | | | 6% |
Mortgage insurance only covers losses that are realized after the borrower defaults and title to the property is subsequently transferred, such as after a foreclosure, short-sale, or a deed-in-lieu of foreclosure. Also, mortgage insurance does not protect us from all losses on covered loans. For example, mortgage insurance is not intended to cover property damage from hazards, including natural disasters; and the mortgage insurance policy permits the exclusion of any material loss directly related to property damage.
In general, we require single-family and multifamily borrowers to obtain and maintain property insurance to cover the risk of damage to their homes or properties resulting from hazards such as fire, wind and, for properties located in Federal Emergency Management Agency-designated Special Flood Hazard Areas, flooding. Since we generally require borrowers to select and obtain hazard insurance policies, our requirements for hazard insurance coverage are verified by the lender or servicer, as applicable. For single-family loans, we require a minimum financial strength rating for non-governmental hazard insurers that must be provided by S&P Global, Demotech, AM Best or KBRA. For multifamily loans, we require a minimum financial strength rating for non-governmental hazard insurers that must be provided by Demotech or AM Best. We do not independently verify the financial condition of these hazard insurers and rely on these rating agencies for their assessment of the financial condition of these insurers.
| | | | | | | | |
| Fannie Mae (In conservatorship) Second Quarter 2024 Form 10-Q | 98 |
| | | | | | | | |
| Notes to Condensed Consolidated Financial Statements | Concentrations of Credit Risk |
The table below displays our mortgage insurer counterparties that provided 10% or more of the risk in force mortgage insurance coverage on mortgage loans in our single-family conventional guaranty book of business.
| | | | | | | | | | | | | | |
| | Percentage of Risk in Force Coverage by Mortgage Insurer |
| | As of |
| | June 30, 2024 | | December 31, 2023 |
Counterparty:(1) | | |
| Mortgage Guaranty Insurance Corp. | | 18 | % | | 19 | % |
| Radian Guaranty, Inc. | | 18 | | | 18 | |
| Arch Capital Group Ltd. | | 17 | | | 18 | |
| Enact Mortgage Insurance Corp. | | 17 | | | 16 | |
| Essent Guaranty, Inc. | | 17 | | | 16 | |
| National Mortgage Insurance Corp. | | 13 | | | 13 | |
| Others | | * | | * |
| Total | | 100 | % | | 100 | % |
* Represents less than 0.5% of the risk in force mortgage insurance coverage.
(1)Insurance coverage amounts provided for each counterparty may include coverage provided by affiliates and subsidiaries of the counterparty.
We have counterparty credit risk relating to the potential insolvency of, or non-performance by, monoline mortgage insurers that insure single-family loans we purchase or guarantee. There is risk that these counterparties may fail to fulfill their obligations to pay our claims under insurance policies. On at least a quarterly basis, we assess our mortgage insurer counterparties’ respective abilities to fulfill their obligations to us. Our assessment includes financial reviews and analyses of the insurers’ portfolios and capital adequacy. If we determine that it is probable that we will not collect all of our claims from one or more of our mortgage insurer counterparties, it could increase our loss reserves, which could adversely affect our results of operations, liquidity, financial condition and net worth.
When we estimate the credit losses that are inherent in our mortgage loans and under the terms of our guaranty obligations, we also consider the recoveries that we expect to receive from primary mortgage insurance, as mortgage insurance recoveries reduce the severity of the loss associated with defaulted loans if the borrower defaults and title to the property is subsequently transferred. Mortgage insurance does not cover credit losses that result from a reduction in mortgage interest paid by the borrower in connection with a loan modification, forbearance of principal, or forbearance of scheduled loan payments. We evaluate the financial condition of our mortgage insurer counterparties and adjust the contractually due recovery amounts to ensure that expected credit losses as of the balance sheet date are included in our loss reserve estimate. As a result, if our assessment of one or more of our mortgage insurer counterparties’ ability to fulfill their respective obligations to us worsens, it could increase our loss reserves. As of June 30, 2024 and December 31, 2023, our estimated benefit from mortgage insurance, which is based on estimated credit losses as of period end, reduced our loss reserves by $1.0 billion and $1.2 billion, respectively.
As of June 30, 2024 and December 31, 2023, we had outstanding receivables of $462 million and $471 million, respectively, recorded in “Other assets” in our condensed consolidated balance sheets related to amounts claimed on insured, defaulted loans excluding government-insured loans. As of June 30, 2024 and December 31, 2023, we assessed these outstanding receivables for collectability, and established a valuation allowance of $401 million and $417 million, respectively.
Mortgage Servicers and Sellers. Mortgage servicers collect mortgage and escrow payments from borrowers, pay taxes and insurance costs from escrow accounts, monitor and report delinquencies, and perform other required activities, including loss mitigation, on our behalf. Our mortgage servicers and sellers may also be obligated to repurchase loans or foreclosed properties, reimburse us for losses or provide other remedies under certain circumstances, such as if it is determined that the mortgage loan did not meet our underwriting or eligibility requirements, if certain loan representations and warranties are violated or if mortgage insurers rescind coverage. Our representation and warranty framework does not require repurchase for loans that have breaches of certain selling representations and warranties if they have met specified criteria for relief.
| | | | | | | | |
| Fannie Mae (In conservatorship) Second Quarter 2024 Form 10-Q | 99 |
| | | | | | | | |
| Notes to Condensed Consolidated Financial Statements | Concentrations of Credit Risk |
Our business with mortgage servicers is concentrated. The table below displays the percentage of our single-family conventional guaranty book of business serviced by our top five depository single-family mortgage servicers and top five non-depository single-family mortgage servicers (i.e., servicers that are not insured depository institutions) based on unpaid principal balance. There were no servicers that serviced 10% or more of our single-family guaranty book of business as of June 30, 2024 or December 31, 2023.
| | | | | | | | | | | | | | |
| | Percentage of Single-Family
Conventional
Guaranty Book of Business |
| | As of |
| | June 30, 2024 | | December 31, 2023 |
| Top five depository servicers | | 21 | % | | 22 | % |
| Top five non-depository servicers | | 28 | | | 27 | |
| Total | | 49 | % | | 49 | % |
As of June 30, 2024, 43% of our single-family conventional guaranty book of business was serviced by depository servicers, and 57% of our single-family conventional guaranty book of business was serviced by non-depository servicers. As of December 31, 2023, 44% of our single-family conventional guaranty book of business was serviced by depository servicers, and 56% of our single-family conventional guaranty book of business was serviced by non-depository servicers.
The table below displays the percentage of our multifamily guaranty book of business serviced by our top five depository multifamily mortgage servicers and top five non-depository multifamily mortgage servicers. As of June 30, 2024, two servicers serviced 10% or more of our multifamily guaranty book of business, Walker & Dunlop, Inc. and Wells Fargo Bank, N.A. (together with its affiliates). As of June 30, 2024 and December 31, 2023, Walker & Dunlop, Inc. and Wells Fargo Bank, N.A. (together with its affiliates) serviced 13% and 10%, respectively, of our multifamily guaranty book of business based on unpaid principal balance. Walker & Dunlop, Inc. is a non-depository servicer and Wells Fargo Bank, N.A. is a depository servicer. | | | | | | | | | | | | | | |
| | Percentage of Multifamily
Guaranty Book of Business |
| | As of |
| | June 30, 2024 | | December 31, 2023 |
| Top five depository servicers | | 26 | % | | 27 | % |
| Top five non-depository servicers | | 44 | | | 44 | |
| Total | | 70 | % | | 71 | % |
As of June 30, 2024 and December 31, 2023, 31% of our multifamily guaranty book of business was serviced by depository servicers and 69% of our multifamily guaranty book of business was serviced by non-depository servicers.
Compared with depository financial institutions, our non-depository servicers pose additional risks because they may not have the same financial strength or operational capacity, or be subject to the same level of regulatory oversight as depository financial institutions.
Derivatives Counterparties. For information on credit risk associated with our derivative transactions and repurchase agreements see “Note 9, Derivative Instruments” and “Note 12, Netting Arrangements.”
| | | | | | | | |
| Fannie Mae (In conservatorship) Second Quarter 2024 Form 10-Q | 100 |
| | | | | | | | |
| Notes to Condensed Consolidated Financial Statements | Netting Arrangements |
12. Netting Arrangements
We use master netting arrangements, which allow us to offset certain financial instruments and collateral with the same counterparty, to minimize counterparty credit exposure. The tables below display information related to derivatives, securities purchased under agreements to resell, and securities sold under agreements to repurchase, which are subject to an enforceable master netting arrangement or similar agreement that are either offset or not offset in our condensed consolidated balance sheets.
| | | | | | | | | | | | | | | | | | | | | | | | | | | | | | | | | | | | | | | | | | | | | | | | | | | | | | | | | | | | |
| | As of June 30, 2024 | | | | |
| | | | Gross Amount Offset(1) | | Net Amount Presented in our Condensed Consolidated Balance Sheets | | Amounts Not Offset in our Condensed Consolidated Balance Sheets | | | | | | |
| | Gross Amount | | | | Financial Instruments(2) | | Collateral(3) | | Net Amount | | | | |
| | (Dollars in millions) | | | | |
| Assets: | | | | | | | | | | | | | | | | | | | | | | |
OTC risk management derivatives | | $ | 376 | | | $ | (342) | | | | $ | 34 | | | | | $ | — | | | | | $ | — | | | | $ | 34 | | | | | |
| Cleared risk management derivatives | | — | | | 52 | | | | 52 | | | | | — | | | | | — | | | | 52 | | | | | |
Mortgage commitment derivatives | | 66 | | | — | | | | 66 | | | | | (50) | | | | | (1) | | | | 15 | | | | | |
| Total derivative assets | | 442 | | | (290) | | | | 152 | | (4) | | | (50) | | | | | (1) | | | | 101 | | | | | |
Securities purchased under agreements to resell(5) | | 70,200 | | | — | | | | 70,200 | | | | | — | | | | | (70,200) | | | | — | | | | | |
| Total assets | | $ | 70,642 | | | $ | (290) | | | | $ | 70,352 | | | | | $ | (50) | | | | | $ | (70,201) | | | | $ | 101 | | | | | |
| Liabilities: | | | | | | | | | | | | | | | | | | | | | | |
OTC risk management derivatives | | $ | (3,027) | | | $ | 3,026 | | | | $ | (1) | | | | | $ | — | | | | | $ | — | | | | $ | (1) | | | | | |
| Cleared risk management derivatives | | — | | | — | | | | — | | | | | — | | | | | — | | | | — | | | | | |
Mortgage commitment derivatives | | (65) | | | — | | | | (65) | | | | | 50 | | | | | 7 | | | | (8) | | | | | |
| | | | | | | | | | | | | | | | | | | | | | |
| | | | | | | | | | | | | | | | | | | | | | |
| Total liabilities | | $ | (3,092) | | | $ | 3,026 | | | | $ | (66) | | (4) | | | $ | 50 | | | | | $ | 7 | | | | $ | (9) | | | | | |
| | | | | | | | | | | | | | | | | | | | | | | | | | | | | | | | | | | | | | | | | | | | | | | | | | | | | | | | | | | | | | |
| | | As of December 31, 2023 | |
| | | | | | | Gross Amount Offset(1) | | | Net Amount Presented in our Condensed Consolidated Balance Sheets | | Amounts Not Offset in our Condensed Consolidated Balance Sheets | | | | |
| | | Gross Amount | | | | | | Financial Instruments(2) | | Collateral(3) | | | Net Amount | |
| | | (Dollars in millions) | |
| Assets: | | | | | | | | | | | | | | | | | | | | | | | | |
OTC risk management derivatives | | | $ | 328 | | | | | $ | (294) | | | | | $ | 34 | | | | | $ | — | | | | | $ | — | | | | | $ | 34 | | |
Cleared risk management derivatives | | | — | | | | | 11 | | | | | 11 | | | | | — | | | | | — | | | | | 11 | | |
Mortgage commitment derivatives | | | 112 | | | | | — | | | | | 112 | | | | | (23) | | | | | (9) | | | | | 80 | | |
| Total derivative assets | | | 440 | | | | | (283) | | | | | 157 | | (4) | | | (23) | | | | | (9) | | | | | 125 | | |
Securities purchased under agreements to resell(5) | | | 65,425 | | | | | — | | | | | 65,425 | | | | | — | | | | | (65,425) | | | | | — | | |
| Total assets | | | $ | 65,865 | | | | | $ | (283) | | | | | $ | 65,582 | | | | | $ | (23) | | | | | $ | (65,434) | | | | | $ | 125 | | |
| Liabilities: | | | | | | | | | | | | | | | | | | | | | | | | |
OTC risk management derivatives | | | $ | (3,223) | | | | | $ | 3,203 | | | | | $ | (20) | | | | | $ | — | | | | | $ | — | | | | | $ | (20) | | |
Cleared risk management derivatives | | | — | | | | | (3) | | | | | (3) | | | | | — | | | | | 3 | | | | | — | | |
Mortgage commitment derivatives | | | (104) | | | | | — | | | | | (104) | | | | | 23 | | | | | 77 | | | | | (4) | | |
| | | | | | | | | | | | | | | | | | | | | | | | |
| | | | | | | | | | | | | | | | | | | | | | | | |
| Total liabilities | | | $ | (3,327) | | | | | $ | 3,200 | | | | | $ | (127) | | (4) | | | $ | 23 | | | | | $ | 80 | | | | | $ | (24) | | |
(1)Represents the effect of the right to offset under legally enforceable master netting arrangements to settle with the same counterparty on a net basis, including cash collateral posted and received and accrued interest.
(2)Mortgage commitment derivative amounts reflect where we have recognized both an asset and a liability with the same counterparty under an enforceable master netting arrangement but we have not elected to offset the related amounts in our condensed consolidated balance sheets.
| | | | | | | | |
| Fannie Mae (In conservatorship) Second Quarter 2024 Form 10-Q | 101 |
| | | | | | | | |
| Notes to Condensed Consolidated Financial Statements | Netting Arrangements |
(3)Represents collateral received that has not been recognized and not offset in our condensed consolidated balance sheets, as well as collateral posted which has been recognized but not offset in our condensed consolidated balance sheets. Does not include collateral held or posted in excess of our exposure. The fair value of non-cash collateral we pledged which the counterparty was permitted to sell or repledge was $2.0 billion and $2.2 billion as of June 30, 2024 and December 31, 2023, respectively. The fair value of non-cash collateral received was $70.2 billion and $65.5 billion, of which $55.3 billion and $55.4 billion could be sold or repledged as of June 30, 2024 and December 31, 2023, respectively. None of the underlying collateral was sold or repledged as of June 30, 2024 or December 31, 2023.
(4)Excludes derivative assets of $67 million and $45 million as of June 30, 2024 and December 31, 2023, respectively, and derivative liabilities of $15 million and $13 million as of June 30, 2024 and December 31, 2023, respectively, recognized in our condensed consolidated balance sheets, that were not subject to enforceable master netting arrangements.
(5)Includes $28.2 billion and $21.8 billion in securities purchased under agreements to resell classified as “Cash and cash equivalents” in our condensed consolidated balance sheets as of June 30, 2024 and December 31, 2023, respectively. Includes $14.4 billion and $12.9 billion in securities purchased under agreements to resell classified as “Restricted cash and cash equivalents” in our condensed consolidated balance sheets as of June 30, 2024 and December 31, 2023, respectively.
Derivative instruments are recorded at fair value and securities purchased under agreements to resell are recorded at amortized cost in our condensed consolidated balance sheets. For a discussion of how we determine our rights to offset the assets and liabilities presented above with the same counterparty, including collateral posted or received, see “Note 15, Netting Arrangements” in our 2023 Form 10-K.
13. Fair Value
We use fair value measurements for the initial recording of certain assets and liabilities and periodic remeasurement of certain assets and liabilities on a recurring or nonrecurring basis.
Fair Value Measurement
Fair value measurement guidance defines fair value, establishes a framework for measuring fair value, and sets forth disclosures around fair value measurements. This guidance applies whenever other accounting guidance requires or permits assets or liabilities to be measured at fair value. The guidance establishes a three-level fair value hierarchy that prioritizes the inputs into the valuation techniques used to measure fair value. The fair value hierarchy gives the highest priority, Level 1, to measurements based on unadjusted quoted prices in active markets for identical assets or liabilities. The next highest priority, Level 2, is given to measurements of assets and liabilities based on limited observable inputs or observable inputs for similar assets and liabilities. The lowest priority, Level 3, is given to measurements based on unobservable inputs.
We use valuation techniques that maximize the use of observable inputs and minimize the use of unobservable inputs. See “Note 16, Fair Value” in our 2023 Form 10-K for information on the valuation control processes and the valuation techniques we use for fair value measurement and disclosure as well as our basis for classifying these measurements as Level 1, Level 2 or Level 3 of the valuation hierarchy in more specific situations. If the inputs used to measure assets or liabilities at fair value change, it may also result in a change in classification between Levels 1, 2, and 3. We made no material changes to the valuation control processes or the valuation techniques for the six months ended June 30, 2024.
| | | | | | | | |
| Fannie Mae (In conservatorship) Second Quarter 2024 Form 10-Q | 102 |
| | | | | | | | |
| Notes to Condensed Consolidated Financial Statements | Fair Value |
Recurring Changes in Fair Value
The following tables display our assets and liabilities measured in our condensed consolidated balance sheets at fair value on a recurring basis subsequent to initial recognition, including instruments for which we have elected the fair value option.
| | | | | | | | | | | | | | | | | | | | | | | | | | | | | | | | | | | | | | | | | | | | | | | | | | | | | | | | | | | | | | |
| | Fair Value Measurements as of June 30, 2024 |
| | Quoted Prices in Active Markets for Identical Assets (Level 1) | | Significant Other Observable Inputs (Level 2) | | Significant Unobservable Inputs (Level 3) | | Netting Adjustment(1) | | Estimated Fair Value |
| | (Dollars in millions) |
| Recurring fair value measurements: | | | | | | | | | | | | | | | | | | | | |
| Assets: | | | | | | | | | | | | | | | | | | | | |
| | | | | | | | | | | | | | | | | | | | |
| Trading securities: | | | | | | | | | | | | | | | | | | | | |
| | | | | | | | | | | | | | | | | | | | |
| | | | | | | | | | | | | | | | | | | | |
| | | | | | | | | | | | | | | | | | | | |
| | | | | | | | | | | | | | | | | | | | |
| Mortgage-related | | | $ | — | | | | | $ | 1,295 | | | | | $ | 32 | | | | | $ | — | | | | | $ | 1,327 | | |
| | | | | | | | | | | | | | | | | | | | |
| | | | | | | | | | | | | | | | | | | | |
| | | | | | | | | | | | | | | | | | | | |
Non-mortgage-related(2) | | | 48,045 | | | | | 20 | | | | | — | | | | | — | | | | | 48,065 | | |
| Total trading securities | | | 48,045 | | | | | 1,315 | | | | | 32 | | | | | — | | | | | 49,392 | | |
| Available-for-sale securities: | | | | | | | | | | | | | | | | | | | | |
| | | | | | | | | | | | | | | | | | | | |
| | | | | | | | | | | | | | | | | | | | |
| | | | | | | | | | | | | | | | | | | | |
Agency(3) | | | — | | | | | 41 | | | | | 315 | | | | | — | | | | | 356 | | |
| | | | | | | | | | | | | | | | | | | | |
| | | | | | | | | | | | | | | | | | | | |
| | | | | | | | | | | | | | | | | | | | |
| Other mortgage-related | | | — | | | | | 5 | | | | | 146 | | | | | — | | | | | 151 | | |
| Total available-for-sale securities | | | — | | | | | 46 | | | | | 461 | | | | | — | | | | | 507 | | |
| Mortgage loans | | | — | | | | | 2,769 | | | | | 425 | | | | | — | | | | | 3,194 | | |
| Derivative assets | | | — | | | | | 400 | | | | | 109 | | | | | (290) | | | | | 219 | | |
| | | | | | | | | | | | | | | | | | | | |
| | | | | | | | | | | | | | | | | | | | |
| | | | | | | | | | | | | | | | | | | | |
| | | | | | | | | | | | | | | | | | | | |
| | | | | | | | | | | | | | | | | | | | |
| | | | | | | | | | | | | | | | | | | | |
| | | | | | | | | | | | | | | | | | | | |
| | | | | | | | | | | | | | | | | | | | |
| Total assets at fair value | | | $ | 48,045 | | | | | $ | 4,530 | | | | | $ | 1,027 | | | | | $ | (290) | | | | | $ | 53,312 | | |
| | | | | | | | | | | | | | | | | | | | |
| Liabilities: | | | | | | | | | | | | | | | | | | | | |
| Long-term debt: | | | | | | | | | | | | | | | | | | | | |
| | | | | | | | | | | | | | | | | | | | |
| | | | | | | | | | | | | | | | | | | | |
| Of Fannie Mae | | | $ | — | | | | | $ | 274 | | | | | $ | 270 | | | | | $ | — | | | | | $ | 544 | | |
| | | | | | | | | | | | | | | | | | | | |
| Of consolidated trusts | | | — | | | | | 13,129 | | | | | 110 | | | | | — | | | | | 13,239 | | |
| Total long-term debt | | | — | | | | | 13,403 | | | | | 380 | | | | | — | | | | | 13,783 | | |
| Derivative liabilities | | | — | | | | | 3,092 | | | | | 15 | | | | | (3,026) | | | | | 81 | | |
| | | | | | | | | | | | | | | | | | | | |
| | | | | | | | | | | | | | | | | | | | |
| | | | | | | | | | | | | | | | | | | | |
| | | | | | | | | | | | | | | | | | | | |
| | | | | | | | | | | | | | | | | | | | |
| | | | | | | | | | | | | | | | | | | | |
| | | | | | | | | | | | | | | | | | | | |
| | | | | | | | | | | | | | | | | | | | |
| Total liabilities at fair value | | | $ | — | | | | | $ | 16,495 | | | | | $ | 395 | | | | | $ | (3,026) | | | | | $ | 13,864 | | |
| | | | | | | | | | | | | | | | | | | | | | | | | | | | | | | | | | | | | | | | | | | | | | | | | | | | | | | | | | | | | | |
| | Fair Value Measurements as of December 31, 2023 |
| | Quoted Prices in Active Markets for Identical Assets (Level 1) | | Significant Other Observable Inputs (Level 2) | | Significant Unobservable Inputs (Level 3) | | Netting Adjustment(1) | | Estimated Fair Value |
| | | (Dollars in millions) | |
| Recurring fair value measurements: | | | | | | | | | | | | | | | | | | | | |
| Assets: | | | | | | | | | | | | | | | | | | | | |
| | | | | | | | | | | | | | | | | | | | |
| Trading securities: | | | | | | | | | | | | | | | | | | | | |
| | | | | | | | | | | | | | | | | | | | |
| | | | | | | | | | | | | | | | | | | | |
| | | | | | | | | | | | | | | | | | | | |
| | | | | | | | | | | | | | | | | | | | |
| Mortgage-related | | | $ | — | | | | | $ | 4,744 | | | | | $ | 26 | | | | | $ | — | | | | | $ | 4,770 | | |
| | | | | | | | | | | | | | | | | | | | |
| | | | | | | | | | | | | | | | | | | | |
| | | | | | | | | | | | | | | | | | | | |
Non-mortgage-related(2) | | | 47,764 | | | | | 18 | | | | | — | | | | | — | | | | | 47,782 | | |
| Total trading securities | | | 47,764 | | | | | 4,762 | | | | | 26 | | | | | — | | | | | 52,552 | | |
| Available-for-sale securities: | | | | | | | | | | | | | | | | | | | | |
| | | | | | | | | | | | | | | | | | | | |
| | | | | | | | | | | | | | | | | | | | |
| | | | | | | | | | | | | | | | | | | | |
Agency(3) | | | — | | | | | 46 | | | | | 331 | | | | | — | | | | | 377 | | |
| | | | | | | | | | | | | | | | | | | | |
| | | | | | | | | | | | | | | | | | | | |
| | | | | | | | | | | | | | | | | | | | |
| Other mortgage-related | | | — | | | | | 4 | | | | | 183 | | | | | — | | | | | 187 | | |
| Total available-for-sale securities | | | — | | | | | 50 | | | | | 514 | | | | | — | | | | | 564 | | |
| Mortgage loans | | | — | | | | | 2,838 | | | | | 477 | | | | | — | | | | | 3,315 | | |
| Derivative assets | | | — | | | | | 395 | | | | | 90 | | | | | (283) | | | | | 202 | | |
| | | | | | | | | | | | | | | | | | | | |
| | | | | | | | | | | | | | | | | | | | |
| | | | | | | | | | | | | | | | | | | | |
| | | | | | | | | | | | | | | | | | | | |
| | | | | | | | | | | | | | | | | | | | |
| | | | | | | | | | | | | | | | | | | | |
| | | | | | | | | | | | | | | | | | | | |
| | | | | | | | | | | | | | | | | | | | |
| Total assets at fair value | | | $ | 47,764 | | | | | $ | 8,045 | | | | | $ | 1,107 | | | | | $ | (283) | | | | | $ | 56,633 | | |
| | | | | | | | | | | | | | | | | | | | |
| Liabilities: | | | | | | | | | | | | | | | | | | | | |
| Long-term debt: | | | | | | | | | | | | | | | | | | | | |
| | | | | | | | | | | | | | | | | | | | |
| | | | | | | | | | | | | | | | | | | | |
| Of Fannie Mae | | | $ | — | | | | | $ | 493 | | | | | $ | 268 | | | | | $ | — | | | | | $ | 761 | | |
| | | | | | | | | | | | | | | | | | | | |
| Of consolidated trusts | | | — | | | | | 14,226 | | | | | 117 | | | | | — | | | | | 14,343 | | |
| Total long-term debt | | | — | | | | | 14,719 | | | | | 385 | | | | | — | | | | | 15,104 | | |
| Derivative liabilities | | | — | | | | | 3,327 | | | | | 13 | | | | | (3,200) | | | | | 140 | | |
| | | | | | | | | | | | | | | | | | | | |
| | | | | | | | | | | | | | | | | | | | |
| | | | | | | | | | | | | | | | | | | | |
| | | | | | | | | | | | | | | | | | | | |
| | | | | | | | | | | | | | | | | | | | |
| | | | | | | | | | | | | | | | | | | | |
| | | | | | | | | | | | | | | | | | | | |
| | | | | | | | | | | | | | | | | | | | |
| Total liabilities at fair value | | | $ | — | | | | | $ | 18,046 | | | | | $ | 398 | | | | | $ | (3,200) | | | | | $ | 15,244 | | |
| | | | | | | | |
| Fannie Mae (In conservatorship) Second Quarter 2024 Form 10-Q | 103 |
| | | | | | | | |
| Notes to Condensed Consolidated Financial Statements | Fair Value |
(1)Derivative contracts are reported on a gross basis by level. The netting adjustment represents the effect of the legal right to offset under legally enforceable master netting arrangements to settle with the same counterparty on a net basis, including cash collateral posted and received.
(2)Primarily includes U.S. Treasury securities.
(3)Agency securities consist of securities issued by Fannie Mae, Freddie Mac, and Ginnie Mae.
The following tables display a reconciliation of all assets and liabilities measured at fair value on a recurring basis using significant unobservable inputs (Level 3). The tables also display gains and losses due to changes in fair value, including both realized and unrealized gains and losses, recognized in our condensed consolidated statements of operations and comprehensive income for Level 3 assets and liabilities.
| | | | | | | | | | | | | | | | | | | | | | | | | | | | | | | | | | | | | | | | | | | | | | | | | | | | | | | | | | | | | | | | | | | | | | | | | | |
| | Fair Value Measurements Using Significant Unobservable Inputs (Level 3) |
| | For the Three Months Ended June 30, 2024 |
| | | | Total Gains (Losses) (Realized/Unrealized) | | | | | | | | | | | | | | | | Net Unrealized Gains (Losses) Included in Net Income Related to Assets and Liabilities Still Held as of June 30, 2024(4)(5) | | Net Unrealized Gains (Losses) Included in OCI Related to Assets and Liabilities Still Held as of June 30, 2024(1) |
| | Balance, March 31, 2024 | | Included in Net Income | | Included in Total OCI (Loss)(1) | | Purchases(2) | | Sales(2) | | Issues(3) | | Settlements(3) | | Transfers out of Level 3 | | Transfers into
Level 3 | | Balance, June 30, 2024 | |
| | (Dollars in millions) |
| Trading securities: | | | | | | | | | | | | | | | | | | | | | | | | |
| | | | | | | | | | | | | | | | | | | | | | | | |
| | | | | | | | | | | | | | | | | | | | | | | | |
| | | | | | | | | | | | | | | | | | | | | | | | |
| | | | | | | | | | | | | | | | | | | | | | | | |
| Mortgage-related | | $ | 28 | | | $ | — | | (5)(6) | $ | — | | | $ | — | | | $ | — | | | $ | — | | | $ | — | | | $ | (3) | | | $ | 7 | | | $ | 32 | | | $ | — | | | $ | — | |
| | | | | | | | | | | | | | | | | | | | | | | | |
| | | | | | | | | | | | | | | | | | | | | | | | |
Available-for-sale securities: | | | | | | | | | | | | | | | | | | | | | | | | |
| | | | | | | | | | | | | | | | | | | | | | | | |
| | | | | | | | | | | | | | | | | | | | | | | | |
Agency | | $ | 323 | | | $ | — | | | $ | (1) | | | $ | — | | | $ | — | | | $ | — | | | $ | (7) | | | $ | — | | | $ | — | | | $ | 315 | | | $ | — | | | $ | — | |
| | | | | | | | | | | | | | | | | | | | | | | | |
| | | | | | | | | | | | | | | | | | | | | | | | |
| | | | | | | | | | | | | | | | | | | | | | | | |
| Other mortgage-related | | 164 | | | 1 | | | (7) | | | — | | | — | | | — | | | (11) | | | (1) | | | — | | | 146 | | | — | | | (6) | |
Total available-for-sale securities | | $ | 487 | | | $ | 1 | | (6)(7) | $ | (8) | | | $ | — | | | $ | — | | | $ | — | | | $ | (18) | | | $ | (1) | | | $ | — | | | $ | 461 | | | $ | — | | | $ | (6) | |
| | | | | | | | | | | | | | | | | | | | | | | | |
Mortgage loans | | $ | 470 | | | $ | (4) | | (5)(6) | $ | — | | | $ | — | | | $ | (2) | | | $ | — | | | $ | (16) | | | $ | (30) | | | $ | 7 | | | $ | 425 | | | $ | (1) | | | $ | — | |
| | | | | | | | | | | | | | | | | | | | | | | | |
| Net derivatives | | 69 | | | — | | (5) | — | | | — | | | — | | | — | | | 25 | | | — | | | — | | | 94 | | | 24 | | | — | |
| | | | | | | | | | | | | | | | | | | | | | | | |
| Long-term debt: | | | | | | | | | | | | | | | | | | | | | | | | |
Of Fannie Mae | | $ | (273) | | | $ | 3 | | (5) | $ | — | | | $ | — | | | $ | — | | | $ | — | | | $ | — | | | $ | — | | | $ | — | | | $ | (270) | | | $ | 3 | | | $ | — | |
Of consolidated trusts | | (114) | | | — | | (5)(6) | — | | | — | | | — | | | — | | | 3 | | | 1 | | | — | | | (110) | | | — | | | — | |
Total long-term debt | | $ | (387) | | | $ | 3 | | | $ | — | | | $ | — | | | $ | — | | | $ | — | | | $ | 3 | | | $ | 1 | | | $ | — | | | $ | (380) | | | $ | 3 | | | $ | — | |
| | | | | | | | |
| Fannie Mae (In conservatorship) Second Quarter 2024 Form 10-Q | 104 |
| | | | | | | | |
| Notes to Condensed Consolidated Financial Statements | Fair Value |
| | | | | | | | | | | | | | | | | | | | | | | | | | | | | | | | | | | | | | | | | | | | | | | | | | | | | | | | | | | | | | | | | | | | | | | | | | |
| | Fair Value Measurements Using Significant Unobservable Inputs (Level 3) |
| | For the Six Months Ended June 30, 2024 |
| | | | Total Gains (Losses) (Realized/Unrealized) | | | | | | | | | | | | | | | | Net Unrealized Gains (Losses) Included in Net Income Related to Assets and Liabilities Still Held as of June 30, 2024(4)(5) | | Net Unrealized Gains (Losses) Included in OCI Related to Assets and Liabilities Still Held as of June 30, 2024(1) |
| | Balance, December 31, 2023 | | Included in Net Income | | Included in Total OCI (Loss)(1) | | Purchases(2) | | Sales(2) | | Issues(3) | | Settlements(3) | | Transfers out of Level 3 | | Transfers into
Level 3 | | Balance, June 30, 2024 | |
| | (Dollars in millions) |
| Trading securities: | | | | | | | | | | | | | | | | | | | | | | | | |
| | | | | | | | | | | | | | | | | | | | | | | | |
| | | | | | | | | | | | | | | | | | | | | | | | |
| | | | | | | | | | | | | | | | | | | | | | | | |
| | | | | | | | | | | | | | | | | | | | | | | | |
| Mortgage-related | | $ | 26 | | | $ | (1) | | (5)(6) | $ | — | | | $ | — | | | $ | — | | | $ | — | | | $ | — | | | $ | (3) | | | $ | 10 | | | $ | 32 | | | $ | (1) | | | $ | — | |
| | | | | | | | | | | | | | | | | | | | | | | | |
| | | | | | | | | | | | | | | | | | | | | | | | |
Available-for-sale securities: | | | | | | | | | | | | | | | | | | | | | | | | |
| | | | | | | | | | | | | | | | | | | | | | | | |
| | | | | | | | | | | | | | | | | | | | | | | | |
Agency | | $ | 331 | | | $ | — | | | $ | — | | | $ | — | | | $ | — | | | $ | — | | | $ | (16) | | | $ | — | | | $ | — | | | $ | 315 | | | $ | — | | | $ | — | |
| | | | | | | | | | | | | | | | | | | | | | | | |
| | | | | | | | | | | | | | | | | | | | | | | | |
| | | | | | | | | | | | | | | | | | | | | | | | |
| Other mortgage-related | | 183 | | | 2 | | | 1 | | | — | | | — | | | — | | | (39) | | | (1) | | | — | | | 146 | | | — | | | — | |
Total available-for-sale securities | | $ | 514 | | | $ | 2 | | (6)(7) | $ | 1 | | | $ | — | | | $ | — | | | $ | — | | | $ | (55) | | | $ | (1) | | | $ | — | | | $ | 461 | | | $ | — | | | $ | — | |
| | | | | | | | | | | | | | | | | | | | | | | | |
Mortgage loans | | $ | 477 | | | $ | (3) | | (5)(6) | $ | — | | | $ | — | | | $ | (6) | | | $ | — | | | $ | (33) | | | $ | (39) | | | $ | 29 | | | $ | 425 | | | $ | (1) | | | $ | — | |
| | | | | | | | | | | | | | | | | | | | | | | | |
| Net derivatives | | 77 | | | (12) | | (5) | — | | | — | | | — | | | — | | | 29 | | | — | | | — | | | 94 | | | 17 | | | — | |
| | | | | | | | | | | | | | | | | | | | | | | | |
| Long-term debt: | | | | | | | | | | | | | | | | | | | | | | | | |
Of Fannie Mae | | $ | (268) | | | $ | (2) | | (5) | $ | — | | | $ | — | | | $ | — | | | $ | — | | | $ | — | | | $ | — | | | $ | — | | | $ | (270) | | | $ | (2) | | | $ | — | |
Of consolidated trusts | | (117) | | | (1) | | (5)(6) | — | | | — | | | — | | | — | | | 7 | | | 1 | | | — | | | (110) | | | (1) | | | — | |
Total long-term debt | | $ | (385) | | | $ | (3) | | | $ | — | | | $ | — | | | $ | — | | | $ | — | | | $ | 7 | | | $ | 1 | | | $ | — | | | $ | (380) | | | $ | (3) | | | $ | — | |
| | | | | | | | | | | | | | | | | | | | | | | | | | | | | | | | | | | | | | | | | | | | | | | | | | | | | | | | | | | | | | | | | | | | | | | | | | |
| | Fair Value Measurements Using Significant Unobservable Inputs (Level 3) |
| | For the Three Months Ended June 30, 2023 |
| | | | Total Gains (Losses) (Realized/Unrealized) | | | | | | | | | | | | | | | | Net Unrealized Gains (Losses) Included in Net Income Related to Assets and Liabilities Still Held as of June 30, 2023(4)(5) | | Net Unrealized Gains (Losses) Included in OCI Related to Assets and Liabilities Still Held as of June 30, 2023(1) |
| | Balance, March 31, 2023 | | Included in Net Income | | Included in Total OCI (Loss)(1) | | Purchases(2) | | Sales(2) | | Issues(3) | | Settlements(3) | | Transfers out of Level 3 | | Transfers into
Level 3 | | Balance, June 30, 2023 | |
| | (Dollars in millions) |
| Trading securities: | | | | | | | | | | | | | | | | | | | | | | | | |
| | | | | | | | | | | | | | | | | | | | | | | | |
| | | | | | | | | | | | | | | | | | | | | | | | |
| | | | | | | | | | | | | | | | | | | | | | | | |
| | | | | | | | | | | | | | | | | | | | | | | | |
| Mortgage-related | | $ | 32 | | | $ | (2) | | (5)(6) | $ | — | | | $ | — | | | $ | — | | | $ | — | | | $ | — | | | $ | (2) | | | $ | — | | | $ | 28 | | | $ | (1) | | | $ | — | |
| | | | | | | | | | | | | | | | | | | | | | | | |
| | | | | | | | | | | | | | | | | | | | | | | | |
Available-for-sale securities: | | | | | | | | | | | | | | | | | | | | | | | | |
| | | | | | | | | | | | | | | | | | | | | | | | |
| | | | | | | | | | | | | | | | | | | | | | | | |
Agency | | $ | 362 | | | $ | 1 | | | $ | 2 | | | $ | — | | | $ | — | | | $ | — | | | $ | (9) | | | $ | — | | | $ | — | | | $ | 356 | | | $ | — | | | $ | 2 | |
| | | | | | | | | | | | | | | | | | | | | | | | |
| | | | | | | | | | | | | | | | | | | | | | | | |
| | | | | | | | | | | | | | | | | | | | | | | | |
| Other mortgage-related | | 260 | | | 3 | | | 1 | | | — | | | — | | | — | | | (28) | | | (1) | | | — | | | 235 | | | — | | | 1 | |
Total available-for-sale securities | | $ | 622 | | | $ | 4 | | (6)(7) | $ | 3 | | | $ | — | | | $ | — | | | $ | — | | | $ | (37) | | | $ | (1) | | | $ | — | | | $ | 591 | | | $ | — | | | $ | 3 | |
| | | | | | | | | | | | | | | | | | | | | | | | |
Mortgage loans | | $ | 526 | | | $ | (4) | | (5)(6) | $ | — | | | $ | — | | | $ | — | | | $ | — | | | $ | (20) | | | $ | (6) | | | $ | 14 | | | $ | 510 | | | $ | (5) | | | $ | — | |
| | | | | | | | | | | | | | | | | | | | | | | | |
| Net derivatives | | (38) | | | 38 | | (5) | — | | | — | | | — | | | — | | | 12 | | | — | | | — | | | 12 | | | 51 | | | — | |
| | | | | | | | | | | | | | | | | | | | | | | | |
| Long-term debt: | | | | | | | | | | | | | | | | | | | | | | | | |
Of Fannie Mae | | $ | (250) | | | $ | (6) | | (5) | $ | — | | | $ | — | | | $ | — | | | $ | — | | | $ | — | | | $ | — | | | $ | — | | | $ | (256) | | | $ | (6) | | | $ | — | |
Of consolidated trusts | | (133) | | | 2 | | (5)(6) | — | | | — | | | — | | | — | | | 6 | | | — | | | — | | | (125) | | | 2 | | | — | |
Total long-term debt | | $ | (383) | | | $ | (4) | | | $ | — | | | $ | — | | | $ | — | | | $ | — | | | $ | 6 | | | $ | — | | | $ | — | | | $ | (381) | | | $ | (4) | | | $ | — | |
| | | | | | | | | | | | | | | | | | | | | | | | |
| | | | | | | | |
| Fannie Mae (In conservatorship) Second Quarter 2024 Form 10-Q | 105 |
| | | | | | | | |
| Notes to Condensed Consolidated Financial Statements | Fair Value |
| | | | | | | | | | | | | | | | | | | | | | | | | | | | | | | | | | | | | | | | | | | | | | | | | | | | | | | | | | | | | | | | | | | | | | | | | | |
| | Fair Value Measurements Using Significant Unobservable Inputs (Level 3) |
| | For the Six Months Ended June 30, 2023 |
| | | | Total Gains (Losses) (Realized/Unrealized) | | | | | | | | | | | | | | | | Net Unrealized Gains (Losses) Included in Net Income Related to Assets and Liabilities Still Held as of June 30, 2023(4)(5) | | Net Unrealized Gains (Losses) Included in OCI Related to Assets and Liabilities Still Held as of June 30, 2023(1) |
| | Balance, December 31, 2022 | | Included in Net Income | | Included in Total OCI (Loss)(1) | | Purchases(2) | | Sales(2) | | Issues(3) | | Settlements(3) | | Transfers out of Level 3 | | Transfers into
Level 3 | | Balance, June 30, 2023 | |
| | (Dollars in millions) |
| Trading securities: | | | | | | | | | | | | | | | | | | | | | | | | |
| | | | | | | | | | | | | | | | | | | | | | | | |
| | | | | | | | | | | | | | | | | | | | | | | | |
| | | | | | | | | | | | | | | | | | | | | | | | |
| | | | | | | | | | | | | | | | | | | | | | | | |
| Mortgage-related | | $ | 47 | | | $ | (8) | | (5)(6) | $ | — | | | $ | — | | | $ | — | | | $ | — | | | $ | — | | | $ | (11) | | | $ | — | | | $ | 28 | | | $ | (5) | | | $ | — | |
| | | | | | | | | | | | | | | | | | | | | | | | |
| | | | | | | | | | | | | | | | | | | | | | | | |
Available-for-sale securities: | | | | | | | | | | | | | | | | | | | | | | | | |
| | | | | | | | | | | | | | | | | | | | | | | | |
| | | | | | | | | | | | | | | | | | | | | | | | |
Agency | | $ | 371 | | | $ | 1 | | | $ | 1 | | | $ | — | | | $ | — | | | $ | — | | | $ | (17) | | | $ | — | | | $ | — | | | $ | 356 | | | $ | — | | | $ | 1 | |
| | | | | | | | | | | | | | | | | | | | | | | | |
| | | | | | | | | | | | | | | | | | | | | | | | |
| | | | | | | | | | | | | | | | | | | | | | | | |
| Other mortgage-related | | 263 | | | 5 | | | 5 | | | — | | | — | | | — | | | (38) | | | (1) | | | 1 | | | 235 | | | — | | | 3 | |
Total available-for-sale securities | | $ | 634 | | | $ | 6 | | (6)(7) | $ | 6 | | | $ | — | | | $ | — | | | $ | — | | | $ | (55) | | | $ | (1) | | | $ | 1 | | | $ | 591 | | | $ | — | | | $ | 4 | |
| | | | | | | | | | | | | | | | | | | | | | | | |
Mortgage loans | | $ | 543 | | | $ | 3 | | (5)(6) | $ | — | | | $ | — | | | $ | — | | | $ | — | | | $ | (45) | | | $ | (15) | | | $ | 24 | | | $ | 510 | | | $ | 1 | | | $ | — | |
| | | | | | | | | | | | | | | | | | | | | | | | |
| Net derivatives | | (37) | | | 32 | | (5) | — | | | — | | | — | | | — | | | 17 | | | — | | | — | | | 12 | | | 49 | | | — | |
| | | | | | | | | | | | | | | | | | | | | | | | |
| Long-term debt: | | | | | | | | | | | | | | | | | | | | | | | | |
Of Fannie Mae | | $ | (242) | | | $ | (14) | | (5) | $ | — | | | $ | — | | | $ | — | | | $ | — | | | $ | — | | | $ | — | | | $ | — | | | $ | (256) | | | $ | (14) | | | $ | — | |
Of consolidated trusts | | (136) | | | — | | (5)(6) | — | | | — | | | — | | | — | | | 11 | | | — | | | — | | | (125) | | | — | | | — | |
Total long-term debt | | $ | (378) | | | $ | (14) | | | $ | — | | | $ | — | | | $ | — | | | $ | — | | | $ | 11 | | | $ | — | | | $ | — | | | $ | (381) | | | $ | (14) | | | $ | — | |
(1)Gains (losses) are included in “Other comprehensive income (loss)” in our condensed consolidated statements of operations and comprehensive income.
(2)Purchases and sales include activity related to the consolidation and deconsolidation of assets of securitization trusts.
(3)Issues and settlements include activity related to the consolidation and deconsolidation of liabilities of securitization trusts.
(4)Amount represents temporary changes in fair value. Amortization, accretion and the impairment of credit losses are not considered unrealized and are not included in this amount.
(5)Gains (losses) are included in “Fair value gains (losses), net” in our condensed consolidated statements of operations and comprehensive income.
(6)Gains (losses) included in “Net interest income” in our condensed consolidated statements of operations and comprehensive income includes amortization of cost basis adjustments.
(7)Gains (losses) are included in “Investment gains (losses), net” in our condensed consolidated statements of operations and comprehensive income.
| | | | | | | | |
| Fannie Mae (In conservatorship) Second Quarter 2024 Form 10-Q | 106 |
| | | | | | | | |
| Notes to Condensed Consolidated Financial Statements | Fair Value |
The following tables display valuation techniques and the range and the weighted average of significant unobservable inputs for our Level 3 assets and liabilities measured at fair value on a recurring basis, excluding instruments for which we have elected the fair value option. Changes in these unobservable inputs can result in significantly higher or lower fair value measurements of these assets and liabilities as of the reporting date.
| | | | | | | | | | | | | | | | | | | | | | | | | | | | | | | | | | | | | | |
| | Fair Value Measurements as of June 30, 2024 |
| | Fair Value | | Significant Valuation Techniques | | Significant Unobservable Inputs(1) | | Range(1) | | Weighted - Average(1)(2) |
| | (Dollars in millions) |
Recurring fair value measurements: | | | | | | | | | | | | |
| Trading securities: | | | | | | | | | | | | |
| | | | | | | | | | | | |
| | | | | | | | | | | | |
| | | | | | | | | | | | |
Mortgage-related(3) | | $ | 32 | | | Various | | | | | | | | |
| | | | | | | | | | | | |
| | | | | | | | | | | | |
| Available-for-sale securities: | | | | | | | | | | | | |
| | | | | | | | | | | | |
Agency(3) | | 315 | | | Consensus | | | | | | | | |
| | | | | | | | | | | | |
| | | | | | | | | | | | |
| | | | | | | | | | | | |
| | | | | | | | | | | | |
| | | | | | | | | | | | |
| | | | | | | | | | | | |
| | | | | | | | | | | | |
| | | | | | | | | | | | |
| | | | | | | | | | | | |
| Other mortgage-related | | 52 | | | Discounted Cash Flow | | Spreads (bps) | | 478.0 | | - | 508.0 | | 492.5 |
| | 2 | | | Single Vendor | | | | | | | | |
| | 92 | | | Various | | | | | | | | |
Total other mortgage-related | | 146 | | | | | | | | | | | |
| Total available-for-sale securities | | $ | 461 | | | | | | | | | | | |
| | | | | | | | | | | | |
| Net derivatives | | $ | 43 | | | Dealer Mark | | | | | | | | |
| | 51 | | | Discounted Cash Flow | | | | | | | | |
| Total net derivatives | | $ | 94 | | | | | | | | | | | |
| | | | | | | | | | | | | | | | | | | | | | | | | | | | | | | | | | | | | | |
| | Fair Value Measurements as of December 31, 2023 |
| | Fair Value | | Significant Valuation Techniques | | Significant Unobservable Inputs(1) | | Range(1) | | Weighted - Average(1)(2) |
| | (Dollars in millions) |
Recurring fair value measurements: | | | | | | | | | | | | |
| Trading securities: | | | | | | | | | | | | |
| | | | | | | | | | | | |
| | | | | | | | | | | | |
Mortgage-related(3) | | $ | 26 | | | Various | | | | | | | | |
| | | | | | | | | | | | |
| Available-for-sale securities: | | | | | | | | | | | | |
| | | | | | | | | | | | |
Agency(3) | | 331 | | | Consensus | | | | | | | | |
| | | | | | | | | | | | |
| | | | | | | | | | | | |
| | | | | | | | | | | | |
| | | | | | | | | | | | |
| | | | | | | | | | | | |
| | | | | | | | | | | | |
| | | | | | | | | | | | |
| | | | | | | | | | | | |
| | | | | | | | | | | | |
| | | | | | | | | | | | |
| | | | | | | | | | | | |
| | | | | | | | | | | | |
| | | | | | | | | | | | |
| Other mortgage-related | | 74 | | | Discounted Cash Flow | | Spreads (bps) | | 530.0 | | - | 560.0 | | 544.8 |
| | 9 | | | Single Vendor | | | | | | | | |
| | 100 | | | Various | | | | | | | | |
Total other mortgage-related | | 183 | | | | | | | | | | | |
| Total available-for-sale securities | | $ | 514 | | | | | | | | | | | |
| | | | | | | | | | | | |
| Net derivatives | | $ | 45 | | | Dealer Mark | | | | | | | | |
| | 32 | | | Discounted Cash Flow | | | | | | | | |
| Total net derivatives | | $ | 77 | | | | | | | | | | | |
(1)Valuation techniques for which no unobservable inputs are disclosed generally reflect the use of third-party pricing services or dealers, and the range of unobservable inputs applied by these sources is not readily available or cannot be reasonably estimated. Where we have disclosed unobservable inputs for consensus and single vendor techniques, those inputs are based on our validations performed at the security level using discounted cash flows.
(2)Unobservable inputs were weighted by the relative fair value of the instruments.
(3)Includes Fannie Mae and Freddie Mac securities.
In our condensed consolidated balance sheets, certain assets and liabilities are measured at fair value on a nonrecurring basis; that is, the instruments are not measured at fair value on an ongoing basis but are subject to fair value adjustments in certain circumstances (for example, when we evaluate loans for impairment). We held no Level 1 assets or liabilities that were measured at fair value on a nonrecurring basis as of June 30, 2024 or December 31, 2023. We held $35 million and $42 million in Level 2 assets as of June 30, 2024 and December 31, 2023, respectively, composed of mortgage loans held for sale that were impaired. We held no Level 2 or Level 3 liabilities that were measured at fair value on a nonrecurring basis as of June 30, 2024 or December 31, 2023.
| | | | | | | | |
| Fannie Mae (In conservatorship) Second Quarter 2024 Form 10-Q | 107 |
| | | | | | | | |
| Notes to Condensed Consolidated Financial Statements | Fair Value |
The following table displays valuation techniques for our Level 3 assets measured at fair value on a nonrecurring basis.
| | | | | | | | | | | | | | | | | | | | |
| | | | Fair Value Measurements as of |
| | Valuation Techniques | | June 30, 2024 | | December 31, 2023 |
| | | | (Dollars in millions) |
| Nonrecurring fair value measurements: | | | | | | |
Mortgage loans:(1) | | | | | | |
| Mortgage loans held for sale, at lower of cost or fair value | | Consensus | | $ | 208 | | | $ | 1,994 | |
| | | | | | |
| | | | | | |
| | | | | | |
| | | | | | |
Single-family mortgage loans held for investment, at amortized cost | | Internal Model | | 330 | | | 407 | |
| | | | | | |
| | | | | | |
Multifamily mortgage loans held for investment, at amortized cost | | Appraisal | | 187 | | | 33 | |
| | | | | | |
| | Broker Price Opinion | | 488 | | | 769 | |
| | Internal Model | | 207 | | | 218 | |
Total multifamily mortgage loans held for investment, at amortized cost | | | | 882 | | | 1,020 | |
| | | | | | |
| Acquired property, net: | | | | | | |
| Single-family | | Accepted Offer | | 28 | | | 23 | |
| | Appraisal | | 53 | | | 43 | |
| | Internal Model | | 249 | | | 230 | |
| | Walk Forward | | 71 | | | 75 | |
| | Various | | 5 | | | 19 | |
| Total single-family | | | | 406 | | | 390 | |
| | | | | | |
| Multifamily | | Various | | 22 | | | 182 | |
| | | | | | |
| Total nonrecurring assets at fair value | | | | $ | 1,848 | | | $ | 3,993 | |
(1)When we measure impairment, including recoveries, based on the fair value of the loan or the underlying collateral and impairment is recorded on any component of the mortgage loan, including accrued interest receivable and amounts due from the borrower for advances of taxes and insurance, we present the entire fair value measurement amount with the corresponding mortgage loan.
| | | | | | | | |
| Fannie Mae (In conservatorship) Second Quarter 2024 Form 10-Q | 108 |
| | | | | | | | |
| Notes to Condensed Consolidated Financial Statements | Fair Value |
Fair Value of Financial Instruments
The following table displays the carrying value and estimated fair value of our financial instruments. The fair value of financial instruments we disclose includes commitments to purchase multifamily and single-family mortgage loans that we do not record in our condensed consolidated balance sheets. The fair values of these commitments are included as “Mortgage loans held for investment, net of allowance for loan losses.” The disclosure excludes all non-financial instruments; therefore, the fair value of our financial assets and liabilities does not represent the underlying fair value of our total consolidated assets and liabilities.
| | | | | | | | | | | | | | | | | | | | | | | | | | | | | | | | | | | | | | | | | | | | |
| | As of June 30, 2024 |
| | Carrying Value | | | Quoted Prices in Active Markets for Identical Assets (Level 1) | | Significant Other Observable Inputs (Level 2) | | | | Significant Unobservable Inputs
(Level 3) | | | | Netting Adjustment | | Estimated Fair Value |
| | (Dollars in millions) |
| Financial assets: | | | | | | | | | | | | | | | | | | |
Cash and cash equivalents, including restricted cash and cash equivalents | | $ | 78,313 | | | | $ | 35,763 | | | | $ | 42,550 | | | | | $ | — | | | | | $ | — | | | $ | 78,313 | |
| Securities purchased under agreements to resell | | 27,650 | | | | — | | | | 27,650 | | | | | — | | | | | — | | | 27,650 | |
| Trading securities | | 49,392 | | | | 48,045 | | | | 1,315 | | | | | 32 | | | | | — | | | 49,392 | |
| Available-for-sale securities | | 507 | | | | — | | | | 46 | | | | | 461 | | | | | — | | | 507 | |
| Mortgage loans held for sale | | 646 | | | | — | | | | 79 | | | | | 618 | | | | | — | | | 697 | |
Mortgage loans held for investment, net of allowance for loan losses | | 4,128,568 | | | | — | | | | 3,493,410 | | | | | 127,303 | | | | | — | | | 3,620,713 | |
| Advances to lenders | | 1,856 | | | | — | | | | 1,856 | | | | | — | | | | | — | | | 1,856 | |
| Derivative assets at fair value | | 219 | | | | — | | | | 400 | | | | | 109 | | | | | (290) | | | 219 | |
| Guaranty assets and buy-ups | | 69 | | | | — | | | | — | | | | | 151 | | | | | — | | | 151 | |
| Total financial assets | | $ | 4,287,220 | | | | $ | 83,808 | | | | $ | 3,567,306 | | | | | $ | 128,674 | | | | | $ | (290) | | | $ | 3,779,498 | |
| | | | | | | | | | | | | | | | | | |
| Financial liabilities: | | | | | | | | | | | | | | | | | | |
| | | | | | | | | | | | | | | | | | |
| Short-term debt: | | | | | | | | | | | | | | | | | | |
| Of Fannie Mae | | $ | 12,008 | | | | $ | — | | | | $ | 12,007 | | | | | $ | — | | | | | $ | — | | | $ | 12,007 | |
| | | | | | | | | | | | | | | | | | |
| Long-term debt: | | | | | | | | | | | | | | | | | | |
| Of Fannie Mae | | 106,535 | | | | — | | | | 106,618 | | | | | 631 | | | | | — | | | 107,249 | |
| Of consolidated trusts | | 4,094,421 | | | | — | | | | 3,553,827 | | | | | 279 | | | | | — | | | 3,554,106 | |
| Derivative liabilities at fair value | | 81 | | | | — | | | | 3,092 | | | | | 15 | | | | | (3,026) | | | 81 | |
| Guaranty obligations | | 75 | | | | — | | | | — | | | | | 59 | | | | | — | | | 59 | |
| Total financial liabilities | | $ | 4,213,120 | | | | $ | — | | | | $ | 3,675,544 | | | | | $ | 984 | | | | | $ | (3,026) | | | $ | 3,673,502 | |
| | | | | | | | |
| Fannie Mae (In conservatorship) Second Quarter 2024 Form 10-Q | 109 |
| | | | | | | | |
| Notes to Condensed Consolidated Financial Statements | Fair Value |
| | | | | | | | | | | | | | | | | | | | | | | | | | | | | | | | | | | | | | | | | | | | |
| | As of December 31, 2023 |
| | Carrying Value | | | Quoted Prices in Active Markets for Identical Assets (Level 1) | | Significant Other Observable Inputs (Level 2) | | | | Significant Unobservable Inputs
(Level 3) | | Netting Adjustment | | Estimated Fair Value |
| | (Dollars in millions) |
| Financial assets: | | | | | | | | | | | | | | | | | | |
| Cash and cash equivalents, including restricted cash and cash equivalents | | $ | 68,706 | | | | $ | 33,981 | | | | $ | 34,725 | | | | | $ | — | | | | | $ | — | | | $ | 68,706 | |
| Securities purchased under agreements to resell | | 30,700 | | | | — | | | | 30,700 | | | | | — | | | | | — | | | 30,700 | |
| Trading securities | | 52,552 | | | | 47,764 | | | | 4,762 | | | | | 26 | | | | | — | | | 52,552 | |
| Available-for-sale securities | | 564 | | | | — | | | | 50 | | | | | 514 | | | | | — | | | 564 | |
| Mortgage loans held for sale | | 2,149 | | | | — | | | | 93 | | | | | 2,196 | | | | | — | | | 2,289 | |
Mortgage loans held for investment, net of allowance for loan losses | | 4,133,482 | | | | — | | | | 3,571,555 | | | | | 130,022 | | | | | — | | | 3,701,577 | |
| Advances to lenders | | 1,389 | | | | — | | | | 1,389 | | | | | — | | | | | — | | | 1,389 | |
| Derivative assets at fair value | | 202 | | | | — | | | | 395 | | | | | 90 | | | | | (283) | | | 202 | |
| Guaranty assets and buy-ups | | 73 | | | | — | | | | — | | | | | 155 | | | | | — | | | 155 | |
| Total financial assets | | $ | 4,289,817 | | | | $ | 81,745 | | | | $ | 3,643,669 | | | | | $ | 133,003 | | | | | $ | (283) | | | $ | 3,858,134 | |
| | | | | | | | | | | | | | | | | | |
| Financial liabilities: | | | | | | | | | | | | | | | | | | |
| | | | | | | | | | | | | | | | | | |
| Short-term debt: | | | | | | | | | | | | | | | | | | |
| Of Fannie Mae | | $ | 17,314 | | | | $ | — | | | | $ | 17,317 | | | | | $ | — | | | | | $ | — | | | $ | 17,317 | |
| | | | | | | | | | | | | | | | | | |
| Long-term debt: | | | | | | | | | | | | | | | | | | |
| Of Fannie Mae | | 106,751 | | | | — | | | | 106,701 | | | | | 605 | | | | | — | | | 107,306 | |
| Of consolidated trusts | | 4,098,653 | | | | — | | | | 3,633,157 | | | | | 293 | | | | | — | | | 3,633,450 | |
| Derivative liabilities at fair value | | 140 | | | | — | | | | 3,327 | | | | | 13 | | | | | (3,200) | | | 140 | |
| Guaranty obligations | | 79 | | | | — | | | | — | | | | | 65 | | | | | — | | | 65 | |
| Total financial liabilities | | $ | 4,222,937 | | | | $ | — | | | | $ | 3,760,502 | | | | | $ | 976 | | | | | $ | (3,200) | | | $ | 3,758,278 | |
For a detailed description and classification of our financial instruments, see “Note 16, Fair Value” in our 2023 Form 10-K.
Fair Value Option
We generally elect the fair value option on a financial instrument when the accounting guidance would otherwise require us to separately account for a derivative that is embedded in an instrument at fair value. Under the fair value option, we carry this type of instrument, in its entirety, at fair value instead of separately accounting for the derivative.
Interest income for the mortgage loans is recorded in “Interest income: Mortgage loans” and interest expense for the debt instruments is recorded in “Interest expense: Long-term debt” in our condensed consolidated statements of operations and comprehensive income.
| | | | | | | | |
| Fannie Mae (In conservatorship) Second Quarter 2024 Form 10-Q | 110 |
| | | | | | | | |
| Notes to Condensed Consolidated Financial Statements | Fair Value |
The following table displays the fair value and unpaid principal balance of the financial instruments for which we have elected the fair value option.
| | | | | | | | | | | | | | | | | | | | | | | | | | | | | | | | | | | | | | | | | | | | | | | | | | | | | | | | | | | | | | | | | | | | | | | |
| As of |
| June 30, 2024 | | December 31, 2023 |
| Loans(1) | | Long-Term Debt of Fannie Mae | | Long-Term Debt of Consolidated Trusts | | Loans(1) | | Long-Term Debt of Fannie Mae | | Long-Term Debt of Consolidated Trusts |
| (Dollars in millions) |
| Fair value | | $ | 3,194 | | | | | $ | 544 | | | | | $ | 13,239 | | | | | $ | 3,315 | | | | | $ | 761 | | | | | $ | 14,343 | | |
| Unpaid principal balance | | 3,402 | | | | | 517 | | | | | 13,528 | | | | | 3,442 | | | | | 731 | | | | | 14,383 | | |
(1)Includes nonaccrual loans with a fair value of $28 million and $32 million as of June 30, 2024 and December 31, 2023, respectively. Includes loans that are 90 days or more past due with a fair value of $24 million and $31 million as of June 30, 2024 and December 31, 2023, respectively.
Changes in Fair Value under the Fair Value Option Election
We recorded losses of $2 million and $47 million for the three and six months ended June 30, 2024, respectively, and losses of $49 million and $22 million for the three and six months ended June 30, 2023, respectively, from changes in the fair value of loans recorded at fair value in “Fair value gains (losses), net” in our condensed consolidated statements of operations and comprehensive income.
We recorded gains of $17 million and $128 million for the three and six months ended June 30, 2024, respectively, and gains of $219 million and losses of $50 million for the three and six months ended June 30, 2023, respectively, from changes in the fair value of long-term debt recorded at fair value in “Fair value gains (losses), net” in our condensed consolidated statements of operations and comprehensive income.
14. Commitments and Contingencies
We are party to various types of legal actions and proceedings, including actions brought on behalf of various classes of claimants. We also are subject to regulatory examinations, inquiries and investigations, and other information gathering requests. In some of the matters, indeterminate amounts are sought. Modern pleading practice in the U.S. permits considerable variation in the assertion of monetary damages or other relief. Jurisdictions may permit claimants not to specify the monetary damages sought or may permit claimants to state only that the amount sought is sufficient to invoke the jurisdiction of the trial court. This variability in pleadings, together with our and our counsel’s actual experience in litigating or settling claims, leads us to conclude that the monetary relief that may be sought by plaintiffs bears little relevance to the merits or disposition value of claims.
Legal actions and proceedings of all types are subject to many uncertain factors that generally cannot be predicted with assurance. Accordingly, the outcome of any given matter and the amount or range of potential loss at particular points in time is frequently difficult to ascertain. Uncertainties can include how fact finders will evaluate documentary evidence and the credibility and effectiveness of witness testimony, and how the court will apply the law. Disposition valuations are also subject to the uncertainty of how opposing parties and their counsel may view the evidence and applicable law.
On a quarterly basis, we review relevant information about pending legal actions and proceedings for the purpose of evaluating and revising our contingencies, accruals and disclosures. We establish an accrual only for matters when the likelihood of a loss is probable and we can reasonably estimate the amount of such loss. We are often unable to estimate the possible losses or ranges of losses, particularly for proceedings that are in their early stages of development, where plaintiffs seek indeterminate or unspecified damages, where there may be novel or unsettled legal questions relevant to the proceedings, or where settlement negotiations have not occurred or progressed. Given the uncertainties involved in any action or proceeding, regardless of whether we have established an accrual, the ultimate resolution of certain of these matters may be material to our operating results for a particular period, depending on, among other factors, the size of the loss or liability imposed and the level of our net income or loss for that period.
In addition to the matters specifically described below, we are involved in a number of legal and regulatory proceedings that arise in the ordinary course of business that we do not expect will have a material impact on our business or financial condition.
Senior Preferred Stock Purchase Agreements Litigation
A consolidated class action (“In re Fannie Mae/Freddie Mac Senior Preferred Stock Purchase Agreement Class Action Litigations”) and a non-class action lawsuit, Fairholme Funds v. FHFA, filed by Fannie Mae and Freddie Mac stockholders against us, FHFA as our conservator, and Freddie Mac were filed in the U.S. District Court for the District
| | | | | | | | |
| Fannie Mae (In conservatorship) Second Quarter 2024 Form 10-Q | 111 |
| | | | | | | | |
| Notes to Condensed Consolidated Financial Statements | Commitments and Contingencies |
of Columbia. The lawsuits challenge the August 2012 amendment to each company’s senior preferred stock purchase agreement with Treasury.
Plaintiffs in these lawsuits allege that the net worth sweep dividend provisions of the senior preferred stock that were implemented pursuant to the August 2012 amendments nullified certain of the stockholders’ rights and caused them harm. Plaintiffs in the class action represent a class of Fannie Mae preferred stockholders and classes of Freddie Mac common and preferred stockholders. The cases were tried before a jury at a trial that commenced on July 24, 2023. On August 14, 2023, the jury returned a verdict for the plaintiffs and awarded damages of $299.4 million to Fannie Mae preferred stockholders. On October 24, 2023, the court held that these stockholders were entitled to receive prejudgment interest on the damage award. On March 20, 2024, the court entered final judgment and set the amount of prejudgment interest owed by Fannie Mae at $199.7 million. On April 17, 2024, the defendants filed a motion for judgment as a matter of law, which has been fully briefed. The parties will have 30 days to appeal following the court’s decision on the motion. Until the motion and any subsequent appeals are resolved and any final judgment amount has been paid, post-judgment interest on the damages and prejudgment interest awards will accrue at a rate of 5.01%, starting on March 20, 2024, to be computed daily and compounded annually. We recognized $495 million in 2023 related to the jury verdict and estimated prejudgment interest through December 31, 2023 in “Other expenses, net.” We recognized an additional $6 million and $11 million of expense for the three and six months ended June 30, 2024, respectively, related to the prejudgment and post-judgment interest.
15. Regulatory Capital Requirements
The enterprise regulatory capital framework went into effect in February 2021; however, we are not required to hold capital according to the framework’s requirements until the date of termination of our conservatorship, or such later date as may be ordered by FHFA. The table below sets forth information about our capital requirements under the standardized approach of the enterprise regulatory capital framework.
| | | | | | | | | | | | | | | | | | | | | | | | | | | | | | | | | | | | | | |
Capital Metrics under the Enterprise Regulatory Capital Framework as of June 30, 2024(1) |
| (Dollars in billions) |
| Adjusted total assets | $ | 4,439 | | | | | | | | | |
| Risk-weighted assets | 1,275 | | | | | | | | | | | |
| | | | | | | | | | | | |
| | Amounts | | Ratios |
| | Available Capital (Deficit)(2) | | Minimum Capital Requirement | | Total Capital Requirement (including Buffers)(3) | | Available Capital (Deficit) Ratio(4) | | Minimum Capital Ratio Requirement | | Total Capital Requirement Ratio (including Buffers) |
| Risk-based capital: | | | | | | | | | | | |
| Total capital (statutory)(5) | $ | (26) | | | $ | 102 | | | $ | 102 | | | (2.0) | % | | 8.0 | % | | 8.0 | % |
| Common equity tier 1 capital | (65) | | | 57 | | | 139 | | | (5.1) | | | 4.5 | | | 10.9 | |
| Tier 1 capital | (45) | | | 77 | | | 159 | | | (3.5) | | | 6.0 | | | 12.5 | |
| Adjusted total capital | (45) | | | 102 | | | 184 | | | (3.5) | | | 8.0 | | | 14.4 | |
| Leverage capital: | | | | | | | | | | | |
| Core capital (statutory)(6) | (34) | | | 111 | | | 111 | | | (0.8) | | | 2.5 | | | 2.5 | |
| Tier 1 capital | (45) | | | 111 | | | 135 | | | (1.0) | | | 2.5 | | | 3.0 | |
| | | | | | | | |
| Fannie Mae (In conservatorship) Second Quarter 2024 Form 10-Q | 112 |
| | | | | | | | |
| Notes to Condensed Consolidated Financial Statements | Regulatory Capital Requirements |
| | | | | | | | | | | | | | | | | | | | | | | | | | | | | | | | | | | | | | |
Capital Metrics under the Enterprise Regulatory Capital Framework as of December 31, 2023(1) |
| (Dollars in billions) |
| Adjusted total assets | $ | 4,552 | | | | | | | | | |
| Risk-weighted assets | 1,357 | | | | | | | | | | | |
| | | | | | | | | | | | |
| | Amounts | | Ratios |
| | Available Capital (Deficit)(2) | | Minimum Capital Requirement | | Total Capital Requirement (including Buffers)(3) | | Available Capital (Deficit) Ratio(4) | | Minimum Capital Ratio Requirement | | Total Capital Requirement Ratio (including Buffers) |
| Risk-based capital: | | | | | | | | | | | |
| Total capital (statutory)(5) | $ | (34) | | | $ | 109 | | | $ | 109 | | | (2.5) | % | | 8.0 | % | | 8.0 | % |
| Common equity tier 1 capital | (74) | | | 61 | | | 140 | | | (5.5) | | | 4.5 | | | 10.3 | |
| Tier 1 capital | (55) | | | 81 | | | 160 | | | (4.1) | | | 6.0 | | | 11.8 | |
| Adjusted total capital | (55) | | | 109 | | | 188 | | | (4.1) | | | 8.0 | | | 13.9 | |
| Leverage capital: | | | | | | | | | | | |
| Core capital (statutory)(6) | (43) | | | 114 | | | 114 | | | (0.9) | | | 2.5 | | | 2.5 | |
| Tier 1 capital | (55) | | | 114 | | | 137 | | | (1.2) | | | 2.5 | | | 3.0 | |
(1)Ratios are calculated as a percentage of risk-weighted assets for risk-based capital metrics and as a percentage of adjusted total assets for leverage capital metrics.
(2)Available capital (deficit) for all line items excludes the stated value of the senior preferred stock ($120.8 billion). Available capital (deficit) for all line items except total capital and core capital also deducts a portion of deferred tax assets. Deferred tax assets arising from temporary differences between GAAP and tax requirements are deducted from capital to the extent they exceed 10% of common equity. As of June 30, 2024 and December 31, 2023, this resulted in the full deduction of deferred tax assets ($11.0 billion and $11.7 billion, respectively) from our available capital (deficit). Available capital (deficit) for common equity tier 1 capital also excludes the value of the perpetual, non-cumulative preferred stock ($19.1 billion) as of June 30, 2024 and December 31, 2023.
(3)The prescribed capital buffers represent the amount of capital we are required to hold above the minimum risk-based and leverage capital requirements. The applicable buffer for risk-based common equity tier 1 capital, tier 1 capital, and adjusted total capital is the PCCBA, which is composed of a stress capital buffer, a stability capital buffer, and a countercyclical capital buffer. The PCCBA must be comprised entirely of common equity tier 1 capital. The applicable buffer for leverage tier 1 capital is the PLBA. The stress capital buffer and countercyclical capital buffer are each calculated by multiplying prescribed factors by adjusted total assets as of the last day of the previous calendar quarter. The stability capital buffer is based on our share of mortgage debt outstanding. The prescribed leverage buffer for June 30, 2024 and December 31, 2023 was set at 50% of the June 30, 2024 and December 31, 2023 stability capital buffer, respectively.
(4)Ratios are negative because we had a deficit in available capital for each tier of capital.
(5)The sum of (a) core capital (see definition in footnote 6 below); and (b) a general allowance for foreclosure losses, which (i) shall include an allowance for portfolio mortgage losses, an allowance for non-reimbursable foreclosure costs on government claims, and an allowance for liabilities reflected on the balance sheet for estimated foreclosure losses on mortgage-backed securities; and (ii) shall not include any reserves made or held against specific assets; and (c) any other amounts from sources of funds available to absorb losses that the Director of FHFA by regulation determines are appropriate to include in determining total capital.
(6)The sum of (a) the stated value of our outstanding common stock (common stock less treasury stock); (b) the stated value of our outstanding perpetual, noncumulative preferred stock; (c) our paid-in capital; and (d) our retained earnings (accumulated deficit). Core capital does not include: (a) accumulated other comprehensive income or (b) senior preferred stock.
| | | | | | | | |
| Fannie Mae (In conservatorship) Second Quarter 2024 Form 10-Q | 113 |
| | | | | | | | |
| Quantitative and Qualitative Disclosures about Market Risk |
Item 3. Quantitative and Qualitative Disclosures about Market Risk
Information about market risk is set forth in “MD&A—Risk Management—Market Risk Management, including Interest-Rate Risk Management.”
Item 4. Controls and Procedures
Overview
We are required under applicable laws and regulations to maintain controls and procedures, which include disclosure controls and procedures as well as internal control over financial reporting, as further described below.
Evaluation of Disclosure Controls and Procedures
Disclosure Controls and Procedures
Disclosure controls and procedures refer to controls and other procedures designed to provide reasonable assurance that information required to be disclosed in the reports we file or submit under the Exchange Act is recorded, processed, summarized and reported within the time periods specified in the SEC’s rules and forms. Disclosure controls and procedures include, without limitation, controls and procedures designed to provide reasonable assurance that information required to be disclosed by us in the reports that we file or submit under the Exchange Act is accumulated and communicated to management, including our Chief Executive Officer and Chief Financial Officer, as appropriate, to allow timely decisions regarding our required disclosure. In designing and evaluating our disclosure controls and procedures, management recognizes that any controls and procedures, no matter how well designed and operated, can provide only reasonable assurance of achieving the desired control objectives, and management was required to apply its judgment in evaluating and implementing possible controls and procedures.
Evaluation of Disclosure Controls and Procedures
As required by Rule 13a-15 under the Exchange Act, management has evaluated, with the participation of our Chief Executive Officer and Chief Financial Officer, the effectiveness of our disclosure controls and procedures in effect as of June 30, 2024, the end of the period covered by this report. As a result of management’s evaluation, our Chief Executive Officer and Chief Financial Officer concluded that our disclosure controls and procedures were not effective at a reasonable assurance level as of June 30, 2024, or as of the date of filing this report.
Our disclosure controls and procedures were not effective as of June 30, 2024, or as of the date of filing this report because they did not adequately ensure the accumulation and communication to management of information known to FHFA that is needed to meet our disclosure obligations under the federal securities laws. As a result, we were not able to rely upon the disclosure controls and procedures that were in place as of June 30, 2024, or as of the date of this filing, and we continue to have a material weakness in our internal control over financial reporting. This material weakness is described in more detail below under “Description of Material Weakness.” Based on discussions with FHFA and the structural nature of this material weakness, we do not expect to remediate this material weakness while we are under conservatorship.
Description of Material Weakness
The Public Company Accounting Oversight Board’s Auditing Standard 2201 defines a material weakness as a deficiency, or a combination of deficiencies, in internal control over financial reporting such that there is a reasonable possibility that a material misstatement of the company’s annual or interim financial statements will not be prevented or detected on a timely basis.
Management has determined that we continued to have the following material weakness as of June 30, 2024, and as of the date of filing this report:
•Disclosure Controls and Procedures. We have been under the conservatorship of FHFA since September 2008. Under the GSE Act, FHFA is an independent agency that currently functions as both our conservator and our regulator with respect to our safety, soundness, and mission. Because of the nature of the conservatorship under the GSE Act, which places us under the “control” of FHFA (as that term is defined by securities laws), some of the information that we may need to meet our disclosure obligations may be solely within the knowledge of FHFA. As our conservator, FHFA has the power to take actions without our knowledge that could be material to our stockholders and other stakeholders, and could significantly affect our financial performance or our continued existence as an ongoing business. Although we and FHFA attempted to design and implement
| | | | | | | | |
| Fannie Mae Second Quarter 2024 Form 10-Q | 114 |
disclosure policies and procedures that would account for the conservatorship and accomplish the same objectives as a disclosure controls and procedures policy of a typical reporting company, there are inherent structural limitations on our ability to design, implement, operate, and test effective disclosure controls and procedures. As both our regulator and our conservator under the GSE Act, FHFA is limited in its ability to design and implement a complete set of disclosure controls and procedures relating to Fannie Mae, particularly with respect to current reporting pursuant to Form 8-K. Similarly, as a regulated entity, we are limited in our ability to design, implement, operate, and test the controls and procedures for which FHFA is responsible.
Due to these circumstances, we have not been able to update our disclosure controls and procedures in a manner that adequately ensures the accumulation and communication to management of information known to FHFA that is needed to meet our disclosure obligations under the federal securities laws, including disclosures affecting our condensed consolidated financial statements. As a result, we did not maintain effective controls and procedures designed to ensure complete and accurate disclosure as required by GAAP as of June 30, 2024, or as of the date of filing this report. Based on discussions with FHFA and the structural nature of this weakness, we do not expect to remediate this material weakness while we are under conservatorship.
Mitigating Actions Related to Material Weakness
We and FHFA have engaged in the following practices intended to permit accumulation and communication to management of information needed to meet our disclosure obligations under the federal securities laws:
•FHFA has established the Division of Conservatorship Oversight and Readiness, which is intended to facilitate operation of the company with the oversight of the conservator.
•We have provided drafts of our SEC filings to FHFA personnel for their review and comment prior to filing. We also have provided drafts of external press releases, statements, and speeches to FHFA personnel for their review and comment prior to release.
•FHFA personnel, including senior officials, have reviewed our SEC filings prior to filing, including this quarterly report on Form 10-Q for the quarter ended June 30, 2024 (“Second Quarter 2024 Form 10-Q”), and engaged in discussions regarding issues associated with the information contained in those filings. Prior to filing our Second Quarter 2024 Form 10-Q, FHFA provided Fannie Mae management with written acknowledgment that it had reviewed the Second Quarter 2024 Form 10-Q, and it was not aware of any material misstatements or omissions in the Second Quarter 2024 Form 10-Q and had no objection to our filing the Second Quarter 2024 Form 10-Q.
•Our senior management meets regularly with senior leadership at FHFA, including, but not limited to, the Director.
•FHFA representatives attend meetings frequently with various groups within the company to enhance the flow of information and to provide oversight on a variety of matters, including accounting, credit and market risk management, external communications, and legal matters.
•Senior officials within FHFA’s Office of the Chief Accountant have met frequently with our senior finance executives regarding our accounting policies, practices, and procedures.
Changes in Internal Control Over Financial Reporting
Management has evaluated, with the participation of our Chief Executive Officer and Chief Financial Officer, whether any changes in our internal control over financial reporting that occurred during our last fiscal quarter have materially affected, or are reasonably likely to materially affect, our internal control over financial reporting. There were no changes in our internal control over financial reporting from April 1, 2024 through June 30, 2024 that management believes have materially affected, or are reasonably likely to materially affect, our internal control over financial reporting.
In the ordinary course of business, we review our system of internal control over financial reporting and make changes that we believe will improve these controls and increase efficiency, while continuing to ensure that we maintain effective internal controls. Changes may include implementing new, more efficient systems, automating manual processes, and updating existing systems.
| | | | | | | | |
| Fannie Mae Second Quarter 2024 Form 10-Q | 115 |
PART II—OTHER INFORMATION
Item 1. Legal Proceedings
The information in this item supplements and updates information regarding certain legal proceedings set forth in “Legal Proceedings” in our 2023 Form 10-K and our First Quarter 2024 Form 10-Q. We also provide information regarding material legal proceedings in “Note 14, Commitments and Contingencies,” which is incorporated herein by reference. In addition to the matters specifically described or incorporated by reference in this item, we are involved in legal and regulatory proceedings that arise in the ordinary course of business that we do not expect will have a material impact on our business or financial condition. However, litigation claims and proceedings of all types are subject to many factors and their outcome and effect on our business and financial condition generally cannot be predicted accurately.
We establish an accrual for legal claims only when a loss is probable and we can reasonably estimate the amount of such loss. The actual costs of resolving legal claims may be substantially higher or lower than the amounts accrued for those claims. If certain of these matters are determined against us, FHFA or Treasury, it could have a material adverse effect on our results of operations, liquidity and financial condition, including our net worth.
Senior Preferred Stock Purchase Agreements Litigation
Since June 2013, preferred and common stockholders of Fannie Mae and Freddie Mac filed lawsuits in multiple federal courts against one or more of the United States, Treasury and FHFA, challenging actions taken by the defendants relating to the Fannie Mae and Freddie Mac senior preferred stock purchase agreements and the conservatorships of Fannie Mae and Freddie Mac. Some of these lawsuits also contain claims against Fannie Mae and Freddie Mac. The legal claims being advanced by one or more of these lawsuits include challenges to the net worth sweep dividend provisions of the senior preferred stock that were implemented pursuant to August 2012 amendments to the agreements, the payment of dividends to Treasury under the net worth sweep dividend provisions, and FHFA’s decision to require Fannie Mae and Freddie Mac to draw funds from Treasury to pay dividends to Treasury prior to the August 2012 amendments. The plaintiffs seek various forms of equitable and injunctive relief as well as damages. The cases that remain pending or were terminated after March 31, 2024 are as follows:
District of Columbia (In re Fannie Mae/Freddie Mac Senior Preferred Stock Purchase Agreement Class Action Litigations and Fairholme Funds v. FHFA). Fannie Mae is a defendant in two cases filed in the U.S. District Court for the District of Columbia, including a consolidated class action. The cases were consolidated for trial, and on August 14, 2023, the jury returned a verdict for the plaintiffs and awarded damages of $299.4 million to Fannie Mae preferred stockholders. On March 20, 2024, the court entered final judgment and set the amount of prejudgment interest owed by Fannie Mae at $199.7 million. On April 17, 2024, the defendants filed a motion for judgment as a matter of law, which has been fully briefed. The parties will have 30 days to appeal following the court’s decision on the motion. See “Note 14, Commitments and Contingencies” for additional information.
Western District of Michigan (Rop et al. v. FHFA et al.). On June 1, 2017, preferred and common stockholders of Fannie Mae and Freddie Mac filed a complaint for declaratory and injunctive relief against FHFA and Treasury in the U.S. District Court for the Western District of Michigan. FHFA and Treasury moved to dismiss the case on September 8, 2017, and plaintiffs filed a motion for summary judgment on October 6, 2017. On September 8, 2020, the court denied plaintiffs’ motion for summary judgment and granted defendants’ motion to dismiss. On October 4, 2022, the U.S. Court of Appeals for the Sixth Circuit reversed the dismissal and remanded the case to the district court to determine whether the stockholders suffered compensable harm. On February 2, 2023, plaintiffs filed a petition with the Supreme Court seeking review of the Sixth Circuit’s decision, which the Supreme Court denied on June 12, 2023. On August 11, 2023, plaintiffs submitted a motion for leave to file an amended complaint in the district court.
District of Minnesota (Bhatti et al. v. FHFA et al.). On June 22, 2017, preferred and common stockholders of Fannie Mae and Freddie Mac filed a complaint for declaratory and injunctive relief against FHFA and Treasury in the U.S. District Court for the District of Minnesota. The court dismissed the case on July 6, 2018. On October 6, 2021, the U.S. Court of Appeals for the Eighth Circuit affirmed in part and reversed in part the district court’s ruling and remanded the case to the district court to determine whether the stockholders suffered compensable harm. On January 26, 2022, plaintiffs filed an amended complaint. On March 11, 2022 and March 14, 2022, Treasury and FHFA each filed motions to dismiss the new complaint. On December 16, 2022, the district court dismissed the case. On March 28, 2024, the Eighth Circuit Court of Appeals affirmed the district court’s dismissal. The shareholders’ time to seek review of that decision lapsed on June 26, 2024, ending the case.
Eastern District of Pennsylvania (Wazee Street Opportunities Fund IV L.P. et al. v. FHFA et al.). On August 16, 2018, common stockholders of Fannie Mae and Freddie Mac filed a complaint for declaratory and injunctive relief against FHFA and Treasury in the U.S. District Court for the Eastern District of Pennsylvania. FHFA and Treasury moved to
| | | | | | | | |
| Fannie Mae Second Quarter 2024 Form 10-Q | 116 |
dismiss the case on November 16, 2018, and plaintiffs filed a motion for summary judgment on December 21, 2018. On July 1, 2024, plaintiffs filed a motion for leave to amend their complaint.
U.S. Court of Federal Claims (Fisher et al. v. United States of America). On December 2, 2013, common stockholders of Fannie Mae filed a lawsuit against the United States that listed Fannie Mae as a nominal defendant. The plaintiffs alleged that the net worth sweep dividend provisions of the senior preferred stock that were implemented pursuant to the August 2012 amendment constituted a taking of Fannie Mae’s property without just compensation in violation of the U.S. Constitution. On February 15, 2023, the court issued an order for plaintiffs to show cause why their claims should not be dismissed, as claims similar to theirs brought by other Fannie Mae stockholders in other cases against the United States had been dismissed by the court. On September 1, 2023, the court dismissed the case with prejudice. On October 30, 2023, plaintiffs filed a notice of appeal.
Item 1A. Risk Factors
In addition to the information in this report, you should carefully consider the risks relating to our business that we identify in “Risk Factors” in our 2023 Form 10-K. Also refer to “MD&A—Risk Management,” “MD&A—Single-Family Business” and “MD&A—Multifamily Business” in our 2023 Form 10-K and in this report for more detailed descriptions of the primary risks to our business and how we seek to manage those risks.
The risks we face could materially adversely affect our business, results of operations, financial condition, liquidity and net worth, and could cause our actual results to differ materially from our past results or the results contemplated by any forward-looking statements we make. We believe the risks described in the other sections of this report and our 2023 Form 10-K referenced above are the most significant we face; however, these are not the only risks we face. We face additional risks and uncertainties not currently known to us or that we currently believe are immaterial.
Item 2. Unregistered Sales of Equity Securities and Use of Proceeds
Common Stock
Our common stock is traded in the over-the-counter market and quoted on the OTCQB, operated by OTC Markets Group Inc., under the ticker symbol “FNMA.”
Recent Sales of Unregistered Equity Securities
Under the terms of our senior preferred stock purchase agreement with Treasury, we are prohibited from selling or issuing our equity interests without the prior written consent of Treasury except under limited circumstances, which are described in “Business—Conservatorship and Treasury Agreements—Treasury Agreements—Covenants” in our 2023 Form 10-K. During the quarter ended June 30, 2024, we did not sell any equity securities.
Information about Certain Securities Issuances by Fannie Mae
Pursuant to SEC regulations, public companies are required to disclose certain information when they incur a material direct financial obligation or become directly or contingently liable for a material obligation under an off-balance sheet arrangement. The disclosure must be made in a current report on Form 8-K under Item 2.03 or, if the obligation is incurred in connection with certain types of securities offerings, in prospectuses for that offering that are filed with the SEC.
Because the securities we issue are exempted securities under the Securities Act of 1933, we do not file registration statements or prospectuses with the SEC with respect to our securities offerings. To comply with the disclosure requirements of Form 8-K relating to the incurrence of material financial obligations, in accordance with a “no-action” letter we received from the SEC staff in 2004, we report our incurrence of these types of obligations in offering circulars or prospectuses (or supplements thereto) that we post on our website within the same time period that a prospectus for a non-exempt securities offering would be required to be filed with the SEC. To the extent we incur a material financial obligation that is not disclosed in this manner, we would file a Form 8-K if required to do so under applicable Form 8-K requirements.
The website address for disclosure about our debt securities is www.fanniemae.com/debtsearch. From this address, investors can access the offering circular and related supplements for debt securities offerings under Fannie Mae’s universal debt facility, including pricing supplements for individual issuances of debt securities.
Disclosure about our obligations pursuant to the MBS we issue, some of which may be off-balance sheet obligations, can be found at www.fanniemae.com/mbsdisclosure. From this address, investors can access information and documents about our MBS, including prospectuses and related prospectus supplements.
| | | | | | | | |
| Fannie Mae Second Quarter 2024 Form 10-Q | 117 |
We are providing our website address solely for your information. Information appearing on our website is not incorporated into this report.
Our Purchases of Equity Securities
We did not repurchase any of our equity securities during the second quarter of 2024.
Dividend Restrictions
Our payment of dividends is subject to the following restrictions:
Restrictions Relating to Conservatorship. Our conservator announced on September 7, 2008 that we would not pay any dividends on the common stock or on any series of preferred stock, other than the senior preferred stock. In addition, FHFA’s regulations relating to conservatorship and receivership operations prohibit us from paying any dividends while in conservatorship unless authorized by the Director of FHFA. The Director of FHFA has directed us to make dividend payments on the senior preferred stock on a quarterly basis for every dividend period for which dividends were payable.
Restrictions Under Senior Preferred Stock Purchase Agreement and Senior Preferred Stock. The senior preferred stock purchase agreement prohibits us from declaring or paying any dividends on Fannie Mae equity securities (other than the senior preferred stock) without the prior written consent of Treasury. In addition, the provisions of the senior preferred stock provide for dividends each quarter through and including the capital reserve end date in the amount, if any, by which our net worth as of the end of the immediately preceding fiscal quarter exceeds an applicable capital reserve amount. The applicable capital reserve amount is the amount of adjusted total capital necessary for us to meet the capital requirements and buffers set forth in the enterprise regulatory capital framework. The capital reserve end date is defined as the last day of the second consecutive fiscal quarter during which we have had and maintained capital equal to, or in excess of, all of the capital requirements and buffers under the enterprise regulatory capital framework. After the capital reserve end date, the amount of quarterly dividends to Treasury will be equal to the lesser of any quarterly increase in our net worth and a 10% annual rate on the then-current liquidation preference of the senior preferred stock. As a result, our ability to retain earnings in excess of the capital requirements and buffers set forth in the enterprise regulatory capital framework will be limited. For more information on the terms of the senior preferred stock purchase agreement and senior preferred stock, see “Business—Conservatorship and Treasury Agreements” in our 2023 Form 10-K.
Additional Restrictions Relating to Preferred Stock. Payment of dividends on our common stock is also subject to the prior payment of dividends on our preferred stock and our senior preferred stock. Payment of dividends on all outstanding preferred stock, other than the senior preferred stock, is also subject to the prior payment of dividends on the senior preferred stock.
Statutory Restrictions. Under the GSE Act, we are not permitted to make a capital distribution (including the payment of dividends) if, after making the distribution, we would be undercapitalized. The Director of FHFA, however, may permit us to repurchase shares if the repurchase is made in connection with the issuance of additional shares or obligations in at least an equivalent amount and will reduce our financial obligations or otherwise improve our financial condition. The GSE Act also provides that: (1) if we are classified as undercapitalized, we may not make a capital distribution that would result in our reclassification as significantly or critically undercapitalized; and (2) if we are classified as significantly undercapitalized, we may not make a capital distribution that would result in our reclassification as critically undercapitalized and we may not make any other capital distribution without the approval of the Director of FHFA. Our capital classifications have been suspended during conservatorship. In addition, under the Charter Act, we must obtain the prior written approval of FHFA to make a capital distribution that would decrease our total capital to an amount less than the risk-based capital level or that would decrease our core capital to an amount less than the minimum capital level.
While not currently applicable, our payment of dividends will be subject to the following restrictions under the enterprise regulatory capital framework effective on the date of termination of our conservatorship:
Restrictions Under Enterprise Regulatory Capital Framework. During a calendar quarter, we will not be permitted to pay dividends or make any other capital distributions (or create an obligation to make such distributions) that, in the aggregate, exceed the amount equal to our eligible retained income for the quarter multiplied by our maximum payout ratio. The maximum payout ratio for a given quarter is the lowest of the payout ratios determined by our capital conservation buffer and our leverage buffer. We will not be subject to this limitation on distributions if we have a capital conservation buffer that is greater than our prescribed capital conservation buffer amount and a leverage buffer that is greater than our prescribed leverage buffer amount. Notwithstanding the above-described limitations, FHFA may permit us to make a distribution upon our request, if FHFA determines that the distribution would not be contrary to the purposes of this section of the enterprise regulatory capital framework or to our safety and soundness. We will not be permitted to make any distributions during a quarter if our eligible retained income is negative and either (a) our capital
| | | | | | | | |
| Fannie Mae Second Quarter 2024 Form 10-Q | 118 |
conservation buffer is less than our stress capital buffer or (b) our leverage buffer is less than our prescribed leverage buffer amount.
Item 3. Defaults Upon Senior Securities
None.
Item 4. Mine Safety Disclosures
None.
Item 5. Other Information
Trading Arrangements
During the quarter ended June 30, 2024, no Fannie Mae director or officer (as that term is defined by the SEC in Rule 16a-1(f) under the Exchange Act) adopted or terminated a Rule 10b5-1 trading arrangement or a non-Rule 10b5-1 trading arrangement for transactions in Fannie Mae securities.
Item 6. Exhibits
The exhibits listed below are being filed or furnished with or incorporated by reference into this report.
| | | | | | | | |
Item | | Description |
| 3.1 | | |
| 3.2 | | |
| 10.1 | | |
| 31.1 | | |
| 31.2 | | |
| 32.1 | | |
| 32.2 | | |
| 101. INS | | Inline XBRL Instance Document* - the instance document does not appear in the Interactive Data File because its XBRL tags are embedded within the Inline XBRL document |
| 101. SCH | | Inline XBRL Taxonomy Extension Schema* |
| 101. CAL | | Inline XBRL Taxonomy Extension Calculation* |
| 101. DEF | | Inline XBRL Taxonomy Extension Definition* |
| 101. LAB | | Inline XBRL Taxonomy Extension Label* |
| 101. PRE | | Inline XBRL Taxonomy Extension Presentation* |
| 104 | | Cover Page Interactive Data File* (embedded within the Inline XBRL document) |
* The financial information contained in these Inline XBRL documents is unaudited.
| | | | | | | | |
| Fannie Mae Second Quarter 2024 Form 10-Q | 119 |
SIGNATURES
Pursuant to the requirements of the Securities Exchange Act of 1934, the registrant has duly caused this report to be signed on its behalf by the undersigned thereunto duly authorized.
| | | | | | | | |
| Federal National Mortgage Association |
| | |
| By: | /s/ Priscilla Almodovar |
| | Priscilla Almodovar
President and Chief Executive Officer |
Date: July 30, 2024
| | | | | | | | |
| By: | /s/ Chryssa C. Halley |
| | Chryssa C. Halley
Executive Vice President and
Chief Financial Officer |
Date: July 30, 2024
| | | | | | | | |
| Fannie Mae Second Quarter 2024 Form 10-Q | 120 |