Exhibit 99.1

Omnicom Group Reports Fourth Quarter and Full Year 2019 Results
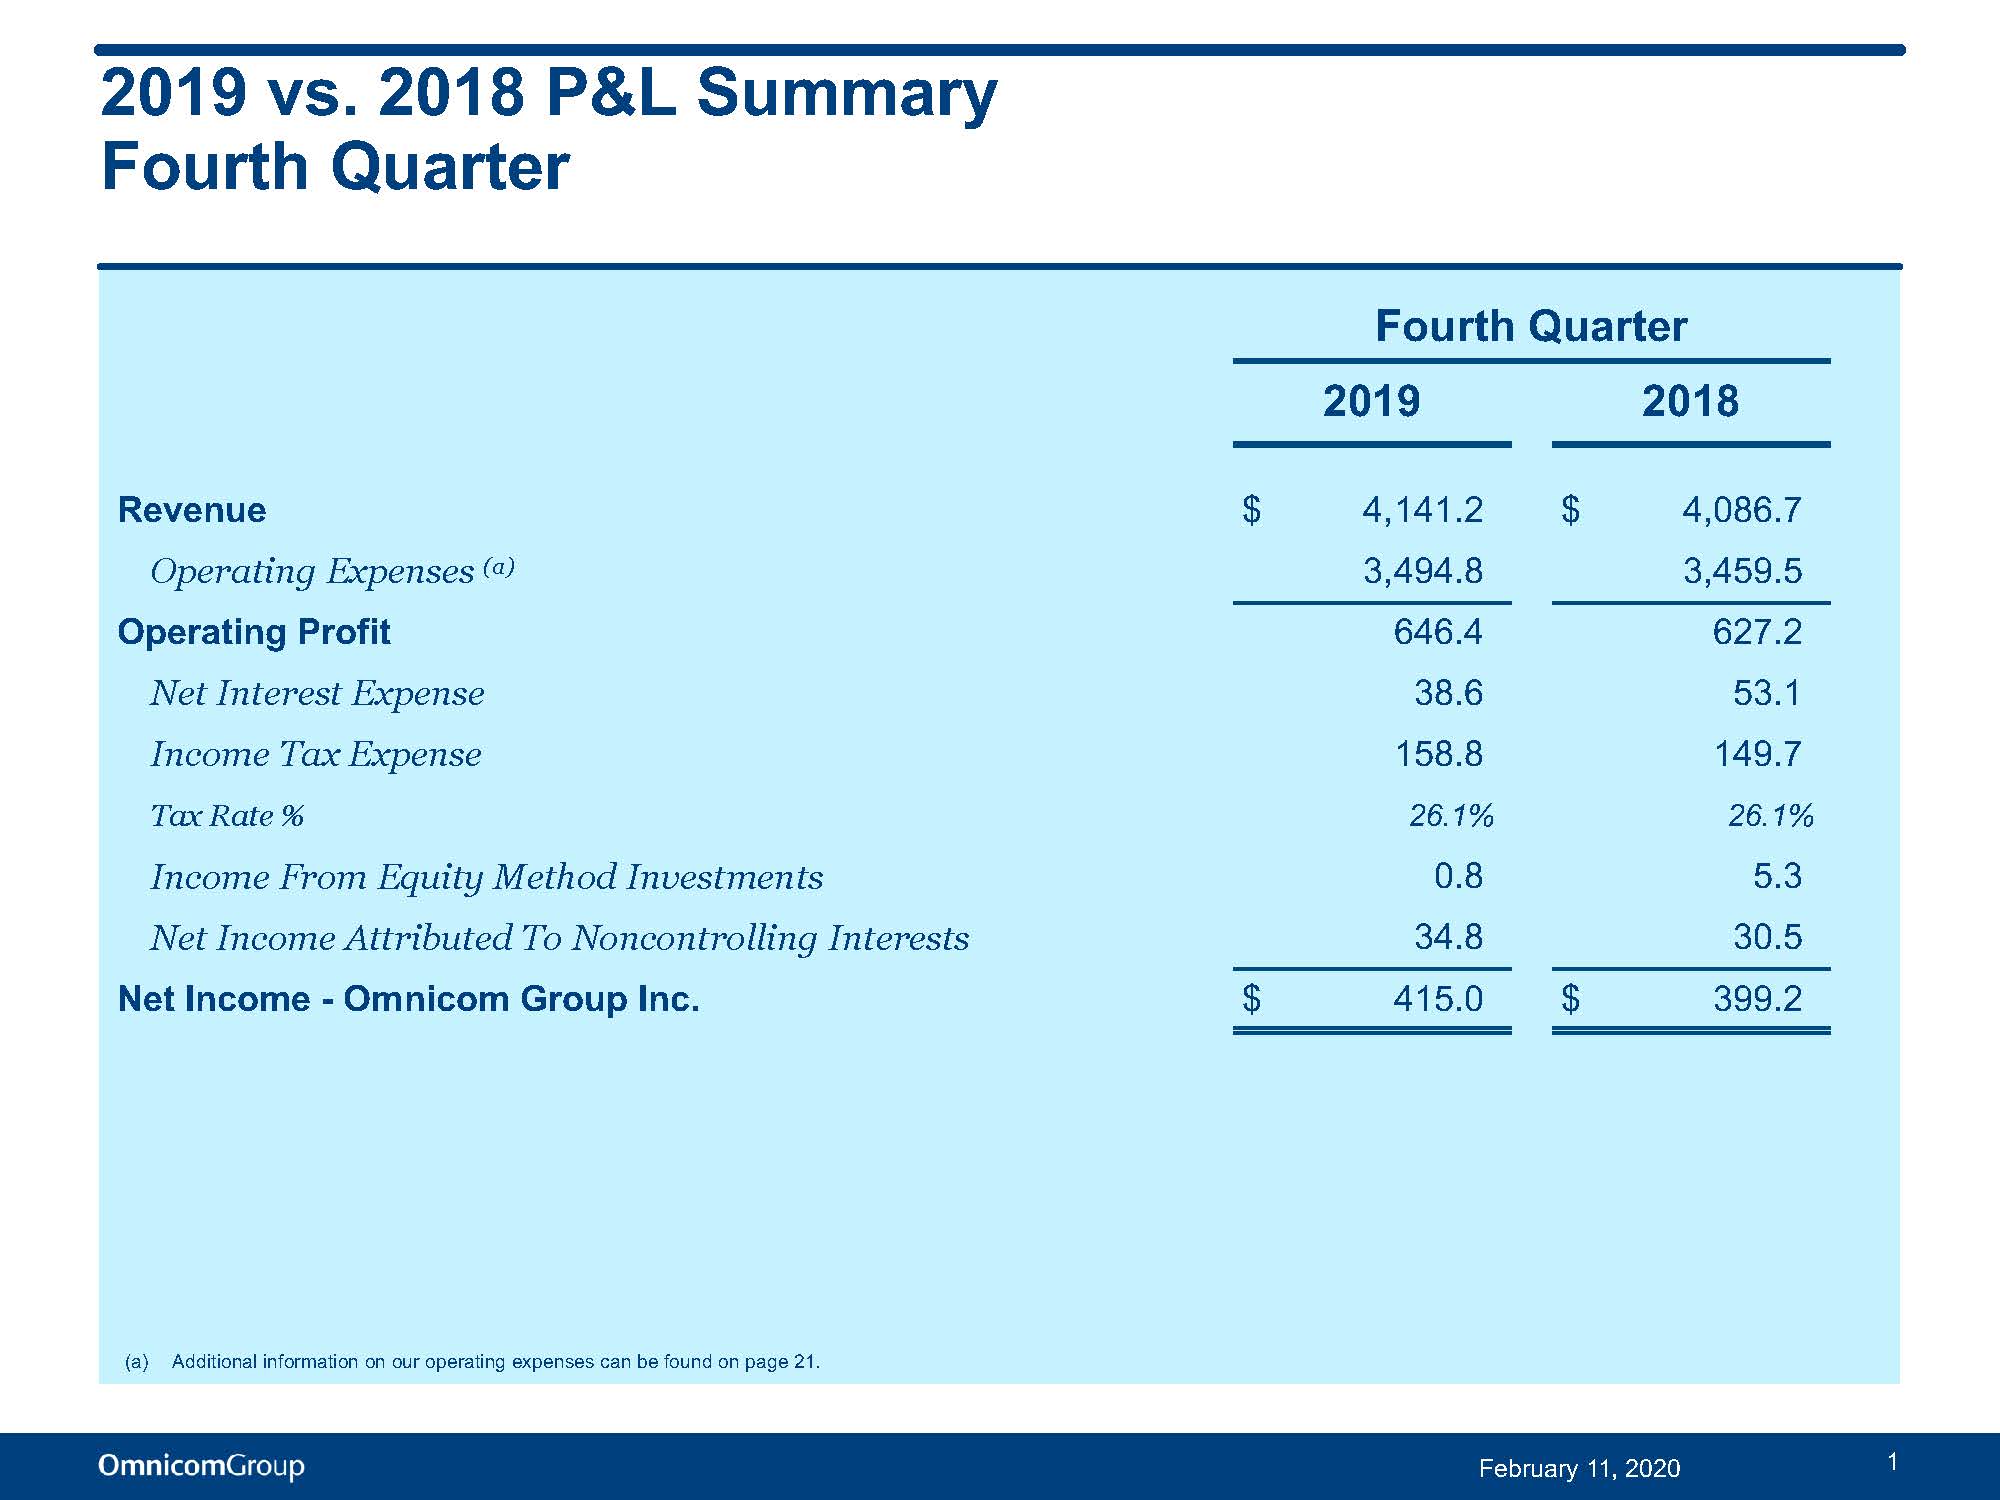
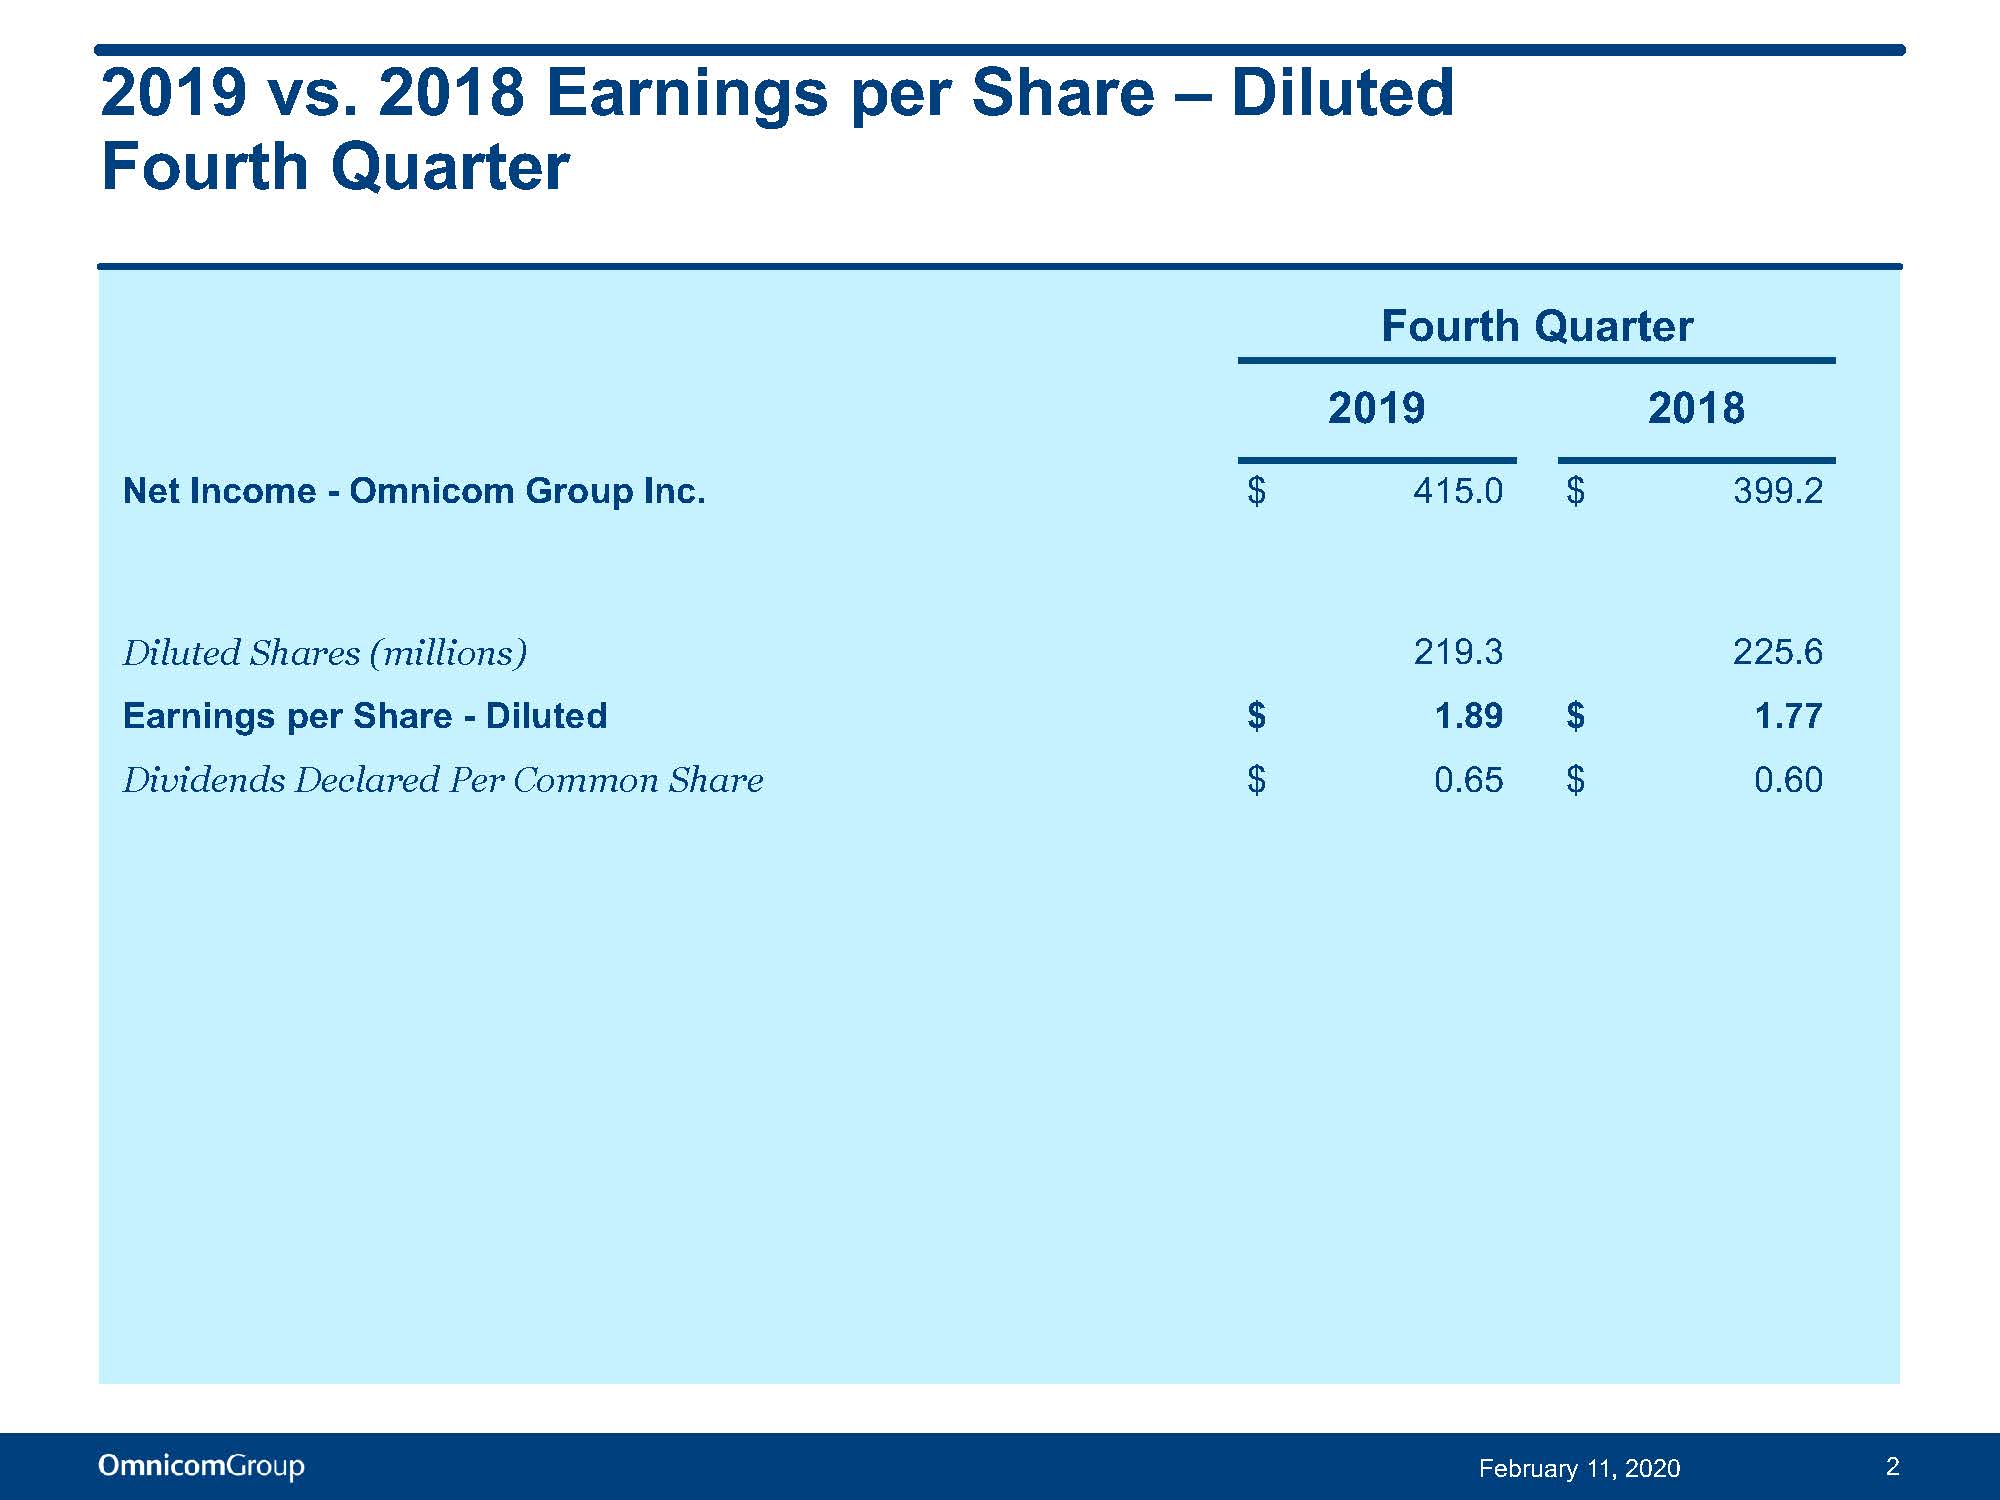
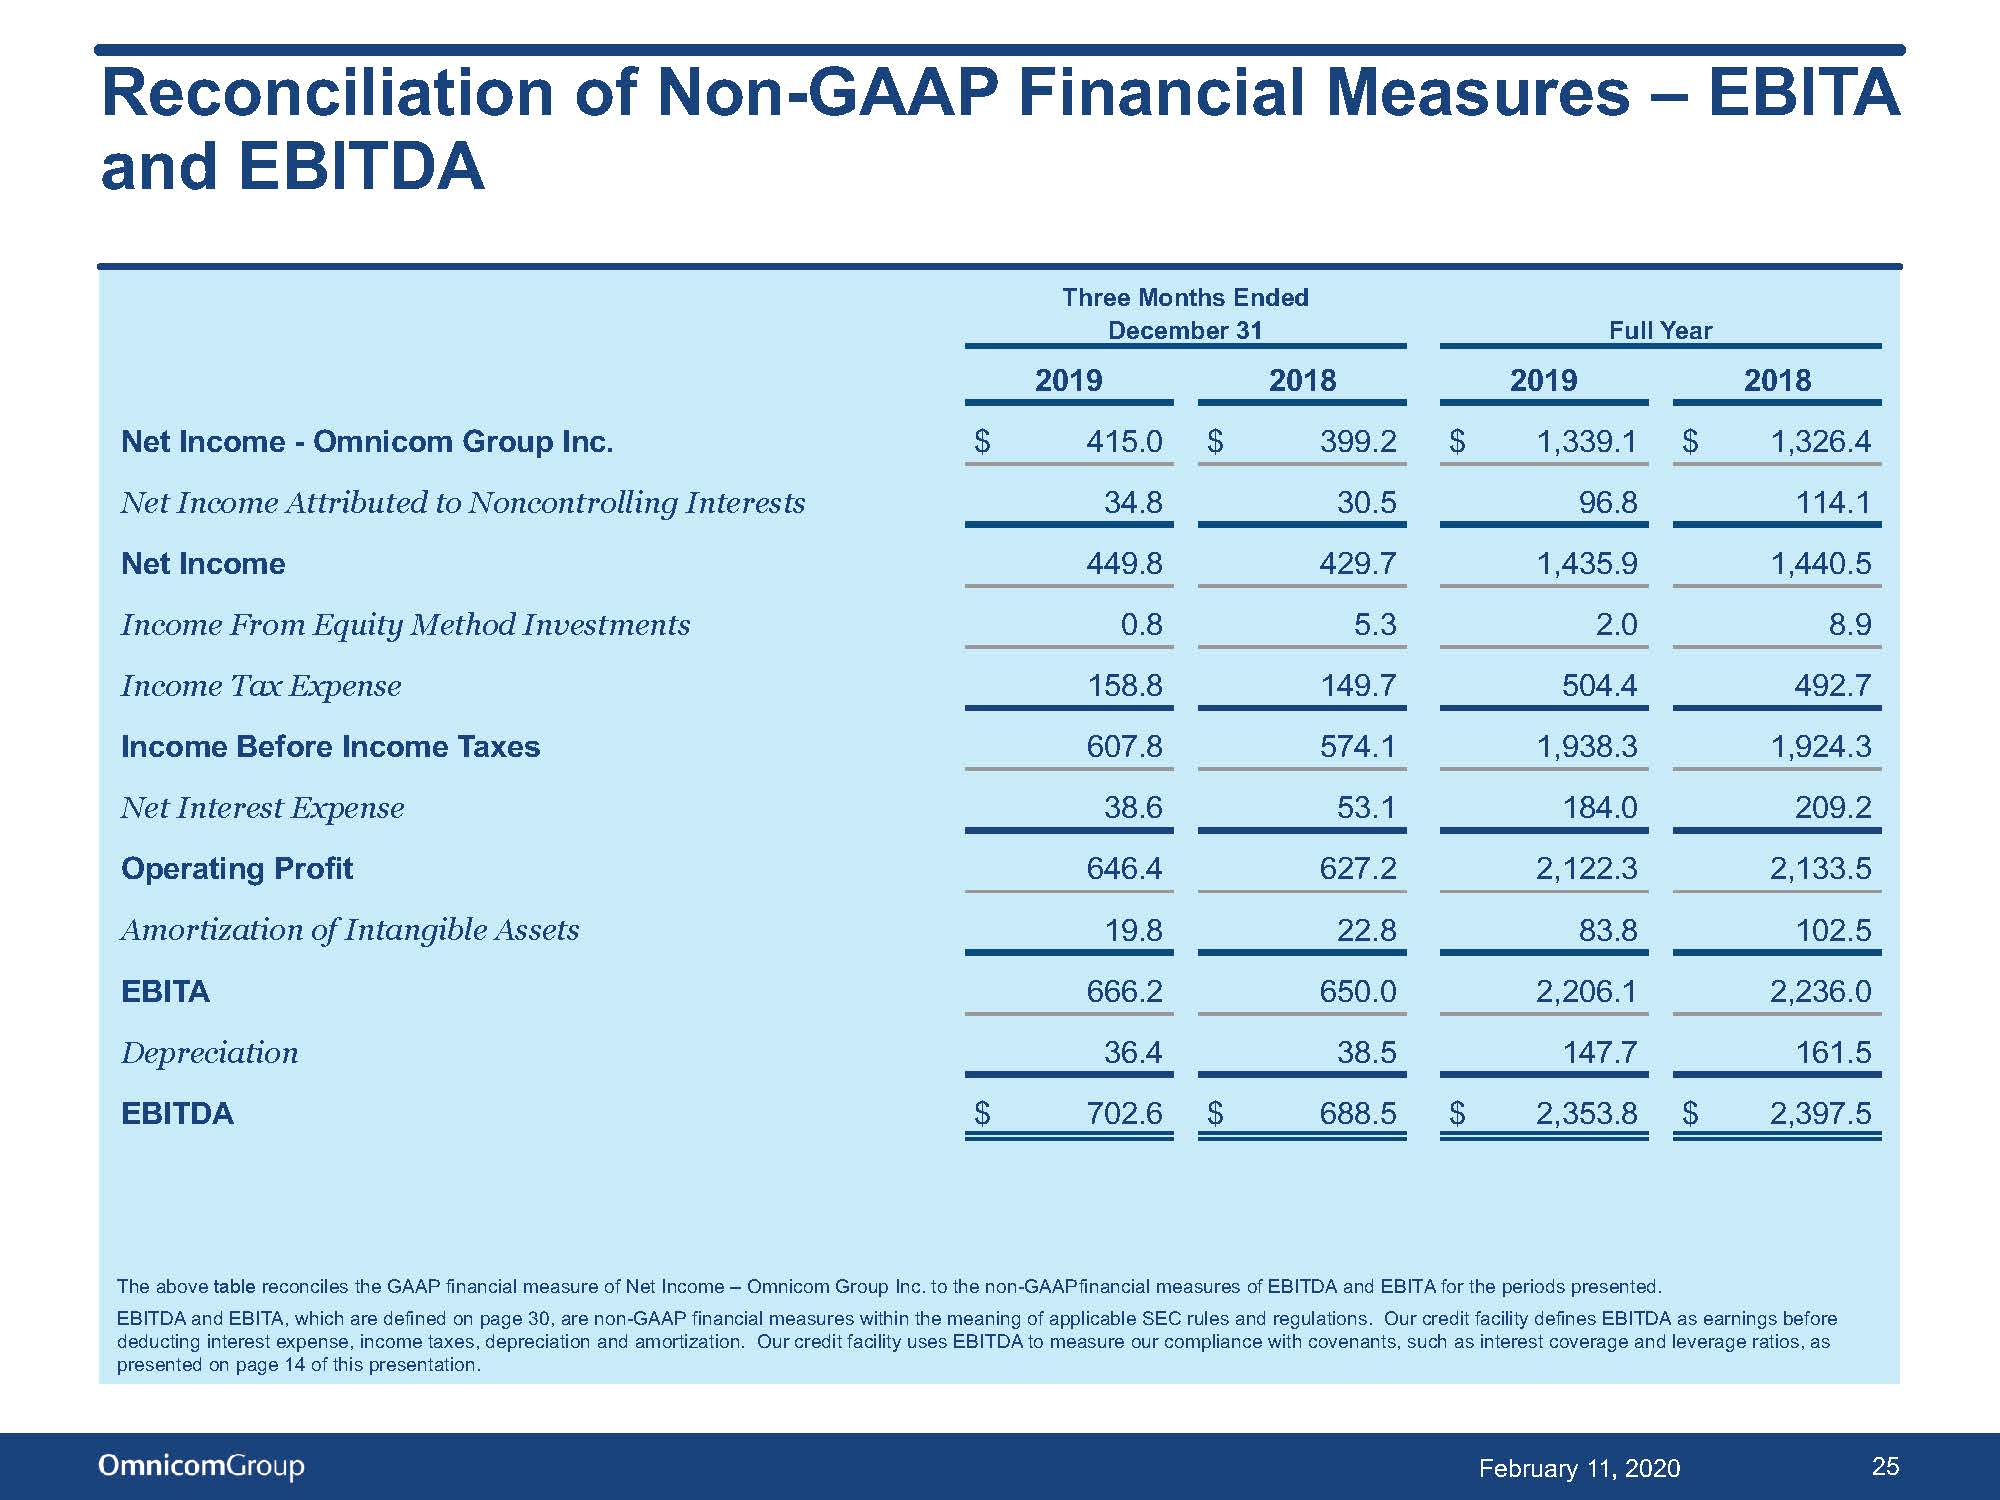
NEW YORK, February 11, 2020 - Omnicom Group Inc. (NYSE: OMC) today announced that its diluted net income per share for the fourth quarter of 2019 increased twelve cents, or 6.8%, to $1.89 per share compared to $1.77 for the fourth quarter of 2018. Net income - Omnicom Group Inc. for the fourth quarter of 2019 increased $15.8 million, or 4.0%, to $415.0 million compared to $399.2 million in the fourth quarter of 2018.
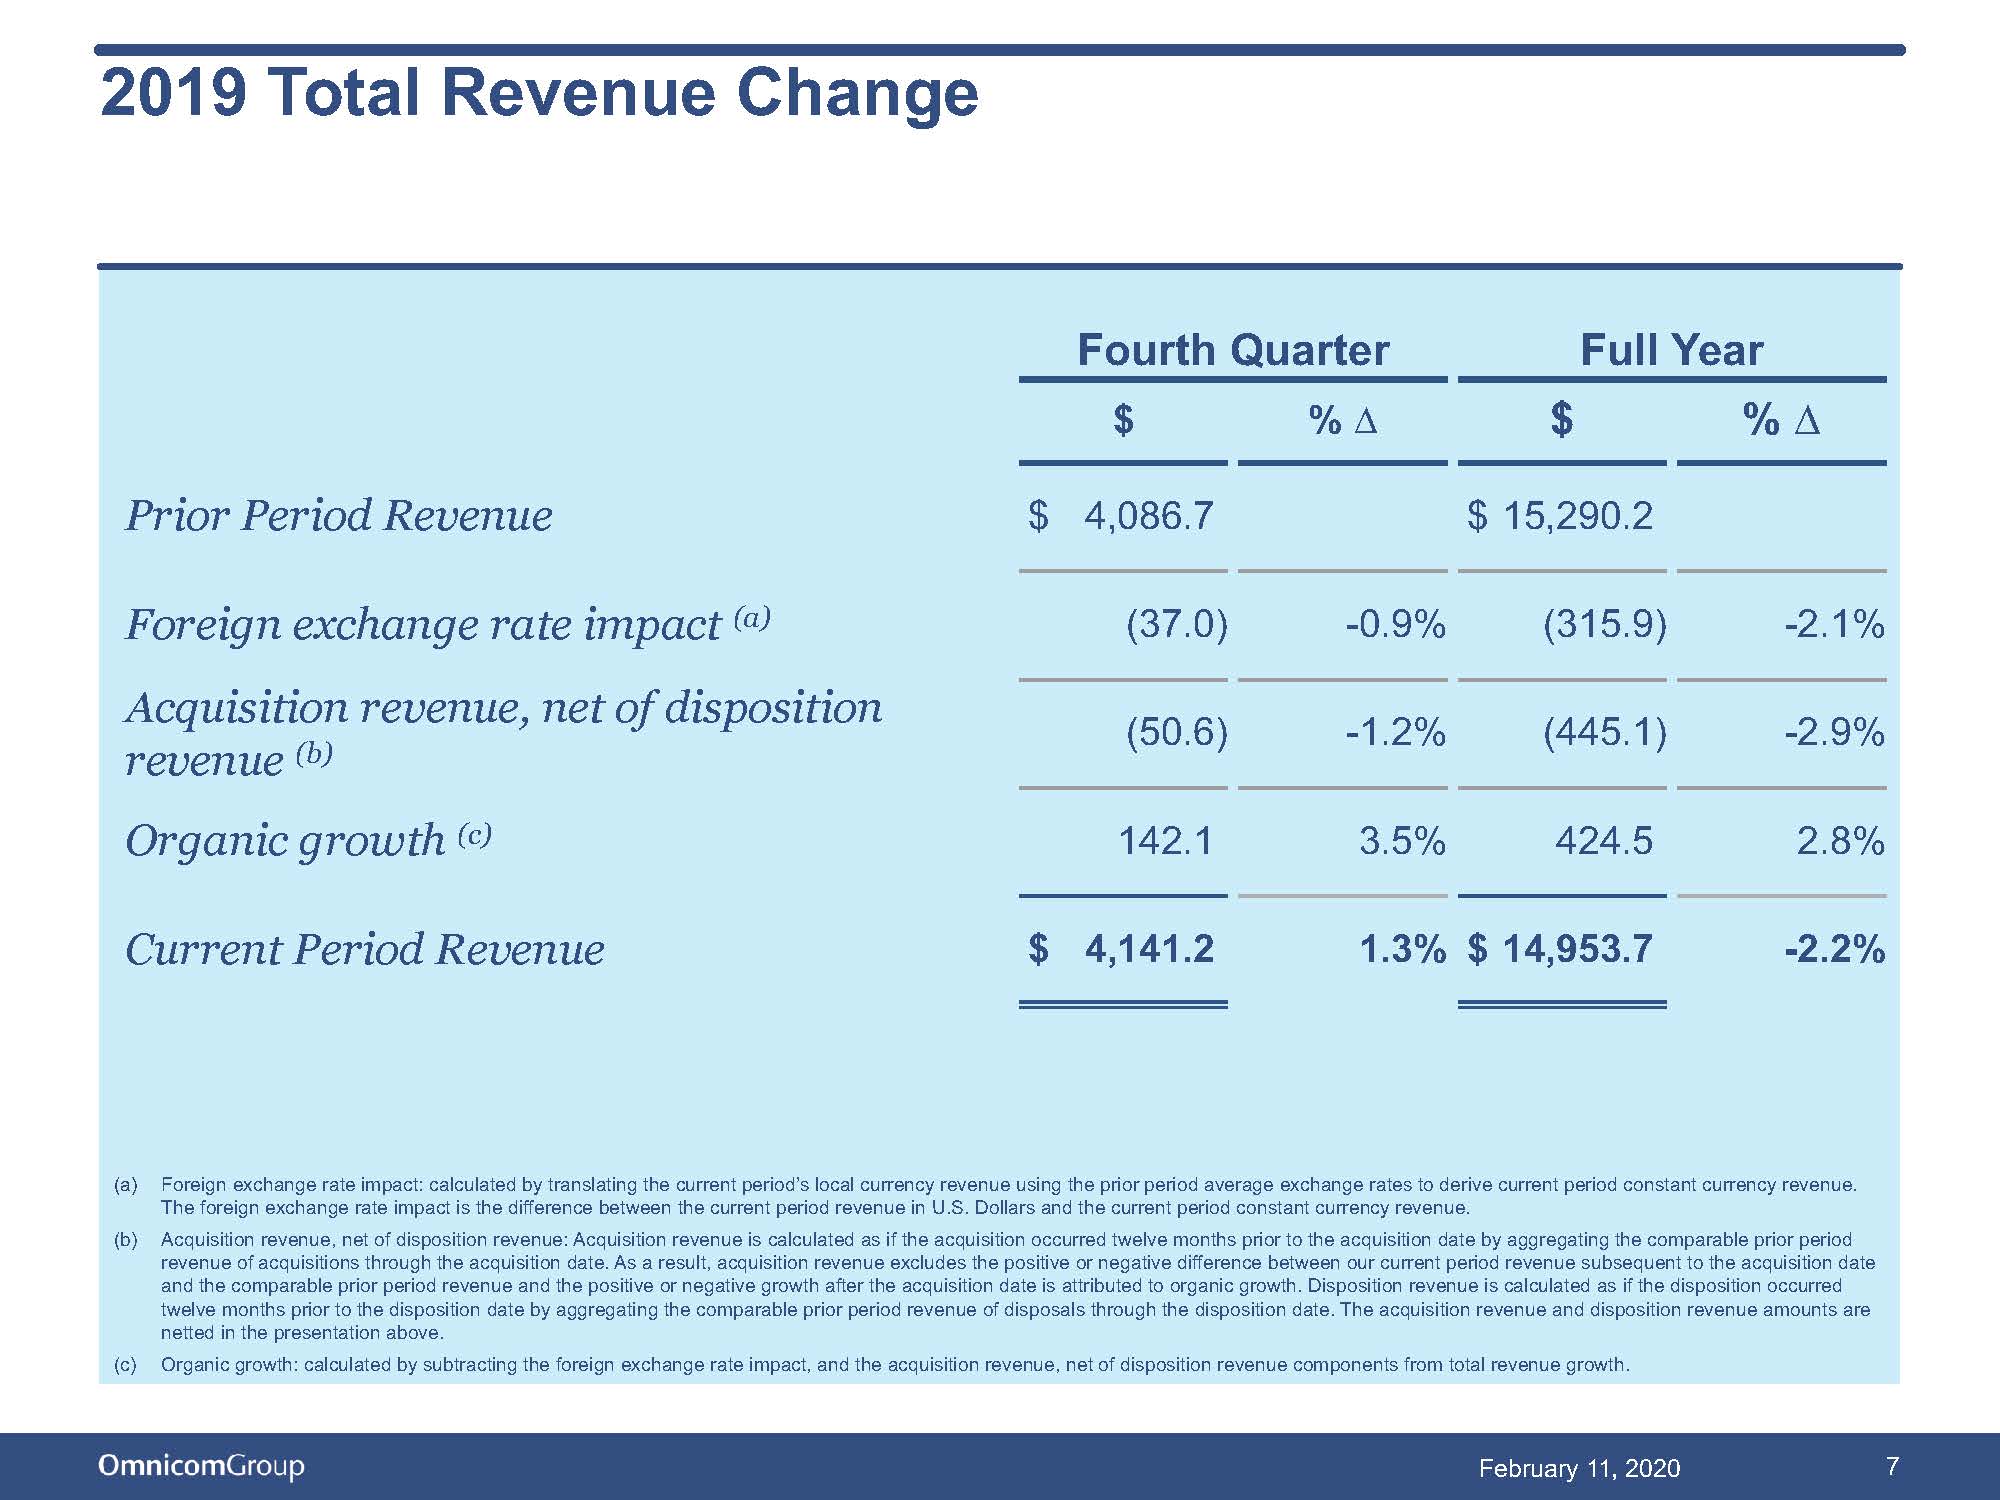
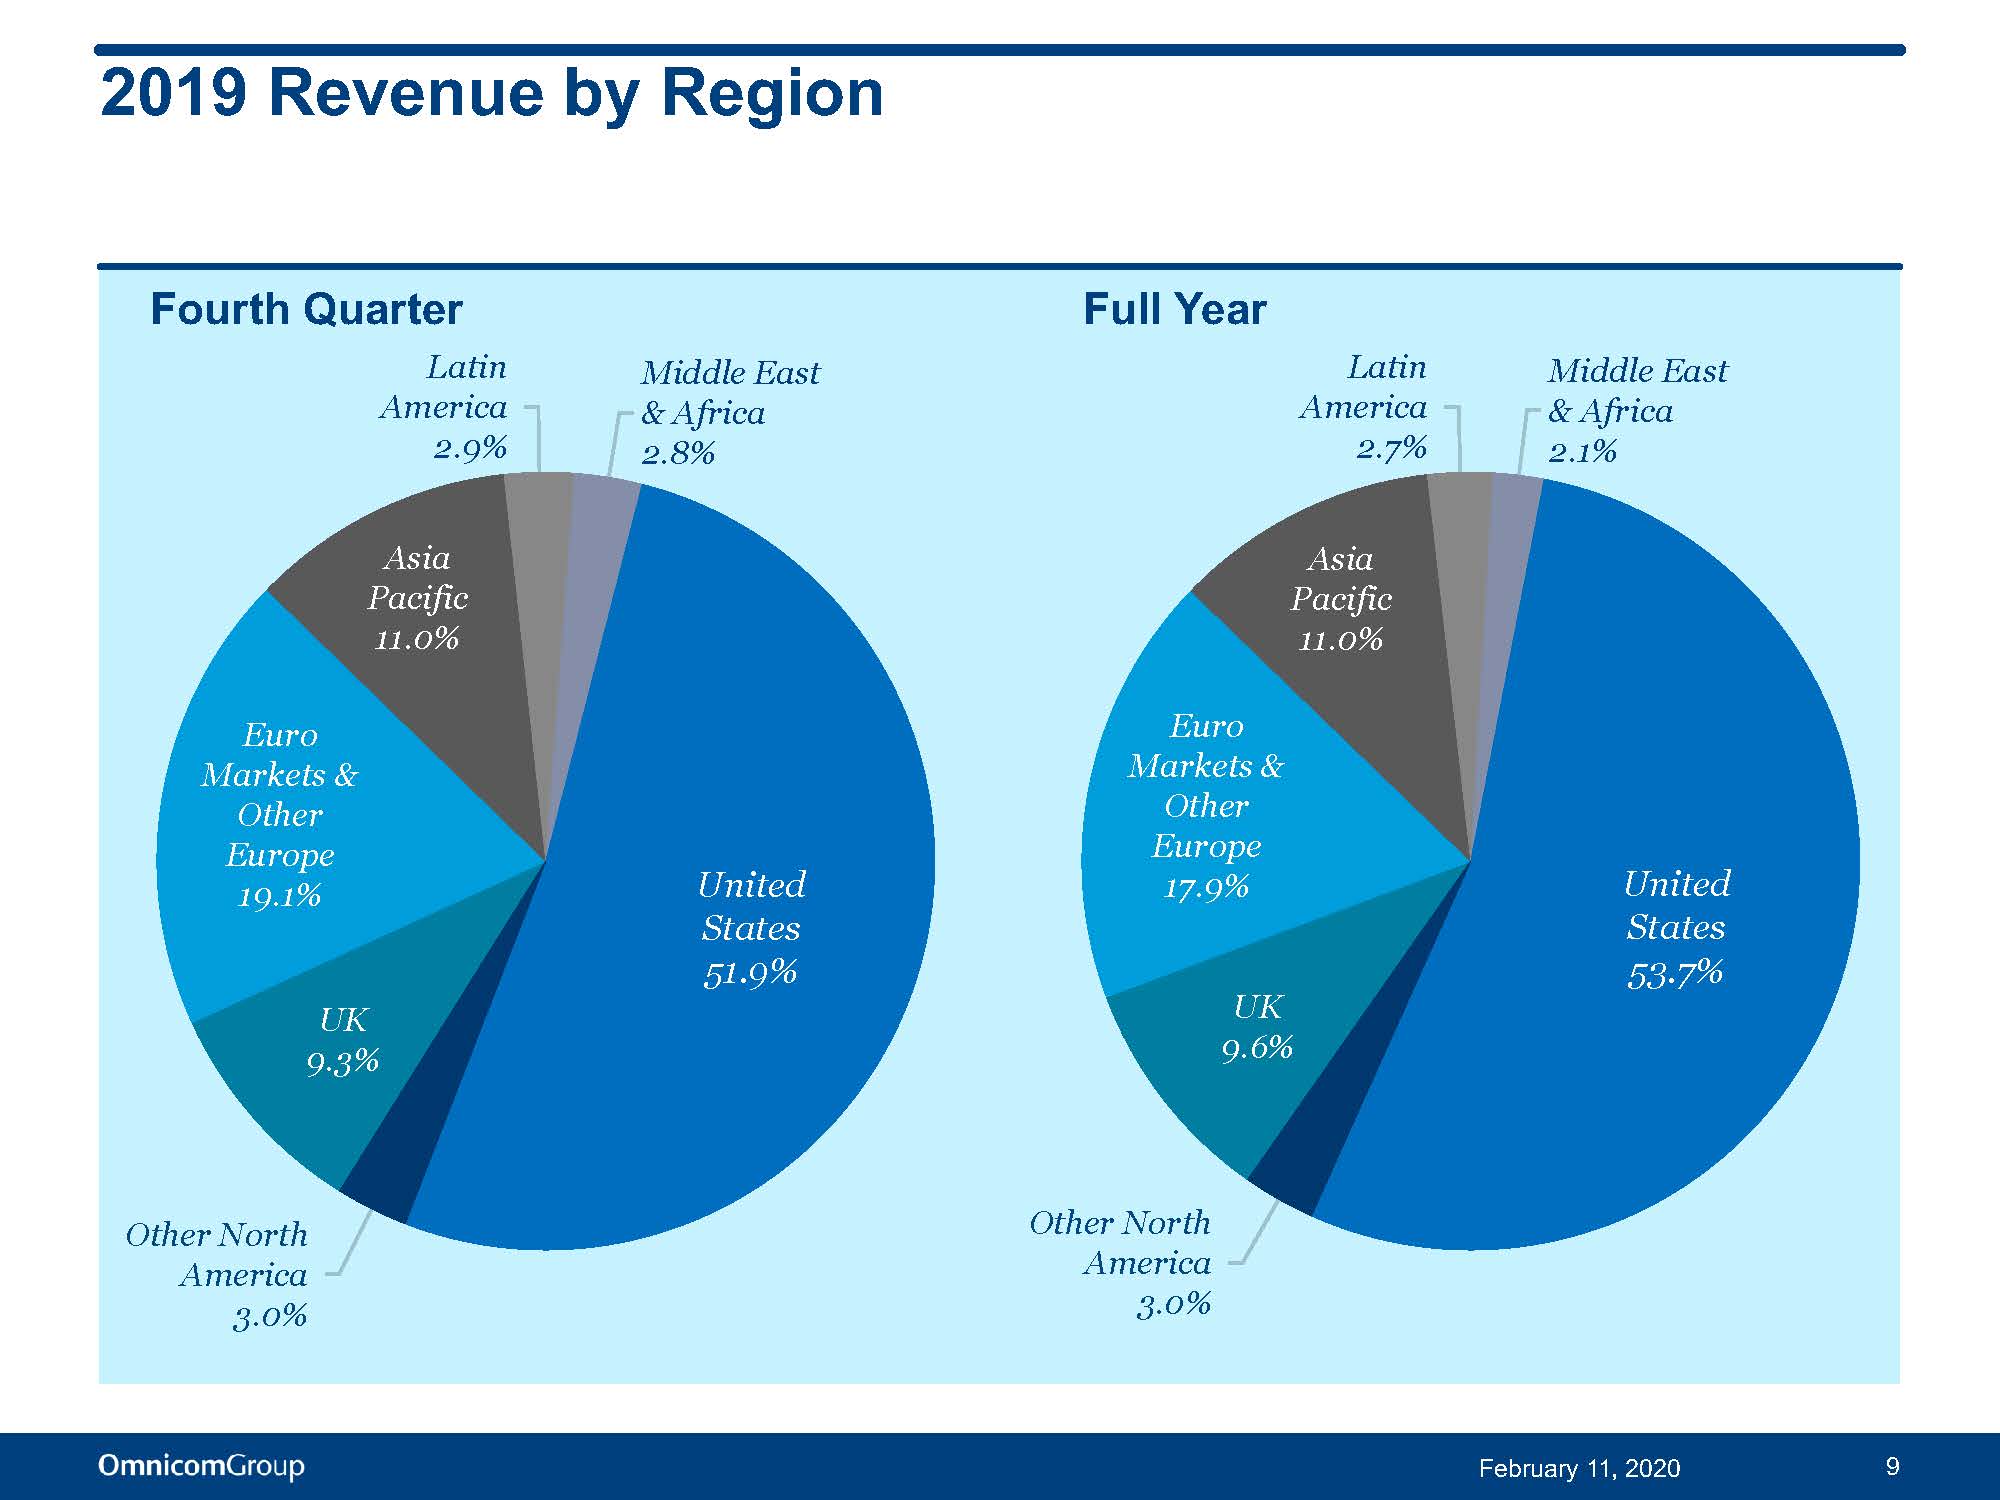
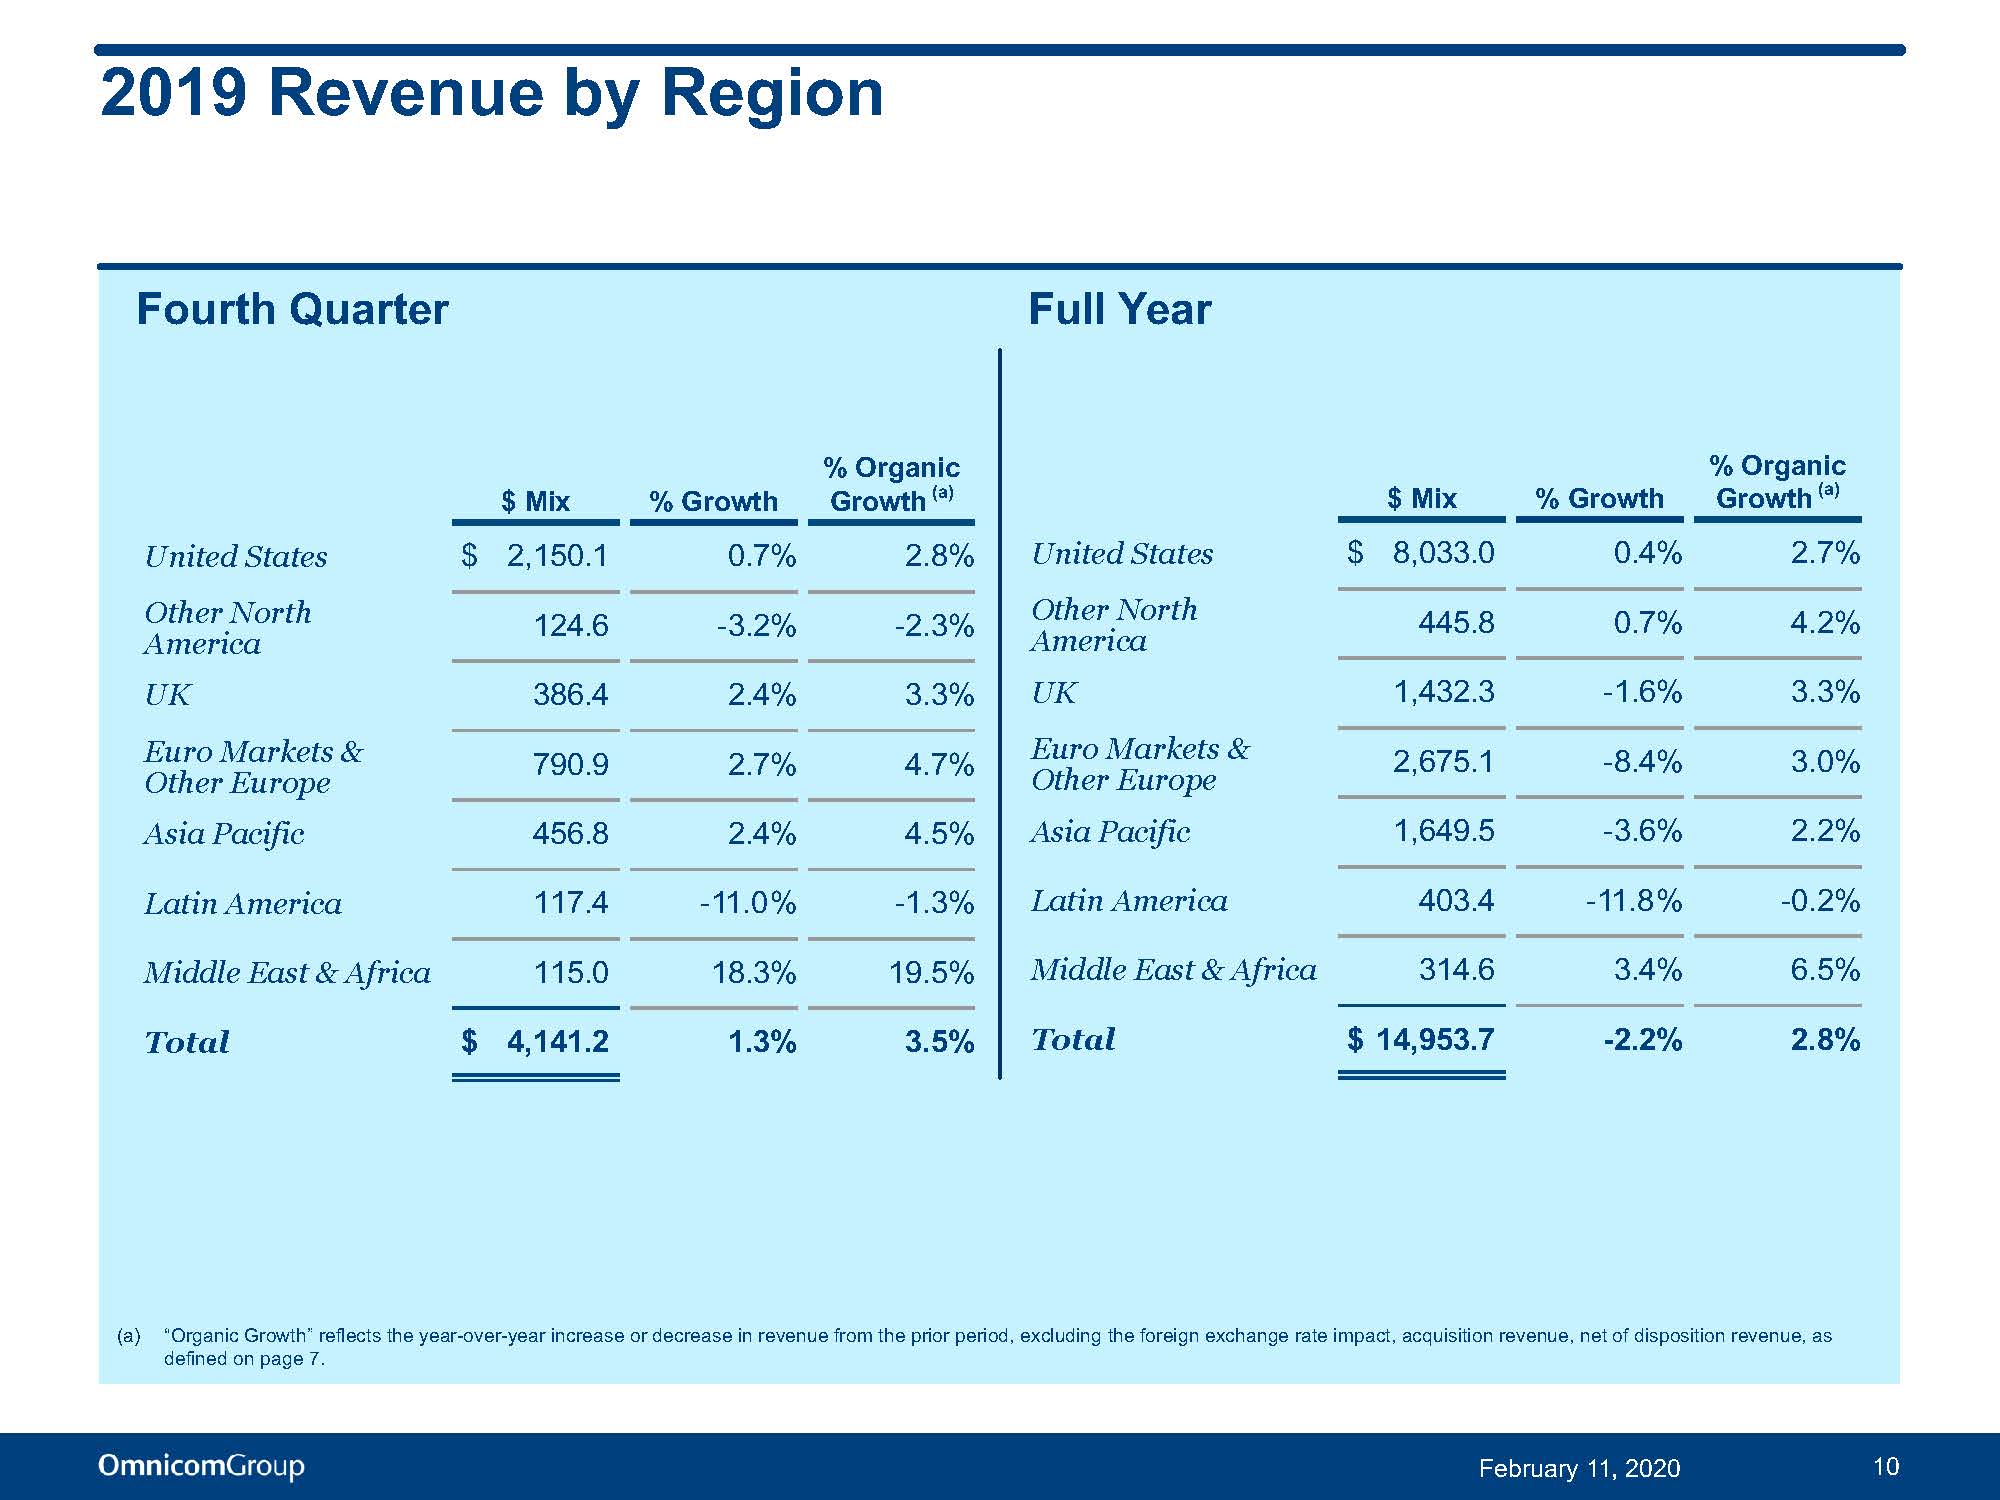
Omnicom’s worldwide revenue in the fourth quarter of 2019 increased 1.3% to $4,141.2 million from $4,086.7 million in the fourth quarter of 2018. The components of the change in revenue included a decrease in revenue from the negative impact of foreign currency translation of 0.9%, a decrease in acquisition revenue, net of disposition revenue of 1.2% and an increase in revenue from organic growth of 3.5% when compared to the fourth quarter of 2018.
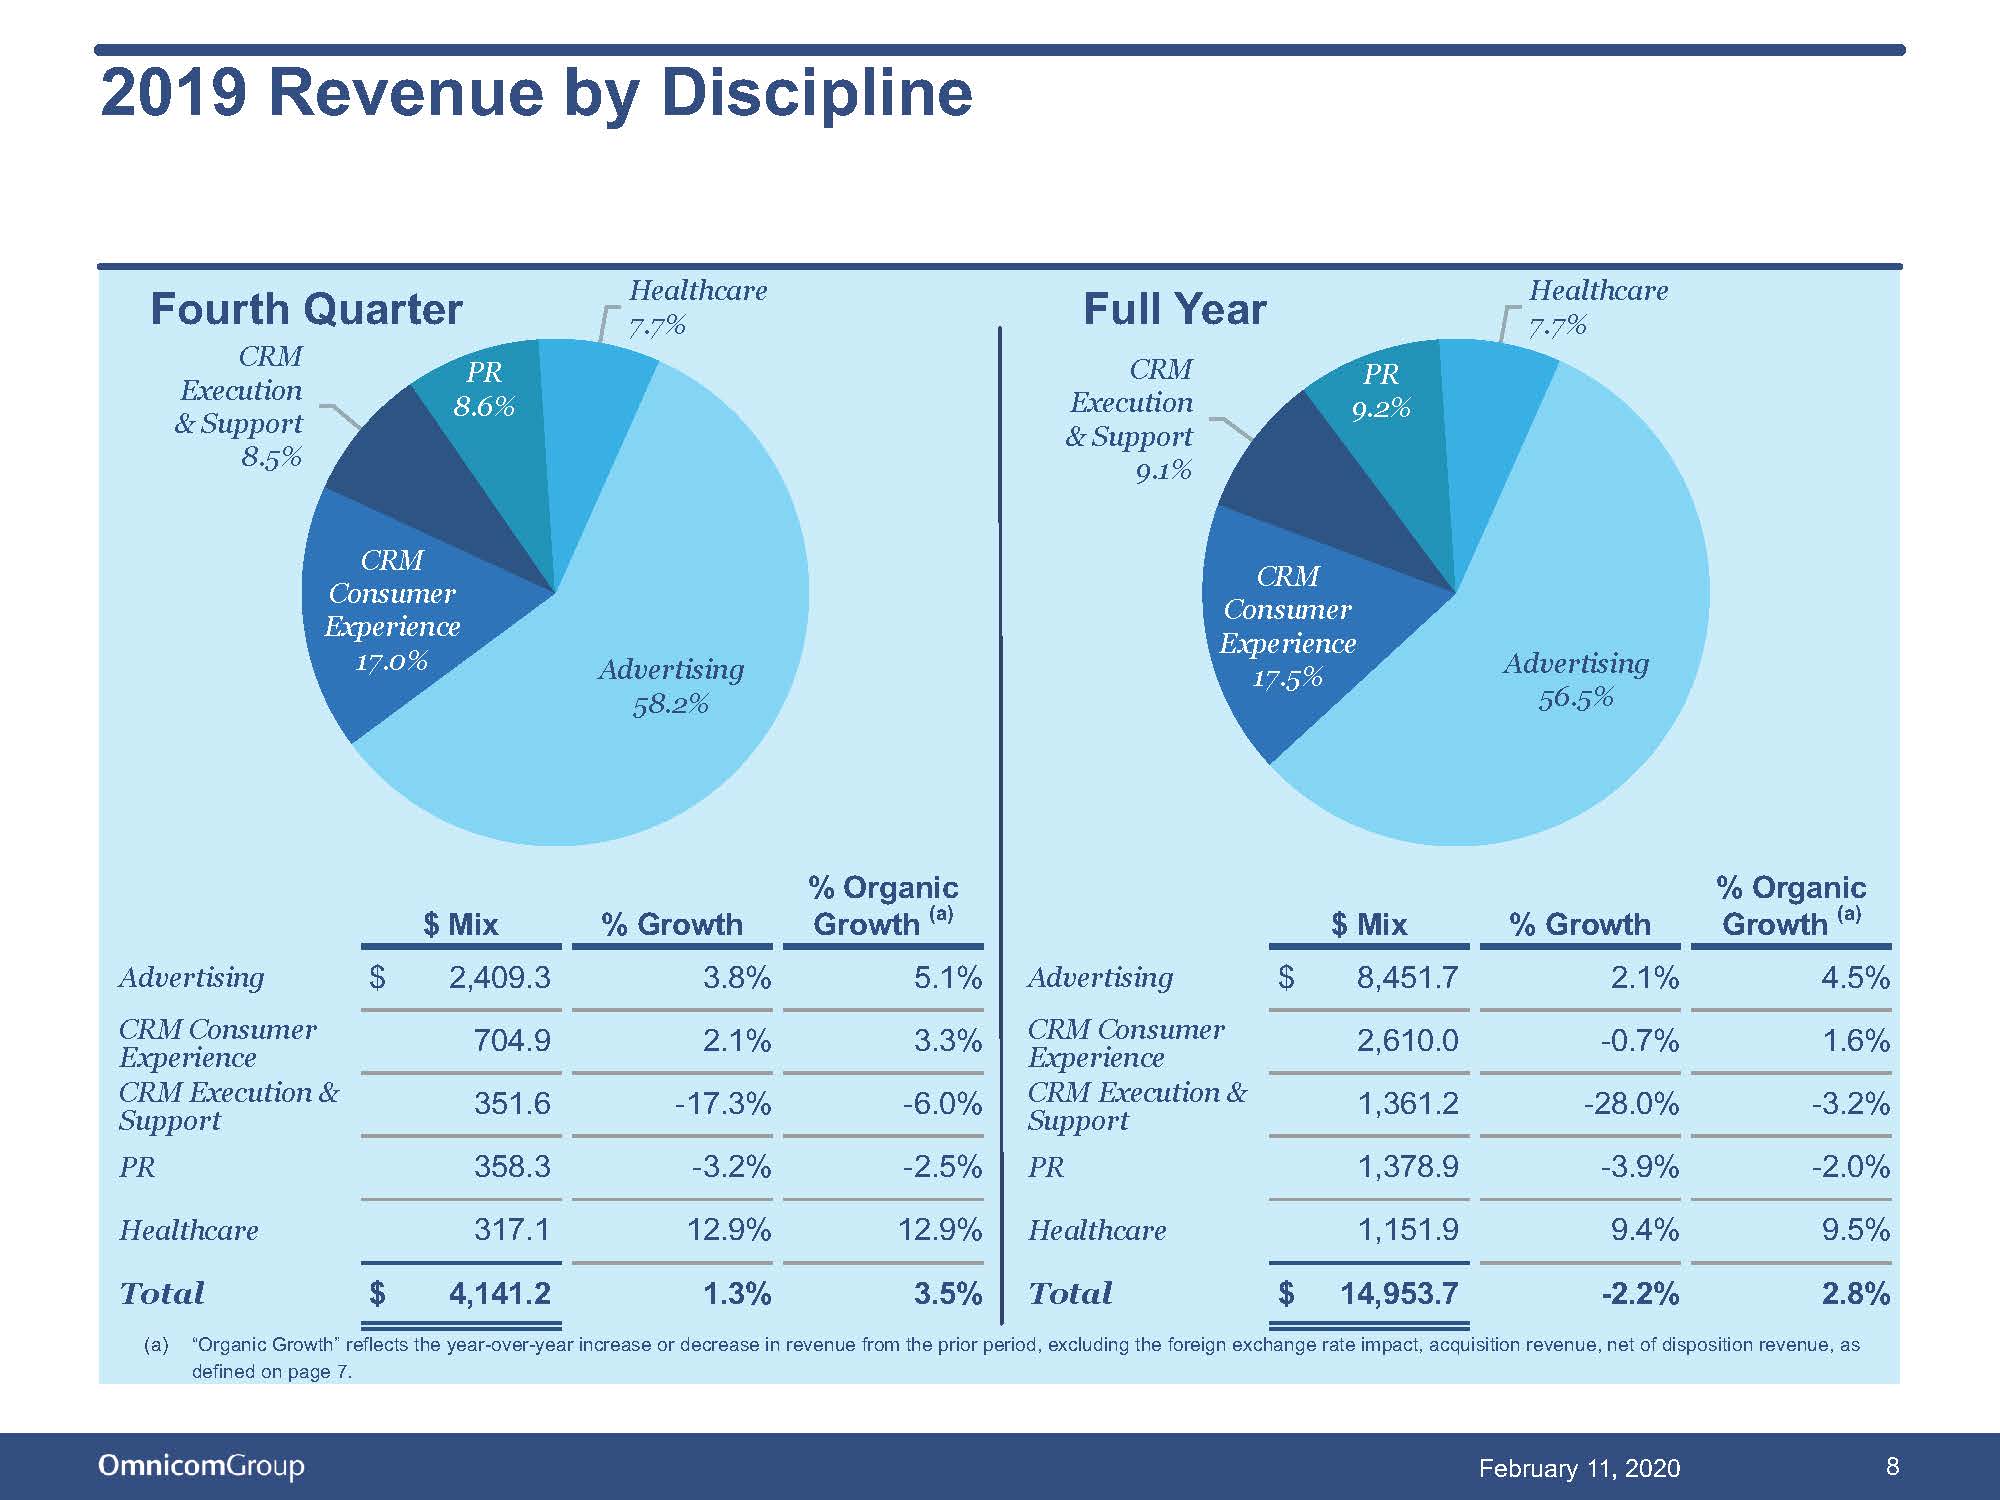
Organic growth in the fourth quarter of 2019 as compared to the fourth quarter of 2018 in our five fundamental disciplines was as follows: Advertising increased 5.1%, CRM Consumer Experience increased 3.3%, CRM Execution & Support decreased 6.0%, Public Relations decreased 2.5% and Healthcare increased 12.9%.
Across our regional markets, organic growth in the fourth quarter of 2019 as compared to the fourth quarter of 2018 was as follows: the United States increased 2.8%, Other North America decreased 2.3%, the United Kingdom increased 3.3%, the Euro Markets and Other Europe increased 4.7%, Asia Pacific increased 4.5%, Latin America decreased 1.3% and the Middle East and Africa increased 19.5%.
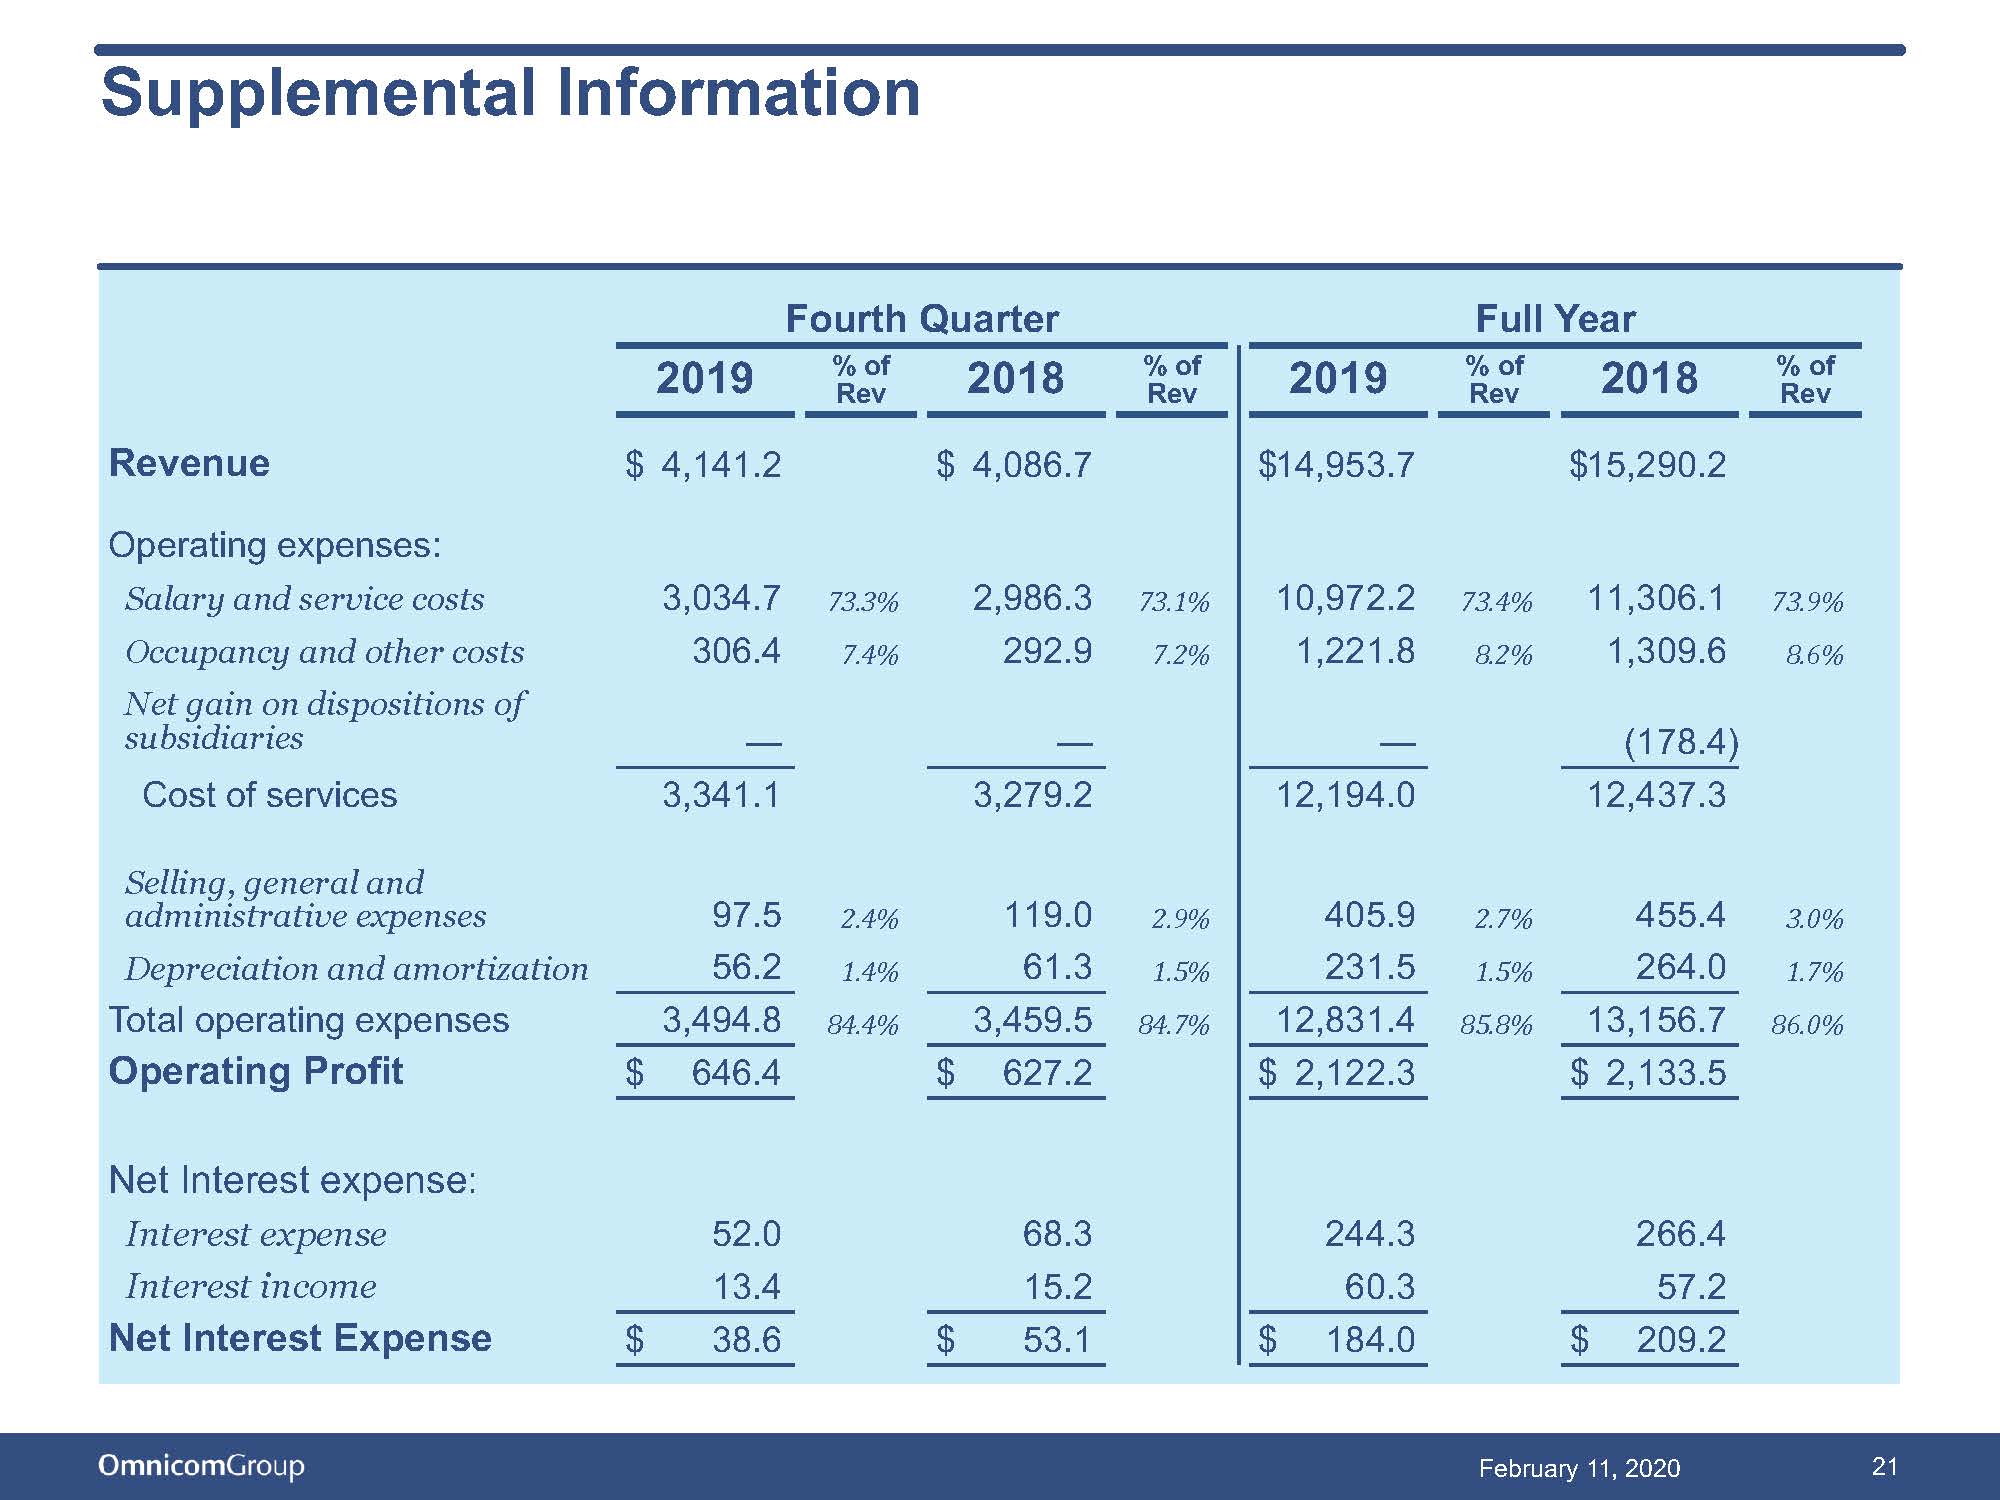
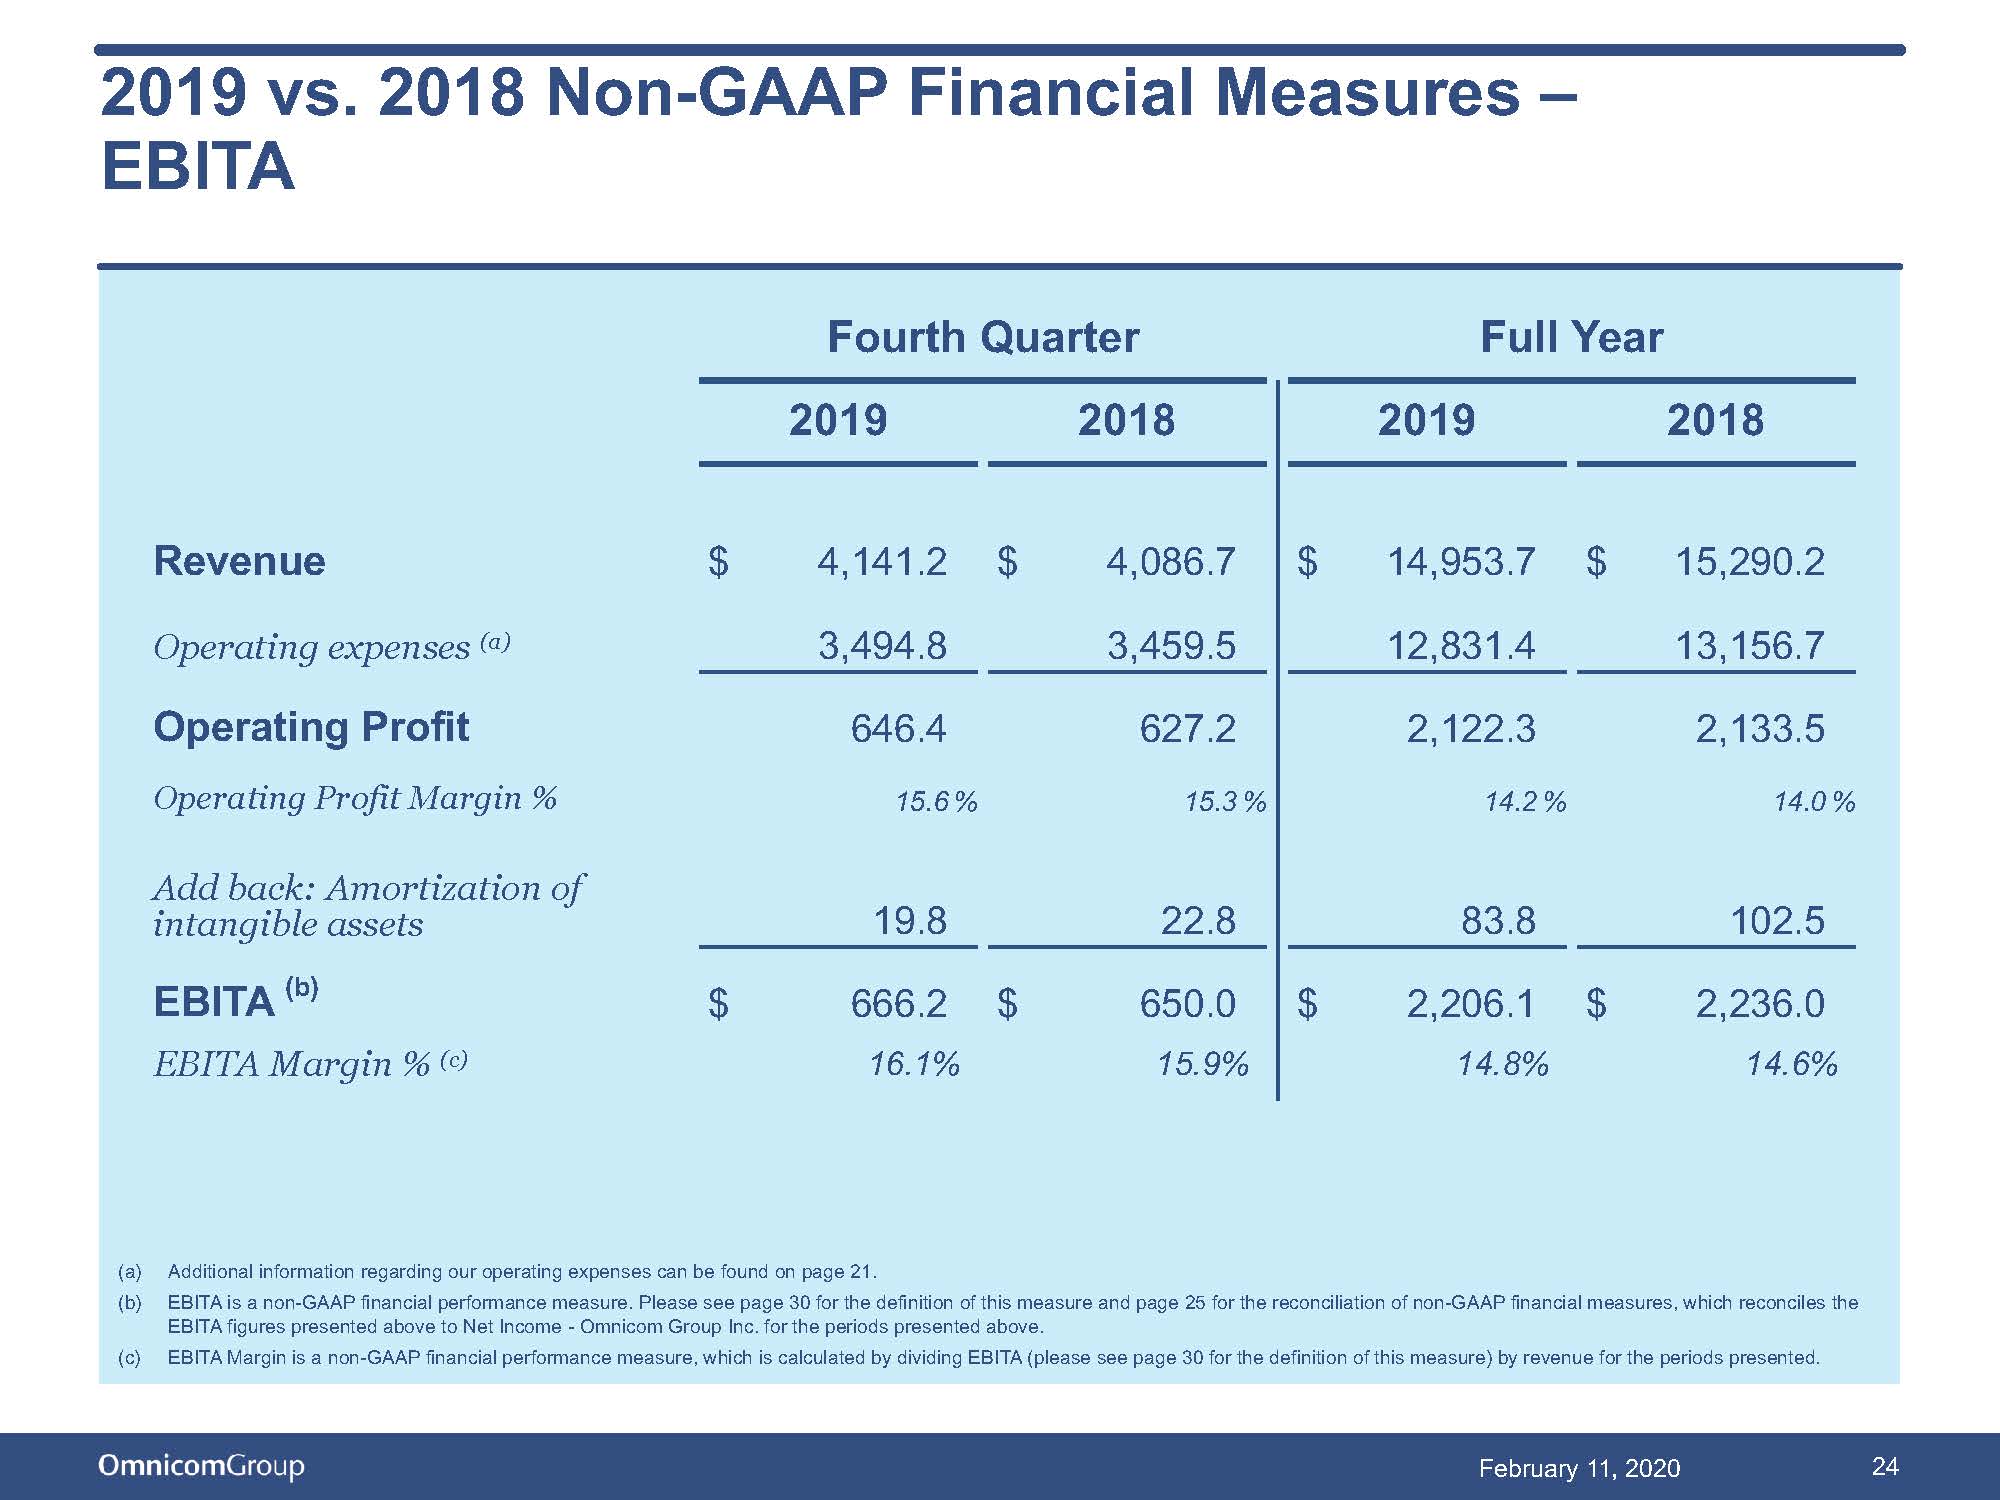
Operating profit in the fourth quarter of 2019 increased $19.2 million, or 3.1%, to $646.4 million from $627.2 million during the fourth quarter of 2018. Our operating margin for the fourth quarter of 2019 increased to 15.6% versus 15.3% for the fourth quarter of 2018.
For the fourth quarter of 2019, our effective income tax rate was 26.1%, which was unchanged when compared to the same period in 2018.

Omnicom Group Inc.
Full Year
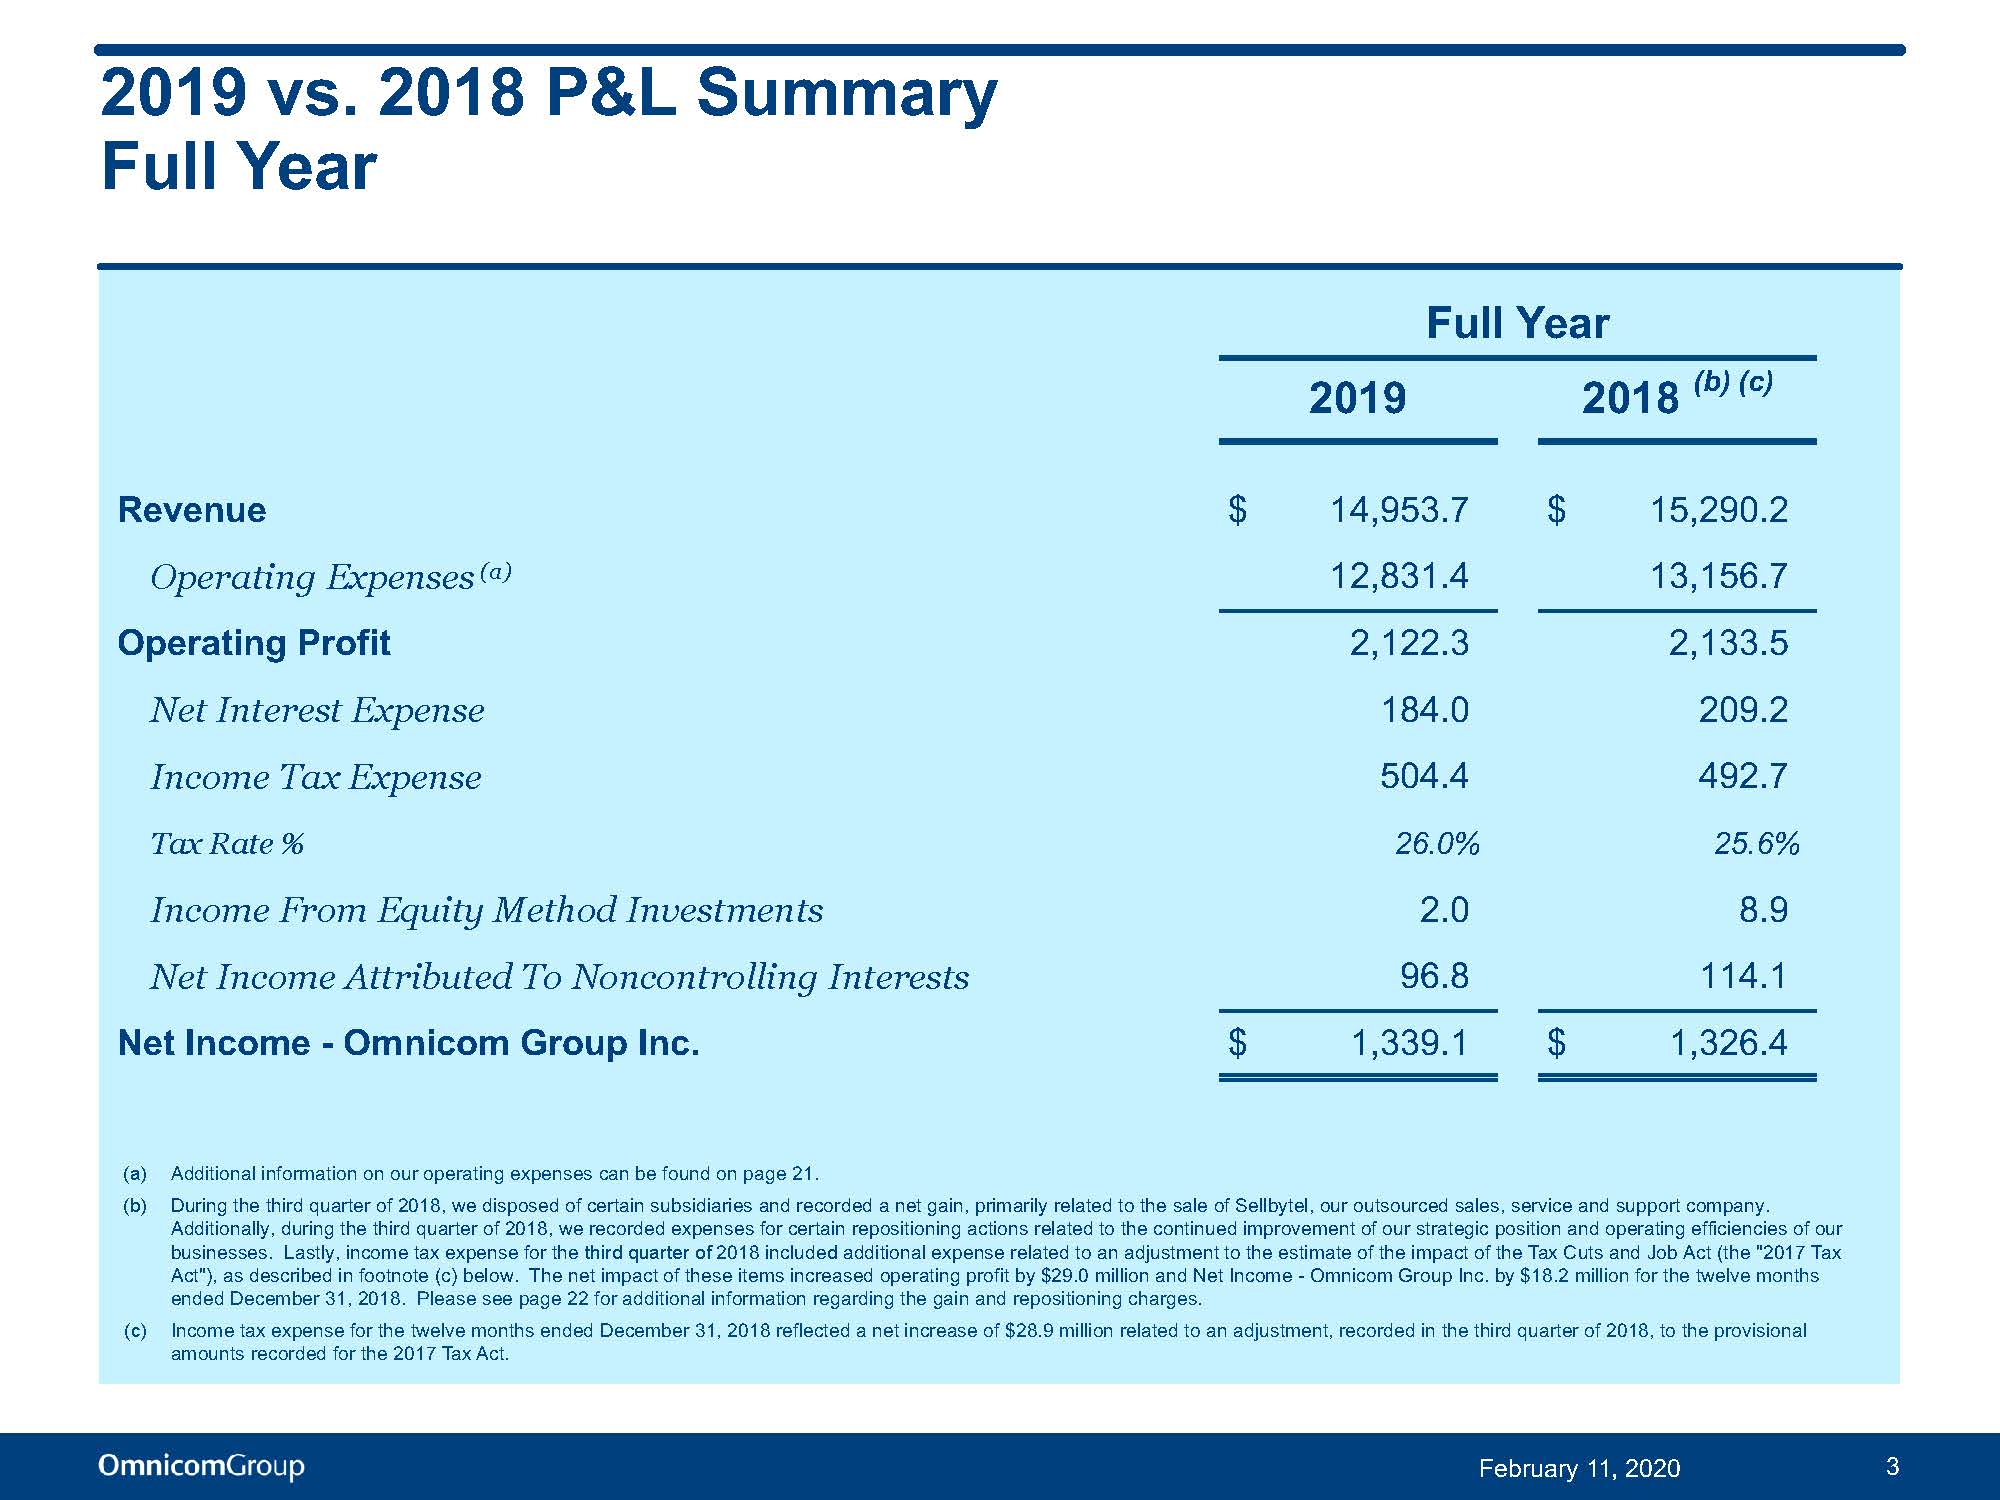
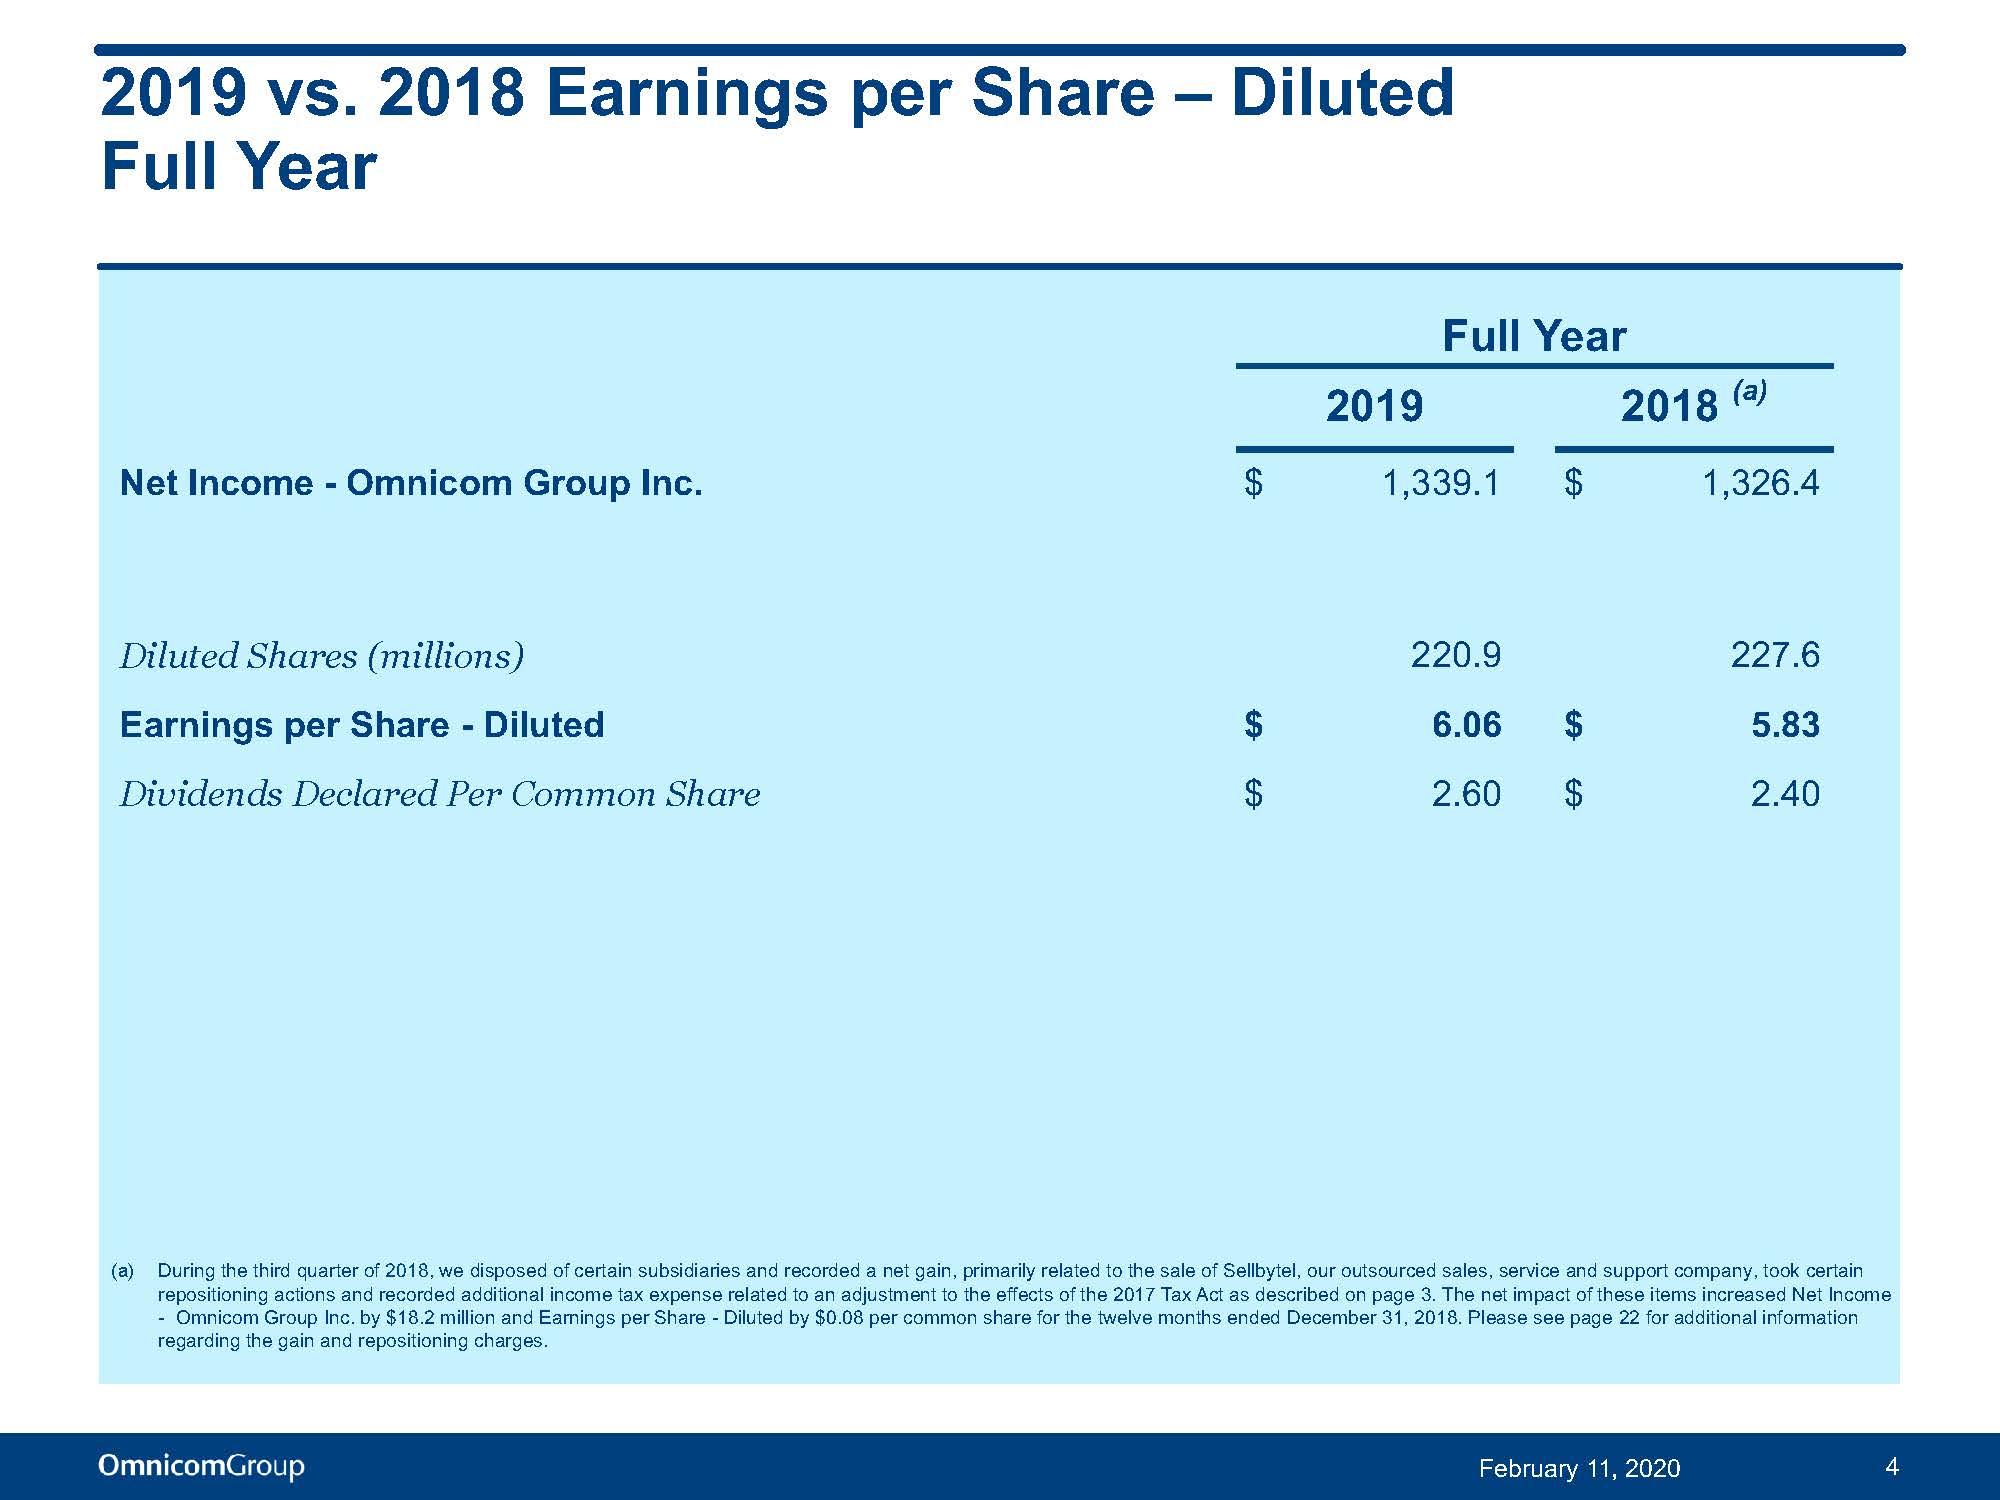
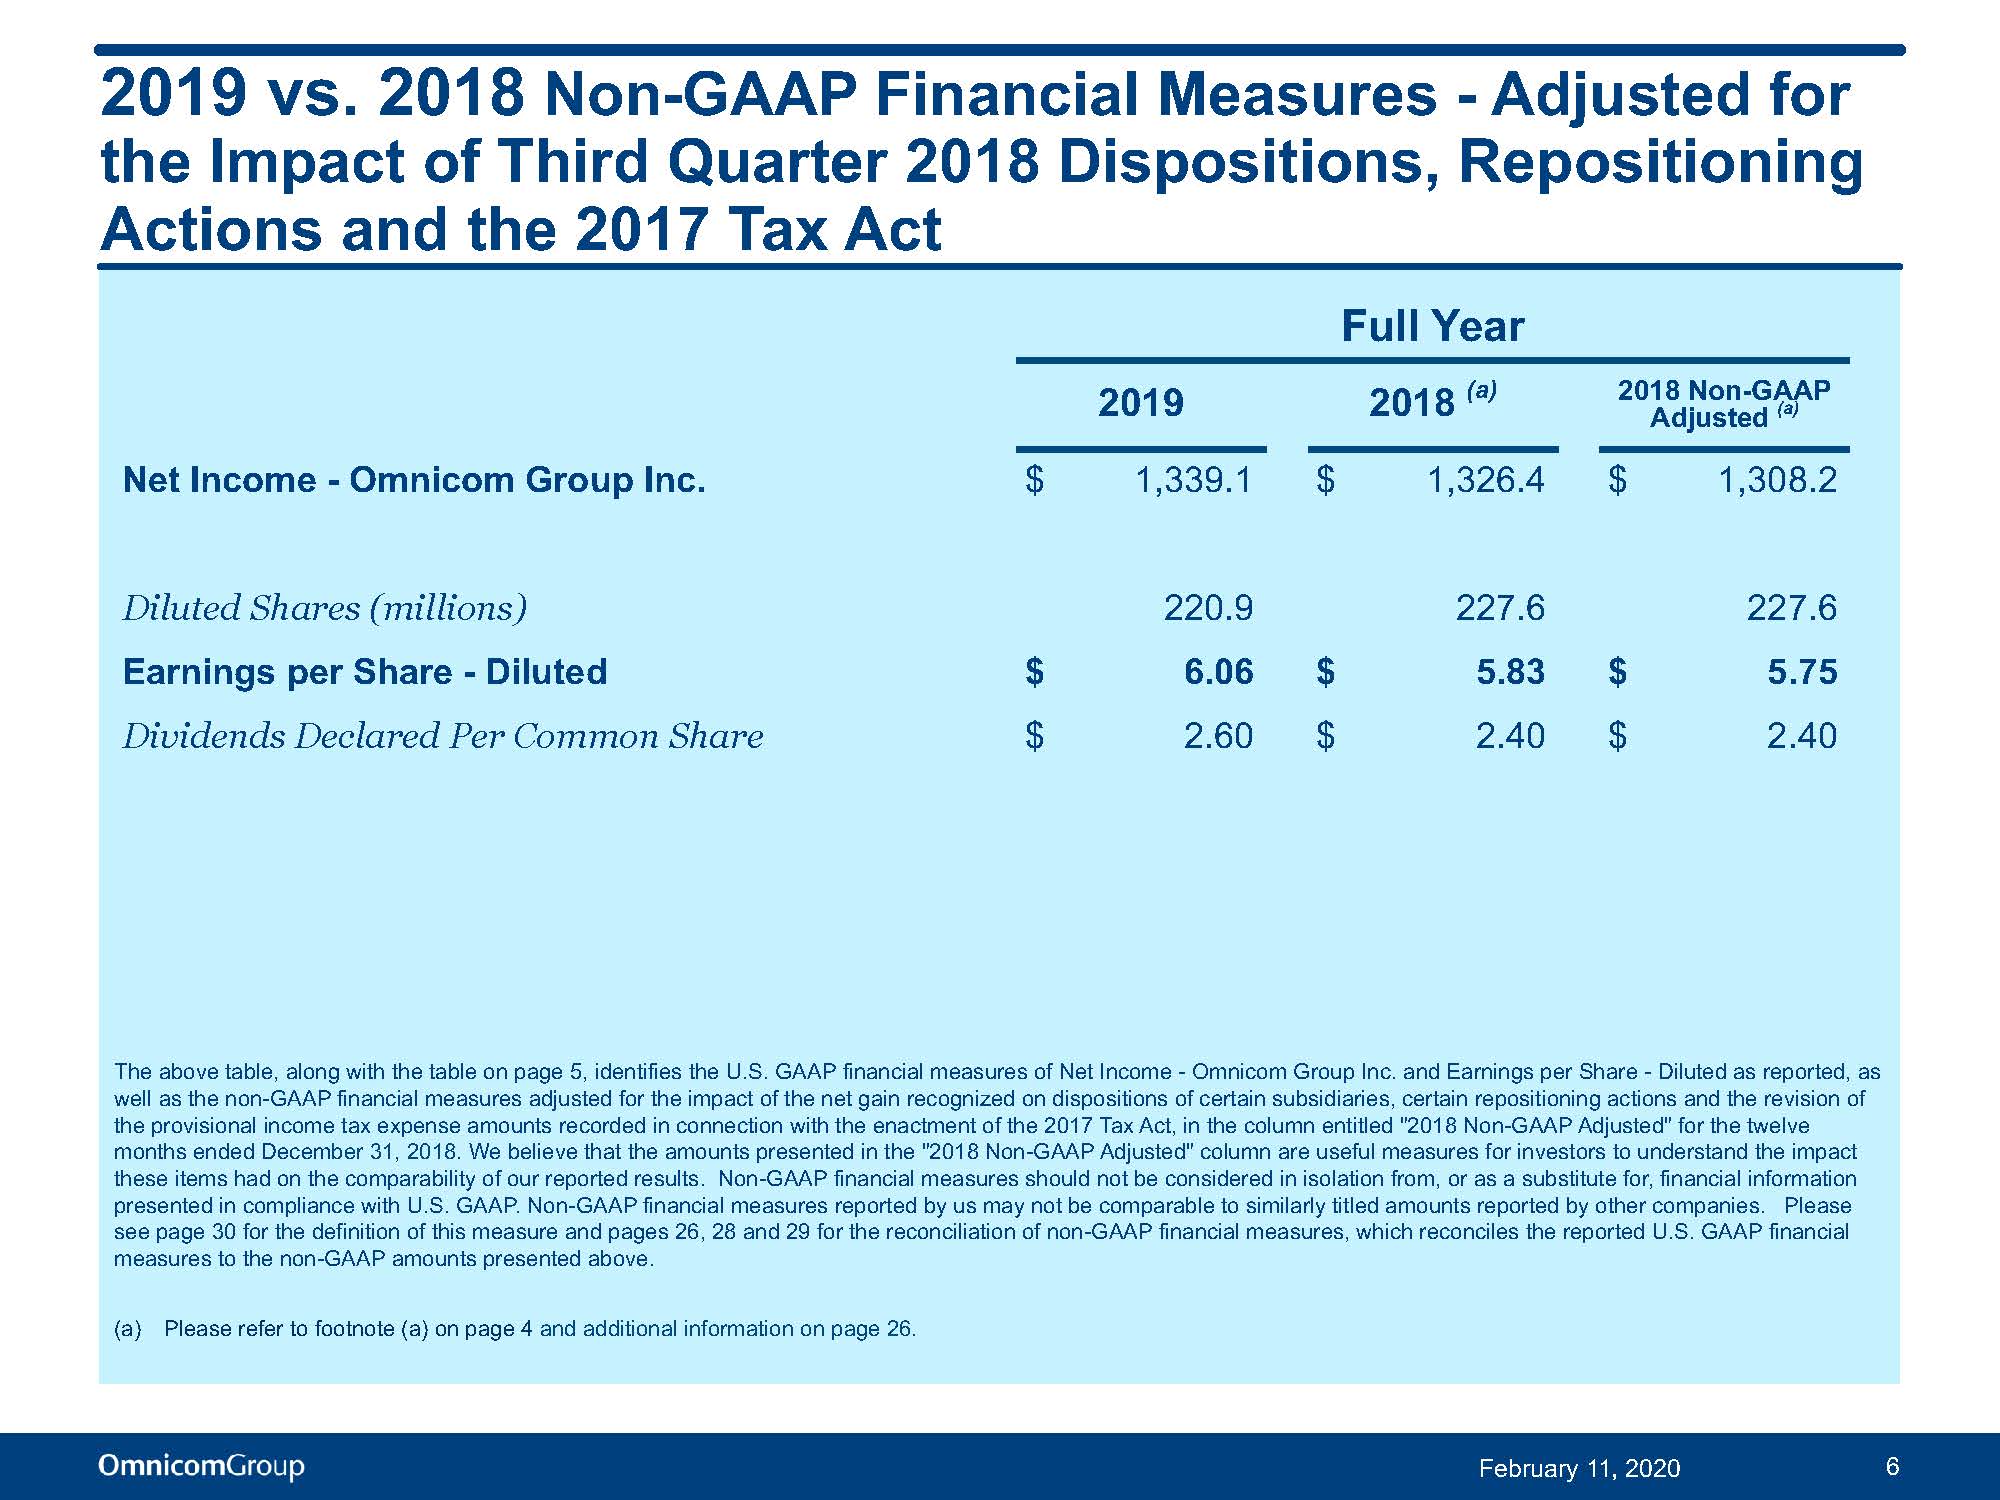
Diluted net income per share for the twelve months ended December 31, 2019 increased twenty-three cents, or 3.9%, to $6.06 per share compared to $5.83 per share for the twelve months ended December 31, 2018. Net income - Omnicom Group Inc. for the twelve months ended December 31, 2019 increased $12.7 million, or 1.0%, to $1,339.1 million compared to $1,326.4 million in the same period in 2018.
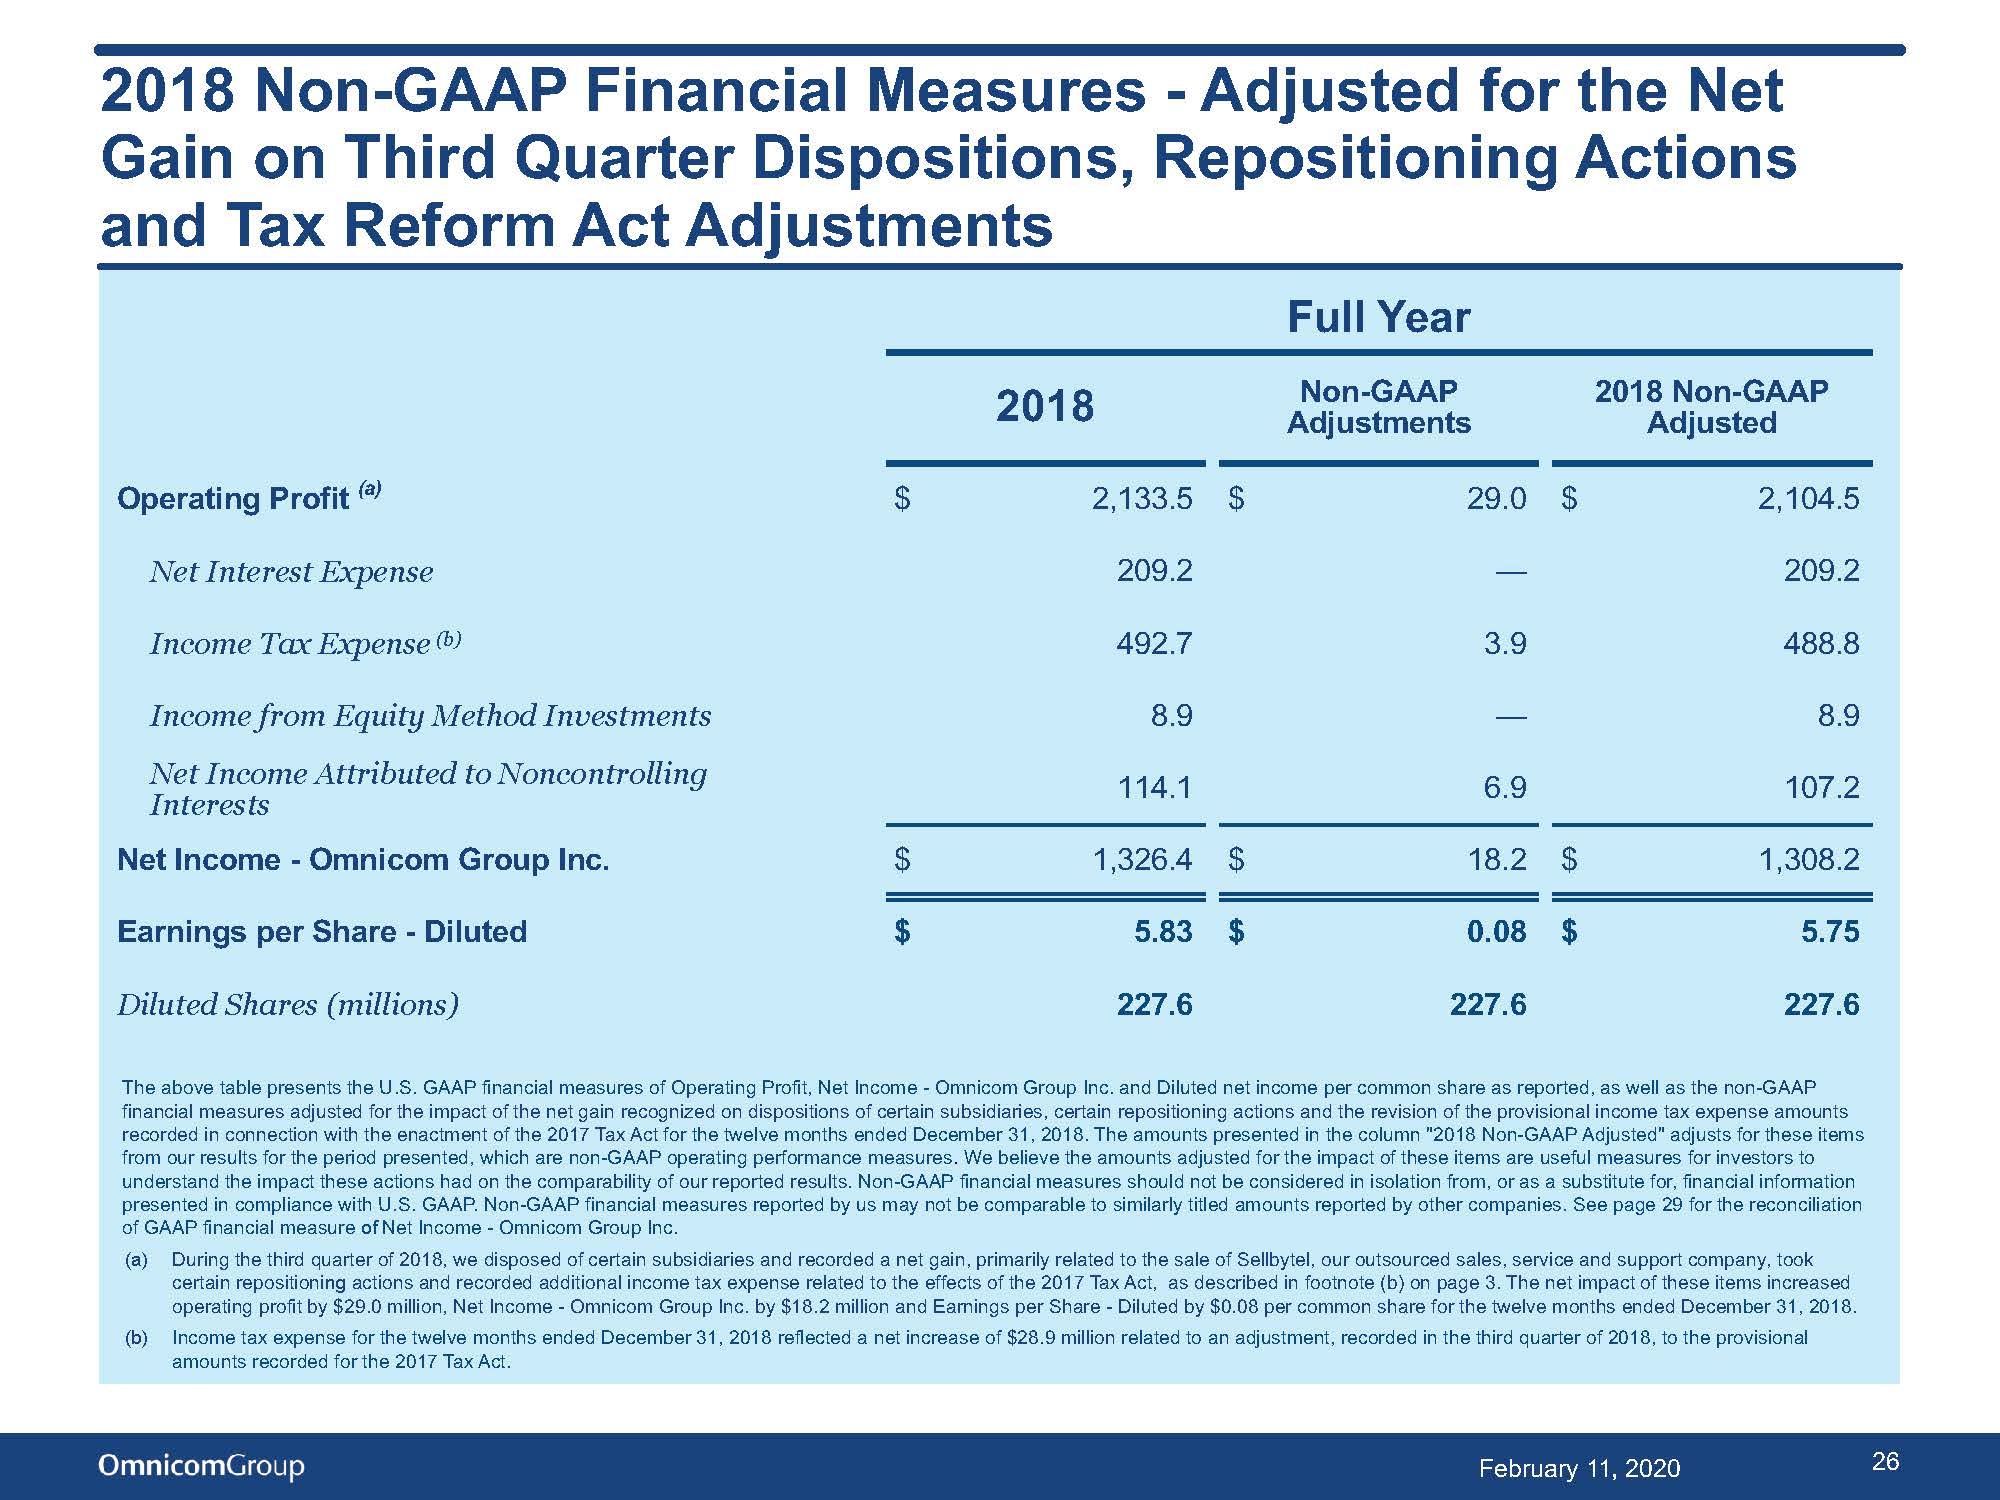
Net income - Omnicom Group Inc. for the twelve months ended December 31, 2018 includes a net after-tax increase of $18.2 million as a result of a net gain on dispositions of certain subsidiaries, less charges in connection with repositioning actions and an increase to income tax expense for adjustments related to the 2017 provisional amounts for the effect of the Tax Cuts and Jobs Act (the "2017 Tax Act"), as discussed further below.
Adjusting for the impact of those items, net income - Omnicom Group Inc. for the twelve months ended December 31, 2019 would have increased $30.9 million and diluted net income per share would have increased thirty-one cents per share, or 5.4%.
Primarily due to the negative effects of foreign exchange rates and disposition activity in excess of acquisitions over the past year, worldwide revenue for the twelve months ended December 31, 2019 decreased 2.2% to $14,953.7 million from $15,290.2 million in the same period of 2018. The components of the change in revenue included a decrease in revenue from the negative impact of foreign currency translation of 2.1%, a decrease in acquisition revenue, net of disposition revenue of 2.9% and an increase in revenue from organic growth of 2.8% when compared to the same period of 2018.
Organic growth for the twelve months ended December 31, 2019 compared to the same period in 2018 in our five fundamental disciplines was as follows: Advertising increased 4.5%, CRM Consumer Experience increased 1.6%, CRM Execution & Support decreased 3.2%, Public Relations decreased 2.0% and Healthcare increased 9.5%.
Across our regional markets, organic growth for the twelve months ended December 31, 2019 as compared to the same period of 2018 was as follows: the United States increased 2.7%, Other North America increased 4.2%, the United Kingdom increased 3.3%, the Euro Markets and Other Europe increased 3.0%,
Page 2
Omnicom Group Inc.
Asia Pacific increased 2.2%, Latin America decreased 0.2% and the Middle East and Africa increased 6.5%.
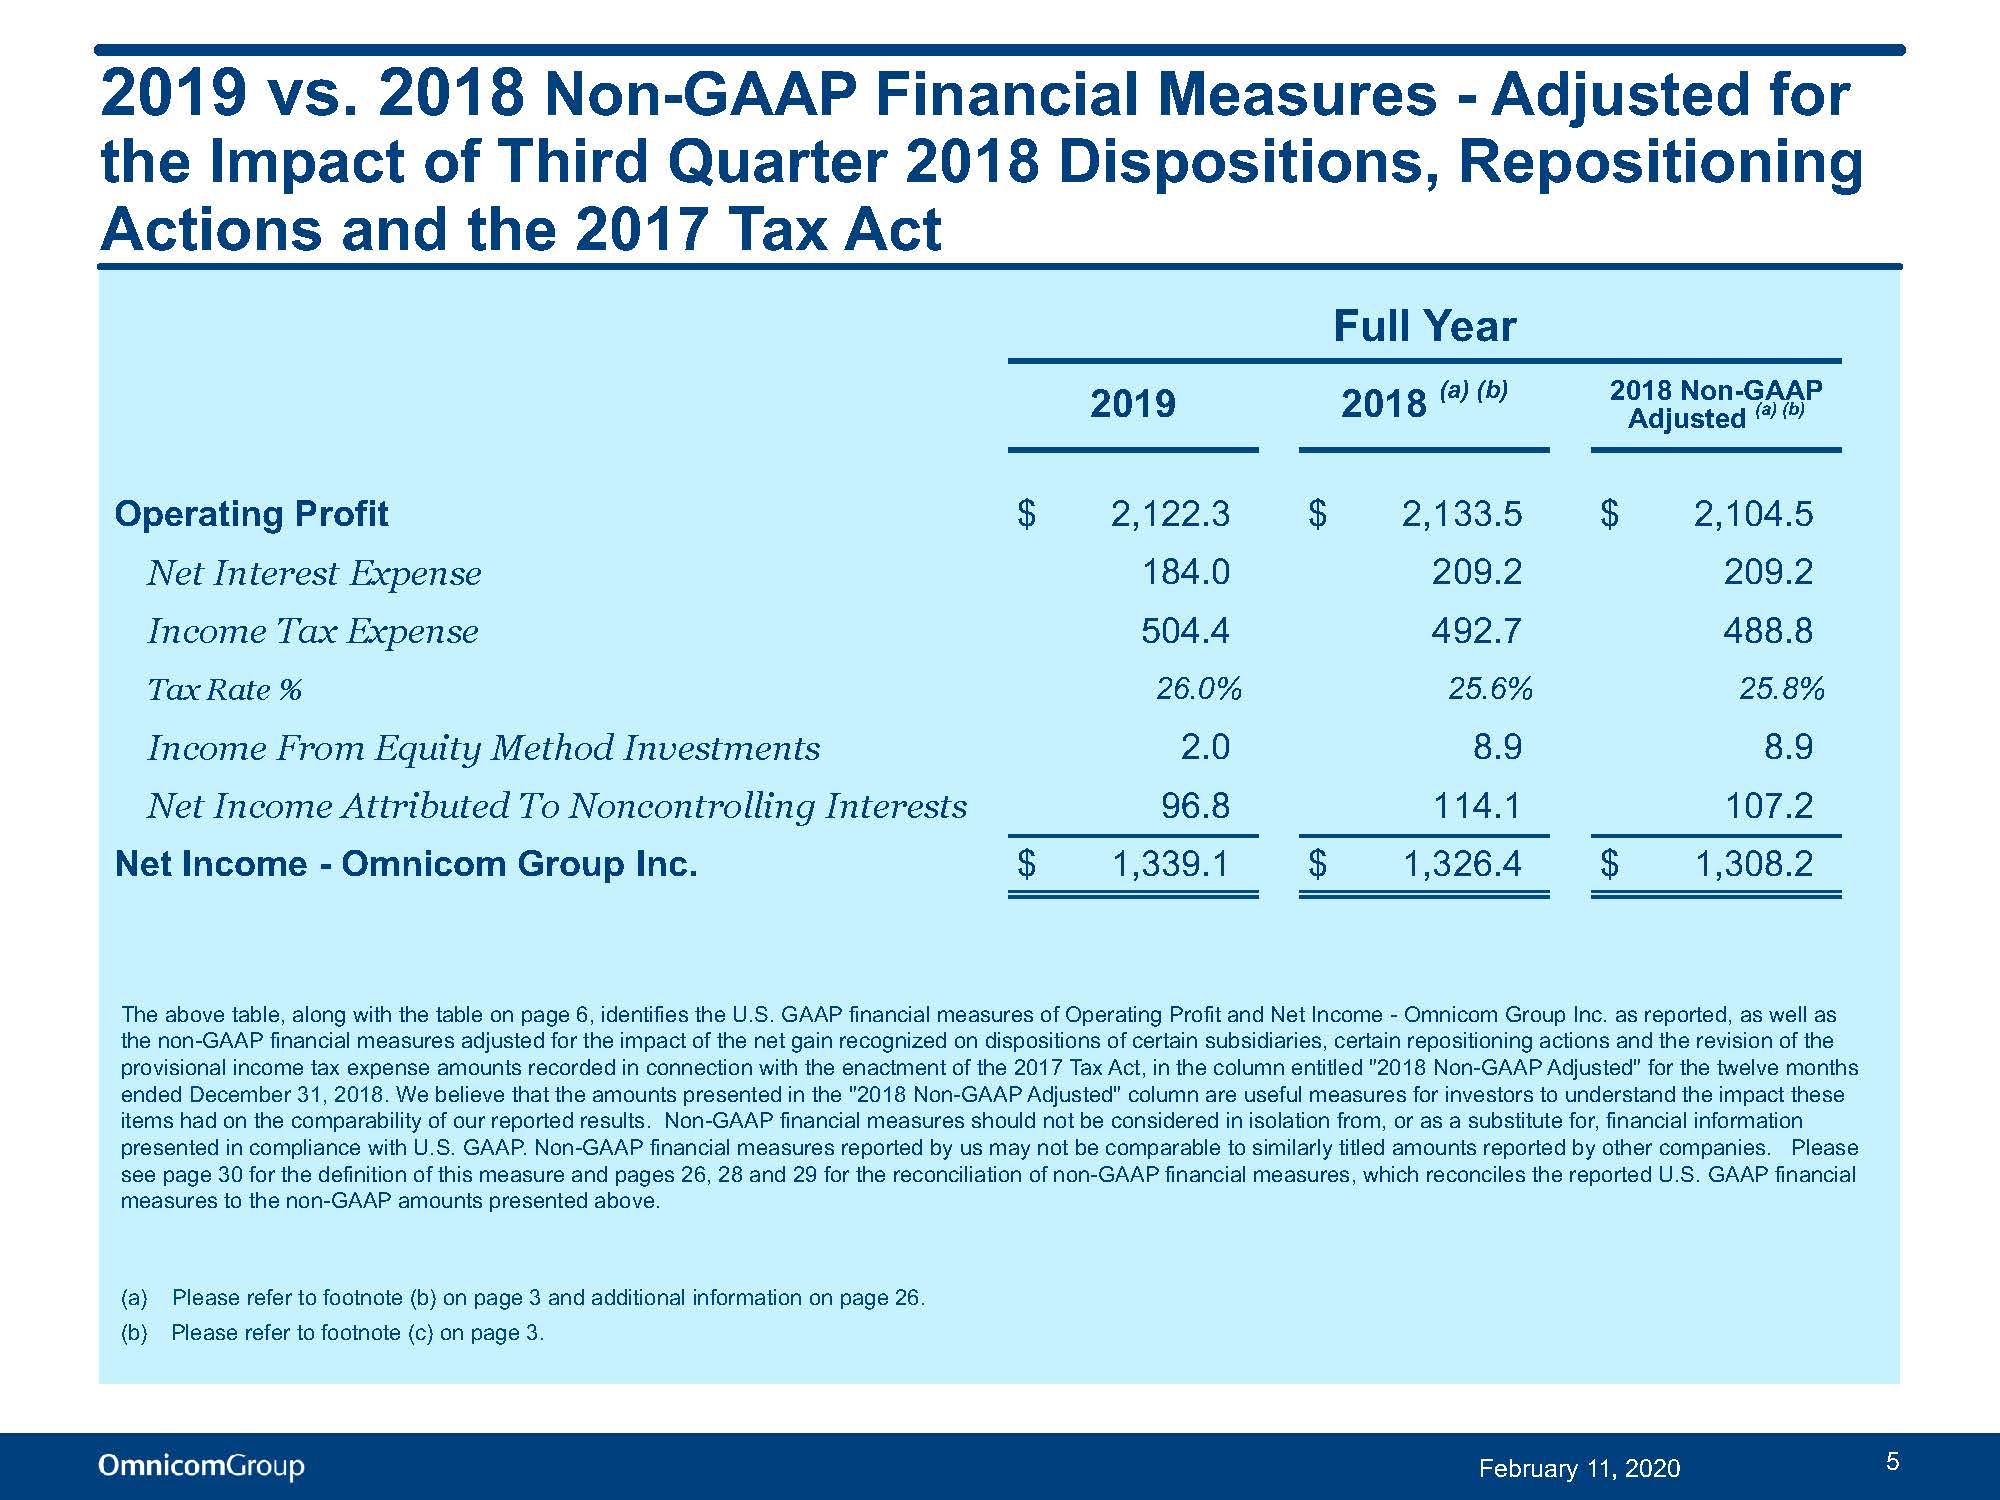
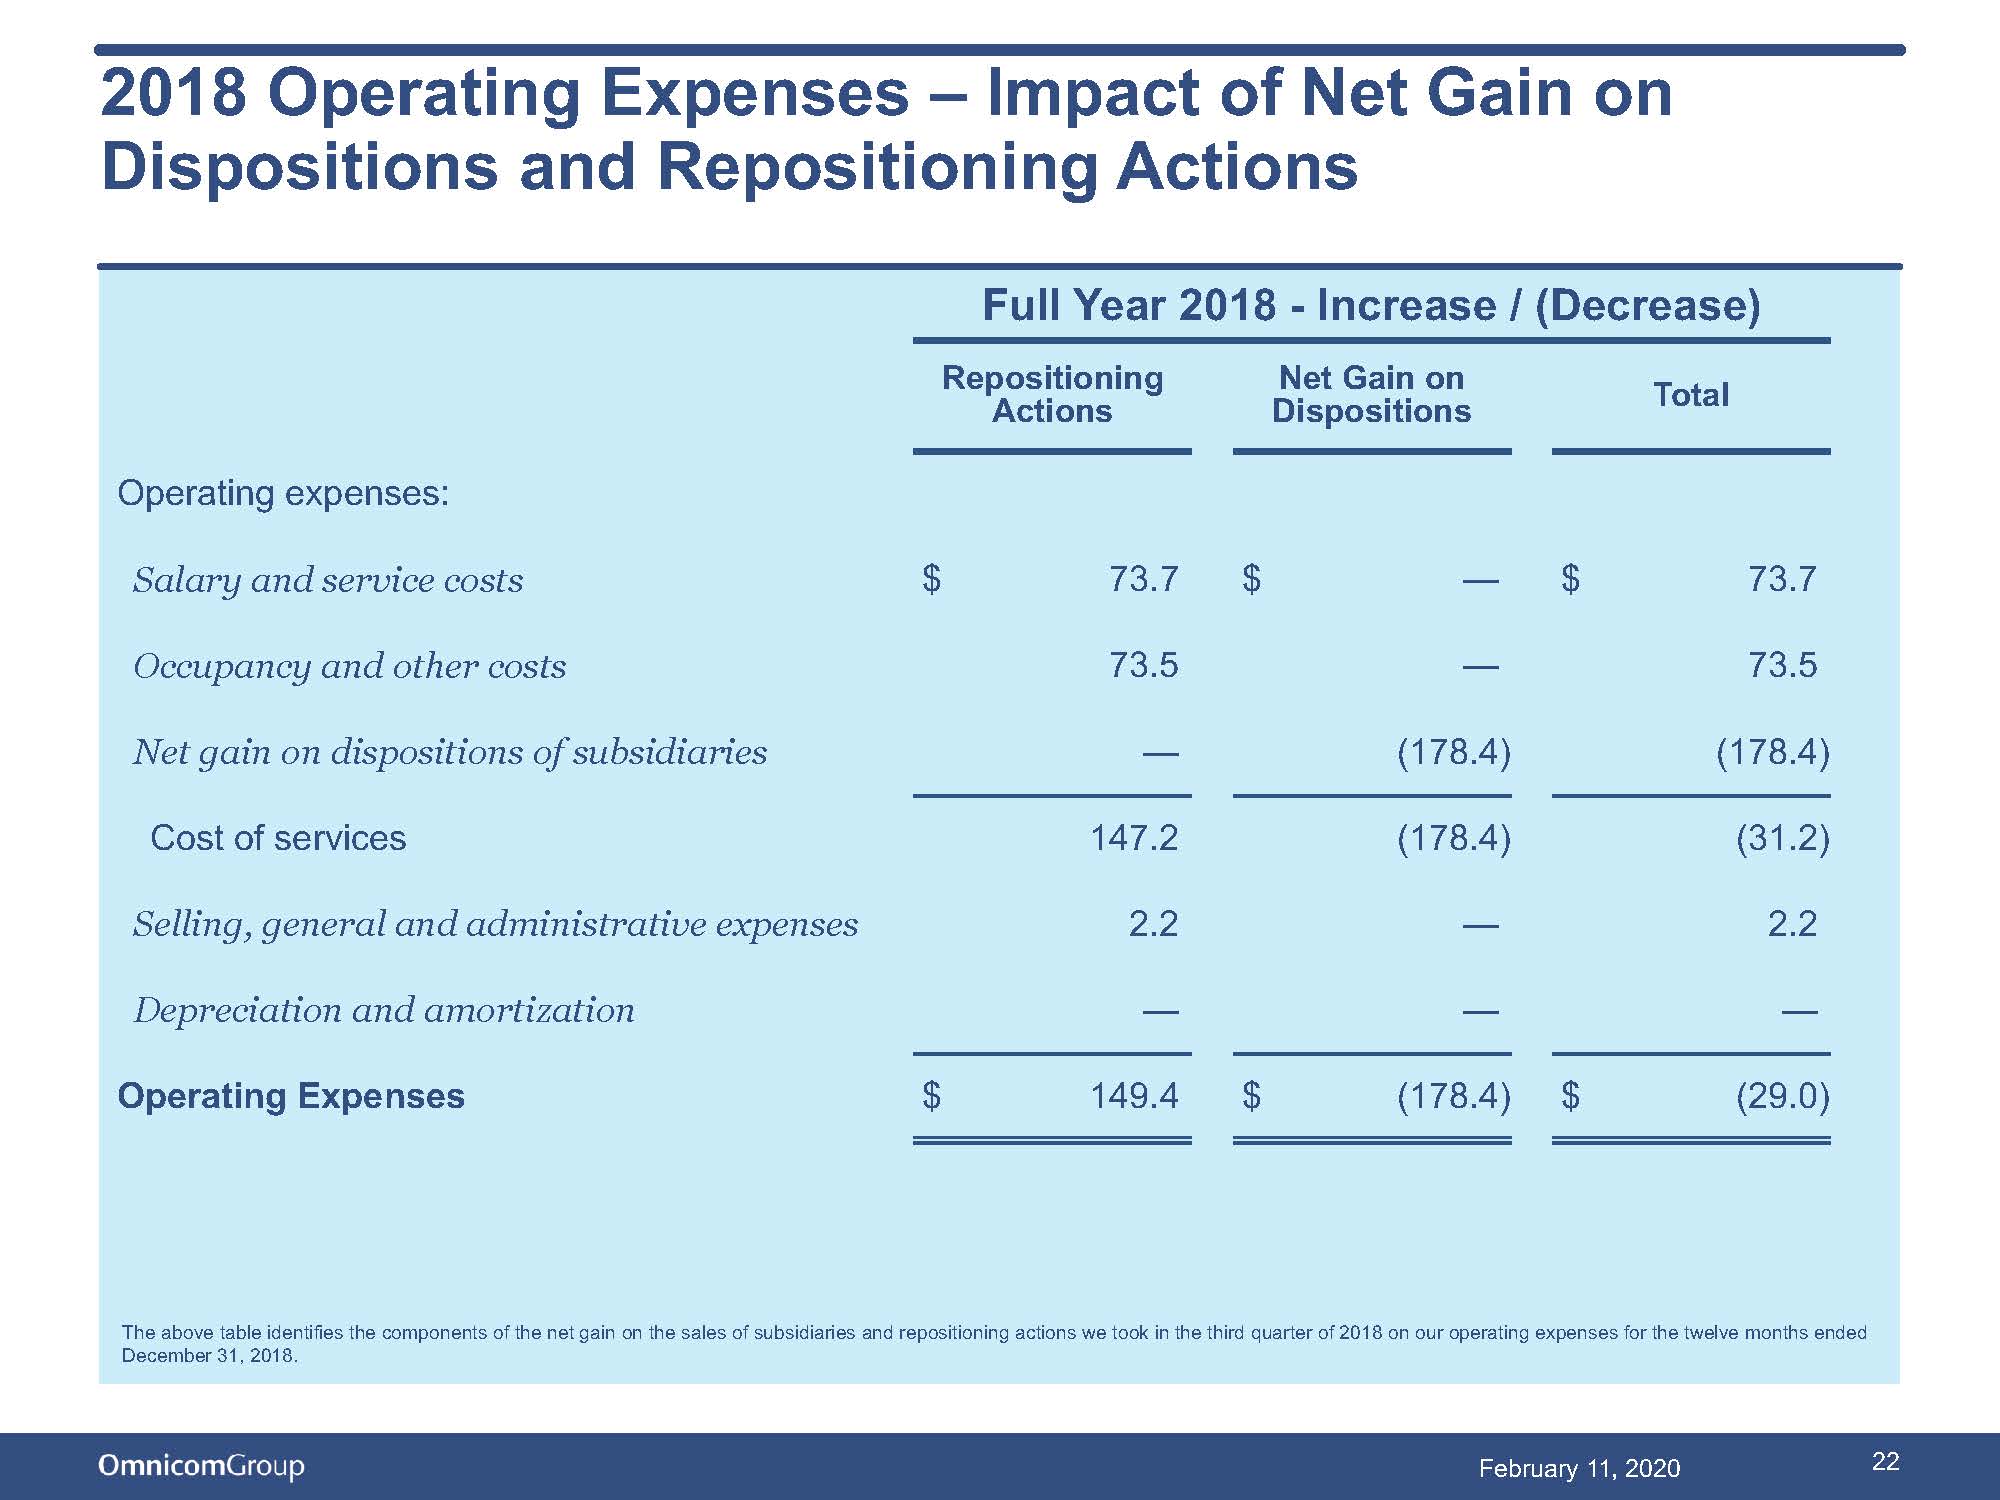
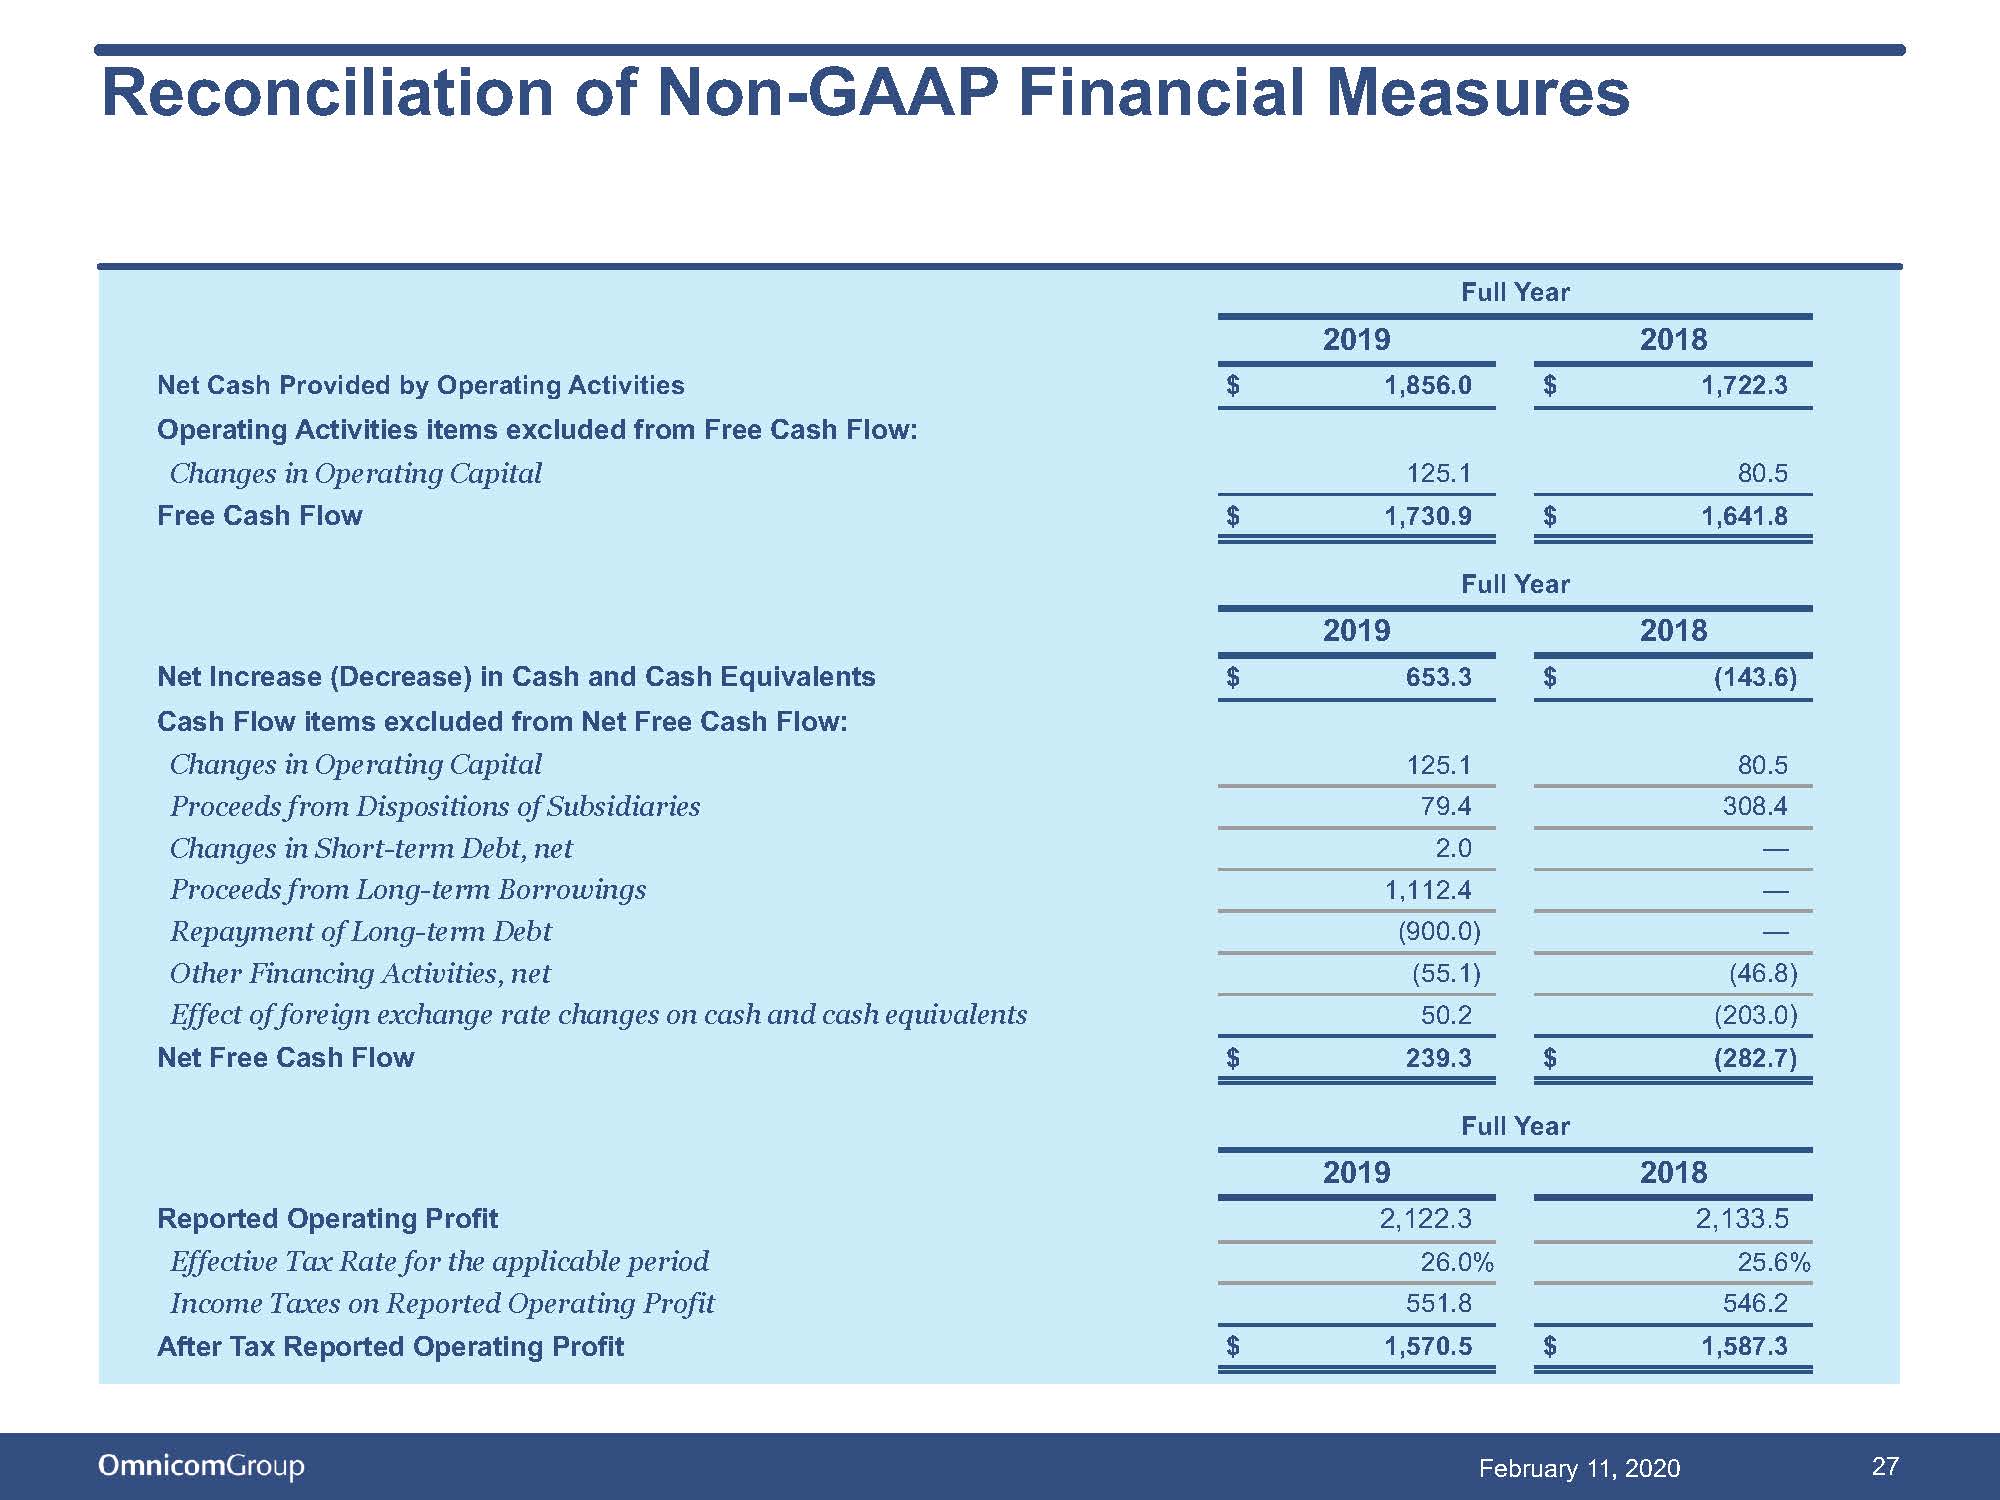
Operating profit for the twelve months ended December 31, 2019 decreased $11.2 million, or 0.5%, to $2,122.3 million from $2,133.5 million for the twelve months ended December 31, 2018. Our operating margin for the twelve months ended December 31, 2019 increased to 14.2% versus 14.0% for the same period of 2018. Operating profit for the twelve months ended December 31, 2018 reflects a net pre-tax increase of $29.0 million from the net gain on dispositions of certain subsidiaries of $178.4 million, which arose primarily from the sale of Sellbytel, our European-based outsourced sales, service and support business, less expenses of $149.4 million in connection with repositioning actions related to the continuing improvement of the strategic position and operating efficiencies of our businesses.
Adjusting for the impact of those items, operating profit for the twelve months ended December 31, 2019 increased $17.8 million, or 0.8%, to $2,122.3 million from $2,104.5 million for the same period in 2018, while operating margin for the twelve months ended December 31, 2019 increased to 14.2% versus 13.8% for the same period of 2018.
For the twelve months ended December 31, 2019, our effective income tax rate was 26.0% compared to 25.6% for the same period in 2018. The effective tax rate for the twelve months of 2018 reflects the impact of a lower tax rate on the net gain on dispositions of subsidiaries in the third quarter of 2018, substantially offset by an increase in tax expense reflecting an adjustment to the provisional amounts related to the 2017 Tax Act.
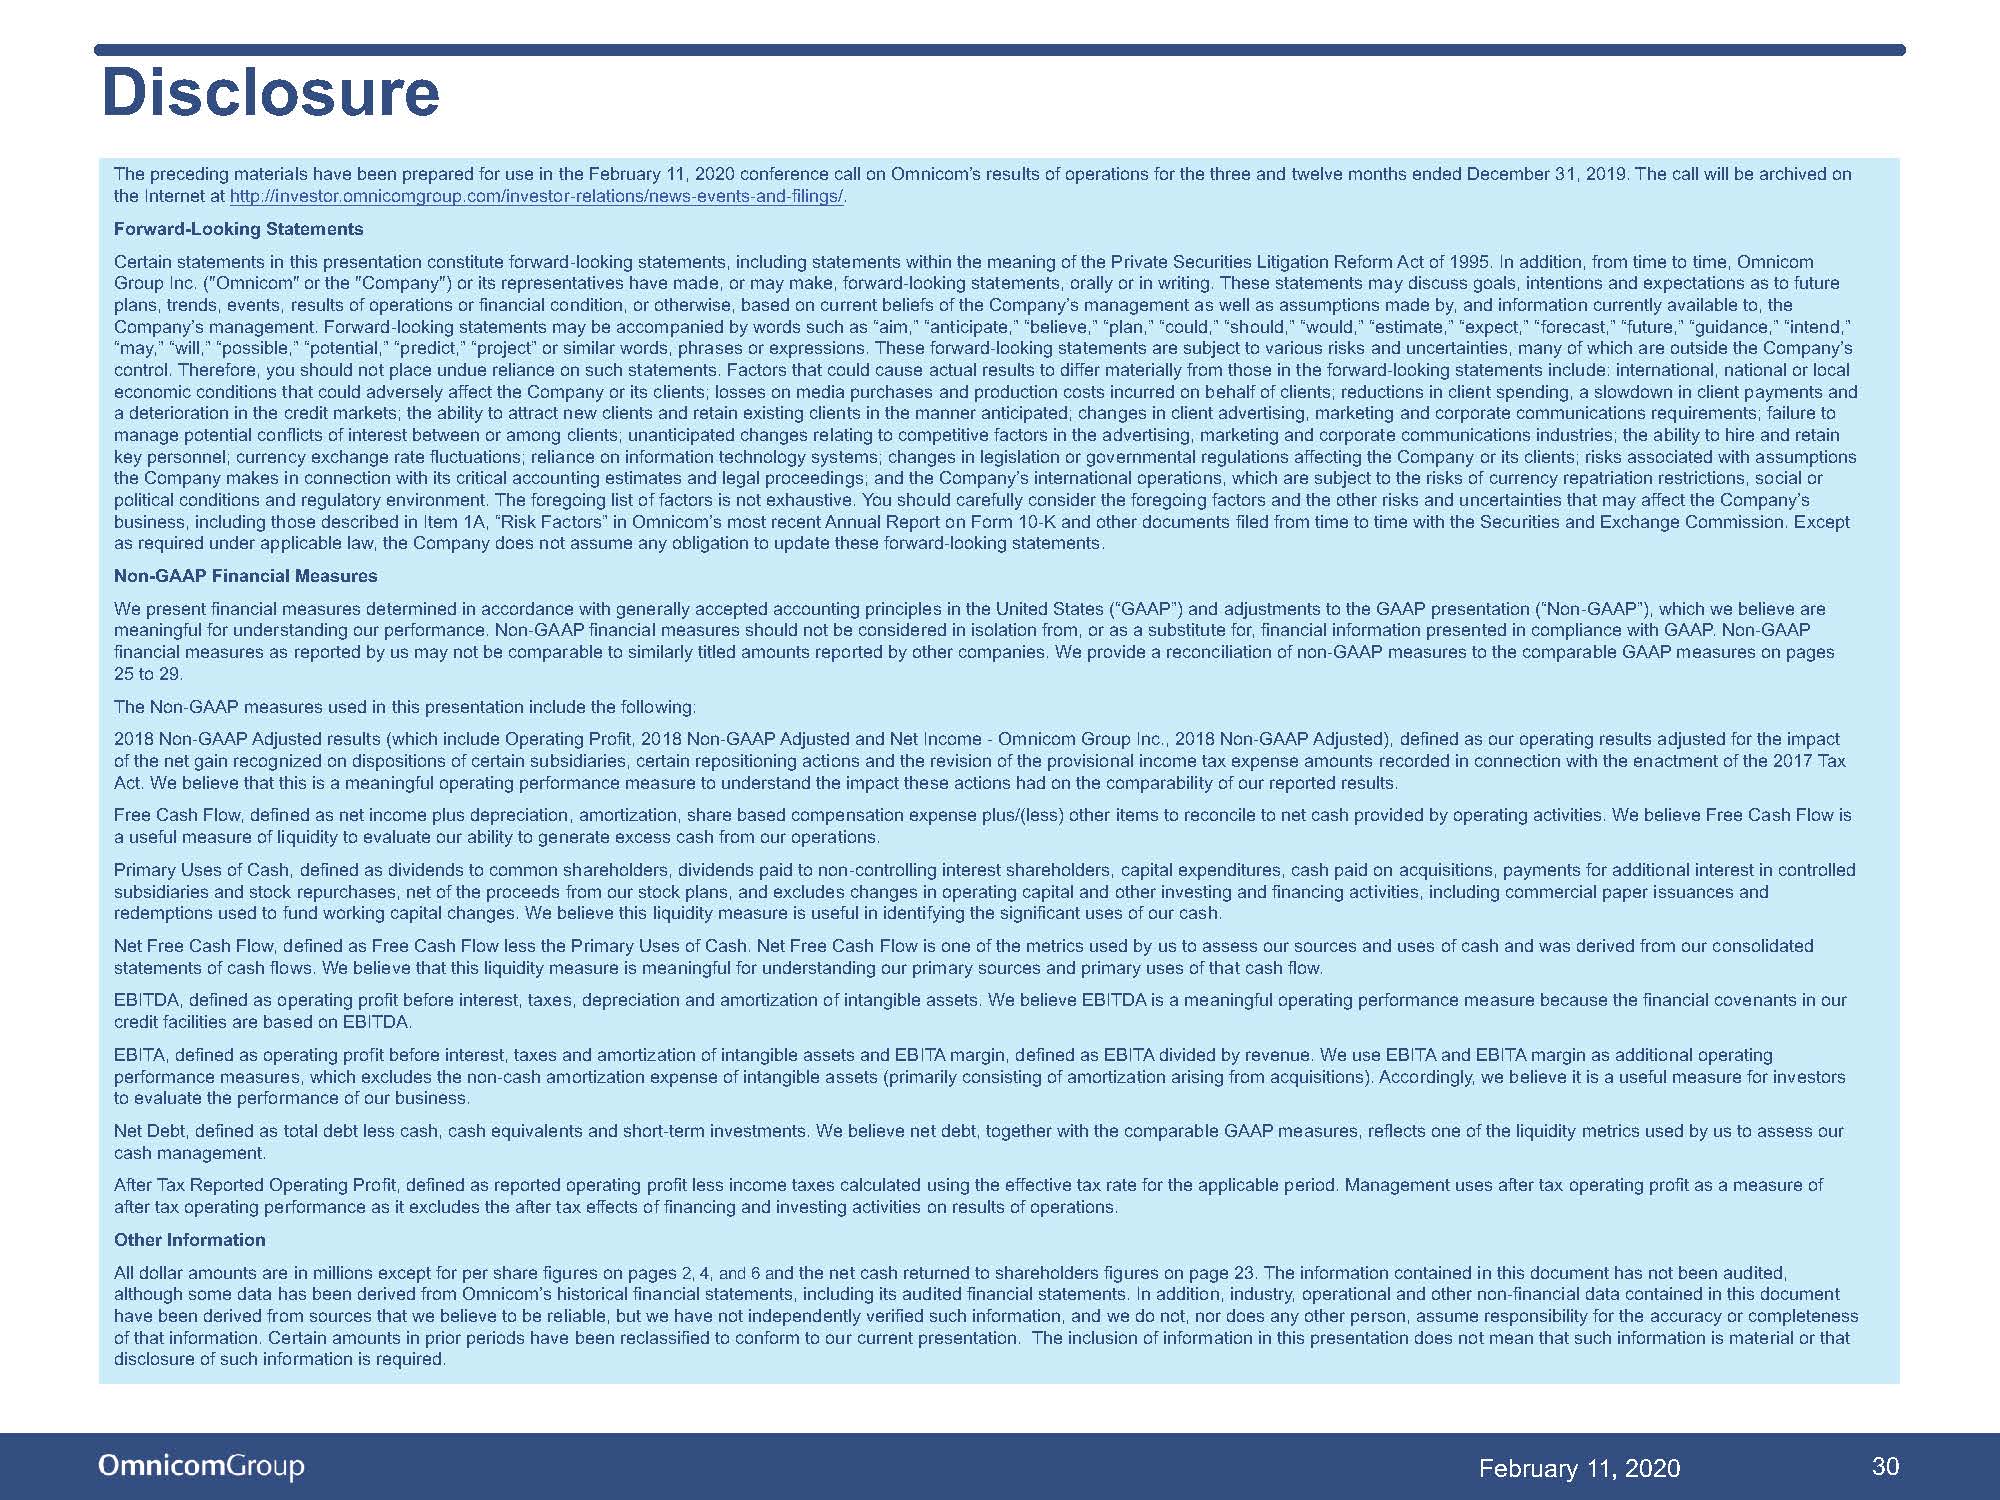
Non-GAAP Financial Measures
We use certain non-GAAP financial measures in describing our performance. 2018 Non-GAAP Adjusted results (which include Operating Profit - 2018 Non-GAAP Adjusted and Net Income - Omnicom Group Inc., 2018 Non-GAAP Adjusted), which adjusts for the impact of the net gain recognized on dispositions of certain subsidiaries, certain repositioning actions and the revision of the provisional income tax expense amounts recorded in connection with the enactment of the 2017 Tax Act, are presented in the full year results presented above and in the tables in this release. We believe that the 2018 Non-GAAP Adjusted results are useful measures for investors to understand the impact these actions had on the comparability of our reported results.
Page 3
Omnicom Group Inc.
Non-GAAP financial measures should not be considered in isolation from, or as a substitute for, financial information presented in compliance with U.S. GAAP. Non-GAAP financial measures reported by us may not be comparable to similarly titled amounts reported by other companies.
Definitions - Components of Revenue Change
We use certain terms in describing the components of the change in revenue above.
Foreign exchange rate impact: calculated by translating the current period’s local currency revenue using the prior period average exchange rates to derive current period constant currency revenue. The foreign exchange rate impact is the difference between the current period revenue in U.S. Dollars and the current period constant currency revenue.
Acquisition revenue, net of disposition revenue: Acquisition revenue is calculated as if the acquisition occurred twelve months prior to the acquisition date by aggregating the comparable prior period revenue of acquisitions through the acquisition date. As a result, acquisition revenue excludes the positive or negative difference between our current period revenue subsequent to the acquisition date and the comparable prior period revenue and the positive or negative growth after the acquisition date is attributed to organic growth. Disposition revenue is calculated as if the disposition occurred twelve months prior to the disposition date by aggregating the comparable prior period revenue of disposals through the disposition date. The acquisition revenue and disposition revenue amounts are netted in the description above.
Organic growth: calculated by subtracting the foreign exchange rate impact component and the acquisition revenue, net of disposition revenue component from total revenue growth.
About Omnicom Group Inc.
Omnicom Group Inc. (NYSE: OMC) (www.omnicomgroup.com) is a leading global marketing and corporate communications company. Omnicom’s branded networks and numerous specialty firms provide advertising, strategic media planning and buying, digital and interactive marketing, direct and promotional marketing, public relations and other specialty communications services to over 5,000 clients in more than 100 countries. Follow us on Twitter for the latest news.
Page 4
For a live webcast or a replay of our fourth quarter earnings conference call, go to http://investor.omnicomgroup.com/investor-relations/news-events-and-filings.
Contacts
| Investor Relations: | Media: |
| Shub Mukherjee | Joanne Trout |
| shub.mukherjee@omnicomgroup.com | joanne.trout@omnicomgroup.com |
Page 5
Omnicom Group Inc.
Consolidated Statements of Income
Three Months Ended December 31
(Unaudited)
(Dollars in Millions, Except Per Share Data)
| 2019 | 2018 | ||||||
| Revenue | $ | 4,141.2 | $ | 4,086.7 | |||
| Operating Expenses: | |||||||
| Salary and service costs | 3,034.7 | 2,986.3 | |||||
| Occupancy and other costs | 306.4 | 292.9 | |||||
| Costs of services | 3,341.1 | 3,279.2 | |||||
| Selling, general and administrative expenses | 97.5 | 119.0 | |||||
| Depreciation and amortization | 56.2 | 61.3 | |||||
| 3,494.8 | 3,459.5 | ||||||
| Operating Profit | 646.4 | 627.2 | |||||
| Interest Expense | 52.0 | 68.3 | |||||
| Interest Income | 13.4 | 15.2 | |||||
| Income Before Income Taxes | 607.8 | 574.1 | |||||
| Income Tax Expense | 158.8 | 149.7 | |||||
| Income From Equity Method Investments | 0.8 | 5.3 | |||||
| Net Income | 449.8 | 429.7 | |||||
| Net Income Attributed To Noncontrolling Interests | 34.8 | 30.5 | |||||
| Net Income - Omnicom Group Inc. | $ | 415.0 | $ | 399.2 | |||
| Net income per share - Omnicom Group Inc. | |||||||
| Basic | $ | 1.90 | $ | 1.78 | |||
| Diluted | $ | 1.89 | $ | 1.77 | |||
| Weighted average shares (in millions) | |||||||
| Basic | 218.2 | 224.6 | |||||
| Diluted | 219.3 | 225.6 | |||||
| Dividends Declared Per Common Share | $ | 0.65 | $ | 0.60 | |||
Page 6
Omnicom Group Inc.
Consolidated Statements of Income
Twelve Months Ended December 31
(Unaudited)
(Dollars in Millions, Except Per Share Data)
| 2019 | 2018 (a) (b) | ||||||
| Revenue | $ | 14,953.7 | $ | 15,290.2 | |||
| Operating Expenses: | |||||||
| Salary and service costs | 10,972.2 | 11,306.1 | |||||
| Occupancy and other costs | 1,221.8 | 1,309.6 | |||||
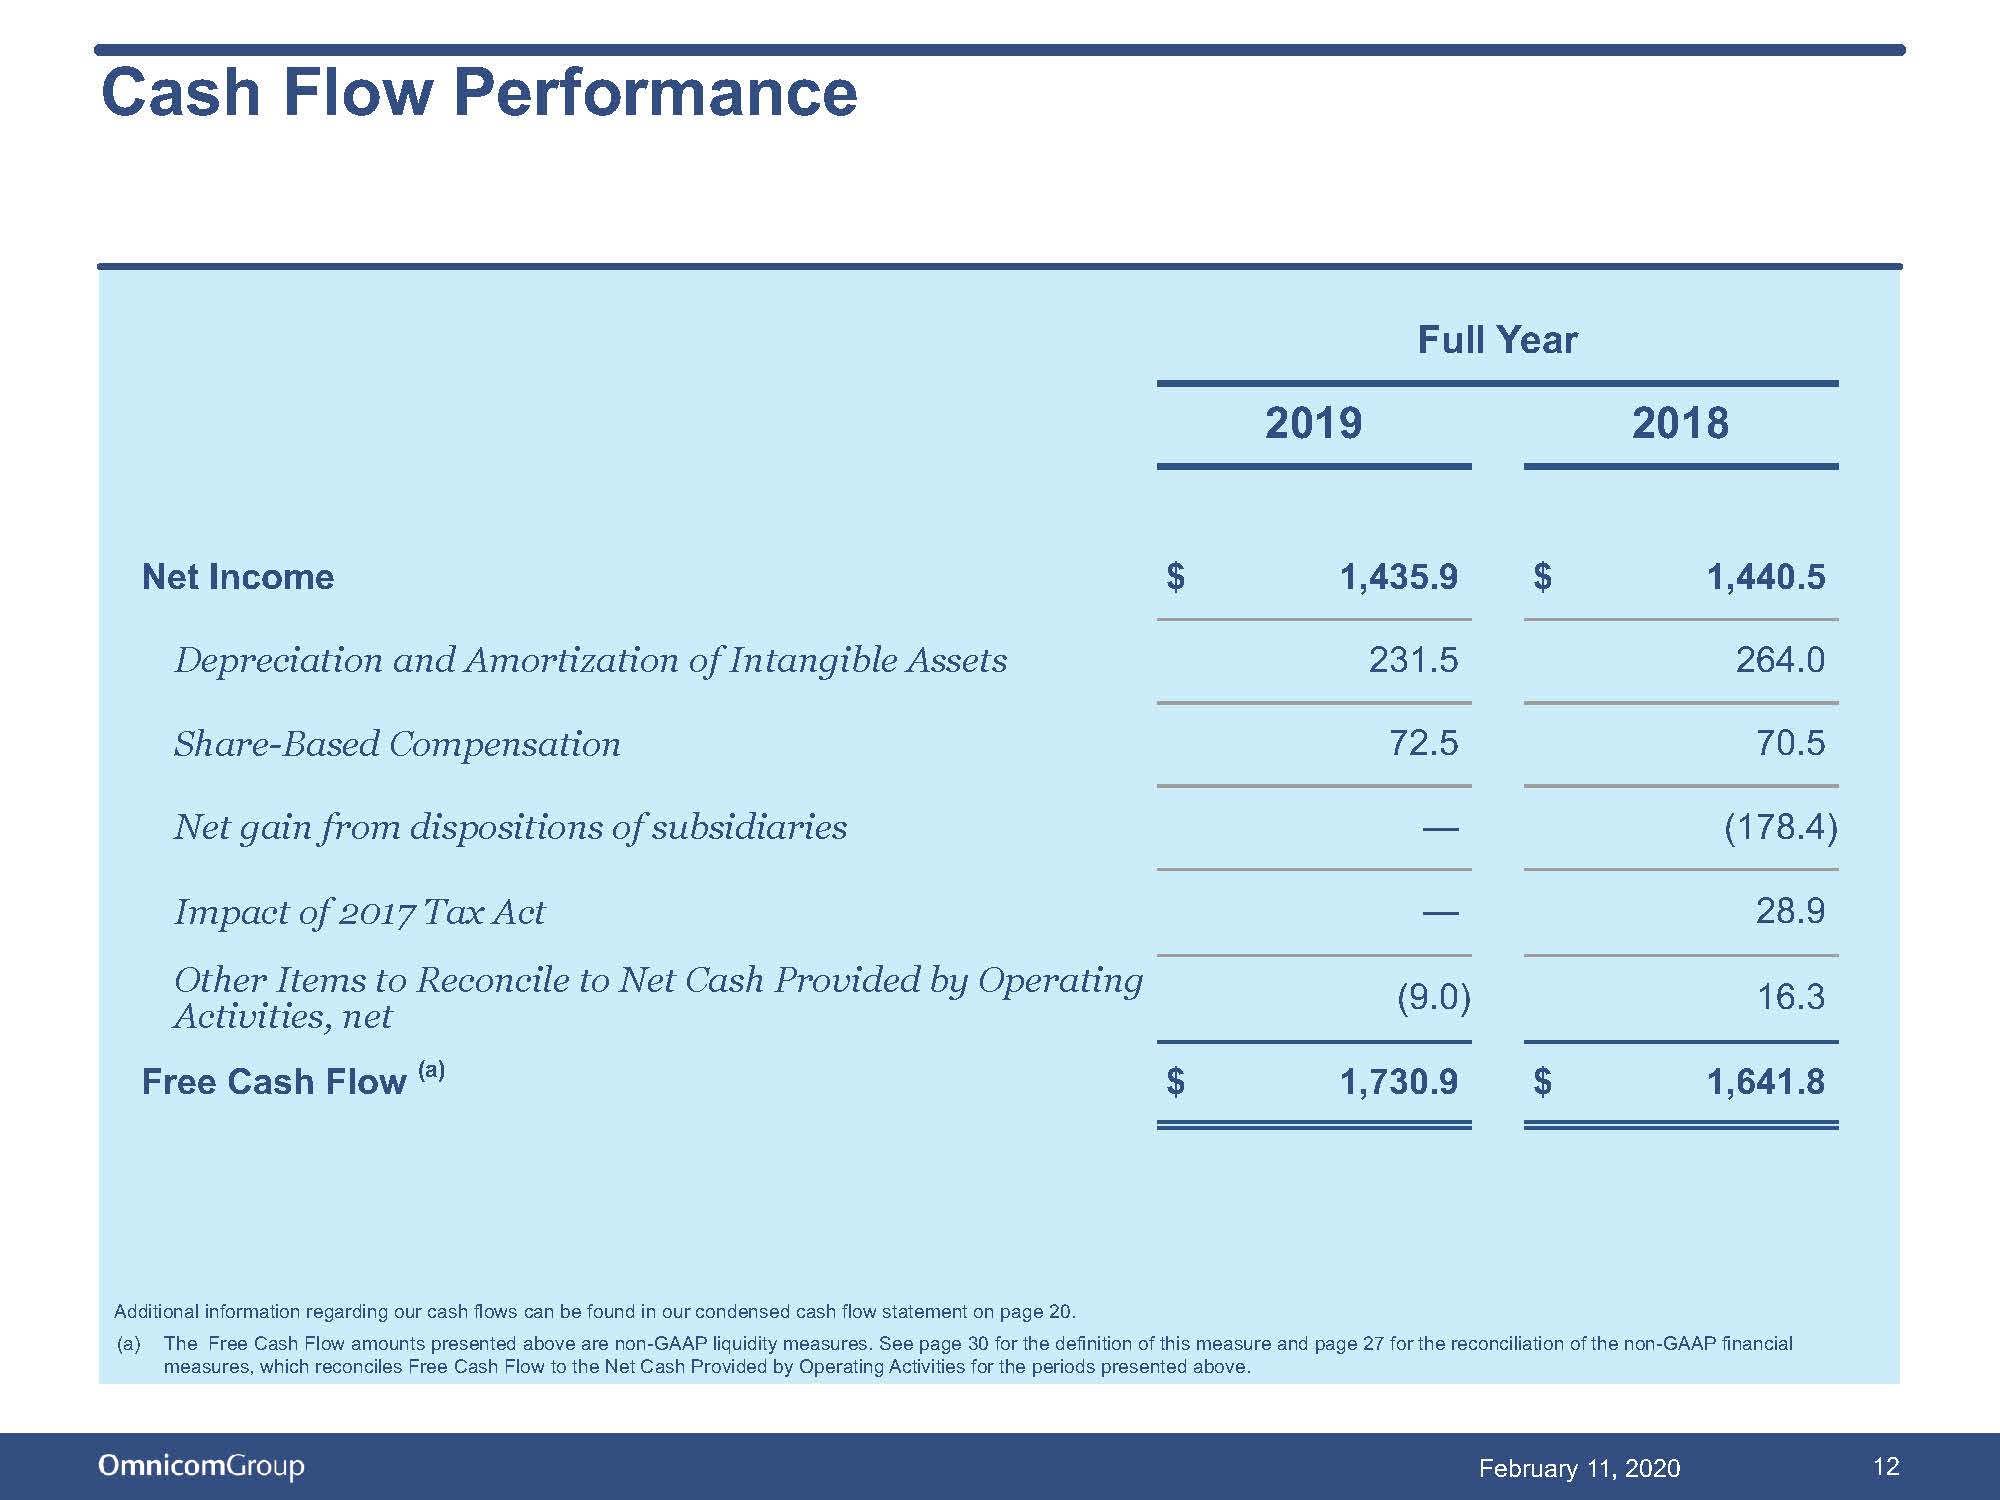
| Net gain on dispositions of subsidiaries | — | (178.4) | |||||
| Costs of services | 12,194.0 | 12,437.3 | |||||
| Selling, general and administrative expenses | 405.9 | 455.4 | |||||
| Depreciation and amortization | 231.5 | 264.0 | |||||
| 12,831.4 | 13,156.7 | ||||||
| Operating Profit | 2,122.3 | 2,133.5 | |||||
| Interest Expense | 244.3 | 266.4 | |||||
| Interest Income | 60.3 | 57.2 | |||||
| Income Before Income Taxes | 1,938.3 | 1,924.3 | |||||
| Income Tax Expense | 504.4 | 492.7 | |||||
| Income From Equity Method Investments | 2.0 | 8.9 | |||||
| Net Income | 1,435.9 | 1,440.5 | |||||
| Net Income Attributed To Noncontrolling Interests | 96.8 | 114.1 | |||||
| Net Income - Omnicom Group Inc. | $ | 1,339.1 | $ | 1,326.4 | |||
| Net income per share - Omnicom Group Inc. | |||||||
| Basic | $ | 6.09 | $ | 5.85 | |||
| Diluted | $ | 6.06 | $ | 5.83 | |||
| Weighted average shares (in millions) | |||||||
| Basic | 219.8 | 226.6 | |||||
| Diluted | 220.9 | 227.6 | |||||
| Dividends Declared Per Common Share | $ | 2.60 | $ | 2.40 | |||
| (a) | During the third quarter of 2018, we disposed of certain subsidiaries and recorded a net gain, primarily related to the sale of Sellbytel, our outsourced sales, service and support company. Additionally, during the third quarter of 2018, we recorded expenses for certain repositioning actions related to the continued improvement of our strategic position and operating efficiencies of our businesses. Lastly, income tax expense in the third quarter of 2018 includes additional expense related to an adjustment to the estimate of the impact of the 2017 Tax Act, as described in footnote (b) below. The net impact of these items increased operating profit by $29.0 million and Net Income - Omnicom Group Inc. by $18.2 million for the twelve months ended December 31, 2018. Additional information regarding the net gain and repositioning actions is presented in the tables on the following pages. |
| (b) | Income tax expense for the twelve months ended December 31, 2018 reflected a net increase of $28.9 million related to an adjustment, recorded in the third quarter of 2018, to the provisional amounts recorded for the 2017 Tax Act. |
Page 7
Omnicom Group Inc.
Impact of Net Gain on Third Quarter 2018 Dispositions and Repositioning Actions on Operating Expenses
Twelve Months Ended December 31, 2018
(Unaudited)
(Dollars in Millions)
| Repositioning Actions | Net Gain on Dispositions | Total | |||||||||
| Operating Expenses (a): | |||||||||||
| Salary and service costs | $ | 73.7 | $ | — | $ | 73.7 | |||||
| Occupancy and other costs | 73.5 | — | 73.5 | ||||||||
| Net gain on dispositions of subsidiaries | — | (178.4) | (178.4) | ||||||||
| Costs of services | 147.2 | (178.4) | (31.2) | ||||||||
| Selling, general and administrative expenses | 2.2 | — | 2.2 | ||||||||
| Depreciation and amortization | — | — | — | ||||||||
| Operating Expenses | $ | 149.4 | $ | (178.4) | $ | (29.0) | |||||
| (a) | The table above identifies the impact of the pre-tax gain on dispositions of certain subsidiaries and repositioning actions we took in the third quarter of 2018 on the components of our operating expenses for the twelve months ended December 31, 2018. |
Page 8
Omnicom Group Inc.
Non-GAAP Financial Measures - Adjusted for the Net Gain on Third Quarter 2018 Dispositions, Repositioning Actions and Tax Reform Act Adjustments
Twelve Months Ended December 31
(Unaudited)
(Dollars in Millions, Except Per Share Data)
| 2019 | 2018 (a) (b) | 2018 Non-GAAP Adjusted (a) (b) | |||||||||
| Operating Profit | $ | 2,122.3 | $ | 2,133.5 | $ | 2,104.5 | |||||
| Net Interest Expense | 184.0 | 209.2 | 209.2 | ||||||||
| Income Tax Expense | 504.4 | 492.7 | 488.8 | ||||||||
| Income From Equity Method Investments | 2.0 | 8.9 | 8.9 | ||||||||
| Net Income Attributed To Noncontrolling Interests | 96.8 | 114.1 | 107.2 | ||||||||
| Net Income - Omnicom Group Inc. | $ | 1,339.1 | $ | 1,326.4 | $ | 1,308.2 | |||||
| Diluted net income per share - Omnicom Group Inc. | $ | 6.06 | $ | 5.83 | $ | 5.75 | |||||
| Diluted weighted average shares (in millions) | 220.9 | 227.6 | 227.6 | ||||||||
The table above identifies the U.S. GAAP financial measures of Operating Profit, Net Income - Omnicom Group Inc. and diluted net income per share - Omnicom Group Inc., as well as the non-GAAP financial measures adjusted for the impact of the net gain recognized on dispositions of certain subsidiaries, certain repositioning actions and the revision of the provisional income tax expense amounts recorded in connection with the enactment of the 2017 Tax Act, in the column entitled "2018 Non-GAAP Adjusted" for the twelve months ended December 31, 2018. We believe that the amounts presented in the "2018 Non-GAAP Adjusted" column are useful measures for investors to understand the impact these items had on the comparability of our reported results. Non-GAAP financial measures should not be considered in isolation from, or as a substitute for, financial information presented in compliance with U.S. GAAP. Non-GAAP financial measures reported by us may not be comparable to similarly titled amounts reported by other companies.
| (a) | During the third quarter of 2018, we disposed of certain subsidiaries and recorded a net gain, primarily related to the sale of Sellbytel, our outsourced sales, service and support company. Additionally, during the third quarter of 2018, we recorded expenses for certain repositioning actions related to the continued improvement of our strategic position and operating efficiencies of our businesses. Lastly, income tax expense in the third quarter of 2018 includes additional expense related to an adjustment to the estimate of the impact of the 2017 Tax Act, as described in footnote (b) below. The net impact of these items increased operating profit by $29.0 million and Net Income - Omnicom Group Inc. by $18.2 million for the twelve months ended December 31, 2018. Additional information regarding the net gain and repositioning actions are presented in the table on the preceding page. |
| (b) | Income tax expense for the twelve months ended December 31, 2018 reflected a net increase of $28.9 million related to an adjustment, recorded in the third quarter of 2018, to the provisional amounts recorded for the 2017 Tax Act recorded in the third quarter of 2018. |
Page 9
Omnicom Group Inc.
Reconciliation of Non-GAAP Financial Measures - Operating Profit, 2018 Non-GAAP Adjusted
Twelve Months Ended December 31
(Unaudited)
(Dollars in Millions)
| 2019 | 2018 | ||||||
| Net Income - Omnicom Group Inc. | $ | 1,339.1 | $ | 1,326.4 | |||
| Net Income Attributed To Noncontrolling Interests | 96.8 | 114.1 | |||||
| Net Income | 1,435.9 | 1,440.5 | |||||
| Income From Equity Method Investments | 2.0 | 8.9 | |||||
| Income Tax Expense | 504.4 | 492.7 | |||||
| Income Before Income Taxes | 1,938.3 | 1,924.3 | |||||
| Interest Income | 60.3 | 57.2 | |||||
| Interest Expense | 244.3 | 266.4 | |||||
| Operating Profit | 2,122.3 | 2,133.5 | |||||
| Net gain on dispositions of subsidiaries | — | (178.4) | |||||
| Repositioning actions | — | 149.4 | |||||
| Operating Profit, 2018 Non-GAAP Adjusted | $ | — | $ | 2,104.5 | |||
| Revenue | $ | — | $ | 15,290.2 | |||
| Operating Profit, 2018 Non-GAAP Adjusted | $ | — | $ | 2,104.5 | |||
| Operating Margin, 2018 Non-GAAP Adjusted | — | % | 13.8 | % | |||
The table above reconciles the U.S. GAAP financial measures of Operating Profit and Operating Margin to the non-GAAP financial measures of Operating Profit, 2018 Non-GAAP Adjusted and Operating Margin, 2018 Non-GAAP Adjusted, which adjusts for the impact of the net gain recognized on dispositions of certain subsidiaries and expenses in connection with certain repositioning actions, all of which were recorded in the third quarter of 2018, for the twelve months ended December 31, 2018. We believe that the amounts adjusted for the impact of these items are useful measures for investors to understand the impact these actions had on the comparability of our reported results. Non-GAAP financial measures should not be considered in isolation from, or as a substitute for, financial information presented in compliance with U.S. GAAP. Non-GAAP financial measures reported by us may not be comparable to similarly titled amounts reported by other companies.
Page 10
Omnicom Group Inc.
Reconciliation of Non-GAAP Financial Measures - Net Income - Omnicom Group Inc., 2018 Non-GAAP Adjusted
Twelve Months Ended December 31, 2018
(Unaudited)
(Dollars in Millions)
| Twelve Months Ended December 31, 2018 | |||||
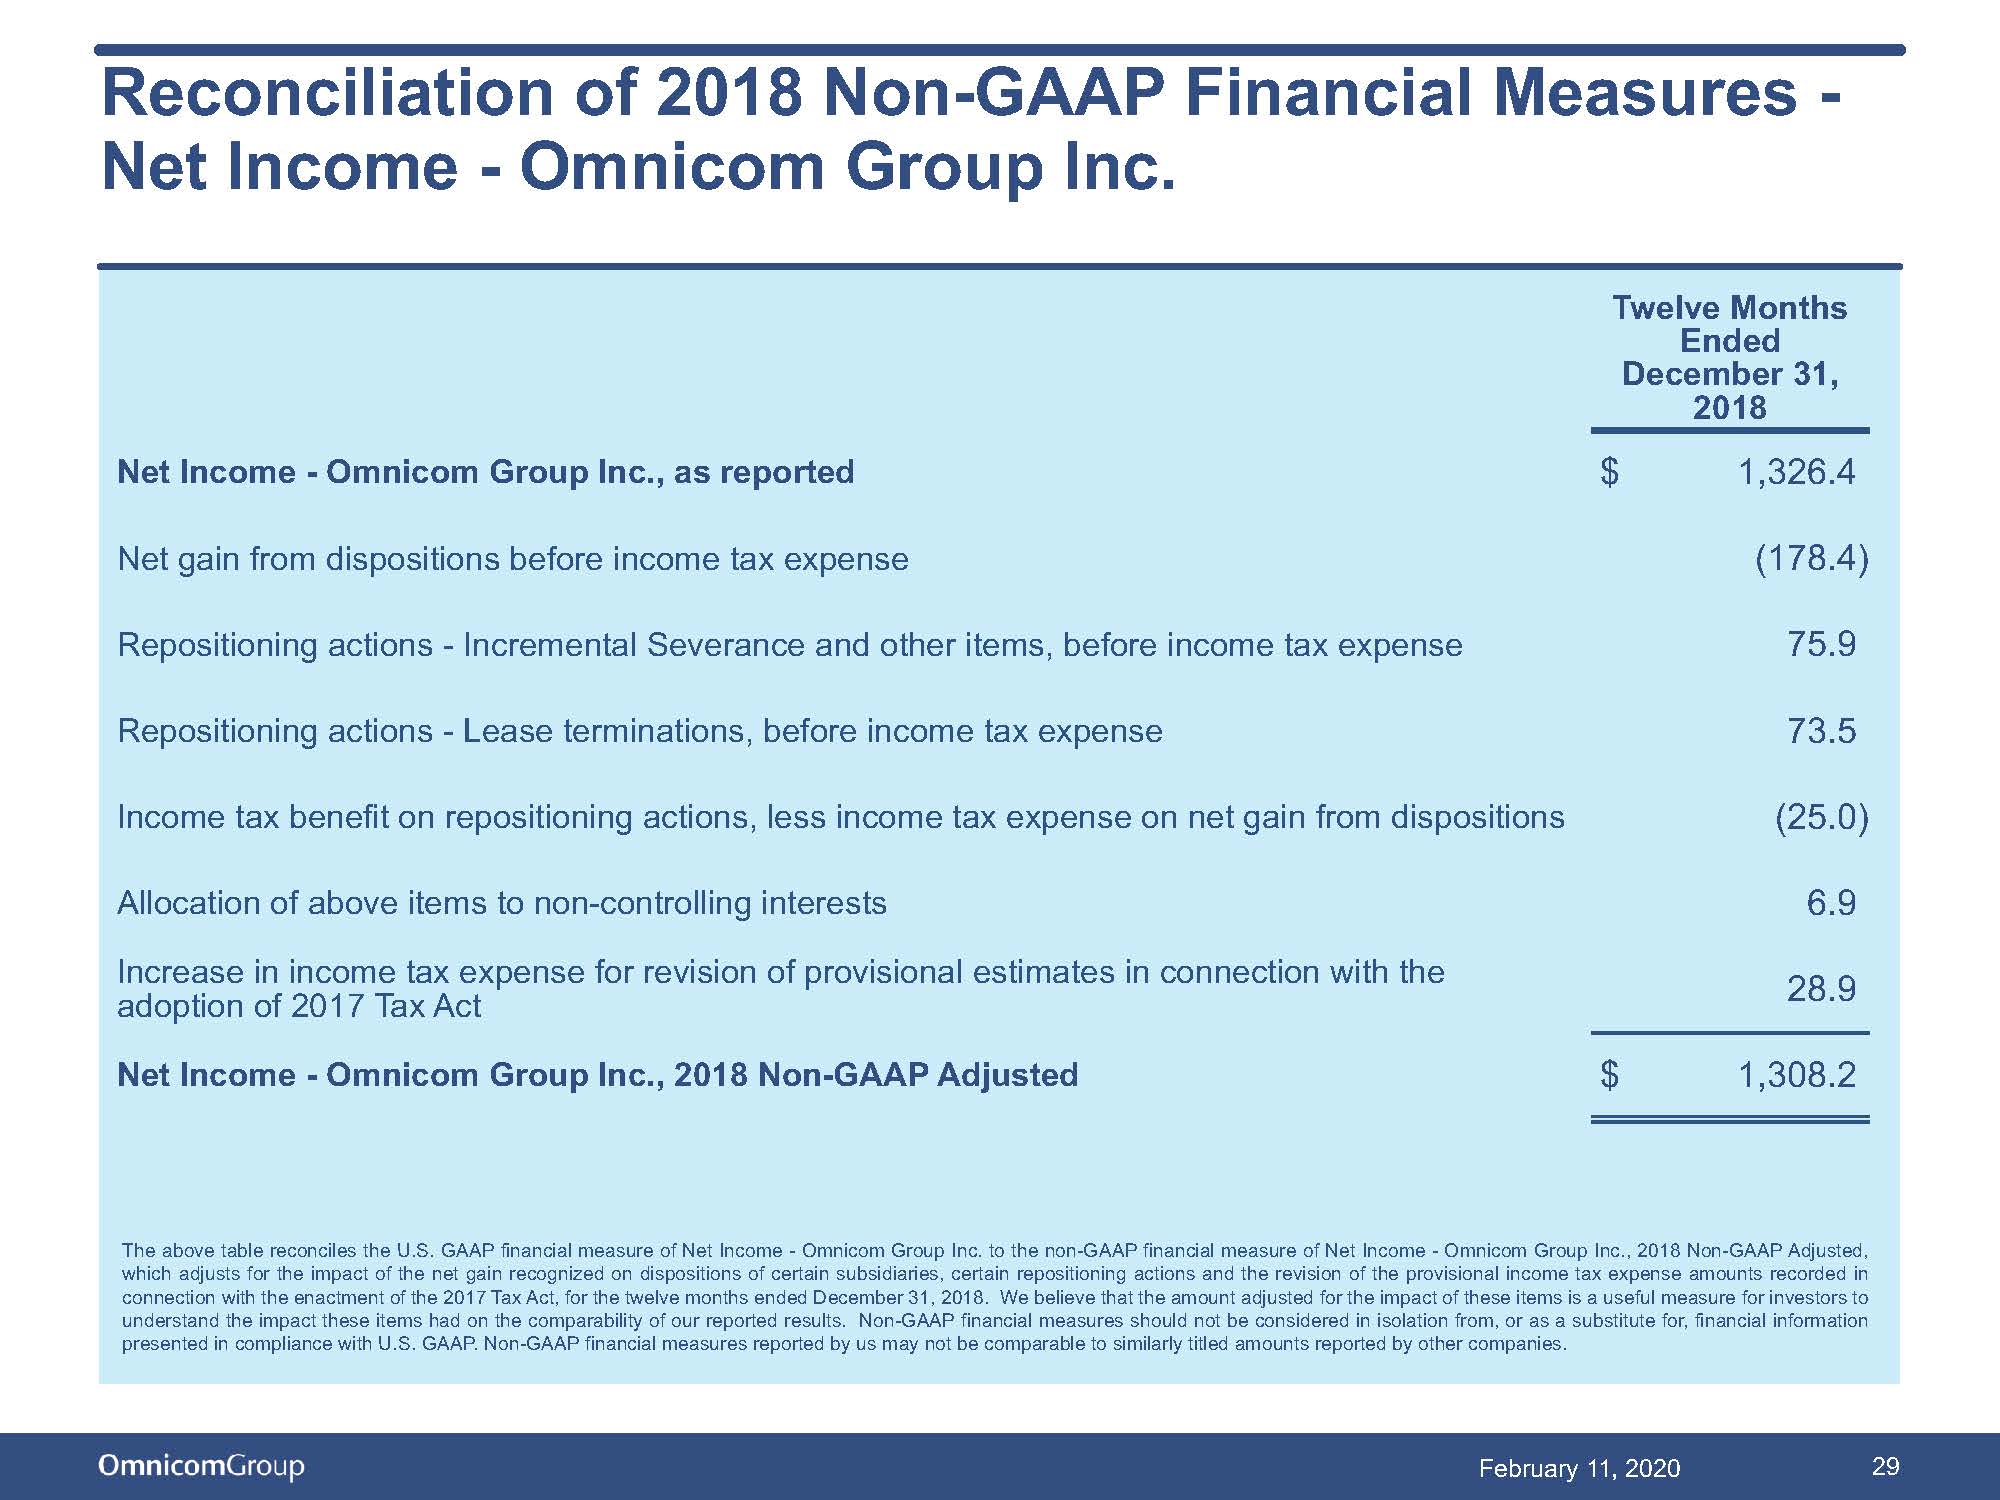
| Net Income - Omnicom Group Inc., as reported | $ | 1,326.4 | |||
| Net gain on dispositions, before income tax expense | (178.4) | ||||
| Repositioning actions - Incremental Severance and other items, before income tax expense | 75.9 | ||||
| Repositioning actions - Lease terminations, before income tax expense | 73.5 | ||||
| Income tax benefit on repositioning actions, less income tax expense on net gain from dispositions | (25.0) | ||||
| Allocation of above items to non-controlling interests | 6.9 | ||||
| Increase in income tax expense for revision of provisional estimates in connection with adoption of 2017 Tax Act | 28.9 | ||||
| Net Income - Omnicom Group Inc., 2018 Non-GAAP Adjusted | $ | 1,308.2 | |||
The table above reconciles the U.S. GAAP financial measure of Net Income - Omnicom Group Inc. to the non-GAAP financial measure of Net Income - Omnicom Group Inc., 2018 Non-GAAP Adjusted, which adjusts for the impact of the net gain recognized on dispositions of certain subsidiaries, certain repositioning actions and the revision of the provisional income tax expense amounts recorded in connection with the enactment of the 2017 Tax Act, for the twelve months ended December 31, 2018. We believe the amounts adjusted for the impact of these items are useful measures for investors to understand the impact these actions had on the comparability of our reported results. Non-GAAP financial measures should not be considered in isolation from, or as a substitute for, financial information presented in compliance with U.S. GAAP. Non-GAAP financial measures reported by us may not be comparable to similarly titled amounts reported by other companies.
Page 11