Exhibit 99.2

First Quarter 2017 Results April 18, 2017 Investor Presentation
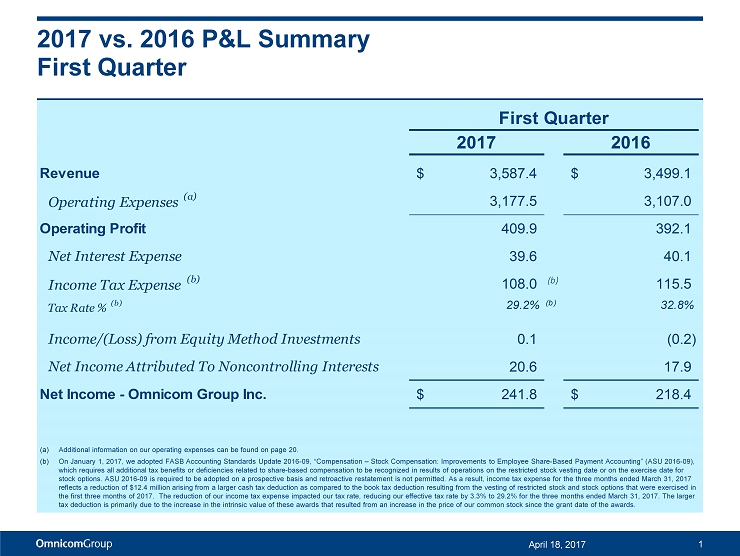
2017 vs. 2016 P&L Summary First Quarter 1 2017 2016 Revenue 3,587.4$ 3,499.1$ Operating Expenses (a) 3,177.5 3,107.0 Operating Profit 409.9 392.1 Net Interest Expense 39.6 40.1 Income Tax Expense (b) 108.0 (b) 115.5 Tax Rate % (b) 29.2% (b) 32.8% Income/(Loss) from Equity Method Investments 0.1 (0.2) Net Income Attributed To Noncontrolling Interests 20.6 17.9 Net Income - Omnicom Group Inc. 241.8$ 218.4$ First Quarter April 18, 2017 (a) Additional information on our operating expenses can be found on page 20. (b) O n January 1, 2017, we adopted FASB Accounting Standards Update 2016 - 09, “Compensation – Stock Compensation: Improvements to Employ ee Share - Based Payment Accounting” (ASU 2016 - 09), which requires all additional tax benefits or deficiencies related to share - based compensation to be recognized in results of op erations on the restricted stock vesting date or on the exercise date for stock options. ASU 2016 - 09 is required to be adopted on a prospective basis and retroactive restatement is not permitted. As a result, income tax expense for the three months ended March 31, 2017 reflects a reduction of $12.4 million arising from a larger cash tax deduction as compared to the book tax deduction resulting from the vesting of restricted stock and stock options that were ex erc ised in the first three months of 2017. The reduction of our income tax expense impacted our tax rate, reducing our effective tax rate by 3.3% to 29.2% for the three months ended March 31, 2017 . The larger tax deduction is primarily due to the increase in the intrinsic value of these awards that resulted from an increase in the price of our common stock since the grant date of the awards.
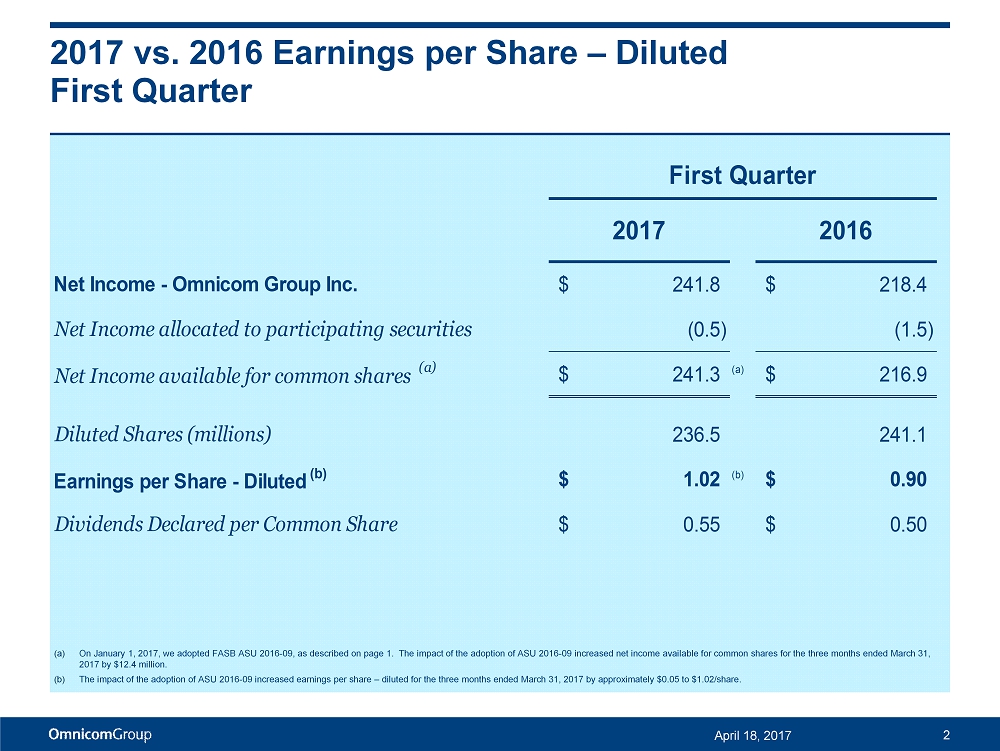
2017 vs. 2016 Earnings per Share – Diluted First Quarter 2 2017 2016 Net Income - Omnicom Group Inc. 241.8$ 218.4$ Net Income allocated to participating securities (0.5) (1.5) Net Income available for common shares (a) 241.3$ (a) 216.9$ Diluted Shares (millions) 236.5 241.1 Earnings per Share - Diluted (b) 1.02$ (b) 0.90$ Dividends Declared per Common Share 0.55$ 0.50$ First Quarter April 18, 2017 (a) On January 1, 2017, we adopted FASB ASU 2016 - 09, as described on page 1. The impact of the adoption of ASU 2016 - 09 increased net income available for common shares for the three months ended March 31, 2017 by $12.4 million. (b) The impact of the adoption of ASU 2016 - 09 increased earnings per share – diluted for the three months ended March 31, 2017 by ap proximately $0.05 to $1.02/share.
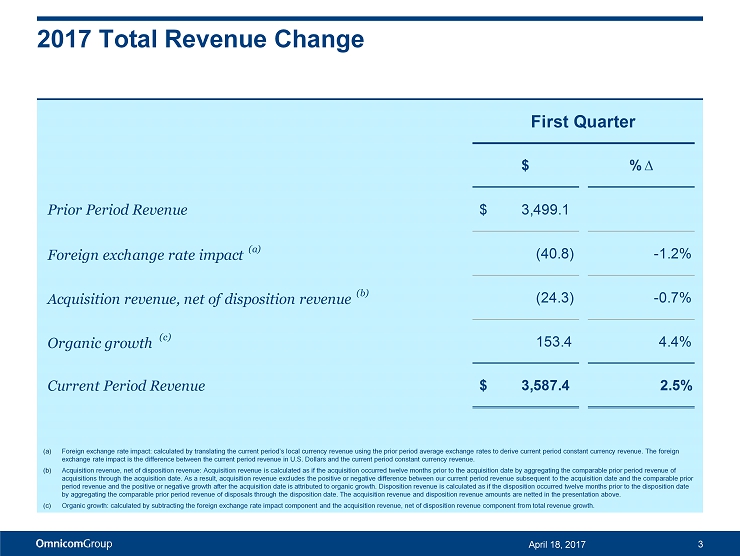
2017 Total Revenue Change 3 April 18, 2017 $ % ∆ Prior Period Revenue $ 3,499.1 Foreign exchange rate impact (a) (40.8) -1.2% Acquisition revenue, net of disposition revenue (b) (24.3) -0.7% Organic growth (c) 153.4 4.4% Current Period Revenue $ 3,587.4 2.5% First Quarter (a) Foreign exchange rate impact: calculated by translating the current period’s local currency revenue using the prior period av era ge exchange rates to derive current period constant currency revenue. The foreign exchange rate impact is the difference between the current period revenue in U.S. Dollars and the current period constant cur ren cy revenue . (b) Acquisition revenue, net of disposition revenue: Acquisition revenue is calculated as if the acquisition occurred twelve mont hs prior to the acquisition date by aggregating the comparable prior period revenue of acquisitions through the acquisition date. As a result, acquisition revenue excludes the positive or negative difference betw een our current period revenue subsequent to the acquisition date and the comparable prior period revenue and the positive or negative growth after the acquisition date is attributed to organic growth. Disposition re ven ue is calculated as if the disposition occurred twelve months prior to the disposition date by aggregating the comparable prior period revenue of disposals through the disposition date. The acquisition revenue and dis pos ition revenue amounts are netted in the presentation above. (c) Organic growth: calculated by subtracting the foreign exchange rate impact component and the acquisition revenue, net of disposition revenue component from total revenue growth.
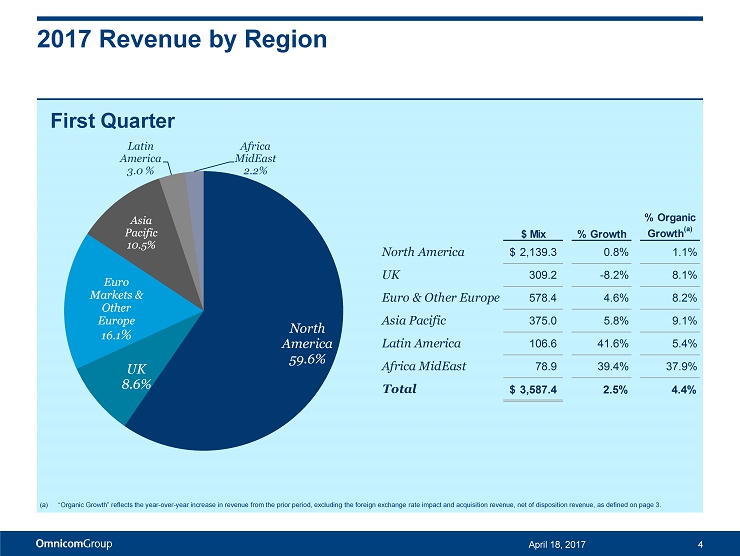
2017 Revenue by Region April 18, 2017 4 First Quarter North America 59.6% UK 8.6% Euro Markets & Other Europe 16.1 % Asia Pacific 10.5% Latin America 3.0 % Africa MidEast 2.2% $ Mix % Growth % Organic Growth (a) North America 2,139.3$ 0.8% 1.1% UK 309.2 -8.2% 8.1% Euro & Other Europe 578.4 4.6% 8.2% Asia Pacific 375.0 5.8% 9.1% Latin America 106.6 41.6% 5.4% Africa MidEast 78.9 39.4% 37.9% Total 3,587.4$ 2.5% 4.4% (a) “Organic Growth” reflects the year - over - year increase in revenue from the prior period, excluding the foreign exchange rate impa ct and acquisition revenue, net of disposition revenue, as defined on page 3 .
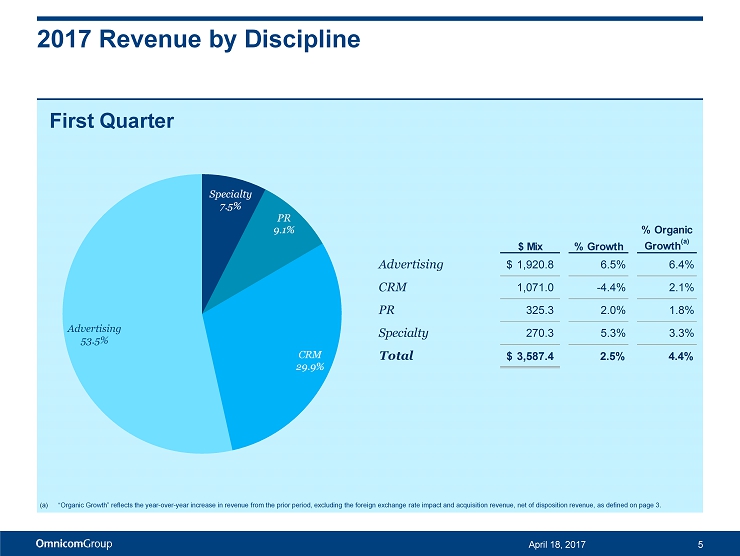
2017 Revenue by Discipline April 18, 2017 5 First Quarter (a) “Organic Growth” reflects the year - over - year increase in revenue from the prior period, excluding the foreign exchange rate impa ct and acquisition revenue, net of disposition revenue, as defined on page 3. Specialty 7.5% PR 9.1% CRM 29.9% Advertising 53.5% $ Mix % Growth % Organic Growth (a) Advertising 1,920.8$ 6.5% 6.4% CRM 1,071.0 -4.4% 2.1% PR 325.3 2.0% 1.8% Specialty 270.3 5.3% 3.3% Total 3,587.4$ 2.5% 4.4%
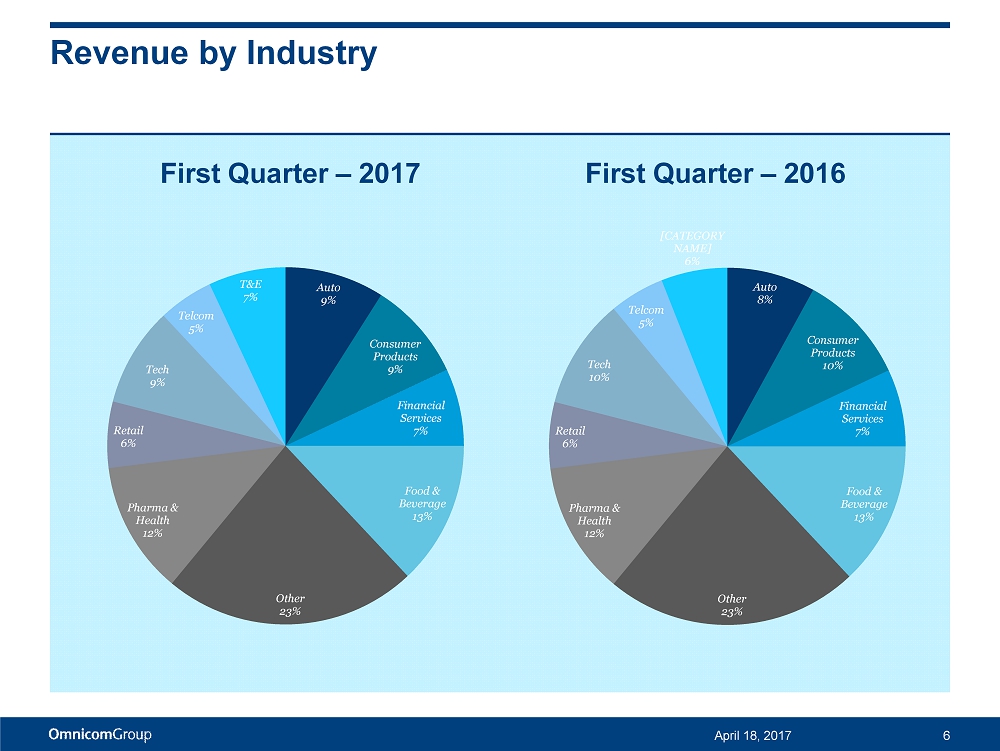
Revenue by Industry April 18, 2017 6 Auto 9% Consumer Products 9% Financial Services 7% Food & Beverage 13% Other 23% Pharma & Health 12% Retail 6% Tech 9% Telcom 5% T&E 7% First Quarter – 2017 First Quarter – 2016 Auto 8% Consumer Products 10% Financial Services 7% Food & Beverage 13% Other 23% Pharma & Health 12% Retail 6% Tech 10% Telcom 5% [CATEGORY NAME] 6%

Cash Flow Performance 7 April 18, 2017 2017 2016 Net Income 262.4$ 236.3$ Depreciation and Amortization Expense 72.7 74.2 Share-Based Compensation Expense 19.3 23.0 Other Items to Reconcile to Net Cash Provided by Operating Activities, net 0.9 19.6 Free Cash Flow (a) 355.3$ 353.1$ (b) Three Months Ended March 31 Additional information regarding our cash flows can be found in our condensed cash flow statement on page 16. (a) The Free Cash Flow amounts presented above are non - GAAP liquidity measures. See page 22 for the definition of this measure and page 19 for the reconciliation of the non - GAAP financial measures, which reconciles Free Cash Flow to the Net Cash Used in Operating Activities for the periods presented above . (b) On January 1, 2017 we adopted ASU 2016 - 09. ASU 2016 - 09 also provided that cash flows related to additional tax benefits or deficiencies related to share - based compensation be classified in operating activities on a retrospective basis. Accordingly , for the three months ended March 31, 2016, free cash flow increased $7.2 million to conform to the current presentation. However there was no effect on net free cash flow (as detailed on page 8) for the three months ended March 31, 2016 as a result of the reclassification.

Cash Flow Performance 8 April 18, 2017 2017 2016 Free Cash Flow (a) 355.3$ 353.1$ (b) Primary Uses of Cash: Dividends paid to Common Shareholders 130.8 122.2 Dividends paid to Noncontrolling Interest Shareholders 10.3 14.9 Capital Expenditures 32.1 41.4 Acquisition of Businesses and Affiliates, Acquisition of Additional Noncontrolling Interests, Contingent Purchase Price Payments and (Purchases of)/Proceeds from Sales of Investments, net 17.9 102.9 Stock Repurchases, net of Proceeds from Stock Plans 231.6 200.4 Primary Uses of Cash (a) 422.7 481.8 (b) Net Free Cash Flow (a) (67.4)$ (128.7)$ Three Months Ended March 31 Additional information regarding our cash flows can be found in our condensed cash flow statement on page 16. (a) The Free Cash Flow, Primary Uses of Cash and Net Free Cash Flow amounts presented above are non - GAAP liquidity measures. See page 22 or the definition of these measures and page 19 for the reconciliation of non - GAAP financial measures, which reconciles Free Cash Flow to the Net Cash Used in Operating Activities and Net Free Cash Flow to the Net Decrease in Cash and Cash Equivalents for the periods presented above . (b) On January 1, 2017 we adopted ASU 2016 - 09. ASU 2016 - 09 also provides that cash flows related to additional tax benefits or deficiencies related to share - based compensation be classified in operating activities on a retrospective basis. In the prior year the additional benefits or deficiencies were classified in financing activities ( gro uped with stock repurchases and proceeds from stock plans ). As a result of the adoption of ASU 2016 - 09, for the three months ended March 31, 2016 free cash flow increased by $7.2 million to conform to the current presentation, with a corresponding increase in primary uses of cash. However there was no effect on net free cash flow for the three months ended March 31, 2016 as a result of the reclassification .
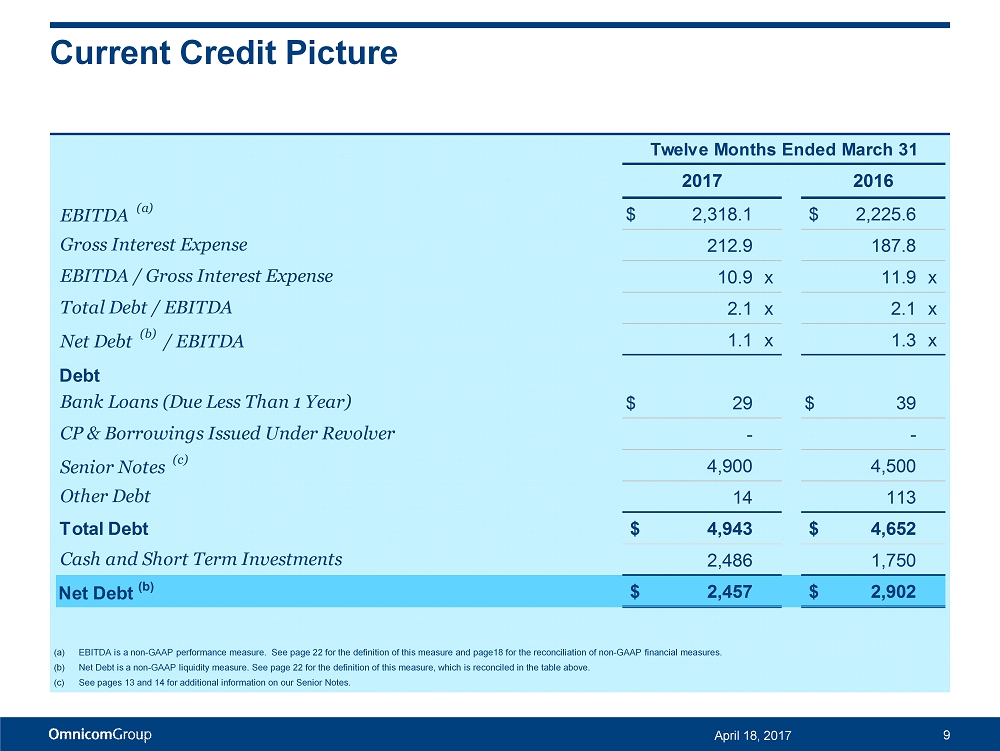
Current Credit Picture 9 April 18, 2017 (a) EBITDA is a non - GAAP performance measure. See page 22 for the definition of this measure and page18 for the reconciliation of n on - GAAP financial measures. (b) Net Debt is a non - GAAP liquidity measure. See page 22 for the definition of this measure, which is reconciled in the table above . (c) See pages 13 and 14 for additional information on our Senior Notes. 2017 2016 EBITDA (a) $ 2,318.1 $ 2,225.6 Gross Interest Expense 212.9 187.8 EBITDA / Gross Interest Expense 10.9 x 11.9 x Total Debt / EBITDA 2.1 x 2.1 x Net Debt (b) / EBITDA 1.1 x 1.3 x Debt Bank Loans (Due Less Than 1 Year) $ 29 $ 39 CP & Borrowings Issued Under Revolver - - Senior Notes (c) 4,900 4,500 Other Debt 14 113 Total Debt $ 4,943 $ 4,652 Cash and Short Term Investments 2,486 1,750 Net Debt (b) $ 2,457 $ 2,902 Twelve Months Ended March 31
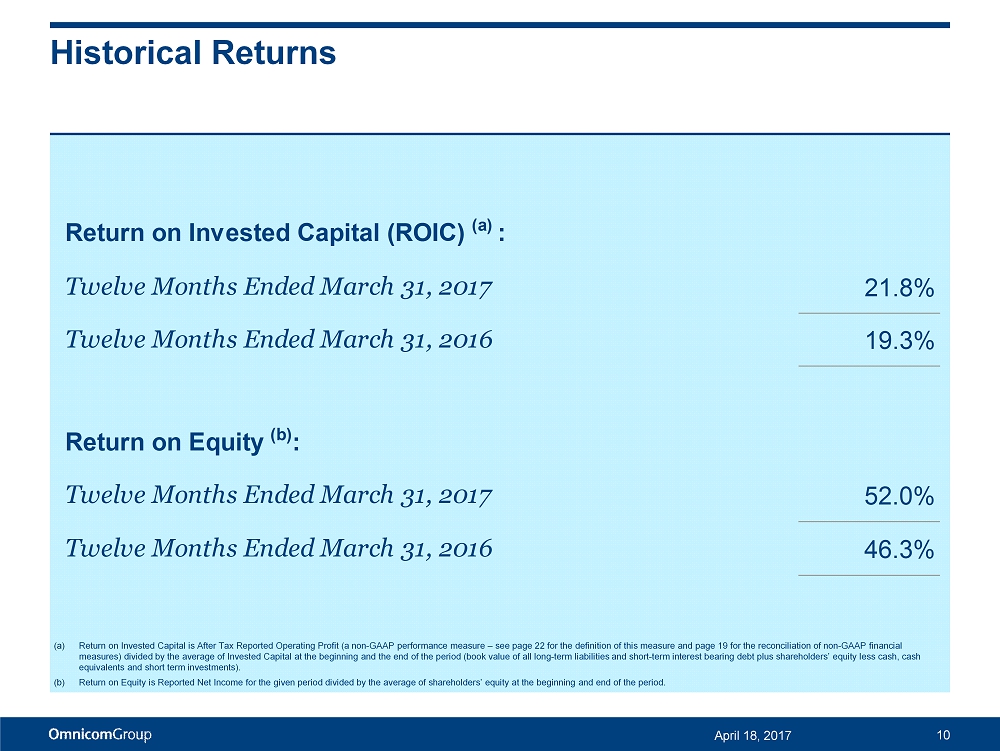
Historical Returns 10 April 18, 2017 Return on Invested Capital (ROIC) (a) : Twelve Months Ended March 31, 2017 21.8% Twelve Months Ended March 31, 2016 19.3% Return on Equity (b) : 15 Twelve Months Ended March 31, 2017 52.0% Twelve Months Ended March 31, 2016 46.3% (a) Return on Invested Capital is After Tax Reported Operating Profit (a non - GAAP performance measure – see page 22 for the definiti on of this measure and page 19 for the reconciliation of non - GAAP financial measures) divided by the average of Invested Capital at the beginning and the end of the period (book value of all long - term liabilities and short - term interest bearing debt plus shareholders’ equity less cash, cash equivalents and short term investments). (b) Return on Equity is Reported Net Income for the given period divided by the average of shareholders’ equity at the beginning and end of the period.
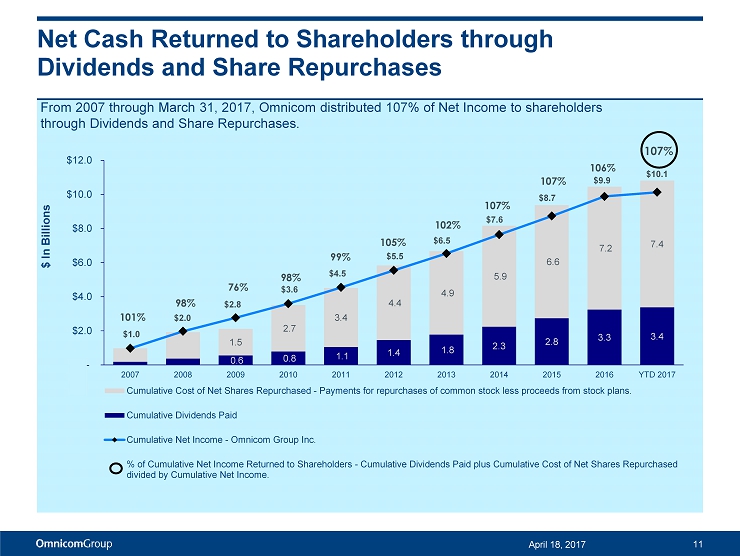
Net Cash Returned to Shareholders through Dividends and Share Repurchases 11 April 18, 2017 0.6 0.8 1.1 1.4 1.8 2.3 2.8 3.3 3.4 1.5 2.7 3.4 4.4 4.9 5.9 6.6 7.2 7.4 $1.0 $2.0 $2.8 $3.6 $4.5 $5.5 $6.5 $7.6 $8.7 $9.9 $10.1 101% 98% 76% 98% 99% 105% 102% 107% 107% 106% 107% $- $2.0 $4.0 $6.0 $8.0 $10.0 $12.0 2007 2008 2009 2010 2011 2012 2013 2014 2015 2016 YTD 2017 Cumulative Cost of Net Shares Repurchased - Payments for repurchases of common stock less proceeds from stock plans. Cumulative Dividends Paid Cumulative Net Income - Omnicom Group Inc. % of Cumulative Net Income Returned to Shareholders - Cumulative Dividends Paid plus Cumulative Cost of Net Shares Repurchased divided by Cumulative Net Income. From 2007 through March 31, 2017, Omnicom distributed 107% of Net Income to shareholders through Dividends and Share Repurchases . $ In Billions

Supplemental Financial Information April 18, 2017 12
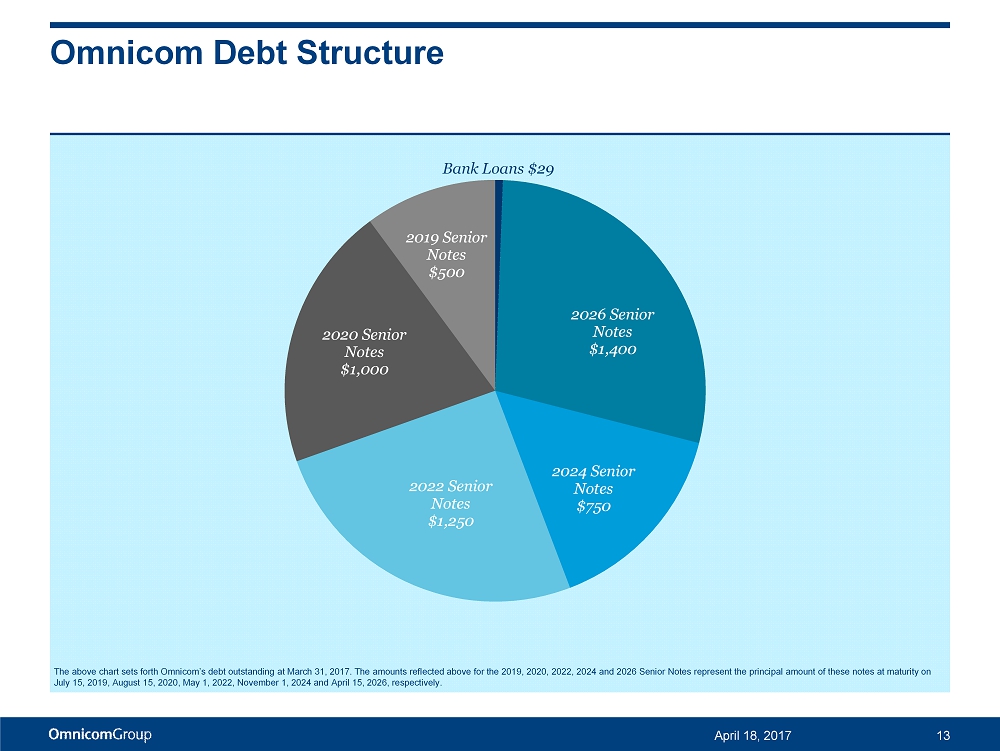
Omnicom Debt Structure Bank Loans $29 2026 Senior Notes $1,400 2024 Senior Notes $ 750 2022 Senior Notes $ 1,250 2020 Senior Notes $1,000 2019 Senior Notes $ 500 13 April 18, 2017 The above chart sets forth Omnicom’s debt outstanding at March 31, 2017. The amounts reflected above for the 2019, 2020, 2022, 2024 and 2026 Senior Notes represent the principal amount of these notes at maturity on July 15, 2019, August 15, 2020, May 1, 2022, November 1, 2024 and April 15, 2026, respectively.
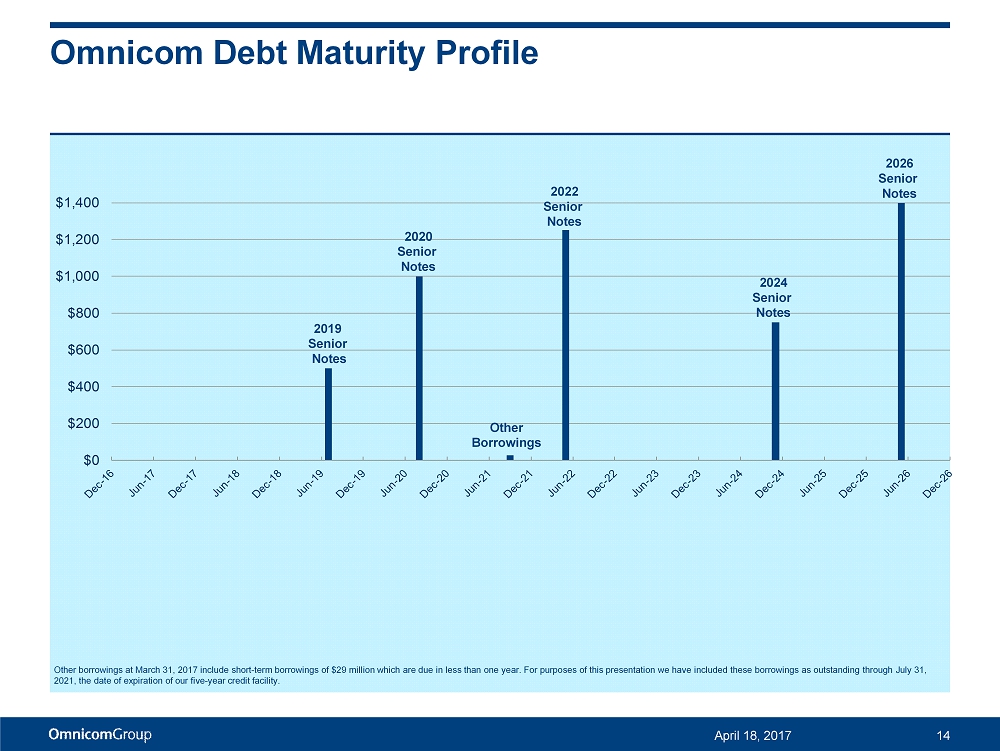
Omnicom Debt Maturity Profile 14 April 18, 2017 Other borrowings at March 31, 2017 include short - term borrowings of $29 million which are due in less than one year. For purposes of this presentation we have included these borrowings as outstandi ng through July 31, 2021, the date of expiration of our five - year credit facility. $0 $200 $400 $600 $800 $1,000 $1,200 $1,400 Other Borrowings 2019 Senior Notes 2020 Senior Notes 2022 Senior Notes 2024 Senior Notes 2026 Senior Notes
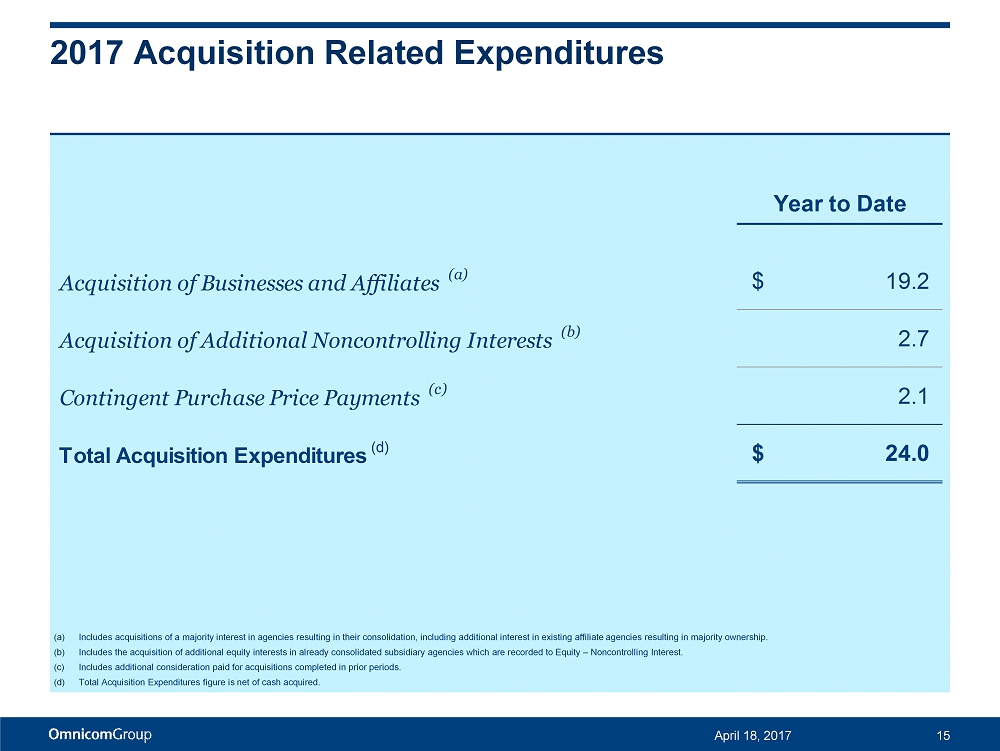
2017 Acquisition Related Expenditures 15 April 18, 2017 (a) Includes acquisitions of a majority interest in agencies resulting in their consolidation, including additional interest in e xis ting affiliate agencies resulting in majority ownership. (b) Includes the acquisition of additional equity interests in already consolidated subsidiary agencies which are recorded to Equ ity – Noncontrolling Interest. (c) Includes additional consideration paid for acquisitions completed in prior periods. (d) Total Acquisition Expenditures figure is net of cash acquired. Year to Date Acquisition of Businesses and Affiliates (a) 19.2$ Acquisition of Additional Noncontrolling Interests (b) 2.7 Contingent Purchase Price Payments (c) 2.1 Total Acquisition Expenditures (d) 24.0$
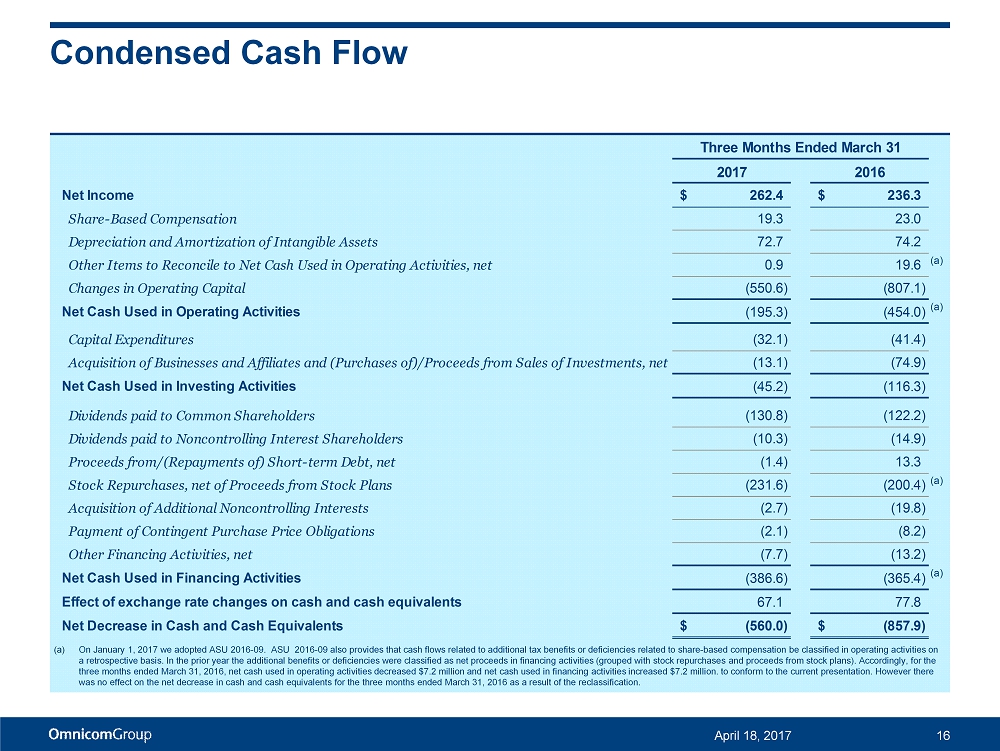
Condensed Cash Flow 16 April 18, 2017 2017 2016 Net Income 262.4$ 236.3$ Share-Based Compensation 19.3 23.0 Depreciation and Amortization of Intangible Assets 72.7 74.2 Other Items to Reconcile to Net Cash Used in Operating Activities, net 0.9 19.6 (a) Changes in Operating Capital (550.6) (807.1) Net Cash Used in Operating Activities (195.3) (454.0) (a) Capital Expenditures (32.1) (41.4) Acquisition of Businesses and Affiliates and (Purchases of)/Proceeds from Sales of Investments, net (13.1) (74.9) Net Cash Used in Investing Activities (45.2) (116.3) Dividends paid to Common Shareholders (130.8) (122.2) Dividends paid to Noncontrolling Interest Shareholders (10.3) (14.9) Proceeds from/(Repayments of) Short-term Debt, net (1.4) 13.3 Stock Repurchases, net of Proceeds from Stock Plans (231.6) (200.4) (a) Acquisition of Additional Noncontrolling Interests (2.7) (19.8) Payment of Contingent Purchase Price Obligations (2.1) (8.2) Other Financing Activities, net (7.7) (13.2) Net Cash Used in Financing Activities (386.6) (365.4) (a) Effect of exchange rate changes on cash and cash equivalents 67.1 77.8 Net Decrease in Cash and Cash Equivalents (560.0)$ (857.9)$ Three Months Ended March 31 (a) On January 1, 2017 we adopted ASU 2016 - 09. ASU 2016 - 09 also provides that cash flows related to additional tax benefits or deficiencies related to share - based compensation be classified in operating activities on a retrospective basis . In the prior year the additional benefits or deficiencies were classified as net proceeds in financing activities (grouped wit h stock repurchases and proceeds from stock plans). Accordingly, for the three months ended March 31, 2016, net cash used in operating activities decreased $7.2 million and net cash used in financin g a ctivities increased $7.2 million. to conform to the current presentation. However there was no effect on the net decrease in cash and cash equivalents for the three months ended March 31, 2016 as a result of the reclassification .
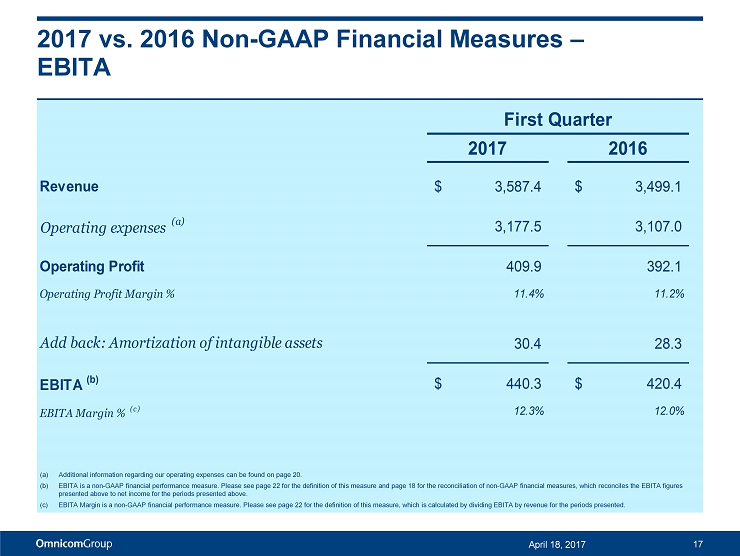
2017 vs. 2016 Non - GAAP Financial Measures – EBITA 17 (a) Additional information regarding our operating expenses can be found on page 20. (b) EBITA is a non - GAAP financial performance measure . Please see page 22 for the definition of this measure and page 18 for the reconciliation of non - GAAP financial measures, which reconciles the EBITA figures presented above to net income for the periods presented above . (c) EBITA Margin is a non - GAAP financial performance measure. Please see page 22 for the definition of this measure, which is calcul ated by dividing EBITA by revenue for the periods presented. First Quarter 2017 2016 Revenue 3,587.4$ 3,499.1$ Operating expenses (a) 3,177.5 3,107.0 Operating Profit 409.9 392.1 Operating Profit Margin % 11.4% 11.2% Add back: Amortization of intangible assets 30.4 28.3 EBITA (b) 440.3$ 420.4$ EBITA Margin % (c) 12.3% 12.0% April 18, 2017
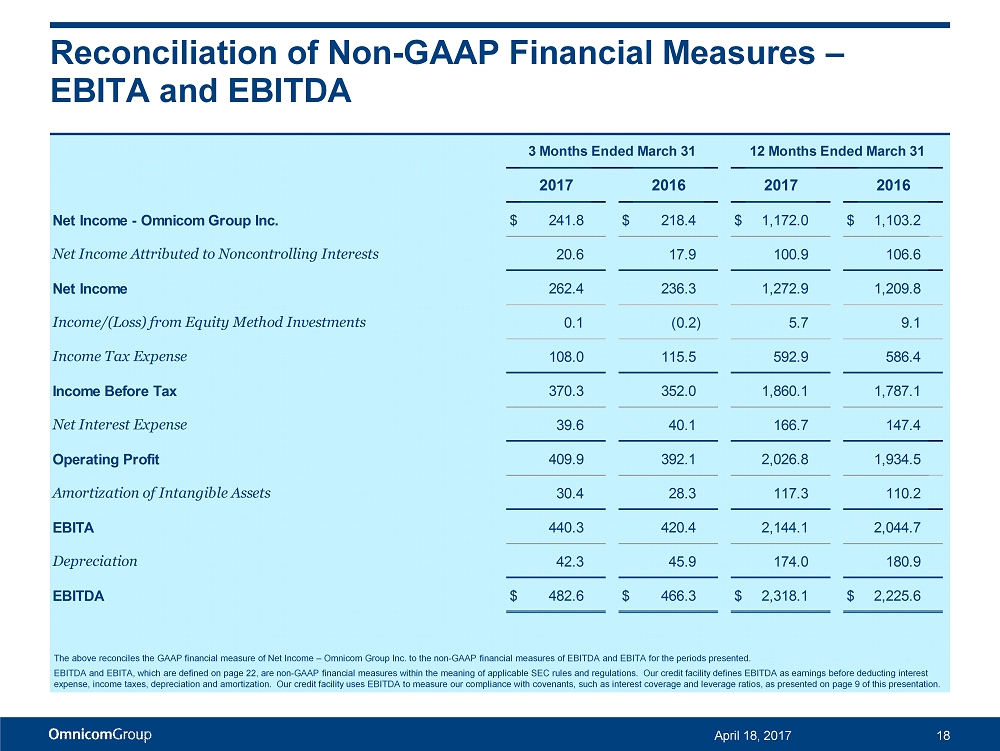
Reconciliation of Non - GAAP Financial Measures – EBITA and EBITDA 18 April 18, 2017 The above reconciles the GAAP financial measure of Net Income – Omnicom Group Inc. to the non - GAAP financial measures of EBITDA and EBITA for the periods presented. EBITDA and EBITA, which are defined on page 22, are non - GAAP financial measures within the meaning of applicable SEC rules and regulations. Our credit facility defines EBITDA as earnings before deducting interest expense, income taxes, depreciation and amortization. Our credit facility uses EBITDA to measure our compliance with covenan ts, such as interest coverage and leverage ratios, as presented on page 9 of this presentation. 2017 2016 2017 2016 Net Income - Omnicom Group Inc. $ 241.8 $ 218.4 $ 1,172.0 $ 1,103.2 Net Income Attributed to Noncontrolling Interests 20.6 17.9 100.9 106.6 Net Income 262.4 236.3 1,272.9 1,209.8 Income/(Loss) from Equity Method Investments 0.1 (0.2) 5.7 9.1 Income Tax Expense 108.0 115.5 592.9 586.4 Income Before Tax 370.3 352.0 1,860.1 1,787.1 Net Interest Expense 39.6 40.1 166.7 147.4 Operating Profit 409.9 392.1 2,026.8 1,934.5 Amortization of Intangible Assets 30.4 28.3 117.3 110.2 EBITA 440.3 420.4 2,144.1 2,044.7 Depreciation 42.3 45.9 174.0 180.9 EBITDA $ 482.6 $ 466.3 $ 2,318.1 $ 2,225.6 3 Months Ended March 31 12 Months Ended March 31
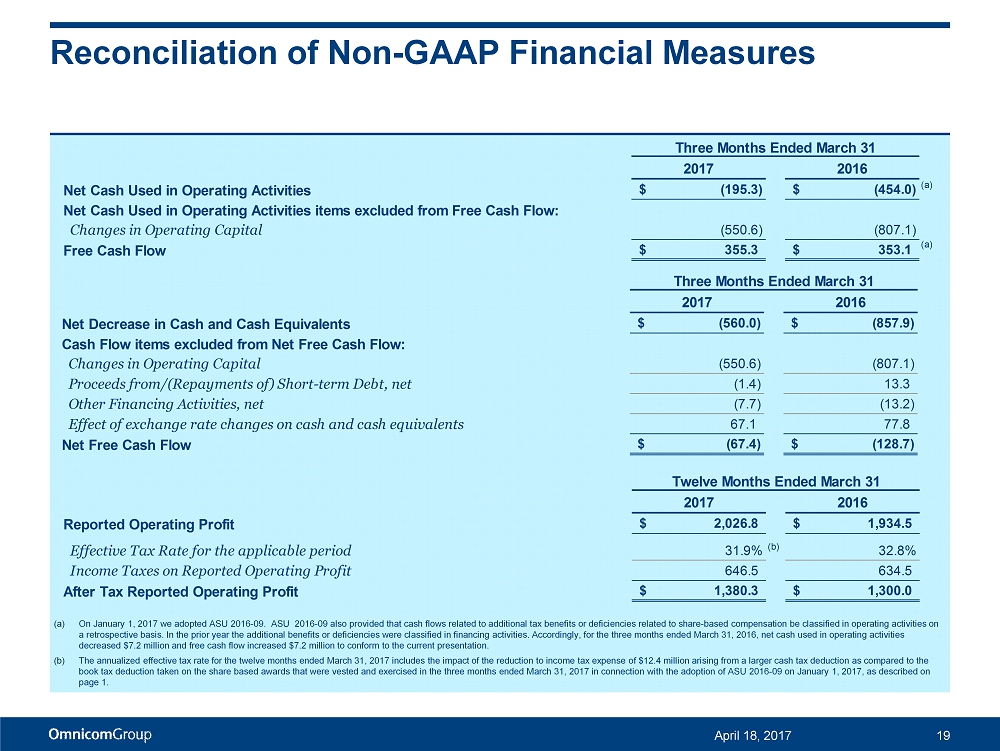
Reconciliation of Non - GAAP Financial Measures April 18, 2017 19 2017 2016 Net Cash Used in Operating Activities (195.3)$ (454.0)$ (a) Net Cash Used in Operating Activities items excluded from Free Cash Flow: Changes in Operating Capital (550.6) (807.1) Free Cash Flow 355.3$ 353.1$ (a) Three Months Ended March 31 2017 2016 Reported Operating Profit 2,026.8$ 1,934.5$ Effective Tax Rate for the applicable period 31.9% (b) 32.8% Income Taxes on Reported Operating Profit 646.5 634.5 After Tax Reported Operating Profit 1,380.3$ 1,300.0$ Twelve Months Ended March 31 2017 2016 Net Decrease in Cash and Cash Equivalents (560.0)$ (857.9)$ Cash Flow items excluded from Net Free Cash Flow: Changes in Operating Capital (550.6) (807.1) Proceeds from/(Repayments of) Short-term Debt, net (1.4) 13.3 Other Financing Activities, net (7.7) (13.2) Effect of exchange rate changes on cash and cash equivalents 67.1 77.8 Net Free Cash Flow (67.4)$ (128.7)$ Three Months Ended March 31 (a) On January 1, 2017 we adopted ASU 2016 - 09. ASU 2016 - 09 also provided that cash flows related to additional tax benefits or deficiencies related to share - based compensation be classified in operating activities on a retrospective basis . In the prior year the additional benefits or deficiencies were classified in financing activities. Accordingly , for the three months ended March 31, 2016, net cash used in operating activities decreased $7.2 million and free cash flow increased $7.2 million to conform to the current presentation. (b) The annualized effective tax rate for the twelve months ended March 31, 2017 includes the impact of the reduction to income t ax expense of $12.4 million arising from a larger cash tax deduction as compared to the book tax deduction taken on the share based awards that were vested and exercised in the three months ended March 31, 2017 in connection with the adoption of ASU 2016 - 09 on January 1, 2017, as described on page 1.
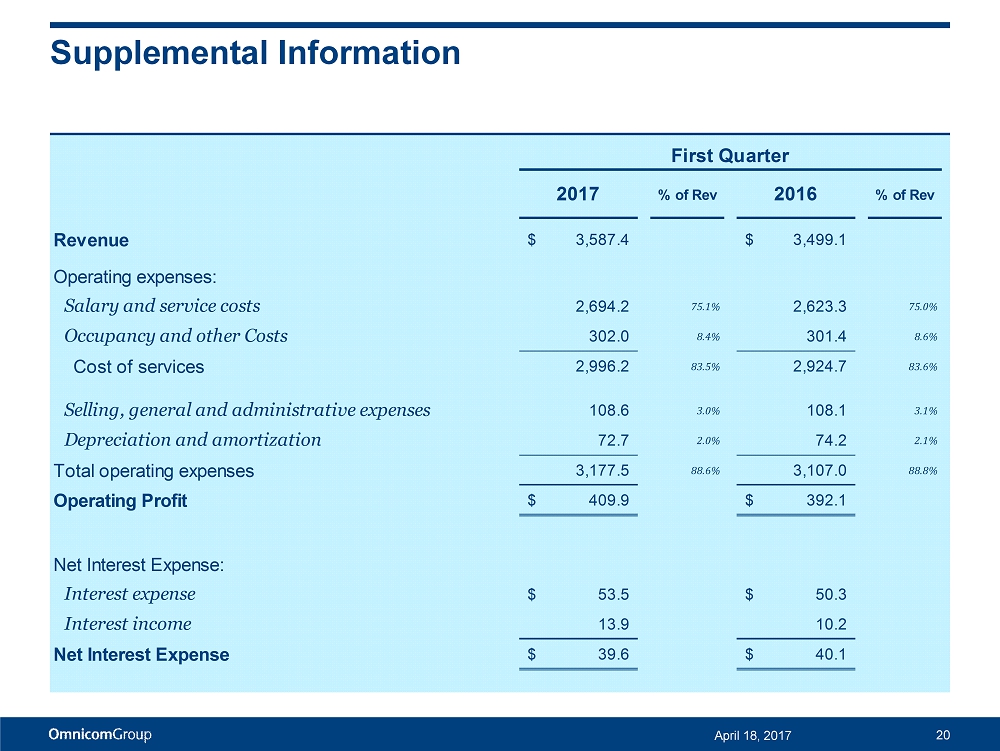
Supplemental Information 20 April 18, 2017 2017 % of Rev 2016 % of Rev Revenue 3,587.4$ 3,499.1$ Operating expenses: Salary and service costs 2,694.2 75.1% 2,623.3 75.0% Occupancy and other Costs 302.0 8.4% 301.4 8.6% Cost of services 2,996.2 83.5% 2,924.7 83.6% Selling, general and administrative expenses 108.6 3.0% 108.1 3.1% Depreciation and amortization 72.7 2.0% 74.2 2.1% Total operating expenses 3,177.5 88.6% 3,107.0 88.8% Operating Profit 409.9$ 392.1$ Net Interest Expense: Interest expense 53.5$ 50.3$ Interest income 13.9 10.2 Net Interest Expense 39.6$ 40.1$ First Quarter
First Quarter Acquisition April 18, 2017 21 TBWA Worldwide has acquired a majority interest in Lucky Generals, a leading independent creative agency in the United Kingdo m . Founded in 2013, Lucky Generals is a full - service creative agency offering a wide range of marketing services, including advertising, experiential, strategy and digital. Lucky Generals is located in London and will operate as a separate brand within the newly formed TBWA UK Group, along with TBWA \ London.
The preceding materials have been prepared for use in the April 18, 2017 conference call on Omnicom’s results of operations f or the period ended March 31, 2017. The call will be archived on the Internet at http://investor.omnicomgroup.com/investor - relations/news - events - and - filings / . Forward - Looking Statements Certain statements in this presentation constitute forward - looking statements, including statements within the meaning of the Pr ivate Securities Litigation Reform Act of 1995. In addition, from time to time, the Company or its representatives have made, or may make, forward - looking statements, orally or in writing. These statements may discuss go als, intentions and expectations as to future plans, trends, events, results of operations or financial condition, or otherwise, based on current beliefs of the Company’s management as well as assumptions made by, and i nfo rmation currently available to, the Company’s management. Forward - looking statements may be accompanied by words such as “aim,” “anticipate,” “believe,” “plan,” “could,” “should,” “would,” “estimate, ” “ expect,” “forecast,” “future,” “guidance,” “intend,” “may,” “will,” “possible,” “potential,” “predict,” “project” or similar words, phrases or expressions. These forward - looking statements are subject to various risks and uncertaint ies, many of which are outside the Company’s control. Therefore, you should not place undue reliance on such statements. Factors that could cause actual results to differ materially from those in the forward - lookin g statements include: international, national or local economic conditions that could adversely affect the Company or its clients; losses on media purchases and production costs incurred on behalf of clients; reductions i n c lient spending, a slowdown in client payments and a deterioration in the credit markets; ability to attract new clients and retain existing clients in the manner anticipated; changes in client advertising, marketin g a nd corporate communications requirements; failure to manage potential conflicts of interest between or among clients; unanticipated changes relating to competitive factors in the advertising, marketing and corporate c omm unications industries; ability to hire and retain key personnel; currency exchange rate fluctuations; reliance on information technology systems; changes in legislation or governmental regulations affecting the Co mpa ny or its clients; risks associated with assumptions the Company makes in connection with its critical accounting estimates and legal proceedings; and the Company’s international operations, which are subject to the ri sks of currency repatriation restrictions, social or political conditions and regulatory environment. The foregoing list of factors is not exhaustive. You should carefully consider the foregoing factors and the oth er risks and uncertainties that may affect the Company’s business, including those described in the “Risk Factors” in Omnicom’s Annual Report on Form 10 - K for the year ended December 31, 2016. Except as required under applicable law, the Company does not assume any obligation to update these forward - looking statements. Non - GAAP Financial Measures We present financial measures determined in accordance with generally accepted accounting principles in the United States (“G AAP ”) and adjustments to the GAAP presentation (“Non - GAAP”), which we believe are meaningful for understanding our performance. Non - GAAP financial measures should not be considered in isolation from, or as a su bstitute for, financial information presented in compliance with GAAP. Non - GAAP financial measures as reported by us may not be comparable to similarly titled amounts reported by other companies. We provid e a reconciliation of non - GAAP measures to the comparable GAAP measures on pages 17, 18 and 19. The Non - GAAP measures used in this presentation include the following: Free Cash Flow, defined as net income plus depreciation, amortization, share based compensation expense plus/(less) other items to reconcile to net cash provided by operating activities. We believe Free Cash Flow is a useful measure of liquidity to evaluate our ability to generate excess cash from our operations. Primary Uses of Cash, defined as dividends to common shareholders, dividends paid to non - controlling interest shareholders, capital expe nditures, cash paid on acquisitions, payments for additional interest in controlled subsidiaries and stock repurchases, net of the proceeds and excess tax benefit from our stock plans, and excludes changes in ope rating capital and other investing and financing activities, including commercial paper issuances and redemptions used to fund working capital changes . We believe this liquidity measure is useful in identifying the significant uses of our cash. Net Free Cash Flow, defined as Free Cash Flow less the Primary Uses of Cash. Net Free Cash Flow is one of the metrics used by us to assess our sources and uses of cash and was derived from our consolida ted statements of cash flows. We believe that this liquidity measure is meaningful for understanding our primary sources and primary uses of that cash flow. EBITDA, defined as operating profit before interest, taxes, depreciation and amortization. We believe EBITDA is meaningful operating performance measure because the financial covenants in our credit facilities are based on EBITDA. EBITA, defined as operating profit before interest, taxes and amortization and EBITA margin, defined as EBITA divided by revenue. We use EBITA and EBITA margin as additional operating performance measures, which excludes the non - cash amortization expense of intangible assets (primarily consisting of amortization arising from acquisi tions). Accordingly, we believe it is a useful measure for investors to evaluate the performance of our businesses. Net Debt, defined as total debt less cash, cash equivalents and short - term investments. We believe net debt, together with the compa rable GAAP measures, reflects one of the liquidity metrics used by us to assess our cash management. After Tax Reported Operating Profit, defined as reported operating profit less income taxes calculated using the effective tax rate for the applicable period. Management uses after tax operating profit as a measure of after tax operating performance as it excludes the after tax effects of financing and investing activities on results of operations. Other Information All dollar amounts are in millions except for per share amounts and figures shown on pages 2 and the net cash returned to shareholders figures on page 11. The information contained in this document has not been audited, although some data has been derived from Omnicom’s historical financial statements, including its audited financial sta tements. In addition, industry, operational and other non - financial data contained in this document have been derived from sources that we believe to be reliable, but we have not independently verified such informati on, and we do not, nor does any other person, assume responsibility for the accuracy or completeness of that information. Certain amounts in prior periods have been reclassified to conform to our current presentat ion . The inclusion of information in this presentation does not mean that such information is material or that disclosure of such inf ormation is required. Disclosure April 18, 2017 22