 EPG
Conference Bob Livingston
May 20, 2014
Exhibit 99.1 |
| 2
Forward looking statements
We want to remind everyone that our comments may contain forward-looking
statements that are inherently subject to uncertainties and risks. We caution
everyone to be guided in their analysis of Dover Corporation by referring to
the documents we file from time to time with the SEC, including our Form
10-K for 2013 and our Form 10-Q for the first quarter of 2014, for a
list of factors that could cause our results to differ from those
anticipated in any such forward- looking statements.
We would also direct your attention to our website, www.dovercorporation.com,
where considerably more information can be found.
2 |
 3
Strategy
Our track record of success is based on:
–
Core technological advantages
–
Leading brands in the markets we serve
–
Commitment to industry leadership through innovation and scale
–
Strong focus on the customer
Our deep understanding of the customer and our exceptional capabilities in
providing solutions enable us to win
Our technologies and innovative products are enablers for our customers to
win Our focus on people drives our performance
–
Develop deep bench
–
Move talent through organization |
 4
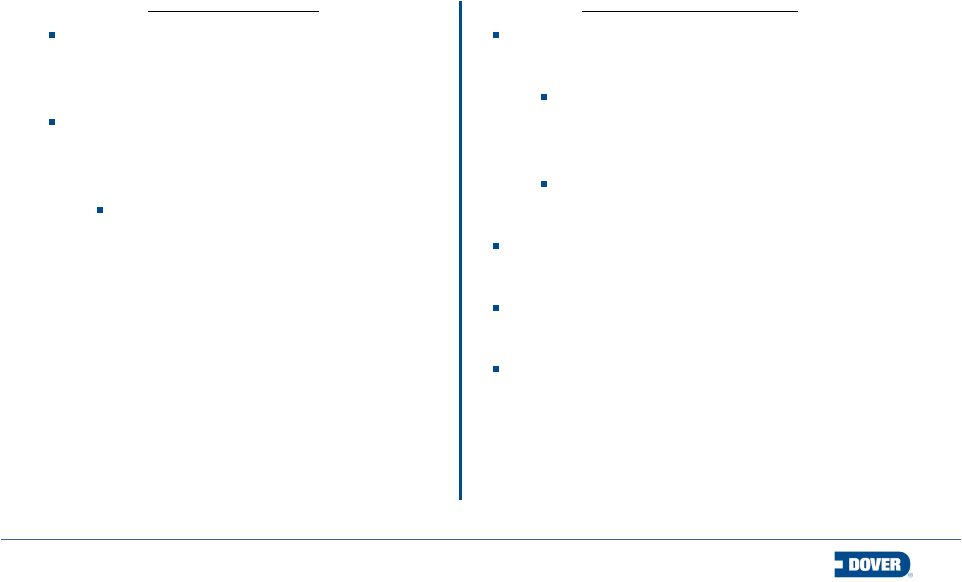
Recent activities support our underlying strategy & strengths
New segment structure to capture
growth opportunities
Building our industrial businesses
–
Continued to expand in our growth
areas
Energy, Fluids, Refrigeration,
Printing & ID all grew organically
and through acquisition
–
Anthony, Finder, KPS, Fibrelite
and MS all expand product
breadth and geographic reach
–
Our business profile is more
consistent and focused with
sustainable higher margins
4
Customer intimacy
–
Innovate for the customer
Recurring theme of delivering
efficiency and sustainability
–
Superior customer service
On-time delivery, quality, support
Leverage our scale
Generate cash
Market share leadership
–
Focus on technology and innovation
drive share gains and customer loyalty
Recent Activities
Underlying Strengths |
 5
Dover has several levers for value creation
5
GROWTH
3% -
5% organically,
complemented by
acquisition growth
MARGIN
Expand segment
margin to 19%
CASH FLOW
Generate free cash flow in
excess of 10% of revenue
Substantial growth
opportunities
Accelerated
productivity initiatives
Significant balance
sheet optionality
Mid-term targets |
 6
Our track record of success
Revenue
EBIT
EPS
Dividends
Note: Revenue and EBIT is in millions; adjusted EPS represents Dover’s
earnings from continuing operations per common share adjusted for gains from discrete and
other tax items of $0.17, $0.16, $0.23, $0.09 and $0.46 respectively, for 2009,
2010, 2011, 2012 and 2013, and other one-time gains of $0.02 in 2013.
$0
$325
$650
$975
$1,300
$0
$2,000
$4,000
$6,000
$8,000
2009
2010
2011
2012
2013
Revenue & EBIT
Revenue
EBIT
$1.00
$1.20
$1.40
$1.60
$0.00
$1.50
$3.00
$4.50
2009
2010
2011
2012
2013
Adj. EPS & Dividends Paid
Adj. EPS
Dividend per share |
 7
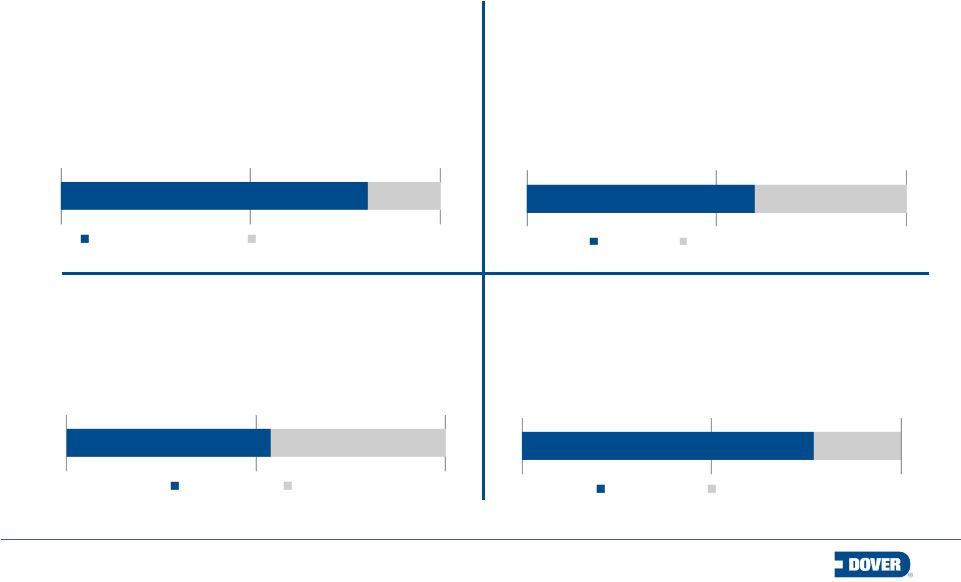
Dover segments at a glance
Revenue Mix
Revenue Mix
Fluids
is focused on the safe handling of critical
fluids across the oil & gas, retail fueling,
chemical, hygienic and industrial end-markets.
Revenue Mix
Refrigeration & Food Equipment
is
the
leading
provider of energy efficient equipment and
systems serving the commercial refrigeration
and food service industries.
Revenue Mix
81%
19%
Drilling & Production
Bearings & Compression
60%
40%
Industrial
Printing & Identification
54%
46%
Fluid Transfer
Pumps
77%
23%
Refrigeration
Food Equipment
Energy
is
a
leading
provider
of
customer
driven solutions and services for safe and
efficient production and processing of oil & gas
worldwide, and has a strong presence in the
bearings and compression components market.
Engineered Systems
is focused on the design,
manufacture and service of critical equipment
and components serving the printing &
identification, vehicle service, waste handling,
and select niche industrial end-markets. |
 8
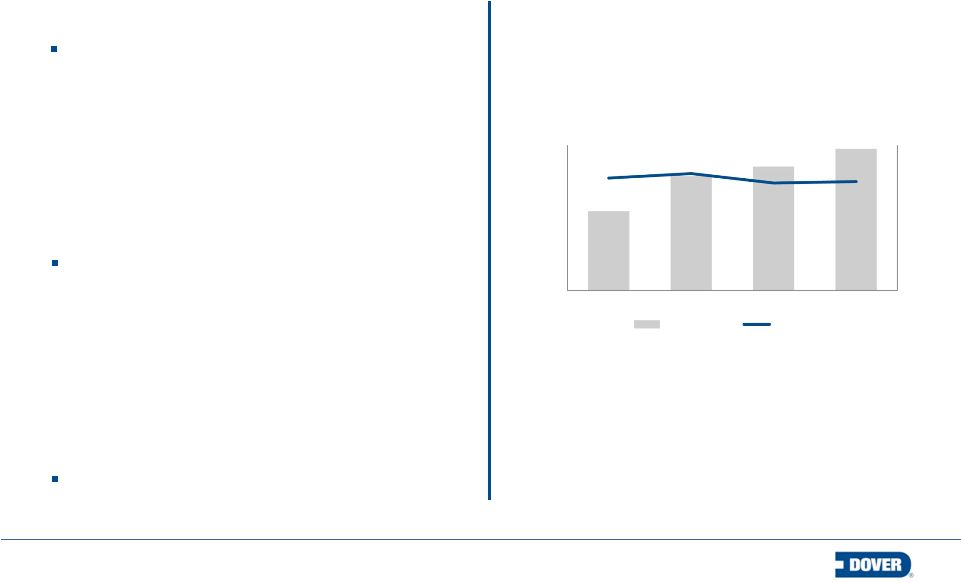
Growth opportunities: A look forward
8
10%
15%
20%
25%
30%
$1,000
$1,200
$1,400
$1,600
$1,800
$2,000
2011
2012
2013
2014F
$ in millions
Revenue & margin
Revenue
Margin
Energy
Grow core business
–
Leverage plunger and gas lift
technologies into international markets
–
Strengthen our position in faster
growing basins
–
Increase OEM share in bearings and
compression
Continue to expand geographical
presence
–
Significant investments in sales, field
engineering and facilities
–
Increase participation in global tenders
–
Seek additional industry partnership
opportunities
Fill in product gaps internally and through
acquisition |
 9
Growth opportunities: A look forward
9
6%
10%
14%
18%
$1,200
$1,600
$2,000
$2,400
$2,800
2011
2012
2013
2014F
$ in millions
Revenue & margin
Revenue
Margin
–
Capitalize in fast growing textile market
–
Grow North American and China presence
in core markets
Make focused industrial investments
–
Concentrate on after-market customer
productivity solutions
–
Expand in high growth recycling and
waste-to energy markets
Extend geographic reach
–
Achieve YOY 10%+ growth outside the US
–
Growing middle class consumption and
higher operating costs driving automation
solutions in emerging markets
Engineered Systems
Expand and extend markets served in
Printing & Identification |
 10
Growth opportunities: A look forward
10
6%
10%
14%
18%
22%
$400
$800
$1,200
$1,600
2011
2012
2013
2014F
$ in millions
Revenue & Margin
Revenue
Margin
Develop and acquire products that provide
complete solutions
–
Innovate around automation, energy
efficiency and compliance
Access new markets through recent
acquisitions
–
Complete “station in a box”
offering
worldwide with KPS and Fibrelite
–
Penetrate NA plastics and oil & gas
markets though European acquisitions
Leverage our global footprint to accelerate
growth
–
Grow presence in Middle East and China
through Maag and Finder channels
–
Expand in Australia through Ebsray’s
LPG and chemical pump technologies
Fluids |
 11
Growth opportunities: A look forward
11
0%
6%
12%
18%
$500
$1,000
$1,500
$2,000
2011
2012
2013
2014F
$ in millions
Revenue & Margin
Revenue
Margin
Refrigeration & Food Equipment
Develop broader customer base
–
Build share with targeted accounts
Capitalize on secular
trends
–
Rising energy costs and increasing
government regulation are driving strong
demand for energy efficient solutions
Penetrate higher growth adjacent markets
–
C-store and small format stores expected
to continue above market growth rates
–
Capitalize on convergence of refrigeration
and food equipment in supermarkets
Acquire assets that expand technology and
geography
–
Build refrigeration capabilities in Brazil
and Europe; Add-ons in food equipment
|
 12
Margin enhancement through productivity
Global supply chain
–
Program now in its 5
year
–
Continuing to leverage the scale of Dover
Many spend categories are being reviewed again
$90
-$120
million
in
savings
or
cost
avoidance
expected
over
the
next
3
years
Shared manufacturing
–
Several consolidation projects are near completion
Hill
Phoenix
will
consolidate
4
sites
in
Atlanta
area
~$3M
of
annualized
savings
*
Energy
will
combine
5
sites
in
Houston
~$1M
of
annualized
savings
*
More projects are on the way
Investing in Lean and Post-Merger Integration (“PMI”)
–
Adding lean resources across segments
–
PMI leaders driven to integrate faster with focus on near term accretion
12
*
Annualized
savings
over
3
years
(2014
–
2016)
th
|
 13
Capital allocation 2014
Strong balance sheet
–
$486 million cash as of March 31, 2014 (primarily overseas)
–
$170 million in proceeds from DEK sale (expected mid-year)
–
Strong
FY
free
cash
flow
expected
( 11%
of
revenue)
We
expect
to
raise
the
dividend
for
59
consecutive
year
Capex expected to be roughly $200 million
Acquisitions
–
Pipeline is active
Completed $1 billion share repurchase program in Q1
–
Capacity to do more; largely dependent on how pipeline develops
13
th
|
 14
Q1 revenue growth led by Fluids and Engineered Systems, also solid growth in
Energy
–
US markets were strong; Europe markets continue to grow; China markets
moderated
–
Bookings growth of 5% is broad-based
–
Margin
impacted
70
bps
by
acquisitions,
core
business
performing
well
Q2
activity
is
solid
across
all
segments;
targeting
the
high-end
of
our
$4.60
-
$4.80
EPS range
–
Energy, Engineered Systems and Fluids all performing well
–
Refrigeration & Food Equipment seasonally ramping as anticipated
–
Margin
will
sequentially
improve
in
the
seasonally
strong
second
quarter
Q1 2014 performance and Q2 commentary
14 |
 |