EX-99.3
Exhibit 99.3
1st
Quarter 2012
Earnings Conference Call
April 27, 2012
Safe
Harbor Statement
The information contained herein is as of the date of this presentation. Many factors may
impact forward-looking statements including, but not limited to, the following: impact of regulation by the FERC, MPSC, NRC and other applicable governmental proceedings and regulations, including any associated impact on rate structures; the amount
and timing of cost recovery allowed as a result of regulatory proceedings, related appeals or new legislation; impact of electric and gas utility restructuring in Michigan, including legislative amendments and Customer Choice programs; economic
conditions and population changes in our geographic area resulting in changes in demand, customer conservation, increased thefts of electricity and gas and high levels of uncollectible accounts receivable; environmental issues, laws, regulations,
and the increasing costs of remediation and compliance, including actual and potential new federal and state requirements; health, safety, financial, environmental and regulatory risks associated with ownership and operation of nuclear facilities;
changes in the cost and availability of coal and other raw materials, purchased power and natural gas; volatility in the short-term natural gas storage markets impacting third-party storage revenues; access to capital markets and the results of
other financing efforts which can be affected by credit agenc y ratings; instability in capital markets which could impact availability of short and long-term financing; the timing and extent of changes in interest rates; the level of borrowings;
the potential for losses on investments, including nuclear decommissioning and benefit plan assets and the related increases in future expense and contributions; the potential for increased costs or delays in completion of significant construction
projects; the uncertainties of successful exploration of unconventional gas and oil resources and challenges in estimating gas and oil reserves with certainty; changes in and application of federal, state and local tax laws and their
interpretations, including the Internal Revenue Code, regulations, rulings, court proceedings and audits; the effects of weather and other natural phenomena on operations and sales to customers, and purchases from suppliers; unplanned outages; the
cost of protecting assets against, or damage due to, terrorism or cyber attacks; employee relations and the impact of collective bargaining agreements; the availability, cost, coverage and terms of insurance and stability of insurance providers;
cost reduction efforts and the maximization of plant and distribution system performance; the effects of competition; changes in and application of accounting standards and financial reporting regulations; changes in federal or state laws and their
interpretation with respect to regulation, energy policy and other business issues; binding arbitration, litigation and related appeals; and the risks discussed in our public filings with the Securities and Exchange Commission. New factors emerge
from time to time. We cannot predict what factors may arise or how such factors may cause our results to differ materially from those contained in any forward-looking statement. Any forward-looking statements refer only as of the date on which such
statements are made. We undertake no obligation to update any forward-looking statement to reflect events or circumstances after the date on which such statement is made or to reflect the occurrence of unanticipated events. This presentation should
also be read in conjunction with the “Forward-Looking Statements” sections in each of DTE Energy’s and Detroit Edison’s 2011 Forms 10-K (which sections are incorporated herein by reference), and in conjunction with other SEC
reports filed by DTE Energy and Detroit Edison.
Cautionary Note – The Securities and Exchange Commission
permits oil and gas companies, in their filings with the SEC, to disclose only proved reserves that a company has demonstrated by actual production or conclusive formation tests to be economically and legally producible under existing economic and
operating conditions. We use certain terms in this presentation such as “probable reserves” that the SEC’s guidelines strictly prohibit us from including in filings with the SEC. You are urged to consider closely the disclosure in DTE
Energy’s 2011 Form 10-K, File No. 1-11607, available from our offices or from our website at www.dteenergy.com. You can also obtain this Forms from the SEC by accessing its website at www.sec.gov or by calling 1-800-SEC-0330.

Participants
• Dave Meador, Executive Vice President and CFO
• Peter Oleksiak, Vice President, Controller & Investor Relations
• Nick Khouri, Vice President and Treasurer
• Mark Rolling, Director of Investor Relations
•
Overview
• First Quarter 2012 Earnings Results
• Cash Flow and Capital Expenditures
• Summary
Investment
Thesis
DTE Energy has a plan it believes will provide 5%—6% long-term operating EPS growth, an attractive
dividend yield and a strong balance sheet
– Utility growth plan driven by mandated investments
5%-6% Average Annual EPS Growth
– Constructive regulatory structure and continued cost savings enable utilities to earn their authorized returns
Attractive Dividend
– Plans in place to achieve operational excellence and customer satisfaction that are distinctive in our industry, with a focus on customer affordability
– Meaningful, low-risk growth opportunities in non-utility businesses continue to provide diversity in earnings and
geography
Overview
DTE Energy 1Q 2012 operating earnings per share* of $0.91 vs. $1.11 in 1Q 2011; maintaining 2012 operating
earnings guidance of $3.65—$3.95
– Detroit Edison results are flat year over year
– MichCon experienced unusually warm weather in 1Q 2012; working to offset weather impact
• Rate case filed April 20, 2012 for $77 million
– Energy Trading had a slight 1Q 2012 loss from unprecedented mild weather
Will leverage opportunities across portfolio of businesses to help offset unfavorable 1Q 2012 weather
Balance sheet remains strong
– Generated $620 million in cash from operations 1Q 2012
– On pace to hit balance sheet targets in 2012
| * |
|
Reconciliation to GAAP reported earnings included in the appendix 6 |
2012
Operating Earnings Guidance*
2011 2012
2012 Drivers
($ millions, except EPS) Actual* Guidance
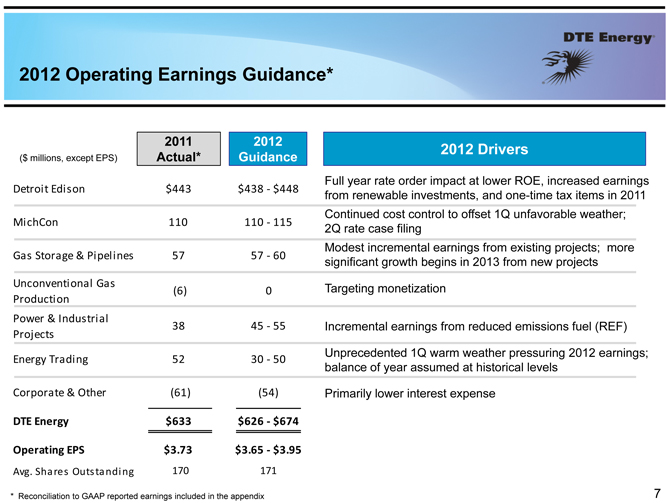
Full
year rate order impact at lower ROE, increased earnings
Detroit Edison $443 $438 $ ? 448 from renewable
investments, and one-time tax items in 2011 Continued cost control to offset 1Q unfavorable weather;
MichCon
110 110 115 ?
2Q rate case filing
Modest incremental earnings from existing projects; more
Gas Storage & Pipelines 57 57 60 ? significant growth begins in 2013 from new projects
Unconventional Gas Targeting monetization
| (6) |
|
0 Production Power & Industrial |
38 45 55 ? Incremental earnings from reduced emissions fuel (REF)
Projects
Unprecedented 1Q warm weather pressuring 2012 earnings;
Energy Trading 52 30 ?50 balance of year assumed at historical levels
Corporate & Other (61) (54) Primarily lower interest expense
DTE Energy $633 $626 $ ? 674
Operating EPS $3.73
$3.65 $ ? 3.95
Avg. Shares Outstanding 170 171
| * |
|
Reconciliation to GAAP reported earnings included in the appendix 7 |
MichCon
Rate Case Filing (U-16999)
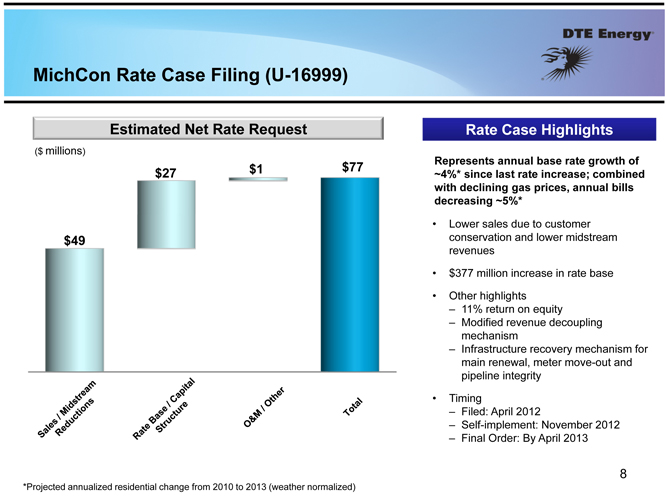
Estimated Net Rate Request Rate Case Highlights
($ millions) Represents annual base rate growth of
$1 $77
$27 ~4%* since last rate increase; combined with declining gas prices, annual bills decreasing ~5%*
• Lower sales due to customer $49 conservation and lower midstream revenues
• $377 million increase in rate base
•
Other highlights
– 11% return on equity
– Modified revenue decoupling mechanism
– Infrastructure recovery mechanism for main renewal, meter move-out and pipeline integrity
• Timing
– Filed: April 2012
– Self-implement: November 2012
– Final Order: By April 2013
*Projected annualized residential change from 2010 to 2013 (weather normalized)
•
Overview
• First Quarter 2012 Earnings Results
• Cash Flow and Capital Expenditure
• Summary
9
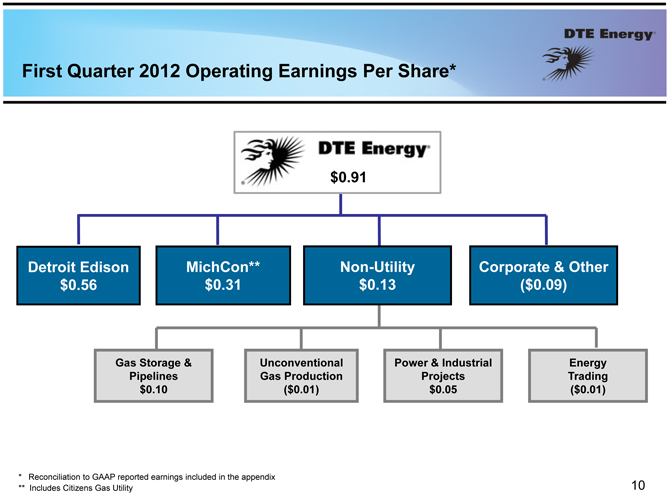
First
Quarter 2012 Operating Earnings Per Share*
$0.91
Detroit Edison MichCon** Non-Utility Corporate & Other $0.56 $0.31 $0.13 ($0.09)
Gas Storage & Unconventional Power & Industrial Energy Pipelines Gas Production Projects Trading $0.10
($0.01) $0.05 ($0.01)
| * |
|
Reconciliation to GAAP reported earnings included in the appendix |
** Includes Citizens Gas Utility 10
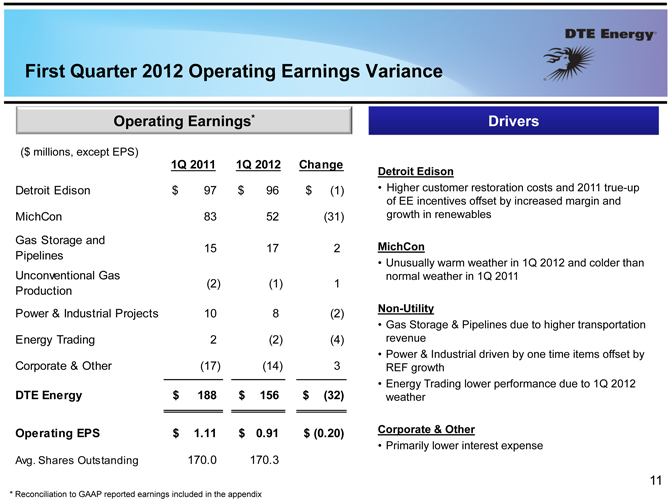
First
Quarter 2012 Operating Earnings Variance
Operating Earnings* Drivers
($ millions, except EPS)
1Q 2011 1Q 2012 Change
Detroit Edison
Detroit Edison $ 97 $ 96 $ (1) • Higher customer restoration costs and 2011 true-up of EE incentives offset by
increased margin and MichCon 83 52 (31) growth in renewables Gas Storage and
15 17 2 MichCon Pipelines
• Unusually warm weather in 1Q 2012 and colder than Unconventional Gas normal weather in 1Q 2011
(2) (1) 1 Production Power & Industrial Projects 10 8 (2) Non-Utility
• Gas
Storage & Pipelines due to higher transportation Energy Trading 2 (2) (4) revenue
•
Power & Industrial driven by one time items offset by Corporate & Other (17) (14) 3 REF growth
• Energy Trading lower performance due to 1Q 2012
DTE Energy $ 188 $ 156 $ (32) weather
Operating EPS $ 1.11 $ 0.91 $ (0.20) Corporate & Other
• Primarily lower interest expense Avg. Shares Outstanding 170.0 170.3
11
| * |
|
Reconciliation to GAAP reported earnings included in the appendix |
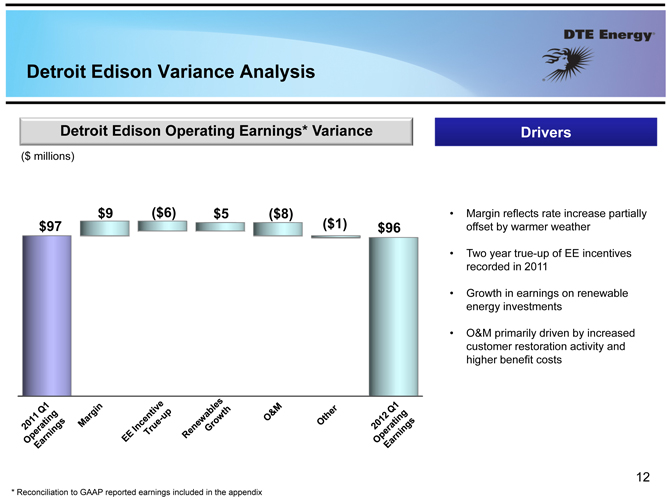
Detroit
Edison Variance Analysis
Detroit Edison Operating Earnings* Variance Drivers
($ millions)
$9 ($6) $5 ($8) • Margin reflects rate increase partially
$97 ($1) $96 offset by warmer weather
• Two
year true-up of EE incentives recorded in 2011
• Growth in earnings on renewable energy investments
• O&M primarily driven by increased customer restoration activity and higher benefit costs
12
| * |
|
Reconciliation to GAAP reported earnings included in the appendix |
•
Overview
• First Quarter 2012 Earnings Results
• Cash Flow and Capital Expenditures
• Summary
13
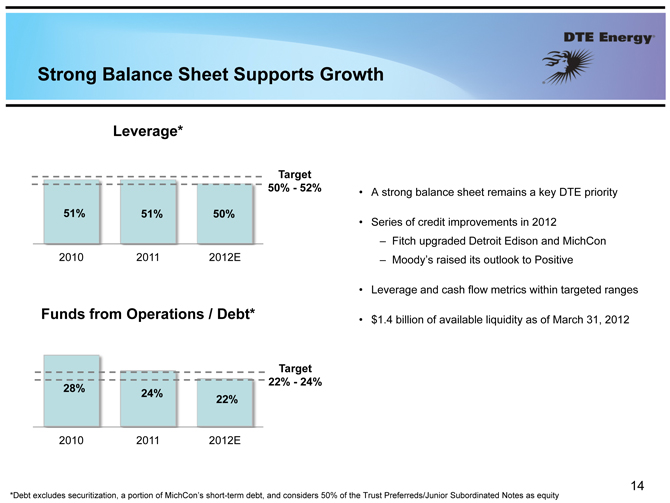
Strong
Balance Sheet Supports Growth
Leverage*
Target
50%—52% • A strong balance sheet remains a key DTE priority
51% 51% 50%
• Series of credit improvements
in 2012
– Fitch upgraded Detroit Edison and MichCon 2010 2011 2012E – Moody’s raised its
outlook to Positive
• Leverage and cash flow metrics within targeted ranges
Funds from Operations / Debt* • $1.4 billion of available liquidity as of March 31, 2012
Target 22%—24% 28% 24% 22%
2010 2011 2012E
*Debt excludes securitization, a
portion of MichCon’s short-term debt, and considers 50% of the Trust Preferreds/Junior Subordinated Notes as equity 14
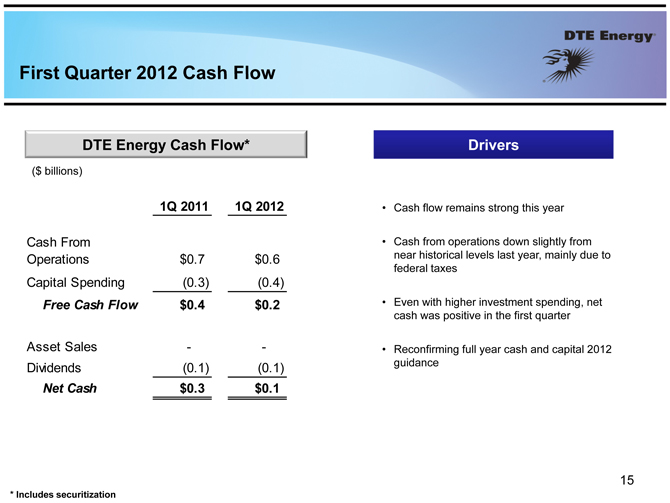
First
Quarter 2012 Cash Flow
DTE Energy Cash Flow* Drivers
($ billions)
1Q 2011 1Q 2012 • Cash flow remains strong this year
Cash From • Cash from operations down slightly from Operations $0.7 $0.6 near historical levels last year, mainly due to federal taxes
Capital Spending (0.3) (0.4)
Free Cash Flow $0.4 $0.2 • Even with higher investment spending, net cash was positive in the first quarter
Asset Sales — —• Reconfirming full year cash and capital 2012
Dividends (0.1) (0.1) guidance
Net Cash $0.3 $0.1
15
| * |
|
Includes securitization |
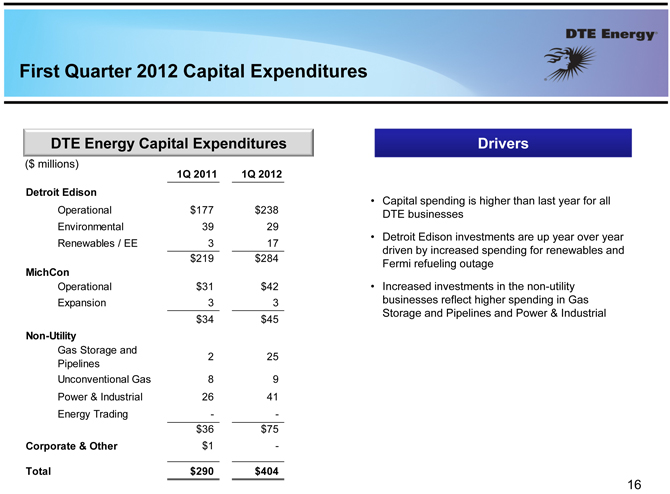
First
Quarter 2012 Capital Expenditures
DTE Energy Capital Expenditures Drivers
($ millions) 1Q 2011 1Q 2012 Detroit Edison
Operational $177 $238 • Capital spending is higher than last year for all
DTE businesses
Environmental 39 29 • Detroit
Edison investments are up year over year Renewables / EE 3 17 driven by increased spending for renewables and $219 $284 Fermi refueling outage
MichCon
Operational $31 $42 • Increased
investments in the non-utility Expansion 3 3 businesses reflect higher spending in Gas Storage and Pipelines and Power & Industrial
$34 $45
Non-Utility
Gas Storage and
2 25 Pipelines Unconventional Gas 8 9 Power & Industrial 26 41 Energy Trading — -
$36 $75
Corporate & Other $1 -
Total $290 $404
16
•
Overview
• First Quarter 2012 Earnings Results
• Cash Flow and Capital Expenditures
• Summary
17
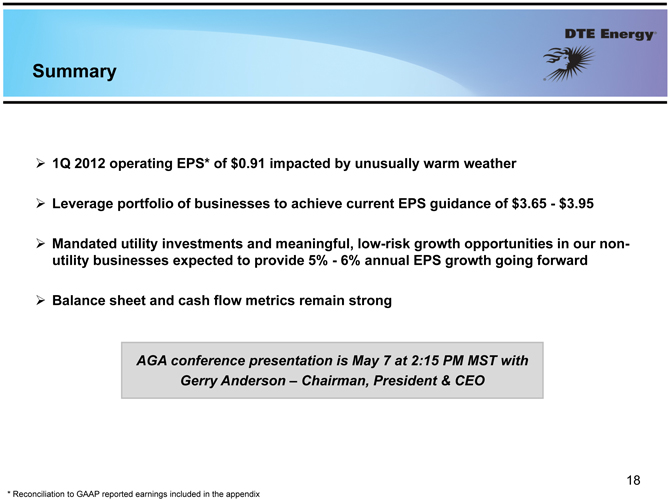
Summary
?1Q 2012 operating EPS* of $0.91 impacted by unusually warm weather
?Leverage portfolio of businesses to achieve current EPS guidance of $3.65—$3.95
?Mandated utility investments and meaningful, low-risk growth opportunities in our non-utility businesses expected to
provide 5%—6% annual EPS growth going forward
?Balance sheet and cash flow metrics remain strong
AGA conference presentation is May 7 at 2:15 PM MST with Gerry Anderson – Chairman,
President & CEO
18
| * |
|
Reconciliation to GAAP reported earnings included in the appendix |

Contact Us
DTE Energy Investor Relations www.dteenergy.com/investors 313-235-8030
19
Appendix
DTE Energy
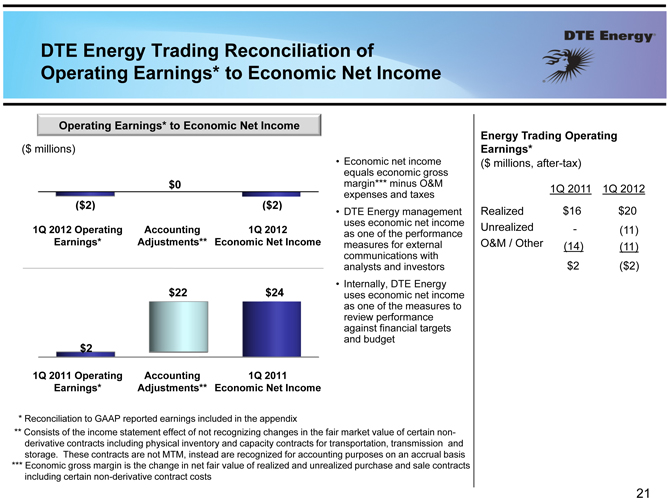
Trading Reconciliation of Operating Earnings* to Economic Net Income
Operating Earnings* to Economic Net
Income Energy Trading Operating ($ millions) Earnings*
• Economic net income ($ millions, after-tax)
equals economic gross $0 margin*** minus O&M
1Q 2011 1Q 2012 expenses and taxes
($2) ($2)
• DTE Energy management Realized $16 $20 uses economic net income Unrealized
1Q 2012 Operating Accounting 1Q 2012 as one of the performance—(11) Earnings* Adjustments** Economic Net Income measures for external O&M / Other
(14) (11) communications with $2 ($2) analysts and investors
• Internally, DTE Energy
$22 $24 uses economic net income as one of the measures to review performance against financial targets and
budget $2
1Q 2011 Operating Accounting 1Q 2011 Earnings* Adjustments** Economic Net Income
| * |
|
Reconciliation to GAAP reported earnings included in the appendix |
** Consists of the income statement effect of not recognizing changes in the fair market value of certain non-derivative
contracts including physical inventory and capacity contracts for transportation, transmission and storage. These contracts are not MTM, instead are recognized for accounting purposes on an accrual basis *** Economic gross margin is the change in
net fair value of realized and unrealized purchase and sale contracts including certain non-derivative contract costs
21
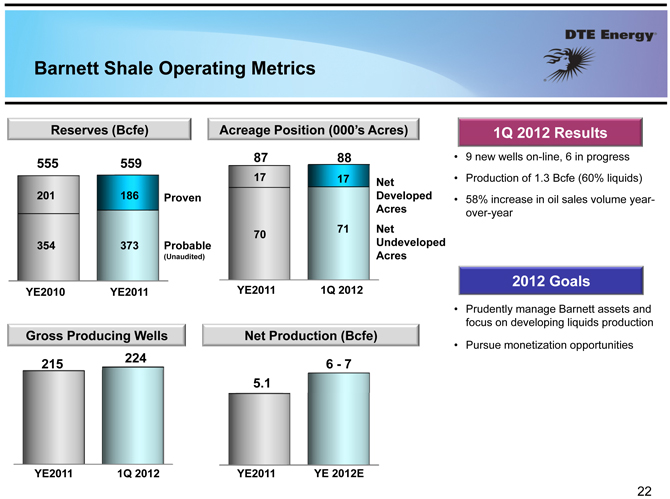
Barnett
Shale Operating Metrics
Reserves (Bcfe) Acreage Position (000’s Acres) 1Q 2012 Results
87 88 • 9 new wells on-line, 6 in progress
555 559
17 17 Net • Production of 1.3 Bcfe
(60% liquids) 201 186 Proven Developed • 58% increase in oil sales volume year-Acres over-year
71 Net 70
354 373 Probable Undeveloped
(Unaudited) Acres
2012 Goals
YE2010 YE2011 YE2011 1Q 2012
• Prudently manage Barnett assets and focus on developing liquids production
Gross Producing Wells Net Production (Bcfe)
• Pursue monetization opportunities
224
215 6—7 5.1
YE2011 1Q 2012 YE2011 YE 2012E
22
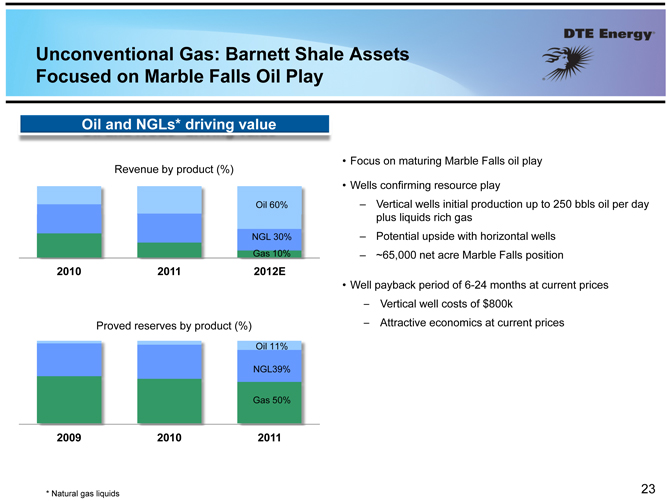
Unconventional Gas: Barnett Shale Assets Focused on Marble Falls Oil Play
Oil and NGLs* driving value
• Focus on maturing Marble Falls oil play Revenue by product (%)
• Wells confirming resource play
Oil 60%
– Vertical wells initial production up to 250 bbls oil per day plus liquids rich gas NGL 30% – Potential upside with horizontal wells Gas 10% – ~65,000 net acre Marble Falls position
2010 2011 2012E
• Well payback period of 6-24 months at current prices
– Vertical well costs of $800k
Proved
reserves by product (%) – Attractive economics at current prices Oil 11%
NGL39%
Gas 50%
2009 2010 2011
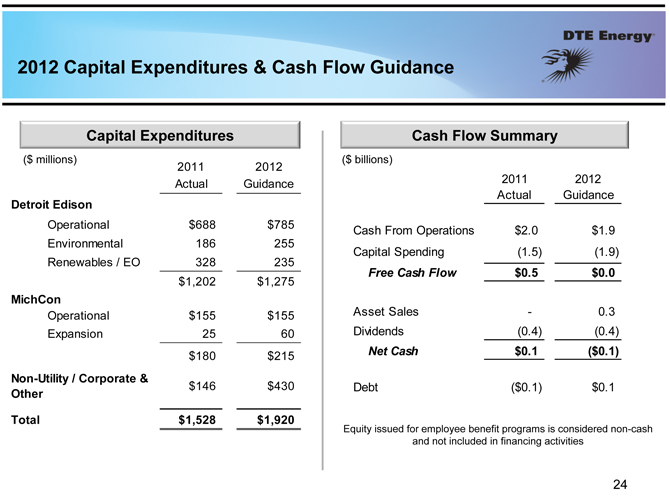
2012
Capital Expenditures & Cash Flow Guidance
Capital Expenditures Cash Flow Summary
($ millions) ($ billions) 2011 2012
Actual Guidance 2011 2012 Actual Guidance
Detroit
Edison
Operational $688 $785
Cash From Operations $2.0 $1.9 Environmental 186 255 Renewables / EO 328 235 Capital Spending (1.5) (1.9)
Free Cash Flow $0.5 $0.0 $1,202 $1,275
MichCon
Operational $155 $155 Asset Sales — 0.3 Expansion 25 60 Dividends (0.4) (0.4) $180 $215 Net Cash $0.1
($0.1) Non-Utility / Corporate & $146 $430 Debt ($0.1) $0.1
Other
Total $1,528 $1,920
Equity issued for employee benefit programs is considered non-cash and not included in financing activities
24
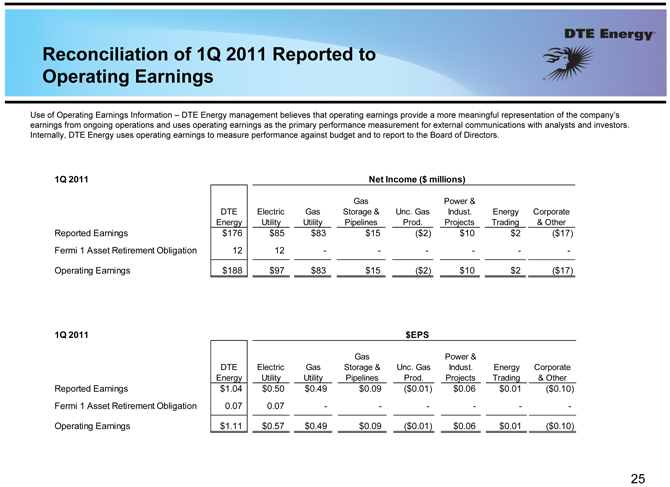
Reconciliation of 1Q 2011 Reported to Operating Earnings
Use of Operating Earnings Information – DTE Energy management believes that operating earnings provide a more
meaningful representation of the company’s earnings from ongoing operations and uses operating earnings as the primary performance measurement for external communications with analysts and investors. Internally, DTE Energy uses operating
earnings to measure performance against budget and to report to the Board of Directors.
1Q 2011 Net Income ($
millions)
Gas Power &
DTE Electric Gas Storage & Unc. Gas Indust. Energy Corporate Energy Utility Utility Pipelines Prod. Projects Trading & Other Reported Earnings $176 $85 $83 $15 ($2) $10
$2 ($17) Fermi 1 Asset Retirement Obligation 12 12 — — — — — -
Operating Earnings
$188 $97 $83 $15 ($2) $10 $2 ($17)
1Q 2011 $EPS
Gas Power &
DTE Electric Gas Storage & Unc. Gas Indust. Energy Corporate Energy Utility Utility Pipelines Prod. Projects Trading & Other Reported Earnings $1.04 $0.50 $0.49 $0.09
($0.01) $0.06 $0.01 ($0.10) Fermi 1 Asset Retirement Obligation 0.07 0.07 — — — — — -
Operating Earnings $1.11 $0.57 $0.49 $0.09 ($0.01) $0.06 $0.01 ($0.10)
25
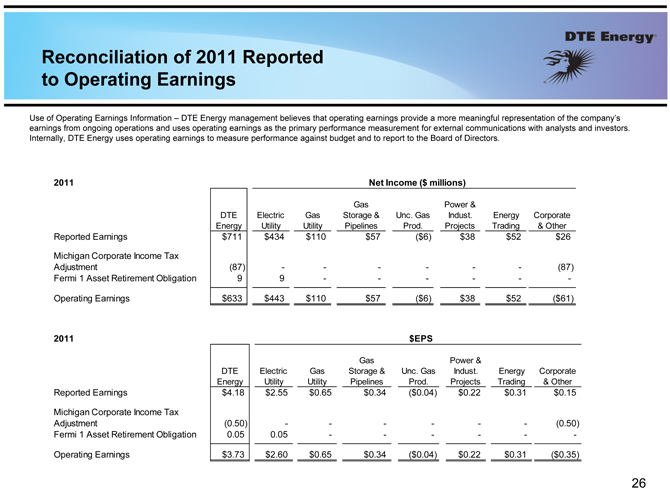
Reconciliation of 2011 Reported to Operating Earnings
Use of Operating Earnings Information – DTE Energy management believes that operating earnings provide a more
meaningful representation of the company’s earnings from ongoing operations and uses operating earnings as the primary performance measurement for external communications with analysts and investors. Internally, DTE Energy uses operating
earnings to measure performance against budget and to report to the Board of Directors.
2011 Net Income ($
millions)
Gas Power &
DTE Electric Gas Storage & Unc. Gas Indust. Energy Corporate Energy Utility Utility Pipelines Prod. Projects Trading & Other Reported Earnings $711 $434 $110 $57 ($6) $38
$52 $26
Michigan Corporate Income Tax
Adjustment (87) — — — — — — (87) Fermi 1 Asset Retirement Obligation 9 9 — — — — — -
Operating Earnings $633 $443 $110 $57 ($6) $38 $52 ($61)
2011 $EPS
Gas Power &
DTE Electric Gas
Storage & Unc. Gas Indust. Energy Corporate Energy Utility Utility Pipelines Prod. Projects Trading & Other Reported Earnings $4.18 $2.55 $0.65 $0.34 ($0.04) $0.22 $0.31 $0.15
Michigan Corporate Income Tax
Adjustment (0.50) — — — — — — (0.50) Fermi 1 Asset Retirement Obligation 0.05 0.05 — — — — — -
Operating Earnings $3.73 $2.60 $0.65 $0.34 ($0.04) $0.22 $0.31 ($0.35)
26
Reconciliation of Other Reported to Operating Earnings
Use of Operating Earnings Information – DTE Energy management believes that operating earnings provide a more
meaningful representation of the company’s earnings from ongoing operations and uses operating earnings as the primary performance measurement for external communications with analysts and investors. Internally, DTE Energy uses operating
earnings to measure performance against budget and to report to the Board of Directors.
In this presentation,
DTE Energy provides guidance for future period operating earnings. It is likely that certain items that impact the company’s future period reported results will be excluded from operating results. A reconciliation to the comparable future
period reported earnings is not provided because it is not possible to provide a reliable forecast of specific line items. These items may fluctuate significantly from period to period and may have a significant impact on reported earnings.
There were no reported to operating earnings adjustments in 1Q 2012.
27