Exhibit 99.2

DTE ENERGY COMPANY
CONSOLIDATED STATEMENTS OF FINANCIAL POSITION (UNAUDITED)
June 30 | December 31 | ||||||
(in Millions) | 2012 | 2011 | |||||
ASSETS | |||||||
Current Assets | |||||||
Cash and cash equivalents | $ | 185 | $ | 68 | |||
Restricted cash, principally Securitization | 110 | 147 | |||||
Accounts receivable (less allowance for doubtful accounts of $153 and $162, respectively) | |||||||
Customer | 1,239 | 1,317 | |||||
Other | 164 | 90 | |||||
Inventories | |||||||
Fuel and gas | 487 | 572 | |||||
Materials and supplies | 223 | 219 | |||||
Deferred income taxes | 65 | 51 | |||||
Derivative assets | 221 | 222 | |||||
Regulatory assets | 194 | 314 | |||||
Other | 162 | 196 | |||||
3,050 | 3,196 | ||||||
Investments | |||||||
Nuclear decommissioning trust funds | 985 | 937 | |||||
Other | 533 | 525 | |||||
1,518 | 1,462 | ||||||
Property | |||||||
Property, plant and equipment | 23,081 | 22,541 | |||||
Less accumulated depreciation, depletion and amortization | (8,929 | ) | (8,795 | ) | |||
14,152 | 13,746 | ||||||
Other Assets | |||||||
Goodwill | 2,020 | 2,020 | |||||
Regulatory assets | 4,390 | 4,539 | |||||
Securitized regulatory assets | 497 | 577 | |||||
Intangible assets | 67 | 73 | |||||
Notes receivable | 117 | 123 | |||||
Derivative assets | 75 | 74 | |||||
Other | 189 | 199 | |||||
7,355 | 7,605 | ||||||
Total Assets | $ | 26,075 | $ | 26,009 | |||
DTE ENERGY COMPANY
CONSOLIDATED STATEMENTS OF FINANCIAL POSITION (UNAUDITED) — (Continued)
June 30 | December 31 | ||||||
(in Millions, except shares) | 2012 | 2011 | |||||
LIABILITIES AND EQUITY | |||||||
Current Liabilities | |||||||
Accounts payable | $ | 728 | $ | 782 | |||
Accrued interest | 94 | 95 | |||||
Dividends payable | 207 | 99 | |||||
Short-term borrowings | 39 | 419 | |||||
Current portion long-term debt, including capital leases | 848 | 526 | |||||
Derivative liabilities | 211 | 158 | |||||
Other | 508 | 549 | |||||
2,635 | 2,628 | ||||||
Long-Term Debt (net of current portion) | |||||||
Mortgage bonds, notes and other | 6,528 | 6,405 | |||||
Securitization bonds | 391 | 479 | |||||
Junior subordinated debentures | 280 | 280 | |||||
Capital lease obligations | 13 | 23 | |||||
7,212 | 7,187 | ||||||
Other Liabilities | |||||||
Deferred income taxes | 3,263 | 3,116 | |||||
Regulatory liabilities | 1,007 | 1,019 | |||||
Asset retirement obligations | 1,641 | 1,591 | |||||
Unamortized investment tax credit | 60 | 65 | |||||
Derivative liabilities | 62 | 89 | |||||
Accrued pension liability | 1,224 | 1,298 | |||||
Accrued postretirement liability | 1,341 | 1,484 | |||||
Nuclear decommissioning | 149 | 148 | |||||
Other | 297 | 331 | |||||
9,044 | 9,141 | ||||||
Commitments and Contingencies | |||||||
Equity | |||||||
Common stock, without par value, 400,000,000 shares authorized, 171,754,812 and 169,247,282 shares issued and outstanding, respectively | 3,549 | 3,417 | |||||
Retained earnings | 3,744 | 3,750 | |||||
Accumulated other comprehensive loss | (151 | ) | (158 | ) | |||
Total DTE Energy Company Equity | 7,142 | 7,009 | |||||
Noncontrolling interests | 42 | 44 | |||||
Total Equity | 7,184 | 7,053 | |||||
Total Liabilities and Equity | $ | 26,075 | $ | 26,009 | |||
DTE ENERGY COMPANY
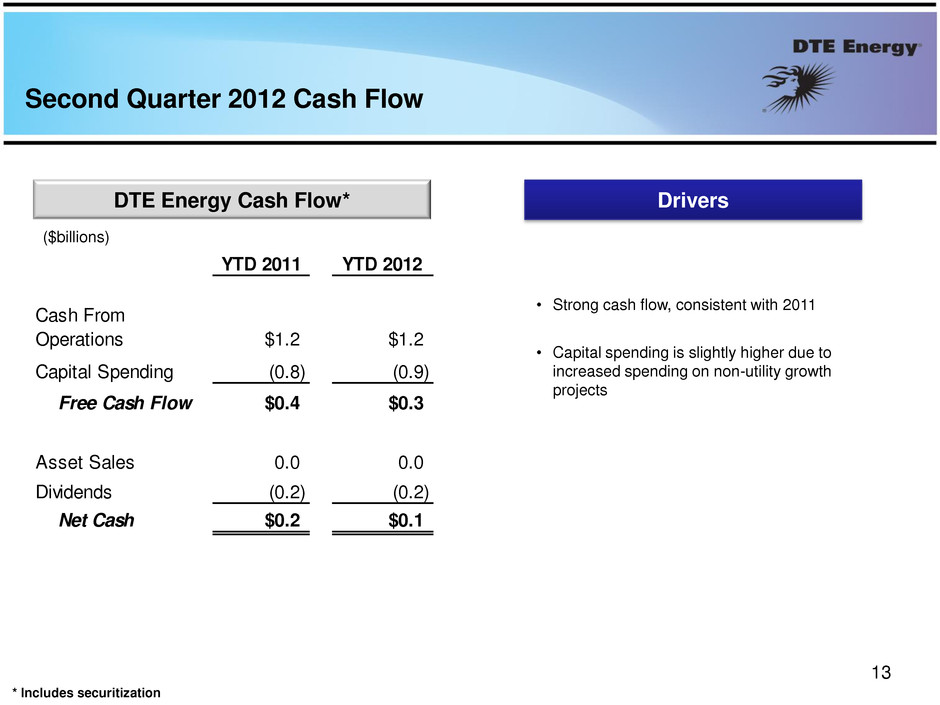
CONSOLIDATED STATEMENTS OF CASH FLOWS (UNAUDITED)
Six Months Ended | |||||||
June 30 | |||||||
(in Millions) | 2012 | 2011 | |||||
Operating Activities | |||||||
Net income | $ | 305 | $ | 378 | |||
Adjustments to reconcile net income to net cash from operating activities: | |||||||
Depreciation, depletion and amortization | 482 | 493 | |||||
Deferred income taxes | 81 | 14 | |||||
Asset (gains) and losses, reserves and impairments, net | (7 | ) | 8 | ||||
Changes in assets and liabilities, exclusive of changes shown separately | 300 | 266 | |||||
Net cash from operating activities | 1,161 | 1,159 | |||||
Investing Activities | |||||||
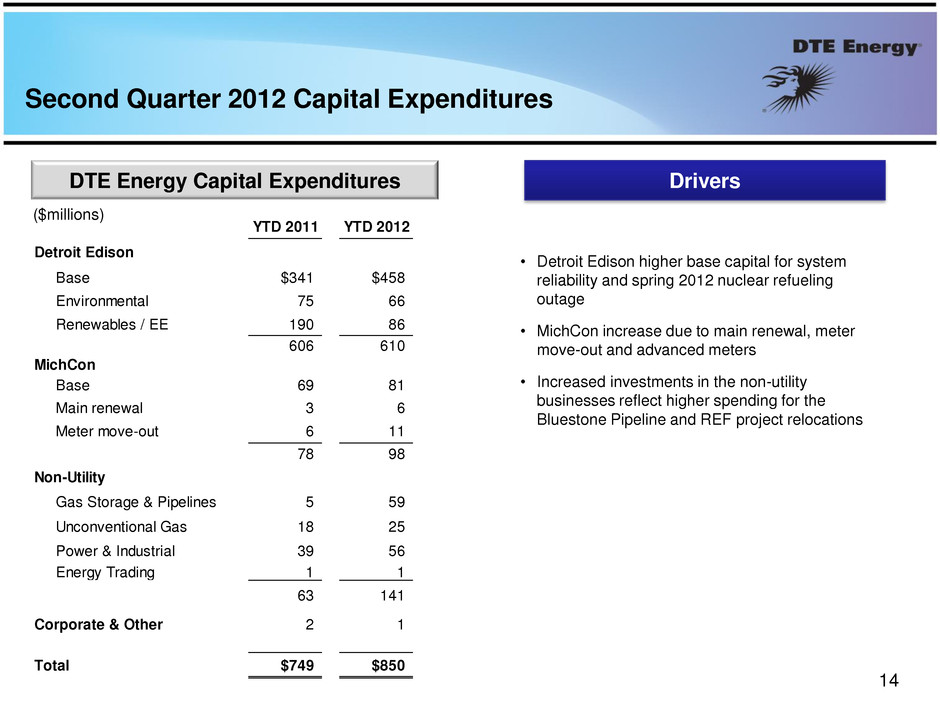
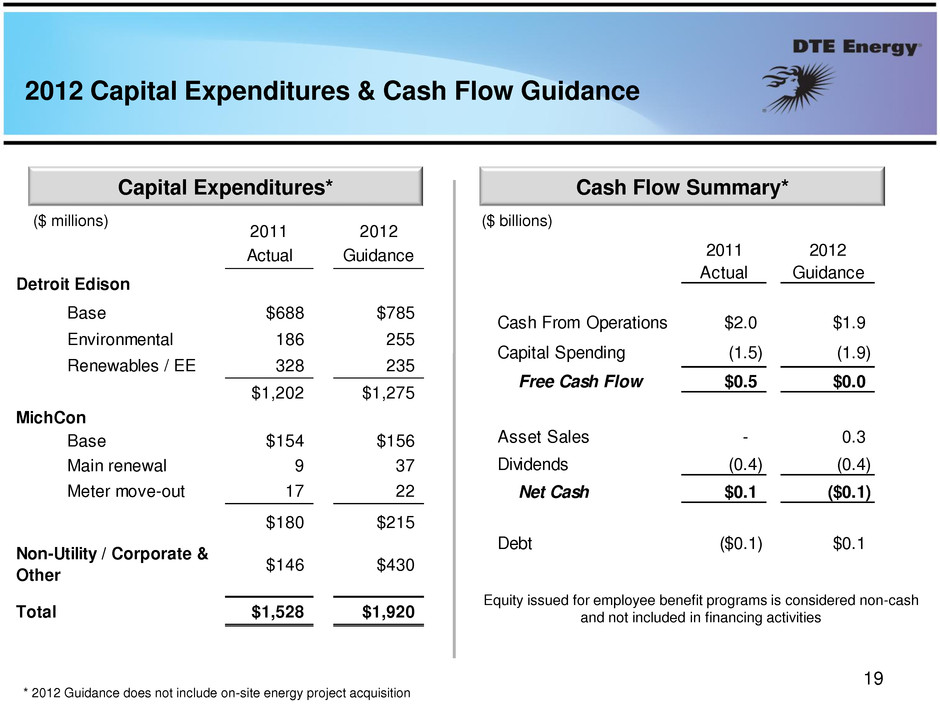
Plant and equipment expenditures — utility | (708 | ) | (684 | ) | |||
Plant and equipment expenditures — non-utility | (131 | ) | (35 | ) | |||
Proceeds from sale of assets | 15 | 9 | |||||
Restricted cash for debt redemption, principally Securitization | 15 | 2 | |||||
Proceeds from sale of nuclear decommissioning trust fund assets | 36 | 59 | |||||
Investment in nuclear decommissioning trust funds | (44 | ) | (76 | ) | |||
Other | (15 | ) | (42 | ) | |||
Net cash used for investing activities | (832 | ) | (767 | ) | |||
Financing Activities | |||||||
Issuance of long-term debt | 496 | 547 | |||||
Redemption of long-term debt | (140 | ) | (721 | ) | |||
Short-term borrowings, net | (380 | ) | 1 | ||||
Issuance of common stock | 20 | — | |||||
Repurchase of common stock | — | (18 | ) | ||||
Dividends on common stock | (199 | ) | (190 | ) | |||
Other | (9 | ) | (15 | ) | |||
Net cash used for financing activities | (212 | ) | (396 | ) | |||
Net Increase (Decrease) in Cash and Cash Equivalents | 117 | (4 | ) | ||||
Cash and Cash Equivalents at Beginning of Period | 68 | 65 | |||||
Cash and Cash Equivalents at End of Period | $ | 185 | $ | 61 | |||
THE DETROIT EDISON COMPANY
CONSOLIDATED STATEMENTS OF OPERATIONS (UNAUDITED)
Three Months Ended | Six Months Ended | ||||||||||||||
June 30 | June 30 | ||||||||||||||
(in Millions) | 2012 | 2011 | 2012 | 2011 | |||||||||||
Operating Revenues | $ | 1,289 | $ | 1,240 | $ | 2,487 | $ | 2,432 | |||||||
Operating Expenses | |||||||||||||||
Fuel and purchased power | 428 | 417 | 805 | 795 | |||||||||||
Operation and maintenance | 334 | 331 | 689 | 660 | |||||||||||
Depreciation and amortization | 203 | 202 | 388 | 404 | |||||||||||
Taxes other than income | 60 | 60 | 128 | 119 | |||||||||||
Asset (gains) and losses, net | (1 | ) | (5 | ) | (1 | ) | 14 | ||||||||
1,024 | 1,005 | 2,009 | 1,992 | ||||||||||||
Operating Income | 265 | 235 | 478 | 440 | |||||||||||
Other (Income) and Deductions | |||||||||||||||
Interest expense | 65 | 73 | 134 | 144 | |||||||||||
Other income | (11 | ) | (11 | ) | (27 | ) | (21 | ) | |||||||
Other expenses | 9 | 6 | 15 | 12 | |||||||||||
63 | 68 | 122 | 135 | ||||||||||||
Income Before Income Taxes | 202 | 167 | 356 | 305 | |||||||||||
Income Tax Expense | 75 | 63 | 132 | 116 | |||||||||||
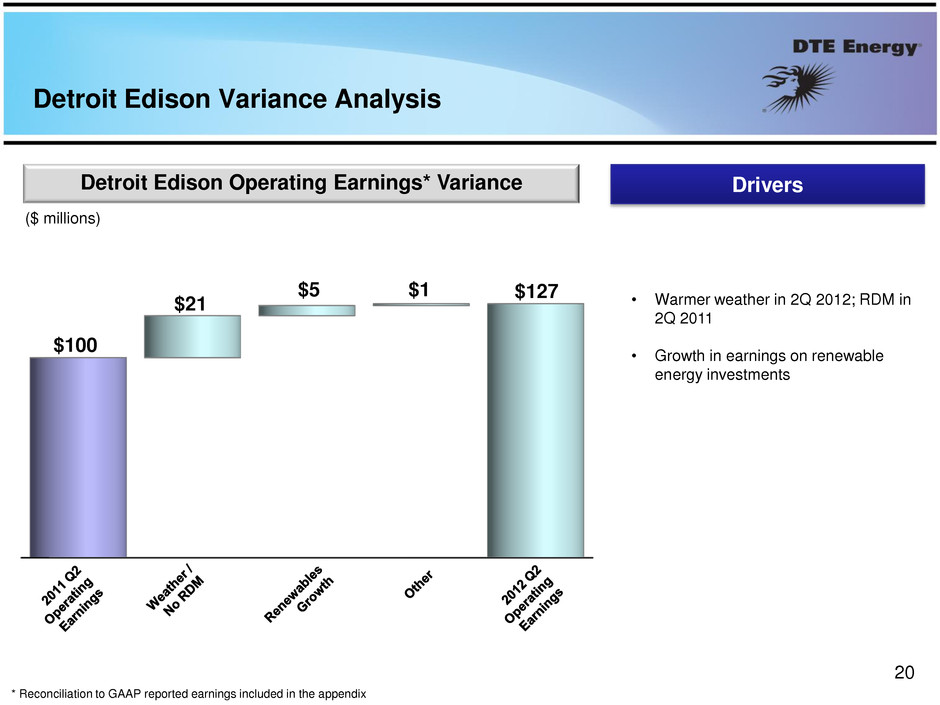
Net Income | $ | 127 | $ | 104 | $ | 224 | $ | 189 | |||||||
MICHIGAN CONSOLIDATED GAS COMPANY
CONSOLIDATED STATEMENTS OF OPERATIONS (UNAUDITED)
Three Months Ended | Six Months Ended | ||||||||||||||
June 30 | June 30 | ||||||||||||||
(in Millions) | 2012 | 2011 | 2012 | 2011 | |||||||||||
Operating Revenues | $ | 209 | $ | 238 | $ | 710 | $ | 918 | |||||||
Operating Expenses | |||||||||||||||
Cost of gas | 59 | 92 | 330 | 491 | |||||||||||
Operation and maintenance | 95 | 102 | 194 | 203 | |||||||||||
Depreciation and amortization | 23 | 22 | 46 | 44 | |||||||||||
Taxes other than income | 13 | 14 | 31 | 31 | |||||||||||
190 | 230 | 601 | 769 | ||||||||||||
Operating Income | 19 | 8 | 109 | 149 | |||||||||||
Other (Income) and Deductions | |||||||||||||||
Interest expense | 14 | 15 | 29 | 31 | |||||||||||
Interest income | (1 | ) | (2 | ) | (3 | ) | (4 | ) | |||||||
Other income | (3 | ) | (1 | ) | (5 | ) | (3 | ) | |||||||
Other expenses | 1 | — | 2 | 1 | |||||||||||
11 | 12 | 23 | 25 | ||||||||||||
Income (Loss) Before Income Taxes | 8 | (4 | ) | 86 | 124 | ||||||||||
Income Tax Expense (Benefit) | 3 | (1 | ) | 30 | 45 | ||||||||||
Net Income (Loss) | $ | 5 | $ | (3 | ) | $ | 56 | $ | 79 | ||||||

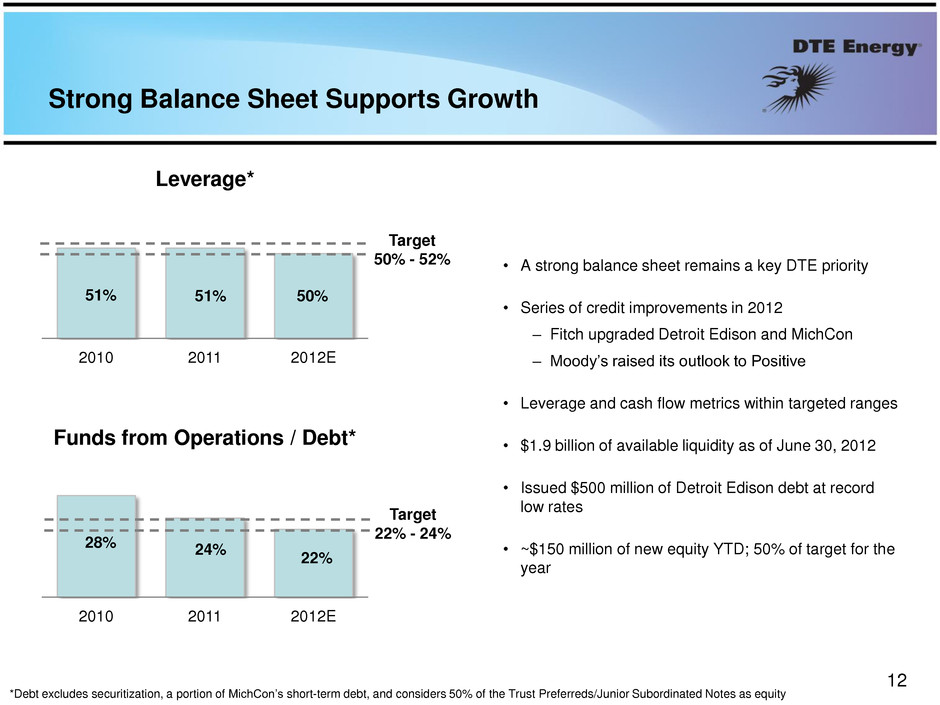
DTE Energy Debt/Equity Calculation
As of June 30, 2012
($ millions)
Short-term borrowings | $ | 39 | |
Current portion of long-term debt, including capital leases | 848 | ||
Mortgage bonds, notes and other | 6,528 | ||
Securitization bonds, excluding current portion | 391 | ||
Capital lease obligations | 13 | ||
Other adjustments | 258 | ||
less Securitization bonds, including current portion | (559 | ) | |
50% Junior Subordinated Debentures | 140 | ||
Total debt | 7,658 | ||
50% Junior Subordinated Debentures | 140 | ||
Total preferred/ other | 140 | ||
Equity | 7,142 | ||
Total capitalization | $ | 14,940 | |
Debt | 51 | % | |
Junior Subordinated Debentures | 1 | % | |
Common shareholders' equity | 48 | % | |
Total | 100 | % | |

Sales Analysis - Q2 2012 | ||||||||||||||||||||
Electric Sales - Detroit Edison Service Area (GWh) | Electric Billings - Detroit Edison Service Area ($000s) | |||||||||||||||||||
Q2 2012 | Q2 2011 | % Change | Q2 2012 | Q2 2011 | % Change | |||||||||||||||
Residential | 3,587 | 3,607 | (1 | )% | Residential | $ | 523,858 | $ | 494,467 | 6 | % | |||||||||
Commercial | 4,247 | 3,998 | 6 | % | Commercial | 481,778 | 409,267 | 18 | % | |||||||||||
Industrial | 2,563 | 2,405 | 7 | % | Industrial | 202,742 | 169,387 | 20 | % | |||||||||||
Other (a) | 221 | 239 | (8 | )% | Other (b) | 26,338 | 49,452 | (47 | )% | |||||||||||
10,618 | 10,249 | 4 | % | $ | 1,234,716 | $ | 1,122,573 | 10 | % | |||||||||||
Choice | 1,312 | 1,409 | (7 | )% | Choice | 23,155 | 25,476 | (9 | )% | |||||||||||
TOTAL SALES | 11,930 | 11,658 | 2 | % | TOTAL | $ | 1,257,871 | $ | 1,148,049 | 10 | % | |||||||||
________________ | ________________ | |||||||||||||||||||
(a) 2011 Excludes 524 GWh related to a wholesale contract terminated Dec 2011 | (b) 2011 includes $23,219k related to a wholesale contract terminated Dec 2011 | |||||||||||||||||||
Gas Sales - MichCon Service Area (MMcf) | Gas Billings - MichCon Service Area ($000s) | |||||||||||||||||||
Q2 2012 | Q2 2011 | % Change | Q2 2012 | Q2 2011 | % Change | |||||||||||||||
Residential | 11,269 | 14,131 | (20 | )% | Residential | $ | 118,469 | $ | 148,485 | (20 | )% | |||||||||
Commercial | 2,394 | 3,169 | (24 | )% | Commercial | 23,214 | 31,449 | (26 | )% | |||||||||||
Industrial | 393 | 204 | 93 | % | Industrial | 3,155 | 1,706 | 85 | % | |||||||||||
14,056 | 17,504 | (20 | )% | $ | 144,838 | $ | 181,640 | (20 | )% | |||||||||||
End User Transportation* | 33,804 | 27,343 | 24 | % | End User Transportation* | 39,587 | 43,183 | (8 | )% | |||||||||||
TOTAL SALES | 47,860 | 44,847 | 7 | % | TOTAL | $ | 184,425 | $ | 224,823 | (18 | )% | |||||||||
________________ | ________________ | |||||||||||||||||||
* Includes choice customers | * Includes choice customers | |||||||||||||||||||
Weather | ||||||||||||
Cooling Degree Days | Heating Degree Days | |||||||||||
Detroit Edison service territory | MichCon service territory | |||||||||||
Q2 2012 | Q2 2011 | % Change | Q2 2012 | Q2 2011 | % Change | |||||||
Actuals | 331 | 242 | 37% | Actuals | 653 | 823 | (21)% | |||||
Normal | 193 | 193 | Normal | 781 | 803 | |||||||
Deviation from normal | 71% | 25% | Deviation from normal | (16)% | 2% | |||||||
Earnings Impact of Weather | |||||||
Variance from normal weather (millions, after-tax) | |||||||
Q2 2012 | Q2 2011 | ||||||
Detroit Edison* | $ | 21 | $ | — | |||
MichCon | $ | (2 | ) | $ | 1 | ||
________________ | |||||||
* Pre 2012 Detroit Edison earnings not affected by weather due to RDM mechanism | |||||||

Sales Analysis - YTD June 30, 2012 | ||||||||||||||||||||
Electric Sales - Detroit Edison Service Area (GWh) | Electric Billings - Detroit Edison Service Area ($000s) | |||||||||||||||||||
YTD 2012 | YTD 2011 | % Change | YTD 2012 | YTD 2011 | % Change | |||||||||||||||
Residential | 7,287 | 7,495 | (3 | )% | Residential | $ | 1,087,273 | $ | 1,013,905 | 7 | % | |||||||||
Commercial | 8,132 | 7,991 | 2 | % | Commercial | 920,445 | 804,973 | 14 | % | |||||||||||
Industrial | 4,938 | 4,747 | 4 | % | Industrial | 390,408 | 333,688 | 17 | % | |||||||||||
Other (a) | 479 | 517 | (7 | )% | Other (b) | 52,803 | 98,164 | (46 | )% | |||||||||||
20,836 | 20,750 | 0 | % | $ | 2,450,929 | $ | 2,250,730 | 9 | % | |||||||||||
Choice | 2,567 | 2,711 | (5 | )% | Choice | 44,625 | 51,511 | (13 | )% | |||||||||||
TOTAL SALES | 23,403 | 23,461 | 0 | % | TOTAL | $ | 2,495,554 | $ | 2,302,241 | 8 | % | |||||||||
________________ | ________________ | |||||||||||||||||||
(a) 2011 Excludes 1,043 GWh related to a wholesale contract terminated Dec 2011 | (b) 2011 includes $45,942k related to a wholesale contract terminated Dec 2011 | |||||||||||||||||||
Gas Sales - MichCon Service Area (MMcf) | Gas Billings - MichCon Service Area ($000s) | |||||||||||||||||||
YTD 2012 | YTD 2011 | % Change | YTD 2012 | YTD 2011 | % Change | |||||||||||||||
Residential | 48,062 | 61,790 | (22 | )% | Residential | $ | 440,114 | $ | 591,759 | (26 | )% | |||||||||
Commercial | 11,046 | 15,673 | (30 | )% | Commercial | 96,209 | 144,820 | (34 | )% | |||||||||||
Industrial | 628 | 503 | 25 | % | Industrial | 4,960 | 4,218 | 18 | % | |||||||||||
59,736 | 77,966 | (23 | )% | $ | 541,283 | $ | 740,797 | (27 | )% | |||||||||||
End User Transportation* | 81,818 | 79,066 | 3 | % | End User Transportation* | 112,763 | 124,415 | (9 | )% | |||||||||||
TOTAL SALES | 141,554 | 157,032 | (10 | )% | TOTAL | $ | 654,046 | $ | 865,212 | (24 | )% | |||||||||
________________ | ________________ | |||||||||||||||||||
* Includes choice customers | * Includes choice customers | |||||||||||||||||||
Weather | ||||||||||||
Cooling Degree Days | Heating Degree Days | |||||||||||
Detroit Edison service territory | MichCon service territory | |||||||||||
YTD 2012 | YTD 2011 | % Change | YTD 2012 | YTD 2011 | % Change | |||||||
Actuals | 347 | 242 | 43% | Actuals | 3,178 | 4,274 | (26)% | |||||
Normal | 193 | 193 | Normal | 4,006 | 4,016 | |||||||
Deviation from normal | 80% | 25% | Deviation from normal | (21)% | 6% | |||||||
Earnings Impact of Weather | |||||||
Variance from normal weather (millions, after-tax) | |||||||
YTD 2012 | YTD 2011 | ||||||
Detroit Edison* | $ | 10 | $ | — | |||
MichCon | $ | (25 | ) | $ | 9 | ||
________________ | |||||||
* Pre 2012 Detroit Edison earnings not affected by weather due to RDM mechanism | |||||||

Detroit Edison Temperature Normal Sales Analysis - June 30, 2012 | ||||||||||||||||||
Temperature Normal Electric Sales - Detroit Edison Service Area (GWh) | Temperature Normal Electric Sales - Detroit Edison Service Area (Includes Electric Choice) (GWh) | |||||||||||||||||
YTD 2012 | YTD 2011 | % Change | YTD 2012 | YTD 2011 | % Change | |||||||||||||
Residential | 7,218 | 7,301 | (1 | )% | Residential | 7,219 | 7,302 | (1 | )% | |||||||||
Commercial | 7,974 | 7,947 | 0 | % | Commercial | 9,465 | 9,551 | (1 | )% | |||||||||
Industrial | 4,920 | 4,743 | 4 | % | Industrial | 5,960 | 5,839 | 2 | % | |||||||||
Other (a) | 479 | 517 | (7 | )% | Other (a) | 479 | 517 | (7 | )% | |||||||||
20,591 | 20,508 | 0 | % | 23,123 | 23,209 | 0 | % | |||||||||||
Choice | 2,532 | 2,701 | (6 | )% | ||||||||||||||
TOTAL SALES | 23,123 | 23,209 | 0 | % | ||||||||||||||
________________ | ||||||||||||||||||
(a) 2011 Excludes 1,043 GWh related to a wholesale contract terminated Dec 2011 | ||||||||||||||||||
