qfr_q22012
CSX Announces Second Quarter Results
Tenth Consecutive Quarter of Year-Over-Year Continuing Earnings Growth
Year-Over-Year Highlights:
| |
• | Operating income improves to $943 million |
| |
• | Operating ratio improves to 68.7 percent |
| |
• | Earnings per share increases to $0.49 per share |
| |
• | Employee safety at all-time best levels |
JACKSONVILLE, Fla. - July 17, 2012 - CSX Corporation (NYSE: CSX) today announced second quarter net earnings of $512 million, or $0.49 per share, versus $506 million, or $0.46 per share, in the same period last year. This represents a 7 percent year-over-year improvement in earnings per share.
“CSX delivered its 10th straight quarter of year-over-year earnings growth despite significant headwinds in its utility coal business,” said Michael J. Ward, chairman, president and chief executive officer. “The company continues to perform well across a wide range of economic and market conditions.”
Total revenue and volume were essentially flat when compared to the same period last year, as increased shipments of export coal, intermodal and automotive products helped offset declines in utility coal.
CSX's train crews are operating more efficiently and the company's strong service product is translating into better asset utilization. These productivity gains, along with resource alignments made in response to changes in the mix of the business, drove an increase in operating income to $943 million. Additionally, the operating ratio improved to 68.7 percent for the quarter, a 60 basis point improvement year-over-year.
“This team remains focused on the safety of our employees and communities, service to our customers, and productivity in our operations,” said Ward. “CSX employees delivered record employee safety results and a significant improvement in the train accident rate.”
Looking forward, even with the continued headwinds in the utility coal market, CSX remains on track for earnings growth for the full-year 2012. In addition, while more challenging, the company continues to have line of sight to a 65 percent operating ratio by 2015.
|
| | | |
Table of Contents | The accompanying unaudited | CSX CORPORATION | CONTACTS: |
| financial information should be | 500 Water Street, C900 | |
| read in conjunction with the | Jacksonville, FL 32202 | INVESTOR RELATIONS |
| Company’s most recent | http://www.csx.com | David Baggs |
| Annual Report on Form 10-K, | | (904) 359-4812 |
| Quarterly Reports on Form | | MEDIA |
| 10-Q, and any Current | | Lauren Rueger |
| Reports on Form 8-K. | | (877) 835-5279 |
This earnings announcement, as well as a package of detailed financial information, is contained in the CSX Quarterly Financial Report available on the company's website at http://investors.csx.com and on Form 8-K with the Securities and Exchange Commission.
CSX executives will conduct a quarterly earnings conference call with the investment community on July 18, 2012, at 8:30 a.m. Eastern time. Investors, media and the public may listen to the conference call by dialing 1-888-327-6279 (888-EARN-CSX) and asking for the CSX earnings call. (Callers outside the U.S., dial 1-773-756-0199). Participants should dial in 10 minutes prior to the call. In conjunction with the call, a live webcast will be accessible and presentation materials will be posted on the company's website at http://investors.csx.com. Following the earnings call, an internet replay of the presentation will be archived on the company website.
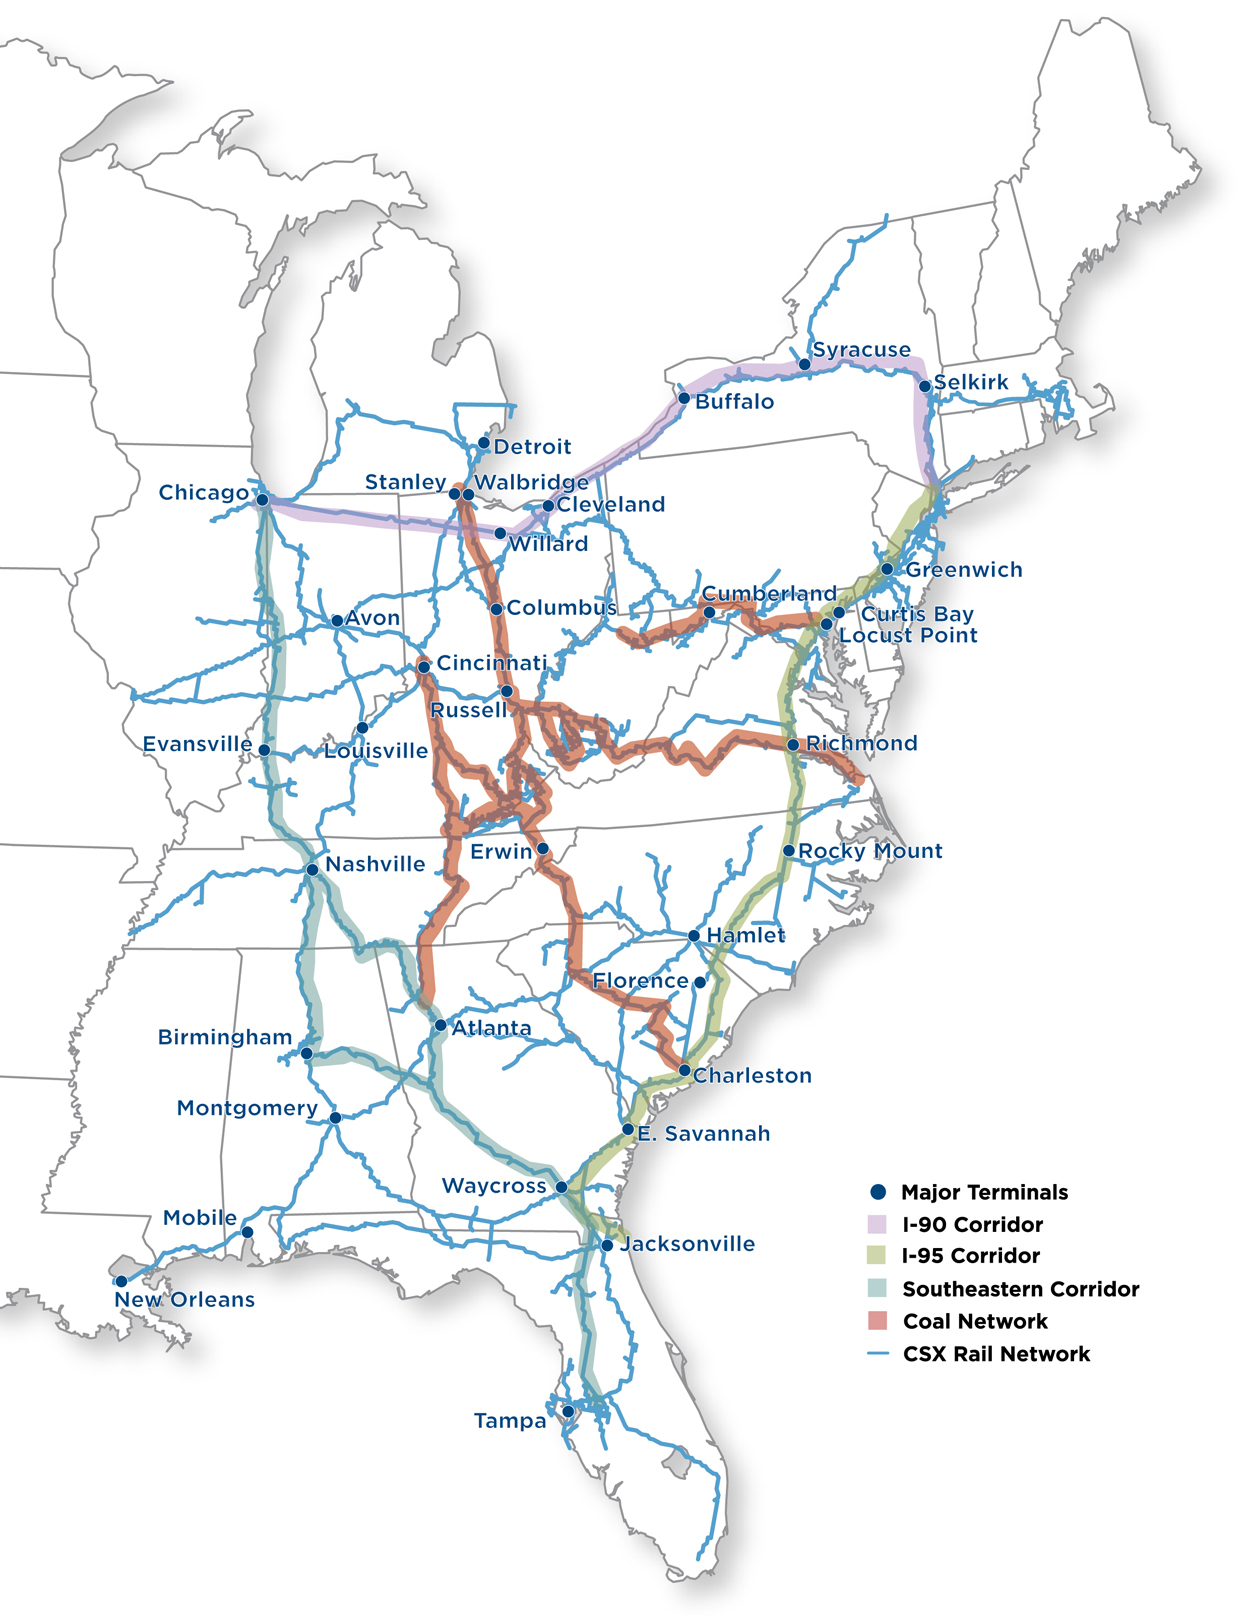
CSX Corporation, based in Jacksonville, Fla., is one of the nation's leading transportation companies, providing rail, intermodal and rail-to-truck transload services. The company's transportation network spans approximately 21,000 miles, with service to 23 eastern states, the District of Columbia and two Canadian provinces. CSX's network connects more than 240 short line railroads and more than 70 ocean, river, and lake ports. More information about CSX Corporation and its subsidiaries is available at www.csx.com. Like us on Facebook (http://www.facebook.com/OfficialCSX) and follow us on Twitter (http://twitter.com/CSX).
Forward-looking Statements
This information and other statements by the company may contain forward-looking statements within the meaning of the Private Securities Litigation Reform Act with respect to, among other items: projections and estimates of earnings, revenues, margins, volumes, rates, cost-savings, expenses, taxes, liquidity, capital expenditures, dividends, share repurchases or other financial items, statements of management's plans, strategies and objectives for future operations, and management's expectations as to future performance and operations and the time by which objectives will be achieved, statements concerning proposed new services, and statements regarding future economic, industry or market conditions or performance. Forward-looking statements are typically identified by words or phrases such as “will,” “should,” “believe,” “expect,” “anticipate,” “project,” “estimate,” “preliminary” and similar expressions. Forward-looking statements speak only as of the date they are made, and the company undertakes no obligation to update or revise any forward-looking statement. If the company updates any forward-looking statement, no inference should be drawn that the company will make additional updates with respect to that statement or any other forward-looking statements.
Forward-looking statements are subject to a number of risks and uncertainties, and actual performance or results could differ materially from that anticipated by any forward-looking statements. Factors that may cause actual results to differ materially from those contemplated by any forward-looking statements include, among others; (i) the company's success in implementing its financial and operational initiatives; (ii) changes in domestic or international economic, political or business conditions, including those affecting the transportation industry (such as the impact of industry competition, conditions, performance and consolidation); (iii) legislative or regulatory changes; (iv) the inherent business risks associated with safety and security; (v) the outcome of claims and litigation involving or affecting the company; (vi) natural events such as severe weather conditions or pandemic health crises; and (vii) the inherent uncertainty associated with projecting economic and business conditions.
Other important assumptions and factors that could cause actual results to differ materially from those in the forward-looking statements are specified in the company's SEC reports, accessible on the SEC's website at www.sec.gov and the company's website at www.csx.com.
CONSOLIDATED INCOME STATEMENTS (Unaudited)
(Dollars in millions, except per share amounts)
|
| | | | | | | | | | | | | | | | | | | | | | | |
| Quarters Ended | | Six Months Ended |
| Jun. 29, 2012 | Jul. 1, 2011 | $ Change | % Change | | Jun. 29, 2012 | Jul. 1, 2011 | $ Change | % Change |
| | | | | | | | | |
Revenue | $ | 3,012 |
| $ | 3,019 |
| $ | (7 | ) | — | % | | $ | 5,978 |
| $ | 5,829 |
| $ | 149 |
| 3 | % |
Expense | | | | | | | | | |
Labor and Fringe | 744 |
| 764 |
| 20 |
| 3 |
| | 1,514 |
| 1,529 |
| 15 |
| 1 |
|
Materials, Supplies and Other | 550 |
| 557 |
| 7 |
| 1 |
| | 1,092 |
| 1,087 |
| (5 | ) | — |
|
Fuel | 410 |
| 431 |
| 21 |
| 5 |
| | 854 |
| 833 |
| (21 | ) | (3 | ) |
Depreciation | 263 |
| 246 |
| (17 | ) | (7 | ) | | 520 |
| 489 |
| (31 | ) | (6 | ) |
Equipment and Other Rents | 102 |
| 95 |
| (7 | ) | (7 | ) | | 199 |
| 192 |
| (7 | ) | (4 | ) |
Total Expense | 2,069 |
| 2,093 |
| 24 |
| 1 |
| | 4,179 |
| 4,130 |
| (49 | ) | (1 | ) |
| | | | | | | | | |
Operating Income | 943 |
| 926 |
| 17 |
| 2 |
| | 1,799 |
| 1,699 |
| 100 |
| 6 |
|
| | | | | | | | | |
Interest Expense | (139 | ) | (134 | ) | (5 | ) | (4 | ) | | (283 | ) | (274 | ) | (9 | ) | (3 | ) |
Other Income - Net(a) | 5 |
| — |
| 5 |
| 100 |
| | 9 |
| 5 |
| 4 |
| 80 |
|
Earnings Before Income Taxes | 809 |
| 792 |
| 17 |
| 2 |
| | 1,525 |
| 1,430 |
| 95 |
| 7 |
|
| | | | | | | | | |
Income Tax Expense(b) | (297 | ) | (286 | ) | (11 | ) | (4 | ) | | (564 | ) | (529 | ) | (35 | ) | (7 | ) |
Net Earnings | $ | 512 |
| $ | 506 |
| $ | 6 |
| 1 | % | | $ | 961 |
| $ | 901 |
| $ | 60 |
| 7 | % |
| | | | | | | | | |
Operating Ratio | 68.7 | % | 69.3 | % | | | | 69.9 | % | 70.9 | % | | |
| | | | | | | | | |
Per Common Share | | | | | | | | | |
Net Earnings Per Share, Assuming Dilution | $ | 0.49 |
| $ | 0.46 |
| $ | 0.03 |
| 7 | % | | $ | 0.92 |
| $ | 0.81 |
| $ | 0.11 |
| 14 | % |
| | | | | | | | | |
Average Shares Outstanding, Assuming Dilution (millions) | 1,043 |
| 1,109 |
| | | | 1,046 |
| 1,112 |
| | |
| | | | | | | | | |
Cash Dividends Paid Per Common Share | $ | 0.14 |
| $ | 0.12 |
| | | | $ | 0.26 |
| $ | 0.21 |
| | |
| | | | | | | | | |
| | | | | | | | | |
See accompanying Notes to Consolidated Financial Statements on page 6.
CONDENSED CONSOLIDATED BALANCE SHEETS
(Dollars in millions)
|
| | | | | | |
| (Unaudited) | |
| Jun. 29, 2012 | Dec. 30, 2011 |
ASSETS |
| | |
Cash, Cash Equivalents and Short-term Investments | $ | 683 |
| $ | 1,306 |
|
Other Current Assets | 1,689 |
| 1,629 |
|
Properties - Net | 25,632 |
| 24,974 |
|
Investment in Affiliates and Other Companies | 1,183 |
| 1,171 |
|
Other Long-term Assets | 402 |
| 393 |
|
Total Assets | $ | 29,589 |
| $ | 29,473 |
|
| | |
| | |
LIABILITIES AND SHAREHOLDERS' EQUITY |
| | |
Current Maturities of Long-term Debt | $ | 508 |
| $ | 507 |
|
Other Current Liabilities | 2,067 |
| 2,180 |
|
Long-term Debt | 8,581 |
| 8,734 |
|
Deferred Income Taxes | 7,896 |
| 7,601 |
|
Other Long-term Liabilities | 1,642 |
| 1,983 |
|
Total Liabilities | 20,694 |
| 21,005 |
|
| | |
Total Shareholders' Equity | 8,895 |
| 8,468 |
|
Total Liabilities and Shareholders' Equity | $ | 29,589 |
| $ | 29,473 |
|
See accompanying Notes to Consolidated Financial Statements on page 6.
CONDENSED CONSOLIDATED CASH FLOW STATEMENTS
(Dollars in millions)
|
| | | | | | |
| (Unaudited) |
| Six Months Ended |
| Jun. 29, 2012 | Jul. 1, 2011 |
OPERATING ACTIVITIES | | |
Net Earnings | $ | 961 |
| $ | 901 |
|
Depreciation | 520 |
| 489 |
|
Deferred Income Taxes | 300 |
| 280 |
|
Contributions to Qualified Pension Plans | (275 | ) | — |
|
Other-Net | (215 | ) | (85 | ) |
Net Cash Provided by Operating Activities | 1,291 |
| 1,585 |
|
| | |
INVESTING ACTIVITIES | | |
Property Additions | (1,223 | ) | (945 | ) |
Purchase of Short-term Investments | (58 | ) | (8 | ) |
Proceeds from Sales of Short-term Investments | 546 |
| 42 |
|
Other Investing Activities | 6 |
| (18 | ) |
Net Cash Used in Investing Activities | (729 | ) | (929 | ) |
| | |
FINANCING ACTIVITIES | | |
Long-term Debt Issued | 300 |
| 600 |
|
Long-term Debt Repaid | (455 | ) | (570 | ) |
Dividends Paid | (270 | ) | (228 | ) |
Shares Repurchased(c) | (300 | ) | (528 | ) |
Other Financing Activities - Net | 22 |
| 30 |
|
Net Cash Used in Financing Activities | (703 | ) | (696 | ) |
| | |
Net Decrease in Cash and Cash Equivalents | (141 | ) | (40 | ) |
| | |
CASH AND CASH EQUIVALENTS | | |
Cash and Cash Equivalents at Beginning of Period | 783 |
| 1,292 |
|
Cash and Cash Equivalents at End of Period | $ | 642 |
| $ | 1,252 |
|
Certain prior year data has been reclassified to conform to the current presentation.
See accompanying Notes to Consolidated Financial Statements on page 6.
NOTES TO CONSOLIDATED FINANCIAL STATEMENTS (Unaudited)
|
| | | | | | | | | | | | | | | | | | | |
| Quarters Ended | | Six Months Ended |
(Dollars in millions) | Jun. 29, 2012 | Jul. 1, 2011 | $ Change | | Jun. 29, 2012 | Jul. 1, 2011 | $ Change |
Interest Income | $ | 1 |
| $ | 1 |
| $ | — |
| | $ | 3 |
| $ | 2 |
| $ | 1 |
|
Income from Real Estate Operations | 2 |
| 5 |
| (3 | ) | | 8 |
| 8 |
| — |
|
Miscellaneous Income (Expense) | 2 |
| (6 | ) | 8 |
| | (2 | ) | (5 | ) | 3 |
|
Total Other Income - Net | $ | 5 |
| $ | — |
| $ | 5 |
| | $ | 9 |
| $ | 5 |
| $ | 4 |
|
| |
b) | Income Tax Expense: During second quarter 2012, the Company recorded an income tax benefit of $9 million, or $0.01 per share, as a result of the resolution of certain tax matters as well as changes in state legislation. During second quarter 2011, the Company recorded a net income tax benefit of $14 million, or just over $0.01 per share, primarily as a result of changes in state legislation. |
| |
c) | Shares Repurchased: CSX did not repurchase any outstanding shares during the second quarter of 2012. |
|
| | | | | | | | | | | | | | | | | | | | | | | | | | | |
VOLUME AND REVENUE (Unaudited) | |
Volume (Thousands of units); Revenue (Dollars in millions); Revenue Per Unit (Dollars) | |
| |
Quarters Ended June 29, 2012 and July 1, 2011 | |
| | | | | | | | |
| Volume | | | Revenue | | | Revenue Per Unit | |
| 2012 | 2011 | % Change | | 2012 | 2011 | % Change | | 2012 | 2011 | % Change |
Agricultural | | | | | | | | | | | | | | |
Agricultural Products | 101 |
| 109 |
| (7 | )% | | | $ | 261 |
| $ | 273 |
| (5 | )% | | | $ | 2,584 |
| $ | 2,505 |
| 2 | % | |
Phosphates and Fertilizers | 79 |
| 80 |
| (1 | ) | | | 125 |
| 119 |
| 6 |
| | | 1,582 |
| 1,488 |
| 8 |
| |
Food and Consumer | 25 |
| 27 |
| (7 | ) | | | 68 |
| 70 |
| (3 | ) | | | 2,720 |
| 2,593 |
| 5 |
| |
Industrial | | | | | | | | | | | | | | |
Chemicals | 120 |
| 119 |
| 1 |
| | | 430 |
| 413 |
| 4 |
| | | 3,583 |
| 3,471 |
| 2 |
| |
Automotive | 111 |
| 87 |
| 27 |
| | | 302 |
| 226 |
| 34 |
| | | 2,721 |
| 2,598 |
| 5 |
| |
Metals | 67 |
| 68 |
| (1 | ) | | | 163 |
| 158 |
| 3 |
| | | 2,433 |
| 2,324 |
| 4 |
| |
Housing and Construction | | | | | | | | | | | | | | |
Emerging Markets | 106 |
| 117 |
| (10 | ) | | | 178 |
| 179 |
| — |
| | | 1,679 |
| 1,530 |
| 10 |
| |
Forest Products | 71 |
| 70 |
| 1 |
| | | 184 |
| 174 |
| 6 |
| | | 2,592 |
| 2,486 |
| 5 |
| |
Total Merchandise | 680 |
| 677 |
| 1 |
| | | 1,711 |
| 1,612 |
| 6 |
| | | 2,516 |
| 2,381 |
| 6 |
| |
| | | | | | | | | | | | | | |
Coal | 331 |
| 388 |
| (14 | ) | | | 820 |
| 958 |
| (14 | ) | | | 2,477 |
| 2,469 |
| — |
| |
| | | | | | | | | | | | | | |
Intermodal(a) | 629 |
| 581 |
| 8 |
| | | 408 |
| 369 |
| 10 |
| | | 649 |
| 635 |
| 2 |
| |
| | | | | | | | | | | | | | |
Other(a) | — |
| — |
| — |
| | | 73 |
| 80 |
| (9 | ) | | | — |
| — |
| — |
| |
| | | | | | | | | | | | | | |
Total | 1,640 |
| 1,646 |
| — | % | | | $ | 3,012 |
| $ | 3,019 |
| — | % | | | $ | 1,837 |
| $ | 1,834 |
| — | % | |
| | | | | | | | | | | | | | |
Six Months Ended June 29, 2012 and July 1, 2011 | |
| | | | | | | | |
| Volume | | | Revenue | | | Revenue Per Unit | |
| 2012 | 2011 | % Change | | 2012 | 2011 | % Change | | 2012 | 2011 | % Change |
Agricultural | | | | | | | | | | | | | | |
Agricultural Products | 209 |
| 218 |
| (4 | )% | | | $ | 536 |
| $ | 533 |
| — | % | | | $ | 2,565 |
| $ | 2,445 |
| 5 | % | |
Phosphates and Fertilizers | 159 |
| 163 |
| (2 | ) | | | 256 |
| 255 |
| — |
| | | 1,610 |
| 1,564 |
| 3 |
| |
Food and Consumer | 50 |
| 52 |
| (3 | ) | | | 135 |
| 133 |
| 2 |
| | | 2,700 |
| 2,558 |
| 5 |
| |
Industrial | | | | | | | | | | | | | | |
Chemicals | 237 |
| 236 |
| 1 |
| | | 845 |
| 807 |
| 5 |
| | | 3,565 |
| 3,419 |
| 4 |
| |
Automotive | 216 |
| 176 |
| 23 |
| | | 583 |
| 445 |
| 31 |
| | | 2,699 |
| 2,528 |
| 7 |
| |
Metals | 139 |
| 135 |
| 3 |
| | | 334 |
| 306 |
| 9 |
| | | 2,403 |
| 2,267 |
| 6 |
| |
Housing and Construction | | | | | | | | | | | | | | |
Emerging Markets | 197 |
| 212 |
| (7 | ) | | | 332 |
| 324 |
| 3 |
| | | 1,685 |
| 1,528 |
| 10 |
| |
Forest Products | 144 |
| 139 |
| 3 |
| | | 365 |
| 335 |
| 9 |
| | | 2,535 |
| 2,410 |
| 6 |
| |
Total Merchandise | 1,351 |
| 1,331 |
| 2 |
| | | 3,386 |
| 3,138 |
| 8 |
| | | 2,506 |
| 2,358 |
| 6 |
| |
| | | | | | | | | | | | | | |
Coal | 662 |
| 773 |
| (14 | ) | | | 1,652 |
| 1,837 |
| (10 | ) | | | 2,495 |
| 2,376 |
| 5 |
| |
| | | | | | | | | | | | | | |
Intermodal(a) | 1,229 |
| 1,134 |
| 8 |
| | | 797 |
| 696 |
| 14 |
| | | 648 |
| 614 |
| 5 |
| |
| | | | | | | | | | | | | | |
Other(a) | — |
| — |
| — |
| | | 143 |
| 158 |
| (10 | ) | | | — |
| — |
| — |
| |
| | | | | | | | | | | | | | |
Total | 3,242 |
| 3,238 |
| — | % | | | $ | 5,978 |
| $ | 5,829 |
| 3 | % | | | $ | 1,844 |
| $ | 1,800 |
| 2 | % | |
(a) 2011 intermodal revenue has been reduced by $7 million and $12 million for the quarter and six months ended July 1, 2011, respectively, from what was previously reported to correct for certain interline business and the corresponding intermodal revenue per unit has been reduced for this as well. The offsetting adjustment is reported in other revenue.
VOLUME AND REVENUE
The Company achieved year-over-year revenue growth in most markets although domestic utility coal volume continues to face challenges resulting from low natural gas prices and high stockpiles. The volume decline in domestic utility coal was offset by volume growth in the export coal, intermodal and automotive markets. Additionally, with the exception of coal which was flat, revenue per unit increased in all markets reflecting higher yields and fuel recovery.
Merchandise
Agricultural
Agricultural Products - Volume decreased due to reduced shipments of ethanol and corn. Ethanol shipments declined as a result of reduced gasoline demand and limitations at storage facilities due to over-production. Corn shipments to the Southeast for animal feed were lower due to substitution from a strong local wheat crop.
Phosphates and Fertilizers - Fertilizer shipments declined as the expectation of moderating prices for finished phosphate products (which include crop nutrients) resulted in delayed purchases.
Food and Consumer - Volume decreased with lower shipments of appliances driven by intermodal conversions partially offset by strength in refrigerated products shipments due to highway-to-rail conversions resulting from tight truck capacity.
Industrial
Chemicals - Volume growth was driven by oil and gas-related markets (which include frac sand and petroleum oil) resulting from the increase in shale drilling activity.
Automotive - Automotive volume grew as North American light vehicle production increased 25% year-over-year to support the continuing recovery of the automotive market.
Metals - Volume declined primarily due to scrap shipments related to weak exports as a result of lower global demand. The decline was likely increased by purchasing delays attributable to expectations for future reduction in scrap prices. These trends were partially offset by growth in finished steel products from strong demand in energy markets for products such as pipe and steel bars.
Housing and Construction
Emerging Markets - Volume declined due to reduced shipments of aggregates (which include crushed stone, sand and gravel) resulting from the completion of several major construction projects. Shipments of salt also declined from higher stockpiles due to the milder winter weather.
Forest Products - Volume improved mostly due to recovering demand for housing and construction.
Coal
Shipments of utility coal declined primarily driven by low natural gas prices and utility stockpiles above target levels. This decrease was partially offset by higher export shipments of U.S. thermal coal.
Intermodal
Domestic growth was driven by new customers, benefits of new capacity and highway conversions. International growth was driven by a new customer.
EXPENSE
Expenses in the quarter decreased $24 million from last year's second quarter. Significant variances are described below.
Labor and Fringe expense decreased $20 million due to the following:
| |
• | Incentive compensation expenses were $18 million lower reflecting the award payouts on existing plans. |
| |
• | Volume related and various other costs were $10 million lower due to increased network efficiency. |
| |
• | Offsetting these decreases, hiring and training expenses were $8 million higher related to increased headcount, as the Company continues to hire ahead of attrition. |
Materials, Supplies and Other expense decreased $7 million due to the following:
| |
• | Recognition of $20 million of the deferred gain from the November 2011 sale of an operating rail corridor to the state of Florida. |
| |
• | Various other costs were lower by $6 million, which in part reflects improved asset utilization and the impact of lower equipment repair costs. |
| |
• | Offsetting these decreases, inflation-related expenses increased $12 million. |
| |
• | Volume-related expenses were $7 million higher due to terminal costs related to the strengthening of the intermodal, export coal and automotive businesses. |
Fuel expense decreased $21 million primarily due to volume and a 2% decrease in the average price per gallon for locomotive fuel. (See Fuel Statistics table below)
Depreciation expense increased $17 million due to a larger asset base.
|
| | | | | | | | | | | | | | | | | | | | |
FUEL STATISTICS |
| | | | | | |
| | Quarters Ended | | Six Months Ended |
| | Jun. 29, 2012 | Jul. 1, 2011 | Change | | Jun. 29, 2012 | Jul. 1, 2011 | Change |
Estimated Locomotive Fuel Consumption (Millions of gallons) | | 120.0 |
| 123.8 |
| 3.8 |
| | 250.0 |
| 251.7 |
| 1.7 |
|
Price per Gallon (Dollars) | | $ | 3.14 |
| $ | 3.21 |
| $ | 0.07 |
| | $ | 3.14 |
| $ | 3.03 |
| $ | (0.11 | ) |
Total Locomotive Fuel Expense (Dollars in millions) | | $ | 377 |
| $ | 397 |
| $ | 20 |
| | $ | 786 |
| $ | 764 |
| $ | (22 | ) |
Total Non-Locomotive Fuel Expense (Dollars in millions) | | 33 |
| 34 |
| 1 |
| | 68 |
| 69 |
| 1 |
|
Total Fuel Expense (Dollars in millions) | | $ | 410 |
| $ | 431 |
| $ | 21 |
| | $ | 854 |
| $ | 833 |
| $ | (21 | ) |
|
| | | | | | | | |
EMPLOYEE COUNTS (Estimated) |
| | | | | |
| 2012 | | 2011 | | Change |
April | 32,365 |
| | 30,808 |
| | 1,557 |
|
May | 32,457 |
| | 31,242 |
| | 1,215 |
|
June | 32,445 |
| | 31,339 |
| | 1,106 |
|
| | | | | |
Average(a) | 32,422 |
| | 31,130 |
| | 1,292 |
|
(a) Average headcount includes employees who are on a furlough retention board which means that they are guaranteed two days of service per week as well as full health and welfare benefits in exchange for remaining available to work when needed. The average employees with this status was 227 employees for the second quarter 2012 versus 8 employees for the quarter last year. These boards are different than a traditional furlough where an employee does not receive guaranteed minimum weekly service and forfeits health and welfare benefits after a defined period of time without service.
OPERATING STATISTICS (Estimated)
|
| | | | | | | | | | | | | | |
| | Quarters Ended | | Six Months Ended |
| | Jun. 29, 2012 | Jul. 1, 2011 | Improvement (Decline) % | | Jun. 29, 2012 | Jul. 1, 2011 | Improvement (Decline) % |
Coal (Millions of Tons) | | | | | | | | |
Domestic | | | | | | | | |
Utility | | 16.9 |
| 26.8 |
| (37 | )% | | 37.1 |
| 54.9 |
| (32 | )% |
Other | | 3.0 |
| 4.0 |
| (25 | ) | | 5.3 |
| 6.5 |
| (18 | ) |
Total Domestic | | 19.9 |
| 30.8 |
| (35 | ) | | 42.4 |
| 61.4 |
| (31 | ) |
Export | | 14.7 |
| 10.4 |
| 41 |
| | 27.2 |
| 21.1 |
| 29 |
|
Coke and Iron Ore | | 2.4 |
| 2.0 |
| 20 |
| | 4.4 |
| 3.5 |
| 26 |
|
Total Coal | | 37.0 |
| 43.2 |
| (14 | )% | | 74.0 |
| 86.0 |
| (14 | )% |
| | | | | | | | |
Revenue Ton-Miles (Billions) | | | | | | | | |
Merchandise | | 33.6 |
| 33.5 |
| — | % | | 66.7 |
| 66.1 |
| 1 | % |
Coal | | 17.4 |
| 19.2 |
| (9 | ) | | 34.7 |
| 38.7 |
| (10 | )% |
Intermodal | | 6.2 |
| 5.6 |
| 11 |
| | 12.0 |
| 10.8 |
| 11 | % |
Total | | 57.2 |
| 58.3 |
| (2 | )% | | 113.4 |
| 115.6 |
| (2 | )% |
| | | | | | | | |
Gross Ton-Miles (Billions) | | | | | | | | |
Total Gross Ton-Miles | | 104.4 |
| 107.2 |
| (3 | )% | | 209.2 |
| 211.7 |
| (1 | )% |
(Excludes locomotive gross ton-miles) | | | | | | | | |
| | | | | | | | |
Safety and Service Measurements | | | | | | | | |
FRA Personal Injury Frequency Index | | 0.66 |
| 0.90 |
| 27 | % | | 0.72 |
| 0.86 |
| 16 | % |
(Number of FRA-reportable injuries per 200,000 man-hours) | | | | | | | | |
FRA Train Accident Rate | | 1.81 |
| 2.28 |
| 21 | % | | 1.97 |
| 2.46 |
| 20 | % |
(Number of FRA-reportable train accidents per million train miles) | | | | | | | | |
| | | | | | | | |
On-Time Train Originations | | 89 | % | 68 | % | 31 | % | | 89 | % | 67 | % | 33 | % |
On-Time Destination Arrivals | | 78 | % | 56 | % | 39 | % | | 77 | % | 57 | % | 35 | % |
| | | | | | | | |
Dwell (Hours) | | 23.2 |
| 26.0 |
| 11 | % | | 23.6 |
| 26.3 |
| 10 | % |
Cars-On-Line | | 189,974 |
| 208,572 |
| 9 | % | | 192,214 |
| 210,484 |
| 9 | % |
| | | | | | | | |
Train Velocity (Miles per hour) | | 22.4 |
| 19.8 |
| 13 | % | | 22.4 |
| 20.1 |
| 11 | % |
| | | | | | | | |
Resources | | | | Increase % | | | | |
Route Miles | | 21,007 |
| 21,046 |
| — | % | | | |
|
Locomotives (Owned and long-term leased) | | 4,163 |
| 4,073 |
| 2 | % | | | |
|
Freight Cars (Owned and long-term leased) | | 70,000 |
| 67,060 |
| 4 | % | | | |
|