United States Securities and Exchange Commission
Washington, D.C. 20549
Form N-CSR
Certified Shareholder Report of Registered Management Investment Companies
Investment Company Act file number 811-01879
Janus
Investment Fund
(Exact name of registrant as specified in charter)
151 Detroit Street, Denver,
Colorado 80206
(Address of principal executive offices) (Zip code)
Kathryn Santoro, 151 Detroit
Street, Denver, Colorado 80206
(Name and address of agent for service)
Registrant's telephone
number, including area code: 303-333-3863
Date of fiscal year end: 9/30
Date of reporting period:
9/30/18
Item 1 - Reports to Shareholders
ANNUAL REPORT September 30, 2018 | |||
Janus Henderson Asia Equity Fund | |||
Janus Investment Fund | |||
| |||
HIGHLIGHTS · Portfolio management perspective · Investment strategy behind your fund · Fund performance,
characteristics |
|

Table of Contents
Janus Henderson Asia Equity Fund
Janus Henderson Asia Equity Fund (unaudited)


PERFORMANCE
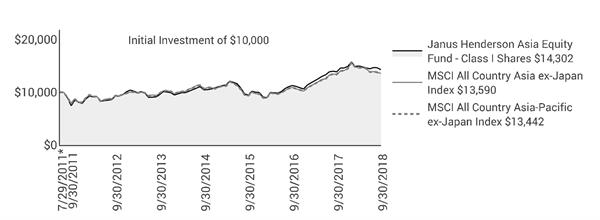
The Janus Henderson Asia Equity Fund’s Class I Shares returned 3.05% over the one-year period ended September 30, 2018. The Fund’s primary benchmark, the MSCI All Country Asia ex-Japan IndexSM, returned 1.45%. The Fund's secondary benchmark, the MSCI All Country Asia-Pacific ex-Japan IndexSM, returned 1.95%.
INVESTMENT ENVIRONMENT
Asian equities posted a positive return for the period, having started strongly, then weakening largely as a result of trade war concerns, a stronger U.S. dollar and higher oil prices. Corporate earnings recovered strongly in 2017, posting double-digit gains while earnings growth expectations also remain healthy for 2018 in local currency terms. Concerns over trade tariffs have dominated news flow and are a major reason Asian equities have traded lower since January. It is also true that the region has been impacted by a broader rotation away from emerging markets, given macroeconomic concerns in countries such as Turkey and Argentina, while U.S. equities maintained strong performance buoyed by tax cuts and a continued recovery in the economy, which is also leading to a normalization of U.S. interest rates from abnormally low levels. The Chinese economy started to slow after the impact of the government’s deleveraging campaign and as the effects of the 2015 stimulus began to wear off. This slowdown has also impacted market sentiment.
PERFORMANCE DISCUSSION
The Fund outperformed its primary and secondary benchmarks over the period. At the sector level, we benefited from our overweight position to the technology sector early in the financial year while the decision to reduce the level of this overweight through 2018 was also positive. Within the technology sector, semiconductor-related shares performed well in the first half of the period on continued strong demand, but these companies underperformed later in the period. Strong performers for the Fund in the technology sector included a leading Taiwanese semiconductor manufacturer and exposure to two Indian IT services companies that benefited from an increase in revenue growth, buoyed by their digital offering and the weaker Indian rupee, which boosted their earnings. Strategically, we also increased our exposure to the financials sector over the period. This was, in part, a decision to rotate the Fund more toward value, given the outperformance of growth companies, but also due to the positive impact on net interest margins from higher interest rates. This led us to add banks in Singapore and Malaysia, and we also added a new bank in Taiwan to the Fund, closing the period with an overweight position to financials. Exposure to private sector Indian financials detracted from relative performance, given some asset-quality issues from weaker competitors, but we are confident in the asset quality and operating performance of the companies we own. Elsewhere, our exposure to insurance companies contributed positively as a regional life insurance company continued to deliver strong new business growth. We also added a Chinese insurer to the Fund during the period and believe the industry offers attractive structural growth. From an allocation perspective, our underweight to China was positive as was the overweight to the Indian stock market, although the latter was offset by the weaker currency.
OUTLOOK
We remain cautious in the short term, but are of the view that markets will eventually come to terms with the reality of trade wars, after which underlying fundamentals like earnings growth will take center stage once again. We continue to believe that investor concerns here are overstated given the healthy domestic demand growth across much of Asia while exports to the U.S. are less significant than in the past. We would expect the introduction of tariffs to impact global growth and that Asia ex Japan should not be disproportionately impacted relative to other regions. The Chinese economy remains crucial to how investors will view the region as a whole,
Janus Investment Fund | 1 |
Janus Henderson Asia Equity Fund (unaudited)
and the government’s ongoing balancing act between gradual deleveraging and maintaining growth is what we are monitoring closely. We still have close to 20% of the Fund allocated to Chinese equities, but that is a significant underweight relative to our primary benchmark, which we are comfortable with at the current juncture. Our key overweights remain to India and Taiwan.
Thank you for your continued investment in Janus Henderson Asia Equity Fund.
2 | SEPTEMBER 30, 2018 |
Janus Henderson Asia Equity Fund (unaudited)
Fund At A Glance
September 30, 2018
5 Top Performers - Holdings |
|
|
| 5 Bottom Performers - Holdings |
| |
Contribution | Contribution | |||||
Taiwan Semiconductor Manufacturing Co Ltd | 1.55% | Hangzhou Hikvision Digital Technology Co Ltd | -0.76% | |||
Tata Consultancy Services Ltd | 1.44% | Largan Precision Co Ltd | -0.66% | |||
Infosys Ltd | 1.17% | Delta Electronics Inc | -0.65% | |||
Uni-President Enterprises Corp | 1.01% | UBS AG London | -0.61% | |||
CSL Ltd | 0.99% | John Keells Holdings PLC | -0.50% | |||
5 Top Performers - Sectors* |
|
|
|
|
| |
Fund | Fund Weighting | MSCI All Country Asia ex-Japan Index | ||||
Contribution | (Average % of Equity) | Weighting | ||||
Consumer Staples | 1.94% | 11.25% | 4.62% | |||
Information Technology | 1.14% | 44.27% | 31.84% | |||
Consumer Discretionary | 0.84% | 10.73% | 8.97% | |||
Health Care | 0.56% | 2.14% | 2.72% | |||
Real Estate | 0.53% | 3.50% | 5.89% | |||
5 Bottom Performers - Sectors* |
|
|
|
|
| |
Fund | Fund Weighting | MSCI All Country Asia ex-Japan Index | ||||
Contribution | (Average % of Equity) | Weighting | ||||
Energy | -1.07% | 0.01% | 4.44% | |||
Industrials | -0.53% | 2.73% | 6.71% | |||
Materials | -0.35% | 0.68% | 4.63% | |||
Financials | -0.28% | 21.47% | 23.29% | |||
Other** | -0.13% | 1.78% | 0.00% | |||
Security contribution to performance is measured by using an algorithm that multiplies the daily performance of each security with the previous day’s ending weight in the portfolio and is gross of advisory fees. Fixed income securities and certain equity securities, such as private placements and some share classes of equity securities, are excluded. | ||||||
* | Based on sector classification according to the Global Industry Classification Standard (“GICS”) codes, which are the exclusive property and a service mark of MSCI Inc. and Standard & Poor’s. | |||||
** | Not a GICS classified sector. | |||||
Janus Investment Fund | 3 |
Janus Henderson Asia Equity Fund (unaudited)
Fund At A Glance
September 30, 2018
5 Largest Equity Holdings - (% of Net Assets) | |
Taiwan Semiconductor Manufacturing Co Ltd | |
Semiconductor & Semiconductor Equipment | 6.5% |
Alibaba Group Holding Ltd (ADR) | |
Internet Software & Services | 4.6% |
HDFC Bank Ltd | |
Banks | 4.3% |
Housing Development Finance Corp Ltd | |
Thrifts & Mortgage Finance | 4.2% |
AIA Group Ltd | |
Insurance | 3.9% |
23.5% | |
Asset Allocation - (% of Net Assets) | |||||
Common Stocks | 92.3% | ||||
Warrants | 4.0% | ||||
Investment Companies | 3.1% | ||||
Preferred Stocks | 2.4% | ||||
Other | (1.8)% | ||||
100.0% | |||||
Emerging markets comprised 76.6% of total net assets.
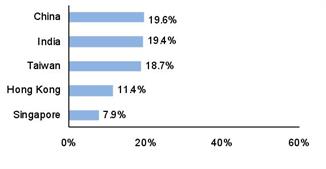
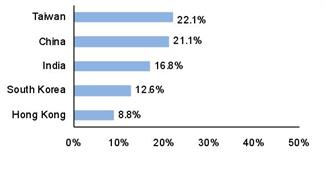
Top Country Allocations - Long Positions - (% of Investment Securities) | |
As of September 30, 2018
| As of September 30, 2017
|
4 | SEPTEMBER 30, 2018 |
Janus Henderson Asia Equity Fund (unaudited)
Performance
See important disclosures on the next page. |
| Expense Ratios - | ||||||||
Average Annual Total Return - for the periods ended September 30, 2018 |
|
| per the January 26, 2018 prospectuses | ||||||
|
| One
| Five
| Since |
|
| Total Annual Fund
| Net Annual Fund
| |
Class A Shares at NAV |
| 2.75% | 8.02% | 4.80% |
|
| 2.49% | 1.54% | |
Class A Shares at MOP |
| -3.17% | 6.74% | 3.94% |
|
|
|
| |
Class C Shares at NAV | 1.98% | 7.23% | 4.06% |
|
| 3.09% | 2.23% | ||
Class C Shares at CDSC |
| 0.99% | 7.23% | 4.06% |
|
|
|
| |
Class D Shares(1) |
| 2.92% | 8.22% | 4.97% |
|
| 2.19% | 1.34% | |
Class I Shares |
| 3.05% | 8.37% | 5.11% |
|
| 2.00% | 1.21% | |
Class N Shares |
| 3.05% | 7.72% | 4.47% |
|
| 1.98% | 1.19% | |
Class S Shares |
| 2.64% | 8.01% | 4.75% |
|
| 2.64% | 1.70% | |
Class T Shares |
| 2.81% | 8.19% | 4.93% |
|
| 2.14% | 1.44% | |
MSCI All Country Asia ex-Japan Index |
| 1.45% | 6.64% | 4.37% |
|
|
|
| |
MSCI All Country Asia-Pacific ex-Japan Index |
| 1.95% | 5.66% | 4.21% |
|
|
|
| |
Morningstar Quartile - Class I Shares |
| 2nd | 1st | 1st |
|
|
|
| |
Morningstar Ranking - based on total returns for Pacific/Asia ex-Japan Stock Funds |
| 15/88 | 3/67 | 10/62 |
|
|
|
| |
Returns quoted are past performance and do not guarantee future results; current performance may be lower or higher. Investment returns and principal value will vary; there may be a gain or loss when shares are sold. For the most recent month-end performance call 800.668.0434 (or 800.525.3713 if you hold shares directly with Janus Henderson) or visit janushenderson.com/performance (or janushenderson.com/allfunds if you hold shares directly with Janus Henderson).
Maximum Offering Price (MOP) returns include the maximum sales charge of 5.75%. Net Asset Value (NAV) returns exclude this charge, which would have reduced returns.
CDSC returns include a 1% contingent deferred sales charge (CDSC) on Shares redeemed within 12 months of purchase. Net Asset Value (NAV) returns exclude this charge, which would have reduced returns.
Net expense ratios reflect the expense waiver, if any, contractually agreed to through February 1, 2019.
The expense ratios for Class N Shares are estimated.
Janus Investment Fund | 5 |
Janus Henderson Asia Equity Fund (unaudited)
Performance
This Fund has a performance-based management fee that may adjust up or down based on the Fund’s performance.
Performance may be affected by risks that include those associated with non-diversification, portfolio turnover, short sales, potential conflicts of interest, foreign and emerging markets, initial public offerings (IPOs), high-yield and high-risk securities, undervalued, overlooked and smaller capitalization companies, real estate related securities including Real Estate Investment Trusts (REITs), derivatives, and commodity-linked investments. Each product has different risks. Please see the prospectus for more information about risks, holdings and other details.
The Fund will normally invest at least 80% of its net assets, measured at the time of purchase, in the type of securities described by its name.
Returns include reinvestment of all dividends and distributions and do not reflect the deduction of taxes that a shareholder would pay on Fund distributions or redemptions of Fund shares. The returns do not include adjustments in accordance with generally accepted accounting principles required at the period end for financial reporting purposes.
See Financial Highlights for actual expense ratios during the reporting period.
Class N Shares commenced operations on January 26, 2018. Performance shown for periods prior to January 26, 2018, reflects the historical performance of the Fund's Class I Shares, calculated using the fees and expenses of Class N Shares, without the effect of any fee and expense limitations or waivers.
If Class N Shares of the Fund had been available during periods prior to January 26, 2018, the performance shown may have been different. The performance shown for periods following the Fund's commencement of Class N Shares reflects the fees and expenses of Class N Shares, net of any applicable fee and expense limitations or waivers. Please refer to the Fund's prospectuses for further details concerning historical performance.
Ranking is for the share class shown only; other classes may have different performance characteristics. When an expense waiver is in effect, it may have a material effect on the total return, and therefore the ranking for the period.
© 2018 Morningstar, Inc. All Rights Reserved.
There is no assurance that the investment process will consistently lead to successful investing.
See Notes to Schedule of Investments and Other Information for index definitions.
Index performance does not reflect the expenses of managing a portfolio as an index is unmanaged and not available for direct investment.
See “Useful Information About Your Fund Report.”
*The Fund’s inception date – July 29, 2011
(1) Closed to certain new investors.
6 | SEPTEMBER 30, 2018 |
Janus Henderson Asia Equity Fund (unaudited)
Expense Examples
As a shareholder of the Fund, you incur two types of costs: (1) transaction costs, such as sales charges (loads) on purchase payments (applicable to Class A Shares only); and (2) ongoing costs, including management fees; 12b-1 distribution and shareholder servicing fees; transfer agent fees and expenses payable pursuant to the Transfer Agency Agreement; and other Fund expenses. This example is intended to help you understand your ongoing costs (in dollars) of investing in the Fund and to compare these costs with the ongoing costs of investing in other mutual funds. To do so, compare this 5% hypothetical example with the 5% hypothetical examples that appear in the shareholder reports of the other funds. The example is based upon an investment of $1,000 invested at the beginning of the period and held for the six-months indicated, unless noted otherwise in the table and footnotes below.
Actual Expenses
The information in the table under the heading “Actual” provides information about actual account values and actual expenses. You may use the information in these columns, together with the amount you invested, to estimate the expenses that you paid over the period. Simply divide your account value by $1,000 (for example, an $8,600 account value divided by $1,000 = 8.6), then multiply the result by the number in the appropriate column for your share class under the heading entitled “Expenses Paid During Period” to estimate the expenses you paid on your account during the period.
Hypothetical Example for Comparison Purposes
The information in the table under the heading “Hypothetical (5% return before expenses)” provides information about hypothetical account values and hypothetical expenses based upon the Fund’s actual expense ratio and an assumed rate of return of 5% per year before expenses, which is not the Fund’s actual return. The hypothetical account values and expenses may not be used to estimate the actual ending account balance or expenses you paid for the period. You may use this information to compare the ongoing costs of investing in the Fund and other funds. To do so, compare this 5% hypothetical example with the 5% hypothetical examples that appear in the shareholder reports of the other funds. Additionally, for an analysis of the fees associated with an investment in any share class or other similar funds, please visit www.finra.org/fundanalyzer.
Please note that the expenses shown in the table are meant to highlight your ongoing costs only and do not reflect any transaction costs. These fees are fully described in the Fund’s prospectuses. Therefore, the hypothetical examples are useful in comparing ongoing costs only, and will not help you determine the relative total costs of owning different funds. In addition, if these transaction costs were included, your costs would have been higher.
Actual | Hypothetical | |||||||||
| Beginning | Ending | Expenses |
| Beginning | Ending | Expenses | Net Annualized | ||
Class A Shares | $1,000.00 | $953.40 | $7.15 |
| $1,000.00 | $1,017.75 | $7.39 | 1.46% | ||
Class C Shares | $1,000.00 | $948.90 | $10.80 |
| $1,000.00 | $1,013.99 | $11.16 | 2.21% | ||
Class D Shares | $1,000.00 | $953.90 | $6.27 |
| $1,000.00 | $1,018.65 | $6.48 | 1.28% | ||
Class I Shares | $1,000.00 | $954.70 | $5.64 |
| $1,000.00 | $1,019.30 | $5.82 | 1.15% | ||
Class N Shares | $1,000.00 | $954.70 | $5.49 |
| $1,000.00 | $1,019.45 | $5.67 | 1.12% | ||
Class S Shares | $1,000.00 | $952.70 | $7.34 |
| $1,000.00 | $1,017.55 | $7.59 | 1.50% | ||
Class T Shares | $1,000.00 | $953.30 | $6.46 |
| $1,000.00 | $1,018.45 | $6.68 | 1.32% | ||
† | Expenses Paid During Period are equal to the Net Annualized Expense Ratio multiplied by the average account value over the period, multiplied by 183/365 (to reflect the one-half year period). Expenses in the examples include the effect of applicable fee waivers and/or expense reimbursements, if any. Had such waivers and/or reimbursements not been in effect, your expenses would have been higher. Please refer to the Notes to Financial Statements or the Fund’s prospectuses for more information regarding waivers and/or reimbursements. | |||||||||
Janus Investment Fund | 7 |
Janus Henderson Asia Equity Fund
Schedule of Investments
September 30, 2018
| Value | ||||||
Common Stocks – 92.3% | |||||||
Automobiles – 2.1% | |||||||
Brilliance China Automotive Holdings Ltd | 334,000 | $540,176 | |||||
Banks – 15.8% | |||||||
BOC Hong Kong Holdings Ltd | 138,500 | 658,184 | |||||
DBS Group Holdings Ltd | 20,400 | 389,432 | |||||
E.Sun Financial Holding Co Ltd | 657,000 | 485,256 | |||||
HDFC Bank Ltd | 41,021 | 1,135,311 | |||||
Oversea-Chinese Banking Corp Ltd | 100,200 | 838,727 | |||||
Public Bank Bhd | 104,600 | 632,101 | |||||
4,139,011 | |||||||
Beverages – 2.4% | |||||||
Treasury Wine Estates Ltd | 50,672 | 640,495 | |||||
Diversified Financial Services – 5.4% | |||||||
Ayala Corp | 45,500 | 781,636 | |||||
Bajaj Holdings & Investment Ltd | 15,000 | 640,199 | |||||
1,421,835 | |||||||
Electronic Equipment, Instruments & Components – 2.7% | |||||||
Largan Precision Co Ltd | 3,000 | 357,178 | |||||
Venture Corp Ltd | 27,300 | 352,161 | |||||
709,339 | |||||||
Food Products – 4.3% | |||||||
Uni-President Enterprises Corp | 330,000 | 861,452 | |||||
Vietnam Dairy Products JSC | 44,184 | 260,084 | |||||
1,121,536 | |||||||
Household Durables – 6.9% | |||||||
Coway Co Ltd | 7,542 | 590,249 | |||||
Nien Made Enterprise Co Ltd | 55,000 | 430,546 | |||||
Techtronic Industries Co Ltd | 124,500 | 795,232 | |||||
1,816,027 | |||||||
Industrial Conglomerates – 1.0% | |||||||
John Keells Holdings PLC | 334,883 | 260,837 | |||||
Information Technology Services – 6.4% | |||||||
Infosys Ltd | 78,939 | 795,080 | |||||
Tata Consultancy Services Ltd | 28,910 | 870,979 | |||||
1,666,059 | |||||||
Insurance – 6.6% | |||||||
AIA Group Ltd | 112,800 | 1,007,259 | |||||
Ping An Insurance Group Co of China Ltd | 70,000 | 710,919 | |||||
1,718,178 | |||||||
Internet Software & Services – 9.6% | |||||||
Alibaba Group Holding Ltd (ADR)* | 7,308 | 1,204,066 | |||||
Baidu Inc (ADR)* | 2,388 | 546,088 | |||||
Tencent Holdings Ltd | 18,600 | 767,961 | |||||
2,518,115 | |||||||
Oil, Gas & Consumable Fuels – 1.6% | |||||||
CNOOC Ltd | 212,000 | 419,781 | |||||
Personal Products – 1.9% | |||||||
LG Household & Health Care Ltd | 428 | 492,407 | |||||
Real Estate Management & Development – 4.6% | |||||||
City Developments Ltd | 78,200 | 521,257 | |||||
Land & Houses PCL (REG) | 1,937,900 | 689,324 | |||||
1,210,581 | |||||||
Semiconductor & Semiconductor Equipment – 6.5% | |||||||
Taiwan Semiconductor Manufacturing Co Ltd | 197,000 | 1,693,770 | |||||
Technology Hardware, Storage & Peripherals – 5.7% | |||||||
Advantech Co Ltd | 90,797 | 676,569 | |||||
Catcher Technology Co Ltd | 44,000 | 484,229 | |||||
Samsung Electronics Co Ltd | 7,781 | 325,875 | |||||
1,486,673 | |||||||
See Notes to Schedule of Investments and Other Information and Notes to Financial Statements. | |
8 | SEPTEMBER 30, 2018 |
Janus Henderson Asia Equity Fund
Schedule of Investments
September 30, 2018
| Value | ||||||
Common Stocks – (continued) | |||||||
Textiles, Apparel & Luxury Goods – 2.2% | |||||||
Samsonite International SA* | 157,800 | $584,601 | |||||
Thrifts & Mortgage Finance – 4.2% | |||||||
Housing Development Finance Corp Ltd | 45,954 | 1,112,355 | |||||
Tobacco – 2.4% | |||||||
ITC Ltd | 153,621 | 631,058 | |||||
Total Common Stocks (cost $21,827,353) | 24,182,834 | ||||||
Preferred Stocks – 2.4% | |||||||
Technology Hardware, Storage & Peripherals – 2.4% | |||||||
Samsung Electronics Co Ltd (cost $470,949) | 17,988 | 613,872 | |||||
Warrants – 4.0% | |||||||
Beverages – 1.5% | |||||||
Jiangsu Yanghe Brewery, expires, 9/27/19* | 21,400 | 395,445 | |||||
Electronic Equipment, Instruments & Components – 1.0% | |||||||
Hangzhou Hikvision Digital Technology Co Ltd, expires, 1/22/19* | 61,300 | 256,048 | |||||
Household Durables – 1.5% | |||||||
Midea Group Co Ltd, expires, 6/25/19* | 68,014 | 398,361 | |||||
Total Warrants (cost $1,314,401) | 1,049,854 | ||||||
Investment Companies – 3.1% | |||||||
Money Markets – 3.1% | |||||||
Fidelity Investments Money Market Treasury Portfolio, 1.9300%ºº (cost $814,883) | 814,883 | 814,883 | |||||
Total Investments (total cost $24,427,586) – 101.8% | 26,661,443 | ||||||
Liabilities, net of Cash, Receivables and Other Assets – (1.8)% | (466,514) | ||||||
Net Assets – 100% | $26,194,929 | ||||||
Summary of Investments by Country - (Long Positions) (unaudited) | |||||
% of | |||||
Investment | |||||
Country | Value | Securities | |||
China | $5,238,845 | 19.6 | % | ||
India | 5,184,982 | 19.4 | |||
Taiwan | 4,989,000 | 18.7 | |||
Hong Kong | 3,045,276 | 11.4 | |||
Singapore | 2,101,577 | 7.9 | |||
South Korea | 2,022,403 | 7.6 | |||
United States | 814,883 | 3.1 | |||
Philippines | 781,636 | 2.9 | |||
Thailand | 689,324 | 2.6 | |||
Australia | 640,495 | 2.4 | |||
Malaysia | 632,101 | 2.4 | |||
Sri Lanka | 260,837 | 1.0 | |||
Vietnam | 260,084 | 1.0 | |||
Total | $26,661,443 | 100.0 | % |
See Notes to Schedule of Investments and Other Information and Notes to Financial Statements. | |
Janus Investment Fund | 9 |
Janus Henderson Asia Equity Fund
Notes to Schedule of Investments and Other Information
MSCI All Country Asia ex-Japan IndexSM | MSCI All Country Asia ex-Japan IndexSM reflects the equity market performance of Asia, excluding Japan. |
MSCI All Country Asia-Pacific ex-Japan IndexSM | The MSCI All Country Asia-Pacific ex-Japan IndexSM reflects the performance of large and mid-cap companies in developed and emerging markets in the Asia Pacific region, excluding Japan. |
ADR | American Depositary Receipt |
PCL | Public Company Limited |
PLC | Public Limited Company |
REG | Registered |
* | Non-income producing security. |
ºº | Rate shown is the 7-day yield as of September 30, 2018. |
The following is a summary of the inputs that were used to value the Fund’s investments in securities and other financial instruments as of September 30, 2018. See Notes to Financial Statements for more information. | ||||||||||||
Valuation Inputs Summary | ||||||||||||
Level 2 - | Level 3 - | |||||||||||
Level 1 - | Other Significant | Significant | ||||||||||
Quoted Prices | Observable Inputs | Unobservable Inputs | ||||||||||
Assets | ||||||||||||
Investments in Securities: | ||||||||||||
Common Stocks | $ | 24,182,834 | $ | - | $ | - | ||||||
Preferred Stocks | - | 613,872 | - | |||||||||
Warrants | 651,493 | 398,361 | - | |||||||||
Investment Companies | 814,883 | - | - | |||||||||
Total Assets | $ | 25,649,210 | $ | 1,012,233 | $ | - | ||||||
10 | SEPTEMBER 30, 2018 |
Janus Henderson Asia Equity Fund
Statement of Assets and Liabilities
September 30, 2018
See footnotes at the end of the Statement. |
|
|
|
|
|
|
|
Assets: | ||||||
Investments, at value(1) | $ | 26,661,443 | ||||
Cash denominated in foreign currency(2) | 4,208 | |||||
Non-interested Trustees' deferred compensation | 566 | |||||
Receivables: | ||||||
Investments sold | 862,707 | |||||
Dividends | 48,763 | |||||
Due from adviser | 34,238 | |||||
Fund shares sold | 4,330 | |||||
Other assets | 864 | |||||
Total Assets |
|
| 27,617,119 |
| ||
Liabilities: | ||||||
Payables: | — | |||||
Investments purchased | 1,167,409 | |||||
Foreign tax liability | 95,690 | |||||
Fund shares repurchased | 49,575 | |||||
Professional fees | 37,899 | |||||
Advisory fees | 22,028 | |||||
Transfer agent fees and expenses | 3,946 | |||||
12b-1 Distribution and shareholder servicing fees | 1,283 | |||||
Non-interested Trustees' deferred compensation fees | 566 | |||||
Custodian fees | 407 | |||||
Non-interested Trustees' fees and expenses | 216 | |||||
Affiliated fund administration fees payable | 55 | |||||
Accrued expenses and other payables | 43,116 | |||||
Total Liabilities |
|
| 1,422,190 |
| ||
Net Assets |
| $ | 26,194,929 |
| ||
See Notes to Financial Statements. | |
Janus Investment Fund | 11 |
Janus Henderson Asia Equity Fund
Statement of Assets and Liabilities
September 30, 2018
|
|
|
|
|
|
|
Net Assets Consist of: | ||||||
Capital (par value and paid-in surplus) | $ | 22,202,381 | ||||
Total distributable earnings (loss)(3) | 3,992,548 | |||||
Total Net Assets |
| $ | 26,194,929 |
| ||
Net Assets - Class A Shares | $ | 816,175 | ||||
Shares Outstanding, $0.01 Par Value (unlimited shares authorized) | 71,467 | |||||
Net Asset Value Per Share(4) |
| $ | 11.42 |
| ||
Maximum Offering Price Per Share(5) |
| $ | 12.12 |
| ||
Net Assets - Class C Shares | $ | 1,243,882 | ||||
Shares Outstanding, $0.01 Par Value (unlimited shares authorized) | 110,078 | |||||
Net Asset Value Per Share(4) |
| $ | 11.30 |
| ||
Net Assets - Class D Shares | $ | 13,089,357 | ||||
Shares Outstanding, $0.01 Par Value (unlimited shares authorized) | 1,134,454 | |||||
Net Asset Value Per Share |
| $ | 11.54 |
| ||
Net Assets - Class I Shares | $ | 1,028,731 | ||||
Shares Outstanding, $0.01 Par Value (unlimited shares authorized) | 89,864 | |||||
Net Asset Value Per Share |
| $ | 11.45 |
| ||
Net Assets - Class N Shares | $ | 8,500,749 | ||||
Shares Outstanding, $0.01 Par Value (unlimited shares authorized) | 735,606 | |||||
Net Asset Value Per Share |
| $ | 11.56 |
| ||
Net Assets - Class S Shares | $ | 483,919 | ||||
Shares Outstanding, $0.01 Par Value (unlimited shares authorized) | 42,250 | |||||
Net Asset Value Per Share |
| $ | 11.45 |
| ||
Net Assets - Class T Shares | $ | 1,032,116 | ||||
Shares Outstanding, $0.01 Par Value (unlimited shares authorized) | 90,773 | |||||
Net Asset Value Per Share |
| $ | 11.37 |
| ||
(1) Includes cost of $24,427,586. (2) Includes cost of $4,208. (3) Includes $95,691 of foreign capital gains tax on investments. (4) Redemption price per share may be reduced for any applicable contingent deferred sales charge. (5) Maximum offering price is computed at 100/94.25 of net asset value. |
See Notes to Financial Statements. | |
12 | SEPTEMBER 30, 2018 |
Janus Henderson Asia Equity Fund
Statement of Operations
For the year ended September 30, 2018(1)
|
|
|
|
|
|
Investment Income: | |||||
| Dividends | $ | 794,493 | ||
Other income | 29,950 | ||||
Foreign tax withheld | (85,604) | ||||
Total Investment Income |
| 738,839 |
| ||
Expenses: | |||||
Advisory fees | 354,962 | ||||
12b-1 Distribution and shareholder servicing fees: | |||||
Class A Shares | 2,382 | ||||
Class C Shares | 12,255 | ||||
Class S Shares | 1,247 | ||||
Transfer agent administrative fees and expenses: | |||||
Class D Shares | 25,395 | ||||
Class S Shares | 1,250 | ||||
Class T Shares | 6,979 | ||||
Transfer agent networking and omnibus fees: | |||||
Class A Shares | 1,060 | ||||
Class C Shares | 936 | ||||
Class I Shares | 1,235 | ||||
Other transfer agent fees and expenses: | |||||
Class A Shares | 146 | ||||
Class C Shares | 146 | ||||
Class D Shares | 7,671 | ||||
Class I Shares | 367 | ||||
Class N Shares | 251 | ||||
Class S Shares | 16 | ||||
Class T Shares | 137 | ||||
Registration fees | 112,850 | ||||
Professional fees | 67,399 | ||||
Shareholder reports expense | 16,781 | ||||
Custodian fees | 11,465 | ||||
Affiliated fund administration fees | 1,939 | ||||
Non-interested Trustees’ fees and expenses | 1,094 | ||||
Other expenses | 32,725 | ||||
Total Expenses |
| 660,688 |
| ||
Less: Excess Expense Reimbursement and Waivers |
| (153,499) |
| ||
Net Expenses |
| 507,189 |
| ||
Net Investment Income/(Loss) |
| 231,650 |
| ||
Net Realized Gain/(Loss) on Investments: | |||||
Investments and foreign currency transactions(2) | 2,156,515 | ||||
Total Net Realized Gain/(Loss) on Investments |
| 2,156,515 |
| ||
Change in Unrealized Net Appreciation/Depreciation: | |||||
Investments, foreign currency translations and non-interested Trustees’ deferred compensation(3) | (949,637) | ||||
Total Change in Unrealized Net Appreciation/Depreciation |
| (949,637) |
| ||
Net Increase/(Decrease) in Net Assets Resulting from Operations | $ | 1,438,528 |
| ||
(1) Period from January 26, 2018 (inception date) through September 30, 2018 for Class N Shares. (2) Includes realized foreign capital gains tax on investments of $(37,432). (3) Includes change in unrealized appreciation/depreciation of $(95,564) due to foreign capital gains tax on investments. |
See Notes to Financial Statements. | |
Janus Investment Fund | 13 |
Janus Henderson Asia Equity Fund
Statements of Changes in Net Assets
|
|
| Year
ended |
| Year
ended | |||
Operations: | ||||||||
Net investment income/(loss) | $ | 231,650 | $ | 155,692 | ||||
Net realized gain/(loss) on investments | 2,156,515 | 1,899,278 | ||||||
Change in unrealized net appreciation/depreciation | (949,637) | 2,464,588 | ||||||
Net Increase/(Decrease) in Net Assets Resulting from Operations |
| 1,438,528 |
|
| 4,519,558 | |||
Dividends and Distributions to Shareholders(2) | ||||||||
Class A Shares | (27,500) | N/A | ||||||
Class C Shares | (26,838) | N/A | ||||||
Class D Shares | (653,620) | N/A | ||||||
Class I Shares | (337,205) | N/A | ||||||
Class S Shares | (12,848) | N/A | ||||||
Class T Shares | (80,293) | N/A | ||||||
| Total Dividends and Distributions to Shareholders |
| (1,138,304) |
|
| N/A | ||
Dividends from Net Investment Income(2) | ||||||||
Class A Shares | N/A | (3,240) | ||||||
Class C Shares | N/A | (1,728) | ||||||
Class D Shares | N/A | (71,030) | ||||||
Class I Shares | N/A | (36,957) | ||||||
Class S Shares | N/A | (3,863) | ||||||
Class T Shares | N/A | (4,515) | ||||||
| Total Dividends from Net Investment Income |
| N/A |
|
| (121,333) | ||
Net Decrease from Dividends and Distributions to Shareholders |
| (1,138,304) |
|
| (121,333) | |||
Capital Share Transactions: | ||||||||
Class A Shares | 484,453 | 53,541 | ||||||
Class C Shares | 315,110 | 451,931 | ||||||
Class D Shares | (8,674,983) | 13,909,129 | ||||||
Class I Shares | (12,337,210) | 8,332,413 | ||||||
Class N Shares | 9,035,795 | N/A | ||||||
Class S Shares | 12,848 | 20,368 | ||||||
Class T Shares | (1,925,915) | 2,575,879 | ||||||
Net Increase/(Decrease) from Capital Share Transactions |
| (13,089,902) |
|
| 25,343,261 | |||
Net Increase/(Decrease) in Net Assets |
| (12,789,678) |
|
| 29,741,486 | |||
Net Assets: | ||||||||
Beginning of period | 38,984,607 | 9,243,121 | ||||||
| End of period(3) | $ | 26,194,929 |
| $ | 38,984,607 | ||
(1) Period from January 26, 2018 (inception date) through September 30, 2018 for Class N Shares. (2) The requirement to disclose dividends and distributions paid to shareholders from net investment income and/or net realized gain from investment transactions was eliminated by the SEC (Securities Exchange Commission) in 2018. (3) Net assets - End of period includes undistributed (overdistributed) net investment income of $114,742 as of September 30, 2017. The requirement to disclose undistributed (overdistributed) net investment income was eliminated by the SEC in 2018. |
See Notes to Financial Statements. | |
14 | SEPTEMBER 30, 2018 |
Janus Henderson Asia Equity Fund
Financial Highlights
Class A Shares | ||||||||||||||||||
For a share outstanding during the year ended September 30 |
| 2018 |
|
| 2017 |
|
| 2016 |
|
| 2015 |
|
| 2014 |
| |||
Net Asset Value, Beginning of Period |
| $11.45 |
|
| $9.42 |
|
| $8.31 |
|
| $9.79 |
|
| $9.44 |
| |||
Income/(Loss) from Investment Operations: | ||||||||||||||||||
Net investment income/(loss)(1) | 0.07 | 0.02 | 0.05 | 0.01 | 0.23(2) | |||||||||||||
Net realized and unrealized gain/(loss) | 0.22 | 2.12 | 1.44 | (0.95) | 0.59 | |||||||||||||
Total from Investment Operations |
| 0.29 |
|
| 2.14 |
|
| 1.49 |
|
| (0.94) |
|
| 0.82 |
| |||
Less Dividends and Distributions: | ||||||||||||||||||
Dividends (from net investment income) | (0.05) | (0.11) | — | (0.17) | (0.14) | |||||||||||||
Distributions (from capital gains) | (0.27) | — | (0.38) | (0.37) | (0.33) | |||||||||||||
Total Dividends and Distributions |
| (0.32) |
|
| (0.11) |
|
| (0.38) |
|
| (0.54) |
|
| (0.47) |
| |||
Net Asset Value, End of Period | $11.42 | $11.45 | $9.42 | $8.31 | $9.79 | |||||||||||||
Total Return* |
| 2.48%(3) |
|
| 23.10% |
|
| 18.58% |
|
| (10.07)% |
|
| 9.06% |
| |||
Net Assets, End of Period (in thousands) | $816 | $366 | $253 | $348 | $456 | |||||||||||||
Average Net Assets for the Period (in thousands) | $954 | $293 | $333 | $400 | $1,053 | |||||||||||||
Ratios to Average Net Assets**: |
|
|
|
|
|
|
|
|
|
|
|
|
|
|
| |||
Ratio of Gross Expenses | 2.08% | 2.49% | 3.51% | 2.87% | 2.49% | |||||||||||||
Ratio of Net Expenses (After Waivers and Expense Offsets) | 1.53% | 1.63% | 1.56% | 1.61% | 1.38% | |||||||||||||
Ratio of Net Investment Income/(Loss) | 0.60% | 0.17% | 0.64% | 0.07% | 2.35%(2) | |||||||||||||
Portfolio Turnover Rate | 41% | 120% | 59% | 152% | 72% | |||||||||||||
1 | ||||||||||||||||||
Class C Shares | ||||||||||||||||||
For a share outstanding during the year ended September 30 |
| 2018 |
|
| 2017 |
|
| 2016 |
|
| 2015 |
|
| 2014 |
| |||
Net Asset Value, Beginning of Period |
| $11.36 |
|
| $9.34 |
|
| $8.29 |
|
| $9.72 |
|
| $9.38 |
| |||
Income/(Loss) from Investment Operations: | ||||||||||||||||||
Net investment income/(loss)(1) | (0.01) | (0.04) | 0.01 | (0.03) | 0.16(2) | |||||||||||||
Net realized and unrealized gain/(loss) | 0.22 | 2.10 | 1.42 | (0.98) | 0.59 | |||||||||||||
Total from Investment Operations |
| 0.21 |
|
| 2.06 |
|
| 1.43 |
|
| (1.01) |
|
| 0.75 |
| |||
Less Dividends and Distributions: | ||||||||||||||||||
Dividends (from net investment income) | — | (0.04) | — | (0.05) | (0.08) | |||||||||||||
Distributions (from capital gains) | (0.27) | — | (0.38) | (0.37) | (0.33) | |||||||||||||
Total Dividends and Distributions |
| (0.27) |
|
| (0.04) |
|
| (0.38) |
|
| (0.42) |
|
| (0.41) |
| |||
Net Asset Value, End of Period | $11.30 | $11.36 | $9.34 | $8.29 | $9.72 | |||||||||||||
Total Return* |
| 1.80%(3) |
|
| 22.17% |
|
| 17.87% |
|
| (10.81)% |
|
| 8.22% |
| |||
Net Assets, End of Period (in thousands) | $1,244 | $957 | $413 | $360 | $332 | |||||||||||||
Average Net Assets for the Period (in thousands) | $1,233 | $519 | $381 | $373 | $802 | |||||||||||||
Ratios to Average Net Assets**: |
|
|
|
|
|
|
|
|
|
|
|
|
|
|
| |||
Ratio of Gross Expenses | 2.78% | 3.09% | 4.23% | 3.59% | 3.24% | |||||||||||||
Ratio of Net Expenses (After Waivers and Expense Offsets) | 2.25% | 2.33% | 2.25% | 2.30% | 2.12% | |||||||||||||
Ratio of Net Investment Income/(Loss) | (0.04)% | (0.42)% | 0.10% | (0.31)% | 1.68%(2) | |||||||||||||
Portfolio Turnover Rate | 41% | 120% | 59% | 152% | 72% | |||||||||||||
* Total return not annualized for periods of less than one full year. ** Annualized for periods of less than one full year. (1) Per share amounts are calculated based on average shares outstanding during the year or period. (2) Net investment income/(loss) per share and Ratio of Net Investment Income/(Loss) to Average Net Assets include a special dividend from Strides Arcolab, Ltd. in December 2013. The impact of the special dividend to Net investment income/(loss) per share and Ratio of Net Investment Income/(Loss) to Average Net Assets is $0.09 and 0.97%, respectively. (3) The return includes adjustments in accordance with generally accepted accounting principles required at period end date. |
See Notes to Financial Statements. | |
Janus Investment Fund | 15 |
Janus Henderson Asia Equity Fund
Financial Highlights
Class D Shares | ||||||||||||||||||
For a share outstanding during the year ended September 30 |
| 2018 |
|
| 2017 |
|
| 2016 |
|
| 2015 |
|
| 2014 |
| |||
Net Asset Value, Beginning of Period |
| $11.56 |
|
| $9.49 |
|
| $8.35 |
|
| $9.84 |
|
| $9.48 |
| |||
Income/(Loss) from Investment Operations: | ||||||||||||||||||
Net investment income/(loss)(1) | 0.07 | 0.07 | 0.08 | 0.07 | 0.24(2) | |||||||||||||
Net realized and unrealized gain/(loss) | 0.23 | 2.11 | 1.45 | (1.00) | 0.61 | |||||||||||||
Total from Investment Operations |
| 0.30 |
|
| 2.18 |
|
| 1.53 |
|
| (0.93) |
|
| 0.85 |
| |||
Less Dividends and Distributions: | ||||||||||||||||||
Dividends (from net investment income) | (0.05) | (0.11) | (0.01) | (0.19) | (0.16) | |||||||||||||
Distributions (from capital gains) | (0.27) | — | (0.38) | (0.37) | (0.33) | |||||||||||||
Total Dividends and Distributions |
| (0.32) |
|
| (0.11) |
|
| (0.39) |
|
| (0.56) |
|
| (0.49) |
| |||
Net Asset Value, End of Period | $11.54 | $11.56 | $9.49 | $8.35 | $9.84 | |||||||||||||
Total Return* |
| 2.57%(3) |
|
| 23.30% |
|
| 18.95% |
|
| (9.99)% |
|
| 9.26% |
| |||
Net Assets, End of Period (in thousands) | $13,089 | $21,577 | $5,314 | $5,640 | $9,084 | |||||||||||||
Average Net Assets for the Period (in thousands) | $21,221 | $11,542 | $5,013 | $6,632 | $8,635 | |||||||||||||
Ratios to Average Net Assets**: |
|
|
|
|
|
|
|
|
|
|
|
|
|
|
| |||
Ratio of Gross Expenses | 1.72% | 2.19% | 3.38% | 2.75% | 2.31% | |||||||||||||
Ratio of Net Expenses (After Waivers and Expense Offsets) | 1.33% | 1.44% | 1.36% | 1.42% | 1.25% | |||||||||||||
Ratio of Net Investment Income/(Loss) | 0.55% | 0.67% | 0.89% | 0.67% | 2.52%(2) | |||||||||||||
Portfolio Turnover Rate | 41% | 120% | 59% | 152% | 72% | |||||||||||||
Class I Shares | ||||||||||||||||||
For a share outstanding during the year ended September 30 |
| 2018 |
|
| 2017 |
|
| 2016 |
|
| 2015 |
|
| 2014 |
| |||
Net Asset Value, Beginning of Period |
| $11.56 |
|
| $9.51 |
|
| $8.37 |
|
| $9.85 |
|
| $9.49 |
| |||
Income/(Loss) from Investment Operations: | ||||||||||||||||||
Net investment income/(loss)(1) | (0.03) | 0.11 | 0.10 | 0.06 | 0.26(2) | |||||||||||||
Net realized and unrealized gain/(loss) | 0.26 | 2.07 | 1.44 | (0.98) | 0.60 | |||||||||||||
Total from Investment Operations |
| 0.23 |
|
| 2.18 |
|
| 1.54 |
|
| (0.92) |
|
| 0.86 |
| |||
Less Dividends and Distributions: | ||||||||||||||||||
Dividends (from net investment income) | (0.07) | (0.13) | (0.02) | (0.19) | (0.17) | |||||||||||||
Distributions (from capital gains) | (0.27) | — | (0.38) | (0.37) | (0.33) | |||||||||||||
Total Dividends and Distributions |
| (0.34) |
|
| (0.13) |
|
| (0.40) |
|
| (0.56) |
|
| (0.50) |
| |||
Net Asset Value, End of Period | $11.45 | $11.56 | $9.51 | $8.37 | $9.85 | |||||||||||||
Total Return* |
| 1.90%(3) |
|
| 23.39% |
|
| 19.09% |
|
| (9.79)% |
|
| 9.43% |
| |||
Net Assets, End of Period (in thousands) | $1,029 | $12,675 | $2,665 | $2,470 | $2,899 | |||||||||||||
Average Net Assets for the Period (in thousands) | $5,848 | $7,408 | $2,528 | $3,017 | $2,751 | |||||||||||||
Ratios to Average Net Assets**: |
|
|
|
|
|
|
|
|
|
|
|
|
|
|
| |||
Ratio of Gross Expenses | 1.44% | 2.00% | 3.19% | 2.56% | 2.15% | |||||||||||||
Ratio of Net Expenses (After Waivers and Expense Offsets) | 1.26% | 1.32% | 1.21% | 1.27% | 1.07% | |||||||||||||
Ratio of Net Investment Income/(Loss) | (0.25)% | 1.01% | 1.14% | 0.57% | 2.75%(2) | |||||||||||||
Portfolio Turnover Rate | 41% | 120% | 59% | 152% | 72% | |||||||||||||
* Total return not annualized for periods of less than one full year. ** Annualized for periods of less than one full year. (1) Per share amounts are calculated based on average shares outstanding during the year or period. (2) Net investment income/(loss) per share and Ratio of Net Investment Income/(Loss) to Average Net Assets include a special dividend from Strides Arcolab, Ltd. in December 2013. The impact of the special dividend to Net investment income/(loss) per share and Ratio of Net Investment Income/(Loss) to Average Net Assets is $0.09 and 0.97%, respectively. (3) The return includes adjustments in accordance with generally accepted accounting principles required at period end date. |
See Notes to Financial Statements. | |
16 | SEPTEMBER 30, 2018 |
Janus Henderson Asia Equity Fund
Financial Highlights
Class N Shares | ||||||
For a share outstanding during the period ended September 30 |
| 2018(1) |
| |||
Net Asset Value, Beginning of Period |
| $12.73 |
| |||
Income/(Loss) from Investment Operations: | ||||||
Net investment income/(loss)(2) | 0.16 | |||||
Net realized and unrealized gain/(loss) | (1.33)(3) | |||||
Total from Investment Operations |
| (1.17) |
| |||
Less Dividends and Distributions: | ||||||
Dividends (from net investment income) | — | |||||
Total Dividends and Distributions |
| — |
| |||
Net Asset Value, End of Period | $11.56 | |||||
Total Return* |
| (9.19)%(4) |
| |||
Net Assets, End of Period (in thousands) | $8,501 | |||||
Average Net Assets for the Period (in thousands) | $7,978 | |||||
Ratios to Average Net Assets**: |
|
|
| |||
Ratio of Gross Expenses | 1.75% | |||||
Ratio of Net Expenses (After Waivers and Expense Offsets) | 1.13% | |||||
Ratio of Net Investment Income/(Loss) | 1.96% | |||||
Portfolio Turnover Rate | 41% | |||||
Class S Shares | ||||||||||||||||||
For a share outstanding during the year ended September 30 |
| 2018 |
|
| 2017 |
|
| 2016 |
|
| 2015 |
|
| 2014 |
| |||
Net Asset Value, Beginning of Period |
| $11.48 |
|
| $9.43 |
|
| $8.32 |
|
| $9.79 |
|
| $9.43 |
| |||
Income/(Loss) from Investment Operations: | ||||||||||||||||||
Net investment income/(loss)(2) | 0.06 | 0.01 | 0.07 | 0.07 | 0.23(5) | |||||||||||||
Net realized and unrealized gain/(loss) | 0.22 | 2.14 | 1.42 | (1.00) | 0.59 | |||||||||||||
Total from Investment Operations |
| 0.28 |
|
| 2.15 |
|
| 1.49 |
|
| (0.93) |
|
| 0.82 |
| |||
Less Dividends and Distributions: | ||||||||||||||||||
Dividends (from net investment income) | (0.04) | (0.10) | — | (0.17) | (0.13) | |||||||||||||
Distributions (from capital gains) | (0.27) | — | (0.38) | (0.37) | (0.33) | |||||||||||||
Total Dividends and Distributions |
| (0.31) |
|
| (0.10) |
|
| (0.38) |
|
| (0.54) |
|
| (0.46) |
| |||
Net Asset Value, End of Period | $11.45 | $11.48 | $9.43 | $8.32 | $9.79 | |||||||||||||
Total Return* |
| 2.37%(4) |
|
| 23.07% |
|
| 18.56% |
|
| (9.97)% |
|
| 9.02% |
| |||
Net Assets, End of Period (in thousands) | $484 | $472 | $368 | $310 | $345 | |||||||||||||
Average Net Assets for the Period (in thousands) | $501 | $413 | $329 | $390 | $752 | |||||||||||||
Ratios to Average Net Assets**: |
|
|
|
|
|
|
|
|
|
|
|
|
|
|
| |||
Ratio of Gross Expenses | 2.36% | 2.64% | 3.67% | 3.06% | 2.58% | |||||||||||||
Ratio of Net Expenses (After Waivers and Expense Offsets) | 1.58% | 1.66% | 1.56% | 1.48% | 1.46% | |||||||||||||
Ratio of Net Investment Income/(Loss) | 0.52% | 0.15% | 0.83% | 0.71% | 2.42%(5) | |||||||||||||
Portfolio Turnover Rate | 41% | 120% | 59% | 152% | 72% | |||||||||||||
* Total return not annualized for periods of less than one full year. ** Annualized for periods of less than one full year. (1) Period from January 26, 2018 (inception date) through September 30, 2018. (2) Per share amounts are calculated based on average shares outstanding during the year or period. (3) This amount does not agree with the change in the aggregate gains and losses in the Fund’s securities for the year or period due to the timing of sales and repurchases of the Fund’s shares in relation to fluctuating market values for the Fund’s securities. (4) The return includes adjustments in accordance with generally accepted accounting principles required at period end date. (5) Net investment income/(loss) per share and Ratio of Net Investment Income/(Loss) to Average Net Assets include a special dividend from Strides Arcolab, Ltd. in December 2013. The impact of the special dividend to Net investment income/(loss) per share and Ratio of Net Investment Income/(Loss) to Average Net Assets is $0.09 and 0.97%, respectively. |
See Notes to Financial Statements. | |
Janus Investment Fund | 17 |
Janus Henderson Asia Equity Fund
Financial Highlights
Class T Shares | ||||||||||||||||||
For a share outstanding during the year ended September 30 |
| 2018 |
|
| 2017 |
|
| 2016 |
|
| 2015 |
|
| 2014 |
| |||
Net Asset Value, Beginning of Period |
| $11.42 |
|
| $9.36 |
|
| $8.25 |
|
| $9.81 |
|
| $9.45 |
| |||
Income/(Loss) from Investment Operations: | ||||||||||||||||||
Net investment income/(loss)(1) | 0.06 | 0.06 | 0.04 | 0.04 | 0.24(2) | |||||||||||||
Net realized and unrealized gain/(loss) | 0.20 | 2.08 | 1.46 | (0.96) | 0.61 | |||||||||||||
Total from Investment Operations |
| 0.26 |
|
| 2.14 |
|
| 1.50 |
|
| (0.92) |
|
| 0.85 |
| |||
Less Dividends and Distributions: | ||||||||||||||||||
Dividends (from net investment income) | (0.04) | (0.08) | (0.01) | (0.27) | (0.16) | |||||||||||||
Distributions (from capital gains) | (0.27) | — | (0.38) | (0.37) | (0.33) | |||||||||||||
Total Dividends and Distributions |
| (0.31) |
|
| (0.08) |
|
| (0.39) |
|
| (0.64) |
|
| (0.49) |
| |||
Net Asset Value, End of Period | $11.37 | $11.42 | $9.36 | $8.25 | $9.81 | |||||||||||||
Total Return* |
| 2.27%(3) |
|
| 23.18% |
|
| 18.88% |
|
| (9.98)% |
|
| 9.37% |
| |||
Net Assets, End of Period (in thousands) | $1,032 | $2,937 | $230 | $306 | $712 | |||||||||||||
Average Net Assets for the Period (in thousands) | $2,799 | $756 | $332 | $566 | $1,357 | |||||||||||||
Ratios to Average Net Assets**: |
|
|
|
|
|
|
|
|
|
|
|
|
|
|
| |||
Ratio of Gross Expenses | 1.81% | 2.14% | 3.41% | 2.73% | 2.44% | |||||||||||||
Ratio of Net Expenses (After Waivers and Expense Offsets) | 1.41% | 1.55% | 1.44% | 1.39% | 1.26% | |||||||||||||
Ratio of Net Investment Income/(Loss) | 0.54% | 0.55% | 0.47% | 0.46% | 2.49%(2) | |||||||||||||
Portfolio Turnover Rate | 41% | 120% | 59% | 152% | 72% | |||||||||||||
* Total return not annualized for periods of less than one full year. ** Annualized for periods of less than one full year. (1) Per share amounts are calculated based on average shares outstanding during the year or period. (2) Net investment income/(loss) per share and Ratio of Net Investment Income/(Loss) to Average Net Assets include a special dividend from Strides Arcolab, Ltd. In December 2013. The impact of the special dividend to Net investment income/(loss) per share and Ratio of Net Investment Income/(Loss) to Average Net Assets is $0.09 and 0.97%, respectively. (3) The return includes adjustments in accordance with generally accepted accounting principles required at period end date. |
See Notes to Financial Statements. | |
18 | SEPTEMBER 30, 2018 |
Janus Henderson Asia Equity Fund
Notes to Financial Statements
1. Organization and Significant Accounting Policies
Janus Henderson Asia Equity Fund (the “Fund”) is a series of Janus Investment Fund (the “Trust”), which is organized as a Massachusetts business trust and is registered under the Investment Company Act of 1940, as amended (the “1940 Act”), as an open-end management investment company, and therefore has applied the specialized accounting and reporting guidance in Financial Accounting Standards Board (“FASB”) Accounting Standards Codification (“ASC”) Topic 946. The Trust offers 48 funds, each of which offers multiple share classes, with differing investment objectives and policies. The Fund seeks long-term growth of capital. The Fund is classified as diversified, as defined in the 1940 Act.
The Fund offers multiple classes of shares in order to meet the needs of various types of investors. Each class represents an interest in the same portfolio of investments. Certain financial intermediaries may not offer all classes of shares. Class D Shares are closed to certain new investors.
Class A Shares and Class C Shares are generally offered through financial intermediary platforms including, but not limited to, traditional brokerage platforms, mutual fund wrap fee programs, bank trust platforms, and retirement platforms.
Class D Shares are generally no longer being made available to new investors who do not already have a direct account with the Janus Henderson funds. Class D Shares are available only to investors who hold accounts directly with the Janus Henderson funds, to immediate family members or members of the same household of an eligible individual investor, and to existing beneficial owners of sole proprietorships or partnerships that hold accounts directly with the Janus Henderson funds.
Class I Shares are available through certain financial intermediary platforms including, but not limited to, mutual fund wrap fee programs, managed account programs, asset allocation programs, bank trust platforms, as well as certain retirement platforms. Class I Shares are also available to certain direct institutional investors including, but not limited to, corporations, certain retirement plans, public plans, and foundations/endowments, who established Class I Share accounts before August 4, 2017.
Class N Shares are generally available only to financial intermediaries purchasing on behalf of: 1) certain adviser-assisted, employer-sponsored retirement plans, including 401(k) plans, 457 plans, 403(b) plans, Taft-Hartley multi-employer plans, profit-sharing and money purchase pension plans, defined benefit plans and certain welfare benefit plans, such as health savings accounts, and nonqualified deferred compensation plans; and 2) retail investors purchasing in qualified or nonqualified accounts, whose accounts are held through an omnibus account at their financial intermediary, and where the financial intermediary requires no payment or reimbursement from the Fund, Janus Capital Management LLC (“Janus Capital”), or its affiliates. Class N Shares are also available to Janus Henderson proprietary products and to certain direct institutional investors approved by Janus Distributors LLC dba Janus Henderson Distributors (“Janus Henderson Distributors”) including, but not limited to, corporations, certain retirement plans, public plans, and foundations and endowments, subject to minimum investment requirements.
Class S Shares are offered through financial intermediary platforms including, but not limited to, retirement platforms and asset allocation, mutual fund wrap, or other discretionary or nondiscretionary fee-based investment advisory programs. In addition, Class S Shares may be available through certain financial intermediaries who have an agreement with Janus Capital or its affiliates to offer Class S Shares on their supermarket platforms.
Class T Shares are available through certain financial intermediary platforms including, but not limited to, mutual fund wrap fee programs, managed account programs, asset allocation programs, bank trust platforms, as well as certain retirement platforms. In addition, Class T Shares may be available through certain financial intermediaries who have an agreement with Janus Capital or its affiliates to offer Class T Shares on their supermarket platforms.
The following accounting policies have been followed by the Fund and are in conformity with accounting principles generally accepted in the United States of America.
Investment Valuation
Securities held by the Fund are valued in accordance with policies and procedures established by and under the supervision of the Trustees (the “Valuation Procedures”). Equity securities traded on a domestic securities exchange are generally valued at the closing prices on the primary market or exchange on which they trade. If such price is lacking for the trading period immediately preceding the time of determination, such securities are valued at their current bid price.
Janus Investment Fund | 19 |
Janus Henderson Asia Equity Fund
Notes to Financial Statements
Equity securities that are traded on a foreign exchange are generally valued at the closing prices on such markets. In the event that there is no current trading volume on a particular security in such foreign exchange, the bid price from the primary exchange is generally used to value the security. Securities that are traded on the over-the-counter (“OTC”) markets are generally valued at their closing or latest bid prices as available. Foreign securities and currencies are converted to U.S. dollars using the applicable exchange rate in effect at the close of the New York Stock Exchange (“NYSE”). The Fund will determine the market value of individual securities held by it by using prices provided by one or more approved professional pricing services or, as needed, by obtaining market quotations from independent broker-dealers. Most debt securities are valued in accordance with the evaluated bid price supplied by the pricing service that is intended to reflect market value. The evaluated bid price supplied by the pricing service is an evaluation that may consider factors such as security prices, yields, maturities and ratings. Certain short-term securities maturing within 60 days or less may be evaluated and valued on an amortized cost basis provided that the amortized cost determined approximates market value. Securities for which market quotations or evaluated prices are not readily available or deemed unreliable are valued at fair value determined in good faith under the Valuation Procedures. Circumstances in which fair value pricing may be utilized include, but are not limited to: (i) a significant event that may affect the securities of a single issuer, such as a merger, bankruptcy, or significant issuer-specific development; (ii) an event that may affect an entire market, such as a natural disaster or significant governmental action; (iii) a nonsignificant event such as a market closing early or not opening, or a security trading halt; and (iv) pricing of a nonvalued security and a restricted or nonpublic security. Special valuation considerations may apply with respect to “odd-lot” fixed-income transactions which, due to their small size, may receive evaluated prices by pricing services which reflect a large block trade and not what actually could be obtained for the odd-lot position. The Fund uses systematic fair valuation models provided by independent third parties to value international equity securities in order to adjust for stale pricing, which may occur between the close of certain foreign exchanges and the close of the NYSE.
Valuation Inputs Summary
FASB ASC 820, Fair Value Measurements and Disclosures (“ASC 820”), defines fair value, establishes a framework for measuring fair value, and expands disclosure requirements regarding fair value measurements. This standard emphasizes that fair value is a market-based measurement that should be determined based on the assumptions that market participants would use in pricing an asset or liability and establishes a hierarchy that prioritizes inputs to valuation techniques used to measure fair value. These inputs are summarized into three broad levels:
Level 1 – Unadjusted quoted prices in active markets the Fund has the ability to access for identical assets or liabilities.
Level 2 – Observable inputs other than unadjusted quoted prices included in Level 1 that are observable for the asset or liability either directly or indirectly. These inputs may include quoted prices for the identical instrument on an inactive market, prices for similar instruments, interest rates, prepayment speeds, credit risk, yield curves, default rates and similar data.
Assets or liabilities categorized as Level 2 in the hierarchy generally include: debt securities fair valued in accordance with the evaluated bid or ask prices supplied by a pricing service; securities traded on OTC markets and listed securities for which no sales are reported that are fair valued at the latest bid price (or yield equivalent thereof) obtained from one or more dealers transacting in a market for such securities or by a pricing service approved by the Fund’s Trustees; certain short-term debt securities with maturities of 60 days or less that are fair valued at amortized cost; and equity securities of foreign issuers whose fair value is determined by using systematic fair valuation models provided by independent third parties in order to adjust for stale pricing which may occur between the close of certain foreign exchanges and the close of the NYSE. Other securities that may be categorized as Level 2 in the hierarchy include, but are not limited to, preferred stocks, bank loans, swaps, investments in unregistered investment companies, options, and forward contracts.
Level 3 – Unobservable inputs for the asset or liability to the extent that relevant observable inputs are not available, representing the Fund’s own assumptions about the assumptions that a market participant would use in valuing the asset or liability, and that would be based on the best information available.
There have been no significant changes in valuation techniques used in valuing any such positions held by the Fund since the beginning of the fiscal year.
The inputs or methodology used for fair valuing securities are not necessarily an indication of the risk associated with investing in those securities. The summary of inputs used as of September 30, 2018 to fair value the Fund’s
20 | SEPTEMBER 30, 2018 |
Janus Henderson Asia Equity Fund
Notes to Financial Statements
investments in securities and other financial instruments is included in the “Valuation Inputs Summary” in the Notes to Schedule of Investments and Other Information.
There were no transfers between Level 1, Level 2 and Level 3 of the fair value hierarchy during the year. The Fund recognizes transfers between the levels as of the beginning of the fiscal year.
Investment Transactions and Investment Income
Investment transactions are accounted for as of the date purchased or sold (trade date). Dividend income is recorded on the ex-dividend date. Certain dividends from foreign securities will be recorded as soon as the Fund is informed of the dividend, if such information is obtained subsequent to the ex-dividend date. Dividends from foreign securities may be subject to withholding taxes in foreign jurisdictions. Interest income is recorded on the accrual basis and includes amortization of premiums and accretion of discounts. Gains and losses are determined on the identified cost basis, which is the same basis used for federal income tax purposes. Income, as well as gains and losses, both realized and unrealized, are allocated daily to each class of shares based upon the ratio of net assets represented by each class as a percentage of total net assets.
Expenses
The Fund bears expenses incurred specifically on its behalf. Each class of shares bears a portion of general expenses, which are allocated daily to each class of shares based upon the ratio of net assets represented by each class as a percentage of total net assets. Expenses directly attributable to a specific class of shares are charged against the operations of such class.
Estimates
The preparation of financial statements in conformity with accounting principles generally accepted in the United States of America requires management to make estimates and assumptions that affect the reported amount of assets and liabilities and disclosure of contingent assets and liabilities at the date of the financial statements, and the reported amounts of income and expenses during the reporting period. Actual results could differ from those estimates.
Indemnifications
In the normal course of business, the Fund may enter into contracts that contain provisions for indemnification of other parties against certain potential liabilities. The Fund’s maximum exposure under these arrangements is unknown, and would involve future claims that may be made against the Fund that have not yet occurred. Currently, the risk of material loss from such claims is considered remote.
Foreign Currency Translations
The Fund does not isolate that portion of the results of operations resulting from the effect of changes in foreign exchange rates on investments from the fluctuations arising from changes in market prices of securities held at the date of the financial statements. Net unrealized appreciation or depreciation of investments and foreign currency translations arise from changes in the value of assets and liabilities, including investments in securities held at the date of the financial statements, resulting from changes in the exchange rates and changes in market prices of securities held.
Currency gains and losses are also calculated on payables and receivables that are denominated in foreign currencies. The payables and receivables are generally related to foreign security transactions and income translations.
Foreign currency-denominated assets and forward currency contracts may involve more risks than domestic transactions, including currency risk, counterparty risk, political and economic risk, regulatory risk and equity risk. Risks may arise from unanticipated movements in the value of foreign currencies relative to the U.S. dollar.
Dividends and Distributions
The Fund generally declares and distributes dividends of net investment income and realized capital gains (if any) annually. The Fund may treat a portion of the amount paid to redeem shares as a distribution of investment company taxable income and realized capital gains that are reflected in the net asset value. This practice, commonly referred to as “equalization,” has no effect on the redeeming shareholder or a Fund’s total return, but may reduce the amounts that would otherwise be required to be paid as taxable dividends to the remaining shareholders. It is possible that the Internal Revenue Service (IRS) could challenge the Funds’ equalization methodology or calculations, and any such challenge could result in additional tax, interest, or penalties to be paid by the Fund.
Janus Investment Fund | 21 |
Janus Henderson Asia Equity Fund
Notes to Financial Statements
The Fund may make certain investments in real estate investment trusts (“REITs”) which pay dividends to their shareholders based upon funds available from operations. It is quite common for these dividends to exceed the REITs’ taxable earnings and profits, resulting in the excess portion of such dividends being designated as a return of capital. If the Fund distributes such amounts, such distributions could constitute a return of capital to shareholders for federal income tax purposes.
Federal Income Taxes
The Fund intends to continue to qualify as a regulated investment company and distribute all of its taxable income in accordance with the requirements of Subchapter M of the Internal Revenue Code. Management has analyzed the Fund’s tax positions taken for all open federal income tax years, generally a three-year period, and has concluded that no provision for federal income tax is required in the Fund’s financial statements. The Fund is not aware of any tax positions for which it is reasonably possible that the total amounts of unrecognized tax benefits will significantly change in the next twelve months.
On December 22, 2017, the Tax Cuts and Jobs Act was signed into law. Currently, Management does not believe the bill will have a material impact on the Fund’s intention to continue to qualify as a regulated investment company, which is generally not subject to U.S. federal income tax.
2. Other Investments and Strategies
Additional Investment Risk
The financial crisis in both the U.S. and global economies over the past several years has resulted, and may continue to result, in a significant decline in the value and liquidity of many securities of issuers worldwide in the equity and fixed-income/credit markets. In response to the crisis, the United States and certain foreign governments, along with the U.S. Federal Reserve and certain foreign central banks, took steps to support the financial markets. The withdrawal of this support, a failure of measures put in place to respond to the crisis, or investor perception that such efforts were not sufficient could each negatively affect financial markets generally, and the value and liquidity of specific securities. In addition, policy and legislative changes in the United States and in other countries continue to impact many aspects of financial regulation. The effect of these changes on the markets, and the practical implications for market participants, including the Fund, may not be fully known for some time. As a result, it may also be unusually difficult to identify both investment risks and opportunities, which could limit or preclude the Fund’s ability to achieve its investment objective. Therefore, it is important to understand that the value of your investment may fall, sometimes sharply, and you could lose money.
The enactment of the Dodd-Frank Wall Street Reform and Consumer Protection Act (the “Dodd-Frank Act”) of 2010 provided for widespread regulation of financial institutions, consumer financial products and services, broker-dealers, OTC derivatives, investment advisers, credit rating agencies, and mortgage lending, which expanded federal oversight in the financial sector, including the investment management industry. Many provisions of the Dodd-Frank Act remain pending and will be implemented through future rulemaking. Therefore, the ultimate impact of the Dodd-Frank Act and the regulations under the Dodd-Frank Act on the Fund and the investment management industry as a whole, is not yet certain.
A number of countries in the European Union (“EU”) have experienced, and may continue to experience, severe economic and financial difficulties. In particular, many EU nations are susceptible to economic risks associated with high levels of debt, notably due to investments in sovereign debt of countries such as Greece, Italy, Spain, Portugal, and Ireland. Many non-governmental issuers, and even certain governments, have defaulted on, or been forced to restructure, their debts. Many other issuers have faced difficulties obtaining credit or refinancing existing obligations. Financial institutions have in many cases required government or central bank support, have needed to raise capital, and/or have been impaired in their ability to extend credit. As a result, financial markets in the EU experienced extreme volatility and declines in asset values and liquidity. Responses to these financial problems by European governments, central banks, and others, including austerity measures and reforms, may not work, may result in social unrest, and may limit future growth and economic recovery or have other unintended consequences. Further defaults or restructurings by governments and others of their debt could have additional adverse effects on economies, financial markets, and asset valuations around the world. Greece, Ireland, and Portugal have already received one or more "bailouts" from other Eurozone member states, and it is unclear how much additional funding they will require or if additional Eurozone member states will require bailouts in the future. The risk of investing in securities in the European markets may also be heightened due to the referendum in which the United Kingdom voted to exit the EU (known as “Brexit”). There is
22 | SEPTEMBER 30, 2018 |
Janus Henderson Asia Equity Fund
Notes to Financial Statements
considerable uncertainty about how Brexit will be conducted, how negotiations of necessary treaties and trade agreements will proceed, or how financial markets will react. In addition, one or more other countries may also abandon the euro and/or withdraw from the EU, placing its currency and banking system in jeopardy.
Certain areas of the world have historically been prone to and economically sensitive to environmental events such as, but not limited to, hurricanes, earthquakes, typhoons, flooding, tidal waves, tsunamis, erupting volcanoes, wildfires or droughts, tornadoes, mudslides, or other weather-related phenomena. Such disasters, and the resulting physical or economic damage, could have a severe and negative impact on the Fund’s investment portfolio and, in the longer term, could impair the ability of issuers in which the Fund invests to conduct their businesses as they would under normal conditions. Adverse weather conditions may also have a particularly significant negative effect on issuers in the agricultural sector and on insurance companies that insure against the impact of natural disasters.
Emerging Market Investing
The Fund may invest in securities of issuers or companies from or with exposure to one or more “developing countries” or “emerging market countries.” To the extent that the Fund invests a significant amount of its assets in one or more of these countries, its returns and net asset value may be affected to a large degree by events and economic conditions in such countries. The risks of foreign investing are heightened when investing in emerging markets, which may result in the price of investments in emerging markets experiencing sudden and sharp price swings. In many developing markets, there is less government supervision and regulation of business and industry practices (including the potential lack of strict finance and accounting controls and standards), stock exchanges, brokers, and listed companies, making these investments potentially more volatile in price and less liquid than investments in developed securities markets, resulting in greater risk to investors. There is a risk in developing countries that a future economic or political crisis could lead to price controls, forced mergers of companies, expropriation or confiscatory taxation, imposition or enforcement of foreign ownership limits, seizure, nationalization, sanctions or imposition of restrictions by various governmental entities on investment and trading, or creation of government monopolies, any of which may have a detrimental effect on the Fund’s investments. In addition, the Fund’s investments may be denominated in foreign currencies and therefore, changes in the value of a country’s currency compared to the U.S. dollar may affect the value of the Fund’s investments. To the extent that the Fund invests a significant portion of its assets in the securities of issuers in or companies of a single country or region, it is more likely to be impacted by events or conditions affecting that country or region, which could have a negative impact on the Fund’s performance. Additionally, foreign and emerging market risks, including, but not limited to, price controls, expropriation or confiscatory taxation, imposition or enforcement of foreign ownership limits, nationalization, and restrictions on repatriation of assets may be heightened to the extent the Fund invests in Chinese local market securities.
3. Investment Advisory Agreements and Other Transactions with Affiliates
The Fund pays Janus Capital an investment advisory fee which is calculated daily and paid monthly. The Fund’s "base" fee rate prior to any performance adjustment (expressed as an annual rate) is 0.92%.
The investment advisory fee rate is determined by calculating a base fee and applying a performance adjustment. The base fee rate is the same as the contractual investment advisory fee rate. The performance adjustment either increases or decreases the base fee depending on how well the Fund has performed relative to its benchmark index. The Fund's benchmark index used in the calculation is the MSCI All Country Asia ex-Japan Index.
The calculation of the performance adjustment applies as follows:
Investment Advisory Fee = Base Fee Rate +/- Performance Adjustment
The investment advisory fee rate paid to Janus Capital by the Fund consists of two components: (1) a base fee calculated by applying the contractual fixed rate of the advisory fee to the Fund’s average daily net assets during the previous month (“Base Fee Rate”), plus or minus (2) a performance-fee adjustment (“Performance Adjustment”) calculated by applying a variable rate of up to 0.15% (positive or negative) to the Fund’s average daily net assets based on the Fund’s relative performance compared to the cumulative investment record of its benchmark index over a 36-month performance measurement period or shorter time period, as applicable.
The Fund’s prospectuses and statement(s) of additional information contain additional information about performance-based fees. The amount shown as advisory fees on the Statement of Operations reflects the Base Fee Rate plus/minus any Performance Adjustment. For the year ended September 30, 2018, the performance adjusted investment advisory fee rate before any waivers and/or reimbursements of expenses is 0.94%.
Janus Investment Fund | 23 |
Janus Henderson Asia Equity Fund
Notes to Financial Statements
Effective December 31, 2017, the Fund’s subadvisory agreement with Henderson Investment Management Limited (“HIML”) was terminated. HIML served as subadviser to the Fund. As subadviser, HIML provided day-to-day management of the investment operations of the Fund subject to the general oversight of the Board of Trustees and Janus Capital. HIML was an affiliate of Janus Capital through a common parent company.
Janus Capital paid HIML a subadvisory fee rate equal to 50% of the investment advisory fee paid by the Fund to Janus Capital (net of any fee waivers and expense reimbursements).
Janus Capital has entered into a personnel-sharing arrangement with its foreign (non-U.S.) affiliates, Henderson Global Investors Limited, Henderson Global Investors (Japan) Ltd., and Henderson Global Investors (Singapore) Ltd. (collectively, “HGIL”), pursuant to which HGIL and certain employees of HGIL serve as “associated persons” of Janus Capital. In this capacity, such employees of HGIL are subject to the oversight and supervision of Janus Capital and may provide portfolio management, research, and related services to the Fund on behalf of Janus Capital.
Janus Capital has contractually agreed to waive the advisory fee payable by the Fund or reimburse expenses in an amount equal to the amount, if any, that the Fund’s total annual fund operating expenses, including the investment advisory fee, but excluding any performance adjustments to management fees (if applicable), the fees payable pursuant to a Rule 12b-1 plan, shareholder servicing fees, such as transfer agency fees (including out-of-pocket costs), administrative services fees and any networking/omnibus/administrative fees payable by any share class, brokerage commissions, interest, dividends, taxes, acquired fund fees and expenses, and extraordinary expenses, exceed the annual rate of 1.11% of the Fund’s average daily net assets. Janus Capital has agreed to continue the waiver until at least February 1, 2019. The previous expense limit (until February 1, 2018) was 1.24%. If applicable, amounts waived and/or reimbursed to the Fund by Janus Capital are disclosed as “Excess Expense Reimbursement and Waivers” on the Statement of Operations.
Janus Services LLC (“Janus Services”), a wholly-owned subsidiary of Janus Capital, is the Fund’s transfer agent. In addition, Janus Services provides or arranges for the provision of certain other administrative services including, but not limited to, recordkeeping, accounting, order processing, and other shareholder services for the Fund. Janus Services is not compensated for its services related to the shares, except for out-of-pocket costs. These amounts are disclosed as “Other transfer agent fees and expenses” on the Statement of Operations.
Certain, but not all, intermediaries may charge administrative fees (such as networking and omnibus) to investors in Class A Shares, Class C Shares, and Class I Shares for administrative services provided on behalf of such investors. These administrative fees are paid by the Class A Shares, Class C Shares, and Class I Shares of the Fund to Janus Services, which uses such fees to reimburse intermediaries. Consistent with the Transfer Agency Agreement between Janus Services and the Fund, Janus Services may negotiate the level, structure, and/or terms of the administrative fees with intermediaries requiring such fees on behalf of the Fund. Janus Capital and its affiliates benefit from an increase in assets that may result from such relationships. The Funds’ Trustees have set limits on fees that the Funds may incur with respect to administrative fees paid for omnibus or networked accounts. Such limits are subject to change by the Trustees in the future. These amounts are disclosed as “Transfer agent networking and omnibus fees” on the Statement of Operations.
The Fund’s Class D Shares pay an administrative services fee at an annual rate of 0.12% of the average daily net assets of Class D Shares for shareholder services provided by Janus Services. Janus Services provides or arranges for the provision of shareholder services including, but not limited to, recordkeeping, accounting, answering inquiries regarding accounts, transaction processing, transaction confirmations, and the mailing of prospectuses and shareholder reports. These amounts are disclosed as “Transfer agent administrative fees and expenses” on the Statement of Operations.
Janus Services receives an administrative services fee at an annual rate of up to 0.25% of the average daily net assets of the Fund’s Class S Shares and Class T Shares for providing or procuring administrative services to investors in Class S Shares and Class T Shares of the Fund. Janus Services expects to use all or a significant portion of this fee to compensate retirement plan service providers, broker-dealers, bank trust departments, financial advisors, and other financial intermediaries for providing these services. Janus Services or its affiliates may also pay fees for services provided by intermediaries to the extent the fees charged by intermediaries exceed the 0.25% of net assets charged to Class S Shares and Class T Shares of the Fund. Janus Services may keep certain amounts retained for reimbursement of out-of-pocket costs incurred for servicing clients of Class S Shares and Class T Shares. These amounts are disclosed as “Transfer agent administrative fees and expenses” on the Statement of Operations.
24 | SEPTEMBER 30, 2018 |
Janus Henderson Asia Equity Fund
Notes to Financial Statements
Services provided by these financial intermediaries may include, but are not limited to, recordkeeping, subaccounting, order processing, providing order confirmations, periodic statements, forwarding prospectuses, shareholder reports, and other materials to existing customers, answering inquiries regarding accounts, and other administrative services. Order processing includes the submission of transactions through the National Securities Clearing Corporation (“NSCC”) or similar systems, or those processed on a manual basis with Janus Capital. For all share classes, Janus Services also seeks reimbursement for costs it incurs as transfer agent and for providing servicing.
Janus Services is compensated for its services related to the Fund’s Class D Shares. These amounts are disclosed as “Other transfer agent fees and expenses” on the Statement of Operations.
Under a distribution and shareholder servicing plan (the “Plan”) adopted in accordance with Rule 12b-1 under the 1940 Act, the Fund pays the Trust’s distributor, Janus Distributors LLC dba Janus Henderson Distributors (“Janus Henderson Distributors”), a wholly-owned subsidiary of Janus Capital, a fee for the sale and distribution and/or shareholder servicing of the Shares at an annual rate of up to 0.25% of the Class A Shares’ average daily net assets, of up to 1.00% of the Class C Shares’ average daily net assets, and of up to 0.25% of the Class S Shares’ average daily net assets. Under the terms of the Plan, the Trust is authorized to make payments to Janus Henderson Distributors for remittance to retirement plan service providers, broker-dealers, bank trust departments, financial advisors, and other financial intermediaries, as compensation for distribution and/or shareholder services performed by such entities for their customers who are investors in the Fund. These amounts are disclosed as “12b-1 Distribution and shareholder servicing fees” on the Statement of Operations. Payments under the Plan are not tied exclusively to actual 12b-1 distribution and shareholder service expenses, and the payments may exceed 12b-1 distribution and shareholder service expenses actually incurred. If any of the Fund’s actual 12b-1 distribution and shareholder service expenses incurred during a calendar year are less than the payments made during a calendar year, the Fund will be refunded the difference. Refunds, if any, are included in “12b-1 Distribution and shareholder servicing fees” in the Statement of Operations.
Janus Capital serves as administrator to the Fund pursuant to an administration agreement between Janus Capital and the Trust. Under the administration agreement, Janus Capital is obligated to provide or arrange for the provision of certain administration, compliance, and accounting services to the Fund, including providing office space for the Fund, and is reimbursed by the Fund for certain of its costs in providing these services (to the extent Janus Capital seeks reimbursement and such costs are not otherwise waived). In addition, employees of Janus Capital and/or its affiliates may serve as officers of the Trust. The Fund pays for some or all of the salaries, fees, and expenses of Janus Capital employees and Fund officers, with respect to certain specified administration functions they perform on behalf of the Fund. The Fund pays these costs based on out-of-pocket expenses incurred by Janus Capital, and these costs are separate and apart from advisory fees and other expenses paid in connection with the investment advisory services Janus Capital (or any subadvisor, as applicable) provides to the Fund. These amounts are disclosed as “Affiliated fund administration fees” on the Statement of Operations. In addition, some expenses related to compensation payable to the Fund’s Chief Compliance Officer and certain compliance staff, all of whom are employees of Janus Capital and/or its affiliates, are shared with the Fund. Total compensation of $504,989 was paid to the Chief Compliance Officer and certain compliance staff by the Trust during the year ended September 30, 2018. The Fund's portion is reported as part of “Other expenses” on the Statement of Operations.
Effective April 1, 2018, BNP Paribas Financial Services (“BPFS”) provides certain administrative services to the Fund, including services related to Fund accounting, calculation of the Fund’s daily NAV, and Fund audit, tax, and reporting obligations, pursuant to a sub-administration agreement with Janus Capital on behalf of the Fund. Janus Capital, as administrator, oversees the provision of these services by BPFS. As compensation for such services, Janus Capital pays BPFS a fee based on a percentage of the Fund’s assets, along with a flat fee, and is reimbursed by the Fund for amounts paid to BPFS (to the extent Janus Capital seeks reimbursement and such costs are not otherwise waived). These amounts are disclosed as part of "Other expenses" on the Statement of Operations.
The Board of Trustees has adopted a deferred compensation plan (the “Deferred Plan”) for independent Trustees to elect to defer receipt of all or a portion of the annual compensation they are entitled to receive from the Fund. All deferred fees are credited to an account established in the name of the Trustees. The amounts credited to the account then increase or decrease, as the case may be, in accordance with the performance of one or more of the Janus Henderson funds that are selected by the Trustees. The account balance continues to fluctuate in accordance with the performance of the selected fund or funds until final payment of all amounts are credited to the account. The fluctuation of the account balance is recorded by the Fund as unrealized appreciation/(depreciation) and is included as of
Janus Investment Fund | 25 |
Janus Henderson Asia Equity Fund
Notes to Financial Statements
September 30, 2018 on the Statement of Assets and Liabilities in the asset, “Non-interested Trustees’ deferred compensation,” and liability, “Non-interested Trustees’ deferred compensation fees.” Additionally, the recorded unrealized appreciation/(depreciation) is included in “Unrealized net appreciation/(depreciation) of investments, foreign currency translations and non-interested Trustees’ deferred compensation” on the Statement of Assets and Liabilities. Deferred compensation expenses for the year ended September 30, 2018 are included in “Non-interested Trustees’ fees and expenses” on the Statement of Operations. Trustees are allowed to change their designation of mutual funds from time to time. Amounts will be deferred until distributed in accordance with the Deferred Plan. Deferred fees of $496,288 were paid by the Trust to the Trustees under the Deferred Plan during the year ended September 30, 2018.
Class A Shares include a 5.75% upfront sales charge of the offering price of the Fund. The sales charge is allocated between Janus Henderson Distributors and financial intermediaries. During the year ended September 30, 2018, Janus Henderson Distributors retained upfront sales charges of $1,942.
A contingent deferred sales charge (“CDSC”) of 1.00% will be deducted with respect to Class A Shares purchased without a sales load and redeemed within 12 months of purchase, unless waived. Any applicable CDSC will be 1.00% of the lesser of the original purchase price or the value of the redemption of the Class A Shares redeemed. There were no CDSCs paid by redeeming shareholders of Class A Shares to Janus Henderson Distributors during the year ended September 30, 2018.
A CDSC of 1.00% will be deducted with respect to Class C Shares redeemed within 12 months of purchase, unless waived. Any applicable CDSC will be 1.00% of the lesser of the original purchase price or the value of the redemption of the Class C Shares redeemed. There were no CDSCs paid by redeeming shareholders of Class C Shares during the year ended September 30, 2018.
As of September 30, 2018, shares of the Fund were owned by affiliates of Janus Henderson Investors, and/or other funds advised by Janus Henderson, as indicated in the table below:
Class | % of Class Owned |
| % of Fund Owned |
| ||
Class A Shares | 14 | % | - | %* | ||
Class C Shares | 33 | 2 | ||||
Class D Shares | - | - | ||||
Class I Shares | - | - | ||||
Class N Shares | - | - | ||||
Class S Shares | 96 | 2 | ||||
Class T Shares | - | - | ||||
* | Less than 0.50% | |||||
In addition, other shareholders, including other funds, individuals, accounts, as well as the Fund’s portfolio manager(s) and/or investment personnel, may from time to time own (beneficially or of record) a significant percentage of the Fund’s Shares and can be considered to “control” the Fund when that ownership exceeds 25% of the Fund’s assets (and which may differ from control as determined in accordance with accounting principles generally accepted in the United States of America).
4. Federal Income Tax
The tax components of capital shown in the table below represent: (1) distribution requirements the Fund must satisfy under the income tax regulations; (2) losses or deductions the Fund may be able to offset against income and gains realized in future years; and (3) unrealized appreciation or depreciation of investments for federal income tax purposes (reduced by foreign tax liability).
Other book to tax differences primarily consist of deferred compensation and foreign currency contract adjustments. The Fund has elected to treat gains and losses on forward foreign currency contracts as capital gains and losses, if applicable. Other foreign currency gains and losses on debt instruments are treated as ordinary income for federal income tax purposes pursuant to Section 988 of the Internal Revenue Code.
26 | SEPTEMBER 30, 2018 |
Janus Henderson Asia Equity Fund
Notes to Financial Statements
Loss Deferrals | Other Book | Net Tax | |||||
Undistributed | Undistributed
| Accumulated | Late-Year | Post-October | to Tax | Appreciation/ | |
$ 475,657 | $ 1,424,254 | $ - | $ - | $ - | $ (831) | $ 2,093,468 | |
The aggregate cost of investments and the composition of unrealized appreciation and depreciation of investment securities for federal income tax purposes as of September 30, 2018 are noted below. The primary differences between book and tax appreciation or depreciation of investments are wash sale loss deferrals and investments in partnerships.
Federal Tax Cost | Unrealized | Unrealized
| Net Tax Appreciation/ |
$ 24,472,284 | $ 3,322,622 | $ (1,133,463) | $ 2,189,159 |
Income and capital gains distributions are determined in accordance with income tax regulations that may differ from accounting principles generally accepted in the United States of America. These differences are due to differing treatments for items such as net short-term gains, deferral of wash sale losses, foreign currency transactions, passive foreign investment companies, net investment losses, and capital loss carryovers. Certain permanent differences such as tax returns of capital and net investment losses noted below have been reclassified to capital.
For the year ended September 30, 2018 | ||||
Distributions | ||||
From Ordinary Income | From Long-Term Capital Gains | Tax Return of Capital | Net Investment Loss | |
$ 614,580 | $ 523,724 | $ - | $ - | |
For the year ended September 30, 2017 | ||||
Distributions | ||||
From Ordinary Income | From Long-Term Capital Gains | Tax Return of Capital | Net Investment Loss | |
$ 121,333 | $ - | $ - | $ - | |
Permanent book to tax basis differences may result in reclassifications between the components of net assets. These differences have no impact on the results of operations or net assets. The following reclassifications have been made to the Fund:
Increase/(Decrease) to Capital | Increase/(Decrease)
to Undistributed | Increase/(Decrease) to Undistributed
|
$ 244,118 | $ (92,180) | $ (151,938) |
Capital has been adjusted by $244,118, including $162,932 of long-term capital gain, for distributions in connection with Fund share redemptions (tax equalization).
Janus Investment Fund | 27 |
Janus Henderson Asia Equity Fund
Notes to Financial Statements
5. Capital Share Transactions
Year ended September 30, 2018(1) | Year ended September 30, 2017 | |||||
Shares | Amount | Shares | Amount | |||
Class A Shares: | ||||||
Shares sold | 88,209 | $ 1,064,767 | 14,701 | $ 150,224 | ||
Reinvested dividends and distributions | 2,333 | 27,500 | 348 | 3,069 | ||
Shares repurchased | (51,015) | (607,814) | (9,956) | (99,752) | ||
Net Increase/(Decrease) | 39,527 | $ 484,453 |
| 5,093 | $ 53,541 | |
Class C Shares: | ||||||
Shares sold | 29,714 | $ 358,544 | 46,337 | $ 514,784 | ||
Reinvested dividends and distributions | 2,288 | 26,838 | 197 | 1,728 | ||
Shares repurchased | (6,159) | (70,272) | (6,458) | (64,581) | ||
Net Increase/(Decrease) | 25,843 | $ 315,110 |
| 40,076 | $ 451,931 | |
Class D Shares: | ||||||
Shares sold | 824,634 | $ 10,061,423 | 1,726,435 | $18,209,178 | ||
Reinvested dividends and distributions | 54,013 | 643,296 | 7,791 | 69,185 | ||
Shares repurchased | (1,611,063) | (19,379,702) | (427,285) | (4,369,234) | ||
Net Increase/(Decrease) | (732,416) | $ (8,674,983) |
| 1,306,941 | $13,909,129 | |
Class I Shares: | ||||||
Shares sold | 103,861 | $ 1,247,856 | 922,141 | $ 9,455,893 | ||
Reinvested dividends and distributions | 28,337 | 337,205 | 4,167 | 36,957 | ||
Shares repurchased | (1,138,895) | (13,922,271) | (110,013) | (1,160,437) | ||
Net Increase/(Decrease) | (1,006,697) | $(12,337,210) |
| 816,295 | $ 8,332,413 | |
Class N Shares: | ||||||
Shares sold | 802,257 | $ 9,826,191 | - | $ - | ||
Reinvested dividends and distributions | - | - | - | - | ||
Shares repurchased | (66,651) | (790,396) | - | - | ||
Net Increase/(Decrease) | 735,606 | $ 9,035,795 |
| - | $ - | |
Class S Shares: | ||||||
Shares sold | - | $ - | 1,702 | $ 16,505 | ||
Reinvested dividends and distributions | 1,086 | 12,848 | 438 | 3,863 | ||
Shares repurchased | - | - | - | - | ||
Net Increase/(Decrease) | 1,086 | $ 12,848 |
| 2,140 | $ 20,368 | |
Class T Shares: | ||||||
Shares sold | 109,999 | $ 1,329,447 | 313,106 | $ 3,375,908 | ||
Reinvested dividends and distributions | 6,689 | 78,728 | 507 | 4,453 | ||
Shares repurchased | (283,108) | (3,334,090) | (81,037) | (804,482) | ||
Net Increase/(Decrease) | (166,420) | $ (1,925,915) |
| 232,576 | $ 2,575,879 | |
(1) | Period from January 26, 2018 (inception date) through September 30, 2018 for Class N Shares. | |||||
6. Purchases and Sales of Investment Securities
For the year ended September 30, 2018, the aggregate cost of purchases and proceeds from sales of investment securities (excluding any short-term securities, short-term options contracts, TBAs, and in-kind transactions, as applicable) was as follows:
Purchases of | Proceeds from Sales | Purchases
of Long- | Proceeds
from Sales |
$15,175,660 | $ 27,920,525 | $ - | $ - |
28 | SEPTEMBER 30, 2018 |
Janus Henderson Asia Equity Fund
Notes to Financial Statements
7. Recent Accounting Pronouncements
The Securities and Exchange Commission adopted amendments to Regulation S-X, for the presentation of distributable earnings and distributions to align with US Generally Accepted Accounting Principles (GAAP). The compliance date of the amendments to Regulation S-X is November 5, 2018. This report incorporates the amendments to Regulation S-X.
The FASB issued Accounting Standards Update No. 2017-08, Receivables – Nonrefundable Fees and Other Costs (Subtopic 310-20), Premium Amortization on Purchased Callable Debt Securities ("ASU 2017-08") to amend the amortization period for certain purchased callable debt securities held at a premium. The guidance requires certain premiums on callable debt securities to be amortized to the earliest call date. The amortization period for callable debt securities purchased at a discount will not be impacted. The amendments are effective for fiscal years, and interim periods within those fiscal years, beginning after December 15, 2018. Early adoption is permitted, including adoption in an interim period. Management is currently evaluating the impacts of ASU 2017-08 on the financial statements.
The FASB issued Accounting Standards Update 2018-13, Fair Value Measurement (Topic 820) in August 2018. The new guidance removes, modifies and enhances the disclosures to Topic 820. For public entities, the amendments are effective for financial statements issued for fiscal years beginning after December 15, 2019, and interim periods within those fiscal years. Management is currently evaluating the impact of this new guidance on the financial statements.
8. Subsequent Event
Management has evaluated whether any events or transactions occurred subsequent to September 30, 2018 and through the date of issuance of the Fund’s financial statements and determined that there were no material events or transactions that would require recognition or disclosure in the Fund’s financial statements other than the following:
Effective November 1, 2018, the Fund has adopted an auto-conversion policy pursuant to which Class C Shares that are known by Janus Capital or its affiliates to have been held for ten years will be automatically converted to Class A Shares without the imposition of any sales charge, fee or other charge. The conversion will generally occur no later than ten business days in the month following the month of the tenth anniversary of the date of purchase. Class C Shares purchased through the reinvestment of dividends and other distributions on Class C Shares will convert to Class A Shares at the same time as the Class C Shares with respect to which they were purchased.
Janus Investment Fund | 29 |
Janus Henderson Asia Equity Fund
Report of Independent Registered Public Accounting Firm
To the Board of Trustees of Janus Investment Fund and Shareholders of Janus Henderson Asia Equity Fund:
Opinion on the Financial Statements
We have audited the accompanying statement of assets and liabilities, including the schedule of investments, of Janus Henderson Asia Equity Fund (one of the funds constituting Janus Investment Fund, referred to hereafter as the "Fund") as of September 30, 2018, the related statement of operations for the year ended September 30, 2018, the statements of changes in net assets for each of the two years in the period ended September 30, 2018, including the related notes, and the financial highlights for each of the periods indicated therein (collectively referred to as the “financial statements”). In our opinion, the financial statements present fairly, in all material respects, the financial position of the Fund as of September 30, 2018, the results of its operations for the year then ended, the changes in its net assets for each of the two years in the period ended September 30, 2018 and the financial highlights for each of the periods indicated therein in conformity with accounting principles generally accepted in the United States of America.
Basis for Opinion
These financial statements are the responsibility of the Fund’s management. Our responsibility is to express an opinion on the Fund’s financial statements based on our audits. We are a public accounting firm registered with the Public Company Accounting Oversight Board (United States) (“PCAOB”) and are required to be independent with respect to the Fund in accordance with the U.S. federal securities laws and the applicable rules and regulations of the Securities and Exchange Commission and the PCAOB.
We conducted our audits of these financial statements in accordance with the standards of the PCAOB. Those standards require that we plan and perform the audit to obtain reasonable assurance about whether the financial statements are free of material misstatement, whether due to error or fraud.
Our audits included performing procedures to assess the risks of material misstatement of the financial statements, whether due to error or fraud, and performing procedures that respond to those risks. Such procedures included examining, on a test basis, evidence regarding the amounts and disclosures in the financial statements. Our audits also included evaluating the accounting principles used and significant estimates made by management, as well as evaluating the overall presentation of the financial statements. Our procedures included confirmation of securities owned as of September 30, 2018 by correspondence with the custodian and brokers; when replies were not received from brokers, we performed other auditing procedures. We believe that our audits provide a reasonable basis for our opinion.

Denver, Colorado
November 16, 2018
We have served as the auditor of one or more investment companies in Janus Henderson Funds since 1990.
30 | SEPTEMBER 30, 2018 |
Janus Henderson Asia Equity Fund
Additional Information (unaudited)
Proxy Voting Policies and Voting Record
A description of the policies and procedures that the Fund uses to determine how to vote proxies relating to its portfolio securities is available without charge: (i) upon request, by calling 1-800-525-1093; (ii) on the Fund’s website at janushenderson.com/proxyvoting; and (iii) on the SEC’s website at http://www.sec.gov. Additionally, information regarding the Fund’s proxy voting record for the most recent twelve-month period ended June 30 is also available, free of charge, through janushenderson.com/proxyvoting and from the SEC’s website at http://www.sec.gov.
Full Holdings
The Fund is required to disclose its complete holdings on Form N-Q within 60 days of the end of the first and third fiscal quarters, and in the annual report and semiannual report to Fund shareholders. These reports (i) are available on the SEC’s website at http://www.sec.gov; (ii) may be reviewed and copied at the SEC’s Public Reference Room in Washington, D.C. (information on the Public Reference Room may be obtained by calling 1-800-SEC-0330); and (iii) are available without charge, upon request, by calling a Janus Henderson representative at 1-877-335-2687 (toll free) (or 1-800-525-3713 if you hold Class D Shares). Portfolio holdings consisting of at least the names of the holdings are generally available on a monthly basis with a 30-day lag. Holdings are generally posted approximately two business days thereafter under Full Holdings for the Fund at janushenderson.com/info (or janushenderson.com/reports if you hold Class D Shares).
APPROVAL OF ADVISORY AGREEMENTS DURING THE PERIOD
The Trustees of Janus Investment Fund and Janus Aspen Series, each of whom serves as an “independent” Trustee (the “Trustees”), oversee the management of each Fund of Janus Investment Fund and each Portfolio of Janus Aspen Series (each, a “Fund” and collectively, the “Funds”), and as required by law, determine annually whether to continue the investment advisory agreement for each Fund and the subadvisory agreements for the 14 Funds that utilize subadvisers.
In connection with their most recent consideration of those agreements for each Fund, the Trustees received and reviewed information provided by Janus Capital and the respective subadvisers in response to requests of the Trustees and their independent legal counsel. They also received and reviewed information and analysis provided by, and in response to requests of, their independent fee consultant. Throughout their consideration of the agreements, the Trustees were advised by their independent legal counsel. The Trustees met with management to consider the agreements, and also met separately in executive session with their independent legal counsel and their independent fee consultant.
Additionally, in connection with their consideration of whether to continue the investment advisory agreement and subadvisory agreement for each Fund, as applicable, the Trustees also received and reviewed information in connection with the transaction to combine the respective businesses of Henderson Group plc and Janus Capital Group, Inc., the parent company of Janus Capital (the “Transaction”), announced in October 2016, which closed in the second quarter of 2017. In this regard, the Trustees reviewed information regarding the impact of the Transaction on the services to be provided by Janus Capital and each subadviser, as applicable, to the Funds under such agreements prior to the close of the Transaction as well as the services provided after the Transaction closed.
At a meeting held on December 7, 2017, based on the Trustees’ evaluation of the information provided by Janus Capital, the subadvisers, and the independent fee consultant, as well as other information, the Trustees determined that the overall arrangements between each Fund and Janus Capital and each subadviser, as applicable, were fair and reasonable in light of the nature, extent and quality of the services provided by Janus Capital, its affiliates and the subadvisers, the fees charged for those services, and other matters that the Trustees considered relevant in the exercise of their business judgment. At that meeting, the Trustees unanimously approved the continuation of the investment advisory agreement for each Fund, and the subadvisory agreement for each subadvised Fund, for the period from February 1, 2018 through February 1, 2019, subject to earlier termination as provided for in each agreement.
In considering the continuation of those agreements, the Trustees reviewed and analyzed various factors that they determined were relevant, including the factors described below, none of which by itself was considered dispositive. However, the material factors and conclusions that formed the basis for the Trustees’ determination to approve the continuation of the agreements are discussed separately below. Also included is a summary of the independent fee consultant’s conclusions and opinions that arose during, and were included as part of, the Trustees’ consideration of the
Janus Investment Fund | 31 |
Janus Henderson Asia Equity Fund
Additional Information (unaudited)
agreements. “Management fees,” as used herein, reflect actual annual advisory fees and any administration fees (excluding out of pocket costs), net of any waivers.
Nature, Extent and Quality of Services
The Trustees reviewed the nature, extent and quality of the services provided by Janus Capital and the subadvisers to the Funds, taking into account the investment objective, strategies and policies of each Fund, and the knowledge the Trustees gained from their regular meetings with management on at least a quarterly basis and their ongoing review of information related to the Funds. In addition, the Trustees reviewed the resources and key personnel of Janus Capital and each subadviser, particularly noting those employees who provide investment and risk management services to the Funds. The Trustees also considered other services provided to the Funds by Janus Capital or the subadvisers, such as managing the execution of portfolio transactions and the selection of broker-dealers for those transactions. The Trustees considered Janus Capital’s role as administrator to the Funds, noting that Janus Capital does not receive a fee for its services but is reimbursed for its out-of-pocket costs. The Trustees considered the role of Janus Capital in monitoring adherence to the Funds’ investment restrictions, providing support services for the Trustees and Trustee committees, and overseeing communications with shareholders and the activities of other service providers, including monitoring compliance with various policies and procedures of the Funds and with applicable securities laws and regulations.
In this regard, the independent fee consultant noted that Janus Capital provides a number of different services for the Funds and Fund shareholders, ranging from investment management services to various other servicing functions, and that, in its opinion, Janus Capital is a capable provider of those services. The independent fee consultant also provided its belief that Janus Capital has developed a number of institutional competitive advantages that should enable it to provide superior investment and service performance over the long term.
The Trustees concluded that the nature, extent and quality of the services provided by Janus Capital or the subadviser to each Fund were appropriate and consistent with the terms of the respective advisory and subadvisory agreements, and that, taking into account steps taken to address those Funds whose performance lagged that of their peers for certain periods, the Funds were likely to benefit from the continued provision of those services. They also concluded that Janus Capital and each subadviser had sufficient personnel, with the appropriate education and experience, to serve the Funds effectively and had demonstrated its ability to attract well-qualified personnel.
Performance of the Funds
The Trustees considered the performance results of each Fund over various time periods. They noted that they considered Fund performance data throughout the year, including periodic meetings with each Fund’s portfolio manager(s), and also reviewed information comparing each Fund’s performance with the performance of comparable funds and peer groups identified by Broadridge Financial Solutions, Inc. (“Broadridge”), an independent data provider, and with the Fund’s benchmark index. In this regard, the independent fee consultant found that the overall Funds’ performance has been strong: for the 36 months ended September 30, 2017, approximately 70% of the Funds were in the top two quartiles of performance, as reported by Morningstar, and for the 12 months ended September 30, 2017, approximately 46% of the Funds were in the top two quartiles of performance, as reported by Morningstar.
The Trustees considered the performance of each Fund, noting that performance may vary by share class, and noted the following:
Alternative Funds
· For Janus Henderson Diversified Alternatives Fund, the Trustees noted that the Fund’s performance was in the second Broadridge quartile for the 36 months ended May 31, 2017 and the second Broadridge quartile for the 12 months ended May 31, 2017.
· For Janus Henderson International Long/Short Equity Fund, the Trustees noted that the Fund’s performance was in the bottom Broadridge quartile for the 12 months ended May 31, 2017. The Trustees noted the reasons for the Fund’s underperformance, the steps Janus Capital had taken or was taking to improve performance, and the Fund’s limited performance history.
Asset Allocation Funds
· For Janus Henderson Global Allocation Fund – Conservative, the Trustees noted that the Fund’s performance was in the bottom Broadridge quartile for the 36 months ended May 31, 2017 and the second Broadridge
32 | SEPTEMBER 30, 2018 |
Janus Henderson Asia Equity Fund
Additional Information (unaudited)
quartile for the 12 months ended May 31, 2017. The Trustees noted the reasons for the Fund’s underperformance, the steps Janus Capital had taken or was taking to improve performance, and that the performance trend was improving.
· For Janus Henderson Global Allocation Fund – Growth, the Trustees noted that the Fund’s performance was in the bottom Broadridge quartile for the 36 months ended May 31, 2017 and the second Broadridge quartile for the 12 months ended May 31, 2017. The Trustees noted the reasons for the Fund’s underperformance, the steps Janus Capital had taken or was taking to improve performance, and that the performance trend was improving.
· For Janus Henderson Global Allocation Fund – Moderate, the Trustees noted that the Fund’s performance was in the bottom Broadridge quartile for the 36 months ended May 31, 2017 and the third Broadridge quartile for the 12 months ended May 31, 2017. The Trustees noted the reasons for the Fund’s underperformance and the steps Janus Capital had taken or was taking to improve performance.
Fixed-Income Funds
· For Janus Henderson Flexible Bond Fund, the Trustees noted that the Fund’s performance was in the bottom Broadridge quartile for the 36 months ended May 31, 2017 and the bottom Broadridge quartile for the 12 months ended May 31, 2017. The Trustees noted the reasons for the Fund’s underperformance and the steps Janus Capital had taken or was taking to improve performance.
· For Janus Henderson Global Bond Fund, the Trustees noted that the Fund’s performance was in the third Broadridge quartile for the 36 months ended May 31, 2017 and the bottom Broadridge quartile for the 12 months ended May 31, 2017. The Trustees noted the reasons for the Fund’s underperformance and the steps Janus Capital had taken or was taking to improve performance.
· For Janus Henderson Global Unconstrained Bond Fund, the Trustees noted that the Fund’s performance was in the third Broadridge quartile for the 36 months ended May 31, 2017 and the bottom Broadridge quartile for the 12 months ended May 31, 2017. The Trustees noted the reasons for the Fund’s underperformance and the steps Janus Capital had taken or was taking to improve performance.
· For Janus Henderson High-Yield Fund, the Trustees noted that the Fund’s performance was in the second Broadridge quartile for the 36 months ended May 31, 2017 and the third Broadridge quartile for the 12 months ended May 31, 2017.
· For Janus Henderson Multi-Sector Income Fund, the Trustees noted that the Fund’s performance was in the first Broadridge quartile for the 36 months ended May 31, 2017 and the second Broadridge quartile for the 12 months ended May 31, 2017.
· For Janus Henderson Real Return Fund, the Trustees noted that the Fund’s performance was in the first Broadridge quartile for the 36 months ended May 31, 2017 and the first Broadridge quartile for the 12 months ended May 31, 2017.
· For Janus Henderson Short-Term Bond Fund, the Trustees noted that the Fund’s performance was in the third Broadridge quartile for the 36 months ended May 31, 2017 and the third Broadridge quartile for the 12 months ended May 31, 2017. The Trustees noted the reasons for the Fund’s underperformance and the steps Janus Capital had taken or was taking to improve performance.
· For Janus Henderson Strategic Income Fund, the Trustees noted that the Fund’s performance was in the first Broadridge quartile for the 36 months ended May 31, 2017 and the second Broadridge quartile for the 12 months ended May 31, 2017.
Global and International Equity Funds
· For Janus Henderson Asia Equity Fund, the Trustees noted that the Fund’s performance was in the first Broadridge quartile for the 36 months ended May 31, 2017 and the first Broadridge quartile for the 12 months ended May 31, 2017.
Janus Investment Fund | 33 |
Janus Henderson Asia Equity Fund
Additional Information (unaudited)
· For Janus Henderson Emerging Markets Fund, the Trustees noted that the Fund’s performance was in the first Broadridge quartile for the 36 months ended May 31, 2017 and the third Broadridge quartile for the 12 months ended May 31, 2017.
· For Janus Henderson European Focus Fund, the Trustees noted that the Fund’s performance was in the bottom Broadridge quartile for the 36 months ended May 31, 2017 and the bottom Broadridge quartile for the 12 months ended May 31, 2017. The Trustees noted the reasons for the Fund’s underperformance and the steps Janus Capital had taken or was taking to improve performance.
· For Janus Henderson Global Equity Income Fund, the Trustees noted that the Fund’s performance was in the third Broadridge quartile for the 36 months ended May 31, 2017 and the second Broadridge quartile for the 12 months ended May 31, 2017. The Trustees noted the reasons for the Fund’s underperformance, the steps Janus Capital had taken or was taking to improve performance, and that the performance trend was improving.
· For Janus Henderson Global Life Sciences Fund, the Trustees noted that the Fund’s performance was in the second Broadridge quartile for the 36 months ended May 31, 2017 and the second Broadridge quartile for the 12 months ended May 31, 2017.
· For Janus Henderson Global Real Estate Fund, the Trustees noted that the Fund’s performance was in the second Broadridge quartile for the 36 months ended May 31, 2017 and the first Broadridge quartile for the 12 months ended May 31, 2017.
· For Janus Henderson Global Research Fund, the Trustees noted that the Fund’s performance was in the third Broadridge quartile for the 36 months ended May 31, 2017 and the second Broadridge quartile for the 12 months ended May 31, 2017. The Trustees noted the reasons for the Fund’s underperformance, while also noting that the Fund has a performance fee structure that results in lower management fees during periods of underperformance, the steps Janus Capital had taken or was taking to improve performance, and that the performance trend was improving.
· For Janus Henderson Global Select Fund, the Trustees noted that the Fund’s performance was in the third Broadridge quartile for the 36 months ended May 31, 2017 and the first Broadridge quartile for the 12 months ended May 31, 2017. The Trustees noted the reasons for the Fund’s underperformance, the steps Janus Capital had taken or was taking to improve performance, and that the performance trend was improving.
· For Janus Henderson Global Technology Fund, the Trustees noted that the Fund’s performance was in the third Broadridge quartile for the 36 months ended May 31, 2017 and the third Broadridge quartile for the 12 months ended May 31, 2017. The Trustees noted the reasons for the Fund’s underperformance and the steps Janus Capital had taken or was taking to improve performance.
· For Janus Henderson Global Value Fund, the Trustees noted that the Fund’s performance was in the third Broadridge quartile for the 36 months ended May 31, 2017 and the bottom Broadridge quartile for the 12 months ended May 31, 2017. The Trustees noted the reasons for the Fund’s underperformance, while also noting that the Fund has a performance fee structure that results in lower management fees during periods of underperformance, and the steps Janus Capital and Perkins had taken or were taking to improve performance.
· For Janus Henderson International Opportunities Fund, the Trustees noted that the Fund’s performance was in the second Broadridge quartile for the 36 months ended May 31, 2017 and the bottom Broadridge quartile for the 12 months ended May 31, 2017.
· For Janus Henderson International Small Cap Fund, the Trustees noted that, due to limited performance for the Fund, performance history was not a material factor.
· For Janus Henderson International Value Fund, the Trustees noted that the Fund’s performance was in the third Broadridge quartile for the 36 months ended May 31, 2017 and the bottom Broadridge quartile for the 12 months ended May 31, 2017. The Trustees noted the reasons for the Fund’s underperformance and the steps Janus Capital and Perkins had taken or were taking to improve performance.
· For Janus Henderson Overseas Fund, the Trustees noted that the Fund’s performance was in the bottom Broadridge quartile for the 36 months ended May 31, 2017 and the first Broadridge quartile for the 12 months ended May 31, 2017. The Trustees noted the reasons for the Fund’s underperformance, while also noting that
34 | SEPTEMBER 30, 2018 |
Janus Henderson Asia Equity Fund
Additional Information (unaudited)
the Fund has a performance fee structure that results in lower management fees during periods of underperformance, the steps Janus Capital had taken or was taking to improve performance, and that the performance trend was improving.
Money Market Funds
· For Janus Henderson Government Money Market Fund, the Trustees noted that the Fund’s performance was in the third Broadridge quartile for the 36 months ended May 31, 2017 and the third Broadridge quartile for the 12 months ended May 31, 2017. The Trustees noted the reasons for the Fund’s underperformance.
· For Janus Henderson Money Market Fund, the Trustees noted that the Fund’s performance was in the third Broadridge quartile for the 36 months ended May 31, 2017 and the third Broadridge quartile for the 12 months ended May 31, 2017. The Trustees noted the reasons for the Fund’s underperformance.
Multi-Asset Funds
· For Janus Henderson Adaptive Global Allocation Fund, the Trustees noted that the Fund’s performance was in the second Broadridge quartile for the 12 months ended May 31, 2017.
· For Janus Henderson All Asset Fund, the Trustees noted that the Fund’s performance was in the third Broadridge quartile for the 36 months ended May 31, 2017 and the third Broadridge quartile for the 12 months ended May 31, 2017. The Trustees noted the reasons for the Fund’s underperformance and the steps Janus Capital had taken or was taking to improve performance.
· For Janus Henderson Dividend & Income Builder Fund, the Trustees noted that the Fund’s performance was in the second Broadridge quartile for the 36 months ended May 31, 2017 and the second Broadridge quartile for the 12 months ended May 31, 2017.
· For Janus Henderson Value Plus Income Fund, the Trustees noted that the Fund’s performance was in the second Broadridge quartile for the 36 months ended May 31, 2017 and the second Broadridge quartile for the 12 months ended May 31, 2017.
Multi-Asset U.S. Equity Funds
· For Janus Henderson Balanced Fund, the Trustees noted that the Fund’s performance was in the first Broadridge quartile for the 36 months ended May 31, 2017 and the first Broadridge quartile for the 12 months ended May 31, 2017.
· For Janus Henderson Contrarian Fund, the Trustees noted that the Fund’s performance was in the bottom Broadridge quartile for the 36 months ended May 31, 2017 and the first Broadridge quartile for the 12 months ended May 31, 2017. The Trustees noted the reasons for the Fund’s underperformance, while also noting that the Fund has a performance fee structure that results in lower management fees during periods of underperformance, the steps Janus Capital had taken or was taking to improve performance, and that the performance trend was improving.
· For Janus Henderson Enterprise Fund, the Trustees noted that the Fund’s performance was in the first Broadridge quartile for the 36 months ended May 31, 2017 and the second Broadridge quartile for the 12 months ended May 31, 2017.
· For Janus Henderson Forty Fund, the Trustees noted that the Fund’s performance was in the first Broadridge quartile for the 36 months ended May 31, 2017 and the third Broadridge quartile for the 12 months ended May 31, 2017.
· For Janus Henderson Growth and Income Fund, the Trustees noted that the Fund’s performance was in the second Broadridge quartile for the 36 months ended May 31, 2017 and the first Broadridge quartile for the 12 months ended May 31, 2017.
· For Janus Henderson Research Fund, the Trustees noted that the Fund’s performance was in the second Broadridge quartile for the 36 months ended May 31, 2017 and the third Broadridge quartile for the 12 months ended May 31, 2017.
Janus Investment Fund | 35 |
Janus Henderson Asia Equity Fund
Additional Information (unaudited)
· For Janus Henderson Triton Fund, the Trustees noted that the Fund’s performance was in the first Broadridge quartile for the 36 months ended May 31, 2017 and the third Broadridge quartile for the 12 months ended May 31, 2017.
· For Janus Henderson U.S. Growth Opportunities Fund, the Trustees noted that the Fund’s performance was in the bottom Broadridge quartile for the 12 months ended May 31, 2017. The Trustees noted the reasons for the Fund’s underperformance, the steps Janus Capital had taken or was taking to improve performance, and the Fund’s limited performance history.
· For Janus Henderson Venture Fund, the Trustees noted that the Fund’s performance was in the first Broadridge quartile for the 36 months ended May 31, 2017 and the bottom Broadridge quartile for the 12 months ended May 31, 2017.
Quantitative Equity Funds
· For Janus Henderson Emerging Markets Managed Volatility Fund, the Trustees noted that the Fund’s performance was in the bottom Broadridge quartile for the 12 months ended May 31, 2017. The Trustees noted the reasons for the Fund’s underperformance, the steps Janus Capital and Intech had taken or were taking to improve performance, and the Fund’s limited performance history.
· For Janus Henderson Global Income Managed Volatility Fund, the Trustees noted that the Fund’s performance was in the first Broadridge quartile for the 36 months ended May 31, 2017 and the third Broadridge quartile for the 12 months ended May 31, 2017.
· For Janus Henderson International Managed Volatility Fund, the Trustees noted that the Fund’s performance was in the third Broadridge quartile for the 36 months ended May 31, 2017 and the bottom Broadridge quartile for the 12 months ended May 31, 2017. The Trustees noted the reasons for the Fund’s underperformance and the steps Janus Capital and Intech had taken or were taking to improve performance.
· For Janus Henderson U.S. Managed Volatility Fund, the Trustees noted that the Fund’s performance was in the second Broadridge quartile for the 36 months ended May 31, 2017 and the bottom Broadridge quartile for the 12 months ended May 31, 2017.
U.S. Equity Funds
· For Janus Henderson Large Cap Value Fund, the Trustees noted that the Fund’s performance was in the third Broadridge quartile for the 36 months ended May 31, 2017 and the bottom Broadridge quartile for the 12 months ended May 31, 2017. The Trustees noted the reasons for the Fund’s underperformance, while also noting that the Fund has a performance fee structure that results in lower management fees during periods of underperformance, and the steps Janus Capital and Perkins had taken or were taking to improve performance.
· For Janus Henderson Mid Cap Value Fund, the Trustees noted that the Fund’s performance was in the second Broadridge quartile for the 36 months ended May 31, 2017 and the second Broadridge quartile for the 12 months ended May 31, 2017.
· For Janus Henderson Select Value Fund, the Trustees noted that the Fund’s performance was in the first Broadridge quartile for the 36 months ended May 31, 2017 and the second Broadridge quartile for the 12 months ended May 31, 2017.
· For Janus Henderson Small Cap Value Fund, the Trustees noted that the Fund’s performance was in the first Broadridge quartile for the 36 months ended May 31, 2017 and the second Broadridge quartile for the 12 months ended May 31, 2017.
Janus Aspen Series
· For Janus Henderson Balanced Portfolio, the Trustees noted that the Fund’s performance was in the first Broadridge quartile for the 36 months ended May 31, 2017 and the first Broadridge quartile for the 12 months ended May 31, 2017.
· For Janus Henderson Enterprise Portfolio, the Trustees noted that the Fund’s performance was in the first Broadridge quartile for the 36 months ended May 31, 2017 and the second Broadridge quartile for the 12 months ended May 31, 2017.
36 | SEPTEMBER 30, 2018 |
Janus Henderson Asia Equity Fund
Additional Information (unaudited)
· For Janus Henderson Flexible Bond Portfolio, the Trustees noted that the Fund’s performance was in the bottom Broadridge quartile for the 36 months ended May 31, 2017 and the bottom Broadridge quartile for the 12 months ended May 31, 2017. The Trustees noted the reasons for the Fund’s underperformance and the steps Janus Capital had taken or was taking to improve performance.
· For Janus Henderson Forty Portfolio, the Trustees noted that the Fund’s performance was in the first Broadridge quartile for the 36 months ended May 31, 2017 and the third Broadridge quartile for the 12 months ended May 31, 2017.
· For Janus Henderson Global Allocation Portfolio – Moderate, the Trustees noted that the Fund’s performance was in the bottom Broadridge quartile for the 36 months ended May 31, 2017 and the second Broadridge quartile for the 12 months ended May 31, 2017. The Trustees noted the reasons for the Fund’s underperformance, the steps Janus Capital had taken or was taking to improve performance, and that the performance trend was improving.
· For Janus Henderson Global Research Portfolio, the Trustees noted that the Fund’s performance was in the third Broadridge quartile for the 36 months ended May 31, 2017 and the third Broadridge quartile for the 12 months ended May 31, 2017. The Trustees noted the reasons for the Fund’s underperformance, while also noting that the Fund has a performance fee structure that results in lower management fees during periods of underperformance, and the steps Janus Capital had taken or was taking to improve performance.
· For Janus Henderson Global Technology Portfolio, the Trustees noted that the Fund’s performance was in the second Broadridge quartile for the 36 months ended May 31, 2017 and the second Broadridge quartile for the 12 months ended May 31, 2017.
· For Janus Henderson Global Unconstrained Bond Portfolio, the Trustees noted that the Fund’s performance was in the bottom Broadridge quartile for the 12 months ended May 31, 2017. The Trustees noted the reasons for the Fund’s underperformance, the steps Janus Capital had taken or was taking to improve performance, and the Fund’s limited performance history.
· For Janus Henderson Mid Cap Value Portfolio, the Trustees noted that the Fund’s performance was in the third Broadridge quartile for the 36 months ended May 31, 2017 and the second Broadridge quartile for the 12 months ended May 31, 2017. The Trustees noted the reasons for the Fund’s underperformance, while also noting that the Fund has a performance fee structure that results in lower management fees during periods of underperformance, the steps Janus Capital and Perkins had taken or were taking to improve performance, and that the performance trend was improving.
· For Janus Henderson Overseas Portfolio, the Trustees noted that the Fund’s performance was in the bottom Broadridge quartile for the 36 months ended May 31, 2017 and the first Broadridge quartile for the 12 months ended May 31, 2017. The Trustees noted the reasons for the Fund’s underperformance, while also noting that the Fund has a performance fee structure that results in lower management fees during periods of underperformance, the steps Janus Capital had taken or was taking to improve performance, and that the performance trend was improving.
· For Janus Henderson Research Portfolio, the Trustees noted that the Fund’s performance was in the second Broadridge quartile for the 36 months ended May 31, 2017 and the third Broadridge quartile for the 12 months ended May 31, 2017.
· For Janus Henderson U.S. Low Volatility Portfolio, the Trustees noted that the Fund’s performance was in the first Broadridge quartile for the 36 months ended May 31, 2017 and the bottom Broadridge quartile for the 12 months ended May 31, 2017.
In consideration of each Fund’s performance, the Trustees concluded that, taking into account the factors relevant to performance, as well as other considerations, including steps taken to improve performance, the Fund’s performance warranted continuation of the Fund’s investment advisory and subadvisory agreement(s).
Costs of Services Provided
The Trustees examined information regarding the fees and expenses of each Fund in comparison to similar information for other comparable funds as provided by Broadridge, an independent data provider. They also reviewed an analysis of
Janus Investment Fund | 37 |
Janus Henderson Asia Equity Fund
Additional Information (unaudited)
that information provided by their independent fee consultant and noted that the rate of management (investment advisory and any administration, but excluding out-of-pocket costs) fees for many of the Funds, after applicable waivers, was below the average management fee rate of the respective peer group of funds selected by an independent data provider. The Trustees also examined information regarding the subadvisory fees charged for subadvisory services, as applicable, noting that all such fees were paid by Janus Capital out of its management fees collected from such Fund.
The independent fee consultant provided its belief that the management fees charged by Janus Capital to each of the Funds under the current investment advisory and administration agreements are reasonable in relation to the services provided by Janus Capital. The independent fee consultant found: (1) the total expenses and management fees of the Funds to be reasonable relative to other mutual funds; (2) total expenses, on average, were 10% below the average total expenses of their respective Broadridge Expense Group peers and 18% below the average total expenses for their Broadridge Expense Universes; (3) management fees for the Funds, on average, were 8% below the average management fees for their Expense Groups and 9% below the average for their Expense Universes; and (4) Fund expenses at the functional level for each asset and share class category were reasonable. The Trustees also considered the total expenses for each share class of each Fund compared to the average total expenses for its Broadridge Expense Group peers and to average total expenses for its Broadridge Expense Universe.
The independent fee consultant concluded that, based on its strategic review of expenses at the complex, category and individual fund level, Fund expenses were found to be reasonable relative to both Expense Group and Expense Universe benchmarks. Further, for certain Funds, the independent fee consultant also performed a systematic “focus list” analysis of expenses in the context of the performance or service delivered to each set of investors in each share class in each selected Fund. Based on this analysis, the independent fee consultant found that the combination of service quality/performance and expenses on these individual Funds and share classes were reasonable in light of performance trends, performance histories, and existence of performance fees, breakpoints, and expense waivers on such Funds.
The Trustees considered the methodology used by Janus Capital and each subadviser in determining compensation payable to portfolio managers, the competitive environment for investment management talent, and the competitive market for mutual funds in different distribution channels.
The Trustees also reviewed management fees charged by Janus Capital and each subadviser to comparable separate account clients and to comparable non-affiliated funds subadvised by Janus Capital or by a subadviser (for which Janus Capital or the subadviser provides only or primarily portfolio management services). Although in most instances subadvisory and separate account fee rates for various investment strategies were lower than management fee rates for Funds having a similar strategy, the Trustees considered that Janus Capital noted that, under the terms of the management agreements with the Funds, Janus Capital performs significant additional services for the Funds that it does not provide to those other clients, including administration services, oversight of the Funds’ other service providers, trustee support, regulatory compliance and numerous other services, and that, in serving the Funds, Janus Capital assumes many legal risks and other costs that it does not assume in servicing its other clients. Moreover, they noted that the independent fee consultant found that: (1) the management fees Janus Capital charges to the Funds are reasonable in relation to the management fees Janus Capital charges to its institutional clients and to the fees Janus Capital charges to funds subadvised by Janus Capital; (2) these institutional and subadvised accounts have different service and infrastructure needs; (3) Janus mutual fund investors enjoy reasonable fees relative to the fees charged to Janus institutional and subadvised fund investors; (4) in three of seven product categories, the Funds receive proportionally better pricing than the industry in relation to Janus institutional clients; and (5) in seven of eight strategies, Janus Capital has lower management fees than funds subadvised by Janus Capital’s portfolio managers.
The Trustees considered the fees for each Fund for its fiscal year ended in 2016, and noted the following with regard to each Fund’s total expenses, net of applicable fee waivers (the Fund’s “total expenses”):
Alternative Funds
· For Janus Henderson Diversified Alternatives Fund, the Trustees noted that, although the Fund’s total expenses exceeded the peer group average for one share class, overall the Fund’s total expenses were reasonable. The Trustees also noted that Janus Capital has contractually agreed to limit the Fund’s expenses.
· For Janus Henderson International Long/Short Equity Fund, the Trustees noted that, although the Fund’s total expenses exceeded the peer group average for one share class, overall the Fund’s total expenses were
38 | SEPTEMBER 30, 2018 |
Janus Henderson Asia Equity Fund
Additional Information (unaudited)
reasonable. The Trustees also noted that Janus Capital has contractually agreed to limit the Fund’s expenses effective June 5, 2017.
Asset Allocation Funds
· For Janus Henderson Global Allocation Fund – Conservative, the Trustees noted that, although the Fund’s total expenses exceeded the peer group average for certain share classes, overall the Fund’s total expenses were reasonable. The Trustees also noted that Janus Capital has contractually agreed to limit the Fund’s expenses, although this limit did not apply because the Fund’s total expenses were already below the applicable fee limit.
· For Janus Henderson Global Allocation Fund – Growth, the Trustees noted that the Fund’s total expenses were below the peer group average for all share classes.
· For Janus Henderson Global Allocation Fund – Moderate, the Trustees noted that, although the Fund’s total expenses exceeded the peer group average for certain share classes, overall the Fund’s total expenses were reasonable. The Trustees also noted that Janus Capital has contractually agreed to limit the Fund’s expenses.
Fixed-Income Funds
· For Janus Henderson Flexible Bond Fund, the Trustees noted that, although the Fund’s total expenses exceeded the peer group average for certain share classes, overall the Fund’s total expenses were reasonable. The Trustees also noted that Janus Capital has contractually agreed to limit the Fund’s expenses, although this limit did not apply because the Fund’s total expenses were already below the applicable fee limit.
· For Janus Henderson Global Bond Fund, the Trustees noted that, although the Fund’s total expenses exceeded the peer group average for certain share classes, overall the Fund’s total expenses were reasonable. The Trustees also noted that Janus Capital has contractually agreed to limit the Fund’s expenses.
· For Janus Henderson Global Unconstrained Bond Fund, the Trustees noted that the Fund’s performance was in the third Broadridge quartile for the 36 months ended May 31, 2017 and the bottom Broadridge quartile for the 12 months ended May 31, 2017. The Trustees noted the reasons for the Fund’s underperformance and the steps Janus Capital had taken or was taking to improve performance.
· For Janus Henderson High-Yield Fund, the Trustees noted that, although the Fund’s total expenses exceeded the peer group average for certain share classes, overall the Fund’s total expenses were reasonable. The Trustees also noted that Janus Capital has contractually agreed to limit the Fund’s expenses, although this limit did not apply because the Fund’s total expenses were already below the applicable fee limit.
· For Janus Henderson Multi-Sector Income Fund, the Trustees noted that, although the Fund’s total expenses exceeded the peer group average for one share class, overall the Fund’s total expenses were reasonable. The Trustees also noted that Janus Capital has contractually agreed to limit the Fund’s expenses.
· For Janus Henderson Real Return Fund, the Trustees noted that, although the Fund’s total expenses exceeded the peer group average for certain share classes, overall the Fund’s total expenses were reasonable. The Trustees also noted that Janus Capital has contractually agreed to limit the Fund’s expenses.
· For Janus Henderson Short-Term Bond Fund, the Trustees noted that, although the Fund’s total expenses exceeded the peer group average for certain share classes, overall the Fund’s total expenses were reasonable. The Trustees also noted that Janus Capital has contractually agreed to waive 11 basis points of management fees effective February 1, 2018 and also has contractually agreed to limit the Fund’s expenses.
· For Janus Henderson Strategic Income Fund, the Trustees noted that, although the Fund’s total expenses exceeded the peer group average for one share class, overall the Fund’s total expenses were reasonable. The Trustees also noted that Janus Capital has contractually agreed to limit the Fund’s expenses effective June 5, 2017.
Global and International Equity Funds
· For Janus Henderson Asia Equity Fund, the Trustees noted that, although the Fund’s total expenses exceeded the peer group average for certain share classes, overall the Fund’s total expenses were reasonable. The Trustees also noted that Janus Capital has contractually agreed to limit the Fund’s expenses.
Janus Investment Fund | 39 |
Janus Henderson Asia Equity Fund
Additional Information (unaudited)
· For Janus Henderson Emerging Markets Fund, the Trustees noted that, although the Fund’s total expenses exceeded the peer group average for one share class, overall the Fund’s total expenses were reasonable. The Trustees also noted that Janus Capital has contractually agreed to limit the Fund’s expenses effective June 5, 2017.
· For Janus Henderson European Focus Fund, the Trustees noted that, although the Fund’s total expenses exceeded the peer group average for one share class, overall the Fund’s total expenses were reasonable. The Trustees also noted that Janus Capital has contractually agreed to limit the Fund’s expenses effective June 5, 2017.
· For Janus Henderson Global Equity Income Fund, the Trustees noted that the Fund’s total expenses were below the peer group average for all share classes.
· For Janus Henderson Global Life Sciences Fund, the Trustees noted that the Fund’s total expenses were below the peer group average for all share classes.
· For Janus Henderson Global Real Estate Fund, the Trustees noted that, although the Fund’s total expenses exceeded the peer group average one share class, overall the Fund’s total expenses were reasonable. The Trustees also noted that Janus Capital has contractually agreed to limit the Fund’s expenses, although this limit did not apply because the Fund’s total expenses were already below the applicable fee limit.
· For Janus Henderson Global Research Fund, the Trustees noted that the Fund’s total expenses were below the peer group average for all share classes.
· For Janus Henderson Global Select Fund, the Trustees noted that, although the Fund’s total expenses exceeded the peer group average for one share class, overall the Fund’s total expenses were reasonable. The Trustees also noted that Janus Capital has contractually agreed to limit the Fund’s expenses, although this limit did not apply because the Fund’s total expenses were already below the applicable fee limit.
· For Janus Henderson Global Technology Fund, the Trustees noted that the Fund’s total expenses were below the peer group average for all share classes.
· For Janus Henderson Global Value Fund, the Trustees noted that the Fund’s total expenses were below the peer group average for all share classes.
· For Janus Henderson International Opportunities Fund, the Trustees noted that, although the Fund’s total expenses exceeded the peer group average for certain share classes, overall the Fund’s total expenses were reasonable. The Trustees also noted that Janus Capital has contractually agreed to limit the Fund’s expenses effective June 5, 2017.
· For Janus Henderson International Small Cap Fund, the Trustees noted that, although the Fund’s total expenses exceeded the peer group average for one share class, overall the Fund’s total expenses were reasonable. The Trustees also noted that Janus Capital has contractually agreed to limit the Fund’s expenses effective June 5, 2017.
· For Janus Henderson International Value Fund, the Trustees noted that, although the Fund’s total expenses exceeded the peer group average for one share class, overall the Fund’s total expenses were reasonable. The Trustees also noted that Janus Capital has contractually agreed to limit the Fund’s expenses.
· For Janus Henderson Overseas Fund, the Trustees noted that the Fund’s total expenses were below the peer group average for all share classes.
Money Market Funds
· For Janus Henderson Government Money Market Fund, the Trustees noted that the Fund’s total expenses were below the peer group average for both share classes. In addition, the Trustees considered that Janus Capital voluntarily waives one-half of its advisory fee and other expenses in order to maintain a positive yield.
· For Janus Henderson Money Market Fund, the Trustees noted that the Fund’s total expenses were below the peer group average for both share classes. In addition, the Trustees considered that Janus Capital voluntarily waives one-half of its advisory fee and other expenses in order to maintain a positive yield.
40 | SEPTEMBER 30, 2018 |
Janus Henderson Asia Equity Fund
Additional Information (unaudited)
Multi-Asset Funds
· For Janus Henderson Adaptive Global Allocation Fund, the Trustees noted that, although the Fund’s total expenses exceeded the peer group average for one share class, overall the Fund’s total expenses were reasonable. The Trustees also noted that Janus Capital has contractually agreed to limit the Fund’s expenses.
· For Janus Henderson All Asset Fund, the Trustees noted that, although the Fund’s total expenses exceeded the peer group average for one share class, overall the Fund’s total expenses were reasonable. The Trustees also noted that Janus Capital has contractually agreed to limit the Fund’s total expenses effective June 5, 2017.
· For Janus Henderson Dividend & Income Builder Fund, the Trustees noted that, although the Fund’s total expenses exceeded the peer group average for certain share classes, overall the Fund’s total expenses were reasonable. The Trustees also noted that Janus Capital has contractually agreed to limit the Fund’s expenses effective June 5, 2017.
· For Janus Henderson Value Plus Income Fund, the Trustees noted that the Fund’s total expenses were below the peer group average for all share classes.
Multi-Asset U.S. Equity Funds
· For Janus Henderson Balanced Fund, the Trustees noted that, although the Fund’s total expenses exceeded the peer group average for certain share classes, overall the Fund’s total expenses were reasonable. The Trustees also noted that Janus Capital has contractually agreed to limit the Fund’s expenses, although this limit did not apply because the Fund’s total expenses were already below the applicable fee limit.
· For Janus Henderson Contrarian Fund, the Trustees noted that, although the Fund’s total expenses exceeded the peer group average for one share class, overall the Fund’s total expenses were reasonable. The Trustees also noted that Janus Capital has contractually agreed to limit the Fund’s expenses, although this limit did not apply because the Fund’s total expenses were already below the applicable fee limit.
· For Janus Henderson Enterprise Fund, the Trustees noted that, although the Fund’s total expenses exceeded the peer group average for certain share classes, overall the Fund’s total expenses were reasonable. The Trustees also noted that Janus Capital has contractually agreed to limit the Fund’s expenses, although this limit did not apply because the Fund’s total expenses were already below the applicable fee limit.
· For Janus Henderson Forty Fund, the Trustees noted that, although the Fund’s total expenses exceeded the peer group average for certain share classes, overall the Fund’s total expenses were reasonable. The Trustees also noted that Janus Capital has contractually agreed to limit the Fund’s expenses, although this limit did not apply because the Fund’s total expenses were already below the applicable fee limit.
· For Janus Henderson Growth and Income Fund, the Trustees noted that, although the Fund’s total expenses exceeded the peer group average for certain share classes, overall the Fund’s total expenses were reasonable. The Trustees also noted that Janus Capital has contractually agreed to limit the Fund’s expenses, although this limit did not apply because the Fund’s total expenses were already below the applicable fee limit.
· For Janus Henderson Research Fund, the Trustees noted that, although the Fund’s total expenses were equal to or exceeded the peer group average for certain share classes, overall the Fund’s total expenses were reasonable. The Trustees also noted that Janus Capital has contractually agreed to limit the Fund’s expenses effective February 1, 2017.
· For Janus Henderson Triton Fund, the Trustees noted that the Fund’s total expenses were below the peer group average for all share classes.
· For Janus Henderson U.S. Growth Opportunities Fund, the Trustees noted that, although the Fund’s total expenses exceeded the peer group average for one share class, overall the Fund’s total expenses were reasonable. The Trustees also noted that Janus Capital has contractually agreed to limit the Fund’s expenses effective June 5, 2017.
· For Janus Henderson Venture Fund, the Trustees noted that the Fund’s total expenses were below the peer group average for all share classes.
Janus Investment Fund | 41 |
Janus Henderson Asia Equity Fund
Additional Information (unaudited)
Quantitative Equity Funds
· For Janus Henderson Emerging Markets Managed Volatility Fund, the Trustees noted that, although the Fund’s total expenses exceeded the peer group average for certain share classes, overall the Fund’s total expenses were reasonable. The Trustees also noted that Janus Capital has contractually agreed to limit the Fund’s expenses.
· For Janus Henderson Global Income Managed Volatility Fund, the Trustees noted that the Fund’s total expenses were below the peer group average for all share classes.
· For Janus Henderson International Managed Volatility Fund, the Trustees noted that, although the Fund’s total expenses exceeded the peer group average for one share class, overall the Fund’s total expenses were reasonable. The Trustees also noted that Janus Capital has contractually agreed to limit the Fund’s expenses.
· For Janus Henderson U.S. Managed Volatility Fund, the Trustees noted that, although the Fund’s total expenses exceeded the peer group average for one share class, overall the Fund’s total expenses were reasonable. The Trustees also noted that Janus Capital has contractually agreed to limit the Fund’s expenses, although this limit did not apply because the Fund’s total expenses were already below the applicable fee limit.
U.S. Equity Funds
· For Janus Henderson Large Cap Value Fund, the Trustees noted that the Fund’s total expenses were below the peer group average for all share classes.
· For Janus Henderson Mid Cap Value Fund, the Trustees noted that the Fund’s total expenses were below the peer group average for all share classes.
· For Janus Henderson Select Value Fund, the Trustees noted that the Fund’s total expenses were below the peer group averages for all share classes.
· For Janus Henderson Small Cap Value Fund, the Trustees noted that, although the Fund’s total expenses exceeded the peer group average for certain share classes, overall the Fund’s total expenses were reasonable. The Trustees also noted that Janus Capital has contractually agreed to limit the Fund’s expenses, although this limit did not apply because the Fund’s total expenses were already below the applicable fee limit.
Janus Aspen Series
· For Janus Henderson Balanced Portfolio, the Trustees noted that, although the Fund’s total expenses exceeded the peer group average for one share class, overall the Fund’s total expenses were reasonable.
· For Janus Henderson Enterprise Portfolio, the Trustees noted that, although the Fund’s total expenses exceeded the peer group average for one share class, overall the Fund’s total expenses were reasonable.
· For Janus Henderson Flexible Bond Portfolio, the Trustees noted that, although the Fund’s total expenses exceeded the peer group average for one share class, overall the Fund’s total expenses were reasonable. The Trustees also noted that Janus Capital has contractually agreed to limit the Fund’s expenses, although this limit did not apply because the Fund’s total expenses were already below the applicable fee limit.
· For Janus Henderson Forty Portfolio, the Trustees noted that, although the Fund’s total expenses exceeded the peer group average for one share class, overall the Fund’s total expenses were reasonable.
· For Janus Henderson Global Allocation Portfolio - Moderate, the Trustees noted that, although the Fund’s total expenses exceeded the peer group average for one share class, overall the Fund’s total expenses were reasonable. The Trustees also noted that Janus Capital has contractually agreed to limit the Fund’s expenses.
· For Janus Henderson Global Research Portfolio, the Trustees noted that the Fund’s total expenses were below the peer group average for both share classes.
· For Janus Henderson Global Technology Portfolio, the Trustees noted that the Fund’s total expenses were below the peer group average for both share classes.
· For Janus Henderson Global Unconstrained Bond Portfolio, the Trustees noted that, although the Fund’s total expenses exceeded the peer group average for one share class, overall the Fund’s total expenses were reasonable. The Trustees also noted that Janus Capital has contractually agreed to limit the Fund’s expenses.
42 | SEPTEMBER 30, 2018 |
Janus Henderson Asia Equity Fund
Additional Information (unaudited)
· For Janus Henderson Mid Cap Value Portfolio, the Trustees noted that the Fund’s total expenses were below the peer group average for both share classes.
· For Janus Henderson Overseas Portfolio, the Trustees noted that the Fund’s total expenses were below the peer group average for both share classes.
· For Janus Henderson Research Portfolio, the Trustees noted that the Fund’s total expenses were below the peer group average for both share classes.
· For Janus Henderson U.S. Low Volatility Portfolio, the Trustees noted that the Fund’s total expenses were below the peer group average for its sole share class.
The Trustees reviewed information on the overall profitability to Janus Capital and its affiliates of their relationship with the Funds, and considered profitability data of other fund managers. The Trustees also considered the financial information, estimated profitability and corporate structure of Janus Capital’s parent company before and after the Transaction. The Trustees recognized that profitability comparisons among fund managers are difficult because of the variation in the type of comparative information that is publicly available, and the profitability of any fund manager is affected by numerous factors, including the organizational structure of the particular fund manager, the types of funds and other accounts it manages, possible other lines of business, the methodology for allocating expenses, and the fund manager’s capital structure and cost of capital. The Trustees also noted that the Trustees’ independent fee consultant reviewed the overall profitability of Janus Capital’s parent company prior to the Transaction, and the independent fee consultant found that, while assessing the reasonableness of Fund expenses in light of such profits was dependent on comparisons with other publicly-traded mutual fund advisers, and that these comparisons were limited in accuracy by differences in complex size, business mix, institutional account orientation and other factors, after accepting these limitations, the level of profit earned by Janus Capital’s parent company was reasonable. In this regard, the independent consultant concluded that the profitability of Janus Capital’s parent company did not show excess nor did it show any insufficiency that could limit the ability to invest the resources needed to drive strong future investment performance on behalf of the Funds.
Additionally, the Trustees considered the estimated profitability to Janus Capital from the investment management services it provided to each Fund. The Trustees also considered such estimated profitability taking into account the impact of the Transaction on Janus Capital’s expense structure on a pro forma basis. In their review, the Trustees considered whether Janus Capital and each subadviser receive adequate incentives and resources to manage the Funds effectively. In reviewing profitability, the Trustees noted that the estimated profitability for an individual Fund is necessarily a product of the allocation methodology utilized by Janus Capital to allocate its expenses as part of the estimated profitability calculation. In this regard, the Trustees noted that the independent fee consultant concluded that (1) the expense allocation methodology utilized by Janus Capital was reasonable and (2) the estimated profitability to Janus Capital from the investment management services it provided to each Fund was reasonable, including after taking into account the impact of the Transaction on Janus Capital’s expense structure on a pro forma basis. The Trustees also considered that the estimated profitability for an individual Fund was influenced by a number of factors, including not only the allocation methodology selected, but also the presence of fee waivers and expense caps, and whether the Fund’s investment management agreement contained breakpoints or a performance fee component. The Trustees determined, after taking into account these factors, among others, that Janus Capital’s estimated profitability with respect to each Fund was not unreasonable in relation to the services provided, and that the variation in the range of such estimated profitability among the Funds was not a material factor in the Board’s approval of the reasonableness of any Fund’s investment management fees.
The Trustees concluded that the management fees payable by each Fund to Janus Capital and its affiliates, as well as the fees paid by Janus Capital to the subadvisers of subadvised Funds, were reasonable in relation to the nature, extent, and quality of the services provided, taking into account the fees charged by other advisers for managing comparable mutual funds with similar strategies, the fees Janus Capital and the subadvisers charge to other clients, and, as applicable, the impact of fund performance on management fees payable by the Funds. The Trustees also concluded that each Fund’s total expenses were reasonable, taking into account the size of the Fund, the quality of services provided by Janus Capital and any subadviser, the investment performance of the Fund, and any expense limitations agreed to or provided by Janus Capital.
Janus Investment Fund | 43 |
Janus Henderson Asia Equity Fund
Additional Information (unaudited)
Economies of Scale
The Trustees considered information about the potential for Janus Capital to realize economies of scale as the assets of the Funds increase. They noted their independent fee consultant’s analysis of economies of scale in prior years. They also noted that, although many Funds pay advisory fees at a base fixed rate as a percentage of net assets, without any breakpoints or performance fees, their independent fee consultant concluded that 86% of these Funds’ share classes have contractual management fees (gross of waivers) below their Broadridge expense group averages. They also noted that for those Funds whose expenses are being reduced by the contractual expense limitations of Janus Capital, Janus Capital is subsidizing certain of these Funds because they have not reached adequate scale. Moreover, as the assets of some of the Funds have declined in the past few years, certain Funds have benefited from having advisory fee rates that have remained constant rather than increasing as assets declined. In addition, performance fee structures have been implemented for various Funds that have caused the effective rate of advisory fees payable by such a Fund to vary depending on the investment performance of the Fund relative to its benchmark index over the measurement period; and a few Funds have fee schedules with breakpoints and reduced fee rates above certain asset levels. The Trustees also noted that the Funds share directly in economies of scale through the lower charges of third-party service providers that are based in part on the combined scale of all of the Funds. Based on all of the information they reviewed, including past research and analysis conducted by the Trustees’ independent fee consultant, the Trustees concluded that the current fee structure of each Fund was reasonable and that the current rates of fees do reflect a sharing between Janus Capital and the Fund of any economies of scale that may be present at the current asset level of the Fund.
The independent fee consultant concluded that, given the limitations of various analytical approaches to economies of scale it had considered in prior years, and their conflicting results, it is difficult to analytically confirm or deny the existence of economies of scale in the Janus complex. The independent consultant concluded that (1) to the extent there were economies of scale at Janus Capital, Janus Capital’s general strategy of setting fixed management fees below peers appeared to share any such economies with investors even on smaller Funds which have not yet achieved those economies and (2) by setting lower fixed fees from the start on these Funds, Janus Capital appeared to be investing to increase the likelihood that these Funds will grow to a level to achieve any scale economies that may exist. Further, the independent fee consultant provided its belief that Fund investors are well-served by the fee levels and performance fee structures in place on the Funds in light of any economies of scale that may be present at Janus Capital.
Other Benefits to Janus Capital
The Trustees also considered benefits that accrue to Janus Capital and its affiliates and subadvisers to the Funds from their relationships with the Funds. They recognized that two affiliates of Janus Capital separately serve the Funds as transfer agent and distributor, respectively, and the transfer agent receives compensation directly from the non-money market funds for services provided. The Trustees also considered Janus Capital’s past and proposed use of commissions paid by the Funds on portfolio brokerage transactions to obtain proprietary and third-party research products and services benefiting the Fund and/or other clients of Janus Capital and/or Janus Capital, and/or a subadviser to a Fund. The Trustees concluded that Janus Capital’s and the subadvisers’ use of these types of client commission arrangements to obtain proprietary and third-party research products and services was consistent with regulatory requirements and guidelines and was likely to benefit each Fund. The Trustees also concluded that, other than the services provided by Janus Capital and its affiliates and subadvisers pursuant to the agreements and the fees to be paid by each Fund therefor, the Funds and Janus Capital and the subadvisers may potentially benefit from their relationship with each other in other ways. They concluded that Janus Capital and/or the subadvisers benefits from the receipt of research products and services acquired through commissions paid on portfolio transactions of the Funds and that the Funds benefit from Janus Capital’s and/or the subadvisers’ receipt of those products and services as well as research products and services acquired through commissions paid by other clients of Janus Capital and/or other clients of the subadvisers. They further concluded that the success of any Fund could attract other business to Janus Capital, the subadvisers or other Janus funds, and that the success of Janus Capital and the subadvisers could enhance Janus Capital’s and the subadvisers’ ability to serve the Funds.
44 | SEPTEMBER 30, 2018 |
Janus Henderson Asia Equity Fund
Useful Information About Your Fund Report (unaudited)
The Management Commentary in this report includes valuable insight as well as statistical information to help you understand how your Fund’s performance and characteristics stack up against those of comparable indices.
If the Fund invests in foreign securities, this report may include information about country exposure. Country exposure is based primarily on the country of risk. A company may be allocated to a country based on other factors such as location of the company’s principal office, the location of the principal trading market for the company’s securities, or the country where a majority of the company’s revenues are derived.
Please keep in mind that the opinions expressed in the Management Commentary are just that: opinions. They are a reflection based on best judgment at the time this report was compiled, which was September 30, 2018. As the investing environment changes, so could opinions. These views are unique and are not necessarily shared by fellow employees or by Janus Henderson in general.
Performance Overviews
Performance overview graphs compare the performance of a hypothetical $10,000 investment in the Fund with one or more widely used market indices. When comparing the performance of the Fund with an index, keep in mind that market indices are not available for investment and do not reflect deduction of expenses.
Average annual total returns are quoted for a Fund with more than one year of performance history. Average annual total return is calculated by taking the growth or decline in value of an investment over a period of time, including reinvestment of dividends and distributions, then calculating the annual compounded percentage rate that would have produced the same result had the rate of growth been constant throughout the period. Average annual total return does not reflect the deduction of taxes that a shareholder would pay on Fund distributions or redemptions of Fund shares.
Cumulative total returns are quoted for a Fund with less than one year of performance history. Cumulative total return is the growth or decline in value of an investment over time, independent of the period of time involved. Cumulative total return does not reflect the deduction of taxes that a shareholder would pay on Fund distributions or redemptions of Fund shares.
Pursuant to federal securities rules, expense ratios shown in the performance chart reflect subsidized (if applicable) and unsubsidized ratios. The total annual fund operating expenses ratio is gross of any fee waivers, reflecting the Fund’s unsubsidized expense ratio. The net annual fund operating expenses ratio (if applicable) includes contractual waivers of Janus Capital and reflects the Fund’s subsidized expense ratio. Ratios may be higher or lower than those shown in the “Financial Highlights” in this report.
Schedule of Investments
Following the performance overview section is the Fund’s Schedule of Investments. This schedule reports the types of securities held in the Fund on the last day of the reporting period. Securities are usually listed by type (common stock, corporate bonds, U.S. Government obligations, etc.) and by industry classification (banking, communications, insurance, etc.). Holdings are subject to change without notice.
The value of each security is quoted as of the last day of the reporting period. The value of securities denominated in foreign currencies is converted into U.S. dollars.
If the Fund invests in foreign securities, it will also provide a summary of investments by country. This summary reports the Fund exposure to different countries by providing the percentage of securities invested in each country. The country of each security represents the country of risk. The Fund’s Schedule of Investments relies upon the industry group and country classifications published by Barclays and/or MSCI Inc.
Tables listing details of individual forward currency contracts, futures, written options, swaptions, and swaps follow the Fund’s Schedule of Investments (if applicable).
Statement of Assets and Liabilities
This statement is often referred to as the “balance sheet.” It lists the assets and liabilities of the Fund on the last day of the reporting period.
Janus Investment Fund | 45 |
Janus Henderson Asia Equity Fund
Useful Information About Your Fund Report (unaudited)
The Fund’s assets are calculated by adding the value of the securities owned, the receivable for securities sold but not yet settled, the receivable for dividends declared but not yet received on securities owned, and the receivable for Fund shares sold to investors but not yet settled. The Fund’s liabilities include payables for securities purchased but not yet settled, Fund shares redeemed but not yet paid, and expenses owed but not yet paid. Additionally, there may be other assets and liabilities such as unrealized gain or loss on forward currency contracts.
The section entitled “Net Assets Consist of” breaks down the components of the Fund’s net assets. Because the Fund must distribute substantially all earnings, you will notice that a significant portion of net assets is shareholder capital.
The last section of this statement reports the net asset value (“NAV”) per share on the last day of the reporting period. The NAV is calculated by dividing the Fund’s net assets for each share class (assets minus liabilities) by the number of shares outstanding.
Statement of Operations
This statement details the Fund’s income, expenses, realized gains and losses on securities and currency transactions, and changes in unrealized appreciation or depreciation of Fund holdings.
The first section in this statement, entitled “Investment Income,” reports the dividends earned from securities and interest earned from interest-bearing securities in the Fund.
The next section reports the expenses incurred by the Fund, including the advisory fee paid to the investment adviser, transfer agent fees and expenses, and printing and postage for mailing statements, financial reports and prospectuses. Expense offsets and expense reimbursements, if any, are also shown.
The last section lists the amounts of realized gains or losses from investment and foreign currency transactions, and changes in unrealized appreciation or depreciation of investments and foreign currency-denominated assets and liabilities. The Fund will realize a gain (or loss) when it sells its position in a particular security. A change in unrealized gain (or loss) refers to the change in net appreciation or depreciation of the Fund during the reporting period. “Net Realized and Unrealized Gain/(Loss) on Investments” is affected both by changes in the market value of Fund holdings and by gains (or losses) realized during the reporting period.
Statements of Changes in Net Assets
These statements report the increase or decrease in the Fund’s net assets during the reporting period. Changes in the Fund’s net assets are attributable to investment operations, dividends and distributions to investors, and capital share transactions. This is important to investors because it shows exactly what caused the Fund’s net asset size to change during the period.
The first section summarizes the information from the Statement of Operations regarding changes in net assets due to the Fund’s investment operations. The Fund’s net assets may also change as a result of dividend and capital gains distributions to investors. If investors receive their dividends and/or distributions in cash, money is taken out of the Fund to pay the dividend and/or distribution. If investors reinvest their dividends and/or distributions, the Fund’s net assets will not be affected. If you compare the Fund’s “Net Decrease from Dividends and Distributions” to “Reinvested Dividends and Distributions,” you will notice that dividends and distributions have little effect on the Fund’s net assets. This is because the majority of the Fund’s investors reinvest their dividends and/or distributions.
The reinvestment of dividends and distributions is included under “Capital Share Transactions.” “Capital Shares” refers to the money investors contribute to the Fund through purchases or withdrawals via redemptions. The Fund’s net assets will increase and decrease in value as investors purchase and redeem shares from the Fund.
Financial Highlights
This schedule provides a per-share breakdown of the components that affect the Fund’s NAV for current and past reporting periods as well as total return, asset size, ratios, and portfolio turnover rate.
The first line in the table reflects the NAV per share at the beginning of the reporting period. The next line reports the net investment income/(loss) per share. Following is the per share total of net gains/(losses), realized and unrealized. Per share dividends and distributions to investors are then subtracted to arrive at the NAV per share at the end of the period. The next line reflects the total return for the period. The total return may include adjustments in accordance with generally accepted accounting principles required at the period end for financial reporting purposes. As a result, the
46 | SEPTEMBER 30, 2018 |
Janus Henderson Asia Equity Fund
Useful Information About Your Fund Report (unaudited)
total return may differ from the total return reflected for individual shareholder transactions. Also included are ratios of expenses and net investment income to average net assets.
The Fund’s expenses may be reduced through expense offsets and expense reimbursements. The ratios shown reflect expenses before and after any such offsets and reimbursements.
The ratio of net investment income/(loss) summarizes the income earned less expenses, divided by the average net assets of the Fund during the reporting period. Do not confuse this ratio with the Fund’s yield. The net investment income ratio is not a true measure of the Fund’s yield because it does not take into account the dividends distributed to the Fund’s investors.
The next figure is the portfolio turnover rate, which measures the buying and selling activity in the Fund. Portfolio turnover is affected by market conditions, changes in the asset size of the Fund, fluctuating volume of shareholder purchase and redemption orders, the nature of the Fund’s investments, and the investment style and/or outlook of the portfolio manager(s) and/or investment personnel. A 100% rate implies that an amount equal to the value of the entire portfolio was replaced once during the fiscal year; a 50% rate means that an amount equal to the value of half the portfolio is traded in a year; and a 200% rate means that an amount equal to the value of the entire portfolio is traded every six months.
Janus Investment Fund | 47 |
Janus Henderson Asia Equity Fund
Designation Requirements (unaudited)
For federal income tax purposes, the Fund designated the following for the year ended September 30, 2018:
| |
Capital Gain Distributions | $686,656 |
Foreign Taxes Paid | $85,590 |
Foreign Source Income | $794,494 |
Dividends Received Deduction Percentage | 0% |
Qualified Dividend Income Percentage | 71% |
48 | SEPTEMBER 30, 2018 |
Janus Henderson Asia Equity Fund
Trustees and Officers (unaudited)
The Fund’s Statement of Additional Information includes additional information about the Trustees and officers and is available, without charge, by calling 1-877-335-2687.
The following are the Trustees and officers of the Trust, together with a brief description of their principal occupations during the last five years (principal occupations for certain Trustees may include periods over five years).
Each Trustee has served in that capacity since he or she was originally elected or appointed. The Trustees do not serve a specified term of office. Each Trustee will hold office until the termination of the Trust or his or her earlier death, resignation, retirement, incapacity, or removal. Under the Fund’s Governance Procedures and Guidelines, the policy is for Trustees to retire no later than the end of the calendar year in which the Trustee turns 75. The Trustees review the Fund’s Governance Procedures and Guidelines from time to time and may make changes they deem appropriate. The Fund’s Nominating and Governance Committee will consider nominees for the position of Trustee recommended by shareholders. Shareholders may submit the name of a candidate for consideration by the Committee by submitting their recommendations to the Trust’s Secretary. Each Trustee is currently a Trustee of one other registered investment company advised by Janus Capital: Janus Aspen Series. Collectively, these two registered investment companies consist of 60 series or funds.
The Trust’s officers are elected annually by the Trustees for a one-year term. Certain officers also serve as officers of Janus Aspen Series. Certain officers of the Fund may also be officers and/or directors of Janus Capital. Except as otherwise disclosed, Fund officers receive no compensation from the Fund, except for the Fund’s Chief Compliance Officer, as authorized by the Trustees.
Janus Investment Fund | 49 |
Janus Henderson Asia Equity Fund
Trustees and Officers (unaudited)
TRUSTEES | ||||||
Name, Address, and Age | Positions Held with the Trust | Length of Time Served | Principal Occupations During the Past Five Years | Number of Portfolios/Funds in Fund Complex Overseen by Trustee | Other Directorships Held by Trustee During the Past Five Years | |
Independent Trustees | ||||||
William F. McCalpin | Chairman | 1/08-Present | Managing Partner, Impact Investments, Athena Capital Advisors LLC (independent registered investment advisor) (since 2016) and Managing Director, Holos Consulting LLC (provides consulting services to foundations and other nonprofit organizations). Formerly, Chief Executive Officer, Imprint Capital (impact investment firm) (2013-2015) and Executive Vice President and Chief Operating Officer of The Rockefeller Brothers Fund (a private family foundation) (1998-2006). | 60 | Director of Mutual Fund Directors Forum (a non-profit organization serving independent directors of U.S. mutual funds), Chairman of the Board and Trustee of The Investment Fund for Foundations Investment Program (TIP) (consisting of 2 funds), and Director of the F.B. Heron Foundation (a private grantmaking foundation). | |
50 | SEPTEMBER 30, 2018 |
Janus Henderson Asia Equity Fund
Trustees and Officers (unaudited)
TRUSTEES | ||||||
Name, Address, and Age | Positions Held with the Trust | Length of Time Served | Principal Occupations During the Past Five Years | Number of Portfolios/Funds in Fund Complex Overseen by Trustee | Other Directorships Held by Trustee During the Past Five Years | |
Independent Trustees | ||||||
Alan A. Brown | Trustee | 1/13-Present | Executive Vice President, Institutional Markets, of Black Creek Group (private equity real estate investment management firm) (since 2012). Formerly, Executive Vice President and Co-Head, Global Private Client Group (2007-2010), Executive Vice President, Mutual Funds (2005-2007), and Chief Marketing Officer (2001-2005) of Nuveen Investments, Inc. (asset management). | 60 | Director of WTTW (PBS affiliate) (since 2003). Formerly, Director of MotiveQuest LLC (strategic social market research company) (2003-2016); Director of Nuveen Global Investors LLC (2007-2011); Director of Communities in Schools (2004-2010); and Director of Mutual Fund Education Alliance (until 2010). | |
Janus Investment Fund | 51 |
Janus Henderson Asia Equity Fund
Trustees and Officers (unaudited)
TRUSTEES | ||||||
Name, Address, and Age | Positions Held with the Trust | Length of Time Served | Principal Occupations During the Past Five Years | Number of Portfolios/Funds in Fund Complex Overseen by Trustee | Other Directorships Held by Trustee During the Past Five Years | |
Independent Trustees | ||||||
William D. Cvengros | Trustee | 1/11-Present | Managing Member and Chief Executive Officer of SJC Capital, LLC (a personal investment company and consulting firm) (since 2002). Formerly, Venture Partner for The Edgewater Funds (a middle market private equity firm) (2002-2004); Chief Executive Officer and President of PIMCO Advisors Holdings L.P. (a publicly traded investment management firm) (1994-2000); and Chief Investment Officer of Pacific Life Insurance Company (a mutual life insurance and annuity company) (1987-1994). | 60 | Advisory Board Member, Innovate Partners Emerging Growth and Equity Fund I (early stage venture capital fund) (since 2014) and Managing Trustee of National Retirement Partners Liquidating Trust (since 2013). Formerly, Chairman, National Retirement Partners, Inc. (formerly a network of advisors to 401(k) plans) (2005-2013); Director of Prospect Acquisition Corp. (a special purpose acquisition corporation) (2007-2009); Director of RemedyTemp, Inc. (temporary help services company) (1996-2006); and Trustee of PIMCO Funds Multi-Manager Series (1990-2000) and Pacific Life Variable Life & Annuity Trusts (1987-1994). | |
52 | SEPTEMBER 30, 2018 |
Janus Henderson Asia Equity Fund
Trustees and Officers (unaudited)
TRUSTEES | ||||||
Name, Address, and Age | Positions Held with the Trust | Length of Time Served | Principal Occupations During the Past Five Years | Number of Portfolios/Funds in Fund Complex Overseen by Trustee | Other Directorships Held by Trustee During the Past Five Years | |
Independent Trustees | ||||||
Raudline Etienne | Trustee | 6/16-Present | Founder, Daraja Capital (advisory and investment firm) (since 2016), and Senior Advisor, Albright Stonebridge Group LLC (global strategy firm) (since 2016). Formerly, Senior Vice President (2011-2015), Albright Stonebridge Group LLC; and Deputy Comptroller and Chief Investment Officer, New York State Common Retirement Fund (public pension fund) (2008-2011). | 60 | Director of Brightwood Capital Advisors, LLC (since 2014). | |
Janus Investment Fund | 53 |
Janus Henderson Asia Equity Fund
Trustees and Officers (unaudited)
TRUSTEES | ||||||
Name, Address, and Age | Positions Held with the Trust | Length of Time Served | Principal Occupations During the Past Five Years | Number of Portfolios/Funds in Fund Complex Overseen by Trustee | Other Directorships Held by Trustee During the Past Five Years | |
Independent Trustees | ||||||
Gary A. Poliner | Trustee | 6/16-Present | Retired. Formerly, President (2010-2013) of Northwestern Mutual Life Insurance Company. | 60 | Director of MGIC Investment Corporation (private mortgage insurance) (since 2013) and West Bend Mutual Insurance Company (property/casualty insurance) (since 2013). Formerly, Trustee of Northwestern Mutual Life Insurance Company (2010-2013); and Director of Frank Russell Company (global asset management firm) (2008-2013). | |
54 | SEPTEMBER 30, 2018 |
Janus Henderson Asia Equity Fund
Trustees and Officers (unaudited)
TRUSTEES | ||||||
Name, Address, and Age | Positions Held with the Trust | Length of Time Served | Principal Occupations During the Past Five Years | Number of Portfolios/Funds in Fund Complex Overseen by Trustee | Other Directorships Held by Trustee During the Past Five Years | |
Independent Trustees | ||||||
James T. Rothe | Trustee | 1/97-Present | Professor Emeritus of Business of the University of Colorado, Colorado Springs, CO (since 2004). Formerly, Co-founder and Managing Director of Roaring Fork Capital SBIC, L.P. (SBA SBIC fund focusing on private investment in public equity firms) (2004-2014), Professor of Business of the University of Colorado (2002-2004), and Distinguished Visiting Professor of Business (2001-2002) of Thunderbird (American Graduate School of International Management), Glendale, AZ. | 60 | Formerly, Director of Red Robin Gourmet Burgers, Inc. (RRGB) (2004-2014). | |
Janus Investment Fund | 55 |
Janus Henderson Asia Equity Fund
Trustees and Officers (unaudited)
TRUSTEES | ||||||
Name, Address, and Age | Positions Held with the Trust | Length of Time Served | Principal Occupations During the Past Five Years | Number of Portfolios/Funds in Fund Complex Overseen by Trustee | Other Directorships Held by Trustee During the Past Five Years | |
Independent Trustees | ||||||
William D. Stewart | Trustee | 6/84-Present | Retired. Formerly, President and founder of HPS Products and Corporate Vice President of MKS Instruments, Boulder, CO (a provider of advanced process control systems for the semiconductor industry) (1976-2012). | 60 | None | |
Diane
L. Wallace | Trustee | 6/17-Present | Retired. | 60 | Formerly, Independent Trustee, Henderson Global Funds (13 portfolios) (2015-2017); Independent Trustee, State Farm Associates' Funds Trust, State Farm Mutual Fund Trust, and State Farm Variable Product Trust (28 portfolios) (2013-2017); Chief Operating Officer, Senior Vice President-Operations, and Chief Financial Officer for Driehaus Capital Management, LLC (1988-2006); and Treasurer for Driehaus Mutual Funds (1996-2002). | |
56 | SEPTEMBER 30, 2018 |
Janus Henderson Asia Equity Fund
Trustees and Officers (unaudited)
TRUSTEES | ||||||
Name, Address, and Age | Positions Held with the Trust | Length of Time Served | Principal Occupations During the Past Five Years | Number of Portfolios/Funds in Fund Complex Overseen by Trustee | Other Directorships Held by Trustee During the Past Five Years | |
Independent Trustees | ||||||
Linda S. Wolf | Trustee | 11/05-Present | Retired. Formerly, Chairman and Chief Executive Officer of Leo Burnett (Worldwide) (advertising agency) (2001-2005). | 60 | Director of Chicago Community Trust (Regional Community Foundation), Chicago Council on Global Affairs, InnerWorkings (U.S. provider of print procurement solutions to corporate clients), Lurie Children’s Hospital (Chicago, IL), Shirley Ryan Ability Lab and Wrapports, LLC (digital communications company). Formerly, Director of Walmart (until 2017), Director of Chicago Convention & Tourism Bureau (until 2014) and The Field Museum of Natural History (Chicago, IL) (until 2014). | |
Janus Investment Fund | 57 |
Janus Henderson Asia Equity Fund
Trustees and Officers (unaudited)
OFFICERS | |||
Name, Address, and Age | Positions Held with the Trust | Term of Office* and Length of Time Served | Principal Occupations During the Past Five Years |
Andrew Gillan | Executive Vice President and Co-Portfolio Manager Janus Henderson Asia Equity Fund | 6/17-Present | Head of Asia (ex-Japan) Equities of Janus Henderson Investors and Portfolio Manager for other Janus Henderson accounts. Formerly, Senior Investment Manager at Aberdeen Asset Management (2001-2013). |
Mervyn Koh | Executive Vice President and Co-Portfolio Manager Janus Henderson Asia Equity Fund | 6/17-Present | Portfolio Manager on the Asia Equity strategy of Janus Henderson Investors. Formerly, Vice President of Emerging Markets Group of Franklin Templeton Investments (2010-2015). |
58 | SEPTEMBER 30, 2018 |
Janus Henderson Asia Equity Fund
Trustees and Officers (unaudited)
OFFICERS | |||
Name, Address, and Age | Positions Held with the Trust | Term of Office* and Length of Time Served | Principal Occupations During the Past Five Years |
Bruce L. Koepfgen | President and Chief Executive Officer | 7/14-Present | Head of North America at Janus Henderson Investors and Janus Capital Management LLC (since 2017); Executive Vice President and Director of Janus International Holding LLC (since 2011); Executive Vice President of Janus Distributors LLC (since 2011); Vice President and Director of Intech Investment Management LLC (since 2011); Executive Vice President and Director of Perkins Investment Management LLC (since 2011); and Executive Vice President and Director of Janus Management Holdings Corporation (since 2011). Formerly, President of Janus Capital Group Inc. and Janus Capital Management LLC (2013-2017); Executive Vice President of Janus Services LLC (2011-2015), Janus Capital Group Inc. and Janus Capital Management LLC (2011-2013); and Chief Financial Officer of Janus Capital Group Inc., Janus Capital Management LLC, Janus Distributors LLC, Janus Management Holdings Corporation, and Janus Services LLC (2011-2013). |
Susan
K. Wold | Vice President, Chief Compliance Officer, and Anti-Money Laundering Officer | 9/17-Present | Senior Vice President and Head of Compliance, North America for Janus Henderson (since September 2017); Formerly, Vice President, Head of Global Corporate Compliance, and Chief Compliance Officer for Janus Capital Management LLC (May 2017-September 2017); and Vice President, Compliance at Janus Capital Group Inc. and Janus Capital Management LLC (2005-2017). |
Janus Investment Fund | 59 |
Janus Henderson Asia Equity Fund
Trustees and Officers (unaudited)
OFFICERS | |||
Name, Address, and Age | Positions Held with the Trust | Term of Office* and Length of Time Served | Principal Occupations During the Past Five Years |
Jesper Nergaard DOB: 1962 | Chief Financial Officer Vice President, Treasurer, and Principal Accounting Officer | 3/05-Present
2/05-Present | Vice President of Janus Capital and Janus Services LLC. |
Kathryn L. Santoro | Vice President, Chief Legal Counsel, and Secretary | 12/16-Present | Vice President of Janus Capital and Janus Services LLC (since 2016). Formerly, Vice President and Associate Counsel of Curian Capital, LLC and Curian Clearing LLC (2013-2016); and General Counsel and Secretary (2011-2012) and Vice President (2009-2012) of Old Mutual Capital, Inc. |
* Officers are elected at least annually by the Trustees for a one-year term and may also be elected from time to time by the Trustees for an interim period. | |||
60 | SEPTEMBER 30, 2018 |
Janus Henderson Asia Equity Fund
Notes
NotesPage1
Janus Investment Fund | 61 |
Knowledge. Shared
At Janus Henderson, we believe in the sharing of expert insight for better investment and business decisions. We call this ethos Knowledge. Shared.
Learn more by visiting janushenderson.com.
| ||||||||
This report is submitted for the general information of shareholders of the Fund. It is not an offer or solicitation for the Fund and is not authorized for distribution to prospective investors unless preceded or accompanied by an effective prospectus. | ||||||||
Janus Henderson, Janus, Henderson, Perkins, Intech and Knowledge. Shared are trademarks of Janus Henderson Group plc or one of its subsidiary entities. © Janus Henderson Group plc. Funds distributed by Janus Henderson Distributors | ||||||||
125-02-93036 11-18 | ||||||||

ANNUAL REPORT September 30, 2018 | |||
Janus Henderson Balanced Fund | |||
Janus Investment Fund | |||
| |||
HIGHLIGHTS · Portfolio management perspective · Investment strategy behind your fund · Fund performance, characteristics | |||
|

Table of Contents
Janus Henderson Balanced Fund
Janus Henderson Balanced Fund (unaudited)


PERFORMANCE
Janus Henderson Balanced Fund’s Class I Shares returned 14.18% for the 12-month period ended September 30, 2018. That compares with 17.91% for the Fund’s primary benchmark, the S&P 500® Index, and -1.22% for the Fund’s secondary benchmark, the Bloomberg Barclays U.S. Aggregate Bond Index. The Balanced Index, an internally calculated benchmark composed of a 55% weighting in the S&P 500 Index and a 45% weighting in the Bloomberg Barclays U.S. Aggregate Bond Index, returned 9.02%.
INVESTMENT ENVIRONMENT
Equities were boosted early in the period as U.S. tax reform was signed into law. Optimism about strong economic growth and U.S. tax reform then pushed equity markets to new heights early in 2018. Subsequently, volatility returned, stemming in large part from concerns that the Federal Reserve (Fed) may increase interest rates at a faster-than-projected pace. Investors also grappled with geopolitical risks throughout the period, including the formation of a populist government in Italy and escalating trade tensions between the U.S. and China. Ultimately, positive corporate earnings and healthy economic data led the major equity indices to end the period near new all-time highs. Within the S&P 500 Index, consumer discretionary and information technology had the strongest returns. Telecommunications and utilities were among the worst performers.
After reaching the tightest levels of this credit cycle in February, investment-grade corporate credit spreads widened. This was due, in part, to concerns around substantial debt-funded consolidation activity and commensurate supply. A number of large mergers and acquisitions (M&A) met with challenges late in the period, and as supply moderated, spreads tightened and finished near where they began. High yield outperformed investment grade, as the asset class was supported by limited new issuance amid investors’ continued reach for yield. While high-yield spreads were more volatile, they ultimately tightened and were once again encroaching on cycle tights by period end.
The Fed raised its benchmark rate four times in the past 12 months, reflecting confidence in the U.S. economy. As investors digested the Fed’s trajectory but questioned the sustainability of growth long term, the Treasury curve flattened. Rates rose across the curve, with the yield on the 10-year Treasury note ending September at 3.06%, up from 2.33% one year ago.
PERFORMANCE DISCUSSION
The Fund, which seeks to provide more consistent returns over time by allocating across the spectrum of fixed income and equity securities, outperformed the Balanced Index, its blended benchmark of the S&P 500 Index (55%) and the Bloomberg Barclays U.S. Aggregate Bond Index (45%). The Fund underperformed its primary benchmark, the S&P 500 Index, but outperformed its secondary benchmark, the Bloomberg Barclays U.S. Aggregate Bond Index.
Our equity-to-fixed income allocation ended the period approximately 61% equities, 39% fixed income and a small position in cash, compared with roughly 65% equities, 34% fixed income and the remainder in cash as of September 30, 2017. The equity allocation may vary based on market conditions, but our positioning reflects our belief that equities offered greater risk-adjusted opportunities versus fixed income throughout the period.
The Fund’s equity sleeve outperformed the S&P 500 Index. Outperformance was led by strong stock selection in the information technology sector. Stock selection in both consumer staples and industrials also aided relative results.
Microsoft was the leading absolute contributor to returns during the period. Microsoft has experienced steep growth across both its commercial and consumer lines of business. It continues to benefit from the secular shift to
Janus Investment Fund | 1 |
Janus Henderson Balanced Fund (unaudited)
Software as a Service (SaaS), as evidenced by robust demand for its Azure cloud platform and the subscription-based Office 365 suite. The resulting revenue growth has driven the stock higher. Microsoft is also making progress in integrating LinkedIn into the company’s Office applications and translating this into revenue growth. Further, management continues to succeed in reallocating costs, discontinuing certain business lines and reinvesting into higher-growth segments. Microsoft raised its dividend throughout the period and has done an admirable job of returning capital to shareholders.
Mastercard was another top contributor. Mastercard is a core holding in our portfolio and we continue to see our investment thesis play out. Our long-term view is that payments companies such as Mastercard are poised to benefit as consumers and businesses switch from cash and check to plastic and electronic payments. Mastercard is particularly well positioned to benefit from this shift because a majority of its revenues are generated outside the U.S., where many markets have a lower penetration of card and electronic payments and are experiencing significantly faster electronic purchase volume growth. The stock was rewarded during the period, given Mastercard’s ability to gain market share amid general growth in card transactions and acceleration in consumer and travel spending. We appreciate the company’s ability to generate cash flow and return it to shareholders via dividends and stock buybacks.
Boeing was another leading contributor. The airline industry continues to benefit from strong global air traffic growth and increased passenger travel distance. With this backdrop, the greater fuel efficiency and longer range of Boeing’s new planes has resulted in strong demand for its aircraft and has allowed the company to expand its market. The company also accelerated production of its 737 plane during the period, which was applauded by investors. We have a favorable opinion of management’s ambitious profit margin target along with its history of returning capital to shareholders and strong dividend growth rate.
Stock selection in the consumer discretionary and real estate sectors weighed on relative results. Colony NorthStar was the leading individual detractor. The company was formed through the three-way merger of real estate investment management firm Colony Capital, and sister firms NorthStar Asset Management Group and NorthStar Realty Finance. The merger has put the combined company in some challenging industries, in our view. We exited our position during the period.
Lam Research, which manufactures and services semiconductor process equipment used in making integrated circuits, also weighed on performance. The stock struggled during the period over concern that the semiconductor industry may be at peak demand with a softer outlook. Despite some expected volatility, we believe demand for semiconductors and the equipment that produces them will continue to be driven by the proliferation of connected devices, and the resulting data that is generated and analyzed, for years to come.
General Motors was another detractor. The company has considerable exposure to the Chinese automotive market through its joint venture with SAIC Motor. Consecutive months of declining Chinese auto sales and global trade tensions, including tariffs on steel – a large input cost for the company – pressured the stock during the period. We appreciate how General Motors is on the leading edge of technological shifts within the industry, including autonomous-driving and electric vehicles. We ultimately believe the tariff headwinds and geopolitical issues will abate over time.
The Fund’s fixed income sleeve outperformed the Bloomberg Barclays U.S. Aggregate Bond Index. Mindful of the potential for equities to pull back following their strong run, we reduced risk in the fixed income sleeve. Given that valuations are full and the credit cycle is in extended innings, we also believe it is prudent to be selective in our spread product exposure. We sought to maintain a diversified portfolio by decreasing our corporate credit allocation and identifying opportunities in shorter-dated and floating rate asset-backed securities (ABS) and bank loans. We increased emphasis on issuers with higher-quality credit ratings. We also added to our U.S. Treasuries allocation, although we remain underweight the asset class. Portfolio duration finished the period at 95% of the index.
Our spread-product diversification proved beneficial, as our allocations to bank loans, ABS and commercial mortgage-backed securities (CMBS) all aided relative results. Carry, a measure of excess income generated by the Fund’s holdings, was particularly accretive in these asset classes. Strong selection in mortgage-backed securities (MBS) also contributed to outperformance. We utilize MBS as ballast for our core portfolios, to act as a diversifier when volatility rises. We emphasize securities with higher expected certainty of cash flows and seek to optimize carry per unit of convexity.
2 | SEPTEMBER 30, 2018 |
Janus Henderson Balanced Fund (unaudited)
At the individual issuer level, a bank loan position in Hilton Hotels & Resorts was a leading contributor to relative returns. The company has benefited from continued strength in consumer spending, and capitalized on low vacancy rates by increasing nightly room rates. We have a favorable opinion of Hilton’s fundamentals as the company has successfully spun off less-profitable business lines and is focused on growing earnings.
While we were pleased with the performance of the aforementioned positioning, other allocations weighed on returns. Our Treasury positioning detracted from relative performance, largely due to yield curve positioning. Our bias toward the long end of the Treasury curve hindered results near period end given the late-period sell-off in long-term rates.
Our positioning in investment-grade corporate credit also detracted from results. Our holdings, which are concentrated in shorter- and intermediate-dated securities, lagged the index constituents. An overweight position in Broadcom also contributed to underperformance in the asset class. Spreads widened significantly early in the period when the semiconductor company made an unexpected bid for Qualcomm, and in effect NXP, which Qualcomm was buying at the time. The bid caught many investors off guard, particularly after Broadcom crossed into the investment-grade space earlier in 2017, and it was speculated that much of the acquisition would be financed with debt. The deal was ultimately blocked by U.S. President Trump, citing national security concerns. We continue to hold the position as we appreciate the company’s diversified business model and ability to generate consistent free cash flow.
OUTLOOK
Our outlook for the U.S. equity market remains sanguine, and we continue to believe that equities present more attractive risk-adjusted opportunities relative to fixed income. Consumer confidence is strong and business confidence is also rising. While we expect the Fed to continue hiking, the low starting point and gradual pace of tightening should present an interest rate backdrop that remains favorable for equities. Steady global economic growth and the benefits of U.S. corporate tax cuts should also provide tailwinds for the asset class. We believe that the manner in which many companies divided tax savings – among shareholders, employees and capital expenditures – could ultimately extend the market rally by boosting both consumer spending and industrial demand in coming months. We remain optimistic for economic growth, and expect secular themes such as an uptick in global travel, the conversion to cloud computing and SaaS, and the increased use of technology to generate cost-cutting efficiencies in the industrials sector to continue building momentum and prove beneficial for a number of our holdings. While trade policy is a risk we monitor, we maintain our optimistic outlook that trade disputes between the U.S. and China will be resolved with a positive outcome for U.S. equities.
In the fixed income sleeve, we are positioned for a higher but flatter Treasury curve. We anticipate market expectations will catch up to the Fed’s outlook for interest rates in coming months, while foreign buyer demand for Treasuries decreases as hedging costs rise, and supply increases to compensate for government spending and tax revenue shortfalls – all of which should push Treasury yields higher. However, we expect range-bound rates on the long end, as investors evaluate the risk of inflation and the sustainability of growth once the impact of tax reform recedes. We intend to maintain duration modestly below that of the benchmark, but will continue in our tactical approach to yield curve positioning.
We believe that the opportunity for strong excess returns in spread products will be lower going forward, and 2020 could present a higher risk environment as the tailwinds of low rates, quantitative easing and tax reform fade. Valuations remain near the tight ends of their ranges, and corporate credit risk grows more asymmetric against us each day. As such, we remain cautious and focused on out-carrying the benchmark, but we will continue to seek attractive risk-adjusted opportunities in issuers with less cyclicality in earnings, strong balance sheets and a commitment to deleveraging. This approach is consistent with our core tenets of capital preservation and strong risk-adjusted returns.
Thank you for investing in Janus Henderson Balanced Fund.
Janus Investment Fund | 3 |
Janus Henderson Balanced Fund (unaudited)
Fund At A Glance
September 30, 2018
5 Top Performers - Holdings |
|
|
| 5 Bottom Performers - Holdings |
| |
Contribution | Contribution | |||||
Microsoft Corp | 2.84% | Colony Capital Inc | -0.40% | |||
Mastercard Inc | 2.39% | Lam Research Corp | -0.25% | |||
Boeing Co | 1.85% | General Motors Co | -0.21% | |||
Adobe Systems Inc | 1.84% | Comcast Corp | -0.17% | |||
Apple Inc | 1.38% | Outfront Media Inc | -0.09% | |||
5 Top Performers - Sectors* |
|
|
|
|
| |
Fund | Fund Weighting | S&P 500 Index | ||||
Contribution | (Average % of Equity) | Weighting | ||||
Information Technology | 3.25% | 26.66% | 25.07% | |||
Consumer Staples | 2.05% | 10.82% | 7.42% | |||
Industrials | 1.95% | 13.79% | 9.98% | |||
Financials | 0.79% | 13.02% | 14.47% | |||
Utilities | 0.47% | 0.00% | 2.88% | |||
5 Bottom Performers - Sectors* |
|
|
|
|
| |
Fund | Fund Weighting | S&P 500 Index | ||||
Contribution | (Average % of Equity) | Weighting | ||||
Consumer Discretionary | -2.25% | 14.82% | 12.57% | |||
Real Estate | -0.46% | 3.49% | 2.78% | |||
Other** | -0.21% | 1.00% | 0.00% | |||
Materials | 0.11% | 2.87% | 2.82% | |||
Energy | 0.20% | 2.57% | 5.98% | |||
Security contribution to performance is measured by using an algorithm that multiplies the daily performance of each security with the previous day’s ending weight in the portfolio and is gross of advisory fees. Fixed income securities and certain equity securities, such as private placements and some share classes of equity securities, are excluded. | ||||||
* | Based on sector classification according to the Global Industry Classification Standard (“GICS”) codes, which are the exclusive property and a service mark of MSCI Inc. and Standard & Poor’s. | |||||
** | Not a GICS classified sector. | |||||
4 | SEPTEMBER 30, 2018 |
Janus Henderson Balanced Fund (unaudited)
Fund At A Glance
September 30, 2018
5 Largest Equity Holdings - (% of Net Assets) | |
Microsoft Corp | |
Software | 3.4% |
Mastercard Inc | |
Information Technology Services | 2.8% |
Alphabet Inc - Class C | |
Internet Software & Services | 2.4% |
Boeing Co | |
Aerospace & Defense | 2.2% |
Apple Inc | |
Technology Hardware, Storage & Peripherals | 2.1% |
12.9% | |
Asset Allocation - (% of Net Assets) | |||||
Common Stocks | 61.1% | ||||
United States Treasury Notes/Bonds | 11.8% | ||||
Corporate Bonds | 11.3% | ||||
Mortgage-Backed Securities | 8.7% | ||||
Asset-Backed/Commercial Mortgage-Backed Securities | 4.9% | ||||
Bank Loans and Mezzanine Loans | 1.5% | ||||
Investment Companies | 0.8% | ||||
Preferred Stocks | 0.0% | ||||
Other | (0.1)% | ||||
100.0% | |||||
Top Country Allocations - Long Positions - (% of Investment Securities) | |
As of September 30, 2018
| As of September 30, 2017
|
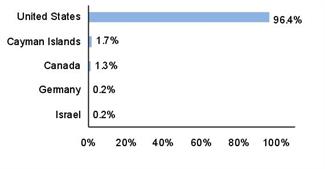
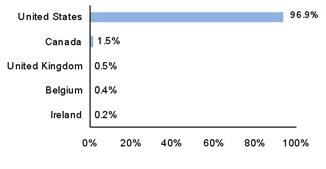
Janus Investment Fund | 5 |
Janus Henderson Balanced Fund (unaudited)
Performance
See important disclosures on the next page. |
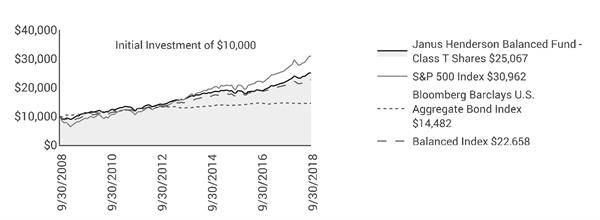
| Expense Ratios - | ||||||||
Average Annual Total Return - for the periods ended September 30, 2018 |
|
| per the January 26, 2018 prospectuses | ||||||
|
| One
| Five
| Ten | Since |
|
| Total
Annual Fund | |
Class A Shares at NAV |
| 13.81% | 9.06% | 9.51% | 9.77% |
|
| 0.94% | |
Class A Shares at MOP |
| 7.27% | 7.78% | 8.87% | 9.52% |
|
|
| |
Class C Shares at NAV | 13.06% | 8.31% | 8.79% | 9.09% |
|
| 1.66% | ||
Class C Shares at CDSC |
| 12.06% | 8.31% | 8.79% | 9.09% |
|
|
| |
Class D Shares(1) |
| 14.10% | 9.30% | 9.72% | 9.86% |
|
| 0.72% | |
Class I Shares |
| 14.18% | 9.39% | 9.63% | 9.82% |
|
| 0.65% | |
Class N Shares |
| 14.26% | 9.47% | 9.63% | 9.82% |
|
| 0.58% | |
Class R Shares |
| 13.38% | 8.65% | 9.11% | 9.38% |
|
| 1.32% | |
Class S Shares |
| 13.67% | 8.92% | 9.37% | 9.61% |
|
| 1.07% | |
Class T Shares |
| 13.94% | 9.20% | 9.63% | 9.82% |
|
| 0.83% | |
S&P 500 Index |
| 17.91% | 13.95% | 11.97% | 9.93% |
|
|
| |
Bloomberg Barclays U.S. Aggregate Bond Index |
| -1.22% | 2.16% | 3.77% | 5.23% |
|
|
| |
Balanced Index |
| 9.02% | 8.63% | 8.52% | 8.07% |
|
|
| |
Morningstar Quartile - Class T Shares |
| 1st | 1st | 1st | 1st |
|
|
| |
Morningstar Ranking - based on total returns for Allocation - 50% to 70% Equity Funds |
| 10/781 | 41/712 | 32/574 | 14/190 |
|
|
| |
Returns quoted are past performance and do not guarantee future results; current performance may be lower or higher. Investment returns and principal value will vary; there may be a gain or loss when shares are sold. For the most recent month-end performance call 800.668.0434 (or 800.525.3713 if you hold shares directly with Janus Henderson) or visit janushenderson.com/performance (or janushenderson.com/allfunds if you hold shares directly with Janus Henderson).
Maximum Offering Price (MOP) returns include the maximum sales charge of 5.75%. Net Asset Value (NAV) returns exclude this charge, which would have reduced returns.
CDSC returns include a 1% contingent deferred sales charge (CDSC) on Shares redeemed within 12 months of purchase. Net Asset Value (NAV) returns exclude this charge, which would have reduced returns.
6 | SEPTEMBER 30, 2018 |
Janus Henderson Balanced Fund (unaudited)
Performance
Performance may be affected by risks that include those associated with non-diversification, portfolio turnover, short sales, potential conflicts of interest,
Janus Investment Fund | 7 |
Janus Henderson Balanced Fund (unaudited)
Performance
foreign and emerging markets, initial public offerings (IPOs), high-yield and high-risk securities, undervalued, overlooked and smaller capitalization companies, real estate related securities including Real Estate Investment Trusts (REITs), derivatives, and commodity-linked investments. Each product has different risks. Please see the prospectus for more information about risks, holdings and other details.
Returns include reinvestment of all dividends and distributions and do not reflect the deduction of taxes that a shareholder would pay on Fund distributions or redemptions of Fund shares. The returns do not include adjustments in accordance with generally accepted accounting principles required at the period end for financial reporting purposes.
See Financial Highlights for actual expense ratios during the reporting period.
Class A Shares, Class C Shares, Class R Shares, and Class S Shares commenced operations on July 6, 2009. Performance shown for each class for periods prior to July 6, 2009, reflects the performance of the Fund’s Class J Shares, the initial share class (renamed Class T Shares effective February 16, 2010), calculated using the fees and expenses of each respective class, without the effect of any fee and expense limitations or waivers.
Class D Shares commenced operations on February 16, 2010. Performance shown for periods prior to February 16, 2010, reflects the performance of the Fund’s former Class J Shares, calculated using the fees and expenses in effect during the periods shown, net of any applicable fee and expense limitations or waivers.
Class I Shares commenced operations on July 6, 2009. Performance shown for periods prior to July 6, 2009, reflects the performance of the Fund’s former Class J Shares, calculated using the fees and expenses of Class J Shares, net of any applicable fee and expense limitations or waivers.
Class N Shares commenced operations on May 31, 2012. Performance shown for periods prior to May 31, 2012, reflects the performance of the Fund’s Class T Shares, calculated using the fees and expenses of Class T Shares, net of any applicable fee and expense limitations or waivers.
If each share class of the Fund had been available during periods prior to its commencement, the performance shown may have been different. The performance shown for periods following the Fund’s commencement of each share class reflects the fees and expenses of each respective share class, net of any applicable fee and expense limitations or waivers. Please refer to the Fund’s prospectuses for further details concerning historical performance.
Ranking is for the share class shown only; other classes may have different performance characteristics. When an expense waiver is in effect, it may have a material effect on the total return, and therefore the ranking for the period.
© 2018 Morningstar, Inc. All Rights Reserved.
There is no assurance that the investment process will consistently lead to successful investing.
See Notes to Schedule of Investments and Other Information for index definitions.
Index performance does not reflect the expenses of managing a portfolio as an index is unmanaged and not available for direct investment.
See “Useful Information About Your Fund Report.”
*The Fund’s inception date – September 1, 1992
(1) Closed to certain new investors.
8 | SEPTEMBER 30, 2018 |
Janus Henderson Balanced Fund (unaudited)
Expense Examples
As a shareholder of the Fund, you incur two types of costs: (1) transaction costs, such as sales charges (loads) on purchase payments (applicable to Class A Shares only); and (2) ongoing costs, including management fees; 12b-1 distribution and shareholder servicing fees; transfer agent fees and expenses payable pursuant to the Transfer Agency Agreement; and other Fund expenses. This example is intended to help you understand your ongoing costs (in dollars) of investing in the Fund and to compare these costs with the ongoing costs of investing in other mutual funds. To do so, compare this 5% hypothetical example with the 5% hypothetical examples that appear in the shareholder reports of the other funds. The example is based upon an investment of $1,000 invested at the beginning of the period and held for the six-months indicated, unless noted otherwise in the table and footnotes below.
Actual Expenses
The information in the table under the heading “Actual” provides information about actual account values and actual expenses. You may use the information in these columns, together with the amount you invested, to estimate the expenses that you paid over the period. Simply divide your account value by $1,000 (for example, an $8,600 account value divided by $1,000 = 8.6), then multiply the result by the number in the appropriate column for your share class under the heading entitled “Expenses Paid During Period” to estimate the expenses you paid on your account during the period.
Hypothetical Example for Comparison Purposes
The information in the table under the heading “Hypothetical (5% return before expenses)” provides information about hypothetical account values and hypothetical expenses based upon the Fund’s actual expense ratio and an assumed rate of return of 5% per year before expenses, which is not the Fund’s actual return. The hypothetical account values and expenses may not be used to estimate the actual ending account balance or expenses you paid for the period. You may use this information to compare the ongoing costs of investing in the Fund and other funds. To do so, compare this 5% hypothetical example with the 5% hypothetical examples that appear in the shareholder reports of the other funds. Additionally, for an analysis of the fees associated with an investment in any share class or other similar funds, please visit www.finra.org/fundanalyzer.
Please note that the expenses shown in the table are meant to highlight your ongoing costs only and do not reflect any transaction costs. These fees are fully described in the Fund’s prospectuses. Therefore, the hypothetical examples are useful in comparing ongoing costs only, and will not help you determine the relative total costs of owning different funds. In addition, if these transaction costs were included, your costs would have been higher.
Actual | Hypothetical | |||||||||
| Beginning | Ending | Expenses |
| Beginning | Ending | Expenses | Net Annualized | ||
Class A Shares | $1,000.00 | $1,076.20 | $4.89 |
| $1,000.00 | $1,020.36 | $4.76 | 0.94% | ||
Class C Shares | $1,000.00 | $1,072.40 | $8.36 |
| $1,000.00 | $1,017.00 | $8.14 | 1.61% | ||
Class D Shares | $1,000.00 | $1,077.40 | $3.70 |
| $1,000.00 | $1,021.51 | $3.60 | 0.71% | ||
Class I Shares | $1,000.00 | $1,077.80 | $3.28 |
| $1,000.00 | $1,021.91 | $3.19 | 0.63% | ||
Class N Shares | $1,000.00 | $1,078.20 | $2.97 |
| $1,000.00 | $1,022.21 | $2.89 | 0.57% | ||
Class R Shares | $1,000.00 | $1,074.10 | $6.81 |
| $1,000.00 | $1,018.50 | $6.63 | 1.31% | ||
Class S Shares | $1,000.00 | $1,075.20 | $5.51 |
| $1,000.00 | $1,019.75 | $5.37 | 1.06% | ||
Class T Shares | $1,000.00 | $1,076.70 | $4.22 |
| $1,000.00 | $1,021.01 | $4.10 | 0.81% | ||
† | Expenses Paid During Period are equal to the Net Annualized Expense Ratio multiplied by the average account value over the period, multiplied by 183/365 (to reflect the one-half year period). Expenses in the examples include the effect of applicable fee waivers and/or expense reimbursements, if any. Had such waivers and/or reimbursements not been in effect, your expenses would have been higher. Please refer to the Notes to Financial Statements or the Fund’s prospectuses for more information regarding waivers and/or reimbursements. | |||||||||
Janus Investment Fund | 9 |
Janus Henderson Balanced Fund
Schedule of Investments
September 30, 2018
Shares
or | Value | ||||||
Asset-Backed/Commercial Mortgage-Backed Securities – 4.9% | |||||||
AmeriCredit Automobile Receivables 2016-1, 3.5900%, 2/8/22 | $7,975,000 | $8,003,749 | |||||
AmeriCredit Automobile Receivables Trust 2015-2, 3.0000%, 6/8/21 | 5,476,000 | 5,475,757 | |||||
Angel Oak Mortgage Trust I LLC 2018-2, | |||||||
ICE LIBOR USD 3 Month + 1.2400%, 3.6740%, 7/27/48 (144A)‡ | 3,464,189 | 3,464,053 | |||||
Applebee's Funding LLC / IHOP Funding LLC, 4.2770%, 9/5/44 (144A) | 34,112,430 | 33,610,118 | |||||
Arroyo Mortgage Trust 2018-1, | |||||||
ICE LIBOR USD 3 Month + 1.2400%, 3.7630%, 4/25/48 (144A)‡ | 5,267,189 | 5,268,806 | |||||
Atrium IX, ICE LIBOR USD 3 Month + 1.2400%, 3.5514%, 5/28/30 (144A)‡ | 7,911,900 | 7,924,322 | |||||
Bain Capital Credit CLO 2018-1, | |||||||
ICE LIBOR USD 3 Month + 0.9600%, 3.3216%, 4/23/31 (144A)‡ | 17,402,000 | 17,328,738 | |||||
BAMLL Commercial Mortgage Securities Trust 2013-WBRK, | |||||||
ICE LIBOR USD 3 Month + 1.2400%, 3.6521%, 3/10/37 (144A)‡ | 8,735,000 | 8,554,997 | |||||
BAMLL Commercial Mortgage Securities Trust 2014-FL1, | |||||||
ICE LIBOR USD 1 Month + 5.5000%, 4.3765%, 12/15/31 (144A)‡ | 3,690,490 | 3,602,954 | |||||
BAMLL Commercial Mortgage Securities Trust 2014-FL1, | |||||||
ICE LIBOR USD 1 Month + 4.0000%, 5.0048%, 12/15/31 (144A)‡ | 916,000 | 909,780 | |||||
BBCMS 2018-TALL Mortgage Trust, | |||||||
ICE LIBOR USD 1 Month + 0.7220%, 2.8804%, 3/15/37 (144A)‡ | 42,882,000 | 42,855,160 | |||||
BBCMS Trust 2015-SRCH, 4.1970%, 8/10/35 (144A) | 10,401,000 | 10,592,616 | |||||
Bean Creek CLO Ltd, | |||||||
ICE LIBOR USD 3 Month + 1.0200%, 3.3675%, 4/20/31 (144A)‡ | 11,174,000 | 11,150,032 | |||||
BHMS 2018-ATLS, ICE LIBOR USD 1 Month + 1.2500%, 3.4084%, 7/15/35 (144A)‡ | 11,750,000 | 11,761,801 | |||||
BXP Trust 2017-GM, 3.3790%, 6/13/39 (144A) | 4,692,000 | 4,535,410 | |||||
Caesars Palace Las Vegas Trust 2017-VICI C, 4.1384%, 10/15/34 (144A) | 6,668,000 | 6,685,842 | |||||
Caesars Palace Las Vegas Trust 2017-VICI D, | |||||||
ICE LIBOR USD 3 Month + 1.2400%, 4.4991%, 10/15/34 (144A)‡ | 6,971,000 | 6,979,508 | |||||
Caesars Palace Las Vegas Trust 2017-VICI E, | |||||||
ICE LIBOR USD 3 Month + 1.2400%, 4.4991%, 10/15/34 (144A)‡ | 9,456,000 | 9,283,560 | |||||
Carlyle Global Market Strategies CLO 2014-2R Ltd, | |||||||
ICE LIBOR USD 3 Month + 1.0500%, 3.3638%, 5/15/31 (144A)‡ | 16,742,000 | 16,688,158 | |||||
Carlyle Global Market Strategies CLO 2016-1 Ltd, | |||||||
ICE LIBOR USD 3 Month + 1.4500%, 4.9000%, 4/20/27 (144A)‡ | 7,824,000 | 7,823,851 | |||||
Carlyle Global Market Strategies CLO 2016-2 Ltd, | |||||||
ICE LIBOR USD 3 Month + 1.5000%, 3.8500%, 7/15/27 (144A)‡ | 5,765,000 | 5,764,937 | |||||
Carlyle US CLO 2018-1 Ltd, | |||||||
ICE LIBOR USD 3 Month + 1.0200%, 3.0752%, 4/20/31 (144A)‡ | 20,918,672 | 20,857,966 | |||||
CIFC Funding 2013-IV Ltd, | |||||||
ICE LIBOR USD 3 Month + 1.0600%, 3.1463%, 4/27/31 (144A)‡ | 6,658,469 | 6,626,395 | |||||
CIFC Funding 2018-I Ltd, | |||||||
ICE LIBOR USD 3 Month + 1.0000%, 3.1572%, 4/18/31 (144A)‡ | 7,487,000 | 7,442,774 | |||||
CIFC Funding 2018-II Ltd, | |||||||
ICE LIBOR USD 3 Month + 1.0400%, 3.0929%, 4/20/31 (144A)‡ | 13,056,000 | 13,020,723 | |||||
Credit Acceptance Auto Loan Trust 2018-2, 3.4700%, 5/17/27 (144A) | 7,222,000 | 7,216,516 | |||||
Credit Acceptance Auto Loan Trust 2018-2, 3.9400%, 7/15/27 (144A) | 4,788,000 | 4,777,697 | |||||
Credit Acceptance Auto Loan Trust 2018-2, 4.1600%, 9/15/27 (144A) | 2,380,000 | 2,380,138 | |||||
CSMLT 2015-2 Trust, | |||||||
ICE LIBOR USD 3 Month + 1.2400%, 3.5000%, 8/25/45 (144A)‡ | 6,460,777 | 6,381,025 | |||||
Drive Auto Receivables Trust 2017-1, 3.8400%, 3/15/23 | 1,157,000 | 1,161,538 | |||||
Drive Auto Receivables Trust 2017-A, 4.1600%, 5/15/24 (144A) | 6,689,000 | 6,755,686 | |||||
Dryden 41 Senior Loan Fund, | |||||||
ICE LIBOR USD 3 Month + 0.9700%, 3.3092%, 4/15/31 (144A)‡ | 10,255,000 | 10,185,707 | |||||
Dryden 55 CLO Ltd, | |||||||
ICE LIBOR USD 3 Month + 1.0200%, 3.0613%, 4/15/31 (144A)‡ | 6,329,000 | 6,314,159 | |||||
Dryden 64 CLO Ltd, | |||||||
ICE LIBOR USD 3 Month + 0.9700%, 3.1895%, 4/18/31 (144A)‡ | 14,758,000 | 14,739,110 | |||||
Evergreen Credit Card Trust, 2.9500%, 3/15/23 (144A) | 3,946,000 | 3,917,609 | |||||
Exeter Automobile Receivables Trust 2018-2, 3.6900%, 3/15/23 (144A) | 5,225,000 | 5,212,408 | |||||
Fannie Mae Connecticut Avenue Securities, | |||||||
ICE LIBOR USD 1 Month + 2.6000%, 4.8158%, 5/25/24‡ | 5,465,994 | 5,814,167 | |||||
See Notes to Schedule of Investments and Other Information and Notes to Financial Statements. | |
10 | SEPTEMBER 30, 2018 |
Janus Henderson Balanced Fund
Schedule of Investments
September 30, 2018
Shares
or | Value | ||||||
Asset-Backed/Commercial Mortgage-Backed Securities – (continued) | |||||||
Fannie Mae Connecticut Avenue Securities, | |||||||
ICE LIBOR USD 1 Month + 3.0000%, 5.2158%, 7/25/24‡ | $23,585,771 | $25,286,605 | |||||
Fannie Mae Connecticut Avenue Securities, | |||||||
ICE LIBOR USD 1 Month + 4.0000%, 6.2158%, 5/25/25‡ | 3,380,008 | 3,717,186 | |||||
Fannie Mae REMICS, 3.0000%, 5/25/48 | 16,630,206 | 15,887,995 | |||||
Flagship Credit Auto Trust 2016-3, 2.7200%, 7/15/22 (144A) | 5,105,000 | 5,054,664 | |||||
Flatiron CLO 18 Ltd, | |||||||
ICE LIBOR USD 3 Month + 0.9500%, 3.4174%, 4/17/31 (144A)‡ | 8,055,000 | 7,999,412 | |||||
Freddie Mac Structured Agency Credit Risk Debt Notes, | |||||||
ICE LIBOR USD 1 Month + 4.5000%, 6.7158%, 2/25/24‡ | 15,648,501 | 18,090,794 | |||||
Freddie Mac Structured Agency Credit Risk Debt Notes, | |||||||
ICE LIBOR USD 1 Month + 3.6000%, 5.8158%, 4/25/24‡ | 10,616,987 | 11,797,343 | |||||
J.P. Morgan Chase Commercial Mortgage Securities Trust 2016-WIKI, | |||||||
3.5537%, 10/5/31 (144A) | 1,557,000 | 1,534,134 | |||||
J.P. Morgan Chase Commercial Mortgage Securities Trust 2016-WIKI, | |||||||
ICE LIBOR USD 3 Month + 1.2400%, 4.1426%, 10/5/31 (144A)‡ | 2,381,000 | 2,341,188 | |||||
JP Morgan Chase Commercial Mortgage Securities Trust 2010-C2 E, | |||||||
ICE LIBOR USD 3 Month + 1.2400%, 5.8281%, 11/15/43 (144A)‡ | 4,265,000 | 4,226,867 | |||||
JP Morgan Chase Commercial Mortgage Securities Trust 2015-UES, | |||||||
ICE LIBOR USD 3 Month + 1.2400%, 3.7417%, 9/5/32 (144A)‡ | 5,067,000 | 4,995,812 | |||||
JP Morgan Mortgage Trust 2018-8, | |||||||
ICE LIBOR USD 3 Month + 1.2400%, 4.0000%, 1/25/49 (144A)‡ | 3,660,113 | 3,613,363 | |||||
LCM XIV LP, ICE LIBOR USD 3 Month + 1.0400%, 3.4398%, 7/20/31 (144A)‡ | 4,733,406 | 4,725,033 | |||||
LCM XVIII LP, ICE LIBOR USD 3 Month + 1.0200%, 3.3675%, 4/20/31 (144A)‡ | 19,680,000 | 19,648,886 | |||||
loanDepot Station Place Agency Securitization Trust 2017-1, | |||||||
ICE LIBOR USD 1 Month + 0.8000%, 3.0158%, 11/25/50 (144A)‡,§ | 16,597,000 | 16,547,641 | |||||
loanDepot Station Place Agency Securitization Trust 2017-1, | |||||||
ICE LIBOR USD 1 Month + 1.0000%, 3.2158%, 11/25/50 (144A)‡,§ | 3,279,000 | 3,271,137 | |||||
Magnetite VIII Ltd, | |||||||
ICE LIBOR USD 3 Month + 0.9800%, 3.3192%, 4/15/31 (144A)‡ | 19,818,000 | 19,770,694 | |||||
Magnetite XV Ltd, ICE LIBOR USD 3 Month + 1.0100%, 3.3453%, 7/25/31 (144A)‡ | 10,787,511 | 10,775,386 | |||||
New Residential Mortgage Loan Trust 2017-3, | |||||||
ICE LIBOR USD 3 Month + 1.2400%, 4.0000%, 4/25/57 (144A)‡ | 6,511,654 | 6,540,080 | |||||
New Residential Mortgage Loan Trust 2018-2, | |||||||
ICE LIBOR USD 3 Month + 1.2400%, 4.5000%, 2/25/58 (144A)‡ | 5,973,541 | 6,087,062 | |||||
Octagon Investment Partners 36 Ltd, | |||||||
ICE LIBOR USD 3 Month + 0.9700%, 3.3092%, 4/15/31 (144A)‡ | 19,941,000 | 19,839,042 | |||||
OneMain Direct Auto Receivables Trust 2018-1, 3.8500%, 10/14/25 (144A) | 2,260,000 | 2,266,152 | |||||
OneMain Direct Auto Receivables Trust 2018-1, 4.4000%, 1/14/28 (144A) | 2,312,000 | 2,309,502 | |||||
OSCAR US Funding Trust V, 2.7300%, 12/15/20 (144A) | 2,670,000 | 2,665,514 | |||||
OSCAR US Funding Trust V, 2.9900%, 12/15/23 (144A) | 3,586,000 | 3,552,919 | |||||
PFS Financing Corp, 2.4000%, 10/17/22 (144A) | 4,462,000 | 4,379,096 | |||||
Santander Drive Auto Receivables Trust 2015-1, 3.2400%, 4/15/21 | 5,742,000 | 5,748,223 | |||||
Santander Drive Auto Receivables Trust 2015-4, 3.5300%, 8/16/21 | 9,836,000 | 9,866,245 | |||||
Santander Drive Auto Receivables Trust 2016-3, 4.2900%, 2/15/24 | 12,409,000 | 12,490,275 | |||||
Santander Drive Auto Receivables Trust 2018-1, 4.3700%, 5/15/25 (144A) | 16,238,000 | 15,935,556 | |||||
Sequoia Mortgage Trust 2018-7 A19, | |||||||
ICE LIBOR USD 3 Month + 1.2400%, 4.0000%, 9/25/48 (144A)‡ | 3,821,659 | 3,782,762 | |||||
Sequoia Mortgage Trust 2018-7 A4, | |||||||
ICE LIBOR USD 3 Month + 1.2400%, 4.0000%, 9/25/48 (144A)‡ | 4,821,210 | 4,831,051 | |||||
Sequoia Mortgage Trust 2018-CH2, | |||||||
ICE LIBOR USD 3 Month + 1.2400%, 4.0000%, 6/25/48 (144A)‡ | 15,768,926 | 15,874,715 | |||||
Sequoia Mortgage Trust 2018-CH3, | |||||||
ICE LIBOR USD 3 Month + 1.2400%, 4.0000%, 8/25/48 (144A)‡ | 6,951,071 | 6,986,236 | |||||
Sounds Point CLO IV-R LTD, | |||||||
ICE LIBOR USD 3 Month + 1.1500%, 3.6514%, 4/18/31 (144A)‡ | 10,591,000 | 10,592,345 | |||||
Starwood Retail Property Trust 2014-STAR, | |||||||
ICE LIBOR USD 1 Month + 2.5000%, 4.6584%, 11/15/27 (144A)‡ | 3,070,000 | 3,043,177 | |||||
Starwood Retail Property Trust 2014-STAR, | |||||||
See Notes to Schedule of Investments and Other Information and Notes to Financial Statements. | |
Janus Investment Fund | 11 |
Janus Henderson Balanced Fund
Schedule of Investments
September 30, 2018
Shares
or | Value | ||||||
Asset-Backed/Commercial Mortgage-Backed Securities – (continued) | |||||||
ICE LIBOR USD 1 Month + 3.2500%, 5.4084%, 11/15/27 (144A)‡ | $9,426,000 | $9,139,534 | |||||
Starwood Retail Property Trust 2014-STAR, | |||||||
ICE LIBOR USD 1 Month + 4.1500%, 6.3084%, 11/15/27 (144A)‡ | 895,638 | 851,272 | |||||
Station Place Securitization Trust 2018-7, | |||||||
ICE LIBOR USD 1 Month + 0.8500%, 2.9159%, 9/24/19 (144A)‡ | 25,147,000 | 25,147,000 | |||||
Towd Point Mortgage Trust 2015-3, | |||||||
ICE LIBOR USD 3 Month + 1.2400%, 3.5000%, 3/25/54 (144A)‡ | 370,403 | 369,750 | |||||
Towd Point Mortgage Trust 2018-3, | |||||||
ICE LIBOR USD 3 Month + 1.2400%, 3.7500%, 5/25/58 (144A)‡ | 4,773,617 | 4,775,358 | |||||
Towd Point Mortgage Trust 2018-4, | |||||||
ICE LIBOR USD 3 Month + 1.2400%, 3.0000%, 6/25/58 (144A)‡ | 8,397,740 | 8,147,925 | |||||
Verizon Owner Trust 2016-2, 2.3600%, 5/20/21 (144A) | 7,042,000 | 6,933,479 | |||||
Voya CLO 2015-2 Ltd, | |||||||
ICE LIBOR USD 3 Month + 1.5000%, 4.8300%, 7/23/27 (144A)‡ | 1,834,000 | 1,833,963 | |||||
Voya CLO 2018-1 Ltd, | |||||||
ICE LIBOR USD 3 Month + 0.9500%, 3.2931%, 4/19/31 (144A)‡ | 21,575,000 | 21,426,262 | |||||
Voya CLO 2018-2 Ltd, | |||||||
ICE LIBOR USD 3 Month + 1.0000%, 3.3740%, 7/15/31 (144A)‡ | 18,370,541 | 18,299,447 | |||||
Wachovia Bank Commercial Mortgage Trust Series 2007-C30, | |||||||
ICE LIBOR USD 3 Month + 1.2400%, 5.4130%, 12/15/43‡ | 2,525,600 | 2,537,438 | |||||
Wachovia Bank Commercial Mortgage Trust Series 2007-C34, | |||||||
ICE LIBOR USD 3 Month + 1.2400%, 6.3433%, 5/15/46‡ | 1,823,167 | 1,853,887 | |||||
Westlake Automobile Receivables Trust 2018-1, 2.9200%, 5/15/23 (144A) | 813,000 | 805,682 | |||||
Westlake Automobile Receivables Trust 2018-1, 3.4100%, 5/15/23 (144A) | 811,000 | 804,630 | |||||
Westlake Automobile Receivables Trust 2018-2, 3.2000%, 1/16/24 (144A) | 1,889,000 | 1,886,450 | |||||
Westlake Automobile Receivables Trust 2018-2, 3.5000%, 1/16/24 (144A) | 3,251,000 | 3,247,035 | |||||
WinWater Mortgage Loan Trust 2015-5, | |||||||
ICE LIBOR USD 3 Month + 1.2400%, 3.5000%, 8/20/45 (144A)‡ | 19,033,868 | 18,894,847 | |||||
Total Asset-Backed/Commercial Mortgage-Backed Securities (cost $796,762,480) | 794,095,818 | ||||||
Bank Loans and Mezzanine Loans – 1.5% | |||||||
Basic Industry – 0.2% | |||||||
Axalta Coating Systems US Holdings Inc, | |||||||
ICE LIBOR USD 3 Month + 1.7500%, 4.1361%, 6/1/24‡ | 24,072,159 | 24,110,434 | |||||
Capital Goods – 0.1% | |||||||
Reynolds Group Holdings Inc, | |||||||
ICE LIBOR USD 3 Month + 2.7500%, 4.9922%, 2/5/23‡ | 17,680,075 | 17,754,332 | |||||
Communications – 0.1% | |||||||
Mission Broadcasting Inc, | |||||||
ICE LIBOR USD 3 Month + 2.5000%, 4.6038%, 1/17/24‡ | 1,071,976 | 1,076,328 | |||||
Nexstar Broadcasting Inc, | |||||||
ICE LIBOR USD 3 Month + 2.5000%, 4.6038%, 1/17/24‡ | 7,641,394 | 7,672,418 | |||||
Zayo Group LLC, ICE LIBOR USD 3 Month + 2.0000%, 4.2422%, 1/19/21‡ | 979,090 | 981,361 | |||||
Zayo Group LLC, ICE LIBOR USD 3 Month + 2.2500%, 4.4922%, 1/19/24‡ | 9,055,830 | 9,093,683 | |||||
18,823,790 | |||||||
Consumer Cyclical – 0.4% | |||||||
Golden Nugget Inc/NV, ICE LIBOR USD 3 Month + 2.7500%, 4.8567%, 10/4/23‡ | 12,866,771 | 12,943,888 | |||||
Hilton Worldwide Finance LLC, | |||||||
ICE LIBOR USD 3 Month + 1.7500%, 3.9658%, 10/25/23‡ | 24,468,361 | 24,576,511 | |||||
KFC Holding Co, ICE LIBOR USD 3 Month + 1.7500%, 3.9147%, 4/3/25‡ | 24,117,068 | 24,132,262 | |||||
Wyndham Hotels & Resorts Inc, | |||||||
ICE LIBOR USD 3 Month + 1.7500%, 3.9922%, 5/30/25‡ | 4,595,000 | 4,607,452 | |||||
66,260,113 | |||||||
Consumer Non-Cyclical – 0.4% | |||||||
Aramark Services Inc, ICE LIBOR USD 3 Month + 1.7500%, 4.0844%, 3/28/24‡ | 9,667,211 | 9,679,295 | |||||
Bausch Health Cos Inc, ICE LIBOR USD 3 Month + 1.2400%, 5.1038%, 6/2/25‡ | 626,925 | 629,890 | |||||
Gentiva Health Services Inc, | |||||||
ICE LIBOR USD 3 Month + 3.7500%, 6.0000%, 7/2/25‡ | 24,242,840 | 24,515,572 | |||||
IQVIA Inc, ICE LIBOR USD 3 Month + 2.0000%, 4.3861%, 3/7/24‡ | 3,481,829 | 3,491,404 | |||||
Moffett Towers Phase II, | |||||||
ICE LIBOR USD 1 Month + 2.8000%, 4.9590%, 6/15/21‡,§ | 20,227,054 | 20,106,913 | |||||
See Notes to Schedule of Investments and Other Information and Notes to Financial Statements. | |
12 | SEPTEMBER 30, 2018 |
Janus Henderson Balanced Fund
Schedule of Investments
September 30, 2018
Shares
or | Value | ||||||
Bank Loans and Mezzanine Loans – (continued) | |||||||
Consumer Non-Cyclical – (continued) | |||||||
Post Holdings Inc, ICE LIBOR USD 3 Month + 2.0000%, 4.2200%, 5/24/24‡ | $2,765,988 | $2,765,490 | |||||
61,188,564 | |||||||
Electric – 0.2% | |||||||
NRG Energy Inc, ICE LIBOR USD 3 Month + 1.7500%, 4.1361%, 6/30/23(a),‡ | 15,448,291 | 15,461,267 | |||||
Vistra Operations Co LLC, ICE LIBOR USD 3 Month + 2.0000%, 0%, 8/4/23(a),‡ | 16,452,000 | 16,466,971 | |||||
31,928,238 | |||||||
Technology – 0.1% | |||||||
CommScope Inc, ICE LIBOR USD 3 Month + 2.0000%, 4.2422%, 12/29/22‡ | 6,860,944 | 6,886,672 | |||||
Microchip Technology Inc, | |||||||
ICE LIBOR USD 3 Month + 2.0000%, 4.2500%, 5/29/25‡ | 13,536,549 | 13,910,945 | |||||
SS&C European Holdings Sarl, | |||||||
ICE LIBOR USD 3 Month + 2.2500%, 4.4922%, 4/16/25(a),‡ | 558,443 | 558,794 | |||||
SS&C Technologies Inc, | |||||||
ICE LIBOR USD 3 Month + 2.2500%, 4.4922%, 4/16/25(a),‡ | 1,460,887 | 1,461,808 | |||||
22,818,219 | |||||||
Total Bank Loans and Mezzanine Loans (cost $242,275,030) | 242,883,690 | ||||||
Corporate Bonds – 11.3% | |||||||
Banking – 1.4% | |||||||
Ally Financial Inc, 3.2500%, 11/5/18 | 5,925,000 | 5,922,630 | |||||
Ally Financial Inc, 8.0000%, 12/31/18 | 3,430,000 | 3,464,300 | |||||
Bank of America Corp, 2.5030%, 10/21/22 | 39,759,000 | 38,064,180 | |||||
Citibank NA, ICE LIBOR USD 3 Month + 0.3200%, 2.6631%, 5/1/20‡ | 40,515,000 | 40,581,679 | |||||
Citizens Financial Group Inc, 3.7500%, 7/1/24 | 3,512,000 | 3,367,308 | |||||
Citizens Financial Group Inc, 4.3500%, 8/1/25 | 2,499,000 | 2,465,974 | |||||
Citizens Financial Group Inc, 4.3000%, 12/3/25 | 13,975,000 | 13,773,140 | |||||
First Republic Bank/CA, 4.6250%, 2/13/47 | 6,748,000 | 6,504,563 | |||||
Goldman Sachs Capital I, 6.3450%, 2/15/34 | 14,903,000 | 17,283,027 | |||||
JPMorgan Chase & Co, 2.2950%, 8/15/21 | 14,888,000 | 14,473,178 | |||||
JPMorgan Chase & Co, 3.6250%, 12/1/27 | 9,450,000 | 8,907,002 | |||||
JPMorgan Chase Bank NA, ICE LIBOR USD 3 Month + 0.3400%, 2.6749%, 4/26/21‡ | 27,198,000 | 27,222,611 | |||||
JPMorgan Chase Bank NA, ICE LIBOR USD 3 Month + 0.3500%, 3.0860%, 4/26/21‡ | 12,545,000 | 12,510,727 | |||||
Morgan Stanley, 3.9500%, 4/23/27 | 8,205,000 | 7,870,547 | |||||
Royal Bank of Canada, ICE LIBOR USD 3 Month + 0.3900%, 2.7289%, 4/30/21‡ | 15,851,000 | 15,906,183 | |||||
SVB Financial Group, 5.3750%, 9/15/20 | 10,783,000 | 11,171,387 | |||||
229,488,436 | |||||||
Basic Industry – 0.8% | |||||||
Anglo American Capital PLC, 4.1250%, 9/27/22 (144A) | 2,431,000 | 2,429,820 | |||||
CF Industries Inc, 4.5000%, 12/1/26 (144A) | 6,033,000 | 5,989,712 | |||||
CF Industries Inc, 5.3750%, 3/15/44 | 10,337,000 | 9,587,567 | |||||
Freeport-McMoRan Inc, 3.1000%, 3/15/20 | 3,551,000 | 3,511,051 | |||||
Freeport-McMoRan Inc, 3.5500%, 3/1/22 | 14,747,000 | 14,341,457 | |||||
Freeport-McMoRan Inc, 3.8750%, 3/15/23 | 5,396,000 | 5,220,198 | |||||
Freeport-McMoRan Inc, 4.5500%, 11/14/24 | 7,116,000 | 6,902,520 | |||||
Freeport-McMoRan Inc, 5.4500%, 3/15/43 | 14,035,000 | 12,736,762 | |||||
Georgia-Pacific LLC, 3.1630%, 11/15/21 (144A) | 17,879,000 | 17,634,265 | |||||
Georgia-Pacific LLC, 3.6000%, 3/1/25 (144A) | 9,355,000 | 9,259,447 | |||||
Reliance Steel & Aluminum Co, 4.5000%, 4/15/23 | 9,155,000 | 9,291,795 | |||||
Steel Dynamics Inc, 4.1250%, 9/15/25 | 9,398,000 | 9,000,465 | |||||
Steel Dynamics Inc, 5.0000%, 12/15/26 | 4,367,000 | 4,345,165 | |||||
Teck Resources Ltd, 4.5000%, 1/15/21 | 967,000 | 976,670 | |||||
Teck Resources Ltd, 8.5000%, 6/1/24 (144A) | 9,212,000 | 10,071,019 | |||||
Teck Resources Ltd, 6.2500%, 7/15/41 | 2,354,000 | 2,471,700 | |||||
123,769,613 | |||||||
Brokerage – 0.5% | |||||||
Cboe Global Markets Inc, 3.6500%, 1/12/27 | 12,181,000 | 11,662,044 | |||||
Charles Schwab Corp, ICE LIBOR USD 3 Month + 0.3200%, 2.6319%, 5/21/21‡ | 14,435,000 | 14,466,559 | |||||
See Notes to Schedule of Investments and Other Information and Notes to Financial Statements. | |
Janus Investment Fund | 13 |
Janus Henderson Balanced Fund
Schedule of Investments
September 30, 2018
Shares
or | Value | ||||||
Corporate Bonds – (continued) | |||||||
Brokerage – (continued) | |||||||
Charles Schwab Corp, 3.2500%, 5/21/21 | $4,475,000 | $4,475,242 | |||||
Charles Schwab Corp, 3.0000%, 3/10/25 | 3,910,000 | 3,741,640 | |||||
E*TRADE Financial Corp, 2.9500%, 8/24/22 | 12,161,000 | 11,758,762 | |||||
E*TRADE Financial Corp, 3.8000%, 8/24/27 | 14,478,000 | 13,753,969 | |||||
E*TRADE Financial Corp, 4.5000%, 6/20/28 | 5,560,000 | 5,560,553 | |||||
Raymond James Financial Inc, 5.6250%, 4/1/24 | 6,341,000 | 6,840,262 | |||||
Raymond James Financial Inc, 3.6250%, 9/15/26 | 6,268,000 | 5,991,067 | |||||
Raymond James Financial Inc, 4.9500%, 7/15/46 | 11,085,000 | 11,246,928 | |||||
89,497,026 | |||||||
Capital Goods – 0.8% | |||||||
Arconic Inc, 5.8700%, 2/23/22 | 1,969,000 | 2,057,605 | |||||
Ball Corp, 4.3750%, 12/15/20 | 8,484,000 | 8,590,050 | |||||
HD Supply Inc, 5.7500%, 4/15/24 (144A)Ç | 23,743,000 | 24,959,829 | |||||
Huntington Ingalls Industries Inc, 5.0000%, 11/15/25 (144A) | 22,065,000 | 22,825,801 | |||||
Martin Marietta Materials Inc, 4.2500%, 7/2/24 | 6,155,000 | 6,190,141 | |||||
Masonite International Corp, 5.6250%, 3/15/23 (144A) | 3,303,000 | 3,377,318 | |||||
Northrop Grumman Corp, 2.5500%, 10/15/22 | 13,938,000 | 13,427,416 | |||||
Owens Corning, 4.2000%, 12/1/24 | 5,726,000 | 5,669,549 | |||||
Owens Corning, 3.4000%, 8/15/26 | 2,760,000 | 2,529,899 | |||||
United Technologies Corp, 3.9500%, 8/16/25 | 6,809,000 | 6,765,787 | |||||
United Technologies Corp, 4.6250%, 11/16/48 | 4,884,000 | 4,884,310 | |||||
Vulcan Materials Co, 4.5000%, 4/1/25 | 11,726,000 | 11,750,663 | |||||
Wabtec Corp, 4.1500%, 3/15/24 | 4,054,000 | 4,017,155 | |||||
Wabtec Corp, 4.7000%, 9/15/28 | 9,259,000 | 9,083,152 | |||||
126,128,675 | |||||||
Communications – 1.6% | |||||||
AT&T Inc, 4.1000%, 2/15/28 (144A) | 13,864,000 | 13,436,045 | |||||
AT&T Inc, 5.2500%, 3/1/37 | 3,531,000 | 3,514,916 | |||||
AT&T Inc, 4.7500%, 5/15/46 | 24,721,000 | 22,551,019 | |||||
AT&T Inc, 5.1500%, 11/15/46 (144A) | 8,173,000 | 7,801,680 | |||||
AT&T Inc, 4.5000%, 3/9/48 | 10,459,000 | 9,111,348 | |||||
BellSouth LLC, 4.3330%, 4/26/19 (144A) | 27,795,000 | 28,003,462 | |||||
CCO Holdings LLC / CCO Holdings Capital Corp, 5.2500%, 3/15/21 | 9,129,000 | 9,186,056 | |||||
Charter Communications Operating LLC / Charter Communications Operating Capital, | |||||||
4.9080%, 7/23/25 | 14,702,000 | 14,921,858 | |||||
Charter Communications Operating LLC / Charter Communications Operating Capital, | |||||||
5.3750%, 5/1/47 | 8,211,000 | 7,827,289 | |||||
Charter Communications Operating LLC / Charter Communications Operating Capital, | |||||||
5.7500%, 4/1/48 | 8,655,000 | 8,649,654 | |||||
Comcast Corp, 3.1500%, 3/1/26 | 14,036,000 | 13,246,386 | |||||
Crown Castle International Corp, 5.2500%, 1/15/23 | 8,030,000 | 8,415,428 | |||||
Crown Castle International Corp, 3.2000%, 9/1/24 | 8,132,000 | 7,733,961 | |||||
CSC Holdings LLC, 5.3750%, 2/1/28 (144A) | 4,473,000 | 4,271,715 | |||||
T-Mobile USA Inc, 6.3750%, 3/1/25 | 1,175,000 | 1,224,115 | |||||
UBM PLC, 5.7500%, 11/3/20 (144A) | 12,264,000 | 12,438,086 | |||||
Unitymedia GmbH, 6.1250%, 1/15/25 (144A) | 12,059,000 | 12,661,950 | |||||
Unitymedia Hessen GmbH & Co KG / Unitymedia NRW GmbH, | |||||||
5.0000%, 1/15/25 (144A) | 12,868,000 | 13,066,039 | |||||
Verizon Communications Inc, 2.6250%, 8/15/26 | 20,225,000 | 18,328,249 | |||||
Verizon Communications Inc, 4.3290%, 9/21/28 (144A) | 21,169,000 | 21,289,812 | |||||
Verizon Communications Inc, 4.8620%, 8/21/46 | 4,836,000 | 4,836,811 | |||||
Viacom Inc, 5.8500%, 9/1/43 | 15,308,000 | 16,170,689 | |||||
Warner Media LLC, 3.6000%, 7/15/25 | 7,778,000 | 7,449,863 | |||||
266,136,431 | |||||||
Consumer Cyclical – 0.8% | |||||||
DR Horton Inc, 3.7500%, 3/1/19 | 8,344,000 | 8,354,475 | |||||
See Notes to Schedule of Investments and Other Information and Notes to Financial Statements. | |
14 | SEPTEMBER 30, 2018 |
Janus Henderson Balanced Fund
Schedule of Investments
September 30, 2018
Shares
or | Value | ||||||
Corporate Bonds – (continued) | |||||||
Consumer Cyclical – (continued) | |||||||
Ford Motor Co, 4.3460%, 12/8/26 | $9,604,000 | $9,042,862 | |||||
Ford Motor Credit Co LLC, 4.6870%, 6/9/25 | 9,687,000 | 9,456,963 | |||||
Ford Motor Credit Co LLC, 4.3890%, 1/8/26 | 2,095,000 | 1,995,402 | |||||
Ford Motor Credit Co LLC, 3.8150%, 11/2/27 | 6,812,000 | 6,090,442 | |||||
General Motors Co, 5.0000%, 10/1/28 | 18,439,000 | 18,200,954 | |||||
General Motors Financial Co Inc, 4.3500%, 1/17/27 | 5,629,000 | 5,375,566 | |||||
IHS Markit Ltd, 5.0000%, 11/1/22 (144A) | 6,025,000 | 6,203,340 | |||||
IHS Markit Ltd, 4.7500%, 2/15/25 (144A) | 10,561,000 | 10,732,511 | |||||
MDC Holdings Inc, 5.5000%, 1/15/24 | 9,186,000 | 9,163,035 | |||||
MGM Growth Properties Operating Partnership LP / MGP Finance Co-Issuer Inc, | |||||||
5.6250%, 5/1/24 | 5,377,000 | 5,511,425 | |||||
MGM Resorts International, 6.7500%, 10/1/20 | 15,311,000 | 16,095,689 | |||||
MGM Resorts International, 6.6250%, 12/15/21 | 6,184,000 | 6,551,948 | |||||
MGM Resorts International, 7.7500%, 3/15/22 | 2,222,000 | 2,435,934 | |||||
MGM Resorts International, 6.0000%, 3/15/23 | 1,111,000 | 1,149,885 | |||||
Toll Brothers Finance Corp, 4.0000%, 12/31/18 | 3,398,000 | 3,395,282 | |||||
Toll Brothers Finance Corp, 5.8750%, 2/15/22 | 3,113,000 | 3,260,868 | |||||
Toll Brothers Finance Corp, 4.3750%, 4/15/23 | 1,750,000 | 1,734,688 | |||||
Wyndham Destinations Inc, 4.1500%, 4/1/24 | 6,899,000 | 6,692,030 | |||||
Wyndham Destinations Inc, 5.1000%, 10/1/25 | 3,552,000 | 3,543,120 | |||||
Wyndham Destinations Inc, 4.5000%, 4/1/27 | 3,967,000 | 3,738,898 | |||||
138,725,317 | |||||||
Consumer Non-Cyclical – 1.1% | |||||||
Becton Dickinson and Co, 2.8940%, 6/6/22 | 6,119,000 | 5,948,276 | |||||
Campbell Soup Co, 3.9500%, 3/15/25 | 7,793,000 | 7,531,854 | |||||
Campbell Soup Co, 4.1500%, 3/15/28 | 11,606,000 | 11,047,884 | |||||
Campbell Soup Co, 4.8000%, 3/15/48 | 27,119,000 | 24,588,259 | |||||
CVS Health Corp, 4.7500%, 12/1/22 | 4,870,000 | 5,043,203 | |||||
CVS Health Corp, 4.1000%, 3/25/25 | 16,638,000 | 16,586,314 | |||||
CVS Health Corp, 4.3000%, 3/25/28 | 23,093,000 | 22,865,098 | |||||
CVS Health Corp, 5.0500%, 3/25/48 | 8,158,000 | 8,334,587 | |||||
Elanco Animal Health Inc, 3.9120%, 8/27/21 (144A) | 2,298,000 | 2,300,077 | |||||
Elanco Animal Health Inc, 4.2720%, 8/28/23 (144A) | 5,844,000 | 5,859,986 | |||||
Elanco Animal Health Inc, 4.9000%, 8/28/28 (144A) | 5,450,000 | 5,530,438 | |||||
HCA Inc, 5.3750%, 9/1/26 | 9,196,000 | 9,306,352 | |||||
HCA Inc, 5.6250%, 9/1/28 | 27,440,000 | 27,577,200 | |||||
Sysco Corp, 2.5000%, 7/15/21 | 2,569,000 | 2,508,611 | |||||
Teva Pharmaceutical Finance Co BV, 2.9500%, 12/18/22 | 1,264,000 | 1,173,585 | |||||
Teva Pharmaceutical Finance Netherlands III BV, 2.8000%, 7/21/23 | 7,318,000 | 6,515,015 | |||||
Teva Pharmaceutical Finance Netherlands III BV, 6.0000%, 4/15/24 | 10,904,000 | 11,070,257 | |||||
Teva Pharmaceutical Finance Netherlands III BV, 3.1500%, 10/1/26 | 6,095,000 | 5,071,992 | |||||
178,858,988 | |||||||
Electric – 0.3% | |||||||
Duke Energy Corp, 1.8000%, 9/1/21 | 3,791,000 | 3,622,896 | |||||
Duke Energy Corp, 2.4000%, 8/15/22 | 5,326,000 | 5,094,519 | |||||
NextEra Energy Operating Partners LP, 4.2500%, 9/15/24 (144A) | 1,785,000 | 1,749,300 | |||||
NRG Energy Inc, 7.2500%, 5/15/26 | 14,330,000 | 15,593,476 | |||||
PPL WEM Ltd / Western Power Distribution Ltd, 5.3750%, 5/1/21 (144A) | 10,425,000 | 10,798,930 | |||||
Southern Co, 2.9500%, 7/1/23 | 8,055,000 | 7,735,981 | |||||
44,595,102 | |||||||
Energy – 1.5% | |||||||
Cheniere Corpus Christi Holdings LLC, 5.1250%, 6/30/27 | 14,954,000 | 15,010,077 | |||||
Cheniere Energy Partners LP, 5.6250%, 10/1/26 (144A) | 15,739,000 | 15,852,321 | |||||
Continental Resources Inc/OK, 5.0000%, 9/15/22 | 18,125,000 | 18,387,812 | |||||
Continental Resources Inc/OK, 4.5000%, 4/15/23 | 14,817,000 | 15,074,282 | |||||
Enbridge Energy Partners LP, 5.8750%, 10/15/25 | 6,028,000 | 6,634,957 | |||||
Energy Transfer Equity LP, 4.2500%, 3/15/23 | 6,781,000 | 6,738,619 | |||||
Energy Transfer Equity LP, 5.8750%, 1/15/24 | 6,488,000 | 6,828,620 | |||||
Energy Transfer Equity LP, 5.5000%, 6/1/27 | 4,838,000 | 5,020,876 | |||||
See Notes to Schedule of Investments and Other Information and Notes to Financial Statements. | |
Janus Investment Fund | 15 |
Janus Henderson Balanced Fund
Schedule of Investments
September 30, 2018
Shares
or | Value | ||||||
Corporate Bonds – (continued) | |||||||
Energy – (continued) | |||||||
Energy Transfer Partners LP, 4.9500%, 6/15/28 | $7,081,000 | $7,205,154 | |||||
Energy Transfer Partners LP, 6.1250%, 12/15/45 | 4,075,000 | 4,340,494 | |||||
Energy Transfer Partners LP, 6.0000%, 6/15/48 | 15,287,000 | 16,275,155 | |||||
EnLink Midstream Partners LP, 4.1500%, 6/1/25 | 13,725,000 | 13,009,723 | |||||
EnLink Midstream Partners LP, 4.8500%, 7/15/26 | 18,305,000 | 17,740,638 | |||||
EQT Midstream Partners LP, 4.7500%, 7/15/23 | 1,230,000 | 1,246,942 | |||||
EQT Midstream Partners LP, 4.0000%, 8/1/24 | 4,190,000 | 3,998,742 | |||||
EQT Midstream Partners LP, 5.5000%, 7/15/28 | 17,969,000 | 18,424,119 | |||||
Kinder Morgan Energy Partners LP, 5.0000%, 10/1/21 | 5,278,000 | 5,482,974 | |||||
Kinder Morgan Inc/DE, 6.5000%, 9/15/20 | 544,000 | 574,935 | |||||
Kinder Morgan Inc/DE, 4.3000%, 3/1/28 | 1,222,000 | 1,210,663 | |||||
Kinder Morgan Inc/DE, 5.5500%, 6/1/45 | 3,434,000 | 3,624,652 | |||||
Kinder Morgan Inc/DE, 5.2000%, 3/1/48 | 2,288,000 | 2,330,011 | |||||
Motiva Enterprises LLC, 5.7500%, 1/15/20 (144A) | 2,309,000 | 2,362,906 | |||||
NGPL PipeCo LLC, 4.3750%, 8/15/22 (144A) | 11,056,000 | 11,138,920 | |||||
NGPL PipeCo LLC, 4.8750%, 8/15/27 (144A) | 3,970,000 | 3,950,150 | |||||
NuStar Logistics LP, 5.6250%, 4/28/27 | 7,198,000 | 7,117,023 | |||||
Plains All American Pipeline LP / PAA Finance Corp, 4.6500%, 10/15/25 | 16,402,000 | 16,567,432 | |||||
Plains All American Pipeline LP / PAA Finance Corp, 4.5000%, 12/15/26 | 4,869,000 | 4,861,891 | |||||
Sabine Pass Liquefaction LLC, 5.0000%, 3/15/27 | 5,526,000 | 5,673,320 | |||||
Western Gas Partners LP, 4.7500%, 8/15/28 | 2,437,000 | 2,381,818 | |||||
Western Gas Partners LP, 5.5000%, 8/15/48 | 2,995,000 | 2,818,761 | |||||
241,883,987 | |||||||
Financial Institutions – 0.2% | |||||||
Jones Lang LaSalle Inc, 4.4000%, 11/15/22 | 12,000,000 | 12,173,559 | |||||
Kennedy-Wilson Inc, 5.8750%, 4/1/24 | 14,308,000 | 14,093,380 | |||||
26,266,939 | |||||||
Insurance – 0.6% | |||||||
Aetna Inc, 2.8000%, 6/15/23 | 5,155,000 | 4,938,686 | |||||
Centene Corp, 4.7500%, 5/15/22 | 738,000 | 745,011 | |||||
Centene Corp, 6.1250%, 2/15/24 | 8,571,000 | 9,020,977 | |||||
Centene Corp, 4.7500%, 1/15/25 | 8,382,000 | 8,361,045 | |||||
Centene Corp, 5.3750%, 6/1/26 (144A) | 22,210,000 | 22,765,250 | |||||
Halfmoon Parent Inc, 3.4000%, 9/17/21 (144A) | 2,438,000 | 2,428,809 | |||||
Halfmoon Parent Inc, 3.7500%, 7/15/23 (144A) | 9,925,000 | 9,887,240 | |||||
Halfmoon Parent Inc, 4.1250%, 11/15/25 (144A) | 7,023,000 | 7,000,536 | |||||
Halfmoon Parent Inc, 4.3750%, 10/15/28 (144A) | 10,740,000 | 10,702,699 | |||||
WellCare Health Plans Inc, 5.2500%, 4/1/25 | 6,871,000 | 6,982,654 | |||||
WellCare Health Plans Inc, 5.3750%, 8/15/26 (144A) | 10,365,000 | 10,546,387 | |||||
93,379,294 | |||||||
Natural Gas – 0.1% | |||||||
Sempra Energy, ICE LIBOR USD 3 Month + 0.5000%, 2.8392%, 1/15/21‡ | 10,085,000 | 10,087,557 | |||||
Owned No Guarantee – 0.1% | |||||||
Syngenta Finance NV, 3.6980%, 4/24/20 (144A) | 5,768,000 | 5,761,184 | |||||
Syngenta Finance NV, 3.9330%, 4/23/21 (144A) | 5,300,000 | 5,285,094 | |||||
Syngenta Finance NV, 4.4410%, 4/24/23 (144A) | 1,012,000 | 1,005,653 | |||||
Syngenta Finance NV, 4.8920%, 4/24/25 (144A) | 2,153,000 | 2,112,539 | |||||
14,164,470 | |||||||
Real Estate Investment Trusts (REITs) – 0.3% | |||||||
Alexandria Real Estate Equities Inc, 2.7500%, 1/15/20 | 5,494,000 | 5,444,071 | |||||
Alexandria Real Estate Equities Inc, 4.6000%, 4/1/22 | 14,963,000 | 15,355,583 | |||||
Reckson Operating Partnership LP, 7.7500%, 3/15/20 | 15,865,000 | 16,754,542 | |||||
Senior Housing Properties Trust, 6.7500%, 4/15/20 | 3,367,000 | 3,462,884 | |||||
Senior Housing Properties Trust, 6.7500%, 12/15/21 | 3,740,000 | 3,980,729 | |||||
44,997,809 | |||||||
Technology – 1.2% | |||||||
Broadcom Corp / Broadcom Cayman Finance Ltd, 3.6250%, 1/15/24 | 3,009,000 | 2,918,111 | |||||
Broadcom Corp / Broadcom Cayman Finance Ltd, 3.1250%, 1/15/25 | 11,638,000 | 10,807,809 | |||||
Broadcom Corp / Broadcom Cayman Finance Ltd, 3.8750%, 1/15/27 | 17,914,000 | 16,894,889 | |||||
See Notes to Schedule of Investments and Other Information and Notes to Financial Statements. | |
16 | SEPTEMBER 30, 2018 |
Janus Henderson Balanced Fund
Schedule of Investments
September 30, 2018
Shares
or | Value | ||||||
Corporate Bonds – (continued) | |||||||
Technology – (continued) | |||||||
Broadcom Corp / Broadcom Cayman Finance Ltd, 3.5000%, 1/15/28 | $2,532,000 | $2,299,374 | |||||
Dell International LLC / EMC Corp, 6.0200%, 6/15/26 (144A) | 29,873,000 | 31,813,139 | |||||
First Data Corp, 7.0000%, 12/1/23 (144A) | 12,086,000 | 12,584,547 | |||||
Marvell Technology Group Ltd, 4.2000%, 6/22/23 | 5,556,000 | 5,527,334 | |||||
Marvell Technology Group Ltd, 4.8750%, 6/22/28 | 6,303,000 | 6,332,534 | |||||
Microchip Technology Inc, 3.9220%, 6/1/21 (144A) | 6,028,000 | 5,992,267 | |||||
Total System Services Inc, 3.8000%, 4/1/21 | 6,313,000 | 6,334,392 | |||||
Total System Services Inc, 4.8000%, 4/1/26 | 13,021,000 | 13,393,093 | |||||
Trimble Inc, 4.7500%, 12/1/24 | 20,920,000 | 21,178,456 | |||||
Trimble Inc, 4.9000%, 6/15/28 | 30,019,000 | 30,174,812 | |||||
Verisk Analytics Inc, 4.8750%, 1/15/19 | 7,016,000 | 7,052,742 | |||||
Verisk Analytics Inc, 5.8000%, 5/1/21 | 12,036,000 | 12,664,619 | |||||
Verisk Analytics Inc, 4.1250%, 9/12/22 | 6,825,000 | 6,904,969 | |||||
Verisk Analytics Inc, 5.5000%, 6/15/45 | 7,953,000 | 8,026,362 | |||||
200,899,449 | |||||||
Total Corporate Bonds (cost $1,835,924,291) | 1,828,879,093 | ||||||
Mortgage-Backed Securities – 8.7% | |||||||
Fannie Mae Pool: | |||||||
7.5000%, 7/1/28 | 131,622 | 142,504 | |||||
6.0000%, 2/1/37 | 439,712 | 487,893 | |||||
3.5000%, 10/1/42 | 5,596,518 | 5,550,756 | |||||
4.5000%, 11/1/42 | 1,823,487 | 1,897,620 | |||||
3.5000%, 12/1/42 | 13,077,864 | 12,906,423 | |||||
3.0000%, 2/1/43 | 452,340 | 436,397 | |||||
3.5000%, 2/1/43 | 13,039,395 | 12,868,447 | |||||
3.5000%, 2/1/43 | 3,200,371 | 3,158,415 | |||||
3.5000%, 4/1/43 | 28,741,220 | 28,364,420 | |||||
3.0000%, 5/1/43 | 1,677,248 | 1,618,064 | |||||
3.5000%, 11/1/43 | 17,610,728 | 17,379,864 | |||||
3.5000%, 4/1/44 | 6,320,117 | 6,267,432 | |||||
5.0000%, 7/1/44 | 419,892 | 450,253 | |||||
4.5000%, 10/1/44 | 4,176,751 | 4,369,360 | |||||
3.5000%, 2/1/45 | 13,112,232 | 12,940,174 | |||||
3.5000%, 2/1/45 | 4,695,630 | 4,633,994 | |||||
4.5000%, 3/1/45 | 6,967,455 | 7,287,697 | |||||
4.5000%, 6/1/45 | 4,139,074 | 4,299,397 | |||||
3.0000%, 10/1/45 | 3,468,661 | 3,322,690 | |||||
3.0000%, 10/1/45 | 2,187,686 | 2,095,625 | |||||
3.5000%, 12/1/45 | 4,101,801 | 4,062,445 | |||||
3.0000%, 1/1/46 | 908,758 | 871,283 | |||||
4.5000%, 2/1/46 | 10,789,179 | 11,224,970 | |||||
3.0000%, 3/1/46 | 29,915,631 | 28,671,907 | |||||
3.0000%, 3/1/46 | 20,137,182 | 19,299,993 | |||||
3.5000%, 5/1/46 | 2,702,512 | 2,669,722 | |||||
3.5000%, 7/1/46 | 13,670,601 | 13,504,734 | |||||
3.5000%, 7/1/46 | 7,578,091 | 7,484,584 | |||||
3.5000%, 8/1/46 | 4,395,524 | 4,340,395 | |||||
4.0000%, 10/1/46 | 504,270 | 511,021 | |||||
3.0000%, 11/1/46 | 6,892,694 | 6,602,931 | |||||
3.0000%, 11/1/46 | 2,147,275 | 2,058,874 | |||||
3.0000%, 11/1/46 | 2,049,476 | 1,965,063 | |||||
3.5000%, 12/1/46 | 1,391,816 | 1,373,923 | |||||
4.5000%, 12/1/46 | 4,225,518 | 4,381,586 | |||||
3.0000%, 2/1/47 | 18,957,921 | 18,307,935 | |||||
3.0000%, 3/1/47 | 14,181,776 | 13,597,834 | |||||
4.0000%, 5/1/47 | 2,866,210 | 2,897,377 | |||||
4.5000%, 5/1/47 | 1,418,123 | 1,478,670 | |||||
4.5000%, 5/1/47 | 1,167,954 | 1,213,842 | |||||
4.5000%, 5/1/47 | 1,159,827 | 1,205,896 | |||||
See Notes to Schedule of Investments and Other Information and Notes to Financial Statements. | |
Janus Investment Fund | 17 |
Janus Henderson Balanced Fund
Schedule of Investments
September 30, 2018
Shares
or | Value | ||||||
Mortgage-Backed Securities – (continued) | |||||||
Fannie Mae Pool – (continued) | |||||||
4.5000%, 5/1/47 | $853,647 | $890,638 | |||||
4.5000%, 5/1/47 | 819,210 | 851,396 | |||||
4.5000%, 5/1/47 | 687,407 | 716,640 | |||||
4.5000%, 5/1/47 | 402,779 | 418,813 | |||||
4.5000%, 5/1/47 | 291,197 | 303,355 | |||||
4.5000%, 5/1/47 | 263,794 | 274,798 | |||||
4.0000%, 6/1/47 | 1,495,080 | 1,514,897 | |||||
4.0000%, 6/1/47 | 739,057 | 746,656 | |||||
4.0000%, 6/1/47 | 707,054 | 716,434 | |||||
4.0000%, 6/1/47 | 336,263 | 339,943 | |||||
4.5000%, 6/1/47 | 5,142,843 | 5,344,900 | |||||
4.5000%, 6/1/47 | 505,406 | 526,508 | |||||
4.0000%, 7/1/47 | 1,281,752 | 1,298,770 | |||||
4.0000%, 7/1/47 | 1,170,111 | 1,185,647 | |||||
4.0000%, 7/1/47 | 556,412 | 563,800 | |||||
4.0000%, 7/1/47 | 357,622 | 362,368 | |||||
4.5000%, 7/1/47 | 3,745,085 | 3,892,225 | |||||
4.5000%, 7/1/47 | 3,295,141 | 3,424,605 | |||||
4.5000%, 7/1/47 | 3,204,358 | 3,330,255 | |||||
3.5000%, 8/1/47 | 6,342,266 | 6,253,835 | |||||
3.5000%, 8/1/47 | 3,915,474 | 3,859,465 | |||||
4.0000%, 8/1/47 | 7,299,962 | 7,375,152 | |||||
4.0000%, 8/1/47 | 2,226,142 | 2,255,698 | |||||
4.0000%, 8/1/47 | 1,359,835 | 1,377,890 | |||||
4.0000%, 8/1/47 | 597,386 | 603,524 | |||||
4.5000%, 8/1/47 | 4,477,343 | 4,653,254 | |||||
4.5000%, 8/1/47 | 878,292 | 912,800 | |||||
4.0000%, 9/1/47 | 708,905 | 718,317 | |||||
4.5000%, 9/1/47 | 2,973,892 | 3,090,741 | |||||
4.5000%, 9/1/47 | 1,036,039 | 1,076,747 | |||||
3.5000%, 10/1/47 | 16,985,075 | 16,727,238 | |||||
4.0000%, 10/1/47 | 3,364,199 | 3,408,864 | |||||
4.0000%, 10/1/47 | 2,863,047 | 2,901,060 | |||||
4.0000%, 10/1/47 | 2,638,985 | 2,674,024 | |||||
4.0000%, 10/1/47 | 1,802,492 | 1,826,424 | |||||
4.0000%, 10/1/47 | 1,539,483 | 1,559,923 | |||||
4.5000%, 10/1/47 | 704,805 | 732,497 | |||||
4.5000%, 10/1/47 | 327,352 | 340,214 | |||||
4.0000%, 11/1/47 | 8,025,161 | 8,117,933 | |||||
4.0000%, 11/1/47 | 4,670,719 | 4,721,599 | |||||
4.0000%, 11/1/47 | 3,833,190 | 3,884,084 | |||||
4.0000%, 11/1/47 | 1,506,860 | 1,526,867 | |||||
4.5000%, 11/1/47 | 3,488,310 | 3,625,370 | |||||
3.5000%, 12/1/47 | 17,547,832 | 17,282,434 | |||||
3.5000%, 12/1/47 | 6,905,352 | 6,814,800 | |||||
3.5000%, 12/1/47 | 4,716,778 | 4,650,571 | |||||
4.0000%, 12/1/47 | 9,149,504 | 9,249,175 | |||||
3.5000%, 1/1/48 | 6,971,628 | 6,878,293 | |||||
3.5000%, 1/1/48 | 5,070,615 | 5,007,130 | |||||
4.0000%, 1/1/48 | 17,537,285 | 17,728,118 | |||||
4.0000%, 1/1/48 | 17,381,837 | 17,612,628 | |||||
4.0000%, 1/1/48 | 2,007,546 | 2,037,491 | |||||
3.5000%, 3/1/48 | 3,030,351 | 2,992,409 | |||||
4.0000%, 3/1/48 | 7,334,675 | 7,432,631 | |||||
4.0000%, 3/1/48 | 1,771,044 | 1,797,433 | |||||
4.5000%, 3/1/48 | 5,967,530 | 6,220,966 | |||||
4.0000%, 4/1/48 | 3,811,217 | 3,868,009 | |||||
4.5000%, 4/1/48 | 4,523,349 | 4,720,335 | |||||
4.0000%, 5/1/48 | 18,563,551 | 18,754,082 | |||||
See Notes to Schedule of Investments and Other Information and Notes to Financial Statements. | |
18 | SEPTEMBER 30, 2018 |
Janus Henderson Balanced Fund
Schedule of Investments
September 30, 2018
Shares
or | Value | ||||||
Mortgage-Backed Securities – (continued) | |||||||
Fannie Mae Pool – (continued) | |||||||
4.0000%, 5/1/48 | $17,722,910 | $17,905,003 | |||||
4.5000%, 5/1/48 | 3,671,933 | 3,825,362 | |||||
4.5000%, 5/1/48 | 3,123,079 | 3,250,923 | |||||
4.0000%, 6/1/48 | 30,602,913 | 30,917,026 | |||||
4.0000%, 6/1/48 | 7,292,525 | 7,367,379 | |||||
4.5000%, 6/1/48 | 3,480,006 | 3,616,566 | |||||
4.0000%, 8/1/48 | 11,303,528 | 11,419,557 | |||||
4.0000%, 9/1/48 | 12,677,000 | 12,807,128 | |||||
3.5000%, 8/1/56 | 22,833,278 | 22,413,634 | |||||
3.0000%, 2/1/57 | 16,379,677 | 15,528,464 | |||||
651,226,125 | |||||||
Freddie Mac Gold Pool: | |||||||
6.0000%, 4/1/40 | 7,824,716 | 8,761,728 | |||||
3.5000%, 2/1/43 | 4,858,968 | 4,808,207 | |||||
3.5000%, 2/1/44 | 5,033,860 | 4,981,249 | |||||
4.5000%, 5/1/44 | 203,056 | 212,219 | |||||
3.5000%, 12/1/44 | 35,219,206 | 34,916,137 | |||||
3.0000%, 1/1/45 | 4,710,331 | 4,533,627 | |||||
4.0000%, 4/1/45 | 88,249 | 89,929 | |||||
4.0000%, 5/1/46 | 3,476,205 | 3,522,940 | |||||
3.5000%, 7/1/46 | 14,451,520 | 14,315,493 | |||||
3.5000%, 7/1/46 | 4,459,137 | 4,395,855 | |||||
3.0000%, 10/1/46 | 17,280,167 | 16,560,206 | |||||
3.5000%, 10/1/46 | 26,382,452 | 25,985,773 | |||||
3.0000%, 12/1/46 | 20,502,169 | 19,647,556 | |||||
3.5000%, 2/1/47 | 16,592,433 | 16,363,902 | |||||
3.5000%, 9/1/47 | 24,655,928 | 24,281,482 | |||||
3.5000%, 9/1/47 | 13,978,391 | 13,766,106 | |||||
3.5000%, 10/1/47 | 12,427,857 | 12,238,153 | |||||
3.5000%, 11/1/47 | 5,628,451 | 5,544,556 | |||||
3.5000%, 12/1/47 | 19,000,312 | 18,756,655 | |||||
3.5000%, 12/1/47 | 4,175,076 | 4,122,309 | |||||
3.5000%, 2/1/48 | 6,393,712 | 6,300,307 | |||||
3.5000%, 2/1/48 | 6,284,794 | 6,197,871 | |||||
3.5000%, 3/1/48 | 36,335,683 | 35,777,413 | |||||
3.5000%, 3/1/48 | 35,098,225 | 34,604,536 | |||||
3.5000%, 3/1/48 | 4,107,997 | 4,044,881 | |||||
4.0000%, 3/1/48 | 4,684,814 | 4,747,317 | |||||
4.0000%, 4/1/48 | 25,585,578 | 25,848,915 | |||||
4.0000%, 4/1/48 | 4,665,497 | 4,726,012 | |||||
4.0000%, 5/1/48 | 19,684,948 | 19,889,769 | |||||
4.0000%, 5/1/48 | 12,435,051 | 12,563,037 | |||||
4.0000%, 6/1/48 | 28,006,852 | 28,296,830 | |||||
4.0000%, 6/1/48 | 5,341,197 | 5,396,362 | |||||
4.0000%, 8/1/48 | 71,769,259 | 72,507,935 | |||||
4.0000%, 8/1/48 | 23,875,508 | 24,230,973 | |||||
4.5000%, 8/1/48 | 17,734,993 | 18,324,514 | |||||
4.5000%, 8/1/48 | 5,790,490 | 5,980,694 | |||||
547,241,448 | |||||||
Ginnie Mae I Pool: | |||||||
6.0000%, 1/15/34 | 118,421 | 128,594 | |||||
4.0000%, 1/15/45 | 15,661,131 | 16,038,311 | |||||
4.5000%, 8/15/46 | 18,391,753 | 19,241,137 | |||||
4.0000%, 7/15/47 | 9,976,386 | 10,148,912 | |||||
4.0000%, 8/15/47 | 2,107,781 | 2,144,193 | |||||
4.0000%, 11/15/47 | 4,222,896 | 4,308,647 | |||||
4.0000%, 12/15/47 | 5,353,975 | 5,462,722 | |||||
57,472,516 | |||||||
See Notes to Schedule of Investments and Other Information and Notes to Financial Statements. | |
Janus Investment Fund | 19 |
Janus Henderson Balanced Fund
Schedule of Investments
September 30, 2018
Shares
or | Value | ||||||
Mortgage-Backed Securities – (continued) | |||||||
Ginnie Mae II Pool: | |||||||
4.5000%, 10/20/41 | $4,501,495 | $4,657,736 | |||||
4.0000%, 8/20/47 | 1,627,334 | 1,666,337 | |||||
4.0000%, 8/20/47 | 791,715 | 810,690 | |||||
4.0000%, 8/20/47 | 391,889 | 401,282 | |||||
4.5000%, 5/20/48 | 9,996,569 | 10,429,565 | |||||
4.5000%, 5/20/48 | 2,386,376 | 2,489,741 | |||||
5.0000%, 7/20/48 | 101,292,177 | 106,057,944 | |||||
5.0000%, 9/20/48 | 20,816,000 | 21,766,524 | |||||
148,279,819 | |||||||
Total Mortgage-Backed Securities (cost $1,429,544,702) | 1,404,219,908 | ||||||
United States Treasury Notes/Bonds – 11.8% | |||||||
2.5000%, 5/31/20 | 144,952,800 | 144,267,672 | |||||
2.5000%, 6/30/20 | 230,275,000 | 229,105,636 | |||||
2.6250%, 7/31/20 | 221,936,000 | 221,216,441 | |||||
2.6250%, 8/31/20 | 381,508,900 | 380,152,754 | |||||
2.7500%, 5/31/23 | 47,274,000 | 46,889,899 | |||||
2.2500%, 11/15/27 | 35,935,000 | 33,638,529 | |||||
2.7500%, 2/15/28 | 10,174,000 | 9,922,432 | |||||
2.8750%, 8/15/28 | 207,891,500 | 204,740,644 | |||||
2.2500%, 8/15/46 | 39,150,000 | 32,312,514 | |||||
2.7500%, 11/15/47 | 186,911,000 | 171,001,661 | |||||
3.0000%, 2/15/48 | 82,857,000 | 79,704,550 | |||||
3.1250%, 5/15/48 | 64,042,500 | 63,159,414 | |||||
3.0000%, 8/15/48 | 307,227,000 | 295,501,970 | |||||
Total United States Treasury Notes/Bonds (cost $1,922,566,740) | 1,911,614,116 | ||||||
Common Stocks – 61.1% | |||||||
Aerospace & Defense – 3.3% | |||||||
Boeing Co | 952,069 | 354,074,461 | |||||
General Dynamics Corp | 898,519 | 183,944,810 | |||||
538,019,271 | |||||||
Air Freight & Logistics – 0.6% | |||||||
United Parcel Service Inc | 780,421 | 91,114,152 | |||||
Airlines – 0.3% | |||||||
Delta Air Lines Inc | 975,365 | 56,405,358 | |||||
Automobiles – 0.7% | |||||||
General Motors Co | 3,564,733 | 120,024,560 | |||||
Banks – 2.5% | |||||||
Bank of America Corp | 3,551,619 | 104,630,696 | |||||
US Bancorp | 5,714,179 | 301,765,793 | |||||
406,396,489 | |||||||
Biotechnology – 0.2% | |||||||
AbbVie Inc | 338,092 | 31,976,741 | |||||
Capital Markets – 3.6% | |||||||
Blackstone Group LP | 2,742,159 | 104,421,415 | |||||
CME Group Inc | 1,458,826 | 248,306,773 | |||||
Goldman Sachs Group Inc | 142,081 | 31,860,243 | |||||
Morgan Stanley | 923,448 | 43,004,973 | |||||
TD Ameritrade Holding Corp | 2,810,087 | 148,456,896 | |||||
576,050,300 | |||||||
Chemicals – 1.5% | |||||||
LyondellBasell Industries NV | 2,426,679 | 248,758,864 | |||||
Consumer Finance – 1.4% | |||||||
American Express Co | 845,469 | 90,033,994 | |||||
Synchrony Financial | 4,581,169 | 142,382,733 | |||||
232,416,727 | |||||||
Electronic Equipment, Instruments & Components – 0.4% | |||||||
Corning Inc | 1,855,270 | 65,491,031 | |||||
See Notes to Schedule of Investments and Other Information and Notes to Financial Statements. | |
20 | SEPTEMBER 30, 2018 |
Janus Henderson Balanced Fund
Schedule of Investments
September 30, 2018
Shares
or | Value | ||||||
Common Stocks – (continued) | |||||||
Equity Real Estate Investment Trusts (REITs) – 1.0% | |||||||
Crown Castle International Corp | 669,927 | $74,582,973 | |||||
MGM Growth Properties LLC | 1,441,854 | 42,520,274 | |||||
Outfront Media Inc | 1,998,955 | 39,879,152 | |||||
156,982,399 | |||||||
Food & Staples Retailing – 3.4% | |||||||
Costco Wholesale Corp | 1,162,010 | 272,932,909 | |||||
Kroger Co | 3,279,338 | 95,461,529 | |||||
Sysco Corp | 2,410,191 | 176,546,491 | |||||
544,940,929 | |||||||
Food Products – 0.5% | |||||||
Hershey Co | 842,925 | 85,978,350 | |||||
Health Care Equipment & Supplies – 2.5% | |||||||
Abbott Laboratories | 2,430,209 | 178,280,132 | |||||
Medtronic PLC | 2,309,431 | 227,178,727 | |||||
405,458,859 | |||||||
Health Care Providers & Services – 0.8% | |||||||
Aetna Inc | 666,141 | 135,126,702 | |||||
Hotels, Restaurants & Leisure – 2.6% | |||||||
Hilton Worldwide Holdings Inc | 581,605 | 46,982,052 | |||||
McDonald's Corp | 1,509,258 | 252,483,771 | |||||
Norwegian Cruise Line Holdings Ltd* | 972,239 | 55,835,686 | |||||
Six Flags Entertainment Corp | 870,314 | 60,765,323 | |||||
416,066,832 | |||||||
Household Products – 0.4% | |||||||
Clorox Co | 378,553 | 56,938,157 | |||||
Industrial Conglomerates – 1.5% | |||||||
3M Co | 364,248 | 76,750,696 | |||||
Honeywell International Inc | 991,646 | 165,009,894 | |||||
241,760,590 | |||||||
Information Technology Services – 4.3% | |||||||
Accenture PLC | 1,171,090 | 199,319,518 | |||||
Automatic Data Processing Inc | 310,034 | 46,709,722 | |||||
Mastercard Inc | 2,023,158 | 450,375,202 | |||||
696,404,442 | |||||||
Insurance – 0.6% | |||||||
Progressive Corp | 1,361,761 | 96,739,501 | |||||
Internet & Direct Marketing Retail – 0.6% | |||||||
Booking Holdings Inc* | 45,385 | 90,043,840 | |||||
Internet Software & Services – 2.4% | |||||||
Alphabet Inc - Class C* | 318,227 | 379,794,378 | |||||
Leisure Products – 0.5% | |||||||
Hasbro Inc | 842,501 | 88,563,705 | |||||
Machinery – 1.3% | |||||||
Deere & Co | 535,016 | 80,428,955 | |||||
Parker-Hannifin Corp | 292,298 | 53,762,371 | |||||
Stanley Black & Decker Inc | 483,828 | 70,851,772 | |||||
205,043,098 | |||||||
Media – 1.5% | |||||||
Comcast Corp | 5,629,626 | 199,345,057 | |||||
Madison Square Garden Co* | 135,219 | 42,637,255 | |||||
241,982,312 | |||||||
Oil, Gas & Consumable Fuels – 1.9% | |||||||
Anadarko Petroleum Corp | 2,035,819 | 137,234,559 | |||||
Suncor Energy Inc | 2,478,312 | 95,885,891 | |||||
Suncor Energy Incž | 2,045,212 | 79,148,042 | |||||
312,268,492 | |||||||
Personal Products – 0.6% | |||||||
Estee Lauder Cos Inc | 715,670 | 104,001,164 | |||||
See Notes to Schedule of Investments and Other Information and Notes to Financial Statements. | |
Janus Investment Fund | 21 |
Janus Henderson Balanced Fund
Schedule of Investments
September 30, 2018
Shares
or | Value | ||||||
Common Stocks – (continued) | |||||||
Pharmaceuticals – 3.7% | |||||||
Allergan PLC | 771,173 | $146,893,033 | |||||
Bristol-Myers Squibb Co | 1,093,733 | 67,898,945 | |||||
Eli Lilly & Co | 1,552,108 | 166,556,709 | |||||
Merck & Co Inc | 3,126,348 | 221,783,127 | |||||
603,131,814 | |||||||
Real Estate Management & Development – 0.8% | |||||||
CBRE Group Inc* | 2,817,806 | 124,265,245 | |||||
Road & Rail – 1.5% | |||||||
CSX Corp | 3,185,078 | 235,855,026 | |||||
Semiconductor & Semiconductor Equipment – 1.8% | |||||||
Intel Corp | 4,012,711 | 189,761,103 | |||||
Lam Research Corp | 647,215 | 98,182,515 | |||||
287,943,618 | |||||||
Software – 5.5% | |||||||
Activision Blizzard Inc | 629,922 | 52,403,211 | |||||
Adobe Systems Inc* | 803,268 | 216,842,197 | |||||
Microsoft Corp | 4,863,605 | 556,248,051 | |||||
salesforce.com Inc* | 408,052 | 64,892,510 | |||||
890,385,969 | |||||||
Specialty Retail – 1.7% | |||||||
Home Depot Inc | 1,347,184 | 279,069,166 | |||||
Technology Hardware, Storage & Peripherals – 2.1% | |||||||
Apple Inc | 1,537,208 | 347,009,334 | |||||
Textiles, Apparel & Luxury Goods – 1.2% | |||||||
NIKE Inc | 2,201,650 | 186,523,788 | |||||
Tobacco – 1.9% | |||||||
Altria Group Inc | 4,998,363 | 301,451,273 | |||||
Total Common Stocks (cost $5,920,137,718) | 9,880,382,476 | ||||||
Preferred Stocks – 0% | |||||||
Real Estate Investment Trusts (REITs) – 0% | |||||||
Colony American Homes III LP*,¢,£,§ (cost $487,924) | 6,162,871 | 454,204 | |||||
Investment Companies – 0.8% | |||||||
Money Markets – 0.8% | |||||||
Janus Henderson Cash Liquidity Fund LLC, 2.0479%ºº,£ (cost $121,239,500) | 121,239,500 | 121,239,500 | |||||
Total Investments (total cost $12,268,938,385) – 100.1% | 16,183,768,805 | ||||||
Liabilities, net of Cash, Receivables and Other Assets – (0.1)% | (22,217,768) | ||||||
Net Assets – 100% | $16,161,551,037 | ||||||
Summary of Investments by Country - (Long Positions) (unaudited) | |||||
% of | |||||
Investment | |||||
Country | Value | Securities | |||
United States | $15,605,224,205 | 96.4 | % | ||
Cayman Islands | 280,777,342 | 1.7 | |||
Canada | 208,377,114 | 1.3 | |||
Germany | 25,727,989 | 0.2 | |||
Israel | 23,830,849 | 0.2 | |||
United Kingdom | 23,237,016 | 0.1 | |||
Switzerland | 14,164,470 | 0.1 | |||
South Africa | 2,429,820 | 0.0 | |||
Total | $16,183,768,805 | 100.0 | % |
See Notes to Schedule of Investments and Other Information and Notes to Financial Statements. | |
22 | SEPTEMBER 30, 2018 |
Janus Henderson Balanced Fund
Schedule of Investments
September 30, 2018
Schedules of Affiliated Investments – (% of Net Assets)
Dividend Income(1) | Realized Gain/(Loss)(1) | Change in Unrealized Appreciation/ Depreciation(1) | Value at 9/30/18 | |||||||
Preferred Stocks - 0.0% | ||||||||||
Real Estate Investment Trusts (REITs) - 0.0% | ||||||||||
Colony American Homes III LP*,¢,§ | $ | - | $ | - | $ | 58,336 | $ | 454,204 | ||
Investment Companies - 0.8% | ||||||||||
Investments Purchased with Cash Collateral from Securities Lending - N/A | ||||||||||
Janus Henderson Cash Collateral Fund LLC, 1.9772%ºº | 26,586∆ | - | - | - | ||||||
Money Markets - 0.8% | ||||||||||
Janus Henderson Cash Liquidity Fund LLC, 2.0479%ºº | 5,859,256 | - | - | 121,239,500 | ||||||
Total Investment Companies | $ | 5,885,842 | $ | - | $ | - | $ | 121,239,500 | ||
Total Affiliated Investments - 0.8% | $ | 5,885,842 | $ | - | $ | 58,336 | $ | 121,693,704 | ||
(1) For securities that were affiliated for a portion of the year ended September 30, 2018, this column reflects amounts for the entire year ended September 30, 2018 and not just the period in which the security was affiliated.
Share Balance at 9/30/17 | Purchases | Sales | Share Balance at 9/30/18 | |||||||
Preferred Stocks - 0.0% | ||||||||||
Real Estate Investment Trusts (REITs) - 0.0% | ||||||||||
Colony American Homes III LP*,¢,§ | 6,162,871 | - | - | 6,162,871 | ||||||
Investment Companies - 0.8% | ||||||||||
Investments Purchased with Cash Collateral from Securities Lending - N/A | ||||||||||
Janus Henderson Cash Collateral Fund LLC, 1.9772%ºº | - | 91,381,250 | (91,381,250) | - | ||||||
Money Markets - 0.8% | ||||||||||
Janus Henderson Cash Liquidity Fund LLC, 2.0479%ºº | 178,494,294 | 5,382,213,206 | (5,439,468,000) | 121,239,500 | ||||||
See Notes to Schedule of Investments and Other Information and Notes to Financial Statements. | |
Janus Investment Fund | 23 |
Janus Henderson Balanced Fund
Notes to Schedule of Investments and Other Information
Balanced Index | Balanced Index is an internally-calculated, hypothetical combination of total returns from the S&P 500® Index (55%) and the Bloomberg Barclays U.S. Aggregate Bond Index (45%). |
Bloomberg Barclays U.S. Aggregate Bond Index | Bloomberg Barclays U.S. Aggregate Bond Index is a broad-based measure of the investment grade, US dollar-denominated, fixed-rate taxable bond market. |
S&P 500® Index | S&P 500® Index reflects U.S. large-cap equity performance and represents broad U.S. equity market performance. |
ICE | Intercontinental Exchange |
LIBOR | London Interbank Offered Rate |
LLC | Limited Liability Company |
LP | Limited Partnership |
PLC | Public Limited Company |
144A | Securities sold under Rule 144A of the Securities Act of 1933, as amended, are subject to legal and/or contractual restrictions on resale and may not be publicly sold without registration under the 1933 Act. Unless otherwise noted, these securities have been determined to be liquid under guidelines established by the Board of Trustees. The total value of 144A securities as of the year ended September 30, 2018 is $1,080,244,839, which represents 6.7% of net assets. |
* | Non-income producing security. |
(a) | All or a portion of this position is not funded, or has been purchased on a delayed delivery or when-issued basis. If applicable, interest rates will be determined and interest will begin to accrue at a future date. See Notes to Financial Statements. |
‡ | Variable or floating rate security. Rate shown is the current rate as of September 30, 2018. Certain variable rate securities are not based on a published reference rate and spread; they are determined by the issuer or agent and current market conditions. Reference rate is as of reset date and may vary by security, which may not indicate a reference rate and/or spread in their description. |
ž | Issued by the same entity and traded on separate exchanges. |
ºº | Rate shown is the 7-day yield as of September 30, 2018. |
Ç | Step bond. The coupon rate will increase or decrease periodically based upon a predetermined schedule. The rate shown reflects the current rate. |
¢ | Security is valued using significant unobservable inputs. |
£ | The Fund may invest in certain securities that are considered affiliated companies. As defined by the Investment Company Act of 1940, as amended, an affiliated company is one in which the Fund owns 5% or more of the outstanding voting securities, or a company which is under common ownership or control. |
∆ | Net of income paid to the securities lending agent and rebates paid to the borrowing counterparties. |
24 | SEPTEMBER 30, 2018 |
Janus Henderson Balanced Fund
Notes to Schedule of Investments and Other Information
§ | Schedule of Restricted and Illiquid Securities (as of September 30, 2018) | |||||||||
Value as a | ||||||||||
Acquisition | % of Net | |||||||||
Date | Cost | Value | Assets | |||||||
Colony American Homes III LP | 1/30/13 | $ | 487,924 | $ | 454,204 | 0.0 | % | |||
loanDepot Station Place Agency Securitization Trust 2017-1, ICE LIBOR USD 1 Month + 0.8000%, 3.0158%, 11/25/50 | 11/29/17-3/23/18 | 16,599,155 | 16,547,641 | 0.1 | ||||||
loanDepot Station Place Agency Securitization Trust 2017-1, ICE LIBOR USD 1 Month + 1.0000%, 3.2158%, 11/25/50 | 11/29/17 | 3,279,000 | 3,271,137 | 0.0 | ||||||
Moffett Towers Phase II, ICE LIBOR USD 1 Month + 2.8000%, 4.9590%, 6/15/21 | 6/25/2018-9/7/18 | 20,141,829 | 20,106,913 | 0.1 | ||||||
Total | $ | 40,507,908 | $ | 40,379,895 | 0.2 | % | ||||
The Fund has registration rights for certain restricted securities held as of September 30, 2018. The issuer incurs all registration costs. | ||||||||||
The following is a summary of the inputs that were used to value the Fund’s investments in securities and other financial instruments as of September 30, 2018. See Notes to Financial Statements for more information. | ||||||||||||
Valuation Inputs Summary | ||||||||||||
Level 2 - | Level 3 - | |||||||||||
Level 1 - | Other Significant | Significant | ||||||||||
Quoted Prices | Observable Inputs | Unobservable Inputs | ||||||||||
Assets | ||||||||||||
Investments in Securities: | ||||||||||||
Asset-Backed/Commercial Mortgage-Backed Securities | $ | - | $ | 794,095,818 | $ | - | ||||||
Bank Loans and Mezzanine Loans | - | 242,883,690 | - | |||||||||
Corporate Bonds | - | 1,828,879,093 | - | |||||||||
Mortgage-Backed Securities | - | 1,404,219,908 | - | |||||||||
United States Treasury Notes/Bonds | - | 1,911,614,116 | - | |||||||||
Common Stocks | 9,880,382,476 | - | - | |||||||||
Preferred Stocks | - | - | 454,204 | |||||||||
Investment Companies | - | 121,239,500 | - | |||||||||
Total Assets | $ | 9,880,382,476 | $ | 6,302,932,125 | $ | 454,204 | ||||||
Janus Investment Fund | 25 |
Janus Henderson Balanced Fund
Statement of Assets and Liabilities
September 30, 2018
See footnotes at the end of the Statement. |
|
|
|
|
|
|
|
Assets: | ||||||
Unaffiliated investments, at value(1) | $ | 16,062,075,101 | ||||
Affiliated investments, at value(2) | 121,693,704 | |||||
Non-interested Trustees' deferred compensation | 347,501 | |||||
Receivables: | ||||||
Investments sold | 155,630,119 | |||||
Interest | 40,359,038 | |||||
Fund shares sold | 28,897,480 | |||||
Dividends | 10,422,525 | |||||
Dividends from affiliates | 227,531 | |||||
Other assets | 69,841 | |||||
Total Assets |
|
| 16,419,722,840 |
| ||
Liabilities: | ||||||
Due to custodian | 35,543,914 | |||||
Payables: | — | |||||
Investments purchased | 177,917,670 | |||||
Fund shares repurchased | 28,725,454 | |||||
Advisory fees | 7,225,467 | |||||
Dividends | 3,515,202 | |||||
Transfer agent fees and expenses | 2,288,738 | |||||
12b-1 Distribution and shareholder servicing fees | 1,713,856 | |||||
Non-interested Trustees' deferred compensation fees | 347,501 | |||||
Non-interested Trustees' fees and expenses | 88,063 | |||||
Professional fees | 60,125 | |||||
Affiliated fund administration fees payable | 32,843 | |||||
Custodian fees | 7,952 | |||||
Accrued expenses and other payables | 705,018 | |||||
Total Liabilities |
|
| 258,171,803 |
| ||
Net Assets |
| $ | 16,161,551,037 |
| ||
See Notes to Financial Statements. | |
26 | SEPTEMBER 30, 2018 |
Janus Henderson Balanced Fund
Statement of Assets and Liabilities
September 30, 2018
|
|
|
|
|
|
|
Net Assets Consist of: | ||||||
Capital (par value and paid-in surplus) | $ | 11,740,783,628 | ||||
Total distributable earnings (loss) | 4,420,767,409 | |||||
Total Net Assets |
| $ | 16,161,551,037 |
| ||
Net Assets - Class A Shares | $ | 768,529,470 | ||||
Shares Outstanding, $0.01 Par Value (unlimited shares authorized) | 21,822,057 | |||||
Net Asset Value Per Share(3) |
| $ | 35.22 |
| ||
Maximum Offering Price Per Share(4) |
| $ | 37.37 |
| ||
Net Assets - Class C Shares | $ | 1,594,610,383 | ||||
Shares Outstanding, $0.01 Par Value (unlimited shares authorized) | 45,689,587 | |||||
Net Asset Value Per Share(3) |
| $ | 34.90 |
| ||
Net Assets - Class D Shares | $ | 1,761,817,499 | ||||
Shares Outstanding, $0.01 Par Value (unlimited shares authorized) | 49,908,234 | |||||
Net Asset Value Per Share |
| $ | 35.30 |
| ||
Net Assets - Class I Shares | $ | 3,197,893,153 | ||||
Shares Outstanding, $0.01 Par Value (unlimited shares authorized) | 90,560,521 | |||||
Net Asset Value Per Share |
| $ | 35.31 |
| ||
Net Assets - Class N Shares | $ | 2,480,945,292 | ||||
Shares Outstanding, $0.01 Par Value (unlimited shares authorized) | 70,323,208 | |||||
Net Asset Value Per Share |
| $ | 35.28 |
| ||
Net Assets - Class R Shares | $ | 345,666,611 | ||||
Shares Outstanding, $0.01 Par Value (unlimited shares authorized) | 9,869,913 | |||||
Net Asset Value Per Share |
| $ | 35.02 |
| ||
Net Assets - Class S Shares | $ | 589,812,469 | ||||
Shares Outstanding, $0.01 Par Value (unlimited shares authorized) | 16,754,116 | |||||
Net Asset Value Per Share |
| $ | 35.20 |
| ||
Net Assets - Class T Shares | $ | 5,422,276,160 | ||||
Shares Outstanding, $0.01 Par Value (unlimited shares authorized) | 153,798,677 | |||||
Net Asset Value Per Share |
| $ | 35.26 |
| ||
(1) Includes cost of $12,147,210,961. (2) Includes cost of $121,727,424. (3) Redemption price per share may be reduced for any applicable contingent deferred sales charge. (4) Maximum offering price is computed at 100/94.25 of net asset value. |
See Notes to Financial Statements. | |
Janus Investment Fund | 27 |
Janus Henderson Balanced Fund
Statement of Operations
For the year ended September 30, 2018
|
|
|
|
|
|
Investment Income: | |||||
| Dividends | $ | 181,290,664 | ||
Interest | 165,567,539 | ||||
Dividends from affiliates | 5,859,256 | ||||
Affiliated securities lending income, net | 26,586 | ||||
Other income | 465,307 | ||||
Foreign tax withheld | (501,840) | ||||
Total Investment Income |
| 352,707,512 |
| ||
Expenses: | |||||
Advisory fees | 79,656,640 | ||||
12b-1 Distribution and shareholder servicing fees: | |||||
Class A Shares | 1,661,460 | ||||
Class C Shares | 13,690,325 | ||||
Class R Shares | 1,688,060 | ||||
Class S Shares | 1,521,420 | ||||
Transfer agent administrative fees and expenses: | |||||
Class D Shares | 1,995,524 | ||||
Class R Shares | 846,753 | ||||
Class S Shares | 1,521,420 | ||||
Class T Shares | 12,713,952 | ||||
Transfer agent networking and omnibus fees: | |||||
Class A Shares | 790,938 | ||||
Class C Shares | 911,610 | ||||
Class I Shares | 1,582,679 | ||||
Other transfer agent fees and expenses: | |||||
Class A Shares | 66,917 | ||||
Class C Shares | 123,514 | ||||
Class D Shares | 233,790 | ||||
Class I Shares | 91,919 | ||||
Class N Shares | 59,586 | ||||
Class R Shares | 4,143 | ||||
Class S Shares | 6,990 | ||||
Class T Shares | 59,855 | ||||
Affiliated fund administration fees | 691,055 | ||||
Shareholder reports expense | 666,822 | ||||
Non-interested Trustees’ fees and expenses | 381,877 | ||||
Registration fees | 305,895 | ||||
Professional fees | 167,127 | ||||
Custodian fees | 94,545 | ||||
Other expenses | 1,011,195 | ||||
Total Expenses |
| 122,546,011 |
| ||
Less: Excess Expense Reimbursement and Waivers |
| (184,939) |
| ||
Net Expenses |
| 122,361,072 |
| ||
Net Investment Income/(Loss) |
| 230,346,440 |
| ||
See Notes to Financial Statements. | |
28 | SEPTEMBER 30, 2018 |
Janus Henderson Balanced Fund
Statement of Operations
For the year ended September 30, 2018
|
|
|
|
|
|
Net Realized Gain/(Loss) on Investments: | |||||
Investments and foreign currency transactions | $ | 605,635,750 | |||
Total Net Realized Gain/(Loss) on Investments |
| 605,635,750 |
| ||
Change in Unrealized Net Appreciation/Depreciation: | |||||
Investments, foreign currency translations and non-interested Trustees’ deferred compensation | 1,047,366,147 | ||||
Investments in affiliates | 58,336 | ||||
Total Change in Unrealized Net Appreciation/Depreciation |
| 1,047,424,483 |
| ||
Net Increase/(Decrease) in Net Assets Resulting from Operations | $ | 1,883,406,673 |
| ||
See Notes to Financial Statements. | |
Janus Investment Fund | 29 |
Janus Henderson Balanced Fund
Statements of Changes in Net Assets
See footnotes at the end of the Statement. |
|
|
| Year
ended |
| Year ended | |||
Operations: | ||||||||
Net investment income/(loss) | $ | 230,346,440 | $ | 230,899,526 | ||||
Net realized gain/(loss) on investments | 605,635,750 | 431,355,435 | ||||||
Change in unrealized net appreciation/depreciation | 1,047,424,483 | 1,204,248,156 | ||||||
Net Increase/(Decrease) in Net Assets Resulting from Operations |
| 1,883,406,673 |
|
| 1,866,503,117 | |||
Dividends and Distributions to Shareholders(1) | ||||||||
Class A Shares | (30,992,137) | N/A | ||||||
Class C Shares | (56,163,240) | N/A | ||||||
Class D Shares | (81,003,352) | N/A | ||||||
Class I Shares | (117,849,780) | N/A | ||||||
Class N Shares | (111,964,032) | N/A | ||||||
Class R Shares | (15,173,092) | N/A | ||||||
Class S Shares | (28,750,295) | N/A | ||||||
Class T Shares | (241,991,501) | N/A | ||||||
| Total Dividends and Distributions to Shareholders |
| (683,887,429) |
|
| N/A | ||
Dividends from Net Investment Income(1) | ||||||||
Class A Shares | N/A | (14,776,686) | ||||||
Class C Shares | N/A | (17,227,608) | ||||||
Class D Shares | N/A | (31,704,825) | ||||||
Class I Shares | N/A | (40,126,722) | ||||||
Class N Shares | N/A | (44,255,552) | ||||||
Class R Shares | N/A | (5,485,701) | ||||||
Class S Shares | N/A | (11,523,204) | ||||||
Class T Shares | N/A | (94,843,741) | ||||||
| Total Dividends from Net Investment Income |
| N/A |
|
| (259,944,039) | ||
Distributions from Net Realized Gain from Investment Transactions(1) | ||||||||
Class A Shares | N/A | (10,879,238) | ||||||
Class C Shares | N/A | (15,956,168) | ||||||
Class D Shares | N/A | (16,710,703) | ||||||
Class I Shares | N/A | (18,975,938) | ||||||
Class N Shares | N/A | (21,666,308) | ||||||
Class R Shares | N/A | (4,011,088) | ||||||
Class S Shares | N/A | (7,629,078) | ||||||
Class T Shares | N/A | (53,548,122) | ||||||
| Total Distributions from Net Realized Gain from Investment Transactions | N/A |
|
| (149,376,643) | |||
Net Decrease from Dividends and Distributions to Shareholders |
| (683,887,429) |
|
| (409,320,682) | |||
See Notes to Financial Statements. | |
30 | SEPTEMBER 30, 2018 |
Janus Henderson Balanced Fund
Statements of Changes in Net Assets
|
|
| Year
ended |
| Year ended | |||
Capital Share Transactions: | ||||||||
Class A Shares | 88,399,391 | (470,623,952) | ||||||
Class C Shares | 188,299,862 | (265,021,176) | ||||||
Class D Shares | 61,673,527 | (15,229,904) | ||||||
Class I Shares | 893,081,658 | 258,374,590 | ||||||
Class N Shares | 237,724,253 | (1,026,029) | ||||||
Class R Shares | (23,285,543) | 21,735,604 | ||||||
Class S Shares | (81,834,698) | (106,679,612) | ||||||
Class T Shares | 266,928,381 | (452,209,506) | ||||||
Net Increase/(Decrease) from Capital Share Transactions |
| 1,630,986,831 |
|
| (1,030,679,985) | |||
Net Increase/(Decrease) in Net Assets |
| 2,830,506,075 |
|
| 426,502,450 | |||
Net Assets: | ||||||||
Beginning of period | 13,331,044,962 | 12,904,542,512 | ||||||
| End of period(2) | $ | 16,161,551,037 |
| $ | 13,331,044,962 | ||
(1) The requirement to disclose dividends and distributions paid to shareholders from net investment income and/or net realized gain from investment transactions was eliminated by the SEC (Securities Exchange Commission) in 2018. (2) Net assets - End of period includes undistributed (overdistributed) net investment income of $16,297,709 as of September 30, 2017. The requirement to disclose undistributed (overdistributed) net investment income was eliminated by the SEC in 2018. |
See Notes to Financial Statements. | |
Janus Investment Fund | 31 |
Janus Henderson Balanced Fund
Financial Highlights
Class A Shares | ||||||||||||||||||
For a share outstanding during the year ended September 30 |
| 2018 |
|
| 2017 |
|
| 2016 |
|
| 2015 |
|
| 2014 |
| |||
Net Asset Value, Beginning of Period |
| $32.46 |
|
| $29.00 |
|
| $29.12 |
|
| $31.10 |
|
| $29.11 |
| |||
Income/(Loss) from Investment Operations: | ||||||||||||||||||
Net investment income/(loss)(1) | 0.50 | 0.52 | 0.47 | 0.55 | 0.49 | |||||||||||||
Net realized and unrealized gain/(loss) | 3.87 | 3.88 | 1.22 | (0.70) | 2.83 | |||||||||||||
Total from Investment Operations |
| 4.37 |
|
| 4.40 |
|
| 1.69 |
|
| (0.15) |
|
| 3.32 |
| |||
Less Dividends and Distributions: | ||||||||||||||||||
Dividends (from net investment income) | (0.50) | (0.59) | (0.48) | (0.52) | (0.47) | |||||||||||||
Distributions (from capital gains) | (1.11) | (0.35) | (1.33) | (1.31) | (0.86) | |||||||||||||
Total Dividends and Distributions |
| (1.61) |
|
| (0.94) |
|
| (1.81) |
|
| (1.83) |
|
| (1.33) |
| |||
Net Asset Value, End of Period | $35.22 | $32.46 | $29.00 | $29.12 | $31.10 | |||||||||||||
Total Return* |
| 13.81% |
|
| 15.44% |
|
| 5.86% |
|
| (0.59)% |
|
| 11.65% |
| |||
Net Assets, End of Period (in thousands) | $768,529 | $625,454 | $1,008,842 | $966,624 | $835,681 | |||||||||||||
Average Net Assets for the Period (in thousands) | $666,296 | $781,785 | $1,037,006 | $941,167 | $839,360 | |||||||||||||
Ratios to Average Net Assets**: |
|
|
|
|
|
|
|
|
|
|
|
|
|
|
| |||
Ratio of Gross Expenses | 0.95% | 0.94% | 0.94% | 0.93% | 0.95% | |||||||||||||
Ratio of Net Expenses (After Waivers and Expense Offsets) | 0.95% | 0.94% | 0.94% | 0.93% | 0.95% | |||||||||||||
Ratio of Net Investment Income/(Loss) | 1.48% | 1.68% | 1.63% | 1.78% | 1.61% | |||||||||||||
Portfolio Turnover Rate | 88% | 60% | 83% | 75% | 72% | |||||||||||||
1 | ||||||||||||||||||
Class C Shares | ||||||||||||||||||
For a share outstanding during the year ended September 30 |
| 2018 |
|
| 2017 |
|
| 2016 |
|
| 2015 |
|
| 2014 |
| |||
Net Asset Value, Beginning of Period |
| $32.19 |
|
| $28.78 |
|
| $28.95 |
|
| $30.93 |
|
| $29.00 |
| |||
Income/(Loss) from Investment Operations: | ||||||||||||||||||
Net investment income/(loss)(1) | 0.27 | 0.31 | 0.26 | 0.34 | 0.27 | |||||||||||||
Net realized and unrealized gain/(loss) | 3.84 | 3.85 | 1.20 | (0.69) | 2.80 | |||||||||||||
Total from Investment Operations |
| 4.11 |
|
| 4.16 |
|
| 1.46 |
|
| (0.35) |
|
| 3.07 |
| |||
Less Dividends and Distributions: | ||||||||||||||||||
Dividends (from net investment income) | (0.29) | (0.40) | (0.30) | (0.32) | (0.28) | |||||||||||||
Distributions (from capital gains) | (1.11) | (0.35) | (1.33) | (1.31) | (0.86) | |||||||||||||
Total Dividends and Distributions |
| (1.40) |
|
| (0.75) |
|
| (1.63) |
|
| (1.63) |
|
| (1.14) |
| |||
Net Asset Value, End of Period | $34.90 | $32.19 | $28.78 | $28.95 | $30.93 | |||||||||||||
Total Return* |
| 13.06% |
|
| 14.67% |
|
| 5.09% |
|
| (1.25)% |
|
| 10.78% |
| |||
Net Assets, End of Period (in thousands) | $1,594,610 | $1,290,994 | $1,408,455 | $1,267,034 | $996,498 | |||||||||||||
Average Net Assets for the Period (in thousands) | $1,403,777 | $1,322,392 | $1,401,426 | $1,175,456 | $874,136 | |||||||||||||
Ratios to Average Net Assets**: |
|
|
|
|
|
|
|
|
|
|
|
|
|
|
| |||
Ratio of Gross Expenses | 1.62% | 1.61% | 1.65% | 1.61% | 1.68% | |||||||||||||
Ratio of Net Expenses (After Waivers and Expense Offsets) | 1.62% | 1.61% | 1.65% | 1.61% | 1.68% | |||||||||||||
Ratio of Net Investment Income/(Loss) | 0.81% | 1.03% | 0.92% | 1.10% | 0.88% | |||||||||||||
Portfolio Turnover Rate | 88% | 60% | 83% | 75% | 72% | |||||||||||||
* Total return not annualized for periods of less than one full year. ** Annualized for periods of less than one full year. (1) Per share amounts are calculated based on average shares outstanding during the year or period. |
See Notes to Financial Statements. | |
32 | SEPTEMBER 30, 2018 |
Janus Henderson Balanced Fund
Financial Highlights
Class D Shares | ||||||||||||||||||
For a share outstanding during the year ended September 30 |
| 2018 |
|
| 2017 |
|
| 2016 |
|
| 2015 |
|
| 2014 |
| |||
Net Asset Value, Beginning of Period |
| $32.52 |
|
| $29.06 |
|
| $29.17 |
|
| $31.14 |
|
| $29.15 |
| |||
Income/(Loss) from Investment Operations: | ||||||||||||||||||
Net investment income/(loss)(1) | 0.58 | 0.59 | 0.53 | 0.61 | 0.56 | |||||||||||||
Net realized and unrealized gain/(loss) | 3.89 | 3.88 | 1.22 | (0.69) | 2.82 | |||||||||||||
Total from Investment Operations |
| 4.47 |
|
| 4.47 |
|
| 1.75 |
|
| (0.08) |
|
| 3.38 |
| |||
Less Dividends and Distributions: | ||||||||||||||||||
Dividends (from net investment income) | (0.58) | (0.66) | (0.53) | (0.58) | (0.53) | |||||||||||||
Distributions (from capital gains) | (1.11) | (0.35) | (1.33) | (1.31) | (0.86) | |||||||||||||
Total Dividends and Distributions |
| (1.69) |
|
| (1.01) |
|
| (1.86) |
|
| (1.89) |
|
| (1.39) |
| |||
Net Asset Value, End of Period | $35.30 | $32.52 | $29.06 | $29.17 | $31.14 | |||||||||||||
Total Return* |
| 14.10% |
|
| 15.68% |
|
| 6.07% |
|
| (0.38)% |
|
| 11.86% |
| |||
Net Assets, End of Period (in thousands) | $1,761,817 | $1,562,693 | $1,411,125 | $1,382,693 | $1,414,364 | |||||||||||||
Average Net Assets for the Period (in thousands) | $1,667,210 | $1,477,105 | $1,415,240 | $1,453,548 | $1,383,412 | |||||||||||||
Ratios to Average Net Assets**: |
|
|
|
|
|
|
|
|
|
|
|
|
|
|
| |||
Ratio of Gross Expenses | 0.71% | 0.72% | 0.73% | 0.73% | 0.73% | |||||||||||||
Ratio of Net Expenses (After Waivers and Expense Offsets) | 0.71% | 0.72% | 0.73% | 0.73% | 0.73% | |||||||||||||
Ratio of Net Investment Income/(Loss) | 1.71% | 1.92% | 1.83% | 1.98% | 1.83% | |||||||||||||
Portfolio Turnover Rate | 88% | 60% | 83% | 75% | 72% | |||||||||||||
Class I Shares | ||||||||||||||||||
For a share outstanding during the year ended September 30 |
| 2018 |
|
| 2017 |
|
| 2016 |
|
| 2015 |
|
| 2014 |
| |||
Net Asset Value, Beginning of Period |
| $32.53 |
|
| $29.06 |
|
| $29.18 |
|
| $31.15 |
|
| $29.15 |
| |||
Income/(Loss) from Investment Operations: | ||||||||||||||||||
Net investment income/(loss)(1) | 0.61 | 0.61 | 0.55 | 0.64 | 0.59 | |||||||||||||
Net realized and unrealized gain/(loss) | 3.88 | 3.89 | 1.21 | (0.70) | 2.83 | |||||||||||||
Total from Investment Operations |
| 4.49 |
|
| 4.50 |
|
| 1.76 |
|
| (0.06) |
|
| 3.42 |
| |||
Less Dividends and Distributions: | ||||||||||||||||||
Dividends (from net investment income) | (0.60) | (0.68) | (0.55) | (0.60) | (0.56) | |||||||||||||
Distributions (from capital gains) | (1.11) | (0.35) | (1.33) | (1.31) | (0.86) | |||||||||||||
Total Dividends and Distributions |
| (1.71) |
|
| (1.03) |
|
| (1.88) |
|
| (1.91) |
|
| (1.42) |
| |||
Net Asset Value, End of Period | $35.31 | $32.53 | $29.06 | $29.18 | $31.15 | |||||||||||||
Total Return* |
| 14.18% |
|
| 15.79% |
|
| 6.10% |
|
| (0.30)% |
|
| 11.99% |
| |||
Net Assets, End of Period (in thousands) | $3,197,893 | $2,096,893 | $1,636,459 | $1,510,302 | $1,306,391 | |||||||||||||
Average Net Assets for the Period (in thousands) | $2,460,247 | $1,795,486 | $1,651,399 | $1,482,511 | $1,167,616 | |||||||||||||
Ratios to Average Net Assets**: |
|
|
|
|
|
|
|
|
|
|
|
|
|
|
| |||
Ratio of Gross Expenses | 0.64% | 0.65% | 0.67% | 0.65% | 0.64% | |||||||||||||
Ratio of Net Expenses (After Waivers and Expense Offsets) | 0.64% | 0.65% | 0.67% | 0.65% | 0.64% | |||||||||||||
Ratio of Net Investment Income/(Loss) | 1.80% | 2.00% | 1.90% | 2.06% | 1.92% | |||||||||||||
Portfolio Turnover Rate | 88% | 60% | 83% | 75% | 72% | |||||||||||||
* Total return not annualized for periods of less than one full year. ** Annualized for periods of less than one full year. (1) Per share amounts are calculated based on average shares outstanding during the year or period. |
See Notes to Financial Statements. | |
Janus Investment Fund | 33 |
Janus Henderson Balanced Fund
Financial Highlights
Class N Shares | ||||||||||||||||||
For a share outstanding during the year ended September 30 |
| 2018 |
|
| 2017 |
|
| 2016 |
|
| 2015 |
|
| 2014 |
| |||
Net Asset Value, Beginning of Period |
| $32.50 |
|
| $29.04 |
|
| $29.15 |
|
| $31.11 |
|
| $29.12 |
| |||
Income/(Loss) from Investment Operations: | ||||||||||||||||||
Net investment income/(loss)(1) | 0.63 | 0.64 | 0.57 | 0.66 | 0.60 | |||||||||||||
Net realized and unrealized gain/(loss) | 3.88 | 3.87 | 1.22 | (0.69) | 2.83 | |||||||||||||
Total from Investment Operations |
| 4.51 |
|
| 4.51 |
|
| 1.79 |
|
| (0.03) |
|
| 3.43 |
| |||
Less Dividends and Distributions: | ||||||||||||||||||
Dividends (from net investment income) | (0.62) | (0.70) | (0.57) | (0.62) | (0.58) | |||||||||||||
Distributions (from capital gains) | (1.11) | (0.35) | (1.33) | (1.31) | (0.86) | |||||||||||||
Total Dividends and Distributions |
| (1.73) |
|
| (1.05) |
|
| (1.90) |
|
| (1.93) |
|
| (1.44) |
| |||
Net Asset Value, End of Period | $35.28 | $32.50 | $29.04 | $29.15 | $31.11 | |||||||||||||
Total Return* |
| 14.26% |
|
| 15.84% |
|
| 6.23% |
|
| (0.20)% |
|
| 12.03% |
| |||
Net Assets, End of Period (in thousands) | $2,480,945 | $2,054,731 | $1,834,036 | $1,709,643 | $1,648,665 | |||||||||||||
Average Net Assets for the Period (in thousands) | $2,273,486 | $1,952,775 | $1,801,032 | $1,751,330 | $1,532,107 | |||||||||||||
Ratios to Average Net Assets**: |
|
|
|
|
|
|
|
|
|
|
|
|
|
|
| |||
Ratio of Gross Expenses | 0.57% | 0.58% | 0.59% | 0.58% | 0.58% | |||||||||||||
Ratio of Net Expenses (After Waivers and Expense Offsets) | 0.57% | 0.58% | 0.59% | 0.58% | 0.58% | |||||||||||||
Ratio of Net Investment Income/(Loss) | 1.86% | 2.07% | 1.98% | 2.14% | 1.98% | |||||||||||||
Portfolio Turnover Rate | 88% | 60% | 83% | 75% | 72% | |||||||||||||
Class R Shares | ||||||||||||||||||
For a share outstanding during the year ended September 30 |
| 2018 |
|
| 2017 |
|
| 2016 |
|
| 2015 |
|
| 2014 |
| |||
Net Asset Value, Beginning of Period |
| $32.29 |
|
| $28.87 |
|
| $29.02 |
|
| $30.99 |
|
| $29.03 |
| |||
Income/(Loss) from Investment Operations: | ||||||||||||||||||
Net investment income/(loss)(1) | 0.37 | 0.40 | 0.35 | 0.43 | 0.37 | |||||||||||||
Net realized and unrealized gain/(loss) | 3.85 | 3.87 | 1.21 | (0.68) | 2.82 | |||||||||||||
Total from Investment Operations |
| 4.22 |
|
| 4.27 |
|
| 1.56 |
|
| (0.25) |
|
| 3.19 |
| |||
Less Dividends and Distributions: | ||||||||||||||||||
Dividends (from net investment income) | (0.38) | (0.50) | (0.38) | (0.41) | (0.37) | |||||||||||||
Distributions (from capital gains) | (1.11) | (0.35) | (1.33) | (1.31) | (0.86) | |||||||||||||
Total Dividends and Distributions |
| (1.49) |
|
| (0.85) |
|
| (1.71) |
|
| (1.72) |
|
| (1.23) |
| |||
Net Asset Value, End of Period | $35.02 | $32.29 | $28.87 | $29.02 | $30.99 | |||||||||||||
Total Return* |
| 13.38% |
|
| 15.02% |
|
| 5.40% |
|
| (0.94)% |
|
| 11.20% |
| |||
Net Assets, End of Period (in thousands) | $345,667 | $341,389 | $283,729 | $281,398 | $309,887 | |||||||||||||
Average Net Assets for the Period (in thousands) | $339,637 | $327,651 | $288,241 | $297,615 | $296,348 | |||||||||||||
Ratios to Average Net Assets**: |
|
|
|
|
|
|
|
|
|
|
|
|
|
|
| |||
Ratio of Gross Expenses | 1.32% | 1.32% | 1.34% | 1.31% | 1.33% | |||||||||||||
Ratio of Net Expenses (After Waivers and Expense Offsets) | 1.32% | 1.32% | 1.34% | 1.31% | 1.33% | |||||||||||||
Ratio of Net Investment Income/(Loss) | 1.11% | 1.33% | 1.23% | 1.39% | 1.23% | |||||||||||||
Portfolio Turnover Rate | 88% | 60% | 83% | 75% | 72% | |||||||||||||
* Total return not annualized for periods of less than one full year. ** Annualized for periods of less than one full year. (1) Per share amounts are calculated based on average shares outstanding during the year or period. |
See Notes to Financial Statements. | |
34 | SEPTEMBER 30, 2018 |
Janus Henderson Balanced Fund
Financial Highlights
Class S Shares | ||||||||||||||||||
For a share outstanding during the year ended September 30 |
| 2018 |
|
| 2017 |
|
| 2016 |
|
| 2015 |
|
| 2014 |
| |||
Net Asset Value, Beginning of Period |
| $32.44 |
|
| $28.99 |
|
| $29.12 |
|
| $31.09 |
|
| $29.11 |
| |||
Income/(Loss) from Investment Operations: | ||||||||||||||||||
Net investment income/(loss)(1) | 0.46 | 0.48 | 0.43 | 0.50 | 0.45 | |||||||||||||
Net realized and unrealized gain/(loss) | 3.87 | 3.88 | 1.21 | (0.68) | 2.83 | |||||||||||||
Total from Investment Operations |
| 4.33 |
|
| 4.36 |
|
| 1.64 |
|
| (0.18) |
|
| 3.28 |
| |||
Less Dividends and Distributions: | ||||||||||||||||||
Dividends (from net investment income) | (0.46) | (0.56) | (0.44) | (0.48) | (0.44) | |||||||||||||
Distributions (from capital gains) | (1.11) | (0.35) | (1.33) | (1.31) | (0.86) | |||||||||||||
Total Dividends and Distributions |
| (1.57) |
|
| (0.91) |
|
| (1.77) |
|
| (1.79) |
|
| (1.30) |
| |||
Net Asset Value, End of Period | $35.20 | $32.44 | $28.99 | $29.12 | $31.09 | |||||||||||||
Total Return* |
| 13.67% |
|
| 15.30% |
|
| 5.68% |
|
| (0.71)% |
|
| 11.49% |
| |||
Net Assets, End of Period (in thousands) | $589,812 | $622,279 | $657,563 | $750,461 | $837,505 | |||||||||||||
Average Net Assets for the Period (in thousands) | $610,278 | $637,727 | $706,818 | $828,503 | $844,760 | |||||||||||||
Ratios to Average Net Assets**: |
|
|
|
|
|
|
|
|
|
|
|
|
|
|
| |||
Ratio of Gross Expenses | 1.07% | 1.07% | 1.09% | 1.08% | 1.08% | |||||||||||||
Ratio of Net Expenses (After Waivers and Expense Offsets) | 1.07% | 1.07% | 1.08% | 1.07% | 1.08% | |||||||||||||
Ratio of Net Investment Income/(Loss) | 1.36% | 1.57% | 1.48% | 1.63% | 1.47% | |||||||||||||
Portfolio Turnover Rate | 88% | 60% | 83% | 75% | 72% | |||||||||||||
Class T Shares | |||||||||||||||||||
For a share outstanding during the year ended September 30 |
|
| 2018 |
|
| 2017 |
|
| 2016 |
|
| 2015 |
|
| 2014 |
| |||
Net Asset Value, Beginning of Period |
|
| $32.49 |
|
| $29.02 |
|
| $29.15 |
|
| $31.12 |
|
| $29.13 |
| |||
Income/(Loss) from Investment Operations: | |||||||||||||||||||
Net investment income/(loss)(1) | 0.54 | 0.56 | 0.50 | 0.58 | 0.53 | ||||||||||||||
Net realized and unrealized gain/(loss) | 3.88 | 3.89 | 1.20 | (0.69) | 2.83 | ||||||||||||||
Total from Investment Operations |
|
| 4.42 |
|
| 4.45 |
|
| 1.70 |
|
| (0.11) |
|
| 3.36 |
| |||
Less Dividends and Distributions: | |||||||||||||||||||
Dividends (from net investment income) | (0.54) | (0.63) | (0.50) | (0.55) | (0.51) | ||||||||||||||
Distributions (from capital gains) | (1.11) | (0.35) | (1.33) | (1.31) | (0.86) | ||||||||||||||
Total Dividends and Distributions |
|
| (1.65) |
|
| (0.98) |
|
| (1.83) |
|
| (1.86) |
|
| (1.37) |
| |||
Net Asset Value, End of Period | $35.26 | $32.49 | $29.02 | $29.15 | $31.12 | ||||||||||||||
Total Return* |
|
| 13.97%(2) |
|
| 15.62% |
|
| 5.92% |
|
| (0.46)% |
|
| 11.77% |
| |||
Net Assets, End of Period (in thousands) | $5,422,276 | $4,736,612 | $4,664,334 | $4,734,896 | $4,541,805 | ||||||||||||||
Average Net Assets for the Period (in thousands) | $5,098,558 | $4,654,904 | $4,856,359 | $4,872,456 | $4,375,206 | ||||||||||||||
Ratios to Average Net Assets**: |
|
|
|
|
|
|
|
|
|
|
|
|
|
|
|
| |||
Ratio of Gross Expenses | 0.82% | 0.83% | 0.84% | 0.83% | 0.83% | ||||||||||||||
Ratio of Net Expenses (After Waivers and Expense Offsets) | 0.82% | 0.82% | 0.83% | 0.82% | 0.82% | ||||||||||||||
Ratio of Net Investment Income/(Loss) | 1.61% | 1.83% | 1.74% | 1.89% | 1.73% | ||||||||||||||
Portfolio Turnover Rate | 88% | 60% | 83% | 75% | 72% | ||||||||||||||
* Total return not annualized for periods of less than one full year. ** Annualized for periods of less than one full year. (1) Per share amounts are calculated based on average shares outstanding during the year or period. (2) The return includes adjustments in accordance with generally accepted accounting principles required at period end date. |
See Notes to Financial Statements. | |
Janus Investment Fund | 35 |
Janus Henderson Balanced Fund
Notes to Financial Statements
1. Organization and Significant Accounting Policies
Janus Henderson Balanced Fund (the “Fund”) is a series of Janus Investment Fund (the “Trust”), which is organized as a Massachusetts business trust and is registered under the Investment Company Act of 1940, as amended (the “1940 Act”), as an open-end management investment company, and therefore has applied the specialized accounting and reporting guidance in Financial Accounting Standards Board (“FASB”) Accounting Standards Codification (“ASC”) Topic 946. The Trust offers 48 funds, each of which offers multiple share classes, with differing investment objectives and policies. The Fund seeks long-term capital growth, consistent with preservation of capital and balanced by current income. The Fund is classified as diversified, as defined in the 1940 Act.
The Fund offers multiple classes of shares in order to meet the needs of various types of investors. Each class represents an interest in the same portfolio of investments. Certain financial intermediaries may not offer all classes of shares. Class D Shares are closed to certain new investors.
Shareholders, including other funds, individuals, accounts, as well as the Fund’s portfolio manager(s) and/or investment personnel, may from time to time own (beneficially or of record) a significant percentage of the Fund’s Shares and can be considered to “control” the Fund when that ownership exceeds 25% of the Fund’s assets (and which may differ from control as determined in accordance with accounting principles generally accepted in the United States of America).
Class A Shares and Class C Shares are generally offered through financial intermediary platforms including, but not limited to, traditional brokerage platforms, mutual fund wrap fee programs, bank trust platforms, and retirement platforms.
Class D Shares are generally no longer being made available to new investors who do not already have a direct account with the Janus Henderson funds. Class D Shares are available only to investors who hold accounts directly with the Janus Henderson funds, to immediate family members or members of the same household of an eligible individual investor, and to existing beneficial owners of sole proprietorships or partnerships that hold accounts directly with the Janus Henderson funds.
Class I Shares are available through certain financial intermediary platforms including, but not limited to, mutual fund wrap fee programs, managed account programs, asset allocation programs, bank trust platforms, as well as certain retirement platforms. Class I Shares are also available to certain direct institutional investors including, but not limited to, corporations, certain retirement plans, public plans, and foundations/endowments, who established Class I Share accounts before August 4, 2017.
Class N Shares are generally available only to financial intermediaries purchasing on behalf of: 1) certain adviser-assisted, employer-sponsored retirement plans, including 401(k) plans, 457 plans, 403(b) plans, Taft-Hartley multi-employer plans, profit-sharing and money purchase pension plans, defined benefit plans and certain welfare benefit plans, such as health savings accounts, and nonqualified deferred compensation plans; and 2) retail investors purchasing in qualified or nonqualified accounts, whose accounts are held through an omnibus account at their financial intermediary, and where the financial intermediary requires no payment or reimbursement from the Fund, Janus Capital Management LLC (“Janus Capital”), or its affiliates. Class N Shares are also available to Janus Henderson proprietary products and to certain direct institutional investors approved by Janus Distributors LLC dba Janus Henderson Distributors (“Janus Henderson Distributors”) including, but not limited to, corporations, certain retirement plans, public plans, and foundations and endowments, subject to minimum investment requirements.
Class R Shares are offered through financial intermediary platforms including, but not limited to, retirement platforms.
Class S Shares are offered through financial intermediary platforms including, but not limited to, retirement platforms and asset allocation, mutual fund wrap, or other discretionary or nondiscretionary fee-based investment advisory programs. In addition, Class S Shares may be available through certain financial intermediaries who have an agreement with Janus Capital or its affiliates to offer Class S Shares on their supermarket platforms.
Class T Shares are available through certain financial intermediary platforms including, but not limited to, mutual fund wrap fee programs, managed account programs, asset allocation programs, bank trust platforms, as well as certain retirement platforms. In addition, Class T Shares may be available through certain financial intermediaries who have an agreement with Janus Capital or its affiliates to offer Class T Shares on their supermarket platforms.
36 | SEPTEMBER 30, 2018 |
Janus Henderson Balanced Fund
Notes to Financial Statements
The following accounting policies have been followed by the Fund and are in conformity with accounting principles generally accepted in the United States of America.
Investment Valuation
Securities held by the Fund are valued in accordance with policies and procedures established by and under the supervision of the Trustees (the “Valuation Procedures”). Equity securities traded on a domestic securities exchange are generally valued at the closing prices on the primary market or exchange on which they trade. If such price is lacking for the trading period immediately preceding the time of determination, such securities are valued at their current bid price. Equity securities that are traded on a foreign exchange are generally valued at the closing prices on such markets. In the event that there is no current trading volume on a particular security in such foreign exchange, the bid price from the primary exchange is generally used to value the security. Securities that are traded on the over-the-counter (“OTC”) markets are generally valued at their closing or latest bid prices as available. Foreign securities and currencies are converted to U.S. dollars using the applicable exchange rate in effect at the close of the New York Stock Exchange (“NYSE”). The Fund will determine the market value of individual securities held by it by using prices provided by one or more approved professional pricing services or, as needed, by obtaining market quotations from independent broker-dealers. Most debt securities are valued in accordance with the evaluated bid price supplied by the pricing service that is intended to reflect market value. The evaluated bid price supplied by the pricing service is an evaluation that may consider factors such as security prices, yields, maturities and ratings. Certain short-term securities maturing within 60 days or less may be evaluated and valued on an amortized cost basis provided that the amortized cost determined approximates market value. Securities for which market quotations or evaluated prices are not readily available or deemed unreliable are valued at fair value determined in good faith under the Valuation Procedures. Circumstances in which fair value pricing may be utilized include, but are not limited to: (i) a significant event that may affect the securities of a single issuer, such as a merger, bankruptcy, or significant issuer-specific development; (ii) an event that may affect an entire market, such as a natural disaster or significant governmental action; (iii) a nonsignificant event such as a market closing early or not opening, or a security trading halt; and (iv) pricing of a nonvalued security and a restricted or nonpublic security. Special valuation considerations may apply with respect to “odd-lot” fixed-income transactions which, due to their small size, may receive evaluated prices by pricing services which reflect a large block trade and not what actually could be obtained for the odd-lot position. The Fund uses systematic fair valuation models provided by independent third parties to value international equity securities in order to adjust for stale pricing, which may occur between the close of certain foreign exchanges and the close of the NYSE.
Valuation Inputs Summary
FASB ASC 820, Fair Value Measurements and Disclosures (“ASC 820”), defines fair value, establishes a framework for measuring fair value, and expands disclosure requirements regarding fair value measurements. This standard emphasizes that fair value is a market-based measurement that should be determined based on the assumptions that market participants would use in pricing an asset or liability and establishes a hierarchy that prioritizes inputs to valuation techniques used to measure fair value. These inputs are summarized into three broad levels:
Level 1 – Unadjusted quoted prices in active markets the Fund has the ability to access for identical assets or liabilities.
Level 2 – Observable inputs other than unadjusted quoted prices included in Level 1 that are observable for the asset or liability either directly or indirectly. These inputs may include quoted prices for the identical instrument on an inactive market, prices for similar instruments, interest rates, prepayment speeds, credit risk, yield curves, default rates and similar data.
Assets or liabilities categorized as Level 2 in the hierarchy generally include: debt securities fair valued in accordance with the evaluated bid or ask prices supplied by a pricing service; securities traded on OTC markets and listed securities for which no sales are reported that are fair valued at the latest bid price (or yield equivalent thereof) obtained from one or more dealers transacting in a market for such securities or by a pricing service approved by the Fund’s Trustees; certain short-term debt securities with maturities of 60 days or less that are fair valued at amortized cost; and equity securities of foreign issuers whose fair value is determined by using systematic fair valuation models provided by independent third parties in order to adjust for stale pricing which may occur between the close of certain foreign exchanges and the close of the NYSE. Other securities that may be categorized as Level 2 in the hierarchy include, but are not limited to, preferred stocks, bank loans, swaps, investments in unregistered investment companies, options, and forward contracts.
Janus Investment Fund | 37 |
Janus Henderson Balanced Fund
Notes to Financial Statements
Level 3 – Unobservable inputs for the asset or liability to the extent that relevant observable inputs are not available, representing the Fund’s own assumptions about the assumptions that a market participant would use in valuing the asset or liability, and that would be based on the best information available.
There have been no significant changes in valuation techniques used in valuing any such positions held by the Fund since the beginning of the fiscal year.
The inputs or methodology used for fair valuing securities are not necessarily an indication of the risk associated with investing in those securities. The summary of inputs used as of September 30, 2018 to fair value the Fund’s investments in securities and other financial instruments is included in the “Valuation Inputs Summary” in the Notes to Schedule of Investments and Other Information.
The Fund did not hold a significant amount of Level 3 securities as of September 30, 2018.
There were no transfers between Level 1, Level 2 and Level 3 of the fair value hierarchy during the year. The Fund recognizes transfers between the levels as of the beginning of the fiscal year.
Investment Transactions and Investment Income
Investment transactions are accounted for as of the date purchased or sold (trade date). Dividend income is recorded on the ex-dividend date. Certain dividends from foreign securities will be recorded as soon as the Fund is informed of the dividend, if such information is obtained subsequent to the ex-dividend date. Dividends from foreign securities may be subject to withholding taxes in foreign jurisdictions. Interest income is recorded on the accrual basis and includes amortization of premiums and accretion of discounts. Gains and losses are determined on the identified cost basis, which is the same basis used for federal income tax purposes. Income, as well as gains and losses, both realized and unrealized, are allocated daily to each class of shares based upon the ratio of net assets represented by each class as a percentage of total net assets.
Expenses
The Fund bears expenses incurred specifically on its behalf. Each class of shares bears a portion of general expenses, which are allocated daily to each class of shares based upon the ratio of net assets represented by each class as a percentage of total net assets. Expenses directly attributable to a specific class of shares are charged against the operations of such class.
Estimates
The preparation of financial statements in conformity with accounting principles generally accepted in the United States of America requires management to make estimates and assumptions that affect the reported amount of assets and liabilities and disclosure of contingent assets and liabilities at the date of the financial statements, and the reported amounts of income and expenses during the reporting period. Actual results could differ from those estimates.
Indemnifications
In the normal course of business, the Fund may enter into contracts that contain provisions for indemnification of other parties against certain potential liabilities. The Fund’s maximum exposure under these arrangements is unknown, and would involve future claims that may be made against the Fund that have not yet occurred. Currently, the risk of material loss from such claims is considered remote.
Foreign Currency Translations
The Fund does not isolate that portion of the results of operations resulting from the effect of changes in foreign exchange rates on investments from the fluctuations arising from changes in market prices of securities held at the date of the financial statements. Net unrealized appreciation or depreciation of investments and foreign currency translations arise from changes in the value of assets and liabilities, including investments in securities held at the date of the financial statements, resulting from changes in the exchange rates and changes in market prices of securities held.
Currency gains and losses are also calculated on payables and receivables that are denominated in foreign currencies. The payables and receivables are generally related to foreign security transactions and income translations.
Foreign currency-denominated assets and forward currency contracts may involve more risks than domestic transactions, including currency risk, counterparty risk, political and economic risk, regulatory risk and equity risk. Risks may arise from unanticipated movements in the value of foreign currencies relative to the U.S. dollar.
38 | SEPTEMBER 30, 2018 |
Janus Henderson Balanced Fund
Notes to Financial Statements
Dividends and Distributions
Dividends of net investment income are generally declared and distributed quarterly, and realized capital gains (if any) are distributed annually. The Fund may treat a portion of the amount paid to redeem shares as a distribution of investment company taxable income and realized capital gains that are reflected in the net asset value. This practice, commonly referred to as “equalization,” has no effect on the redeeming shareholder or a Fund’s total return, but may reduce the amounts that would otherwise be required to be paid as taxable dividends to the remaining shareholders. It is possible that the Internal Revenue Service (IRS) could challenge the Funds’ equalization methodology or calculations, and any such challenge could result in additional tax, interest, or penalties to be paid by the Fund.
The Fund may make certain investments in real estate investment trusts (“REITs”) which pay dividends to their shareholders based upon funds available from operations. It is quite common for these dividends to exceed the REITs’ taxable earnings and profits, resulting in the excess portion of such dividends being designated as a return of capital. If the Fund distributes such amounts, such distributions could constitute a return of capital to shareholders for federal income tax purposes.
Federal Income Taxes
The Fund intends to continue to qualify as a regulated investment company and distribute all of its taxable income in accordance with the requirements of Subchapter M of the Internal Revenue Code. Management has analyzed the Fund’s tax positions taken for all open federal income tax years, generally a three-year period, and has concluded that no provision for federal income tax is required in the Fund’s financial statements. The Fund is not aware of any tax positions for which it is reasonably possible that the total amounts of unrecognized tax benefits will significantly change in the next twelve months.
On December 22, 2017, the Tax Cuts and Jobs Act was signed into law. Currently, Management does not believe the bill will have a material impact on the Fund’s intention to continue to qualify as a regulated investment company, which is generally not subject to U.S. federal income tax.
2. Other Investments and Strategies
Additional Investment Risk
The financial crisis in both the U.S. and global economies over the past several years has resulted, and may continue to result, in a significant decline in the value and liquidity of many securities of issuers worldwide in the equity and fixed-income/credit markets. In response to the crisis, the United States and certain foreign governments, along with the U.S. Federal Reserve and certain foreign central banks, took steps to support the financial markets. The withdrawal of this support, a failure of measures put in place to respond to the crisis, or investor perception that such efforts were not sufficient could each negatively affect financial markets generally, and the value and liquidity of specific securities. In addition, policy and legislative changes in the United States and in other countries continue to impact many aspects of financial regulation. The effect of these changes on the markets, and the practical implications for market participants, including the Fund, may not be fully known for some time. As a result, it may also be unusually difficult to identify both investment risks and opportunities, which could limit or preclude the Fund’s ability to achieve its investment objective. Therefore, it is important to understand that the value of your investment may fall, sometimes sharply, and you could lose money.
The enactment of the Dodd-Frank Wall Street Reform and Consumer Protection Act (the “Dodd-Frank Act”) of 2010 provided for widespread regulation of financial institutions, consumer financial products and services, broker-dealers, OTC derivatives, investment advisers, credit rating agencies, and mortgage lending, which expanded federal oversight in the financial sector, including the investment management industry. Many provisions of the Dodd-Frank Act remain pending and will be implemented through future rulemaking. Therefore, the ultimate impact of the Dodd-Frank Act and the regulations under the Dodd-Frank Act on the Fund and the investment management industry as a whole, is not yet certain.
A number of countries in the European Union (“EU”) have experienced, and may continue to experience, severe economic and financial difficulties. In particular, many EU nations are susceptible to economic risks associated with high levels of debt, notably due to investments in sovereign debt of countries such as Greece, Italy, Spain, Portugal, and Ireland. Many non-governmental issuers, and even certain governments, have defaulted on, or been forced to restructure, their debts. Many other issuers have faced difficulties obtaining credit or refinancing existing obligations. Financial institutions have in many cases required government or central bank support, have needed to raise capital, and/or have been impaired in their ability to extend credit. As a result, financial markets in the EU experienced extreme
Janus Investment Fund | 39 |
Janus Henderson Balanced Fund
Notes to Financial Statements
volatility and declines in asset values and liquidity. Responses to these financial problems by European governments, central banks, and others, including austerity measures and reforms, may not work, may result in social unrest, and may limit future growth and economic recovery or have other unintended consequences. Further defaults or restructurings by governments and others of their debt could have additional adverse effects on economies, financial markets, and asset valuations around the world. Greece, Ireland, and Portugal have already received one or more "bailouts" from other Eurozone member states, and it is unclear how much additional funding they will require or if additional Eurozone member states will require bailouts in the future. The risk of investing in securities in the European markets may also be heightened due to the referendum in which the United Kingdom voted to exit the EU (known as “Brexit”). There is considerable uncertainty about how Brexit will be conducted, how negotiations of necessary treaties and trade agreements will proceed, or how financial markets will react. In addition, one or more other countries may also abandon the euro and/or withdraw from the EU, placing its currency and banking system in jeopardy.
Certain areas of the world have historically been prone to and economically sensitive to environmental events such as, but not limited to, hurricanes, earthquakes, typhoons, flooding, tidal waves, tsunamis, erupting volcanoes, wildfires or droughts, tornadoes, mudslides, or other weather-related phenomena. Such disasters, and the resulting physical or economic damage, could have a severe and negative impact on the Fund’s investment portfolio and, in the longer term, could impair the ability of issuers in which the Fund invests to conduct their businesses as they would under normal conditions. Adverse weather conditions may also have a particularly significant negative effect on issuers in the agricultural sector and on insurance companies that insure against the impact of natural disasters.
Counterparties
Fund transactions involving a counterparty are subject to the risk that the counterparty or a third party will not fulfill its obligation to the Fund (“counterparty risk”). Counterparty risk may arise because of the counterparty’s financial condition (i.e., financial difficulties, bankruptcy, or insolvency), market activities and developments, or other reasons, whether foreseen or not. A counterparty’s inability to fulfill its obligation may result in significant financial loss to the Fund. The Fund may be unable to recover its investment from the counterparty or may obtain a limited recovery, and/or recovery may be delayed. The extent of the Fund’s exposure to counterparty risk with respect to financial assets and liabilities approximates its carrying value.
The Fund may be exposed to counterparty risk through participation in various programs, including, but not limited to, lending its securities to third parties, cash sweep arrangements whereby the Fund’s cash balance is invested in one or more types of cash management vehicles, as well as investments in, but not limited to, repurchase agreements, debt securities, and derivatives, including various types of swaps, futures and options. The Fund intends to enter into financial transactions with counterparties that Janus Capital believes to be creditworthy at the time of the transaction. There is always the risk that Janus Capital’s analysis of a counterparty’s creditworthiness is incorrect or may change due to market conditions. To the extent that the Fund focuses its transactions with a limited number of counterparties, it will have greater exposure to the risks associated with one or more counterparties.
Loans
The Fund may invest in various commercial loans, including bank loans, bridge loans, debtor-in-possession (“DIP”) loans, mezzanine loans, and other fixed and floating rate loans. These loans may be acquired through loan participations and assignments or on a when-issued basis. Commercial loans will comprise no more than 20% of the Fund’s total assets. Below are descriptions of the types of loans held by the Fund as of September 30, 2018.
· Bank Loans - Bank loans are obligations of companies or other entities entered into in connection with recapitalizations, acquisitions, and refinancings. The Fund’s investments in bank loans are generally acquired as a participation interest in, or assignment of, loans originated by a lender or other financial institution. These investments may include institutionally-traded floating and fixed-rate debt securities.
· Floating Rate Loans – Floating rate loans are debt securities that have floating interest rates, that adjust periodically, and are tied to a benchmark lending rate, such as London Interbank Offered Rate (“LIBOR”). In other cases, the lending rate could be tied to the prime rate offered by one or more major U.S. banks or the rate paid on large certificates of deposit traded in the secondary markets. If the benchmark lending rate changes, the rate payable to lenders under the loan will change at the next scheduled adjustment date specified in the loan agreement. Floating rate loans are typically issued to companies (‘‘borrowers’’) in connection with recapitalizations, acquisitions, and refinancings. Floating rate loan investments are generally below investment grade. Senior floating rate loans are secured by specific collateral of a borrower and are
40 | SEPTEMBER 30, 2018 |
Janus Henderson Balanced Fund
Notes to Financial Statements
senior in the borrower’s capital structure. The senior position in the borrower’s capital structure generally gives holders of senior loans a claim on certain of the borrower’s assets that is senior to subordinated debt and preferred and common stock in the case of a borrower’s default. Floating rate loan investments may involve foreign borrowers, and investments may be denominated in foreign currencies. Floating rate loans often involve borrowers whose financial condition is troubled or uncertain and companies that are highly leveraged. The Fund may invest in obligations of borrowers who are in bankruptcy proceedings. While the Fund generally expects to invest in fully funded term loans, certain of the loans in which the Fund may invest include revolving loans, bridge loans, and delayed draw term loans.
Purchasers of floating rate loans may pay and/or receive certain fees. The Fund may receive fees such as covenant waiver fees or prepayment penalty fees. The Fund may pay fees such as facility fees. Such fees may affect the Fund’s return.
· Mezzanine Loans - Mezzanine loans are secured by the stock of the company that owns the assets. Mezzanine loans are a hybrid of debt and equity financing that is typically used to fund the expansion of existing companies. A mezzanine loan is composed of debt capital that gives the lender the right to convert to an ownership or equity interest in the company if the loan is not paid back in time and in full. Mezzanine loans typically are the most subordinated debt obligation in an issuer’s capital structure.
Mortgage- and Asset-Backed Securities
Mortgage- and asset-backed securities represent interests in “pools” of commercial or residential mortgages or other assets, including consumer loans or receivables. The Fund may purchase fixed or variable rate commercial or residential mortgage-backed securities issued by the Government National Mortgage Association (“Ginnie Mae”), the Federal National Mortgage Association (“Fannie Mae”), the Federal Home Loan Mortgage Corporation (“Freddie Mac”), or other governmental or government-related entities. Ginnie Mae’s guarantees are backed by the full faith and credit of the U.S. Government, which means that the U.S. Government guarantees that the interest and principal will be paid when due. Fannie Mae and Freddie Mac securities are not backed by the full faith and credit of the U.S. Government. In September 2008, the Federal Housing Finance Agency (“FHFA”), an agency of the U.S. Government, placed Fannie Mae and Freddie Mac under conservatorship. Since that time, Fannie Mae and Freddie Mac have received capital support through U.S. Treasury preferred stock purchases, and Treasury and Federal Reserve purchases of their mortgage-backed securities. The FHFA and the U.S. Treasury have imposed strict limits on the size of these entities’ mortgage portfolios. The FHFA has the power to cancel any contract entered into by Fannie Mae and Freddie Mac prior to FHFA’s appointment as conservator or receiver, including the guarantee obligations of Fannie Mae and Freddie Mac.
The Fund may also purchase other mortgage- and asset-backed securities through single- and multi-seller conduits, collateralized debt obligations, structured investment vehicles, and other similar securities. Asset-backed securities may be backed by various consumer obligations, including automobile loans, equipment leases, credit card receivables, or other collateral. In the event the underlying loans are not paid, the securities’ issuer could be forced to sell the assets and recognize losses on such assets, which could impact your return. Unlike traditional debt instruments, payments on these securities include both interest and a partial payment of principal. Mortgage- and asset-backed securities are subject to both extension risk, where borrowers pay off their debt obligations more slowly in times of rising interest rates, and prepayment risk, where borrowers pay off their debt obligations sooner than expected in times of declining interest rates. These risks may reduce the Fund’s returns. In addition, investments in mortgage- and asset-backed securities, including those comprised of subprime mortgages, may be subject to a higher degree of credit risk, valuation risk, and liquidity risk than various other types of fixed-income securities. Additionally, although mortgage-backed securities are generally supported by some form of government or private guarantee and/or insurance, there is no assurance that guarantors or insurers will meet their obligations.
Real Estate Investing
The Fund may invest in equity and debt securities of real estate-related companies. Such companies may include those in the real estate industry or real estate-related industries. These securities may include common stocks, corporate bonds, preferred stocks, and other equity securities, including, but not limited to, mortgage-backed securities, real estate-backed securities, securities of REITs and similar REIT-like entities. A REIT is a trust that invests in real estate-related projects, such as properties, mortgage loans, and construction loans. REITs are generally categorized as equity, mortgage, or hybrid REITs. A REIT may be listed on an exchange or traded OTC.
Janus Investment Fund | 41 |
Janus Henderson Balanced Fund
Notes to Financial Statements
Restricted Security Transactions
Restricted securities held by the Fund may not be sold except in exempt transactions or in a public offering registered under the Securities Act of 1933, as amended. The risk of investing in such securities is generally greater than the risk of investing in the securities of widely held, publicly traded companies. Lack of a secondary market and resale restrictions may result in the inability of the Fund to sell a security at a fair price and may substantially delay the sale of the security. In addition, these securities may exhibit greater price volatility than securities for which secondary markets exist.
Securities Lending
Under procedures adopted by the Trustees, the Fund may seek to earn additional income by lending securities to certain qualified broker-dealers and institutions. Deutsche Bank AG acts as securities lending agent and a limited purpose custodian or subcustodian to receive and disburse cash balances and cash collateral, hold short-term investments, hold collateral, and perform other custodian functions in accordance with the Agency Securities Lending and Repurchase Agreement. The Fund may lend portfolio securities in an amount equal to up to 1/3 of its total assets as determined at the time of the loan origination. There is the risk of delay in recovering a loaned security or the risk of loss in collateral rights if the borrower fails financially. In addition, Janus Capital makes efforts to balance the benefits and risks from granting such loans. All loans will be continuously secured by collateral which may consist of cash, U.S. Government securities, domestic and foreign short-term debt instruments, letters of credit, time deposits, repurchase agreements, money market mutual funds or other money market accounts, or such other collateral as permitted by the SEC. If the Fund is unable to recover a security on loan, the Fund may use the collateral to purchase replacement securities in the market. There is a risk that the value of the collateral could decrease below the cost of the replacement security by the time the replacement investment is made, resulting in a loss to the Fund.
Upon receipt of cash collateral, Janus Capital may invest it in affiliated or non-affiliated cash management vehicles, whether registered or unregistered entities, as permitted by the 1940 Act and rules promulgated thereunder. Janus Capital currently intends to invest the cash collateral in a cash management vehicle for which Janus Capital serves as investment adviser, Janus Henderson Cash Collateral Fund LLC. An investment in Janus Henderson Cash Collateral Fund LLC is generally subject to the same risks that shareholders experience when investing in similarly structured vehicles, such as the potential for significant fluctuations in assets as a result of the purchase and redemption activity of the securities lending program, a decline in the value of the collateral, and possible liquidity issues. Such risks may delay the return of the cash collateral and cause the Fund to violate its agreement to return the cash collateral to a borrower in a timely manner. As adviser to the Fund and Janus Henderson Cash Collateral Fund LLC, Janus Capital has an inherent conflict of interest as a result of its fiduciary duties to both the Fund and Janus Henderson Cash Collateral Fund LLC. Additionally, Janus Capital receives an investment advisory fee of 0.05% for managing Janus Henderson Cash Collateral Fund LLC, but it may not receive a fee for managing certain other affiliated cash management vehicles in which the Fund may invest, and therefore may have an incentive to allocate preferred investment opportunities to investment vehicles for which it is receiving a fee.
The value of the collateral must be at least 102% of the market value of the loaned securities that are denominated in U.S. dollars and 105% of the market value of the loaned securities that are not denominated in U.S. dollars. Loaned securities and related collateral are marked-to-market each business day based upon the market value of the loaned securities at the close of business, employing the most recent available pricing information. Collateral levels are then adjusted based on this mark-to-market evaluation.
The cash collateral invested by Janus Capital is disclosed in the Schedule of Investments (if applicable). Income earned from the investment of the cash collateral, net of rebates paid to, or fees paid by, borrowers and less the fees paid to the lending agent are included as “Affiliated securities lending income, net” on the Statement of Operations. There were no securities on loan as of September 30, 2018.
Sovereign Debt
The Fund may invest in U.S. and non-U.S. government debt securities (“sovereign debt”). Some investments in sovereign debt, such as U.S. sovereign debt, are considered low risk. However, investments in sovereign debt, especially the debt of less developed countries, can involve a high degree of risk, including the risk that the governmental entity that controls the repayment of sovereign debt may not be willing or able to repay the principal and/or to pay the interest on its sovereign debt in a timely manner. A sovereign debtor’s willingness or ability to satisfy its debt obligation may be affected by various factors including, but not limited to, its cash flow situation, the extent of its foreign currency reserves, the availability of foreign exchange when a payment is due, the relative size of its debt position in relation to its
42 | SEPTEMBER 30, 2018 |
Janus Henderson Balanced Fund
Notes to Financial Statements
economy as a whole, the sovereign debtor’s policy toward international lenders, and local political constraints to which the governmental entity may be subject. Sovereign debtors may also be dependent on expected disbursements from foreign governments, multilateral agencies, and other entities. The failure of a sovereign debtor to implement economic reforms, achieve specified levels of economic performance, or repay principal or interest when due may result in the cancellation of third party commitments to lend funds to the sovereign debtor, which may further impair such debtor’s ability or willingness to timely service its debts. The Fund may be requested to participate in the rescheduling of such sovereign debt and to extend further loans to governmental entities, which may adversely affect the Fund’s holdings. In the event of default, there may be limited or no legal remedies for collecting sovereign debt and there may be no bankruptcy proceedings through which the Fund may collect all or part of the sovereign debt that a governmental entity has not repaid. In addition, to the extent the Fund invests in non-U.S. sovereign debt, it may be subject to currency risk.
When-Issued, Delayed Delivery and Forward Commitment Transactions
The Fund may purchase or sell securities on a when-issued, delayed delivery, or forward commitment basis. When purchasing a security on a when-issued, delayed delivery, or forward commitment basis, the Fund assumes the rights and risks of ownership of the security, including the risk of price and yield fluctuations, and takes such fluctuations into account when determining its net asset value. Typically, no income accrues on securities the Fund has committed to purchase prior to the time delivery of the securities is made. Because the Fund is not required to pay for the security until the delivery date, these risks are in addition to the risks associated with the Fund’s other investments. If the other party to a transaction fails to deliver the securities, the Fund could miss a favorable price or yield opportunity. If the Fund remains substantially fully invested at a time when when-issued, delayed delivery, or forward commitment purchases are outstanding, the purchases may result in a form of leverage.
When the Fund has sold a security on a when-issued, delayed delivery, or forward commitment basis, the Fund does not participate in future gains or losses with respect to the security. If the other party to a transaction fails to pay for the securities, the Fund could suffer a loss. Additionally, when selling a security on a when-issued, delayed delivery, or forward commitment basis without owning the security, the Fund will incur a loss if the security’s price appreciates in value such that the security’s price is above the agreed upon price on the settlement date. The Fund may dispose of or renegotiate a transaction after it is entered into, and may purchase or sell when-issued, delayed delivery or forward commitment securities before the settlement date, which may result in a gain or loss.
3. Investment Advisory Agreements and Other Transactions with Affiliates
The Fund pay Janus Capital an investment advisory fee which is calculated daily and paid monthly. The Fund’s contractual investment advisory fee rate (expressed as an annual rate) is 0.55% of its average daily net assets.
Janus Capital has contractually agreed to waive the advisory fee payable by the Fund or reimburse expenses in an amount equal to the amount, if any, that the Fund’s total annual fund operating expenses, including the investment advisory fee, but excluding the fees payable pursuant to a Rule 12b-1 plan, shareholder servicing fees, such as transfer agency fees (including out-of-pocket costs), administrative services fees and any networking/omnibus/administrative fees payable by any share class, brokerage commissions, interest, dividends, taxes, acquired fund fees and expenses, and extraordinary expenses, exceed the annual rate of 0.68% of the Fund’s average daily net assets. Janus Capital has agreed to continue the waivers until at least February 1, 2019. If applicable, amounts waived and/or reimbursed to the Fund by Janus Capital are disclosed as “Excess Expense Reimbursement and Waivers” on the Statement of Operations.
Janus Services LLC (“Janus Services”), a wholly-owned subsidiary of Janus Capital, is the Fund’s transfer agent. In addition, Janus Services provides or arranges for the provision of certain other administrative services including, but not limited to, recordkeeping, accounting, order processing, and other shareholder services for the Fund. Janus Services is not compensated for its services related to the shares, except for out-of-pocket costs. These amounts are disclosed as “Other transfer agent fees and expenses” on the Statement of Operations.
Certain, but not all, intermediaries may charge administrative fees (such as networking and omnibus) to investors in Class A Shares, Class C Shares, and Class I Shares for administrative services provided on behalf of such investors. These administrative fees are paid by the Class A Shares, Class C Shares, and Class I Shares of the Fund to Janus Services, which uses such fees to reimburse intermediaries. Consistent with the Transfer Agency Agreement between Janus Services and the Fund, Janus Services may negotiate the level, structure, and/or terms of the administrative fees with intermediaries requiring such fees on behalf of the Fund. Janus Capital and its affiliates benefit from an increase in assets that may result from such relationships. The Funds’ Trustees have set limits on fees that the Funds may incur with respect to administrative fees paid for omnibus or networked accounts. Such limits are subject to change by the
Janus Investment Fund | 43 |
Janus Henderson Balanced Fund
Notes to Financial Statements
Trustees in the future. These amounts are disclosed as “Transfer agent networking and omnibus fees” on the Statement of Operations.
The Fund’s Class D Shares pay an administrative services fee at an annual rate of 0.12% of the average daily net assets of Class D Shares for shareholder services provided by Janus Services. Janus Services provides or arranges for the provision of shareholder services including, but not limited to, recordkeeping, accounting, answering inquiries regarding accounts, transaction processing, transaction confirmations, and the mailing of prospectuses and shareholder reports. These amounts are disclosed as “Transfer agent administrative fees and expenses” on the Statement of Operations.
Janus Services receives an administrative services fee at an annual rate of up to 0.25% of the average daily net assets of the Fund’s Class R Shares, Class S Shares, and Class T Shares for providing or procuring administrative services to investors in Class R Shares, Class S Shares, and Class T Shares of the Fund. Janus Services expects to use all or a significant portion of this fee to compensate retirement plan service providers, broker-dealers, bank trust departments, financial advisors, and other financial intermediaries for providing these services. Janus Services or its affiliates may also pay fees for services provided by intermediaries to the extent the fees charged by intermediaries exceed the 0.25% of net assets charged to Class R Shares, Class S Shares, and Class T Shares of the Fund. Janus Services may keep certain amounts retained for reimbursement of out-of-pocket costs incurred for servicing clients of Class R Shares, Class S Shares, and Class T Shares. These amounts are disclosed as “Transfer agent administrative fees and expenses” on the Statement of Operations.
Services provided by these financial intermediaries may include, but are not limited to, recordkeeping, subaccounting, order processing, providing order confirmations, periodic statements, forwarding prospectuses, shareholder reports, and other materials to existing customers, answering inquiries regarding accounts, and other administrative services. Order processing includes the submission of transactions through the National Securities Clearing Corporation (“NSCC”) or similar systems, or those processed on a manual basis with Janus Capital. For all share classes, Janus Services also seeks reimbursement for costs it incurs as transfer agent and for providing servicing.
Janus Services is compensated for its services related to the Fund’s Class D Shares. These amounts are disclosed as “Other transfer agent fees and expenses” on the Statement of Operations.
Under a distribution and shareholder servicing plan (the “Plan”) adopted in accordance with Rule 12b-1 under the 1940 Act, the Fund pays the Trust’s distributor, Janus Henderson Distributors, a wholly-owned subsidiary of Janus Capital, a fee for the sale and distribution and/or shareholder servicing of the Shares at an annual rate of up to 0.25% of the Class A Shares’ average daily net assets, of up to 1.00% of the Class C Shares’ average daily net assets, of up to 0.50% of the Class R Shares' average daily net assets, and of up to 0.25% of the Class S Shares’ average daily net assets. Under the terms of the Plan, the Trust is authorized to make payments to Janus Henderson Distributors for remittance to retirement plan service providers, broker-dealers, bank trust departments, financial advisors, and other financial intermediaries, as compensation for distribution and/or shareholder services performed by such entities for their customers who are investors in the Fund. These amounts are disclosed as “12b-1 Distribution and shareholder servicing fees” on the Statement of Operations. Payments under the Plan are not tied exclusively to actual 12b-1 distribution and shareholder service expenses, and the payments may exceed 12b-1 distribution and shareholder service expenses actually incurred. If any of the Fund’s actual 12b-1 distribution and shareholder service expenses incurred during a calendar year are less than the payments made during a calendar year, the Fund will be refunded the difference. Refunds, if any, are included in “12b-1 Distribution and shareholder servicing fees” in the Statement of Operations.
Janus Capital serves as administrator to the Fund pursuant to an administration agreement between Janus Capital and the Trust. Under the administration agreement, Janus Capital is obligated to provide or arrange for the provision of certain administration, compliance, and accounting services to the Fund, including providing office space for the Fund, and is reimbursed by the Fund for certain of its costs in providing these services (to the extent Janus Capital seeks reimbursement and such costs are not otherwise waived). In addition, employees of Janus Capital and/or its affiliates may serve as officers of the Trust. The Fund pays for some or all of the salaries, fees, and expenses of Janus Capital employees and Fund officers, with respect to certain specified administration functions they perform on behalf of the Fund. The Fund pays these costs based on out-of-pocket expenses incurred by Janus Capital, and these costs are separate and apart from advisory fees and other expenses paid in connection with the investment advisory services Janus Capital (or any subadvisor, as applicable) provides to the Fund. These amounts are disclosed as “Affiliated fund
44 | SEPTEMBER 30, 2018 |
Janus Henderson Balanced Fund
Notes to Financial Statements
administration fees” on the Statement of Operations. In addition, some expenses related to compensation payable to the Fund’s Chief Compliance Officer and certain compliance staff, all of whom are employees of Janus Capital and/or its affiliates, are shared with the Fund. Total compensation of $504,989 was paid to the Chief Compliance Officer and certain compliance staff by the Trust during the year ended September 30, 2018. The Fund's portion is reported as part of “Other expenses” on the Statement of Operations.
Effective April 1, 2018, BNP Paribas Financial Services (“BPFS”) provides certain administrative services to the Fund, including services related to Fund accounting, calculation of the Fund’s daily NAV, and Fund audit, tax, and reporting obligations, pursuant to a sub-administration agreement with Janus Capital on behalf of the Fund. Janus Capital, as administrator, oversees the provision of these services by BPFS. As compensation for such services, Janus Capital pays BPFS a fee based on a percentage of the Fund’s assets, along with a flat fee, and is reimbursed by the Fund for amounts paid to BPFS (to the extent Janus Capital seeks reimbursement and such costs are not otherwise waived). These amounts are disclosed as part of "Other expenses" on the Statement of Operations.
The Board of Trustees has adopted a deferred compensation plan (the “Deferred Plan”) for independent Trustees to elect to defer receipt of all or a portion of the annual compensation they are entitled to receive from the Fund. All deferred fees are credited to an account established in the name of the Trustees. The amounts credited to the account then increase or decrease, as the case may be, in accordance with the performance of one or more of the Janus Henderson funds that are selected by the Trustees. The account balance continues to fluctuate in accordance with the performance of the selected fund or funds until final payment of all amounts are credited to the account. The fluctuation of the account balance is recorded by the Fund as unrealized appreciation/(depreciation) and is included as of September 30, 2018 on the Statement of Assets and Liabilities in the asset, “Non-interested Trustees’ deferred compensation,” and liability, “Non-interested Trustees’ deferred compensation fees.” Additionally, the recorded unrealized appreciation/(depreciation) is included in “Unrealized net appreciation/(depreciation) of investments, foreign currency translations and non-interested Trustees’ deferred compensation” on the Statement of Assets and Liabilities. Deferred compensation expenses for the year ended September 30, 2018 are included in “Non-interested Trustees’ fees and expenses” on the Statement of Operations. Trustees are allowed to change their designation of mutual funds from time to time. Amounts will be deferred until distributed in accordance with the Deferred Plan. Deferred fees of $496,288 were paid by the Trust to the Trustees under the Deferred Plan during the year ended September 30, 2018.
Pursuant to the provisions of the 1940 Act and related rules, the Fund may participate in an affiliated or nonaffiliated cash sweep program. In the cash sweep program, uninvested cash balances of the Fund may be used to purchase shares of affiliated or nonaffiliated money market funds or cash management pooled investment vehicles. The Fund is eligible to participate in the cash sweep program (the “Investing Funds”). As adviser, Janus Capital has an inherent conflict of interest because of its fiduciary duties to the affiliated money market funds or cash management pooled investment vehicles and the Investing Funds. Janus Henderson Cash Liquidity Fund LLC is an affiliated unregistered cash management pooled investment vehicle that invests primarily in highly-rated short-term fixed-income securities. Janus Henderson Cash Liquidity Fund LLC currently maintains a NAV of $1.00 per share and distributes income daily in a manner consistent with a registered product compliant with Rule 2a-7 under the 1940 Act. There are no restrictions on the Fund's ability to withdraw investments from Janus Henderson Cash Liquidity Fund LLC at will, and there are no unfunded capital commitments due from the Fund to Janus Henderson Cash Liquidity Fund LLC. The units of Janus Henderson Cash Liquidity Fund LLC are not charged any management fee, sales charge or service fee.
Any purchases and sales, realized gains/losses and recorded dividends from affiliated investments during the year ended September 30, 2018 can be found in the “Schedules of Affiliated Investments” located in the Schedule of Investments.
Class A Shares include a 5.75% upfront sales charge of the offering price of the Fund. The sales charge is allocated between Janus Henderson Distributors and financial intermediaries. During the year ended September 30, 2018, Janus Henderson Distributors retained upfront sales charges of $574,522.
A contingent deferred sales charge (“CDSC”) of 1.00% will be deducted with respect to Class A Shares purchased without a sales load and redeemed within 12 months of purchase, unless waived. Any applicable CDSC will be 1.00% of the lesser of the original purchase price or the value of the redemption of the Class A Shares redeemed. During the year ended September 30, 2018, redeeming shareholders of Class A Shares paid CDSCs of $30 to Janus Henderson Distributors.
Janus Investment Fund | 45 |
Janus Henderson Balanced Fund
Notes to Financial Statements
A CDSC of 1.00% will be deducted with respect to Class C Shares redeemed within 12 months of purchase, unless waived. Any applicable CDSC will be 1.00% of the lesser of the original purchase price or the value of the redemption of the Class C Shares redeemed. During the year ended September 30, 2018, redeeming shareholders of Class C Shares paid CDSCs of $105,722.
The Fund is permitted to purchase or sell securities (“cross-trade”) between itself and other funds or accounts managed by Janus Capital in accordance with Rule 17a-7 under the Investment Company Act of 1940 (“Rule 17a-7”), when the transaction is consistent with the investment objectives and policies of the Fund and in accordance with the Internal Cross Trade Procedures adopted by the Trust’s Board of Trustees. These procedures have been designed to ensure that any cross-trade of securities by the Fund from or to another fund or account that is or could be considered an affiliate of the Fund under certain limited circumstances by virtue of having a common investment adviser, common Officer, or common Trustee complies with Rule 17a-7. Under these procedures, each cross-trade is effected at the current market price to save costs where allowed. During the year ended September 30, 2018, the Fund engaged in cross trades amounting to $267,735,193 in purchases and $72,848,132 in sales, resulting in a net realized gain of $1,482,876. The net realized gain is included within the “Net Realized Gain/(Loss) on Investments” section of the Fund’s Statement of Operations.
4. Federal Income Tax
The tax components of capital shown in the table below represent: (1) distribution requirements the Fund must satisfy under the income tax regulations; (2) losses or deductions the Fund may be able to offset against income and gains realized in future years; and (3) unrealized appreciation or depreciation of investments for federal income tax purposes.
Other book to tax differences primarily consist of deferred compensation and foreign currency contract adjustments. The Fund has elected to treat gains and losses on forward foreign currency contracts as capital gains and losses, if applicable. Other foreign currency gains and losses on debt instruments are treated as ordinary income for federal income tax purposes pursuant to Section 988 of the Internal Revenue Code.
Loss Deferrals | Other Book | Net Tax | |||||
Undistributed
| Undistributed | Accumulated | Late-Year
| Post-October | to Tax | Appreciation/ | |
$ 17,833,481 | $ 507,497,580 | $ - | $ - | $ - | $ (303,898) | $3,895,740,246 | |
The aggregate cost of investments and the composition of unrealized appreciation and depreciation of investment securities for federal income tax purposes as of September 30, 2018 are noted below. The primary differences between book and tax appreciation or depreciation of investments are wash sale loss deferrals and investments in partnerships.
Federal Tax Cost | Unrealized | Unrealized
| Net Tax Appreciation/ |
$ 12,288,028,559 | $4,012,037,376 | $(116,297,130) | $ 3,895,740,246 |
46 | SEPTEMBER 30, 2018 |
Janus Henderson Balanced Fund
Notes to Financial Statements
Income and capital gains distributions are determined in accordance with income tax regulations that may differ from accounting principles generally accepted in the United States of America. These differences are due to differing treatments for items such as net short-term gains, deferral of wash sale losses, foreign currency transactions, passive foreign investment companies, net investment losses, and capital loss carryovers. Certain permanent differences such as tax returns of capital and net investment losses noted below have been reclassified to capital.
For the year ended September 30, 2018 | ||||
Distributions | ||||
From Ordinary Income | From Long-Term Capital Gains | Tax Return of Capital | Net Investment Loss | |
$ 232,344,680 | $ 451,542,749 | $ - | $ - | |
For the year ended September 30, 2017 | ||||
Distributions | ||||
From Ordinary Income | From Long-Term Capital Gains | Tax Return of Capital | Net Investment Loss | |
$ 259,944,039 | $ 149,376,643 | $ - | $ - | |
Permanent book to tax basis differences may result in reclassifications between the components of net assets. These differences have no impact on the results of operations or net assets. The following reclassifications have been made to the Fund:
Increase/(Decrease) to Capital | Increase/(Decrease)
to Undistributed | Increase/(Decrease) to Undistributed
|
$ 35,551,734 | $ 1,209,293 | $ (36,761,027) |
Capital has been adjusted by $35,551,734, all of which is long-term capital gain, for distributions in connection with Fund share redemptions (tax equalization).
Janus Investment Fund | 47 |
Janus Henderson Balanced Fund
Notes to Financial Statements
5. Capital Share Transactions
Year ended September 30, 2018 | Year ended September 30, 2017 | |||||
Shares | Amount | Shares | Amount | |||
Class A Shares: | ||||||
Shares sold | 7,711,873 | $ 262,344,651 | 4,892,032 | $ 149,292,367 | ||
Reinvested dividends and distributions | 685,030 | 22,698,836 | 686,042 | 20,573,575 | ||
Shares repurchased | (5,846,216) | (196,644,096) | (21,099,933) | (640,489,894) | ||
Net Increase/(Decrease) | 2,550,687 | $ 88,399,391 |
| (15,521,859) | $ (470,623,952) | |
Class C Shares: | ||||||
Shares sold | 11,914,884 | $ 400,945,569 | 4,820,698 | $ 146,784,395 | ||
Reinvested dividends and distributions | 1,463,080 | 47,959,330 | 912,472 | 27,191,116 | ||
Shares repurchased | (7,792,574) | (260,605,037) | (14,566,623) | (438,996,687) | ||
Net Increase/(Decrease) | 5,585,390 | $ 188,299,862 |
| (8,833,453) | $ (265,021,176) | |
Class D Shares: | ||||||
Shares sold | 4,027,607 | $ 136,140,889 | 3,521,432 | $ 108,112,668 | ||
Reinvested dividends and distributions | 2,380,330 | 79,049,288 | 1,557,916 | 47,244,151 | ||
Shares repurchased | (4,547,747) | (153,516,650) | (5,595,939) | (170,586,723) | ||
Net Increase/(Decrease) | 1,860,190 | $ 61,673,527 |
| (516,591) | $ (15,229,904) | |
Class I Shares: | ||||||
Shares sold | 42,715,098 | $1,457,353,192 | 28,860,088 | $ 890,078,436 | ||
Reinvested dividends and distributions | 2,828,037 | 94,126,294 | 1,564,288 | 47,582,450 | ||
Shares repurchased | (19,436,315) | (658,397,828) | (22,275,217) | (679,286,296) | ||
Net Increase/(Decrease) | 26,106,820 | $ 893,081,658 |
| 8,149,159 | $ 258,374,590 | |
Class N Shares: | ||||||
Shares sold | 12,069,205 | $ 408,403,498 | 9,756,479 | $ 297,337,988 | ||
Reinvested dividends and distributions | 3,367,860 | 111,853,805 | 2,173,373 | 65,921,800 | ||
Shares repurchased | (8,331,331) | (282,533,050) | (11,877,539) | (364,285,817) | ||
Net Increase/(Decrease) | 7,105,734 | $ 237,724,253 |
| 52,313 | $ (1,026,029) | |
Class R Shares: | ||||||
Shares sold | 1,805,672 | $ 60,736,128 | 3,890,500 | $ 117,381,225 | ||
Reinvested dividends and distributions | 426,954 | 14,042,797 | 290,029 | 8,686,978 | ||
Shares repurchased | (2,935,300) | (98,064,468) | (3,435,822) | (104,332,599) | ||
Net Increase/(Decrease) | (702,674) | $ (23,285,543) |
| 744,707 | $ 21,735,604 | |
Class S Shares: | ||||||
Shares sold | 3,061,183 | $ 103,174,114 | 3,169,757 | $ 96,748,173 | ||
Reinvested dividends and distributions | 864,701 | 28,595,766 | 632,904 | 19,069,362 | ||
Shares repurchased | (6,353,867) | (213,604,578) | (7,302,690) | (222,497,147) | ||
Net Increase/(Decrease) | (2,427,983) | $ (81,834,698) |
| (3,500,029) | $ (106,679,612) | |
Class T Shares: | ||||||
Shares sold | 30,485,638 | $1,030,049,011 | 20,318,231 | $ 618,839,684 | ||
Reinvested dividends and distributions | 7,228,929 | 239,724,774 | 4,860,745 | 147,060,598 | ||
Shares repurchased | (29,722,726) | (1,002,845,404) | (40,073,621) | (1,218,109,788) | ||
Net Increase/(Decrease) | 7,991,841 | $ 266,928,381 |
| (14,894,645) | $ (452,209,506) | |
6. Purchases and Sales of Investment Securities
For the year ended September 30, 2018, the aggregate cost of purchases and proceeds from sales of investment securities (excluding any short-term securities, short-term options contracts, TBAs, and in-kind transactions, as applicable) was as follows:
Purchases of | Proceeds from Sales | Purchases
of Long- | Proceeds
from Sales |
$5,668,464,143 | $5,821,870,027 | $ 7,801,246,198 | $ 6,146,293,355 |
48 | SEPTEMBER 30, 2018 |
Janus Henderson Balanced Fund
Notes to Financial Statements
7. Recent Accounting Pronouncements
The Securities and Exchange Commission adopted amendments to Regulation S-X, for the presentation of distributable earnings and distributions to align with US Generally Accepted Accounting Principles (GAAP). The compliance date of the amendments to Regulation S-X is November 5, 2018. This report incorporates the amendments to Regulation S-X.
The FASB issued Accounting Standards Update No. 2017-08, Receivables – Nonrefundable Fees and Other Costs (Subtopic 310-20), Premium Amortization on Purchased Callable Debt Securities ("ASU 2017-08") to amend the amortization period for certain purchased callable debt securities held at a premium. The guidance requires certain premiums on callable debt securities to be amortized to the earliest call date. The amortization period for callable debt securities purchased at a discount will not be impacted. The amendments are effective for fiscal years, and interim periods within those fiscal years, beginning after December 15, 2018. Early adoption is permitted, including adoption in an interim period. Management is currently evaluating the impacts of ASU 2017-08 on the financial statements.
The FASB issued Accounting Standards Update 2018-13, Fair Value Measurement (Topic 820) in August 2018. The new guidance removes, modifies and enhances the disclosures to Topic 820. For public entities, the amendments are effective for financial statements issued for fiscal years beginning after December 15, 2019, and interim periods within those fiscal years. Management is currently evaluating the impact of this new guidance on the financial statements.
8. Subsequent Event
Management has evaluated whether any events or transactions occurred subsequent to September 30, 2018 and through the date of issuance of the Fund’s financial statements and determined that there were no material events or transactions that would require recognition or disclosure in the Fund’s financial statements other than the following:
Effective November 1, 2018, the Fund has adopted an auto-conversion policy pursuant to which Class C Shares that are known by Janus Capital or its affiliates to have been held for ten years will be automatically converted to Class A Shares without the imposition of any sales charge, fee or other charge. The conversion will generally occur no later than ten business days in the month following the month of the tenth anniversary of the date of purchase. Class C Shares purchased through the reinvestment of dividends and other distributions on Class C Shares will convert to Class A Shares at the same time as the Class C Shares with respect to which they were purchased.
Janus Investment Fund | 49 |
Janus Henderson Balanced Fund
Report of Independent Registered Public Accounting Firm
To the Board of Trustees of Janus Investment Fund and Shareholders of Janus Henderson Balanced Fund:
Opinion on the Financial Statements
We have audited the accompanying statement of assets and liabilities, including the schedule of investments, of Janus Henderson Balanced Fund (one of the funds constituting Janus Investment Fund, referred to hereafter as the "Fund") as of September 30, 2018, the related statement of operations for the year ended September 30, 2018, the statements of changes in net assets for each of the two years in the period ended September 30, 2018, including the related notes, and the financial highlights for each of the five years in the period ended September 30, 2018 (collectively referred to as the “financial statements”). In our opinion, the financial statements present fairly, in all material respects, the financial position of the Fund as of September 30, 2018, the results of its operations for the year then ended, the changes in its net assets for each of the two years in the period ended September 30, 2018 and the financial highlights for each of the five years in the period ended September 30, 2018 in conformity with accounting principles generally accepted in the United States of America.
Basis for Opinion
These financial statements are the responsibility of the Fund’s management. Our responsibility is to express an opinion on the Fund’s financial statements based on our audits. We are a public accounting firm registered with the Public Company Accounting Oversight Board (United States) (“PCAOB”) and are required to be independent with respect to the Fund in accordance with the U.S. federal securities laws and the applicable rules and regulations of the Securities and Exchange Commission and the PCAOB.
We conducted our audits of these financial statements in accordance with the standards of the PCAOB. Those standards require that we plan and perform the audit to obtain reasonable assurance about whether the financial statements are free of material misstatement, whether due to error or fraud.
Our audits included performing procedures to assess the risks of material misstatement of the financial statements, whether due to error or fraud, and performing procedures that respond to those risks. Such procedures included examining, on a test basis, evidence regarding the amounts and disclosures in the financial statements. Our audits also included evaluating the accounting principles used and significant estimates made by management, as well as evaluating the overall presentation of the financial statements. Our procedures included confirmation of securities owned as of September 30, 2018 by correspondence with the custodian, transfer agent, investee companies and brokers; when replies were not received from brokers, we performed other auditing procedures. We believe that our audits provide a reasonable basis for our opinion.

Denver, Colorado
November 16, 2018
We have served as the auditor of one or more investment companies in Janus Henderson Funds since 1990.
50 | SEPTEMBER 30, 2018 |
Janus Henderson Balanced Fund
Additional Information (unaudited)
Proxy Voting Policies and Voting Record
A description of the policies and procedures that the Fund uses to determine how to vote proxies relating to its portfolio securities is available without charge: (i) upon request, by calling 1-800-525-1093; (ii) on the Fund’s website at janushenderson.com/proxyvoting; and (iii) on the SEC’s website at http://www.sec.gov. Additionally, information regarding the Fund’s proxy voting record for the most recent twelve-month period ended June 30 is also available, free of charge, through janushenderson.com/proxyvoting and from the SEC’s website at http://www.sec.gov.
Full Holdings
The Fund is required to disclose its complete holdings on Form N-Q within 60 days of the end of the first and third fiscal quarters, and in the annual report and semiannual report to Fund shareholders. These reports (i) are available on the SEC’s website at http://www.sec.gov; (ii) may be reviewed and copied at the SEC’s Public Reference Room in Washington, D.C. (information on the Public Reference Room may be obtained by calling 1-800-SEC-0330); and (iii) are available without charge, upon request, by calling a Janus Henderson representative at 1-877-335-2687 (toll free) (or 1-800-525-3713 if you hold Class D Shares). Portfolio holdings consisting of at least the names of the holdings are generally available on a monthly basis with a 30-day lag. Holdings are generally posted approximately two business days thereafter under Full Holdings for the Fund at janushenderson.com/info (or janushenderson.com/reports if you hold Class D Shares).
APPROVAL OF ADVISORY AGREEMENTS DURING THE PERIOD
The Trustees of Janus Investment Fund and Janus Aspen Series, each of whom serves as an “independent” Trustee (the “Trustees”), oversee the management of each Fund of Janus Investment Fund and each Portfolio of Janus Aspen Series (each, a “Fund” and collectively, the “Funds”), and as required by law, determine annually whether to continue the investment advisory agreement for each Fund and the subadvisory agreements for the 14 Funds that utilize subadvisers.
In connection with their most recent consideration of those agreements for each Fund, the Trustees received and reviewed information provided by Janus Capital and the respective subadvisers in response to requests of the Trustees and their independent legal counsel. They also received and reviewed information and analysis provided by, and in response to requests of, their independent fee consultant. Throughout their consideration of the agreements, the Trustees were advised by their independent legal counsel. The Trustees met with management to consider the agreements, and also met separately in executive session with their independent legal counsel and their independent fee consultant.
Additionally, in connection with their consideration of whether to continue the investment advisory agreement and subadvisory agreement for each Fund, as applicable, the Trustees also received and reviewed information in connection with the transaction to combine the respective businesses of Henderson Group plc and Janus Capital Group, Inc., the parent company of Janus Capital (the “Transaction”), announced in October 2016, which closed in the second quarter of 2017. In this regard, the Trustees reviewed information regarding the impact of the Transaction on the services to be provided by Janus Capital and each subadviser, as applicable, to the Funds under such agreements prior to the close of the Transaction as well as the services provided after the Transaction closed.
At a meeting held on December 7, 2017, based on the Trustees’ evaluation of the information provided by Janus Capital, the subadvisers, and the independent fee consultant, as well as other information, the Trustees determined that the overall arrangements between each Fund and Janus Capital and each subadviser, as applicable, were fair and reasonable in light of the nature, extent and quality of the services provided by Janus Capital, its affiliates and the subadvisers, the fees charged for those services, and other matters that the Trustees considered relevant in the exercise of their business judgment. At that meeting, the Trustees unanimously approved the continuation of the investment advisory agreement for each Fund, and the subadvisory agreement for each subadvised Fund, for the period from February 1, 2018 through February 1, 2019, subject to earlier termination as provided for in each agreement.
In considering the continuation of those agreements, the Trustees reviewed and analyzed various factors that they determined were relevant, including the factors described below, none of which by itself was considered dispositive. However, the material factors and conclusions that formed the basis for the Trustees’ determination to approve the continuation of the agreements are discussed separately below. Also included is a summary of the independent fee consultant’s conclusions and opinions that arose during, and were included as part of, the Trustees’ consideration of the
Janus Investment Fund | 51 |
Janus Henderson Balanced Fund
Additional Information (unaudited)
agreements. “Management fees,” as used herein, reflect actual annual advisory fees and any administration fees (excluding out of pocket costs), net of any waivers.
Nature, Extent and Quality of Services
The Trustees reviewed the nature, extent and quality of the services provided by Janus Capital and the subadvisers to the Funds, taking into account the investment objective, strategies and policies of each Fund, and the knowledge the Trustees gained from their regular meetings with management on at least a quarterly basis and their ongoing review of information related to the Funds. In addition, the Trustees reviewed the resources and key personnel of Janus Capital and each subadviser, particularly noting those employees who provide investment and risk management services to the Funds. The Trustees also considered other services provided to the Funds by Janus Capital or the subadvisers, such as managing the execution of portfolio transactions and the selection of broker-dealers for those transactions. The Trustees considered Janus Capital’s role as administrator to the Funds, noting that Janus Capital does not receive a fee for its services but is reimbursed for its out-of-pocket costs. The Trustees considered the role of Janus Capital in monitoring adherence to the Funds’ investment restrictions, providing support services for the Trustees and Trustee committees, and overseeing communications with shareholders and the activities of other service providers, including monitoring compliance with various policies and procedures of the Funds and with applicable securities laws and regulations.
In this regard, the independent fee consultant noted that Janus Capital provides a number of different services for the Funds and Fund shareholders, ranging from investment management services to various other servicing functions, and that, in its opinion, Janus Capital is a capable provider of those services. The independent fee consultant also provided its belief that Janus Capital has developed a number of institutional competitive advantages that should enable it to provide superior investment and service performance over the long term.
The Trustees concluded that the nature, extent and quality of the services provided by Janus Capital or the subadviser to each Fund were appropriate and consistent with the terms of the respective advisory and subadvisory agreements, and that, taking into account steps taken to address those Funds whose performance lagged that of their peers for certain periods, the Funds were likely to benefit from the continued provision of those services. They also concluded that Janus Capital and each subadviser had sufficient personnel, with the appropriate education and experience, to serve the Funds effectively and had demonstrated its ability to attract well-qualified personnel.
Performance of the Funds
The Trustees considered the performance results of each Fund over various time periods. They noted that they considered Fund performance data throughout the year, including periodic meetings with each Fund’s portfolio manager(s), and also reviewed information comparing each Fund’s performance with the performance of comparable funds and peer groups identified by Broadridge Financial Solutions, Inc. (“Broadridge”), an independent data provider, and with the Fund’s benchmark index. In this regard, the independent fee consultant found that the overall Funds’ performance has been strong: for the 36 months ended September 30, 2017, approximately 70% of the Funds were in the top two quartiles of performance, as reported by Morningstar, and for the 12 months ended September 30, 2017, approximately 46% of the Funds were in the top two quartiles of performance, as reported by Morningstar.
The Trustees considered the performance of each Fund, noting that performance may vary by share class, and noted the following:
Alternative Funds
· For Janus Henderson Diversified Alternatives Fund, the Trustees noted that the Fund’s performance was in the second Broadridge quartile for the 36 months ended May 31, 2017 and the second Broadridge quartile for the 12 months ended May 31, 2017.
· For Janus Henderson International Long/Short Equity Fund, the Trustees noted that the Fund’s performance was in the bottom Broadridge quartile for the 12 months ended May 31, 2017. The Trustees noted the reasons for the Fund’s underperformance, the steps Janus Capital had taken or was taking to improve performance, and the Fund’s limited performance history.
Asset Allocation Funds
· For Janus Henderson Global Allocation Fund – Conservative, the Trustees noted that the Fund’s performance was in the bottom Broadridge quartile for the 36 months ended May 31, 2017 and the second Broadridge
52 | SEPTEMBER 30, 2018 |
Janus Henderson Balanced Fund
Additional Information (unaudited)
quartile for the 12 months ended May 31, 2017. The Trustees noted the reasons for the Fund’s underperformance, the steps Janus Capital had taken or was taking to improve performance, and that the performance trend was improving.
· For Janus Henderson Global Allocation Fund – Growth, the Trustees noted that the Fund’s performance was in the bottom Broadridge quartile for the 36 months ended May 31, 2017 and the second Broadridge quartile for the 12 months ended May 31, 2017. The Trustees noted the reasons for the Fund’s underperformance, the steps Janus Capital had taken or was taking to improve performance, and that the performance trend was improving.
· For Janus Henderson Global Allocation Fund – Moderate, the Trustees noted that the Fund’s performance was in the bottom Broadridge quartile for the 36 months ended May 31, 2017 and the third Broadridge quartile for the 12 months ended May 31, 2017. The Trustees noted the reasons for the Fund’s underperformance and the steps Janus Capital had taken or was taking to improve performance.
Fixed-Income Funds
· For Janus Henderson Flexible Bond Fund, the Trustees noted that the Fund’s performance was in the bottom Broadridge quartile for the 36 months ended May 31, 2017 and the bottom Broadridge quartile for the 12 months ended May 31, 2017. The Trustees noted the reasons for the Fund’s underperformance and the steps Janus Capital had taken or was taking to improve performance.
· For Janus Henderson Global Bond Fund, the Trustees noted that the Fund’s performance was in the third Broadridge quartile for the 36 months ended May 31, 2017 and the bottom Broadridge quartile for the 12 months ended May 31, 2017. The Trustees noted the reasons for the Fund’s underperformance and the steps Janus Capital had taken or was taking to improve performance.
· For Janus Henderson Global Unconstrained Bond Fund, the Trustees noted that the Fund’s performance was in the third Broadridge quartile for the 36 months ended May 31, 2017 and the bottom Broadridge quartile for the 12 months ended May 31, 2017. The Trustees noted the reasons for the Fund’s underperformance and the steps Janus Capital had taken or was taking to improve performance.
· For Janus Henderson High-Yield Fund, the Trustees noted that the Fund’s performance was in the second Broadridge quartile for the 36 months ended May 31, 2017 and the third Broadridge quartile for the 12 months ended May 31, 2017.
· For Janus Henderson Multi-Sector Income Fund, the Trustees noted that the Fund’s performance was in the first Broadridge quartile for the 36 months ended May 31, 2017 and the second Broadridge quartile for the 12 months ended May 31, 2017.
· For Janus Henderson Real Return Fund, the Trustees noted that the Fund’s performance was in the first Broadridge quartile for the 36 months ended May 31, 2017 and the first Broadridge quartile for the 12 months ended May 31, 2017.
· For Janus Henderson Short-Term Bond Fund, the Trustees noted that the Fund’s performance was in the third Broadridge quartile for the 36 months ended May 31, 2017 and the third Broadridge quartile for the 12 months ended May 31, 2017. The Trustees noted the reasons for the Fund’s underperformance and the steps Janus Capital had taken or was taking to improve performance.
· For Janus Henderson Strategic Income Fund, the Trustees noted that the Fund’s performance was in the first Broadridge quartile for the 36 months ended May 31, 2017 and the second Broadridge quartile for the 12 months ended May 31, 2017.
Global and International Equity Funds
· For Janus Henderson Asia Equity Fund, the Trustees noted that the Fund’s performance was in the first Broadridge quartile for the 36 months ended May 31, 2017 and the first Broadridge quartile for the 12 months ended May 31, 2017.
Janus Investment Fund | 53 |
Janus Henderson Balanced Fund
Additional Information (unaudited)
· For Janus Henderson Emerging Markets Fund, the Trustees noted that the Fund’s performance was in the first Broadridge quartile for the 36 months ended May 31, 2017 and the third Broadridge quartile for the 12 months ended May 31, 2017.
· For Janus Henderson European Focus Fund, the Trustees noted that the Fund’s performance was in the bottom Broadridge quartile for the 36 months ended May 31, 2017 and the bottom Broadridge quartile for the 12 months ended May 31, 2017. The Trustees noted the reasons for the Fund’s underperformance and the steps Janus Capital had taken or was taking to improve performance.
· For Janus Henderson Global Equity Income Fund, the Trustees noted that the Fund’s performance was in the third Broadridge quartile for the 36 months ended May 31, 2017 and the second Broadridge quartile for the 12 months ended May 31, 2017. The Trustees noted the reasons for the Fund’s underperformance, the steps Janus Capital had taken or was taking to improve performance, and that the performance trend was improving.
· For Janus Henderson Global Life Sciences Fund, the Trustees noted that the Fund’s performance was in the second Broadridge quartile for the 36 months ended May 31, 2017 and the second Broadridge quartile for the 12 months ended May 31, 2017.
· For Janus Henderson Global Real Estate Fund, the Trustees noted that the Fund’s performance was in the second Broadridge quartile for the 36 months ended May 31, 2017 and the first Broadridge quartile for the 12 months ended May 31, 2017.
· For Janus Henderson Global Research Fund, the Trustees noted that the Fund’s performance was in the third Broadridge quartile for the 36 months ended May 31, 2017 and the second Broadridge quartile for the 12 months ended May 31, 2017. The Trustees noted the reasons for the Fund’s underperformance, while also noting that the Fund has a performance fee structure that results in lower management fees during periods of underperformance, the steps Janus Capital had taken or was taking to improve performance, and that the performance trend was improving.
· For Janus Henderson Global Select Fund, the Trustees noted that the Fund’s performance was in the third Broadridge quartile for the 36 months ended May 31, 2017 and the first Broadridge quartile for the 12 months ended May 31, 2017. The Trustees noted the reasons for the Fund’s underperformance, the steps Janus Capital had taken or was taking to improve performance, and that the performance trend was improving.
· For Janus Henderson Global Technology Fund, the Trustees noted that the Fund’s performance was in the third Broadridge quartile for the 36 months ended May 31, 2017 and the third Broadridge quartile for the 12 months ended May 31, 2017. The Trustees noted the reasons for the Fund’s underperformance and the steps Janus Capital had taken or was taking to improve performance.
· For Janus Henderson Global Value Fund, the Trustees noted that the Fund’s performance was in the third Broadridge quartile for the 36 months ended May 31, 2017 and the bottom Broadridge quartile for the 12 months ended May 31, 2017. The Trustees noted the reasons for the Fund’s underperformance, while also noting that the Fund has a performance fee structure that results in lower management fees during periods of underperformance, and the steps Janus Capital and Perkins had taken or were taking to improve performance.
· For Janus Henderson International Opportunities Fund, the Trustees noted that the Fund’s performance was in the second Broadridge quartile for the 36 months ended May 31, 2017 and the bottom Broadridge quartile for the 12 months ended May 31, 2017.
· For Janus Henderson International Small Cap Fund, the Trustees noted that, due to limited performance for the Fund, performance history was not a material factor.
· For Janus Henderson International Value Fund, the Trustees noted that the Fund’s performance was in the third Broadridge quartile for the 36 months ended May 31, 2017 and the bottom Broadridge quartile for the 12 months ended May 31, 2017. The Trustees noted the reasons for the Fund’s underperformance and the steps Janus Capital and Perkins had taken or were taking to improve performance.
· For Janus Henderson Overseas Fund, the Trustees noted that the Fund’s performance was in the bottom Broadridge quartile for the 36 months ended May 31, 2017 and the first Broadridge quartile for the 12 months ended May 31, 2017. The Trustees noted the reasons for the Fund’s underperformance, while also noting that
54 | SEPTEMBER 30, 2018 |
Janus Henderson Balanced Fund
Additional Information (unaudited)
the Fund has a performance fee structure that results in lower management fees during periods of underperformance, the steps Janus Capital had taken or was taking to improve performance, and that the performance trend was improving.
Money Market Funds
· For Janus Henderson Government Money Market Fund, the Trustees noted that the Fund’s performance was in the third Broadridge quartile for the 36 months ended May 31, 2017 and the third Broadridge quartile for the 12 months ended May 31, 2017. The Trustees noted the reasons for the Fund’s underperformance.
· For Janus Henderson Money Market Fund, the Trustees noted that the Fund’s performance was in the third Broadridge quartile for the 36 months ended May 31, 2017 and the third Broadridge quartile for the 12 months ended May 31, 2017. The Trustees noted the reasons for the Fund’s underperformance.
Multi-Asset Funds
· For Janus Henderson Adaptive Global Allocation Fund, the Trustees noted that the Fund’s performance was in the second Broadridge quartile for the 12 months ended May 31, 2017.
· For Janus Henderson All Asset Fund, the Trustees noted that the Fund’s performance was in the third Broadridge quartile for the 36 months ended May 31, 2017 and the third Broadridge quartile for the 12 months ended May 31, 2017. The Trustees noted the reasons for the Fund’s underperformance and the steps Janus Capital had taken or was taking to improve performance.
· For Janus Henderson Dividend & Income Builder Fund, the Trustees noted that the Fund’s performance was in the second Broadridge quartile for the 36 months ended May 31, 2017 and the second Broadridge quartile for the 12 months ended May 31, 2017.
· For Janus Henderson Value Plus Income Fund, the Trustees noted that the Fund’s performance was in the second Broadridge quartile for the 36 months ended May 31, 2017 and the second Broadridge quartile for the 12 months ended May 31, 2017.
Multi-Asset U.S. Equity Funds
· For Janus Henderson Balanced Fund, the Trustees noted that the Fund’s performance was in the first Broadridge quartile for the 36 months ended May 31, 2017 and the first Broadridge quartile for the 12 months ended May 31, 2017.
· For Janus Henderson Contrarian Fund, the Trustees noted that the Fund’s performance was in the bottom Broadridge quartile for the 36 months ended May 31, 2017 and the first Broadridge quartile for the 12 months ended May 31, 2017. The Trustees noted the reasons for the Fund’s underperformance, while also noting that the Fund has a performance fee structure that results in lower management fees during periods of underperformance, the steps Janus Capital had taken or was taking to improve performance, and that the performance trend was improving.
· For Janus Henderson Enterprise Fund, the Trustees noted that the Fund’s performance was in the first Broadridge quartile for the 36 months ended May 31, 2017 and the second Broadridge quartile for the 12 months ended May 31, 2017.
· For Janus Henderson Forty Fund, the Trustees noted that the Fund’s performance was in the first Broadridge quartile for the 36 months ended May 31, 2017 and the third Broadridge quartile for the 12 months ended May 31, 2017.
· For Janus Henderson Growth and Income Fund, the Trustees noted that the Fund’s performance was in the second Broadridge quartile for the 36 months ended May 31, 2017 and the first Broadridge quartile for the 12 months ended May 31, 2017.
· For Janus Henderson Research Fund, the Trustees noted that the Fund’s performance was in the second Broadridge quartile for the 36 months ended May 31, 2017 and the third Broadridge quartile for the 12 months ended May 31, 2017.
Janus Investment Fund | 55 |
Janus Henderson Balanced Fund
Additional Information (unaudited)
· For Janus Henderson Triton Fund, the Trustees noted that the Fund’s performance was in the first Broadridge quartile for the 36 months ended May 31, 2017 and the third Broadridge quartile for the 12 months ended May 31, 2017.
· For Janus Henderson U.S. Growth Opportunities Fund, the Trustees noted that the Fund’s performance was in the bottom Broadridge quartile for the 12 months ended May 31, 2017. The Trustees noted the reasons for the Fund’s underperformance, the steps Janus Capital had taken or was taking to improve performance, and the Fund’s limited performance history.
· For Janus Henderson Venture Fund, the Trustees noted that the Fund’s performance was in the first Broadridge quartile for the 36 months ended May 31, 2017 and the bottom Broadridge quartile for the 12 months ended May 31, 2017.
Quantitative Equity Funds
· For Janus Henderson Emerging Markets Managed Volatility Fund, the Trustees noted that the Fund’s performance was in the bottom Broadridge quartile for the 12 months ended May 31, 2017. The Trustees noted the reasons for the Fund’s underperformance, the steps Janus Capital and Intech had taken or were taking to improve performance, and the Fund’s limited performance history.
· For Janus Henderson Global Income Managed Volatility Fund, the Trustees noted that the Fund’s performance was in the first Broadridge quartile for the 36 months ended May 31, 2017 and the third Broadridge quartile for the 12 months ended May 31, 2017.
· For Janus Henderson International Managed Volatility Fund, the Trustees noted that the Fund’s performance was in the third Broadridge quartile for the 36 months ended May 31, 2017 and the bottom Broadridge quartile for the 12 months ended May 31, 2017. The Trustees noted the reasons for the Fund’s underperformance and the steps Janus Capital and Intech had taken or were taking to improve performance.
· For Janus Henderson U.S. Managed Volatility Fund, the Trustees noted that the Fund’s performance was in the second Broadridge quartile for the 36 months ended May 31, 2017 and the bottom Broadridge quartile for the 12 months ended May 31, 2017.
U.S. Equity Funds
· For Janus Henderson Large Cap Value Fund, the Trustees noted that the Fund’s performance was in the third Broadridge quartile for the 36 months ended May 31, 2017 and the bottom Broadridge quartile for the 12 months ended May 31, 2017. The Trustees noted the reasons for the Fund’s underperformance, while also noting that the Fund has a performance fee structure that results in lower management fees during periods of underperformance, and the steps Janus Capital and Perkins had taken or were taking to improve performance.
· For Janus Henderson Mid Cap Value Fund, the Trustees noted that the Fund’s performance was in the second Broadridge quartile for the 36 months ended May 31, 2017 and the second Broadridge quartile for the 12 months ended May 31, 2017.
· For Janus Henderson Select Value Fund, the Trustees noted that the Fund’s performance was in the first Broadridge quartile for the 36 months ended May 31, 2017 and the second Broadridge quartile for the 12 months ended May 31, 2017.
· For Janus Henderson Small Cap Value Fund, the Trustees noted that the Fund’s performance was in the first Broadridge quartile for the 36 months ended May 31, 2017 and the second Broadridge quartile for the 12 months ended May 31, 2017.
Janus Aspen Series
· For Janus Henderson Balanced Portfolio, the Trustees noted that the Fund’s performance was in the first Broadridge quartile for the 36 months ended May 31, 2017 and the first Broadridge quartile for the 12 months ended May 31, 2017.
· For Janus Henderson Enterprise Portfolio, the Trustees noted that the Fund’s performance was in the first Broadridge quartile for the 36 months ended May 31, 2017 and the second Broadridge quartile for the 12 months ended May 31, 2017.
56 | SEPTEMBER 30, 2018 |
Janus Henderson Balanced Fund
Additional Information (unaudited)
· For Janus Henderson Flexible Bond Portfolio, the Trustees noted that the Fund’s performance was in the bottom Broadridge quartile for the 36 months ended May 31, 2017 and the bottom Broadridge quartile for the 12 months ended May 31, 2017. The Trustees noted the reasons for the Fund’s underperformance and the steps Janus Capital had taken or was taking to improve performance.
· For Janus Henderson Forty Portfolio, the Trustees noted that the Fund’s performance was in the first Broadridge quartile for the 36 months ended May 31, 2017 and the third Broadridge quartile for the 12 months ended May 31, 2017.
· For Janus Henderson Global Allocation Portfolio – Moderate, the Trustees noted that the Fund’s performance was in the bottom Broadridge quartile for the 36 months ended May 31, 2017 and the second Broadridge quartile for the 12 months ended May 31, 2017. The Trustees noted the reasons for the Fund’s underperformance, the steps Janus Capital had taken or was taking to improve performance, and that the performance trend was improving.
· For Janus Henderson Global Research Portfolio, the Trustees noted that the Fund’s performance was in the third Broadridge quartile for the 36 months ended May 31, 2017 and the third Broadridge quartile for the 12 months ended May 31, 2017. The Trustees noted the reasons for the Fund’s underperformance, while also noting that the Fund has a performance fee structure that results in lower management fees during periods of underperformance, and the steps Janus Capital had taken or was taking to improve performance.
· For Janus Henderson Global Technology Portfolio, the Trustees noted that the Fund’s performance was in the second Broadridge quartile for the 36 months ended May 31, 2017 and the second Broadridge quartile for the 12 months ended May 31, 2017.
· For Janus Henderson Global Unconstrained Bond Portfolio, the Trustees noted that the Fund’s performance was in the bottom Broadridge quartile for the 12 months ended May 31, 2017. The Trustees noted the reasons for the Fund’s underperformance, the steps Janus Capital had taken or was taking to improve performance, and the Fund’s limited performance history.
· For Janus Henderson Mid Cap Value Portfolio, the Trustees noted that the Fund’s performance was in the third Broadridge quartile for the 36 months ended May 31, 2017 and the second Broadridge quartile for the 12 months ended May 31, 2017. The Trustees noted the reasons for the Fund’s underperformance, while also noting that the Fund has a performance fee structure that results in lower management fees during periods of underperformance, the steps Janus Capital and Perkins had taken or were taking to improve performance, and that the performance trend was improving.
· For Janus Henderson Overseas Portfolio, the Trustees noted that the Fund’s performance was in the bottom Broadridge quartile for the 36 months ended May 31, 2017 and the first Broadridge quartile for the 12 months ended May 31, 2017. The Trustees noted the reasons for the Fund’s underperformance, while also noting that the Fund has a performance fee structure that results in lower management fees during periods of underperformance, the steps Janus Capital had taken or was taking to improve performance, and that the performance trend was improving.
· For Janus Henderson Research Portfolio, the Trustees noted that the Fund’s performance was in the second Broadridge quartile for the 36 months ended May 31, 2017 and the third Broadridge quartile for the 12 months ended May 31, 2017.
· For Janus Henderson U.S. Low Volatility Portfolio, the Trustees noted that the Fund’s performance was in the first Broadridge quartile for the 36 months ended May 31, 2017 and the bottom Broadridge quartile for the 12 months ended May 31, 2017.
In consideration of each Fund’s performance, the Trustees concluded that, taking into account the factors relevant to performance, as well as other considerations, including steps taken to improve performance, the Fund’s performance warranted continuation of the Fund’s investment advisory and subadvisory agreement(s).
Costs of Services Provided
The Trustees examined information regarding the fees and expenses of each Fund in comparison to similar information for other comparable funds as provided by Broadridge, an independent data provider. They also reviewed an analysis of
Janus Investment Fund | 57 |
Janus Henderson Balanced Fund
Additional Information (unaudited)
that information provided by their independent fee consultant and noted that the rate of management (investment advisory and any administration, but excluding out-of-pocket costs) fees for many of the Funds, after applicable waivers, was below the average management fee rate of the respective peer group of funds selected by an independent data provider. The Trustees also examined information regarding the subadvisory fees charged for subadvisory services, as applicable, noting that all such fees were paid by Janus Capital out of its management fees collected from such Fund.
The independent fee consultant provided its belief that the management fees charged by Janus Capital to each of the Funds under the current investment advisory and administration agreements are reasonable in relation to the services provided by Janus Capital. The independent fee consultant found: (1) the total expenses and management fees of the Funds to be reasonable relative to other mutual funds; (2) total expenses, on average, were 10% below the average total expenses of their respective Broadridge Expense Group peers and 18% below the average total expenses for their Broadridge Expense Universes; (3) management fees for the Funds, on average, were 8% below the average management fees for their Expense Groups and 9% below the average for their Expense Universes; and (4) Fund expenses at the functional level for each asset and share class category were reasonable. The Trustees also considered the total expenses for each share class of each Fund compared to the average total expenses for its Broadridge Expense Group peers and to average total expenses for its Broadridge Expense Universe.
The independent fee consultant concluded that, based on its strategic review of expenses at the complex, category and individual fund level, Fund expenses were found to be reasonable relative to both Expense Group and Expense Universe benchmarks. Further, for certain Funds, the independent fee consultant also performed a systematic “focus list” analysis of expenses in the context of the performance or service delivered to each set of investors in each share class in each selected Fund. Based on this analysis, the independent fee consultant found that the combination of service quality/performance and expenses on these individual Funds and share classes were reasonable in light of performance trends, performance histories, and existence of performance fees, breakpoints, and expense waivers on such Funds.
The Trustees considered the methodology used by Janus Capital and each subadviser in determining compensation payable to portfolio managers, the competitive environment for investment management talent, and the competitive market for mutual funds in different distribution channels.
The Trustees also reviewed management fees charged by Janus Capital and each subadviser to comparable separate account clients and to comparable non-affiliated funds subadvised by Janus Capital or by a subadviser (for which Janus Capital or the subadviser provides only or primarily portfolio management services). Although in most instances subadvisory and separate account fee rates for various investment strategies were lower than management fee rates for Funds having a similar strategy, the Trustees considered that Janus Capital noted that, under the terms of the management agreements with the Funds, Janus Capital performs significant additional services for the Funds that it does not provide to those other clients, including administration services, oversight of the Funds’ other service providers, trustee support, regulatory compliance and numerous other services, and that, in serving the Funds, Janus Capital assumes many legal risks and other costs that it does not assume in servicing its other clients. Moreover, they noted that the independent fee consultant found that: (1) the management fees Janus Capital charges to the Funds are reasonable in relation to the management fees Janus Capital charges to its institutional clients and to the fees Janus Capital charges to funds subadvised by Janus Capital; (2) these institutional and subadvised accounts have different service and infrastructure needs; (3) Janus mutual fund investors enjoy reasonable fees relative to the fees charged to Janus institutional and subadvised fund investors; (4) in three of seven product categories, the Funds receive proportionally better pricing than the industry in relation to Janus institutional clients; and (5) in seven of eight strategies, Janus Capital has lower management fees than funds subadvised by Janus Capital’s portfolio managers.
The Trustees considered the fees for each Fund for its fiscal year ended in 2016, and noted the following with regard to each Fund’s total expenses, net of applicable fee waivers (the Fund’s “total expenses”):
Alternative Funds
· For Janus Henderson Diversified Alternatives Fund, the Trustees noted that, although the Fund’s total expenses exceeded the peer group average for one share class, overall the Fund’s total expenses were reasonable. The Trustees also noted that Janus Capital has contractually agreed to limit the Fund’s expenses.
· For Janus Henderson International Long/Short Equity Fund, the Trustees noted that, although the Fund’s total expenses exceeded the peer group average for one share class, overall the Fund’s total expenses were
58 | SEPTEMBER 30, 2018 |
Janus Henderson Balanced Fund
Additional Information (unaudited)
reasonable. The Trustees also noted that Janus Capital has contractually agreed to limit the Fund’s expenses effective June 5, 2017.
Asset Allocation Funds
· For Janus Henderson Global Allocation Fund – Conservative, the Trustees noted that, although the Fund’s total expenses exceeded the peer group average for certain share classes, overall the Fund’s total expenses were reasonable. The Trustees also noted that Janus Capital has contractually agreed to limit the Fund’s expenses, although this limit did not apply because the Fund’s total expenses were already below the applicable fee limit.
· For Janus Henderson Global Allocation Fund – Growth, the Trustees noted that the Fund’s total expenses were below the peer group average for all share classes.
· For Janus Henderson Global Allocation Fund – Moderate, the Trustees noted that, although the Fund’s total expenses exceeded the peer group average for certain share classes, overall the Fund’s total expenses were reasonable. The Trustees also noted that Janus Capital has contractually agreed to limit the Fund’s expenses.
Fixed-Income Funds
· For Janus Henderson Flexible Bond Fund, the Trustees noted that, although the Fund’s total expenses exceeded the peer group average for certain share classes, overall the Fund’s total expenses were reasonable. The Trustees also noted that Janus Capital has contractually agreed to limit the Fund’s expenses, although this limit did not apply because the Fund’s total expenses were already below the applicable fee limit.
· For Janus Henderson Global Bond Fund, the Trustees noted that, although the Fund’s total expenses exceeded the peer group average for certain share classes, overall the Fund’s total expenses were reasonable. The Trustees also noted that Janus Capital has contractually agreed to limit the Fund’s expenses.
· For Janus Henderson Global Unconstrained Bond Fund, the Trustees noted that the Fund’s performance was in the third Broadridge quartile for the 36 months ended May 31, 2017 and the bottom Broadridge quartile for the 12 months ended May 31, 2017. The Trustees noted the reasons for the Fund’s underperformance and the steps Janus Capital had taken or was taking to improve performance.
· For Janus Henderson High-Yield Fund, the Trustees noted that, although the Fund’s total expenses exceeded the peer group average for certain share classes, overall the Fund’s total expenses were reasonable. The Trustees also noted that Janus Capital has contractually agreed to limit the Fund’s expenses, although this limit did not apply because the Fund’s total expenses were already below the applicable fee limit.
· For Janus Henderson Multi-Sector Income Fund, the Trustees noted that, although the Fund’s total expenses exceeded the peer group average for one share class, overall the Fund’s total expenses were reasonable. The Trustees also noted that Janus Capital has contractually agreed to limit the Fund’s expenses.
· For Janus Henderson Real Return Fund, the Trustees noted that, although the Fund’s total expenses exceeded the peer group average for certain share classes, overall the Fund’s total expenses were reasonable. The Trustees also noted that Janus Capital has contractually agreed to limit the Fund’s expenses.
· For Janus Henderson Short-Term Bond Fund, the Trustees noted that, although the Fund’s total expenses exceeded the peer group average for certain share classes, overall the Fund’s total expenses were reasonable. The Trustees also noted that Janus Capital has contractually agreed to waive 11 basis points of management fees effective February 1, 2018 and also has contractually agreed to limit the Fund’s expenses.
· For Janus Henderson Strategic Income Fund, the Trustees noted that, although the Fund’s total expenses exceeded the peer group average for one share class, overall the Fund’s total expenses were reasonable. The Trustees also noted that Janus Capital has contractually agreed to limit the Fund’s expenses effective June 5, 2017.
Global and International Equity Funds
· For Janus Henderson Asia Equity Fund, the Trustees noted that, although the Fund’s total expenses exceeded the peer group average for certain share classes, overall the Fund’s total expenses were reasonable. The Trustees also noted that Janus Capital has contractually agreed to limit the Fund’s expenses.
Janus Investment Fund | 59 |
Janus Henderson Balanced Fund
Additional Information (unaudited)
· For Janus Henderson Emerging Markets Fund, the Trustees noted that, although the Fund’s total expenses exceeded the peer group average for one share class, overall the Fund’s total expenses were reasonable. The Trustees also noted that Janus Capital has contractually agreed to limit the Fund’s expenses effective June 5, 2017.
· For Janus Henderson European Focus Fund, the Trustees noted that, although the Fund’s total expenses exceeded the peer group average for one share class, overall the Fund’s total expenses were reasonable. The Trustees also noted that Janus Capital has contractually agreed to limit the Fund’s expenses effective June 5, 2017.
· For Janus Henderson Global Equity Income Fund, the Trustees noted that the Fund’s total expenses were below the peer group average for all share classes.
· For Janus Henderson Global Life Sciences Fund, the Trustees noted that the Fund’s total expenses were below the peer group average for all share classes.
· For Janus Henderson Global Real Estate Fund, the Trustees noted that, although the Fund’s total expenses exceeded the peer group average one share class, overall the Fund’s total expenses were reasonable. The Trustees also noted that Janus Capital has contractually agreed to limit the Fund’s expenses, although this limit did not apply because the Fund’s total expenses were already below the applicable fee limit.
· For Janus Henderson Global Research Fund, the Trustees noted that the Fund’s total expenses were below the peer group average for all share classes.
· For Janus Henderson Global Select Fund, the Trustees noted that, although the Fund’s total expenses exceeded the peer group average for one share class, overall the Fund’s total expenses were reasonable. The Trustees also noted that Janus Capital has contractually agreed to limit the Fund’s expenses, although this limit did not apply because the Fund’s total expenses were already below the applicable fee limit.
· For Janus Henderson Global Technology Fund, the Trustees noted that the Fund’s total expenses were below the peer group average for all share classes.
· For Janus Henderson Global Value Fund, the Trustees noted that the Fund’s total expenses were below the peer group average for all share classes.
· For Janus Henderson International Opportunities Fund, the Trustees noted that, although the Fund’s total expenses exceeded the peer group average for certain share classes, overall the Fund’s total expenses were reasonable. The Trustees also noted that Janus Capital has contractually agreed to limit the Fund’s expenses effective June 5, 2017.
· For Janus Henderson International Small Cap Fund, the Trustees noted that, although the Fund’s total expenses exceeded the peer group average for one share class, overall the Fund’s total expenses were reasonable. The Trustees also noted that Janus Capital has contractually agreed to limit the Fund’s expenses effective June 5, 2017.
· For Janus Henderson International Value Fund, the Trustees noted that, although the Fund’s total expenses exceeded the peer group average for one share class, overall the Fund’s total expenses were reasonable. The Trustees also noted that Janus Capital has contractually agreed to limit the Fund’s expenses.
· For Janus Henderson Overseas Fund, the Trustees noted that the Fund’s total expenses were below the peer group average for all share classes.
Money Market Funds
· For Janus Henderson Government Money Market Fund, the Trustees noted that the Fund’s total expenses were below the peer group average for both share classes. In addition, the Trustees considered that Janus Capital voluntarily waives one-half of its advisory fee and other expenses in order to maintain a positive yield.
· For Janus Henderson Money Market Fund, the Trustees noted that the Fund’s total expenses were below the peer group average for both share classes. In addition, the Trustees considered that Janus Capital voluntarily waives one-half of its advisory fee and other expenses in order to maintain a positive yield.
60 | SEPTEMBER 30, 2018 |
Janus Henderson Balanced Fund
Additional Information (unaudited)
Multi-Asset Funds
· For Janus Henderson Adaptive Global Allocation Fund, the Trustees noted that, although the Fund’s total expenses exceeded the peer group average for one share class, overall the Fund’s total expenses were reasonable. The Trustees also noted that Janus Capital has contractually agreed to limit the Fund’s expenses.
· For Janus Henderson All Asset Fund, the Trustees noted that, although the Fund’s total expenses exceeded the peer group average for one share class, overall the Fund’s total expenses were reasonable. The Trustees also noted that Janus Capital has contractually agreed to limit the Fund’s total expenses effective June 5, 2017.
· For Janus Henderson Dividend & Income Builder Fund, the Trustees noted that, although the Fund’s total expenses exceeded the peer group average for certain share classes, overall the Fund’s total expenses were reasonable. The Trustees also noted that Janus Capital has contractually agreed to limit the Fund’s expenses effective June 5, 2017.
· For Janus Henderson Value Plus Income Fund, the Trustees noted that the Fund’s total expenses were below the peer group average for all share classes.
Multi-Asset U.S. Equity Funds
· For Janus Henderson Balanced Fund, the Trustees noted that, although the Fund’s total expenses exceeded the peer group average for certain share classes, overall the Fund’s total expenses were reasonable. The Trustees also noted that Janus Capital has contractually agreed to limit the Fund’s expenses, although this limit did not apply because the Fund’s total expenses were already below the applicable fee limit.
· For Janus Henderson Contrarian Fund, the Trustees noted that, although the Fund’s total expenses exceeded the peer group average for one share class, overall the Fund’s total expenses were reasonable. The Trustees also noted that Janus Capital has contractually agreed to limit the Fund’s expenses, although this limit did not apply because the Fund’s total expenses were already below the applicable fee limit.
· For Janus Henderson Enterprise Fund, the Trustees noted that, although the Fund’s total expenses exceeded the peer group average for certain share classes, overall the Fund’s total expenses were reasonable. The Trustees also noted that Janus Capital has contractually agreed to limit the Fund’s expenses, although this limit did not apply because the Fund’s total expenses were already below the applicable fee limit.
· For Janus Henderson Forty Fund, the Trustees noted that, although the Fund’s total expenses exceeded the peer group average for certain share classes, overall the Fund’s total expenses were reasonable. The Trustees also noted that Janus Capital has contractually agreed to limit the Fund’s expenses, although this limit did not apply because the Fund’s total expenses were already below the applicable fee limit.
· For Janus Henderson Growth and Income Fund, the Trustees noted that, although the Fund’s total expenses exceeded the peer group average for certain share classes, overall the Fund’s total expenses were reasonable. The Trustees also noted that Janus Capital has contractually agreed to limit the Fund’s expenses, although this limit did not apply because the Fund’s total expenses were already below the applicable fee limit.
· For Janus Henderson Research Fund, the Trustees noted that, although the Fund’s total expenses were equal to or exceeded the peer group average for certain share classes, overall the Fund’s total expenses were reasonable. The Trustees also noted that Janus Capital has contractually agreed to limit the Fund’s expenses effective February 1, 2017.
· For Janus Henderson Triton Fund, the Trustees noted that the Fund’s total expenses were below the peer group average for all share classes.
· For Janus Henderson U.S. Growth Opportunities Fund, the Trustees noted that, although the Fund’s total expenses exceeded the peer group average for one share class, overall the Fund’s total expenses were reasonable. The Trustees also noted that Janus Capital has contractually agreed to limit the Fund’s expenses effective June 5, 2017.
· For Janus Henderson Venture Fund, the Trustees noted that the Fund’s total expenses were below the peer group average for all share classes.
Janus Investment Fund | 61 |
Janus Henderson Balanced Fund
Additional Information (unaudited)
Quantitative Equity Funds
· For Janus Henderson Emerging Markets Managed Volatility Fund, the Trustees noted that, although the Fund’s total expenses exceeded the peer group average for certain share classes, overall the Fund’s total expenses were reasonable. The Trustees also noted that Janus Capital has contractually agreed to limit the Fund’s expenses.
· For Janus Henderson Global Income Managed Volatility Fund, the Trustees noted that the Fund’s total expenses were below the peer group average for all share classes.
· For Janus Henderson International Managed Volatility Fund, the Trustees noted that, although the Fund’s total expenses exceeded the peer group average for one share class, overall the Fund’s total expenses were reasonable. The Trustees also noted that Janus Capital has contractually agreed to limit the Fund’s expenses.
· For Janus Henderson U.S. Managed Volatility Fund, the Trustees noted that, although the Fund’s total expenses exceeded the peer group average for one share class, overall the Fund’s total expenses were reasonable. The Trustees also noted that Janus Capital has contractually agreed to limit the Fund’s expenses, although this limit did not apply because the Fund’s total expenses were already below the applicable fee limit.
U.S. Equity Funds
· For Janus Henderson Large Cap Value Fund, the Trustees noted that the Fund’s total expenses were below the peer group average for all share classes.
· For Janus Henderson Mid Cap Value Fund, the Trustees noted that the Fund’s total expenses were below the peer group average for all share classes.
· For Janus Henderson Select Value Fund, the Trustees noted that the Fund’s total expenses were below the peer group averages for all share classes.
· For Janus Henderson Small Cap Value Fund, the Trustees noted that, although the Fund’s total expenses exceeded the peer group average for certain share classes, overall the Fund’s total expenses were reasonable. The Trustees also noted that Janus Capital has contractually agreed to limit the Fund’s expenses, although this limit did not apply because the Fund’s total expenses were already below the applicable fee limit.
Janus Aspen Series
· For Janus Henderson Balanced Portfolio, the Trustees noted that, although the Fund’s total expenses exceeded the peer group average for one share class, overall the Fund’s total expenses were reasonable.
· For Janus Henderson Enterprise Portfolio, the Trustees noted that, although the Fund’s total expenses exceeded the peer group average for one share class, overall the Fund’s total expenses were reasonable.
· For Janus Henderson Flexible Bond Portfolio, the Trustees noted that, although the Fund’s total expenses exceeded the peer group average for one share class, overall the Fund’s total expenses were reasonable. The Trustees also noted that Janus Capital has contractually agreed to limit the Fund’s expenses, although this limit did not apply because the Fund’s total expenses were already below the applicable fee limit.
· For Janus Henderson Forty Portfolio, the Trustees noted that, although the Fund’s total expenses exceeded the peer group average for one share class, overall the Fund’s total expenses were reasonable.
· For Janus Henderson Global Allocation Portfolio - Moderate, the Trustees noted that, although the Fund’s total expenses exceeded the peer group average for one share class, overall the Fund’s total expenses were reasonable. The Trustees also noted that Janus Capital has contractually agreed to limit the Fund’s expenses.
· For Janus Henderson Global Research Portfolio, the Trustees noted that the Fund’s total expenses were below the peer group average for both share classes.
· For Janus Henderson Global Technology Portfolio, the Trustees noted that the Fund’s total expenses were below the peer group average for both share classes.
· For Janus Henderson Global Unconstrained Bond Portfolio, the Trustees noted that, although the Fund’s total expenses exceeded the peer group average for one share class, overall the Fund’s total expenses were reasonable. The Trustees also noted that Janus Capital has contractually agreed to limit the Fund’s expenses.
62 | SEPTEMBER 30, 2018 |
Janus Henderson Balanced Fund
Additional Information (unaudited)
· For Janus Henderson Mid Cap Value Portfolio, the Trustees noted that the Fund’s total expenses were below the peer group average for both share classes.
· For Janus Henderson Overseas Portfolio, the Trustees noted that the Fund’s total expenses were below the peer group average for both share classes.
· For Janus Henderson Research Portfolio, the Trustees noted that the Fund’s total expenses were below the peer group average for both share classes.
· For Janus Henderson U.S. Low Volatility Portfolio, the Trustees noted that the Fund’s total expenses were below the peer group average for its sole share class.
The Trustees reviewed information on the overall profitability to Janus Capital and its affiliates of their relationship with the Funds, and considered profitability data of other fund managers. The Trustees also considered the financial information, estimated profitability and corporate structure of Janus Capital’s parent company before and after the Transaction. The Trustees recognized that profitability comparisons among fund managers are difficult because of the variation in the type of comparative information that is publicly available, and the profitability of any fund manager is affected by numerous factors, including the organizational structure of the particular fund manager, the types of funds and other accounts it manages, possible other lines of business, the methodology for allocating expenses, and the fund manager’s capital structure and cost of capital. The Trustees also noted that the Trustees’ independent fee consultant reviewed the overall profitability of Janus Capital’s parent company prior to the Transaction, and the independent fee consultant found that, while assessing the reasonableness of Fund expenses in light of such profits was dependent on comparisons with other publicly-traded mutual fund advisers, and that these comparisons were limited in accuracy by differences in complex size, business mix, institutional account orientation and other factors, after accepting these limitations, the level of profit earned by Janus Capital’s parent company was reasonable. In this regard, the independent consultant concluded that the profitability of Janus Capital’s parent company did not show excess nor did it show any insufficiency that could limit the ability to invest the resources needed to drive strong future investment performance on behalf of the Funds.
Additionally, the Trustees considered the estimated profitability to Janus Capital from the investment management services it provided to each Fund. The Trustees also considered such estimated profitability taking into account the impact of the Transaction on Janus Capital’s expense structure on a pro forma basis. In their review, the Trustees considered whether Janus Capital and each subadviser receive adequate incentives and resources to manage the Funds effectively. In reviewing profitability, the Trustees noted that the estimated profitability for an individual Fund is necessarily a product of the allocation methodology utilized by Janus Capital to allocate its expenses as part of the estimated profitability calculation. In this regard, the Trustees noted that the independent fee consultant concluded that (1) the expense allocation methodology utilized by Janus Capital was reasonable and (2) the estimated profitability to Janus Capital from the investment management services it provided to each Fund was reasonable, including after taking into account the impact of the Transaction on Janus Capital’s expense structure on a pro forma basis. The Trustees also considered that the estimated profitability for an individual Fund was influenced by a number of factors, including not only the allocation methodology selected, but also the presence of fee waivers and expense caps, and whether the Fund’s investment management agreement contained breakpoints or a performance fee component. The Trustees determined, after taking into account these factors, among others, that Janus Capital’s estimated profitability with respect to each Fund was not unreasonable in relation to the services provided, and that the variation in the range of such estimated profitability among the Funds was not a material factor in the Board’s approval of the reasonableness of any Fund’s investment management fees.
The Trustees concluded that the management fees payable by each Fund to Janus Capital and its affiliates, as well as the fees paid by Janus Capital to the subadvisers of subadvised Funds, were reasonable in relation to the nature, extent, and quality of the services provided, taking into account the fees charged by other advisers for managing comparable mutual funds with similar strategies, the fees Janus Capital and the subadvisers charge to other clients, and, as applicable, the impact of fund performance on management fees payable by the Funds. The Trustees also concluded that each Fund’s total expenses were reasonable, taking into account the size of the Fund, the quality of services provided by Janus Capital and any subadviser, the investment performance of the Fund, and any expense limitations agreed to or provided by Janus Capital.
Janus Investment Fund | 63 |
Janus Henderson Balanced Fund
Additional Information (unaudited)
Economies of Scale
The Trustees considered information about the potential for Janus Capital to realize economies of scale as the assets of the Funds increase. They noted their independent fee consultant’s analysis of economies of scale in prior years. They also noted that, although many Funds pay advisory fees at a base fixed rate as a percentage of net assets, without any breakpoints or performance fees, their independent fee consultant concluded that 86% of these Funds’ share classes have contractual management fees (gross of waivers) below their Broadridge expense group averages. They also noted that for those Funds whose expenses are being reduced by the contractual expense limitations of Janus Capital, Janus Capital is subsidizing certain of these Funds because they have not reached adequate scale. Moreover, as the assets of some of the Funds have declined in the past few years, certain Funds have benefited from having advisory fee rates that have remained constant rather than increasing as assets declined. In addition, performance fee structures have been implemented for various Funds that have caused the effective rate of advisory fees payable by such a Fund to vary depending on the investment performance of the Fund relative to its benchmark index over the measurement period; and a few Funds have fee schedules with breakpoints and reduced fee rates above certain asset levels. The Trustees also noted that the Funds share directly in economies of scale through the lower charges of third-party service providers that are based in part on the combined scale of all of the Funds. Based on all of the information they reviewed, including past research and analysis conducted by the Trustees’ independent fee consultant, the Trustees concluded that the current fee structure of each Fund was reasonable and that the current rates of fees do reflect a sharing between Janus Capital and the Fund of any economies of scale that may be present at the current asset level of the Fund.
The independent fee consultant concluded that, given the limitations of various analytical approaches to economies of scale it had considered in prior years, and their conflicting results, it is difficult to analytically confirm or deny the existence of economies of scale in the Janus complex. The independent consultant concluded that (1) to the extent there were economies of scale at Janus Capital, Janus Capital’s general strategy of setting fixed management fees below peers appeared to share any such economies with investors even on smaller Funds which have not yet achieved those economies and (2) by setting lower fixed fees from the start on these Funds, Janus Capital appeared to be investing to increase the likelihood that these Funds will grow to a level to achieve any scale economies that may exist. Further, the independent fee consultant provided its belief that Fund investors are well-served by the fee levels and performance fee structures in place on the Funds in light of any economies of scale that may be present at Janus Capital.
Other Benefits to Janus Capital
The Trustees also considered benefits that accrue to Janus Capital and its affiliates and subadvisers to the Funds from their relationships with the Funds. They recognized that two affiliates of Janus Capital separately serve the Funds as transfer agent and distributor, respectively, and the transfer agent receives compensation directly from the non-money market funds for services provided. The Trustees also considered Janus Capital’s past and proposed use of commissions paid by the Funds on portfolio brokerage transactions to obtain proprietary and third-party research products and services benefiting the Fund and/or other clients of Janus Capital and/or Janus Capital, and/or a subadviser to a Fund. The Trustees concluded that Janus Capital’s and the subadvisers’ use of these types of client commission arrangements to obtain proprietary and third-party research products and services was consistent with regulatory requirements and guidelines and was likely to benefit each Fund. The Trustees also concluded that, other than the services provided by Janus Capital and its affiliates and subadvisers pursuant to the agreements and the fees to be paid by each Fund therefor, the Funds and Janus Capital and the subadvisers may potentially benefit from their relationship with each other in other ways. They concluded that Janus Capital and/or the subadvisers benefits from the receipt of research products and services acquired through commissions paid on portfolio transactions of the Funds and that the Funds benefit from Janus Capital’s and/or the subadvisers’ receipt of those products and services as well as research products and services acquired through commissions paid by other clients of Janus Capital and/or other clients of the subadvisers. They further concluded that the success of any Fund could attract other business to Janus Capital, the subadvisers or other Janus funds, and that the success of Janus Capital and the subadvisers could enhance Janus Capital’s and the subadvisers’ ability to serve the Funds.
64 | SEPTEMBER 30, 2018 |
Janus Henderson Balanced Fund
Useful Information About Your Fund Report (unaudited)
The Management Commentary in this report includes valuable insight as well as statistical information to help you understand how your Fund’s performance and characteristics stack up against those of comparable indices.
If the Fund invests in foreign securities, this report may include information about country exposure. Country exposure is based primarily on the country of risk. A company may be allocated to a country based on other factors such as location of the company’s principal office, the location of the principal trading market for the company’s securities, or the country where a majority of the company’s revenues are derived.
Please keep in mind that the opinions expressed in the Management Commentary are just that: opinions. They are a reflection based on best judgment at the time this report was compiled, which was September 30, 2018. As the investing environment changes, so could opinions. These views are unique and are not necessarily shared by fellow employees or by Janus Henderson in general.
Performance Overviews
Performance overview graphs compare the performance of a hypothetical $10,000 investment in the Fund with one or more widely used market indices. When comparing the performance of the Fund with an index, keep in mind that market indices are not available for investment and do not reflect deduction of expenses.
Average annual total returns are quoted for a Fund with more than one year of performance history. Average annual total return is calculated by taking the growth or decline in value of an investment over a period of time, including reinvestment of dividends and distributions, then calculating the annual compounded percentage rate that would have produced the same result had the rate of growth been constant throughout the period. Average annual total return does not reflect the deduction of taxes that a shareholder would pay on Fund distributions or redemptions of Fund shares.
Cumulative total returns are quoted for a Fund with less than one year of performance history. Cumulative total return is the growth or decline in value of an investment over time, independent of the period of time involved. Cumulative total return does not reflect the deduction of taxes that a shareholder would pay on Fund distributions or redemptions of Fund shares.
Pursuant to federal securities rules, expense ratios shown in the performance chart reflect subsidized (if applicable) and unsubsidized ratios. The total annual fund operating expenses ratio is gross of any fee waivers, reflecting the Fund’s unsubsidized expense ratio. The net annual fund operating expenses ratio (if applicable) includes contractual waivers of Janus Capital and reflects the Fund’s subsidized expense ratio. Ratios may be higher or lower than those shown in the “Financial Highlights” in this report.
Schedule of Investments
Following the performance overview section is the Fund’s Schedule of Investments. This schedule reports the types of securities held in the Fund on the last day of the reporting period. Securities are usually listed by type (common stock, corporate bonds, U.S. Government obligations, etc.) and by industry classification (banking, communications, insurance, etc.). Holdings are subject to change without notice.
The value of each security is quoted as of the last day of the reporting period. The value of securities denominated in foreign currencies is converted into U.S. dollars.
If the Fund invests in foreign securities, it will also provide a summary of investments by country. This summary reports the Fund exposure to different countries by providing the percentage of securities invested in each country. The country of each security represents the country of risk. The Fund’s Schedule of Investments relies upon the industry group and country classifications published by Barclays and/or MSCI Inc.
Tables listing details of individual forward currency contracts, futures, written options, swaptions, and swaps follow the Fund’s Schedule of Investments (if applicable).
Statement of Assets and Liabilities
This statement is often referred to as the “balance sheet.” It lists the assets and liabilities of the Fund on the last day of the reporting period.
Janus Investment Fund | 65 |
Janus Henderson Balanced Fund
Useful Information About Your Fund Report (unaudited)
The Fund’s assets are calculated by adding the value of the securities owned, the receivable for securities sold but not yet settled, the receivable for dividends declared but not yet received on securities owned, and the receivable for Fund shares sold to investors but not yet settled. The Fund’s liabilities include payables for securities purchased but not yet settled, Fund shares redeemed but not yet paid, and expenses owed but not yet paid. Additionally, there may be other assets and liabilities such as unrealized gain or loss on forward currency contracts.
The section entitled “Net Assets Consist of” breaks down the components of the Fund’s net assets. Because the Fund must distribute substantially all earnings, you will notice that a significant portion of net assets is shareholder capital.
The last section of this statement reports the net asset value (“NAV”) per share on the last day of the reporting period. The NAV is calculated by dividing the Fund’s net assets for each share class (assets minus liabilities) by the number of shares outstanding.
Statement of Operations
This statement details the Fund’s income, expenses, realized gains and losses on securities and currency transactions, and changes in unrealized appreciation or depreciation of Fund holdings.
The first section in this statement, entitled “Investment Income,” reports the dividends earned from securities and interest earned from interest-bearing securities in the Fund.
The next section reports the expenses incurred by the Fund, including the advisory fee paid to the investment adviser, transfer agent fees and expenses, and printing and postage for mailing statements, financial reports and prospectuses. Expense offsets and expense reimbursements, if any, are also shown.
The last section lists the amounts of realized gains or losses from investment and foreign currency transactions, and changes in unrealized appreciation or depreciation of investments and foreign currency-denominated assets and liabilities. The Fund will realize a gain (or loss) when it sells its position in a particular security. A change in unrealized gain (or loss) refers to the change in net appreciation or depreciation of the Fund during the reporting period. “Net Realized and Unrealized Gain/(Loss) on Investments” is affected both by changes in the market value of Fund holdings and by gains (or losses) realized during the reporting period.
Statements of Changes in Net Assets
These statements report the increase or decrease in the Fund’s net assets during the reporting period. Changes in the Fund’s net assets are attributable to investment operations, dividends and distributions to investors, and capital share transactions. This is important to investors because it shows exactly what caused the Fund’s net asset size to change during the period.
The first section summarizes the information from the Statement of Operations regarding changes in net assets due to the Fund’s investment operations. The Fund’s net assets may also change as a result of dividend and capital gains distributions to investors. If investors receive their dividends and/or distributions in cash, money is taken out of the Fund to pay the dividend and/or distribution. If investors reinvest their dividends and/or distributions, the Fund’s net assets will not be affected. If you compare the Fund’s “Net Decrease from Dividends and Distributions” to “Reinvested Dividends and Distributions,” you will notice that dividends and distributions have little effect on the Fund’s net assets. This is because the majority of the Fund’s investors reinvest their dividends and/or distributions.
The reinvestment of dividends and distributions is included under “Capital Share Transactions.” “Capital Shares” refers to the money investors contribute to the Fund through purchases or withdrawals via redemptions. The Fund’s net assets will increase and decrease in value as investors purchase and redeem shares from the Fund.
Financial Highlights
This schedule provides a per-share breakdown of the components that affect the Fund’s NAV for current and past reporting periods as well as total return, asset size, ratios, and portfolio turnover rate.
The first line in the table reflects the NAV per share at the beginning of the reporting period. The next line reports the net investment income/(loss) per share. Following is the per share total of net gains/(losses), realized and unrealized. Per share dividends and distributions to investors are then subtracted to arrive at the NAV per share at the end of the period. The next line reflects the total return for the period. Also included are ratios of expenses and net investment income to average net assets.
66 | SEPTEMBER 30, 2018 |
Janus Henderson Balanced Fund
Useful Information About Your Fund Report (unaudited)
The Fund’s expenses may be reduced through expense offsets and expense reimbursements. The ratios shown reflect expenses before and after any such offsets and reimbursements.
The ratio of net investment income/(loss) summarizes the income earned less expenses, divided by the average net assets of the Fund during the reporting period. Do not confuse this ratio with the Fund’s yield. The net investment income ratio is not a true measure of the Fund’s yield because it does not take into account the dividends distributed to the Fund’s investors.
The next figure is the portfolio turnover rate, which measures the buying and selling activity in the Fund. Portfolio turnover is affected by market conditions, changes in the asset size of the Fund, fluctuating volume of shareholder purchase and redemption orders, the nature of the Fund’s investments, and the investment style and/or outlook of the portfolio manager(s) and/or investment personnel. A 100% rate implies that an amount equal to the value of the entire portfolio was replaced once during the fiscal year; a 50% rate means that an amount equal to the value of half the portfolio is traded in a year; and a 200% rate means that an amount equal to the value of the entire portfolio is traded every six months.
Janus Investment Fund | 67 |
Janus Henderson Balanced Fund
Designation Requirements (unaudited)
For federal income tax purposes, the Fund designated the following for the year ended September 30, 2018:
| |
Capital Gain Distributions | $487,094,483 |
Dividends Received Deduction Percentage | 100% |
Qualified Dividend Income Percentage | 100% |
68 | SEPTEMBER 30, 2018 |
Janus Henderson Balanced Fund
Trustees and Officers (unaudited)
The Fund’s Statement of Additional Information includes additional information about the Trustees and officers and is available, without charge, by calling 1-877-335-2687.
The following are the Trustees and officers of the Trust, together with a brief description of their principal occupations during the last five years (principal occupations for certain Trustees may include periods over five years).
Each Trustee has served in that capacity since he or she was originally elected or appointed. The Trustees do not serve a specified term of office. Each Trustee will hold office until the termination of the Trust or his or her earlier death, resignation, retirement, incapacity, or removal. Under the Fund’s Governance Procedures and Guidelines, the policy is for Trustees to retire no later than the end of the calendar year in which the Trustee turns 75. The Trustees review the Fund’s Governance Procedures and Guidelines from time to time and may make changes they deem appropriate. The Fund’s Nominating and Governance Committee will consider nominees for the position of Trustee recommended by shareholders. Shareholders may submit the name of a candidate for consideration by the Committee by submitting their recommendations to the Trust’s Secretary. Each Trustee is currently a Trustee of one other registered investment company advised by Janus Capital: Janus Aspen Series. Collectively, these two registered investment companies consist of 60 series or funds.
The Trust’s officers are elected annually by the Trustees for a one-year term. Certain officers also serve as officers of Janus Aspen Series. Certain officers of the Fund may also be officers and/or directors of Janus Capital. Except as otherwise disclosed, Fund officers receive no compensation from the Fund, except for the Fund’s Chief Compliance Officer, as authorized by the Trustees.
Janus Investment Fund | 69 |
Janus Henderson Balanced Fund
Trustees and Officers (unaudited)
TRUSTEES | ||||||
Name, Address, and Age | Positions Held with the Trust | Length of Time Served | Principal Occupations During the Past Five Years | Number of Portfolios/Funds in Fund Complex Overseen by Trustee | Other Directorships Held by Trustee During the Past Five Years | |
Independent Trustees | ||||||
William
F. McCalpin | Chairman | 1/08-Present | Managing Partner, Impact Investments, Athena Capital Advisors LLC (independent registered investment advisor) (since 2016) and Managing Director, Holos Consulting LLC (provides consulting services to foundations and other nonprofit organizations). Formerly, Chief Executive Officer, Imprint Capital (impact investment firm) (2013-2015) and Executive Vice President and Chief Operating Officer of The Rockefeller Brothers Fund (a private family foundation) (1998-2006). | 60 | Director of Mutual Fund Directors Forum (a non-profit organization serving independent directors of U.S. mutual funds), Chairman of the Board and Trustee of The Investment Fund for Foundations Investment Program (TIP) (consisting of 2 funds), and Director of the F.B. Heron Foundation (a private grantmaking foundation). | |
70 | SEPTEMBER 30, 2018 |
Janus Henderson Balanced Fund
Trustees and Officers (unaudited)
TRUSTEES | ||||||
Name, Address, and Age | Positions Held with the Trust | Length of Time Served | Principal Occupations During the Past Five Years | Number of Portfolios/Funds in Fund Complex Overseen by Trustee | Other Directorships Held by Trustee During the Past Five Years | |
Independent Trustees | ||||||
Alan
A. Brown | Trustee | 1/13-Present | Executive Vice President, Institutional Markets, of Black Creek Group (private equity real estate investment management firm) (since 2012). Formerly, Executive Vice President and Co-Head, Global Private Client Group (2007-2010), Executive Vice President, Mutual Funds (2005-2007), and Chief Marketing Officer (2001-2005) of Nuveen Investments, Inc. (asset management). | 60 | Director of WTTW (PBS affiliate) (since 2003). Formerly, Director of MotiveQuest LLC (strategic social market research company) (2003-2016); Director of Nuveen Global Investors LLC (2007-2011); Director of Communities in Schools (2004-2010); and Director of Mutual Fund Education Alliance (until 2010). | |
Janus Investment Fund | 71 |
Janus Henderson Balanced Fund
Trustees and Officers (unaudited)
TRUSTEES | ||||||
Name, Address, and Age | Positions Held with the Trust | Length of Time Served | Principal Occupations During the Past Five Years | Number of Portfolios/Funds in Fund Complex Overseen by Trustee | Other Directorships Held by Trustee During the Past Five Years | |
Independent Trustees | ||||||
William
D. Cvengros | Trustee | 1/11-Present | Managing Member and Chief Executive Officer of SJC Capital, LLC (a personal investment company and consulting firm) (since 2002). Formerly, Venture Partner for The Edgewater Funds (a middle market private equity firm) (2002-2004); Chief Executive Officer and President of PIMCO Advisors Holdings L.P. (a publicly traded investment management firm) (1994-2000); and Chief Investment Officer of Pacific Life Insurance Company (a mutual life insurance and annuity company) (1987-1994). | 60 | Advisory Board Member, Innovate Partners Emerging Growth and Equity Fund I (early stage venture capital fund) (since 2014) and Managing Trustee of National Retirement Partners Liquidating Trust (since 2013). Formerly, Chairman, National Retirement Partners, Inc. (formerly a network of advisors to 401(k) plans) (2005-2013); Director of Prospect Acquisition Corp. (a special purpose acquisition corporation) (2007-2009); Director of RemedyTemp, Inc. (temporary help services company) (1996-2006); and Trustee of PIMCO Funds Multi-Manager Series (1990-2000) and Pacific Life Variable Life & Annuity Trusts (1987-1994). | |
72 | SEPTEMBER 30, 2018 |
Janus Henderson Balanced Fund
Trustees and Officers (unaudited)
TRUSTEES | ||||||
Name, Address, and Age | Positions Held with the Trust | Length of Time Served | Principal Occupations During the Past Five Years | Number of Portfolios/Funds in Fund Complex Overseen by Trustee | Other Directorships Held by Trustee During the Past Five Years | |
Independent Trustees | ||||||
Raudline
Etienne | Trustee | 6/16-Present | Founder, Daraja Capital (advisory and investment firm) (since 2016), and Senior Advisor, Albright Stonebridge Group LLC (global strategy firm) (since 2016). Formerly, Senior Vice President (2011-2015), Albright Stonebridge Group LLC; and Deputy Comptroller and Chief Investment Officer, New York State Common Retirement Fund (public pension fund) (2008-2011). | 60 | Director of Brightwood Capital Advisors, LLC (since 2014). | |
Janus Investment Fund | 73 |
Janus Henderson Balanced Fund
Trustees and Officers (unaudited)
TRUSTEES | ||||||
Name, Address, and Age | Positions Held with the Trust | Length of Time Served | Principal Occupations During the Past Five Years | Number of Portfolios/Funds in Fund Complex Overseen by Trustee | Other Directorships Held by Trustee During the Past Five Years | |
Independent Trustees | ||||||
Gary
A. Poliner | Trustee | 6/16-Present | Retired. Formerly, President (2010-2013) of Northwestern Mutual Life Insurance Company. | 60 | Director of MGIC Investment Corporation (private mortgage insurance) (since 2013) and West Bend Mutual Insurance Company (property/casualty insurance) (since 2013). Formerly, Trustee of Northwestern Mutual Life Insurance Company (2010-2013); and Director of Frank Russell Company (global asset management firm) (2008-2013). | |
74 | SEPTEMBER 30, 2018 |
Janus Henderson Balanced Fund
Trustees and Officers (unaudited)
TRUSTEES | ||||||
Name, Address, and Age | Positions Held with the Trust | Length of Time Served | Principal Occupations During the Past Five Years | Number of Portfolios/Funds in Fund Complex Overseen by Trustee | Other Directorships Held by Trustee During the Past Five Years | |
Independent Trustees | ||||||
James
T. Rothe | Trustee | 1/97-Present | Professor Emeritus of Business of the University of Colorado, Colorado Springs, CO (since 2004). Formerly, Co-founder and Managing Director of Roaring Fork Capital SBIC, L.P. (SBA SBIC fund focusing on private investment in public equity firms) (2004-2014), Professor of Business of the University of Colorado (2002-2004), and Distinguished Visiting Professor of Business (2001-2002) of Thunderbird (American Graduate School of International Management), Glendale, AZ. | 60 | Formerly, Director of Red Robin Gourmet Burgers, Inc. (RRGB) (2004-2014). | |
Janus Investment Fund | 75 |
Janus Henderson Balanced Fund
Trustees and Officers (unaudited)
TRUSTEES | ||||||
Name, Address, and Age | Positions Held with the Trust | Length of Time Served | Principal Occupations During the Past Five Years | Number of Portfolios/Funds in Fund Complex Overseen by Trustee | Other Directorships Held by Trustee During the Past Five Years | |
Independent Trustees | ||||||
William
D. Stewart | Trustee | 6/84-Present | Retired. Formerly, President and founder of HPS Products and Corporate Vice President of MKS Instruments, Boulder, CO (a provider of advanced process control systems for the semiconductor industry) (1976-2012). | 60 | None | |
Diane
L. Wallace | Trustee | 6/17-Present | Retired. | 60 | Formerly, Independent Trustee, Henderson Global Funds (13 portfolios) (2015-2017); Independent Trustee, State Farm Associates' Funds Trust, State Farm Mutual Fund Trust, and State Farm Variable Product Trust (28 portfolios) (2013-2017); Chief Operating Officer, Senior Vice President-Operations, and Chief Financial Officer for Driehaus Capital Management, LLC (1988-2006); and Treasurer for Driehaus Mutual Funds (1996-2002). | |
76 | SEPTEMBER 30, 2018 |
Janus Henderson Balanced Fund
Trustees and Officers (unaudited)
TRUSTEES | ||||||
Name, Address, and Age | Positions Held with the Trust | Length of Time Served | Principal Occupations During the Past Five Years | Number of Portfolios/Funds in Fund Complex Overseen by Trustee | Other Directorships Held by Trustee During the Past Five Years | |
Independent Trustees | ||||||
Linda
S. Wolf | Trustee | 11/05-Present | Retired. Formerly, Chairman and Chief Executive Officer of Leo Burnett (Worldwide) (advertising agency) (2001-2005). | 60 | Director of Chicago Community Trust (Regional Community Foundation), Chicago Council on Global Affairs, InnerWorkings (U.S. provider of print procurement solutions to corporate clients), Lurie Children’s Hospital (Chicago, IL), Shirley Ryan Ability Lab and Wrapports, LLC (digital communications company). Formerly, Director of Walmart (until 2017), Director of Chicago Convention & Tourism Bureau (until 2014) and The Field Museum of Natural History (Chicago, IL) (until 2014). | |
Janus Investment Fund | 77 |
Janus Henderson Balanced Fund
Trustees and Officers (unaudited)
OFFICERS | |||
Name, Address, and Age | Positions Held with the Trust | Term of Office* and Length of Time Served | Principal Occupations During the Past Five Years |
Jeremiah
Buckley | Executive Vice President and
Co-Portfolio Manager | 12/15-Present | Portfolio Manager for other Janus Henderson accounts. |
Marc
Pinto | Executive Vice President and
Co-Portfolio Manager | 5/05-Present | Portfolio Manager for other Janus Henderson accounts. |
Mayur
Saigal | Executive Vice President and
Co-Portfolio Manager | 12/15-Present | Portfolio Manager for other Janus Henderson accounts. |
Darrell
Watters | Executive Vice President and
Co-Portfolio Manager | 12/15-Present | Head of U.S. Fundamental Fixed Income of Janus Henderson Investors and Portfolio Manager for other Janus Henderson accounts. |
78 | SEPTEMBER 30, 2018 |
Janus Henderson Balanced Fund
Trustees and Officers (unaudited)
OFFICERS | |||
Name, Address, and Age | Positions Held with the Trust | Term of Office* and Length of Time Served | Principal Occupations During the Past Five Years |
Bruce
L. Koepfgen | President and Chief Executive Officer | 7/14-Present | Head of North America at Janus Henderson Investors and Janus Capital Management LLC (since 2017); Executive Vice President and Director of Janus International Holding LLC (since 2011); Executive Vice President of Janus Distributors LLC (since 2011); Vice President and Director of Intech Investment Management LLC (since 2011); Executive Vice President and Director of Perkins Investment Management LLC (since 2011); and Executive Vice President and Director of Janus Management Holdings Corporation (since 2011). Formerly, President of Janus Capital Group Inc. and Janus Capital Management LLC (2013-2017); Executive Vice President of Janus Services LLC (2011-2015), Janus Capital Group Inc. and Janus Capital Management LLC (2011-2013); and Chief Financial Officer of Janus Capital Group Inc., Janus Capital Management LLC, Janus Distributors LLC, Janus Management Holdings Corporation, and Janus Services LLC (2011-2013). |
Susan
K. Wold | Vice President, Chief Compliance Officer, and Anti-Money Laundering Officer | 9/17-Present | Senior Vice President and Head of Compliance, North America for Janus Henderson (since September 2017); Formerly, Vice President, Head of Global Corporate Compliance, and Chief Compliance Officer for Janus Capital Management LLC (May 2017-September 2017); and Vice President, Compliance at Janus Capital Group Inc. and Janus Capital Management LLC (2005-2017). |
Jesper
Nergaard | Chief Financial Officer | 3/05-Present | Vice President of Janus Capital and Janus Services LLC. |
Janus Investment Fund | 79 |
Janus Henderson Balanced Fund
Trustees and Officers (unaudited)
OFFICERS | |||
Name, Address, and Age | Positions Held with the Trust | Term of Office* and Length of Time Served | Principal Occupations During the Past Five Years |
Kathryn
L. Santoro | Vice President, Chief Legal Counsel, and Secretary | 12/16-Present | Vice President of Janus Capital and Janus Services LLC (since 2016). Formerly, Vice President and Associate Counsel of Curian Capital, LLC and Curian Clearing LLC (2013-2016); and General Counsel and Secretary (2011-2012) and Vice President (2009-2012) of Old Mutual Capital, Inc. |
* Officers are elected at least annually by the Trustees for a one-year term and may also be elected from time to time by the Trustees for an interim period. | |||
80 | SEPTEMBER 30, 2018 |
Janus Henderson Balanced Fund
Notes
NotesPage1
Janus Investment Fund | 81 |
Janus Henderson Balanced Fund
Notes
NotesPage2
82 | SEPTEMBER 30, 2018 |
Knowledge. Shared
At Janus Henderson, we believe in the sharing of expert insight for better investment and business decisions. We call this ethos Knowledge. Shared.
Learn more by visiting janushenderson.com.
| ||||||||
This report is submitted for the general information of shareholders of the Fund. It is not an offer or solicitation for the Fund and is not authorized for distribution to prospective investors unless preceded or accompanied by an effective prospectus. | ||||||||
Janus Henderson, Janus, Henderson, Perkins, Intech and Knowledge. Shared are trademarks of Janus Henderson Group plc or one of its subsidiary entities. © Janus Henderson Group plc. Funds distributed by Janus Henderson Distributors | ||||||||
125-02-93037 11-18 | ||||||||

ANNUAL REPORT September 30, 2018 | |||
Janus Henderson Contrarian Fund | |||
Janus Investment Fund | |||
| |||
HIGHLIGHTS · Portfolio management perspective · Investment strategy behind your fund · Fund performance, characteristics | |||
|

Table of Contents
Janus Henderson Contrarian Fund
Janus Henderson Contrarian Fund (unaudited)

PERFORMANCE
The Janus Henderson Contrarian Fund’s Class I Shares returned 17.35% over the one-year period ended September 30, 2018. The Fund’s benchmark, the S&P 500® Index, returned 17.91%.
INVESTMENT ENVIRONMENT
U.S. large-cap stocks enjoyed sharp gains during the 12-month period, as an improving U.S. economy and renewed corporate earnings strength drove stocks higher. The anticipated benefits of lower tax rates and deregulation also helped boost U.S. stocks. The consumer discretionary and information technology sectors experienced the largest gains within the S&P 500 Index.
PERFORMANCE DISCUSSION
The Fund underperformed its benchmark, the S&P 500 Index, for the period. As part of our contrarian investment approach, we seek stocks that trade at a significant discount to our estimate of fair value, whose intrinsic value we believe will grow over time, and whose management teams are aligned with shareholders. For most stocks in our portfolio, we believe the market misunderstands the business model, undervalues the company’s assets, or underappreciates the company’s long-term growth potential. We believe a concentrated, high-conviction portfolio of such companies can drive outperformance over time as the intrinsic value of these businesses gains greater appreciation by the market. This period, we were pleased to see many holdings begin to show confirmation of their true earnings potential. However, we also held a few stocks that produced disappointing results and detracted from our performance. Some of those positions were sold as part of the portfolio manager transition.
General Electric was our largest detractor. The stock was down after the company announced it would take a $6.2 billion write-off after reviewing its insurance portfolio, which is a part of the company’s finance arm, GE Capital. While the news was disappointing, we see upside for the stock. GE holds dominant share in most markets it serves and much of its revenue from those markets is derived from aftermarket parts or services, creating recurring revenue for the business. In our view, the leadership position and stability of its businesses are not reflected in the stock’s current valuation.
Summit Materials also detracted from Fund performance this period. Disappointing earnings affected the stock in the third quarter. Heightened price competition in its cement business was a headwind to revenues during the third quarter as well, but we continue to like the stock. We believe Summit operates in a favorable industry structure, in which a limited number of competitors in any single market give it a high degree of pricing power. We also think the company will continue to benefit from U.S. construction demand.
Envision Healthcare was another large detractor. The company provides physician outsourcing services to hospitals and health systems and also owns ambulatory surgery centers. Managed care companies have pressured consumers to limit utilization of hospital services, and that has hurt volumes for Envision. We sold the stock due to volume concerns and what we viewed as executional missteps from the management team.
While a few stocks were large detractors from our results, we were pleased by the results of many other companies in our portfolio. Ultimate Software was our largest contributor. Delays in implementing a few large customers onto its payroll and HR systems weighed on the stock during the previous year. The stock has re-rated as the implementation issues get further in the rearview mirror and the market has received more confirmation of robust demand for its cloud-based payroll solutions. We continue to see upside for the stock and believe growth for Ultimate Software is underappreciated, as its cloud-based subscription software for payroll and HR departments takes share from legacy, on-premises solutions.
Janus Investment Fund | 1 |
Janus Henderson Contrarian Fund (unaudited)
Axon Enterprise was another large contributor. The company makes Taser brand weapons and body cameras for polices officers. We think societal trends favoring the use of nonlethal weapons and police activity surveillance favor the company. The stock had been out of favor because near-term profitability had disappointed, but the company has brought in a new CFO who has since focused the company on growth and profitability, which helped lift the stock this year.
The Trade Desk also added meaningfully to results. The stock was up significantly after its quarterly earnings handily beat market expectations over the last two consecutive quarters. We believe The Trade Desk is still in the early days of growing its business. The programmatic advertising specialist works with large companies and advertising agencies to help them deploy digital advertising spending across channels in a more cost-effective way. We also believe it is one of few companies that can buy and coordinate advertising across channels and measure the return from those investments. Its services should continue to enjoy rapid uptake as advertising spreads across different digital and offline channels.
DERIVATIVES USAGE
Please see the Derivative Instruments section in the “Notes to Financial Statements” for a discussion of derivatives used by the Fund.
OUTLOOK
We remain constructive on the economic backdrop and earnings environment. Deregulation and corporate taxes are spurring business confidence and we believe it should add legs to the economic cycle. Low unemployment is also buttressing consumer confidence and encouraging increased spending.
One market dynamic we are keeping an eye on is a valuation divergence between two different market segments. As of the end of the third quarter, the market has assigned low multiples to companies that are cyclical or whose cost base and/or end markets face pressure from tariffs. Meanwhile, multiples continue to expand for companies tied to strong secular growth trends.
We believe we have balanced exposure to both camps within our portfolio and, at present, we have maintained our traditional weighting to the three types of companies we invest in: those we believe have misunderstood business models, undervalued assets, or underestimated long-term growth potential. At the margin, we added to position sizes of a few cyclical businesses whose revenues are not tied to global trade, but we have not made big changes to the portfolio.
We remain overweight the financial sector, and believe the market still fails to fully appreciate the benefit of deregulation and for some banks to finally leverage excess capital that has built up in a stringent regulatory environment since the financial crisis. We also believe U.S. tax reform and rising rates will benefit the sector.
We also see opportunity for companies within a few industries where we believe consolidation will lead to greater levels of profitability than the market appreciates. We wouldn’t be surprised to see further consolidation in some industries due to increasing business confidence, tax reform that allows companies to access cash overseas, and as disruption within the economy forces companies to make acquisitions to adapt their business models. We look forward to seeing how companies tied to these themes perform in the coming quarters.
Thank you for your investment in the Janus Henderson Contrarian Fund.
2 | SEPTEMBER 30, 2018 |
Janus Henderson Contrarian Fund (unaudited)
Fund At A Glance
September 30, 2018
5 Top Performers - Holdings |
|
|
| 5 Bottom Performers - Holdings |
| |
Contribution | Contribution | |||||
Ultimate Software Group Inc | 2.24% | General Electric Co | -1.15% | |||
Axon Enterprise Inc | 2.04% | Summit Materials Inc | -0.97% | |||
Trade Desk Inc | 2.02% | Envision Healthcare Corp | -0.70% | |||
Abbott Laboratories | 1.71% | Allergan PLC | -0.56% | |||
DexCom Inc | 1.34% | Flex Ltd | -0.46% | |||
5 Top Performers - Sectors* |
|
|
|
|
| |
Fund | Fund Weighting | S&P 500 Index | ||||
Contribution | (Average % of Equity) | Weighting | ||||
Utilities | 1.17% | 2.39% | 2.88% | |||
Consumer Staples | 1.06% | 0.45% | 7.42% | |||
Industrials | 0.86% | 10.31% | 9.98% | |||
Energy | 0.45% | 1.49% | 5.98% | |||
Real Estate | 0.37% | 0.00% | 2.78% | |||
5 Bottom Performers - Sectors* |
|
|
|
|
| |
Fund | Fund Weighting | S&P 500 Index | ||||
Contribution | (Average % of Equity) | Weighting | ||||
Materials | -1.64% | 12.18% | 2.82% | |||
Consumer Discretionary | -0.93% | 11.07% | 12.57% | |||
Financials | -0.88% | 22.33% | 14.47% | |||
Information Technology | -0.61% | 22.13% | 25.07% | |||
Other** | -0.17% | 1.05% | 0.00% | |||
Security contribution to performance is measured by using an algorithm that multiplies the daily performance of each security with the previous day’s ending weight in the portfolio and is gross of advisory fees. Fixed income securities and certain equity securities, such as private placements and some share classes of equity securities, are excluded. | ||||||
* | Based on sector classification according to the Global Industry Classification Standard (“GICS”) codes, which are the exclusive property and a service mark of MSCI Inc. and Standard & Poor’s. | |||||
** | Not a GICS classified sector. | |||||
Janus Investment Fund | 3 |
Janus Henderson Contrarian Fund (unaudited)
Fund At A Glance
September 30, 2018
5 Largest Equity Holdings - (% of Net Assets) | |
Ball Corp | |
Containers & Packaging | 6.1% |
Abbott Laboratories | |
Health Care Equipment & Supplies | 5.5% |
Citigroup Inc | |
Banks | 5.4% |
TD Ameritrade Holding Corp | |
Capital Markets | 4.8% |
Ultimate Software Group Inc | |
Software | 3.8% |
25.6% | |
Asset Allocation - (% of Net Assets) | |||||
Common Stocks | 97.7% | ||||
Investment Companies | 2.3% | ||||
Preferred Stocks | 0.0% | ||||
Other | (0.0)% | ||||
100.0% | |||||
Top Country Allocations - Long Positions - (% of Investment Securities) | |
As of September 30, 2018
| As of September 30, 2017
|
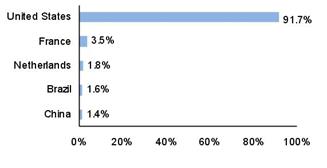
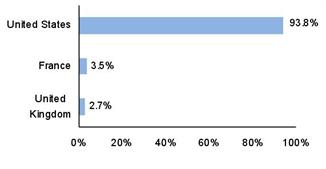
4 | SEPTEMBER 30, 2018 |
Janus Henderson Contrarian Fund (unaudited)
Performance
See important disclosures on the next page. |
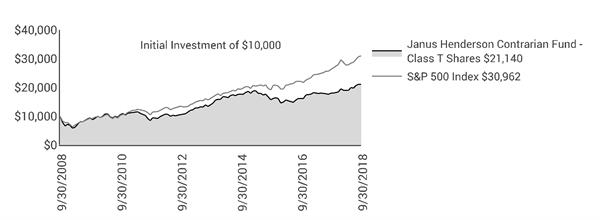
| Expense Ratios - | ||||||||
Average Annual Total Return - for the periods ended September 30, 2018 |
|
| per the January 26, 2018 prospectuses | ||||||
|
| One
| Five
| Ten | Since |
|
| Total
Annual Fund | |
Class A Shares at NAV |
| 17.01% | 8.31% | 7.65% | 7.02% |
|
| 0.82% | |
Class A Shares at MOP |
| 10.30% | 7.03% | 7.02% | 6.68% |
|
|
| |
Class C Shares at NAV | 16.16% | 7.52% | 6.94% | 6.22% |
|
| 1.61% | ||
Class C Shares at CDSC |
| 15.16% | 7.52% | 6.94% | 6.22% |
|
|
| |
Class D Shares(1) |
| 17.26% | 8.53% | 7.85% | 7.20% |
|
| 0.64% | |
Class I Shares |
| 17.35% | 8.61% | 7.77% | 7.16% |
|
| 0.56% | |
Class N Shares |
| 17.37% | 8.44% | 7.77% | 7.16% |
|
| 0.51% | |
Class R Shares |
| 16.32% | 7.86% | 7.27% | 6.56% |
|
| 1.24% | |
Class S Shares |
| 16.71% | 8.14% | 7.52% | 6.83% |
|
| 0.98% | |
Class T Shares |
| 17.11% | 8.44% | 7.77% | 7.16% |
|
| 0.73% | |
S&P 500 Index |
| 17.91% | 13.95% | 11.97% | 6.20% |
|
|
| |
Morningstar Quartile - Class T Shares |
| 32/472 | 287/387 | 301/327 | 112/164 |
|
|
| |
Morningstar Ranking - based on total returns for Mid-Cap Blend Funds |
| 1st | 4th | 4th | 3rd |
|
|
| |
Returns quoted are past performance and do not guarantee future results; current performance may be lower or higher. Investment returns and principal value will vary; there may be a gain or loss when shares are sold. For the most recent month-end performance call 800.668.0434 (or 800.525.3713 if you hold shares directly with Janus Henderson) or visit janushenderson.com/performance (or janushenderson.com/allfunds if you hold shares directly with Janus Henderson).
Maximum Offering Price (MOP) returns include the maximum sales charge of 5.75%. Net Asset Value (NAV) returns exclude this charge, which would have reduced returns.
CDSC returns include a 1% contingent deferred sales charge (CDSC) on Shares redeemed within 12 months of purchase. Net Asset Value (NAV) returns exclude this charge, which would have reduced returns.
This Fund has a performance-based management fee that may adjust up or down based on the Fund’s performance.
Performance may be affected by risks that include those associated with non-diversification, portfolio turnover, short sales, potential conflicts of interest, foreign and emerging markets, initial public offerings (IPOs), high-yield and high-risk securities, undervalued, overlooked and smaller capitalization companies, real estate related securities including Real Estate Investment Trusts (REITs), derivatives, and commodity-linked investments. Each product
Janus Investment Fund | 5 |
Janus Henderson Contrarian Fund (unaudited)
Performance
has different risks. Please see the prospectus for more information about risks, holdings and other details.
Returns include reinvestment of all dividends and distributions and do not reflect the deduction of taxes that a shareholder would pay on Fund distributions or redemptions of Fund shares. The returns do not include adjustments in accordance with generally accepted accounting principles required at the period end for financial reporting purposes.
See Financial Highlights for actual expense ratios during the reporting period.
Class A Shares, Class C Shares, Class R Shares, and Class S Shares commenced operations on July 6, 2009. Performance shown for each class for periods prior to July 6, 2009, reflects the performance of the Fund’s Class J Shares, the initial share class (renamed Class T Shares effective February 16, 2010), calculated using the fees and expenses of each respective class, without the effect of any fee and expense limitations or waivers.
Class D Shares commenced operations on February 16, 2010. Performance shown for periods prior to February 16, 2010, reflects the performance of the Fund’s former Class J Shares, calculated using the fees and expenses in effect during the periods shown, net of any applicable fee and expense limitations or waivers.
Class I Shares commenced operations on July 6, 2009. Performance shown for periods prior to July 6, 2009, reflects the performance of the Fund’s former Class J Shares, calculated using the fees and expenses of Class J Shares, net of any applicable fee and expense limitations or waivers.
Class N Shares commenced operations on August 4, 2017. Performance shown for periods prior to August 4, 2017, reflects the performance of the Fund’s Class T Shares, calculated using the fees and expenses of Class T Shares, net of any applicable fee and expense limitations or waivers.
If each share class of the Fund had been available during periods prior to its commencement, the performance shown may have been different. The performance shown for periods following the Fund’s commencement of each share class reflects the fees and expenses of each respective share class, net of any applicable fee and expense limitations or waivers. Please refer to the Fund’s prospectuses for further details concerning historical performance.
Ranking is for the share class shown only; other classes may have different performance characteristics. When an expense waiver is in effect, it may have a material effect on the total return, and therefore the ranking for the period.
© 2018 Morningstar, Inc. All Rights Reserved.
There is no assurance that the investment process will consistently lead to successful investing.
See Notes to Schedule of Investments and Other Information for index definitions.
Index performance does not reflect the expenses of managing a portfolio as an index is unmanaged and not available for direct investment.
See “Useful Information About Your Fund Report.”
*The Fund’s inception date – February 29, 2000
(1) Closed to certain new investors.
6 | SEPTEMBER 30, 2018 |
Janus Henderson Contrarian Fund (unaudited)
Expense Examples
As a shareholder of the Fund, you incur two types of costs: (1) transaction costs, such as sales charges (loads) on purchase payments (applicable to Class A Shares only); and (2) ongoing costs, including management fees; 12b-1 distribution and shareholder servicing fees; transfer agent fees and expenses payable pursuant to the Transfer Agency Agreement; and other Fund expenses. This example is intended to help you understand your ongoing costs (in dollars) of investing in the Fund and to compare these costs with the ongoing costs of investing in other mutual funds. To do so, compare this 5% hypothetical example with the 5% hypothetical examples that appear in the shareholder reports of the other funds. The example is based upon an investment of $1,000 invested at the beginning of the period and held for the six-months indicated, unless noted otherwise in the table and footnotes below.
Actual Expenses
The information in the table under the heading “Actual” provides information about actual account values and actual expenses. You may use the information in these columns, together with the amount you invested, to estimate the expenses that you paid over the period. Simply divide your account value by $1,000 (for example, an $8,600 account value divided by $1,000 = 8.6), then multiply the result by the number in the appropriate column for your share class under the heading entitled “Expenses Paid During Period” to estimate the expenses you paid on your account during the period.
Hypothetical Example for Comparison Purposes
The information in the table under the heading “Hypothetical (5% return before expenses)” provides information about hypothetical account values and hypothetical expenses based upon the Fund’s actual expense ratio and an assumed rate of return of 5% per year before expenses, which is not the Fund’s actual return. The hypothetical account values and expenses may not be used to estimate the actual ending account balance or expenses you paid for the period. You may use this information to compare the ongoing costs of investing in the Fund and other funds. To do so, compare this 5% hypothetical example with the 5% hypothetical examples that appear in the shareholder reports of the other funds. Additionally, for an analysis of the fees associated with an investment in any share class or other similar funds, please visit www.finra.org/fundanalyzer.
Please note that the expenses shown in the table are meant to highlight your ongoing costs only and do not reflect any transaction costs. These fees are fully described in the Fund’s prospectuses. Therefore, the hypothetical examples are useful in comparing ongoing costs only, and will not help you determine the relative total costs of owning different funds. In addition, if these transaction costs were included, your costs would have been higher.
Actual | Hypothetical | |||||||||
| Beginning | Ending | Expenses |
| Beginning | Ending | Expenses | Net Annualized | ||
Class A Shares | $1,000.00 | $1,108.20 | $4.65 |
| $1,000.00 | $1,020.66 | $4.46 | 0.88% | ||
Class C Shares | $1,000.00 | $1,104.10 | $8.12 |
| $1,000.00 | $1,017.35 | $7.79 | 1.54% | ||
Class D Shares | $1,000.00 | $1,109.10 | $3.49 |
| $1,000.00 | $1,021.76 | $3.35 | 0.66% | ||
Class I Shares | $1,000.00 | $1,109.50 | $3.07 |
| $1,000.00 | $1,022.16 | $2.94 | 0.58% | ||
Class N Shares | $1,000.00 | $1,109.80 | $2.70 |
| $1,000.00 | $1,022.51 | $2.59 | 0.51% | ||
Class R Shares | $1,000.00 | $1,103.70 | $8.33 |
| $1,000.00 | $1,017.15 | $7.99 | 1.58% | ||
Class S Shares | $1,000.00 | $1,105.80 | $5.75 |
| $1,000.00 | $1,019.60 | $5.52 | 1.09% | ||
Class T Shares | $1,000.00 | $1,108.70 | $3.86 |
| $1,000.00 | $1,021.41 | $3.70 | 0.73% | ||
† | Expenses Paid During Period are equal to the Net Annualized Expense Ratio multiplied by the average account value over the period, multiplied by 183/365 (to reflect the one-half year period). Expenses in the examples include the effect of applicable fee waivers and/or expense reimbursements, if any. Had such waivers and/or reimbursements not been in effect, your expenses would have been higher. Please refer to the Notes to Financial Statements or the Fund’s prospectuses for more information regarding waivers and/or reimbursements. | |||||||||
Janus Investment Fund | 7 |
Janus Henderson Contrarian Fund
Schedule of Investments
September 30, 2018
| Value | ||||||
Common Stocks – 97.7% | |||||||
Aerospace & Defense – 4.1% | |||||||
Axon Enterprise Inc* | 395,171 | $27,041,551 | |||||
Harris Corp | 495,622 | 83,864,199 | |||||
110,905,750 | |||||||
Banks – 13.0% | |||||||
Bank of America Corp | 2,275,755 | 67,043,742 | |||||
Citigroup Inc | 2,036,089 | 146,069,025 | |||||
PacWest Bancorp | 1,891,875 | 90,147,844 | |||||
Webster Financial Corp | 829,417 | 48,902,426 | |||||
352,163,037 | |||||||
Biotechnology – 2.0% | |||||||
BioCryst Pharmaceuticals Inc* | 1,424,806 | 10,871,270 | |||||
HLS Therapeutics Inc*,£,§ | 1,935,741 | 20,758,818 | |||||
Insmed Inc* | 1,171,245 | 23,682,574 | |||||
55,312,662 | |||||||
Capital Markets – 7.9% | |||||||
Intercontinental Exchange Inc | 1,134,864 | 84,989,965 | |||||
TD Ameritrade Holding Corp | 2,449,700 | 129,417,651 | |||||
214,407,616 | |||||||
Chemicals – 2.6% | |||||||
Air Products & Chemicals Inc | 418,718 | 69,946,842 | |||||
Construction Materials – 2.4% | |||||||
Summit Materials Inc | 3,645,375 | 66,272,917 | |||||
Containers & Packaging – 6.1% | |||||||
Ball Corp | 3,798,997 | 167,117,878 | |||||
Electronic Equipment, Instruments & Components – 1.8% | |||||||
Flex Ltd* | 3,676,835 | 48,240,075 | |||||
Health Care Equipment & Supplies – 8.6% | |||||||
Abbott Laboratories | 2,025,828 | 148,614,742 | |||||
DexCom Inc* | 143,598 | 20,540,258 | |||||
Glaukos Corp* | 488,117 | 31,678,793 | |||||
ICU Medical Inc* | 115,232 | 32,581,848 | |||||
233,415,641 | |||||||
Hotels, Restaurants & Leisure – 1.0% | |||||||
Norwegian Cruise Line Holdings Ltd* | 481,010 | 27,624,404 | |||||
Independent Power and Renewable Electricity Producers – 3.7% | |||||||
NRG Energy Inc | 2,709,582 | 101,338,367 | |||||
Industrial Conglomerates – 1.5% | |||||||
General Electric Co | 3,642,065 | 41,118,914 | |||||
Information Technology Services – 2.5% | |||||||
Pagseguro Digital Ltd* | 1,577,759 | 43,656,591 | |||||
WEX Inc* | 122,826 | 24,658,548 | |||||
68,315,139 | |||||||
Internet Software & Services – 8.0% | |||||||
Alphabet Inc - Class C* | 80,740 | 96,360,768 | |||||
Altaba Inc* | 677,559 | 46,155,319 | |||||
Tencent Holdings Ltd | 918,600 | 37,927,352 | |||||
Trade Desk Inc* | 242,816 | 36,643,363 | |||||
217,086,802 | |||||||
Leisure Products – 2.1% | |||||||
Hasbro Inc | 532,449 | 55,971,039 | |||||
Machinery – 4.1% | |||||||
Stanley Black & Decker Inc | 503,900 | 73,791,116 | |||||
Wabtec Corp | 368,797 | 38,679,429 | |||||
112,470,545 | |||||||
Media – 6.0% | |||||||
Liberty Media Corp-Liberty Formula One* | 1,787,601 | 66,480,881 | |||||
Vivendi SA | 3,729,485 | 95,986,397 | |||||
162,467,278 | |||||||
See Notes to Schedule of Investments and Other Information and Notes to Financial Statements. | |
8 | SEPTEMBER 30, 2018 |
Janus Henderson Contrarian Fund
Schedule of Investments
September 30, 2018
| Value | ||||||
Common Stocks – (continued) | |||||||
Metals & Mining – 1.8% | |||||||
Constellium NV* | 3,866,361 | $47,749,558 | |||||
Oil, Gas & Consumable Fuels – 1.3% | |||||||
Anadarko Petroleum Corp | 542,095 | 36,542,624 | |||||
Pharmaceuticals – 5.4% | |||||||
Allergan PLC | 530,275 | 101,006,782 | |||||
Amneal Pharmaceuticals Inc* | 1,242,141 | 27,563,109 | |||||
Collegium Pharmaceutical Inc*,# | 1,171,914 | 17,274,012 | |||||
145,843,903 | |||||||
Semiconductor & Semiconductor Equipment – 2.0% | |||||||
Microchip Technology Inc | 691,613 | 54,575,182 | |||||
Software – 5.2% | |||||||
Dell Technologies Inc - Class V* | 397,365 | 38,592,089 | |||||
Ultimate Software Group Inc* | 318,609 | 102,652,634 | |||||
141,244,723 | |||||||
Specialty Retail – 2.0% | |||||||
Tractor Supply Co | 610,076 | 55,443,707 | |||||
Technology Hardware, Storage & Peripherals – 1.8% | |||||||
NCR Corp* | 1,691,731 | 48,062,078 | |||||
Textiles, Apparel & Luxury Goods – 0.8% | |||||||
Under Armour Inc - Class C* | 1,180,087 | 22,964,493 | |||||
Total Common Stocks (cost $2,267,485,261) | 2,656,601,174 | ||||||
Preferred Stocks – 0% | |||||||
Real Estate Investment Trusts (REITs) – 0% | |||||||
Colony American Homes III LP*,¢,§ (cost $109,351) | 1,377,158 | 101,497 | |||||
Investment Companies – 2.3% | |||||||
Investments Purchased with Cash Collateral from Securities Lending – 0.1% | |||||||
Janus Henderson Cash Collateral Fund LLC, 1.9772%ºº,£ | 3,301,625 | 3,301,625 | |||||
Money Markets – 2.2% | |||||||
Janus Henderson Cash Liquidity Fund LLC, 2.0479%ºº,£ | 59,674,290 | 59,674,290 | |||||
Total Investment Companies (cost $62,975,915) | 62,975,915 | ||||||
Total Investments (total cost $2,330,570,527) – 100.0% | 2,719,678,586 | ||||||
Liabilities, net of Cash, Receivables and Other Assets – (0)% | (547,120) | ||||||
Net Assets – 100% | $2,719,131,466 | ||||||
Summary of Investments by Country - (Long Positions) (unaudited) | |||||
% of | |||||
Investment | |||||
Country | Value | Securities | |||
United States | $2,494,358,688 | 91.7 | % | ||
France | 95,986,397 | 3.5 | |||
Netherlands | 47,749,558 | 1.8 | |||
Brazil | 43,656,591 | 1.6 | |||
China | 37,927,352 | 1.4 | |||
Total | $2,719,678,586 | 100.0 | % |
See Notes to Schedule of Investments and Other Information and Notes to Financial Statements. | |
Janus Investment Fund | 9 |
Janus Henderson Contrarian Fund
Schedule of Investments
September 30, 2018
Schedules of Affiliated Investments – (% of Net Assets)
Dividend Income(1) | Realized Gain/(Loss)(1) | Change in Unrealized Appreciation/ Depreciation(1) | Value at 9/30/18 | |||||||
Common Stocks - 0.8% | ||||||||||
Biotechnology - 0.8% | ||||||||||
HLS Therapeutics Inc*,§ | $ | - | $ | - | $ | 4,750,240 | $ | 20,758,818 | ||
Investment Companies - 2.3% | ||||||||||
Investments Purchased with Cash Collateral from Securities Lending - 0.1% | ||||||||||
Janus Henderson Cash Collateral Fund LLC, 1.9772%ºº | 363,287∆ | - | - | 3,301,625 | ||||||
Money Markets - 2.2% | ||||||||||
Janus Henderson Cash Liquidity Fund LLC, 2.0479%ºº | 457,611 | - | - | 59,674,290 | ||||||
Total Investment Companies | $ | 820,898 | $ | - | $ | - | $ | 62,975,915 | ||
Total Affiliated Investments - 3.1% | $ | 820,898 | $ | - | $ | 4,750,240 | $ | 83,734,733 | ||
(1) For securities that were affiliated for a portion of the year ended September 30, 2018, this column reflects amounts for the entire year ended September 30, 2018 and not just the period in which the security was affiliated.
Share Balance at 9/30/17 | Purchases | Sales | Share Balance at 9/30/18 | |||||||
Common Stocks - 0.8% | ||||||||||
Biotechnology - 0.8% | ||||||||||
HLS Therapeutics Inc*,§ | 1,935,741 | - | - | 1,935,741 | ||||||
Investment Companies - 2.3% | ||||||||||
Investments Purchased with Cash Collateral from Securities Lending - 0.1% | ||||||||||
Janus Henderson Cash Collateral Fund LLC, 1.9772%ºº | - | 612,052,910 | (608,751,285) | 3,301,625 | ||||||
Money Markets - 2.2% | ||||||||||
Janus Henderson Cash Liquidity Fund LLC, 2.0479%ºº | 118,010,490 | 687,160,800 | (745,497,000) | 59,674,290 | ||||||
See Notes to Schedule of Investments and Other Information and Notes to Financial Statements. | |
10 | SEPTEMBER 30, 2018 |
Janus Henderson Contrarian Fund
Schedule of Investments
September 30, 2018
The following tables provide information about the effect of derivatives and hedging activities on the Fund’s Statement of Operations for the year ended September 30, 2018.
The effect of Derivative Instruments (not accounted for as hedging instruments) on the Statement of Operations for the year ended September 30, 2018 | ||||
Amount of Realized Gain/(Loss) Recognized on Derivatives | ||||
Derivative |
| Currency
| ||
Forward foreign currency exchange contracts | $(445,886) | |||
Amount of Change in Unrealized Appreciation/Depreciation Recognized on Derivatives | ||||
Derivative |
| Currency
| ||
Forward foreign currency exchange contracts | $(344,249) | |||
Please see the "Net Realized Gain/(Loss) on Investments" and "Change in Unrealized Net Appreciation/Depreciation" sections of the Fund’s Statement of Operations.
Average Ending Monthly Market Value of Derivative Instruments During the Year Ended September 30, 2018 | |
| Market Value(a) |
Forward foreign currency exchange contracts, sold | $ 27,578,972 |
(a) Forward foreign currency exchange contracts are reported as the average ending monthly currency amount sold. | |
See Notes to Schedule of Investments and Other Information and Notes to Financial Statements. | |
Janus Investment Fund | 11 |
Janus Henderson Contrarian Fund
Notes to Schedule of Investments and Other Information
S&P 500® Index | S&P 500® Index reflects U.S. large-cap equity performance and represents broad U.S. equity market performance. |
LLC | Limited Liability Company |
PLC | Public Limited Company |
* | Non-income producing security. |
ºº | Rate shown is the 7-day yield as of September 30, 2018. |
# | Loaned security; a portion of the security is on loan at September 30, 2018. |
¢ | Security is valued using significant unobservable inputs. |
£ | The Fund may invest in certain securities that are considered affiliated companies. As defined by the Investment Company Act of 1940, as amended, an affiliated company is one in which the Fund owns 5% or more of the outstanding voting securities, or a company which is under common ownership or control. |
∆ | Net of income paid to the securities lending agent and rebates paid to the borrowing counterparties. |
§ | Schedule of Restricted and Illiquid Securities (as of September 30, 2018) | |||||||||
Value as a | ||||||||||
Acquisition | % of Net | |||||||||
Date | Cost | Value | Assets | |||||||
Colony American Homes III LP | 1/30/13 | $ | 109,351 | $ | 101,497 | 0.0 | % | |||
HLS Therapeutics Inc | 7/2/15 | 17,597,650 | 20,758,818 | 0.8 | ||||||
Total | $ | 17,707,001 | $ | 20,860,315 | 0.8 | % | ||||
The Fund has registration rights for certain restricted securities held as of September 30, 2018. The issuer incurs all registration costs. | ||||||||||
The following is a summary of the inputs that were used to value the Fund’s investments in securities and other financial instruments as of September 30, 2018. See Notes to Financial Statements for more information. | ||||||||||||
Valuation Inputs Summary | ||||||||||||
Level 2 - | Level 3 - | |||||||||||
Level 1 - | Other Significant | Significant | ||||||||||
Quoted Prices | Observable Inputs | Unobservable Inputs | ||||||||||
Assets | ||||||||||||
Investments in Securities: | ||||||||||||
Common Stocks | ||||||||||||
Biotechnology | $ | 34,553,844 | $ | 20,758,818 | $ | - | ||||||
All Other | 2,601,288,512 | - | - | |||||||||
Preferred Stocks | - | - | 101,497 | |||||||||
Investment Companies | - | 62,975,915 | - | |||||||||
Total Assets | $ | 2,635,842,356 | $ | 83,734,733 | $ | 101,497 | ||||||
12 | SEPTEMBER 30, 2018 |
Janus Henderson Contrarian Fund
Statement of Assets and Liabilities
September 30, 2018
|
|
|
|
|
|
|
Assets: | ||||||
Unaffiliated investments, at value(1)(2) | $ | 2,635,943,853 | ||||
Affiliated investments, at value(3) | 83,734,733 | |||||
Non-interested Trustees' deferred compensation | 58,476 | |||||
Receivables: | ||||||
Investments sold | 18,749,653 | |||||
Dividends | 903,698 | |||||
Fund shares sold | 255,867 | |||||
Foreign tax reclaims | 224,131 | |||||
Dividends from affiliates | 58,222 | |||||
Other assets | 3,532 | |||||
Total Assets |
|
| 2,739,932,165 |
| ||
Liabilities: | ||||||
Due to custodian | 3,757 | |||||
Collateral for securities loaned (Note 3) | 3,301,625 | |||||
Payables: | — | |||||
Investments purchased | 14,232,201 | |||||
Fund shares repurchased | 1,154,668 | |||||
Advisory fees | 1,078,815 | |||||
Transfer agent fees and expenses | 492,710 | |||||
Non-interested Trustees' deferred compensation fees | 58,476 | |||||
Professional fees | 46,164 | |||||
12b-1 Distribution and shareholder servicing fees | 19,567 | |||||
Non-interested Trustees' fees and expenses | 15,514 | |||||
Affiliated fund administration fees payable | 5,590 | |||||
Custodian fees | 1,212 | |||||
Accrued expenses and other payables | 390,400 | |||||
Total Liabilities |
|
| 20,800,699 |
| ||
Net Assets |
| $ | 2,719,131,466 |
| ||
See Notes to Financial Statements. | |
Janus Investment Fund | 13 |
Janus Henderson Contrarian Fund
Statement of Assets and Liabilities
September 30, 2018
|
|
|
|
|
|
|
Net Assets Consist of: | ||||||
Capital (par value and paid-in surplus) | $ | 2,147,335,073 | ||||
Total distributable earnings (loss) | 571,796,393 | |||||
Total Net Assets |
| $ | 2,719,131,466 |
| ||
Net Assets - Class A Shares | $ | 14,939,917 | ||||
Shares Outstanding, $0.01 Par Value (unlimited shares authorized) | 691,405 | |||||
Net Asset Value Per Share(4) |
| $ | 21.61 |
| ||
Maximum Offering Price Per Share(5) |
| $ | 22.93 |
| ||
Net Assets - Class C Shares | $ | 19,126,356 | ||||
Shares Outstanding, $0.01 Par Value (unlimited shares authorized) | 948,735 | |||||
Net Asset Value Per Share(4) |
| $ | 20.16 |
| ||
Net Assets - Class D Shares | $ | 1,925,748,742 | ||||
Shares Outstanding, $0.01 Par Value (unlimited shares authorized) | 88,965,514 | |||||
Net Asset Value Per Share |
| $ | 21.65 |
| ||
Net Assets - Class I Shares | $ | 54,347,819 | ||||
Shares Outstanding, $0.01 Par Value (unlimited shares authorized) | 2,507,348 | |||||
Net Asset Value Per Share |
| $ | 21.68 |
| ||
Net Assets - Class N Shares | $ | 26,807,606 | ||||
Shares Outstanding, $0.01 Par Value (unlimited shares authorized) | 1,239,326 | |||||
Net Asset Value Per Share |
| $ | 21.63 |
| ||
Net Assets - Class R Shares | $ | 675,876 | ||||
Shares Outstanding, $0.01 Par Value (unlimited shares authorized) | 32,227 | |||||
Net Asset Value Per Share |
| $ | 20.97 |
| ||
Net Assets - Class S Shares | $ | 1,033,069 | ||||
Shares Outstanding, $0.01 Par Value (unlimited shares authorized) | 47,979 | |||||
Net Asset Value Per Share |
| $ | 21.53 |
| ||
Net Assets - Class T Shares | $ | 676,452,081 | ||||
Shares Outstanding, $0.01 Par Value (unlimited shares authorized) | 31,273,938 | |||||
Net Asset Value Per Share |
| $ | 21.63 |
| ||
(1) Includes cost of $2,249,996,962. (2) Includes $3,208,530 of securities on loan. See Note 3 in Notes to Financial Statements. (3) Includes cost of $80,573,565. (4) Redemption price per share may be reduced for any applicable contingent deferred sales charge. (5) Maximum offering price is computed at 100/94.25 of net asset value. |
See Notes to Financial Statements. | |
14 | SEPTEMBER 30, 2018 |
Janus Henderson Contrarian Fund
Statement of Operations
For the year ended September 30, 2018
|
|
|
|
|
|
Investment Income: | |||||
| Dividends | $ | 30,193,667 | ||
Dividends from affiliates | 457,611 | ||||
Affiliated securities lending income, net | 363,287 | ||||
Other income | 30 | ||||
Foreign tax withheld | (160,118) | ||||
Total Investment Income |
| 30,854,477 |
| ||
Expenses: | |||||
Advisory fees | 12,147,088 | ||||
12b-1 Distribution and shareholder servicing fees: | |||||
Class A Shares | 34,882 | ||||
Class C Shares | 210,772 | ||||
Class R Shares | 3,324 | ||||
Class S Shares | 7,645 | ||||
Transfer agent administrative fees and expenses: | |||||
Class D Shares | 2,204,146 | ||||
Class R Shares | 1,662 | ||||
Class S Shares | 7,645 | ||||
Class T Shares | 1,637,096 | ||||
Transfer agent networking and omnibus fees: | |||||
Class A Shares | 14,044 | ||||
Class C Shares | 20,392 | ||||
Class I Shares | 44,236 | ||||
Other transfer agent fees and expenses: | |||||
Class A Shares | 1,646 | ||||
Class C Shares | 2,300 | ||||
Class D Shares | 410,504 | ||||
Class I Shares | 2,790 | ||||
Class N Shares | 776 | ||||
Class R Shares | 67 | ||||
Class S Shares | 80 | ||||
Class T Shares | 16,839 | ||||
Shareholder reports expense | 461,150 | ||||
Registration fees | 130,799 | ||||
Affiliated fund administration fees | 126,161 | ||||
Professional fees | 79,747 | ||||
Non-interested Trustees’ fees and expenses | 66,112 | ||||
Custodian fees | 29,286 | ||||
Other expenses | 180,855 | ||||
Total Expenses |
| 17,842,044 |
| ||
Less: Excess Expense Reimbursement and Waivers |
| (65,212) |
| ||
Net Expenses |
| 17,776,832 |
| ||
Net Investment Income/(Loss) |
| 13,077,645 |
| ||
See Notes to Financial Statements. | |
Janus Investment Fund | 15 |
Janus Henderson Contrarian Fund
Statement of Operations
For the year ended September 30, 2018
|
|
|
|
|
|
Net Realized Gain/(Loss) on Investments: | |||||
Investments and foreign currency transactions | $ | 200,426,695 | |||
Forward foreign currency exchange contracts | (445,886) | ||||
Total Net Realized Gain/(Loss) on Investments |
| 199,980,809 |
| ||
Change in Unrealized Net Appreciation/Depreciation: | |||||
Investments, foreign currency translations and non-interested Trustees’ deferred compensation | 197,890,844 | ||||
Investments in affiliates | 4,750,240 | ||||
Forward foreign currency exchange contracts | (344,249) | ||||
Total Change in Unrealized Net Appreciation/Depreciation |
| 202,296,835 |
| ||
Net Increase/(Decrease) in Net Assets Resulting from Operations | $ | 415,355,289 |
| ||
See Notes to Financial Statements. | |
16 | SEPTEMBER 30, 2018 |
Janus Henderson Contrarian Fund
Statements of Changes in Net Assets
|
|
| Year
ended |
| Year ended | |||
Operations: | ||||||||
Net investment income/(loss) | $ | 13,077,645 | $ | 8,351,853 | ||||
Net realized gain/(loss) on investments | 199,980,809 | 205,216,561 | ||||||
Change in unrealized net appreciation/depreciation | 202,296,835 | 90,734,041 | ||||||
Net Increase/(Decrease) in Net Assets Resulting from Operations |
| 415,355,289 |
|
| 304,302,455 | |||
Dividends and Distributions to Shareholders(2) | ||||||||
Class A Shares | (988,770) | N/A | ||||||
Class C Shares | (1,846,338) | N/A | ||||||
Class D Shares | (136,146,535) | N/A | ||||||
Class I Shares | (4,829,794) | N/A | ||||||
Class N Shares | (1,833,679) | N/A | ||||||
Class R Shares | (50,300) | N/A | ||||||
Class S Shares | (245,468) | N/A | ||||||
Class T Shares | (48,816,373) | N/A | ||||||
| Total Dividends and Distributions to Shareholders |
| (194,757,257) |
|
| N/A | ||
Dividends from Net Investment Income(2) | ||||||||
Class A Shares | N/A | (9,471) | ||||||
Class D Shares | N/A | (6,330,300) | ||||||
Class I Shares | N/A | (370,633) | ||||||
Class T Shares | N/A | (1,938,754) | ||||||
| Total Dividends from Net Investment Income |
| N/A |
|
| (8,649,158) | ||
Distributions from Net Realized Gain from Investment Transactions(2) | ||||||||
Class A Shares | N/A | (1,591,772) | ||||||
Class C Shares | N/A | (1,431,912) | ||||||
Class D Shares | N/A | (65,676,530) | ||||||
Class I Shares | N/A | (3,259,157) | ||||||
Class R Shares | N/A | (37,789) | ||||||
Class S Shares | N/A | (134,790) | ||||||
Class T Shares | N/A | (26,523,128) | ||||||
| Total Distributions from Net Realized Gain from Investment Transactions | N/A |
|
| (98,655,078) | |||
Net Decrease from Dividends and Distributions to Shareholders |
| (194,757,257) |
|
| (107,304,236) | |||
Capital Share Transactions: | ||||||||
Class A Shares | (773,296) | (42,552,373) | ||||||
Class C Shares | (9,770,402) | (22,038,781) | ||||||
Class D Shares | (55,211,917) | (137,692,200) | ||||||
Class I Shares | (25,520,409) | (23,862,766) | ||||||
Class N Shares | 5,120,393 | 18,733,894 | ||||||
Class R Shares | (115,254) | (387,918) | ||||||
Class S Shares | (3,080,689) | (470,683) | ||||||
Class T Shares | (51,022,860) | (134,486,934) | ||||||
Net Increase/(Decrease) from Capital Share Transactions |
| (140,374,434) |
|
| (342,757,761) | |||
Net Increase/(Decrease) in Net Assets |
| 80,223,598 |
|
| (145,759,542) | |||
Net Assets: | ||||||||
Beginning of period | 2,638,907,868 | 2,784,667,410 | ||||||
| End of period(3) | $ | 2,719,131,466 |
| $ | 2,638,907,868 | ||
(1) Period from August 4, 2017 (inception date) through September 30, 2017 for Class N Shares. (2) The requirement to disclose dividends and distributions paid to shareholders from net investment income and/or net realized gain from investment transactions was eliminated by the SEC (Securities Exchange Commission) in 2018. (3) Net assets - End of period includes undistributed (overdistributed) net investment income of $(48,620) as of September 30, 2017. The requirement to disclose undistributed (overdistributed) net investment income was eliminated by the SEC in 2018. |
See Notes to Financial Statements. | |
Janus Investment Fund | 17 |
Janus Henderson Contrarian Fund
Financial Highlights
Class A Shares | ||||||||||||||||||
For a share outstanding during the year ended September 30 |
| 2018 |
|
| 2017 |
|
| 2016 |
|
| 2015 |
|
| 2014 |
| |||
Net Asset Value, Beginning of Period |
| $19.92 |
|
| $18.53 |
|
| $18.56 |
|
| $23.11 |
|
| $18.48 |
| |||
Income/(Loss) from Investment Operations: | ||||||||||||||||||
Net investment income/(loss)(1) | 0.06 | 0.05 | 0.07 | 0.05 | 0.02 | |||||||||||||
Net realized and unrealized gain/(loss) | 3.10 | 2.02 | 0.43 | (2.26) | 4.61 | |||||||||||||
Total from Investment Operations |
| 3.16 |
|
| 2.07 |
|
| 0.50 |
|
| (2.21) |
|
| 4.63 |
| |||
Less Dividends and Distributions: | ||||||||||||||||||
Dividends (from net investment income) | — | —(2) | (0.03) | (0.06) | —(2) | |||||||||||||
Distributions (from capital gains) | (1.47) | (0.68) | (0.50) | (2.28) | — | |||||||||||||
Total Dividends and Distributions |
| (1.47) |
|
| (0.68) |
|
| (0.53) |
|
| (2.34) |
|
| — |
| |||
Net Asset Value, End of Period | $21.61 | $19.92 | $18.53 | $18.56 | $23.11 | |||||||||||||
Total Return* |
| 16.89%(3) |
|
| 11.24% |
|
| 2.77% |
|
| (10.76)% |
|
| 25.08% |
| |||
Net Assets, End of Period (in thousands) | $14,940 | $14,557 | $53,928 | $102,425 | $75,649 | |||||||||||||
Average Net Assets for the Period (in thousands) | $13,854 | $30,749 | $73,939 | $114,845 | $46,300 | |||||||||||||
Ratios to Average Net Assets**: |
|
|
|
|
|
|
|
|
|
|
|
|
|
|
| |||
Ratio of Gross Expenses | 0.87% | 0.82% | 0.90% | 1.13% | 1.02% | |||||||||||||
Ratio of Net Expenses (After Waivers and Expense Offsets) | 0.87% | 0.82% | 0.90% | 1.13% | 1.02% | |||||||||||||
Ratio of Net Investment Income/(Loss) | 0.31% | 0.25% | 0.37% | 0.21% | 0.10% | |||||||||||||
Portfolio Turnover Rate | 59% | 116% | 51% | 70% | 61% | |||||||||||||
1 | ||||||||||||||||||
Class C Shares | ||||||||||||||||||
For a share outstanding during the year ended September 30 |
| 2018 |
|
| 2017 |
|
| 2016 |
|
| 2015 |
|
| 2014 |
| |||
Net Asset Value, Beginning of Period |
| $18.80 |
|
| $17.64 |
|
| $17.79 |
|
| $22.34 |
|
| $18.01 |
| |||
Income/(Loss) from Investment Operations: | ||||||||||||||||||
Net investment income/(loss)(1) | (0.07) | (0.10) | (0.06) | (0.11) | (0.15) | |||||||||||||
Net realized and unrealized gain/(loss) | 2.90 | 1.94 | 0.41 | (2.16) | 4.48 | |||||||||||||
Total from Investment Operations |
| 2.83 |
|
| 1.84 |
|
| 0.35 |
|
| (2.27) |
|
| 4.33 |
| |||
Less Dividends and Distributions: | ||||||||||||||||||
Dividends (from net investment income) | — | — | — | — | — | |||||||||||||
Distributions (from capital gains) | (1.47) | (0.68) | (0.50) | (2.28) | — | |||||||||||||
Total Dividends and Distributions |
| (1.47) |
|
| (0.68) |
|
| (0.50) |
|
| (2.28) |
|
| — |
| |||
Net Asset Value, End of Period | $20.16 | $18.80 | $17.64 | $17.79 | $22.34 | |||||||||||||
Total Return* |
| 16.10%(3) |
|
| 10.46% |
|
| 2.02% |
|
| (11.44)% |
|
| 24.04% |
| |||
Net Assets, End of Period (in thousands) | $19,126 | $27,507 | $47,112 | $77,497 | $56,098 | |||||||||||||
Average Net Assets for the Period (in thousands) | $21,999 | $35,731 | $58,609 | $86,160 | $34,189 | |||||||||||||
Ratios to Average Net Assets**: |
|
|
|
|
|
|
|
|
|
|
|
|
|
|
| |||
Ratio of Gross Expenses | 1.56% | 1.53% | 1.62% | 1.89% | 1.80% | |||||||||||||
Ratio of Net Expenses (After Waivers and Expense Offsets) | 1.56% | 1.53% | 1.62% | 1.89% | 1.80% | |||||||||||||
Ratio of Net Investment Income/(Loss) | (0.38)% | (0.54)% | (0.36)% | (0.54)% | (0.69)% | |||||||||||||
Portfolio Turnover Rate | 59% | 116% | 51% | 70% | 61% | |||||||||||||
* Total return not annualized for periods of less than one full year. ** Annualized for periods of less than one full year. (1) Per share amounts are calculated based on average shares outstanding during the year or period. (2) Less than $0.005 on a per share basis. (3) The return includes adjustments in accordance with generally accepted accounting principles required at period end date. |
See Notes to Financial Statements. | |
18 | SEPTEMBER 30, 2018 |
Janus Henderson Contrarian Fund
Financial Highlights
Class D Shares | ||||||||||||||||||
For a share outstanding during the year ended September 30 |
| 2018 |
|
| 2017 |
|
| 2016 |
|
| 2015 |
|
| 2014 |
| |||
Net Asset Value, Beginning of Period |
| $19.97 |
|
| $18.60 |
|
| $18.64 |
|
| $23.18 |
|
| $18.53 |
| |||
Income/(Loss) from Investment Operations: | ||||||||||||||||||
Net investment income/(loss)(1) | 0.11 | 0.06 | 0.10 | 0.08 | 0.05 | |||||||||||||
Net realized and unrealized gain/(loss) | 3.11 | 2.06 | 0.44 | (2.27) | 4.64 | |||||||||||||
Total from Investment Operations |
| 3.22 |
|
| 2.12 |
|
| 0.54 |
|
| (2.19) |
|
| 4.69 |
| |||
Less Dividends and Distributions: | ||||||||||||||||||
Dividends (from net investment income) | (0.07) | (0.07) | (0.08) | (0.07) | (0.04) | |||||||||||||
Distributions (from capital gains) | (1.47) | (0.68) | (0.50) | (2.28) | — | |||||||||||||
Total Dividends and Distributions |
| (1.54) |
|
| (0.75) |
|
| (0.58) |
|
| (2.35) |
|
| (0.04) |
| |||
Net Asset Value, End of Period | $21.65 | $19.97 | $18.60 | $18.64 | $23.18 | |||||||||||||
Total Return* |
| 17.20%(2) |
|
| 11.43% |
|
| 2.98% |
|
| (10.63)% |
|
| 25.33% |
| |||
Net Assets, End of Period (in thousands) | $1,925,749 | $1,824,343 | $1,830,310 | $1,976,590 | $2,382,592 | |||||||||||||
Average Net Assets for the Period (in thousands) | $1,841,765 | $1,882,932 | $1,856,945 | $2,354,562 | $2,258,453 | |||||||||||||
Ratios to Average Net Assets**: |
|
|
|
|
|
|
|
|
|
|
|
|
|
|
| |||
Ratio of Gross Expenses | 0.65% | 0.64% | 0.70% | 0.95% | 0.80% | |||||||||||||
Ratio of Net Expenses (After Waivers and Expense Offsets) | 0.65% | 0.64% | 0.70% | 0.95% | 0.80% | |||||||||||||
Ratio of Net Investment Income/(Loss) | 0.53% | 0.33% | 0.56% | 0.35% | 0.24% | |||||||||||||
Portfolio Turnover Rate | 59% | 116% | 51% | 70% | 61% | |||||||||||||
Class I Shares | ||||||||||||||||||
For a share outstanding during the year ended September 30 |
| 2018 |
|
| 2017 |
|
| 2016 |
|
| 2015 |
|
| 2014 |
| |||
Net Asset Value, Beginning of Period |
| $19.99 |
|
| $18.61 |
|
| $18.64 |
|
| $23.20 |
|
| $18.55 |
| |||
Income/(Loss) from Investment Operations: | ||||||||||||||||||
Net investment income/(loss)(1) | 0.12 | 0.07 | 0.11 | 0.10 | 0.09 | |||||||||||||
Net realized and unrealized gain/(loss) | 3.12 | 2.07 | 0.44 | (2.28) | 4.63 | |||||||||||||
Total from Investment Operations |
| 3.24 |
|
| 2.14 |
|
| 0.55 |
|
| (2.18) |
|
| 4.72 |
| |||
Less Dividends and Distributions: | ||||||||||||||||||
Dividends (from net investment income) | (0.08) | (0.08) | (0.08) | (0.10) | (0.07) | |||||||||||||
Distributions (from capital gains) | (1.47) | (0.68) | (0.50) | (2.28) | — | |||||||||||||
Total Dividends and Distributions |
| (1.55) |
|
| (0.76) |
|
| (0.58) |
|
| (2.38) |
|
| (0.07) |
| |||
Net Asset Value, End of Period | $21.68 | $19.99 | $18.61 | $18.64 | $23.20 | |||||||||||||
Total Return* |
| 17.29%(2) |
|
| 11.54% |
|
| 3.05% |
|
| (10.60)% |
|
| 25.47% |
| |||
Net Assets, End of Period (in thousands) | $54,348 | $75,603 | $93,875 | $248,586 | $329,245 | |||||||||||||
Average Net Assets for the Period (in thousands) | $58,166 | $104,290 | $144,380 | $382,723 | $184,931 | |||||||||||||
Ratios to Average Net Assets**: |
|
|
|
|
|
|
|
|
|
|
|
|
|
|
| |||
Ratio of Gross Expenses | 0.57% | 0.56% | 0.63% | 0.86% | 0.74% | |||||||||||||
Ratio of Net Expenses (After Waivers and Expense Offsets) | 0.57% | 0.56% | 0.63% | 0.86% | 0.74% | |||||||||||||
Ratio of Net Investment Income/(Loss) | 0.60% | 0.37% | 0.61% | 0.44% | 0.40% | |||||||||||||
Portfolio Turnover Rate | 59% | 116% | 51% | 70% | 61% | |||||||||||||
* Total return not annualized for periods of less than one full year. ** Annualized for periods of less than one full year. (1) Per share amounts are calculated based on average shares outstanding during the year or period. (2) The return includes adjustments in accordance with generally accepted accounting principles required at period end date. |
See Notes to Financial Statements. | |
Janus Investment Fund | 19 |
Janus Henderson Contrarian Fund
Financial Highlights
Class N Shares | |||||||||
For a share outstanding during the year or period ended September 30 |
| 2018 |
|
| 2017(1) |
| |||
Net Asset Value, Beginning of Period |
| $19.96 |
|
| $19.49 |
| |||
Income/(Loss) from Investment Operations: | |||||||||
Net investment income/(loss)(2) | 0.14 | 0.01 | |||||||
Net realized and unrealized gain/(loss) | 3.10 | 0.46 | |||||||
Total from Investment Operations |
| 3.24 |
|
| 0.47 |
| |||
Less Dividends and Distributions: | |||||||||
Dividends (from net investment income) | (0.10) | — | |||||||
Distributions (from capital gains) | (1.47) | — | |||||||
Total Dividends and Distributions |
| (1.57) |
|
| — |
| |||
Net Asset Value, End of Period | $21.63 | $19.96 | |||||||
Total Return* |
| 17.37% |
|
| 2.41% |
| |||
Net Assets, End of Period (in thousands) | $26,808 | $19,528 | |||||||
Average Net Assets for the Period (in thousands) | $24,664 | $12,254 | |||||||
Ratios to Average Net Assets**: |
|
|
|
|
|
| |||
Ratio of Gross Expenses | 0.50% | 0.51% | |||||||
Ratio of Net Expenses (After Waivers and Expense Offsets) | 0.50% | 0.51% | |||||||
Ratio of Net Investment Income/(Loss) | 0.69% | 0.44% | |||||||
Portfolio Turnover Rate | 59% | 116% | |||||||
Class R Shares | ||||||||||||||||||
For a share outstanding during the year ended September 30 |
| 2018 |
|
| 2017 |
|
| 2016 |
|
| 2015 |
|
| 2014 |
| |||
Net Asset Value, Beginning of Period |
| $19.47 |
|
| $18.19 |
|
| $18.27 |
|
| $22.81 |
|
| $18.31 |
| |||
Income/(Loss) from Investment Operations: | ||||||||||||||||||
Net investment income/(loss)(2) | (0.05) | (0.04) | —(3) | (0.05) | (0.07) | |||||||||||||
Net realized and unrealized gain/(loss) | 3.02 | 2.00 | 0.42 | (2.21) | 4.57 | |||||||||||||
Total from Investment Operations |
| 2.97 |
|
| 1.96 |
|
| 0.42 |
|
| (2.26) |
|
| 4.50 |
| |||
Less Dividends and Distributions: | ||||||||||||||||||
Dividends (from net investment income) | — | — | — | — | — | |||||||||||||
Distributions (from capital gains) | (1.47) | (0.68) | (0.50) | (2.28) | — | |||||||||||||
Total Dividends and Distributions |
| (1.47) |
|
| (0.68) |
|
| (0.50) |
|
| (2.28) |
|
| — |
| |||
Net Asset Value, End of Period | $20.97 | $19.47 | $18.19 | $18.27 | $22.81 | |||||||||||||
Total Return* |
| 16.26%(4) |
|
| 10.81% |
|
| 2.36% |
|
| (11.13)% |
|
| 24.58% |
| |||
Net Assets, End of Period (in thousands) | $676 | $740 | $1,058 | $1,592 | $1,994 | |||||||||||||
Average Net Assets for the Period (in thousands) | $667 | $974 | $1,191 | $2,031 | $1,910 | |||||||||||||
Ratios to Average Net Assets**: |
|
|
|
|
|
|
|
|
|
|
|
|
|
|
| |||
Ratio of Gross Expenses | 1.47% | 1.23% | 1.27% | 1.54% | 1.38% | |||||||||||||
Ratio of Net Expenses (After Waivers and Expense Offsets) | 1.41% | 1.23% | 1.27% | 1.54% | 1.38% | |||||||||||||
Ratio of Net Investment Income/(Loss) | (0.24)% | (0.21)% | 0.00%(5) | (0.23)% | (0.35)% | |||||||||||||
Portfolio Turnover Rate | 59% | 116% | 51% | 70% | 61% | |||||||||||||
* Total return not annualized for periods of less than one full year. ** Annualized for periods of less than one full year. (1) Period from August 4, 2017 (inception date) through September 30, 2017. (2) Per share amounts are calculated based on average shares outstanding during the year or period. (3) Less than $0.005 on a per share basis. (4) The return includes adjustments in accordance with generally accepted accounting principles required at period end date. (5) Less than 0.005%. |
See Notes to Financial Statements. | |
20 | SEPTEMBER 30, 2018 |
Janus Henderson Contrarian Fund
Financial Highlights
Class S Shares | ||||||||||||||||||
For a share outstanding during the year ended September 30 |
| 2018 |
|
| 2017 |
|
| 2016 |
|
| 2015 |
|
| 2014 |
| |||
Net Asset Value, Beginning of Period |
| $19.89 |
|
| $18.53 |
|
| $18.55 |
|
| $23.09 |
|
| $18.48 |
| |||
Income/(Loss) from Investment Operations: | ||||||||||||||||||
Net investment income/(loss)(1) | 0.02 | —(2) | 0.04 | —(2) | (0.01) | |||||||||||||
Net realized and unrealized gain/(loss) | 3.09 | 2.04 | 0.44 | (2.25) | 4.62 | |||||||||||||
Total from Investment Operations |
| 3.11 |
|
| 2.04 |
|
| 0.48 |
|
| (2.25) |
|
| 4.61 |
| |||
Less Dividends and Distributions: | ||||||||||||||||||
Dividends (from net investment income) | — | — | — | (0.01) | — | |||||||||||||
Distributions (from capital gains) | (1.47) | (0.68) | (0.50) | (2.28) | — | |||||||||||||
Total Dividends and Distributions |
| (1.47) |
|
| (0.68) |
|
| (0.50) |
|
| (2.29) |
|
| — |
| |||
Net Asset Value, End of Period | $21.53 | $19.89 | $18.53 | $18.55 | $23.09 | |||||||||||||
Total Return* |
| 16.65%(3) |
|
| 11.05% |
|
| 2.65% |
|
| (10.92)% |
|
| 24.95% |
| |||
Net Assets, End of Period (in thousands) | $1,033 | $3,842 | $4,052 | $4,578 | $6,346 | |||||||||||||
Average Net Assets for the Period (in thousands) | $3,068 | $3,920 | $4,208 | $6,905 | $5,130 | |||||||||||||
Ratios to Average Net Assets**: |
|
|
|
|
|
|
|
|
|
|
|
|
|
|
| |||
Ratio of Gross Expenses | 1.04% | 0.98% | 1.04% | 1.29% | 1.16% | |||||||||||||
Ratio of Net Expenses (After Waivers and Expense Offsets) | 1.03% | 0.97% | 1.03% | 1.28% | 1.15% | |||||||||||||
Ratio of Net Investment Income/(Loss) | 0.10% | 0.00%(4) | 0.22% | 0.01% | (0.05)% | |||||||||||||
Portfolio Turnover Rate | 59% | 116% | 51% | 70% | 61% | |||||||||||||
Class T Shares | ||||||||||||||||||
For a share outstanding during the year ended September 30 |
| 2018 |
|
| 2017 |
|
| 2016 |
|
| 2015 |
|
| 2014 |
| |||
Net Asset Value, Beginning of Period |
| $19.95 |
|
| $18.58 |
|
| $18.62 |
|
| $23.15 |
|
| $18.51 |
| |||
Income/(Loss) from Investment Operations: | ||||||||||||||||||
Net investment income/(loss)(1) | 0.09 | 0.05 | 0.09 | 0.06 | 0.03 | |||||||||||||
Net realized and unrealized gain/(loss) | 3.11 | 2.05 | 0.43 | (2.26) | 4.64 | |||||||||||||
Total from Investment Operations |
| 3.20 |
|
| 2.10 |
|
| 0.52 |
|
| (2.20) |
|
| 4.67 |
| |||
Less Dividends and Distributions: | ||||||||||||||||||
Dividends (from net investment income) | (0.05) | (0.05) | (0.06) | (0.05) | (0.03) | |||||||||||||
Distributions (from capital gains) | (1.47) | (0.68) | (0.50) | (2.28) | — | |||||||||||||
Total Dividends and Distributions |
| (1.52) |
|
| (0.73) |
|
| (0.56) |
|
| (2.33) |
|
| (0.03) |
| |||
Net Asset Value, End of Period | $21.63 | $19.95 | $18.58 | $18.62 | $23.15 | |||||||||||||
Total Return* |
| 17.11% |
|
| 11.35% |
|
| 2.87% |
|
| (10.68)% |
|
| 25.24% |
| |||
Net Assets, End of Period (in thousands) | $676,452 | $672,788 | $754,333 | $940,738 | $1,308,109 | |||||||||||||
Average Net Assets for the Period (in thousands) | $656,674 | $741,874 | $814,169 | $1,252,238 | $1,238,665 | |||||||||||||
Ratios to Average Net Assets**: |
|
|
|
|
|
|
|
|
|
|
|
|
|
|
| |||
Ratio of Gross Expenses | 0.74% | 0.73% | 0.79% | 1.04% | 0.89% | |||||||||||||
Ratio of Net Expenses (After Waivers and Expense Offsets) | 0.73% | 0.72% | 0.77% | 1.02% | 0.89% | |||||||||||||
Ratio of Net Investment Income/(Loss) | 0.44% | 0.26% | 0.48% | 0.27% | 0.16% | |||||||||||||
Portfolio Turnover Rate | 59% | 116% | 51% | 70% | 61% | |||||||||||||
* Total return not annualized for periods of less than one full year. ** Annualized for periods of less than one full year. (1) Per share amounts are calculated based on average shares outstanding during the year or period. (2) Less than $0.005 on a per share basis. (3) The return includes adjustments in accordance with generally accepted accounting principles required at period end date. (4) Less than 0.005%. |
See Notes to Financial Statements. | |
Janus Investment Fund | 21 |
Janus Henderson Contrarian Fund
Notes to Financial Statements
1. Organization and Significant Accounting Policies
Janus Henderson Contrarian Fund (the “Fund”) is a series of Janus Investment Fund (the “Trust”), which is organized as a Massachusetts business trust and is registered under the Investment Company Act of 1940, as amended (the “1940 Act”), as an open-end management investment company, and therefore has applied the specialized accounting and reporting guidance in Financial Accounting Standards Board (“FASB”) Accounting Standards Codification (“ASC”) Topic 946. The Trust offers 48 funds, each of which offers multiple share classes, with differing investment objectives and policies. The Fund seeks long-term growth of capital. The Fund is classified as nondiversified, as defined in the 1940 Act.
The Fund offers multiple classes of shares in order to meet the needs of various types of investors. Each class represents an interest in the same portfolio of investments. Certain financial intermediaries may not offer all classes of shares. Class D Shares are closed to certain new investors.
Class A Shares and Class C Shares are generally offered through financial intermediary platforms including, but not limited to, traditional brokerage platforms, mutual fund wrap fee programs, bank trust platforms, and retirement platforms.
Class D Shares are generally no longer being made available to new investors who do not already have a direct account with the Janus Henderson funds. Class D Shares are available only to investors who hold accounts directly with the Janus Henderson funds, to immediate family members or members of the same household of an eligible individual investor, and to existing beneficial owners of sole proprietorships or partnerships that hold accounts directly with the Janus Henderson funds.
Class I Shares are available through certain financial intermediary platforms including, but not limited to, mutual fund wrap fee programs, managed account programs, asset allocation programs, bank trust platforms, as well as certain retirement platforms. Class I Shares are also available to certain direct institutional investors including, but not limited to, corporations, certain retirement plans, public plans, and foundations/endowments, who established Class I Share accounts before August 4, 2017.
Class N Shares are generally available only to financial intermediaries purchasing on behalf of: 1) certain adviser-assisted, employer-sponsored retirement plans, including 401(k) plans, 457 plans, 403(b) plans, Taft-Hartley multi-employer plans, profit-sharing and money purchase pension plans, defined benefit plans and certain welfare benefit plans, such as health savings accounts, and nonqualified deferred compensation plans; and 2) retail investors purchasing in qualified or nonqualified accounts, whose accounts are held through an omnibus account at their financial intermediary, and where the financial intermediary requires no payment or reimbursement from the Fund, Janus Capital Management LLC (“Janus Capital”), or its affiliates. Class N Shares are also available to Janus Henderson proprietary products and to certain direct institutional investors approved by Janus Distributors LLC dba Janus Henderson Distributors (“Janus Henderson Distributors”) including, but not limited to, corporations, certain retirement plans, public plans, and foundations and endowments, subject to minimum investment requirements.
Class R Shares are offered through financial intermediary platforms including, but not limited to, retirement platforms.
Class S Shares are offered through financial intermediary platforms including, but not limited to, retirement platforms and asset allocation, mutual fund wrap, or other discretionary or nondiscretionary fee-based investment advisory programs. In addition, Class S Shares may be available through certain financial intermediaries who have an agreement with Janus Capital or its affiliates to offer Class S Shares on their supermarket platforms.
Class T Shares are available through certain financial intermediary platforms including, but not limited to, mutual fund wrap fee programs, managed account programs, asset allocation programs, bank trust platforms, as well as certain retirement platforms. In addition, Class T Shares may be available through certain financial intermediaries who have an agreement with Janus Capital or its affiliates to offer Class T Shares on their supermarket platforms.
The following accounting policies have been followed by the Fund and are in conformity with accounting principles generally accepted in the United States of America.
Investment Valuation
Securities held by the Fund are valued in accordance with policies and procedures established by and under the supervision of the Trustees (the “Valuation Procedures”). Equity securities traded on a domestic securities exchange are
22 | SEPTEMBER 30, 2018 |
Janus Henderson Contrarian Fund
Notes to Financial Statements
generally valued at the closing prices on the primary market or exchange on which they trade. If such price is lacking for the trading period immediately preceding the time of determination, such securities are valued at their current bid price. Equity securities that are traded on a foreign exchange are generally valued at the closing prices on such markets. In the event that there is no current trading volume on a particular security in such foreign exchange, the bid price from the primary exchange is generally used to value the security. Securities that are traded on the over-the-counter (“OTC”) markets are generally valued at their closing or latest bid prices as available. Foreign securities and currencies are converted to U.S. dollars using the applicable exchange rate in effect at the close of the New York Stock Exchange (“NYSE”). The Fund will determine the market value of individual securities held by it by using prices provided by one or more approved professional pricing services or, as needed, by obtaining market quotations from independent broker-dealers. Most debt securities are valued in accordance with the evaluated bid price supplied by the pricing service that is intended to reflect market value. The evaluated bid price supplied by the pricing service is an evaluation that may consider factors such as security prices, yields, maturities and ratings. Certain short-term securities maturing within 60 days or less may be evaluated and valued on an amortized cost basis provided that the amortized cost determined approximates market value. Securities for which market quotations or evaluated prices are not readily available or deemed unreliable are valued at fair value determined in good faith under the Valuation Procedures. Circumstances in which fair value pricing may be utilized include, but are not limited to: (i) a significant event that may affect the securities of a single issuer, such as a merger, bankruptcy, or significant issuer-specific development; (ii) an event that may affect an entire market, such as a natural disaster or significant governmental action; (iii) a nonsignificant event such as a market closing early or not opening, or a security trading halt; and (iv) pricing of a nonvalued security and a restricted or nonpublic security. Special valuation considerations may apply with respect to “odd-lot” fixed-income transactions which, due to their small size, may receive evaluated prices by pricing services which reflect a large block trade and not what actually could be obtained for the odd-lot position. The Fund uses systematic fair valuation models provided by independent third parties to value international equity securities in order to adjust for stale pricing, which may occur between the close of certain foreign exchanges and the close of the NYSE.
Valuation Inputs Summary
FASB ASC 820, Fair Value Measurements and Disclosures (“ASC 820”), defines fair value, establishes a framework for measuring fair value, and expands disclosure requirements regarding fair value measurements. This standard emphasizes that fair value is a market-based measurement that should be determined based on the assumptions that market participants would use in pricing an asset or liability and establishes a hierarchy that prioritizes inputs to valuation techniques used to measure fair value. These inputs are summarized into three broad levels:
Level 1 – Unadjusted quoted prices in active markets the Fund has the ability to access for identical assets or liabilities.
Level 2 – Observable inputs other than unadjusted quoted prices included in Level 1 that are observable for the asset or liability either directly or indirectly. These inputs may include quoted prices for the identical instrument on an inactive market, prices for similar instruments, interest rates, prepayment speeds, credit risk, yield curves, default rates and similar data.
Assets or liabilities categorized as Level 2 in the hierarchy generally include: debt securities fair valued in accordance with the evaluated bid or ask prices supplied by a pricing service; securities traded on OTC markets and listed securities for which no sales are reported that are fair valued at the latest bid price (or yield equivalent thereof) obtained from one or more dealers transacting in a market for such securities or by a pricing service approved by the Fund’s Trustees; certain short-term debt securities with maturities of 60 days or less that are fair valued at amortized cost; and equity securities of foreign issuers whose fair value is determined by using systematic fair valuation models provided by independent third parties in order to adjust for stale pricing which may occur between the close of certain foreign exchanges and the close of the NYSE. Other securities that may be categorized as Level 2 in the hierarchy include, but are not limited to, preferred stocks, bank loans, swaps, investments in unregistered investment companies, options, and forward contracts.
Level 3 – Unobservable inputs for the asset or liability to the extent that relevant observable inputs are not available, representing the Fund’s own assumptions about the assumptions that a market participant would use in valuing the asset or liability, and that would be based on the best information available.
There have been no significant changes in valuation techniques used in valuing any such positions held by the Fund since the beginning of the fiscal year.
Janus Investment Fund | 23 |
Janus Henderson Contrarian Fund
Notes to Financial Statements
The inputs or methodology used for fair valuing securities are not necessarily an indication of the risk associated with investing in those securities. The summary of inputs used as of September 30, 2018 to fair value the Fund’s investments in securities and other financial instruments is included in the “Valuation Inputs Summary” in the Notes to Schedule of Investments and Other Information.
The Fund did not hold a significant amount of Level 3 securities as of September 30, 2018.
The Fund recognizes transfers between the levels as of the beginning of the fiscal year. The following describes the amounts of transfers between Level 1, Level 2 and Level 3 of the fair value hierarchy during the year.
Financial assets of $16,008,578 were transferred out of Level 3 to Level 2 since certain security’s prices were determined using other significant observable inputs at the end of the current fiscal year and significant unobservable inputs at the end of the prior fiscal year.
Investment Transactions and Investment Income
Investment transactions are accounted for as of the date purchased or sold (trade date). Dividend income is recorded on the ex-dividend date. Certain dividends from foreign securities will be recorded as soon as the Fund is informed of the dividend, if such information is obtained subsequent to the ex-dividend date. Dividends from foreign securities may be subject to withholding taxes in foreign jurisdictions. Interest income is recorded on the accrual basis and includes amortization of premiums and accretion of discounts. Gains and losses are determined on the identified cost basis, which is the same basis used for federal income tax purposes. Income, as well as gains and losses, both realized and unrealized, are allocated daily to each class of shares based upon the ratio of net assets represented by each class as a percentage of total net assets.
Expenses
The Fund bears expenses incurred specifically on its behalf. Each class of shares bears a portion of general expenses, which are allocated daily to each class of shares based upon the ratio of net assets represented by each class as a percentage of total net assets. Expenses directly attributable to a specific class of shares are charged against the operations of such class.
Estimates
The preparation of financial statements in conformity with accounting principles generally accepted in the United States of America requires management to make estimates and assumptions that affect the reported amount of assets and liabilities and disclosure of contingent assets and liabilities at the date of the financial statements, and the reported amounts of income and expenses during the reporting period. Actual results could differ from those estimates.
Indemnifications
In the normal course of business, the Fund may enter into contracts that contain provisions for indemnification of other parties against certain potential liabilities. The Fund’s maximum exposure under these arrangements is unknown, and would involve future claims that may be made against the Fund that have not yet occurred. Currently, the risk of material loss from such claims is considered remote.
Foreign Currency Translations
The Fund does not isolate that portion of the results of operations resulting from the effect of changes in foreign exchange rates on investments from the fluctuations arising from changes in market prices of securities held at the date of the financial statements. Net unrealized appreciation or depreciation of investments and foreign currency translations arise from changes in the value of assets and liabilities, including investments in securities held at the date of the financial statements, resulting from changes in the exchange rates and changes in market prices of securities held.
Currency gains and losses are also calculated on payables and receivables that are denominated in foreign currencies. The payables and receivables are generally related to foreign security transactions and income translations.
Foreign currency-denominated assets and forward currency contracts may involve more risks than domestic transactions, including currency risk, counterparty risk, political and economic risk, regulatory risk and equity risk. Risks may arise from unanticipated movements in the value of foreign currencies relative to the U.S. dollar.
Dividends and Distributions
The Fund generally declares and distributes dividends of net investment income and realized capital gains (if any) annually. The Fund may treat a portion of the amount paid to redeem shares as a distribution of investment company
24 | SEPTEMBER 30, 2018 |
Janus Henderson Contrarian Fund
Notes to Financial Statements
taxable income and realized capital gains that are reflected in the net asset value. This practice, commonly referred to as “equalization,” has no effect on the redeeming shareholder or a Fund’s total return, but may reduce the amounts that would otherwise be required to be paid as taxable dividends to the remaining shareholders. It is possible that the Internal Revenue Service (IRS) could challenge the Funds’ equalization methodology or calculations, and any such challenge could result in additional tax, interest, or penalties to be paid by the Fund.
The Fund may make certain investments in real estate investment trusts (“REITs”) which pay dividends to their shareholders based upon funds available from operations. It is quite common for these dividends to exceed the REITs’ taxable earnings and profits, resulting in the excess portion of such dividends being designated as a return of capital. If the Fund distributes such amounts, such distributions could constitute a return of capital to shareholders for federal income tax purposes.
Federal Income Taxes
The Fund intends to continue to qualify as a regulated investment company and distribute all of its taxable income in accordance with the requirements of Subchapter M of the Internal Revenue Code. Management has analyzed the Fund’s tax positions taken for all open federal income tax years, generally a three-year period, and has concluded that no provision for federal income tax is required in the Fund’s financial statements. The Fund is not aware of any tax positions for which it is reasonably possible that the total amounts of unrecognized tax benefits will significantly change in the next twelve months.
On December 22, 2017, the Tax Cuts and Jobs Act was signed into law. Currently, Management does not believe the bill will have a material impact on the Fund’s intention to continue to qualify as a regulated investment company, which is generally not subject to U.S. federal income tax.
2. Derivative Instruments
The Fund may invest in various types of derivatives, which may at times result in significant derivative exposure. A derivative is a financial instrument whose performance is derived from the performance of another asset. The Fund may invest in derivative instruments including, but not limited to: futures contracts, put options, call options, options on future contracts, options on foreign currencies, options on recovery locks, options on security and commodity indices, swaps, forward contracts, structured investments, and other equity-linked derivatives. Each derivative instrument that was held by the Fund during the year ended September 30, 2018 is discussed in further detail below. A summary of derivative activity by the Fund is reflected in the tables at the end of the Schedule of Investments.
The Fund may use derivative instruments for hedging purposes (to offset risks associated with an investment, currency exposure, or market conditions), to adjust currency exposure relative to a benchmark index, or for speculative purposes (to earn income and seek to enhance returns). When the Fund invests in a derivative for speculative purposes, the Fund will be fully exposed to the risks of loss of that derivative, which may sometimes be greater than the derivative’s cost. The Fund may not use any derivative to gain exposure to an asset or class of assets that it would be prohibited by its investment restrictions from purchasing directly. The Fund’s ability to use derivative instruments may also be limited by tax considerations.
Investments in derivatives in general are subject to market risks that may cause their prices to fluctuate over time. Investments in derivatives may not directly correlate with the price movements of the underlying instrument. As a result, the use of derivatives may expose the Fund to additional risks that it would not be subject to if it invested directly in the securities underlying those derivatives. The use of derivatives may result in larger losses or smaller gains than otherwise would be the case. Derivatives can be volatile and may involve significant risks.
In pursuit of its investment objective, the Fund may seek to use derivatives to increase or decrease exposure to the following market risk factors:
· Commodity Risk – the risk related to the change in value of commodities or commodity-linked investments due to changes in the overall market movements, volatility of the underlying benchmark, changes in interest rates, or other factors affecting a particular industry or commodity such as drought, floods, weather, livestock disease, embargoes, tariffs, and international economic, political, and regulatory developments.
· Counterparty Risk – the risk that the counterparty (the party on the other side of the transaction) on a derivative transaction will be unable to honor its financial obligation to the Fund.
Janus Investment Fund | 25 |
Janus Henderson Contrarian Fund
Notes to Financial Statements
· Credit Risk – the risk an issuer will be unable to make principal and interest payments when due, or will default on its obligations.
· Currency Risk – the risk that changes in the exchange rate between currencies will adversely affect the value (in U.S. dollar terms) of an investment.
· Equity Risk – the risk related to the change in value of equity securities as they relate to increases or decreases in the general market.
· Index Risk – if the derivative is linked to the performance of an index, it will be subject to the risks associated with changes in that index. If the index changes, the Fund could receive lower interest payments or experience a reduction in the value of the derivative to below what the Fund paid. Certain indexed securities, including inverse securities (which move in an opposite direction to the index), may create leverage, to the extent that they increase or decrease in value at a rate that is a multiple of the changes in the applicable index.
· Interest Rate Risk – the risk that the value of fixed-income securities will generally decline as prevailing interest rates rise, which may cause the Fund’s NAV to likewise decrease.
· Leverage Risk – the risk associated with certain types of leveraged investments or trading strategies pursuant to which relatively small market movements may result in large changes in the value of an investment. The Fund creates leverage by investing in instruments, including derivatives, where the investment loss can exceed the original amount invested. Certain investments or trading strategies, such as short sales, that involve leverage can result in losses that greatly exceed the amount originally invested.
· Liquidity Risk – the risk that certain securities may be difficult or impossible to sell at the time that the seller would like or at the price that the seller believes the security is currently worth.
Derivatives may generally be traded OTC or on an exchange. Derivatives traded OTC are agreements that are individually negotiated between parties and can be tailored to meet a purchaser’s needs. OTC derivatives are not guaranteed by a clearing agency and may be subject to increased credit risk.
In an effort to mitigate credit risk associated with derivatives traded OTC, the Fund may enter into collateral agreements with certain counterparties whereby, subject to certain minimum exposure requirements, the Fund may require the counterparty to post collateral if the Fund has a net aggregate unrealized gain on all OTC derivative contracts with a particular counterparty. Additionally, the Fund may deposit cash and/or treasuries as collateral with the counterparty and/or custodian daily (based on the daily valuation of the financial asset) if the Fund has a net aggregate unrealized loss on OTC derivative contracts with a particular counterparty. All liquid securities and restricted cash are considered to cover in an amount at all times equal to or greater than the Fund’s commitment with respect to certain exchange-traded derivatives, centrally cleared derivatives, forward foreign currency exchange contracts, short sales, and/or securities with extended settlement dates. There is no guarantee that counterparty exposure is reduced and these arrangements are dependent on Janus Capital's ability to establish and maintain appropriate systems and trading.
Forward Foreign Currency Exchange Contracts
A forward foreign currency exchange contract (“forward currency contract”) is an obligation to buy or sell a specified currency at a future date at a negotiated rate (which may be U.S. dollars or a foreign currency). The Fund may enter into forward currency contracts for hedging purposes, including, but not limited to, reducing exposure to changes in foreign currency exchange rates on foreign portfolio holdings and locking in the U.S. dollar cost of firm purchase and sale commitments for securities denominated in or exposed to foreign currencies. The Fund may also invest in forward currency contracts for non-hedging purposes such as seeking to enhance returns. The Fund is subject to currency risk and counterparty risk in the normal course of pursuing its investment objective through its investments in forward currency contracts.
Forward currency contracts are valued by converting the foreign value to U.S. dollars by using the current spot U.S. dollar exchange rate and/or forward rate for that currency. Exchange and forward rates as of the close of the NYSE shall be used to value the forward currency contracts. The unrealized appreciation/(depreciation) for forward currency contracts is reported in the Statement of Assets and Liabilities as a receivable or payable and in the Statement of Operations for the change in unrealized net appreciation/depreciation (if applicable). The gain or loss arising from the difference between the U.S. dollar cost of the original contract and the value of the foreign currency in U.S. dollars upon closing a forward currency contract is reported on the Statement of Operations (if applicable).
26 | SEPTEMBER 30, 2018 |
Janus Henderson Contrarian Fund
Notes to Financial Statements
During the year, the Fund entered into forward currency contracts with the obligation to sell foreign currencies in the future at an agreed upon rate in order to decrease exposure to currency risk associated with foreign currency denominated securities held by the Fund.
There were no forward currency contracts held at September 30, 2018.
3. Other Investments and Strategies
Additional Investment Risk
The financial crisis in both the U.S. and global economies over the past several years has resulted, and may continue to result, in a significant decline in the value and liquidity of many securities of issuers worldwide in the equity and fixed-income/credit markets. In response to the crisis, the United States and certain foreign governments, along with the U.S. Federal Reserve and certain foreign central banks, took steps to support the financial markets. The withdrawal of this support, a failure of measures put in place to respond to the crisis, or investor perception that such efforts were not sufficient could each negatively affect financial markets generally, and the value and liquidity of specific securities. In addition, policy and legislative changes in the United States and in other countries continue to impact many aspects of financial regulation. The effect of these changes on the markets, and the practical implications for market participants, including the Fund, may not be fully known for some time. As a result, it may also be unusually difficult to identify both investment risks and opportunities, which could limit or preclude the Fund’s ability to achieve its investment objective. Therefore, it is important to understand that the value of your investment may fall, sometimes sharply, and you could lose money.
The enactment of the Dodd-Frank Wall Street Reform and Consumer Protection Act (the “Dodd-Frank Act”) of 2010 provided for widespread regulation of financial institutions, consumer financial products and services, broker-dealers, OTC derivatives, investment advisers, credit rating agencies, and mortgage lending, which expanded federal oversight in the financial sector, including the investment management industry. Many provisions of the Dodd-Frank Act remain pending and will be implemented through future rulemaking. Therefore, the ultimate impact of the Dodd-Frank Act and the regulations under the Dodd-Frank Act on the Fund and the investment management industry as a whole, is not yet certain.
A number of countries in the European Union (“EU”) have experienced, and may continue to experience, severe economic and financial difficulties. In particular, many EU nations are susceptible to economic risks associated with high levels of debt, notably due to investments in sovereign debt of countries such as Greece, Italy, Spain, Portugal, and Ireland. Many non-governmental issuers, and even certain governments, have defaulted on, or been forced to restructure, their debts. Many other issuers have faced difficulties obtaining credit or refinancing existing obligations. Financial institutions have in many cases required government or central bank support, have needed to raise capital, and/or have been impaired in their ability to extend credit. As a result, financial markets in the EU experienced extreme volatility and declines in asset values and liquidity. Responses to these financial problems by European governments, central banks, and others, including austerity measures and reforms, may not work, may result in social unrest, and may limit future growth and economic recovery or have other unintended consequences. Further defaults or restructurings by governments and others of their debt could have additional adverse effects on economies, financial markets, and asset valuations around the world. Greece, Ireland, and Portugal have already received one or more "bailouts" from other Eurozone member states, and it is unclear how much additional funding they will require or if additional Eurozone member states will require bailouts in the future. The risk of investing in securities in the European markets may also be heightened due to the referendum in which the United Kingdom voted to exit the EU (known as “Brexit”). There is considerable uncertainty about how Brexit will be conducted, how negotiations of necessary treaties and trade agreements will proceed, or how financial markets will react. In addition, one or more other countries may also abandon the euro and/or withdraw from the EU, placing its currency and banking system in jeopardy.
Certain areas of the world have historically been prone to and economically sensitive to environmental events such as, but not limited to, hurricanes, earthquakes, typhoons, flooding, tidal waves, tsunamis, erupting volcanoes, wildfires or droughts, tornadoes, mudslides, or other weather-related phenomena. Such disasters, and the resulting physical or economic damage, could have a severe and negative impact on the Fund’s investment portfolio and, in the longer term, could impair the ability of issuers in which the Fund invests to conduct their businesses as they would under normal conditions. Adverse weather conditions may also have a particularly significant negative effect on issuers in the agricultural sector and on insurance companies that insure against the impact of natural disasters.
Janus Investment Fund | 27 |
Janus Henderson Contrarian Fund
Notes to Financial Statements
Counterparties
Fund transactions involving a counterparty are subject to the risk that the counterparty or a third party will not fulfill its obligation to the Fund (“counterparty risk”). Counterparty risk may arise because of the counterparty’s financial condition (i.e., financial difficulties, bankruptcy, or insolvency), market activities and developments, or other reasons, whether foreseen or not. A counterparty’s inability to fulfill its obligation may result in significant financial loss to the Fund. The Fund may be unable to recover its investment from the counterparty or may obtain a limited recovery, and/or recovery may be delayed. The extent of the Fund’s exposure to counterparty risk with respect to financial assets and liabilities approximates its carrying value. See the "Offsetting Assets and Liabilities" section of this Note for further details.
The Fund may be exposed to counterparty risk through participation in various programs, including, but not limited to, lending its securities to third parties, cash sweep arrangements whereby the Fund’s cash balance is invested in one or more types of cash management vehicles, as well as investments in, but not limited to, repurchase agreements, debt securities, and derivatives, including various types of swaps, futures and options. The Fund intends to enter into financial transactions with counterparties that Janus Capital believes to be creditworthy at the time of the transaction. There is always the risk that Janus Capital’s analysis of a counterparty’s creditworthiness is incorrect or may change due to market conditions. To the extent that the Fund focuses its transactions with a limited number of counterparties, it will have greater exposure to the risks associated with one or more counterparties.
Offsetting Assets and Liabilities
The Fund presents gross and net information about transactions that are either offset in the financial statements or subject to an enforceable master netting arrangement or similar agreement with a designated counterparty, regardless of whether the transactions are actually offset in the Statement of Assets and Liabilities.
The following table presents gross amounts of recognized assets and/or liabilities and the net amounts after deducting collateral that has been pledged by counterparties or has been pledged to counterparties (if applicable). For corresponding information grouped by type of instrument, see the Fund's Schedule of Investments.
Offsetting of Financial Assets and Derivative Assets | |||||||||
Gross Amounts | |||||||||
of Recognized | Offsetting Asset | Collateral | |||||||
Counterparty | Assets | or Liability(a) | Pledged(b) | Net Amount | |||||
Deutsche Bank AG | $ | 3,208,530 | $ | — | $ | (3,208,530) | $ | — | |
(a) | Represents the amount of assets or liabilities that could be offset with the same counterparty under master netting or similar agreements that management elects not to offset on the Statement of Assets and Liabilities. | ||||||||
(b) | Collateral pledged is limited to the net outstanding amount due to/from an individual counterparty. The actual collateral amounts pledged may exceed these amounts and may fluctuate in value. | ||||||||
Deutsche Bank AG acts as securities lending agent and a limited purpose custodian or subcustodian to receive and disburse cash balances and cash collateral, hold short-term investments, hold collateral, and perform other custodian functions in accordance with the Agency Securities Lending and Repurchase Agreement. Securities on loan will be continuously secured by collateral which may consist of cash, U.S. Government securities, domestic and foreign short-term debt instruments, letters of credit, time deposits, repurchase agreements, money market mutual funds or other money market accounts, or such other collateral as permitted by the SEC. The value of the collateral must be at least 102% of the market value of the loaned securities that are denominated in U.S. dollars and 105% of the market value of the loaned securities that are not denominated in U.S. dollars. Upon receipt of cash collateral, Janus Capital intends to invest the cash collateral in a cash management vehicle for which Janus Capital serves as investment adviser, Janus Henderson Cash Collateral Fund LLC. Loaned securities and related collateral are marked-to-market each business day based upon the market value of the loaned securities at the close of business, employing the most recent available pricing information. Collateral levels are then adjusted based on this mark-to-market evaluation.
Real Estate Investing
The Fund may invest in equity and debt securities of real estate-related companies. Such companies may include those in the real estate industry or real estate-related industries. These securities may include common stocks, corporate bonds, preferred stocks, and other equity securities, including, but not limited to, mortgage-backed securities, real estate-backed securities, securities of REITs and similar REIT-like entities. A REIT is a trust that invests in real estate-
28 | SEPTEMBER 30, 2018 |
Janus Henderson Contrarian Fund
Notes to Financial Statements
related projects, such as properties, mortgage loans, and construction loans. REITs are generally categorized as equity, mortgage, or hybrid REITs. A REIT may be listed on an exchange or traded OTC.
Restricted Security Transactions
Restricted securities held by the Fund may not be sold except in exempt transactions or in a public offering registered under the Securities Act of 1933, as amended. The risk of investing in such securities is generally greater than the risk of investing in the securities of widely held, publicly traded companies. Lack of a secondary market and resale restrictions may result in the inability of the Fund to sell a security at a fair price and may substantially delay the sale of the security. In addition, these securities may exhibit greater price volatility than securities for which secondary markets exist.
Securities Lending
Under procedures adopted by the Trustees, the Fund may seek to earn additional income by lending securities to certain qualified broker-dealers and institutions. Deutsche Bank AG acts as securities lending agent and a limited purpose custodian or subcustodian to receive and disburse cash balances and cash collateral, hold short-term investments, hold collateral, and perform other custodian functions in accordance with the Agency Securities Lending and Repurchase Agreement. The Fund may lend portfolio securities in an amount equal to up to 1/3 of its total assets as determined at the time of the loan origination. There is the risk of delay in recovering a loaned security or the risk of loss in collateral rights if the borrower fails financially. In addition, Janus Capital makes efforts to balance the benefits and risks from granting such loans. All loans will be continuously secured by collateral which may consist of cash, U.S. Government securities, domestic and foreign short-term debt instruments, letters of credit, time deposits, repurchase agreements, money market mutual funds or other money market accounts, or such other collateral as permitted by the SEC. If the Fund is unable to recover a security on loan, the Fund may use the collateral to purchase replacement securities in the market. There is a risk that the value of the collateral could decrease below the cost of the replacement security by the time the replacement investment is made, resulting in a loss to the Fund.
Upon receipt of cash collateral, Janus Capital may invest it in affiliated or non-affiliated cash management vehicles, whether registered or unregistered entities, as permitted by the 1940 Act and rules promulgated thereunder. Janus Capital currently intends to invest the cash collateral in a cash management vehicle for which Janus Capital serves as investment adviser, Janus Henderson Cash Collateral Fund LLC. An investment in Janus Henderson Cash Collateral Fund LLC is generally subject to the same risks that shareholders experience when investing in similarly structured vehicles, such as the potential for significant fluctuations in assets as a result of the purchase and redemption activity of the securities lending program, a decline in the value of the collateral, and possible liquidity issues. Such risks may delay the return of the cash collateral and cause the Fund to violate its agreement to return the cash collateral to a borrower in a timely manner. As adviser to the Fund and Janus Henderson Cash Collateral Fund LLC, Janus Capital has an inherent conflict of interest as a result of its fiduciary duties to both the Fund and Janus Henderson Cash Collateral Fund LLC. Additionally, Janus Capital receives an investment advisory fee of 0.05% for managing Janus Henderson Cash Collateral Fund LLC, but it may not receive a fee for managing certain other affiliated cash management vehicles in which the Fund may invest, and therefore may have an incentive to allocate preferred investment opportunities to investment vehicles for which it is receiving a fee.
The value of the collateral must be at least 102% of the market value of the loaned securities that are denominated in U.S. dollars and 105% of the market value of the loaned securities that are not denominated in U.S. dollars. Loaned securities and related collateral are marked-to-market each business day based upon the market value of the loaned securities at the close of business, employing the most recent available pricing information. Collateral levels are then adjusted based on this mark-to-market evaluation.
The cash collateral invested by Janus Capital is disclosed in the Schedule of Investments (if applicable). Income earned from the investment of the cash collateral, net of rebates paid to, or fees paid by, borrowers and less the fees paid to the lending agent are included as “Affiliated securities lending income, net” on the Statement of Operations. As of September 30, 2018, securities lending transactions accounted for as secured borrowings with an overnight and continuous contractual maturity are $3,208,530 for equity securities. Gross amounts of recognized liabilities for securities lending (collateral received) as of September 30, 2018 is $3,301,625, resulting in the net amount due to the counterparty of $93,095.
Janus Investment Fund | 29 |
Janus Henderson Contrarian Fund
Notes to Financial Statements
4. Investment Advisory Agreements and Other Transactions with Affiliates
The Fund pays Janus Capital an investment advisory fee which is calculated daily and paid monthly. The Fund’s "base" fee rate prior to any performance adjustment (expressed as an annual rate) is 0.64%.
The investment advisory fee rate is determined by calculating a base fee and applying a performance adjustment. The base fee rate is the same as the contractual investment advisory fee rate. The performance adjustment either increases or decreases the base fee depending on how well the Fund has performed relative to its benchmark index. The Fund's benchmark index used in the calculation is the S&P 500® Index.
The calculation of the performance adjustment applies as follows:
Investment Advisory Fee = Base Fee Rate +/- Performance Adjustment
The investment advisory fee rate paid to Janus Capital by the Fund consists of two components: (1) a base fee calculated by applying the contractual fixed rate of the advisory fee to the Fund’s average daily net assets during the previous month (“Base Fee Rate”), plus or minus (2) a performance-fee adjustment (“Performance Adjustment”) calculated by applying a variable rate of up to 0.15% (positive or negative) to the Fund’s average daily net assets based on the Fund’s relative performance compared to the cumulative investment record of its benchmark index over a 36-month performance measurement period or shorter time period, as applicable.
The Fund’s prospectuses and statement(s) of additional information contain additional information about performance-based fees. The amount shown as advisory fees on the Statement of Operations reflects the Base Fee Rate plus/minus any Performance Adjustment. For the year ended September 30, 2018, the performance adjusted investment advisory fee rate before any waivers and/or reimbursements of expenses is 0.47%.
Janus Capital has contractually agreed to waive the advisory fee payable by the Fund or reimburse expenses in an amount equal to the amount, if any, that the Fund’s total annual fund operating expenses, including the investment advisory fee, but excluding any performance adjustments to management fees (if applicable), the fees payable pursuant to a Rule 12b-1 plan, shareholder servicing fees, such as transfer agency fees (including out-of-pocket costs), administrative services fees and any networking/omnibus/administrative fees payable by any share class, brokerage commissions, interest, dividends, taxes, acquired fund fees and expenses, and extraordinary expenses, exceed the annual rate of 0.83% of the Fund’s average daily net assets. Janus Capital has agreed to continue the waivers until at least February 1, 2019. If applicable, amounts waived and/or reimbursed to the Fund by Janus Capital are disclosed as “Excess Expense Reimbursement and Waivers” on the Statement of Operations.
Janus Services LLC (“Janus Services”), a wholly-owned subsidiary of Janus Capital, is the Fund’s transfer agent. In addition, Janus Services provides or arranges for the provision of certain other administrative services including, but not limited to, recordkeeping, accounting, order processing, and other shareholder services for the Fund. Janus Services is not compensated for its services related to the shares, except for out-of-pocket costs. These amounts are disclosed as “Other transfer agent fees and expenses” on the Statement of Operations.
Certain, but not all, intermediaries may charge administrative fees (such as networking and omnibus) to investors in Class A Shares, Class C Shares, and Class I Shares for administrative services provided on behalf of such investors. These administrative fees are paid by the Class A Shares, Class C Shares, and Class I Shares of the Fund to Janus Services, which uses such fees to reimburse intermediaries. Consistent with the Transfer Agency Agreement between Janus Services and the Fund, Janus Services may negotiate the level, structure, and/or terms of the administrative fees with intermediaries requiring such fees on behalf of the Fund. Janus Capital and its affiliates benefit from an increase in assets that may result from such relationships. The Funds’ Trustees have set limits on fees that the Funds may incur with respect to administrative fees paid for omnibus or networked accounts. Such limits are subject to change by the Trustees in the future. These amounts are disclosed as “Transfer agent networking and omnibus fees” on the Statement of Operations.
The Fund’s Class D Shares pay an administrative services fee at an annual rate of 0.12% of the average daily net assets of Class D Shares for shareholder services provided by Janus Services. Janus Services provides or arranges for the provision of shareholder services including, but not limited to, recordkeeping, accounting, answering inquiries regarding accounts, transaction processing, transaction confirmations, and the mailing of prospectuses and shareholder reports. These amounts are disclosed as “Transfer agent administrative fees and expenses” on the Statement of Operations.
30 | SEPTEMBER 30, 2018 |
Janus Henderson Contrarian Fund
Notes to Financial Statements
Janus Services receives an administrative services fee at an annual rate of up to 0.25% of the average daily net assets of the Fund’s Class R Shares, Class S Shares, and Class T Shares for providing or procuring administrative services to investors in Class R Shares, Class S Shares, and Class T Shares of the Fund. Janus Services expects to use all or a significant portion of this fee to compensate retirement plan service providers, broker-dealers, bank trust departments, financial advisors, and other financial intermediaries for providing these services. Janus Services or its affiliates may also pay fees for services provided by intermediaries to the extent the fees charged by intermediaries exceed the 0.25% of net assets charged to Class R Shares, Class S Shares, and Class T Shares of the Fund. Janus Services may keep certain amounts retained for reimbursement of out-of-pocket costs incurred for servicing clients of Class R Shares, Class S Shares, and Class T Shares. These amounts are disclosed as “Transfer agent administrative fees and expenses” on the Statement of Operations.
Services provided by these financial intermediaries may include, but are not limited to, recordkeeping, subaccounting, order processing, providing order confirmations, periodic statements, forwarding prospectuses, shareholder reports, and other materials to existing customers, answering inquiries regarding accounts, and other administrative services. Order processing includes the submission of transactions through the National Securities Clearing Corporation (“NSCC”) or similar systems, or those processed on a manual basis with Janus Capital. For all share classes, Janus Services also seeks reimbursement for costs it incurs as transfer agent and for providing servicing.
Janus Services is compensated for its services related to the Fund’s Class D Shares. These amounts are disclosed as “Other transfer agent fees and expenses” on the Statement of Operations.
Under a distribution and shareholder servicing plan (the “Plan”) adopted in accordance with Rule 12b-1 under the 1940 Act, the Fund pays the Trust’s distributor, Janus Henderson Distributors, a wholly-owned subsidiary of Janus Capital, a fee for the sale and distribution and/or shareholder servicing of the Shares at an annual rate of up to 0.25% of the Class A Shares’ average daily net assets, of up to 1.00% of the Class C Shares’ average daily net assets, of up to 0.50% of the Class R Shares' average daily net assets, and of up to 0.25% of the Class S Shares’ average daily net assets. Under the terms of the Plan, the Trust is authorized to make payments to Janus Henderson Distributors for remittance to retirement plan service providers, broker-dealers, bank trust departments, financial advisors, and other financial intermediaries, as compensation for distribution and/or shareholder services performed by such entities for their customers who are investors in the Fund. These amounts are disclosed as “12b-1 Distribution and shareholder servicing fees” on the Statement of Operations. Payments under the Plan are not tied exclusively to actual 12b-1 distribution and shareholder service expenses, and the payments may exceed 12b-1 distribution and shareholder service expenses actually incurred. If any of the Fund’s actual 12b-1 distribution and shareholder service expenses incurred during a calendar year are less than the payments made during a calendar year, the Fund will be refunded the difference. Refunds, if any, are included in “12b-1 Distribution and shareholder servicing fees” in the Statement of Operations.
Janus Capital serves as administrator to the Fund pursuant to an administration agreement between Janus Capital and the Trust. Under the administration agreement, Janus Capital is obligated to provide or arrange for the provision of certain administration, compliance, and accounting services to the Fund, including providing office space for the Fund, and is reimbursed by the Fund for certain of its costs in providing these services (to the extent Janus Capital seeks reimbursement and such costs are not otherwise waived). In addition, employees of Janus Capital and/or its affiliates may serve as officers of the Trust. The Fund pays for some or all of the salaries, fees, and expenses of Janus Capital employees and Fund officers, with respect to certain specified administration functions they perform on behalf of the Fund. The Fund pays these costs based on out-of-pocket expenses incurred by Janus Capital, and these costs are separate and apart from advisory fees and other expenses paid in connection with the investment advisory services Janus Capital (or any subadvisor, as applicable) provides to the Fund. These amounts are disclosed as “Affiliated fund administration fees” on the Statement of Operations. In addition, some expenses related to compensation payable to the Fund’s Chief Compliance Officer and certain compliance staff, all of whom are employees of Janus Capital and/or its affiliates, are shared with the Fund. Total compensation of $504,989 was paid to the Chief Compliance Officer and certain compliance staff by the Trust during the year ended September 30, 2018. The Fund's portion is reported as part of “Other expenses” on the Statement of Operations.
Effective April 1, 2018, BNP Paribas Financial Services (“BPFS”) provides certain administrative services to the Fund, including services related to Fund accounting, calculation of the Fund’s daily NAV, and Fund audit, tax, and reporting obligations, pursuant to a sub-administration agreement with Janus Capital on behalf of the Fund. Janus Capital, as administrator, oversees the provision of these services by BPFS. As compensation for such services, Janus Capital pays
Janus Investment Fund | 31 |
Janus Henderson Contrarian Fund
Notes to Financial Statements
BPFS a fee based on a percentage of the Fund’s assets, along with a flat fee, and is reimbursed by the Fund for amounts paid to BPFS (to the extent Janus Capital seeks reimbursement and such costs are not otherwise waived). These amounts are disclosed as part of "Other expenses" on the Statement of Operations.
The Board of Trustees has adopted a deferred compensation plan (the “Deferred Plan”) for independent Trustees to elect to defer receipt of all or a portion of the annual compensation they are entitled to receive from the Fund. All deferred fees are credited to an account established in the name of the Trustees. The amounts credited to the account then increase or decrease, as the case may be, in accordance with the performance of one or more of the Janus Henderson funds that are selected by the Trustees. The account balance continues to fluctuate in accordance with the performance of the selected fund or funds until final payment of all amounts are credited to the account. The fluctuation of the account balance is recorded by the Fund as unrealized appreciation/(depreciation) and is included as of September 30, 2018 on the Statement of Assets and Liabilities in the asset, “Non-interested Trustees’ deferred compensation,” and liability, “Non-interested Trustees’ deferred compensation fees.” Additionally, the recorded unrealized appreciation/(depreciation) is included in “Unrealized net appreciation/(depreciation) of investments, foreign currency translations and non-interested Trustees’ deferred compensation” on the Statement of Assets and Liabilities. Deferred compensation expenses for the year ended September 30, 2018 are included in “Non-interested Trustees’ fees and expenses” on the Statement of Operations. Trustees are allowed to change their designation of mutual funds from time to time. Amounts will be deferred until distributed in accordance with the Deferred Plan. Deferred fees of $496,288 were paid by the Trust to the Trustees under the Deferred Plan during the year ended September 30, 2018.
Pursuant to the provisions of the 1940 Act and related rules, the Fund may participate in an affiliated or nonaffiliated cash sweep program. In the cash sweep program, uninvested cash balances of the Fund may be used to purchase shares of affiliated or nonaffiliated money market funds or cash management pooled investment vehicles. The Fund is eligible to participate in the cash sweep program (the “Investing Funds”). As adviser, Janus Capital has an inherent conflict of interest because of its fiduciary duties to the affiliated money market funds or cash management pooled investment vehicles and the Investing Funds. Janus Henderson Cash Liquidity Fund LLC is an affiliated unregistered cash management pooled investment vehicle that invests primarily in highly-rated short-term fixed-income securities. Janus Henderson Cash Liquidity Fund LLC currently maintains a NAV of $1.00 per share and distributes income daily in a manner consistent with a registered product compliant with Rule 2a-7 under the 1940 Act. There are no restrictions on the Fund's ability to withdraw investments from Janus Henderson Cash Liquidity Fund LLC at will, and there are no unfunded capital commitments due from the Fund to Janus Henderson Cash Liquidity Fund LLC. The units of Janus Henderson Cash Liquidity Fund LLC are not charged any management fee, sales charge or service fee.
Any purchases and sales, realized gains/losses and recorded dividends from affiliated investments during the year ended September 30, 2018 can be found in the “Schedules of Affiliated Investments” located in the Schedule of Investments.
Class A Shares include a 5.75% upfront sales charge of the offering price of the Fund. The sales charge is allocated between Janus Henderson Distributors and financial intermediaries. During the year ended September 30, 2018, Janus Henderson Distributors retained upfront sales charges of $4,385.
A contingent deferred sales charge (“CDSC”) of 1.00% will be deducted with respect to Class A Shares purchased without a sales load and redeemed within 12 months of purchase, unless waived. Any applicable CDSC will be 1.00% of the lesser of the original purchase price or the value of the redemption of the Class A Shares redeemed. There were no CDSCs paid by redeeming shareholders of Class A Shares to Janus Henderson Distributors during the year ended September 30, 2018.
A CDSC of 1.00% will be deducted with respect to Class C Shares redeemed within 12 months of purchase, unless waived. Any applicable CDSC will be 1.00% of the lesser of the original purchase price or the value of the redemption of the Class C Shares redeemed. During the year ended September 30, 2018, redeeming shareholders of Class C Shares paid CDSCs of $514.
As of September 30, 2018, shares of the Fund were owned by affiliates of Janus Henderson Investors, and/or other funds advised by Janus Henderson, as indicated in the table below:
Class | % of Class Owned |
| % of Fund Owned |
| |
Class A Shares | - | % | - | % | |
Class C Shares | - | - |
32 | SEPTEMBER 30, 2018 |
Janus Henderson Contrarian Fund
Notes to Financial Statements
Class D Shares | - | - | |||
Class I Shares | - | - | |||
Class N Shares | 67 | 1 | |||
Class R Shares | - | - | |||
Class S Shares | - | - | |||
Class T Shares | - | - | |||
In addition, other shareholders, including other funds, individuals, accounts, as well as the Fund’s portfolio manager(s) and/or investment personnel, may from time to time own (beneficially or of record) a significant percentage of the Fund’s Shares and can be considered to “control” the Fund when that ownership exceeds 25% of the Fund’s assets (and which may differ from control as determined in accordance with accounting principles generally accepted in the United States of America).
The Fund is permitted to purchase or sell securities (“cross-trade”) between itself and other funds or accounts managed by Janus Capital in accordance with Rule 17a-7 under the Investment Company Act of 1940 (“Rule 17a-7”), when the transaction is consistent with the investment objectives and policies of the Fund and in accordance with the Internal Cross Trade Procedures adopted by the Trust’s Board of Trustees. These procedures have been designed to ensure that any cross-trade of securities by the Fund from or to another fund or account that is or could be considered an affiliate of the Fund under certain limited circumstances by virtue of having a common investment adviser, common Officer, or common Trustee complies with Rule 17a-7. Under these procedures, each cross-trade is effected at the current market price to save costs where allowed. During the year ended September 30, 2018, the Fund engaged in cross trades amounting to $3,008,835 in purchases and $4,751,563 in sales, resulting in a net realized gain of $346,678. The net realized gain is included within the “Net Realized Gain/(Loss) on Investments” section of the Fund’s Statement of Operations.
5. Federal Income Tax
The tax components of capital shown in the table below represent: (1) distribution requirements the Fund must satisfy under the income tax regulations; (2) losses or deductions the Fund may be able to offset against income and gains realized in future years; and (3) unrealized appreciation or depreciation of investments for federal income tax purposes.
Other book to tax differences primarily consist of deferred compensation, derivatives, and foreign currency contract adjustments. The Fund has elected to treat gains and losses on forward foreign currency contracts as capital gains and losses, if applicable. Other foreign currency gains and losses on debt instruments are treated as ordinary income for federal income tax purposes pursuant to Section 988 of the Internal Revenue Code.
Loss Deferrals | Other Book | Net Tax | |||||
Undistributed
| Undistributed | Accumulated | Late-Year
| Post-October | to Tax | Appreciation/ | |
$ 89,769,868 | $ 92,961,834 | $ - | $ - | $ - | $ (43,761) | $389,108,452 | |
During the year ended September 30, 2018, capital loss carryovers of $3,630,703 were utilized by the Fund.
The aggregate cost of investments and the composition of unrealized appreciation and depreciation of investment securities for federal income tax purposes as of September 30, 2018 are noted below. The primary differences between book and tax appreciation or depreciation of investments are wash sale loss deferrals and investments in partnerships.
Federal Tax Cost | Unrealized | Unrealized | Net
Tax Appreciation/ |
$ 2,330,570,134 | $473,179,818 | $(84,071,366) | $ 389,108,452 |
Income and capital gains distributions are determined in accordance with income tax regulations that may differ from accounting principles generally accepted in the United States of America. These differences are due to differing treatments for items such as net short-term gains, deferral of wash sale losses, foreign currency transactions, passive
Janus Investment Fund | 33 |
Janus Henderson Contrarian Fund
Notes to Financial Statements
foreign investment companies, net investment losses, and capital loss carryovers. Certain permanent differences such as tax returns of capital and net investment losses noted below have been reclassified to capital.
For the year ended September 30, 2018 | ||||
Distributions | ||||
From Ordinary Income | From Long-Term Capital Gains | Tax Return of Capital | Net Investment Loss | |
$ 27,021,173 | $ 167,736,084 | $ - | $ - | |
For the year ended September 30, 2017 | ||||
Distributions | ||||
From Ordinary Income | From Long-Term Capital Gains | Tax Return of Capital | Net Investment Loss | |
$ 8,649,158 | $ 98,655,078 | $ - | $ - | |
Permanent book to tax basis differences may result in reclassifications between the components of net assets. These differences have no impact on the results of operations or net assets. The following reclassifications have been made to the Fund:
Increase/(Decrease) to Capital | Increase/(Decrease)
to Undistributed | Increase/(Decrease) to Undistributed
|
$ 547,257 | $ 1,761,546 | $ (2,308,803) |
Capital has been adjusted by $547,262, including $284,732 of long-term capital gain, for distributions in connection with Fund share redemptions (tax equalization).
34 | SEPTEMBER 30, 2018 |
Janus Henderson Contrarian Fund
Notes to Financial Statements
6. Capital Share Transactions
Year ended September 30, 2018 | Year ended September 30, 2017(1) | |||||
Shares | Amount | Shares | Amount | |||
Class A Shares: | ||||||
Shares sold | 163,878 | $ 3,339,177 | 266,100 | $ 5,230,826 | ||
Reinvested dividends and distributions | 43,596 | 825,705 | 72,537 | 1,431,885 | ||
Shares repurchased | (246,836) | (4,938,178) | (2,518,531) | (49,215,084) | ||
Net Increase/(Decrease) | (39,362) | $ (773,296) |
| (2,179,894) | $ (42,552,373) | |
Class C Shares: | ||||||
Shares sold | 43,992 | $ 818,406 | 76,862 | $ 1,440,246 | ||
Reinvested dividends and distributions | 86,158 | 1,530,158 | 57,617 | 1,079,157 | ||
Shares repurchased | (644,770) | (12,118,966) | (1,342,255) | (24,558,184) | ||
Net Increase/(Decrease) | (514,620) | $ (9,770,402) |
| (1,207,776) | $ (22,038,781) | |
Class D Shares: | ||||||
Shares sold | 1,863,725 | $ 37,760,019 | 1,995,023 | $ 39,320,595 | ||
Reinvested dividends and distributions | 6,992,332 | 132,434,739 | 3,548,990 | 70,163,548 | ||
Shares repurchased | (11,244,335) | (225,406,675) | (12,602,849) | (247,176,343) | ||
Net Increase/(Decrease) | (2,388,278) | $(55,211,917) |
| (7,058,836) | $(137,692,200) | |
Class I Shares: | ||||||
Shares sold | 775,122 | $ 15,663,396 | 3,360,618 | $ 66,133,878 | ||
Reinvested dividends and distributions | 211,245 | 4,003,084 | 149,795 | 2,962,946 | ||
Shares repurchased | (2,260,733) | (45,186,889) | (4,772,468) | (92,959,590) | ||
Net Increase/(Decrease) | (1,274,366) | $(25,520,409) |
| (1,262,055) | $ (23,862,766) | |
Class N Shares: | ||||||
Shares sold | 468,821 | $ 9,399,345 | 985,246 | $ 18,869,039 | ||
Reinvested dividends and distributions | 97,020 | 1,833,679 | - | - | ||
Shares repurchased | (304,865) | (6,112,631) | (6,896) | (135,145) | ||
Net Increase/(Decrease) | 260,976 | $ 5,120,393 |
| 978,350 | $ 18,733,894 | |
Class R Shares: | ||||||
Shares sold | 4,582 | $ 88,787 | 10,734 | $ 207,603 | ||
Reinvested dividends and distributions | 2,658 | 49,098 | 1,855 | 35,915 | ||
Shares repurchased | (13,008) | (253,139) | (32,733) | (631,436) | ||
Net Increase/(Decrease) | (5,768) | $ (115,254) |
| (20,144) | $ (387,918) | |
Class S Shares: | ||||||
Shares sold | 13,013 | $ 266,206 | 14,331 | $ 280,026 | ||
Reinvested dividends and distributions | 12,981 | 245,468 | 6,828 | 134,790 | ||
Shares repurchased | (171,192) | (3,592,363) | (46,672) | (885,499) | ||
Net Increase/(Decrease) | (145,198) | $ (3,080,689) |
| (25,513) | $ (470,683) | |
Class T Shares: | ||||||
Shares sold | 2,400,717 | $ 48,704,842 | 2,495,432 | $ 49,053,633 | ||
Reinvested dividends and distributions | 2,517,400 | 47,679,561 | 1,407,698 | 27,816,109 | ||
Shares repurchased | (7,361,090) | (147,407,263) | (10,778,428) | (211,356,676) | ||
Net Increase/(Decrease) | (2,442,973) | $(51,022,860) |
| (6,875,298) | $(134,486,934) | |
(1) | Period from August 4, 2017 (inception date) through September 30, 2017 for Class N Shares. | |||||
7. Purchases and Sales of Investment Securities
For the year ended September 30, 2018, the aggregate cost of purchases and proceeds from sales of investment securities (excluding any short-term securities, short-term options contracts, TBAs, and in-kind transactions, as applicable) was as follows:
Purchases of | Proceeds from Sales | Purchases
of Long- | Proceeds
from Sales |
$1,536,843,015 | $1,812,665,837 | $ - | $ - |
Janus Investment Fund | 35 |
Janus Henderson Contrarian Fund
Notes to Financial Statements
8. Recent Accounting Pronouncements
The Securities and Exchange Commission adopted amendments to Regulation S-X, for the presentation of distributable earnings and distributions to align with US Generally Accepted Accounting Principles (GAAP). The compliance date of the amendments to Regulation S-X is November 5, 2018. This report incorporates the amendments to Regulation S-X.
The FASB issued Accounting Standards Update No. 2017-08, Receivables – Nonrefundable Fees and Other Costs (Subtopic 310-20), Premium Amortization on Purchased Callable Debt Securities ("ASU 2017-08") to amend the amortization period for certain purchased callable debt securities held at a premium. The guidance requires certain premiums on callable debt securities to be amortized to the earliest call date. The amortization period for callable debt securities purchased at a discount will not be impacted. The amendments are effective for fiscal years, and interim periods within those fiscal years, beginning after December 15, 2018. Early adoption is permitted, including adoption in an interim period. Management is currently evaluating the impacts of ASU 2017-08 on the financial statements.
The FASB issued Accounting Standards Update 2018-13, Fair Value Measurement (Topic 820) in August 2018. The new guidance removes, modifies and enhances the disclosures to Topic 820. For public entities, the amendments are effective for financial statements issued for fiscal years beginning after December 15, 2019, and interim periods within those fiscal years. Management is currently evaluating the impact of this new guidance on the financial statements.
9. Subsequent Event
Management has evaluated whether any events or transactions occurred subsequent to September 30, 2018 and through the date of issuance of the Fund’s financial statements and determined that there were no material events or transactions that would require recognition or disclosure in the Fund’s financial statements other than the following:
Effective November 1, 2018, the Fund has adopted an auto-conversion policy pursuant to which Class C Shares that are known by Janus Capital or its affiliates to have been held for ten years will be automatically converted to Class A Shares without the imposition of any sales charge, fee or other charge. The conversion will generally occur no later than ten business days in the month following the month of the tenth anniversary of the date of purchase. Class C Shares purchased through the reinvestment of dividends and other distributions on Class C Shares will convert to Class A Shares at the same time as the Class C Shares with respect to which they were purchased.
36 | SEPTEMBER 30, 2018 |
Janus Henderson Contrarian Fund
Report of Independent Registered Public Accounting Firm
To the Board of Trustees of Janus Investment Fund and Shareholders of Janus Henderson Contrarian Fund:
Opinion on the Financial Statements
We have audited the accompanying statement of assets and liabilities, including the schedule of investments, of Janus Henderson Contrarian Fund (one of the funds constituting Janus Investment Fund, referred to hereafter as the "Fund") as of September 30, 2018, the related statement of operations for the year ended September 30, 2018, the statements of changes in net assets for each of the two years in the period ended September 30, 2018, including the related notes, and the financial highlights for each of the periods indicated therein (collectively referred to as the “financial statements”). In our opinion, the financial statements present fairly, in all material respects, the financial position of the Fund as of September 30, 2018, the results of its operations for the year then ended, the changes in its net assets for each of the two years in the period ended September 30, 2018 and the financial highlights for each of the periods indicated therein in conformity with accounting principles generally accepted in the United States of America.
Basis for Opinion
These financial statements are the responsibility of the Fund’s management. Our responsibility is to express an opinion on the Fund’s financial statements based on our audits. We are a public accounting firm registered with the Public Company Accounting Oversight Board (United States) (“PCAOB”) and are required to be independent with respect to the Fund in accordance with the U.S. federal securities laws and the applicable rules and regulations of the Securities and Exchange Commission and the PCAOB.
We conducted our audits of these financial statements in accordance with the standards of the PCAOB. Those standards require that we plan and perform the audit to obtain reasonable assurance about whether the financial statements are free of material misstatement, whether due to error or fraud.
Our audits included performing procedures to assess the risks of material misstatement of the financial statements, whether due to error or fraud, and performing procedures that respond to those risks. Such procedures included examining, on a test basis, evidence regarding the amounts and disclosures in the financial statements. Our audits also included evaluating the accounting principles used and significant estimates made by management, as well as evaluating the overall presentation of the financial statements. Our procedures included confirmation of securities owned as of September 30, 2018 by correspondence with the custodian, transfer agent, investee companies and brokers; when replies were not received from brokers, we performed other auditing procedures. We believe that our audits provide a reasonable basis for our opinion.

Denver, Colorado
November 16, 2018
We have served as the auditor of one or more investment companies in Janus Henderson Funds since 1990.
Janus Investment Fund | 37 |
Janus Henderson Contrarian Fund
Additional Information (unaudited)
Proxy Voting Policies and Voting Record
A description of the policies and procedures that the Fund uses to determine how to vote proxies relating to its portfolio securities is available without charge: (i) upon request, by calling 1-800-525-1093; (ii) on the Fund’s website at janushenderson.com/proxyvoting; and (iii) on the SEC’s website at http://www.sec.gov. Additionally, information regarding the Fund’s proxy voting record for the most recent twelve-month period ended June 30 is also available, free of charge, through janushenderson.com/proxyvoting and from the SEC’s website at http://www.sec.gov.
Full Holdings
The Fund is required to disclose its complete holdings on Form N-Q within 60 days of the end of the first and third fiscal quarters, and in the annual report and semiannual report to Fund shareholders. These reports (i) are available on the SEC’s website at http://www.sec.gov; (ii) may be reviewed and copied at the SEC’s Public Reference Room in Washington, D.C. (information on the Public Reference Room may be obtained by calling 1-800-SEC-0330); and (iii) are available without charge, upon request, by calling a Janus Henderson representative at 1-877-335-2687 (toll free) (or 1-800-525-3713 if you hold Class D Shares). Portfolio holdings consisting of at least the names of the holdings are generally available on a monthly basis with a 30-day lag. Holdings are generally posted approximately two business days thereafter under Full Holdings for the Fund at janushenderson.com/info (or janushenderson.com/reports if you hold Class D Shares).
APPROVAL OF ADVISORY AGREEMENTS DURING THE PERIOD
The Trustees of Janus Investment Fund and Janus Aspen Series, each of whom serves as an “independent” Trustee (the “Trustees”), oversee the management of each Fund of Janus Investment Fund and each Portfolio of Janus Aspen Series (each, a “Fund” and collectively, the “Funds”), and as required by law, determine annually whether to continue the investment advisory agreement for each Fund and the subadvisory agreements for the 14 Funds that utilize subadvisers.
In connection with their most recent consideration of those agreements for each Fund, the Trustees received and reviewed information provided by Janus Capital and the respective subadvisers in response to requests of the Trustees and their independent legal counsel. They also received and reviewed information and analysis provided by, and in response to requests of, their independent fee consultant. Throughout their consideration of the agreements, the Trustees were advised by their independent legal counsel. The Trustees met with management to consider the agreements, and also met separately in executive session with their independent legal counsel and their independent fee consultant.
Additionally, in connection with their consideration of whether to continue the investment advisory agreement and subadvisory agreement for each Fund, as applicable, the Trustees also received and reviewed information in connection with the transaction to combine the respective businesses of Henderson Group plc and Janus Capital Group, Inc., the parent company of Janus Capital (the “Transaction”), announced in October 2016, which closed in the second quarter of 2017. In this regard, the Trustees reviewed information regarding the impact of the Transaction on the services to be provided by Janus Capital and each subadviser, as applicable, to the Funds under such agreements prior to the close of the Transaction as well as the services provided after the Transaction closed.
At a meeting held on December 7, 2017, based on the Trustees’ evaluation of the information provided by Janus Capital, the subadvisers, and the independent fee consultant, as well as other information, the Trustees determined that the overall arrangements between each Fund and Janus Capital and each subadviser, as applicable, were fair and reasonable in light of the nature, extent and quality of the services provided by Janus Capital, its affiliates and the subadvisers, the fees charged for those services, and other matters that the Trustees considered relevant in the exercise of their business judgment. At that meeting, the Trustees unanimously approved the continuation of the investment advisory agreement for each Fund, and the subadvisory agreement for each subadvised Fund, for the period from February 1, 2018 through February 1, 2019, subject to earlier termination as provided for in each agreement.
In considering the continuation of those agreements, the Trustees reviewed and analyzed various factors that they determined were relevant, including the factors described below, none of which by itself was considered dispositive. However, the material factors and conclusions that formed the basis for the Trustees’ determination to approve the continuation of the agreements are discussed separately below. Also included is a summary of the independent fee consultant’s conclusions and opinions that arose during, and were included as part of, the Trustees’ consideration of the
38 | SEPTEMBER 30, 2018 |
Janus Henderson Contrarian Fund
Additional Information (unaudited)
agreements. “Management fees,” as used herein, reflect actual annual advisory fees and any administration fees (excluding out of pocket costs), net of any waivers.
Nature, Extent and Quality of Services
The Trustees reviewed the nature, extent and quality of the services provided by Janus Capital and the subadvisers to the Funds, taking into account the investment objective, strategies and policies of each Fund, and the knowledge the Trustees gained from their regular meetings with management on at least a quarterly basis and their ongoing review of information related to the Funds. In addition, the Trustees reviewed the resources and key personnel of Janus Capital and each subadviser, particularly noting those employees who provide investment and risk management services to the Funds. The Trustees also considered other services provided to the Funds by Janus Capital or the subadvisers, such as managing the execution of portfolio transactions and the selection of broker-dealers for those transactions. The Trustees considered Janus Capital’s role as administrator to the Funds, noting that Janus Capital does not receive a fee for its services but is reimbursed for its out-of-pocket costs. The Trustees considered the role of Janus Capital in monitoring adherence to the Funds’ investment restrictions, providing support services for the Trustees and Trustee committees, and overseeing communications with shareholders and the activities of other service providers, including monitoring compliance with various policies and procedures of the Funds and with applicable securities laws and regulations.
In this regard, the independent fee consultant noted that Janus Capital provides a number of different services for the Funds and Fund shareholders, ranging from investment management services to various other servicing functions, and that, in its opinion, Janus Capital is a capable provider of those services. The independent fee consultant also provided its belief that Janus Capital has developed a number of institutional competitive advantages that should enable it to provide superior investment and service performance over the long term.
The Trustees concluded that the nature, extent and quality of the services provided by Janus Capital or the subadviser to each Fund were appropriate and consistent with the terms of the respective advisory and subadvisory agreements, and that, taking into account steps taken to address those Funds whose performance lagged that of their peers for certain periods, the Funds were likely to benefit from the continued provision of those services. They also concluded that Janus Capital and each subadviser had sufficient personnel, with the appropriate education and experience, to serve the Funds effectively and had demonstrated its ability to attract well-qualified personnel.
Performance of the Funds
The Trustees considered the performance results of each Fund over various time periods. They noted that they considered Fund performance data throughout the year, including periodic meetings with each Fund’s portfolio manager(s), and also reviewed information comparing each Fund’s performance with the performance of comparable funds and peer groups identified by Broadridge Financial Solutions, Inc. (“Broadridge”), an independent data provider, and with the Fund’s benchmark index. In this regard, the independent fee consultant found that the overall Funds’ performance has been strong: for the 36 months ended September 30, 2017, approximately 70% of the Funds were in the top two quartiles of performance, as reported by Morningstar, and for the 12 months ended September 30, 2017, approximately 46% of the Funds were in the top two quartiles of performance, as reported by Morningstar.
The Trustees considered the performance of each Fund, noting that performance may vary by share class, and noted the following:
Alternative Funds
· For Janus Henderson Diversified Alternatives Fund, the Trustees noted that the Fund’s performance was in the second Broadridge quartile for the 36 months ended May 31, 2017 and the second Broadridge quartile for the 12 months ended May 31, 2017.
· For Janus Henderson International Long/Short Equity Fund, the Trustees noted that the Fund’s performance was in the bottom Broadridge quartile for the 12 months ended May 31, 2017. The Trustees noted the reasons for the Fund’s underperformance, the steps Janus Capital had taken or was taking to improve performance, and the Fund’s limited performance history.
Asset Allocation Funds
· For Janus Henderson Global Allocation Fund – Conservative, the Trustees noted that the Fund’s performance was in the bottom Broadridge quartile for the 36 months ended May 31, 2017 and the second Broadridge
Janus Investment Fund | 39 |
Janus Henderson Contrarian Fund
Additional Information (unaudited)
quartile for the 12 months ended May 31, 2017. The Trustees noted the reasons for the Fund’s underperformance, the steps Janus Capital had taken or was taking to improve performance, and that the performance trend was improving.
· For Janus Henderson Global Allocation Fund – Growth, the Trustees noted that the Fund’s performance was in the bottom Broadridge quartile for the 36 months ended May 31, 2017 and the second Broadridge quartile for the 12 months ended May 31, 2017. The Trustees noted the reasons for the Fund’s underperformance, the steps Janus Capital had taken or was taking to improve performance, and that the performance trend was improving.
· For Janus Henderson Global Allocation Fund – Moderate, the Trustees noted that the Fund’s performance was in the bottom Broadridge quartile for the 36 months ended May 31, 2017 and the third Broadridge quartile for the 12 months ended May 31, 2017. The Trustees noted the reasons for the Fund’s underperformance and the steps Janus Capital had taken or was taking to improve performance.
Fixed-Income Funds
· For Janus Henderson Flexible Bond Fund, the Trustees noted that the Fund’s performance was in the bottom Broadridge quartile for the 36 months ended May 31, 2017 and the bottom Broadridge quartile for the 12 months ended May 31, 2017. The Trustees noted the reasons for the Fund’s underperformance and the steps Janus Capital had taken or was taking to improve performance.
· For Janus Henderson Global Bond Fund, the Trustees noted that the Fund’s performance was in the third Broadridge quartile for the 36 months ended May 31, 2017 and the bottom Broadridge quartile for the 12 months ended May 31, 2017. The Trustees noted the reasons for the Fund’s underperformance and the steps Janus Capital had taken or was taking to improve performance.
· For Janus Henderson Global Unconstrained Bond Fund, the Trustees noted that the Fund’s performance was in the third Broadridge quartile for the 36 months ended May 31, 2017 and the bottom Broadridge quartile for the 12 months ended May 31, 2017. The Trustees noted the reasons for the Fund’s underperformance and the steps Janus Capital had taken or was taking to improve performance.
· For Janus Henderson High-Yield Fund, the Trustees noted that the Fund’s performance was in the second Broadridge quartile for the 36 months ended May 31, 2017 and the third Broadridge quartile for the 12 months ended May 31, 2017.
· For Janus Henderson Multi-Sector Income Fund, the Trustees noted that the Fund’s performance was in the first Broadridge quartile for the 36 months ended May 31, 2017 and the second Broadridge quartile for the 12 months ended May 31, 2017.
· For Janus Henderson Real Return Fund, the Trustees noted that the Fund’s performance was in the first Broadridge quartile for the 36 months ended May 31, 2017 and the first Broadridge quartile for the 12 months ended May 31, 2017.
· For Janus Henderson Short-Term Bond Fund, the Trustees noted that the Fund’s performance was in the third Broadridge quartile for the 36 months ended May 31, 2017 and the third Broadridge quartile for the 12 months ended May 31, 2017. The Trustees noted the reasons for the Fund’s underperformance and the steps Janus Capital had taken or was taking to improve performance.
· For Janus Henderson Strategic Income Fund, the Trustees noted that the Fund’s performance was in the first Broadridge quartile for the 36 months ended May 31, 2017 and the second Broadridge quartile for the 12 months ended May 31, 2017.
Global and International Equity Funds
· For Janus Henderson Asia Equity Fund, the Trustees noted that the Fund’s performance was in the first Broadridge quartile for the 36 months ended May 31, 2017 and the first Broadridge quartile for the 12 months ended May 31, 2017.
40 | SEPTEMBER 30, 2018 |
Janus Henderson Contrarian Fund
Additional Information (unaudited)
· For Janus Henderson Emerging Markets Fund, the Trustees noted that the Fund’s performance was in the first Broadridge quartile for the 36 months ended May 31, 2017 and the third Broadridge quartile for the 12 months ended May 31, 2017.
· For Janus Henderson European Focus Fund, the Trustees noted that the Fund’s performance was in the bottom Broadridge quartile for the 36 months ended May 31, 2017 and the bottom Broadridge quartile for the 12 months ended May 31, 2017. The Trustees noted the reasons for the Fund’s underperformance and the steps Janus Capital had taken or was taking to improve performance.
· For Janus Henderson Global Equity Income Fund, the Trustees noted that the Fund’s performance was in the third Broadridge quartile for the 36 months ended May 31, 2017 and the second Broadridge quartile for the 12 months ended May 31, 2017. The Trustees noted the reasons for the Fund’s underperformance, the steps Janus Capital had taken or was taking to improve performance, and that the performance trend was improving.
· For Janus Henderson Global Life Sciences Fund, the Trustees noted that the Fund’s performance was in the second Broadridge quartile for the 36 months ended May 31, 2017 and the second Broadridge quartile for the 12 months ended May 31, 2017.
· For Janus Henderson Global Real Estate Fund, the Trustees noted that the Fund’s performance was in the second Broadridge quartile for the 36 months ended May 31, 2017 and the first Broadridge quartile for the 12 months ended May 31, 2017.
· For Janus Henderson Global Research Fund, the Trustees noted that the Fund’s performance was in the third Broadridge quartile for the 36 months ended May 31, 2017 and the second Broadridge quartile for the 12 months ended May 31, 2017. The Trustees noted the reasons for the Fund’s underperformance, while also noting that the Fund has a performance fee structure that results in lower management fees during periods of underperformance, the steps Janus Capital had taken or was taking to improve performance, and that the performance trend was improving.
· For Janus Henderson Global Select Fund, the Trustees noted that the Fund’s performance was in the third Broadridge quartile for the 36 months ended May 31, 2017 and the first Broadridge quartile for the 12 months ended May 31, 2017. The Trustees noted the reasons for the Fund’s underperformance, the steps Janus Capital had taken or was taking to improve performance, and that the performance trend was improving.
· For Janus Henderson Global Technology Fund, the Trustees noted that the Fund’s performance was in the third Broadridge quartile for the 36 months ended May 31, 2017 and the third Broadridge quartile for the 12 months ended May 31, 2017. The Trustees noted the reasons for the Fund’s underperformance and the steps Janus Capital had taken or was taking to improve performance.
· For Janus Henderson Global Value Fund, the Trustees noted that the Fund’s performance was in the third Broadridge quartile for the 36 months ended May 31, 2017 and the bottom Broadridge quartile for the 12 months ended May 31, 2017. The Trustees noted the reasons for the Fund’s underperformance, while also noting that the Fund has a performance fee structure that results in lower management fees during periods of underperformance, and the steps Janus Capital and Perkins had taken or were taking to improve performance.
· For Janus Henderson International Opportunities Fund, the Trustees noted that the Fund’s performance was in the second Broadridge quartile for the 36 months ended May 31, 2017 and the bottom Broadridge quartile for the 12 months ended May 31, 2017.
· For Janus Henderson International Small Cap Fund, the Trustees noted that, due to limited performance for the Fund, performance history was not a material factor.
· For Janus Henderson International Value Fund, the Trustees noted that the Fund’s performance was in the third Broadridge quartile for the 36 months ended May 31, 2017 and the bottom Broadridge quartile for the 12 months ended May 31, 2017. The Trustees noted the reasons for the Fund’s underperformance and the steps Janus Capital and Perkins had taken or were taking to improve performance.
· For Janus Henderson Overseas Fund, the Trustees noted that the Fund’s performance was in the bottom Broadridge quartile for the 36 months ended May 31, 2017 and the first Broadridge quartile for the 12 months ended May 31, 2017. The Trustees noted the reasons for the Fund’s underperformance, while also noting that
Janus Investment Fund | 41 |
Janus Henderson Contrarian Fund
Additional Information (unaudited)
the Fund has a performance fee structure that results in lower management fees during periods of underperformance, the steps Janus Capital had taken or was taking to improve performance, and that the performance trend was improving.
Money Market Funds
· For Janus Henderson Government Money Market Fund, the Trustees noted that the Fund’s performance was in the third Broadridge quartile for the 36 months ended May 31, 2017 and the third Broadridge quartile for the 12 months ended May 31, 2017. The Trustees noted the reasons for the Fund’s underperformance.
· For Janus Henderson Money Market Fund, the Trustees noted that the Fund’s performance was in the third Broadridge quartile for the 36 months ended May 31, 2017 and the third Broadridge quartile for the 12 months ended May 31, 2017. The Trustees noted the reasons for the Fund’s underperformance.
Multi-Asset Funds
· For Janus Henderson Adaptive Global Allocation Fund, the Trustees noted that the Fund’s performance was in the second Broadridge quartile for the 12 months ended May 31, 2017.
· For Janus Henderson All Asset Fund, the Trustees noted that the Fund’s performance was in the third Broadridge quartile for the 36 months ended May 31, 2017 and the third Broadridge quartile for the 12 months ended May 31, 2017. The Trustees noted the reasons for the Fund’s underperformance and the steps Janus Capital had taken or was taking to improve performance.
· For Janus Henderson Dividend & Income Builder Fund, the Trustees noted that the Fund’s performance was in the second Broadridge quartile for the 36 months ended May 31, 2017 and the second Broadridge quartile for the 12 months ended May 31, 2017.
· For Janus Henderson Value Plus Income Fund, the Trustees noted that the Fund’s performance was in the second Broadridge quartile for the 36 months ended May 31, 2017 and the second Broadridge quartile for the 12 months ended May 31, 2017.
Multi-Asset U.S. Equity Funds
· For Janus Henderson Balanced Fund, the Trustees noted that the Fund’s performance was in the first Broadridge quartile for the 36 months ended May 31, 2017 and the first Broadridge quartile for the 12 months ended May 31, 2017.
· For Janus Henderson Contrarian Fund, the Trustees noted that the Fund’s performance was in the bottom Broadridge quartile for the 36 months ended May 31, 2017 and the first Broadridge quartile for the 12 months ended May 31, 2017. The Trustees noted the reasons for the Fund’s underperformance, while also noting that the Fund has a performance fee structure that results in lower management fees during periods of underperformance, the steps Janus Capital had taken or was taking to improve performance, and that the performance trend was improving.
· For Janus Henderson Enterprise Fund, the Trustees noted that the Fund’s performance was in the first Broadridge quartile for the 36 months ended May 31, 2017 and the second Broadridge quartile for the 12 months ended May 31, 2017.
· For Janus Henderson Forty Fund, the Trustees noted that the Fund’s performance was in the first Broadridge quartile for the 36 months ended May 31, 2017 and the third Broadridge quartile for the 12 months ended May 31, 2017.
· For Janus Henderson Growth and Income Fund, the Trustees noted that the Fund’s performance was in the second Broadridge quartile for the 36 months ended May 31, 2017 and the first Broadridge quartile for the 12 months ended May 31, 2017.
· For Janus Henderson Research Fund, the Trustees noted that the Fund’s performance was in the second Broadridge quartile for the 36 months ended May 31, 2017 and the third Broadridge quartile for the 12 months ended May 31, 2017.
42 | SEPTEMBER 30, 2018 |
Janus Henderson Contrarian Fund
Additional Information (unaudited)
· For Janus Henderson Triton Fund, the Trustees noted that the Fund’s performance was in the first Broadridge quartile for the 36 months ended May 31, 2017 and the third Broadridge quartile for the 12 months ended May 31, 2017.
· For Janus Henderson U.S. Growth Opportunities Fund, the Trustees noted that the Fund’s performance was in the bottom Broadridge quartile for the 12 months ended May 31, 2017. The Trustees noted the reasons for the Fund’s underperformance, the steps Janus Capital had taken or was taking to improve performance, and the Fund’s limited performance history.
· For Janus Henderson Venture Fund, the Trustees noted that the Fund’s performance was in the first Broadridge quartile for the 36 months ended May 31, 2017 and the bottom Broadridge quartile for the 12 months ended May 31, 2017.
Quantitative Equity Funds
· For Janus Henderson Emerging Markets Managed Volatility Fund, the Trustees noted that the Fund’s performance was in the bottom Broadridge quartile for the 12 months ended May 31, 2017. The Trustees noted the reasons for the Fund’s underperformance, the steps Janus Capital and Intech had taken or were taking to improve performance, and the Fund’s limited performance history.
· For Janus Henderson Global Income Managed Volatility Fund, the Trustees noted that the Fund’s performance was in the first Broadridge quartile for the 36 months ended May 31, 2017 and the third Broadridge quartile for the 12 months ended May 31, 2017.
· For Janus Henderson International Managed Volatility Fund, the Trustees noted that the Fund’s performance was in the third Broadridge quartile for the 36 months ended May 31, 2017 and the bottom Broadridge quartile for the 12 months ended May 31, 2017. The Trustees noted the reasons for the Fund’s underperformance and the steps Janus Capital and Intech had taken or were taking to improve performance.
· For Janus Henderson U.S. Managed Volatility Fund, the Trustees noted that the Fund’s performance was in the second Broadridge quartile for the 36 months ended May 31, 2017 and the bottom Broadridge quartile for the 12 months ended May 31, 2017.
U.S. Equity Funds
· For Janus Henderson Large Cap Value Fund, the Trustees noted that the Fund’s performance was in the third Broadridge quartile for the 36 months ended May 31, 2017 and the bottom Broadridge quartile for the 12 months ended May 31, 2017. The Trustees noted the reasons for the Fund’s underperformance, while also noting that the Fund has a performance fee structure that results in lower management fees during periods of underperformance, and the steps Janus Capital and Perkins had taken or were taking to improve performance.
· For Janus Henderson Mid Cap Value Fund, the Trustees noted that the Fund’s performance was in the second Broadridge quartile for the 36 months ended May 31, 2017 and the second Broadridge quartile for the 12 months ended May 31, 2017.
· For Janus Henderson Select Value Fund, the Trustees noted that the Fund’s performance was in the first Broadridge quartile for the 36 months ended May 31, 2017 and the second Broadridge quartile for the 12 months ended May 31, 2017.
· For Janus Henderson Small Cap Value Fund, the Trustees noted that the Fund’s performance was in the first Broadridge quartile for the 36 months ended May 31, 2017 and the second Broadridge quartile for the 12 months ended May 31, 2017.
Janus Aspen Series
· For Janus Henderson Balanced Portfolio, the Trustees noted that the Fund’s performance was in the first Broadridge quartile for the 36 months ended May 31, 2017 and the first Broadridge quartile for the 12 months ended May 31, 2017.
· For Janus Henderson Enterprise Portfolio, the Trustees noted that the Fund’s performance was in the first Broadridge quartile for the 36 months ended May 31, 2017 and the second Broadridge quartile for the 12 months ended May 31, 2017.
Janus Investment Fund | 43 |
Janus Henderson Contrarian Fund
Additional Information (unaudited)
· For Janus Henderson Flexible Bond Portfolio, the Trustees noted that the Fund’s performance was in the bottom Broadridge quartile for the 36 months ended May 31, 2017 and the bottom Broadridge quartile for the 12 months ended May 31, 2017. The Trustees noted the reasons for the Fund’s underperformance and the steps Janus Capital had taken or was taking to improve performance.
· For Janus Henderson Forty Portfolio, the Trustees noted that the Fund’s performance was in the first Broadridge quartile for the 36 months ended May 31, 2017 and the third Broadridge quartile for the 12 months ended May 31, 2017.
· For Janus Henderson Global Allocation Portfolio – Moderate, the Trustees noted that the Fund’s performance was in the bottom Broadridge quartile for the 36 months ended May 31, 2017 and the second Broadridge quartile for the 12 months ended May 31, 2017. The Trustees noted the reasons for the Fund’s underperformance, the steps Janus Capital had taken or was taking to improve performance, and that the performance trend was improving.
· For Janus Henderson Global Research Portfolio, the Trustees noted that the Fund’s performance was in the third Broadridge quartile for the 36 months ended May 31, 2017 and the third Broadridge quartile for the 12 months ended May 31, 2017. The Trustees noted the reasons for the Fund’s underperformance, while also noting that the Fund has a performance fee structure that results in lower management fees during periods of underperformance, and the steps Janus Capital had taken or was taking to improve performance.
· For Janus Henderson Global Technology Portfolio, the Trustees noted that the Fund’s performance was in the second Broadridge quartile for the 36 months ended May 31, 2017 and the second Broadridge quartile for the 12 months ended May 31, 2017.
· For Janus Henderson Global Unconstrained Bond Portfolio, the Trustees noted that the Fund’s performance was in the bottom Broadridge quartile for the 12 months ended May 31, 2017. The Trustees noted the reasons for the Fund’s underperformance, the steps Janus Capital had taken or was taking to improve performance, and the Fund’s limited performance history.
· For Janus Henderson Mid Cap Value Portfolio, the Trustees noted that the Fund’s performance was in the third Broadridge quartile for the 36 months ended May 31, 2017 and the second Broadridge quartile for the 12 months ended May 31, 2017. The Trustees noted the reasons for the Fund’s underperformance, while also noting that the Fund has a performance fee structure that results in lower management fees during periods of underperformance, the steps Janus Capital and Perkins had taken or were taking to improve performance, and that the performance trend was improving.
· For Janus Henderson Overseas Portfolio, the Trustees noted that the Fund’s performance was in the bottom Broadridge quartile for the 36 months ended May 31, 2017 and the first Broadridge quartile for the 12 months ended May 31, 2017. The Trustees noted the reasons for the Fund’s underperformance, while also noting that the Fund has a performance fee structure that results in lower management fees during periods of underperformance, the steps Janus Capital had taken or was taking to improve performance, and that the performance trend was improving.
· For Janus Henderson Research Portfolio, the Trustees noted that the Fund’s performance was in the second Broadridge quartile for the 36 months ended May 31, 2017 and the third Broadridge quartile for the 12 months ended May 31, 2017.
· For Janus Henderson U.S. Low Volatility Portfolio, the Trustees noted that the Fund’s performance was in the first Broadridge quartile for the 36 months ended May 31, 2017 and the bottom Broadridge quartile for the 12 months ended May 31, 2017.
In consideration of each Fund’s performance, the Trustees concluded that, taking into account the factors relevant to performance, as well as other considerations, including steps taken to improve performance, the Fund’s performance warranted continuation of the Fund’s investment advisory and subadvisory agreement(s).
Costs of Services Provided
The Trustees examined information regarding the fees and expenses of each Fund in comparison to similar information for other comparable funds as provided by Broadridge, an independent data provider. They also reviewed an analysis of
44 | SEPTEMBER 30, 2018 |
Janus Henderson Contrarian Fund
Additional Information (unaudited)
that information provided by their independent fee consultant and noted that the rate of management (investment advisory and any administration, but excluding out-of-pocket costs) fees for many of the Funds, after applicable waivers, was below the average management fee rate of the respective peer group of funds selected by an independent data provider. The Trustees also examined information regarding the subadvisory fees charged for subadvisory services, as applicable, noting that all such fees were paid by Janus Capital out of its management fees collected from such Fund.
The independent fee consultant provided its belief that the management fees charged by Janus Capital to each of the Funds under the current investment advisory and administration agreements are reasonable in relation to the services provided by Janus Capital. The independent fee consultant found: (1) the total expenses and management fees of the Funds to be reasonable relative to other mutual funds; (2) total expenses, on average, were 10% below the average total expenses of their respective Broadridge Expense Group peers and 18% below the average total expenses for their Broadridge Expense Universes; (3) management fees for the Funds, on average, were 8% below the average management fees for their Expense Groups and 9% below the average for their Expense Universes; and (4) Fund expenses at the functional level for each asset and share class category were reasonable. The Trustees also considered the total expenses for each share class of each Fund compared to the average total expenses for its Broadridge Expense Group peers and to average total expenses for its Broadridge Expense Universe.
The independent fee consultant concluded that, based on its strategic review of expenses at the complex, category and individual fund level, Fund expenses were found to be reasonable relative to both Expense Group and Expense Universe benchmarks. Further, for certain Funds, the independent fee consultant also performed a systematic “focus list” analysis of expenses in the context of the performance or service delivered to each set of investors in each share class in each selected Fund. Based on this analysis, the independent fee consultant found that the combination of service quality/performance and expenses on these individual Funds and share classes were reasonable in light of performance trends, performance histories, and existence of performance fees, breakpoints, and expense waivers on such Funds.
The Trustees considered the methodology used by Janus Capital and each subadviser in determining compensation payable to portfolio managers, the competitive environment for investment management talent, and the competitive market for mutual funds in different distribution channels.
The Trustees also reviewed management fees charged by Janus Capital and each subadviser to comparable separate account clients and to comparable non-affiliated funds subadvised by Janus Capital or by a subadviser (for which Janus Capital or the subadviser provides only or primarily portfolio management services). Although in most instances subadvisory and separate account fee rates for various investment strategies were lower than management fee rates for Funds having a similar strategy, the Trustees considered that Janus Capital noted that, under the terms of the management agreements with the Funds, Janus Capital performs significant additional services for the Funds that it does not provide to those other clients, including administration services, oversight of the Funds’ other service providers, trustee support, regulatory compliance and numerous other services, and that, in serving the Funds, Janus Capital assumes many legal risks and other costs that it does not assume in servicing its other clients. Moreover, they noted that the independent fee consultant found that: (1) the management fees Janus Capital charges to the Funds are reasonable in relation to the management fees Janus Capital charges to its institutional clients and to the fees Janus Capital charges to funds subadvised by Janus Capital; (2) these institutional and subadvised accounts have different service and infrastructure needs; (3) Janus mutual fund investors enjoy reasonable fees relative to the fees charged to Janus institutional and subadvised fund investors; (4) in three of seven product categories, the Funds receive proportionally better pricing than the industry in relation to Janus institutional clients; and (5) in seven of eight strategies, Janus Capital has lower management fees than funds subadvised by Janus Capital’s portfolio managers.
The Trustees considered the fees for each Fund for its fiscal year ended in 2016, and noted the following with regard to each Fund’s total expenses, net of applicable fee waivers (the Fund’s “total expenses”):
Alternative Funds
· For Janus Henderson Diversified Alternatives Fund, the Trustees noted that, although the Fund’s total expenses exceeded the peer group average for one share class, overall the Fund’s total expenses were reasonable. The Trustees also noted that Janus Capital has contractually agreed to limit the Fund’s expenses.
· For Janus Henderson International Long/Short Equity Fund, the Trustees noted that, although the Fund’s total expenses exceeded the peer group average for one share class, overall the Fund’s total expenses were
Janus Investment Fund | 45 |
Janus Henderson Contrarian Fund
Additional Information (unaudited)
reasonable. The Trustees also noted that Janus Capital has contractually agreed to limit the Fund’s expenses effective June 5, 2017.
Asset Allocation Funds
· For Janus Henderson Global Allocation Fund – Conservative, the Trustees noted that, although the Fund’s total expenses exceeded the peer group average for certain share classes, overall the Fund’s total expenses were reasonable. The Trustees also noted that Janus Capital has contractually agreed to limit the Fund’s expenses, although this limit did not apply because the Fund’s total expenses were already below the applicable fee limit.
· For Janus Henderson Global Allocation Fund – Growth, the Trustees noted that the Fund’s total expenses were below the peer group average for all share classes.
· For Janus Henderson Global Allocation Fund – Moderate, the Trustees noted that, although the Fund’s total expenses exceeded the peer group average for certain share classes, overall the Fund’s total expenses were reasonable. The Trustees also noted that Janus Capital has contractually agreed to limit the Fund’s expenses.
Fixed-Income Funds
· For Janus Henderson Flexible Bond Fund, the Trustees noted that, although the Fund’s total expenses exceeded the peer group average for certain share classes, overall the Fund’s total expenses were reasonable. The Trustees also noted that Janus Capital has contractually agreed to limit the Fund’s expenses, although this limit did not apply because the Fund’s total expenses were already below the applicable fee limit.
· For Janus Henderson Global Bond Fund, the Trustees noted that, although the Fund’s total expenses exceeded the peer group average for certain share classes, overall the Fund’s total expenses were reasonable. The Trustees also noted that Janus Capital has contractually agreed to limit the Fund’s expenses.
· For Janus Henderson Global Unconstrained Bond Fund, the Trustees noted that the Fund’s performance was in the third Broadridge quartile for the 36 months ended May 31, 2017 and the bottom Broadridge quartile for the 12 months ended May 31, 2017. The Trustees noted the reasons for the Fund’s underperformance and the steps Janus Capital had taken or was taking to improve performance.
· For Janus Henderson High-Yield Fund, the Trustees noted that, although the Fund’s total expenses exceeded the peer group average for certain share classes, overall the Fund’s total expenses were reasonable. The Trustees also noted that Janus Capital has contractually agreed to limit the Fund’s expenses, although this limit did not apply because the Fund’s total expenses were already below the applicable fee limit.
· For Janus Henderson Multi-Sector Income Fund, the Trustees noted that, although the Fund’s total expenses exceeded the peer group average for one share class, overall the Fund’s total expenses were reasonable. The Trustees also noted that Janus Capital has contractually agreed to limit the Fund’s expenses.
· For Janus Henderson Real Return Fund, the Trustees noted that, although the Fund’s total expenses exceeded the peer group average for certain share classes, overall the Fund’s total expenses were reasonable. The Trustees also noted that Janus Capital has contractually agreed to limit the Fund’s expenses.
· For Janus Henderson Short-Term Bond Fund, the Trustees noted that, although the Fund’s total expenses exceeded the peer group average for certain share classes, overall the Fund’s total expenses were reasonable. The Trustees also noted that Janus Capital has contractually agreed to waive 11 basis points of management fees effective February 1, 2018 and also has contractually agreed to limit the Fund’s expenses.
· For Janus Henderson Strategic Income Fund, the Trustees noted that, although the Fund’s total expenses exceeded the peer group average for one share class, overall the Fund’s total expenses were reasonable. The Trustees also noted that Janus Capital has contractually agreed to limit the Fund’s expenses effective June 5, 2017.
Global and International Equity Funds
· For Janus Henderson Asia Equity Fund, the Trustees noted that, although the Fund’s total expenses exceeded the peer group average for certain share classes, overall the Fund’s total expenses were reasonable. The Trustees also noted that Janus Capital has contractually agreed to limit the Fund’s expenses.
46 | SEPTEMBER 30, 2018 |
Janus Henderson Contrarian Fund
Additional Information (unaudited)
· For Janus Henderson Emerging Markets Fund, the Trustees noted that, although the Fund’s total expenses exceeded the peer group average for one share class, overall the Fund’s total expenses were reasonable. The Trustees also noted that Janus Capital has contractually agreed to limit the Fund’s expenses effective June 5, 2017.
· For Janus Henderson European Focus Fund, the Trustees noted that, although the Fund’s total expenses exceeded the peer group average for one share class, overall the Fund’s total expenses were reasonable. The Trustees also noted that Janus Capital has contractually agreed to limit the Fund’s expenses effective June 5, 2017.
· For Janus Henderson Global Equity Income Fund, the Trustees noted that the Fund’s total expenses were below the peer group average for all share classes.
· For Janus Henderson Global Life Sciences Fund, the Trustees noted that the Fund’s total expenses were below the peer group average for all share classes.
· For Janus Henderson Global Real Estate Fund, the Trustees noted that, although the Fund’s total expenses exceeded the peer group average one share class, overall the Fund’s total expenses were reasonable. The Trustees also noted that Janus Capital has contractually agreed to limit the Fund’s expenses, although this limit did not apply because the Fund’s total expenses were already below the applicable fee limit.
· For Janus Henderson Global Research Fund, the Trustees noted that the Fund’s total expenses were below the peer group average for all share classes.
· For Janus Henderson Global Select Fund, the Trustees noted that, although the Fund’s total expenses exceeded the peer group average for one share class, overall the Fund’s total expenses were reasonable. The Trustees also noted that Janus Capital has contractually agreed to limit the Fund’s expenses, although this limit did not apply because the Fund’s total expenses were already below the applicable fee limit.
· For Janus Henderson Global Technology Fund, the Trustees noted that the Fund’s total expenses were below the peer group average for all share classes.
· For Janus Henderson Global Value Fund, the Trustees noted that the Fund’s total expenses were below the peer group average for all share classes.
· For Janus Henderson International Opportunities Fund, the Trustees noted that, although the Fund’s total expenses exceeded the peer group average for certain share classes, overall the Fund’s total expenses were reasonable. The Trustees also noted that Janus Capital has contractually agreed to limit the Fund’s expenses effective June 5, 2017.
· For Janus Henderson International Small Cap Fund, the Trustees noted that, although the Fund’s total expenses exceeded the peer group average for one share class, overall the Fund’s total expenses were reasonable. The Trustees also noted that Janus Capital has contractually agreed to limit the Fund’s expenses effective June 5, 2017.
· For Janus Henderson International Value Fund, the Trustees noted that, although the Fund’s total expenses exceeded the peer group average for one share class, overall the Fund’s total expenses were reasonable. The Trustees also noted that Janus Capital has contractually agreed to limit the Fund’s expenses.
· For Janus Henderson Overseas Fund, the Trustees noted that the Fund’s total expenses were below the peer group average for all share classes.
Money Market Funds
· For Janus Henderson Government Money Market Fund, the Trustees noted that the Fund’s total expenses were below the peer group average for both share classes. In addition, the Trustees considered that Janus Capital voluntarily waives one-half of its advisory fee and other expenses in order to maintain a positive yield.
· For Janus Henderson Money Market Fund, the Trustees noted that the Fund’s total expenses were below the peer group average for both share classes. In addition, the Trustees considered that Janus Capital voluntarily waives one-half of its advisory fee and other expenses in order to maintain a positive yield.
Janus Investment Fund | 47 |
Janus Henderson Contrarian Fund
Additional Information (unaudited)
Multi-Asset Funds
· For Janus Henderson Adaptive Global Allocation Fund, the Trustees noted that, although the Fund’s total expenses exceeded the peer group average for one share class, overall the Fund’s total expenses were reasonable. The Trustees also noted that Janus Capital has contractually agreed to limit the Fund’s expenses.
· For Janus Henderson All Asset Fund, the Trustees noted that, although the Fund’s total expenses exceeded the peer group average for one share class, overall the Fund’s total expenses were reasonable. The Trustees also noted that Janus Capital has contractually agreed to limit the Fund’s total expenses effective June 5, 2017.
· For Janus Henderson Dividend & Income Builder Fund, the Trustees noted that, although the Fund’s total expenses exceeded the peer group average for certain share classes, overall the Fund’s total expenses were reasonable. The Trustees also noted that Janus Capital has contractually agreed to limit the Fund’s expenses effective June 5, 2017.
· For Janus Henderson Value Plus Income Fund, the Trustees noted that the Fund’s total expenses were below the peer group average for all share classes.
Multi-Asset U.S. Equity Funds
· For Janus Henderson Balanced Fund, the Trustees noted that, although the Fund’s total expenses exceeded the peer group average for certain share classes, overall the Fund’s total expenses were reasonable. The Trustees also noted that Janus Capital has contractually agreed to limit the Fund’s expenses, although this limit did not apply because the Fund’s total expenses were already below the applicable fee limit.
· For Janus Henderson Contrarian Fund, the Trustees noted that, although the Fund’s total expenses exceeded the peer group average for one share class, overall the Fund’s total expenses were reasonable. The Trustees also noted that Janus Capital has contractually agreed to limit the Fund’s expenses, although this limit did not apply because the Fund’s total expenses were already below the applicable fee limit.
· For Janus Henderson Enterprise Fund, the Trustees noted that, although the Fund’s total expenses exceeded the peer group average for certain share classes, overall the Fund’s total expenses were reasonable. The Trustees also noted that Janus Capital has contractually agreed to limit the Fund’s expenses, although this limit did not apply because the Fund’s total expenses were already below the applicable fee limit.
· For Janus Henderson Forty Fund, the Trustees noted that, although the Fund’s total expenses exceeded the peer group average for certain share classes, overall the Fund’s total expenses were reasonable. The Trustees also noted that Janus Capital has contractually agreed to limit the Fund’s expenses, although this limit did not apply because the Fund’s total expenses were already below the applicable fee limit.
· For Janus Henderson Growth and Income Fund, the Trustees noted that, although the Fund’s total expenses exceeded the peer group average for certain share classes, overall the Fund’s total expenses were reasonable. The Trustees also noted that Janus Capital has contractually agreed to limit the Fund’s expenses, although this limit did not apply because the Fund’s total expenses were already below the applicable fee limit.
· For Janus Henderson Research Fund, the Trustees noted that, although the Fund’s total expenses were equal to or exceeded the peer group average for certain share classes, overall the Fund’s total expenses were reasonable. The Trustees also noted that Janus Capital has contractually agreed to limit the Fund’s expenses effective February 1, 2017.
· For Janus Henderson Triton Fund, the Trustees noted that the Fund’s total expenses were below the peer group average for all share classes.
· For Janus Henderson U.S. Growth Opportunities Fund, the Trustees noted that, although the Fund’s total expenses exceeded the peer group average for one share class, overall the Fund’s total expenses were reasonable. The Trustees also noted that Janus Capital has contractually agreed to limit the Fund’s expenses effective June 5, 2017.
· For Janus Henderson Venture Fund, the Trustees noted that the Fund’s total expenses were below the peer group average for all share classes.
48 | SEPTEMBER 30, 2018 |
Janus Henderson Contrarian Fund
Additional Information (unaudited)
Quantitative Equity Funds
· For Janus Henderson Emerging Markets Managed Volatility Fund, the Trustees noted that, although the Fund’s total expenses exceeded the peer group average for certain share classes, overall the Fund’s total expenses were reasonable. The Trustees also noted that Janus Capital has contractually agreed to limit the Fund’s expenses.
· For Janus Henderson Global Income Managed Volatility Fund, the Trustees noted that the Fund’s total expenses were below the peer group average for all share classes.
· For Janus Henderson International Managed Volatility Fund, the Trustees noted that, although the Fund’s total expenses exceeded the peer group average for one share class, overall the Fund’s total expenses were reasonable. The Trustees also noted that Janus Capital has contractually agreed to limit the Fund’s expenses.
· For Janus Henderson U.S. Managed Volatility Fund, the Trustees noted that, although the Fund’s total expenses exceeded the peer group average for one share class, overall the Fund’s total expenses were reasonable. The Trustees also noted that Janus Capital has contractually agreed to limit the Fund’s expenses, although this limit did not apply because the Fund’s total expenses were already below the applicable fee limit.
U.S. Equity Funds
· For Janus Henderson Large Cap Value Fund, the Trustees noted that the Fund’s total expenses were below the peer group average for all share classes.
· For Janus Henderson Mid Cap Value Fund, the Trustees noted that the Fund’s total expenses were below the peer group average for all share classes.
· For Janus Henderson Select Value Fund, the Trustees noted that the Fund’s total expenses were below the peer group averages for all share classes.
· For Janus Henderson Small Cap Value Fund, the Trustees noted that, although the Fund’s total expenses exceeded the peer group average for certain share classes, overall the Fund’s total expenses were reasonable. The Trustees also noted that Janus Capital has contractually agreed to limit the Fund’s expenses, although this limit did not apply because the Fund’s total expenses were already below the applicable fee limit.
Janus Aspen Series
· For Janus Henderson Balanced Portfolio, the Trustees noted that, although the Fund’s total expenses exceeded the peer group average for one share class, overall the Fund’s total expenses were reasonable.
· For Janus Henderson Enterprise Portfolio, the Trustees noted that, although the Fund’s total expenses exceeded the peer group average for one share class, overall the Fund’s total expenses were reasonable.
· For Janus Henderson Flexible Bond Portfolio, the Trustees noted that, although the Fund’s total expenses exceeded the peer group average for one share class, overall the Fund’s total expenses were reasonable. The Trustees also noted that Janus Capital has contractually agreed to limit the Fund’s expenses, although this limit did not apply because the Fund’s total expenses were already below the applicable fee limit.
· For Janus Henderson Forty Portfolio, the Trustees noted that, although the Fund’s total expenses exceeded the peer group average for one share class, overall the Fund’s total expenses were reasonable.
· For Janus Henderson Global Allocation Portfolio - Moderate, the Trustees noted that, although the Fund’s total expenses exceeded the peer group average for one share class, overall the Fund’s total expenses were reasonable. The Trustees also noted that Janus Capital has contractually agreed to limit the Fund’s expenses.
· For Janus Henderson Global Research Portfolio, the Trustees noted that the Fund’s total expenses were below the peer group average for both share classes.
· For Janus Henderson Global Technology Portfolio, the Trustees noted that the Fund’s total expenses were below the peer group average for both share classes.
· For Janus Henderson Global Unconstrained Bond Portfolio, the Trustees noted that, although the Fund’s total expenses exceeded the peer group average for one share class, overall the Fund’s total expenses were reasonable. The Trustees also noted that Janus Capital has contractually agreed to limit the Fund’s expenses.
Janus Investment Fund | 49 |
Janus Henderson Contrarian Fund
Additional Information (unaudited)
· For Janus Henderson Mid Cap Value Portfolio, the Trustees noted that the Fund’s total expenses were below the peer group average for both share classes.
· For Janus Henderson Overseas Portfolio, the Trustees noted that the Fund’s total expenses were below the peer group average for both share classes.
· For Janus Henderson Research Portfolio, the Trustees noted that the Fund’s total expenses were below the peer group average for both share classes.
· For Janus Henderson U.S. Low Volatility Portfolio, the Trustees noted that the Fund’s total expenses were below the peer group average for its sole share class.
The Trustees reviewed information on the overall profitability to Janus Capital and its affiliates of their relationship with the Funds, and considered profitability data of other fund managers. The Trustees also considered the financial information, estimated profitability and corporate structure of Janus Capital’s parent company before and after the Transaction. The Trustees recognized that profitability comparisons among fund managers are difficult because of the variation in the type of comparative information that is publicly available, and the profitability of any fund manager is affected by numerous factors, including the organizational structure of the particular fund manager, the types of funds and other accounts it manages, possible other lines of business, the methodology for allocating expenses, and the fund manager’s capital structure and cost of capital. The Trustees also noted that the Trustees’ independent fee consultant reviewed the overall profitability of Janus Capital’s parent company prior to the Transaction, and the independent fee consultant found that, while assessing the reasonableness of Fund expenses in light of such profits was dependent on comparisons with other publicly-traded mutual fund advisers, and that these comparisons were limited in accuracy by differences in complex size, business mix, institutional account orientation and other factors, after accepting these limitations, the level of profit earned by Janus Capital’s parent company was reasonable. In this regard, the independent consultant concluded that the profitability of Janus Capital’s parent company did not show excess nor did it show any insufficiency that could limit the ability to invest the resources needed to drive strong future investment performance on behalf of the Funds.
Additionally, the Trustees considered the estimated profitability to Janus Capital from the investment management services it provided to each Fund. The Trustees also considered such estimated profitability taking into account the impact of the Transaction on Janus Capital’s expense structure on a pro forma basis. In their review, the Trustees considered whether Janus Capital and each subadviser receive adequate incentives and resources to manage the Funds effectively. In reviewing profitability, the Trustees noted that the estimated profitability for an individual Fund is necessarily a product of the allocation methodology utilized by Janus Capital to allocate its expenses as part of the estimated profitability calculation. In this regard, the Trustees noted that the independent fee consultant concluded that (1) the expense allocation methodology utilized by Janus Capital was reasonable and (2) the estimated profitability to Janus Capital from the investment management services it provided to each Fund was reasonable, including after taking into account the impact of the Transaction on Janus Capital’s expense structure on a pro forma basis. The Trustees also considered that the estimated profitability for an individual Fund was influenced by a number of factors, including not only the allocation methodology selected, but also the presence of fee waivers and expense caps, and whether the Fund’s investment management agreement contained breakpoints or a performance fee component. The Trustees determined, after taking into account these factors, among others, that Janus Capital’s estimated profitability with respect to each Fund was not unreasonable in relation to the services provided, and that the variation in the range of such estimated profitability among the Funds was not a material factor in the Board’s approval of the reasonableness of any Fund’s investment management fees.
The Trustees concluded that the management fees payable by each Fund to Janus Capital and its affiliates, as well as the fees paid by Janus Capital to the subadvisers of subadvised Funds, were reasonable in relation to the nature, extent, and quality of the services provided, taking into account the fees charged by other advisers for managing comparable mutual funds with similar strategies, the fees Janus Capital and the subadvisers charge to other clients, and, as applicable, the impact of fund performance on management fees payable by the Funds. The Trustees also concluded that each Fund’s total expenses were reasonable, taking into account the size of the Fund, the quality of services provided by Janus Capital and any subadviser, the investment performance of the Fund, and any expense limitations agreed to or provided by Janus Capital.
50 | SEPTEMBER 30, 2018 |
Janus Henderson Contrarian Fund
Additional Information (unaudited)
Economies of Scale
The Trustees considered information about the potential for Janus Capital to realize economies of scale as the assets of the Funds increase. They noted their independent fee consultant’s analysis of economies of scale in prior years. They also noted that, although many Funds pay advisory fees at a base fixed rate as a percentage of net assets, without any breakpoints or performance fees, their independent fee consultant concluded that 86% of these Funds’ share classes have contractual management fees (gross of waivers) below their Broadridge expense group averages. They also noted that for those Funds whose expenses are being reduced by the contractual expense limitations of Janus Capital, Janus Capital is subsidizing certain of these Funds because they have not reached adequate scale. Moreover, as the assets of some of the Funds have declined in the past few years, certain Funds have benefited from having advisory fee rates that have remained constant rather than increasing as assets declined. In addition, performance fee structures have been implemented for various Funds that have caused the effective rate of advisory fees payable by such a Fund to vary depending on the investment performance of the Fund relative to its benchmark index over the measurement period; and a few Funds have fee schedules with breakpoints and reduced fee rates above certain asset levels. The Trustees also noted that the Funds share directly in economies of scale through the lower charges of third-party service providers that are based in part on the combined scale of all of the Funds. Based on all of the information they reviewed, including past research and analysis conducted by the Trustees’ independent fee consultant, the Trustees concluded that the current fee structure of each Fund was reasonable and that the current rates of fees do reflect a sharing between Janus Capital and the Fund of any economies of scale that may be present at the current asset level of the Fund.
The independent fee consultant concluded that, given the limitations of various analytical approaches to economies of scale it had considered in prior years, and their conflicting results, it is difficult to analytically confirm or deny the existence of economies of scale in the Janus complex. The independent consultant concluded that (1) to the extent there were economies of scale at Janus Capital, Janus Capital’s general strategy of setting fixed management fees below peers appeared to share any such economies with investors even on smaller Funds which have not yet achieved those economies and (2) by setting lower fixed fees from the start on these Funds, Janus Capital appeared to be investing to increase the likelihood that these Funds will grow to a level to achieve any scale economies that may exist. Further, the independent fee consultant provided its belief that Fund investors are well-served by the fee levels and performance fee structures in place on the Funds in light of any economies of scale that may be present at Janus Capital.
Other Benefits to Janus Capital
The Trustees also considered benefits that accrue to Janus Capital and its affiliates and subadvisers to the Funds from their relationships with the Funds. They recognized that two affiliates of Janus Capital separately serve the Funds as transfer agent and distributor, respectively, and the transfer agent receives compensation directly from the non-money market funds for services provided. The Trustees also considered Janus Capital’s past and proposed use of commissions paid by the Funds on portfolio brokerage transactions to obtain proprietary and third-party research products and services benefiting the Fund and/or other clients of Janus Capital and/or Janus Capital, and/or a subadviser to a Fund. The Trustees concluded that Janus Capital’s and the subadvisers’ use of these types of client commission arrangements to obtain proprietary and third-party research products and services was consistent with regulatory requirements and guidelines and was likely to benefit each Fund. The Trustees also concluded that, other than the services provided by Janus Capital and its affiliates and subadvisers pursuant to the agreements and the fees to be paid by each Fund therefor, the Funds and Janus Capital and the subadvisers may potentially benefit from their relationship with each other in other ways. They concluded that Janus Capital and/or the subadvisers benefits from the receipt of research products and services acquired through commissions paid on portfolio transactions of the Funds and that the Funds benefit from Janus Capital’s and/or the subadvisers’ receipt of those products and services as well as research products and services acquired through commissions paid by other clients of Janus Capital and/or other clients of the subadvisers. They further concluded that the success of any Fund could attract other business to Janus Capital, the subadvisers or other Janus funds, and that the success of Janus Capital and the subadvisers could enhance Janus Capital’s and the subadvisers’ ability to serve the Funds.
Janus Investment Fund | 51 |
Janus Henderson Contrarian Fund
Useful Information About Your Fund Report (unaudited)
The Management Commentary in this report includes valuable insight as well as statistical information to help you understand how your Fund’s performance and characteristics stack up against those of comparable indices.
If the Fund invests in foreign securities, this report may include information about country exposure. Country exposure is based primarily on the country of risk. A company may be allocated to a country based on other factors such as location of the company’s principal office, the location of the principal trading market for the company’s securities, or the country where a majority of the company’s revenues are derived.
Please keep in mind that the opinions expressed in the Management Commentary are just that: opinions. They are a reflection based on best judgment at the time this report was compiled, which was September 30, 2018. As the investing environment changes, so could opinions. These views are unique and are not necessarily shared by fellow employees or by Janus Henderson in general.
Performance Overviews
Performance overview graphs compare the performance of a hypothetical $10,000 investment in the Fund with one or more widely used market indices. When comparing the performance of the Fund with an index, keep in mind that market indices are not available for investment and do not reflect deduction of expenses.
Average annual total returns are quoted for a Fund with more than one year of performance history. Average annual total return is calculated by taking the growth or decline in value of an investment over a period of time, including reinvestment of dividends and distributions, then calculating the annual compounded percentage rate that would have produced the same result had the rate of growth been constant throughout the period. Average annual total return does not reflect the deduction of taxes that a shareholder would pay on Fund distributions or redemptions of Fund shares.
Cumulative total returns are quoted for a Fund with less than one year of performance history. Cumulative total return is the growth or decline in value of an investment over time, independent of the period of time involved. Cumulative total return does not reflect the deduction of taxes that a shareholder would pay on Fund distributions or redemptions of Fund shares.
Pursuant to federal securities rules, expense ratios shown in the performance chart reflect subsidized (if applicable) and unsubsidized ratios. The total annual fund operating expenses ratio is gross of any fee waivers, reflecting the Fund’s unsubsidized expense ratio. The net annual fund operating expenses ratio (if applicable) includes contractual waivers of Janus Capital and reflects the Fund’s subsidized expense ratio. Ratios may be higher or lower than those shown in the “Financial Highlights” in this report.
Schedule of Investments
Following the performance overview section is the Fund’s Schedule of Investments. This schedule reports the types of securities held in the Fund on the last day of the reporting period. Securities are usually listed by type (common stock, corporate bonds, U.S. Government obligations, etc.) and by industry classification (banking, communications, insurance, etc.). Holdings are subject to change without notice.
The value of each security is quoted as of the last day of the reporting period. The value of securities denominated in foreign currencies is converted into U.S. dollars.
If the Fund invests in foreign securities, it will also provide a summary of investments by country. This summary reports the Fund exposure to different countries by providing the percentage of securities invested in each country. The country of each security represents the country of risk. The Fund’s Schedule of Investments relies upon the industry group and country classifications published by Barclays and/or MSCI Inc.
Tables listing details of individual forward currency contracts, futures, written options, swaptions, and swaps follow the Fund’s Schedule of Investments (if applicable).
Statement of Assets and Liabilities
This statement is often referred to as the “balance sheet.” It lists the assets and liabilities of the Fund on the last day of the reporting period.
52 | SEPTEMBER 30, 2018 |
Janus Henderson Contrarian Fund
Useful Information About Your Fund Report (unaudited)
The Fund’s assets are calculated by adding the value of the securities owned, the receivable for securities sold but not yet settled, the receivable for dividends declared but not yet received on securities owned, and the receivable for Fund shares sold to investors but not yet settled. The Fund’s liabilities include payables for securities purchased but not yet settled, Fund shares redeemed but not yet paid, and expenses owed but not yet paid. Additionally, there may be other assets and liabilities such as unrealized gain or loss on forward currency contracts.
The section entitled “Net Assets Consist of” breaks down the components of the Fund’s net assets. Because the Fund must distribute substantially all earnings, you will notice that a significant portion of net assets is shareholder capital.
The last section of this statement reports the net asset value (“NAV”) per share on the last day of the reporting period. The NAV is calculated by dividing the Fund’s net assets for each share class (assets minus liabilities) by the number of shares outstanding.
Statement of Operations
This statement details the Fund’s income, expenses, realized gains and losses on securities and currency transactions, and changes in unrealized appreciation or depreciation of Fund holdings.
The first section in this statement, entitled “Investment Income,” reports the dividends earned from securities and interest earned from interest-bearing securities in the Fund.
The next section reports the expenses incurred by the Fund, including the advisory fee paid to the investment adviser, transfer agent fees and expenses, and printing and postage for mailing statements, financial reports and prospectuses. Expense offsets and expense reimbursements, if any, are also shown.
The last section lists the amounts of realized gains or losses from investment and foreign currency transactions, and changes in unrealized appreciation or depreciation of investments and foreign currency-denominated assets and liabilities. The Fund will realize a gain (or loss) when it sells its position in a particular security. A change in unrealized gain (or loss) refers to the change in net appreciation or depreciation of the Fund during the reporting period. “Net Realized and Unrealized Gain/(Loss) on Investments” is affected both by changes in the market value of Fund holdings and by gains (or losses) realized during the reporting period.
Statements of Changes in Net Assets
These statements report the increase or decrease in the Fund’s net assets during the reporting period. Changes in the Fund’s net assets are attributable to investment operations, dividends and distributions to investors, and capital share transactions. This is important to investors because it shows exactly what caused the Fund’s net asset size to change during the period.
The first section summarizes the information from the Statement of Operations regarding changes in net assets due to the Fund’s investment operations. The Fund’s net assets may also change as a result of dividend and capital gains distributions to investors. If investors receive their dividends and/or distributions in cash, money is taken out of the Fund to pay the dividend and/or distribution. If investors reinvest their dividends and/or distributions, the Fund’s net assets will not be affected. If you compare the Fund’s “Net Decrease from Dividends and Distributions” to “Reinvested Dividends and Distributions,” you will notice that dividends and distributions have little effect on the Fund’s net assets. This is because the majority of the Fund’s investors reinvest their dividends and/or distributions.
The reinvestment of dividends and distributions is included under “Capital Share Transactions.” “Capital Shares” refers to the money investors contribute to the Fund through purchases or withdrawals via redemptions. The Fund’s net assets will increase and decrease in value as investors purchase and redeem shares from the Fund.
Financial Highlights
This schedule provides a per-share breakdown of the components that affect the Fund’s NAV for current and past reporting periods as well as total return, asset size, ratios, and portfolio turnover rate.
The first line in the table reflects the NAV per share at the beginning of the reporting period. The next line reports the net investment income/(loss) per share. Following is the per share total of net gains/(losses), realized and unrealized. Per share dividends and distributions to investors are then subtracted to arrive at the NAV per share at the end of the period. The next line reflects the total return for the period. The total return may include adjustments in accordance with generally accepted accounting principles required at the period end for financial reporting purposes. As a result, the
Janus Investment Fund | 53 |
Janus Henderson Contrarian Fund
Useful Information About Your Fund Report (unaudited)
total return may differ from the total return reflected for individual shareholder transactions. Also included are ratios of expenses and net investment income to average net assets.
The Fund’s expenses may be reduced through expense offsets and expense reimbursements. The ratios shown reflect expenses before and after any such offsets and reimbursements.
The ratio of net investment income/(loss) summarizes the income earned less expenses, divided by the average net assets of the Fund during the reporting period. Do not confuse this ratio with the Fund’s yield. The net investment income ratio is not a true measure of the Fund’s yield because it does not take into account the dividends distributed to the Fund’s investors.
The next figure is the portfolio turnover rate, which measures the buying and selling activity in the Fund. Portfolio turnover is affected by market conditions, changes in the asset size of the Fund, fluctuating volume of shareholder purchase and redemption orders, the nature of the Fund’s investments, and the investment style and/or outlook of the portfolio manager(s) and/or investment personnel. A 100% rate implies that an amount equal to the value of the entire portfolio was replaced once during the fiscal year; a 50% rate means that an amount equal to the value of half the portfolio is traded in a year; and a 200% rate means that an amount equal to the value of the entire portfolio is traded every six months.
54 | SEPTEMBER 30, 2018 |
Janus Henderson Contrarian Fund
Designation Requirements (unaudited)
For federal income tax purposes, the Fund designated the following for the year ended September 30, 2018:
| |
Capital Gain Distributions | $168,020,816 |
Dividends Received Deduction Percentage | 31% |
Qualified Dividend Income Percentage | 32% |
Janus Investment Fund | 55 |
Janus Henderson Contrarian Fund
Trustees and Officers (unaudited)
The Fund’s Statement of Additional Information includes additional information about the Trustees and officers and is available, without charge, by calling 1-877-335-2687.
The following are the Trustees and officers of the Trust, together with a brief description of their principal occupations during the last five years (principal occupations for certain Trustees may include periods over five years).
Each Trustee has served in that capacity since he or she was originally elected or appointed. The Trustees do not serve a specified term of office. Each Trustee will hold office until the termination of the Trust or his or her earlier death, resignation, retirement, incapacity, or removal. Under the Fund’s Governance Procedures and Guidelines, the policy is for Trustees to retire no later than the end of the calendar year in which the Trustee turns 75. The Trustees review the Fund’s Governance Procedures and Guidelines from time to time and may make changes they deem appropriate. The Fund’s Nominating and Governance Committee will consider nominees for the position of Trustee recommended by shareholders. Shareholders may submit the name of a candidate for consideration by the Committee by submitting their recommendations to the Trust’s Secretary. Each Trustee is currently a Trustee of one other registered investment company advised by Janus Capital: Janus Aspen Series. Collectively, these two registered investment companies consist of 60 series or funds.
The Trust’s officers are elected annually by the Trustees for a one-year term. Certain officers also serve as officers of Janus Aspen Series. Certain officers of the Fund may also be officers and/or directors of Janus Capital. Except as otherwise disclosed, Fund officers receive no compensation from the Fund, except for the Fund’s Chief Compliance Officer, as authorized by the Trustees.
56 | SEPTEMBER 30, 2018 |
Janus Henderson Contrarian Fund
Trustees and Officers (unaudited)
TRUSTEES | ||||||
Name, Address, and Age | Positions Held with the Trust | Length of Time Served | Principal Occupations During the Past Five Years | Number of Portfolios/Funds in Fund Complex Overseen by Trustee | Other Directorships Held by Trustee During the Past Five Years | |
Independent Trustees | ||||||
William F. McCalpin | Chairman | 1/08-Present | Managing Partner, Impact Investments, Athena Capital Advisors LLC (independent registered investment advisor) (since 2016) and Managing Director, Holos Consulting LLC (provides consulting services to foundations and other nonprofit organizations). Formerly, Chief Executive Officer, Imprint Capital (impact investment firm) (2013-2015) and Executive Vice President and Chief Operating Officer of The Rockefeller Brothers Fund (a private family foundation) (1998-2006). | 60 | Director of Mutual Fund Directors Forum (a non-profit organization serving independent directors of U.S. mutual funds), Chairman of the Board and Trustee of The Investment Fund for Foundations Investment Program (TIP) (consisting of 2 funds), and Director of the F.B. Heron Foundation (a private grantmaking foundation). | |
Janus Investment Fund | 57 |
Janus Henderson Contrarian Fund
Trustees and Officers (unaudited)
TRUSTEES | ||||||
Name, Address, and Age | Positions Held with the Trust | Length of Time Served | Principal Occupations During the Past Five Years | Number of Portfolios/Funds in Fund Complex Overseen by Trustee | Other Directorships Held by Trustee During the Past Five Years | |
Independent Trustees | ||||||
Alan A. Brown | Trustee | 1/13-Present | Executive Vice President, Institutional Markets, of Black Creek Group (private equity real estate investment management firm) (since 2012). Formerly, Executive Vice President and Co-Head, Global Private Client Group (2007-2010), Executive Vice President, Mutual Funds (2005-2007), and Chief Marketing Officer (2001-2005) of Nuveen Investments, Inc. (asset management). | 60 | Director of WTTW (PBS affiliate) (since 2003). Formerly, Director of MotiveQuest LLC (strategic social market research company) (2003-2016); Director of Nuveen Global Investors LLC (2007-2011); Director of Communities in Schools (2004-2010); and Director of Mutual Fund Education Alliance (until 2010). | |
58 | SEPTEMBER 30, 2018 |
Janus Henderson Contrarian Fund
Trustees and Officers (unaudited)
TRUSTEES | ||||||
Name, Address, and Age | Positions Held with the Trust | Length of Time Served | Principal Occupations During the Past Five Years | Number of Portfolios/Funds in Fund Complex Overseen by Trustee | Other Directorships Held by Trustee During the Past Five Years | |
Independent Trustees | ||||||
William D. Cvengros | Trustee | 1/11-Present | Managing Member and Chief Executive Officer of SJC Capital, LLC (a personal investment company and consulting firm) (since 2002). Formerly, Venture Partner for The Edgewater Funds (a middle market private equity firm) (2002-2004); Chief Executive Officer and President of PIMCO Advisors Holdings L.P. (a publicly traded investment management firm) (1994-2000); and Chief Investment Officer of Pacific Life Insurance Company (a mutual life insurance and annuity company) (1987-1994). | 60 | Advisory Board Member, Innovate Partners Emerging Growth and Equity Fund I (early stage venture capital fund) (since 2014) and Managing Trustee of National Retirement Partners Liquidating Trust (since 2013). Formerly, Chairman, National Retirement Partners, Inc. (formerly a network of advisors to 401(k) plans) (2005-2013); Director of Prospect Acquisition Corp. (a special purpose acquisition corporation) (2007-2009); Director of RemedyTemp, Inc. (temporary help services company) (1996-2006); and Trustee of PIMCO Funds Multi-Manager Series (1990-2000) and Pacific Life Variable Life & Annuity Trusts (1987-1994). | |
Janus Investment Fund | 59 |
Janus Henderson Contrarian Fund
Trustees and Officers (unaudited)
TRUSTEES | ||||||
Name, Address, and Age | Positions Held with the Trust | Length of Time Served | Principal Occupations During the Past Five Years | Number of Portfolios/Funds in Fund Complex Overseen by Trustee | Other Directorships Held by Trustee During the Past Five Years | |
Independent Trustees | ||||||
Raudline Etienne | Trustee | 6/16-Present | Founder, Daraja Capital (advisory and investment firm) (since 2016), and Senior Advisor, Albright Stonebridge Group LLC (global strategy firm) (since 2016). Formerly, Senior Vice President (2011-2015), Albright Stonebridge Group LLC; and Deputy Comptroller and Chief Investment Officer, New York State Common Retirement Fund (public pension fund) (2008-2011). | 60 | Director of Brightwood Capital Advisors, LLC (since 2014). | |
60 | SEPTEMBER 30, 2018 |
Janus Henderson Contrarian Fund
Trustees and Officers (unaudited)
TRUSTEES | ||||||
Name, Address, and Age | Positions Held with the Trust | Length of Time Served | Principal Occupations During the Past Five Years | Number of Portfolios/Funds in Fund Complex Overseen by Trustee | Other Directorships Held by Trustee During the Past Five Years | |
Independent Trustees | ||||||
Gary A. Poliner | Trustee | 6/16-Present | Retired. Formerly, President (2010-2013) of Northwestern Mutual Life Insurance Company. | 60 | Director of MGIC Investment Corporation (private mortgage insurance) (since 2013) and West Bend Mutual Insurance Company (property/casualty insurance) (since 2013). Formerly, Trustee of Northwestern Mutual Life Insurance Company (2010-2013); and Director of Frank Russell Company (global asset management firm) (2008-2013). | |
Janus Investment Fund | 61 |
Janus Henderson Contrarian Fund
Trustees and Officers (unaudited)
TRUSTEES | ||||||
Name, Address, and Age | Positions Held with the Trust | Length of Time Served | Principal Occupations During the Past Five Years | Number of Portfolios/Funds in Fund Complex Overseen by Trustee | Other Directorships Held by Trustee During the Past Five Years | |
Independent Trustees | ||||||
James T. Rothe | Trustee | 1/97-Present | Professor Emeritus of Business of the University of Colorado, Colorado Springs, CO (since 2004). Formerly, Co-founder and Managing Director of Roaring Fork Capital SBIC, L.P. (SBA SBIC fund focusing on private investment in public equity firms) (2004-2014), Professor of Business of the University of Colorado (2002-2004), and Distinguished Visiting Professor of Business (2001-2002) of Thunderbird (American Graduate School of International Management), Glendale, AZ. | 60 | Formerly, Director of Red Robin Gourmet Burgers, Inc. (RRGB) (2004-2014). | |
62 | SEPTEMBER 30, 2018 |
Janus Henderson Contrarian Fund
Trustees and Officers (unaudited)
TRUSTEES | ||||||
Name, Address, and Age | Positions Held with the Trust | Length of Time Served | Principal Occupations During the Past Five Years | Number of Portfolios/Funds in Fund Complex Overseen by Trustee | Other Directorships Held by Trustee During the Past Five Years | |
Independent Trustees | ||||||
William D. Stewart | Trustee | 6/84-Present | Retired. Formerly, President and founder of HPS Products and Corporate Vice President of MKS Instruments, Boulder, CO (a provider of advanced process control systems for the semiconductor industry) (1976-2012). | 60 | None | |
Diane
L. Wallace | Trustee | 6/17-Present | Retired. | 60 | Formerly, Independent Trustee, Henderson Global Funds (13 portfolios) (2015-2017); Independent Trustee, State Farm Associates' Funds Trust, State Farm Mutual Fund Trust, and State Farm Variable Product Trust (28 portfolios) (2013-2017); Chief Operating Officer, Senior Vice President-Operations, and Chief Financial Officer for Driehaus Capital Management, LLC (1988-2006); and Treasurer for Driehaus Mutual Funds (1996-2002). | |
Janus Investment Fund | 63 |
Janus Henderson Contrarian Fund
Trustees and Officers (unaudited)
TRUSTEES | ||||||
Name, Address, and Age | Positions Held with the Trust | Length of Time Served | Principal Occupations During the Past Five Years | Number of Portfolios/Funds in Fund Complex Overseen by Trustee | Other Directorships Held by Trustee During the Past Five Years | |
Independent Trustees | ||||||
Linda S. Wolf | Trustee | 11/05-Present | Retired. Formerly, Chairman and Chief Executive Officer of Leo Burnett (Worldwide) (advertising agency) (2001-2005). | 60 | Director of Chicago Community Trust (Regional Community Foundation), Chicago Council on Global Affairs, InnerWorkings (U.S. provider of print procurement solutions to corporate clients), Lurie Children’s Hospital (Chicago, IL), Shirley Ryan Ability Lab and Wrapports, LLC (digital communications company). Formerly, Director of Walmart (until 2017), Director of Chicago Convention & Tourism Bureau (until 2014) and The Field Museum of Natural History (Chicago, IL) (until 2014). | |
64 | SEPTEMBER 30, 2018 |
Janus Henderson Contrarian Fund
Trustees and Officers (unaudited)
OFFICERS | |||
Name, Address, and Age | Positions Held with the Trust | Term of Office* and Length of Time Served | Principal Occupations During the Past Five Years |
Nick Schommer 151 Detroit Street Denver, CO 80206 DOB: 1978 | Executive Vice President and Portfolio Manager Janus Henderson Contrarian Fund | 7/17-Present | Portfolio Manager for other Janus Henderson accounts. Formerly, associate portfolio manager at Thornburg Investment Management (2012-2013). |
Bruce L. Koepfgen | President and Chief Executive Officer | 7/14-Present | Head of North America at Janus Henderson Investors and Janus Capital Management LLC (since 2017); Executive Vice President and Director of Janus International Holding LLC (since 2011); Executive Vice President of Janus Distributors LLC (since 2011); Vice President and Director of Intech Investment Management LLC (since 2011); Executive Vice President and Director of Perkins Investment Management LLC (since 2011); and Executive Vice President and Director of Janus Management Holdings Corporation (since 2011). Formerly, President of Janus Capital Group Inc. and Janus Capital Management LLC (2013-2017); Executive Vice President of Janus Services LLC (2011-2015), Janus Capital Group Inc. and Janus Capital Management LLC (2011-2013); and Chief Financial Officer of Janus Capital Group Inc., Janus Capital Management LLC, Janus Distributors LLC, Janus Management Holdings Corporation, and Janus Services LLC (2011-2013). |
Janus Investment Fund | 65 |
Janus Henderson Contrarian Fund
Trustees and Officers (unaudited)
OFFICERS | |||
Name, Address, and Age | Positions Held with the Trust | Term of Office* and Length of Time Served | Principal Occupations During the Past Five Years |
Susan K. Wold | Vice President, Chief Compliance Officer, and Anti-Money Laundering Officer | 9/17-Present | Senior Vice President and Head of Compliance, North America for Janus Henderson (since September 2017); Formerly, Vice President, Head of Global Corporate Compliance, and Chief Compliance Officer for Janus Capital Management LLC (May 2017-September 2017); and Vice President, Compliance at Janus Capital Group Inc. and Janus Capital Management LLC (2005-2017). |
Jesper
Nergaard | Chief Financial Officer | 3/05-Present | Vice President of Janus Capital and Janus Services LLC. |
Kathryn L. Santoro | Vice President, Chief Legal Counsel, and Secretary | 12/16-Present | Vice President of Janus Capital and Janus Services LLC (since 2016). Formerly, Vice President and Associate Counsel of Curian Capital, LLC and Curian Clearing LLC (2013-2016); and General Counsel and Secretary (2011-2012) and Vice President (2009-2012) of Old Mutual Capital, Inc. |
* Officers are elected at least annually by the Trustees for a one-year term and may also be elected from time to time by the Trustees for an interim period. | |||
66 | SEPTEMBER 30, 2018 |
Janus Henderson Contrarian Fund
Notes
NotesPage1
Janus Investment Fund | 67 |
Janus Henderson Contrarian Fund
Notes
NotesPage2
68 | SEPTEMBER 30, 2018 |
Janus Henderson Contrarian Fund
Notes
NotesPage3
Janus Investment Fund | 69 |
Knowledge. Shared
At Janus Henderson, we believe in the sharing of expert insight for better investment and business decisions. We call this ethos Knowledge. Shared.
Learn more by visiting janushenderson.com.
| ||||||||
This report is submitted for the general information of shareholders of the Fund. It is not an offer or solicitation for the Fund and is not authorized for distribution to prospective investors unless preceded or accompanied by an effective prospectus. | ||||||||
Janus Henderson, Janus, Henderson, Perkins, Intech and Knowledge. Shared are trademarks of Janus Henderson Group plc or one of its subsidiary entities. © Janus Henderson Group plc. Funds distributed by Janus Henderson Distributors | ||||||||
125-02-93038 11-18 | ||||||||

ANNUAL REPORT September 30, 2018 | |||
Janus Henderson Emerging Markets Fund | |||
Janus Investment Fund | |||
| |||
HIGHLIGHTS · Portfolio management perspective · Investment strategy behind your fund · Fund performance, characteristics | |||
|

Table of Contents
Janus Henderson Emerging Markets Fund
Janus Henderson Emerging Markets Fund (unaudited)


PERFORMANCE
The Janus Henderson Emerging Markets Fund underperformed its benchmark, the MSCI Emerging Markets Index SM for the 12-month period ended September 30, 2018. The Fund’s I shares returned -5.62% while the MSCI Emerging Markets Index returned -0.81%.
INVESTMENT ENVIRONMENT
Emerging markets produced a slight negative return over the period after a sharp turn in sentiment in 2018. The markets of Qatar, Russia and Thailand were among the strongest performers while Greek and Filipino equities were among the weaker performers.
PERFORMANCE DISCUSSION
Tiger Brands, the South African-listed food manufacturing and consumer goods company, was the largest negative contributor to returns during the period. In addition to an adverse food safety issue affecting its meat processing business during the early part of this year, the company traded down due to lower margin products in its milling and baking division. We believe the franchise is still fundamentally strong, and that the management team has the skills to improve returns. To that end, we believe the long-term risk/reward is attractive and the stock is worthy of a significant holding.
Grasim Industries and its parent, the family-owned Aditya Birla Group, both detracted from performance. Grasim is a diversified Indian conglomerate, with cement operations through its majority ownership of India's leading producer, Ultratech Cement, as well as businesses in textiles and chemicals production. The Birlas are a respected family who have built strong brands, and have an impressive track record of corporate governance and creating value for shareholders.
Tata Consulting Services, the Indian information technology giant, was the largest positive contributor to relative returns. Demand for digital services from enterprise customers has been driving revenues and its experienced management team continues to demonstrate strong execution. We are mindful of the valuation at current levels and have started to slightly reduce the position to fund other high- conviction ideas.
Uni-President Enterprises, the Taiwanese holding company that owns Uni-President China, among other subsidiaries, was a large positive contributor to relative returns. The business continues to demonstrate strong profit and cash flow growth as a result of its strong consumer food brands.
OUTLOOK
Following a period of optimism and rising valuations at the start of the year, appetite for the emerging market asset class has waned over the period. It does appear there are a number of fault lines opening up across the region, which we believe will remind investors of the value of those businesses that have allocated capital and managed their balance sheets sensibly. We are mindful of the need to stick to our belief not to compromise on quality, to maintain a long-term approach and to apply a strict valuation discipline. With a long-term perspective, we remain positive about the opportunities for equity investors created by the structural trend of rising living standards in some parts of the developing world.
Thank you for your investment in the Janus Henderson Emerging Markets Fund.
Janus Investment Fund | 1 |
Janus Henderson Emerging Markets Fund (unaudited)
Fund At A Glance
September 30, 2018
5 Top Performers - Holdings |
|
|
| 5 Bottom Performers - Holdings |
| |
Contribution | Contribution | |||||
Uni-President Enterprises Corp | 1.28% | Tiger Brands Ltd | -1.61% | |||
Tata Consultancy Services Ltd | 1.27% | Banco Bradesco SA | -0.82% | |||
Standard Bank Group Ltd | 0.70% | Vodafone Idea Ltd | -0.78% | |||
LG Household & Health Care Ltd | 0.61% | Aditya Birla Capital Ltd | -0.68% | |||
Infosys Ltd | 0.51% | Grasim Industries Ltd | -0.64% | |||
5 Top Performers - Sectors* |
|
|
|
|
| |
Fund | Fund Weighting | MSCI Emerging Markets Index | ||||
Contribution | (Average % of Equity) | Weighting | ||||
Information Technology | 1.81% | 8.40% | 27.84% | |||
Consumer Discretionary | 0.94% | 5.49% | 9.79% | |||
Real Estate | 0.45% | 0.00% | 2.86% | |||
Industrials | -0.13% | 6.15% | 5.24% | |||
Health Care | -0.34% | 1.63% | 2.78% | |||
5 Bottom Performers - Sectors* |
|
|
|
|
| |
Fund | Fund Weighting | MSCI Emerging Markets Index | ||||
Contribution | (Average % of Equity) | Weighting | ||||
Materials | -1.84% | 12.46% | 7.46% | |||
Energy | -1.56% | 1.03% | 7.15% | |||
Financials | -1.34% | 16.47% | 23.43% | |||
Telecom Services | -0.67% | 2.33% | 4.57% | |||
Consumer Staples | -0.50% | 34.39% | 6.46% | |||
Security contribution to performance is measured by using an algorithm that multiplies the daily performance of each security with the previous day’s ending weight in the portfolio and is gross of advisory fees. Fixed income securities and certain equity securities, such as private placements and some share classes of equity securities, are excluded. | ||||||
* | Based on sector classification according to the Global Industry Classification Standard (“GICS”) codes, which are the exclusive property and a service mark of MSCI Inc. and Standard & Poor’s. | |||||
2 | SEPTEMBER 30, 2018 |
Janus Henderson Emerging Markets Fund (unaudited)
Fund At A Glance
September 30, 2018
5 Largest Equity Holdings - (% of Net Assets) | |
Uni-President Enterprises Corp | |
Food Products | 5.1% |
Tiger Brands Ltd | |
Food Products | 4.0% |
Tata Consultancy Services Ltd | |
Information Technology Services | 3.5% |
Fomento Economico Mexicano SAB de CV (ADR) | |
Beverages | 3.1% |
Newcrest Mining Ltd | |
Metals & Mining | 3.1% |
18.8% | |
Asset Allocation - (% of Net Assets) | |||||
Common Stocks | 92.5% | ||||
Investment Companies | 5.7% | ||||
Preferred Stocks | 1.2% | ||||
Other | 0.6% | ||||
100.0% | |||||
Emerging markets comprised 78.9% of total net assets.
Top Country Allocations - Long Positions - (% of Investment Securities) | |
As of September 30, 2018
| As of September 30, 2017
|
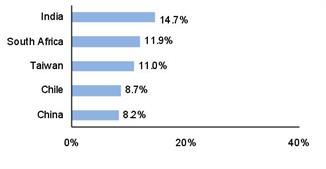
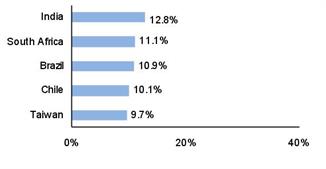
Janus Investment Fund | 3 |
Janus Henderson Emerging Markets Fund (unaudited)
Performance
See important disclosures on the next page. |
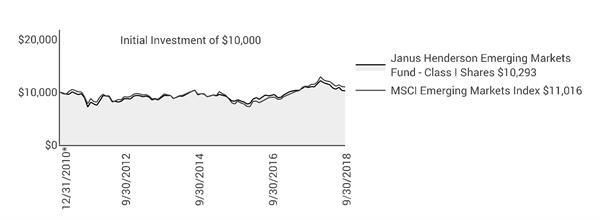
| Expense Ratios - | ||||||||
Average Annual Total Return - for the periods ended September 30, 2018 |
|
| per the January 26, 2018 prospectuses | ||||||
|
| One
| Five
| Since |
|
| Total Annual Fund
| Net Annual Fund
| |
Class A Shares at NAV |
| -5.80% | 2.38% | 0.12% |
|
| 1.48% | 1.33% | |
Class A Shares at MOP |
| -11.20% | 1.19% | -0.64% |
|
|
|
| |
Class C Shares at NAV | -6.48% | 1.61% | -0.62% |
|
| 2.33% | 2.10% | ||
Class C Shares at CDSC |
| -7.40% | 1.61% | -0.62% |
|
|
|
| |
Class D Shares(1) |
| -5.64% | 2.37% | 0.11% |
|
| 1.38% | 1.19% | |
Class I Shares |
| -5.62% | 2.65% | 0.37% |
|
| 1.26% | 1.11% | |
Class N Shares |
| -5.53% | 2.53% | 0.21% |
|
| 1.16% | 1.03% | |
Class S Shares |
| -5.98% | 2.06% | -0.20% |
|
| 1.66% | 1.54% | |
Class T Shares |
| -5.76% | 2.31% | 0.04% |
|
| 1.44% | 1.29% | |
MSCI Emerging Markets Index |
| -0.81% | 3.61% | 1.26% |
|
|
|
| |
Morningstar Quartile - Class I Shares |
| 3rd | 3rd | 3rd |
|
|
|
| |
Morningstar Ranking - based on total returns for Diversified Emerging Markets Funds |
| 567/860 | 371/616 | 286/416 |
|
|
|
| |
Returns quoted are past performance and do not guarantee future results; current performance may be lower or higher. Investment returns and principal value will vary; there may be a gain or loss when shares are sold. For the most recent month-end performance call 800.668.0434 (or 800.525.3713 if you hold shares directly with Janus Henderson) or visit janushenderson.com/performance (or janushenderson.com/allfunds if you hold shares directly with Janus Henderson).
Maximum Offering Price (MOP) returns include the maximum sales charge of 5.75%. Net Asset Value (NAV) returns exclude this charge, which would have reduced returns.
CDSC returns include a 1% contingent deferred sales charge (CDSC) on Shares redeemed within 12 months of purchase. Net Asset Value (NAV) returns exclude this charge, which would have reduced returns.
Net expense ratios reflect the expense waiver, if any, contractually agreed to through February 1, 2019.
The expense ratios shown are estimated.
Performance may be affected by risks that include those associated with non-diversification, portfolio turnover, short sales, potential conflicts of interest,
4 | SEPTEMBER 30, 2018 |
Janus Henderson Emerging Markets Fund (unaudited)
Performance
foreign and emerging markets, initial public offerings (IPOs), high-yield and high-risk securities, undervalued, overlooked and smaller capitalization companies, real estate related securities including Real Estate Investment Trusts (REITs), derivatives, and commodity-linked investments. Each product has different risks. Please see the prospectus for more information about risks, holdings and other details.
The Fund will normally invest at least 80% of its net assets, measured at the time of purchase, in the type of securities described by its name.
Returns include reinvestment of all dividends and distributions and do not reflect the deduction of taxes that a shareholder would pay on Fund distributions or redemptions of Fund shares. The returns do not include adjustments in accordance with generally accepted accounting principles required at the period end for financial reporting purposes.
See Financial Highlights for actual expense ratios during the reporting period.
Returns of the Fund shown prior to June 5, 2017 are those for Henderson Emerging Markets Fund (the “Predecessor Fund”), which merged into the Fund after the close of business on June 2, 2017. The Predecessor Fund was advised by Henderson Global Investors (North America) Inc. and subadvised by Henderson Investment Management Limited. Class A Shares, Class C Shares, Class I Shares, and Class R6 Shares of the Predecessor Fund were reorganized into Class A Shares, Class C Shares, Class I Shares, and Class N Shares, respectively, of the Fund. In connection with this reorganization, certain shareholders of the Predecessor Fund who held shares directly with the Predecessor Fund and not through an intermediary had the Class A Shares, Class C Shares, Class I Shares, and Class N Shares of the Fund received in the reorganization automatically exchanged for Class D Shares of the Fund following the reorganization. Class A Shares, Class C Shares and Class I Shares of the Predecessor Fund commenced operations with the Predecessor Fund’s inception on December 31, 2010. Class R6 Shares of the Predecessor Fund commenced operations on November 30, 2015. Class D Shares, Class S Shares, and Class T Shares commenced operations on June 5, 2017.
Performance of Class A Shares shown for periods prior to June 5, 2017, reflects the performance of Class A Shares of the Predecessor Fund, calculated using the fees and expenses of Class A Shares of the Predecessor Fund, in effect during the periods shown, net of any applicable fee and expense limitations or waivers.
Performance of Class C Shares shown for periods prior to June 5, 2017, reflects the performance of Class C Shares of the Predecessor Fund, calculated using the fees and expenses of Class C Shares of the Predecessor Fund, in effect during the periods shown, net of any applicable fee and expense limitations or waivers.
Performance of Class I Shares shown for periods prior to June 5, 2017, reflects the performance of Class I Shares of the Predecessor Fund, calculated using the fees and expenses of Class I Shares of the Predecessor Fund, in effect during the periods shown, net of any applicable fee and expense limitations or waivers.
Performance of Class N Shares shown for periods prior to June 5, 2017, reflects the performance of Class R6 Shares of the Predecessor Fund, calculated using the fees and expenses of Class R6 Shares of the Predecessor Fund, in effect during the periods shown, net of any applicable fee and expense limitations or waivers, except that for periods prior to November 30, 2015, performance for Class N Shares reflects the performance of Class I Shares of the Predecessor Fund, calculated using the estimated fees and expenses of Class N Shares, net of any applicable fee and expense limitations or waivers.
Performance of Class S Shares shown for periods prior to June 5, 2017, reflects the performance of Class I Shares of the Predecessor Fund, calculated using the estimated fees and expenses of Class S Shares, net of any applicable fee and expense limitations or waivers.
Performance of Class T Shares shown for periods prior to June 5, 2017, reflects the performance of Class I Shares of the Predecessor Fund, calculated using the estimated fees and expenses of Class T Shares, net of any applicable fee and expense limitations or waivers.
Performance of Class D Shares shown for periods prior to June 5, 2017, reflects the performance of Class I Shares of the Predecessor Fund, calculated using the estimated fees and expenses of Class D Shares, net of any applicable fee and expense limitations or waivers.
If each share class of the Fund had been available during periods prior to its commencement, the performance shown may have been different. The performance shown for periods following the Fund’s commencement of each share class reflects the fees and expenses of each respective share class, net of any applicable fee and expense limitations or waivers. Please refer to the Fund’s prospectuses for further details concerning historical performance.
Ranking is for the share class shown only; other classes may have different performance characteristics. When an expense waiver is in effect, it may have a material effect on the total return, and therefore the ranking for the period.
© 2018 Morningstar, Inc. All Rights Reserved.
There is no assurance that the investment process will consistently lead to successful investing.
See Notes to Schedule of Investments and Other Information for index definitions.
Index performance does not reflect the expenses of managing a portfolio as an index is unmanaged and not available for direct investment.
See “Useful Information About Your Fund Report.”
*The Predecessor Fund’s inception date – December 31, 2010
(1) Closed to certain new investors.
Janus Investment Fund | 5 |
Janus Henderson Emerging Markets Fund (unaudited)
Expense Examples
As a shareholder of the Fund, you incur two types of costs: (1) transaction costs, such as sales charges (loads) on purchase payments (applicable to Class A Shares only); and (2) ongoing costs, including management fees; 12b-1 distribution and shareholder servicing fees; transfer agent fees and expenses payable pursuant to the Transfer Agency Agreement; and other Fund expenses. This example is intended to help you understand your ongoing costs (in dollars) of investing in the Fund and to compare these costs with the ongoing costs of investing in other mutual funds. To do so, compare this 5% hypothetical example with the 5% hypothetical examples that appear in the shareholder reports of the other funds. The example is based upon an investment of $1,000 invested at the beginning of the period and held for the six-months indicated, unless noted otherwise in the table and footnotes below.
Actual Expenses
The information in the table under the heading “Actual” provides information about actual account values and actual expenses. You may use the information in these columns, together with the amount you invested, to estimate the expenses that you paid over the period. Simply divide your account value by $1,000 (for example, an $8,600 account value divided by $1,000 = 8.6), then multiply the result by the number in the appropriate column for your share class under the heading entitled “Expenses Paid During Period” to estimate the expenses you paid on your account during the period.
Hypothetical Example for Comparison Purposes
The information in the table under the heading “Hypothetical (5% return before expenses)” provides information about hypothetical account values and hypothetical expenses based upon the Fund’s actual expense ratio and an assumed rate of return of 5% per year before expenses, which is not the Fund’s actual return. The hypothetical account values and expenses may not be used to estimate the actual ending account balance or expenses you paid for the period. You may use this information to compare the ongoing costs of investing in the Fund and other funds. To do so, compare this 5% hypothetical example with the 5% hypothetical examples that appear in the shareholder reports of the other funds. Additionally, for an analysis of the fees associated with an investment in any share class or other similar funds, please visit www.finra.org/fundanalyzer.
Please note that the expenses shown in the table are meant to highlight your ongoing costs only and do not reflect any transaction costs. These fees are fully described in the Fund’s prospectuses. Therefore, the hypothetical examples are useful in comparing ongoing costs only, and will not help you determine the relative total costs of owning different funds. In addition, if these transaction costs were included, your costs would have been higher.
Actual | Hypothetical | |||||||||
| Beginning | Ending | Expenses |
| Beginning | Ending | Expenses | Net Annualized | ||
Class A Shares | $1,000.00 | $880.20 | $6.27 |
| $1,000.00 | $1,018.40 | $6.73 | 1.33% | ||
Class C Shares | $1,000.00 | $877.90 | $9.74 |
| $1,000.00 | $1,014.69 | $10.45 | 2.07% | ||
Class D Shares | $1,000.00 | $880.80 | $5.56 |
| $1,000.00 | $1,019.15 | $5.97 | 1.18% | ||
Class I Shares | $1,000.00 | $881.60 | $5.14 |
| $1,000.00 | $1,019.60 | $5.52 | 1.09% | ||
Class N Shares | $1,000.00 | $881.70 | $4.86 |
| $1,000.00 | $1,019.90 | $5.22 | 1.03% | ||
Class S Shares | $1,000.00 | $879.70 | $6.88 |
| $1,000.00 | $1,017.75 | $7.39 | 1.46% | ||
Class T Shares | $1,000.00 | $880.80 | $5.89 |
| $1,000.00 | $1,018.80 | $6.33 | 1.25% | ||
† | Expenses Paid During Period are equal to the Net Annualized Expense Ratio multiplied by the average account value over the period, multiplied by 183/365 (to reflect the one-half year period). Expenses in the examples include the effect of applicable fee waivers and/or expense reimbursements, if any. Had such waivers and/or reimbursements not been in effect, your expenses would have been higher. Please refer to the Notes to Financial Statements or the Fund’s prospectuses for more information regarding waivers and/or reimbursements. | |||||||||
6 | SEPTEMBER 30, 2018 |
Janus Henderson Emerging Markets Fund
Schedule of Investments
September 30, 2018
| Value | ||||||
Common Stocks – 92.5% | |||||||
Auto Components – 1.0% | |||||||
Fuyao Glass Industry Group Co Ltd (144A) | 200,000 | $726,887 | |||||
Mahle-Metal Leve SA | 182,766 | 1,097,565 | |||||
1,824,452 | |||||||
Banks – 8.3% | |||||||
Banco Bradesco SA | 409,283 | 2,609,900 | |||||
City Union Bank Ltd | 394,358 | 967,090 | |||||
Commercial International Bank Egypt SAE (GDR) | 608,958 | 2,776,849 | |||||
Guaranty Trust Bank PLC | 2,986,163 | 299,641 | |||||
Guaranty Trust Bank PLC (GDR) | 297,309 | 1,560,872 | |||||
Kasikornbank PCL | 264,800 | 1,785,537 | |||||
Komercni banka as | 34,709 | 1,425,630 | |||||
Standard Bank Group Ltd | 244,952 | 3,032,935 | |||||
14,458,454 | |||||||
Beverages – 10.9% | |||||||
China Resources Beer Holdings Co Ltd | 422,000 | 1,695,461 | |||||
Cia Cervecerias Unidas SA (ADR) | 185,962 | 5,188,340 | |||||
Fomento Economico Mexicano SAB de CV | 42,126 | 416,915 | |||||
Fomento Economico Mexicano SAB de CV (ADR) | 54,165 | 5,360,710 | |||||
Guinness Nigeria PLC | 2,794,559 | 613,767 | |||||
Heineken Holding NV | 54,955 | 4,976,190 | |||||
Nigerian Breweries PLC | 2,949,693 | 740,966 | |||||
18,992,349 | |||||||
Capital Markets – 1.1% | |||||||
Aditya Birla Capital Ltd* | 1,163,693 | 1,840,684 | |||||
Chemicals – 1.6% | |||||||
African Oxygen Ltd | 1,329,798 | 2,822,611 | |||||
Communications Equipment – 0.3% | |||||||
VTech Holdings Ltd | 42,400 | 489,654 | |||||
Construction Materials – 2.8% | |||||||
Grasim Industries Ltd | 343,800 | 4,845,193 | |||||
Containers & Packaging – 1.6% | |||||||
Greatview Aseptic Packaging Co Ltd | 3,094,000 | 1,972,312 | |||||
Nampak Ltd* | 821,339 | 891,440 | |||||
2,863,752 | |||||||
Diversified Financial Services – 1.9% | |||||||
Remgro Ltd | 240,207 | 3,352,330 | |||||
Electric Utilities – 0.8% | |||||||
Tata Power Co Ltd | 1,492,636 | 1,356,053 | |||||
Electronic Equipment, Instruments & Components – 0.8% | |||||||
Delta Electronics Inc | 196,465 | 842,977 | |||||
Delta Electronics Thailand PCL | 233,300 | 503,331 | |||||
1,346,308 | |||||||
Food & Staples Retailing – 0.9% | |||||||
Shoprite Holdings Ltd | 116,424 | 1,578,685 | |||||
Food Products – 18.7% | |||||||
Century Pacific Food Inc | 4,344,900 | 1,142,125 | |||||
China Mengniu Dairy Co Ltd* | 538,800 | 1,793,040 | |||||
Grupo Herdez SAB de CV | 1,441,695 | 3,261,555 | |||||
Nestle Nigeria PLC | 405,792 | 1,559,667 | |||||
Standard Foods Corp | 1,305,041 | 2,171,435 | |||||
Tiger Brands Ltd | 371,271 | 6,961,676 | |||||
Uni-President China Holdings Ltd | 4,336,000 | 4,625,200 | |||||
Uni-President Enterprises Corp | 3,434,280 | 8,965,056 | |||||
Universal Robina Corp | 769,220 | 2,057,614 | |||||
32,537,368 | |||||||
Gas Utilities – 0.4% | |||||||
China Resources Gas Group Ltd | 168,000 | 683,555 | |||||
Hotels, Restaurants & Leisure – 0.5% | |||||||
City Lodge Hotels Ltd | 85,914 | 849,189 | |||||
See Notes to Schedule of Investments and Other Information and Notes to Financial Statements. | |
Janus Investment Fund | 7 |
Janus Henderson Emerging Markets Fund
Schedule of Investments
September 30, 2018
| Value | ||||||
Common Stocks – (continued) | |||||||
Household Durables – 0.6% | |||||||
Pepkor Holdings Ltd* | 866,604 | $976,131 | |||||
Household Products – 2.6% | |||||||
PZ Cussons PLC | 791,620 | 2,411,978 | |||||
Vinda International Holdings Ltd | 1,270,000 | 2,180,508 | |||||
4,592,486 | |||||||
Independent Power and Renewable Electricity Producers – 0.8% | |||||||
Engie Brasil Energia SA | 154,112 | 1,354,076 | |||||
Industrial Conglomerates – 5.1% | |||||||
LG Corp | 72,425 | 4,740,830 | |||||
Quinenco SA | 1,353,054 | 4,115,610 | |||||
8,856,440 | |||||||
Information Technology Services – 7.4% | |||||||
Cognizant Technology Solutions Corp | 49,725 | 3,836,284 | |||||
Infosys Ltd | 297,561 | 2,997,060 | |||||
Tata Consultancy Services Ltd | 202,258 | 6,093,482 | |||||
12,926,826 | |||||||
Insurance – 0.8% | |||||||
Samsung Fire & Marine Insurance Co Ltd | 5,548 | 1,420,640 | |||||
Leisure Products – 2.0% | |||||||
Merida Industry Co Ltd | 733,000 | 3,433,199 | |||||
Machinery – 0.4% | |||||||
WEG SA | 129,153 | 631,676 | |||||
Metals & Mining – 3.1% | |||||||
Newcrest Mining Ltd | 381,456 | 5,350,915 | |||||
Oil, Gas & Consumable Fuels – 1.1% | |||||||
Cairn Energy PLC* | 644,298 | 1,953,029 | |||||
Paper & Forest Products – 1.7% | |||||||
Duratex SA | 1,351,270 | 3,021,710 | |||||
Personal Products – 3.8% | |||||||
LG Household & Health Care Ltd | 1,456 | 1,675,102 | |||||
Unilever PLC | 89,746 | 4,930,919 | |||||
6,606,021 | |||||||
Pharmaceuticals – 3.0% | |||||||
Cipla Ltd/India | 339,530 | 3,063,768 | |||||
Mega Lifesciences PCL | 1,811,400 | 2,087,060 | |||||
5,150,828 | |||||||
Technology Hardware, Storage & Peripherals – 2.1% | |||||||
Asustek Computer Inc | 423,000 | 3,657,659 | |||||
Textiles, Apparel & Luxury Goods – 1.3% | |||||||
Stella International Holdings Ltd | 596,500 | 532,651 | |||||
Yue Yuen Industrial Holdings Ltd | 654,300 | 1,817,988 | |||||
2,350,639 | |||||||
Thrifts & Mortgage Finance – 1.8% | |||||||
Housing Development Finance Corp Ltd | 127,794 | 3,093,361 | |||||
Water Utilities – 2.6% | |||||||
Inversiones Aguas Metropolitanas SA | 2,462,604 | 3,664,972 | |||||
Manila Water Co Inc | 1,880,000 | 852,647 | |||||
4,517,619 | |||||||
Wireless Telecommunication Services – 0.7% | |||||||
Vodafone Idea Ltd* | 2,185,834 | 1,162,541 | |||||
Total Common Stocks (cost $160,684,265) | 160,896,433 | ||||||
Preferred Stocks – 1.2% | |||||||
Beverages – 1.2% | |||||||
Embotelladora Andina SA | 621,236 | 2,088,141 | |||||
Oil, Gas & Consumable Fuels – 0% | |||||||
International Petroleum Ltd*,¢ | 955,965 | 0 | |||||
Total Preferred Stocks (cost $2,469,279) | 2,088,141 | ||||||
See Notes to Schedule of Investments and Other Information and Notes to Financial Statements. | |
8 | SEPTEMBER 30, 2018 |
Janus Henderson Emerging Markets Fund
Schedule of Investments
September 30, 2018
| Value | ||||||
Investment Companies – 5.7% | |||||||
Money Markets – 5.7% | |||||||
Fidelity Investments Money Market Treasury Portfolio, 1.9300%ºº (cost $9,859,355) | 9,859,355 | $9,859,355 | |||||
Total Investments (total cost $173,012,899) – 99.4% | 172,843,929 | ||||||
Cash, Receivables and Other Assets, net of Liabilities – 0.6% | 1,040,794 | ||||||
Net Assets – 100% | $173,884,723 | ||||||
Summary of Investments by Country - (Long Positions) (unaudited) | |||||
% of | |||||
Investment | |||||
Country | Value | Securities | |||
India | $25,419,232 | 14.7 | % | ||
South Africa | 20,464,997 | 11.9 | |||
Taiwan | 19,070,326 | 11.0 | |||
Chile | 15,057,063 | 8.7 | |||
China | 14,209,614 | 8.2 | |||
United States | 13,695,639 | 7.9 | |||
United Kingdom | 9,295,926 | 5.4 | |||
Mexico | 9,039,180 | 5.2 | |||
Brazil | 8,714,927 | 5.1 | |||
South Korea | 7,836,572 | 4.5 | |||
Australia | 5,350,915 | 3.1 | |||
Netherlands | 4,976,190 | 2.9 | |||
Nigeria | 4,774,913 | 2.8 | |||
Thailand | 4,375,928 | 2.5 | |||
Philippines | 4,052,386 | 2.4 | |||
Egypt | 2,776,849 | 1.6 | |||
Hong Kong | 2,307,642 | 1.3 | |||
Czech Republic | 1,425,630 | 0.8 | |||
Total | $172,843,929 | 100.0 | % |
See Notes to Schedule of Investments and Other Information and Notes to Financial Statements. | |
Janus Investment Fund | 9 |
Janus Henderson Emerging Markets Fund
Notes to Schedule of Investments and Other Information
MSCI Emerging Markets IndexSM | MSCI Emerging Markets IndexSM reflects the equity market performance of emerging markets. |
ADR | American Depositary Receipt |
GDR | Global Depositary Receipt |
PCL | Public Company Limited |
PLC | Public Limited Company |
144A | Securities sold under Rule 144A of the Securities Act of 1933, as amended, are subject to legal and/or contractual restrictions on resale and may not be publicly sold without registration under the 1933 Act. Unless otherwise noted, these securities have been determined to be liquid under guidelines established by the Board of Trustees. The total value of 144A securities as of the year ended September 30, 2018 is $726,887, which represents 0.4% of net assets. |
* | Non-income producing security. |
ºº | Rate shown is the 7-day yield as of September 30, 2018. |
¢ | Security is valued using significant unobservable inputs. |
The following is a summary of the inputs that were used to value the Fund’s investments in securities and other financial instruments as of September 30, 2018. See Notes to Financial Statements for more information. | ||||||||||||
Valuation Inputs Summary | ||||||||||||
Level 2 - | Level 3 - | |||||||||||
Level 1 - | Other Significant | Significant | ||||||||||
Quoted Prices | Observable Inputs | Unobservable Inputs | ||||||||||
Assets | ||||||||||||
Investments in Securities: | ||||||||||||
Common Stocks | $ | 160,896,433 | $ | - | $ | - | ||||||
Preferred Stocks | ||||||||||||
Beverages | - | 2,088,141 | - | |||||||||
Oil, Gas & Consumable Fuels | - | - | 0 | |||||||||
Investment Companies | 9,859,355 | - | - | |||||||||
Total Assets | $ | 170,755,788 | $ | 2,088,141 | $ | 0 | ||||||
10 | SEPTEMBER 30, 2018 |
Janus Henderson Emerging Markets Fund
Statement of Assets and Liabilities
September 30, 2018
See footnotes at the end of the Statement. |
|
|
|
|
|
|
|
Assets: | ||||||
Investments, at value(1) | $ | 172,843,929 | ||||
Non-interested Trustees' deferred compensation | 3,728 | |||||
Receivables: | ||||||
Investments sold | 925,070 | |||||
Fund shares sold | 685,984 | |||||
Dividends | 310,686 | |||||
Foreign tax reclaims | 1,043 | |||||
Other assets | 18,190 | |||||
Total Assets |
|
| 174,788,630 |
| ||
Liabilities: | ||||||
Payables: | — | |||||
Investments purchased | 474,568 | |||||
Foreign tax liability | 116,468 | |||||
Fund shares repurchased | 93,939 | |||||
Advisory fees | 68,708 | |||||
Audit fee payable | 40,427 | |||||
Transfer agent fees and expenses | 22,140 | |||||
Registration fees | 13,380 | |||||
Custodian fees | 13,135 | |||||
12b-1 Distribution and shareholder servicing fees | 8,601 | |||||
Printing fees | 7,382 | |||||
Non-interested Trustees' deferred compensation fees | 3,728 | |||||
Professional fees | 2,544 | |||||
Non-interested Trustees' fees and expenses | 1,188 | |||||
Affiliated fund administration fees payable | 355 | |||||
Accrued expenses and other payables | 37,344 | |||||
Total Liabilities |
|
| 903,907 |
| ||
Net Assets |
| $ | 173,884,723 |
| ||
See Notes to Financial Statements. | |
Janus Investment Fund | 11 |
Janus Henderson Emerging Markets Fund
Statement of Assets and Liabilities
September 30, 2018
|
|
|
|
|
|
|
Net Assets Consist of: | ||||||
Capital (par value and paid-in surplus) | $ | 171,575,444 | ||||
Total distributable earnings (loss)(2) | 2,309,279 | |||||
Total Net Assets |
| $ | 173,884,723 |
| ||
Net Assets - Class A Shares | $ | 15,770,542 | ||||
Shares Outstanding, $0.01 Par Value (unlimited shares authorized) | 1,664,300 | |||||
Net Asset Value Per Share(3) |
| $ | 9.48 |
| ||
Maximum Offering Price Per Share(4) |
| $ | 10.06 |
| ||
Net Assets - Class C Shares | $ | 5,984,748 | ||||
Shares Outstanding, $0.01 Par Value (unlimited shares authorized) | 656,304 | |||||
Net Asset Value Per Share(3) |
| $ | 9.12 |
| ||
Net Assets - Class D Shares | $ | 13,104,255 | ||||
Shares Outstanding, $0.01 Par Value (unlimited shares authorized) | 1,375,593 | |||||
Net Asset Value Per Share |
| $ | 9.53 |
| ||
Net Assets - Class I Shares | $ | 107,276,493 | ||||
Shares Outstanding, $0.01 Par Value (unlimited shares authorized) | 11,263,701 | |||||
Net Asset Value Per Share |
| $ | 9.52 |
| ||
Net Assets - Class N Shares | $ | 25,133,731 | ||||
Shares Outstanding, $0.01 Par Value (unlimited shares authorized) | 2,637,018 | |||||
Net Asset Value Per Share |
| $ | 9.53 |
| ||
Net Assets - Class S Shares | $ | 1,753,005 | ||||
Shares Outstanding, $0.01 Par Value (unlimited shares authorized) | 184,357 | |||||
Net Asset Value Per Share |
| $ | 9.51 |
| ||
Net Assets - Class T Shares | $ | 4,861,949 | ||||
Shares Outstanding, $0.01 Par Value (unlimited shares authorized) | 510,864 | |||||
Net Asset Value Per Share |
| $ | 9.52 |
| ||
(1) Includes cost of $173,012,899. (2) Includes $116,469 of foreign capital gains tax on investments. (3) Redemption price per share may be reduced for any applicable contingent deferred sales charge. (4) Maximum offering price is computed at 100/94.25 of net asset value. |
See Notes to Financial Statements. | |
12 | SEPTEMBER 30, 2018 |
Janus Henderson Emerging Markets Fund
Statement of Operations
For the year ended September 30, 2018
See footnotes at the end of the Statement. |
|
|
|
|
|
|
Investment Income: | |||||
| Dividends | $ | 4,894,710 | ||
Other income | 159,726 | ||||
Foreign tax withheld | (620,488) | ||||
Total Investment Income |
| 4,433,948 |
| ||
Expenses: | |||||
Advisory fees | 1,969,333 | ||||
12b-1 Distribution and shareholder servicing fees: | |||||
Class A Shares | 40,152 | ||||
Class C Shares | 82,851 | ||||
Class S Shares | 2,970 | ||||
Transfer agent administrative fees and expenses: | |||||
Class D Shares | 18,676 | ||||
Class S Shares | 2,970 | ||||
Class T Shares | 18,134 | ||||
Transfer agent networking and omnibus fees: | |||||
Class A Shares | 5,471 | ||||
Class C Shares | 5,088 | ||||
Class I Shares | 70,268 | ||||
Other transfer agent fees and expenses: | |||||
Class A Shares | 1,810 | ||||
Class C Shares | 904 | ||||
Class D Shares | 1,121 | ||||
Class I Shares | 3,905 | ||||
Class N Shares | 898 | ||||
Class S Shares | 10 | ||||
Class T Shares | 59 | ||||
Registration fees | 128,497 | ||||
Professional fees | 97,664 | ||||
Custodian fees | 92,807 | ||||
Shareholder reports expense | 32,913 | ||||
Affiliated fund administration fees | 9,746 | ||||
Non-interested Trustees’ fees and expenses | 5,119 | ||||
Other expenses | 42,823 | ||||
Total Expenses |
| 2,634,189 |
| ||
Less: Excess Expense Reimbursement and Waivers |
| (346,874) |
| ||
Net Expenses |
| 2,287,315 |
| ||
Net Investment Income/(Loss) |
| 2,146,633 |
| ||
See Notes to Financial Statements. | |
Janus Investment Fund | 13 |
Janus Henderson Emerging Markets Fund
Statement of Operations
For the year ended September 30, 2018
|
|
|
|
|
|
Net Realized Gain/(Loss) on Investments: | |||||
Investments and foreign currency transactions(1) | $ | 4,021,591 | |||
Total Net Realized Gain/(Loss) on Investments |
| 4,021,591 |
| ||
Change in Unrealized Net Appreciation/Depreciation: | |||||
Investments, foreign currency translations and non-interested Trustees’ deferred compensation(2) | (17,308,273) | ||||
Total Change in Unrealized Net Appreciation/Depreciation |
| (17,308,273) |
| ||
Net Increase/(Decrease) in Net Assets Resulting from Operations | $ | (11,140,049) |
| ||
(1) Includes realized foreign capital gains tax on investments of $(16,075). (2) Includes change in unrealized appreciation/depreciation of $(88,690) due to foreign capital gains tax on investments. |
See Notes to Financial Statements. | |
14 | SEPTEMBER 30, 2018 |
Janus Henderson Emerging Markets Fund
Statements of Changes in Net Assets
|
|
| Year
ended |
| Period ended |
| Year
ended | ||||
Operations: | |||||||||||
Net investment income/(loss) | $ | 2,146,633 | $ | 795,495 | $ | 1,596,268 | |||||
Net realized gain/(loss) on investments | 4,021,591 | 980,181 | 6,353,838 | ||||||||
Change in unrealized net appreciation/depreciation | (17,308,273) | 1,609,480 | 5,444,904 | ||||||||
Net Increase/(Decrease) in Net Assets Resulting from Operations |
| (11,140,049) |
|
| 3,385,156 |
|
| 13,395,010 | |||
Dividends and Distributions to Shareholders(3) | |||||||||||
Class A Shares | (459,832) | N/A | N/A | ||||||||
Class C Shares | (200,053) | N/A | N/A | ||||||||
Class D Shares | (475,263) | N/A | N/A | ||||||||
Class I Shares | (3,741,499) | N/A | N/A | ||||||||
Class N Shares | (902,442) | N/A | N/A | ||||||||
Class S Shares | (9,313) | N/A | N/A | ||||||||
Class T Shares | (237,676) | N/A | N/A | ||||||||
| Total Dividends and Distributions to Shareholders |
| (6,026,078) |
|
| N/A |
|
| N/A | ||
Dividends from Net Investment Income(3) | |||||||||||
Class A Shares | N/A | — | (84,478) | ||||||||
Class C Shares | N/A | — | (10,078) | ||||||||
Class I Shares | N/A | — | (467,218) | ||||||||
Class N Shares | N/A | — | (18,614) | ||||||||
| Total Dividends from Net Investment Income |
| N/A |
|
| — |
|
| (580,388) | ||
Net Decrease from Dividends and Distributions to Shareholders |
| (6,026,078) |
|
| — |
|
| (580,388) | |||
Capital Share Transactions: (Note 5) | |||||||||||
Class A Shares | 1,667,423 | 180,695 | 6,952,439 | ||||||||
Class C Shares | (2,358,097) | 350,563 | 4,245,080 | ||||||||
Class D Shares | (1,628,266) | (761,157) | 16,083,829 | ||||||||
Class I Shares | 5,040,165 | 3,603,991 | 62,540,753 | ||||||||
Class N Shares | (13,936,642) | (307,870) | 38,887,654 | ||||||||
Class S Shares | 1,685,020 | 7,058 | 296,026 | ||||||||
Class T Shares | (2,295,108) | 6,742 | 7,394,663 | ||||||||
Net Increase/(Decrease) from Capital Share Transactions |
| (11,825,505) |
|
| 3,080,022 |
|
| 136,400,444 | |||
Net Increase/(Decrease) in Net Assets |
| (28,991,632) |
|
| 6,465,178 |
|
| 149,215,066 | |||
Net Assets: | |||||||||||
Beginning of period | 202,876,355 | 196,411,177 | 47,196,111 | ||||||||
| End of period(4) | $ | 173,884,723 |
| $ | 202,876,355 |
| $ | 196,411,177 | ||
(1) Period from August 1, 2017 through September 30, 2017. The Fund changed its fiscal year end from July 31 to September 30. (2) Period from June 5, 2017 (inception date) through July 31, 2017 for Class D Shares, Class S Shares and Class T Shares. (3) The requirement to disclose distributions paid to shareholders net investments income; and/or net realized gain from investment transactions was eliminated by the SEC (Securities Exchange Commission) for 2018. (4) Net assets - End of period includes undistributed (overdistributed) net investment income of $1,657,803 as of September 30, 2017 and $912,164 as of July 31, 2017. The requirement to parenthetically disclose undistributed net investment income was eliminated by the SEC for 2018. |
See Notes to Financial Statements. | |
Janus Investment Fund | 15 |
Janus Henderson Emerging Markets Fund
Financial Highlights
Class A Shares | |||||||||
For a share outstanding during the year or period ended September 30 |
| 2018 |
|
| 2017(1) |
| |||
Net Asset Value, Beginning of Period |
| $10.36 |
|
| $10.19 |
| |||
Income/(Loss) from Investment Operations: | |||||||||
Net investment income/(loss)(2) | 0.10 | 0.04 | |||||||
Net realized and unrealized gain/(loss) | (0.67) | 0.13 | |||||||
Total from Investment Operations |
| (0.57) |
|
| 0.17 |
| |||
Less Dividends and Distributions: | |||||||||
Dividends (from net investment income) | (0.10) | — | |||||||
Distributions (from capital gains) | (0.21) | — | |||||||
Total Dividends and Distributions |
| (0.31) |
|
| — |
| |||
Net Asset Value, End of Period | $9.48 | $10.36 | |||||||
Total Return* |
| (5.80)% |
|
| 1.67% |
| |||
Net Assets, End of Period (in thousands) | $15,771 | $15,562 | |||||||
Average Net Assets for the Period (in thousands) | $16,103 | $15,471 | |||||||
Ratios to Average Net Assets**: |
|
|
|
|
|
| |||
Ratio of Gross Expenses | 1.51% | 1.75% | |||||||
Ratio of Net Expenses (After Waivers and Expense Offsets) | 1.33% | 1.46% | |||||||
Ratio of Net Investment Income/(Loss) | 0.93% | 2.18% | |||||||
Portfolio Turnover Rate | 26% | 2% | |||||||
Class C Shares | |||||||||
For a share outstanding during the year ended September 30 |
| 2018 |
|
| 2017(1) |
| |||
Net Asset Value, Beginning of Period |
| $9.98 |
|
| $9.83 |
| |||
Income/(Loss) from Investment Operations: | |||||||||
Net investment income/(loss)(2) | 0.01 | 0.02 | |||||||
Net realized and unrealized gain/(loss) | (0.65) | 0.13 | |||||||
Total from Investment Operations |
| (0.64) |
|
| 0.15 |
| |||
Less Dividends and Distributions: | |||||||||
Dividends (from net investment income) | (0.01) | — | |||||||
Distributions (from capital gains) | (0.21) | — | |||||||
Total Dividends and Distributions |
| (0.22) |
|
| — |
| |||
Net Asset Value, End of Period | $9.12 | $9.98 | |||||||
Total Return* |
| (6.59)%(3) |
|
| 1.53% |
| |||
Net Assets, End of Period (in thousands) | $5,985 | $9,017 | |||||||
Average Net Assets for the Period (in thousands) | $8,442 | $8,877 | |||||||
Ratios to Average Net Assets**: |
|
|
|
|
|
| |||
Ratio of Gross Expenses | 2.26% | 2.65% | |||||||
Ratio of Net Expenses (After Waivers and Expense Offsets) | 2.07% | 2.35% | |||||||
Ratio of Net Investment Income/(Loss) | 0.11% | 1.29% | |||||||
Portfolio Turnover Rate | 26% | 2% | |||||||
* Total return not annualized for periods of less than one full year. ** Annualized for periods of less than one full year. (1) Period from August 1, 2017 through September 30, 2017. The Fund changed its fiscal year end from July 31 to September 30. (2) Per share amounts are calculated based on average shares outstanding during the year or period. (3) The return includes adjustments in accordance with generally accepted accounting principles required at period end date. |
See Notes to Financial Statements. | |
16 | SEPTEMBER 30, 2018 |
Janus Henderson Emerging Markets Fund
Financial Highlights
Class A Shares | |||||||||||||||
For a share outstanding during the year ended July 31 |
| 2017 |
|
| 2016 |
|
| 2015 |
|
| 2014 |
| |||
Net Asset Value, Beginning of Period |
| $9.10 |
|
| $8.60 |
|
| $9.82 |
|
| $8.49 |
| |||
Income/(Loss) from Investment Operations: | |||||||||||||||
Net investment income/(loss)(1) | 0.10 | 0.13 | 0.02 | 0.02 | |||||||||||
Net realized and unrealized gain/(loss) | 1.05 | 0.39 | (1.24) | 1.31 | |||||||||||
Total from Investment Operations |
| 1.15 |
|
| 0.52 |
|
| (1.22) |
|
| 1.33 |
| |||
Less Dividends and Distributions: | |||||||||||||||
Dividends (from net investment income) | (0.06) | (0.02) | — | — | |||||||||||
Total Dividends and Distributions |
| (0.06) |
|
| (0.02) |
|
| — |
|
| — |
| |||
Net Asset Value, End of Period | $10.19 | $9.10 | $8.60 | $9.82 | |||||||||||
Total Return* |
| 12.80% |
|
| 6.07% |
|
| (12.42)% |
|
| 15.67% |
| |||
Net Assets, End of Period (in thousands) | $15,124 | $6,510 | $8,272 | $8,656 | |||||||||||
Average Net Assets for the Period (in thousands) | $12,523 | $5,958 | $8,108 | $10,236 | |||||||||||
Ratios to Average Net Assets**: |
|
|
|
|
|
|
|
|
|
|
|
| |||
Ratio of Gross Expenses | 1.76% | 2.36%(2) | 2.13% | 1.97% | |||||||||||
Ratio of Net Expenses (After Waivers and Expense Offsets) | 1.54% | 1.79% | 1.79% | 1.79% | |||||||||||
Ratio of Net Investment Income/(Loss) | 1.05% | 1.64% | 0.21% | 0.26% | |||||||||||
Portfolio Turnover Rate | 32% | 86% | 148% | 97% | |||||||||||
1 | |||||||||||||||
Class C Shares | |||||||||||||||
For a share outstanding during the year ended July 31 |
| 2017 |
|
| 2016 |
|
| 2015 |
|
| 2014 |
| |||
Net Asset Value, Beginning of Period |
| $8.79 |
|
| $8.35 |
|
| $9.61 |
|
| $8.37 |
| |||
Income/(Loss) from Investment Operations: | |||||||||||||||
Net investment income/(loss)(1) | 0.03 | 0.06 | (0.06) | (0.04) | |||||||||||
Net realized and unrealized gain/(loss) | 1.02 | 0.38 | (1.20) | 1.28 | |||||||||||
Total from Investment Operations |
| 1.05 |
|
| 0.44 |
|
| (1.26) |
|
| 1.24 |
| |||
Less Dividends and Distributions: | |||||||||||||||
Dividends (from net investment income) | (0.01) | — | — | — | |||||||||||
Total Dividends and Distributions |
| (0.01) |
|
| — |
|
| — |
|
| — |
| |||
Net Asset Value, End of Period | $9.83 | $8.79 | $8.35 | $9.61 | |||||||||||
Total Return* |
| 12.03% |
|
| 5.27% |
|
| (13.11)% |
|
| 14.81% |
| |||
Net Assets, End of Period (in thousands) | $8,530 | $3,553 | $3,049 | $4,036 | |||||||||||
Average Net Assets for the Period (in thousands) | $6,219 | $3,028 | $3,471 | $3,584 | |||||||||||
Ratios to Average Net Assets**: |
|
|
|
|
|
|
|
|
|
|
|
| |||
Ratio of Gross Expenses | 2.53% | 3.16%(2) | 2.90% | 2.74% | |||||||||||
Ratio of Net Expenses (After Waivers and Expense Offsets) | 2.29% | 2.54% | 2.54% | 2.54% | |||||||||||
Ratio of Net Investment Income/(Loss) | 0.37% | 0.70% | (0.62)% | (0.42)% | |||||||||||
Portfolio Turnover Rate | 32% | 86% | 148% | 97% | |||||||||||
* Total return not annualized for periods of less than one full year. ** Annualized for periods of less than one full year. (1) Per share amounts are calculated based on average shares outstanding during the year or period. (2) The Ratio of Gross Expenses include a reimbursement of prior period custodian out-of-pocket expenses. The Ratio of Gross Expenses would have been 0.07% higher had the custodian not reimbursed the Fund. |
See Notes to Financial Statements. | |
Janus Investment Fund | 17 |
Janus Henderson Emerging Markets Fund
Financial Highlights
Class D Shares | |||||||||
For a share outstanding during the year or period ended September 30 |
| 2018 |
|
| 2017(1) |
| |||
Net Asset Value, Beginning of Period |
| $10.41 |
|
| $10.24 |
| |||
Income/(Loss) from Investment Operations: | |||||||||
Net investment income/(loss)(2) | 0.11 | 0.04 | |||||||
Net realized and unrealized gain/(loss) | (0.67) | 0.13 | |||||||
Total from Investment Operations |
| (0.56) |
|
| 0.17 |
| |||
Less Dividends and Distributions: | |||||||||
Dividends (from net investment income) | (0.11) | — | |||||||
Distributions (from capital gains) | (0.21) | — | |||||||
Total Dividends and Distributions |
| (0.32) |
|
| — |
| |||
Net Asset Value, End of Period | $9.53 | $10.41 | |||||||
Total Return* |
| (5.64)% |
|
| 1.66% |
| |||
Net Assets, End of Period (in thousands) | $13,104 | $16,053 | |||||||
Average Net Assets for the Period (in thousands) | $15,607 | $16,501 | |||||||
Ratios to Average Net Assets**: |
|
|
|
|
|
| |||
Ratio of Gross Expenses | 1.38% | 1.80% | |||||||
Ratio of Net Expenses (After Waivers and Expense Offsets) | 1.15% | 1.46% | |||||||
Ratio of Net Investment Income/(Loss) | 1.08% | 2.18% | |||||||
Portfolio Turnover Rate | 26% | 2% | |||||||
Class I Shares | |||||||||
For a share outstanding during the year ended September 30 |
| 2018 |
|
| 2017(1) |
| |||
Net Asset Value, Beginning of Period |
| $10.42 |
|
| $10.24 |
| |||
Income/(Loss) from Investment Operations: | |||||||||
Net investment income/(loss)(2) | 0.12 | 0.04 | |||||||
Net realized and unrealized gain/(loss) | (0.69) | 0.14 | |||||||
Total from Investment Operations |
| (0.57) |
|
| 0.18 |
| |||
Less Dividends and Distributions: | |||||||||
Dividends (from net investment income) | (0.12) | — | |||||||
Distributions (from capital gains) | (0.21) | — | |||||||
Total Dividends and Distributions |
| (0.33) |
|
| — |
| |||
Net Asset Value, End of Period | $9.52 | $10.42 | |||||||
Total Return* |
| (5.72)%(3) |
|
| 1.76% |
| |||
Net Assets, End of Period (in thousands) | $107,276 | $112,952 | |||||||
Average Net Assets for the Period (in thousands) | $119,036 | $110,859 | |||||||
Ratios to Average Net Assets**: |
|
|
|
|
|
| |||
Ratio of Gross Expenses | 1.26% | 1.49% | |||||||
Ratio of Net Expenses (After Waivers and Expense Offsets) | 1.09% | 1.20% | |||||||
Ratio of Net Investment Income/(Loss) | 1.17% | 2.42% | |||||||
Portfolio Turnover Rate | 26% | 2% | |||||||
* Total return not annualized for periods of less than one full year. ** Annualized for periods of less than one full year. (1) Period from August 1, 2017 through September 30, 2017. The Fund changed its fiscal year end from July 31 to September 30. (2) Per share amounts are calculated based on average shares outstanding during the year or period. (3) The return includes adjustments in accordance with generally accepted accounting principles required at period end date. |
See Notes to Financial Statements. | |
18 | SEPTEMBER 30, 2018 |
Janus Henderson Emerging Markets Fund
Financial Highlights
Class D Shares | ||||||
For a share outstanding during the period ended July 31 |
| 2017(1) |
| |||
Net Asset Value, Beginning of Period |
| $10.05 |
| |||
Income/(Loss) from Investment Operations: | ||||||
Net investment income/(loss)(2) | 0.07 | |||||
Net realized and unrealized gain/(loss) | 0.12 | |||||
Total from Investment Operations |
| 0.19 |
| |||
Less Dividends and Distributions: | ||||||
Dividends (from net investment income) | — | |||||
Total Dividends and Distributions |
| — |
| |||
Net Asset Value, End of Period | $10.24 | |||||
Total Return* |
| 1.89% |
| |||
Net Assets, End of Period (in thousands) | $16,527 | |||||
Average Net Assets for the Period (in thousands) | $14,711 | |||||
Ratios to Average Net Assets**: |
|
|
| |||
Ratio of Gross Expenses | 1.35% | |||||
Ratio of Net Expenses (After Waivers and Expense Offsets) | 1.32% | |||||
Ratio of Net Investment Income/(Loss) | 4.63% | |||||
Portfolio Turnover Rate | 32% | |||||
Class I Shares | |||||||||||||||
For a share outstanding during the year ended July 31 |
| 2017 |
|
| 2016 |
|
| 2015 |
|
| 2014 |
| |||
Net Asset Value, Beginning of Period |
| $9.13 |
|
| $8.63 |
|
| $9.86 |
|
| $8.49 |
| |||
Income/(Loss) from Investment Operations: | |||||||||||||||
Net investment income/(loss)(2) | 0.15 | 0.13 | 0.03 | 0.05 | |||||||||||
Net realized and unrealized gain/(loss) | 1.03 | 0.42 | (1.25) | 1.32 | |||||||||||
Total from Investment Operations |
| 1.18 |
|
| 0.55 |
|
| (1.22) |
|
| 1.37 |
| |||
Less Dividends and Distributions: | |||||||||||||||
Dividends (from net investment income) | (0.07) | (0.05) | (0.01) | — | |||||||||||
Total Dividends and Distributions |
| (0.07) |
|
| (0.05) |
|
| (0.01) |
|
| — |
| |||
Net Asset Value, End of Period | $10.24 | $9.13 | $8.63 | $9.86 | |||||||||||
Total Return* |
| 13.15% |
|
| 6.41% |
|
| (12.34)% |
|
| 16.14% |
| |||
Net Assets, End of Period (in thousands) | $107,513 | $36,815 | $12,652 | $16,057 | |||||||||||
Average Net Assets for the Period (in thousands) | $62,396 | $21,242 | $15,071 | $13,724 | |||||||||||
Ratios to Average Net Assets**: |
|
|
|
|
|
|
|
|
|
|
|
| |||
Ratio of Gross Expenses | 1.46% | 2.09%(3) | 1.85% | 1.66% | |||||||||||
Ratio of Net Expenses (After Waivers and Expense Offsets) | 1.27% | 1.54% | 1.54% | 1.54% | |||||||||||
Ratio of Net Investment Income/(Loss) | 1.63% | 1.52% | 0.37% | 0.56% | |||||||||||
Portfolio Turnover Rate | 32% | 86% | 148% | 97% | |||||||||||
* Total return not annualized for periods of less than one full year. ** Annualized for periods of less than one full year. (1) Period from June 5, 2017 (inception date) through July 31, 2017. (2) Per share amounts are calculated based on average shares outstanding during the year or period. (3) The Ratio of Gross Expenses include a reimbursement of prior period custodian out-of-pocket expenses. The Ratio of Gross Expenses would have been 0.07% higher had the custodian not reimbursed the Fund. |
See Notes to Financial Statements. | |
Janus Investment Fund | 19 |
Janus Henderson Emerging Markets Fund
Financial Highlights
Class N Shares | |||||||||
For a share outstanding during the year or period ended September 30 |
| 2018 |
|
| 2017 | ||||