United States Securities and Exchange Commission
Washington, D.C. 20549
Form N-CSR
Certified Shareholder Report of Registered Management Investment Companies
Investment Company Act file number 811-01879
Janus
Investment Fund
(Exact name of registrant as specified in charter)
151 Detroit Street, Denver,
Colorado 80206
(Address of principal executive offices) (Zip code)
Kathryn Santoro, 151 Detroit
Street, Denver, Colorado 80206
(Name and address of agent for service)
Registrant's telephone
number, including area code: 303-333-3863
Date of fiscal year end: 6/30
Date of reporting period:
6/30/18
Item 1 - Reports to Shareholders
ANNUAL REPORT June 30, 2018 | |||
Janus Henderson Adaptive Global Allocation Fund | |||
Janus Investment Fund | |||
| |||
HIGHLIGHTS · Portfolio management perspective · Investment strategy behind your fund · Fund performance,
characteristics |
|

Table of Contents
Janus Henderson Adaptive Global Allocation Fund
Janus Henderson Adaptive Global Allocation Fund (unaudited)


PERFORMANCE OVERVIEW
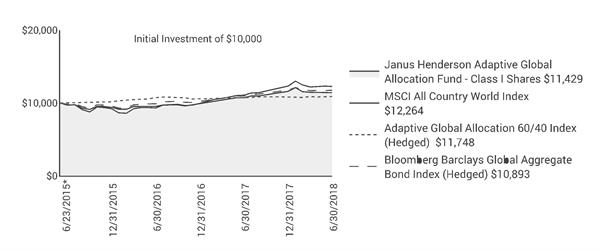
Janus Henderson Adaptive Global Allocation Fund Class I Shares returned 6.57% for the 12-month period ended June 30, 2018. This compares with a return of 10.73% for its primary benchmark, the MSCI All Country World Index. The Fund’s secondary benchmark, the Adaptive Global Allocation 60-40 Index, an internally calculated index comprised of the MSCI All Country World Index (60%) and the Bloomberg Barclays Global Aggregate Bond Index (40%), returned 7.12%. Its tertiary benchmark, the Bloomberg Barclays Global Aggregate Bond Index, returned 1.66%.
MARKET ENVIRONMENT
Global financial markets generated gains during the period despite a return of volatility during the winter. Risk assets rose during the autumn of 2017 as investor grew optimistic about the prospects for tax reform in the U.S. However, concerns that inflation may surprise to the upside caused many to consider that the Federal Reserve (Fed) may raise interest rates faster than expected. This fueled the sell-off that hit both risky and traditionally safer asset classes. Higher rates and an improving U.S. economic outlook pushed the yield on 10-year Treasury notes up 56 basis points (bps) to 2.86%. The yield on 2-year notes rose a more pronounced 115 bps to 2.53%. Political concerns in Europe, however, sent Germany’s Bund in the other direction with yields sliding from a period high of 0.77% to as low as 0.26%.
Global stocks rose, led by the U.S. On a sector level, technology and energy gained, with the latter being driven by a roughly 50% increase in crude oil prices. Telecommunications was the worst performing sector. Investment-grade corporate credits finished slightly in the red as spreads widened to 124 bps. High-yield issuers, however, managed to deliver modestly positive returns.
PERFORMANCE DISCUSSION
For the period, the Fund underperformed its primary and secondary benchmarks, the MSCI All Country World Index, and the Adaptive Global Allocation 60-40 Index, respectively. It outperformed its tertiary benchmark, the Bloomberg Barclays Global Aggregate Bond Index. For the full period, the Fund’s relative underperformance was due to an underweight in equities as well as an underweight in a concentrated set of mega-cap stocks, which drove a considerable portion of ACWI’s returns over the period.
We believe that compound returns are most affected by tail risks, not average returns. For that key reason, the Fund’s focus is on mitigating drawdowns while capturing upside opportunities. Our proprietary technology garners information constantly from the options markets, and we view their implied estimates of tail risk as robust and reliable indicators of future risk. The strategy sees these indicators as extremely useful in dynamically managing the risk of an investment in order to enhance compound returns. While the Fund dynamically allocates to equities, at any time, equity weightings could vary. The typical average equity weight is less than 100%. Thus, the Fund may underperform during a period of consistently strong equity performance.
We view investment risk as having two components: drawdown risk and upside risk. Of course, while compound returns are most affected by drawdowns (left tail risk), we believe that not participating in upside opportunities (right tail risk) is also risky.
We are watching several developments in markets and the global economy. Markets are underestimating the
Janus Investment Fund | 1 |
Janus Henderson Adaptive Global Allocation Fund (unaudited)
possibility of an increase in real rates leading to a sell-off in bonds. The market today is too focused on inflation fears. Yet, fixed income markets are already pricing in normalized inflation values with 10-year U.S. break-even inflation, for example, above 2.1%. Real rates, however, are still quite low in some major developed markets, with Germany being the key example. Inflation was the first step of the path towards normalization; real rates are the second – potentially more painful – step as they impact prices of all asset classes, from equities to commodities.
Investors must also be acutely aware of how rising interest volatility will impact the term premium of bonds. Thought rate volatility has not increased, when it does, investors will demand a greater risk premium to lend for longer tenors, and the term premium, which has eluded investors for the past several years should return.
How high interest rates head is a fear of many. But the real fear should be not where they head but how they get there. A violent chaotic path should breed fear, not a measured controlled path.
Investors must get conditioned to more volatile markets. The reason for this is the linkage between interest rates and volatility. Rates and volatility are tightly linked as both are sources of carry (a measure of excess income generated by the Fund’s holdings). Higher rates should lead to higher volatility as the historical source of carry for investors – bonds – finally start to offer more attractive yields, given steps by global central banks to normalize monetary policy. Other sources of carry, including volatility sales, will also have to offer more attractive relative yields to remain competitive. Higher Treasury yields are now luring investors away from selling volatility, a strategy that has been a factor in suppressing large price swings in stocks and bonds in recent years. While we have seen equity volatility increase, rate volatility should ultimately follow as central banks continue to remove monetary accommodation.
While the downside to every asset class has increased due to higher volatility, we believe that select emerging market (EM) equities such as Brazil appear particularly attractive relative to the alternatives. We see both a healthy US consumer and a stronger US dollar, which boasts competitiveness of EM exports. In eras past, a strong US dollar has derailed the public debt market of EM countries as US dollar debt swelled. But EM countries now are much more prudent in the currency risk they take when funding their liabilities, so a stronger US dollar can improve competitiveness without derailing balance sheets. A further tailwind from higher commodities prices stands to benefit major emerging markets that are significant exporters of raw materials.
During the period, with the aim of hedging certain exposures, the Fund used a series of derivative instruments including options, futures, swaps and forward exchange contracts. Since many of the derivatives we use, namely futures and certain options, are liquid, the Fund utilizes them as low-cost instruments to dynamically adjust exposures to desired targets. Other derivatives, including swaps and forward contracts, are also used to adjust portfolio exposures as conditions merit in a timely and/or cost-effective manner. This may lead to short positions in futures when exposures need to be adjusted downward. For the period, the Fund’s derivative exposure contributed to performance.
Please see the Derivative Instruments section in the “Notes to Financial Statements” for a discussion of derivatives used by the Fund.
OUTLOOK
The Fund is designed to operate at a level of risk consistent with the long-term average downside risk of a 60/40 portfolio. If the risk in markets today is much higher than average, then the Fund allocations will be adjusted away from 60/40 to an allocation that seeks to provide the targeted risk level.
While our signals over the past year consistently pointed to equities as being attractive, in the period’s closing weeks, our proprietary options-based tail risk model signals no compelling opportunities across asset classes with none offering large upside potential. The trade-off between the level of expected upside risk versus the level of expected downside risk is not particularly attractive for equities or any other asset class. However, on the bright side, we also do not see significant downside risk to stocks, suggesting that we aren’t near a left-tail tipping point just yet.
Thank you for investing in Janus Henderson Adaptive Global Allocation Fund.
2 | JUNE 30, 2018 |
Janus Henderson Adaptive Global Allocation Fund (unaudited)
Fund At A Glance
June 30, 2018
5 Largest Equity Holdings - (% of Net Assets) | |
Vanguard Total International Bond | |
Exchange-Traded Funds (ETFs) | 9.4% |
iShares Agency Bond | |
Exchange-Traded Funds (ETFs) | 5.2% |
iShares 7-10 Year Treasury Bond | |
Exchange-Traded Funds (ETFs) | 4.9% |
Vanguard Mortgage-Backed Securities | |
Exchange-Traded Funds (ETFs) | 4.9% |
Vanguard FTSE All-World ex-US | |
Exchange-Traded Funds (ETFs) | 4.8% |
29.2% | |
Asset Allocation - (% of Net Assets) | |||||
Investment Companies | 93.2% | ||||
Common Stocks | 14.5% | ||||
U.S. Government Agency Notes | 2.9% | ||||
Commercial Paper | 2.8% | ||||
Preferred Stocks | 0.0% | ||||
Other | (13.4)% | ||||
100.0% | |||||
Top Country Allocations - Long Positions - (% of Investment Securities) | |
As of June 30, 2018
| As of June 30, 2017
|
Janus Investment Fund | 3 |
Janus Henderson Adaptive Global Allocation Fund (unaudited)
Performance
See important disclosures on the next page. |
| Expense Ratios - | |||||||
Average Annual Total Return - for the periods ended June 30, 2018 |
|
| per the October 27, 2017 prospectuses | |||||
|
| One
| Since |
|
| Total
Annual Fund | Net Annual Fund
| |
Class A Shares at NAV |
| 6.27% | 4.24% |
|
| 1.62% | 1.06% | |
Class A Shares at MOP |
| 0.19% | 2.22% |
|
|
|
| |
Class C Shares at NAV | 5.58% | 3.49% |
|
| 2.36% | 1.81% | ||
Class C Shares at CDSC |
| 4.59% | 3.49% |
|
|
|
| |
Class D Shares(1) |
| 6.51% | 4.32% |
|
| 2.11% | 0.96% | |
Class I Shares |
| 6.57% | 4.52% |
|
| 1.50% | 0.81% | |
Class N Shares |
| 6.62% | 4.54% |
|
| 1.34% | 0.81% | |
Class S Shares |
| 6.24% | 4.12% |
|
| 1.85% | 1.31% | |
Class T Shares |
| 6.40% | 4.33% |
|
| 1.61% | 1.06% | |
MSCI All Country World Index(2) |
| 10.73% | 6.99% |
|
|
|
| |
Adaptive Global Allocation 60/40 Index (Hedged) |
| 7.12% | 5.48% |
|
|
|
| |
Bloomberg Barclays Global Aggregate Bond Index (Hedged) |
| 1.66% | 2.87% |
|
|
|
| |
Morningstar Quartile - Class I Shares |
| 2nd | 2nd |
|
|
|
| |
Morningstar Ranking - based on total returns for World Allocation Funds |
| 128/487 | 111/451 |
|
|
|
| |
Returns quoted are past performance and do not guarantee future results; current performance may be lower or higher. Investment returns and principal value will vary; there may be a gain or loss when shares are sold. For the most recent month-end performance call 800.668.0434 (or 800.525.3713 if you hold shares directly with Janus Henderson) or visit janushenderson.com/performance (or janushenderson.com/allfunds if you hold shares directly with Janus Henderson).
Maximum Offering Price (MOP) returns include the maximum sales charge of 5.75%. Net Asset Value (NAV) returns exclude this charge, which would have reduced returns.
CDSC returns include a 1% contingent deferred sales charge (CDSC) on Shares redeemed within 12 months of purchase. Net Asset Value (NAV) returns exclude this charge, which would have reduced returns.
4 | JUNE 30, 2018 |
Janus Henderson Adaptive Global Allocation Fund (unaudited)
Performance
Net expense ratios reflect the expense waiver, if any, contractually agreed to through November 1, 2018.
Performance may be affected by risks that include those associated with non-diversification, portfolio turnover, short sales, potential conflicts of interest, foreign and emerging markets, initial public offerings (IPOs), high-yield and high-risk securities, undervalued, overlooked and smaller capitalization companies, real estate related securities including Real Estate Investment Trusts (REITs), derivatives, and commodity-linked investments. Each product has different risks. Please see the prospectus for more information about risks, holdings and other details.
There is a risk that the Fund’s investments will correlate with stocks and bonds to a greater degree than anticipated, and that the proprietary options implied information model used to implement the Fund's investment strategy may not achieve the desired results. The Fund may underperform during up markets and be negatively affected in down markets. Diversification does not assure a profit or eliminate the risk of loss.
Returns include reinvestment of all dividends and distributions and do not reflect the deduction of taxes that a shareholder would pay on Fund distributions or redemptions of Fund shares. The returns do not include adjustments in accordance with generally accepted accounting principles required at the period end for financial reporting purposes.
See Financial Highlights for actual expense ratios during the reporting period.
Ranking is for the share class shown only; other classes may have different performance characteristics. When an expense waiver is in effect, it may have a material effect on the total return, and therefore the ranking for the period.
© 2018 Morningstar, Inc. All Rights Reserved.
There is no assurance that the investment process will consistently lead to successful investing.
See Notes to Schedule of Investments and Other Information for index definitions.
Index performance does not reflect the expenses of managing a portfolio as an index is unmanaged and not available for direct investment.
See “Useful Information About Your Fund Report.”
*The Fund’s inception date – June 23, 2015
(1) Closed to certain new investors.
(2) Effective on or about January 1, 2017, the Fund’s investment strategies and benchmark indices changed. These changes are intended to provide the Fund with more flexibility to invest across global equity investments and global fixed-income investments and at times, invest in commodity-linked investments, without having to allocate its investments across these asset classes in any fixed proportion. In addition, these changes limit the Fund’s use of derivatives. The changes to the Fund's benchmark indices are summarized below:
· The Fund’s primary benchmark changed from the Adaptive Global Allocation 70/30 Index to the MSCI All Country World Index.
· The Adaptive Global Allocation 60/40 Index was added as a secondary benchmark for the Fund.
· The Fund will continue to retain the Bloomberg Barclays Global Aggregate Bond Index as an additional secondary benchmark.
Janus Investment Fund | 5 |
Janus Henderson Adaptive Global Allocation Fund (unaudited)
Expense Examples
As a shareholder of the Fund, you incur two types of costs: (1) transaction costs, such as sales charges (loads) on purchase payments (applicable to Class A Shares only); and (2) ongoing costs, including management fees; 12b-1 distribution and shareholder servicing fees; transfer agent fees and expenses payable pursuant to the Transfer Agency Agreement; and other Fund expenses. This example is intended to help you understand your ongoing costs (in dollars) of investing in the Fund and to compare these costs with the ongoing costs of investing in other mutual funds. To do so, compare this 5% hypothetical example with the 5% hypothetical examples that appear in the shareholder reports of the other funds. The example is based upon an investment of $1,000 invested at the beginning of the period and held for the six-months indicated, unless noted otherwise in the table and footnotes below.
Actual Expenses
The information in the table under the heading “Actual” provides information about actual account values and actual expenses. You may use the information in these columns, together with the amount you invested, to estimate the expenses that you paid over the period. Simply divide your account value by $1,000 (for example, an $8,600 account value divided by $1,000 = 8.6), then multiply the result by the number in the appropriate column for your share class under the heading entitled “Expenses Paid During Period” to estimate the expenses you paid on your account during the period.
Hypothetical Example for Comparison Purposes
The information in the table under the heading “Hypothetical (5% return before expenses)” provides information about hypothetical account values and hypothetical expenses based upon the Fund’s actual expense ratio and an assumed rate of return of 5% per year before expenses, which is not the Fund’s actual return. The hypothetical account values and expenses may not be used to estimate the actual ending account balance or expenses you paid for the period. You may use this information to compare the ongoing costs of investing in the Fund and other funds. To do so, compare this 5% hypothetical example with the 5% hypothetical examples that appear in the shareholder reports of the other funds. Additionally, for an analysis of the fees associated with an investment in any share class or other similar funds, please visit www.finra.org/fundanalyzer.
Please note that the expenses shown in the table are meant to highlight your ongoing costs only and do not reflect any transaction costs. These fees are fully described in the Fund’s prospectuses. Therefore, the hypothetical examples are useful in comparing ongoing costs only, and will not help you determine the relative total costs of owning different funds. In addition, if these transaction costs were included, your costs would have been higher.
Actual | Hypothetical | |||||||||
| Beginning | Ending | Expenses |
| Beginning | Ending | Expenses | Net Annualized | ||
Class A Shares | $1,000.00 | $983.00 | $4.87 |
| $1,000.00 | $1,019.89 | $4.96 | 0.99% | ||
Class C Shares | $1,000.00 | $980.10 | $8.49 |
| $1,000.00 | $1,016.22 | $8.65 | 1.73% | ||
Class D Shares | $1,000.00 | $984.00 | $4.13 |
| $1,000.00 | $1,020.63 | $4.21 | 0.84% | ||
Class I Shares | $1,000.00 | $984.90 | $3.59 |
| $1,000.00 | $1,021.17 | $3.66 | 0.73% | ||
Class N Shares | $1,000.00 | $984.90 | $3.45 |
| $1,000.00 | $1,021.32 | $3.51 | 0.70% | ||
Class S Shares | $1,000.00 | $983.00 | $5.31 |
| $1,000.00 | $1,019.44 | $5.41 | 1.08% | ||
Class T Shares | $1,000.00 | $984.00 | $4.38 |
| $1,000.00 | $1,020.38 | $4.46 | 0.89% | ||
† | Expenses Paid During Period are equal to the Net Annualized Expense Ratio multiplied by the average account value over the period, multiplied by 181/365 (to reflect the one-half year period). Expenses in the examples include the effect of applicable fee waivers and/or expense reimbursements, if any. Had such waivers and/or reimbursements not been in effect, your expenses would have been higher. Please refer to the Notes to Financial Statements or the Fund’s prospectuses for more information regarding waivers and/or reimbursements. | |||||||||
6 | JUNE 30, 2018 |
Janus Henderson Adaptive Global Allocation Fund
Schedule of Investments
June 30, 2018
Shares
or | Value | ||||||
Common Stocks – 14.5% | |||||||
Aerospace & Defense – 0.1% | |||||||
Arconic Inc | 375 | $6,379 | |||||
BAE Systems PLC | 456 | 3,891 | |||||
Boeing Co | 7 | 2,349 | |||||
Harris Corp | 11 | 1,590 | |||||
L3 Technologies Inc | 5 | 962 | |||||
Leonardo SpA | 217 | 2,142 | |||||
Meggitt PLC | 60 | 390 | |||||
MTU Aero Engines AG | 25 | 4,801 | |||||
Raytheon Co | 81 | 15,648 | |||||
Rolls-Royce Holdings PLC* | 62 | 808 | |||||
Safran SA | 23 | 2,790 | |||||
Textron Inc | 45 | 2,966 | |||||
TransDigm Group Inc* | 5 | 1,726 | |||||
46,442 | |||||||
Air Freight & Logistics – 0% | |||||||
CH Robinson Worldwide Inc | 122 | 10,207 | |||||
Expeditors International of Washington Inc | 48 | 3,509 | |||||
FedEx Corp | 64 | 14,532 | |||||
Royal Mail PLC | 1,115 | 7,429 | |||||
United Parcel Service Inc | 18 | 1,912 | |||||
37,589 | |||||||
Airlines – 0% | |||||||
Alaska Air Group Inc | 64 | 3,865 | |||||
American Airlines Group Inc | 152 | 5,770 | |||||
Delta Air Lines Inc | 37 | 1,833 | |||||
Japan Airlines Co Ltd | 100 | 3,544 | |||||
Southwest Airlines Co | 316 | 16,078 | |||||
United Continental Holdings Inc* | 92 | 6,415 | |||||
37,505 | |||||||
Auto Components – 0.1% | |||||||
Aptiv PLC | 419 | 38,393 | |||||
NOK Corp | 200 | 3,867 | |||||
Nokian Renkaat OYJ | 430 | 16,947 | |||||
Stanley Electric Co Ltd | 100 | 3,401 | |||||
Toyoda Gosei Co Ltd | 100 | 2,532 | |||||
Valeo SA | 134 | 7,314 | |||||
Yokohama Rubber Co Ltd | 100 | 2,076 | |||||
74,530 | |||||||
Automobiles – 0.1% | |||||||
Ferrari NV | 42 | 5,699 | |||||
Fiat Chrysler Automobiles NV* | 405 | 7,709 | |||||
Ford Motor Co | 2,842 | 31,461 | |||||
General Motors Co | 710 | 27,974 | |||||
Harley-Davidson Inc | 147 | 6,186 | |||||
Mitsubishi Motors Corp | 300 | 2,389 | |||||
Nissan Motor Co Ltd | 600 | 5,831 | |||||
Peugeot SA | 38 | 866 | |||||
Renault SA | 99 | 8,402 | |||||
Subaru Corp | 200 | 5,819 | |||||
Yamaha Motor Co Ltd | 100 | 2,511 | |||||
104,847 | |||||||
Banks – 0.5% | |||||||
Aozora Bank Ltd | 200 | 7,606 | |||||
Bank of America Corp | 659 | 18,577 | |||||
Bank of East Asia Ltd | 2,000 | 7,958 | |||||
Bank of Kyoto Ltd | 100 | 4,624 | |||||
Bank of Queensland Ltd | 1,091 | 8,218 | |||||
Bankia SA | 8,649 | 32,246 | |||||
Barclays PLC | 3,961 | 9,875 | |||||
See Notes to Schedule of Investments and Other Information and Notes to Financial Statements. | |
Janus Investment Fund | 7 |
Janus Henderson Adaptive Global Allocation Fund
Schedule of Investments
June 30, 2018
Shares
or | Value | ||||||
Common Stocks – (continued) | |||||||
Banks – (continued) | |||||||
BB&T Corp | 59 | $2,976 | |||||
Bendigo & Adelaide Bank Ltd | 626 | 5,051 | |||||
BOC Hong Kong Holdings Ltd | 3,000 | 14,066 | |||||
CaixaBank SA | 1,000 | 4,319 | |||||
Chiba Bank Ltd | 900 | 6,342 | |||||
Citigroup Inc | 258 | 17,265 | |||||
Comerica Inc | 207 | 18,820 | |||||
Commonwealth Bank of Australia | 152 | 8,229 | |||||
Concordia Financial Group Ltd | 400 | 2,033 | |||||
DNB ASA | 222 | 4,332 | |||||
Erste Group Bank AG* | 72 | 3,001 | |||||
Fifth Third Bancorp | 511 | 14,666 | |||||
Fukuoka Financial Group Inc | 2,000 | 10,044 | |||||
Hang Seng Bank Ltd | 1,300 | 32,353 | |||||
Huntington Bancshares Inc/OH | 178 | 2,627 | |||||
Japan Post Bank Co Ltd | 400 | 4,651 | |||||
JPMorgan Chase & Co | 76 | 7,919 | |||||
Mebuki Financial Group Inc | 2,000 | 6,710 | |||||
National Australia Bank Ltd | 824 | 16,769 | |||||
Nordea Bank AB | 326 | 3,138 | |||||
People's United Financial Inc | 792 | 14,327 | |||||
Raiffeisen Bank International AG | 21 | 643 | |||||
Regions Financial Corp | 1,009 | 17,940 | |||||
Royal Bank of Scotland Group PLC* | 2,605 | 8,800 | |||||
Seven Bank Ltd | 1,400 | 4,282 | |||||
Shinsei Bank Ltd | 200 | 3,074 | |||||
Shizuoka Bank Ltd | 300 | 2,693 | |||||
Standard Chartered PLC | 735 | 6,715 | |||||
SunTrust Banks Inc | 123 | 8,120 | |||||
Suruga Bank Ltd | 500 | 4,468 | |||||
Wells Fargo & Co | 212 | 11,753 | |||||
Zions Bancorporation | 439 | 23,131 | |||||
380,361 | |||||||
Beverages – 0.3% | |||||||
Brown-Forman Corp - Class B | 242 | 11,860 | |||||
Coca-Cola Amatil Ltd | 1,935 | 13,164 | |||||
Coca-Cola Co | 1,607 | 70,483 | |||||
Coca-Cola European Partners PLC | 92 | 3,739 | |||||
Constellation Brands Inc | 61 | 13,351 | |||||
Davide Campari-Milano SpA | 1,417 | 11,644 | |||||
Heineken NV | 3 | 301 | |||||
Molson Coors Brewing Co | 183 | 12,451 | |||||
Monster Beverage Corp* | 134 | 7,678 | |||||
PepsiCo Inc | 392 | 42,677 | |||||
Suntory Beverage & Food Ltd | 100 | 4,269 | |||||
Treasury Wine Estates Ltd | 165 | 2,131 | |||||
193,748 | |||||||
Biotechnology – 0.2% | |||||||
AbbVie Inc | 149 | 13,805 | |||||
Alexion Pharmaceuticals Inc* | 46 | 5,711 | |||||
Biogen Inc* | 51 | 14,802 | |||||
Celgene Corp* | 326 | 25,891 | |||||
CSL Ltd | 94 | 13,436 | |||||
Gilead Sciences Inc | 540 | 38,254 | |||||
Grifols SA | 876 | 26,270 | |||||
Incyte Corp* | 212 | 14,204 | |||||
Regeneron Pharmaceuticals Inc* | 10 | 3,450 | |||||
Vertex Pharmaceuticals Inc* | 91 | 15,466 | |||||
171,289 | |||||||
See Notes to Schedule of Investments and Other Information and Notes to Financial Statements. | |
8 | JUNE 30, 2018 |
Janus Henderson Adaptive Global Allocation Fund
Schedule of Investments
June 30, 2018
Shares
or | Value | ||||||
Common Stocks – (continued) | |||||||
Building Products – 0% | |||||||
Allegion PLC | 116 | $8,974 | |||||
Assa Abloy AB | 171 | 3,640 | |||||
Cie de Saint-Gobain | 86 | 3,835 | |||||
Fortune Brands Home & Security Inc | 187 | 10,040 | |||||
Johnson Controls International plc | 25 | 836 | |||||
27,325 | |||||||
Capital Markets – 0.3% | |||||||
ASX Ltd | 533 | 25,493 | |||||
Bank of New York Mellon Corp | 229 | 12,350 | |||||
E*TRADE Financial Corp* | 43 | 2,630 | |||||
Franklin Resources Inc | 477 | 15,288 | |||||
Goldman Sachs Group Inc | 55 | 12,131 | |||||
Hong Kong Exchanges & Clearing Ltd | 600 | 17,979 | |||||
IGM Financial Inc | 667 | 19,338 | |||||
Investec PLC | 200 | 1,418 | |||||
Japan Exchange Group Inc | 400 | 7,429 | |||||
London Stock Exchange Group PLC | 217 | 12,783 | |||||
Macquarie Group Ltd | 44 | 4,043 | |||||
Moody's Corp | 49 | 8,357 | |||||
Morgan Stanley | 171 | 8,105 | |||||
Natixis SA | 633 | 4,481 | |||||
Northern Trust Corp | 36 | 3,704 | |||||
Partners Group Holding AG | 19 | 13,942 | |||||
Raymond James Financial Inc | 46 | 4,110 | |||||
SBI Holdings Inc/Japan | 600 | 15,420 | |||||
Thomson Reuters Corp | 471 | 19,008 | |||||
208,009 | |||||||
Chemicals – 0.7% | |||||||
Air Products & Chemicals Inc | 40 | 6,229 | |||||
Air Water Inc | 400 | 7,335 | |||||
Akzo Nobel NV | 625 | 53,252 | |||||
Albemarle Corp | 63 | 5,943 | |||||
CF Industries Holdings Inc | 137 | 6,083 | |||||
Clariant AG* | 724 | 17,343 | |||||
Covestro AG | 236 | 21,042 | |||||
Daicel Corp | 400 | 4,421 | |||||
DowDuPont Inc | 210 | 13,843 | |||||
Eastman Chemical Co | 87 | 8,697 | |||||
Ecolab Inc | 181 | 25,400 | |||||
Evonik Industries AG | 646 | 22,113 | |||||
FMC Corp | 110 | 9,813 | |||||
Hitachi Chemical Co Ltd | 500 | 10,074 | |||||
Incitec Pivot Ltd | 6,584 | 17,755 | |||||
International Flavors & Fragrances Inc | 164 | 20,329 | |||||
Johnson Matthey PLC | 337 | 16,070 | |||||
JSR Corp | 300 | 5,093 | |||||
K+S AG | 705 | 17,397 | |||||
Kaneka Corp | 1,000 | 8,954 | |||||
Kansai Paint Co Ltd | 100 | 2,074 | |||||
Koninklijke DSM NV | 228 | 22,892 | |||||
LANXESS AG | 127 | 9,896 | |||||
LyondellBasell Industries NV | 54 | 5,932 | |||||
Mitsubishi Gas Chemical Co Inc | 300 | 6,787 | |||||
Mosaic Co | 95 | 2,665 | |||||
Nippon Paint Holdings Co Ltd | 100 | 4,298 | |||||
Nissan Chemical Industries Ltd | 100 | 4,660 | |||||
Orica Ltd | 940 | 12,370 | |||||
PPG Industries Inc | 73 | 7,572 | |||||
Praxair Inc | 45 | 7,117 | |||||
See Notes to Schedule of Investments and Other Information and Notes to Financial Statements. | |
Janus Investment Fund | 9 |
Janus Henderson Adaptive Global Allocation Fund
Schedule of Investments
June 30, 2018
Shares
or | Value | ||||||
Common Stocks – (continued) | |||||||
Chemicals – (continued) | |||||||
Sherwin-Williams Co | 23 | $9,374 | |||||
Symrise AG | 586 | 51,367 | |||||
Taiyo Nippon Sanso Corp | 500 | 7,160 | |||||
Teijin Ltd | 300 | 5,498 | |||||
Tosoh Corp | 300 | 4,643 | |||||
Umicore SA | 37 | 2,113 | |||||
Yara International ASA | 13 | 538 | |||||
464,142 | |||||||
Commercial Services & Supplies – 0.2% | |||||||
Brambles Ltd | 1,510 | 9,936 | |||||
Cintas Corp | 66 | 12,215 | |||||
Edenred | 230 | 7,258 | |||||
G4S PLC | 2,200 | 7,760 | |||||
Republic Services Inc | 506 | 34,590 | |||||
Waste Management Inc | 503 | 40,914 | |||||
112,673 | |||||||
Communications Equipment – 0.1% | |||||||
Cisco Systems Inc | 174 | 7,487 | |||||
F5 Networks Inc* | 58 | 10,002 | |||||
Juniper Networks Inc | 1,593 | 43,680 | |||||
Motorola Solutions Inc | 130 | 15,128 | |||||
Nokia OYJ | 2,898 | 16,624 | |||||
Telefonaktiebolaget LM Ericsson | 884 | 6,806 | |||||
99,727 | |||||||
Construction & Engineering – 0.1% | |||||||
Bouygues SA | 106 | 4,563 | |||||
CIMIC Group Ltd | 167 | 5,223 | |||||
Fluor Corp | 248 | 12,097 | |||||
Hochtief AG | 11 | 1,987 | |||||
Jacobs Engineering Group Inc | 160 | 10,158 | |||||
Quanta Services Inc* | 177 | 5,912 | |||||
Skanska AB | 106 | 1,925 | |||||
SNC-Lavalin Group Inc | 72 | 3,180 | |||||
45,045 | |||||||
Construction Materials – 0.1% | |||||||
Boral Ltd | 1,561 | 7,531 | |||||
CRH PLC | 321 | 11,344 | |||||
James Hardie Industries PLC (CDI) | 295 | 4,965 | |||||
Martin Marietta Materials Inc | 35 | 7,817 | |||||
Taiheiyo Cement Corp | 200 | 6,575 | |||||
Vulcan Materials Co | 42 | 5,421 | |||||
43,653 | |||||||
Consumer Finance – 0% | |||||||
Acom Co Ltd | 700 | 2,689 | |||||
American Express Co | 15 | 1,470 | |||||
Synchrony Financial | 142 | 4,740 | |||||
8,899 | |||||||
Containers & Packaging – 0.1% | |||||||
Amcor Ltd/Australia | 1,300 | 13,882 | |||||
Avery Dennison Corp | 206 | 21,033 | |||||
Ball Corp | 359 | 12,762 | |||||
CCL Industries Inc | 220 | 10,787 | |||||
International Paper Co | 295 | 15,364 | |||||
Packaging Corp of America | 39 | 4,360 | |||||
Sealed Air Corp | 417 | 17,702 | |||||
95,890 | |||||||
Distributors – 0% | |||||||
Jardine Cycle & Carriage Ltd | 200 | 4,663 | |||||
See Notes to Schedule of Investments and Other Information and Notes to Financial Statements. | |
10 | JUNE 30, 2018 |
Janus Henderson Adaptive Global Allocation Fund
Schedule of Investments
June 30, 2018
Shares
or | Value | ||||||
Common Stocks – (continued) | |||||||
Diversified Consumer Services – 0.1% | |||||||
H&R Block Inc | 3,773 | $85,949 | |||||
Diversified Financial Services – 0.1% | |||||||
AMP Ltd | 688 | 1,811 | |||||
Eurazeo SA | 255 | 19,319 | |||||
Industrivarden AB | 385 | 7,458 | |||||
Kinnevik AB | 539 | 18,448 | |||||
Standard Life Aberdeen PLC | 6,413 | 27,554 | |||||
Wendel SA | 32 | 4,403 | |||||
78,993 | |||||||
Diversified Telecommunication Services – 0.6% | |||||||
AT&T Inc | 3,407 | 109,710 | |||||
BCE Inc | 254 | 10,288 | |||||
CenturyLink Inc | 1,831 | 34,130 | |||||
Deutsche Telekom AG* | 98 | 1,521 | |||||
Elisa OYJ | 472 | 21,856 | |||||
HKT Trust & HKT Ltd | 14,000 | 17,852 | |||||
Iliad SA | 32 | 5,052 | |||||
Koninklijke KPN NV | 6,201 | 16,854 | |||||
Nippon Telegraph & Telephone Corp | 100 | 4,545 | |||||
Orange SA | 764 | 12,779 | |||||
PCCW Ltd | 21,000 | 11,817 | |||||
Proximus SADP | 167 | 3,766 | |||||
Singapore Telecommunications Ltd | 7,600 | 17,161 | |||||
Swisscom AG | 19 | 8,497 | |||||
Telecom Italia SpA/Milano - RSP | 3,929 | 2,560 | |||||
Telefonica Deutschland Holding AG | 499 | 1,966 | |||||
Telefonica SA | 1,380 | 11,761 | |||||
Telenor ASA | 584 | 11,974 | |||||
Telia Co AB | 1,963 | 8,972 | |||||
Telstra Corp Ltd | 11,043 | 21,390 | |||||
TELUS Corp | 340 | 12,079 | |||||
TPG Telecom Ltd | 1,089 | 4,164 | |||||
Verizon Communications Inc | 1,649 | 82,961 | |||||
433,655 | |||||||
Electric Utilities – 0.2% | |||||||
Alliant Energy Corp | 211 | 8,930 | |||||
AusNet Services | 1,948 | 2,322 | |||||
Chubu Electric Power Co Inc | 100 | 1,499 | |||||
Chugoku Electric Power Co Inc | 500 | 6,463 | |||||
CLP Holdings Ltd | 1,000 | 10,729 | |||||
Duke Energy Corp | 12 | 949 | |||||
Electricite de France SA | 504 | 6,908 | |||||
Emera Inc | 52 | 1,693 | |||||
Eversource Energy | 122 | 7,150 | |||||
Fortum OYJ | 623 | 14,859 | |||||
HK Electric Investments & HK Electric Investments Ltd | 1,500 | 1,430 | |||||
Hydro One Ltd | 1,512 | 23,051 | |||||
Kyushu Electric Power Co Inc | 100 | 1,118 | |||||
PG&E Corp* | 16 | 681 | |||||
Pinnacle West Capital Corp | 94 | 7,573 | |||||
Power Assets Holdings Ltd | 2,000 | 13,981 | |||||
PPL Corp | 135 | 3,854 | |||||
Terna Rete Elettrica Nazionale SpA | 1,393 | 7,516 | |||||
Tohoku Electric Power Co Inc | 100 | 1,221 | |||||
Tokyo Electric Power Co Holdings Inc* | 100 | 465 | |||||
122,392 | |||||||
Electrical Equipment – 0% | |||||||
AMETEK Inc | 255 | 18,401 | |||||
Melrose Industries PLC | 3,507 | 9,840 | |||||
See Notes to Schedule of Investments and Other Information and Notes to Financial Statements. | |
Janus Investment Fund | 11 |
Janus Henderson Adaptive Global Allocation Fund
Schedule of Investments
June 30, 2018
Shares
or | Value | ||||||
Common Stocks – (continued) | |||||||
Electrical Equipment – (continued) | |||||||
Mitsubishi Electric Corp | 100 | $1,329 | |||||
OSRAM Licht AG | 80 | 3,267 | |||||
Rockwell Automation Inc | 22 | 3,657 | |||||
36,494 | |||||||
Electronic Equipment, Instruments & Components – 0.2% | |||||||
Amphenol Corp | 740 | 64,491 | |||||
Corning Inc | 806 | 22,173 | |||||
FLIR Systems Inc | 162 | 8,419 | |||||
Hamamatsu Photonics KK | 100 | 4,288 | |||||
Hexagon AB | 358 | 19,946 | |||||
119,317 | |||||||
Energy Equipment & Services – 0.3% | |||||||
Baker Hughes a GE Co | 1,149 | 37,951 | |||||
Halliburton Co | 1,033 | 46,547 | |||||
National Oilwell Varco Inc | 413 | 17,924 | |||||
Schlumberger Ltd | 1,037 | 69,510 | |||||
TechnipFMC PLC | 337 | 10,696 | |||||
Tenaris SA | 142 | 2,589 | |||||
185,217 | |||||||
Equity Real Estate Investment Trusts (REITs) – 0.3% | |||||||
Alexandria Real Estate Equities Inc | 56 | 7,066 | |||||
American Tower Corp | 29 | 4,181 | |||||
Apartment Investment & Management Co | 151 | 6,387 | |||||
Ascendas Real Estate Investment Trust | 1,500 | 2,911 | |||||
Boston Properties Inc | 16 | 2,007 | |||||
British Land Co PLC | 99 | 878 | |||||
CapitaLand Mall Trust | 6,300 | 9,560 | |||||
Covivio | 5 | 520 | |||||
Dexus | 383 | 2,761 | |||||
Duke Realty Corp | 158 | 4,587 | |||||
Equity Residential | 73 | 4,649 | |||||
Essex Property Trust Inc | 5 | 1,195 | |||||
Federal Realty Investment Trust | 14 | 1,772 | |||||
Goodman Group | 1,289 | 9,199 | |||||
GPT Group | 998 | 3,749 | |||||
H&R Real Estate Investment Trust | 204 | 3,122 | |||||
Hammerson PLC | 323 | 2,221 | |||||
Iron Mountain Inc | 260 | 9,103 | |||||
Klepierre SA | 65 | 2,445 | |||||
Land Securities Group PLC | 114 | 1,435 | |||||
Mid-America Apartment Communities Inc | 94 | 9,463 | |||||
Mirvac Group | 6,327 | 10,186 | |||||
Nippon Prologis REIT Inc | 7 | 14,525 | |||||
Prologis Inc | 97 | 6,372 | |||||
Realty Income Corp | 86 | 4,626 | |||||
RioCan Real Estate Investment Trust | 415 | 7,624 | |||||
SBA Communications Corp* | 33 | 5,449 | |||||
Scentre Group | 2,392 | 7,791 | |||||
SL Green Realty Corp | 20 | 2,011 | |||||
SmartCentres Real Estate Investment Trust | 49 | 1,138 | |||||
UDR Inc | 146 | 5,481 | |||||
United Urban Investment Corp | 10 | 15,542 | |||||
Ventas Inc | 153 | 8,713 | |||||
Vicinity Centres | 115 | 221 | |||||
Vornado Realty Trust | 66 | 4,879 | |||||
Weyerhaeuser Co | 237 | 8,641 | |||||
192,410 | |||||||
Food & Staples Retailing – 0.4% | |||||||
Aeon Co Ltd | 100 | 2,139 | |||||
See Notes to Schedule of Investments and Other Information and Notes to Financial Statements. | |
12 | JUNE 30, 2018 |
Janus Henderson Adaptive Global Allocation Fund
Schedule of Investments
June 30, 2018
Shares
or | Value | ||||||
Common Stocks – (continued) | |||||||
Food & Staples Retailing – (continued) | |||||||
Carrefour SA | 241 | $3,889 | |||||
Colruyt SA* | 196 | 11,177 | |||||
George Weston Ltd | 255 | 20,807 | |||||
ICA Gruppen AB# | 256 | 7,849 | |||||
J Sainsbury PLC | 676 | 2,864 | |||||
Kroger Co | 453 | 12,888 | |||||
Loblaw Cos Ltd | 299 | 15,376 | |||||
METRO AG | 173 | 2,137 | |||||
Seven & i Holdings Co Ltd | 100 | 4,359 | |||||
Sysco Corp | 1,298 | 88,640 | |||||
Tesco PLC | 1,556 | 5,269 | |||||
Walgreens Boots Alliance Inc | 422 | 25,326 | |||||
Walmart Inc | 238 | 20,385 | |||||
Wesfarmers Ltd | 353 | 12,943 | |||||
Wm Morrison Supermarkets PLC | 4,093 | 13,595 | |||||
Woolworths Group Ltd | 616 | 13,951 | |||||
263,594 | |||||||
Food Products – 0.3% | |||||||
Associated British Foods PLC | 154 | 5,551 | |||||
Calbee Inc | 100 | 3,760 | |||||
Campbell Soup Co | 420 | 17,027 | |||||
Conagra Brands Inc | 113 | 4,037 | |||||
Danone SA | 357 | 26,168 | |||||
General Mills Inc | 282 | 12,481 | |||||
Hershey Co | 577 | 53,696 | |||||
Hormel Foods Corp | 215 | 8,000 | |||||
JM Smucker Co | 20 | 2,150 | |||||
Kellogg Co | 148 | 10,341 | |||||
Marine Harvest ASA | 124 | 2,470 | |||||
McCormick & Co Inc/MD | 352 | 40,864 | |||||
Mondelez International Inc | 501 | 20,541 | |||||
Orkla ASA | 2,382 | 20,867 | |||||
Toyo Suisan Kaisha Ltd | 100 | 3,560 | |||||
WH Group Ltd | 1,500 | 1,213 | |||||
Wilmar International Ltd | 500 | 1,121 | |||||
Yamazaki Baking Co Ltd | 100 | 2,612 | |||||
236,459 | |||||||
Gas Utilities – 0% | |||||||
APA Group | 206 | 1,500 | |||||
Gas Natural SDG SA | 317 | 8,387 | |||||
Hong Kong & China Gas Co Ltd | 6,200 | 11,832 | |||||
Osaka Gas Co Ltd | 100 | 2,069 | |||||
Toho Gas Co Ltd | 100 | 3,460 | |||||
27,248 | |||||||
Health Care Equipment & Supplies – 0.6% | |||||||
Abbott Laboratories | 218 | 13,296 | |||||
Baxter International Inc | 952 | 70,296 | |||||
Becton Dickinson and Co | 23 | 5,510 | |||||
Boston Scientific Corp* | 624 | 20,405 | |||||
Cooper Cos Inc | 33 | 7,770 | |||||
Cyberdyne Inc* | 200 | 2,337 | |||||
Dentsply Sirona Inc | 70 | 3,064 | |||||
Edwards Lifesciences Corp* | 120 | 17,468 | |||||
Essilor International Cie Generale d'Optique SA | 213 | 30,050 | |||||
Hologic Inc* | 99 | 3,935 | |||||
Olympus Corp | 100 | 3,736 | |||||
ResMed Inc | 114 | 11,808 | |||||
Smith & Nephew PLC | 1,938 | 35,633 | |||||
Sonova Holding AG | 391 | 70,172 | |||||
See Notes to Schedule of Investments and Other Information and Notes to Financial Statements. | |
Janus Investment Fund | 13 |
Janus Henderson Adaptive Global Allocation Fund
Schedule of Investments
June 30, 2018
Shares
or | Value | ||||||
Common Stocks – (continued) | |||||||
Health Care Equipment & Supplies – (continued) | |||||||
Straumann Holding AG | 61 | $46,455 | |||||
Stryker Corp | 151 | 25,498 | |||||
Varian Medical Systems Inc* | 166 | 18,878 | |||||
Zimmer Biomet Holdings Inc | 89 | 9,918 | |||||
396,229 | |||||||
Health Care Providers & Services – 0.3% | |||||||
Alfresa Holdings Corp | 100 | 2,349 | |||||
Anthem Inc | 25 | 5,951 | |||||
Cardinal Health Inc | 36 | 1,758 | |||||
Centene Corp* | 49 | 6,037 | |||||
Cigna Corp | 71 | 12,066 | |||||
CVS Health Corp | 100 | 6,435 | |||||
DaVita Inc* | 275 | 19,096 | |||||
Fresenius Medical Care AG & Co KGaA | 25 | 2,523 | |||||
Fresenius SE & Co KGaA | 349 | 28,021 | |||||
Henry Schein Inc* | 77 | 5,593 | |||||
Laboratory Corp of America Holdings* | 159 | 28,545 | |||||
Medipal Holdings Corp | 200 | 4,018 | |||||
Quest Diagnostics Inc | 157 | 17,261 | |||||
Ramsay Health Care Ltd | 21 | 840 | |||||
Sonic Healthcare Ltd | 923 | 16,785 | |||||
Suzuken Co Ltd/Aichi Japan | 100 | 4,231 | |||||
UnitedHealth Group Inc | 22 | 5,397 | |||||
Universal Health Services Inc | 163 | 18,165 | |||||
185,071 | |||||||
Health Care Technology – 0% | |||||||
M3 Inc | 100 | 3,981 | |||||
Hotels, Restaurants & Leisure – 0.4% | |||||||
Accor SA | 149 | 7,298 | |||||
Carnival Corp | 187 | 10,717 | |||||
Chipotle Mexican Grill Inc* | 91 | 39,255 | |||||
Crown Resorts Ltd | 933 | 9,342 | |||||
Domino's Pizza Enterprises Ltd | 27 | 1,043 | |||||
Flight Centre Travel Group Ltd | 152 | 7,155 | |||||
Galaxy Entertainment Group Ltd | 1,000 | 7,676 | |||||
Hilton Worldwide Holdings Inc | 516 | 40,847 | |||||
InterContinental Hotels Group PLC | 240 | 14,928 | |||||
Marriott International Inc/MD | 59 | 7,469 | |||||
McDonald's Corp | 126 | 19,743 | |||||
McDonald's Holdings Co Japan Ltd | 100 | 5,099 | |||||
Merlin Entertainments PLC | 1,387 | 7,075 | |||||
MGM China Holdings Ltd | 2,000 | 4,631 | |||||
Norwegian Cruise Line Holdings Ltd* | 376 | 17,766 | |||||
Restaurant Brands International Inc | 41 | 2,473 | |||||
Royal Caribbean Cruises Ltd | 7 | 725 | |||||
Sands China Ltd | 1,600 | 8,526 | |||||
Starbucks Corp | 416 | 20,322 | |||||
Tabcorp Holdings Ltd | 2,652 | 8,776 | |||||
Whitbread PLC | 504 | 26,324 | |||||
Wynn Resorts Ltd | 43 | 7,196 | |||||
274,386 | |||||||
Household Durables – 0.1% | |||||||
Electrolux AB | 90 | 2,049 | |||||
Husqvarna AB | 275 | 2,605 | |||||
Leggett & Platt Inc | 422 | 18,838 | |||||
Lennar Corp | 49 | 2,573 | |||||
Mohawk Industries Inc* | 66 | 14,142 | |||||
Newell Brands Inc | 654 | 16,867 | |||||
Sekisui Chemical Co Ltd | 100 | 1,703 | |||||
See Notes to Schedule of Investments and Other Information and Notes to Financial Statements. | |
14 | JUNE 30, 2018 |
Janus Henderson Adaptive Global Allocation Fund
Schedule of Investments
June 30, 2018
Shares
or | Value | ||||||
Common Stocks – (continued) | |||||||
Household Durables – (continued) | |||||||
Whirlpool Corp | 125 | $18,279 | |||||
77,056 | |||||||
Household Products – 0.4% | |||||||
Church & Dwight Co Inc | 688 | 36,574 | |||||
Clorox Co | 309 | 41,792 | |||||
Colgate-Palmolive Co | 1,409 | 91,317 | |||||
Henkel AG & Co KGaA | 18 | 2,003 | |||||
Kimberly-Clark Corp | 610 | 64,257 | |||||
Lion Corp | 200 | 3,667 | |||||
Procter & Gamble Co | 677 | 52,847 | |||||
Reckitt Benckiser Group PLC | 79 | 6,493 | |||||
298,950 | |||||||
Independent Power and Renewable Electricity Producers – 0% | |||||||
AES Corp/VA | 50 | 671 | |||||
Electric Power Development Co Ltd | 100 | 2,581 | |||||
NRG Energy Inc | 57 | 1,750 | |||||
Uniper SE | 231 | 6,886 | |||||
11,888 | |||||||
Industrial Conglomerates – 0.1% | |||||||
3M Co | 14 | 2,754 | |||||
CK Hutchison Holdings Ltd | 1,000 | 10,554 | |||||
General Electric Co | 2,251 | 30,636 | |||||
Keihan Holdings Co Ltd | 100 | 3,587 | |||||
Roper Technologies Inc | 59 | 16,279 | |||||
Seibu Holdings Inc | 100 | 1,685 | |||||
Sembcorp Industries Ltd | 900 | 1,812 | |||||
Smiths Group PLC | 258 | 5,779 | |||||
73,086 | |||||||
Information Technology Services – 0.7% | |||||||
Amadeus IT Group SA | 334 | 26,314 | |||||
Atos SE | 253 | 34,473 | |||||
Automatic Data Processing Inc | 193 | 25,889 | |||||
Broadridge Financial Solutions Inc | 51 | 5,870 | |||||
CGI Group Inc* | 474 | 30,041 | |||||
Cognizant Technology Solutions Corp | 160 | 12,638 | |||||
Computershare Ltd | 693 | 9,483 | |||||
DXC Technology Co | 400 | 32,244 | |||||
Fidelity National Information Services Inc | 638 | 67,647 | |||||
Fiserv Inc* | 130 | 9,632 | |||||
FleetCor Technologies Inc* | 77 | 16,220 | |||||
Gartner Inc* | 216 | 28,706 | |||||
Global Payments Inc | 448 | 49,948 | |||||
International Business Machines Corp | 64 | 8,941 | |||||
Mastercard Inc | 50 | 9,826 | |||||
Nomura Research Institute Ltd | 200 | 9,682 | |||||
NTT Data Corp | 200 | 2,301 | |||||
Paychex Inc | 304 | 20,778 | |||||
PayPal Holdings Inc* | 209 | 17,403 | |||||
Visa Inc | 51 | 6,755 | |||||
Western Union Co | 2,077 | 42,225 | |||||
Wirecard AG | 41 | 6,599 | |||||
473,615 | |||||||
Insurance – 0.6% | |||||||
Aegon NV | 973 | 5,814 | |||||
Ageas | 138 | 6,958 | |||||
AIA Group Ltd | 1,200 | 10,389 | |||||
American International Group Inc | 271 | 14,368 | |||||
Aon PLC | 170 | 23,319 | |||||
Arthur J Gallagher & Co | 352 | 22,979 | |||||
See Notes to Schedule of Investments and Other Information and Notes to Financial Statements. | |
Janus Investment Fund | 15 |
Janus Henderson Adaptive Global Allocation Fund
Schedule of Investments
June 30, 2018
Shares
or | Value | ||||||
Common Stocks – (continued) | |||||||
Insurance – (continued) | |||||||
Assurant Inc | 231 | $23,906 | |||||
Baloise Holding AG | 32 | 4,656 | |||||
Chubb Ltd | 261 | 33,152 | |||||
Cincinnati Financial Corp | 157 | 10,497 | |||||
Everest Re Group Ltd | 62 | 14,290 | |||||
Gjensidige Forsikring ASA | 699 | 11,452 | |||||
Hannover Rueck SE | 9 | 1,122 | |||||
Hartford Financial Services Group Inc | 192 | 9,817 | |||||
Insurance Australia Group Ltd | 2,289 | 14,499 | |||||
Intact Financial Corp | 308 | 21,849 | |||||
Loews Corp | 620 | 29,934 | |||||
Mapfre SA | 6,154 | 18,518 | |||||
Medibank Pvt Ltd | 4,663 | 10,094 | |||||
NN Group NV | 87 | 3,530 | |||||
Poste Italiane SpA (144A) | 278 | 2,321 | |||||
Power Financial Corp | 626 | 14,644 | |||||
Progressive Corp | 326 | 19,283 | |||||
Prudential Financial Inc | 16 | 1,496 | |||||
QBE Insurance Group Ltd | 2,387 | 17,256 | |||||
RSA Insurance Group PLC | 1,331 | 11,930 | |||||
Sampo Oyj | 212 | 10,337 | |||||
SCOR SE | 38 | 1,410 | |||||
Sony Financial Holdings Inc | 600 | 11,427 | |||||
Swiss Life Holding AG* | 5 | 1,740 | |||||
Torchmark Corp | 270 | 21,981 | |||||
Willis Towers Watson PLC | 211 | 31,988 | |||||
Zurich Insurance Group AG | 15 | 4,451 | |||||
441,407 | |||||||
Internet & Direct Marketing Retail – 0.1% | |||||||
Amazon.com Inc* | 12 | 20,398 | |||||
Booking Holdings Inc* | 1 | 2,027 | |||||
Expedia Group Inc | 80 | 9,615 | |||||
Netflix Inc* | 36 | 14,091 | |||||
Rakuten Inc | 100 | 675 | |||||
TripAdvisor Inc* | 236 | 13,148 | |||||
Zalando SE (144A)* | 98 | 5,473 | |||||
65,427 | |||||||
Internet Software & Services – 0.1% | |||||||
Akamai Technologies Inc* | 283 | 20,724 | |||||
Alphabet Inc* | 18 | 20,325 | |||||
eBay Inc* | 523 | 18,964 | |||||
Facebook Inc* | 65 | 12,631 | |||||
REA Group Ltd | 6 | 405 | |||||
Shopify Inc* | 28 | 4,084 | |||||
Twitter Inc* | 281 | 12,271 | |||||
United Internet AG | 51 | 2,920 | |||||
VeriSign Inc* | 20 | 2,748 | |||||
95,072 | |||||||
Leisure Products – 0% | |||||||
Hasbro Inc | 211 | 19,477 | |||||
Sankyo Co Ltd | 100 | 3,912 | |||||
23,389 | |||||||
Life Sciences Tools & Services – 0.2% | |||||||
Agilent Technologies Inc | 11 | 680 | |||||
Illumina Inc* | 17 | 4,748 | |||||
IQVIA Holdings Inc* | 302 | 30,146 | |||||
Lonza Group AG* | 25 | 6,644 | |||||
Mettler-Toledo International Inc* | 45 | 26,038 | |||||
PerkinElmer Inc | 442 | 32,368 | |||||
See Notes to Schedule of Investments and Other Information and Notes to Financial Statements. | |
16 | JUNE 30, 2018 |
Janus Henderson Adaptive Global Allocation Fund
Schedule of Investments
June 30, 2018
Shares
or | Value | ||||||
Common Stocks – (continued) | |||||||
Life Sciences Tools & Services – (continued) | |||||||
Waters Corp* | 71 | $13,745 | |||||
114,369 | |||||||
Machinery – 0.2% | |||||||
Alfa Laval AB | 57 | 1,349 | |||||
Alstom SA | 196 | 9,001 | |||||
Amada Holdings Co Ltd | 100 | 960 | |||||
ANDRITZ AG | 169 | 8,967 | |||||
Caterpillar Inc | 37 | 5,020 | |||||
CNH Industrial NV | 351 | 3,719 | |||||
Cummins Inc | 100 | 13,300 | |||||
Deere & Co | 63 | 8,807 | |||||
Fortive Corp | 49 | 3,778 | |||||
JTEKT Corp | 200 | 2,716 | |||||
KION Group AG | 48 | 3,449 | |||||
Komatsu Ltd | 100 | 2,847 | |||||
Metso OYJ | 76 | 2,544 | |||||
MISUMI Group Inc | 100 | 2,911 | |||||
Mitsubishi Heavy Industries Ltd | 100 | 3,636 | |||||
NGK Insulators Ltd | 100 | 1,779 | |||||
PACCAR Inc | 65 | 4,027 | |||||
Pentair PLC | 291 | 12,245 | |||||
Snap-on Inc | 18 | 2,893 | |||||
Stanley Black & Decker Inc | 30 | 3,984 | |||||
Volvo AB | 358 | 5,704 | |||||
Wartsila OYJ Abp | 24 | 471 | |||||
Xylem Inc/NY | 175 | 11,792 | |||||
115,899 | |||||||
Marine – 0% | |||||||
Kuehne + Nagel International AG | 2 | 301 | |||||
Media – 0.7% | |||||||
CBS Corp | 684 | 38,454 | |||||
Charter Communications Inc* | 185 | 54,244 | |||||
Comcast Corp | 624 | 20,473 | |||||
DISH Network Corp* | 60 | 2,017 | |||||
Eutelsat Communications SA | 462 | 9,567 | |||||
Hakuhodo DY Holdings Inc | 200 | 3,207 | |||||
Interpublic Group of Cos Inc | 1,298 | 30,425 | |||||
ITV PLC | 7,257 | 16,656 | |||||
News Corp | 4,924 | 76,322 | |||||
Omnicom Group Inc | 470 | 35,847 | |||||
Pearson PLC | 336 | 3,906 | |||||
RTL Group SA | 486 | 32,950 | |||||
Shaw Communications Inc | 939 | 19,130 | |||||
Singapore Press Holdings Ltd | 2,400 | 4,573 | |||||
Telenet Group Holding NV* | 201 | 9,368 | |||||
Toho Co Ltd/Tokyo | 100 | 3,351 | |||||
Viacom Inc | 459 | 13,843 | |||||
Vivendi SA | 877 | 21,453 | |||||
Walt Disney Co | 818 | 85,735 | |||||
WPP PLC | 623 | 9,802 | |||||
491,323 | |||||||
Metals & Mining – 0.4% | |||||||
Agnico Eagle Mines Ltd | 169 | 7,749 | |||||
Alumina Ltd | 6,074 | 12,571 | |||||
Anglo American PLC | 90 | 1,998 | |||||
Antofagasta PLC | 634 | 8,235 | |||||
ArcelorMittal | 42 | 1,226 | |||||
Barrick Gold Corp | 849 | 11,154 | |||||
BHP Billiton Ltd | 357 | 8,944 | |||||
See Notes to Schedule of Investments and Other Information and Notes to Financial Statements. | |
Janus Investment Fund | 17 |
Janus Henderson Adaptive Global Allocation Fund
Schedule of Investments
June 30, 2018
Shares
or | Value | ||||||
Common Stocks – (continued) | |||||||
Metals & Mining – (continued) | |||||||
BHP Billiton PLC | 152 | $3,401 | |||||
BlueScope Steel Ltd | 489 | 6,232 | |||||
Boliden AB | 604 | 19,551 | |||||
Fortescue Metals Group Ltd | 2,420 | 7,849 | |||||
Franco-Nevada Corp | 167 | 12,190 | |||||
Freeport-McMoRan Inc | 493 | 8,509 | |||||
Glencore PLC* | 1,156 | 5,480 | |||||
Goldcorp Inc | 867 | 11,905 | |||||
Hitachi Metals Ltd | 500 | 5,186 | |||||
Kinross Gold Corp* | 437 | 1,646 | |||||
Newcrest Mining Ltd | 683 | 11,069 | |||||
Newmont Mining Corp | 1,184 | 44,649 | |||||
Norsk Hydro ASA | 757 | 4,534 | |||||
Nucor Corp | 220 | 13,750 | |||||
Randgold Resources Ltd | 136 | 10,458 | |||||
Rio Tinto Ltd | 93 | 5,772 | |||||
South32 Ltd | 302 | 813 | |||||
Teck Resources Ltd | 559 | 14,242 | |||||
thyssenkrupp AG | 717 | 17,443 | |||||
256,556 | |||||||
Multiline Retail – 0.1% | |||||||
Dollar Tree Inc* | 201 | 17,085 | |||||
Dollarama Inc | 440 | 17,058 | |||||
Harvey Norman Holdings Ltd | 2,116 | 5,194 | |||||
J Front Retailing Co Ltd | 100 | 1,518 | |||||
Kohl's Corp | 203 | 14,799 | |||||
Macy's Inc | 124 | 4,641 | |||||
Marks & Spencer Group PLC | 1,715 | 6,672 | |||||
Next PLC | 54 | 4,310 | |||||
Nordstrom Inc | 40 | 2,071 | |||||
Target Corp | 142 | 10,809 | |||||
84,157 | |||||||
Multi-Utilities – 0.2% | |||||||
AGL Energy Ltd | 467 | 7,782 | |||||
Ameren Corp | 113 | 6,876 | |||||
Canadian Utilities Ltd | 1,460 | 36,875 | |||||
CenterPoint Energy Inc | 176 | 4,877 | |||||
Centrica PLC | 7,281 | 15,142 | |||||
CMS Energy Corp | 199 | 9,409 | |||||
Dominion Energy Inc | 238 | 16,227 | |||||
E.ON SE | 221 | 2,361 | |||||
NiSource Inc | 272 | 7,148 | |||||
RWE AG | 69 | 1,573 | |||||
Sempra Energy | 63 | 7,315 | |||||
Suez | 822 | 10,657 | |||||
Veolia Environnement SA | 117 | 2,503 | |||||
WEC Energy Group Inc | 102 | 6,594 | |||||
135,339 | |||||||
Oil, Gas & Consumable Fuels – 1.0% | |||||||
AltaGas Ltd | 1,032 | 21,315 | |||||
Anadarko Petroleum Corp | 363 | 26,590 | |||||
Apache Corp | 671 | 31,369 | |||||
ARC Resources Ltd | 878 | 9,071 | |||||
BP PLC | 551 | 4,195 | |||||
Cabot Oil & Gas Corp | 2,169 | 51,622 | |||||
Caltex Australia Ltd | 585 | 14,126 | |||||
Cameco Corp | 608 | 6,841 | |||||
Canadian Natural Resources Ltd | 70 | 2,527 | |||||
Cenovus Energy Inc | 262 | 2,721 | |||||
See Notes to Schedule of Investments and Other Information and Notes to Financial Statements. | |
18 | JUNE 30, 2018 |
Janus Henderson Adaptive Global Allocation Fund
Schedule of Investments
June 30, 2018
Shares
or | Value | ||||||
Common Stocks – (continued) | |||||||
Oil, Gas & Consumable Fuels – (continued) | |||||||
Chevron Corp | 71 | $8,977 | |||||
Cimarex Energy Co | 197 | 20,043 | |||||
Concho Resources Inc* | 158 | 21,859 | |||||
ConocoPhillips | 370 | 25,759 | |||||
Crescent Point Energy Corp | 697 | 5,122 | |||||
Devon Energy Corp | 186 | 8,177 | |||||
Enbridge Inc | 266 | 9,511 | |||||
Encana Corp | 75 | 980 | |||||
Eni SpA | 376 | 6,981 | |||||
EOG Resources Inc | 28 | 3,484 | |||||
EQT Corp | 836 | 46,130 | |||||
Equinor ASA | 423 | 11,200 | |||||
Exxon Mobil Corp | 444 | 36,732 | |||||
Hess Corp | 195 | 13,044 | |||||
HollyFrontier Corp | 60 | 4,106 | |||||
Husky Energy Inc | 369 | 5,752 | |||||
Idemitsu Kosan Co Ltd | 100 | 3,560 | |||||
Imperial Oil Ltd | 29 | 964 | |||||
Kinder Morgan Inc/DE | 2,752 | 48,628 | |||||
Koninklijke Vopak NV | 63 | 2,908 | |||||
Lundin Petroleum AB | 140 | 4,457 | |||||
Marathon Oil Corp | 651 | 13,580 | |||||
Marathon Petroleum Corp | 483 | 33,887 | |||||
Neste Oyj | 132 | 10,320 | |||||
Newfield Exploration Co* | 186 | 5,627 | |||||
Noble Energy Inc | 319 | 11,254 | |||||
Occidental Petroleum Corp | 270 | 22,594 | |||||
Oil Search Ltd | 1,314 | 8,680 | |||||
OMV AG | 53 | 3,002 | |||||
ONEOK Inc | 327 | 22,834 | |||||
Origin Energy Ltd* | 911 | 6,794 | |||||
Pioneer Natural Resources Co | 94 | 17,789 | |||||
Repsol SA | 56 | 1,093 | |||||
Santos Ltd* | 1,345 | 6,268 | |||||
Snam SpA | 2,275 | 9,477 | |||||
TransCanada Corp | 488 | 21,116 | |||||
Valero Energy Corp | 245 | 27,153 | |||||
Williams Cos Inc | 1,226 | 33,237 | |||||
Woodside Petroleum Ltd | 269 | 7,078 | |||||
720,534 | |||||||
Paper & Forest Products – 0.1% | |||||||
Mondi PLC | 673 | 18,125 | |||||
Stora Enso OYJ | 459 | 8,967 | |||||
UPM-Kymmene OYJ | 530 | 18,924 | |||||
46,016 | |||||||
Personal Products – 0% | |||||||
Beiersdorf AG | 33 | 3,747 | |||||
Coty Inc | 664 | 9,362 | |||||
Estee Lauder Cos Inc | 7 | 999 | |||||
14,108 | |||||||
Pharmaceuticals – 0.5% | |||||||
Allergan PLC | 17 | 2,834 | |||||
Astellas Pharma Inc | 300 | 4,571 | |||||
AstraZeneca PLC | 983 | 68,046 | |||||
Bayer AG | 175 | 19,279 | |||||
Bristol-Myers Squibb Co | 634 | 35,086 | |||||
Eli Lilly & Co | 257 | 21,930 | |||||
Johnson & Johnson | 46 | 5,582 | |||||
Kyowa Hakko Kirin Co Ltd | 200 | 4,026 | |||||
See Notes to Schedule of Investments and Other Information and Notes to Financial Statements. | |
Janus Investment Fund | 19 |
Janus Henderson Adaptive Global Allocation Fund
Schedule of Investments
June 30, 2018
Shares
or | Value | ||||||
Common Stocks – (continued) | |||||||
Pharmaceuticals – (continued) | |||||||
Merck & Co Inc | 138 | $8,377 | |||||
Merck KGaA | 261 | 25,480 | |||||
Mitsubishi Tanabe Pharma Corp | 200 | 3,454 | |||||
Mylan NV* | 132 | 4,770 | |||||
Ono Pharmaceutical Co Ltd | 100 | 2,342 | |||||
Otsuka Holdings Co Ltd | 100 | 4,843 | |||||
Perrigo Co PLC | 16 | 1,167 | |||||
Pfizer Inc | 515 | 18,684 | |||||
Roche Holding AG | 332 | 73,905 | |||||
Sanofi | 268 | 21,458 | |||||
Santen Pharmaceutical Co Ltd | 200 | 3,482 | |||||
Shionogi & Co Ltd | 100 | 5,133 | |||||
Sumitomo Dainippon Pharma Co Ltd | 100 | 2,115 | |||||
UCB SA | 302 | 23,672 | |||||
Valeant Pharmaceuticals International Inc* | 313 | 7,286 | |||||
Vifor Pharma AG | 105 | 16,760 | |||||
Zoetis Inc | 41 | 3,493 | |||||
387,775 | |||||||
Professional Services – 0.1% | |||||||
Bureau Veritas SA | 114 | 3,040 | |||||
Equifax Inc | 145 | 18,141 | |||||
Experian PLC | 23 | 569 | |||||
Nielsen Holdings PLC | 52 | 1,608 | |||||
RELX PLC | 367 | 7,855 | |||||
Robert Half International Inc | 45 | 2,930 | |||||
SEEK Ltd | 199 | 3,226 | |||||
Verisk Analytics Inc* | 190 | 20,452 | |||||
Wolters Kluwer NV | 66 | 3,715 | |||||
61,536 | |||||||
Real Estate Management & Development – 0.2% | |||||||
CBRE Group Inc* | 16 | 764 | |||||
CK Asset Holdings Ltd | 3,000 | 23,704 | |||||
Deutsche Wohnen SE | 15 | 724 | |||||
Henderson Land Development Co Ltd | 2,200 | 11,580 | |||||
Hongkong Land Holdings Ltd* | 1,000 | 7,150 | |||||
Hulic Co Ltd | 500 | 5,324 | |||||
LendLease Group | 967 | 14,221 | |||||
New World Development Co Ltd | 3,000 | 4,193 | |||||
Nomura Real Estate Holdings Inc | 200 | 4,434 | |||||
Swire Pacific Ltd | 2,000 | 21,132 | |||||
Tokyo Tatemono Co Ltd | 100 | 1,372 | |||||
Tokyu Fudosan Holdings Corp | 500 | 3,520 | |||||
Vonovia SE | 22 | 1,047 | |||||
Wharf Holdings Ltd | 4,000 | 12,813 | |||||
111,978 | |||||||
Road & Rail – 0.1% | |||||||
Aurizon Holdings Ltd | 2,551 | 8,200 | |||||
Canadian Pacific Railway Ltd | 7 | 1,283 | |||||
CSX Corp | 31 | 1,977 | |||||
East Japan Railway Co | 100 | 9,579 | |||||
JB Hunt Transport Services Inc | 115 | 13,978 | |||||
Kansas City Southern | 87 | 9,219 | |||||
Keikyu Corp | 200 | 3,278 | |||||
Keio Corp | 100 | 4,836 | |||||
MTR Corp Ltd | 2,500 | 13,775 | |||||
Tokyu Corp | 200 | 3,444 | |||||
Union Pacific Corp | 27 | 3,825 | |||||
73,394 | |||||||
See Notes to Schedule of Investments and Other Information and Notes to Financial Statements. | |
20 | JUNE 30, 2018 |
Janus Henderson Adaptive Global Allocation Fund
Schedule of Investments
June 30, 2018
Shares
or | Value | ||||||
Common Stocks – (continued) | |||||||
Semiconductor & Semiconductor Equipment – 0.2% | |||||||
Advanced Micro Devices Inc* | 113 | $1,694 | |||||
Applied Materials Inc | 244 | 11,270 | |||||
ASM Pacific Technology Ltd | 100 | 1,256 | |||||
ASML Holding NV | 25 | 4,930 | |||||
Broadcom Inc | 37 | 8,978 | |||||
Infineon Technologies AG | 902 | 22,984 | |||||
Intel Corp | 297 | 14,764 | |||||
KLA-Tencor Corp | 72 | 7,382 | |||||
Lam Research Corp | 32 | 5,531 | |||||
Microchip Technology Inc | 33 | 3,001 | |||||
Micron Technology Inc* | 275 | 14,421 | |||||
Qorvo Inc* | 47 | 3,768 | |||||
QUALCOMM Inc | 218 | 12,234 | |||||
STMicroelectronics NV | 234 | 5,199 | |||||
Xilinx Inc | 507 | 33,087 | |||||
150,499 | |||||||
Software – 0.5% | |||||||
Activision Blizzard Inc | 194 | 14,806 | |||||
Adobe Systems Inc* | 17 | 4,145 | |||||
BlackBerry Ltd* | 1,726 | 16,649 | |||||
CA Inc | 2,765 | 98,572 | |||||
Cadence Design Systems Inc* | 500 | 21,655 | |||||
Citrix Systems Inc* | 37 | 3,879 | |||||
Electronic Arts Inc* | 181 | 25,525 | |||||
Microsoft Corp | 217 | 21,398 | |||||
Open Text Corp | 393 | 13,833 | |||||
Red Hat Inc* | 172 | 23,112 | |||||
Sage Group PLC | 2,564 | 21,171 | |||||
salesforce.com Inc* | 47 | 6,411 | |||||
Symantec Corp | 942 | 19,452 | |||||
Synopsys Inc* | 794 | 67,943 | |||||
Take-Two Interactive Software Inc* | 31 | 3,669 | |||||
Temenos AG* | 92 | 13,918 | |||||
Ubisoft Entertainment SA* | 124 | 13,566 | |||||
389,704 | |||||||
Specialty Retail – 0.3% | |||||||
Advance Auto Parts Inc | 92 | 12,484 | |||||
AutoZone Inc* | 43 | 28,850 | |||||
Best Buy Co Inc | 52 | 3,878 | |||||
CarMax Inc* | 285 | 20,768 | |||||
Foot Locker Inc | 114 | 6,002 | |||||
Gap Inc | 142 | 4,599 | |||||
Hennes & Mauritz AB | 118 | 1,757 | |||||
Industria de Diseno Textil SA | 29 | 989 | |||||
Kingfisher PLC | 2,204 | 8,635 | |||||
L Brands Inc | 330 | 12,170 | |||||
Lowe's Cos Inc | 110 | 10,513 | |||||
O'Reilly Automotive Inc* | 88 | 24,074 | |||||
Ross Stores Inc | 31 | 2,627 | |||||
Tiffany & Co | 111 | 14,608 | |||||
TJX Cos Inc | 235 | 22,367 | |||||
Tractor Supply Co | 119 | 9,102 | |||||
Ulta Beauty Inc* | 48 | 11,206 | |||||
USS Co Ltd | 100 | 1,901 | |||||
196,530 | |||||||
Technology Hardware, Storage & Peripherals – 0.2% | |||||||
Apple Inc | 61 | 11,292 | |||||
Brother Industries Ltd | 100 | 1,972 | |||||
Canon Inc | 100 | 3,276 | |||||
See Notes to Schedule of Investments and Other Information and Notes to Financial Statements. | |
Janus Investment Fund | 21 |
Janus Henderson Adaptive Global Allocation Fund
Schedule of Investments
June 30, 2018
Shares
or | Value | ||||||
Common Stocks – (continued) | |||||||
Technology Hardware, Storage & Peripherals – (continued) | |||||||
FUJIFILM Holdings Corp | 100 | $3,902 | |||||
HP Inc | 323 | 7,329 | |||||
Konica Minolta Inc | 100 | 926 | |||||
NEC Corp | 400 | 10,971 | |||||
NetApp Inc | 107 | 8,403 | |||||
Seagate Technology PLC | 78 | 4,405 | |||||
Seiko Epson Corp | 100 | 1,733 | |||||
Western Digital Corp | 291 | 22,526 | |||||
Xerox Corp | 2,432 | 58,368 | |||||
135,103 | |||||||
Textiles, Apparel & Luxury Goods – 0.2% | |||||||
adidas AG | 47 | 10,263 | |||||
Asics Corp | 100 | 1,688 | |||||
Hanesbrands Inc | 299 | 6,584 | |||||
Hermes International | 1 | 611 | |||||
Hugo Boss AG | 87 | 7,889 | |||||
Kering SA | 3 | 1,692 | |||||
Li & Fung Ltd | 16,000 | 5,842 | |||||
Michael Kors Holdings Ltd* | 130 | 8,658 | |||||
NIKE Inc | 352 | 28,047 | |||||
Puma SE | 7 | 4,087 | |||||
PVH Corp | 158 | 23,656 | |||||
Tapestry Inc | 412 | 19,245 | |||||
Under Armour Inc*,# | 422 | 9,487 | |||||
VF Corp | 342 | 27,880 | |||||
155,629 | |||||||
Tobacco – 0.1% | |||||||
British American Tobacco PLC | 64 | 3,232 | |||||
Imperial Brands PLC | 328 | 12,211 | |||||
Philip Morris International Inc | 352 | 28,420 | |||||
Swedish Match AB | 63 | 3,120 | |||||
46,983 | |||||||
Trading Companies & Distributors – 0.1% | |||||||
Brenntag AG | 21 | 1,170 | |||||
Bunzl PLC | 130 | 3,936 | |||||
Fastenal Co | 139 | 6,690 | |||||
ITOCHU Corp | 300 | 5,431 | |||||
Marubeni Corp | 200 | 1,524 | |||||
Mitsui & Co Ltd | 100 | 1,666 | |||||
Rexel SA | 415 | 5,963 | |||||
Travis Perkins PLC | 903 | 16,945 | |||||
United Rentals Inc* | 35 | 5,167 | |||||
WW Grainger Inc | 5 | 1,542 | |||||
50,034 | |||||||
Transportation Infrastructure – 0.1% | |||||||
Aena SME SA | 12 | 2,177 | |||||
Aeroports de Paris | 32 | 7,230 | |||||
Getlink | 1,746 | 23,936 | |||||
Sydney Airport | 959 | 5,078 | |||||
Transurban Group | 1,124 | 9,980 | |||||
48,401 | |||||||
Water Utilities – 0.1% | |||||||
American Water Works Co Inc | 109 | 9,306 | |||||
Severn Trent PLC | 439 | 11,456 | |||||
United Utilities Group PLC | 1,731 | 17,427 | |||||
38,189 | |||||||
Wireless Telecommunication Services – 0.1% | |||||||
KDDI Corp | 200 | 5,469 | |||||
NTT DOCOMO Inc | 1,000 | 25,472 | |||||
See Notes to Schedule of Investments and Other Information and Notes to Financial Statements. | |
22 | JUNE 30, 2018 |
Janus Henderson Adaptive Global Allocation Fund
Schedule of Investments
June 30, 2018
Shares
or | Value | ||||||
Common Stocks – (continued) | |||||||
Wireless Telecommunication Services – (continued) | |||||||
Rogers Communications Inc | 430 | $20,425 | |||||
Tele2 AB | 34 | 399 | |||||
51,765 | |||||||
Total Common Stocks (cost $10,104,662) | 10,233,744 | ||||||
Preferred Stocks – 0% | |||||||
Auto Components – 0% | |||||||
Schaeffler AG | 142 | 1,846 | |||||
Automobiles – 0% | |||||||
Porsche Automobil Holding SE | 154 | 9,808 | |||||
Health Care Equipment & Supplies – 0% | |||||||
Sartorius AG | 68 | 10,158 | |||||
Total Preferred Stocks (cost $23,330) | 21,812 | ||||||
Investment Companies – 93.2% | |||||||
Exchange-Traded Funds (ETFs) – 81.5% | |||||||
Invesco QQQ Trust Series 1 | 11,687 | 2,006,074 | |||||
iShares 20+ Year Treasury Bond | 17,641 | 2,147,263 | |||||
iShares 7-10 Year Treasury Bond# | 33,438 | 3,427,729 | |||||
iShares Agency Bond | 32,482 | 3,619,144 | |||||
iShares Currency Hedged MSCI Japan | 70,770 | 2,282,333 | |||||
iShares iBoxx High Yield Corporate Bond# | 5,862 | 498,739 | |||||
iShares iBoxx Investment Grade Corporate Bond | 23,817 | 2,728,714 | |||||
iShares MSCI Canada | 9,420 | 268,564 | |||||
iShares MSCI Europe Financials | 8,060 | 163,054 | |||||
iShares MSCI Hong Kong | 10,097 | 244,448 | |||||
iShares MSCI Japan | 23,535 | 1,362,912 | |||||
iShares MSCI Spain Index Fund# | 10,849 | 329,267 | |||||
Vanguard Consumer Staples# | 4,986 | 669,470 | |||||
Vanguard Financials# | 38,214 | 2,577,534 | |||||
Vanguard FTSE All World ex-US Small-Cap# | 15,794 | 1,822,786 | |||||
Vanguard FTSE All-World ex-US | 65,379 | 3,389,247 | |||||
Vanguard FTSE Emerging Markets | 64,958 | 2,741,228 | |||||
Vanguard FTSE Europe | 25,813 | 1,448,884 | |||||
Vanguard FTSE Pacific | 20,453 | 1,431,301 | |||||
Vanguard Growth | 5,471 | 819,611 | |||||
Vanguard High Dividend Yield | 7,751 | 643,721 | |||||
Vanguard Industrials# | 18,107 | 2,459,112 | |||||
Vanguard Information Technology# | 9,908 | 1,797,311 | |||||
Vanguard International High Dividend Yield | 14,658 | 912,167 | |||||
Vanguard Materials | 3,210 | 422,308 | |||||
Vanguard Mid-Cap | 12,122 | 1,910,912 | |||||
Vanguard Mortgage-Backed Securities# | 66,365 | 3,411,825 | |||||
Vanguard S&P 500 | 8,772 | 2,188,702 | |||||
Vanguard Small-Cap | 6,373 | 992,085 | |||||
Vanguard Small-Cap Value | 3,101 | 421,085 | |||||
Vanguard Total International Bond | 121,452 | 6,644,639 | |||||
Vanguard Value | 16,460 | 1,709,042 | |||||
57,491,211 | |||||||
Investments Purchased with Cash Collateral from Securities Lending – 11.7% | |||||||
Janus Henderson Cash Collateral Fund LLC, 1.8237%ºº,£ | 8,252,929 | 8,252,929 | |||||
Total Investment Companies (cost $64,867,019) | 65,744,140 | ||||||
Commercial Paper – 2.8% | |||||||
Enbridge Energy Partners , 0%, 7/18/18 (Section 4(2))◊ | $1,900,000 | 1,897,688 | |||||
Harley-Davidson Financial Services, 0%, 8/16/18 (Section 4(2))◊ | 100,000 | 99,678 | |||||
Total Commercial Paper (cost $1,996,704) | 1,997,366 | ||||||
See Notes to Schedule of Investments and Other Information and Notes to Financial Statements. | |
Janus Investment Fund | 23 |
Janus Henderson Adaptive Global Allocation Fund
Schedule of Investments
June 30, 2018
Shares
or | Value | ||||||
U.S. Government Agency Notes – 2.9% | |||||||
Federal Home Loan Bank Discount Notes: | |||||||
0%, 7/2/18◊ (cost $1,999,750) | $2,000,000 | $2,000,000 | |||||
Total Investments (total cost $78,991,465) – 113.4% | 79,997,062 | ||||||
Liabilities, net of Cash, Receivables and Other Assets – (13.4)% | (9,454,628) | ||||||
Net Assets – 100% | $70,542,434 | ||||||
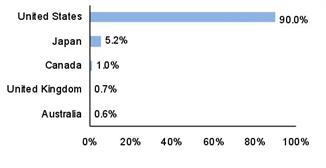
Summary of Investments by Country - (Long Positions) (unaudited) | |||||
% of | |||||
Investment | |||||
Country | Value | Securities | |||
United States | $72,026,158 | 90.0 | % | ||
Japan | 4,144,401 | 5.2 | |||
Canada | 766,491 | 1.0 | |||
United Kingdom | 543,867 | 0.7 | |||
Australia | 505,739 | 0.6 | |||
Germany | 369,299 | 0.5 | |||
France | 331,325 | 0.4 | |||
Hong Kong | 284,431 | 0.4 | |||
Switzerland | 278,784 | 0.3 | |||
Spain | 132,074 | 0.2 | |||
Finland | 121,849 | 0.2 | |||
Sweden | 119,173 | 0.1 | |||
Netherlands | 117,935 | 0.1 | |||
Norway | 67,367 | 0.1 | |||
Italy | 62,357 | 0.1 | |||
Belgium | 57,054 | 0.1 | |||
Singapore | 41,801 | 0.0 | |||
Austria | 15,613 | 0.0 | |||
Ireland | 11,344 | 0.0 | |||
Total | $79,997,062 | 100.0 | % |
Schedules of Affiliated Investments – (% of Net Assets)
Dividend Income | Realized Gain/(Loss) | Change in Unrealized Appreciation/ Depreciation | Value at 6/30/18 | |||||||
Investment Companies - 11.7% | ||||||||||
Investments Purchased with Cash Collateral from Securities Lending - 11.7% | ||||||||||
Janus Henderson Cash Collateral Fund LLC,1.8237%ºº | $ | 13,738∆ | $ | - | $ | - | $ | 8,252,929 | ||
See Notes to Schedule of Investments and Other Information and Notes to Financial Statements. | |
24 | JUNE 30, 2018 |
Janus Henderson Adaptive Global Allocation Fund
Schedule of Investments
June 30, 2018
Share Balance at 6/30/17 | Purchases | Sales | Share Balance at 6/30/18 | |||||||
Investment Companies - 11.7% | ||||||||||
Investments Purchased with Cash Collateral from Securities Lending - 11.7% | ||||||||||
Janus Henderson Cash Collateral Fund LLC,1.8237%ºº | - | 39,368,482 | (31,115,553) | 8,252,929 | ||||||
Schedule of Forward Foreign Currency Exchange Contracts, Open |
Counterparty/ Foreign Currency | Settlement Date | Foreign Currency Amount (Sold)/ Purchased | USD Currency Amount (Sold)/ Purchased | Market Value and Unrealized Appreciation/ (Depreciation) | ||||
Bank of America: | ||||||||
British Pound | 7/12/18 | (926,500) | $ | 1,235,265 | $ | 12,179 | ||
Canadian Dollar | 7/12/18 | (1,047,500) | 809,211 | 12,205 | ||||
Euro | 7/12/18 | (2,535,117) | 2,965,884 | 3,410 | ||||
27,794 | ||||||||
HSBC Securities (USA), Inc.: | ||||||||
Australian Dollar | 7/12/18 | (859,000) | 651,360 | 15,767 | ||||
Japanese Yen | 7/12/18 | (321,000,000) | 2,965,879 | 64,156 | ||||
Korean Won | 7/12/18 | (384,600,000) | 356,990 | 11,732 | ||||
Swedish Krona | 7/12/18 | (1,835,000) | 209,024 | 3,926 | ||||
Swiss Franc | 7/12/18 | (271,000) | 276,156 | 2,152 | ||||
Taiwan Dollar | 7/12/18 | (8,444,000) | 282,276 | 5,081 | ||||
102,814 | ||||||||
Total | $ | 130,608 | ||||||
The following table, grouped by derivative type, provides information about the fair value and location of derivatives within the Statement of Assets and Liabilities as of June 30, 2018.
Fair Value of Derivative Instruments (not accounted for as hedging instruments) as of June 30, 2018 | |||||
|
|
|
|
| Currency
|
Asset Derivatives: | |||||
Forward foreign currency exchange contracts | $130,608 | ||||
| |||||
See Notes to Schedule of Investments and Other Information and Notes to Financial Statements. | |
Janus Investment Fund | 25 |
Janus Henderson Adaptive Global Allocation Fund
Schedule of Investments
June 30, 2018
The following tables provide information about the effect of derivatives and hedging activities on the Fund’s Statement of Operations for the year ended June 30, 2018.
The effect of Derivative Instruments (not accounted for as hedging instruments) on the Statement of Operations for the year ended June 30, 2018 | ||||||||
Amount of Realized Gain/(Loss) Recognized on Derivatives | ||||||||
Derivative |
| Currency |
| Equity |
| Total | ||
Futures contracts | $ - | $ (8,332) | $ (8,332) | |||||
Forward foreign currency exchange contracts | (274,116) | - | (274,116) | |||||
Purchased options contracts | - | (84,943) | (84,943) | |||||
Written options contracts | - | 86,713 | 86,713 | |||||
Total |
| $(274,116) |
| $ (6,562) |
| $(280,678) | ||
Amount of Change in Unrealized Appreciation/Depreciation Recognized on Derivatives | ||||||||
Derivative |
| Currency
|
| Equity |
| Total | ||
Forward foreign currency exchange contracts | $ 196,848 | $ - | $ 196,848 | |||||
Please see the "Net Realized Gain/(Loss) on Investments" and "Change in Unrealized Net Appreciation/Depreciation" sections of the Fund’s Statement of Operations.
Average Ending Monthly Market Value of Derivative Instruments During the Year Ended June 30, 2018 | |
| Market Value |
Forward foreign currency exchange contracts, sold | $ 5,201,230 |
Purchased options contracts, put | 37,315 |
Written options contracts, put | 16,674 |
See Notes to Schedule of Investments and Other Information and Notes to Financial Statements. | |
26 | JUNE 30, 2018 |
Janus Henderson Adaptive Global Allocation Fund
Notes to Schedule of Investments and Other Information
Adaptive Global Allocation 60/40 Index | Adaptive Global Allocation 60/40 Index is an internally-calculated, hypothetical combination of total returns from the MSCI All Country World IndexSM (60%) and the Bloomberg Barclays Global Aggregate Bond Index (Hedged) (40%). |
Bloomberg Barclays Global Aggregate Bond Index | Bloomberg Barclays Global Aggregate Bond Index is a broad-based measure of the global investment grade fixed-rate debt markets. |
MSCI All Country World IndexSM | MSCI All Country World IndexSM reflects the equity market performance of global developed and emerging markets. |
CDI | Clearing House Electronic Subregister System Depositary Interest |
LLC | Limited Liability Company |
PLC | Public Limited Company |
144A | Securities sold under Rule 144A of the Securities Act of 1933, as amended, are subject to legal and/or contractual restrictions on resale and may not be publicly sold without registration under the 1933 Act. Unless otherwise noted, these securities have been determined to be liquid under guidelines established by the Board of Trustees. The total value of 144A securities as of the year ended June 30, 2018 is $7,794, which represents 0.0% of net assets. |
4(2) | Securities sold under Section 4(2) of the Securities Act of 1933, as amended, are subject to legal and/or contractual restrictions on resale and may not be publicly sold without registration under the 1933 Act. Unless otherwise noted, these securities have been determined to be liquid under guidelines established by the Board of Trustees. The total value of 4(2) securities as of the year ended June 30, 2018 is $1,997,366, which represents 2.8% of net assets. |
* | Non-income producing security. |
ºº | Rate shown is the 7-day yield as of June 30, 2018. |
# | Loaned security; a portion of the security is on loan at June 30, 2018. |
◊ | Zero coupon bond. |
£ | The Fund may invest in certain securities that are considered affiliated companies. As defined by the Investment Company Act of 1940, as amended, an affiliated company is one in which the Fund owns 5% or more of the outstanding voting securities, or a company which is under common ownership or control. |
∆ | Net of income paid to the securities lending agent and rebates paid to the borrowing counterparties. |
Janus Investment Fund | 27 |
Janus Henderson Adaptive Global Allocation Fund
Notes to Schedule of Investments and Other Information
The following is a summary of the inputs that were used to value the Fund’s investments in securities and other financial instruments as of June 30, 2018. See Notes to Financial Statements for more information. | ||||||
Valuation Inputs Summary | ||||||
Level 2 - | Level 3 - | |||||
Level 1 - | Other Significant | Significant | ||||
Quotes Prices | Observable Inputs | Unobservable Inputs | ||||
Assets | ||||||
Investments in Securities: | ||||||
Common Stocks | ||||||
Aerospace & Defense | $ | 31,620 | $ | 14,822 | $ | - |
Air Freight & Logistics | 30,160 | 7,429 | - | |||
Airlines | 33,961 | 3,544 | - | |||
Auto Components | 38,393 | 36,137 | - | |||
Automobiles | 65,621 | 39,226 | - | |||
Banks | 158,121 | 222,240 | - | |||
Beverages | 162,239 | 31,509 | - | |||
Biotechnology | 131,583 | 39,706 | - | |||
Building Products | 19,850 | 7,475 | - | |||
Capital Markets | 105,021 | 102,988 | - | |||
Chemicals | 128,997 | 335,145 | - | |||
Commercial Services & Supplies | 87,719 | 24,954 | - | |||
Communications Equipment | 76,297 | 23,430 | - | |||
Construction & Engineering | 31,347 | 13,698 | - | |||
Construction Materials | 13,238 | 30,415 | - | |||
Consumer Finance | 6,210 | 2,689 | - | |||
Containers & Packaging | 82,008 | 13,882 | - | |||
Distributors | - | 4,663 | - | |||
Diversified Financial Services | - | 78,993 | - | |||
Diversified Telecommunication Services | 249,168 | 184,487 | - | |||
Electric Utilities | 53,881 | 68,511 | - | |||
Electrical Equipment | 22,058 | 14,436 | - | |||
Electronic Equipment, Instruments & Components | 95,083 | 24,234 | - | |||
Energy Equipment & Services | 182,628 | 2,589 | - | |||
Equity Real Estate Investment Trusts (REITs) | 108,466 | 83,944 | - | |||
Food & Staples Retailing | 183,422 | 80,172 | - | |||
Food Products | 169,137 | 67,322 | - | |||
Gas Utilities | - | 27,248 | - | |||
Health Care Equipment & Supplies | 207,846 | 188,383 | - | |||
Health Care Providers & Services | 126,304 | 58,767 | - | |||
Health Care Technology | - | 3,981 | - | |||
Hotels, Restaurants & Leisure | 166,513 | 107,873 | - | |||
Household Durables | 70,699 | 6,357 | - | |||
Household Products | 286,787 | 12,163 | - | |||
Independent Power and Renewable Electricity Producers | 2,421 | 9,467 | - | |||
Industrial Conglomerates | 49,669 | 23,417 | - | |||
Information Technology Services | 384,763 | 88,852 | - | |||
Insurance | 293,503 | 147,904 | - | |||
Internet & Direct Marketing Retail | 59,279 | 6,148 | - | |||
Internet Software & Services | 91,747 | 3,325 | - | |||
Leisure Products | 19,477 | 3,912 | - | |||
Life Sciences Tools & Services | 107,725 | 6,644 | - | |||
Machinery | 65,846 | 50,053 | - | |||
28 | JUNE 30, 2018 |
Janus Henderson Adaptive Global Allocation Fund
Notes to Schedule of Investments and Other Information
Valuation Inputs Summary
Level 2 - | Level 3 - | ||||||||||||
Level 1 - | Other Significant | Significant | |||||||||||
Quotes Prices | Observable Inputs | Unobservable Inputs | |||||||||||
Marine | - | 301 | - | ||||||||||
Media | 376,490 | 114,833 | - | ||||||||||
Metals & Mining | 125,794 | 130,762 | - | ||||||||||
Multiline Retail | 66,463 | 17,694 | - | ||||||||||
Multi-Utilities | 95,321 | 40,018 | - | ||||||||||
Oil, Gas & Consumable Fuels | 620,395 | 100,139 | - | ||||||||||
Paper & Forest Products | - | 46,016 | - | ||||||||||
Personal Products | 10,361 | 3,747 | - | ||||||||||
Pharmaceuticals | 109,209 | 278,566 | - | ||||||||||
Professional Services | 43,131 | 18,405 | - | ||||||||||
Real Estate Management & Development | 7,914 | 104,064 | - | ||||||||||
Road & Rail | 30,282 | 43,112 | - | ||||||||||
Semiconductor & Semiconductor Equipment | 116,130 | 34,369 | - | ||||||||||
Software | 341,049 | 48,655 | - | ||||||||||
Specialty Retail | 183,248 | 13,282 | - | ||||||||||
Technology Hardware, Storage & Peripherals | 112,323 | 22,780 | - | ||||||||||
Textiles, Apparel & Luxury Goods | 123,557 | 32,072 | - | ||||||||||
Tobacco | 28,420 | 18,563 | - | ||||||||||
Trading Companies & Distributors | 13,399 | 36,635 | - | ||||||||||
Transportation Infrastructure | - | 48,401 | - | ||||||||||
Water Utilities | 9,306 | 28,883 | - | ||||||||||
Wireless Telecommunication Services | 20,425 | 31,340 | - | ||||||||||
All Other | 85,949 | - | - | ||||||||||
Preferred Stocks | - | 21,812 | - | ||||||||||
Investment Companies | 57,491,211 | 8,252,929 | - | ||||||||||
Commercial Paper | - | 1,997,366 | - | ||||||||||
U.S. Government Agency Notes | - | 2,000,000 | - | ||||||||||
Total Investments in Securities | $ | 64,209,184 | $ | 15,787,878 | $ | - | |||||||
Other Financial Instruments(a): | |||||||||||||
Forward Foreign Currency Exchange Contracts | - | 130,608 | - | ||||||||||
Total Assets | $ | 64,209,184 | $ | 15,918,486 | $ | - | |||||||
(a) | Other financial instruments include forward foreign currency exchange, futures, written options, written swaptions, and swap contracts. Forward foreign currency exchange contracts are reported at their unrealized appreciation/(depreciation) at measurement date, which represents the change in the contract's value from trade date. Futures, certain written options on futures, and centrally cleared swap contracts are reported at their variation margin at measurement date, which represents the amount due to/from the Fund at that date. Written options, written swaptions, and other swap contracts are reported at their market value at measurement date. | ||||||||||||
Janus Investment Fund | 29 |
Janus Henderson Adaptive Global Allocation Fund
Statement of Assets and Liabilities
June 30, 2018
See footnotes at the end of the Statement. |
|
|
|
|
|
|
|
Assets: | ||||||
Unaffiliated investments, at value(1)(2) | $ | 71,744,133 | ||||
Affiliated investments, at value(3) | 8,252,929 | |||||
Cash | 104,909 | |||||
Forward foreign currency exchange contracts | 130,608 | |||||
Cash denominated in foreign currency(4) | 1,671 | |||||
Non-interested Trustees' deferred compensation | 1,477 | |||||
Receivables: | ||||||
Investments sold | 9,488,591 | |||||
Dividends | 70,194 | |||||
Due from adviser | 57,469 | |||||
Foreign tax reclaims | 6,775 | |||||
Other assets | 155 | |||||
Total Assets |
|
| 89,858,911 |
| ||
Liabilities: | ||||||
Collateral for securities loaned (Note 3) | 8,252,929 | |||||
Payables: | — | |||||
Investments purchased | 10,812,494 | |||||
Advisory fees | 44,797 | |||||
Professional fees | 44,190 | |||||
Non-affiliated fund administration fees payable | 30,009 | |||||
Dividends | 15,969 | |||||
Custodian fees | 13,914 | |||||
Transfer agent fees and expenses | 3,237 | |||||
12b-1 Distribution and shareholder servicing fees | 1,796 | |||||
Non-interested Trustees' deferred compensation fees | 1,477 | |||||
Non-interested Trustees' fees and expenses | 607 | |||||
Affiliated fund administration fees payable | 149 | |||||
Accrued expenses and other payables | 94,909 | |||||
Total Liabilities |
|
| 19,316,477 |
| ||
Net Assets |
| $ | 70,542,434 |
| ||
See Notes to Financial Statements. | |
30 | JUNE 30, 2018 |
Janus Henderson Adaptive Global Allocation Fund
Statement of Assets and Liabilities
June 30, 2018
|
|
|
|
|
|
|
Net Assets Consist of: | ||||||
Capital (par value and paid-in surplus) | $ | 67,339,936 | ||||
Undistributed net investment income/(loss) | 353,881 | |||||
Undistributed net realized gain/(loss) from investments and foreign currency transactions | 1,712,335 | |||||
Unrealized net appreciation/(depreciation) of investments, foreign currency translations and non-interested Trustees’ deferred compensation | 1,136,282 | |||||
Total Net Assets |
| $ | 70,542,434 |
| ||
Net Assets - Class A Shares | $ | 766,301 | ||||
Shares Outstanding, $0.01 Par Value (unlimited shares authorized) | 73,457 | |||||
Net Asset Value Per Share(5) |
| $ | 10.43 |
| ||
Maximum Offering Price Per Share(6) |
| $ | 11.07 |
| ||
Net Assets - Class C Shares | $ | 1,602,796 | ||||
Shares Outstanding, $0.01 Par Value (unlimited shares authorized) | 154,882 | |||||
Net Asset Value Per Share(5) |
| $ | 10.35 |
| ||
Net Assets - Class D Shares | $ | 2,480,438 | ||||
Shares Outstanding, $0.01 Par Value (unlimited shares authorized) | 237,799 | |||||
Net Asset Value Per Share |
| $ | 10.43 |
| ||
Net Assets - Class I Shares | $ | 9,959,059 | ||||
Shares Outstanding, $0.01 Par Value (unlimited shares authorized) | 952,519 | |||||
Net Asset Value Per Share |
| $ | 10.46 |
| ||
Net Assets - Class N Shares | $ | 51,920,617 | ||||
Shares Outstanding, $0.01 Par Value (unlimited shares authorized) | 4,965,860 | |||||
Net Asset Value Per Share |
| $ | 10.46 |
| ||
Net Assets - Class S Shares | $ | 1,256,426 | ||||
Shares Outstanding, $0.01 Par Value (unlimited shares authorized) | 120,554 | |||||
Net Asset Value Per Share |
| $ | 10.42 |
| ||
Net Assets - Class T Shares | $ | 2,556,797 | ||||
Shares Outstanding, $0.01 Par Value (unlimited shares authorized) | 245,108 | |||||
Net Asset Value Per Share |
| $ | 10.43 |
| ||
(1) Includes cost of $70,738,536. (2) Includes $8,082,194 of securities on loan. See Note 3 in Notes to Financial Statements. (3) Includes cost of $8,252,929. (4) Includes cost of $1,671. (5) Redemption price per share may be reduced for any applicable contingent deferred sales charge. (6) Maximum offering price is computed at 100/94.25 of net asset value. |
See Notes to Financial Statements. | |
Janus Investment Fund | 31 |
Janus Henderson Adaptive Global Allocation Fund
Statement of Operations
For the year ended June 30, 2018
|
|
|
|
|
|
Investment Income: | |||||
| Dividends | $ | 1,397,006 | ||
Interest | 82,593 | ||||
Affiliated securities lending income, net | 13,738 | ||||
Other income | 323 | ||||
Foreign tax withheld | (11,931) | ||||
Total Investment Income |
| 1,481,729 |
| ||
Expenses: | |||||
Advisory fees | 487,689 | ||||
12b-1 Distribution and shareholder servicing fees: | |||||
Class A Shares | 1,937 | ||||
Class C Shares | 14,459 | ||||
Class S Shares | 3,160 | ||||
Transfer agent administrative fees and expenses: | |||||
Class D Shares | 2,564 | ||||
Class S Shares | 3,160 | ||||
Class T Shares | 6,573 | ||||
Transfer agent networking and omnibus fees: | |||||
Class A Shares | 124 | ||||
Class C Shares | 168 | ||||
Class I Shares | 2,557 | ||||
Other transfer agent fees and expenses: | |||||
Class A Shares | 93 | ||||
Class C Shares | 142 | ||||
Class D Shares | 360 | ||||
Class I Shares | 220 | ||||
Class N Shares | 1,684 | ||||
Class S Shares | 24 | ||||
Class T Shares | 50 | ||||
Registration fees | 119,833 | ||||
Custodian fees | 113,311 | ||||
Professional fees | 59,119 | ||||
Non-affiliated fund administration fees | 30,011 | ||||
Shareholder reports expense | 20,894 | ||||
Affiliated fund administration fees | 4,071 | ||||
Non-interested Trustees’ fees and expenses | 2,194 | ||||
Other expenses | 4,273 | ||||
Total Expenses |
| 878,670 |
| ||
Less: Excess Expense Reimbursement and Waivers |
| (369,184) |
| ||
Net Expenses |
| 509,486 |
| ||
Net Investment Income/(Loss) |
| 972,243 |
| ||
Net Realized Gain/(Loss) on Investments: | |||||
Investments and foreign currency transactions | 4,424,363 | ||||
Purchased options contracts | (84,943) | ||||
Forward foreign currency exchange contracts | (274,116) | ||||
Futures contracts | (8,332) | ||||
Written options contracts | 86,713 | ||||
Total Net Realized Gain/(Loss) on Investments |
| 4,143,685 |
| ||
Change in Unrealized Net Appreciation/Depreciation: | |||||
Investments, foreign currency translations and non-interested Trustees’ deferred compensation | (1,485,126) | ||||
Forward foreign currency exchange contracts | 196,848 | ||||
Total Change in Unrealized Net Appreciation/Depreciation |
| (1,288,278) |
| ||
Net Increase/(Decrease) in Net Assets Resulting from Operations | $ | 3,827,650 |
| ||
See Notes to Financial Statements. | |
32 | JUNE 30, 2018 |
Janus Henderson Adaptive Global Allocation Fund
Statements of Changes in Net Assets
|
|
| Year
ended |
| Year ended | |||
Operations: | ||||||||
Net investment income/(loss) | $ | 972,243 | $ | 562,650 | ||||
Net realized gain/(loss) on investments | 4,143,685 | 4,303,273 | ||||||
Change in unrealized net appreciation/depreciation | (1,288,278) | 1,595,291 | ||||||
Net Increase/(Decrease) in Net Assets Resulting from Operations |
| 3,827,650 |
|
| 6,461,214 | |||
Dividends and Distributions to Shareholders: | ||||||||
Dividends from Net Investment Income | ||||||||
Class A Shares | (12,386) | (5,289) | ||||||
Class C Shares | (15,309) | (1,847) | ||||||
Class D Shares | (34,259) | (13,395) | ||||||
Class I Shares | (74,095) | (12,820) | ||||||
Class N Shares | (959,456) | (544,951) | ||||||
Class S Shares | (18,359) | (8,556) | ||||||
Class T Shares | (42,761) | (11,892) | ||||||
| Total Dividends from Net Investment Income |
| (1,156,625) |
|
| (598,750) | ||
Distributions from Net Realized Gain from Investment Transactions | ||||||||
Class A Shares | (42,830) | — | ||||||
Class C Shares | (83,298) | — | ||||||
Class D Shares | (110,002) | — | ||||||
Class I Shares | (229,169) | — | ||||||
Class N Shares | (2,889,637) | — | ||||||
Class S Shares | (69,088) | — | ||||||
Class T Shares | (138,227) | — | ||||||
| Total Distributions from Net Realized Gain from Investment Transactions | (3,562,251) |
|
| — | |||
Net Decrease from Dividends and Distributions to Shareholders |
| (4,718,876) |
|
| (598,750) | |||
Capital Share Transactions: | ||||||||
Class A Shares | 32,841 | 108,044 | ||||||
Class C Shares | 409,268 | 61,795 | ||||||
Class D Shares | 916,576 | 179,662 | ||||||
Class I Shares | 5,453,056 | 3,267,488 | ||||||
Class N Shares | 3,755,002 | (4,666,016) | ||||||
Class S Shares | 87,770 | 8,507 | ||||||
Class T Shares | 315,716 | 1,085,345 | ||||||
Net Increase/(Decrease) from Capital Share Transactions |
| 10,970,229 |
|
| 44,825 | |||
Net Increase/(Decrease) in Net Assets |
| 10,079,003 |
|
| 5,907,289 | |||
Net Assets: | ||||||||
Beginning of period | 60,463,431 | 54,556,142 | ||||||
| End of period | $ | 70,542,434 |
| $ | 60,463,431 | ||
Undistributed Net Investment Income/(Loss) | $ | 353,881 |
| $ | 220,840 | |||
See Notes to Financial Statements. | |
Janus Investment Fund | 33 |
Janus Henderson Adaptive Global Allocation Fund
Financial Highlights
Class A Shares | |||||||||||||||
For a share outstanding during each year or period ended June 30 |
| 2018 |
|
| 2017 |
|
| 2016 |
|
| 2015(1) |
| |||
Net Asset Value, Beginning of Period |
| $10.55 |
|
| $9.49 |
|
| $9.69 |
|
| $10.00 |
| |||
Income/(Loss) from Investment Operations: | |||||||||||||||
Net investment income/(loss)(2) | 0.13 | 0.09 | 0.05 | 0.01 | |||||||||||
Net realized and unrealized gain/(loss) | 0.55 | 1.06 | (0.23) | (0.32) | |||||||||||
Total from Investment Operations |
| 0.68 |
|
| 1.15 |
|
| (0.18) |
|
| (0.31) |
| |||
Less Dividends and Distributions: | |||||||||||||||
Dividends (from net investment income) | (0.18) | (0.09) | (0.02) | — | |||||||||||
Distributions (from capital gains) | (0.62) | — | — | — | |||||||||||
Total Dividends and Distributions |
| (0.80) |
|
| (0.09) |
|
| (0.02) |
|
| — |
| |||
Net Asset Value, End of Period | $10.43 | $10.55 | $9.49 | $9.69 | |||||||||||
Total Return* |
| 6.27% |
|
| 12.17% |
|
| (1.85)% |
|
| (3.10)% |
| |||
Net Assets, End of Period (in thousands) | $766 | $743 | $571 | $485 | |||||||||||
Average Net Assets for the Period (in thousands) | $777 | $609 | $530 | $496 | |||||||||||
Ratios to Average Net Assets**: |
|
|
|
|
|
|
|
|
|
|
|
| |||
Ratio of Gross Expenses | 1.63% | 1.52% | 1.54% | 13.45% | |||||||||||
Ratio of Net Expenses (After Waivers and Expense Offsets) | 1.01% | 1.07% | 1.09% | 1.07% | |||||||||||
Ratio of Net Investment Income/(Loss) | 1.24% | 0.86% | 0.55% | 5.04% | |||||||||||
Portfolio Turnover Rate | 440% | 302%(3) | 122% | 10% | |||||||||||
1 | |||||||||||||||
Class C Shares | |||||||||||||||
For a share outstanding during each year or period ended June 30 |
| 2018 |
|
| 2017 |
|
| 2016 |
|
| 2015(1) |
| |||
Net Asset Value, Beginning of Period |
| $10.48 |
|
| $9.44 |
|
| $9.69 |
|
| $10.00 |
| |||
Income/(Loss) from Investment Operations: | |||||||||||||||
Net investment income/(loss)(2) | 0.06 | 0.01 | (0.01) | 0.01 | |||||||||||
Net realized and unrealized gain/(loss) | 0.54 | 1.05 | (0.23) | (0.32) | |||||||||||
Total from Investment Operations |
| 0.60 |
|
| 1.06 |
|
| (0.24) |
|
| (0.31) |
| |||
Less Dividends and Distributions: | |||||||||||||||
Dividends (from net investment income) | (0.11) | (0.02) | (0.01) | — | |||||||||||
Distributions (from capital gains) | (0.62) | — | — | — | |||||||||||
Total Dividends and Distributions |
| (0.73) |
|
| (0.02) |
|
| (0.01) |
|
| — |
| |||
Net Asset Value, End of Period | $10.35 | $10.48 | $9.44 | $9.69 | |||||||||||
Total Return* |
| 5.58% |
|
| 11.21% |
|
| (2.52)% |
|
| (3.10)% |
| |||
Net Assets, End of Period (in thousands) | $1,603 | $1,225 | $1,046 | $24 | |||||||||||
Average Net Assets for the Period (in thousands) | $1,448 | $1,112 | $827 | $25 | |||||||||||
Ratios to Average Net Assets**: |
|
|
|
|
|
|
|
|
|
|
|
| |||
Ratio of Gross Expenses | 2.34% | 2.27% | 2.29% | 14.19% | |||||||||||
Ratio of Net Expenses (After Waivers and Expense Offsets) | 1.75% | 1.83% | 1.84% | 1.82% | |||||||||||
Ratio of Net Investment Income/(Loss) | 0.54% | 0.05% | (0.06)% | 4.29% | |||||||||||
Portfolio Turnover Rate | 440% | 302%(3) | 122% | 10% | |||||||||||
* Total return not annualized for periods of less than one full year. ** Annualized for periods of less than one full year. (1) Period from June 23, 2015 (inception date) through June 30, 2015. (2) Per share amounts are calculated based on average shares outstanding during the year or period. (3) The increase in the portfolio turnover rate was due to a restructuring of the Fund’s portfolio as a result of a change in its principal investment strategies. |
See Notes to Financial Statements. | |
34 | JUNE 30, 2018 |
Janus Henderson Adaptive Global Allocation Fund
Financial Highlights
Class D Shares | |||||||||||||||
For a share outstanding during each year or period ended June 30 |
| 2018 |
|
| 2017 |
|
| 2016 |
|
| 2015(1) |
| |||
Net Asset Value, Beginning of Period |
| $10.54 |
|
| $9.49 |
|
| $9.70 |
|
| $10.00 |
| |||
Income/(Loss) from Investment Operations: | |||||||||||||||
Net investment income/(loss)(2) | 0.15 | 0.09 | 0.06 | 0.01 | |||||||||||
Net realized and unrealized gain/(loss) | 0.55 | 1.05 | (0.25) | (0.31) | |||||||||||
Total from Investment Operations |
| 0.70 |
|
| 1.14 |
|
| (0.19) |
|
| (0.30) |
| |||
Less Dividends and Distributions: | |||||||||||||||
Dividends (from net investment income) | (0.19) | (0.09) | (0.02) | — | |||||||||||
Distributions (from capital gains) | (0.62) | — | — | — | |||||||||||
Total Dividends and Distributions |
| (0.81) |
|
| (0.09) |
|
| (0.02) |
|
| — |
| |||
Net Asset Value, End of Period | $10.43 | $10.54 | $9.49 | $9.70 | |||||||||||
Total Return* |
| 6.51% |
|
| 12.13% |
|
| (1.93)% |
|
| (3.00)% |
| |||
Net Assets, End of Period (in thousands) | $2,480 | $1,619 | $1,285 | $102 | |||||||||||
Average Net Assets for the Period (in thousands) | $2,139 | $1,435 | $973 | $64 | |||||||||||
Ratios to Average Net Assets**: |
|
|
|
|
|
|
|
|
|
|
|
| |||
Ratio of Gross Expenses | 1.84% | 2.01% | 2.59% | 20.64% | |||||||||||
Ratio of Net Expenses (After Waivers and Expense Offsets) | 0.86% | 0.96% | 1.10% | 0.98% | |||||||||||
Ratio of Net Investment Income/(Loss) | 1.39% | 0.94% | 0.69% | 5.03% | |||||||||||
Portfolio Turnover Rate | 440% | 302%(3) | 122% | 10% | |||||||||||
Class I Shares | ||||||||||||||||
For a share outstanding during each year or period ended June 30 |
|
| 2018 |
|
| 2017 |
|
| 2016 |
|
| 2015(1) |
| |||
Net Asset Value, Beginning of Period |
|
| $10.57 |
|
| $9.51 |
|
| $9.69 |
|
| $10.00 |
| |||
Income/(Loss) from Investment Operations: | ||||||||||||||||
Net investment income/(loss)(2) | 0.19 | 0.17 | 0.09 | 0.01 | ||||||||||||
Net realized and unrealized gain/(loss) | 0.52 | 1.00 | (0.24) | (0.32) | ||||||||||||
Total from Investment Operations |
|
| 0.71 |
|
| 1.17 |
|
| (0.15) |
|
| (0.31) |
| |||
Less Dividends and Distributions: | ||||||||||||||||
Dividends (from net investment income) | (0.20) | (0.11) | (0.03) | — | ||||||||||||
Distributions (from capital gains) | (0.62) | — | — | — | ||||||||||||
Total Dividends and Distributions |
|
| (0.82) |
|
| (0.11) |
|
| (0.03) |
|
| — |
| |||
Net Asset Value, End of Period | $10.46 | $10.57 | $9.51 | $9.69 | ||||||||||||
Total Return* |
|
| 6.57% |
|
| 12.42% |
|
| (1.55)% |
|
| (3.10)% |
| |||
Net Assets, End of Period (in thousands) | $9,959 | $4,596 | $1,090 | $48 | ||||||||||||
Average Net Assets for the Period (in thousands) | $4,830 | $1,802 | $854 | $50 | ||||||||||||
Ratios to Average Net Assets**: |
|
|
|
|
|
|
|
|
|
|
|
|
| |||
Ratio of Gross Expenses | 1.38% | 1.40% | 1.28% | 13.19% | ||||||||||||
Ratio of Net Expenses (After Waivers and Expense Offsets) | 0.79% | 0.80% | 0.83% | 0.82% | ||||||||||||
Ratio of Net Investment Income/(Loss) | 1.75% | 1.69% | 0.94% | 5.29% | ||||||||||||
Portfolio Turnover Rate | 440% | 302%(3) | 122% | 10% | ||||||||||||
* Total return not annualized for periods of less than one full year. ** Annualized for periods of less than one full year. (1) Period from June 23, 2015 (inception date) through June 30, 2015. (2) Per share amounts are calculated based on average shares outstanding during the year or period. (3) The increase in the portfolio turnover rate was due to a restructuring of the Fund’s portfolio as a result of a change in its principal investment strategies. |
See Notes to Financial Statements. | |
Janus Investment Fund | 35 |
Janus Henderson Adaptive Global Allocation Fund
Financial Highlights
Class N Shares | |||||||||||||||
For a share outstanding during each year or period ended June 30 |
| 2018 |
|
| 2017 |
|
| 2016 |
|
| 2015(1) |
| |||
Net Asset Value, Beginning of Period |
| $10.56 |
|
| $9.51 |
|
| $9.70 |
|
| $10.00 |
| |||
Income/(Loss) from Investment Operations: | |||||||||||||||
Net investment income/(loss)(2) | 0.16 | 0.10 | 0.07 | 0.01 | |||||||||||
Net realized and unrealized gain/(loss) | 0.56 | 1.06 | (0.23) | (0.31) | |||||||||||
Total from Investment Operations |
| 0.72 |
|
| 1.16 |
|
| (0.16) |
|
| (0.30) |
| |||
Less Dividends and Distributions: | |||||||||||||||
Dividends (from net investment income) | (0.20) | (0.11) | (0.03) | — | |||||||||||
Distributions (from capital gains) | (0.62) | — | — | — | |||||||||||
Total Dividends and Distributions |
| (0.82) |
|
| (0.11) |
|
| (0.03) |
|
| — |
| |||
Net Asset Value, End of Period | $10.46 | $10.56 | $9.51 | $9.70 | |||||||||||
Total Return* |
| 6.72% |
|
| 12.43% |
|
| (1.65)% |
|
| (3.00)% |
| |||
Net Assets, End of Period (in thousands) | $51,921 | $48,806 | $48,423 | $53,702 | |||||||||||
Average Net Assets for the Period (in thousands) | $52,068 | $48,134 | $49,786 | $9,234 | |||||||||||
Ratios to Average Net Assets**: |
|
|
|
|
|
|
|
|
|
|
|
| |||
Ratio of Gross Expenses | 1.27% | 1.24% | 1.27% | 67.74% | |||||||||||
Ratio of Net Expenses (After Waivers and Expense Offsets) | 0.73% | 0.81% | 0.83% | 0.82% | |||||||||||
Ratio of Net Investment Income/(Loss) | 1.52% | 1.03% | 0.73% | 6.84% | |||||||||||
Portfolio Turnover Rate | 440% | 302%(3) | 122% | 10% | |||||||||||
Class S Shares | ||||||||||||||||
For a share outstanding during each year or period ended June 30 |
|
| 2018 |
|
| 2017 |
|
| 2016 |
|
| 2015(1) |
| |||
Net Asset Value, Beginning of Period |
|
| $10.53 |
|
| $9.48 |
|
| $9.69 |
|
| $10.00 |
| |||
Income/(Loss) from Investment Operations: | ||||||||||||||||
Net investment income/(loss)(2) | 0.12 | 0.07 | 0.05 | 0.01 | ||||||||||||
Net realized and unrealized gain/(loss) | 0.55 | 1.06 | (0.24) | (0.32) | ||||||||||||
Total from Investment Operations |
|
| 0.67 |
|
| 1.13 |
|
| (0.19) |
|
| (0.31) |
| |||
Less Dividends and Distributions: | ||||||||||||||||
Dividends (from net investment income) | (0.16) | (0.08) | (0.02) | — | ||||||||||||
Distributions (from capital gains) | (0.62) | — | — | — | ||||||||||||
Total Dividends and Distributions |
|
| (0.78) |
|
| (0.08) |
|
| (0.02) |
|
| — |
| |||
Net Asset Value, End of Period | $10.42 | $10.53 | $9.48 | $9.69 | ||||||||||||
Total Return* |
|
| 6.24% |
|
| 11.95% |
|
| (1.99)% |
|
| (3.10)% |
| |||
Net Assets, End of Period (in thousands) | $1,256 | $1,183 | $1,057 | $24 | ||||||||||||
Average Net Assets for the Period (in thousands) | $1,267 | $1,110 | $831 | $25 | ||||||||||||
Ratios to Average Net Assets**: |
|
|
|
|
|
|
|
|
|
|
|
|
| |||
Ratio of Gross Expenses | 1.83% | 1.75% | 1.78% | 13.69% | ||||||||||||
Ratio of Net Expenses (After Waivers and Expense Offsets) | 1.11% | 1.17% | 1.24% | 1.32% | ||||||||||||
Ratio of Net Investment Income/(Loss) | 1.14% | 0.70% | 0.53% | 4.79% | ||||||||||||
Portfolio Turnover Rate | 440% | 302%(3) | 122% | 10% | ||||||||||||
* Total return not annualized for periods of less than one full year. ** Annualized for periods of less than one full year. (1) Period from June 23, 2015 (inception date) through June 30, 2015. (2) Per share amounts are calculated based on average shares outstanding during the year or period. (3) The increase in the portfolio turnover rate was due to a restructuring of the Fund’s portfolio as a result of a change in its principal investment strategies. |
See Notes to Financial Statements. | |
36 | JUNE 30, 2018 |
Janus Henderson Adaptive Global Allocation Fund
Financial Highlights
Class T Shares | |||||||||||||||
For a share outstanding during each year or period ended June 30 |
| 2018 |
|
| 2017 |
|
| 2016 |
|
| 2015(1) |
| |||
Net Asset Value, Beginning of Period |
| $10.55 |
|
| $9.50 |
|
| $9.69 |
|
| $10.00 |
| |||
Income/(Loss) from Investment Operations: | |||||||||||||||
Net investment income/(loss)(2) | 0.14 | 0.09 | 0.07 | 0.01 | |||||||||||
Net realized and unrealized gain/(loss) | 0.55 | 1.06 | (0.24) | (0.32) | |||||||||||
Total from Investment Operations |
| 0.69 |
|
| 1.15 |
|
| (0.17) |
|
| (0.31) |
| |||
Less Dividends and Distributions: | |||||||||||||||
Dividends (from net investment income) | (0.19) | (0.10) | (0.02) | — | |||||||||||
Distributions (from capital gains) | (0.62) | — | — | — | |||||||||||
Total Dividends and Distributions |
| (0.81) |
|
| (0.10) |
|
| (0.02) |
|
| — |
| |||
Net Asset Value, End of Period | $10.43 | $10.55 | $9.50 | $9.69 | |||||||||||
Total Return* |
| 6.40% |
|
| 12.17% |
|
| (1.72)% |
|
| (3.10)% |
| |||
Net Assets, End of Period (in thousands) | $2,557 | $2,291 | $1,085 | $48 | |||||||||||
Average Net Assets for the Period (in thousands) | $2,635 | $1,204 | $856 | $50 | |||||||||||
Ratios to Average Net Assets**: |
|
|
|
|
|
|
|
|
|
|
|
| |||
Ratio of Gross Expenses | 1.54% | 1.51% | 1.53% | 13.44% | |||||||||||
Ratio of Net Expenses (After Waivers and Expense Offsets) | 0.92% | 0.94% | 1.00% | 1.07% | |||||||||||
Ratio of Net Investment Income/(Loss) | 1.30% | 0.95% | 0.77% | 5.04% | |||||||||||
Portfolio Turnover Rate | 440% | 302%(3) | 122% | 10% | |||||||||||
* Total return not annualized for periods of less than one full year. ** Annualized for periods of less than one full year. (1) Period from June 23, 2015 (inception date) through June 30, 2015. (2) Per share amounts are calculated based on average shares outstanding during the year or period. (3) The increase in the portfolio turnover rate was due to a restructuring of the Fund’s portfolio as a result of a change in its principal investment strategies. |
See Notes to Financial Statements. | |
Janus Investment Fund | 37 |
Janus Henderson Adaptive Global Allocation Fund
Notes to Financial Statements
1. Organization and Significant Accounting Policies
Janus Henderson Adaptive Global Allocation Fund (the “Fund”) is a series of Janus Investment Fund (the “Trust”), which is organized as a Massachusetts business trust and is registered under the Investment Company Act of 1940, as amended (the “1940 Act”), as an open-end management investment company, and therefore has applied the specialized accounting and reporting guidance in Financial Accounting Standards Board (“FASB”) Accounting Standards Codification (“ASC”) Topic 946. The Trust offers 49 funds, each of which offers multiple share classes, with differing investment objectives and policies. The Fund seeks total return through growth of capital and income. The Fund is classified as nondiversified, as defined in the 1940 Act.
The Fund offers multiple classes of shares in order to meet the needs of various types of investors. Each class represents an interest in the same portfolio of investments. Certain financial intermediaries may not offer all classes of shares. Class D Shares are closed to certain new investors.
Class A Shares and Class C Shares are generally offered through financial intermediary platforms including, but not limited to, traditional brokerage platforms, mutual fund wrap fee programs, bank trust platforms, and retirement platforms.
Class D Shares are generally no longer being made available to new investors who do not already have a direct account with the Janus Henderson funds. Class D Shares are available only to investors who hold accounts directly with the Janus Henderson funds, to immediate family members or members of the same household of an eligible individual investor, and to existing beneficial owners of sole proprietorships or partnerships that hold accounts directly with the Janus Henderson funds.
Class I Shares are available through certain financial intermediary platforms including, but not limited to, mutual fund wrap fee programs, managed account programs, asset allocation programs, bank trust platforms, as well as certain retirement platforms. Class I Shares are also available to certain direct institutional investors including, but not limited to, corporations, certain retirement plans, public plans, and foundations/endowments, who established Class I Share accounts before August 4, 2017.
Class N Shares are generally available only to financial intermediaries purchasing on behalf of: 1) certain adviser-assisted, employer-sponsored retirement plans, including 401(k) plans, 457 plans, 403(b) plans, Taft-Hartley multi-employer plans, profit-sharing and money purchase pension plans, defined benefit plans and certain welfare benefit plans, such as health savings accounts, and nonqualified deferred compensation plans; and 2) retail investors purchasing in qualified or nonqualified accounts, whose accounts are held through an omnibus account at their financial intermediary, and where the financial intermediary requires no payment or reimbursement from the Fund, Janus Capital Management LLC (“Janus Capital”), or its affiliates. Class N Shares are also available to Janus Henderson proprietary products and to certain direct institutional investors approved by Janus Distributors LLC dba Janus Henderson Distributors (“Janus Henderson Distributors”) including, but not limited to, corporations, certain retirement plans, public plans, and foundations and endowments, subject to minimum investment requirements.
Class S Shares are offered through financial intermediary platforms including, but not limited to, retirement platforms and asset allocation, mutual fund wrap, or other discretionary or nondiscretionary fee-based investment advisory programs. In addition, Class S Shares may be available through certain financial intermediaries who have an agreement with Janus Capital or its affiliates to offer Class S Shares on their supermarket platforms.
Class T Shares are available through certain financial intermediary platforms including, but not limited to, mutual fund wrap fee programs, managed account programs, asset allocation programs, bank trust platforms, as well as certain retirement platforms. In addition, Class T Shares may be available through certain financial intermediaries who have an agreement with Janus Capital or its affiliates to offer Class T Shares on their supermarket platforms.
The following accounting policies have been followed by the Fund and are in conformity with accounting principles generally accepted in the United States of America.
Investment Valuation
Securities held by the Fund are valued in accordance with policies and procedures established by and under the supervision of the Trustees (the “Valuation Procedures”). Equity securities traded on a domestic securities exchange are generally valued at the closing prices on the primary market or exchange on which they trade. If such price is lacking for the trading period immediately preceding the time of determination, such securities are valued at their current bid price.
38 | JUNE 30, 2018 |
Janus Henderson Adaptive Global Allocation Fund
Notes to Financial Statements
Equity securities that are traded on a foreign exchange are generally valued at the closing prices on such markets. In the event that there is no current trading volume on a particular security in such foreign exchange, the bid price from the primary exchange is generally used to value the security. Securities that are traded on the over-the-counter (“OTC”) markets are generally valued at their closing or latest bid prices as available. Foreign securities and currencies are converted to U.S. dollars using the applicable exchange rate in effect at the close of the New York Stock Exchange (“NYSE”). The Fund will determine the market value of individual securities held by it by using prices provided by one or more approved professional pricing services or, as needed, by obtaining market quotations from independent broker-dealers. Most debt securities are valued in accordance with the evaluated bid price supplied by the pricing service that is intended to reflect market value. The evaluated bid price supplied by the pricing service is an evaluation that may consider factors such as security prices, yields, maturities and ratings. Certain short-term securities maturing within 60 days or less may be evaluated and valued on an amortized cost basis provided that the amortized cost determined approximates market value. Securities for which market quotations or evaluated prices are not readily available or deemed unreliable are valued at fair value determined in good faith under the Valuation Procedures. Circumstances in which fair value pricing may be utilized include, but are not limited to: (i) a significant event that may affect the securities of a single issuer, such as a merger, bankruptcy, or significant issuer-specific development; (ii) an event that may affect an entire market, such as a natural disaster or significant governmental action; (iii) a nonsignificant event such as a market closing early or not opening, or a security trading halt; and (iv) pricing of a nonvalued security and a restricted or nonpublic security. Special valuation considerations may apply with respect to “odd-lot” fixed-income transactions which, due to their small size, may receive evaluated prices by pricing services which reflect a large block trade and not what actually could be obtained for the odd-lot position. The Fund uses systematic fair valuation models provided by independent third parties to value international equity securities in order to adjust for stale pricing, which may occur between the close of certain foreign exchanges and the close of the NYSE.
Valuation Inputs Summary
FASB ASC 820, Fair Value Measurements and Disclosures (“ASC 820”), defines fair value, establishes a framework for measuring fair value, and expands disclosure requirements regarding fair value measurements. This standard emphasizes that fair value is a market-based measurement that should be determined based on the assumptions that market participants would use in pricing an asset or liability and establishes a hierarchy that prioritizes inputs to valuation techniques used to measure fair value. These inputs are summarized into three broad levels:
Level 1 – Unadjusted quoted prices in active markets the Fund has the ability to access for identical assets or liabilities.
Level 2 – Observable inputs other than unadjusted quoted prices included in Level 1 that are observable for the asset or liability either directly or indirectly. These inputs may include quoted prices for the identical instrument on an inactive market, prices for similar instruments, interest rates, prepayment speeds, credit risk, yield curves, default rates and similar data.
Assets or liabilities categorized as Level 2 in the hierarchy generally include: debt securities fair valued in accordance with the evaluated bid or ask prices supplied by a pricing service; securities traded on OTC markets and listed securities for which no sales are reported that are fair valued at the latest bid price (or yield equivalent thereof) obtained from one or more dealers transacting in a market for such securities or by a pricing service approved by the Fund’s Trustees; certain short-term debt securities with maturities of 60 days or less that are fair valued at amortized cost; and equity securities of foreign issuers whose fair value is determined by using systematic fair valuation models provided by independent third parties in order to adjust for stale pricing which may occur between the close of certain foreign exchanges and the close of the NYSE. Other securities that may be categorized as Level 2 in the hierarchy include, but are not limited to, preferred stocks, bank loans, swaps, investments in unregistered investment companies, options, and forward contracts.
Level 3 – Unobservable inputs for the asset or liability to the extent that relevant observable inputs are not available, representing the Fund’s own assumptions about the assumptions that a market participant would use in valuing the asset or liability, and that would be based on the best information available.
There have been no significant changes in valuation techniques used in valuing any such positions held by the Fund since the beginning of the fiscal year.
The inputs or methodology used for fair valuing securities are not necessarily an indication of the risk associated with investing in those securities. The summary of inputs used as of June 30, 2018 to fair value the Fund’s investments in
Janus Investment Fund | 39 |
Janus Henderson Adaptive Global Allocation Fund
Notes to Financial Statements
securities and other financial instruments is included in the “Valuation Inputs Summary” in the Notes to Schedule of Investments and Other Information.
The Fund recognizes transfers between the levels as of the beginning of the fiscal year. The following describes the amounts of transfers between Level 1, Level 2 and Level 3 of the fair value hierarchy during the year.
Financial assets of $3,843,033 were transferred out of Level 1 to Level 2 since certain foreign equity prices were applied a fair valuation adjustment factor at the end of the current period and no factor was applied at the end of the prior fiscal year.
Investment Transactions and Investment Income
Investment transactions are accounted for as of the date purchased or sold (trade date). Dividend income is recorded on the ex-dividend date. Certain dividends from foreign securities will be recorded as soon as the Fund is informed of the dividend, if such information is obtained subsequent to the ex-dividend date. Dividends from foreign securities may be subject to withholding taxes in foreign jurisdictions. Interest income is recorded on the accrual basis and includes amortization of premiums and accretion of discounts. Gains and losses are determined on the identified cost basis, which is the same basis used for federal income tax purposes. Income, as well as gains and losses, both realized and unrealized, are allocated daily to each class of shares based upon the ratio of net assets represented by each class as a percentage of total net assets.
Expenses
The Fund bears expenses incurred specifically on its behalf. Each class of shares bears a portion of general expenses, which are allocated daily to each class of shares based upon the ratio of net assets represented by each class as a percentage of total net assets. Expenses directly attributable to a specific class of shares are charged against the operations of such class.
Estimates
The preparation of financial statements in conformity with accounting principles generally accepted in the United States of America requires management to make estimates and assumptions that affect the reported amount of assets and liabilities and disclosure of contingent assets and liabilities at the date of the financial statements, and the reported amounts of income and expenses during the reporting period. Actual results could differ from those estimates.
Indemnifications
In the normal course of business, the Fund may enter into contracts that contain provisions for indemnification of other parties against certain potential liabilities. The Fund’s maximum exposure under these arrangements is unknown, and would involve future claims that may be made against the Fund that have not yet occurred. Currently, the risk of material loss from such claims is considered remote.
Foreign Currency Translations
The Fund does not isolate that portion of the results of operations resulting from the effect of changes in foreign exchange rates on investments from the fluctuations arising from changes in market prices of securities held at the date of the financial statements. Net unrealized appreciation or depreciation of investments and foreign currency translations arise from changes in the value of assets and liabilities, including investments in securities held at the date of the financial statements, resulting from changes in the exchange rates and changes in market prices of securities held.
Currency gains and losses are also calculated on payables and receivables that are denominated in foreign currencies. The payables and receivables are generally related to foreign security transactions and income translations.
Foreign currency-denominated assets and forward currency contracts may involve more risks than domestic transactions, including currency risk, counterparty risk, political and economic risk, regulatory risk and equity risk. Risks may arise from unanticipated movements in the value of foreign currencies relative to the U.S. dollar.
Dividends and Distributions
The Fund generally declares and distributes dividends of net investment income and realized capital gains (if any) annually. The Fund may treat a portion of the amount paid to redeem shares as a distribution of investment company taxable income and realized capital gains that are reflected in the net asset value. This practice, commonly referred to as “equalization,” has no effect on the redeeming shareholder or the Fund’s total return, but may reduce the amounts
40 | JUNE 30, 2018 |
Janus Henderson Adaptive Global Allocation Fund
Notes to Financial Statements
that would otherwise be required to be paid as taxable dividends to the remaining shareholders. It is possible that the Internal Revenue Service (IRS) could challenge the Fund's equalization methodology or calculations, and any such challenge could result in additional tax, interest, or penalties to be paid by the Fund.
The Fund may make certain investments in real estate investment trusts (“REITs”) which pay dividends to their shareholders based upon funds available from operations. It is quite common for these dividends to exceed the REITs’ taxable earnings and profits, resulting in the excess portion of such dividends being designated as a return of capital. If the Fund distributes such amounts, such distributions could constitute a return of capital to shareholders for federal income tax purposes.
Federal Income Taxes
The Fund intends to continue to qualify as a regulated investment company and distribute all of its taxable income in accordance with the requirements of Subchapter M of the Internal Revenue Code. Management has analyzed the Fund’s tax positions taken for all open federal income tax years, generally a three-year period, and has concluded that no provision for federal income tax is required in the Fund’s financial statements. The Fund is not aware of any tax positions for which it is reasonably possible that the total amounts of unrecognized tax benefits will significantly change in the next twelve months.
On December 22, 2017, the Tax Cuts and Jobs Act was signed into law. Currently, Management does not believe the bill will have a material impact on the Fund’s intention to continue to qualify as a regulated investment company, which is generally not subject to U.S. federal income tax.
2. Derivative Instruments
The Fund may invest in various types of derivatives, which may at times result in significant derivative exposure. A derivative is a financial instrument whose performance is derived from the performance of another asset. The Fund may invest in derivative instruments including, but not limited to: futures contracts, put options, call options, options on future contracts, options on foreign currencies, options on recovery locks, options on security and commodity indices, swaps, forward contracts, structured investments, and other equity-linked derivatives. Each derivative instrument that was held by the Fund during the year ended June 30, 2018 is discussed in further detail below. A summary of derivative activity by the Fund is reflected in the tables at the end of the Schedule of Investments.
The Fund may use derivative instruments for hedging purposes (to offset risks associated with an investment, currency exposure, or market conditions), to adjust currency exposure relative to a benchmark index, or for speculative purposes (to earn income and seek to enhance returns). When the Fund invests in a derivative for speculative purposes, the Fund will be fully exposed to the risks of loss of that derivative, which may sometimes be greater than the derivative’s cost. The Fund may not use any derivative to gain exposure to an asset or class of assets that it would be prohibited by its investment restrictions from purchasing directly. The Fund’s ability to use derivative instruments may also be limited by tax considerations.
Investments in derivatives in general are subject to market risks that may cause their prices to fluctuate over time. Investments in derivatives may not directly correlate with the price movements of the underlying instrument. As a result, the use of derivatives may expose the Fund to additional risks that it would not be subject to if it invested directly in the securities underlying those derivatives. The use of derivatives may result in larger losses or smaller gains than otherwise would be the case. Derivatives can be volatile and may involve significant risks.
In pursuit of its investment objective, the Fund may seek to use derivatives to increase or decrease exposure to the following market risk factors:
· Commodity Risk – the risk related to the change in value of commodities or commodity-linked investments due to changes in the overall market movements, volatility of the underlying benchmark, changes in interest rates, or other factors affecting a particular industry of commodity such as drought, floods, weather, livestock disease, embargoes, tariffs, and international economic, political, and regulatory developments.
· Counterparty Risk – the risk that the counterparty (the party on the other side of the transaction) on a derivative transaction will be unable to honor its financial obligation to the Fund.
· Credit Risk – the risk an issuer will be unable to make principal and interest payments when due, or will default on its obligations.
Janus Investment Fund | 41 |
Janus Henderson Adaptive Global Allocation Fund
Notes to Financial Statements
· Currency Risk – the risk that changes in the exchange rate between currencies will adversely affect the value (in U.S. dollar terms) of an investment.
· Equity Risk – the risk related to the change in value of equity securities as they relate to increases or decreases in the general market.
· Index Risk – if the derivative is linked to the performance of an index, it will be subject to the risks associated with changes in that index. If the index changes, the Fund could receive lower interest payments or experience a reduction in the value of the derivative to below what the Fund paid. Certain indexed securities, including inverse securities (which move in an opposite direction to the index), may create leverage, to the extent that they increase or decrease in value at a rate that is a multiple of the changes in the applicable index.
· Interest Rate Risk – the risk that the value of fixed-income securities will generally decline as prevailing interest rates rise, which may cause the Fund’s NAV to likewise decrease.
· Leverage Risk – the risk associated with certain types of leveraged investments or trading strategies pursuant to which relatively small market movements may result in large changes in the value of an investment. The Fund creates leverage by investing in instruments, including derivatives, where the investment loss can exceed the original amount invested. Certain investments or trading strategies, such as short sales, that involve leverage can result in losses that greatly exceed the amount originally invested.
· Liquidity Risk – the risk that certain securities may be difficult or impossible to sell at the time that the seller would like or at the price that the seller believes the security is currently worth.
Derivatives may generally be traded OTC or on an exchange. Derivatives traded OTC are agreements that are individually negotiated between parties and can be tailored to meet a purchaser’s needs. OTC derivatives are not guaranteed by a clearing agency and may be subject to increased credit risk.
In an effort to mitigate credit risk associated with derivatives traded OTC, the Fund may enter into collateral agreements with certain counterparties whereby, subject to certain minimum exposure requirements, the Fund may require the counterparty to post collateral if the Fund has a net aggregate unrealized gain on all OTC derivative contracts with a particular counterparty. Additionally, the Fund may deposit cash and/or treasuries as collateral with the counterparty and/or custodian daily (based on the daily valuation of the financial asset) if the Fund has a net aggregate unrealized loss on OTC derivative contracts with a particular counterparty. All liquid securities and restricted cash are considered to cover in an amount at all times equal to or greater than the Fund’s commitment with respect to certain exchange-traded derivatives, centrally cleared derivatives, forward foreign currency exchange contracts, short sales, and/or securities with extended settlement dates. There is no guarantee that counterparty exposure is reduced and these arrangements are dependent on Janus Capital's ability to establish and maintain appropriate systems and trading.
Forward Foreign Currency Exchange Contracts
A forward foreign currency exchange contract (“forward currency contract”) is an obligation to buy or sell a specified currency at a future date at a negotiated rate (which may be U.S. dollars or a foreign currency). The Fund may enter into forward currency contracts for hedging purposes, including, but not limited to, reducing exposure to changes in foreign currency exchange rates on foreign portfolio holdings and locking in the U.S. dollar cost of firm purchase and sale commitments for securities denominated in or exposed to foreign currencies. The Fund may also invest in forward currency contracts for non-hedging purposes such as seeking to enhance returns. The Fund is subject to currency risk and counterparty risk in the normal course of pursuing its investment objective through its investments in forward currency contracts.
Forward currency contracts are valued by converting the foreign value to U.S. dollars by using the current spot U.S. dollar exchange rate and/or forward rate for that currency. Exchange and forward rates as of the close of the NYSE shall be used to value the forward currency contracts. The unrealized appreciation/(depreciation) for forward currency contracts is reported in the Statement of Assets and Liabilities as a receivable or payable and in the Statement of Operations for the change in unrealized net appreciation/depreciation (if applicable). The gain or loss arising from the difference between the U.S. dollar cost of the original contract and the value of the foreign currency in U.S. dollars upon closing a forward currency contract is reported on the Statement of Operations (if applicable).
42 | JUNE 30, 2018 |
Janus Henderson Adaptive Global Allocation Fund
Notes to Financial Statements
During the year, the Fund entered into forward currency contracts with the obligation to sell foreign currencies in the future at an agreed upon rate in order to take a negative outlook on the related currency. These forward contracts seek to increase exposure to currency risk.
During the year, the Fund entered into forward currency contracts with the obligation to sell foreign currencies in the future at an agreed upon rate in order to decrease exposure to currency risk associated with foreign currency denominated securities held by the Fund.
Futures Contracts
A futures contract is an exchange-traded agreement to take or make delivery of an underlying asset at a specific time in the future for a specific predetermined negotiated price. The Fund may enter into futures contracts to gain exposure to the stock market or other markets pending investment of cash balances or to meet liquidity needs. The Fund is subject to interest rate risk, equity risk, and currency risk in the normal course of pursuing its investment objective through its investments in futures contracts. The Fund may also use such derivative instruments to hedge or protect from adverse movements in securities prices, currency rates or interest rates. The use of futures contracts may involve risks such as the possibility of illiquid markets or imperfect correlation between the values of the contracts and the underlying securities, or that the counterparty will fail to perform its obligations.
Futures contracts on commodities are valued at the settlement price on valuation date on the commodities exchange as reported by an approved vendor. Mini contracts, as defined in the description of the contract, shall be valued using the Actual Settlement Price or “ASET” price type as reported by an approved vendor. In the event that foreign futures trade when the foreign equity markets are closed, the last foreign futures trade price shall be used. Futures contracts are marked-to-market daily, and the daily variation margin is recorded as a receivable or payable on the Statement of Assets and Liabilities (if applicable). The change in unrealized net appreciation/depreciation is reported on the Statement of Operations (if applicable). When a contract is closed, a realized gain or loss is reported on the Statement of Operations (if applicable), equal to the difference between the opening and closing value of the contract. Securities held by the Fund that are designated as collateral for market value on futures contracts are noted on the Schedule of Investments (if applicable). Such collateral is in the possession of the Fund’s futures commission merchant.
With futures, there is minimal counterparty credit risk to the Fund since futures are exchange-traded and the exchange’s clearinghouse, as counterparty to all exchange-traded futures, guarantees the futures against default.
During the year, the Fund sold futures on equity indices to decrease exposure to equity risk. There were no futures held at June 30, 2018.
Options Contracts
An options contract provides the purchaser with the right, but not the obligation, to buy (call option) or sell (put option) a financial instrument at an agreed upon price on or before a specified date. The purchaser pays a premium to the seller for this right. The seller has the corresponding obligation to sell or buy a financial instrument if the purchaser (owner) "exercises" the option. When an option is exercised, the proceeds on sales for a written call option, the purchase cost for a written put option, or the cost of the security for a purchased put or call option are adjusted by the amount of premium received or paid. Upon expiration, or closing of the option transaction, a realized gain or loss is reported on the Statement of Operations (if applicable). The difference between the premium paid/received and the market value of the option is recorded as unrealized appreciation or depreciation. The net change in unrealized appreciation or depreciation is reported on the Statement of Operations (if applicable). Option contracts are typically valued using an approved vendor’s option valuation model. To the extent reliable market quotations are available, option contracts are valued using market quotations. In cases when an approved vendor cannot provide coverage for an option and there is no reliable market quotation, a broker quotation or an internal valuation using the Black-Scholes model, the Cox-Rubinstein Binomial Option Pricing Model, or other appropriate option pricing model is used. Certain options contracts are marked-to-market daily, and the daily variation margin is recorded as a receivable or payable on the Statement of Assets and Liabilities as “Variation margin receivable” or “Variation margin payable” (if applicable).
The Fund may use options contracts to hedge against changes in interest rates, the values of equities, or foreign currencies. The Fund generally invests in options to hedge against adverse movements in the value of portfolio holdings. The use of such instruments may involve certain additional risks as a result of unanticipated movements in the market. A lack of correlation between the value of an instrument underlying an option and the asset being hedged, or unexpected adverse price movements, could render the Fund’s hedging strategy unsuccessful. In addition, there can be no assurance that a liquid secondary market will exist for any option purchased or sold. The Fund may be subject to
Janus Investment Fund | 43 |
Janus Henderson Adaptive Global Allocation Fund
Notes to Financial Statements
counterparty risk, interest rate risk, liquidity risk, equity risk, commodity risk, and currency risk in the normal course of pursuing its investment objective through its investments in options contracts.
Options traded on an exchange are regulated and the terms of the options are standardized. Options traded OTC expose the Fund to counterparty risk in the event that the counterparty does not perform. This risk is mitigated by having a netting arrangement between the Fund and the counterparty and by having the counterparty post collateral to cover the Fund’s exposure to the counterparty.
The Fund may purchase put options to hedge against a decline in the value of its portfolio. By using put options in this way, the Fund will reduce any profit it might otherwise have realized in the underlying security by the amount of the premium paid for the put option and by transaction costs. The Fund may purchase call options to hedge against an increase in the price of securities that it may buy in the future. The premium paid for the call option plus any transaction costs will reduce the benefit, if any, realized by the Fund upon exercise of the option, and, unless the price of the underlying security rises sufficiently, the option may expire worthless to the Fund. The risk in buying options is that the Fund pays a premium whether or not the options are exercised. Options purchased are reported in the Schedule of Investments (if applicable).
During the year, the Fund purchased put options on various ETFs for the purpose of decreasing exposure to individual equity risk.
In writing an option, the Fund bears the risk of an unfavorable change in the price of the security underlying the written option. When an option is written, the Fund receives a premium and becomes obligated to sell or purchase the underlying security at a fixed price, upon exercise of the option. Options written are reported as a liability on the Statement of Assets and Liabilities as “Options written, at value” (if applicable). The risk in writing call options is that the Fund gives up the opportunity for profit if the market price of the security increases and the options are exercised. The risk in writing put options is that the Fund may incur a loss if the market price of the security decreases and the options are exercised. The risk in buying options is that the Fund pays a premium whether or not the options are exercised. Exercise of an option written by the Fund could result in the Fund buying or selling a security at a price different from the current market value.
During the year, the Fund wrote put options on various ETFs for the purpose of increasing exposure to individual equity risk and/or generating income.
There were no purchased or written options held at June 30, 2018.
3. Other Investments and Strategies
Additional Investment Risk
The financial crisis in both the U.S. and global economies over the past several years has resulted, and may continue to result, in a significant decline in the value and liquidity of many securities of issuers worldwide in the equity and fixed-income/credit markets. In response to the crisis, the United States and certain foreign governments, along with the U.S. Federal Reserve and certain foreign central banks, took steps to support the financial markets. The withdrawal of this support, a failure of measures put in place to respond to the crisis, or investor perception that such efforts were not sufficient could each negatively affect financial markets generally, and the value and liquidity of specific securities. In addition, policy and legislative changes in the United States and in other countries continue to impact many aspects of financial regulation. The effect of these changes on the markets, and the practical implications for market participants, including the Fund, may not be fully known for some time. As a result, it may also be unusually difficult to identify both investment risks and opportunities, which could limit or preclude the Fund’s ability to achieve its investment objective. Therefore, it is important to understand that the value of your investment may fall, sometimes sharply, and you could lose money.
The enactment of the Dodd-Frank Wall Street Reform and Consumer Protection Act (the “Dodd-Frank Act”) of 2010 provided for widespread regulation of financial institutions, consumer financial products and services, broker-dealers, OTC derivatives, investment advisers, credit rating agencies, and mortgage lending, which expanded federal oversight in the financial sector, including the investment management industry. Many provisions of the Dodd-Frank Act remain pending and will be implemented through future rulemaking. Therefore, the ultimate impact of the Dodd-Frank Act and the regulations under the Dodd-Frank Act on the Fund and the investment management industry as a whole, is not yet certain.
44 | JUNE 30, 2018 |
Janus Henderson Adaptive Global Allocation Fund
Notes to Financial Statements
A number of countries in the European Union (“EU”) have experienced, and may continue to experience, severe economic and financial difficulties. In particular, many EU nations are susceptible to economic risks associated with high levels of debt, notably due to investments in sovereign debt of countries such as Greece, Italy, Spain, Portugal, and Ireland. Many non-governmental issuers, and even certain governments, have defaulted on, or been forced to restructure, their debts. Many other issuers have faced difficulties obtaining credit or refinancing existing obligations. Financial institutions have in many cases required government or central bank support, have needed to raise capital, and/or have been impaired in their ability to extend credit. As a result, financial markets in the EU experienced extreme volatility and declines in asset values and liquidity. Responses to these financial problems by European governments, central banks, and others, including austerity measures and reforms, may not work, may result in social unrest, and may limit future growth and economic recovery or have other unintended consequences. Further defaults or restructurings by governments and others of their debt could have additional adverse effects on economies, financial markets, and asset valuations around the world. Greece, Ireland, and Portugal have already received one or more "bailouts" from other Eurozone member states, and it is unclear how much additional funding they will require or if additional Eurozone member states will require bailouts in the future. The risk of investing in securities in the European markets may also be heightened due to the referendum in which the United Kingdom voted to exit the EU (known as “Brexit”). There is considerable uncertainty about how Brexit will be conducted, how negotiations of necessary treaties and trade agreements will proceed, or how financial markets will react. In addition, one or more other countries may also abandon the euro and/or withdraw from the EU, placing its currency and banking system in jeopardy.
Certain areas of the world have historically been prone to and economically sensitive to environmental events such as, but not limited to, hurricanes, earthquakes, typhoons, flooding, tidal waves, tsunamis, erupting volcanoes, wildfires or droughts, tornadoes, mudslides, or other weather-related phenomena. Such disasters, and the resulting physical or economic damage, could have a severe and negative impact on the Fund’s investment portfolio and, in the longer term, could impair the ability of issuers in which the Fund invests to conduct their businesses as they would under normal conditions. Adverse weather conditions may also have a particularly significant negative effect on issuers in the agricultural sector and on insurance companies that insure against the impact of natural disasters.
Counterparties
Fund transactions involving a counterparty are subject to the risk that the counterparty or a third party will not fulfill its obligation to the Fund (“counterparty risk”). Counterparty risk may arise because of the counterparty’s financial condition (i.e., financial difficulties, bankruptcy, or insolvency), market activities and developments, or other reasons, whether foreseen or not. A counterparty’s inability to fulfill its obligation may result in significant financial loss to the Fund. The Fund may be unable to recover its investment from the counterparty or may obtain a limited recovery, and/or recovery may be delayed. The extent of the Fund’s exposure to counterparty risk with respect to financial assets and liabilities approximates its carrying value. See the "Offsetting Assets and Liabilities" section of this Note for further details.
The Fund may be exposed to counterparty risk through participation in various programs, including, but not limited to, lending its securities to third parties, cash sweep arrangements whereby the Fund’s cash balance is invested in one or more types of cash management vehicles, as well as investments in, but not limited to, repurchase agreements, debt securities, and derivatives, including various types of swaps, futures and options. The Fund intends to enter into financial transactions with counterparties that Janus Capital believes to be creditworthy at the time of the transaction. There is always the risk that Janus Capital’s analysis of a counterparty’s creditworthiness is incorrect or may change due to market conditions. To the extent that the Fund focuses its transactions with a limited number of counterparties, it will have greater exposure to the risks associated with one or more counterparties.
Exchange-Traded and Mutual Funds
The Fund may invest in exchange-traded funds (“ETFs”) and mutual funds to gain exposure to a particular portion of the market. ETFs are typically open-end investment companies, which may seek to track the performance of a specific index or be actively managed. ETFs are traded on a national securities exchange at market prices that may vary from the net asset value of their underlying investments. Accordingly, there may be times when an ETF trades at a premium or discount. When the Fund invests in an ETF or mutual fund, in addition to directly bearing the expenses associated with its own operations, it will bear a pro rata portion of the ETF's or mutual fund’s expenses. As a result, the cost of investing in the Fund may be higher than the cost of investing directly in ETFs or mutual funds and may be higher than other mutual funds that invest directly in stocks and bonds. ETFs also involve the risk that an active trading market for an ETF's shares may not develop or be maintained. Similarly, because the value of ETF shares depends on the demand in the market, the Fund may not be able to purchase or sell an ETF at the most optimal time, which could adversely
Janus Investment Fund | 45 |
Janus Henderson Adaptive Global Allocation Fund
Notes to Financial Statements
affect the Fund’s performance. In addition, ETFs that track particular indices may be unable to match the performance of such underlying indices due to the temporary unavailability of certain index securities in the secondary market or other factors, such as discrepancies with respect to the weighting of securities. Because the Fund may invest in a broad range of ETFs and mutual funds, such risks may include, but are not limited to, leverage risk, foreign exposure risk, interest rate risk, emerging markets risk, fixed-income risk, and commodity-linked investments risk. The Fund is also subject to the risks associated with the securities in which the ETF or mutual fund invests.
Offsetting Assets and Liabilities
The Fund presents gross and net information about transactions that are either offset in the financial statements or subject to an enforceable master netting arrangement or similar agreement with a designated counterparty, regardless of whether the transactions are actually offset in the Statement of Assets and Liabilities.
In order to better define its contractual rights and to secure rights that will help the Fund mitigate its counterparty risk, the Fund has entered into an International Swaps and Derivatives Association, Inc. Master Agreement (“ISDA Master Agreement”) or similar agreement with its derivative contract counterparties. An ISDA Master Agreement is a bilateral agreement between the Fund and a counterparty that governs OTC derivatives and forward foreign currency exchange contracts and typically contains, among other things, collateral posting terms and netting provisions in the event of a default and/or termination event. Under an ISDA Master Agreement, in the event of a default and/or termination event, the Fund may offset with each counterparty certain derivative financial instruments’ payables and/or receivables with collateral held and/or posted and create one single net payment. For financial reporting purposes, the Fund does not offset certain derivative financial instruments’ payables and receivables and related collateral on the Statement of Assets and Liabilities.
The following tables present gross amounts of recognized assets and/or liabilities and the net amounts after deducting collateral that has been pledged by counterparties or has been pledged to counterparties (if applicable). For corresponding information grouped by type of instrument, see the “Fair Value of Derivative Instruments (not accounted for as hedging instruments) as of June 30, 2018” table located in the Fund’s Schedule of Investments.
Offsetting of Financial Assets and Derivative Assets | |||||||||
Gross Amounts | |||||||||
of Recognized | Offsetting Asset | Collateral | |||||||
Counterparty | Assets | or Liability(a) | Pledged(b) | Net Amount | |||||
Bank of America | $ | 27,794 | $ | — | $ | — | $ | 27,794 | |
Deutsche Bank AG | 8,082,194 | — | (8,082,194) | — | |||||
HSBC Securities (USA), Inc. | 102,814 | — | — | 102,814 | |||||
Total | $ | 8,212,802 | $ | — | $ | (8,082,194) | $ | 130,608 | |
(a) | Represents the amount of assets or liabilities that could be offset with the same counterparty under master netting or similar agreements that management elects not to offset on the Statement of Assets and Liabilities. | ||||||||
(b) | Collateral pledged is limited to the net outstanding amount due to/from an individual counterparty. The actual collateral amounts pledged may exceed these amounts and may fluctuate in value. | ||||||||
Deutsche Bank AG acts as securities lending agent and a limited purpose custodian or subcustodian to receive and disburse cash balances and cash collateral, hold short-term investments, hold collateral, and perform other custodian functions in accordance with the Agency Securities Lending and Repurchase Agreement. Securities on loan will be continuously secured by collateral which may consist of cash, U.S. Government securities, domestic and foreign short-term debt instruments, letters of credit, time deposits, repurchase agreements, money market mutual funds or other money market accounts, or such other collateral as permitted by the SEC. The value of the collateral must be at least 102% of the market value of the loaned securities that are denominated in U.S. dollars and 105% of the market value of the loaned securities that are not denominated in U.S. dollars. Upon receipt of cash collateral, Janus Capital intends to invest the cash collateral in a cash management vehicle for which Janus Capital serves as investment adviser, Janus Henderson Cash Collateral Fund LLC. Loaned securities and related collateral are marked-to-market each business day based upon the market value of the loaned securities at the close of business, employing the most recent available pricing information. Collateral levels are then adjusted based on this mark-to-market evaluation.
46 | JUNE 30, 2018 |
Janus Henderson Adaptive Global Allocation Fund
Notes to Financial Statements
The Fund generally does not exchange collateral on its forward foreign currency contracts with its counterparties; however, all liquid securities and restricted cash are considered to cover in an amount at all times equal to or greater than the Fund’s commitment with respect to these contracts. Certain securities may be segregated at the Fund’s custodian. These segregated securities are denoted on the accompanying Schedule of Investments and are evaluated daily to ensure their cover and/or market value equals or exceeds the Fund’s corresponding forward foreign currency exchange contract's obligation value.
Real Estate Investing
The Fund may invest in equity and debt securities of real estate-related companies. Such companies may include those in the real estate industry or real estate-related industries. These securities may include common stocks, corporate bonds, preferred stocks, and other equity securities, including, but not limited to, mortgage-backed securities, real estate-backed securities, securities of REITs and similar REIT-like entities. A REIT is a trust that invests in real estate-related projects, such as properties, mortgage loans, and construction loans. REITs are generally categorized as equity, mortgage, or hybrid REITs. A REIT may be listed on an exchange or traded OTC.
Securities Lending
Under procedures adopted by the Trustees, the Fund may seek to earn additional income by lending securities to certain qualified broker-dealers and institutions. Deutsche Bank AG acts as securities lending agent and a limited purpose custodian or subcustodian to receive and disburse cash balances and cash collateral, hold short-term investments, hold collateral, and perform other custodian functions in accordance with the Agency Securities Lending and Repurchase Agreement. The Fund may lend portfolio securities in an amount equal to up to 1/3 of its total assets as determined at the time of the loan origination. There is the risk of delay in recovering a loaned security or the risk of loss in collateral rights if the borrower fails financially. In addition, Janus Capital makes efforts to balance the benefits and risks from granting such loans. All loans will be continuously secured by collateral which may consist of cash, U.S. Government securities, domestic and foreign short-term debt instruments, letters of credit, time deposits, repurchase agreements, money market mutual funds or other money market accounts, or such other collateral as permitted by the SEC. If the Fund is unable to recover a security on loan, the Fund may use the collateral to purchase replacement securities in the market. There is a risk that the value of the collateral could decrease below the cost of the replacement security by the time the replacement investment is made, resulting in a loss to the Fund.
Upon receipt of cash collateral, Janus Capital may invest it in affiliated or non-affiliated cash management vehicles, whether registered or unregistered entities, as permitted by the 1940 Act and rules promulgated thereunder. Janus Capital currently intends to invest the cash collateral in a cash management vehicle for which Janus Capital serves as investment adviser, Janus Henderson Cash Collateral Fund LLC. An investment in Janus Henderson Cash Collateral Fund LLC is generally subject to the same risks that shareholders experience when investing in similarly structured vehicles, such as the potential for significant fluctuations in assets as a result of the purchase and redemption activity of the securities lending program, a decline in the value of the collateral, and possible liquidity issues. Such risks may delay the return of the cash collateral and cause the Fund to violate its agreement to return the cash collateral to a borrower in a timely manner. As adviser to the Fund and Janus Henderson Cash Collateral Fund LLC, Janus Capital has an inherent conflict of interest as a result of its fiduciary duties to both the Fund and Janus Henderson Cash Collateral Fund LLC. Additionally, Janus Capital receives an investment advisory fee of 0.05% for managing Janus Henderson Cash Collateral Fund LLC, but it may not receive a fee for managing certain other affiliated cash management vehicles in which the Fund may invest, and therefore may have an incentive to allocate preferred investment opportunities to investment vehicles for which it is receiving a fee.
The value of the collateral must be at least 102% of the market value of the loaned securities that are denominated in U.S. dollars and 105% of the market value of the loaned securities that are not denominated in U.S. dollars. Loaned securities and related collateral are marked-to-market each business day based upon the market value of the loaned securities at the close of business, employing the most recent available pricing information. Collateral levels are then adjusted based on this mark-to-market evaluation.
The cash collateral invested by Janus Capital is disclosed in the Schedule of Investments (if applicable).
Income earned from the investment of the cash collateral, net of rebates paid to, or fees paid by, borrowers and less the fees paid to the lending agent are included as “Affiliated securities lending income, net” on the Statement of Operations. As of June 30, 2018, securities lending transactions accounted for as secured borrowings with an overnight and
Janus Investment Fund | 47 |
Janus Henderson Adaptive Global Allocation Fund
Notes to Financial Statements
continuous contractual maturity are $8,082,194. Gross amounts of recognized liabilities for securities lending (collateral received) as of June 30, 2018 is $8,252,929, resulting in the net amount due to the counterparty of $170,734.
Sovereign Debt
The Fund may invest in U.S. and non-U.S. government debt securities (“sovereign debt”). Some investments in sovereign debt, such as U.S. sovereign debt, are considered low risk. However, investments in sovereign debt, especially the debt of less developed countries, can involve a high degree of risk, including the risk that the governmental entity that controls the repayment of sovereign debt may not be willing or able to repay the principal and/or to pay the interest on its sovereign debt in a timely manner. A sovereign debtor’s willingness or ability to satisfy its debt obligation may be affected by various factors including, but not limited to, its cash flow situation, the extent of its foreign currency reserves, the availability of foreign exchange when a payment is due, the relative size of its debt position in relation to its economy as a whole, the sovereign debtor’s policy toward international lenders, and local political constraints to which the governmental entity may be subject. Sovereign debtors may also be dependent on expected disbursements from foreign governments, multilateral agencies, and other entities. The failure of a sovereign debtor to implement economic reforms, achieve specified levels of economic performance, or repay principal or interest when due may result in the cancellation of third party commitments to lend funds to the sovereign debtor, which may further impair such debtor’s ability or willingness to timely service its debts. The Fund may be requested to participate in the rescheduling of such sovereign debt and to extend further loans to governmental entities, which may adversely affect the Fund’s holdings. In the event of default, there may be limited or no legal remedies for collecting sovereign debt and there may be no bankruptcy proceedings through which the Fund may collect all or part of the sovereign debt that a governmental entity has not repaid. In addition, to the extent the Fund invests in non-U.S. sovereign debt, it may be subject to currency risk.
4. Investment Advisory Agreements and Other Transactions with Affiliates
The Fund pays Janus Capital an investment advisory fee which is calculated daily and paid monthly. The following table reflects the Fund’s contractual investment advisory fee rate (expressed as an annual rate).
Average Daily Net Assets of the Fund | Contractual Investment Advisory Fee (%) |
First $2 Billion | 0.75 |
Next $2 Billion | 0.72 |
Over $4 Billion | 0.70 |
Janus Capital has contractually agreed to waive the advisory fee payable by the Fund or reimburse expenses in an amount equal to the amount, if any, that the Fund’s total annual fund operating expenses, including the investment advisory fee, but excluding the fees payable pursuant to a Rule 12b-1 plan, shareholder servicing fees, such as transfer agency fees (including out-of-pocket costs), administrative services fees and any networking/omnibus/administrative fees payable by any share class, brokerage commissions, interest, dividends, taxes, acquired fund fees and expenses, and extraordinary expenses, exceed the annual rate of 0.71% of the Fund’s average daily net assets. In addition, Janus Capital shall additionally reimburse or waive acquired fund fees and expenses to the extent they exceed 0.10%. Janus Capital has agreed to continue the waivers until at least November 1, 2018. The previous expense limit (until November 1, 2017) was 0.82%. If applicable, amounts waived and/or reimbursed to the Fund by Janus Capital are disclosed as “Excess Expense Reimbursement and Waivers” on the Statement of Operations.
For a period of three years subsequent to the Fund’s commencement of operations, Janus Capital could have recovered from the Fund fees and expenses previously waived or reimbursed, which could then be considered a deferral, if the Fund’s expense ratio, including recovered expenses, fell below the expense limit. During the year ended June 30, 2018, Janus Capital reimbursed the Fund $343,615 of fees and expenses that were eligible for recoupment. The recoupment of such reimbursements expired June 23, 2018.
Janus Services LLC (“Janus Services”), a wholly-owned subsidiary of Janus Capital, is the Fund’s transfer agent. In addition, Janus Services provides or arranges for the provision of certain other administrative services including, but not limited to, recordkeeping, accounting, order processing, and other shareholder services for the Fund. Janus Services is not compensated for its services related to the shares, except for out-of-pocket costs. These amounts are disclosed as “Other transfer agent fees and expenses” on the Statement of Operations.
Certain, but not all, intermediaries may charge administrative fees (such as networking and omnibus) to investors in Class A Shares, Class C Shares, and Class I Shares for administrative services provided on behalf of such investors.
48 | JUNE 30, 2018 |
Janus Henderson Adaptive Global Allocation Fund
Notes to Financial Statements
These administrative fees are paid by the Class A Shares, Class C Shares, and Class I Shares of the Fund to Janus Services, which uses such fees to reimburse intermediaries. Consistent with the Transfer Agency Agreement between Janus Services and the Fund, Janus Services may negotiate the level, structure, and/or terms of the administrative fees with intermediaries requiring such fees on behalf of the Fund. Janus Capital and its affiliates benefit from an increase in assets that may result from such relationships. The Funds’ Trustees have set limits on fees that the Funds may incur with respect to administrative fees paid for omnibus or networked accounts. Such limits are subject to change by the Trustees in the future. These amounts are disclosed as “Transfer agent networking and omnibus fees” on the Statement of Operations.
The Fund’s Class D Shares pay an administrative services fee at an annual rate of 0.12% of the average daily net assets of Class D Shares for shareholder services provided by Janus Services. Janus Services provides or arranges for the provision of shareholder services including, but not limited to, recordkeeping, accounting, answering inquiries regarding accounts, transaction processing, transaction confirmations, and the mailing of prospectuses and shareholder reports. These amounts are disclosed as “Transfer agent administrative fees and expenses” on the Statement of Operations.
Janus Services receives an administrative services fee at an annual rate of up to 0.25% of the average daily net assets of the Fund’s Class S Shares and Class T Shares for providing or procuring administrative services to investors in Class S Shares and Class T Shares of the Fund. Janus Services expects to use all or a significant portion of this fee to compensate retirement plan service providers, broker-dealers, bank trust departments, financial advisors, and other financial intermediaries for providing these services. Janus Services or its affiliates may also pay fees for services provided by intermediaries to the extent the fees charged by intermediaries exceed the 0.25% of net assets charged to Class S Shares and Class T Shares of the Fund. Janus Services may keep certain amounts retained for reimbursement of out-of-pocket costs incurred for servicing clients of Class S Shares and Class T Shares. These amounts are disclosed as “Transfer agent administrative fees and expenses” on the Statement of Operations.
Services provided by these financial intermediaries may include, but are not limited to, recordkeeping, subaccounting, order processing, providing order confirmations, periodic statements, forwarding prospectuses, shareholder reports, and other materials to existing customers, answering inquiries regarding accounts, and other administrative services. Order processing includes the submission of transactions through the National Securities Clearing Corporation (“NSCC”) or similar systems, or those processed on a manual basis with Janus Capital. For all share classes except Class D Shares, Janus Services also seeks reimbursement for costs it incurs as transfer agent and for providing servicing.
Janus Services is compensated for its services related to the Fund’s Class D Shares. In addition to the administrative fees discussed above, Janus Services receives reimbursement for out-of-pocket costs it incurs for serving as transfer agent and providing, or arranging for, servicing to shareholders. These amounts are disclosed as “Other transfer agent fees and expenses” on the Statement of Operations.
Under a distribution and shareholder servicing plan (the “Plan”) adopted in accordance with Rule 12b-1 under the 1940 Act, the Fund pays the Trust’s distributor, Janus Henderson Distributors, a wholly-owned subsidiary of Janus Capital, a fee for the sale and distribution and/or shareholder servicing of the Shares at an annual rate of up to 0.25% of the Class A Shares’ average daily net assets, of up to 1.00% of the Class C Shares’ average daily net assets, and of up to 0.25% of the Class S Shares’ average daily net assets. Under the terms of the Plan, the Trust is authorized to make payments to Janus Henderson Distributors for remittance to retirement plan service providers, broker-dealers, bank trust departments, financial advisors, and other financial intermediaries, as compensation for distribution and/or shareholder services performed by such entities for their customers who are investors in the Fund. These amounts are disclosed as “12b-1 Distribution and shareholder servicing fees” on the Statement of Operations. Payments under the Plan are not tied exclusively to actual 12b-1 distribution and shareholder service expenses, and the payments may exceed 12b-1 distribution and shareholder service expenses actually incurred. If any of the Fund’s actual 12b-1 distribution and shareholder service expenses incurred during a calendar year are less than the payments made during a calendar year, the Fund will be refunded the difference. Refunds, if any, are included in “12b-1 Distribution and shareholder servicing fees” in the Statement of Operations.
Janus Capital serves as administrator to the Fund pursuant to an administration agreement between Janus Capital and the Trust. Under the administration agreement, Janus Capital provides oversight and coordination of the Fund’s service providers, recordkeeping, and other administrative services, and is reimbursed by the Fund for certain of its costs in providing these services (to the extent Janus Capital seeks reimbursement and such costs are not otherwise waived). In
Janus Investment Fund | 49 |
Janus Henderson Adaptive Global Allocation Fund
Notes to Financial Statements
addition, employees of Janus Capital and/or its affiliates may serve as officers of the Trust. The Fund pays for some or all of the salaries, fees, and expenses of Janus Capital employees and Fund officers, with respect to certain specified administration functions they perform on behalf of the Fund. The Fund pays these costs based on out-of-pocket expenses incurred by Janus Capital, and these costs are separate and apart from advisory fees and other expenses paid in connection with the investment advisory services Janus Capital (or any subadvisor, as applicable) provides to the Fund. These amounts are disclosed as “Affiliated Fund administration fees” on the Statement of Operations. In addition, some expenses related to compensation payable to the Fund’s Chief Compliance Officer and certain compliance staff, all of whom are employees of Janus Capital and/or its affiliates, are shared with the Fund. Total compensation of $476,345 was paid to the Chief Compliance Officer and certain compliance staff by the Trust during the year ended June 30, 2018. The Fund's portion is reported as part of “Other expenses” on the Statement of Operations.
Effective April 1, 2018, BNP Paribas Financial Services (“BPFS”) provides certain administrative services to the Fund, including services related to Fund accounting, calculation of the Fund’s daily NAV, and Fund audit, tax, and reporting obligations, pursuant to a sub-administration agreement with Janus Capital on behalf of the Fund. As compensation for such services, Janus Capital pays BPFS a fee based on a percentage of the Fund’s assets, along with a flat fee, and is reimbursed by the Fund for amounts paid to BPFS (to the extent Janus Capital seeks reimbursement and such costs are not otherwise waived). These amounts are disclosed as “Non-affiliated fund administration fees” on the Statement of Operations.
The Board of Trustees has adopted a deferred compensation plan (the “Deferred Plan”) for independent Trustees to elect to defer receipt of all or a portion of the annual compensation they are entitled to receive from the Fund. All deferred fees are credited to an account established in the name of the Trustees. The amounts credited to the account then increase or decrease, as the case may be, in accordance with the performance of one or more of the Janus Henderson funds that are selected by the Trustees. The account balance continues to fluctuate in accordance with the performance of the selected fund or funds until final payment of all amounts are credited to the account. The fluctuation of the account balance is recorded by the Fund as unrealized appreciation/(depreciation) and is included as of June 30, 2018 on the Statement of Assets and Liabilities in the asset, “Non-interested Trustees’ deferred compensation,” and liability, “Non-interested Trustees’ deferred compensation fees.” Additionally, the recorded unrealized appreciation/(depreciation) is included in “Unrealized net appreciation/(depreciation) of investments, foreign currency translations and non-interested Trustees’ deferred compensation” on the Statement of Assets and Liabilities. Deferred compensation expenses for the year ended June 30, 2018 are included in “Non-interested Trustees’ fees and expenses” on the Statement of Operations. Trustees are allowed to change their designation of mutual funds from time to time. Amounts will be deferred until distributed in accordance with the Deferred Plan. Deferred fees of $471,025 were paid by the Trust to the Trustees under the Deferred Plan during the year ended June 30, 2018.
Class A Shares include a 5.75% upfront sales charge of the offering price of the Fund. The sales charge is allocated between Janus Henderson Distributors and financial intermediaries. During the year ended June 30, 2018, Janus Henderson Distributors retained upfront sales charges of $483.
A contingent deferred sales charge (“CDSC”) of 1.00% will be deducted with respect to Class A Shares purchased without a sales load and redeemed within 12 months of purchase, unless waived. Any applicable CDSC will be 1.00% of the lesser of the original purchase price or the value of the redemption of the Class A Shares redeemed. There were no CDSCs paid by redeeming shareholders of Class A Shares to Janus Henderson Distributors during the year ended June 30, 2018.
A CDSC of 1.00% will be deducted with respect to Class C Shares redeemed within 12 months of purchase, unless waived. Any applicable CDSC will be 1.00% of the lesser of the original purchase price or the value of the redemption of the Class C Shares redeemed. There were no CDSCs paid by redeeming shareholders of Class C Shares during the year ended June 30, 2018.
50 | JUNE 30, 2018 |
Janus Henderson Adaptive Global Allocation Fund
Notes to Financial Statements
As of June 30, 2018, shares of the Fund were owned by affiliates of Janus Henderson Investors, and/or other funds advised by Janus Henderson, as indicated in the table below:
Class | % of Class Owned |
| % of Fund Owned |
| |
Class A Shares | 74 | % | 1 | % | |
Class C Shares | 77 | 2 | |||
Class D Shares | 52 | 2 | |||
Class I Shares | 13 | 2 | |||
Class N Shares | 98 | 72 | |||
Class S Shares | 99 | 2 | |||
Class T Shares | 50 | 2 | |||
In addition, other shareholders, including other funds, individuals, accounts, as well as the Fund’s portfolio manager(s) and/or investment personnel, may from time to time own (beneficially or of record) a significant percentage of the Fund’s Shares and can be considered to “control” the Fund when that ownership exceeds 25% of the Fund’s assets (and which may differ from control as determined in accordance with accounting principles generally accepted in the United States of America).
5. Federal Income Tax
The tax components of capital shown in the table below represent: (1) distribution requirements the Fund must satisfy under the income tax regulations; (2) losses or deductions the Fund may be able to offset against income and gains realized in future years; and (3) unrealized appreciation or depreciation of investments for federal income tax purposes.
Other book to tax differences primarily consist of deferred compensation, derivatives, and foreign currency contract adjustments. The Fund has elected to treat gains and losses on forward foreign currency contracts as capital gains and losses, if applicable. Other foreign currency gains and losses on debt instruments are treated as ordinary income for federal income tax purposes pursuant to Section 988 of the Internal Revenue Code.
Loss Deferrals | Other Book | Net Tax | |||||
Undistributed | Undistributed
| Accumulated | Late-Year | Post-October | to Tax | Appreciation/ | |
$ 1,207,682 | $ 2,096,422 | $ - | $ - | $ - | $ 614 | $ (102,220) | |
The aggregate cost of investments and the composition of unrealized appreciation and depreciation of investment securities for federal income tax purposes as of June 30, 2018 are noted below. The primary differences between book and tax appreciation or depreciation of investments are wash sale loss deferrals, investments in partnerships and investments in passive foreign investment companies.
Federal Tax Cost | Unrealized
| Unrealized | Net Tax Appreciation/ |
$ 80,099,282 | $ 902,560 | $ (1,004,780) | $ (102,220) |
Information on the tax components of derivatives as of June 30, 2018 is as follows:
Federal Tax Cost | Unrealized | Unrealized | Net
Tax Appreciation/ |
$ 125,527 | $ 5,081 | $ - | $ 5,081 |
Tax cost of investments and unrealized appreciation/(depreciation) may also include timing differences that do not constitute adjustments to tax basis.
Janus Investment Fund | 51 |
Janus Henderson Adaptive Global Allocation Fund
Notes to Financial Statements
Income and capital gains distributions are determined in accordance with income tax regulations that may differ from accounting principles generally accepted in the United States of America. These differences are due to differing treatments for items such as net short-term gains, deferral of wash sale losses, foreign currency transactions, passive foreign investment companies, net investment losses, and capital loss carryovers. Certain permanent differences such as tax returns of capital and net investment losses noted below have been reclassified to capital.
For the year ended June 30, 2018 | ||||
Distributions | ||||
From Ordinary Income | From Long-Term Capital Gains | Tax Return of Capital | Net Investment Loss | |
$ 4,131,790 | $ 587,086 | $ - | $ - | |
For the year ended June 30, 2017 | ||||
Distributions | ||||
From Ordinary Income | From Long-Term Capital Gains | Tax Return of Capital | Net Investment Loss | |
$ 598,750 | $ - | $ - | $ - | |
Permanent book to tax basis differences may result in reclassifications between the components of net assets. These differences have no impact on the results of operations or net assets. The following reclassifications have been made to the Fund:
Increase/(Decrease) to Capital | Increase/(Decrease)
to Undistributed | Increase/(Decrease) to Undistributed
|
$ 139,048 | $ 317,423 | $ (456,471) |
Capital has been adjusted by $139,048, including $56,360 of long-term capital gain, for distributions in connection with Fund share redemptions (tax equalization).
52 | JUNE 30, 2018 |
Janus Henderson Adaptive Global Allocation Fund
Notes to Financial Statements
6. Capital Share Transactions
Year ended June 30, 2018 | Year ended June 30, 2017 | |||||
Shares | Amount | Shares | Amount | |||
Class A Shares: | ||||||
Shares sold | 19,160 | $ 204,066 | 10,099 | $ 106,444 | ||
Reinvested dividends and distributions | 5,219 | 55,216 | 540 | 5,289 | ||
Shares repurchased | (21,405) | (226,441) | (350) | (3,689) | ||
Net Increase/(Decrease) | 2,974 | $ 32,841 |
| 10,289 | $ 108,044 | |
Class C Shares: | ||||||
Shares sold | 28,828 | $ 312,302 | 7,963 | $ 80,428 | ||
Reinvested dividends and distributions | 9,356 | 98,607 | 189 | 1,847 | ||
Shares repurchased | (156) | (1,641) | (2,086) | (20,480) | ||
Net Increase/(Decrease) | 38,028 | $ 409,268 |
| 6,066 | $ 61,795 | |
Class D Shares: | ||||||
Shares sold | 102,858 | $1,118,070 | 38,178 | $ 379,076 | ||
Reinvested dividends and distributions | 13,642 | 144,192 | 1,369 | 13,386 | ||
Shares repurchased | (32,266) | (345,686) | (21,398) | (212,800) | ||
Net Increase/(Decrease) | 84,234 | $ 916,576 |
| 18,149 | $ 179,662 | |
Class I Shares: | ||||||
Shares sold | 628,842 | $6,660,877 | 342,781 | $ 3,504,650 | ||
Reinvested dividends and distributions | 28,637 | 303,264 | 1,308 | 12,820 | ||
Shares repurchased | (139,819) | (1,511,085) | (23,808) | (249,982) | ||
Net Increase/(Decrease) | 517,660 | $5,453,056 |
| 320,281 | $ 3,267,488 | |
Class N Shares: | ||||||
Shares sold | 369,834 | $4,063,452 | 82,790 | $ 825,703 | ||
Reinvested dividends and distributions | 363,465 | 3,849,093 | 55,607 | 544,951 | ||
Shares repurchased | (387,157) | (4,157,543) | (610,500) | (6,036,670) | ||
Net Increase/(Decrease) | 346,142 | $3,755,002 |
| (472,103) | $(4,666,016) | |
Class S Shares: | ||||||
Shares sold | 4,733 | $ 50,023 | - | $ - | ||
Reinvested dividends and distributions | 8,273 | 87,447 | 875 | 8,556 | ||
Shares repurchased | (4,774) | (49,700) | (6) | (49) | ||
Net Increase/(Decrease) | 8,232 | $ 87,770 |
| 869 | $ 8,507 | |
Class T Shares: | ||||||
Shares sold | 65,840 | $ 721,009 | 103,305 | $ 1,088,835 | ||
Reinvested dividends and distributions | 17,123 | 180,988 | 1,215 | 11,892 | ||
Shares repurchased | (55,095) | (586,281) | (1,559) | (15,382) | ||
Net Increase/(Decrease) | 27,868 | $ 315,716 |
| 102,961 | $ 1,085,345 | |
7. Purchases and Sales of Investment Securities
For the year ended June 30, 2018, the aggregate cost of purchases and proceeds from sales of investment securities (excluding any short-term securities, short-term options contracts, TBAs, and in-kind transactions, as applicable) was as follows:
Purchases of | Proceeds from Sales | Purchases
of Long- | Proceeds
from Sales |
$269,625,684 | $ 264,951,511 | $ - | $ - |
8. Recent Accounting Pronouncements
The Securities and Exchange Commission ("SEC") adopted new rules as well as amendments to its rules to modernize the reporting and disclosure of information by registered investment companies. In addition, the SEC adopted amendments to Regulation S-X, which require standardized, enhanced disclosure about derivatives in investment
Janus Investment Fund | 53 |
Janus Henderson Adaptive Global Allocation Fund
Notes to Financial Statements
company financial statements, as well as other amendments. The compliance date of the amendments to Regulation S-X was August 1, 2017. This report incorporates the amendments to Regulation S-X.
The FASB issued Accounting Standards Update No. 2017-08, Receivables – Nonrefundable Fees and Other Costs (Subtopic 310-20), Premium Amortization on Purchased Callable Debt Securities ("ASU 2017-08") to amend the amortization period for certain purchased callable debt securities held at a premium. The guidance requires certain premiums on callable debt securities to be amortized to the earliest call date. The amortization period for callable debt securities purchased at a discount will not be impacted. The amendments are effective for fiscal years, and interim periods within those fiscal years, beginning after December 15, 2018. Early adoption is permitted, including adoption in an interim period. Management is currently evaluating the impacts of ASU 2017-08 on the financial statements.
9. Subsequent Event
Management has evaluated whether any events or transactions occurred subsequent to June 30, 2018 and through the date of issuance of the Fund’s financial statements and determined that there were no material events or transactions that would require recognition or disclosure in the Fund’s financial statements.
54 | JUNE 30, 2018 |
Janus Henderson Adaptive Global Allocation Fund
Report of Independent Registered Public Accounting Firm
To the Board of Trustees of Janus Investment Fund and Shareholders of Janus Henderson Adaptive Global Allocation Fund:
Opinion on the Financial Statements
We have audited the accompanying statement of assets and liabilities, including the schedule of investments, of Janus Henderson Adaptive Global Allocation Fund (one of the funds constituting Janus Investment Fund, referred to hereafter as the "Fund") as of June 30, 2018, the related statement of operations for the year ended June 30, 2018, the statements of changes in net assets for each of the two years in the period ended June 30, 2018, including the related notes, and the financial highlights for each of the three years in the period then ended and the period from June 23, 2015 (inception date) through June 30, 2015 (collectively referred to as the “financial statements”). In our opinion, the financial statements present fairly, in all material respects, the financial position of the Fund as of June 30, 2018, the results of its operations for the year then ended, the changes in its net assets for each of the two years in the period ended June 30, 2018 and the financial highlights for each of the three years in the period then ended and the period from June 23, 2015 (inception date) through June 30, 2015 in conformity with accounting principles generally accepted in the United States of America.
Basis for Opinion
These financial statements are the responsibility of the Fund’s management. Our responsibility is to express an opinion on the Fund’s financial statements based on our audits. We are a public accounting firm registered with the Public Company Accounting Oversight Board (United States) (“PCAOB”) and are required to be independent with respect to the Fund in accordance with the U.S. federal securities laws and the applicable rules and regulations of the Securities and Exchange Commission and the PCAOB.
We conducted our audits of these financial statements in accordance with the standards of the PCAOB. Those standards require that we plan and perform the audit to obtain reasonable assurance about whether the financial statements are free of material misstatement, whether due to error or fraud.
Our audits included performing procedures to assess the risks of material misstatement of the financial statements, whether due to error or fraud, and performing procedures that respond to those risks. Such procedures included examining, on a test basis, evidence regarding the amounts and disclosures in the financial statements. Our audits also included evaluating the accounting principles used and significant estimates made by management, as well as evaluating the overall presentation of the financial statements. Our procedures included confirmation of securities owned as of June 30, 2018 by correspondence with the custodian, transfer agent and brokers; when replies were not received from brokers, we performed other auditing procedures. We believe that our audits provide a reasonable basis for our opinion.

Denver,
Colorado
August 17, 2018
We have served as the auditor of one or more investment companies in Janus Henderson Funds since 1990.
Janus Investment Fund | 55 |
Janus Henderson Adaptive Global Allocation Fund
Additional Information (unaudited)
Proxy Voting Policies and Voting Record
A description of the policies and procedures that the Fund uses to determine how to vote proxies relating to its portfolio securities is available without charge: (i) upon request, by calling 1-800-525-1093; (ii) on the Fund’s website at janushenderson.com/proxyvoting; and (iii) on the SEC’s website at http://www.sec.gov. Additionally, information regarding the Fund’s proxy voting record for the most recent twelve-month period ended June 30 is also available, free of charge, through janushenderson.com/proxyvoting and from the SEC’s website at http://www.sec.gov.
Full Holdings
The Fund is required to disclose its complete holdings on Form N-Q within 60 days of the end of the first and third fiscal quarters, and in the annual report and semiannual report to Fund shareholders. These reports (i) are available on the SEC’s website at http://www.sec.gov; (ii) may be reviewed and copied at the SEC’s Public Reference Room in Washington, D.C. (information on the Public Reference Room may be obtained by calling 1-800-SEC-0330); and (iii) are available without charge, upon request, by calling a Janus Henderson representative at 1-877-335-2687 (toll free) (or 1-800-525-3713 if you hold Class D shares). Portfolio holdings consisting of at least the names of the holdings are generally available on a monthly basis with a 30-day lag. Holdings are generally posted approximately two business days thereafter under Full Holdings for the Fund at janushenderson.com/info (or janushenderson.com/reports if you hold Class D Shares).
APPROVAL OF ADVISORY AGREEMENTS DURING THE PERIOD
The Trustees of Janus Investment Fund and Janus Aspen Series, each of whom serves as an “independent” Trustee (the “Trustees”), oversee the management of each Fund of Janus Investment Fund and each Portfolio of Janus Aspen Series (each, a “Fund” and collectively, the “Funds”), and as required by law, determine annually whether to continue the investment advisory agreement for each Fund and the subadvisory agreements for the 14 Funds that utilize subadvisers.
In connection with their most recent consideration of those agreements for each Fund, the Trustees received and reviewed information provided by Janus Capital and the respective subadvisers in response to requests of the Trustees and their independent legal counsel. They also received and reviewed information and analysis provided by, and in response to requests of, their independent fee consultant. Throughout their consideration of the agreements, the Trustees were advised by their independent legal counsel. The Trustees met with management to consider the agreements, and also met separately in executive session with their independent legal counsel and their independent fee consultant.
Additionally, in connection with their consideration of whether to continue the investment advisory agreement and subadvisory agreement for each Fund, as applicable, the Trustees also received and reviewed information in connection with the transaction to combine the respective businesses of Henderson Group plc and Janus Capital Group, Inc., the parent company of Janus Capital (the “Transaction”), announced in October 2016, which closed in the second quarter of 2017. In this regard, the Trustees reviewed information regarding the impact of the Transaction on the services to be provided by Janus Capital and each subadviser, as applicable, to the Funds under such agreements prior to the close of the Transaction as well as the services provided after the Transaction closed.
At a meeting held on December 7, 2017, based on the Trustees’ evaluation of the information provided by Janus Capital, the subadvisers, and the independent fee consultant, as well as other information, the Trustees determined that the overall arrangements between each Fund and Janus Capital and each subadviser, as applicable, were fair and reasonable in light of the nature, extent and quality of the services provided by Janus Capital, its affiliates and the subadvisers, the fees charged for those services, and other matters that the Trustees considered relevant in the exercise of their business judgment. At that meeting, the Trustees unanimously approved the continuation of the investment advisory agreement for each Fund, and the subadvisory agreement for each subadvised Fund, for the period from February 1, 2018 through February 1, 2019, subject to earlier termination as provided for in each agreement.
In considering the continuation of those agreements, the Trustees reviewed and analyzed various factors that they determined were relevant, including the factors described below, none of which by itself was considered dispositive. However, the material factors and conclusions that formed the basis for the Trustees’ determination to approve the continuation of the agreements are discussed separately below. Also included is a summary of the independent fee consultant’s conclusions and opinions that arose during, and were included as part of, the Trustees’ consideration of the
56 | JUNE 30, 2018 |
Janus Henderson Adaptive Global Allocation Fund
Additional Information (unaudited)
agreements. “Management fees,” as used herein, reflect actual annual advisory fees and any administration fees (excluding out of pocket costs), net of any waivers.
Nature, Extent and Quality of Services
The Trustees reviewed the nature, extent and quality of the services provided by Janus Capital and the subadvisers to the Funds, taking into account the investment objective, strategies and policies of each Fund, and the knowledge the Trustees gained from their regular meetings with management on at least a quarterly basis and their ongoing review of information related to the Funds. In addition, the Trustees reviewed the resources and key personnel of Janus Capital and each subadviser, particularly noting those employees who provide investment and risk management services to the Funds. The Trustees also considered other services provided to the Funds by Janus Capital or the subadvisers, such as managing the execution of portfolio transactions and the selection of broker-dealers for those transactions. The Trustees considered Janus Capital’s role as administrator to the Funds, noting that Janus Capital does not receive a fee for its services but is reimbursed for its out-of-pocket costs. The Trustees considered the role of Janus Capital in monitoring adherence to the Funds’ investment restrictions, providing support services for the Trustees and Trustee committees, and overseeing communications with shareholders and the activities of other service providers, including monitoring compliance with various policies and procedures of the Funds and with applicable securities laws and regulations.
In this regard, the independent fee consultant noted that Janus Capital provides a number of different services for the Funds and Fund shareholders, ranging from investment management services to various other servicing functions, and that, in its opinion, Janus Capital is a capable provider of those services. The independent fee consultant also provided its belief that Janus Capital has developed a number of institutional competitive advantages that should enable it to provide superior investment and service performance over the long term.
The Trustees concluded that the nature, extent and quality of the services provided by Janus Capital or the subadviser to each Fund were appropriate and consistent with the terms of the respective advisory and subadvisory agreements, and that, taking into account steps taken to address those Funds whose performance lagged that of their peers for certain periods, the Funds were likely to benefit from the continued provision of those services. They also concluded that Janus Capital and each subadviser had sufficient personnel, with the appropriate education and experience, to serve the Funds effectively and had demonstrated its ability to attract well-qualified personnel.
Performance of the Funds
The Trustees considered the performance results of each Fund over various time periods. They noted that they considered Fund performance data throughout the year, including periodic meetings with each Fund’s portfolio manager(s), and also reviewed information comparing each Fund’s performance with the performance of comparable funds and peer groups identified by Broadridge Financial Solutions, Inc. (“Broadridge”), an independent data provider, and with the Fund’s benchmark index. In this regard, the independent fee consultant found that the overall Funds’ performance has been strong: for the 36 months ended September 30, 2017, approximately 70% of the Funds were in the top two quartiles of performance, as reported by Morningstar, and for the 12 months ended September 30, 2017, approximately 46% of the Funds were in the top two quartiles of performance, as reported by Morningstar.
The Trustees considered the performance of each Fund, noting that performance may vary by share class, and noted the following:
Alternative Funds
· For Janus Henderson Diversified Alternatives Fund, the Trustees noted that the Fund’s performance was in the second Broadridge quartile for the 36 months ended May 31, 2017 and the second Broadridge quartile for the 12 months ended May 31, 2017.
· For Janus Henderson International Long/Short Equity Fund, the Trustees noted that the Fund’s performance was in the bottom Broadridge quartile for the 12 months ended May 31, 2017. The Trustees noted the reasons for the Fund’s underperformance, the steps Janus Capital had taken or was taking to improve performance, and the Fund’s limited performance history.
Asset Allocation Funds
· For Janus Henderson Global Allocation Fund – Conservative, the Trustees noted that the Fund’s performance was in the bottom Broadridge quartile for the 36 months ended May 31, 2017 and the second Broadridge
Janus Investment Fund | 57 |
Janus Henderson Adaptive Global Allocation Fund
Additional Information (unaudited)
quartile for the 12 months ended May 31, 2017. The Trustees noted the reasons for the Fund’s underperformance, the steps Janus Capital had taken or was taking to improve performance, and that the performance trend was improving.
· For Janus Henderson Global Allocation Fund – Growth, the Trustees noted that the Fund’s performance was in the bottom Broadridge quartile for the 36 months ended May 31, 2017 and the second Broadridge quartile for the 12 months ended May 31, 2017. The Trustees noted the reasons for the Fund’s underperformance, the steps Janus Capital had taken or was taking to improve performance, and that the performance trend was improving.
· For Janus Henderson Global Allocation Fund – Moderate, the Trustees noted that the Fund’s performance was in the bottom Broadridge quartile for the 36 months ended May 31, 2017 and the third Broadridge quartile for the 12 months ended May 31, 2017. The Trustees noted the reasons for the Fund’s underperformance and the steps Janus Capital had taken or was taking to improve performance.
Fixed-Income Funds
· For Janus Henderson Flexible Bond Fund, the Trustees noted that the Fund’s performance was in the bottom Broadridge quartile for the 36 months ended May 31, 2017 and the bottom Broadridge quartile for the 12 months ended May 31, 2017. The Trustees noted the reasons for the Fund’s underperformance and the steps Janus Capital had taken or was taking to improve performance.
· For Janus Henderson Global Bond Fund, the Trustees noted that the Fund’s performance was in the third Broadridge quartile for the 36 months ended May 31, 2017 and the bottom Broadridge quartile for the 12 months ended May 31, 2017. The Trustees noted the reasons for the Fund’s underperformance and the steps Janus Capital had taken or was taking to improve performance.
· For Janus Henderson Global Unconstrained Bond Fund, the Trustees noted that the Fund’s performance was in the third Broadridge quartile for the 36 months ended May 31, 2017 and the bottom Broadridge quartile for the 12 months ended May 31, 2017. The Trustees noted the reasons for the Fund’s underperformance and the steps Janus Capital had taken or was taking to improve performance.
· For Janus Henderson High-Yield Fund, the Trustees noted that the Fund’s performance was in the second Broadridge quartile for the 36 months ended May 31, 2017 and the third Broadridge quartile for the 12 months ended May 31, 2017.
· For Janus Henderson Multi-Sector Income Fund, the Trustees noted that the Fund’s performance was in the first Broadridge quartile for the 36 months ended May 31, 2017 and the second Broadridge quartile for the 12 months ended May 31, 2017.
· For Janus Henderson Real Return Fund, the Trustees noted that the Fund’s performance was in the first Broadridge quartile for the 36 months ended May 31, 2017 and the first Broadridge quartile for the 12 months ended May 31, 2017.
· For Janus Henderson Short-Term Bond Fund, the Trustees noted that the Fund’s performance was in the third Broadridge quartile for the 36 months ended May 31, 2017 and the third Broadridge quartile for the 12 months ended May 31, 2017. The Trustees noted the reasons for the Fund’s underperformance and the steps Janus Capital had taken or was taking to improve performance.
· For Janus Henderson Strategic Income Fund, the Trustees noted that the Fund’s performance was in the first Broadridge quartile for the 36 months ended May 31, 2017 and the second Broadridge quartile for the 12 months ended May 31, 2017.
Global and International Equity Funds
· For Janus Henderson Asia Equity Fund, the Trustees noted that the Fund’s performance was in the first Broadridge quartile for the 36 months ended May 31, 2017 and the first Broadridge quartile for the 12 months ended May 31, 2017.
58 | JUNE 30, 2018 |
Janus Henderson Adaptive Global Allocation Fund
Additional Information (unaudited)
· For Janus Henderson Emerging Markets Fund, the Trustees noted that the Fund’s performance was in the first Broadridge quartile for the 36 months ended May 31, 2017 and the third Broadridge quartile for the 12 months ended May 31, 2017.
· For Janus Henderson European Focus Fund, the Trustees noted that the Fund’s performance was in the bottom Broadridge quartile for the 36 months ended May 31, 2017 and the bottom Broadridge quartile for the 12 months ended May 31, 2017. The Trustees noted the reasons for the Fund’s underperformance and the steps Janus Capital had taken or was taking to improve performance.
· For Janus Henderson Global Equity Income Fund, the Trustees noted that the Fund’s performance was in the third Broadridge quartile for the 36 months ended May 31, 2017 and the second Broadridge quartile for the 12 months ended May 31, 2017. The Trustees noted the reasons for the Fund’s underperformance, the steps Janus Capital had taken or was taking to improve performance, and that the performance trend was improving.
· For Janus Henderson Global Life Sciences Fund, the Trustees noted that the Fund’s performance was in the second Broadridge quartile for the 36 months ended May 31, 2017 and the second Broadridge quartile for the 12 months ended May 31, 2017.
· For Janus Henderson Global Real Estate Fund, the Trustees noted that the Fund’s performance was in the second Broadridge quartile for the 36 months ended May 31, 2017 and the first Broadridge quartile for the 12 months ended May 31, 2017.
· For Janus Henderson Global Research Fund, the Trustees noted that the Fund’s performance was in the third Broadridge quartile for the 36 months ended May 31, 2017 and the second Broadridge quartile for the 12 months ended May 31, 2017. The Trustees noted the reasons for the Fund’s underperformance, while also noting that the Fund has a performance fee structure that results in lower management fees during periods of underperformance, the steps Janus Capital had taken or was taking to improve performance, and that the performance trend was improving.
· For Janus Henderson Global Select Fund, the Trustees noted that the Fund’s performance was in the third Broadridge quartile for the 36 months ended May 31, 2017 and the first Broadridge quartile for the 12 months ended May 31, 2017. The Trustees noted the reasons for the Fund’s underperformance, the steps Janus Capital had taken or was taking to improve performance, and that the performance trend was improving.
· For Janus Henderson Global Technology Fund, the Trustees noted that the Fund’s performance was in the third Broadridge quartile for the 36 months ended May 31, 2017 and the third Broadridge quartile for the 12 months ended May 31, 2017. The Trustees noted the reasons for the Fund’s underperformance and the steps Janus Capital had taken or was taking to improve performance.
· For Janus Henderson Global Value Fund, the Trustees noted that the Fund’s performance was in the third Broadridge quartile for the 36 months ended May 31, 2017 and the bottom Broadridge quartile for the 12 months ended May 31, 2017. The Trustees noted the reasons for the Fund’s underperformance, while also noting that the Fund has a performance fee structure that results in lower management fees during periods of underperformance, and the steps Janus Capital and Perkins had taken or were taking to improve performance.
· For Janus Henderson International Opportunities Fund, the Trustees noted that the Fund’s performance was in the second Broadridge quartile for the 36 months ended May 31, 2017 and the bottom Broadridge quartile for the 12 months ended May 31, 2017.
· For Janus Henderson International Small Cap Fund, the Trustees noted that, due to limited performance for the Fund, performance history was not a material factor.
· For Janus Henderson International Value Fund, the Trustees noted that the Fund’s performance was in the third Broadridge quartile for the 36 months ended May 31, 2017 and the bottom Broadridge quartile for the 12 months ended May 31, 2017. The Trustees noted the reasons for the Fund’s underperformance and the steps Janus Capital and Perkins had taken or were taking to improve performance.
· For Janus Henderson Overseas Fund, the Trustees noted that the Fund’s performance was in the bottom Broadridge quartile for the 36 months ended May 31, 2017 and the first Broadridge quartile for the 12 months ended May 31, 2017. The Trustees noted the reasons for the Fund’s underperformance, while also noting that
Janus Investment Fund | 59 |
Janus Henderson Adaptive Global Allocation Fund
Additional Information (unaudited)
the Fund has a performance fee structure that results in lower management fees during periods of underperformance, the steps Janus Capital had taken or was taking to improve performance, and that the performance trend was improving.
Money Market Funds
· For Janus Henderson Government Money Market Fund, the Trustees noted that the Fund’s performance was in the third Broadridge quartile for the 36 months ended May 31, 2017 and the third Broadridge quartile for the 12 months ended May 31, 2017. The Trustees noted the reasons for the Fund’s underperformance.
· For Janus Henderson Money Market Fund, the Trustees noted that the Fund’s performance was in the third Broadridge quartile for the 36 months ended May 31, 2017 and the third Broadridge quartile for the 12 months ended May 31, 2017. The Trustees noted the reasons for the Fund’s underperformance.
Multi-Asset Funds
· For Janus Henderson Adaptive Global Allocation Fund, the Trustees noted that the Fund’s performance was in the second Broadridge quartile for the 12 months ended May 31, 2017.
· For Janus Henderson All Asset Fund, the Trustees noted that the Fund’s performance was in the third Broadridge quartile for the 36 months ended May 31, 2017 and the third Broadridge quartile for the 12 months ended May 31, 2017. The Trustees noted the reasons for the Fund’s underperformance and the steps Janus Capital had taken or was taking to improve performance.
· For Janus Henderson Dividend & Income Builder Fund, the Trustees noted that the Fund’s performance was in the second Broadridge quartile for the 36 months ended May 31, 2017 and the second Broadridge quartile for the 12 months ended May 31, 2017.
· For Janus Henderson Value Plus Income Fund, the Trustees noted that the Fund’s performance was in the second Broadridge quartile for the 36 months ended May 31, 2017 and the second Broadridge quartile for the 12 months ended May 31, 2017.
Multi-Asset U.S. Equity Funds
· For Janus Henderson Balanced Fund, the Trustees noted that the Fund’s performance was in the first Broadridge quartile for the 36 months ended May 31, 2017 and the first Broadridge quartile for the 12 months ended May 31, 2017.
· For Janus Henderson Contrarian Fund, the Trustees noted that the Fund’s performance was in the bottom Broadridge quartile for the 36 months ended May 31, 2017 and the first Broadridge quartile for the 12 months ended May 31, 2017. The Trustees noted the reasons for the Fund’s underperformance, while also noting that the Fund has a performance fee structure that results in lower management fees during periods of underperformance, the steps Janus Capital had taken or was taking to improve performance, and that the performance trend was improving.
· For Janus Henderson Enterprise Fund, the Trustees noted that the Fund’s performance was in the first Broadridge quartile for the 36 months ended May 31, 2017 and the second Broadridge quartile for the 12 months ended May 31, 2017.
· For Janus Henderson Forty Fund, the Trustees noted that the Fund’s performance was in the first Broadridge quartile for the 36 months ended May 31, 2017 and the third Broadridge quartile for the 12 months ended May 31, 2017.
· For Janus Henderson Growth and Income Fund, the Trustees noted that the Fund’s performance was in the second Broadridge quartile for the 36 months ended May 31, 2017 and the first Broadridge quartile for the 12 months ended May 31, 2017.
· For Janus Henderson Research Fund, the Trustees noted that the Fund’s performance was in the second Broadridge quartile for the 36 months ended May 31, 2017 and the third Broadridge quartile for the 12 months ended May 31, 2017.
60 | JUNE 30, 2018 |
Janus Henderson Adaptive Global Allocation Fund
Additional Information (unaudited)
· For Janus Henderson Triton Fund, the Trustees noted that the Fund’s performance was in the first Broadridge quartile for the 36 months ended May 31, 2017 and the third Broadridge quartile for the 12 months ended May 31, 2017.
· For Janus Henderson U.S. Growth Opportunities Fund, the Trustees noted that the Fund’s performance was in the bottom Broadridge quartile for the 12 months ended May 31, 2017. The Trustees noted the reasons for the Fund’s underperformance, the steps Janus Capital had taken or was taking to improve performance, and the Fund’s limited performance history.
· For Janus Henderson Venture Fund, the Trustees noted that the Fund’s performance was in the first Broadridge quartile for the 36 months ended May 31, 2017 and the bottom Broadridge quartile for the 12 months ended May 31, 2017.
Quantitative Equity Funds
· For Janus Henderson Emerging Markets Managed Volatility Fund, the Trustees noted that the Fund’s performance was in the bottom Broadridge quartile for the 12 months ended May 31, 2017. The Trustees noted the reasons for the Fund’s underperformance, the steps Janus Capital and Intech had taken or were taking to improve performance, and the Fund’s limited performance history.
· For Janus Henderson Global Income Managed Volatility Fund, the Trustees noted that the Fund’s performance was in the first Broadridge quartile for the 36 months ended May 31, 2017 and the third Broadridge quartile for the 12 months ended May 31, 2017.
· For Janus Henderson International Managed Volatility Fund, the Trustees noted that the Fund’s performance was in the third Broadridge quartile for the 36 months ended May 31, 2017 and the bottom Broadridge quartile for the 12 months ended May 31, 2017. The Trustees noted the reasons for the Fund’s underperformance and the steps Janus Capital and Intech had taken or were taking to improve performance.
· For Janus Henderson U.S. Managed Volatility Fund, the Trustees noted that the Fund’s performance was in the second Broadridge quartile for the 36 months ended May 31, 2017 and the bottom Broadridge quartile for the 12 months ended May 31, 2017.
U.S. Equity Funds
· For Janus Henderson Large Cap Value Fund, the Trustees noted that the Fund’s performance was in the third Broadridge quartile for the 36 months ended May 31, 2017 and the bottom Broadridge quartile for the 12 months ended May 31, 2017. The Trustees noted the reasons for the Fund’s underperformance, while also noting that the Fund has a performance fee structure that results in lower management fees during periods of underperformance, and the steps Janus Capital and Perkins had taken or were taking to improve performance.
· For Janus Henderson Mid Cap Value Fund, the Trustees noted that the Fund’s performance was in the second Broadridge quartile for the 36 months ended May 31, 2017 and the second Broadridge quartile for the 12 months ended May 31, 2017.
· For Janus Henderson Select Value Fund, the Trustees noted that the Fund’s performance was in the first Broadridge quartile for the 36 months ended May 31, 2017 and the second Broadridge quartile for the 12 months ended May 31, 2017.
· For Janus Henderson Small Cap Value Fund, the Trustees noted that the Fund’s performance was in the first Broadridge quartile for the 36 months ended May 31, 2017 and the second Broadridge quartile for the 12 months ended May 31, 2017.
Janus Aspen Series
· For Janus Henderson Balanced Portfolio, the Trustees noted that the Fund’s performance was in the first Broadridge quartile for the 36 months ended May 31, 2017 and the first Broadridge quartile for the 12 months ended May 31, 2017.
· For Janus Henderson Enterprise Portfolio, the Trustees noted that the Fund’s performance was in the first Broadridge quartile for the 36 months ended May 31, 2017 and the second Broadridge quartile for the 12 months ended May 31, 2017.
Janus Investment Fund | 61 |
Janus Henderson Adaptive Global Allocation Fund
Additional Information (unaudited)
· For Janus Henderson Flexible Bond Portfolio, the Trustees noted that the Fund’s performance was in the bottom Broadridge quartile for the 36 months ended May 31, 2017 and the bottom Broadridge quartile for the 12 months ended May 31, 2017. The Trustees noted the reasons for the Fund’s underperformance and the steps Janus Capital had taken or was taking to improve performance.
· For Janus Henderson Forty Portfolio, the Trustees noted that the Fund’s performance was in the first Broadridge quartile for the 36 months ended May 31, 2017 and the third Broadridge quartile for the 12 months ended May 31, 2017.
· For Janus Henderson Global Allocation Portfolio – Moderate, the Trustees noted that the Fund’s performance was in the bottom Broadridge quartile for the 36 months ended May 31, 2017 and the second Broadridge quartile for the 12 months ended May 31, 2017. The Trustees noted the reasons for the Fund’s underperformance, the steps Janus Capital had taken or was taking to improve performance, and that the performance trend was improving.
· For Janus Henderson Global Research Portfolio, the Trustees noted that the Fund’s performance was in the third Broadridge quartile for the 36 months ended May 31, 2017 and the third Broadridge quartile for the 12 months ended May 31, 2017. The Trustees noted the reasons for the Fund’s underperformance, while also noting that the Fund has a performance fee structure that results in lower management fees during periods of underperformance, and the steps Janus Capital had taken or was taking to improve performance.
· For Janus Henderson Global Technology Portfolio, the Trustees noted that the Fund’s performance was in the second Broadridge quartile for the 36 months ended May 31, 2017 and the second Broadridge quartile for the 12 months ended May 31, 2017.
· For Janus Henderson Global Unconstrained Bond Portfolio, the Trustees noted that the Fund’s performance was in the bottom Broadridge quartile for the 12 months ended May 31, 2017. The Trustees noted the reasons for the Fund’s underperformance, the steps Janus Capital had taken or was taking to improve performance, and the Fund’s limited performance history.
· For Janus Henderson Mid Cap Value Portfolio, the Trustees noted that the Fund’s performance was in the third Broadridge quartile for the 36 months ended May 31, 2017 and the second Broadridge quartile for the 12 months ended May 31, 2017. The Trustees noted the reasons for the Fund’s underperformance, while also noting that the Fund has a performance fee structure that results in lower management fees during periods of underperformance, the steps Janus Capital and Perkins had taken or were taking to improve performance, and that the performance trend was improving.
· For Janus Henderson Overseas Portfolio, the Trustees noted that the Fund’s performance was in the bottom Broadridge quartile for the 36 months ended May 31, 2017 and the first Broadridge quartile for the 12 months ended May 31, 2017. The Trustees noted the reasons for the Fund’s underperformance, while also noting that the Fund has a performance fee structure that results in lower management fees during periods of underperformance, the steps Janus Capital had taken or was taking to improve performance, and that the performance trend was improving.
· For Janus Henderson Research Portfolio, the Trustees noted that the Fund’s performance was in the second Broadridge quartile for the 36 months ended May 31, 2017 and the third Broadridge quartile for the 12 months ended May 31, 2017.
· For Janus Henderson U.S. Low Volatility Portfolio, the Trustees noted that the Fund’s performance was in the first Broadridge quartile for the 36 months ended May 31, 2017 and the bottom Broadridge quartile for the 12 months ended May 31, 2017.
In consideration of each Fund’s performance, the Trustees concluded that, taking into account the factors relevant to performance, as well as other considerations, including steps taken to improve performance, the Fund’s performance warranted continuation of the Fund’s investment advisory and subadvisory agreement(s).
Costs of Services Provided
The Trustees examined information regarding the fees and expenses of each Fund in comparison to similar information for other comparable funds as provided by Broadridge, an independent data provider. They also reviewed an analysis of
62 | JUNE 30, 2018 |
Janus Henderson Adaptive Global Allocation Fund
Additional Information (unaudited)
that information provided by their independent fee consultant and noted that the rate of management (investment advisory and any administration, but excluding out-of-pocket costs) fees for many of the Funds, after applicable waivers, was below the average management fee rate of the respective peer group of funds selected by an independent data provider. The Trustees also examined information regarding the subadvisory fees charged for subadvisory services, as applicable, noting that all such fees were paid by Janus Capital out of its management fees collected from such Fund.
The independent fee consultant provided its belief that the management fees charged by Janus Capital to each of the Funds under the current investment advisory and administration agreements are reasonable in relation to the services provided by Janus Capital. The independent fee consultant found: (1) the total expenses and management fees of the Funds to be reasonable relative to other mutual funds; (2) total expenses, on average, were 10% below the average total expenses of their respective Broadridge Expense Group peers and 18% below the average total expenses for their Broadridge Expense Universes; (3) management fees for the Funds, on average, were 8% below the average management fees for their Expense Groups and 9% below the average for their Expense Universes; and (4) Fund expenses at the functional level for each asset and share class category were reasonable. The Trustees also considered the total expenses for each share class of each Fund compared to the average total expenses for its Broadridge Expense Group peers and to average total expenses for its Broadridge Expense Universe.
The independent fee consultant concluded that, based on its strategic review of expenses at the complex, category and individual fund level, Fund expenses were found to be reasonable relative to both Expense Group and Expense Universe benchmarks. Further, for certain Funds, the independent fee consultant also performed a systematic “focus list” analysis of expenses in the context of the performance or service delivered to each set of investors in each share class in each selected Fund. Based on this analysis, the independent fee consultant found that the combination of service quality/performance and expenses on these individual Funds and share classes were reasonable in light of performance trends, performance histories, and existence of performance fees, breakpoints, and expense waivers on such Funds.
The Trustees considered the methodology used by Janus Capital and each subadviser in determining compensation payable to portfolio managers, the competitive environment for investment management talent, and the competitive market for mutual funds in different distribution channels.
The Trustees also reviewed management fees charged by Janus Capital and each subadviser to comparable separate account clients and to comparable non-affiliated funds subadvised by Janus Capital or by a subadviser (for which Janus Capital or the subadviser provides only or primarily portfolio management services). Although in most instances subadvisory and separate account fee rates for various investment strategies were lower than management fee rates for Funds having a similar strategy, the Trustees considered that Janus Capital noted that, under the terms of the management agreements with the Funds, Janus Capital performs significant additional services for the Funds that it does not provide to those other clients, including administration services, oversight of the Funds’ other service providers, trustee support, regulatory compliance and numerous other services, and that, in serving the Funds, Janus Capital assumes many legal risks and other costs that it does not assume in servicing its other clients. Moreover, they noted that the independent fee consultant found that: (1) the management fees Janus Capital charges to the Funds are reasonable in relation to the management fees Janus Capital charges to its institutional clients and to the fees Janus Capital charges to funds subadvised by Janus Capital; (2) these institutional and subadvised accounts have different service and infrastructure needs; (3) Janus mutual fund investors enjoy reasonable fees relative to the fees charged to Janus institutional and subadvised fund investors; (4) in three of seven product categories, the Funds receive proportionally better pricing than the industry in relation to Janus institutional clients; and (5) in seven of eight strategies, Janus Capital has lower management fees than funds subadvised by Janus Capital’s portfolio managers.
The Trustees considered the fees for each Fund for its fiscal year ended in 2016, and noted the following with regard to each Fund’s total expenses, net of applicable fee waivers (the Fund’s “total expenses”):
Alternative Funds
· For Janus Henderson Diversified Alternatives Fund, the Trustees noted that, although the Fund’s total expenses exceeded the peer group average for one share class, overall the Fund’s total expenses were reasonable. The Trustees also noted that Janus Capital has contractually agreed to limit the Fund’s expenses.
· For Janus Henderson International Long/Short Equity Fund, the Trustees noted that, although the Fund’s total expenses exceeded the peer group average for one share class, overall the Fund’s total expenses were
Janus Investment Fund | 63 |
Janus Henderson Adaptive Global Allocation Fund
Additional Information (unaudited)
reasonable. The Trustees also noted that Janus Capital has contractually agreed to limit the Fund’s expenses effective June 5, 2017.
Asset Allocation Funds
· For Janus Henderson Global Allocation Fund – Conservative, the Trustees noted that, although the Fund’s total expenses exceeded the peer group average for certain share classes, overall the Fund’s total expenses were reasonable. The Trustees also noted that Janus Capital has contractually agreed to limit the Fund’s expenses, although this limit did not apply because the Fund’s total expenses were already below the applicable fee limit.
· For Janus Henderson Global Allocation Fund – Growth, the Trustees noted that the Fund’s total expenses were below the peer group average for all share classes.
· For Janus Henderson Global Allocation Fund – Moderate, the Trustees noted that, although the Fund’s total expenses exceeded the peer group average for certain share classes, overall the Fund’s total expenses were reasonable. The Trustees also noted that Janus Capital has contractually agreed to limit the Fund’s expenses.
Fixed-Income Funds
· For Janus Henderson Flexible Bond Fund, the Trustees noted that, although the Fund’s total expenses exceeded the peer group average for certain share classes, overall the Fund’s total expenses were reasonable. The Trustees also noted that Janus Capital has contractually agreed to limit the Fund’s expenses, although this limit did not apply because the Fund’s total expenses were already below the applicable fee limit.
· For Janus Henderson Global Bond Fund, the Trustees noted that, although the Fund’s total expenses exceeded the peer group average for certain share classes, overall the Fund’s total expenses were reasonable. The Trustees also noted that Janus Capital has contractually agreed to limit the Fund’s expenses.
· For Janus Henderson Global Unconstrained Bond Fund, the Trustees noted that the Fund’s performance was in the third Broadridge quartile for the 36 months ended May 31, 2017 and the bottom Broadridge quartile for the 12 months ended May 31, 2017. The Trustees noted the reasons for the Fund’s underperformance and the steps Janus Capital had taken or was taking to improve performance.
· For Janus Henderson High-Yield Fund, the Trustees noted that, although the Fund’s total expenses exceeded the peer group average for certain share classes, overall the Fund’s total expenses were reasonable. The Trustees also noted that Janus Capital has contractually agreed to limit the Fund’s expenses, although this limit did not apply because the Fund’s total expenses were already below the applicable fee limit.
· For Janus Henderson Multi-Sector Income Fund, the Trustees noted that, although the Fund’s total expenses exceeded the peer group average for one share class, overall the Fund’s total expenses were reasonable. The Trustees also noted that Janus Capital has contractually agreed to limit the Fund’s expenses.
· For Janus Henderson Real Return Fund, the Trustees noted that, although the Fund’s total expenses exceeded the peer group average for certain share classes, overall the Fund’s total expenses were reasonable. The Trustees also noted that Janus Capital has contractually agreed to limit the Fund’s expenses.
· For Janus Henderson Short-Term Bond Fund, the Trustees noted that, although the Fund’s total expenses exceeded the peer group average for certain share classes, overall the Fund’s total expenses were reasonable. The Trustees also noted that Janus Capital has contractually agreed to waive 11 basis points of management fees effective February 1, 2018 and also has contractually agreed to limit the Fund’s expenses.
· For Janus Henderson Strategic Income Fund, the Trustees noted that, although the Fund’s total expenses exceeded the peer group average for one share class, overall the Fund’s total expenses were reasonable. The Trustees also noted that Janus Capital has contractually agreed to limit the Fund’s expenses effective June 5, 2017.
Global and International Equity Funds
· For Janus Henderson Asia Equity Fund, the Trustees noted that, although the Fund’s total expenses exceeded the peer group average for certain share classes, overall the Fund’s total expenses were reasonable. The Trustees also noted that Janus Capital has contractually agreed to limit the Fund’s expenses.
64 | JUNE 30, 2018 |
Janus Henderson Adaptive Global Allocation Fund
Additional Information (unaudited)
· For Janus Henderson Emerging Markets Fund, the Trustees noted that, although the Fund’s total expenses exceeded the peer group average for one share class, overall the Fund’s total expenses were reasonable. The Trustees also noted that Janus Capital has contractually agreed to limit the Fund’s expenses effective June 5, 2017.
· For Janus Henderson European Focus Fund, the Trustees noted that, although the Fund’s total expenses exceeded the peer group average for one share class, overall the Fund’s total expenses were reasonable. The Trustees also noted that Janus Capital has contractually agreed to limit the Fund’s expenses effective June 5, 2017.
· For Janus Henderson Global Equity Income Fund, the Trustees noted that the Fund’s total expenses were below the peer group average for all share classes.
· For Janus Henderson Global Life Sciences Fund, the Trustees noted that the Fund’s total expenses were below the peer group average for all share classes.
· For Janus Henderson Global Real Estate Fund, the Trustees noted that, although the Fund’s total expenses exceeded the peer group average one share class, overall the Fund’s total expenses were reasonable. The Trustees also noted that Janus Capital has contractually agreed to limit the Fund’s expenses, although this limit did not apply because the Fund’s total expenses were already below the applicable fee limit.
· For Janus Henderson Global Research Fund, the Trustees noted that the Fund’s total expenses were below the peer group average for all share classes.
· For Janus Henderson Global Select Fund, the Trustees noted that, although the Fund’s total expenses exceeded the peer group average for one share class, overall the Fund’s total expenses were reasonable. The Trustees also noted that Janus Capital has contractually agreed to limit the Fund’s expenses, although this limit did not apply because the Fund’s total expenses were already below the applicable fee limit.
· For Janus Henderson Global Technology Fund, the Trustees noted that the Fund’s total expenses were below the peer group average for all share classes.
· For Janus Henderson Global Value Fund, the Trustees noted that the Fund’s total expenses were below the peer group average for all share classes.
· For Janus Henderson International Opportunities Fund, the Trustees noted that, although the Fund’s total expenses exceeded the peer group average for certain share classes, overall the Fund’s total expenses were reasonable. The Trustees also noted that Janus Capital has contractually agreed to limit the Fund’s expenses effective June 5, 2017.
· For Janus Henderson International Small Cap Fund, the Trustees noted that, although the Fund’s total expenses exceeded the peer group average for one share class, overall the Fund’s total expenses were reasonable. The Trustees also noted that Janus Capital has contractually agreed to limit the Fund’s expenses effective June 5, 2017.
· For Janus Henderson International Value Fund, the Trustees noted that, although the Fund’s total expenses exceeded the peer group average for one share class, overall the Fund’s total expenses were reasonable. The Trustees also noted that Janus Capital has contractually agreed to limit the Fund’s expenses.
· For Janus Henderson Overseas Fund, the Trustees noted that the Fund’s total expenses were below the peer group average for all share classes.
Money Market Funds
· For Janus Henderson Government Money Market Fund, the Trustees noted that the Fund’s total expenses were below the peer group average for both share classes. In addition, the Trustees considered that Janus Capital voluntarily waives one-half of its advisory fee and other expenses in order to maintain a positive yield.
· For Janus Henderson Money Market Fund, the Trustees noted that the Fund’s total expenses were below the peer group average for both share classes. In addition, the Trustees considered that Janus Capital voluntarily waives one-half of its advisory fee and other expenses in order to maintain a positive yield.
Janus Investment Fund | 65 |
Janus Henderson Adaptive Global Allocation Fund
Additional Information (unaudited)
Multi-Asset Funds
· For Janus Henderson Adaptive Global Allocation Fund, the Trustees noted that, although the Fund’s total expenses exceeded the peer group average for one share class, overall the Fund’s total expenses were reasonable. The Trustees also noted that Janus Capital has contractually agreed to limit the Fund’s expenses.
· For Janus Henderson All Asset Fund, the Trustees noted that, although the Fund’s total expenses exceeded the peer group average for one share class, overall the Fund’s total expenses were reasonable. The Trustees also noted that Janus Capital has contractually agreed to limit the Fund’s total expenses effective June 5, 2017.
· For Janus Henderson Dividend & Income Builder Fund, the Trustees noted that, although the Fund’s total expenses exceeded the peer group average for certain share classes, overall the Fund’s total expenses were reasonable. The Trustees also noted that Janus Capital has contractually agreed to limit the Fund’s expenses effective June 5, 2017.
· For Janus Henderson Value Plus Income Fund, the Trustees noted that the Fund’s total expenses were below the peer group average for all share classes.
Multi-Asset U.S. Equity Funds
· For Janus Henderson Balanced Fund, the Trustees noted that, although the Fund’s total expenses exceeded the peer group average for certain share classes, overall the Fund’s total expenses were reasonable. The Trustees also noted that Janus Capital has contractually agreed to limit the Fund’s expenses, although this limit did not apply because the Fund’s total expenses were already below the applicable fee limit.
· For Janus Henderson Contrarian Fund, the Trustees noted that, although the Fund’s total expenses exceeded the peer group average for one share class, overall the Fund’s total expenses were reasonable. The Trustees also noted that Janus Capital has contractually agreed to limit the Fund’s expenses, although this limit did not apply because the Fund’s total expenses were already below the applicable fee limit.
· For Janus Henderson Enterprise Fund, the Trustees noted that, although the Fund’s total expenses exceeded the peer group average for certain share classes, overall the Fund’s total expenses were reasonable. The Trustees also noted that Janus Capital has contractually agreed to limit the Fund’s expenses, although this limit did not apply because the Fund’s total expenses were already below the applicable fee limit.
· For Janus Henderson Forty Fund, the Trustees noted that, although the Fund’s total expenses exceeded the peer group average for certain share classes, overall the Fund’s total expenses were reasonable. The Trustees also noted that Janus Capital has contractually agreed to limit the Fund’s expenses, although this limit did not apply because the Fund’s total expenses were already below the applicable fee limit.
· For Janus Henderson Growth and Income Fund, the Trustees noted that, although the Fund’s total expenses exceeded the peer group average for certain share classes, overall the Fund’s total expenses were reasonable. The Trustees also noted that Janus Capital has contractually agreed to limit the Fund’s expenses, although this limit did not apply because the Fund’s total expenses were already below the applicable fee limit.
· For Janus Henderson Research Fund, the Trustees noted that, although the Fund’s total expenses were equal to or exceeded the peer group average for certain share classes, overall the Fund’s total expenses were reasonable. The Trustees also noted that Janus Capital has contractually agreed to limit the Fund’s expenses effective February 1, 2017.
· For Janus Henderson Triton Fund, the Trustees noted that the Fund’s total expenses were below the peer group average for all share classes.
· For Janus Henderson U.S. Growth Opportunities Fund, the Trustees noted that, although the Fund’s total expenses exceeded the peer group average for one share class, overall the Fund’s total expenses were reasonable. The Trustees also noted that Janus Capital has contractually agreed to limit the Fund’s expenses effective June 5, 2017.
· For Janus Henderson Venture Fund, the Trustees noted that the Fund’s total expenses were below the peer group average for all share classes.
66 | JUNE 30, 2018 |
Janus Henderson Adaptive Global Allocation Fund
Additional Information (unaudited)
Quantitative Equity Funds
· For Janus Henderson Emerging Markets Managed Volatility Fund, the Trustees noted that, although the Fund’s total expenses exceeded the peer group average for certain share classes, overall the Fund’s total expenses were reasonable. The Trustees also noted that Janus Capital has contractually agreed to limit the Fund’s expenses.
· For Janus Henderson Global Income Managed Volatility Fund, the Trustees noted that the Fund’s total expenses were below the peer group average for all share classes.
· For Janus Henderson International Managed Volatility Fund, the Trustees noted that, although the Fund’s total expenses exceeded the peer group average for one share class, overall the Fund’s total expenses were reasonable. The Trustees also noted that Janus Capital has contractually agreed to limit the Fund’s expenses.
· For Janus Henderson U.S. Managed Volatility Fund, the Trustees noted that, although the Fund’s total expenses exceeded the peer group average for one share class, overall the Fund’s total expenses were reasonable. The Trustees also noted that Janus Capital has contractually agreed to limit the Fund’s expenses, although this limit did not apply because the Fund’s total expenses were already below the applicable fee limit.
U.S. Equity Funds
· For Janus Henderson Large Cap Value Fund, the Trustees noted that the Fund’s total expenses were below the peer group average for all share classes.
· For Janus Henderson Mid Cap Value Fund, the Trustees noted that the Fund’s total expenses were below the peer group average for all share classes.
· For Janus Henderson Select Value Fund, the Trustees noted that the Fund’s total expenses were below the peer group averages for all share classes.
· For Janus Henderson Small Cap Value Fund, the Trustees noted that, although the Fund’s total expenses exceeded the peer group average for certain share classes, overall the Fund’s total expenses were reasonable. The Trustees also noted that Janus Capital has contractually agreed to limit the Fund’s expenses, although this limit did not apply because the Fund’s total expenses were already below the applicable fee limit.
Janus Aspen Series
· For Janus Henderson Balanced Portfolio, the Trustees noted that, although the Fund’s total expenses exceeded the peer group average for one share class, overall the Fund’s total expenses were reasonable.
· For Janus Henderson Enterprise Portfolio, the Trustees noted that, although the Fund’s total expenses exceeded the peer group average for one share class, overall the Fund’s total expenses were reasonable.
· For Janus Henderson Flexible Bond Portfolio, the Trustees noted that, although the Fund’s total expenses exceeded the peer group average for one share class, overall the Fund’s total expenses were reasonable. The Trustees also noted that Janus Capital has contractually agreed to limit the Fund’s expenses, although this limit did not apply because the Fund’s total expenses were already below the applicable fee limit.
· For Janus Henderson Forty Portfolio, the Trustees noted that, although the Fund’s total expenses exceeded the peer group average for one share class, overall the Fund’s total expenses were reasonable.
· For Janus Henderson Global Allocation Portfolio - Moderate, the Trustees noted that, although the Fund’s total expenses exceeded the peer group average for one share class, overall the Fund’s total expenses were reasonable. The Trustees also noted that Janus Capital has contractually agreed to limit the Fund’s expenses.
· For Janus Henderson Global Research Portfolio, the Trustees noted that the Fund’s total expenses were below the peer group average for both share classes.
· For Janus Henderson Global Technology Portfolio, the Trustees noted that the Fund’s total expenses were below the peer group average for both share classes.
· For Janus Henderson Global Unconstrained Bond Portfolio, the Trustees noted that, although the Fund’s total expenses exceeded the peer group average for one share class, overall the Fund’s total expenses were reasonable. The Trustees also noted that Janus Capital has contractually agreed to limit the Fund’s expenses.
Janus Investment Fund | 67 |
Janus Henderson Adaptive Global Allocation Fund
Additional Information (unaudited)
· For Janus Henderson Mid Cap Value Portfolio, the Trustees noted that the Fund’s total expenses were below the peer group average for both share classes.
· For Janus Henderson Overseas Portfolio, the Trustees noted that the Fund’s total expenses were below the peer group average for both share classes.
· For Janus Henderson Research Portfolio, the Trustees noted that the Fund’s total expenses were below the peer group average for both share classes.
· For Janus Henderson U.S. Low Volatility Portfolio, the Trustees noted that the Fund’s total expenses were below the peer group average for its sole share class.
The Trustees reviewed information on the overall profitability to Janus Capital and its affiliates of their relationship with the Funds, and considered profitability data of other fund managers. The Trustees also considered the financial information, estimated profitability and corporate structure of Janus Capital’s parent company before and after the Transaction. The Trustees recognized that profitability comparisons among fund managers are difficult because of the variation in the type of comparative information that is publicly available, and the profitability of any fund manager is affected by numerous factors, including the organizational structure of the particular fund manager, the types of funds and other accounts it manages, possible other lines of business, the methodology for allocating expenses, and the fund manager’s capital structure and cost of capital. The Trustees also noted that the Trustees’ independent fee consultant reviewed the overall profitability of Janus Capital’s parent company prior to the Transaction, and the independent fee consultant found that, while assessing the reasonableness of Fund expenses in light of such profits was dependent on comparisons with other publicly-traded mutual fund advisers, and that these comparisons were limited in accuracy by differences in complex size, business mix, institutional account orientation and other factors, after accepting these limitations, the level of profit earned by Janus Capital’s parent company was reasonable. In this regard, the independent consultant concluded that the profitability of Janus Capital’s parent company did not show excess nor did it show any insufficiency that could limit the ability to invest the resources needed to drive strong future investment performance on behalf of the Funds.
Additionally, the Trustees considered the estimated profitability to Janus Capital from the investment management services it provided to each Fund. The Trustees also considered such estimated profitability taking into account the impact of the Transaction on Janus Capital’s expense structure on a pro forma basis. In their review, the Trustees considered whether Janus Capital and each subadviser receive adequate incentives and resources to manage the Funds effectively. In reviewing profitability, the Trustees noted that the estimated profitability for an individual Fund is necessarily a product of the allocation methodology utilized by Janus Capital to allocate its expenses as part of the estimated profitability calculation. In this regard, the Trustees noted that the independent fee consultant concluded that (1) the expense allocation methodology utilized by Janus Capital was reasonable and (2) the estimated profitability to Janus Capital from the investment management services it provided to each Fund was reasonable, including after taking into account the impact of the Transaction on Janus Capital’s expense structure on a pro forma basis. The Trustees also considered that the estimated profitability for an individual Fund was influenced by a number of factors, including not only the allocation methodology selected, but also the presence of fee waivers and expense caps, and whether the Fund’s investment management agreement contained breakpoints or a performance fee component. The Trustees determined, after taking into account these factors, among others, that Janus Capital’s estimated profitability with respect to each Fund was not unreasonable in relation to the services provided, and that the variation in the range of such estimated profitability among the Funds was not a material factor in the Board’s approval of the reasonableness of any Fund’s investment management fees.
The Trustees concluded that the management fees payable by each Fund to Janus Capital and its affiliates, as well as the fees paid by Janus Capital to the subadvisers of subadvised Funds, were reasonable in relation to the nature, extent, and quality of the services provided, taking into account the fees charged by other advisers for managing comparable mutual funds with similar strategies, the fees Janus Capital and the subadvisers charge to other clients, and, as applicable, the impact of fund performance on management fees payable by the Funds. The Trustees also concluded that each Fund’s total expenses were reasonable, taking into account the size of the Fund, the quality of services provided by Janus Capital and any subadviser, the investment performance of the Fund, and any expense limitations agreed to or provided by Janus Capital.
68 | JUNE 30, 2018 |
Janus Henderson Adaptive Global Allocation Fund
Additional Information (unaudited)
Economies of Scale
The Trustees considered information about the potential for Janus Capital to realize economies of scale as the assets of the Funds increase. They noted their independent fee consultant’s analysis of economies of scale in prior years. They also noted that, although many Funds pay advisory fees at a base fixed rate as a percentage of net assets, without any breakpoints or performance fees, their independent fee consultant concluded that 86% of these Funds’ share classes have contractual management fees (gross of waivers) below their Broadridge expense group averages. They also noted that for those Funds whose expenses are being reduced by the contractual expense limitations of Janus Capital, Janus Capital is subsidizing certain of these Funds because they have not reached adequate scale. Moreover, as the assets of some of the Funds have declined in the past few years, certain Funds have benefited from having advisory fee rates that have remained constant rather than increasing as assets declined. In addition, performance fee structures have been implemented for various Funds that have caused the effective rate of advisory fees payable by such a Fund to vary depending on the investment performance of the Fund relative to its benchmark index over the measurement period; and a few Funds have fee schedules with breakpoints and reduced fee rates above certain asset levels. The Trustees also noted that the Funds share directly in economies of scale through the lower charges of third-party service providers that are based in part on the combined scale of all of the Funds. Based on all of the information they reviewed, including past research and analysis conducted by the Trustees’ independent fee consultant, the Trustees concluded that the current fee structure of each Fund was reasonable and that the current rates of fees do reflect a sharing between Janus Capital and the Fund of any economies of scale that may be present at the current asset level of the Fund.
The independent fee consultant concluded that, given the limitations of various analytical approaches to economies of scale it had considered in prior years, and their conflicting results, it is difficult to analytically confirm or deny the existence of economies of scale in the Janus complex. The independent consultant concluded that (1) to the extent there were economies of scale at Janus Capital, Janus Capital’s general strategy of setting fixed management fees below peers appeared to share any such economies with investors even on smaller Funds which have not yet achieved those economies and (2) by setting lower fixed fees from the start on these Funds, Janus Capital appeared to be investing to increase the likelihood that these Funds will grow to a level to achieve any scale economies that may exist. Further, the independent fee consultant provided its belief that Fund investors are well-served by the fee levels and performance fee structures in place on the Funds in light of any economies of scale that may be present at Janus Capital.
Other Benefits to Janus Capital
The Trustees also considered benefits that accrue to Janus Capital and its affiliates and subadvisers to the Funds from their relationships with the Funds. They recognized that two affiliates of Janus Capital separately serve the Funds as transfer agent and distributor, respectively, and the transfer agent receives compensation directly from the non-money market funds for services provided. The Trustees also considered Janus Capital’s past and proposed use of commissions paid by the Funds on portfolio brokerage transactions to obtain proprietary and third-party research products and services benefiting the Fund and/or other clients of Janus Capital and/or Janus Capital, and/or a subadviser to a Fund. The Trustees concluded that Janus Capital’s and the subadvisers’ use of these types of client commission arrangements to obtain proprietary and third-party research products and services was consistent with regulatory requirements and guidelines and was likely to benefit each Fund. The Trustees also concluded that, other than the services provided by Janus Capital and its affiliates and subadvisers pursuant to the agreements and the fees to be paid by each Fund therefor, the Funds and Janus Capital and the subadvisers may potentially benefit from their relationship with each other in other ways. They concluded that Janus Capital and/or the subadvisers benefits from the receipt of research products and services acquired through commissions paid on portfolio transactions of the Funds and that the Funds benefit from Janus Capital’s and/or the subadvisers’ receipt of those products and services as well as research products and services acquired through commissions paid by other clients of Janus Capital and/or other clients of the subadvisers. They further concluded that the success of any Fund could attract other business to Janus Capital, the subadvisers or other Janus funds, and that the success of Janus Capital and the subadvisers could enhance Janus Capital’s and the subadvisers’ ability to serve the Funds.
Janus Investment Fund | 69 |
Janus Henderson Adaptive Global Allocation Fund
Useful Information About Your Fund Report (unaudited)
The Management Commentary in this report includes valuable insight as well as statistical information to help you understand how your Fund’s performance and characteristics stack up against those of comparable indices.
If the Fund invests in foreign securities, this report may include information about country exposure. Country exposure is based primarily on the country of risk. A company may be allocated to a country based on other factors such as location of the company’s principal office, the location of the principal trading market for the company’s securities, or the country where a majority of the company’s revenues are derived.
Please keep in mind that the opinions expressed in the Management Commentary are just that: opinions. They are a reflection based on best judgment at the time this report was compiled, which was June 30, 2018. As the investing environment changes, so could opinions. These views are unique and are not necessarily shared by fellow employees or by Janus Henderson in general.
Performance Overviews
Performance overview graphs compare the performance of a hypothetical $10,000 investment in the Fund with one or more widely used market indices. When comparing the performance of the Fund with an index, keep in mind that market indices are not available for investment and do not reflect deduction of expenses.
Average annual total returns are quoted for a Fund with more than one year of performance history. Average annual total return is calculated by taking the growth or decline in value of an investment over a period of time, including reinvestment of dividends and distributions, then calculating the annual compounded percentage rate that would have produced the same result had the rate of growth been constant throughout the period. Average annual total return does not reflect the deduction of taxes that a shareholder would pay on Fund distributions or redemptions of Fund shares.
Cumulative total returns are quoted for a Fund with less than one year of performance history. Cumulative total return is the growth or decline in value of an investment over time, independent of the period of time involved. Cumulative total return does not reflect the deduction of taxes that a shareholder would pay on Fund distributions or redemptions of Fund shares.
Pursuant to federal securities rules, expense ratios shown in the performance chart reflect subsidized (if applicable) and unsubsidized ratios. The total annual fund operating expenses ratio is gross of any fee waivers, reflecting the Fund’s unsubsidized expense ratio. The net annual fund operating expenses ratio (if applicable) includes contractual waivers of Janus Capital and reflects the Fund’s subsidized expense ratio. Ratios may be higher or lower than those shown in the “Financial Highlights” in this report.
Schedule of Investments
Following the performance overview section is the Fund’s Schedule of Investments. This schedule reports the types of securities held in the Fund on the last day of the reporting period. Securities are usually listed by type (common stock, corporate bonds, U.S. Government obligations, etc.) and by industry classification (banking, communications, insurance, etc.). Holdings are subject to change without notice.
The value of each security is quoted as of the last day of the reporting period. The value of securities denominated in foreign currencies is converted into U.S. dollars.
If the Fund invests in foreign securities, it will also provide a summary of investments by country. This summary reports the Fund exposure to different countries by providing the percentage of securities invested in each country. The country of each security represents the country of risk. The Fund’s Schedule of Investments relies upon the industry group and country classifications published by Barclays and/or MSCI Inc.
Tables listing details of individual forward currency contracts, futures, written options, swaptions, and swaps follow the Fund’s Schedule of Investments (if applicable).
Statement of Assets and Liabilities
This statement is often referred to as the “balance sheet.” It lists the assets and liabilities of the Fund on the last day of the reporting period.
70 | JUNE 30, 2018 |
Janus Henderson Adaptive Global Allocation Fund
Useful Information About Your Fund Report (unaudited)
The Fund’s assets are calculated by adding the value of the securities owned, the receivable for securities sold but not yet settled, the receivable for dividends declared but not yet received on securities owned, and the receivable for Fund shares sold to investors but not yet settled. The Fund’s liabilities include payables for securities purchased but not yet settled, Fund shares redeemed but not yet paid, and expenses owed but not yet paid. Additionally, there may be other assets and liabilities such as unrealized gain or loss on forward currency contracts.
The section entitled “Net Assets Consist of” breaks down the components of the Fund’s net assets. Because the Fund must distribute substantially all earnings, you will notice that a significant portion of net assets is shareholder capital.
The last section of this statement reports the net asset value (“NAV”) per share on the last day of the reporting period. The NAV is calculated by dividing the Fund’s net assets for each share class (assets minus liabilities) by the number of shares outstanding.
Statement of Operations
This statement details the Fund’s income, expenses, realized gains and losses on securities and currency transactions, and changes in unrealized appreciation or depreciation of Fund holdings.
The first section in this statement, entitled “Investment Income,” reports the dividends earned from securities and interest earned from interest-bearing securities in the Fund.
The next section reports the expenses incurred by the Fund, including the advisory fee paid to the investment adviser, transfer agent fees and expenses, and printing and postage for mailing statements, financial reports and prospectuses. Expense offsets and expense reimbursements, if any, are also shown.
The last section lists the amounts of realized gains or losses from investment and foreign currency transactions, and changes in unrealized appreciation or depreciation of investments and foreign currency-denominated assets and liabilities. The Fund will realize a gain (or loss) when it sells its position in a particular security. A change in unrealized gain (or loss) refers to the change in net appreciation or depreciation of the Fund during the reporting period. “Net Realized and Unrealized Gain/(Loss) on Investments” is affected both by changes in the market value of Fund holdings and by gains (or losses) realized during the reporting period.
Statements of Changes in Net Assets
These statements report the increase or decrease in the Fund’s net assets during the reporting period. Changes in the Fund’s net assets are attributable to investment operations, dividends and distributions to investors, and capital share transactions. This is important to investors because it shows exactly what caused the Fund’s net asset size to change during the period.
The first section summarizes the information from the Statement of Operations regarding changes in net assets due to the Fund’s investment operations. The Fund’s net assets may also change as a result of dividend and capital gains distributions to investors. If investors receive their dividends and/or distributions in cash, money is taken out of the Fund to pay the dividend and/or distribution. If investors reinvest their dividends and/or distributions, the Fund’s net assets will not be affected. If you compare the Fund’s “Net Decrease from Dividends and Distributions” to “Reinvested Dividends and Distributions,” you will notice that dividends and distributions have little effect on the Fund’s net assets. This is because the majority of the Fund’s investors reinvest their dividends and/or distributions.
The reinvestment of dividends and distributions is included under “Capital Share Transactions.” “Capital Shares” refers to the money investors contribute to the Fund through purchases or withdrawals via redemptions. The Fund’s net assets will increase and decrease in value as investors purchase and redeem shares from the Fund.
Financial Highlights
This schedule provides a per-share breakdown of the components that affect the Fund’s NAV for current and past reporting periods as well as total return, asset size, ratios, and portfolio turnover rate.
The first line in the table reflects the NAV per share at the beginning of the reporting period. The next line reports the net investment income/(loss) per share. Following is the per share total of net gains/(losses), realized and unrealized. Per share dividends and distributions to investors are then subtracted to arrive at the NAV per share at the end of the period. The next line reflects the total return for the period. Also included are ratios of expenses and net investment income to average net assets.
Janus Investment Fund | 71 |
Janus Henderson Adaptive Global Allocation Fund
Useful Information About Your Fund Report (unaudited)
The Fund’s expenses may be reduced through expense offsets and expense reimbursements. The ratios shown reflect expenses before and after any such offsets and reimbursements.
The ratio of net investment income/(loss) summarizes the income earned less expenses, divided by the average net assets of the Fund during the reporting period. Do not confuse this ratio with the Fund’s yield. The net investment income ratio is not a true measure of the Fund’s yield because it does not take into account the dividends distributed to the Fund’s investors.
The next figure is the portfolio turnover rate, which measures the buying and selling activity in the Fund. Portfolio turnover is affected by market conditions, changes in the asset size of the Fund, fluctuating volume of shareholder purchase and redemption orders, the nature of the Fund’s investments, and the investment style and/or outlook of the portfolio manager(s) and/or investment personnel. A 100% rate implies that an amount equal to the value of the entire portfolio was replaced once during the fiscal year; a 50% rate means that an amount equal to the value of half the portfolio is traded in a year; and a 200% rate means that an amount equal to the value of the entire portfolio is traded every six months.
72 | JUNE 30, 2018 |
Janus Henderson Adaptive Global Allocation Fund
Designation Requirements (unaudited)
For federal income tax purposes, the Fund designated the following for the year ended June 30, 2018:
| |
Capital Gain Distributions | $643,446 |
Dividends Received Deduction Percentage | 81% |
Qualified Dividend Income Percentage | 98% |
Janus Investment Fund | 73 |
Janus Henderson Adaptive Global Allocation Fund
Trustees and Officers (unaudited)
The Fund’s Statement of Additional Information includes additional information about the Trustees and officers and is available, without charge, by calling 1-877-335-2687.
The following are the Trustees and officers of the Trust, together with a brief description of their principal occupations during the last five years (principal occupations for certain Trustees may include periods over five years).
Each Trustee has served in that capacity since he or she was originally elected or appointed. The Trustees do not serve a specified term of office. Each Trustee will hold office until the termination of the Trust or his or her earlier death, resignation, retirement, incapacity, or removal. Under the Fund’s Governance Procedures and Guidelines, the policy is for Trustees to retire no later than the end of the calendar year in which the Trustee turns 75. The Trustees review the Fund’s Governance Procedures and Guidelines from time to time and may make changes they deem appropriate. The Fund’s Nominating and Governance Committee will consider nominees for the position of Trustee recommended by shareholders. Shareholders may submit the name of a candidate for consideration by the Committee by submitting their recommendations to the Trust’s Secretary. Each Trustee is currently a Trustee of one other registered investment company advised by Janus Capital: Janus Aspen Series. Collectively, these two registered investment companies consist of 61 series or funds.
The Trust’s officers are elected annually by the Trustees for a one-year term. Certain officers also serve as officers of Janus Aspen Series. Certain officers of the Fund may also be officers and/or directors of Janus Capital. Except as otherwise disclosed, Fund officers receive no compensation from the Fund, except for the Fund’s Chief Compliance Officer, as authorized by the Trustees.
74 | JUNE 30, 2018 |
Janus Henderson Adaptive Global Allocation Fund
Trustees and Officers (unaudited)
TRUSTEES | |||||
Name, Address, and Age | Positions Held with the Trust | Length of Time Served | Principal Occupations During the Past Five Years | Number of Portfolios/Funds in Fund Complex Overseen by Trustee | Other Directorships Held by Trustee During the Past Five Years |
Independent Trustees | |||||
William
F. McCalpin | Chairman | 1/08-Present | Managing Partner, Impact Investments, Athena Capital Advisors LLC (independent registered investment advisor) (since 2016) and Managing Director, Holos Consulting LLC (provides consulting services to foundations and other nonprofit organizations). Formerly, Chief Executive Officer, Imprint Capital (impact investment firm) (2013-2015) and Executive Vice President and Chief Operating Officer of The Rockefeller Brothers Fund (a private family foundation) (1998-2006). | 61 | Director of Mutual Fund Directors Forum (a non-profit organization serving independent directors of U.S. mutual funds), Chairman of the Board and Trustee of The Investment Fund for Foundations Investment Program (TIP) (consisting of 2 funds), and Director of the F.B. Heron Foundation (a private grantmaking foundation). |
Janus Investment Fund | 75 |
Janus Henderson Adaptive Global Allocation Fund
Trustees and Officers (unaudited)
TRUSTEES | |||||
Name, Address, and Age | Positions Held with the Trust | Length of Time Served | Principal Occupations During the Past Five Years | Number of Portfolios/Funds in Fund Complex Overseen by Trustee | Other Directorships Held by Trustee During the Past Five Years |
Independent Trustees | |||||
Alan
A. Brown | Trustee | 1/13-Present | Executive Vice President, Institutional Markets, of Black Creek Group (private equity real estate investment management firm) (since 2012). Formerly, Executive Vice President and Co-Head, Global Private Client Group (2007-2010), Executive Vice President, Mutual Funds (2005-2007), and Chief Marketing Officer (2001-2005) of Nuveen Investments, Inc. (asset management). | 61 | Director of WTTW (PBS affiliate) (since 2003). Formerly, Director of MotiveQuest LLC (strategic social market research company) (2003-2016); Director of Nuveen Global Investors LLC (2007-2011); Director of Communities in Schools (2004-2010); and Director of Mutual Fund Education Alliance (until 2010). |
76 | JUNE 30, 2018 |
Janus Henderson Adaptive Global Allocation Fund
Trustees and Officers (unaudited)
TRUSTEES | |||||
Name, Address, and Age | Positions Held with the Trust | Length of Time Served | Principal Occupations During the Past Five Years | Number of Portfolios/Funds in Fund Complex Overseen by Trustee | Other Directorships Held by Trustee During the Past Five Years |
Independent Trustees | |||||
William
D. Cvengros | Trustee | 1/11-Present | Managing Member and Chief Executive Officer of SJC Capital, LLC (a personal investment company and consulting firm) (since 2002). Formerly, Venture Partner for The Edgewater Funds (a middle market private equity firm) (2002-2004); Chief Executive Officer and President of PIMCO Advisors Holdings L.P. (a publicly traded investment management firm) (1994-2000); and Chief Investment Officer of Pacific Life Insurance Company (a mutual life insurance and annuity company) (1987-1994). | 61 | Advisory Board Member, Innovate Partners Emerging Growth and Equity Fund I (early stage venture capital fund) (since 2014) and Managing Trustee of National Retirement Partners Liquidating Trust (since 2013). Formerly, Chairman, National Retirement Partners, Inc. (formerly a network of advisors to 401(k) plans) (2005-2013); Director of Prospect Acquisition Corp. (a special purpose acquisition corporation) (2007-2009); Director of RemedyTemp, Inc. (temporary help services company) (1996-2006); and Trustee of PIMCO Funds Multi-Manager Series (1990-2000) and Pacific Life Variable Life & Annuity Trusts (1987-1994). |
Janus Investment Fund | 77 |
Janus Henderson Adaptive Global Allocation Fund
Trustees and Officers (unaudited)
TRUSTEES | |||||
Name, Address, and Age | Positions Held with the Trust | Length of Time Served | Principal Occupations During the Past Five Years | Number of Portfolios/Funds in Fund Complex Overseen by Trustee | Other Directorships Held by Trustee During the Past Five Years |
Independent Trustees | |||||
Raudline
Etienne | Trustee | 6/16-Present | Founder, Daraja Capital (advisory and investment firm) (since 2016), and Senior Advisor, Albright Stonebridge Group LLC (global strategy firm) (since 2016). Formerly, Senior Vice President (2011-2015), Albright Stonebridge Group LLC; and Deputy Comptroller and Chief Investment Officer, New York State Common Retirement Fund (public pension fund) (2008-2011). | 61 | Director of Brightwood Capital Advisors, LLC (since 2014). |
Gary A. Poliner | Trustee | 6/16-Present | Retired. Formerly, President (2010-2013) of Northwestern Mutual Life Insurance Company. | 61 | Director of MGIC Investment Corporation (private mortgage insurance) (since 2013) and West Bend Mutual Insurance Company (property/casualty insurance) (since 2013). Formerly, Trustee of Northwestern Mutual Life Insurance Company (2010-2013); and Director of Frank Russell Company (global asset management firm) (2008-2013). |
78 | JUNE 30, 2018 |
Janus Henderson Adaptive Global Allocation Fund
Trustees and Officers (unaudited)
TRUSTEES | |||||
Name, Address, and Age | Positions Held with the Trust | Length of Time Served | Principal Occupations During the Past Five Years | Number of Portfolios/Funds in Fund Complex Overseen by Trustee | Other Directorships Held by Trustee During the Past Five Years |
Independent Trustees | |||||
James
T. Rothe | Trustee | 1/97-Present | Professor Emeritus of Business of the University of Colorado, Colorado Springs, CO (since 2004). Formerly, Co-founder and Managing Director of Roaring Fork Capital SBIC, L.P. (SBA SBIC fund focusing on private investment in public equity firms) (2004-2014), Professor of Business of the University of Colorado (2002-2004), and Distinguished Visiting Professor of Business (2001-2002) of Thunderbird (American Graduate School of International Management), Glendale, AZ. | 61 | Formerly, Director of Red Robin Gourmet Burgers, Inc. (RRGB) (2004- 2014). |
William
D. Stewart | Trustee | 6/84-Present | Retired. Formerly, President and founder of HPS Products and Corporate Vice President of MKS Instruments, Boulder, CO (a provider of advanced process control systems for the semiconductor industry) (1976-2012). | 61 | None |
Janus Investment Fund | 79 |
Janus Henderson Adaptive Global Allocation Fund
Trustees and Officers (unaudited)
TRUSTEES | |||||
Name, Address, and Age | Positions Held with the Trust | Length of Time Served | Principal Occupations During the Past Five Years | Number of Portfolios/Funds in Fund Complex Overseen by Trustee | Other Directorships Held by Trustee During the Past Five Years |
Independent Trustees | |||||
Diane
L. Wallace | Trustee | 6/17-Present | Retired. | 61 | Formerly, Independent Trustee, Henderson Global Funds (13 portfolios) (2015-2017); Independent Trustee, State Farm Associates' Funds Trust, State Farm Mutual Fund Trust, and State Farm Variable Product Trust (28 portfolios) (2013-2017). Chief Operating Officer, Senior Vice President-Operations, and Chief Financial Officer for Driehaus Capital Management, LLC (1988-2006); and Treasurer of Driehaus Mutual Funds (1996-2002). |
80 | JUNE 30, 2018 |
Janus Henderson Adaptive Global Allocation Fund
Trustees and Officers (unaudited)
TRUSTEES | |||||
Name, Address, and Age | Positions Held with the Trust | Length of Time Served | Principal Occupations During the Past Five Years | Number of Portfolios/Funds in Fund Complex Overseen by Trustee | Other Directorships Held by Trustee During the Past Five Years |
Independent Trustees | |||||
Linda
S. Wolf | Trustee | 11/05-Present | Retired. Formerly, Chairman and Chief Executive Officer of Leo Burnett (Worldwide) (advertising agency) (2001-2005). | 61 | Director of Chicago Community Trust (Regional Community Foundation), Chicago Council on Global Affairs, InnerWorkings (U.S. provider of print procurement solutions to corporate clients), Lurie Children’s Hospital (Chicago, IL), Shirley Ryan Ability Lab and Wrapports, LLC (digital communications company). Formerly, Director of Walmart (until 2017); Director of Chicago Convention & Tourism Bureau (until 2014); and The Field Museum of Natural History (Chicago, IL) (until 2014). |
Janus Investment Fund | 81 |
Janus Henderson Adaptive Global Allocation Fund
Trustees and Officers (unaudited)
OFFICERS | |||
Name, Address, and Age | Positions Held with the Trust | Term of Office* and Length of Time Served | Principal Occupations During the Past Five Years |
Ashwin Alankar | Executive Vice President and
Co-Portfolio Manager | 6/15-Present | Senior Vice President and Global Head of Asset Allocation and Risk Management of Janus Capital and Portfolio Manager for other Janus Henderson accounts. Formerly, Co-Chief Investment Officer of AllianceBernstein’s Tail Risk Parity (2010-2014). |
Enrique
Chang | Executive Vice President and
Co-Portfolio Manager | 6/15-Present | Global Chief Investment Officer of Janus Henderson Investors and Portfolio Manager for other Janus Henderson accounts. Formerly, President, Head of Investments of Janus Capital (2016-2017); and Chief Investment Officer Equities and Asset Allocation of Janus Capital (2013-2016). During the five years prior to 2013, Mr. Chang was Chief Investment Officer and Executive Vice President for American Century Investments. |
82 | JUNE 30, 2018 |
Janus Henderson Adaptive Global Allocation Fund
Trustees and Officers (unaudited)
OFFICERS | |||
Name, Address, and Age | Positions Held with the Trust | Term of Office* and Length of Time Served | Principal Occupations During the Past Five Years |
Bruce L. Koepfgen | President and Chief Executive Officer | 7/14-Present | Head of North America at Janus Henderson Investors and Janus Capital Management LLC (since 2017); Executive Vice President and Director of Janus International Holding LLC (since 2011); Executive Vice President of Janus Distributors LLC (since 2011); Vice President and Director of Intech Investment Management LLC (since 2011); Executive Vice President and Director of Perkins Investment Management LLC (since 2011); and Executive Vice President and Director of Janus Management Holdings Corporation (since 2011). Formerly, President of Janus Capital Group Inc. and Janus Capital Management LLC (2013-2017); Executive Vice President of Janus Services LLC (2011-2015), Janus Capital Group Inc. and Janus Capital Management LLC (2011-2013); and Chief Financial Officer of Janus Capital Group Inc., Janus Capital Management LLC, Janus Distributors LLC, Janus Management Holdings Corporation, and Janus Services LLC (2011-2013). |
Susan
K. Wold | Vice President, Chief Compliance Officer, and Anti-Money Laundering Officer | 9/17-Present | Senior Vice President and Head of Compliance, North America for
Janus Henderson (since September 2017); |
Jesper
Nergaard | Chief Financial Officer | 3/05-Present | Vice President of Janus Capital and Janus Services LLC. |
Janus Investment Fund | 83 |
Janus Henderson Adaptive Global Allocation Fund
Trustees and Officers (unaudited)
OFFICERS | ||||
Name, Address, and Age | Positions Held with the Trust | Term of Office* and Length of Time Served | Principal Occupations During the Past Five Years | |
Kathryn L. Santoro | Vice President, Chief Legal Counsel, and Secretary | 12/16-Present | Vice President of Janus Capital and Janus Services LLC (since 2016). Formerly, Vice President and Associate Counsel of Curian Capital, LLC and Curian Clearing LLC (2013-2016); and General Counsel and Secretary (2011-2012) and Vice President (2009-2012) of Old Mutual Capital, Inc. | |
*Officers are elected at least annually by the Trustees for a one-year term and may also be elected from time to time by the Trustees for an interim period. | ||||
84 | JUNE 30, 2018 |
Janus Henderson Adaptive Global Allocation Fund
Notes
NotesPage1
Janus Investment Fund | 85 |
Knowledge. Shared
At Janus Henderson, we believe in the sharing of expert insight for better investment and business decisions. We call this ethos Knowledge. Shared.
Learn more by visiting janushenderson.com.
| ||||||||
This report is submitted for the general information of shareholders of the Fund. It is not an offer or solicitation for the Fund and is not authorized for distribution to prospective investors unless preceded or accompanied by an effective prospectus. | ||||||||
Janus Henderson, Janus, Henderson, Perkins, Intech and Henderson Geneva are trademarks or registered trademarks of Janus Henderson Investors. © Janus Henderson Investors. The name Janus Henderson Investors includes HGI Group Limited, Henderson Global Investors (Brand Management) Sarl and Janus International Holding LLC. Funds distributed by Janus Henderson Distributors | ||||||||
125-02-93059 08-18 | ||||||||

ANNUAL REPORT June 30, 2018 | |||
Janus Henderson All Asset Fund | |||
Janus Investment Fund | |||
| |||
HIGHLIGHTS · Portfolio management perspective · Investment strategy behind your fund · Fund performance, characteristics | |||
|

Table of Contents
Janus Henderson All Asset Fund
Janus Henderson All Asset Fund (unaudited)

PERFORMANCE
The Janus Henderson All Asset Fund’s Class I Shares generated a positive absolute return of 3.78% over the 12-month period from July 1, 2017, to June 30, 2018. The Fund’s primary benchmark, the 3-Month USD LIBOR, returned 1.53%. Since inception in 2012, the Fund has returned 4.01% annualized.
INVESTMENT ENVIRONMENT
The 12 months to the end of June 2018 were characterized by good stock market returns, rising U.S. Treasury yields and, latterly, a stronger U.S. dollar. This occurred against a background where the global economic growth remained solid and inflation broadly moved back toward central bank targets. Most risks were eventually swept aside, although rising trade tensions at the end of the period weighed on investor sentiment.
Strong performance from the U.S. economy was a major feature of the period. Tax cuts and higher spending commitments helped boost economic output. Reductions in corporate and personal tax rates improved confidence at a relatively late point in the economic cycle but come at a cost of higher budget deficits. In January 2018, Jay Powell took over from Janet Yellen as Chair of the Federal Reserve (Fed), which continued its path of monetary policy normalization. The Fed implemented three further interest rate increases over the 12 months as inflation moved back up toward the target level, despite the wage growth only edging higher. The slow rate of earnings growth continues to vex policy makers given the very low unemployment rate. However, other indicators of labor market demand and the strength of the U.S. economy suggest greater wage pressure should be coming through.
Outside the U.S., political events were in focus. Another strong win for the incumbent Japanese government in an election during the second half of 2018 was welcomed by investors as a sign that there was continued commitment to structural reforms and defeating deflation. In contrast, European elections brought uncertainty. Difficulties in forming an Italian government became even more challenging as the final coalition between two non-mainstream parties raised concerns about unaffordable higher spending and Italy’s position within the eurozone. Elsewhere, a change in the Spanish government and coalition issues in Germany brought tension at a time of disappointing economic data. In the UK, negotiations to leave the European Union continued to dominate headlines.
More globally, the end of the reporting period was dominated by escalating global trade tensions. A move toward protectionism could have major consequences for the global, interlinked network of supply chains. While it is likely that all countries will suffer if trade tariffs are generally raised, investors were more immediately concerned with the impact on regions with significant export exposure, such as China, Europe and Japan.
The S&P 500® Index returned 14.4% over the period, led by the technology and consumer sectors. However, volatility returned to equity markets more broadly at the end of January 2018 as optimism became extended and markets suffered a sharp drop. The recovery has been slow but global equity markets have now edged back into positive territory for the year so far. European equities lagged other regions over the reporting period. A strong U.S. dollar in 2018 was a headwind for emerging market equities, in particular.
U.S. Treasury yields were significantly higher at the end of the period than at the start, particularly the shorter-maturity 2-year bonds, which are heavily influenced by the outlook for monetary policy. Other major global sovereign bond markets saw smaller moves, with German Bunds actually ending the period lower.
Corporate bonds suffered from widening credit spreads and rising U.S. Treasury yields. Investment-grade debt delivered negative returns but high-yield bonds performed better over the 12 months. Emerging market debt
Janus Investment Fund | 1 |
Janus Henderson All Asset Fund (unaudited)
suffered from widening credit spreads and currency weakness against the U.S. dollar in 2018.
Within commodities, the price of gold was little changed between the start and end of the period. However, the price of oil surged over 60% on concerns about reducing global supply. Industrial metal prices were also higher as global growth remained solid.
PERFORMANCE DISCUSSION
The Fund outperformed its primary benchmark over the reporting period. Outperformance was largely generated by the Fund’s risk assets, with equity holdings providing the majority of returns.
All equity regions contributed positively to performance, with the largest contributions coming from Japanese and U.S. equities. Futures positions in the TOPIX, FTSE 100 and Euro Stoxx 50 indices were the most significant performers over the period.
While positions in S&P 500 futures were the largest contributor with U.S. equities, exposure to regional banks and technology stocks also added significantly to performance. The Vanguard Information Technology ETF benefited from the technology sector delivering exceptionally strong returns. The SPDR S&P Regional Banking ETF produced solid returns and diversification during periods of significant increases in U.S. Treasury yields.
Fixed income contributions were small but accretive to the overall returns from the Fund. Sovereigns were a slight drag but allocations to Treasury Inflation Protected Securities (TIPS) helped offset most of the negative performance from 10-year Treasury futures. All areas of credit added to performance, as did emerging market debt.
In alternatives, gold was the most significant contributor to performance. Real estate was broadly flat but alternative strategies were a mild drag on returns following some poor performance from certain strategies toward the end of the period.
Overseas currency exposure was the largest negative contributor to performance as the U.S. dollar strengthened, particularly toward the latter part of the reporting period.
Please see the Derivative Instruments section in the “Notes to Financial Statements” for a discussion of derivatives used by the Fund.
OUTLOOK
The gradual move away from easy monetary policy and rising trade tensions continue to bring about the return of greater volatility to markets. Investors will need to continue to adapt to this transition in the investment environment and be wary of the assets that have benefited most from the period of low volatility and easy money. Volatility will present both risks and opportunities. This should be a productive environment for those able to carefully pick the right moments to switch between asset classes.
2 | JUNE 30, 2018 |
Janus Henderson All Asset Fund (unaudited)
Fund At A Glance
June 30, 2018
Holdings - (% of Net Assets) | |||
Fidelity Investments Money Market Treasury Portfolio | 42.2 | % | |
iShares TIPS Bond | 7.4 | ||
Janus Henderson Emerging Markets Fund - Class N Shares | 4.4 | ||
PIMCO Enhanced Short Maturity Active | 4.1 | ||
T Rowe Price US High Yield Fund | 4.0 | ||
Janus Henderson Global Equity Income Fund - Class N Shares | 3.9 | ||
AQR Equity Market Neutral Fund | 3.8 | ||
SPDR S&P Regional Banking | 3.6 | ||
AQR Managed Futures Strategy Fund | 3.5 | ||
iShares Edge MSCI Min Vol EAFE | 3.4 | ||
iShares Edge MSCI Min Vol Emerging Markets | 3.2 | ||
BlackRock Emerging Markets Flexible Dynamic Bond Portfolio | 3.2 | ||
iShares JP Morgan USD Emerging Markets Bond | 3.0 | ||
Invesco International Dividend Achievers | 3.0 | ||
Invesco Senior Loan | 3.0 | ||
Janus Henderson Strategic Income Fund - Class N Shares | 2.8 | ||
US Cities Fund LP | 1.1 |
Asset Allocation - (% of Net Assets) | ||||
Money Markets | 42.2% | |||
Exchange-Traded Funds (ETFs) | 30.7% | |||
Fixed Income Funds | 10.0% | |||
Equity Funds | 9.4% | |||
Alternative Funds | 7.3% | |||
Other | 0.4% | |||
100.0% | ||||
Janus Investment Fund | 3 |
Janus Henderson All Asset Fund (unaudited)
Performance
See important disclosures on the next page. |
| Expense Ratios - | ||||||||
Average Annual Total Return - for the periods ended June 30, 2018 |
|
| per the October 27, 2017 prospectuses | ||||||
|
| One
| Five
| Since |
|
| Total Annual Fund
| Net Annual Fund
| |
Class A Shares at NAV |
| 3.45% | 3.84% | 3.74% |
|
| 1.54% | 1.29% | |
Class A Shares at MOP |
| -2.47% | 2.62% | 2.76% |
|
|
|
| |
Class C Shares at NAV | 2.69% | 3.03% | 2.95% |
|
| 2.30% | 2.05% | ||
Class C Shares at CDSC |
| 1.73% | 3.03% | 2.95% |
|
|
|
| |
Class D Shares(1) |
| 3.67% | 3.83% | 3.72% |
|
| 1.37% | 1.11% | |
Class I Shares |
| 3.78% | 4.11% | 4.01% |
|
| 1.27% | 1.03% | |
Class N Shares |
| 3.71% | 4.00% | 3.88% |
|
| 1.23% | 0.97% | |
Class S Shares |
| 3.46% | 3.53% | 3.40% |
|
| 1.71% | 1.46% | |
Class T Shares |
| 3.60% | 3.75% | 3.63% |
|
| 1.46% | 1.21% | |
3-Month USD LIBOR |
| 1.53% | 0.66% | 0.61% |
|
|
|
| |
MSCI World Index (Net) |
| 11.09% | 9.94% | 9.94% |
|
|
|
| |
Morningstar Quartile - Class I Shares |
| 3rd | 3rd | 4th |
|
|
|
| |
Morningstar Ranking - based on total returns for World Allocation Funds |
| 336/487 | 310/413 | 296/386 |
|
|
|
| |
Returns quoted are past performance and do not guarantee future results; current performance may be lower or higher. Investment returns and principal value will vary; there may be a gain or loss when shares are sold. For the most recent month-end performance call 800.668.0434 (or 800.525.3713 if you hold shares directly with Janus Henderson) or visit janushenderson.com/performance (or janushenderson.com/allfunds if you hold shares directly with Janus Henderson).
Maximum Offering Price (MOP) returns include the maximum sales charge of 5.75%. Net Asset Value (NAV) returns exclude this charge, which would have reduced returns.
CDSC returns include a 1% contingent deferred sales charge (CDSC) on Shares redeemed within 12 months of purchase. Net Asset Value (NAV) returns exclude this charge, which would have reduced returns.
Net expense ratios reflect the expense waiver, if any, contractually agreed to through November 1, 2018.
The expense ratios shown are estimated.
Performance may be affected by risks that include those associated with non-diversification, portfolio turnover, short sales, potential conflicts of interest,
4 | JUNE 30, 2018 |
Janus Henderson All Asset Fund (unaudited)
Performance
foreign and emerging markets, initial public offerings (IPOs), high-yield and high-risk securities, undervalued, overlooked and smaller capitalization companies, real estate related securities including Real Estate Investment Trusts (REITs), derivatives, and commodity-linked investments. Each product has different risks. Please see the prospectus for more information about risks, holdings and other details.
Returns include reinvestment of all dividends and distributions and do not reflect the deduction of taxes that a shareholder would pay on Fund distributions or redemptions of Fund shares. The returns do not include adjustments in accordance with generally accepted accounting principles required at the period end for financial reporting purposes.
See Financial Highlights for actual expense ratios during the reporting period.
Returns of the Fund shown prior to June 5, 2017, are those for Henderson All Asset Fund (the “Predecessor Fund”), which merged into the Fund after the close of business on June 2, 2017. The Predecessor Fund was advised by Henderson Global Investors (North America) Inc. and subadvised by Henderson Investment Management Limited. Class A Shares, Class C Shares, Class I Shares, and Class R6 Shares of the Predecessor Fund were reorganized into Class A Shares, Class C Shares, Class I Shares, and Class N Shares, respectively, of the Fund. In connection with this reorganization, certain shareholders of the Predecessor Fund who held shares directly with the Predecessor Fund and not through an intermediary had the Class A Shares, Class C Shares, Class I Shares, and Class N Shares of the Fund received in the reorganization automatically exchanged for Class D Shares of the Fund following the reorganization. Class A Shares, Class C Shares, and Class I Shares of the Predecessor Fund commenced operations with the Predecessor Fund’s inception on March 30, 2012. Class R6 Shares of the Predecessor Fund commenced operations on November 30, 2015. Class D Shares, Class S Shares, and Class T Shares commenced operations on June 5, 2017.
Performance of Class A Shares shown for periods prior to June 5, 2017, reflects the performance of Class A Shares of the Predecessor Fund, calculated using the fees and expenses of Class A Shares of the Predecessor Fund, in effect during the periods shown, net of any applicable fee and expense limitations or waivers.
Performance of Class C Shares shown for periods prior to June 5, 2017, reflects the performance of Class C Shares of the Predecessor Fund, calculated using the fees and expenses of Class C Shares of the Predecessor Fund, in effect during the periods shown, net of any applicable fee and expense limitations or waivers.
Performance of Class I Shares shown for periods prior to June 5, 2017, reflects the performance of Class I Shares of the Predecessor Fund, calculated using the fees and expenses of Class I Shares of the Predecessor Fund, in effect during the periods shown, net of any applicable fee and expense limitations or waivers.
Performance of Class N Shares shown for periods prior to June 5, 2017, reflects the performance of Class R6 Shares of the Predecessor Fund, calculated using the fees and expenses of Class R6 Shares of the Predecessor Fund, in effect during the periods shown, net of any applicable fee and expense limitations or waivers, except that for periods prior to November 30, 2015, performance for Class N Shares reflects the performance of Class I Shares of the Predecessor Fund, calculated using the estimated fees and expenses of Class N Shares, net of any applicable fee and expense limitations or waivers.
Performance of Class S Shares shown for periods prior to June 5, 2017, reflects the performance of Class I Shares of the Predecessor Fund, calculated using the estimated fees and expenses of Class S Shares, net of any applicable fee and expense limitations or waivers.
Performance of Class T Shares shown for periods prior to June 5, 2017, reflects the performance of Class I Shares of the Predecessor Fund, calculated using the estimated fees and expenses of Class T Shares, net of any applicable fee and expense limitations or waivers.
Performance of Class D Shares shown for periods prior to June 5, 2017, reflects the performance of Class I Shares of the Predecessor Fund, calculated using the estimated fees and expenses of Class D Shares, net of any applicable fee and expense limitations or waivers.
If each share class of the Fund had been available during periods prior to its commencement, the performance shown may have been different. The performance shown for periods following the Fund’s commencement of each share class reflects the fees and expenses of each respective share class, net of any applicable fee and expense limitations or waivers. Please refer to the Fund’s prospectuses for further details concerning historical performance.
Ranking is for the share class shown only; other classes may have different performance characteristics. When an expense waiver is in effect, it may have a material effect on the total return, and therefore the ranking for the period.
© 2018 Morningstar, Inc. All Rights Reserved.
There is no assurance that the investment process will consistently lead to successful investing.
See Notes to Schedule of Investments and Other Information for index definitions.
Index performance does not reflect the expenses of managing a portfolio as an index is unmanaged and not available for direct investment.
See “Useful Information About Your Fund Report.”
Effective June 5, 2017, the Fund’s performance is compared to the MSCI World Index net of foreign withholding taxes. Previously, the Predecessor Fund used the MSCI World Index gross of foreign withholding taxes. The net version of the benchmark is believed to more closely reflect the Fund’s investment universe.
See important disclosures on the next page. |
Janus Investment Fund | 5 |
Janus Henderson All Asset Fund (unaudited)
Performance
Effective July 9, 2018, the Fund is closed to new investors. The Fund will liquidate on or about December 31, 2018 and may deviate from its stated investment strategies and policies and accordingly cease being managed to meet its investment objective as it prepares for liquidation. See the prospectus supplement for further details.
*The Predecessor Fund’s inception date – March 30, 2012
(1) Closed to certain new investors.
6 | JUNE 30, 2018 |
Janus Henderson All Asset Fund (unaudited)
Expense Examples
As a shareholder of the Fund, you incur two types of costs: (1) transaction costs, such as sales charges (loads) on purchase payments (applicable to Class A Shares only); and (2) ongoing costs, including management fees; 12b-1 distribution and shareholder servicing fees; transfer agent fees and expenses payable pursuant to the Transfer Agency Agreement; and other Fund expenses. This example is intended to help you understand your ongoing costs (in dollars) of investing in the Fund and to compare these costs with the ongoing costs of investing in other mutual funds. To do so, compare this 5% hypothetical example with the 5% hypothetical examples that appear in the shareholder reports of the other funds. The example is based upon an investment of $1,000 invested at the beginning of the period and held for the six-months indicated, unless noted otherwise in the table and footnotes below.
Actual Expenses
The information in the table under the heading “Actual” provides information about actual account values and actual expenses. You may use the information in these columns, together with the amount you invested, to estimate the expenses that you paid over the period. Simply divide your account value by $1,000 (for example, an $8,600 account value divided by $1,000 = 8.6), then multiply the result by the number in the appropriate column for your share class under the heading entitled “Expenses Paid During Period” to estimate the expenses you paid on your account during the period.
Hypothetical Example for Comparison Purposes
The information in the table under the heading “Hypothetical (5% return before expenses)” provides information about hypothetical account values and hypothetical expenses based upon the Fund’s actual expense ratio and an assumed rate of return of 5% per year before expenses, which is not the Fund’s actual return. The hypothetical account values and expenses may not be used to estimate the actual ending account balance or expenses you paid for the period. You may use this information to compare the ongoing costs of investing in the Fund and other funds. To do so, compare this 5% hypothetical example with the 5% hypothetical examples that appear in the shareholder reports of the other funds. Additionally, for an analysis of the fees associated with an investment in any share class or other similar funds, please visit www.finra.org/fundanalyzer.
Please note that the expenses shown in the table are meant to highlight your ongoing costs only and do not reflect any transaction costs. These fees are fully described in the Fund’s prospectuses. Therefore, the hypothetical examples are useful in comparing ongoing costs only, and will not help you determine the relative total costs of owning different funds. In addition, if these transaction costs were included, your costs would have been higher.
Actual | Hypothetical | |||||||||
| Beginning | Ending | Expenses |
| Beginning | Ending | Expenses | Net Annualized | ||
Class A Shares | $1,000.00 | $981.90 | $4.18 |
| $1,000.00 | $1,020.58 | $4.26 | 0.85% | ||
Class C Shares | $1,000.00 | $977.80 | $7.55 |
| $1,000.00 | $1,017.16 | $7.70 | 1.54% | ||
Class D Shares | $1,000.00 | $982.80 | $3.20 |
| $1,000.00 | $1,021.57 | $3.26 | 0.65% | ||
Class I Shares | $1,000.00 | $983.70 | $2.85 |
| $1,000.00 | $1,021.92 | $2.91 | 0.58% | ||
Class N Shares | $1,000.00 | $982.70 | $2.56 |
| $1,000.00 | $1,022.22 | $2.61 | 0.52% | ||
Class S Shares | $1,000.00 | $982.80 | $3.98 |
| $1,000.00 | $1,020.78 | $4.06 | 0.81% | ||
Class T Shares | $1,000.00 | $981.80 | $3.44 |
| $1,000.00 | $1,021.32 | $3.51 | 0.70% | ||
† | Expenses Paid During Period are equal to the Net Annualized Expense Ratio multiplied by the average account value over the period, multiplied by 181/365 (to reflect the one-half year period). Expenses in the examples include the effect of applicable fee waivers and/or expense reimbursements, if any. Had such waivers and/or reimbursements not been in effect, your expenses would have been higher. Please refer to the Notes to Financial Statements or the Fund’s prospectuses for more information regarding waivers and/or reimbursements. | |||||||||
Janus Investment Fund | 7 |
Janus Henderson All Asset Fund
Schedule of Investments
June 30, 2018
| Value | ||||||
Investment Companies – 99.6% | |||||||
Alternative Funds – 7.3% | |||||||
AQR Equity Market Neutral Fund | 162,124 | $1,815,792 | |||||
AQR Managed Futures Strategy Fund* | 190,973 | 1,665,285 | |||||
3,481,077 | |||||||
Equity Funds – 9.4% | |||||||
Janus Henderson Emerging Markets Fund - Class N Shares£ | 216,898 | 2,125,603 | |||||
Janus Henderson Global Equity Income Fund - Class N Shares£ | 259,680 | 1,880,084 | |||||
US Cities Fund LP* | 956 | 524,428 | |||||
4,530,115 | |||||||
Exchange-Traded Funds (ETFs) – 30.7% | |||||||
Invesco International Dividend Achievers | 92,109 | 1,437,821 | |||||
Invesco Senior Loan | 62,715 | 1,436,174 | |||||
iShares Edge MSCI Min Vol EAFE | 23,064 | 1,640,773 | |||||
iShares Edge MSCI Min Vol Emerging Markets | 26,389 | 1,526,340 | |||||
iShares JP Morgan USD Emerging Markets Bond | 13,527 | 1,444,278 | |||||
iShares TIPS Bond | 31,605 | 3,567,256 | |||||
PIMCO Enhanced Short Maturity Active | 19,098 | 1,939,402 | |||||
SPDR S&P Regional Banking | 27,933 | 1,703,913 | |||||
14,695,957 | |||||||
Fixed Income Funds – 10.0% | |||||||
BlackRock Emerging Markets Flexible Dynamic Bond Portfolio | 175,111 | 1,507,705 | |||||
Janus Henderson Strategic Income Fund - Class N Shares£ | 145,561 | 1,356,627 | |||||
T Rowe Price US High Yield Fund | 196,963 | 1,916,448 | |||||
4,780,780 | |||||||
Money Markets – 42.2% | |||||||
Fidelity Investments Money Market Treasury Portfolio, 1.7500%ºº | 20,228,301 | 20,228,301 | |||||
Total Investments (total cost $47,583,884) – 99.6% | 47,716,230 | ||||||
Cash, Receivables and Other Assets, net of Liabilities – 0.4% | 214,899 | ||||||
Net Assets – 100% | $47,931,129 | ||||||
See Notes to Schedule of Investments and Other Information and Notes to Financial Statements. | |
8 | JUNE 30, 2018 |
Janus Henderson All Asset Fund
Schedule of Investments
June 30, 2018
Schedules of Affiliated Investments – (% of Net Assets)
Dividend Income(1) | Realized Gain/(Loss)(1) | Change in Unrealized Appreciation/ Depreciation(1) | Value at 6/30/18 | |||||||
Investment Companies - 11.2% | ||||||||||
Equity Funds - 8.4% | ||||||||||
Janus Henderson Emerging Markets Fund - Class N Shares | 70,388 | - | (23,798) | 2,125,603 | ||||||
Janus Henderson Global Equity Income Fund - Class N Shares | 122,957 | - | (88,710) | 1,880,084 | ||||||
Total Equity Funds | $ | 193,345 | $ | - | $ | (112,508) | $ | 4,005,687 | ||
Fixed Income Funds - 2.8% | ||||||||||
Janus Henderson Strategic Income Fund - Class N Shares | $ | 33,464 | $ | - | $ | (17,449) | $ | 1,356,627 | ||
Total Affiliated Investments - 11.2% | $ | 226,809 | $ | - | $ | (129,957) | $ | 5,362,314 | ||
(1) For securities that were affiliated for a portion of the year ended June 30, 2018, this column reflects amounts for the entire year ended June 30, 2018 and not just the year in which the security was affiliated.
Share Balance at 6/30/17 | Purchases | Sales | Share Balance at 6/30/18 | |||||||
Investment Companies - 11.2% | ||||||||||
Equity Funds - 8.4% | ||||||||||
Janus Henderson Emerging Markets Fund - Class N Shares | 210,214 | 6,684 | - | 216,898 | ||||||
Janus Henderson Global Equity Income Fund - Class N Shares | 231,489 | 28,191 | - | 259,680 | ||||||
Fixed Income Funds - 2.8% | ||||||||||
Janus Henderson Strategic Income Fund - Class N Shares | 142,014 | 3,547 | - | 145,561 | ||||||
Schedule of Forward Foreign Currency Exchange Contracts, Open |
Counterparty/ Foreign Currency | Settlement Date | Foreign Currency Amount (Sold)/ Purchased | USD Currency Amount (Sold)/ Purchased | Market Value and Unrealized Appreciation/ (Depreciation) | ||||
BNP Paribas: | ||||||||
British Pound | 7/25/18 | 2,170,494 | $ | (2,875,808) | $ | (8,593) | ||
Euro | 7/25/18 | 976,819 | (1,133,448) | 9,265 | ||||
Japanese Yen | 7/25/18 | 361,909,519 | (3,283,881) | (9,098) | ||||
Total | $ | (8,426) | ||||||
See Notes to Schedule of Investments and Other Information and Notes to Financial Statements. | |
Janus Investment Fund | 9 |
Janus Henderson All Asset Fund
Schedule of Investments
June 30, 2018
Schedule of Futures
Description | Number of Contracts | Expiration Date | Value and Notional Amount | Unrealized Appreciation/ (Depreciation) | Variation Margin Asset/(Liability) | ||||||||
Futures Purchased: | |||||||||||||
10-Year US Treasury | 25 | 9/19/18 | $ | 3,004,688 | $ | 30,078 | $ | 3,906 | |||||
EURO STOXX | 56 | 9/21/18 | 2,217,427 | (47,480) | 17,722 | ||||||||
FTSE 100 | 30 | 9/21/18 | 3,009,065 | (19,233) | 43,257 | ||||||||
OSE NIKKEI | 7 | 9/13/18 | 1,409,485 | 869 | (648) | ||||||||
OSE TOPIX | 12 | 9/13/18 | 1,875,881 | (30,488) | (1,259) | ||||||||
S&P 500 E-mini | 26 | 9/21/18 | 3,537,950 | (85,082) | (1,105) | ||||||||
Total | $ | (151,336) | $ | 61,873 | |||||||||
The following table, grouped by derivative type, provides information about the fair value and location of derivatives within the Statement of Assets and Liabilities as of June 30, 2018.
Fair Value of Derivative Instruments (not accounted for as hedging instruments) as of June 30, 2018 | |||||||||||
|
|
|
|
| Currency |
| Equity |
| Interest Rate |
| Total |
Asset Derivatives: | |||||||||||
Forward foreign currency exchange contracts | $ 9,265 | $ - | $ - | $ 9,265 | |||||||
Variation margin receivable | - | 60,979 | 3,906 | 64,885 | |||||||
Total Asset Derivatives |
|
| $ 9,265 |
| $ 60,979 |
| $ 3,906 |
| $74,150 | ||
| |||||||||||
Liability Derivatives: | |||||||||||
Forward foreign currency exchange contracts | $ 17,691 | $ - | $ - | $17,691 | |||||||
Variation margin payable | - | 3,012 | - | 3,012 | |||||||
Total Liability Derivatives |
|
| $ 17,691 |
| $ 3,012 |
| $ - |
| $20,703 | ||
See Notes to Schedule of Investments and Other Information and Notes to Financial Statements. | |
10 | JUNE 30, 2018 |
Janus Henderson All Asset Fund
Schedule of Investments
June 30, 2018
The following tables provides information about the effect of derivatives and hedging activities on the Fund’s Statement of Operations for the year ended June 30, 2018.
The effect of Derivative Instruments (not accounted for as hedging instruments) on the Statement of Operations for the year ended June 30, 2018 | ||||||||||
Amount of Realized Gain/(Loss) Recognized on Derivatives | ||||||||||
Derivative |
| Currency
|
| Equity |
| Interest Rate |
| Total | ||
Futures contracts | $ - | $996,814 | $ (111,803) | $ 885,011 | ||||||
Forward foreign currency exchange contracts | 205,797 | - | - | 205,797 | ||||||
Total |
| $205,797 |
| $996,814 |
| $ (111,803) |
| $1,090,808 | ||
Amount of Change in Unrealized Appreciation/Depreciation Recognized on Derivatives | ||||||||||
Derivative |
| Currency
|
| Equity |
| Interest Rate |
| Total | ||
Futures contracts | $ - | $ (8,421) | $ 35,000 | $ 26,579 | ||||||
Forward foreign currency exchange contracts | (83,930) | - | - | (83,930) | ||||||
Total |
| $ (83,930) |
| $ (8,421) |
| $ 35,000 |
| $ (57,351) | ||
Please see the "Net Realized Gain/(Loss) on Investments" and "Change in Unrealized Net Appreciation/Depreciation" sections of the Fund’s Statement of Operations.
Average Ending Monthly Market Value of Derivative Instruments During the Year Ended June 30, 2018 | |
| Market Value |
Forward foreign currency exchange contracts, purchased | $ 7,049,890 |
Forward foreign currency exchange contracts, sold | 212,565 |
Futures contracts, purchased | 13,996,295 |
See Notes to Schedule of Investments and Other Information and Notes to Financial Statements. | |
Janus Investment Fund | 11 |
Janus Henderson All Asset Fund
Notes to Schedule of Investments and Other Information
LIBOR (London Interbank Offered Rate) | LIBOR (London Interbank Offered Rate) is a short-term interest rate that banks offer one another and generally represents current cash rates. |
MSCI World IndexSM | MSCI World IndexSM reflects the equity market performance of global developed markets. |
S&P 500® Index | S&P 500® Index reflects U.S. large-cap equity performance and represents broad U.S. equity market performance. |
LP | Limited Partnership |
SPDR | Standard & Poor's Depositary Receipt |
* | Non-income producing security. |
ºº | Rate shown is the 7-day yield as of June 30, 2018. |
£ | The Fund may invest in certain securities that are considered affiliated companies. As defined by the Investment Company Act of 1940, as amended, an affiliated company is one in which the Fund owns 5% or more of the outstanding voting securities, or a company which is under common ownership or control. |
12 | JUNE 30, 2018 |
Janus Henderson All Asset Fund
Notes to Schedule of Investments and Other Information
The following is a summary of the inputs that were used to value the Fund’s investments in securities and other financial instruments as of June 30, 2018. See Notes to Financial Statements for more information. | |||||||||||||
Valuation Inputs Summary | |||||||||||||
Level 2 - | Level 3 - | ||||||||||||
Level 1 - | Other Significant | Significant | |||||||||||
Quotes Prices | Observable Inputs | Unobservable Inputs | |||||||||||
Assets | |||||||||||||
Investments in Securities: | |||||||||||||
Investment Companies | |||||||||||||
Alternative Funds | $ | 3,481,077 | $ | - | $ | - | |||||||
Equity Funds | 4,005,687 | 524,428 | - | ||||||||||
Exchange-Traded Funds (ETFs) | 14,695,957 | - | - | ||||||||||
Fixed Income Funds | 4,780,780 | - | - | ||||||||||
Money Markets | 20,228,301 | - | - | ||||||||||
Total Investments in Securities | $ | 47,191,802 | $ | 524,428 | $ | - | |||||||
Other Financial Instruments(a): | |||||||||||||
Forward Foreign Currency Exchange Contracts | - | 9,265 | - | ||||||||||
Variation Margin Receivable | 64,885 | - | - | ||||||||||
Total Assets | $ | 47,256,687 | $ | 533,693 | $ | - | |||||||
Liabilities | |||||||||||||
Forward Foreign Currency Exchange Contracts | - | 17,691 | - | ||||||||||
Variation Margin Payable | 3,012 | - | - | ||||||||||
Total Liabilities | $ | 3,012 | $ | 17,691 | $ | - | |||||||
(a) | Other financial instruments include forward foreign currency exchange, futures, written options, written swaptions, and swap contracts. Forward foreign currency exchange contracts are reported at their unrealized appreciation/(depreciation) at measurement date, which represents the change in the contract's value from trade date. Futures, certain written options on futures, and centrally cleared swap contracts are reported at their variation margin at measurement date, which represents the amount due to/from the Fund at that date. Written options, written swaptions, and other swap contracts are reported at their market value at measurement date. | ||||||||||||
Janus Investment Fund | 13 |
Janus Henderson All Asset Fund
Statement of Assets and Liabilities
June 30, 2018
See footnotes at the end of the Statement. |
|
|
|
|
|
|
|
Assets: | ||||||
Unaffiliated investments, at value(1) | $ | 42,353,916 | ||||
Affiliated investments, at value(2) | 5,362,314 | |||||
Cash | 26,784,155 | |||||
Deposits with brokers for futures | 515,563 | |||||
Forward foreign currency exchange contracts | 9,265 | |||||
Variation margin receivable | 64,885 | |||||
Non-interested Trustees' deferred compensation | 1,005 | |||||
Receivables: | ||||||
Fund shares sold | 24,284 | |||||
Foreign tax reclaims | 570 | |||||
Other assets | 15,789 | |||||
Total Assets |
|
| 75,131,746 |
| ||
Liabilities: | ||||||
Due to custodian | 26,739,652 | |||||
Forward foreign currency exchange contracts | 17,691 | |||||
Variation margin payable | 3,012 | |||||
Payables: | — | |||||
Investments purchased | 280,174 | |||||
Fund shares repurchased | 85,012 | |||||
Professional fees | 39,060 | |||||
Non-affiliated fund administration fees payable | 12,021 | |||||
12b-1 Distribution and shareholder servicing fees | 6,609 | |||||
Advisory fees | 5,348 | |||||
Transfer agent fees and expenses | 3,755 | |||||
Non-interested Trustees' deferred compensation fees | 1,005 | |||||
Custodian fees | 595 | |||||
Non-interested Trustees' fees and expenses | 472 | |||||
Affiliated fund administration fees payable | 103 | |||||
Accrued expenses and other payables | 6,108 | |||||
Total Liabilities |
|
| 27,200,617 |
| ||
Net Assets |
| $ | 47,931,129 |
| ||
See Notes to Financial Statements. | |
14 | JUNE 30, 2018 |
Janus Henderson All Asset Fund
Statement of Assets and Liabilities
June 30, 2018
|
|
|
|
|
|
|
Net Assets Consist of: | ||||||
Capital (par value and paid-in surplus) | $ | 46,954,639 | ||||
Undistributed net investment income/(loss) | 487,008 | |||||
Undistributed net realized gain/(loss) from investments and foreign currency transactions | 519,390 | |||||
Unrealized net appreciation/(depreciation) of investments, foreign currency translations and non-interested Trustees’ deferred compensation | (29,908) | |||||
Total Net Assets |
| $ | 47,931,129 |
| ||
Net Assets - Class A Shares | $ | 1,658,301 | ||||
Shares Outstanding, $0.01 Par Value (unlimited shares authorized) | 160,969 | |||||
Net Asset Value Per Share(3) |
| $ | 10.30 |
| ||
Maximum Offering Price Per Share(4) |
| $ | 10.93 |
| ||
Net Assets - Class C Shares | $ | 7,221,705 | ||||
Shares Outstanding, $0.01 Par Value (unlimited shares authorized) | 715,104 | |||||
Net Asset Value Per Share(3) |
| $ | 10.10 |
| ||
Net Assets - Class D Shares | $ | 936,931 | ||||
Shares Outstanding, $0.01 Par Value (unlimited shares authorized) | 91,447 | |||||
Net Asset Value Per Share |
| $ | 10.25 |
| ||
Net Assets - Class I Shares | $ | 6,035,781 | ||||
Shares Outstanding, $0.01 Par Value (unlimited shares authorized) | 588,784 | |||||
Net Asset Value Per Share |
| $ | 10.25 |
| ||
Net Assets - Class N Shares | $ | 31,892,620 | ||||
Shares Outstanding, $0.01 Par Value (unlimited shares authorized) | 3,117,370 | |||||
Net Asset Value Per Share |
| $ | 10.23 |
| ||
Net Assets - Class S Shares | $ | 51,172 | ||||
Shares Outstanding, $0.01 Par Value (unlimited shares authorized) | 4,991 | |||||
Net Asset Value Per Share |
| $ | 10.25 |
| ||
Net Assets - Class T Shares | $ | 134,619 | ||||
Shares Outstanding, $0.01 Par Value (unlimited shares authorized) | 13,122 | |||||
Net Asset Value Per Share |
| $ | 10.26 |
| ||
(1) Includes cost of $42,276,478. (2) Includes cost of $5,307,406. (3) Redemption price per share may be reduced for any applicable contingent deferred sales charge. (4) Maximum offering price is computed at 100/94.25 of net asset value. |
See Notes to Financial Statements. | |
Janus Investment Fund | 15 |
Janus Henderson All Asset Fund
Statement of Operations
For the year ended June 30, 2018
|
|
|
|
|
|
Investment Income: | |||||
| Dividends | $ | 823,030 | ||
Dividends from affiliates | 226,809 | ||||
Other income | 34,053 | ||||
Total Investment Income |
| 1,083,892 |
| ||
Expenses: | |||||
Advisory fees | 197,689 | ||||
12b-1 Distribution and shareholder servicing fees: | |||||
Class A Shares | 4,684 | ||||
Class C Shares | 73,283 | ||||
Class S Shares | 107 | ||||
Transfer agent administrative fees and expenses: | |||||
Class D Shares | 741 | ||||
Class S Shares | 128 | ||||
Class T Shares | 210 | ||||
Transfer agent networking and omnibus fees: | |||||
Class A Shares | 1,433 | ||||
Class C Shares | 4,886 | ||||
Class I Shares | 4,529 | ||||
Other transfer agent fees and expenses: | |||||
Class A Shares | 273 | ||||
Class C Shares | 814 | ||||
Class D Shares | 116 | ||||
Class I Shares | 430 | ||||
Class N Shares | 1,230 | ||||
Class T Shares | 10 | ||||
Professional fees | 51,647 | ||||
Registration fees | 27,496 | ||||
Non-affiliated fund administration fees | 12,023 | ||||
Custodian fees | 7,308 | ||||
Shareholder reports expense | 6,340 | ||||
Affiliated fund administration fees | 3,121 | ||||
Non-interested Trustees’ fees and expenses | 1,084 | ||||
Other expenses | 14,869 | ||||
Total Expenses |
| 414,451 |
| ||
Less: Excess Expense Reimbursement and Waivers |
| (59,399) |
| ||
Net Expenses |
| 355,052 |
| ||
Net Investment Income/(Loss) |
| 728,840 |
| ||
Net Realized Gain/(Loss) on Investments: | |||||
Investments and foreign currency transactions | 374,005 | ||||
Forward foreign currency exchange contracts | 205,797 | ||||
Futures contracts | 885,011 | ||||
Capital gain distributions from underlying funds | 45,266 | ||||
Total Net Realized Gain/(Loss) on Investments |
| 1,510,079 |
| ||
Change in Unrealized Net Appreciation/Depreciation: | |||||
Investments, foreign currency translations and non-interested Trustees’ deferred compensation | (381,023) | ||||
Investments in affiliates | (129,957) | ||||
Forward foreign currency exchange contracts | (83,930) | ||||
Futures contracts | 26,579 | ||||
Total Change in Unrealized Net Appreciation/Depreciation |
| (568,331) |
| ||
Net Increase/(Decrease) in Net Assets Resulting from Operations | $ | 1,670,588 |
| ||
See Notes to Financial Statements. | |
16 | JUNE 30, 2018 |
Janus Henderson All Asset Fund
Statements of Changes in Net Assets
|
|
| Year
ended |
| Period ended |
| Year
ended | ||||
Operations: | |||||||||||
Net investment income/(loss) | $ | 728,840 | $ | 473,118 | $ | 467,923 | |||||
Net realized gain/(loss) on investments | 1,510,079 | 3,531,639 | (1,417,530) | ||||||||
Change in unrealized net appreciation/depreciation | (568,331) | (1,033,928) | 290,617 | ||||||||
Net Increase/(Decrease) in Net Assets Resulting from Operations |
| 1,670,588 |
|
| 2,970,829 |
|
| (658,990) | |||
Dividends and Distributions to Shareholders: | |||||||||||
Dividends from Net Investment Income | |||||||||||
Class A Shares | (29,769) | (16,309) | (15,397) | ||||||||
Class C Shares | (40,622) | — | — | ||||||||
Class D Shares | (14,536) | — | N/A | ||||||||
Class I Shares | (156,220) | (52,539) | (101,094) | ||||||||
Class N Shares | (667,439) | (241,031) | (230,208) | ||||||||
Class S Shares | (905) | — | N/A | ||||||||
Class T Shares | (974) | — | N/A | ||||||||
| Total Dividends from Net Investment Income |
| (910,465) |
|
| (309,879) |
|
| (346,699) | ||
Distributions from Net Realized Gain from Investment Transactions | |||||||||||
Class A Shares | (100,034) | — | (161,332) | ||||||||
Class C Shares | (413,271) | — | (297,759) | ||||||||
Class D Shares | (37,421) | — | N/A | ||||||||
Class I Shares | (400,627) | — | (411,454) | ||||||||
Class N Shares | (1,696,854) | — | (860,579) | ||||||||
Class S Shares | (2,726) | — | N/A | ||||||||
Class T Shares | (2,726) | — | N/A | ||||||||
| Total Distributions from Net Realized Gain from Investment Transactions | (2,653,659) |
|
| — |
|
| (1,731,124) | |||
Net Decrease from Dividends and Distributions to Shareholders |
| (3,564,124) |
|
| (309,879) |
|
| (2,077,823) | |||
Capital Share Transactions: | |||||||||||
Class A Shares | (137,827) | (2,312,576) | (2,065,085) | ||||||||
Class C Shares | (502,747) | (1,732,547) | (1,096,409) | ||||||||
Class D Shares | 910,048 | 79,738 | N/A | ||||||||
Class I Shares | (1,028,520) | (3,845,659) | (32,054,787) | ||||||||
Class N Shares | 2,364,293 | 149,275 | 29,428,493 | ||||||||
Class S Shares | 3,631 | 50,010 | N/A | ||||||||
Class T Shares | 88,264 | 50,010 | N/A | ||||||||
Net Increase/(Decrease) from Capital Share Transactions |
| 1,697,142 |
|
| (7,561,749) |
|
| (5,787,788) | |||
Net Increase/(Decrease) in Net Assets |
| (196,394) |
|
| (4,900,799) |
|
| (8,524,601) | |||
Net Assets: | |||||||||||
Beginning of period | 48,127,523 | 53,028,322 | 61,552,923 | ||||||||
| End of period | $ | 47,931,129 |
| $ | 48,127,523 |
| $ | 53,028,322 | ||
Undistributed Net Investment Income/(Loss) | $ | 487,009 |
| $ | 436,631 |
| $ | 68,893 | |||
(1) Period from June 5, 2017 (inception date) through June 30, 2017 for Class D Shares, Class S Shares and Class T Shares. (2) Period from August 1, 2017 through June 30, 2017. The Fund changed its fiscal year end from July 31 to June 30. (3) Period from November 30, 2015 (inception date) through July 31, 2016 for Class N Shares. |
See Notes to Financial Statements. | |
Janus Investment Fund | 17 |
Janus Henderson All Asset Fund
Financial Highlights
Class A Shares | |||||||||
For a share outstanding during the year or period ended June 30 |
| 2018 |
|
| 2017(1) |
| |||
Net Asset Value, Beginning of Period |
| $10.70 |
|
| $10.12 |
| |||
Income/(Loss) from Investment Operations: | |||||||||
Net investment income/(loss)(2) | 0.14 | 0.09 | |||||||
Net realized and unrealized gain/(loss) | 0.22 | 0.53 | |||||||
Total from Investment Operations |
| 0.36 |
|
| 0.62 |
| |||
Less Dividends and Distributions: | |||||||||
Dividends (from net investment income) | (0.17) | (0.04) | |||||||
Distributions (from capital gains) | (0.59) | — | |||||||
Total Dividends and Distributions |
| (0.76) |
|
| (0.04) |
| |||
Net Asset Value, End of Period | $10.30 | $10.70 | |||||||
Total Return* |
| 3.25%(3) |
|
| 6.18% |
| |||
Net Assets, End of Period (in thousands) | $1,658 | $1,862 | |||||||
Average Net Assets for the Period (in thousands) | $1,885 | $3,232 | |||||||
Ratios to Average Net Assets**: |
|
|
|
|
|
| |||
Ratio of Gross Expenses(4) | 1.01% | 1.01% | |||||||
Ratio of Net Expenses (After Waivers and Expense Offsets)(4) | 0.87% | 0.85% | |||||||
Ratio of Net Investment Income/(Loss)(4) | 1.30% | 0.91% | |||||||
Portfolio Turnover Rate | 16% | 55% | |||||||
Class C Shares | |||||||||
For a share outstanding during the year or period ended June 30 |
| 2018 |
|
| 2017(1) |
| |||
Net Asset Value, Beginning of Period |
| $10.46 |
|
| $9.93 |
| |||
Income/(Loss) from Investment Operations: | |||||||||
Net investment income/(loss)(2) | 0.06 | 0.02 | |||||||
Net realized and unrealized gain/(loss) | 0.23 | 0.51 | |||||||
Total from Investment Operations |
| 0.29 |
|
| 0.53 |
| |||
Less Dividends and Distributions: | |||||||||
Dividends (from net investment income) | (0.06) | — | |||||||
Distributions (from capital gains) | (0.59) | — | |||||||
Total Dividends and Distributions |
| (0.65) |
|
| — |
| |||
Net Asset Value, End of Period | $10.10 | $10.46 | |||||||
Total Return* |
| 2.59%(3) |
|
| 5.34% |
| |||
Net Assets, End of Period (in thousands) | $7,222 | $7,979 | |||||||
Average Net Assets for the Period (in thousands) | $7,524 | $8,949 | |||||||
Ratios to Average Net Assets**: |
|
|
|
|
|
| |||
Ratio of Gross Expenses(4) | 1.70% | 1.78% | |||||||
Ratio of Net Expenses (After Waivers and Expense Offsets)(4) | 1.58% | 1.60% | |||||||
Ratio of Net Investment Income/(Loss)(4) | 0.61% | 0.22% | |||||||
Portfolio Turnover Rate | 16% | 55% | |||||||
* Total return not annualized for periods of less than one full year. ** Annualized for periods of less than one full year. (1) Period from August 1, 2016 through June 30, 2017. The Fund changed its fiscal year end from July 31 to June 30. (2) Per share amounts are calculated based on average shares outstanding during the year or period. (3) The return includes adjustments in accordance with generally accepted accounting principles required at period end date. (4) Ratios do not include indirect expenses of the underlying funds and/or investment companies in which the Fund invests. |
See Notes to Financial Statements. | |
18 | JUNE 30, 2018 |
Janus Henderson All Asset Fund
Financial Highlights
Class A Shares | |||||||||||||||
For a share outstanding during the year or period ended July 31 |
| 2016 |
|
| 2015 |
|
| 2014 |
|
| 2013 |
| |||
Net Asset Value, Beginning of Period |
| $10.55 |
|
| $10.76 |
|
| $10.52 |
|
| $9.93 |
| |||
Income/(Loss) from Investment Operations: | |||||||||||||||
Net investment income/(loss)(1) | 0.08 | 0.09 | 0.10 | 0.09 | |||||||||||
Net realized and unrealized gain/(loss) | (0.17) | 0.12 | 0.56 | 0.61 | |||||||||||
Total from Investment Operations |
| (0.09) |
|
| 0.21 |
|
| 0.66 |
|
| 0.70 |
| |||
Less Dividends and Distributions: | |||||||||||||||
Dividends (from net investment income) | (0.03) | (0.14) | (0.11) | (0.09) | |||||||||||
Distributions (from capital gains) | (0.31) | (0.28) | (0.31) | (0.02) | |||||||||||
Total Dividends and Distributions |
| (0.34) |
|
| (0.42) |
|
| (0.42) |
|
| (0.11) |
| |||
Net Asset Value, End of Period | $10.12 | $10.55 | $10.76 | $10.52 | |||||||||||
Total Return* |
| (0.71)% |
|
| 1.94% |
|
| 6.44% |
|
| 7.05% |
| |||
Net Assets, End of Period (in thousands) | $4,011 | $6,396 | $8,929 | $12,023 | |||||||||||
Average Net Assets for the Period (in thousands) | $4,935 | $7,122 | $10,041 | $10,644 | |||||||||||
Ratios to Average Net Assets**: |
|
|
|
|
|
|
|
|
|
|
|
| |||
Ratio of Gross Expenses(2) | 0.95%(3) | 0.91% | 0.93% | 1.10% | |||||||||||
Ratio of Net Expenses (After Waivers and Expense Offsets)(2) | 0.85% | 0.85% | 0.85% | 0.85% | |||||||||||
Ratio of Net Investment Income/(Loss)(2) | 0.84% | 0.88% | 0.94% | 0.86% | |||||||||||
Portfolio Turnover Rate | 44% | 19% | 52% | 37% | |||||||||||
1 | |||||||||||||||
Class C Shares | |||||||||||||||
For a share outstanding during the year or period ended July 31 |
| 2016 |
|
| 2015 |
|
| 2014 |
|
| 2013 |
| |||
Net Asset Value, Beginning of Period |
| $10.39 |
|
| $10.63 |
|
| $10.43 |
|
| $9.91 |
| |||
Income/(Loss) from Investment Operations: | |||||||||||||||
Net investment income/(loss)(1) | 0.01 | 0.02 | 0.02 | 0.02 | |||||||||||
Net realized and unrealized gain/(loss) | (0.16) | 0.10 | 0.56 | 0.59 | |||||||||||
Total from Investment Operations |
| (0.15) |
|
| 0.12 |
|
| 0.58 |
|
| 0.61 |
| |||
Less Dividends and Distributions: | |||||||||||||||
Dividends (from net investment income) | — | (0.08) | (0.07) | (0.07) | |||||||||||
Distributions (from capital gains) | (0.31) | (0.28) | (0.31) | (0.02) | |||||||||||
Total Dividends and Distributions |
| (0.31) |
|
| (0.36) |
|
| (0.38) |
|
| (0.09) |
| |||
Net Asset Value, End of Period | $9.93 | $10.39 | $10.63 | $10.43 | |||||||||||
Total Return* |
| (1.37)% |
|
| 1.14% |
|
| 5.61% |
|
| 6.18% |
| |||
Net Assets, End of Period (in thousands) | $9,247 | $10,824 | $11,094 | $9,357 | |||||||||||
Average Net Assets for the Period (in thousands) | $9,422 | $11,557 | $10,389 | $5,333 | |||||||||||
Ratios to Average Net Assets**: |
|
|
|
|
|
|
|
|
|
|
|
| |||
Ratio of Gross Expenses(2) | 1.71%(3) | 1.68% | 1.67% | 1.80% | |||||||||||
Ratio of Net Expenses (After Waivers and Expense Offsets)(2) | 1.60% | 1.60% | 1.60% | 1.60% | |||||||||||
Ratio of Net Investment Income/(Loss)(2) | 0.09% | 0.18% | 0.20% | 0.20% | |||||||||||
Portfolio Turnover Rate | 44% | 19% | 52% | 37% | |||||||||||
* Total return not annualized for periods of less than one full year. ** Annualized for periods of less than one full year. (1) Per share amounts are calculated based on average shares outstanding during the year or period. (2) Ratios do not include indirect expenses of the underlying funds and/or investment companies in which the Fund invests. (3) The Ratio of Gross Expenses include a reimbursement of prior period custodian out-of-pocket expenses. The Ratio of Gross Expenses would have been 0.01% higher had the custodian not reimbursed the Fund. |
See Notes to Financial Statements. | |
Janus Investment Fund | 19 |
Janus Henderson All Asset Fund
Financial Highlights
Class D Shares | |||||||||
For a share outstanding during the year or period ended June 30 |
| 2018 |
|
| 2017(1) |
| |||
Net Asset Value, Beginning of Period |
| $10.67 |
|
| $10.76 |
| |||
Income/(Loss) from Investment Operations: | |||||||||
Net investment income/(loss)(2) | 0.17 | 0.03 | |||||||
Net realized and unrealized gain/(loss) | 0.23 | (0.12)(3) | |||||||
Total from Investment Operations |
| 0.40 |
|
| (0.09) |
| |||
Less Dividends and Distributions: | |||||||||
Dividends (from net investment income) | (0.23) | — | |||||||
Distributions (from capital gains) | (0.59) | — | |||||||
Total Dividends and Distributions |
| (0.82) |
|
| — |
| |||
Net Asset Value, End of Period | $10.25 | $10.67 | |||||||
Total Return* |
| 3.57%(4) |
|
| (0.84)% |
| |||
Net Assets, End of Period (in thousands) | $937 | $79 | |||||||
Average Net Assets for the Period (in thousands) | $615 | $77 | |||||||
Ratios to Average Net Assets**: |
|
|
|
|
|
| |||
Ratio of Gross Expenses(5) | 0.98% | 0.86% | |||||||
Ratio of Net Expenses (After Waivers and Expense Offsets)(5) | 0.66% | 0.69% | |||||||
Ratio of Net Investment Income/(Loss)(5) | 1.64% | 3.79% | |||||||
Portfolio Turnover Rate | 16% | 55% | |||||||
Class I Shares | |||||||||
For a share outstanding during the year or period ended June 30 |
| 2018 |
|
| 2017(6) |
| |||
Net Asset Value, Beginning of Period |
| $10.67 |
|
| $10.10 |
| |||
Income/(Loss) from Investment Operations: | |||||||||
Net investment income/(loss)(2) | 0.17 | 0.11 | |||||||
Net realized and unrealized gain/(loss) | 0.23 | 0.53 | |||||||
Total from Investment Operations |
| 0.40 |
|
| 0.64 |
| |||
Less Dividends and Distributions: | |||||||||
Dividends (from net investment income) | (0.23) | (0.07) | |||||||
Distributions (from capital gains) | (0.59) | — | |||||||
Total Dividends and Distributions |
| (0.82) |
|
| (0.07) |
| |||
Net Asset Value, End of Period | $10.25 | $10.67 | |||||||
Total Return* |
| 3.58%(4) |
|
| 6.38% |
| |||
Net Assets, End of Period (in thousands) | $6,036 | $7,334 | |||||||
Average Net Assets for the Period (in thousands) | $7,343 | $8,349 | |||||||
Ratios to Average Net Assets**: |
|
|
|
|
|
| |||
Ratio of Gross Expenses(5) | 0.71% | 0.79% | |||||||
Ratio of Net Expenses (After Waivers and Expense Offsets)(5) | 0.60% | 0.59% | |||||||
Ratio of Net Investment Income/(Loss)(5) | 1.59% | 1.19% | |||||||
Portfolio Turnover Rate | 16% | 55% | |||||||
* Total return not annualized for periods of less than one full year. ** Annualized for periods of less than one full year. (1) Period from June 5, 2017 (inception date) through June 30, 2017. (2) Per share amounts are calculated based on average shares outstanding during the year or period. (3) This amount does not agree with the change in the aggregate gains and losses in the Fund’s securities for the year or period due to the timing of sales and repurchases of the Fund’s shares in relation to fluctuating market values for the Fund’s securities. (4) The return includes adjustments in accordance with generally accepted accounting principles required at period end date. (5) Ratios do not include indirect expenses of the underlying funds and/or investment companies in which the Fund invests. (6) Period from August 1, 2016 through June 30, 2017. The Fund changed its fiscal year end from July 31 to June 30. |
See Notes to Financial Statements. | |
20 | JUNE 30, 2018 |
Janus Henderson All Asset Fund
Financial Highlights
Class I Shares | |||||||||||||||
For a share outstanding during the year or period ended July 31 |
| 2016 |
|
| 2015 |
|
| 2014 |
|
| 2013 |
| |||
Net Asset Value, Beginning of Period |
| $10.55 |
|
| $10.77 |
|
| $10.54 |
|
| $9.94 |
| |||
Income/(Loss) from Investment Operations: | |||||||||||||||
Net investment income/(loss)(1) | 0.07 | 0.13 | 0.13 | 0.11 | |||||||||||
Net realized and unrealized gain/(loss) | (0.13) | 0.10 | 0.56 | 0.61 | |||||||||||
Total from Investment Operations |
| (0.06) |
|
| 0.23 |
|
| 0.69 |
|
| 0.72 |
| |||
Less Dividends and Distributions: | |||||||||||||||
Dividends (from net investment income) | (0.08) | (0.17) | (0.15) | (0.10) | |||||||||||
Distributions (from capital gains) | (0.31) | (0.28) | (0.31) | (0.02) | |||||||||||
Total Dividends and Distributions |
| (0.39) |
|
| (0.45) |
|
| (0.46) |
|
| (0.12) |
| |||
Net Asset Value, End of Period | $10.10 | $10.55 | $10.77 | $10.54 | |||||||||||
Total Return* |
| (0.45)% |
|
| 2.20% |
|
| 6.72% |
|
| 7.28% |
| |||
Net Assets, End of Period (in thousands) | $10,750 | $44,333 | $46,867 | $43,221 | |||||||||||
Average Net Assets for the Period (in thousands) | $22,035 | $45,011 | $52,153 | $35,799 | |||||||||||
Ratios to Average Net Assets**: |
|
|
|
|
|
|
|
|
|
|
|
| |||
Ratio of Gross Expenses(2) | 0.68%(3) | 0.63% | 0.62% | 0.79% | |||||||||||
Ratio of Net Expenses (After Waivers and Expense Offsets)(2) | 0.60% | 0.60% | 0.60% | 0.60% | |||||||||||
Ratio of Net Investment Income/(Loss)(2) | 0.69% | 1.18% | 1.22% | 1.10% | |||||||||||
Portfolio Turnover Rate | 44% | 19% | 52% | 37% | |||||||||||
* Total return not annualized for periods of less than one full year. ** Annualized for periods of less than one full year. (1) Per share amounts are calculated based on average shares outstanding during the year or period. (2) Ratios do not include indirect expenses of the underlying funds and/or investment companies in which the Fund invests. (3) The Ratio of Gross Expenses include a reimbursement of prior period custodian out-of-pocket expenses. The Ratio of Gross Expenses would have been 0.01% higher had the custodian not reimbursed the Fund. |
See Notes to Financial Statements. | |
Janus Investment Fund | 21 |
Janus Henderson All Asset Fund
Financial Highlights
Class N Shares | |||||||||
For a share outstanding during the year or period ended June 30 |
| 2018 |
|
| 2017(1) |
| |||
Net Asset Value, Beginning of Period |
| $10.65 |
|
| $10.09 |
| |||
Income/(Loss) from Investment Operations: | |||||||||
Net investment income/(loss)(2) | 0.18 | 0.12 | |||||||
Net realized and unrealized gain/(loss) | 0.22 | 0.52 | |||||||
Total from Investment Operations |
| 0.40 |
|
| 0.64 |
| |||
Less Dividends and Distributions: | |||||||||
Dividends (from net investment income) | (0.23) | (0.08) | |||||||
Distributions (from capital gains) | (0.59) | — | |||||||
Total Dividends and Distributions |
| (0.82) |
|
| (0.08) |
| |||
Net Asset Value, End of Period | $10.23 | $10.65 | |||||||
Total Return* |
| 3.61%(3) |
|
| 6.43% |
| |||
Net Assets, End of Period (in thousands) | $31,893 | $30,774 | |||||||
Average Net Assets for the Period (in thousands) | $32,052 | $29,638 | |||||||
Ratios to Average Net Assets**: |
|
|
|
|
|
| |||
Ratio of Gross Expenses(4) | 0.64% | 0.71% | |||||||
Ratio of Net Expenses (After Waivers and Expense Offsets)(4) | 0.53% | 0.60% | |||||||
Ratio of Net Investment Income/(Loss)(4) | 1.65% | 1.24% | |||||||
Portfolio Turnover Rate | 16% | 55% | |||||||
Class S Shares | ||||||||||
For a share outstanding during the year or period ended June 30 |
|
| 2018 |
|
| 2017(5) |
| |||
Net Asset Value, Beginning of Period |
|
| $10.67 |
|
| $10.76 |
| |||
Income/(Loss) from Investment Operations: | ||||||||||
Net investment income/(loss)(2) | 0.14 | 0.03 | ||||||||
Net realized and unrealized gain/(loss) | 0.22 | (0.12)(6) | ||||||||
Total from Investment Operations |
|
| 0.36 |
|
| (0.09) |
| |||
Less Dividends and Distributions: | ||||||||||
Dividends (from net investment income) | (0.19) | — | ||||||||
Distributions (from capital gains) | (0.59) | — | ||||||||
Total Dividends and Distributions |
|
| (0.78) |
|
| — |
| |||
Net Asset Value, End of Period | $10.25 | $10.67 | ||||||||
Total Return* |
|
| 3.26%(3) |
|
| (0.84)% |
| |||
Net Assets, End of Period (in thousands) | $51 | $50 | ||||||||
Average Net Assets for the Period (in thousands) | $51 | $50 | ||||||||
Ratios to Average Net Assets**: |
|
|
|
|
|
|
| |||
Ratio of Gross Expenses(4) | 2.55% | 1.26% | ||||||||
Ratio of Net Expenses (After Waivers and Expense Offsets)(4) | 0.86% | 1.09% | ||||||||
Ratio of Net Investment Income/(Loss)(4) | 1.32% | 3.31% | ||||||||
Portfolio Turnover Rate | 16% | 55% | ||||||||
* Total return not annualized for periods of less than one full year. ** Annualized for periods of less than one full year. (1) Period from August 1, 2016 through June 30, 2017. The Fund changed its fiscal year end from July 31 to June 30. (2) Per share amounts are calculated based on average shares outstanding during the year or period. (3) The return includes adjustments in accordance with generally accepted accounting principles required at period end date. (4) Ratios do not include indirect expenses of the underlying funds and/or investment companies in which the Fund invests. (5) Period from June 5, 2017 (inception date) through June 30, 2017. (6) This amount does not agree with the change in the aggregate gains and losses in the Fund’s securities for the year or period due to the timing of sales and repurchases of the Fund’s shares in relation to fluctuating market values for the Fund’s securities. |
See Notes to Financial Statements. | |
22 | JUNE 30, 2018 |
Janus Henderson All Asset Fund
Financial Highlights
Class N Shares | ||||||
For a share outstanding during the period ended July 31 |
| 2016(1) |
| |||
Net Asset Value, Beginning of Period |
| $10.25 |
| |||
Income/(Loss) from Investment Operations: | ||||||
Net investment income/(loss)(2) | 0.12 | |||||
Net realized and unrealized gain/(loss) | 0.11(3) | |||||
Total from Investment Operations |
| 0.23 |
| |||
Less Dividends and Distributions: | ||||||
Dividends (from net investment income) | (0.08) | |||||
Distributions (from capital gains) | (0.31) | |||||
Total Dividends and Distributions |
| (0.39) |
| |||
Net Asset Value, End of Period | $10.09 | |||||
Total Return* |
| 2.37% |
| |||
Net Assets, End of Period (in thousands) | $29,020 | |||||
Average Net Assets for the Period (in thousands) | $27,943 | |||||
Ratios to Average Net Assets**: |
|
|
| |||
Ratio of Gross Expenses(4) | 0.64%(5) | |||||
Ratio of Net Expenses (After Waivers and Expense Offsets)(4) | 0.60% | |||||
Ratio of Net Investment Income/(Loss)(4) | 1.88% | |||||
Portfolio Turnover Rate | 44% | |||||
* Total return not annualized for periods of less than one full year. ** Annualized for periods of less than one full year. (1) Period from November 30, 2015 (inception date) through July 31, 2016. (2) Per share amounts are calculated based on average shares outstanding during the year or period. (3) This amount does not agree with the change in the aggregate gains and losses in the Fund’s securities for the year or period due to the timing of sales and repurchases of the Fund’s shares in relation to fluctuating market values for the Fund’s securities. (4) Ratios do not include indirect expenses of the underlying funds and/or investment companies in which the Fund invests. (5) The Ratio of Gross Expenses include a reimbursement of prior period custodian out-of-pocket expenses. The Ratio of Gross Expenses would have been 0.01% higher had the custodian not reimbursed the Fund. |
See Notes to Financial Statements. | |
Janus Investment Fund | 23 |
Janus Henderson All Asset Fund
Financial Highlights
Class T Shares | |||||||||
For a share outstanding during the year or period ended June 30 |
| 2018 |
|
| 2017(1) |
| |||
Net Asset Value, Beginning of Period |
| $10.67 |
|
| $10.76 |
| |||
Income/(Loss) from Investment Operations: | |||||||||
Net investment income/(loss)(2) | 0.15 | 0.03 | |||||||
Net realized and unrealized gain/(loss) | 0.24 | (0.12)(3) | |||||||
Total from Investment Operations |
| 0.39 |
|
| (0.09) |
| |||
Less Dividends and Distributions: | |||||||||
Dividends (from net investment income) | (0.21) | — | |||||||
Distributions (from capital gains) | (0.59) | — | |||||||
Total Dividends and Distributions |
| (0.80) |
|
| — |
| |||
Net Asset Value, End of Period | $10.26 | $10.67 | |||||||
Total Return* |
| 3.50%(4) |
|
| (0.84)% |
| |||
Net Assets, End of Period (in thousands) | $135 | $50 | |||||||
Average Net Assets for the Period (in thousands) | $84 | $50 | |||||||
Ratios to Average Net Assets**: |
|
|
|
|
|
| |||
Ratio of Gross Expenses(5) | 1.78% | 0.99% | |||||||
Ratio of Net Expenses (After Waivers and Expense Offsets)(5) | 0.69% | 0.82% | |||||||
Ratio of Net Investment Income/(Loss)(5) | 1.43% | 3.58% | |||||||
Portfolio Turnover Rate | 16% | 55% | |||||||
* Total return not annualized for periods of less than one full year. ** Annualized for periods of less than one full year. (1) Period from June 5, 2017 (inception date) through June 30, 2017. (2) Per share amounts are calculated based on average shares outstanding during the year or period. (3) This amount does not agree with the change in the aggregate gains and losses in the Fund’s securities for the year or period due to the timing of sales and repurchases of the Fund’s shares in relation to fluctuating market values for the Fund’s securities. (4) The return includes adjustments in accordance with generally accepted accounting principles required at period end date. (5) Ratios do not include indirect expenses of the underlying funds and/or investment companies in which the Fund invests. |
See Notes to Financial Statements. | |
24 | JUNE 30, 2018 |
Janus Henderson All Asset Fund
Notes to Financial Statements
1. Organization and Significant Accounting Policies
Janus Henderson All Asset Fund (the “Fund”) is a series of Janus Investment Fund (the “Trust”), which is organized as a Massachusetts business trust and is registered under the Investment Company Act of 1940, as amended (the “1940 Act”), as an open-end management investment company, and therefore has applied the specialized accounting and reporting guidance in Financial Accounting Standards Board (“FASB”) Accounting Standards Codification (“ASC”) Topic 946. The Fund operates as a “fund of funds,” meaning substantially all of the Fund’s assets will be invested in other underlying funds (the “underlying funds”). The Trust offers 49 funds, each of which offers multiple share classes, with differing investment objectives and policies. The Fund seeks to provide total return by investing in a broad range of asset classes. The Fund is classified as diversified, as defined in the 1940 Act.
Pursuant to the Agreement and Plan of Reorganization, the Fund acquired all the assets and liabilities of the Henderson All Asset Fund (the “Predecessor Fund”), a series of Henderson Global Funds, in exchange for Class A, Class C, Class I and Class N Fund shares having an aggregate net asset value equal to the value of the aggregate net assets of the same share class of the Predecessor Fund (except that Class R6 Predecessor Fund shares were exchanged for Class N Fund shares) (the “Reorganization”). The Reorganization occurred at the close of business on June 2, 2017.
The Predecessor Fund and the Fund had identical investment objectives and substantially similar investment policies and principal risks. For financial reporting purposes, the Predecessor Fund’s financial and performance history prior to the Reorganization is carried forward and reflected in the Fund’s financial statements and financial highlights.
The last fiscal year end of the Predecessor Fund was July 31, 2016. Subsequent to July 31, 2016, the Fund changed its fiscal year end to June 30, 2017, to reflect the fiscal year end of certain funds of the Trust.
The Fund offers multiple classes of shares in order to meet the needs of various types of investors. Each class represents an interest in the same portfolio of investments. Certain financial intermediaries may not offer all classes of shares. Class D Shares are closed to certain new investors.
Class A Shares and Class C Shares are generally offered through financial intermediary platforms including, but not limited to, traditional brokerage platforms, mutual fund wrap fee programs, bank trust platforms, and retirement platforms.
Class D Shares are generally no longer being made available to new investors who do not already have a direct account with the Janus Henderson funds. Class D Shares are available only to investors who hold accounts directly with the Janus Henderson funds, to immediate family members or members of the same household of an eligible individual investor, and to existing beneficial owners of sole proprietorships or partnerships that hold accounts directly with the Janus Henderson funds.
Class I Shares are available through certain financial intermediary platforms including, but not limited to, mutual fund wrap fee programs, managed account programs, asset allocation programs, bank trust platforms, as well as certain retirement platforms. Class I Shares are also available to certain direct institutional investors including, but not limited to, corporations, certain retirement plans, public plans, and foundations/endowments, who established Class I Share accounts before August 4, 2017.
Class N Shares are generally available only to financial intermediaries purchasing on behalf of: 1) certain adviser-assisted, employer-sponsored retirement plans, including 401(k) plans, 457 plans, 403(b) plans, Taft-Hartley multi-employer plans, profit-sharing and money purchase pension plans, defined benefit plans and certain welfare benefit plans, such as health savings accounts, and nonqualified deferred compensation plans; and 2) retail investors purchasing in qualified or nonqualified accounts, whose accounts are held through an omnibus account at their financial intermediary, and where the financial intermediary requires no payment or reimbursement from the Fund, Janus Capital Management LLC (“Janus Capital”), or its affiliates. Class N Shares are also available to Janus Henderson proprietary products and to certain direct institutional investors approved by Janus Distributors LLC dba Janus Henderson Distributors (“Janus Henderson Distributors”) including, but not limited to, corporations, certain retirement plans, public plans, and foundations and endowments, subject to minimum investment requirements.
Class S Shares are offered through financial intermediary platforms including, but not limited to, retirement platforms and asset allocation, mutual fund wrap, or other discretionary or nondiscretionary fee-based investment advisory programs. In addition, Class S Shares may be available through certain financial intermediaries who have an agreement with Janus Capital or its affiliates to offer Class S Shares on their supermarket platforms.
Janus Investment Fund | 25 |
Janus Henderson All Asset Fund
Notes to Financial Statements
Class T Shares are available through certain financial intermediary platforms including, but not limited to, mutual fund wrap fee programs, managed account programs, asset allocation programs, bank trust platforms, as well as certain retirement platforms. In addition, Class T Shares may be available through certain financial intermediaries who have an agreement with Janus Capital or its affiliates to offer Class T Shares on their supermarket platforms.
Underlying Funds
The Fund may seek exposure to both traditional asset classes (such as equity and fixed-income investments) and alternative asset classes (such as real estate, commodities, currencies, private equity, and absolute return strategies) by investing in other investment companies or investment pools, by investing directly in securities and other investments or through the use of derivatives. Such investment companies and investment pools might include, for example, other open-end or closed-end investment companies (including investment companies that concentrate their investments in one or more industries or economic or market sectors), exchange-traded funds (“ETFs”, which are open-end investment companies whose shares may be bought or sold by investors in transactions on major stock exchanges), unit investment trusts, and domestic or foreign private investment pools (including investment companies not registered under the 1940 Act, such as “hedge funds”) or indexes of investment pools. Additional details and descriptions of the investment objectives and strategies of each of the underlying funds are available in the underlying funds’ prospectuses. The Trustees of the underlying funds may change the investment objectives or strategies of the underlying funds at any time without prior notice to the Fund’s shareholders.
The following accounting policies have been followed by the Fund and are in conformity with accounting principles generally accepted in the United States of America.
Investment Valuation
The Fund’s net asset value (“NAV”) is calculated based upon the NAV of each of the underlying funds in which the Fund invests on the day of valuation. The NAV for each class of the underlying funds is computed by dividing the total value of securities and other assets allocated to the class, less liabilities allocated to that class, by the total number of shares outstanding for the class.
Valuation Inputs Summary
FASB ASC 820, Fair Value Measurements and Disclosures (“ASC 820”), defines fair value, establishes a framework for measuring fair value, and expands disclosure requirements regarding fair value measurements. This standard emphasizes that fair value is a market-based measurement that should be determined based on the assumptions that market participants would use in pricing an asset or liability and establishes a hierarchy that prioritizes inputs to valuation techniques used to measure fair value. These inputs are summarized into three broad levels:
Level 1 – Unadjusted quoted prices in active markets the Fund has the ability to access for identical assets or liabilities.
Level 2 – Observable inputs other than unadjusted quoted prices included in Level 1 that are observable for the asset or liability either directly or indirectly. These inputs may include quoted prices for the identical instrument on an inactive market, prices for similar instruments, interest rates, prepayment speeds, credit risk, yield curves, default rates and similar data.
Assets or liabilities categorized as Level 2 in the hierarchy generally include: debt securities fair valued in accordance with the evaluated bid or ask prices supplied by a pricing service; securities traded on OTC markets and listed securities for which no sales are reported that are fair valued at the latest bid price (or yield equivalent thereof) obtained from one or more dealers transacting in a market for such securities or by a pricing service approved by the Fund’s Trustees; certain short-term debt securities with maturities of 60 days or less that are fair valued at amortized cost; and equity securities of foreign issuers whose fair value is determined by using systematic fair valuation models provided by independent third parties in order to adjust for stale pricing which may occur between the close of certain foreign exchanges and the close of the NYSE. Other securities that may be categorized as Level 2 in the hierarchy include, but are not limited to, preferred stocks, bank loans, swaps, investments in unregistered investment companies, options, and forward contracts.
Level 3 – Unobservable inputs for the asset or liability to the extent that relevant observable inputs are not available, representing the Fund’s own assumptions about the assumptions that a market participant would use in valuing the asset or liability, and that would be based on the best information available.
26 | JUNE 30, 2018 |
Janus Henderson All Asset Fund
Notes to Financial Statements
The Fund classifies each of its investments in the underlying funds without consideration as to the classification level of the specific investments held by the underlying funds.There have been no significant changes in valuation techniques used in valuing any such positions held by the Fund since the beginning of the fiscal year.
The inputs or methodology used for fair valuing securities are not necessarily an indication of the risk associated with investing in those securities. The summary of inputs used as of June 30, 2018 to fair value the Fund’s investments in securities and other financial instruments is included in the “Valuation Inputs Summary” in the Notes to Schedule of Investments and Other Information.
There were no transfers between Level 1, Level 2 and Level 3 of the fair value hierarchy during the year. The Fund recognizes transfers between the levels as of the beginning of the fiscal year.
Investment Transactions and Investment Income
Investment transactions are accounted for as of the date purchased or sold (trade date). Dividend income is recorded on the ex-dividend date. Certain dividends from foreign securities held by the underlying funds will be recorded as soon as the Fund is informed of the dividend, if such information is obtained subsequent to the ex-dividend date. Dividends from foreign securities may be subject to withholding taxes in foreign jurisdictions. Any distributions from the underlying funds are recorded in accordance with the character of the distributions as designated by the underlying funds. Gains and losses are determined on the identified cost basis, which is the same basis used for federal income tax purposes. Income, as well as gains and losses, both realized and unrealized, are allocated daily to each class of shares based upon the ratio of net assets represented by each class as a percentage of total net assets.
Expenses
The Fund bears expenses incurred specifically on its behalf. Additionally, the Fund, as a shareholder in the underlying funds, will also indirectly bear its pro rata share of the expenses incurred by the underlying funds. Each class of shares bears a portion of general expenses, which are allocated daily to each class of shares based upon the ratio of net assets represented by each class as a percentage of total net assets. Expenses directly attributable to a specific class of shares are charged against the operations of such class.
Estimates
The preparation of financial statements in conformity with accounting principles generally accepted in the United States of America requires management to make estimates and assumptions that affect the reported amount of assets and liabilities and disclosure of contingent assets and liabilities at the date of the financial statements, and the reported amounts of income and expenses during the reporting period. Actual results could differ from those estimates.
Indemnifications
In the normal course of business, the Fund may enter into contracts that contain provisions for indemnification of other parties against certain potential liabilities. The Fund’s maximum exposure under these arrangements is unknown, and would involve future claims that may be made against the Fund that have not yet occurred. Currently, the risk of material loss from such claims is considered remote.
Foreign Currency Translations
The Fund does not isolate that portion of the results of operations resulting from the effect of changes in foreign exchange rates on investments from the fluctuations arising from changes in market prices of securities held at the date of the financial statements. Net unrealized appreciation or depreciation of investments and foreign currency translations arise from changes in the value of assets and liabilities, including investments in securities held at the date of the financial statements, resulting from changes in the exchange rates and changes in market prices of securities held.
Currency gains and losses are also calculated on payables and receivables that are denominated in foreign currencies. The payables and receivables are generally related to foreign security transactions and income translations.
Foreign currency-denominated assets and forward currency contracts may involve more risks than domestic transactions, including currency risk, counterparty risk, political and economic risk, regulatory risk and equity risk. Risks may arise from unanticipated movements in the value of foreign currencies relative to the U.S. dollar.
Dividends and Distributions
The Fund generally declares and distributes dividends of net investment income and realized capital gains (if any) annually. The Fund may treat a portion of the amount paid to redeem shares as a distribution of investment company
Janus Investment Fund | 27 |
Janus Henderson All Asset Fund
Notes to Financial Statements
taxable income and realized capital gains that are reflected in the net asset value. This practice, commonly referred to as “equalization,” has no effect on the redeeming shareholder or the Fund’s total return, but may reduce the amounts that would otherwise be required to be paid as taxable dividends to the remaining shareholders. It is possible that the Internal Revenue Service (IRS) could challenge the Fund's equalization methodology or calculations, and any such challenge could result in additional tax, interest, or penalties to be paid by the Fund.
The underlying funds may make certain investments in real estate investment trusts (“REITs”) which pay dividends to their shareholders based upon funds available from operations. It is quite common for these dividends to exceed the REITs’ taxable earnings and profits, resulting in the excess portion of such dividends being designated as a return of capital. If the underlying funds distribute such amounts, such distributions could constitute a return of capital to shareholders for federal income tax purposes.
Federal Income Taxes
The Fund intends to continue to qualify as a regulated investment company and distribute all of its taxable income in accordance with the requirements of Subchapter M of the Internal Revenue Code. Management has analyzed the Fund’s tax positions taken for all open federal income tax years, generally a three-year period, and has concluded that no provision for federal income tax is required in the Fund’s financial statements. The Fund is not aware of any tax positions for which it is reasonably possible that the total amounts of unrecognized tax benefits will significantly change in the next twelve months.
On December 22, 2017, the Tax Cuts and Jobs Act was signed into law. Currently, Management does not believe the bill will have a material impact on the Fund’s intention to continue to qualify as a regulated investment company, which is generally not subject to U.S. federal income tax.
2. Derivative Instruments
The Fund may invest in various types of derivatives, which may at times result in significant derivative exposure. A derivative is a financial instrument whose performance is derived from the performance of another asset. The Fund may invest in derivative instruments including, but not limited to: futures contracts, put options, call options, options on future contracts, options on foreign currencies, options on recovery locks, options on security and commodity indices, swaps, forward contracts, structured investments, and other equity-linked derivatives. Each derivative instrument that was held by the Fund during the year ended June 30, 2018 is discussed in further detail below. A summary of derivative activity by the Fund is reflected in the tables at the end of the Schedule of Investments.
The Fund may use derivative instruments for hedging purposes (to offset risks associated with an investment, currency exposure, or market conditions), to adjust currency exposure relative to a benchmark index, or for speculative purposes (to earn income and seek to enhance returns). When the Fund invests in a derivative for speculative purposes, the Fund will be fully exposed to the risks of loss of that derivative, which may sometimes be greater than the derivative’s cost. The Fund may not use any derivative to gain exposure to an asset or class of assets that it would be prohibited by its investment restrictions from purchasing directly. The Fund’s ability to use derivative instruments may also be limited by tax considerations.
Investments in derivatives in general are subject to market risks that may cause their prices to fluctuate over time. Investments in derivatives may not directly correlate with the price movements of the underlying instrument. As a result, the use of derivatives may expose the Fund to additional risks that it would not be subject to if it invested directly in the securities underlying those derivatives. The use of derivatives may result in larger losses or smaller gains than otherwise would be the case. Derivatives can be volatile and may involve significant risks.
In pursuit of its investment objective, the Fund may seek to use derivatives to increase or decrease exposure to the following market risk factors:
· Commodity Risk – the risk related to the change in value of commodities or commodity-linked investments due to changes in the overall market movements, volatility of the underlying benchmark, changes in interest rates, or other factors affecting a particular industry of commodity such as drought, floods, weather, livestock disease, embargoes, tariffs, and international economic, political, and regulatory developments.
· Counterparty Risk – the risk that the counterparty (the party on the other side of the transaction) on a derivative transaction will be unable to honor its financial obligation to the Fund.
28 | JUNE 30, 2018 |
Janus Henderson All Asset Fund
Notes to Financial Statements
· Credit Risk – the risk an issuer will be unable to make principal and interest payments when due, or will default on its obligations.
· Currency Risk – the risk that changes in the exchange rate between currencies will adversely affect the value (in U.S. dollar terms) of an investment.
· Equity Risk – the risk related to the change in value of equity securities as they relate to increases or decreases in the general market.
· Index Risk – if the derivative is linked to the performance of an index, it will be subject to the risks associated with changes in that index. If the index changes, the Fund could receive lower interest payments or experience a reduction in the value of the derivative to below what the Fund paid. Certain indexed securities, including inverse securities (which move in an opposite direction to the index), may create leverage, to the extent that they increase or decrease in value at a rate that is a multiple of the changes in the applicable index.
· Interest Rate Risk – the risk that the value of fixed-income securities will generally decline as prevailing interest rates rise, which may cause the Fund’s NAV to likewise decrease.
· Leverage Risk – the risk associated with certain types of leveraged investments or trading strategies pursuant to which relatively small market movements may result in large changes in the value of an investment. The Fund creates leverage by investing in instruments, including derivatives, where the investment loss can exceed the original amount invested. Certain investments or trading strategies, such as short sales, that involve leverage can result in losses that greatly exceed the amount originally invested.
· Liquidity Risk – the risk that certain securities may be difficult or impossible to sell at the time that the seller would like or at the price that the seller believes the security is currently worth.
Derivatives may generally be traded OTC or on an exchange. Derivatives traded OTC are agreements that are individually negotiated between parties and can be tailored to meet a purchaser’s needs. OTC derivatives are not guaranteed by a clearing agency and may be subject to increased credit risk.
In an effort to mitigate credit risk associated with derivatives traded OTC, the Fund may enter into collateral agreements with certain counterparties whereby, subject to certain minimum exposure requirements, the Fund may require the counterparty to post collateral if the Fund has a net aggregate unrealized gain on all OTC derivative contracts with a particular counterparty. Additionally, the Fund may deposit cash and/or treasuries as collateral with the counterparty and/or custodian daily (based on the daily valuation of the financial asset) if the Fund has a net aggregate unrealized loss on OTC derivative contracts with a particular counterparty. All liquid securities and restricted cash are considered to cover in an amount at all times equal to or greater than the Fund’s commitment with respect to certain exchange-traded derivatives, centrally cleared derivatives, forward foreign currency exchange contracts, short sales, and/or securities with extended settlement dates. There is no guarantee that counterparty exposure is reduced and these arrangements are dependent on Janus Capital's ability to establish and maintain appropriate systems and trading.
Forward Foreign Currency Exchange Contracts
A forward foreign currency exchange contract (“forward currency contract”) is an obligation to buy or sell a specified currency at a future date at a negotiated rate (which may be U.S. dollars or a foreign currency). The Fund may enter into forward currency contracts for hedging purposes, including, but not limited to, reducing exposure to changes in foreign currency exchange rates on foreign portfolio holdings and locking in the U.S. dollar cost of firm purchase and sale commitments for securities denominated in or exposed to foreign currencies. The Fund may also invest in forward currency contracts for non-hedging purposes such as seeking to enhance returns. The Fund is subject to currency risk and counterparty risk in the normal course of pursuing its investment objective through its investments in forward currency contracts.
Forward currency contracts are valued by converting the foreign value to U.S. dollars by using the current spot U.S. dollar exchange rate and/or forward rate for that currency. Exchange and forward rates as of the close of the NYSE shall be used to value the forward currency contracts. The unrealized appreciation/(depreciation) for forward currency contracts is reported in the Statement of Assets and Liabilities as a receivable or payable and in the Statement of Operations for the change in unrealized net appreciation/depreciation (if applicable). The gain or loss arising from the difference between the U.S. dollar cost of the original contract and the value of the foreign currency in U.S. dollars upon closing a forward currency contract is reported on the Statement of Operations (if applicable).
Janus Investment Fund | 29 |
Janus Henderson All Asset Fund
Notes to Financial Statements
The Fund may enter into forward currency contracts with the obligation to purchase foreign currencies in the future at an agreed upon rate in order to decrease exposure to currency risk associated with foreign currency denominated securities held by the Fund and/or in order to take a positive outlook on the related currency to increase exposure to currency risk.
The Fund may enter into forward currency contracts with the obligation to sell foreign currencies in the future at an agreed upon rate in order to decrease exposure to currency risk associated with foreign currency denominated securities held by the Fund and/or in order to take a negative outlook on the related currency to increase exposure to currency risk.
During the year, the Fund entered into forward currency contracts with the obligation to purchase foreign currencies in the future at an agreed upon rate in order to decrease exposure to currency risk associated with foreign currency denominated securities held by the Fund.
Futures Contracts
A futures contract is an exchange-traded agreement to take or make delivery of an underlying asset at a specific time in the future for a specific predetermined negotiated price. The Fund may enter into futures contracts to gain exposure to the stock market or other markets pending investment of cash balances or to meet liquidity needs. The Fund is subject to interest rate risk, equity risk, and currency risk in the normal course of pursuing its investment objective through its investments in futures contracts. The Fund may also use such derivative instruments to hedge or protect from adverse movements in securities prices, currency rates or interest rates. The use of futures contracts may involve risks such as the possibility of illiquid markets or imperfect correlation between the values of the contracts and the underlying securities, or that the counterparty will fail to perform its obligations.
Futures contracts on commodities are valued at the settlement price on valuation date on the commodities exchange as reported by an approved vendor. Mini contracts, as defined in the description of the contract, shall be valued using the Actual Settlement Price or “ASET” price type as reported by an approved vendor. In the event that foreign futures trade when the foreign equity markets are closed, the last foreign futures trade price shall be used. Futures contracts are marked-to-market daily, and the daily variation margin is recorded as a receivable or payable on the Statement of Assets and Liabilities (if applicable). The change in unrealized net appreciation/depreciation is reported on the Statement of Operations (if applicable). When a contract is closed, a realized gain or loss is reported on the Statement of Operations (if applicable), equal to the difference between the opening and closing value of the contract. Securities held by the Fund that are designated as collateral for market value on futures contracts are noted on the Schedule of Investments (if applicable). Such collateral is in the possession of the Fund’s futures commission merchant.
With futures, there is minimal counterparty credit risk to the Fund since futures are exchange-traded and the exchange’s clearinghouse, as counterparty to all exchange-traded futures, guarantees the futures against default.
The Fund may purchase or sell futures on equity indices to increase or decrease exposure to equity risk.
The Fund may purchase or sell futures on interest rates to increase or decrease exposure to interest rate risk.
3. Other Investments and Strategies
Additional Investment Risk
The financial crisis in both the U.S. and global economies over the past several years has resulted, and may continue to result, in a significant decline in the value and liquidity of many securities of issuers worldwide in the equity and fixed-income/credit markets. In response to the crisis, the United States and certain foreign governments, along with the U.S. Federal Reserve and certain foreign central banks, took steps to support the financial markets. The withdrawal of this support, a failure of measures put in place to respond to the crisis, or investor perception that such efforts were not sufficient could each negatively affect financial markets generally, and the value and liquidity of specific securities. In addition, policy and legislative changes in the United States and in other countries continue to impact many aspects of financial regulation. The effect of these changes on the markets, and the practical implications for market participants, including the Fund, may not be fully known for some time. As a result, it may also be unusually difficult to identify both investment risks and opportunities, which could limit or preclude the Fund’s ability to achieve its investment objective. Therefore, it is important to understand that the value of your investment may fall, sometimes sharply, and you could lose money.
30 | JUNE 30, 2018 |
Janus Henderson All Asset Fund
Notes to Financial Statements
The enactment of the Dodd-Frank Wall Street Reform and Consumer Protection Act (the “Dodd-Frank Act”) of 2010 provided for widespread regulation of financial institutions, consumer financial products and services, broker-dealers, OTC derivatives, investment advisers, credit rating agencies, and mortgage lending, which expanded federal oversight in the financial sector, including the investment management industry. Many provisions of the Dodd-Frank Act remain pending and will be implemented through future rulemaking. Therefore, the ultimate impact of the Dodd-Frank Act and the regulations under the Dodd-Frank Act on the Fund and the investment management industry as a whole, is not yet certain.
A number of countries in the European Union (“EU”) have experienced, and may continue to experience, severe economic and financial difficulties. In particular, many EU nations are susceptible to economic risks associated with high levels of debt, notably due to investments in sovereign debt of countries such as Greece, Italy, Spain, Portugal, and Ireland. Many non-governmental issuers, and even certain governments, have defaulted on, or been forced to restructure, their debts. Many other issuers have faced difficulties obtaining credit or refinancing existing obligations. Financial institutions have in many cases required government or central bank support, have needed to raise capital, and/or have been impaired in their ability to extend credit. As a result, financial markets in the EU experienced extreme volatility and declines in asset values and liquidity. Responses to these financial problems by European governments, central banks, and others, including austerity measures and reforms, may not work, may result in social unrest, and may limit future growth and economic recovery or have other unintended consequences. Further defaults or restructurings by governments and others of their debt could have additional adverse effects on economies, financial markets, and asset valuations around the world. Greece, Ireland, and Portugal have already received one or more "bailouts" from other Eurozone member states, and it is unclear how much additional funding they will require or if additional Eurozone member states will require bailouts in the future. The risk of investing in securities in the European markets may also be heightened due to the referendum in which the United Kingdom voted to exit the EU (known as “Brexit”). There is considerable uncertainty about how Brexit will be conducted, how negotiations of necessary treaties and trade agreements will proceed, or how financial markets will react. In addition, one or more other countries may also abandon the euro and/or withdraw from the EU, placing its currency and banking system in jeopardy.
Certain areas of the world have historically been prone to and economically sensitive to environmental events such as, but not limited to, hurricanes, earthquakes, typhoons, flooding, tidal waves, tsunamis, erupting volcanoes, wildfires or droughts, tornadoes, mudslides, or other weather-related phenomena. Such disasters, and the resulting physical or economic damage, could have a severe and negative impact on the Fund’s investment portfolio and, in the longer term, could impair the ability of issuers in which the Fund invests to conduct their businesses as they would under normal conditions. Adverse weather conditions may also have a particularly significant negative effect on issuers in the agricultural sector and on insurance companies that insure against the impact of natural disasters.
Counterparties
Fund transactions involving a counterparty are subject to the risk that the counterparty or a third party will not fulfill its obligation to the Fund (“counterparty risk”). Counterparty risk may arise because of the counterparty’s financial condition (i.e., financial difficulties, bankruptcy, or insolvency), market activities and developments, or other reasons, whether foreseen or not. A counterparty’s inability to fulfill its obligation may result in significant financial loss to the Fund. The Fund may be unable to recover its investment from the counterparty or may obtain a limited recovery, and/or recovery may be delayed. The extent of the Fund’s exposure to counterparty risk with respect to financial assets and liabilities approximates its carrying value. See the "Offsetting Assets and Liabilities" section of this Note for further details.
The Fund may be exposed to counterparty risk through participation in various programs, including, but not limited to, lending its securities to third parties, cash sweep arrangements whereby the Fund’s cash balance is invested in one or more types of cash management vehicles, as well as investments in, but not limited to, repurchase agreements, debt securities, and derivatives, including various types of swaps, futures and options. The Fund intends to enter into financial transactions with counterparties that Janus Capital believes to be creditworthy at the time of the transaction. There is always the risk that Janus Capital’s analysis of a counterparty’s creditworthiness is incorrect or may change due to market conditions. To the extent that the Fund focuses its transactions with a limited number of counterparties, it will have greater exposure to the risks associated with one or more counterparties.
Exchange-Traded and Mutual Funds
The Fund may invest in exchange-traded funds (“ETFs”) and mutual funds to gain exposure to a particular portion of the market. ETFs are typically open-end investment companies, which may seek to track the performance of a specific index or be actively managed. ETFs are traded on a national securities exchange at market prices that may vary from
Janus Investment Fund | 31 |
Janus Henderson All Asset Fund
Notes to Financial Statements
the net asset value of their underlying investments. Accordingly, there may be times when an ETF trades at a premium or discount. When the Fund invests in an ETF or mutual fund, in addition to directly bearing the expenses associated with its own operations, it will bear a pro rata portion of the ETF's or mutual fund’s expenses. As a result, the cost of investing in the Fund may be higher than the cost of investing directly in ETFs or mutual funds and may be higher than other mutual funds that invest directly in stocks and bonds. ETFs also involve the risk that an active trading market for an ETF's shares may not develop or be maintained. Similarly, because the value of ETF shares depends on the demand in the market, the Fund may not be able to purchase or sell an ETF at the most optimal time, which could adversely affect the Fund’s performance. In addition, ETFs that track particular indices may be unable to match the performance of such underlying indices due to the temporary unavailability of certain index securities in the secondary market or other factors, such as discrepancies with respect to the weighting of securities. Because the Fund may invest in a broad range of ETFs and mutual funds, such risks may include, but are not limited to, leverage risk, foreign exposure risk, interest rate risk, emerging markets risk, fixed-income risk, and commodity-linked investments risk. The Fund is also subject to the risks associated with the securities in which the ETF or mutual fund invests.
Offsetting Assets and Liabilities
The Fund presents gross and net information about transactions that are either offset in the financial statements or subject to an enforceable master netting arrangement or similar agreement with a designated counterparty, regardless of whether the transactions are actually offset in the Statement of Assets and Liabilities.
In order to better define its contractual rights and to secure rights that will help the Fund mitigate its counterparty risk, the Fund has entered into an International Swaps and Derivatives Association, Inc. Master Agreement (“ISDA Master Agreement”) or similar agreement with its derivative contract counterparties. An ISDA Master Agreement is a bilateral agreement between the Fund and a counterparty that governs OTC derivatives and forward foreign currency exchange contracts and typically contains, among other things, collateral posting terms and netting provisions in the event of a default and/or termination event. Under an ISDA Master Agreement, in the event of a default and/or termination event, the Fund may offset with each counterparty certain derivative financial instruments’ payables and/or receivables with collateral held and/or posted and create one single net payment. For financial reporting purposes, the Fund does not offset certain derivative financial instruments’ payables and receivables and related collateral on the Statement of Assets and Liabilities.
The following table presents gross amounts of recognized assets and/or liabilities and the net amounts after deducting collateral that has been pledged by counterparties or has been pledged to counterparties (if applicable). For corresponding information grouped by type of instrument, see the “Fair Value of Derivative Instruments (not accounted for as hedging instruments) as of June 30, 2018” table located in the Fund’s Schedule of Investments.
Offsetting of Financial Assets and Derivative Assets | |||||||||
Gross Amounts | |||||||||
of Recognized | Offsetting Asset | Collateral | |||||||
Counterparty | Assets | or Liability(a) | Pledged(b) | Net Amount | |||||
BNP Paribas | $ | 9,265 | $ | (9,265) | $ | — | $ | — | |
Offsetting of Financial Liabilities and Derivative Liabilities | |||||||||
Gross Amounts | |||||||||
of Recognized | Offsetting Asset | Collateral | |||||||
Counterparty | Liabilities | or Liability(a) | Pledged(b) | Net Amount | |||||
BNP Paribas | $ | 17,691 | $ | (9,265) | $ | — | $ | 8,426 | |
(a) | Represents the amount of assets or liabilities that could be offset with the same counterparty under master netting or similar agreements that management elects not to offset on the Statement of Assets and Liabilities. | ||||||||
(b) | Collateral pledged is limited to the net outstanding amount due to/from an individual counterparty. The actual collateral amounts pledged may exceed these amounts and may fluctuate in value. | ||||||||
The Fund generally does not exchange collateral on its forward foreign currency contracts with its counterparties; however, all liquid securities and restricted cash are considered to cover in an amount at all times equal to or greater than the Fund’s commitment with respect to these contracts. Certain securities may be segregated at the Fund’s
32 | JUNE 30, 2018 |
Janus Henderson All Asset Fund
Notes to Financial Statements
custodian. These segregated securities are denoted on the accompanying Schedule of Investments and are evaluated daily to ensure their cover and/or market value equals or exceeds the Fund’s corresponding forward foreign currency exchange contract's obligation value.
4. Investment Advisory Agreements and Other Transactions with Affiliates
The Fund pays Janus Capital an investment advisory fee which is calculated daily and paid monthly. The Fund’s contractual investment advisory fee rate (expressed as an annual rate) is 0.40% of its average daily net assets.
Effective December 31, 2017, the Fund’s subadvisory agreement with Henderson Investment Management Limited (“HIML”) was terminated. HIML served as subadviser to the Fund. As subadviser, HIML provided day-to-day management of the investment operations of the Fund subject to the general oversight of the Board of Trustees and Janus Capital. HIML was an affiliate of Janus Capital through a common parent company.
Janus Capital paid HIML a subadvisory fee rate equal to 50% of the investment advisory fee paid by the Fund to Janus Capital (net of any fee waivers and expense reimbursements).
Janus Capital has entered into a personnel-sharing arrangement with its foreign (non-U.S.) affiliates, Henderson Global Investors Limited, Henderson Global Investors (Japan) Ltd., and Henderson Global Investors (Singapore) Ltd. (collectively, “HGIL”), pursuant to which HGIL and certain employees of HGIL serve as “associated persons” of Janus Capital. In this capacity, such employees of HGIL are subject to the oversight and supervision of Janus Capital and may provide portfolio management, research, and related services to the Fund on behalf of Janus Capital.
Janus Capital has contractually agreed to waive the investment advisory fee and/or reimburse operating expenses to the extent that the Fund’s total annual fund operating expenses but excluding the 12b-1 distribution and shareholder servicing fees (applicable to Class A Shares, Class C Shares, and Class S Shares) such as transfer agency fees (including out-of-pocket costs), administrative services fees, and any networking/omnibus/administrative fees payable by any share class, brokerage commissions, interest, dividends, taxes, acquired fund fees and expenses, and extraordinary expenses) exceed the annual rate of 0.51% of the Fund’s average daily net assets. Janus Capital has agreed to continue the waiver until November 1, 2018. Class R shares, If applicable, amounts waived and/or reimbursed to the Fund by Janus Capital are disclosed as “Excess Expense Reimbursement and Waivers” on the Statement of Operations.
Janus Services LLC (“Janus Services”), a wholly-owned subsidiary of Janus Capital, is the Fund’s and the underlying funds’ transfer agent. In addition, Janus Services provides or arranges for the provision of certain other administrative services including, but not limited to, recordkeeping, accounting, order processing, and other shareholder services for the Fund. Janus Services is not compensated for its services related to the shares, except for out-of-pocket costs. These amounts are disclosed as “Other transfer agent fees and expenses” on the Statement of Operations.
Certain, but not all, intermediaries may charge administrative fees (such as networking and omnibus) to investors in Class A Shares, Class C Shares, and Class I Shares for administrative services provided on behalf of such investors. These administrative fees are paid by the Class A Shares, Class C Shares, and Class I Shares of the Fund to Janus Services, which uses such fees to reimburse intermediaries. Consistent with the Transfer Agency Agreement between Janus Services and the Fund, Janus Services may negotiate the level, structure, and/or terms of the administrative fees with intermediaries requiring such fees on behalf of the Fund. Janus Capital and its affiliates benefit from an increase in assets that may result from such relationships. The Funds’ Trustees have set limits on fees that the Funds may incur with respect to administrative fees paid for omnibus or networked accounts. Such limits are subject to change by the Trustees in the future. These amounts are disclosed as “Transfer agent networking and omnibus fees” on the Statement of Operations.
The Fund’s Class D Shares pay an administrative services fee at an annual rate of 0.12% of the average daily net assets of Class D Shares for shareholder services provided by Janus Services. Janus Services provides or arranges for the provision of shareholder services including, but not limited to, recordkeeping, accounting, answering inquiries regarding accounts, transaction processing, transaction confirmations, and the mailing of prospectuses and shareholder reports. These amounts are disclosed as “Transfer agent administrative fees and expenses” on the Statement of Operations.
Janus Services receives an administrative services fee at an annual rate of up to 0.25% of the average daily net assets of the Fund’s Class S Shares and Class T Shares for providing or procuring administrative services to investors in Class
Janus Investment Fund | 33 |
Janus Henderson All Asset Fund
Notes to Financial Statements
S Shares and Class T Shares of the Fund. Janus Services expects to use all or a significant portion of this fee to compensate retirement plan service providers, broker-dealers, bank trust departments, financial advisors, and other financial intermediaries for providing these services. Janus Services or its affiliates may also pay fees for services provided by intermediaries to the extent the fees charged by intermediaries exceed the 0.25% of net assets charged to Class S Shares and Class T Shares of the Fund. Janus Services may keep certain amounts retained for reimbursement of out-of-pocket costs incurred for servicing clients of Class S Shares and Class T Shares. These amounts are disclosed as “Transfer agent administrative fees and expenses” on the Statement of Operations.
Services provided by these financial intermediaries may include, but are not limited to, recordkeeping, subaccounting, order processing, providing order confirmations, periodic statements, forwarding prospectuses, shareholder reports, and other materials to existing customers, answering inquiries regarding accounts, and other administrative services. Order processing includes the submission of transactions through the National Securities Clearing Corporation (“NSCC”) or similar systems, or those processed on a manual basis with Janus Capital. For all share classes except Class D Shares, Janus Services also seeks reimbursement for costs it incurs as transfer agent and for providing servicing.
Janus Services is compensated for its services related to the Fund’s Class D Shares. In addition to the administrative fees discussed above, Janus Services receives reimbursement for out-of-pocket costs it incurs for serving as transfer agent and providing, or arranging for, servicing to shareholders. These amounts are disclosed as “Other transfer agent fees and expenses” on the Statement of Operations.
Under a distribution and shareholder servicing plan (the “Plan”) adopted in accordance with Rule 12b-1 under the 1940 Act, the Fund pays the Trust’s distributor, Janus Henderson Distributors, a wholly-owned subsidiary of Janus Capital, a fee for the sale and distribution and/or shareholder servicing of the Shares at an annual rate of up to 0.25% of the Class A Shares’ average daily net assets, of up to 1.00% of the Class C Shares’ average daily net assets and of up to 0.25% of the Class S Shares’ average daily net assets. Under the terms of the Plan, the Trust is authorized to make payments to Janus Henderson Distributors for remittance to retirement plan service providers, broker-dealers, bank trust departments, financial advisors, and other financial intermediaries, as compensation for distribution and/or shareholder services performed by such entities for their customers who are investors in the Fund. These amounts are disclosed as “12b-1 Distribution and shareholder servicing fees” on the Statement of Operations. Payments under the Plan are not tied exclusively to actual 12b-1 distribution and shareholder service expenses, and the payments may exceed 12b-1 distribution and shareholder service expenses actually incurred. If any of the Fund’s actual 12b-1 distribution and shareholder service expenses incurred during a calendar year are less than the payments made during a calendar year, the Fund will be refunded the difference. Refunds, if any, are included in “12b-1 Distribution fees and shareholder servicing fees” in the Statement of Operations.
Janus Capital serves as administrator to the Fund pursuant to an administration agreement between Janus Capital and the Trust. Under the administration agreement, Janus Capital provides oversight and coordination of the Fund’s service providers, recordkeeping, and other administrative services, and is reimbursed by the Fund for certain of its costs in providing these services (to the extent Janus Capital seeks reimbursement and such costs are not otherwise waived). In addition, employees of Janus Capital and/or its affiliates may serve as officers of the Trust. The Fund pays for some or all of the salaries, fees, and expenses of Janus Capital employees and Fund officers, with respect to certain specified administration functions they perform on behalf of the Fund. The Fund pays these costs based on out-of-pocket expenses incurred by Janus Capital, and these costs are separate and apart from advisory fees and other expenses paid in connection with the investment advisory services Janus Capital (or any subadvisor, as applicable) provides to the Fund. These amounts are disclosed as “Affiliated Fund administration fees” on the Statement of Operations. In addition, some expenses related to compensation payable to the Fund’s Chief Compliance Officer and certain compliance staff, all of whom are employees of Janus Capital and/or its affiliates, are shared with the Fund. Total compensation of $476,345 was paid to the Chief Compliance Officer and certain compliance staff by the Trust during the year ended June 30, 2018. The Fund's portion is reported as part of “Other expenses” on the Statement of Operations.
Effective April 1, 2018, BNP Paribas Financial Services (“BPFS”) provides certain administrative services to the Fund, including services related to Fund accounting, calculation of the Fund’s daily NAV, and Fund audit, tax, and reporting obligations, pursuant to a sub-administration agreement with Janus Capital on behalf of the Fund. As compensation for such services, Janus Capital pays BPFS a fee based on a percentage of the Fund’s assets, along with a flat fee, and is reimbursed by the Fund for amounts paid to BPFS (to the extent Janus Capital seeks reimbursement and such costs are not otherwise waived). These amounts are disclosed as “Non-affiliated fund administration fees” on the Statement of Operations.
34 | JUNE 30, 2018 |
Janus Henderson All Asset Fund
Notes to Financial Statements
The Board of Trustees has adopted a deferred compensation plan (the “Deferred Plan”) for independent Trustees to elect to defer receipt of all or a portion of the annual compensation they are entitled to receive from the Fund. All deferred fees are credited to an account established in the name of the Trustees. The amounts credited to the account then increase or decrease, as the case may be, in accordance with the performance of one or more of the Janus Henderson funds that are selected by the Trustees. The account balance continues to fluctuate in accordance with the performance of the selected fund or funds until final payment of all amounts are credited to the account. The fluctuation of the account balance is recorded by the Fund as unrealized appreciation/(depreciation) and is included as of June 30, 2018 on the Statement of Assets and Liabilities in the asset, “Non-interested Trustees’ deferred compensation,” and liability, “Non-interested Trustees’ deferred compensation fees.” Additionally, the recorded unrealized appreciation/(depreciation) is included in “Unrealized net appreciation/(depreciation) of investments, foreign currency translations and non-interested Trustees’ deferred compensation” on the Statement of Assets and Liabilities. Deferred compensation expenses for the year ended June 30, 2018 are included in “Non-interested Trustees’ fees and expenses” on the Statement of Operations. Trustees are allowed to change their designation of mutual funds from time to time. Amounts will be deferred until distributed in accordance with the Deferred Plan. Deferred fees of $471,025 were paid by the Trust to the Trustees under the Deferred Plan during the year ended June 30, 2018.
Any purchases and sales, realized gains/losses and recorded dividends from affiliated investments during the year ended June 30, 2018 can be found in a table located in the Schedule of Investments and Other Information.
Class A Shares include a 5.75% upfront sales charge of the offering price of the Fund. The sales charge is allocated between Janus Henderson Distributors and financial intermediaries. During the year ended June 30, 2018, Janus Henderson Distributors retained upfront sales charges of $3,240.
A contingent deferred sales charge (“CDSC”) of 1.00% will be deducted with respect to Class A Shares purchased without a sales load and redeemed within 12 months of purchase, unless waived. Any applicable CDSC will be 1.00% of the lesser of the original purchase price or the value of the redemption of the Class A Shares redeemed. During the year ended June 30, 2018, redeeming shareholders of Class A Shares paid CDSCs of $2 to Janus Henderson Distributors.
A CDSC of 1.00% will be deducted with respect to Class C Shares redeemed within 12 months of purchase, unless waived. Any applicable CDSC will be 1.00% of the lesser of the original purchase price or the value of the redemption of the Class C Shares redeemed. During the year ended June 30, 2018, redeeming shareholders of Class C Shares paid CDSCs of $643.
As of June 30, 2018, shares of the Fund were owned by affiliates of Janus Henderson Investors, and/or other funds advised by Janus Henderson, as indicated in the table below:
Class | % of Class Owned |
| % of Fund Owned |
| ||
Class A Shares | - | %* | - | %* | ||
Class C Shares | -* | -* | ||||
Class D Shares | 5 | -* | ||||
Class I Shares | -* | -* | ||||
Class N Shares | -* | -* | ||||
Class S Shares | 100 | -* | ||||
Class T Shares | 38 | -* | ||||
* | Less than 0.50% | |||||
Janus Investment Fund | 35 |
Janus Henderson All Asset Fund
Notes to Financial Statements
In addition, other shareholders, including other funds, individuals, accounts, as well as the Fund’s portfolio manager(s) and/or investment personnel, may from time to time own (beneficially or of record) a significant percentage of the Fund’s Shares and can be considered to “control” the Fund when that ownership exceeds 25% of the Fund’s assets (and which may differ from control as determined in accordance with accounting principles generally accepted in the United States of America).
5. Federal Income Tax
The tax components of capital shown in the table below represent: (1) distribution requirements the Fund must satisfy under the income tax regulations; (2) losses or deductions the Fund may be able to offset against income and gains realized in future years; and (3) unrealized appreciation or depreciation of investments for federal income tax purposes.
Other book to tax differences primarily consist of deferred compensation, derivatives, and foreign currency contract adjustments. The Fund has elected to treat gains and losses on forward foreign currency contracts as capital gains and losses, if applicable. Other foreign currency gains and losses on debt instruments are treated as ordinary income for federal income tax purposes pursuant to Section 988 of the Internal Revenue Code.
Loss Deferrals | Other Book | Net Tax | |||||
Undistributed | Undistributed
| Accumulated | Late-Year | Post-October | to Tax | Appreciation/ | |
$ 1,079,300 | $ 77,745 | $ - | $ - | $ - | $ (32,953) | $ (147,601) | |
The aggregate cost of investments and the composition of unrealized appreciation and depreciation of investment securities for federal income tax purposes as of June 30, 2018 are noted below. The primary differences between book and tax appreciation or depreciation of investments are wash sale loss deferrals and investments in partnerships.
Federal Tax Cost | Unrealized | Unrealized
| Net Tax Appreciation/ |
$ 47,863,831 | $ 627,073 | $ (774,674) | $ (147,601) |
Information on the tax components of derivatives as of June 30, 2018 is as follows:
Federal Tax Cost | Unrealized | Unrealized | Net
Tax Appreciation/ |
$ 130,306 | $ 869 | $ (30,488) | $ (29,619) |
Tax cost of investments and unrealized appreciation/(depreciation) may also include timing differences that do not constitute adjustments to tax basis.
Income and capital gains distributions are determined in accordance with income tax regulations that may differ from accounting principles generally accepted in the United States of America. These differences are due to differing treatments for items such as net short-term gains, deferral of wash sale losses, foreign currency transactions, net investment losses, and capital loss carryovers. Certain permanent differences such as tax returns of capital and net investment losses noted below have been reclassified to capital.
For the year ended June 30, 2018 | ||||
Distributions | ||||
From Ordinary Income | From Long-Term Capital Gains | Tax Return of Capital | Net Investment Loss | |
$ 2,151,602 | $ 1,412,522 | $ - | $ - | |
36 | JUNE 30, 2018 |
Janus Henderson All Asset Fund
Notes to Financial Statements
For the period ended June 30, 2017 | ||||
Distributions | ||||
From Ordinary Income | From Long-Term Capital Gains | Tax Return of Capital | Net Investment Loss | |
$ 309,879 | $ - | $ - | $ - | |
For the year ended July 31, 2016 | ||||
Distributions | ||||
From Ordinary Income | From Long-Term Capital Gains | Tax Return of Capital | Net Investment Loss | |
$ 1,377,424 | $ 700,399 | $ - | $ - | |
Permanent book to tax basis differences may result in reclassifications between the components of net assets. These differences have no impact on the results of operations or net assets. The following reclassifications have been made to the Fund:
Increase/(Decrease) to Capital | Increase/(Decrease)
to Undistributed | Increase/(Decrease) to Undistributed
|
$ - | $ 232,002 | $ (232,002) |
Janus Investment Fund | 37 |
Janus Henderson All Asset Fund
Notes to Financial Statements
6. Capital Share Transactions
Year ended June 30, 2018 | Period ended June 30, 2017(1) | |||||
Shares | Amount | Shares | Amount | |||
Class A Shares: | ||||||
Shares sold | 48,201 | $ 525,233 | 48,061 | $ 489,973 | ||
Reinvested dividends and distributions | 12,312 | 129,155 | 926 | 9,384 | ||
Shares repurchased | (73,546) | (792,215) | (271,215) | (2,811,933) | ||
Net Increase/(Decrease) | (13,033) | $ (137,827) |
| (222,228) | $(2,312,576) | |
Class C Shares: | ||||||
Shares sold | 97,146 | $ 1,023,851 | 272,453 | $ 2,717,264 | ||
Reinvested dividends and distributions | 35,136 | 362,603 | - | - | ||
Shares repurchased | (179,801) | (1,889,201) | (441,397) | (4,449,811) | ||
Net Increase/(Decrease) | (47,519) | $ (502,747) |
| (168,944) | $(1,732,547) | |
Class D Shares: | ||||||
Shares sold | 81,664 | $ 885,173 | 7,406 | $ 79,738 | ||
Reinvested dividends and distributions | 4,981 | 51,957 | - | - | ||
Shares repurchased | (2,604) | (27,082) | - | - | ||
Net Increase/(Decrease) | 84,041 | $ 910,048 |
| 7,406 | $ 79,738 | |
Class I Shares: | ||||||
Shares sold | 80,322 | $ 867,578 | 220,782 | $ 2,264,674 | ||
Reinvested dividends and distributions | 51,183 | 533,836 | 5,108 | 51,538 | ||
Shares repurchased | (229,868) | (2,429,934) | (602,702) | (6,161,871) | ||
Net Increase/(Decrease) | (98,363) | $(1,028,520) |
| (376,812) | $(3,845,659) | |
Class N Shares: | ||||||
Shares sold | - | $ - | 4,417 | $ 44,259 | ||
Reinvested dividends and distributions | 227,336 | 2,364,293 | 23,932 | 240,992 | ||
Shares repurchased | - | - | (13,373) | (135,976) | ||
Net Increase/(Decrease) | 227,336 | $ 2,364,293 |
| 14,976 | $ 149,275 | |
Class S Shares: | ||||||
Shares sold | - | $ - | 4,644 | $ 50,010 | ||
Reinvested dividends and distributions | 347 | 3,631 | - | - | ||
Shares repurchased | - | - | - | - | ||
Net Increase/(Decrease) | 347 | $ 3,631 |
| 4,644 | $ 50,010 | |
Class T Shares: | ||||||
Shares sold | 8,479 | $ 88,275 | 4,644 | $ 50,010 | ||
Reinvested dividends and distributions | 330 | 3,700 | - | - | ||
Shares repurchased | (331) | (3,711) | - | - | ||
Net Increase/(Decrease) | 8,478 | $ 88,264 |
| 4,644 | $ 50,010 | |
(1) | Period from June 5, 2017 (inception date) through June 30, 2017 for Class D Shares, Class S Shares and Class T Shares. | |||||
38 | JUNE 30, 2018 |
Janus Henderson All Asset Fund
Notes to Financial Statements
Year ended July 31, 2016(1) | Shares | Amount | |
Class A Shares: | |||
Shares sold | 242,349 | $ 2,389,247 | |
Reinvested dividends and distributions | 17,076 | 168,932 | |
Shares repurchased | (469,446) | (4,623,264) | |
Net Increase/(Decrease) | (210,021) | $ (2,065,085) | |
Class C Shares: | |||
Shares sold | 328,077 | $ 3,171,463 | |
Reinvested dividends and distributions | 26,511 | 257,689 | |
Shares repurchased | (464,349) | (4,525,561) | |
Net Increase/(Decrease) | (109,761) | $ (1,096,409) | |
Class I Shares: | |||
Shares sold | 270,034 | $ 2,652,602 | |
Reinvested dividends and distributions | 51,382 | 507,864 | |
Shares repurchased | (3,460,698) | (35,215,253) | |
Net Increase/(Decrease) | (3,139,282) | $(32,054,787) | |
Class N Shares: | |||
Shares sold | 2,765,534 | $ 28,346,633 | |
Reinvested dividends and distributions | 110,490 | 1,090,787 | |
Shares repurchased | (966) | (8,927) | |
Net Increase/(Decrease) | 2,875,058 | $ 29,428,493 | |
(1) | Period from November 30, 2015 (inception date) through July 31, 2016 for Class N Shares. | ||
7. Purchases and Sales of Investment Securities
For the year ended June 30, 2018, the aggregate cost of purchases and proceeds from sales of investment securities (excluding any short-term securities, short-term options contracts, TBAs, and in-kind transactions, as applicable) was as follows:
Purchases of | Proceeds from Sales | Purchases of Long- | Proceeds from Sales |
$ 4,743,625 | $ 8,792,405 | $ - | $ - |
8. Recent Accounting Pronouncements
The Securities and Exchange Commission ("SEC") adopted new rules as well as amendments to its rules to modernize the reporting and disclosure of information by registered investment companies. In addition, the SEC adopted amendments to Regulation S-X, which require standardized, enhanced disclosure about derivatives in investment company financial statements, as well as other amendments. The compliance date of the amendments to Regulation S-X was August 1, 2017. This report incorporates the amendments to Regulation S-X.
The FASB issued Accounting Standards Update No. 2017-08, Receivables – Nonrefundable Fees and Other Costs (Subtopic 310-20), Premium Amortization on Purchased Callable Debt Securities ("ASU 2017-08") to amend the amortization period for certain purchased callable debt securities held at a premium. The guidance requires certain premiums on callable debt securities to be amortized to the earliest call date. The amortization period for callable debt securities purchased at a discount will not be impacted. The amendments are effective for fiscal years, and interim periods within those fiscal years, beginning after December 15, 2018. Early adoption is permitted, including adoption in an interim period. Management is currently evaluating the impacts of ASU 2017-08 on the financial statements.
Janus Investment Fund | 39 |
Janus Henderson All Asset Fund
Notes to Financial Statements
9. Subsequent Event
Management has evaluated whether any events or transactions occurred subsequent to June 30, 2018 and through the date of issuance of the Fund’s financial statements and determined that there were no material events or transactions that would require recognition or disclosure in the Fund’s financial statements other than the following:.
The Board of Trustees of the Trust has approved plan to liquidate and terminate the Fund with such liquidation effective on or about December 31, 2018, or at such other time as may be authorized by the Board of Trustees ("Liquidation Date"). Termination of the Fund is expected to occur as soon as practicable following the Liquidation Date.
40 | JUNE 30, 2018 |
Janus Henderson All Asset Fund
Report of Independent Registered Public Accounting Firm
To the Board of Trustees of Janus Investment Fund and Shareholders of Janus Henderson All Asset Fund:
Opinion on the Financial Statements
We have audited the accompanying statement of assets and liabilities, including the schedule of investments, of Janus Henderson All Asset Fund (one of the funds constituting Janus Investment Fund, referred to hereafter as the "Fund") as of June 30, 2018, the related statement of operations for the year ended June 30, 2018, the statements of changes in net assets for the year ended June 30, 2018 and for the period from August 1, 2016 through June 30, 2017, including the related notes, and the financial highlights for each of the periods indicated therein beginning on or after August 1, 2016 (collectively referred to as the “financial statements”). In our opinion, the financial statements present fairly, in all material respects, the financial position of the Fund as of June 30, 2018, the results of its operations for the year then ended, the changes in its net assets for the year ended June 30, 2018 and for the period from August 1, 2016 through June 30, 2017 and the financial highlights for each of the periods indicated therein beginning on or after August 1, 2016 in conformity with accounting principles generally accepted in the United States of America.
The financial statements of the Fund as of and for the year ended July 31, 2016, and the financial highlights for each of the periods ended on or prior to July 31, 2016 (not presented herein, other than the statements of changes in net assets and the financial highlights) were audited by other auditors whose report dated September 23, 2016 expressed an unqualified opinion on those financial statements and financial highlights.
Basis for Opinion
These financial statements are the responsibility of the Fund’s management. Our responsibility is to express an opinion on the Fund’s financial statements based on our audits. We are a public accounting firm registered with the Public Company Accounting Oversight Board (United States) (“PCAOB”) and are required to be independent with respect to the Fund in accordance with the U.S. federal securities laws and the applicable rules and regulations of the Securities and Exchange Commission and the PCAOB.
We conducted our audits of these financial statements in accordance with the standards of the PCAOB. Those standards require that we plan and perform the audit to obtain reasonable assurance about whether the financial statements are free of material misstatement, whether due to error or fraud.
Our audits included performing procedures to assess the risks of material misstatement of the financial statements, whether due to error or fraud, and performing procedures that respond to those risks. Such procedures included examining, on a test basis, evidence regarding the amounts and disclosures in the financial statements. Our audits also included evaluating the accounting principles used and significant estimates made by management, as well as evaluating the overall presentation of the financial statements. Our procedures included confirmation of securities owned as of June 30, 2018 by correspondence with the custodian and brokers; when replies were not received from brokers, we performed other auditing procedures. We believe that our audits provide a reasonable basis for our opinion.

Denver, Colorado
August 17, 2018
We have served as the auditor of one or more investment companies in Janus Henderson Funds since 1990.
Janus Investment Fund | 41 |
Janus Henderson All Asset Fund
Additional Information (unaudited)
Proxy Voting Policies and Voting Record
A description of the policies and procedures that the Fund uses to determine how to vote proxies relating to its portfolio securities is available without charge: (i) upon request, by calling 1-800-525-1093; (ii) on the Fund’s website at janushenderson.com/proxyvoting; and (iii) on the SEC’s website at http://www.sec.gov. Additionally, information regarding the Fund’s proxy voting record for the most recent twelve-month period ended June 30 is also available, free of charge, through janushenderson.com/proxyvoting and from the SEC’s website at http://www.sec.gov.
Full Holdings
The Fund is required to disclose its complete holdings on Form N-Q within 60 days of the end of the first and third fiscal quarters, and in the annual report and semiannual report to Fund shareholders. These reports (i) are available on the SEC’s website at http://www.sec.gov; (ii) may be reviewed and copied at the SEC’s Public Reference Room in Washington, D.C. (information on the Public Reference Room may be obtained by calling 1-800-SEC-0330); and (iii) are available without charge, upon request, by calling a Janus Henderson representative at 1-877-335-2687 (toll free) (or 1-800-525-3713 if you hold Class D shares). Portfolio holdings consisting of at least the names of the holdings are generally available on a monthly basis with a 30-day lag. Holdings are generally posted approximately two business days thereafter under Full Holdings for the Fund at janushenderson.com/info (or janushenderson.com/reports if you hold Class D Shares).
APPROVAL OF ADVISORY AGREEMENTS DURING THE PERIOD
The Trustees of Janus Investment Fund and Janus Aspen Series, each of whom serves as an “independent” Trustee (the “Trustees”), oversee the management of each Fund of Janus Investment Fund and each Portfolio of Janus Aspen Series (each, a “Fund” and collectively, the “Funds”), and as required by law, determine annually whether to continue the investment advisory agreement for each Fund and the subadvisory agreements for the 14 Funds that utilize subadvisers.
In connection with their most recent consideration of those agreements for each Fund, the Trustees received and reviewed information provided by Janus Capital and the respective subadvisers in response to requests of the Trustees and their independent legal counsel. They also received and reviewed information and analysis provided by, and in response to requests of, their independent fee consultant. Throughout their consideration of the agreements, the Trustees were advised by their independent legal counsel. The Trustees met with management to consider the agreements, and also met separately in executive session with their independent legal counsel and their independent fee consultant.
Additionally, in connection with their consideration of whether to continue the investment advisory agreement and subadvisory agreement for each Fund, as applicable, the Trustees also received and reviewed information in connection with the transaction to combine the respective businesses of Henderson Group plc and Janus Capital Group, Inc., the parent company of Janus Capital (the “Transaction”), announced in October 2016, which closed in the second quarter of 2017. In this regard, the Trustees reviewed information regarding the impact of the Transaction on the services to be provided by Janus Capital and each subadviser, as applicable, to the Funds under such agreements prior to the close of the Transaction as well as the services provided after the Transaction closed.
At a meeting held on December 7, 2017, based on the Trustees’ evaluation of the information provided by Janus Capital, the subadvisers, and the independent fee consultant, as well as other information, the Trustees determined that the overall arrangements between each Fund and Janus Capital and each subadviser, as applicable, were fair and reasonable in light of the nature, extent and quality of the services provided by Janus Capital, its affiliates and the subadvisers, the fees charged for those services, and other matters that the Trustees considered relevant in the exercise of their business judgment. At that meeting, the Trustees unanimously approved the continuation of the investment advisory agreement for each Fund, and the subadvisory agreement for each subadvised Fund, for the period from February 1, 2018 through February 1, 2019, subject to earlier termination as provided for in each agreement.
In considering the continuation of those agreements, the Trustees reviewed and analyzed various factors that they determined were relevant, including the factors described below, none of which by itself was considered dispositive. However, the material factors and conclusions that formed the basis for the Trustees’ determination to approve the continuation of the agreements are discussed separately below. Also included is a summary of the independent fee consultant’s conclusions and opinions that arose during, and were included as part of, the Trustees’ consideration of the
42 | JUNE 30, 2018 |
Janus Henderson All Asset Fund
Additional Information (unaudited)
agreements. “Management fees,” as used herein, reflect actual annual advisory fees and any administration fees (excluding out of pocket costs), net of any waivers.
Nature, Extent and Quality of Services
The Trustees reviewed the nature, extent and quality of the services provided by Janus Capital and the subadvisers to the Funds, taking into account the investment objective, strategies and policies of each Fund, and the knowledge the Trustees gained from their regular meetings with management on at least a quarterly basis and their ongoing review of information related to the Funds. In addition, the Trustees reviewed the resources and key personnel of Janus Capital and each subadviser, particularly noting those employees who provide investment and risk management services to the Funds. The Trustees also considered other services provided to the Funds by Janus Capital or the subadvisers, such as managing the execution of portfolio transactions and the selection of broker-dealers for those transactions. The Trustees considered Janus Capital’s role as administrator to the Funds, noting that Janus Capital does not receive a fee for its services but is reimbursed for its out-of-pocket costs. The Trustees considered the role of Janus Capital in monitoring adherence to the Funds’ investment restrictions, providing support services for the Trustees and Trustee committees, and overseeing communications with shareholders and the activities of other service providers, including monitoring compliance with various policies and procedures of the Funds and with applicable securities laws and regulations.
In this regard, the independent fee consultant noted that Janus Capital provides a number of different services for the Funds and Fund shareholders, ranging from investment management services to various other servicing functions, and that, in its opinion, Janus Capital is a capable provider of those services. The independent fee consultant also provided its belief that Janus Capital has developed a number of institutional competitive advantages that should enable it to provide superior investment and service performance over the long term.
The Trustees concluded that the nature, extent and quality of the services provided by Janus Capital or the subadviser to each Fund were appropriate and consistent with the terms of the respective advisory and subadvisory agreements, and that, taking into account steps taken to address those Funds whose performance lagged that of their peers for certain periods, the Funds were likely to benefit from the continued provision of those services. They also concluded that Janus Capital and each subadviser had sufficient personnel, with the appropriate education and experience, to serve the Funds effectively and had demonstrated its ability to attract well-qualified personnel.
Performance of the Funds
The Trustees considered the performance results of each Fund over various time periods. They noted that they considered Fund performance data throughout the year, including periodic meetings with each Fund’s portfolio manager(s), and also reviewed information comparing each Fund’s performance with the performance of comparable funds and peer groups identified by Broadridge Financial Solutions, Inc. (“Broadridge”), an independent data provider, and with the Fund’s benchmark index. In this regard, the independent fee consultant found that the overall Funds’ performance has been strong: for the 36 months ended September 30, 2017, approximately 70% of the Funds were in the top two quartiles of performance, as reported by Morningstar, and for the 12 months ended September 30, 2017, approximately 46% of the Funds were in the top two quartiles of performance, as reported by Morningstar.
The Trustees considered the performance of each Fund, noting that performance may vary by share class, and noted the following:
Alternative Funds
· For Janus Henderson Diversified Alternatives Fund, the Trustees noted that the Fund’s performance was in the second Broadridge quartile for the 36 months ended May 31, 2017 and the second Broadridge quartile for the 12 months ended May 31, 2017.
· For Janus Henderson International Long/Short Equity Fund, the Trustees noted that the Fund’s performance was in the bottom Broadridge quartile for the 12 months ended May 31, 2017. The Trustees noted the reasons for the Fund’s underperformance, the steps Janus Capital had taken or was taking to improve performance, and the Fund’s limited performance history.
Asset Allocation Funds
· For Janus Henderson Global Allocation Fund – Conservative, the Trustees noted that the Fund’s performance was in the bottom Broadridge quartile for the 36 months ended May 31, 2017 and the second Broadridge
Janus Investment Fund | 43 |
Janus Henderson All Asset Fund
Additional Information (unaudited)
quartile for the 12 months ended May 31, 2017. The Trustees noted the reasons for the Fund’s underperformance, the steps Janus Capital had taken or was taking to improve performance, and that the performance trend was improving.
· For Janus Henderson Global Allocation Fund – Growth, the Trustees noted that the Fund’s performance was in the bottom Broadridge quartile for the 36 months ended May 31, 2017 and the second Broadridge quartile for the 12 months ended May 31, 2017. The Trustees noted the reasons for the Fund’s underperformance, the steps Janus Capital had taken or was taking to improve performance, and that the performance trend was improving.
· For Janus Henderson Global Allocation Fund – Moderate, the Trustees noted that the Fund’s performance was in the bottom Broadridge quartile for the 36 months ended May 31, 2017 and the third Broadridge quartile for the 12 months ended May 31, 2017. The Trustees noted the reasons for the Fund’s underperformance and the steps Janus Capital had taken or was taking to improve performance.
Fixed-Income Funds
· For Janus Henderson Flexible Bond Fund, the Trustees noted that the Fund’s performance was in the bottom Broadridge quartile for the 36 months ended May 31, 2017 and the bottom Broadridge quartile for the 12 months ended May 31, 2017. The Trustees noted the reasons for the Fund’s underperformance and the steps Janus Capital had taken or was taking to improve performance.
· For Janus Henderson Global Bond Fund, the Trustees noted that the Fund’s performance was in the third Broadridge quartile for the 36 months ended May 31, 2017 and the bottom Broadridge quartile for the 12 months ended May 31, 2017. The Trustees noted the reasons for the Fund’s underperformance and the steps Janus Capital had taken or was taking to improve performance.
· For Janus Henderson Global Unconstrained Bond Fund, the Trustees noted that the Fund’s performance was in the third Broadridge quartile for the 36 months ended May 31, 2017 and the bottom Broadridge quartile for the 12 months ended May 31, 2017. The Trustees noted the reasons for the Fund’s underperformance and the steps Janus Capital had taken or was taking to improve performance.
· For Janus Henderson High-Yield Fund, the Trustees noted that the Fund’s performance was in the second Broadridge quartile for the 36 months ended May 31, 2017 and the third Broadridge quartile for the 12 months ended May 31, 2017.
· For Janus Henderson Multi-Sector Income Fund, the Trustees noted that the Fund’s performance was in the first Broadridge quartile for the 36 months ended May 31, 2017 and the second Broadridge quartile for the 12 months ended May 31, 2017.
· For Janus Henderson Real Return Fund, the Trustees noted that the Fund’s performance was in the first Broadridge quartile for the 36 months ended May 31, 2017 and the first Broadridge quartile for the 12 months ended May 31, 2017.
· For Janus Henderson Short-Term Bond Fund, the Trustees noted that the Fund’s performance was in the third Broadridge quartile for the 36 months ended May 31, 2017 and the third Broadridge quartile for the 12 months ended May 31, 2017. The Trustees noted the reasons for the Fund’s underperformance and the steps Janus Capital had taken or was taking to improve performance.
· For Janus Henderson Strategic Income Fund, the Trustees noted that the Fund’s performance was in the first Broadridge quartile for the 36 months ended May 31, 2017 and the second Broadridge quartile for the 12 months ended May 31, 2017.
Global and International Equity Funds
· For Janus Henderson Asia Equity Fund, the Trustees noted that the Fund’s performance was in the first Broadridge quartile for the 36 months ended May 31, 2017 and the first Broadridge quartile for the 12 months ended May 31, 2017.
44 | JUNE 30, 2018 |
Janus Henderson All Asset Fund
Additional Information (unaudited)
· For Janus Henderson Emerging Markets Fund, the Trustees noted that the Fund’s performance was in the first Broadridge quartile for the 36 months ended May 31, 2017 and the third Broadridge quartile for the 12 months ended May 31, 2017.
· For Janus Henderson European Focus Fund, the Trustees noted that the Fund’s performance was in the bottom Broadridge quartile for the 36 months ended May 31, 2017 and the bottom Broadridge quartile for the 12 months ended May 31, 2017. The Trustees noted the reasons for the Fund’s underperformance and the steps Janus Capital had taken or was taking to improve performance.
· For Janus Henderson Global Equity Income Fund, the Trustees noted that the Fund’s performance was in the third Broadridge quartile for the 36 months ended May 31, 2017 and the second Broadridge quartile for the 12 months ended May 31, 2017. The Trustees noted the reasons for the Fund’s underperformance, the steps Janus Capital had taken or was taking to improve performance, and that the performance trend was improving.
· For Janus Henderson Global Life Sciences Fund, the Trustees noted that the Fund’s performance was in the second Broadridge quartile for the 36 months ended May 31, 2017 and the second Broadridge quartile for the 12 months ended May 31, 2017.
· For Janus Henderson Global Real Estate Fund, the Trustees noted that the Fund’s performance was in the second Broadridge quartile for the 36 months ended May 31, 2017 and the first Broadridge quartile for the 12 months ended May 31, 2017.
· For Janus Henderson Global Research Fund, the Trustees noted that the Fund’s performance was in the third Broadridge quartile for the 36 months ended May 31, 2017 and the second Broadridge quartile for the 12 months ended May 31, 2017. The Trustees noted the reasons for the Fund’s underperformance, while also noting that the Fund has a performance fee structure that results in lower management fees during periods of underperformance, the steps Janus Capital had taken or was taking to improve performance, and that the performance trend was improving.
· For Janus Henderson Global Select Fund, the Trustees noted that the Fund’s performance was in the third Broadridge quartile for the 36 months ended May 31, 2017 and the first Broadridge quartile for the 12 months ended May 31, 2017. The Trustees noted the reasons for the Fund’s underperformance, the steps Janus Capital had taken or was taking to improve performance, and that the performance trend was improving.
· For Janus Henderson Global Technology Fund, the Trustees noted that the Fund’s performance was in the third Broadridge quartile for the 36 months ended May 31, 2017 and the third Broadridge quartile for the 12 months ended May 31, 2017. The Trustees noted the reasons for the Fund’s underperformance and the steps Janus Capital had taken or was taking to improve performance.
· For Janus Henderson Global Value Fund, the Trustees noted that the Fund’s performance was in the third Broadridge quartile for the 36 months ended May 31, 2017 and the bottom Broadridge quartile for the 12 months ended May 31, 2017. The Trustees noted the reasons for the Fund’s underperformance, while also noting that the Fund has a performance fee structure that results in lower management fees during periods of underperformance, and the steps Janus Capital and Perkins had taken or were taking to improve performance.
· For Janus Henderson International Opportunities Fund, the Trustees noted that the Fund’s performance was in the second Broadridge quartile for the 36 months ended May 31, 2017 and the bottom Broadridge quartile for the 12 months ended May 31, 2017.
· For Janus Henderson International Small Cap Fund, the Trustees noted that, due to limited performance for the Fund, performance history was not a material factor.
· For Janus Henderson International Value Fund, the Trustees noted that the Fund’s performance was in the third Broadridge quartile for the 36 months ended May 31, 2017 and the bottom Broadridge quartile for the 12 months ended May 31, 2017. The Trustees noted the reasons for the Fund’s underperformance and the steps Janus Capital and Perkins had taken or were taking to improve performance.
· For Janus Henderson Overseas Fund, the Trustees noted that the Fund’s performance was in the bottom Broadridge quartile for the 36 months ended May 31, 2017 and the first Broadridge quartile for the 12 months ended May 31, 2017. The Trustees noted the reasons for the Fund’s underperformance, while also noting that
Janus Investment Fund | 45 |
Janus Henderson All Asset Fund
Additional Information (unaudited)
the Fund has a performance fee structure that results in lower management fees during periods of underperformance, the steps Janus Capital had taken or was taking to improve performance, and that the performance trend was improving.
Money Market Funds
· For Janus Henderson Government Money Market Fund, the Trustees noted that the Fund’s performance was in the third Broadridge quartile for the 36 months ended May 31, 2017 and the third Broadridge quartile for the 12 months ended May 31, 2017. The Trustees noted the reasons for the Fund’s underperformance.
· For Janus Henderson Money Market Fund, the Trustees noted that the Fund’s performance was in the third Broadridge quartile for the 36 months ended May 31, 2017 and the third Broadridge quartile for the 12 months ended May 31, 2017. The Trustees noted the reasons for the Fund’s underperformance.
Multi-Asset Funds
· For Janus Henderson Adaptive Global Allocation Fund, the Trustees noted that the Fund’s performance was in the second Broadridge quartile for the 12 months ended May 31, 2017.
· For Janus Henderson All Asset Fund, the Trustees noted that the Fund’s performance was in the third Broadridge quartile for the 36 months ended May 31, 2017 and the third Broadridge quartile for the 12 months ended May 31, 2017. The Trustees noted the reasons for the Fund’s underperformance and the steps Janus Capital had taken or was taking to improve performance.
· For Janus Henderson Dividend & Income Builder Fund, the Trustees noted that the Fund’s performance was in the second Broadridge quartile for the 36 months ended May 31, 2017 and the second Broadridge quartile for the 12 months ended May 31, 2017.
· For Janus Henderson Value Plus Income Fund, the Trustees noted that the Fund’s performance was in the second Broadridge quartile for the 36 months ended May 31, 2017 and the second Broadridge quartile for the 12 months ended May 31, 2017.
Multi-Asset U.S. Equity Funds
· For Janus Henderson Balanced Fund, the Trustees noted that the Fund’s performance was in the first Broadridge quartile for the 36 months ended May 31, 2017 and the first Broadridge quartile for the 12 months ended May 31, 2017.
· For Janus Henderson Contrarian Fund, the Trustees noted that the Fund’s performance was in the bottom Broadridge quartile for the 36 months ended May 31, 2017 and the first Broadridge quartile for the 12 months ended May 31, 2017. The Trustees noted the reasons for the Fund’s underperformance, while also noting that the Fund has a performance fee structure that results in lower management fees during periods of underperformance, the steps Janus Capital had taken or was taking to improve performance, and that the performance trend was improving.
· For Janus Henderson Enterprise Fund, the Trustees noted that the Fund’s performance was in the first Broadridge quartile for the 36 months ended May 31, 2017 and the second Broadridge quartile for the 12 months ended May 31, 2017.
· For Janus Henderson Forty Fund, the Trustees noted that the Fund’s performance was in the first Broadridge quartile for the 36 months ended May 31, 2017 and the third Broadridge quartile for the 12 months ended May 31, 2017.
· For Janus Henderson Growth and Income Fund, the Trustees noted that the Fund’s performance was in the second Broadridge quartile for the 36 months ended May 31, 2017 and the first Broadridge quartile for the 12 months ended May 31, 2017.
· For Janus Henderson Research Fund, the Trustees noted that the Fund’s performance was in the second Broadridge quartile for the 36 months ended May 31, 2017 and the third Broadridge quartile for the 12 months ended May 31, 2017.
46 | JUNE 30, 2018 |
Janus Henderson All Asset Fund
Additional Information (unaudited)
· For Janus Henderson Triton Fund, the Trustees noted that the Fund’s performance was in the first Broadridge quartile for the 36 months ended May 31, 2017 and the third Broadridge quartile for the 12 months ended May 31, 2017.
· For Janus Henderson U.S. Growth Opportunities Fund, the Trustees noted that the Fund’s performance was in the bottom Broadridge quartile for the 12 months ended May 31, 2017. The Trustees noted the reasons for the Fund’s underperformance, the steps Janus Capital had taken or was taking to improve performance, and the Fund’s limited performance history.
· For Janus Henderson Venture Fund, the Trustees noted that the Fund’s performance was in the first Broadridge quartile for the 36 months ended May 31, 2017 and the bottom Broadridge quartile for the 12 months ended May 31, 2017.
Quantitative Equity Funds
· For Janus Henderson Emerging Markets Managed Volatility Fund, the Trustees noted that the Fund’s performance was in the bottom Broadridge quartile for the 12 months ended May 31, 2017. The Trustees noted the reasons for the Fund’s underperformance, the steps Janus Capital and Intech had taken or were taking to improve performance, and the Fund’s limited performance history.
· For Janus Henderson Global Income Managed Volatility Fund, the Trustees noted that the Fund’s performance was in the first Broadridge quartile for the 36 months ended May 31, 2017 and the third Broadridge quartile for the 12 months ended May 31, 2017.
· For Janus Henderson International Managed Volatility Fund, the Trustees noted that the Fund’s performance was in the third Broadridge quartile for the 36 months ended May 31, 2017 and the bottom Broadridge quartile for the 12 months ended May 31, 2017. The Trustees noted the reasons for the Fund’s underperformance and the steps Janus Capital and Intech had taken or were taking to improve performance.
· For Janus Henderson U.S. Managed Volatility Fund, the Trustees noted that the Fund’s performance was in the second Broadridge quartile for the 36 months ended May 31, 2017 and the bottom Broadridge quartile for the 12 months ended May 31, 2017.
U.S. Equity Funds
· For Janus Henderson Large Cap Value Fund, the Trustees noted that the Fund’s performance was in the third Broadridge quartile for the 36 months ended May 31, 2017 and the bottom Broadridge quartile for the 12 months ended May 31, 2017. The Trustees noted the reasons for the Fund’s underperformance, while also noting that the Fund has a performance fee structure that results in lower management fees during periods of underperformance, and the steps Janus Capital and Perkins had taken or were taking to improve performance.
· For Janus Henderson Mid Cap Value Fund, the Trustees noted that the Fund’s performance was in the second Broadridge quartile for the 36 months ended May 31, 2017 and the second Broadridge quartile for the 12 months ended May 31, 2017.
· For Janus Henderson Select Value Fund, the Trustees noted that the Fund’s performance was in the first Broadridge quartile for the 36 months ended May 31, 2017 and the second Broadridge quartile for the 12 months ended May 31, 2017.
· For Janus Henderson Small Cap Value Fund, the Trustees noted that the Fund’s performance was in the first Broadridge quartile for the 36 months ended May 31, 2017 and the second Broadridge quartile for the 12 months ended May 31, 2017.
Janus Aspen Series
· For Janus Henderson Balanced Portfolio, the Trustees noted that the Fund’s performance was in the first Broadridge quartile for the 36 months ended May 31, 2017 and the first Broadridge quartile for the 12 months ended May 31, 2017.
· For Janus Henderson Enterprise Portfolio, the Trustees noted that the Fund’s performance was in the first Broadridge quartile for the 36 months ended May 31, 2017 and the second Broadridge quartile for the 12 months ended May 31, 2017.
Janus Investment Fund | 47 |
Janus Henderson All Asset Fund
Additional Information (unaudited)
· For Janus Henderson Flexible Bond Portfolio, the Trustees noted that the Fund’s performance was in the bottom Broadridge quartile for the 36 months ended May 31, 2017 and the bottom Broadridge quartile for the 12 months ended May 31, 2017. The Trustees noted the reasons for the Fund’s underperformance and the steps Janus Capital had taken or was taking to improve performance.
· For Janus Henderson Forty Portfolio, the Trustees noted that the Fund’s performance was in the first Broadridge quartile for the 36 months ended May 31, 2017 and the third Broadridge quartile for the 12 months ended May 31, 2017.
· For Janus Henderson Global Allocation Portfolio – Moderate, the Trustees noted that the Fund’s performance was in the bottom Broadridge quartile for the 36 months ended May 31, 2017 and the second Broadridge quartile for the 12 months ended May 31, 2017. The Trustees noted the reasons for the Fund’s underperformance, the steps Janus Capital had taken or was taking to improve performance, and that the performance trend was improving.
· For Janus Henderson Global Research Portfolio, the Trustees noted that the Fund’s performance was in the third Broadridge quartile for the 36 months ended May 31, 2017 and the third Broadridge quartile for the 12 months ended May 31, 2017. The Trustees noted the reasons for the Fund’s underperformance, while also noting that the Fund has a performance fee structure that results in lower management fees during periods of underperformance, and the steps Janus Capital had taken or was taking to improve performance.
· For Janus Henderson Global Technology Portfolio, the Trustees noted that the Fund’s performance was in the second Broadridge quartile for the 36 months ended May 31, 2017 and the second Broadridge quartile for the 12 months ended May 31, 2017.
· For Janus Henderson Global Unconstrained Bond Portfolio, the Trustees noted that the Fund’s performance was in the bottom Broadridge quartile for the 12 months ended May 31, 2017. The Trustees noted the reasons for the Fund’s underperformance, the steps Janus Capital had taken or was taking to improve performance, and the Fund’s limited performance history.
· For Janus Henderson Mid Cap Value Portfolio, the Trustees noted that the Fund’s performance was in the third Broadridge quartile for the 36 months ended May 31, 2017 and the second Broadridge quartile for the 12 months ended May 31, 2017. The Trustees noted the reasons for the Fund’s underperformance, while also noting that the Fund has a performance fee structure that results in lower management fees during periods of underperformance, the steps Janus Capital and Perkins had taken or were taking to improve performance, and that the performance trend was improving.
· For Janus Henderson Overseas Portfolio, the Trustees noted that the Fund’s performance was in the bottom Broadridge quartile for the 36 months ended May 31, 2017 and the first Broadridge quartile for the 12 months ended May 31, 2017. The Trustees noted the reasons for the Fund’s underperformance, while also noting that the Fund has a performance fee structure that results in lower management fees during periods of underperformance, the steps Janus Capital had taken or was taking to improve performance, and that the performance trend was improving.
· For Janus Henderson Research Portfolio, the Trustees noted that the Fund’s performance was in the second Broadridge quartile for the 36 months ended May 31, 2017 and the third Broadridge quartile for the 12 months ended May 31, 2017.
· For Janus Henderson U.S. Low Volatility Portfolio, the Trustees noted that the Fund’s performance was in the first Broadridge quartile for the 36 months ended May 31, 2017 and the bottom Broadridge quartile for the 12 months ended May 31, 2017.
In consideration of each Fund’s performance, the Trustees concluded that, taking into account the factors relevant to performance, as well as other considerations, including steps taken to improve performance, the Fund’s performance warranted continuation of the Fund’s investment advisory and subadvisory agreement(s).
Costs of Services Provided
The Trustees examined information regarding the fees and expenses of each Fund in comparison to similar information for other comparable funds as provided by Broadridge, an independent data provider. They also reviewed an analysis of
48 | JUNE 30, 2018 |
Janus Henderson All Asset Fund
Additional Information (unaudited)
that information provided by their independent fee consultant and noted that the rate of management (investment advisory and any administration, but excluding out-of-pocket costs) fees for many of the Funds, after applicable waivers, was below the average management fee rate of the respective peer group of funds selected by an independent data provider. The Trustees also examined information regarding the subadvisory fees charged for subadvisory services, as applicable, noting that all such fees were paid by Janus Capital out of its management fees collected from such Fund.
The independent fee consultant provided its belief that the management fees charged by Janus Capital to each of the Funds under the current investment advisory and administration agreements are reasonable in relation to the services provided by Janus Capital. The independent fee consultant found: (1) the total expenses and management fees of the Funds to be reasonable relative to other mutual funds; (2) total expenses, on average, were 10% below the average total expenses of their respective Broadridge Expense Group peers and 18% below the average total expenses for their Broadridge Expense Universes; (3) management fees for the Funds, on average, were 8% below the average management fees for their Expense Groups and 9% below the average for their Expense Universes; and (4) Fund expenses at the functional level for each asset and share class category were reasonable. The Trustees also considered the total expenses for each share class of each Fund compared to the average total expenses for its Broadridge Expense Group peers and to average total expenses for its Broadridge Expense Universe.
The independent fee consultant concluded that, based on its strategic review of expenses at the complex, category and individual fund level, Fund expenses were found to be reasonable relative to both Expense Group and Expense Universe benchmarks. Further, for certain Funds, the independent fee consultant also performed a systematic “focus list” analysis of expenses in the context of the performance or service delivered to each set of investors in each share class in each selected Fund. Based on this analysis, the independent fee consultant found that the combination of service quality/performance and expenses on these individual Funds and share classes were reasonable in light of performance trends, performance histories, and existence of performance fees, breakpoints, and expense waivers on such Funds.
The Trustees considered the methodology used by Janus Capital and each subadviser in determining compensation payable to portfolio managers, the competitive environment for investment management talent, and the competitive market for mutual funds in different distribution channels.
The Trustees also reviewed management fees charged by Janus Capital and each subadviser to comparable separate account clients and to comparable non-affiliated funds subadvised by Janus Capital or by a subadviser (for which Janus Capital or the subadviser provides only or primarily portfolio management services). Although in most instances subadvisory and separate account fee rates for various investment strategies were lower than management fee rates for Funds having a similar strategy, the Trustees considered that Janus Capital noted that, under the terms of the management agreements with the Funds, Janus Capital performs significant additional services for the Funds that it does not provide to those other clients, including administration services, oversight of the Funds’ other service providers, trustee support, regulatory compliance and numerous other services, and that, in serving the Funds, Janus Capital assumes many legal risks and other costs that it does not assume in servicing its other clients. Moreover, they noted that the independent fee consultant found that: (1) the management fees Janus Capital charges to the Funds are reasonable in relation to the management fees Janus Capital charges to its institutional clients and to the fees Janus Capital charges to funds subadvised by Janus Capital; (2) these institutional and subadvised accounts have different service and infrastructure needs; (3) Janus mutual fund investors enjoy reasonable fees relative to the fees charged to Janus institutional and subadvised fund investors; (4) in three of seven product categories, the Funds receive proportionally better pricing than the industry in relation to Janus institutional clients; and (5) in seven of eight strategies, Janus Capital has lower management fees than funds subadvised by Janus Capital’s portfolio managers.
The Trustees considered the fees for each Fund for its fiscal year ended in 2016, and noted the following with regard to each Fund’s total expenses, net of applicable fee waivers (the Fund’s “total expenses”):
Alternative Funds
· For Janus Henderson Diversified Alternatives Fund, the Trustees noted that, although the Fund’s total expenses exceeded the peer group average for one share class, overall the Fund’s total expenses were reasonable. The Trustees also noted that Janus Capital has contractually agreed to limit the Fund’s expenses.
· For Janus Henderson International Long/Short Equity Fund, the Trustees noted that, although the Fund’s total expenses exceeded the peer group average for one share class, overall the Fund’s total expenses were
Janus Investment Fund | 49 |
Janus Henderson All Asset Fund
Additional Information (unaudited)
reasonable. The Trustees also noted that Janus Capital has contractually agreed to limit the Fund’s expenses effective June 5, 2017.
Asset Allocation Funds
· For Janus Henderson Global Allocation Fund – Conservative, the Trustees noted that, although the Fund’s total expenses exceeded the peer group average for certain share classes, overall the Fund’s total expenses were reasonable. The Trustees also noted that Janus Capital has contractually agreed to limit the Fund’s expenses, although this limit did not apply because the Fund’s total expenses were already below the applicable fee limit.
· For Janus Henderson Global Allocation Fund – Growth, the Trustees noted that the Fund’s total expenses were below the peer group average for all share classes.
· For Janus Henderson Global Allocation Fund – Moderate, the Trustees noted that, although the Fund’s total expenses exceeded the peer group average for certain share classes, overall the Fund’s total expenses were reasonable. The Trustees also noted that Janus Capital has contractually agreed to limit the Fund’s expenses.
Fixed-Income Funds
· For Janus Henderson Flexible Bond Fund, the Trustees noted that, although the Fund’s total expenses exceeded the peer group average for certain share classes, overall the Fund’s total expenses were reasonable. The Trustees also noted that Janus Capital has contractually agreed to limit the Fund’s expenses, although this limit did not apply because the Fund’s total expenses were already below the applicable fee limit.
· For Janus Henderson Global Bond Fund, the Trustees noted that, although the Fund’s total expenses exceeded the peer group average for certain share classes, overall the Fund’s total expenses were reasonable. The Trustees also noted that Janus Capital has contractually agreed to limit the Fund’s expenses.
· For Janus Henderson Global Unconstrained Bond Fund, the Trustees noted that the Fund’s performance was in the third Broadridge quartile for the 36 months ended May 31, 2017 and the bottom Broadridge quartile for the 12 months ended May 31, 2017. The Trustees noted the reasons for the Fund’s underperformance and the steps Janus Capital had taken or was taking to improve performance.
· For Janus Henderson High-Yield Fund, the Trustees noted that, although the Fund’s total expenses exceeded the peer group average for certain share classes, overall the Fund’s total expenses were reasonable. The Trustees also noted that Janus Capital has contractually agreed to limit the Fund’s expenses, although this limit did not apply because the Fund’s total expenses were already below the applicable fee limit.
· For Janus Henderson Multi-Sector Income Fund, the Trustees noted that, although the Fund’s total expenses exceeded the peer group average for one share class, overall the Fund’s total expenses were reasonable. The Trustees also noted that Janus Capital has contractually agreed to limit the Fund’s expenses.
· For Janus Henderson Real Return Fund, the Trustees noted that, although the Fund’s total expenses exceeded the peer group average for certain share classes, overall the Fund’s total expenses were reasonable. The Trustees also noted that Janus Capital has contractually agreed to limit the Fund’s expenses.
· For Janus Henderson Short-Term Bond Fund, the Trustees noted that, although the Fund’s total expenses exceeded the peer group average for certain share classes, overall the Fund’s total expenses were reasonable. The Trustees also noted that Janus Capital has contractually agreed to waive 11 basis points of management fees effective February 1, 2018 and also has contractually agreed to limit the Fund’s expenses.
· For Janus Henderson Strategic Income Fund, the Trustees noted that, although the Fund’s total expenses exceeded the peer group average for one share class, overall the Fund’s total expenses were reasonable. The Trustees also noted that Janus Capital has contractually agreed to limit the Fund’s expenses effective June 5, 2017.
Global and International Equity Funds
· For Janus Henderson Asia Equity Fund, the Trustees noted that, although the Fund’s total expenses exceeded the peer group average for certain share classes, overall the Fund’s total expenses were reasonable. The Trustees also noted that Janus Capital has contractually agreed to limit the Fund’s expenses.
50 | JUNE 30, 2018 |
Janus Henderson All Asset Fund
Additional Information (unaudited)
· For Janus Henderson Emerging Markets Fund, the Trustees noted that, although the Fund’s total expenses exceeded the peer group average for one share class, overall the Fund’s total expenses were reasonable. The Trustees also noted that Janus Capital has contractually agreed to limit the Fund’s expenses effective June 5, 2017.
· For Janus Henderson European Focus Fund, the Trustees noted that, although the Fund’s total expenses exceeded the peer group average for one share class, overall the Fund’s total expenses were reasonable. The Trustees also noted that Janus Capital has contractually agreed to limit the Fund’s expenses effective June 5, 2017.
· For Janus Henderson Global Equity Income Fund, the Trustees noted that the Fund’s total expenses were below the peer group average for all share classes.
· For Janus Henderson Global Life Sciences Fund, the Trustees noted that the Fund’s total expenses were below the peer group average for all share classes.
· For Janus Henderson Global Real Estate Fund, the Trustees noted that, although the Fund’s total expenses exceeded the peer group average one share class, overall the Fund’s total expenses were reasonable. The Trustees also noted that Janus Capital has contractually agreed to limit the Fund’s expenses, although this limit did not apply because the Fund’s total expenses were already below the applicable fee limit.
· For Janus Henderson Global Research Fund, the Trustees noted that the Fund’s total expenses were below the peer group average for all share classes.
· For Janus Henderson Global Select Fund, the Trustees noted that, although the Fund’s total expenses exceeded the peer group average for one share class, overall the Fund’s total expenses were reasonable. The Trustees also noted that Janus Capital has contractually agreed to limit the Fund’s expenses, although this limit did not apply because the Fund’s total expenses were already below the applicable fee limit.
· For Janus Henderson Global Technology Fund, the Trustees noted that the Fund’s total expenses were below the peer group average for all share classes.
· For Janus Henderson Global Value Fund, the Trustees noted that the Fund’s total expenses were below the peer group average for all share classes.
· For Janus Henderson International Opportunities Fund, the Trustees noted that, although the Fund’s total expenses exceeded the peer group average for certain share classes, overall the Fund’s total expenses were reasonable. The Trustees also noted that Janus Capital has contractually agreed to limit the Fund’s expenses effective June 5, 2017.
· For Janus Henderson International Small Cap Fund, the Trustees noted that, although the Fund’s total expenses exceeded the peer group average for one share class, overall the Fund’s total expenses were reasonable. The Trustees also noted that Janus Capital has contractually agreed to limit the Fund’s expenses effective June 5, 2017.
· For Janus Henderson International Value Fund, the Trustees noted that, although the Fund’s total expenses exceeded the peer group average for one share class, overall the Fund’s total expenses were reasonable. The Trustees also noted that Janus Capital has contractually agreed to limit the Fund’s expenses.
· For Janus Henderson Overseas Fund, the Trustees noted that the Fund’s total expenses were below the peer group average for all share classes.
Money Market Funds
· For Janus Henderson Government Money Market Fund, the Trustees noted that the Fund’s total expenses were below the peer group average for both share classes. In addition, the Trustees considered that Janus Capital voluntarily waives one-half of its advisory fee and other expenses in order to maintain a positive yield.
· For Janus Henderson Money Market Fund, the Trustees noted that the Fund’s total expenses were below the peer group average for both share classes. In addition, the Trustees considered that Janus Capital voluntarily waives one-half of its advisory fee and other expenses in order to maintain a positive yield.
Janus Investment Fund | 51 |
Janus Henderson All Asset Fund
Additional Information (unaudited)
Multi-Asset Funds
· For Janus Henderson Adaptive Global Allocation Fund, the Trustees noted that, although the Fund’s total expenses exceeded the peer group average for one share class, overall the Fund’s total expenses were reasonable. The Trustees also noted that Janus Capital has contractually agreed to limit the Fund’s expenses.
· For Janus Henderson All Asset Fund, the Trustees noted that, although the Fund’s total expenses exceeded the peer group average for one share class, overall the Fund’s total expenses were reasonable. The Trustees also noted that Janus Capital has contractually agreed to limit the Fund’s total expenses effective June 5, 2017.
· For Janus Henderson Dividend & Income Builder Fund, the Trustees noted that, although the Fund’s total expenses exceeded the peer group average for certain share classes, overall the Fund’s total expenses were reasonable. The Trustees also noted that Janus Capital has contractually agreed to limit the Fund’s expenses effective June 5, 2017.
· For Janus Henderson Value Plus Income Fund, the Trustees noted that the Fund’s total expenses were below the peer group average for all share classes.
Multi-Asset U.S. Equity Funds
· For Janus Henderson Balanced Fund, the Trustees noted that, although the Fund’s total expenses exceeded the peer group average for certain share classes, overall the Fund’s total expenses were reasonable. The Trustees also noted that Janus Capital has contractually agreed to limit the Fund’s expenses, although this limit did not apply because the Fund’s total expenses were already below the applicable fee limit.
· For Janus Henderson Contrarian Fund, the Trustees noted that, although the Fund’s total expenses exceeded the peer group average for one share class, overall the Fund’s total expenses were reasonable. The Trustees also noted that Janus Capital has contractually agreed to limit the Fund’s expenses, although this limit did not apply because the Fund’s total expenses were already below the applicable fee limit.
· For Janus Henderson Enterprise Fund, the Trustees noted that, although the Fund’s total expenses exceeded the peer group average for certain share classes, overall the Fund’s total expenses were reasonable. The Trustees also noted that Janus Capital has contractually agreed to limit the Fund’s expenses, although this limit did not apply because the Fund’s total expenses were already below the applicable fee limit.
· For Janus Henderson Forty Fund, the Trustees noted that, although the Fund’s total expenses exceeded the peer group average for certain share classes, overall the Fund’s total expenses were reasonable. The Trustees also noted that Janus Capital has contractually agreed to limit the Fund’s expenses, although this limit did not apply because the Fund’s total expenses were already below the applicable fee limit.
· For Janus Henderson Growth and Income Fund, the Trustees noted that, although the Fund’s total expenses exceeded the peer group average for certain share classes, overall the Fund’s total expenses were reasonable. The Trustees also noted that Janus Capital has contractually agreed to limit the Fund’s expenses, although this limit did not apply because the Fund’s total expenses were already below the applicable fee limit.
· For Janus Henderson Research Fund, the Trustees noted that, although the Fund’s total expenses were equal to or exceeded the peer group average for certain share classes, overall the Fund’s total expenses were reasonable. The Trustees also noted that Janus Capital has contractually agreed to limit the Fund’s expenses effective February 1, 2017.
· For Janus Henderson Triton Fund, the Trustees noted that the Fund’s total expenses were below the peer group average for all share classes.
· For Janus Henderson U.S. Growth Opportunities Fund, the Trustees noted that, although the Fund’s total expenses exceeded the peer group average for one share class, overall the Fund’s total expenses were reasonable. The Trustees also noted that Janus Capital has contractually agreed to limit the Fund’s expenses effective June 5, 2017.
· For Janus Henderson Venture Fund, the Trustees noted that the Fund’s total expenses were below the peer group average for all share classes.
52 | JUNE 30, 2018 |
Janus Henderson All Asset Fund
Additional Information (unaudited)
Quantitative Equity Funds
· For Janus Henderson Emerging Markets Managed Volatility Fund, the Trustees noted that, although the Fund’s total expenses exceeded the peer group average for certain share classes, overall the Fund’s total expenses were reasonable. The Trustees also noted that Janus Capital has contractually agreed to limit the Fund’s expenses.
· For Janus Henderson Global Income Managed Volatility Fund, the Trustees noted that the Fund’s total expenses were below the peer group average for all share classes.
· For Janus Henderson International Managed Volatility Fund, the Trustees noted that, although the Fund’s total expenses exceeded the peer group average for one share class, overall the Fund’s total expenses were reasonable. The Trustees also noted that Janus Capital has contractually agreed to limit the Fund’s expenses.
· For Janus Henderson U.S. Managed Volatility Fund, the Trustees noted that, although the Fund’s total expenses exceeded the peer group average for one share class, overall the Fund’s total expenses were reasonable. The Trustees also noted that Janus Capital has contractually agreed to limit the Fund’s expenses, although this limit did not apply because the Fund’s total expenses were already below the applicable fee limit.
U.S. Equity Funds
· For Janus Henderson Large Cap Value Fund, the Trustees noted that the Fund’s total expenses were below the peer group average for all share classes.
· For Janus Henderson Mid Cap Value Fund, the Trustees noted that the Fund’s total expenses were below the peer group average for all share classes.
· For Janus Henderson Select Value Fund, the Trustees noted that the Fund’s total expenses were below the peer group averages for all share classes.
· For Janus Henderson Small Cap Value Fund, the Trustees noted that, although the Fund’s total expenses exceeded the peer group average for certain share classes, overall the Fund’s total expenses were reasonable. The Trustees also noted that Janus Capital has contractually agreed to limit the Fund’s expenses, although this limit did not apply because the Fund’s total expenses were already below the applicable fee limit.
Janus Aspen Series
· For Janus Henderson Balanced Portfolio, the Trustees noted that, although the Fund’s total expenses exceeded the peer group average for one share class, overall the Fund’s total expenses were reasonable.
· For Janus Henderson Enterprise Portfolio, the Trustees noted that, although the Fund’s total expenses exceeded the peer group average for one share class, overall the Fund’s total expenses were reasonable.
· For Janus Henderson Flexible Bond Portfolio, the Trustees noted that, although the Fund’s total expenses exceeded the peer group average for one share class, overall the Fund’s total expenses were reasonable. The Trustees also noted that Janus Capital has contractually agreed to limit the Fund’s expenses, although this limit did not apply because the Fund’s total expenses were already below the applicable fee limit.
· For Janus Henderson Forty Portfolio, the Trustees noted that, although the Fund’s total expenses exceeded the peer group average for one share class, overall the Fund’s total expenses were reasonable.
· For Janus Henderson Global Allocation Portfolio - Moderate, the Trustees noted that, although the Fund’s total expenses exceeded the peer group average for one share class, overall the Fund’s total expenses were reasonable. The Trustees also noted that Janus Capital has contractually agreed to limit the Fund’s expenses.
· For Janus Henderson Global Research Portfolio, the Trustees noted that the Fund’s total expenses were below the peer group average for both share classes.
· For Janus Henderson Global Technology Portfolio, the Trustees noted that the Fund’s total expenses were below the peer group average for both share classes.
· For Janus Henderson Global Unconstrained Bond Portfolio, the Trustees noted that, although the Fund’s total expenses exceeded the peer group average for one share class, overall the Fund’s total expenses were reasonable. The Trustees also noted that Janus Capital has contractually agreed to limit the Fund’s expenses.
Janus Investment Fund | 53 |
Janus Henderson All Asset Fund
Additional Information (unaudited)
· For Janus Henderson Mid Cap Value Portfolio, the Trustees noted that the Fund’s total expenses were below the peer group average for both share classes.
· For Janus Henderson Overseas Portfolio, the Trustees noted that the Fund’s total expenses were below the peer group average for both share classes.
· For Janus Henderson Research Portfolio, the Trustees noted that the Fund’s total expenses were below the peer group average for both share classes.
· For Janus Henderson U.S. Low Volatility Portfolio, the Trustees noted that the Fund’s total expenses were below the peer group average for its sole share class.
The Trustees reviewed information on the overall profitability to Janus Capital and its affiliates of their relationship with the Funds, and considered profitability data of other fund managers. The Trustees also considered the financial information, estimated profitability and corporate structure of Janus Capital’s parent company before and after the Transaction. The Trustees recognized that profitability comparisons among fund managers are difficult because of the variation in the type of comparative information that is publicly available, and the profitability of any fund manager is affected by numerous factors, including the organizational structure of the particular fund manager, the types of funds and other accounts it manages, possible other lines of business, the methodology for allocating expenses, and the fund manager’s capital structure and cost of capital. The Trustees also noted that the Trustees’ independent fee consultant reviewed the overall profitability of Janus Capital’s parent company prior to the Transaction, and the independent fee consultant found that, while assessing the reasonableness of Fund expenses in light of such profits was dependent on comparisons with other publicly-traded mutual fund advisers, and that these comparisons were limited in accuracy by differences in complex size, business mix, institutional account orientation and other factors, after accepting these limitations, the level of profit earned by Janus Capital’s parent company was reasonable. In this regard, the independent consultant concluded that the profitability of Janus Capital’s parent company did not show excess nor did it show any insufficiency that could limit the ability to invest the resources needed to drive strong future investment performance on behalf of the Funds.
Additionally, the Trustees considered the estimated profitability to Janus Capital from the investment management services it provided to each Fund. The Trustees also considered such estimated profitability taking into account the impact of the Transaction on Janus Capital’s expense structure on a pro forma basis. In their review, the Trustees considered whether Janus Capital and each subadviser receive adequate incentives and resources to manage the Funds effectively. In reviewing profitability, the Trustees noted that the estimated profitability for an individual Fund is necessarily a product of the allocation methodology utilized by Janus Capital to allocate its expenses as part of the estimated profitability calculation. In this regard, the Trustees noted that the independent fee consultant concluded that (1) the expense allocation methodology utilized by Janus Capital was reasonable and (2) the estimated profitability to Janus Capital from the investment management services it provided to each Fund was reasonable, including after taking into account the impact of the Transaction on Janus Capital’s expense structure on a pro forma basis. The Trustees also considered that the estimated profitability for an individual Fund was influenced by a number of factors, including not only the allocation methodology selected, but also the presence of fee waivers and expense caps, and whether the Fund’s investment management agreement contained breakpoints or a performance fee component. The Trustees determined, after taking into account these factors, among others, that Janus Capital’s estimated profitability with respect to each Fund was not unreasonable in relation to the services provided, and that the variation in the range of such estimated profitability among the Funds was not a material factor in the Board’s approval of the reasonableness of any Fund’s investment management fees.
The Trustees concluded that the management fees payable by each Fund to Janus Capital and its affiliates, as well as the fees paid by Janus Capital to the subadvisers of subadvised Funds, were reasonable in relation to the nature, extent, and quality of the services provided, taking into account the fees charged by other advisers for managing comparable mutual funds with similar strategies, the fees Janus Capital and the subadvisers charge to other clients, and, as applicable, the impact of fund performance on management fees payable by the Funds. The Trustees also concluded that each Fund’s total expenses were reasonable, taking into account the size of the Fund, the quality of services provided by Janus Capital and any subadviser, the investment performance of the Fund, and any expense limitations agreed to or provided by Janus Capital.
54 | JUNE 30, 2018 |
Janus Henderson All Asset Fund
Additional Information (unaudited)
Economies of Scale
The Trustees considered information about the potential for Janus Capital to realize economies of scale as the assets of the Funds increase. They noted their independent fee consultant’s analysis of economies of scale in prior years. They also noted that, although many Funds pay advisory fees at a base fixed rate as a percentage of net assets, without any breakpoints or performance fees, their independent fee consultant concluded that 86% of these Funds’ share classes have contractual management fees (gross of waivers) below their Broadridge expense group averages. They also noted that for those Funds whose expenses are being reduced by the contractual expense limitations of Janus Capital, Janus Capital is subsidizing certain of these Funds because they have not reached adequate scale. Moreover, as the assets of some of the Funds have declined in the past few years, certain Funds have benefited from having advisory fee rates that have remained constant rather than increasing as assets declined. In addition, performance fee structures have been implemented for various Funds that have caused the effective rate of advisory fees payable by such a Fund to vary depending on the investment performance of the Fund relative to its benchmark index over the measurement period; and a few Funds have fee schedules with breakpoints and reduced fee rates above certain asset levels. The Trustees also noted that the Funds share directly in economies of scale through the lower charges of third-party service providers that are based in part on the combined scale of all of the Funds. Based on all of the information they reviewed, including past research and analysis conducted by the Trustees’ independent fee consultant, the Trustees concluded that the current fee structure of each Fund was reasonable and that the current rates of fees do reflect a sharing between Janus Capital and the Fund of any economies of scale that may be present at the current asset level of the Fund.
The independent fee consultant concluded that, given the limitations of various analytical approaches to economies of scale it had considered in prior years, and their conflicting results, it is difficult to analytically confirm or deny the existence of economies of scale in the Janus complex. The independent consultant concluded that (1) to the extent there were economies of scale at Janus Capital, Janus Capital’s general strategy of setting fixed management fees below peers appeared to share any such economies with investors even on smaller Funds which have not yet achieved those economies and (2) by setting lower fixed fees from the start on these Funds, Janus Capital appeared to be investing to increase the likelihood that these Funds will grow to a level to achieve any scale economies that may exist. Further, the independent fee consultant provided its belief that Fund investors are well-served by the fee levels and performance fee structures in place on the Funds in light of any economies of scale that may be present at Janus Capital.
Other Benefits to Janus Capital
The Trustees also considered benefits that accrue to Janus Capital and its affiliates and subadvisers to the Funds from their relationships with the Funds. They recognized that two affiliates of Janus Capital separately serve the Funds as transfer agent and distributor, respectively, and the transfer agent receives compensation directly from the non-money market funds for services provided. The Trustees also considered Janus Capital’s past and proposed use of commissions paid by the Funds on portfolio brokerage transactions to obtain proprietary and third-party research products and services benefiting the Fund and/or other clients of Janus Capital and/or Janus Capital, and/or a subadviser to a Fund. The Trustees concluded that Janus Capital’s and the subadvisers’ use of these types of client commission arrangements to obtain proprietary and third-party research products and services was consistent with regulatory requirements and guidelines and was likely to benefit each Fund. The Trustees also concluded that, other than the services provided by Janus Capital and its affiliates and subadvisers pursuant to the agreements and the fees to be paid by each Fund therefor, the Funds and Janus Capital and the subadvisers may potentially benefit from their relationship with each other in other ways. They concluded that Janus Capital and/or the subadvisers benefits from the receipt of research products and services acquired through commissions paid on portfolio transactions of the Funds and that the Funds benefit from Janus Capital’s and/or the subadvisers’ receipt of those products and services as well as research products and services acquired through commissions paid by other clients of Janus Capital and/or other clients of the subadvisers. They further concluded that the success of any Fund could attract other business to Janus Capital, the subadvisers or other Janus funds, and that the success of Janus Capital and the subadvisers could enhance Janus Capital’s and the subadvisers’ ability to serve the Funds.
Janus Investment Fund | 55 |
Janus Henderson All Asset Fund
Useful Information About Your Fund Report (unaudited)
The Management Commentary in this report includes valuable insight as well as statistical information to help you understand how your Fund’s performance and characteristics stack up against those of comparable indices.
If the Fund invests in foreign securities, this report may include information about country exposure. Country exposure is based primarily on the country of risk. A company may be allocated to a country based on other factors such as location of the company’s principal office, the location of the principal trading market for the company’s securities, or the country where a majority of the company’s revenues are derived.
Please keep in mind that the opinions expressed in the Management Commentary are just that: opinions. They are a reflection based on best judgment at the time this report was compiled, which was June 30, 2018. As the investing environment changes, so could opinions. These views are unique and are not necessarily shared by fellow employees or by Janus Henderson in general.
Performance Overviews
Performance overview graphs compare the performance of a hypothetical $10,000 investment in the Fund with one or more widely used market indices. When comparing the performance of the Fund with an index, keep in mind that market indices are not available for investment and do not reflect deduction of expenses.
Average annual total returns are quoted for a Fund with more than one year of performance history. Average annual total return is calculated by taking the growth or decline in value of an investment over a period of time, including reinvestment of dividends and distributions, then calculating the annual compounded percentage rate that would have produced the same result had the rate of growth been constant throughout the period. Average annual total return does not reflect the deduction of taxes that a shareholder would pay on Fund distributions or redemptions of Fund shares.
Cumulative total returns are quoted for a Fund with less than one year of performance history. Cumulative total return is the growth or decline in value of an investment over time, independent of the period of time involved. Cumulative total return does not reflect the deduction of taxes that a shareholder would pay on Fund distributions or redemptions of Fund shares.
Pursuant to federal securities rules, expense ratios shown in the performance chart reflect subsidized (if applicable) and unsubsidized ratios. The total annual fund operating expenses ratio is gross of any fee waivers, reflecting the Fund’s unsubsidized expense ratio. The net annual fund operating expenses ratio (if applicable) includes contractual waivers of Janus Capital and reflects the Fund’s subsidized expense ratio. Ratios may be higher or lower than those shown in the “Financial Highlights” in this report.
Schedule of Investments
Following the performance overview section is the Fund’s Schedule of Investments. This schedule reports the types of securities held in the Fund on the last day of the reporting period. Securities are usually listed by type (common stock, corporate bonds, U.S. Government obligations, etc.) and by industry classification (banking, communications, insurance, etc.). Holdings are subject to change without notice.
The value of each security is quoted as of the last day of the reporting period. The value of securities denominated in foreign currencies is converted into U.S. dollars.
If the Fund invests in foreign securities, it will also provide a summary of investments by country. This summary reports the Fund exposure to different countries by providing the percentage of securities invested in each country. The country of each security represents the country of risk. The Fund’s Schedule of Investments relies upon the industry group and country classifications published by Barclays and/or MSCI Inc.
Tables listing details of individual forward currency contracts, futures, written options, swaptions, and swaps follow the Fund’s Schedule of Investments (if applicable).
Statement of Assets and Liabilities
This statement is often referred to as the “balance sheet.” It lists the assets and liabilities of the Fund on the last day of the reporting period.
56 | JUNE 30, 2018 |
Janus Henderson All Asset Fund
Useful Information About Your Fund Report (unaudited)
The Fund’s assets are calculated by adding the value of the securities owned, the receivable for securities sold but not yet settled, the receivable for dividends declared but not yet received on securities owned, and the receivable for Fund shares sold to investors but not yet settled. The Fund’s liabilities include payables for securities purchased but not yet settled, Fund shares redeemed but not yet paid, and expenses owed but not yet paid. Additionally, there may be other assets and liabilities such as unrealized gain or loss on forward currency contracts.
The section entitled “Net Assets Consist of” breaks down the components of the Fund’s net assets. Because the Fund must distribute substantially all earnings, you will notice that a significant portion of net assets is shareholder capital.
The last section of this statement reports the net asset value (“NAV”) per share on the last day of the reporting period. The NAV is calculated by dividing the Fund’s net assets for each share class (assets minus liabilities) by the number of shares outstanding.
Statement of Operations
This statement details the Fund’s income, expenses, realized gains and losses on securities and currency transactions, and changes in unrealized appreciation or depreciation of Fund holdings.
The first section in this statement, entitled “Investment Income,” reports the dividends earned from securities and interest earned from interest-bearing securities in the Fund.
The next section reports the expenses incurred by the Fund, including the advisory fee paid to the investment adviser, transfer agent fees and expenses, and printing and postage for mailing statements, financial reports and prospectuses. Expense offsets and expense reimbursements, if any, are also shown.
The last section lists the amounts of realized gains or losses from investment and foreign currency transactions, and changes in unrealized appreciation or depreciation of investments and foreign currency-denominated assets and liabilities. The Fund will realize a gain (or loss) when it sells its position in a particular security. A change in unrealized gain (or loss) refers to the change in net appreciation or depreciation of the Fund during the reporting period. “Net Realized and Unrealized Gain/(Loss) on Investments” is affected both by changes in the market value of Fund holdings and by gains (or losses) realized during the reporting period.
Statements of Changes in Net Assets
These statements report the increase or decrease in the Fund’s net assets during the reporting period. Changes in the Fund’s net assets are attributable to investment operations, dividends and distributions to investors, and capital share transactions. This is important to investors because it shows exactly what caused the Fund’s net asset size to change during the period.
The first section summarizes the information from the Statement of Operations regarding changes in net assets due to the Fund’s investment operations. The Fund’s net assets may also change as a result of dividend and capital gains distributions to investors. If investors receive their dividends and/or distributions in cash, money is taken out of the Fund to pay the dividend and/or distribution. If investors reinvest their dividends and/or distributions, the Fund’s net assets will not be affected. If you compare the Fund’s “Net Decrease from Dividends and Distributions” to “Reinvested Dividends and Distributions,” you will notice that dividends and distributions have little effect on the Fund’s net assets. This is because the majority of the Fund’s investors reinvest their dividends and/or distributions.
The reinvestment of dividends and distributions is included under “Capital Share Transactions.” “Capital Shares” refers to the money investors contribute to the Fund through purchases or withdrawals via redemptions. The Fund’s net assets will increase and decrease in value as investors purchase and redeem shares from the Fund.
Financial Highlights
This schedule provides a per-share breakdown of the components that affect the Fund’s NAV for current and past reporting periods as well as total return, asset size, ratios, and portfolio turnover rate.
The first line in the table reflects the NAV per share at the beginning of the reporting period. The next line reports the net investment income/(loss) per share. Following is the per share total of net gains/(losses), realized and unrealized. Per share dividends and distributions to investors are then subtracted to arrive at the NAV per share at the end of the period. The next line reflects the total return for the period. Also included are ratios of expenses and net investment income to average net assets.
Janus Investment Fund | 57 |
Janus Henderson All Asset Fund
Useful Information About Your Fund Report (unaudited)
The Fund’s expenses may be reduced through expense offsets and expense reimbursements. The ratios shown reflect expenses before and after any such offsets and reimbursements.
The ratio of net investment income/(loss) summarizes the income earned less expenses, divided by the average net assets of the Fund during the reporting period. Do not confuse this ratio with the Fund’s yield. The net investment income ratio is not a true measure of the Fund’s yield because it does not take into account the dividends distributed to the Fund’s investors.
The next figure is the portfolio turnover rate, which measures the buying and selling activity in the Fund. Portfolio turnover is affected by market conditions, changes in the asset size of the Fund, fluctuating volume of shareholder purchase and redemption orders, the nature of the Fund’s investments, and the investment style and/or outlook of the portfolio manager(s) and/or investment personnel. A 100% rate implies that an amount equal to the value of the entire portfolio was replaced once during the fiscal year; a 50% rate means that an amount equal to the value of half the portfolio is traded in a year; and a 200% rate means that an amount equal to the value of the entire portfolio is traded every six months.
58 | JUNE 30, 2018 |
Janus Henderson All Asset Fund
Designation Requirements (unaudited)
For federal income tax purposes, the Fund designated the following for the year ended June 30, 2018:
| |
Capital Gain Distributions | $1,412,522 |
Dividends Received Deduction Percentage | 80% |
Qualified Dividend Income Percentage | 67% |
Janus Investment Fund | 59 |
Janus Henderson All Asset Fund
Trustees and Officers (unaudited)
The Fund’s Statement of Additional Information includes additional information about the Trustees and officers and is available, without charge, by calling 1-877-335-2687.
The following are the Trustees and officers of the Trust, together with a brief description of their principal occupations during the last five years (principal occupations for certain Trustees may include periods over five years).
Each Trustee has served in that capacity since he or she was originally elected or appointed. The Trustees do not serve a specified term of office. Each Trustee will hold office until the termination of the Trust or his or her earlier death, resignation, retirement, incapacity, or removal. Under the Fund’s Governance Procedures and Guidelines, the policy is for Trustees to retire no later than the end of the calendar year in which the Trustee turns 75. The Trustees review the Fund’s Governance Procedures and Guidelines from time to time and may make changes they deem appropriate. The Fund’s Nominating and Governance Committee will consider nominees for the position of Trustee recommended by shareholders. Shareholders may submit the name of a candidate for consideration by the Committee by submitting their recommendations to the Trust’s Secretary. Each Trustee is currently a Trustee of one other registered investment company advised by Janus Capital: Janus Aspen Series. Collectively, these two registered investment companies consist of 61 series or funds.
The Trust’s officers are elected annually by the Trustees for a one-year term. Certain officers also serve as officers of Janus Aspen Series. Certain officers of the Fund may also be officers and/or directors of Janus Capital. Except as otherwise disclosed, Fund officers receive no compensation from the Fund, except for the Fund’s Chief Compliance Officer, as authorized by the Trustees.
60 | JUNE 30, 2018 |
Janus Henderson All Asset Fund
Trustees and Officers (unaudited)
TRUSTEES | |||||
Name, Address, and Age | Positions Held with the Trust | Length of Time Served | Principal Occupations During the Past Five Years | Number of Portfolios/Funds in Fund Complex Overseen by Trustee | Other Directorships Held by Trustee During the Past Five Years |
Independent Trustees | |||||
William
F. McCalpin | Chairman | 1/08-Present | Managing Partner, Impact Investments, Athena Capital Advisors LLC (independent registered investment advisor) (since 2016) and Managing Director, Holos Consulting LLC (provides consulting services to foundations and other nonprofit organizations). Formerly, Chief Executive Officer, Imprint Capital (impact investment firm) (2013-2015) and Executive Vice President and Chief Operating Officer of The Rockefeller Brothers Fund (a private family foundation) (1998-2006). | 61 | Director of Mutual Fund Directors Forum (a non-profit organization serving independent directors of U.S. mutual funds), Chairman of the Board and Trustee of The Investment Fund for Foundations Investment Program (TIP) (consisting of 2 funds), and Director of the F.B. Heron Foundation (a private grantmaking foundation). |
Janus Investment Fund | 61 |
Janus Henderson All Asset Fund
Trustees and Officers (unaudited)
TRUSTEES | |||||
Name, Address, and Age | Positions Held with the Trust | Length of Time Served | Principal Occupations During the Past Five Years | Number of Portfolios/Funds in Fund Complex Overseen by Trustee | Other Directorships Held by Trustee During the Past Five Years |
Independent Trustees | |||||
Alan
A. Brown | Trustee | 1/13-Present | Executive Vice President, Institutional Markets, of Black Creek Group (private equity real estate investment management firm) (since 2012). Formerly, Executive Vice President and Co-Head, Global Private Client Group (2007-2010), Executive Vice President, Mutual Funds (2005-2007), and Chief Marketing Officer (2001-2005) of Nuveen Investments, Inc. (asset management). | 61 | Director of WTTW (PBS affiliate) (since 2003). Formerly, Director of MotiveQuest LLC (strategic social market research company) (2003-2016); Director of Nuveen Global Investors LLC (2007-2011); Director of Communities in Schools (2004-2010); and Director of Mutual Fund Education Alliance (until 2010). |
62 | JUNE 30, 2018 |
Janus Henderson All Asset Fund
Trustees and Officers (unaudited)
TRUSTEES | |||||
Name, Address, and Age | Positions Held with the Trust | Length of Time Served | Principal Occupations During the Past Five Years | Number of Portfolios/Funds in Fund Complex Overseen by Trustee | Other Directorships Held by Trustee During the Past Five Years |
Independent Trustees | |||||
William
D. Cvengros | Trustee | 1/11-Present | Managing Member and Chief Executive Officer of SJC Capital, LLC (a personal investment company and consulting firm) (since 2002). Formerly, Venture Partner for The Edgewater Funds (a middle market private equity firm) (2002-2004); Chief Executive Officer and President of PIMCO Advisors Holdings L.P. (a publicly traded investment management firm) (1994-2000); and Chief Investment Officer of Pacific Life Insurance Company (a mutual life insurance and annuity company) (1987-1994). | 61 | Advisory Board Member, Innovate Partners Emerging Growth and Equity Fund I (early stage venture capital fund) (since 2014) and Managing Trustee of National Retirement Partners Liquidating Trust (since 2013). Formerly, Chairman, National Retirement Partners, Inc. (formerly a network of advisors to 401(k) plans) (2005-2013); Director of Prospect Acquisition Corp. (a special purpose acquisition corporation) (2007-2009); Director of RemedyTemp, Inc. (temporary help services company) (1996-2006); and Trustee of PIMCO Funds Multi-Manager Series (1990-2000) and Pacific Life Variable Life & Annuity Trusts (1987-1994). |
Janus Investment Fund | 63 |
Janus Henderson All Asset Fund
Trustees and Officers (unaudited)
TRUSTEES | |||||
Name, Address, and Age | Positions Held with the Trust | Length of Time Served | Principal Occupations During the Past Five Years | Number of Portfolios/Funds in Fund Complex Overseen by Trustee | Other Directorships Held by Trustee During the Past Five Years |
Independent Trustees | |||||
Raudline
Etienne | Trustee | 6/16-Present | Founder, Daraja Capital (advisory and investment firm) (since 2016), and Senior Advisor, Albright Stonebridge Group LLC (global strategy firm) (since 2016). Formerly, Senior Vice President (2011-2015), Albright Stonebridge Group LLC; and Deputy Comptroller and Chief Investment Officer, New York State Common Retirement Fund (public pension fund) (2008-2011). | 61 | Director of Brightwood Capital Advisors, LLC (since 2014). |
Gary A. Poliner | Trustee | 6/16-Present | Retired. Formerly, President (2010-2013) of Northwestern Mutual Life Insurance Company. | 61 | Director of MGIC Investment Corporation (private mortgage insurance) (since 2013) and West Bend Mutual Insurance Company (property/casualty insurance) (since 2013). Formerly, Trustee of Northwestern Mutual Life Insurance Company (2010-2013); and Director of Frank Russell Company (global asset management firm) (2008-2013). |
64 | JUNE 30, 2018 |
Janus Henderson All Asset Fund
Trustees and Officers (unaudited)
TRUSTEES | |||||
Name, Address, and Age | Positions Held with the Trust | Length of Time Served | Principal Occupations During the Past Five Years | Number of Portfolios/Funds in Fund Complex Overseen by Trustee | Other Directorships Held by Trustee During the Past Five Years |
Independent Trustees | |||||
James
T. Rothe | Trustee | 1/97-Present | Professor Emeritus of Business of the University of Colorado, Colorado Springs, CO (since 2004). Formerly, Co-founder and Managing Director of Roaring Fork Capital SBIC, L.P. (SBA SBIC fund focusing on private investment in public equity firms) (2004-2014), Professor of Business of the University of Colorado (2002-2004), and Distinguished Visiting Professor of Business (2001-2002) of Thunderbird (American Graduate School of International Management), Glendale, AZ. | 61 | Formerly, Director of Red Robin Gourmet Burgers, Inc. (RRGB) (2004- 2014). |
William
D. Stewart | Trustee | 6/84-Present | Retired. Formerly, President and founder of HPS Products and Corporate Vice President of MKS Instruments, Boulder, CO (a provider of advanced process control systems for the semiconductor industry) (1976-2012). | 61 | None |
Janus Investment Fund | 65 |
Janus Henderson All Asset Fund
Trustees and Officers (unaudited)
TRUSTEES | |||||
Name, Address, and Age | Positions Held with the Trust | Length of Time Served | Principal Occupations During the Past Five Years | Number of Portfolios/Funds in Fund Complex Overseen by Trustee | Other Directorships Held by Trustee During the Past Five Years |
Independent Trustees | |||||
Diane
L. Wallace | Trustee | 6/17-Present | Retired. | 61 | Formerly, Independent Trustee, Henderson Global Funds (13 portfolios) (2015-2017); Independent Trustee, State Farm Associates' Funds Trust, State Farm Mutual Fund Trust, and State Farm Variable Product Trust (28 portfolios) (2013-2017). Chief Operating Officer, Senior Vice President-Operations, and Chief Financial Officer for Driehaus Capital Management, LLC (1988-2006); and Treasurer of Driehaus Mutual Funds (1996-2002). |
66 | JUNE 30, 2018 |
Janus Henderson All Asset Fund
Trustees and Officers (unaudited)
TRUSTEES | |||||
Name, Address, and Age | Positions Held with the Trust | Length of Time Served | Principal Occupations During the Past Five Years | Number of Portfolios/Funds in Fund Complex Overseen by Trustee | Other Directorships Held by Trustee During the Past Five Years |
Independent Trustees | |||||
Linda
S. Wolf | Trustee | 11/05-Present | Retired. Formerly, Chairman and Chief Executive Officer of Leo Burnett (Worldwide) (advertising agency) (2001-2005). | 61 | Director of Chicago Community Trust (Regional Community Foundation), Chicago Council on Global Affairs, InnerWorkings (U.S. provider of print procurement solutions to corporate clients), Lurie Children’s Hospital (Chicago, IL), Shirley Ryan Ability Lab and Wrapports, LLC (digital communications company). Formerly, Director of Walmart (until 2017); Director of Chicago Convention & Tourism Bureau (until 2014); and The Field Museum of Natural History (Chicago, IL) (until 2014). |
Janus Investment Fund | 67 |
Janus Henderson All Asset Fund
Trustees and Officers (unaudited)
OFFICERS | |||
Name, Address, and Age | Positions Held with the Trust | Term of Office* and Length of Time Served | Principal Occupations During the Past Five Years |
Paul O'Connor | Executive Vice President and
Portfolio Manager | 6/17-Present (Predecessor Fund: since 11/13) | Head of Multi-Asset of Janus Henderson Investors and Portfolio Manager of other Janus Henderson accounts. Formerly, Head of Asset Allocation at Mercer Partners (2011-2013). |
Bruce L. Koepfgen | President and Chief Executive Officer | 7/14-Present | Head of North America at Janus Henderson Investors and Janus Capital Management LLC (since 2017); Executive Vice President and Director of Janus International Holding LLC (since 2011); Executive Vice President of Janus Distributors LLC (since 2011); Vice President and Director of Intech Investment Management LLC (since 2011); Executive Vice President and Director of Perkins Investment Management LLC (since 2011); and Executive Vice President and Director of Janus Management Holdings Corporation (since 2011). Formerly, President of Janus Capital Group Inc. and Janus Capital Management LLC (2013-2017); Executive Vice President of Janus Services LLC (2011-2015), Janus Capital Group Inc. and Janus Capital Management LLC (2011-2013); and Chief Financial Officer of Janus Capital Group Inc., Janus Capital Management LLC, Janus Distributors LLC, Janus Management Holdings Corporation, and Janus Services LLC (2011-2013). |
68 | JUNE 30, 2018 |
Janus Henderson All Asset Fund
Trustees and Officers (unaudited)
OFFICERS | |||
Name, Address, and Age | Positions Held with the Trust | Term of Office* and Length of Time Served | Principal Occupations During the Past Five Years |
Susan K. Wold | Vice President, Chief Compliance Officer, and Anti-Money Laundering Officer | 9/17-Present | Senior Vice President and Head of Compliance, North America for Janus Henderson (since September 2017); Formerly, Vice President, Head of Global Corporate Compliance, and Chief Compliance Officer for Janus Capital Management LLC (May 2017- September 2017); Vice President, Compliance at Janus Capital Group Inc. and Janus Capital Management LLC (2005-2017). |
Jesper
Nergaard | Chief Financial Officer | 3/05-Present | Vice President of Janus Capital and Janus Services LLC. |
Kathryn L. Santoro | Vice President, Chief Legal Counsel, and Secretary | 12/16-Present | Vice President of Janus Capital and Janus Services LLC (since 2016). Formerly, Vice President and Associate Counsel of Curian Capital, LLC and Curian Clearing LLC (2013-2016); and General Counsel and Secretary (2011-2012) and Vice President (2009-2012) of Old Mutual Capital, Inc. |
* Officers are elected at least annually by the Trustees for a one-year term and may also be elected from time to time by the Trustees for an interim period. | |||
Janus Investment Fund | 69 |
Knowledge. Shared
At Janus Henderson, we believe in the sharing of expert insight for better investment and business decisions. We call this ethos Knowledge. Shared.
Learn more by visiting janushenderson.com.
| ||||||||
This report is submitted for the general information of shareholders of the Fund. It is not an offer or solicitation for the Fund and is not authorized for distribution to prospective investors unless preceded or accompanied by an effective prospectus. | ||||||||
Janus Henderson, Janus, Henderson, Perkins, Intech and Henderson Geneva are trademarks or registered trademarks of Janus Henderson Investors. © Janus Henderson Investors. The name Janus Henderson Investors includes HGI Group Limited, Henderson Global Investors (Brand Management) Sarl and Janus International Holding LLC. Funds distributed by Janus Henderson Distributors | ||||||||
125-02-93074 08-18 | ||||||||

ANNUAL REPORT June 30, 2018 | |||
Janus Henderson Diversified Alternatives Fund | |||
Janus Investment Fund | |||
| |||
HIGHLIGHTS · Portfolio management perspective · Investment strategy behind your fund · Fund performance,
characteristics |
|

Table of Contents
Janus Henderson Diversified Alternatives Fund
Investments | |
Information | |
Janus Henderson Diversified Alternatives Fund (unaudited)


PERFORMANCE SUMMARY
For the 12 months ended June 30, 2018, the Janus Henderson Diversified Alternatives Fund’s Class I Shares returned 1.74%, compared with a return of -0.40% for its primary benchmark, the Bloomberg Barclays U.S. Aggregate Bond Index, and 4.18% for its secondary benchmark, LIBOR + 3%.
MARKET ENVIRONMENT
Aided by optimism about strong economic growth, strengthening fundamentals and U.S. tax reform, risk markets rose through the second half of 2017 and into 2018 despite a hiccup in August as North Korea fired missiles over Japan. Equity markets hit all-time highs and corporate credit spreads reached cycle tights early in 2018. However, investors quickly had to contend with elevated market volatility, stemming in large part from concerns over the pace of rate hikes from the Federal Reserve (Fed). Later in the period, rising trade tensions threatened to weigh on business confidence and the formation of a eurosceptic coalition government in Italy created uncertainty in Europe. Corporate credit spreads widened, with more pronounced widening in investment grade, as tapering demand, debt-funded consolidation activity and steady supply further impacted valuations.
Despite volatility, global stocks delivered strong gains during the period. The prospects of synchronized growth and a U.S. dollar that weakened over much of the period boosted emerging market stocks. The energy sector was among the top performers, benefiting as crude oil prices rose 61%. The Fed ultimately raised rates three times, reflecting near-term confidence in the U.S. economy. However, stable long-term expectations contributed to a flatter yield curve. After cresting 3% intra-period, the yield on the 10-year Treasury note closed the period at 2.86%, up from 2.31% at the period start.
PERFORMANCE DISCUSSION
The Fund outperformed its primary benchmark and underperformed its secondary benchmark during the 12-month period. Over time, the Fund seeks to provide positive absolute returns and offer true diversification with low correlation to stocks and bonds by investing in a portfolio of risk premia strategies.
Despite volatility, three of the Fund’s momentum strategies were able to generate positive returns during the period, with the equity momentum and currency momentum strategies among the leading contributors. The equity momentum strategy was the leading contributor to returns as the period saw equity markets around the world experience continued strong growth despite volatility. This strategy seeks to capture directional momentum in equities through the quantitative analysis of equity index price movement. It outperformed as it was able to capture the strong upward trend in equities.
The currency momentum strategy also delivered positive returns. This strategy, which looks to capture long-term movements in the U.S. dollar versus a basket of foreign currencies, benefited as the dollar generally strengthened during the period.
The commodity roll yield strategy was another leading contributor to returns. This strategy seeks to generate returns by providing liquidity to the most “crowded” section of the commodity futures curve. It is typically short the most active front-month contract and long farther-dated tenors. The strategy benefited from favorable supply/demand dynamics in a number of commodities (i.e., livestock, wheat and natural gas) at different points during the period.
Although many of the Fund’s strategies were able to capitalize on trends during the period, the equity value strategy delivered negative returns. This strategy aims to capture the potential return associated with holding value equities while also being short growth stocks. Value stocks rallied near the end of 2017 and were expected to
Janus Investment Fund | 1 |
Janus Henderson Diversified Alternatives Fund (unaudited)
outperform growth stocks given rising interest rates and the passage of a tax reform bill at the end of 2017. However, the technology sector ultimately led the market higher during the period, causing value to generally underperform growth.
The equity emerging strategy also underperformed. This strategy looks to capture the potential return specifically associated with holding equities in companies of less-developed economies. The noise around potential trade wars during the period weighed on the asset class; investors were concerned that emerging markets, particularly China, would be impacted in the event of a trade dispute, and fled for regions that were perceived as being more insulated.
The rates momentum strategy, which looks to capture the persistence in the movement of interest rates, also delivered negative returns. While the yield of the 10-year Treasury note generally moved higher during the period, it did so in a relatively choppy fashion, which weighed on returns.
DERIVATIVES USAGE
The Fund makes extensive use of derivatives because they are generally the most efficient and liquid way to gain our desired exposures. Swaps are used to take exposures in equity, fixed income and commodity indices. Futures are used to take exposures in commodities, currencies and long-end fixed income markets. Forwards are employed to take exposures in foreign currencies, generally one week in length. In aggregate, these positions contributed to performance during the period.
Please see the Derivative Instruments section in the “Notes to Consolidated Financial Statements” for a discussion of derivatives used by the Fund.
OUTLOOK
The Fund’s model undergoes a monthly rebalancing in which it adjusts its allocations to the 11 risk premia strategies according to the market conditions experienced during the month. This rebalancing process is designed to optimize the weightings of the strategies in order to deliver consistent, absolute returns with low correlation to stocks and bonds and a targeted volatility of 5% to 7%.
The Fund’s model appears to be constructive on continued strength in commodities, as evidenced by increasingly long positions in commodities such as oil. Given the volatility in the segment, however, the allocation to the commodity value strategy was reduced. The allocations to the equity momentum, currency momentum and rates momentum also reduced as the asset classes have been exhibiting indecisive directional movements. Additionally, after being automatically turned off by the Fund’s model in the face of extreme volatility in early 2018, the currency carry strategy, which looks to generate returns by taking advantage of short-term yield differentials between various currencies, was turned back on shortly before the period ended.
Thank you for investing in Janus Henderson Diversified Alternative Fund.
2 | JUNE 30, 2018 |
Janus Henderson Diversified Alternatives Fund (unaudited)
Fund At A Glance
June 30, 2018
Asset Allocation |
|
Commodity | 38.3% |
Equity | 28.6% |
Fixed Income | 17.2% |
Currency | 14.0% |
Cash & Cash Equivalents | 1.9% |
100.0% | |
The allocations shown reflect absolute notional exposures to various asset classes. The allocations are calculated net of cash segregated for future obligations. | |
Janus Investment Fund | 3 |
Janus Henderson Diversified Alternatives Fund (unaudited)
Performance
See important disclosures on the next page. |
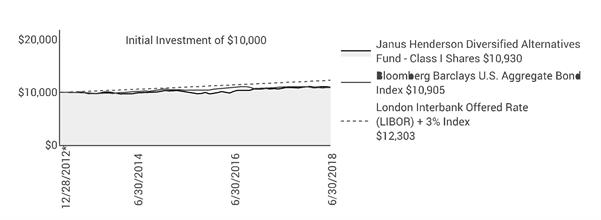
| Expense Ratios - | ||||||||
Average Annual Total Return - for the periods ended June 30, 2018 |
|
| per the October 27, 2017 prospectuses | ||||||
|
| One
| Five
| Since |
|
| Total Annual Fund
| Net Annual Fund
| |
Class A Shares at NAV |
| 1.56% | 1.92% | 1.41% |
|
| 1.62% | 1.36% | |
Class A Shares at MOP |
| -4.28% | 0.72% | 0.33% |
|
|
|
| |
Class C Shares at NAV | 0.81% | 1.27% | 0.76% |
|
| 2.34% | 2.10% | ||
Class C Shares at CDSC |
| -0.18% | 1.27% | 0.76% |
|
|
|
| |
Class D Shares(1) |
| 1.66% | 2.02% | 1.52% |
|
| 1.66% | 1.24% | |
Class I Shares |
| 1.74% | 2.12% | 1.63% |
|
| 1.34% | 1.13% | |
Class N Shares |
| 1.83% | 2.17% | 1.67% |
|
| 1.32% | 1.09% | |
Class S Shares |
| 1.39% | 1.83% | 1.30% |
|
| 1.83% | 1.59% | |
Class T Shares |
| 1.69% | 2.03% | 1.51% |
|
| 1.56% | 1.34% | |
Bloomberg Barclays U.S. Aggregate Bond Index |
| -0.40% | 2.27% | 1.59% |
|
|
|
| |
London Interbank Offered Rate (LIBOR) + 3% Index |
| 4.18% | 3.82% | 3.84%** |
|
|
|
| |
Morningstar Quartile - Class I Shares |
| 3rd | 3rd | 3rd |
|
|
|
| |
Morningstar Ranking - based on total returns for Multialternative Funds |
| 181/394 | 105/192 | 131/180 |
|
|
|
| |
Returns quoted are past performance and do not guarantee future results; current performance may be lower or higher. Investment returns and principal value will vary; there may be a gain or loss when shares are sold. For the most recent month-end performance call 800.668.0434 (or 800.525.3713 if you hold shares directly with Janus Henderson) or visit janushenderson.com/performance (or janushenderson.com/allfunds if you hold shares directly with Janus Henderson).
Maximum Offering Price (MOP) returns include the maximum sales charge of 5.75%. Net Asset Value (NAV) returns exclude this charge, which would have reduced returns.
CDSC returns include a 1% contingent deferred sales charge (CDSC) on Shares redeemed within 12 months of purchase. Net Asset Value (NAV) returns exclude this charge, which would have reduced returns.
Net expense ratios reflect the expense waiver, if any, contractually agreed to through November 1, 2018.
4 | JUNE 30, 2018 |
Janus Henderson Diversified Alternatives Fund (unaudited)
Performance
Performance may be affected by risks that include those associated with non-diversification, portfolio turnover, short sales, potential conflicts of interest, foreign and emerging markets, initial public offerings (IPOs), high-yield and high-risk securities, undervalued, overlooked and smaller capitalization companies, real estate related securities including Real Estate Investment Trusts (REITs), derivatives, and commodity-linked investments. Each product has different risks. Please see the prospectus for more information about risks, holdings and other details.
There is a risk that the Fund’s investments will correlate with stocks and bonds to a greater degree than anticipated, and the investment process may not achieve the desired results. The Fund may underperform during up markets and be negatively affected in down markets. Diversification does not assure a profit or eliminate the risk of loss.
Returns include reinvestment of all dividends and distributions and do not reflect the deduction of taxes that a shareholder would pay on Fund distributions or redemptions of Fund shares. The returns do not include adjustments in accordance with generally accepted accounting principles required at the period end for financial reporting purposes.
See Consolidated Financial Highlights for actual expense ratios during the reporting period.
Ranking is for the share class shown only; other classes may have different performance characteristics. When an expense waiver is in effect, it may have a material effect on the total return, and therefore the ranking for the period.
© 2018 Morningstar, Inc. All Rights Reserved.
There is no assurance that the investment process will consistently lead to successful investing.
See Notes to Consolidated Schedule of Investments and Other Information for index definitions.
Index performance does not reflect the expenses of managing a portfolio as an index is unmanaged and not available for direct investment.
See “Useful Information About Your Fund Report.”
*The Fund’s inception date – December 28, 2012
** The London Interbank Offered Rate (LIBOR) + 3% since inception returns are calculated from December 31, 2012.
(1) Closed to certain new investors.
Janus Investment Fund | 5 |
Janus Henderson Diversified Alternatives Fund (unaudited)
Expense Examples
As a shareholder of the Fund, you incur two types of costs: (1) transaction costs, such as sales charges (loads) on purchase payments (applicable to Class A Shares only); and (2) ongoing costs, including management fees; 12b-1 distribution and shareholder servicing fees; transfer agent fees and expenses payable pursuant to the Transfer Agency Agreement; and other Fund expenses. This example is intended to help you understand your ongoing costs (in dollars) of investing in the Fund and to compare these costs with the ongoing costs of investing in other mutual funds. To do so, compare this 5% hypothetical example with the 5% hypothetical examples that appear in the shareholder reports of the other funds. The example is based upon an investment of $1,000 invested at the beginning of the period and held for the six-months indicated, unless noted otherwise in the table and footnotes below.
Actual Expenses
The information in the table under the heading “Actual” provides information about actual account values and actual expenses. You may use the information in these columns, together with the amount you invested, to estimate the expenses that you paid over the period. Simply divide your account value by $1,000 (for example, an $8,600 account value divided by $1,000 = 8.6), then multiply the result by the number in the appropriate column for your share class under the heading entitled “Expenses Paid During Period” to estimate the expenses you paid on your account during the period.
Hypothetical Example for Comparison Purposes
The information in the table under the heading “Hypothetical (5% return before expenses)” provides information about hypothetical account values and hypothetical expenses based upon the Fund’s actual expense ratio and an assumed rate of return of 5% per year before expenses, which is not the Fund’s actual return. The hypothetical account values and expenses may not be used to estimate the actual ending account balance or expenses you paid for the period. You may use this information to compare the ongoing costs of investing in the Fund and other funds. To do so, compare this 5% hypothetical example with the 5% hypothetical examples that appear in the shareholder reports of the other funds. Additionally, for an analysis of the fees associated with an investment in any share class or other similar funds, please visit www.finra.org/fundanalyzer.
Please note that the expenses shown in the table are meant to highlight your ongoing costs only and do not reflect any transaction costs. These fees are fully described in the Fund’s prospectuses. Therefore, the hypothetical examples are useful in comparing ongoing costs only, and will not help you determine the relative total costs of owning different funds. In addition, if these transaction costs were included, your costs would have been higher.
Actual | Hypothetical | |||||||||
| Beginning | Ending | Expenses |
| Beginning | Ending | Expenses | Net Annualized | ||
Class A Shares | $1,000.00 | $996.00 | $7.03 |
| $1,000.00 | $1,017.75 | $7.10 | 1.42% | ||
Class C Shares | $1,000.00 | $993.00 | $10.53 |
| $1,000.00 | $1,014.23 | $10.64 | 2.13% | ||
Class D Shares | $1,000.00 | $996.10 | $6.14 |
| $1,000.00 | $1,018.65 | $6.21 | 1.24% | ||
Class I Shares | $1,000.00 | $997.00 | $5.94 |
| $1,000.00 | $1,018.84 | $6.01 | 1.20% | ||
Class N Shares | $1,000.00 | $997.10 | $5.45 |
| $1,000.00 | $1,019.34 | $5.51 | 1.10% | ||
Class S Shares | $1,000.00 | $995.00 | $7.27 |
| $1,000.00 | $1,017.50 | $7.35 | 1.47% | ||
Class T Shares | $1,000.00 | $997.00 | $6.34 |
| $1,000.00 | $1,018.45 | $6.41 | 1.28% | ||
† | Expenses Paid During Period are equal to the Net Annualized Expense Ratio multiplied by the average account value over the period, multiplied by 181/365 (to reflect the one-half year period). Expenses in the examples include the effect of applicable fee waivers and/or expense reimbursements, if any. Had such waivers and/or reimbursements not been in effect, your expenses would have been higher. Please refer to the Notes to Consolidated Financial Statements or the Fund’s prospectuses for more information regarding waivers and/or reimbursements. | |||||||||
6 | JUNE 30, 2018 |
Janus Henderson Diversified Alternatives Fund
Consolidated Schedule of Investments
June 30, 2018
Shares or | Value | ||||||
Investment Companies – 6.1% | |||||||
Money Markets – 6.1% | |||||||
Janus Henderson Cash Liquidity Fund LLC, 1.8501%(a),ºº,£ (cost $6,988,466) | 6,988,466 | $6,988,466 | |||||
U.S. Government Agency Notes – 88.3% | |||||||
United States Treasury Bill: | |||||||
0%, 7/12/18◊ | $15,000,000 | 14,993,000 | |||||
0%, 8/9/18◊ | 10,500,000 | 10,479,759 | |||||
0%, 9/6/18◊ | 18,000,000 | 17,937,960 | |||||
0%, 10/11/18†,◊ | 20,000,000 | 19,902,163 | |||||
0%, 11/8/18◊ | 20,000,000 | 19,857,384 | |||||
0%, 12/6/18◊ | 18,000,000 | 17,840,743 | |||||
Total U.S. Government Agency Notes (cost $100,998,617) | 101,011,009 | ||||||
Total Investments (total cost $107,987,083) – 94.4% | 107,999,475 | ||||||
Cash, Receivables and Other Assets, net of Liabilities – 5.6% | 6,444,272 | ||||||
Net Assets – 100% | $114,443,747 | ||||||
Schedules of Affiliated Investments – (% of Net Assets)
Dividend Income | Realized Gain/(Loss) | Change in Unrealized Appreciation/ Depreciation | Value at 6/30/18 | |||||||
Investment Companies - 6.1% | ||||||||||
Money Markets - 6.1% | ||||||||||
Janus Henderson Cash Liquidity Fund LLC, 1.8501%(a)ºº | $ | 105,148 | $ | - | $ | - | $ | 6,988,466 | ||
Share Balance at 6/30/17 | Purchases | Sales | Share Balance at 6/30/18 | |||||||
Investment Companies - 6.1% | ||||||||||
Money Markets - 6.1% | ||||||||||
Janus Henderson Cash Liquidity Fund LLC, 1.8501%(a)ºº | 5,561,820 | 106,376,420 | (104,949,774) | 6,988,466 | ||||||
See Notes to Consolidated Schedule of Investments and Other Information and Notes to Consolidated Financial Statements. | |
Janus Investment Fund | 7 |
Janus Henderson Diversified Alternatives Fund
Consolidated Schedule of Investments
June 30, 2018
Schedule of Forward Foreign Currency Exchange Contracts, Open |
Counterparty/ Foreign Currency | Settlement Date | Foreign Currency Amount (Sold)/ Purchased | USD Currency Amount (Sold)/ Purchased | Market Value and Unrealized Appreciation/ (Depreciation) | ||||
HSBC Securities (USA), Inc.: | ||||||||
Australian Dollar | 7/13/18 | 3,931,000 | $ | (2,907,938) | $ | 705 | ||
Canadian Dollar | 7/13/18 | (1,285,000) | 977,657 | (77) | ||||
Euro | 7/13/18 | (1,700,000) | 1,986,559 | (182) | ||||
Japanese Yen | 7/13/18 | (604,400,000) | 5,456,553 | (7,420) | ||||
New Zealand Dollar | 7/13/18 | 8,629,000 | (5,845,802) | (3,076) | ||||
Norwegian Krone | 7/13/18 | 32,860,000 | (4,034,858) | 3,365 | ||||
Swedish Krona | 7/13/18 | (47,280,000) | 5,286,056 | 1,128 | ||||
Swiss Franc | 7/13/18 | (5,197,000) | 5,242,553 | (12,565) | ||||
Total | $ | (18,122) | ||||||
See Notes to Consolidated Schedule of Investments and Other Information and Notes to Consolidated Financial Statements. | |
8 | JUNE 30, 2018 |
Janus Henderson Diversified Alternatives Fund
Consolidated Schedule of Investments
June 30, 2018
Schedule of Futures
Description | Number of Contracts | Expiration Date | Value and Notional Amount | Unrealized Appreciation/ (Depreciation) | Variation Margin Asset/(Liability) | ||||||||
Futures Purchased: | |||||||||||||
10-Year US Treasury Note | 127 | 9/19/18 | $ | 15,263,813 | $ | (21,864) | $ | 673 | |||||
Brent Crude(a) | 41 | 9/28/18 | 3,219,730 | - | (84) | ||||||||
Copper(a) | 11 | 12/27/18 | 821,700 | (77,478) | (1,378) | ||||||||
Cotton(a) | 75 | 3/7/19 | 3,137,250 | (96,442) | (4,669) | ||||||||
Euro-Bund | 127 | 9/6/18 | 24,105,946 | 129,860 | 10,843 | ||||||||
Gold(a) | 7 | 10/29/18 | 882,140 | (37,725) | 2,085 | ||||||||
S&P 500 E-mini | 116 | 9/21/18 | 15,784,700 | (12,605) | 9,359 | ||||||||
Silver(a) | 10 | 12/27/18 | 815,800 | (10,207) | 7,850 | ||||||||
US Dollar Index | 217 | 9/17/18 | 20,473,733 | 256,928 | (202,139) | ||||||||
Wheat(a) | 89 | 3/14/19 | 2,368,513 | (12,238) | (12,509) | ||||||||
WTI Crude(a) | 43 | 8/21/18 | 3,115,780 | (430) | (550) | ||||||||
Total - Futures Purchased | 117,799 | (190,519) | |||||||||||
Futures Sold: | |||||||||||||
Coffee(a) | 18 | 12/18/18 | 800,213 | 23,963 | 4,388 | ||||||||
Corn(a) | 45 | 12/14/18 | 835,313 | 55,363 | (11,294) | ||||||||
Live Cattle(a) | 18 | 12/31/18 | 818,640 | (15,769) | (17,100) | ||||||||
Soybean(a) | 18 | 1/14/19 | 800,100 | 26,256 | 2,964 | ||||||||
Sugar(a) | 57 | 2/28/19 | 826,728 | 47,904 | (1,885) | ||||||||
Wheat(a) | 33 | 12/14/18 | 852,638 | 60,838 | (26,744) | ||||||||
Total - Futures Sold | 198,555 | (49,671) | |||||||||||
Total | $ | 316,354 | $ | (240,190) | |||||||||
See Notes to Consolidated Schedule of Investments and Other Information and Notes to Consolidated Financial Statements. | |
Janus Investment Fund | 9 |
Janus Henderson Diversified Alternatives Fund
Consolidated Schedule of Investments
June 30, 2018
Schedule of Total Return Swaps | |||||||||||
Counterparty/ Return Paid by the Fund | Return Received by the Fund | Payment Frequency | Termination Date | Notional Amount | Value and Unrealized Appreciation/ (Depreciation) | ||||||
Barclays Capital, Inc.:
3 month USD LIBOR plus 20 basis points | Bloomberg Barclays U.S. Credit RBI Series-1 Index | Monthly | 8/1/18 | 24,700,000 | USD | $ | (3,649) |
BNP Paribas:
Minus 20 basis points | A long/short basket of equity indices(1) | Monthly | 7/31/18 | 25,100,000 | USD | - | |||||
Plus 40 basis points | A long/short basket of equity indices(2) | Monthly | 7/31/18 | 31,700,000 | USD | - | |||||
- |
Goldman Sachs International:
1 month USD LIBOR plus 90 basis points | MSCI Daily Total Return Net Emerging Markets | Monthly | 7/5/18 | (16,898,631) | USD | 37 | |||||
MSCI Daily Total Return Gross World USD | 1 month USD LIBOR Plus 25 basis points | Monthly | 7/5/18 | 16,899,925 | USD | 188 | |||||
225 |
JPMorgan Chase & Co.:
Plus 13 basis points(a) | A long/short basket of commodity indices(3) | Monthly | 7/31/18 | 123,100,000 | USD | 6,400 | |||||
Total | $ | 2,976 |
(1) Long Index – Russell 2000 Total Return Index, Short Index – Russell 1000 Total Return Index
(2) Long Index – S&P 500 Pure Value TR Index, Short Index – S&P 500 Pure Growth TR Index
(3) Long Index – Bloomberg Commodity Index 2-4-6 Forward Blend, Short Index – Bloomberg Commodity Index
See Notes to Consolidated Schedule of Investments and Other Information and Notes to Consolidated Financial Statements. | |
10 | JUNE 30, 2018 |
Janus Henderson Diversified Alternatives Fund
Consolidated Schedule of Investments
June 30, 2018
The following table, grouped by derivative type, provides information about the fair value and location of derivatives within the Consolidated Statement of Assets and Liabilities as of June 30, 2018.
Fair Value of Derivative Instruments (not accounted for as hedging instruments) as of June 30, 2018 | ||||||||||||||
|
|
|
| Commodity |
| Credit |
| Currency |
| Equity |
| Interest Rate |
| Total |
Asset Derivatives: | ||||||||||||||
Forward foreign currency exchange contracts | $ - | $ - | $ 5,198 | $ - | $ - | $ 5,198 | ||||||||
Outstanding swap contracts, at value | 6,400 | - | - | 225 | - | 6,625 | ||||||||
Variation margin receivable | 17,287 | (a) | - | - | 9,359 | (a) | 11,516 | 38,162 | ||||||
Total Asset Derivatives |
| $ 23,687 |
| $ - |
| $ 5,198 |
| $ 9,584 |
| $ 11,516 |
| $ 49,985 | ||
| ||||||||||||||
Liability Derivatives: | ||||||||||||||
Forward foreign currency exchange contracts | $ - | $ - | $ 23,320 | $ - | $ - | $ 23,320 | ||||||||
Outstanding swap contracts, at value | - | 3,649 | - | - | - | 3,649 | ||||||||
Variation margin payable | 76,213 | (a) | - | 202,139 | (a) | - | - | 278,352 | ||||||
Total Liability Derivatives |
| $ 76,213 |
| $ 3,649 |
| $225,459 |
| $ - |
| $ - |
| $305,321 | ||
(a) Amounts relate to variation margin for futures. | ||||||||||||||
The following tables provide information about the effect of derivatives and hedging activities on the Fund’s Consolidated Statement of Operations for the year ended June 30, 2018.
The effect of Derivative Instruments (not accounted for as hedging instruments) on the Consolidated Statement of Operations for the year ended June 30, 2018 | |||||||||||||
Amount of Realized Gain/(Loss) Recognized on Derivatives | |||||||||||||
Derivative | Commodity |
| Credit |
| Currency |
| Equity |
| Interest Rate |
| Total | ||
Futures contracts | $1,117,569 | $ - | $1,158,330 | $1,161,627 | $ (543,279) | $2,894,247 | |||||||
Forward foreign currency exchange contracts | - | - | (287,934) | - | - | (287,934) | |||||||
Swap contracts | 1,051,133 | (1,030,092) | - | (1,765,778) | - | (1,744,737) | |||||||
Total | $2,168,702 |
| $(1,030,092) |
| $ 870,396 |
| $ (604,151) |
| $ (543,279) |
| $ 861,576 | ||
Amount of Change in Unrealized Appreciation/Depreciation Recognized on Derivatives | |||||||||||||
Derivative | Commodity |
| Credit |
| Currency |
| Equity |
| Interest Rate |
| Total | ||
Futures contracts | $ 222,679 | $ - | $ (20,199) | $ 50,848 | $ 90,239 | $ 343,567 | |||||||
Forward foreign currency exchange contracts | - | - | (29,765) | - | - | (29,765) | |||||||
Swap contracts | 6,382 | (7,005) | - | (3,859) | - | (4,482) | |||||||
Total | $ 229,061 |
| $ (7,005) |
| $ (49,964) |
| $ 46,989 |
| $ 90,239 |
| $ 309,320 | ||
Please see the “Net Realized Gain/(Loss) on Investments” and “Change in Unrealized Net Appreciation/Depreciation” sections of the Fund’s Consolidated Statement of Operations.
See Notes to Consolidated Schedule of Investments and Other Information and Notes to Consolidated Financial Statements. | |
Janus Investment Fund | 11 |
Janus Henderson Diversified Alternatives Fund
Consolidated Schedule of Investments
June 30, 2018
Average Ending Monthly Market Value of Derivative Instruments During the Year Ended June 30, 2018 | |
| Market Value |
Forward foreign currency exchange contracts, purchased | $ 6,790,213 |
Forward foreign currency exchange contracts, sold | 9,627,093 |
Futures contracts, purchased | 48,909,413 |
Futures contracts, sold | 45,278,688 |
Total return swaps, long | 4,434 |
Total return swaps, short | (7,645) |
See Notes to Consolidated Schedule of Investments and Other Information and Notes to Consolidated Financial Statements. | |
12 | JUNE 30, 2018 |
Janus Henderson Diversified Alternatives Fund
Notes to Consolidated Schedule of Investments and Other Information
Bloomberg Barclays U.S. Aggregate Bond Index | Bloomberg Barclays U.S. Aggregate Bond Index is a broad-based measure of the investment grade, US dollar-denominated, fixed-rate taxable bond market. |
London Interbank Offered Rate (LIBOR) | LIBOR (London Interbank Offered Rate) is a short-term interest rate that banks offer one another and generally represents current cash rates. |
S&P 500® Index | S&P 500® Index reflects U.S. large-cap equity performance and represents broad U.S. equity market performance. |
LLC | Limited Liability Company |
(a) | All or a portion of this security is owned by Janus Diversified Alternatives Subsidiary, Ltd. See Note 1 in Notes to Consolidated Financial Statements. |
† | All or a portion of this security has been segregated at the Fund’s custodian or counterparty to cover forward foreign currency exchange contracts, exchange-traded derivatives, centrally cleared derivatives, short sales, and/or securities with extended settlement dates. Assets segregated at the Fund’s custodian or counterparty are evaluated daily to ensure their cover and/or market value equals or exceeds the current market value of the Fund’s corresponding obligation value. |
ºº | Rate shown is the 7-day yield as of June 30, 2018. |
◊ | Zero coupon bond. |
£ | The Fund may invest in certain securities that are considered affiliated companies. As defined by the Investment Company Act of 1940, as amended, an affiliated company is one in which the Fund owns 5% or more of the outstanding voting securities, or a company which is under common ownership or control. |
Janus Investment Fund | 13 |
Janus Henderson Diversified Alternatives Fund
Notes to Consolidated Schedule of Investments and Other Information
The following is a summary of the inputs that were used to value the Fund’s investments in securities and other financial instruments as of June 30, 2018. See Notes to Consolidated Financial Statements for more information. | |||||||||||||
Valuation Inputs Summary | |||||||||||||
Level 2 - | Level 3 - | ||||||||||||
Level 1 - | Other Significant | Significant | |||||||||||
Quotes Prices | Observable Inputs | Unobservable Inputs | |||||||||||
Assets | |||||||||||||
Investments in Securities: | |||||||||||||
Investment Companies | $ | - | $ | 6,988,466 | $ | - | |||||||
U.S. Government Agency Notes | - | 101,011,009 | - | ||||||||||
Total Investments in Securities | $ | - | $ | 107,999,475 | $ | - | |||||||
Other Financial Instruments(a): | |||||||||||||
Forward Foreign Currency Exchange Contracts | $ | - | $ | 5,198 | $ | - | |||||||
Outstanding Swap Contracts, at Value | - | 6,625 | - | ||||||||||
Variation Margin Receivable | 38,162 | - | - | ||||||||||
Total Assets | $ | 38,162 | $ | 108,011,298 | $ | - | |||||||
Liabilities | |||||||||||||
Other Financial Instruments(a): | |||||||||||||
Forward Foreign Currency Exchange Contracts | $ | - | $ | 23,320 | $ | - | |||||||
Outstanding Swap Contracts, at Value | - | 3,649 | - | ||||||||||
Variation Margin Payable | 278,352 | - | - | ||||||||||
Total Liabilities | $ | 278,352 | $ | 26,969 | $ | - | |||||||
(a) | Other financial instruments include forward foreign currency exchange, futures, written options, written swaptions, and swap contracts. Forward foreign currency exchange contracts are reported at their unrealized appreciation/(depreciation) at measurement date, which represents the change in the contract's value from trade date. Futures, certain written options on futures, and centrally cleared swap contracts are reported at their variation margin at measurement date, which represents the amount due to/from the Fund at that date. Written options, written swaptions, and other swap contracts are reported at their market value at measurement date. | ||||||||||||
14 | JUNE 30, 2018 |
Janus Henderson Diversified Alternatives Fund
Consolidated Statement of Assets and Liabilities
June 30, 2018
See footnotes at the end of the Consolidated Statement. |
|
|
|
|
|
|
|
Assets: | ||||||
Unaffiliated investments, at value(1) | $ | 101,011,009 | ||||
Affiliated investments, at value(2) | 6,988,466 | |||||
Cash | 879,885 | |||||
Deposits with brokers for futures | 2,250,000 | |||||
Deposits with brokers for OTC derivatives | 4,340,000 | |||||
Forward foreign currency exchange contracts | 5,198 | |||||
Outstanding swap contracts, at value | 6,625 | |||||
Variation margin receivable | 38,162 | |||||
Non-interested Trustees' deferred compensation | 2,391 | |||||
Receivables: | ||||||
Fund shares sold | 331,352 | |||||
Dividends and interest on swap contracts | 27,210 | |||||
Dividends from affiliates | 13,915 | |||||
Foreign tax reclaims | 454 | |||||
Other assets | 100,463 | |||||
Total Assets |
|
| 115,995,130 |
| ||
Liabilities: | ||||||
Forward foreign currency exchange contracts | 23,320 | |||||
Outstanding swap contracts, at value | 3,649 | |||||
Variation margin payable | 278,352 | |||||
Payables: | — | |||||
Investments purchased | 895,537 | |||||
Dividends and interest on swap contracts | 99,826 | |||||
Advisory fees | 81,145 | |||||
Professional fees | 49,989 | |||||
Fund shares repurchased | 34,456 | |||||
Non-affiliated fund administration fees payable | 20,266 | |||||
Transfer agent fees and expenses | 6,023 | |||||
12b-1 Distribution and shareholder servicing fees | 3,010 | |||||
Non-interested Trustees' deferred compensation fees | 2,391 | |||||
Custodian fees | 1,381 | |||||
Non-interested Trustees' fees and expenses | 817 | |||||
Affiliated fund administration fees payable | 243 | |||||
Accrued expenses and other payables | 50,978 | |||||
Total Liabilities |
|
| 1,551,383 |
| ||
Net Assets |
| $ | 114,443,747 |
| ||
See Notes to Consolidated Financial Statements. | |
Janus Investment Fund | 15 |
Janus Henderson Diversified Alternatives Fund
Consolidated Statement of Assets and Liabilities
June 30, 2018
|
|
|
|
|
|
|
Net Assets Consist of: | ||||||
Capital (par value and paid-in surplus) | $ | 114,763,585 | ||||
Undistributed net investment income/(loss) | 676,199 | |||||
Undistributed net realized gain/(loss) from investments and foreign currency transactions | (1,309,872) | |||||
Unrealized net appreciation/(depreciation) of investments, foreign currency translations and non-interested Trustees’ deferred compensation | 313,835 | |||||
Total Net Assets |
| $ | 114,443,747 |
| ||
Net Assets - Class A Shares | $ | 3,941,300 | ||||
Shares Outstanding, $0.01 Par Value (unlimited shares authorized) | 392,048 | |||||
Net Asset Value Per Share(3) |
| $ | 10.05 |
| ||
Maximum Offering Price Per Share(4) |
| $ | 10.66 |
| ||
Net Assets - Class C Shares | $ | 2,188,403 | ||||
Shares Outstanding, $0.01 Par Value (unlimited shares authorized) | 221,975 | |||||
Net Asset Value Per Share(3) |
| $ | 9.86 |
| ||
Net Assets - Class D Shares | $ | 5,168,723 | ||||
Shares Outstanding, $0.01 Par Value (unlimited shares authorized) | 511,940 | |||||
Net Asset Value Per Share |
| $ | 10.10 |
| ||
Net Assets - Class I Shares | $ | 19,706,928 | ||||
Shares Outstanding, $0.01 Par Value (unlimited shares authorized) | 1,948,637 | |||||
Net Asset Value Per Share |
| $ | 10.11 |
| ||
Net Assets - Class N Shares | $ | 75,615,044 | ||||
Shares Outstanding, $0.01 Par Value (unlimited shares authorized) | 7,452,583 | |||||
Net Asset Value Per Share |
| $ | 10.15 |
| ||
Net Assets - Class S Shares | $ | 1,472,958 | ||||
Shares Outstanding, $0.01 Par Value (unlimited shares authorized) | 147,237 | |||||
Net Asset Value Per Share |
| $ | 10.00 |
| ||
Net Assets - Class T Shares | $ | 6,350,391 | ||||
Shares Outstanding, $0.01 Par Value (unlimited shares authorized) | 631,936 | |||||
Net Asset Value Per Share |
| $ | 10.05 |
| ||
(1) Includes cost of $100,998,617. (2) Includes cost of $6,988,466. (3) Redemption price per share may be reduced for any applicable contingent deferred sales charge. (4) Maximum offering price is computed at 100/94.25 of net asset value. |
See Notes to Consolidated Financial Statements. | |
16 | JUNE 30, 2018 |
Janus Henderson Diversified Alternatives Fund
Consolidated Statement of Operations
For the year ended June 30, 2018
|
|
|
|
|
|
Investment Income: | |||||
| Interest | $ | 1,124,140 | ||
Dividends from affiliates | 105,148 | ||||
Other income | 14,555 | ||||
Total Investment Income |
| 1,243,843 |
| ||
Expenses: | |||||
Advisory fees | 1,076,151 | ||||
12b-1 Distribution and shareholder servicing fees: | |||||
Class A Shares | 7,770 | ||||
Class C Shares | 21,571 | ||||
Class S Shares | 3,691 | ||||
Transfer agent administrative fees and expenses: | |||||
Class D Shares | 6,026 | ||||
Class S Shares | 3,691 | ||||
Class T Shares | 12,768 | ||||
Transfer agent networking and omnibus fees: | |||||
Class A Shares | 1,252 | ||||
Class C Shares | 597 | ||||
Class I Shares | 10,793 | ||||
Other transfer agent fees and expenses: | |||||
Class A Shares | 336 | ||||
Class C Shares | 214 | ||||
Class D Shares | 1,528 | ||||
Class I Shares | 589 | ||||
Class N Shares | 2,098 | ||||
Class S Shares | 26 | ||||
Class T Shares | 125 | ||||
Registration fees | 109,809 | ||||
Professional fees | 65,832 | ||||
Shareholder reports expense | 36,525 | ||||
Non-affiliated fund administration fees | 20,267 | ||||
Custodian fees | 13,422 | ||||
Affiliated fund administration fees | 5,935 | ||||
Non-interested Trustees’ fees and expenses | 3,139 | ||||
Other expenses | 8,366 | ||||
Total Expenses |
| 1,412,521 |
| ||
Less: Excess Expense Reimbursement and Waivers |
| (235,842) |
| ||
Net Expenses |
| 1,176,679 |
| ||
Net Investment Income/(Loss) |
| 67,164 |
| ||
Net Realized Gain/(Loss) on Investments: | |||||
Investments and foreign currency transactions | 19,336 | ||||
Forward foreign currency exchange contracts | (287,934) | ||||
Futures contracts | 2,894,247 | ||||
Swap contracts | (1,744,737) | ||||
Total Net Realized Gain/(Loss) on Investments |
| 880,912 |
| ||
Change in Unrealized Net Appreciation/Depreciation: | |||||
Investments, foreign currency translations and non-interested Trustees’ deferred compensation | 12,938 | ||||
Forward foreign currency exchange contracts | (29,765) | ||||
Futures contracts | 343,567 | ||||
Swap contracts | (4,482) | ||||
Total Change in Unrealized Net Appreciation/Depreciation |
| 322,258 |
| ||
Net Increase/(Decrease) in Net Assets Resulting from Operations | $ | 1,270,334 |
| ||
See Notes to Consolidated Financial Statements. | |
Janus Investment Fund | 17 |
Janus Henderson Diversified Alternatives Fund
Consolidated Statements of Changes in Net Assets
|
|
| Year
ended |
| Year ended | |||
Operations: | ||||||||
Net investment income/(loss) | $ | 67,164 | $ | (581,252) | ||||
Net realized gain/(loss) on investments | 880,912 | 5,436,962 | ||||||
Change in unrealized net appreciation/depreciation | 322,258 | (1,392,807) | ||||||
Net Increase/(Decrease) in Net Assets Resulting from Operations |
| 1,270,334 |
|
| 3,462,903 | |||
Dividends and Distributions to Shareholders: | ||||||||
Dividends from Net Investment Income | ||||||||
Class A Shares | (39,665) | (84,982) | ||||||
Class C Shares | (3,459) | (39,641) | ||||||
Class D Shares | (62,629) | (129,036) | ||||||
Class I Shares | (208,324) | (105,459) | ||||||
Class N Shares | (1,223,347) | (1,334,148) | ||||||
Class S Shares | (13,853) | (41,439) | ||||||
Class T Shares | (77,225) | (70,488) | ||||||
| Total Dividends from Net Investment Income |
| (1,628,502) |
|
| (1,805,193) | ||
Distributions from Net Realized Gain from Investment Transactions | ||||||||
Class A Shares | (43,076) | — | ||||||
Class C Shares | (28,894) | — | ||||||
Class D Shares | (62,973) | — | ||||||
Class I Shares | (172,208) | — | ||||||
Class N Shares | (1,013,987) | — | ||||||
Class S Shares | (19,521) | — | ||||||
Class T Shares | (70,833) | — | ||||||
| Total Distributions from Net Realized Gain from Investment Transactions | (1,411,492) |
|
| — | |||
Net Decrease from Dividends and Distributions to Shareholders |
| (3,039,994) |
|
| (1,805,193) | |||
Capital Share Transactions: | ||||||||
Class A Shares | 1,696,051 | (648,350) | ||||||
Class C Shares | 137,371 | 280,356 | ||||||
Class D Shares | 361,550 | (8,871) | ||||||
Class I Shares | 13,307,958 | 4,238,843 | ||||||
Class N Shares | 26,406,111 | 1,786,193 | ||||||
Class S Shares | 34,374 | 41,439 | ||||||
Class T Shares | 2,750,667 | 2,073,135 | ||||||
Net Increase/(Decrease) from Capital Share Transactions |
| 44,694,082 |
|
| 7,762,745 | |||
Net Increase/(Decrease) in Net Assets |
| 42,924,422 |
|
| 9,420,455 | |||
Net Assets: | ||||||||
Beginning of period | 71,519,325 | 62,098,870 | ||||||
| End of period | $ | 114,443,747 |
| $ | 71,519,325 | ||
Undistributed Net Investment Income/(Loss) | $ | 676,199 |
| $ | 551,752 | |||
See Notes to Consolidated Financial Statements. | |
18 | JUNE 30, 2018 |
Janus Henderson Diversified Alternatives Fund
Consolidated Financial Highlights
Class A Shares | ||||||||||||||||||
For a share outstanding during each year ended June 30 |
| 2018 |
|
| 2017 |
|
| 2016 |
|
| 2015 |
|
| 2014 |
| |||
Net Asset Value, Beginning of Period |
| $10.16 |
|
| $9.92 |
|
| $9.98 |
|
| $9.84 |
|
| $9.82 |
| |||
Income/(Loss) from Investment Operations: | ||||||||||||||||||
Net investment income/(loss)(1) | (0.02) | (0.11) | (0.14) | (0.15) | (0.13) | |||||||||||||
Net realized and unrealized gain/(loss) | 0.18 | 0.63 | 0.18 | 0.37 | 0.15 | |||||||||||||
Total from Investment Operations |
| 0.16 |
|
| 0.52 |
|
| 0.04 |
|
| 0.22 |
|
| 0.02 |
| |||
Less Dividends and Distributions: | ||||||||||||||||||
Dividends (from net investment income) | (0.13) | (0.28) | — | — | — | |||||||||||||
Distributions (from capital gains) | (0.14) | — | (0.10) | (0.08) | — | |||||||||||||
Total Dividends and Distributions |
| (0.27) |
|
| (0.28) |
|
| (0.10) |
|
| (0.08) |
|
| — |
| |||
Net Asset Value, End of Period | $10.05 | $10.16 | $9.92 | $9.98 | $9.84 | |||||||||||||
Total Return* |
| 1.46%(2) |
|
| 5.29% |
|
| 0.42% |
|
| 2.22% |
|
| 0.20% |
| |||
Net Assets, End of Period (in thousands) | $3,941 | $2,297 | $2,882 | $2,740 | $4,055 | |||||||||||||
Average Net Assets for the Period (in thousands) | $3,110 | $2,737 | $2,730 | $2,048 | $3,752 | |||||||||||||
Ratios to Average Net Assets**: |
|
|
|
|
|
|
|
|
|
|
|
|
|
|
| |||
Ratio of Gross Expenses | 1.68% | 1.83% | 1.89% | 1.84% | 1.70% | |||||||||||||
Ratio of Net Expenses (After Waivers and Expense Offsets) | 1.44% | 1.54% | 1.53% | 1.52% | 1.46% | |||||||||||||
Ratio of Net Investment Income/(Loss) | (0.23)% | (1.13)% | (1.42)% | (1.51)% | (1.34)% | |||||||||||||
Portfolio Turnover Rate | 0% | 16% | 0% | 0% | 59% | |||||||||||||
1 | ||||||||||||||||||
Class C Shares | ||||||||||||||||||
For a share outstanding during each year ended June 30 |
| 2018 |
|
| 2017 |
|
| 2016 |
|
| 2015 |
|
| 2014 |
| |||
Net Asset Value, Beginning of Period |
| $9.94 |
|
| $9.72 |
|
| $9.84 |
|
| $9.79 |
|
| $9.78 |
| |||
Income/(Loss) from Investment Operations: | ||||||||||||||||||
Net investment income/(loss)(1) | (0.14) | (0.18) | (0.21) | (0.23) | (0.15) | |||||||||||||
Net realized and unrealized gain/(loss) | 0.22 | 0.61 | 0.19 | 0.36 | 0.16 | |||||||||||||
Total from Investment Operations |
| 0.08 |
|
| 0.43 |
|
| (0.02) |
|
| 0.13 |
|
| 0.01 |
| |||
Less Dividends and Distributions: | ||||||||||||||||||
Dividends (from net investment income) | (0.02) | (0.21) | — | — | — | |||||||||||||
Distributions (from capital gains) | (0.14) | — | (0.10) | (0.08) | — | |||||||||||||
Total Dividends and Distributions |
| (0.16) |
|
| (0.21) |
|
| (0.10) |
|
| (0.08) |
|
| — |
| |||
Net Asset Value, End of Period | $9.86 | $9.94 | $9.72 | $9.84 | $9.79 | |||||||||||||
Total Return* |
| 0.71%(2) |
|
| 4.48% |
|
| (0.19)% |
|
| 1.31% |
|
| 0.10% |
| |||
Net Assets, End of Period (in thousands) | $2,188 | $2,071 | $1,749 | $1,709 | $3,516 | |||||||||||||
Average Net Assets for the Period (in thousands) | $2,162 | $1,885 | $1,685 | $1,752 | $3,551 | |||||||||||||
Ratios to Average Net Assets**: |
|
|
|
|
|
|
|
|
|
|
|
|
|
|
| |||
Ratio of Gross Expenses | 2.44% | 2.56% | 2.63% | 2.59% | 1.89% | |||||||||||||
Ratio of Net Expenses (After Waivers and Expense Offsets) | 2.18% | 2.29% | 2.27% | 2.26% | 1.64% | |||||||||||||
Ratio of Net Investment Income/(Loss) | (1.42)% | (1.85)% | (2.15)% | (2.26)% | (1.52)% | |||||||||||||
Portfolio Turnover Rate | 0% | 16% | 0% | 0% | 59% | |||||||||||||
* Total return not annualized for periods of less than one full year. ** Annualized for periods of less than one full year. (1) Per share amounts are calculated based on average shares outstanding during the year or period. (2) The return includes adjustments in accordance with generally accepted accounting principles required at period end date. |
See Notes to Consolidated Financial Statements. | |
Janus Investment Fund | 19 |
Janus Henderson Diversified Alternatives Fund
Consolidated Financial Highlights
Class D Shares | ||||||||||||||||||
For a share outstanding during each year ended June 30 |
| 2018 |
|
| 2017 |
|
| 2016 |
|
| 2015 |
|
| 2014 |
| |||
Net Asset Value, Beginning of Period |
| $10.20 |
|
| $9.96 |
|
| $10.00 |
|
| $9.85 |
|
| $9.82 |
| |||
Income/(Loss) from Investment Operations: | ||||||||||||||||||
Net investment income/(loss)(1) | (0.06) | (0.10) | (0.13) | (0.14) | (0.13) | |||||||||||||
Net realized and unrealized gain/(loss) | 0.24 | 0.63 | 0.19 | 0.37 | 0.16 | |||||||||||||
Total from Investment Operations |
| 0.18 |
|
| 0.53 |
|
| 0.06 |
|
| 0.23 |
|
| 0.03 |
| |||
Less Dividends and Distributions: | ||||||||||||||||||
Dividends (from net investment income) | (0.14) | (0.29) | — | — | — | |||||||||||||
Distributions (from capital gains) | (0.14) | — | (0.10) | (0.08) | — | |||||||||||||
Total Dividends and Distributions |
| (0.28) |
|
| (0.29) |
|
| (0.10) |
|
| (0.08) |
|
| — |
| |||
Net Asset Value, End of Period | $10.10 | $10.20 | $9.96 | $10.00 | $9.85 | |||||||||||||
Total Return* |
| 1.66% |
|
| 5.38% |
|
| 0.62% |
|
| 2.32% |
|
| 0.31% |
| |||
Net Assets, End of Period (in thousands) | $5,169 | $4,857 | $4,758 | $3,060 | $6,170 | |||||||||||||
Average Net Assets for the Period (in thousands) | $5,034 | $4,638 | $3,829 | $3,281 | $5,964 | |||||||||||||
Ratios to Average Net Assets**: |
|
|
|
|
|
|
|
|
|
|
|
|
|
|
| |||
Ratio of Gross Expenses | 1.75% | 1.87% | 2.05% | 1.96% | 1.66% | |||||||||||||
Ratio of Net Expenses (After Waivers and Expense Offsets) | 1.30% | 1.41% | 1.42% | 1.43% | 1.41% | |||||||||||||
Ratio of Net Investment Income/(Loss) | (0.60)% | (0.97)% | (1.30)% | (1.42)% | (1.28)% | |||||||||||||
Portfolio Turnover Rate | 0% | 16% | 0% | 0% | 59% | |||||||||||||
Class I Shares | ||||||||||||||||||
For a share outstanding during each year ended June 30 |
| 2018 |
|
| 2017 |
|
| 2016 |
|
| 2015 |
|
| 2014 |
| |||
Net Asset Value, Beginning of Period |
| $10.24 |
|
| $10.00 |
|
| $10.02 |
|
| $9.87 |
|
| $9.83 |
| |||
Income/(Loss) from Investment Operations: | ||||||||||||||||||
Net investment income/(loss)(1) | 0.02 | (0.08) | (0.11) | (0.13) | (0.11) | |||||||||||||
Net realized and unrealized gain/(loss) | 0.15 | 0.63 | 0.19 | 0.36 | 0.15 | |||||||||||||
Total from Investment Operations |
| 0.17 |
|
| 0.55 |
|
| 0.08 |
|
| 0.23 |
|
| 0.04 |
| |||
Less Dividends and Distributions: | ||||||||||||||||||
Dividends (from net investment income) | (0.16) | (0.31) | — | — | — | |||||||||||||
Distributions (from capital gains) | (0.14) | — | (0.10) | (0.08) | — | |||||||||||||
Total Dividends and Distributions |
| (0.30) |
|
| (0.31) |
|
| (0.10) |
|
| (0.08) |
|
| — |
| |||
Net Asset Value, End of Period | $10.11 | $10.24 | $10.00 | $10.02 | $9.87 | |||||||||||||
Total Return* |
| 1.64%(2) |
|
| 5.51% |
|
| 0.82% |
|
| 2.32% |
|
| 0.41% |
| |||
Net Assets, End of Period (in thousands) | $19,707 | $6,713 | $2,383 | $2,265 | $5,727 | |||||||||||||
Average Net Assets for the Period (in thousands) | $12,386 | $4,396 | $2,318 | $2,586 | $6,201 | |||||||||||||
Ratios to Average Net Assets**: |
|
|
|
|
|
|
|
|
|
|
|
|
|
|
| |||
Ratio of Gross Expenses | 1.45% | 1.55% | 1.63% | 1.59% | 1.50% | |||||||||||||
Ratio of Net Expenses (After Waivers and Expense Offsets) | 1.22% | 1.31% | 1.27% | 1.26% | 1.25% | |||||||||||||
Ratio of Net Investment Income/(Loss) | 0.24% | (0.81)% | (1.16)% | (1.26)% | (1.13)% | |||||||||||||
Portfolio Turnover Rate | 0% | 16% | 0% | 0% | 59% | |||||||||||||
* Total return not annualized for periods of less than one full year. ** Annualized for periods of less than one full year. (1) Per share amounts are calculated based on average shares outstanding during the year or period. (2) The return includes adjustments in accordance with generally accepted accounting principles required at period end date. |
See Notes to Consolidated Financial Statements. | |
20 | JUNE 30, 2018 |
Janus Henderson Diversified Alternatives Fund
Consolidated Financial Highlights
Class N Shares | ||||||||||||||||||
For a share outstanding during each year ended June 30 |
| 2018 |
|
| 2017 |
|
| 2016 |
|
| 2015 |
|
| 2014 |
| |||
Net Asset Value, Beginning of Period |
| $10.26 |
|
| $10.01 |
|
| $10.04 |
|
| $9.87 |
|
| $9.83 |
| |||
Income/(Loss) from Investment Operations: | ||||||||||||||||||
Net investment income/(loss)(1) | 0.02 | (0.08) | (0.11) | (0.13) | (0.11) | |||||||||||||
Net realized and unrealized gain/(loss) | 0.17 | 0.63 | 0.18 | 0.38 | 0.15 | |||||||||||||
Total from Investment Operations |
| 0.19 |
|
| 0.55 |
|
| 0.07 |
|
| 0.25 |
|
| 0.04 |
| |||
Less Dividends and Distributions: | ||||||||||||||||||
Dividends (from net investment income) | (0.16) | (0.30) | — | — | — | |||||||||||||
Distributions (from capital gains) | (0.14) | — | (0.10) | (0.08) | — | |||||||||||||
Total Dividends and Distributions |
| (0.30) |
|
| (0.30) |
|
| (0.10) |
|
| (0.08) |
|
| — |
| |||
Net Asset Value, End of Period | $10.15 | $10.26 | $10.01 | $10.04 | $9.87 | |||||||||||||
Total Return* |
| 1.83% |
|
| 5.58% |
|
| 0.72% |
|
| 2.52% |
|
| 0.41% |
| |||
Net Assets, End of Period (in thousands) | $75,615 | $50,421 | $47,367 | $52,478 | $57,190 | |||||||||||||
Average Net Assets for the Period (in thousands) | $68,132 | $47,482 | $48,364 | $54,416 | $57,130 | |||||||||||||
Ratios to Average Net Assets**: |
|
|
|
|
|
|
|
|
|
|
|
|
|
|
| |||
Ratio of Gross Expenses | 1.36% | 1.53% | 1.62% | 1.60% | 1.49% | |||||||||||||
Ratio of Net Expenses (After Waivers and Expense Offsets) | 1.14% | 1.26% | 1.25% | 1.25% | 1.25% | |||||||||||||
Ratio of Net Investment Income/(Loss) | 0.17% | (0.83)% | (1.14)% | (1.24)% | (1.13)% | |||||||||||||
Portfolio Turnover Rate | 0% | 16% | 0% | 0% | 59% | |||||||||||||
Class S Shares | ||||||||||||||||||
For a share outstanding during each year ended June 30 |
| 2018 |
|
| 2017 |
|
| 2016 |
|
| 2015 |
|
| 2014 |
| |||
Net Asset Value, Beginning of Period |
| $10.10 |
|
| $9.89 |
|
| $9.92 |
|
| $9.82 |
|
| $9.81 |
| |||
Income/(Loss) from Investment Operations: | ||||||||||||||||||
Net investment income/(loss)(1) | (0.08) | (0.12) | (0.12) | (0.18) | (0.14) | |||||||||||||
Net realized and unrealized gain/(loss) | 0.22 | 0.63 | 0.19 | 0.36 | 0.15 | |||||||||||||
Total from Investment Operations |
| 0.14 |
|
| 0.51 |
|
| 0.07 |
|
| 0.18 |
|
| 0.01 |
| |||
Less Dividends and Distributions: | ||||||||||||||||||
Dividends (from net investment income) | (0.10) | (0.30) | — | — | — | |||||||||||||
Distributions (from capital gains) | (0.14) | — | (0.10) | (0.08) | — | |||||||||||||
Total Dividends and Distributions |
| (0.24) |
|
| (0.30) |
|
| (0.10) |
|
| (0.08) |
|
| — |
| |||
Net Asset Value, End of Period | $10.00 | $10.10 | $9.89 | $9.92 | $9.82 | |||||||||||||
Total Return* |
| 1.29%(2) |
|
| 5.17% |
|
| 0.72% |
|
| 1.82% |
|
| 0.10% |
| |||
Net Assets, End of Period (in thousands) | $1,473 | $1,453 | $1,381 | $1,371 | $3,506 | |||||||||||||
Average Net Assets for the Period (in thousands) | $1,480 | $1,425 | $1,340 | $1,578 | $3,492 | |||||||||||||
Ratios to Average Net Assets**: |
|
|
|
|
|
|
|
|
|
|
|
|
|
|
| |||
Ratio of Gross Expenses | 1.92% | 2.04% | 2.12% | 2.07% | 1.95% | |||||||||||||
Ratio of Net Expenses (After Waivers and Expense Offsets) | 1.53% | 1.64% | 1.33% | 1.75% | 1.58% | |||||||||||||
Ratio of Net Investment Income/(Loss) | (0.79)% | (1.21)% | (1.22)% | (1.74)% | (1.46)% | |||||||||||||
Portfolio Turnover Rate | 0% | 16% | 0% | 0% | 59% | |||||||||||||
* Total return not annualized for periods of less than one full year. ** Annualized for periods of less than one full year. (1) Per share amounts are calculated based on average shares outstanding during the year or period. (2) The return includes adjustments in accordance with generally accepted accounting principles required at period end date. |
See Notes to Consolidated Financial Statements. | |
Janus Investment Fund | 21 |
Janus Henderson Diversified Alternatives Fund
Consolidated Financial Highlights
Class T Shares | ||||||||||||||||||
For a share outstanding during each year ended June 30 |
| 2018 |
|
| 2017 |
|
| 2016 |
|
| 2015 |
|
| 2014 |
| |||
Net Asset Value, Beginning of Period |
| $10.17 |
|
| $9.95 |
|
| $9.98 |
|
| $9.85 |
|
| $9.82 |
| |||
Income/(Loss) from Investment Operations: | ||||||||||||||||||
Net investment income/(loss)(1) | —(2) | (0.10) | (0.10) | (0.15) | (0.13) | |||||||||||||
Net realized and unrealized gain/(loss) | 0.17 | 0.63 | 0.17 | 0.36 | 0.16 | |||||||||||||
Total from Investment Operations |
| 0.17 |
|
| 0.53 |
|
| 0.07 |
|
| 0.21 |
|
| 0.03 |
| |||
Less Dividends and Distributions: | ||||||||||||||||||
Dividends (from net investment income) | (0.15) | (0.31) | — | — | — | |||||||||||||
Distributions (from capital gains) | (0.14) | — | (0.10) | (0.08) | — | |||||||||||||
Total Dividends and Distributions |
| (0.29) |
|
| (0.31) |
|
| (0.10) |
|
| (0.08) |
|
| — |
| |||
Net Asset Value, End of Period | $10.05 | $10.17 | $9.95 | $9.98 | $9.85 | |||||||||||||
Total Return* |
| 1.59%(3) |
|
| 5.39% |
|
| 0.72% |
|
| 2.12% |
|
| 0.31% |
| |||
Net Assets, End of Period (in thousands) | $6,350 | $3,708 | $1,579 | $2,517 | $3,809 | |||||||||||||
Average Net Assets for the Period (in thousands) | $5,110 | $2,556 | $1,689 | $2,162 | $3,773 | |||||||||||||
Ratios to Average Net Assets**: |
|
|
|
|
|
|
|
|
|
|
|
|
|
|
| |||
Ratio of Gross Expenses | 1.62% | 1.77% | 1.87% | 1.83% | 1.75% | |||||||||||||
Ratio of Net Expenses (After Waivers and Expense Offsets) | 1.33% | 1.45% | 1.18% | 1.51% | 1.40% | |||||||||||||
Ratio of Net Investment Income/(Loss) | (0.03)% | (0.97)% | (1.08)% | (1.50)% | (1.28)% | |||||||||||||
Portfolio Turnover Rate | 0% | 16% | 0% | 0% | 59% | |||||||||||||
* Total return not annualized for periods of less than one full year. ** Annualized for periods of less than one full year. (1) Per share amounts are calculated based on average shares outstanding during the year or period. (2) Less than $0.005 on a per share basis. (3) The return includes adjustments in accordance with generally accepted accounting principles required at period end date. |
See Notes to Consolidated Financial Statements. | |
22 | JUNE 30, 2018 |
Janus Henderson Diversified Alternatives Fund
Notes to Consolidated Financial Statements
1. Organization and Significant Accounting Policies
Janus Henderson Diversified Alternatives Fund (the “Fund”) is a series of Janus Investment Fund (the “Trust”), which is organized as a Massachusetts business trust and is registered under the Investment Company Act of 1940, as amended (the “1940 Act”), as an open-end management investment company, and therefore has applied the specialized accounting and reporting guidance in Financial Accounting Standards Board (“FASB”) Accounting Standards Codification (“ASC”) Topic 946. The Trust offers 49 funds which include multiple series of shares, with differing investment objectives and policies. The Fund seeks absolute return with low correlation to stocks and bonds. The Fund is classified as diversified, as defined in the 1940 Act.
The Fund offers multiple classes of shares in order to meet the needs of various types of investors. Each class represents an interest in the same portfolio of investments. Certain financial intermediaries may not offer all classes of shares. Class D Shares are closed to certain new investors.
Class A Shares and Class C Shares are generally offered through financial intermediary platforms including, but not limited to, traditional brokerage platforms, mutual fund wrap fee programs, bank trust platforms, and retirement platforms.
Class D Shares are generally no longer being made available to new investors who do not already have a direct account with the Janus Henderson funds. Class D Shares are available only to investors who hold accounts directly with the Janus Henderson funds, to immediate family members or members of the same household of an eligible individual investor, and to existing beneficial owners of sole proprietorships or partnerships that hold accounts directly with the Janus Henderson funds.
Class I Shares are available through certain financial intermediary platforms including, but not limited to, mutual fund wrap fee programs, managed account programs, asset allocation programs, bank trust platforms, as well as certain retirement platforms. Class I Shares are also available to certain direct institutional investors including, but not limited to, corporations, certain retirement plans, public plans, and foundations/endowments, who established Class I Share accounts before August 4, 2017.
Class N Shares are generally available only to financial intermediaries purchasing on behalf of: 1) certain adviser-assisted, employer-sponsored retirement plans, including 401(k) plans, 457 plans, 403(b) plans, Taft-Hartley multi-employer plans, profit-sharing and money purchase pension plans, defined benefit plans and certain welfare benefit plans, such as health savings accounts, and nonqualified deferred compensation plans; and 2) retail investors purchasing in qualified or nonqualified accounts, whose accounts are held through an omnibus account at their financial intermediary, and where the financial intermediary requires no payment or reimbursement from the Fund, Janus Capital Management LLC (“Janus Capital”), or its affiliates. Class N Shares are also available to Janus Henderson proprietary products and to certain direct institutional investors approved by Janus Distributors LLC dba Janus Henderson Distributors (“Janus Henderson Distributors”) including, but not limited to, corporations, certain retirement plans, public plans, and foundations and endowments, subject to minimum investment requirements.
Class S Shares are offered through financial intermediary platforms including, but not limited to, retirement platforms and asset allocation, mutual fund wrap, or other discretionary or nondiscretionary fee-based investment advisory programs. In addition, Class S Shares may be available through certain financial intermediaries who have an agreement with Janus Capital or its affiliates to offer Class S Shares on their supermarket platforms.
Class T Shares are available through certain financial intermediary platforms including, but not limited to, mutual fund wrap fee programs, managed account programs, asset allocation programs, bank trust platforms, as well as certain retirement platforms. In addition, Class T Shares may be available through certain financial intermediaries who have an agreement with Janus Capital or its affiliates to offer Class T Shares on their supermarket platforms.
Investment in Subsidiary
To qualify as a regulated investment company under the Internal Revenue Code of 1986, as amended (the “Code”), 90% of the Fund’s income must be from certain qualified sources. Direct investment in many commodities-related investments generates income that is not from a qualifying source for purposes of meeting this 90% test. The Fund will seek to gain exposure to the commodity markets, in whole or in part, through investments in the Janus Diversified Alternatives Subsidiary, Ltd., a wholly-owned subsidiary of the Fund (”Subsidiary”) organized under the laws of the Cayman Islands, which is generally subject to the same investment policies and restrictions as the Fund. The Subsidiary
Janus Investment Fund | 23 |
Janus Henderson Diversified Alternatives Fund
Notes to Consolidated Financial Statements
may invest without limitation in commodity index-linked swaps, commodity futures, commodity swaps, commodity-linked notes, and other commodity-linked derivative instruments. The Subsidiary may also invest in fixed-income securities and other investments which may serve as margin or collateral for the Subsidiary’s derivatives positions. The Fund may invest 25% or less of its total assets in the Subsidiary. Income or net capital gains from the Fund’s investment in the Subsidiary would be treated as ordinary income to the Fund. Janus Capital is the adviser to the Subsidiary. The Subsidiary will not be subject to U.S. laws (including securities laws) and their protections. The Subsidiary is subject to the laws of a foreign jurisdiction, which can be affected by developments in that jurisdiction.
By investing in the Subsidiary, the Fund will be indirectly exposed to the risks associated with the Subsidiary’s investments, which are generally similar to those that are permitted to be held by the Fund. The Subsidiary is not registered under the 1940 Act, and is not subject to all of the provisions of the 1940 Act. The IRS has previously issued a number of private letter rulings to mutual funds (but not the Fund) in which it ruled that income from a fund’s investment in a wholly-owned foreign subsidiary that invests in commodity-linked derivatives, such as the Subsidiary, constitutes qualifying income. The IRS has suspended issuance of any further private letter rulings pending a review of its position. A change in the IRS’ position or changes in the laws of the United States and/or the Cayman Islands could result in the inability of the Fund and/or the Subsidiary to operate and could adversely affect the Fund. In particular, unfavorable treatment of the income derived from the Fund’s investment in the Subsidiary could jeopardize the Fund’s status as a regulated investment company under the Code, which in turn may subject the Fund to higher tax rates and/or penalties. Additionally, the Commodity Futures Trading Commission (“CFTC”) adopted changes to Rule 4.5 under the Commodity Exchange Act in 2012 that required Janus Capital to register with the CFTC, and operation of the Fund and Subsidiary is subject to certain CFTC rules and regulations. Existing or new CFTC regulation may increase the costs of implementing the Fund’s strategies, which could negatively affect the Fund’s returns.
The Subsidiary was incorporated on December 28, 2012 as a wholly-owned subsidiary of Janus Diversified Alternatives Fund. As of June 30, 2018, the Fund owns 688,356 shares of the Subsidiary, with a market value of $10,512,961. This represents 9% of the Fund’s net assets. The Fund’s Consolidated Schedule of Investments, Consolidated Statement of Assets and Liabilities, Consolidated Statement of Operations, Consolidated Statements of Changes in Net Assets, and Consolidated Financial Highlights include the accounts of both the Fund and the Subsidiary. All inter-company transactions and balances have been eliminated in consolidation.
As of June 30, 2018, Subsidiary information included in the Consolidated Financial Statements is as follows:
Net assets | $ 10,512,961 |
Market value of investments | 5,134,505 |
Net income/(loss) | 43,748 |
Net realized gain/(loss) | 2,667,165 |
Net change in unrealized appreciation/depreciation | 373,536 |
The following accounting policies have been followed by the Fund and are in conformity with accounting principles generally accepted in the United States of America.
Investment Valuation
Securities held by the Fund are valued in accordance with policies and procedures established by and under the supervision of the Trustees (the “Valuation Procedures”). Equity securities traded on a domestic securities exchange are generally valued at the closing prices on the primary market or exchange on which they trade. If such price is lacking for the trading period immediately preceding the time of determination, such securities are valued at their current bid price. Equity securities that are traded on a foreign exchange are generally valued at the closing prices on such markets. In the event that there is no current trading volume on a particular security in such foreign exchange, the bid price from the primary exchange is generally used to value the security. Securities that are traded on the over-the-counter (“OTC”) markets are generally valued at their closing or latest bid prices as available. Foreign securities and currencies are converted to U.S. dollars using the applicable exchange rate in effect at the close of the New York Stock Exchange (“NYSE”). The Fund will determine the market value of individual securities held by it by using prices provided by one or more approved professional pricing services or, as needed, by obtaining market quotations from independent broker-dealers. Most debt securities are valued in accordance with the evaluated bid price supplied by the pricing service that is intended to reflect market value. The evaluated bid price supplied by the pricing service is an evaluation that may consider factors such as security prices, yields, maturities and ratings. Certain short-term securities maturing within 60
24 | JUNE 30, 2018 |
Janus Henderson Diversified Alternatives Fund
Notes to Consolidated Financial Statements
days or less may be evaluated and valued on an amortized cost basis provided that the amortized cost determined approximates market value. Securities for which market quotations or evaluated prices are not readily available or deemed unreliable are valued at fair value determined in good faith under the Valuation Procedures. Circumstances in which fair value pricing may be utilized include, but are not limited to: (i) a significant event that may affect the securities of a single issuer, such as a merger, bankruptcy, or significant issuer-specific development; (ii) an event that may affect an entire market, such as a natural disaster or significant governmental action; (iii) a nonsignificant event such as a market closing early or not opening, or a security trading halt; and (iv) pricing of a nonvalued security and a restricted or nonpublic security. Special valuation considerations may apply with respect to “odd-lot” fixed-income transactions which, due to their small size, may receive evaluated prices by pricing services which reflect a large block trade and not what actually could be obtained for the odd-lot position. The Fund uses systematic fair valuation models provided by independent third parties to value international equity securities in order to adjust for stale pricing, which may occur between the close of certain foreign exchanges and the close of the NYSE.
Information on the valuation of certain derivatives is contained in Note 2 below.
Valuation Inputs Summary
FASB ASC 820, Fair Value Measurements and Disclosures (“ASC 820”), defines fair value, establishes a framework for measuring fair value, and expands disclosure requirements regarding fair value measurements. This standard emphasizes that fair value is a market-based measurement that should be determined based on the assumptions that market participants would use in pricing an asset or liability and establishes a hierarchy that prioritizes inputs to valuation techniques used to measure fair value. These inputs are summarized into three broad levels:
Level 1 – Unadjusted quoted prices in active markets the Fund has the ability to access for identical assets or liabilities.
Level 2 – Observable inputs other than unadjusted quoted prices included in Level 1 that are observable for the asset or liability either directly or indirectly. These inputs may include quoted prices for the identical instrument on an inactive market, prices for similar instruments, interest rates, prepayment speeds, credit risk, yield curves, default rates and similar data.
Assets or liabilities categorized as Level 2 in the hierarchy generally include: debt securities fair valued in accordance with the evaluated bid or ask prices supplied by a pricing service; securities traded on OTC markets and listed securities for which no sales are reported that are fair valued at the latest bid price (or yield equivalent thereof) obtained from one or more dealers transacting in a market for such securities or by a pricing service approved by the Fund’s Trustees; certain short-term debt securities with maturities of 60 days or less that are fair valued at amortized cost; and equity securities of foreign issuers whose fair value is determined by using systematic fair valuation models provided by independent third parties in order to adjust for stale pricing which may occur between the close of certain foreign exchanges and the close of the NYSE. Other securities that may be categorized as Level 2 in the hierarchy include, but are not limited to, preferred stocks, bank loans, swaps, investments in unregistered investment companies, options, and forward contracts.
Level 3 – Unobservable inputs for the asset or liability to the extent that relevant observable inputs are not available, representing the Fund’s own assumptions about the assumptions that a market participant would use in valuing the asset or liability, and that would be based on the best information available.
There have been no significant changes in valuation techniques used in valuing any such positions held by the Fund since the beginning of the fiscal year.
The inputs or methodology used for fair valuing securities are not necessarily an indication of the risk associated with investing in those securities. The summary of inputs used as of June 30, 2018 to fair value the Fund’s investments in securities and other financial instruments is included in the “Valuation Inputs Summary” in the Notes to Consolidated Schedule of Investments and Other Information.
There were no transfers between Level 1, Level 2 and Level 3 of the fair value hierarchy during the year. The Fund recognizes transfers between the levels as of the beginning of the fiscal year.
Investment Transactions and Investment Income
Investment transactions are accounted for as of the date purchased or sold (trade date). Dividend income is recorded on the ex-dividend date. Certain dividends from foreign securities will be recorded as soon as the Fund is informed of
Janus Investment Fund | 25 |
Janus Henderson Diversified Alternatives Fund
Notes to Consolidated Financial Statements
the dividend, if such information is obtained subsequent to the ex-dividend date. Dividends from foreign securities may be subject to withholding taxes in foreign jurisdictions. Interest income is recorded on the accrual basis and includes amortization of premiums and accretion of discounts. Gains and losses are determined on the identified cost basis, which is the same basis used for federal income tax purposes. Income, as well as gains and losses, both realized and unrealized, are allocated daily to each class of shares based upon the ratio of net assets represented by each class as a percentage of total net assets.
Expenses
The Fund bears expenses incurred specifically on its behalf. Each class of shares bears a portion of general expenses, which are allocated daily to each class of shares based upon the ratio of net assets represented by each class as a percentage of total net assets. Expenses directly attributable to a specific class of shares are charged against the operations of such class. Additionally, the Fund, as a shareholder in the Subsidiary, will also indirectly bear its pro rata share of the expenses incurred by the Subsidiary.
Estimates
The preparation of consolidated financial statements in conformity with accounting principles generally accepted in the United States of America requires management to make estimates and assumptions that affect the reported amount of assets and liabilities and disclosure of contingent assets and liabilities at the date of the consolidated financial statements, and the reported amounts of income and expenses during the reporting period. Actual results could differ from those estimates.
Indemnifications
In the normal course of business, the Fund may enter into contracts that contain provisions for indemnification of other parties against certain potential liabilities. The Fund’s maximum exposure under these arrangements is unknown, and would involve future claims that may be made against the Fund that have not yet occurred. Currently, the risk of material loss from such claims is considered remote.
Foreign Currency Translations
The Fund does not isolate that portion of the results of operations resulting from the effect of changes in foreign exchange rates on investments from the fluctuations arising from changes in market prices of securities held at the date of the consolidated financial statements. Net unrealized appreciation or depreciation of investments and foreign currency translations arise from changes in the value of assets and liabilities, including investments in securities held at the date of the consolidated financial statements, resulting from changes in the exchange rates and changes in market prices of securities held.
Currency gains and losses are also calculated on payables and receivables that are denominated in foreign currencies. The payables and receivables are generally related to foreign security transactions and income translations.
Foreign currency-denominated assets and forward currency contracts may involve more risks than domestic transactions, including currency risk, counterparty risk, political and economic risk, regulatory risk and equity risk. Risks may arise from unanticipated movements in the value of foreign currencies relative to the U.S. dollar.
Dividends and Distributions
The Fund generally declares and distributes dividends of net investment income and realized capital gains (if any) annually. The Fund may treat a portion of the amount paid to redeem shares as a distribution of investment company taxable income and realized capital gains that are reflected in the net asset value. This practice, commonly referred to as “equalization,” has no effect on the redeeming shareholder or the Fund’s total return, but may reduce the amounts that would otherwise be required to be paid as taxable dividends to the remaining shareholders. It is possible that the Internal Revenue Service (IRS) could challenge the Fund's equalization methodology or calculations, and any such challenge could result in additional tax, interest, or penalties to be paid by the Fund.
Federal Income Taxes
The Fund intends to continue to qualify as a regulated investment company and distribute all of its taxable income in accordance with the requirements of Subchapter M of the Internal Revenue Code. Management has analyzed the Fund’s tax positions taken for all open federal income tax years, generally a three-year period, and has concluded that no provision for federal income tax is required in the Fund’s consolidated financial statements. The Fund is not aware of any tax positions for which it is reasonably possible that the total amounts of unrecognized tax benefits will significantly change in the next twelve months.
26 | JUNE 30, 2018 |
Janus Henderson Diversified Alternatives Fund
Notes to Consolidated Financial Statements
On December 22, 2017, the Tax Cuts and Jobs Act was signed into law. Currently, Management does not believe the bill will have a material impact on the Fund’s intention to continue to qualify as a regulated investment company, which is generally not subject to U.S. federal income tax.
2. Derivative Instruments
The Fund may invest in various types of derivatives, which may at times result in significant derivative exposure. A derivative is a financial instrument whose performance is derived from the performance of another asset. The Fund may invest in derivative instruments including, but not limited to: futures contracts, put options, call options, options on future contracts, options on foreign currencies, options on recovery locks, options on security and commodity indices, swaps, forward contracts, structured investments, and other equity-linked derivatives. Each derivative instrument that was held by the Fund during the year ended June 30, 2018 is discussed in further detail below. A summary of derivative activity by the Fund is reflected in the tables at the end of the Consolidated Statement of Investments.
The Fund may use derivative instruments for hedging purposes (to offset risks associated with an investment, currency exposure, or market conditions), to adjust currency exposure relative to a benchmark index, or for speculative purposes (to earn income and seek to enhance returns). When the Fund invests in a derivative for speculative purposes, the Fund will be fully exposed to the risks of loss of that derivative, which may sometimes be greater than the derivative’s cost. The Fund may not use any derivative to gain exposure to an asset or class of assets that it would be prohibited by its investment restrictions from purchasing directly. The Fund’s ability to use derivative instruments may also be limited by tax considerations.
Investments in derivatives in general are subject to market risks that may cause their prices to fluctuate over time. Investments in derivatives may not directly correlate with the price movements of the underlying instrument. As a result, the use of derivatives may expose the Fund to additional risks that it would not be subject to if it invested directly in the securities underlying those derivatives. The use of derivatives may result in larger losses or smaller gains than otherwise would be the case. Derivatives can be volatile and may involve significant risks.
In pursuit of its investment objective, the Fund may seek to use derivatives to increase or decrease exposure to the following market risk factors:
· Commodity Risk – the risk related to the change in value of commodities or commodity-linked investments due to changes in the overall market movements, volatility of the underlying benchmark, changes in interest rates, or other factors affecting a particular industry of commodity such as drought, floods, weather, livestock disease, embargoes, tariffs, and international economic, political, and regulatory developments.
· Counterparty Risk – the risk that the counterparty (the party on the other side of the transaction) on a derivative transaction will be unable to honor its financial obligation to the Fund.
· Credit Risk – the risk an issuer will be unable to make principal and interest payments when due, or will default on its obligations.
· Currency Risk – the risk that changes in the exchange rate between currencies will adversely affect the value (in U.S. dollar terms) of an investment.
· Equity Risk – the risk related to the change in value of equity securities as they relate to increases or decreases in the general market.
· Index Risk – if the derivative is linked to the performance of an index, it will be subject to the risks associated with changes in that index. If the index changes, the Fund could receive lower interest payments or experience a reduction in the value of the derivative to below what the Fund paid. Certain indexed securities, including inverse securities (which move in an opposite direction to the index), may create leverage, to the extent that they increase or decrease in value at a rate that is a multiple of the changes in the applicable index.
· Interest Rate Risk – the risk that the value of fixed-income securities will generally decline as prevailing interest rates rise, which may cause the Fund’s NAV to likewise decrease.
· Leverage Risk – the risk associated with certain types of leveraged investments or trading strategies pursuant to which relatively small market movements may result in large changes in the value of an investment. The Fund creates leverage by investing in instruments, including derivatives, where the investment loss can exceed the
Janus Investment Fund | 27 |
Janus Henderson Diversified Alternatives Fund
Notes to Consolidated Financial Statements
original amount invested. Certain investments or trading strategies, such as short sales, that involve leverage can result in losses that greatly exceed the amount originally invested.
· Liquidity Risk – the risk that certain securities may be difficult or impossible to sell at the time that the seller would like or at the price that the seller believes the security is currently worth.
Derivatives may generally be traded OTC or on an exchange. Derivatives traded OTC are agreements that are individually negotiated between parties and can be tailored to meet a purchaser’s needs. OTC derivatives are not guaranteed by a clearing agency and may be subject to increased credit risk.
In an effort to mitigate credit risk associated with derivatives traded OTC, the Fund may enter into collateral agreements with certain counterparties whereby, subject to certain minimum exposure requirements, the Fund may require the counterparty to post collateral if the Fund has a net aggregate unrealized gain on all OTC derivative contracts with a particular counterparty. Additionally, the Fund may deposit cash and/or treasuries as collateral with the counterparty and/or custodian daily (based on the daily valuation of the financial asset) if the Fund has a net aggregate unrealized loss on OTC derivative contracts with a particular counterparty. All liquid securities and restricted cash are considered to cover in an amount at all times equal to or greater than the Fund’s commitment with respect to certain exchange-traded derivatives, centrally cleared derivatives, forward foreign currency exchange contracts, short sales, and/or securities with extended settlement dates. There is no guarantee that counterparty exposure is reduced and these arrangements are dependent on Janus Capital's ability to establish and maintain appropriate systems and trading.
Commodity-Linked Investments
The Fund may invest in commodity index-linked swap agreements, commodity options and futures, and options on futures that provide exposure to the investment returns of the commodities markets. The Fund may also invest in other commodity-linked derivative instruments, such as commodity-linked notes (“structured notes”). The Fund will seek to gain exposure to the commodity markets, in whole or in part, through investments in the Subsidiary which is generally subject to the same investment policies and restrictions as the Fund. The Subsidiary invests in commodity-linked investments and other investments which may serve as margin or collateral for the Subsidiary’s derivative positions. Such exposure may subject the Fund to greater volatility than investments in traditional securities. The value of a given commodity-linked derivative investment typically is based upon the price movements of a physical commodity (such as heating oil, livestock, or agricultural products), a commodity futures contract or commodity index, or some other readily measurable economic variable. The value of commodity-linked derivative instruments may therefore be affected by changes in overall market movements, volatility of the underlying benchmark, changes in interest rates, or other factors affecting a particular industry or commodity such as drought, floods, weather, livestock disease, embargoes, tariffs, and international economic, political, and regulatory developments.
Forward Foreign Currency Exchange Contracts
A forward foreign currency exchange contract (“forward currency contract”) is an obligation to buy or sell a specified currency at a future date at a negotiated rate (which may be U.S. dollars or a foreign currency). The Fund may enter into forward currency contracts for hedging purposes, including, but not limited to, reducing exposure to changes in foreign currency exchange rates on foreign portfolio holdings and locking in the U.S. dollar cost of firm purchase and sale commitments for securities denominated in or exposed to foreign currencies. The Fund may also invest in forward currency contracts for non-hedging purposes such as seeking to enhance returns. The Fund is subject to currency risk and counterparty risk in the normal course of pursuing its investment objective through its investments in forward currency contracts.
Forward currency contracts are valued by converting the foreign value to U.S. dollars by using the current spot U.S. dollar exchange rate and/or forward rate for that currency. Exchange and forward rates as of the close of the NYSE shall be used to value the forward currency contracts. The unrealized appreciation/(depreciation) for forward currency contracts is reported in the Consolidated Statement of Assets and Liabilities as a receivable or payable and in the Consolidated Statement of Operations for the change in unrealized net appreciation/depreciation (if applicable). The gain or loss arising from the difference between the U.S. dollar cost of the original contract and the value of the foreign currency in U.S. dollars upon closing a forward currency contract is reported on the Consolidated Statement of Operations (if applicable).
During the year, the Fund entered into forward currency contracts with the obligation to purchase foreign currencies in the future at an agreed upon rate in order to take a positive outlook on the related currency. These forward contracts seek to increase exposure to currency risk.
28 | JUNE 30, 2018 |
Janus Henderson Diversified Alternatives Fund
Notes to Consolidated Financial Statements
During the year, the Fund entered into forward currency contracts with the obligation to sell foreign currencies in the future at an agreed upon rate in order to take a negative outlook on the related currency. These forward contracts seek to increase exposure to currency risk.
Futures Contracts
A futures contract is an exchange-traded agreement to take or make delivery of an underlying asset at a specific time in the future for a specific predetermined negotiated price. The Fund may enter into futures contracts to gain exposure to the stock market or other markets pending investment of cash balances or to meet liquidity needs. The Fund is subject to interest rate risk, equity risk, and currency risk in the normal course of pursuing its investment objective through its investments in futures contracts. The Fund may also use such derivative instruments to hedge or protect from adverse movements in securities prices, currency rates or interest rates. The use of futures contracts may involve risks such as the possibility of illiquid markets or imperfect correlation between the values of the contracts and the underlying securities, or that the counterparty will fail to perform its obligations.
Futures contracts on commodities are valued at the settlement price on valuation date on the commodities exchange as reported by an approved vendor. Mini contracts, as defined in the description of the contract, shall be valued using the Actual Settlement Price or “ASET” price type as reported by an approved vendor. In the event that foreign futures trade when the foreign equity markets are closed, the last foreign futures trade price shall be used. Futures contracts are marked-to-market daily, and the daily variation margin is recorded as a receivable or payable on the Consolidated Statement of Assets and Liabilities (if applicable). The change in unrealized net appreciation/depreciation is reported on the Consolidated Statement of Operations (if applicable). When a contract is closed, a realized gain or loss is reported on the Consolidated Statement of Operations (if applicable), equal to the difference between the opening and closing value of the contract. Securities held by the Fund that are designated as collateral for market value on futures contracts are noted on the Consolidated Schedule of Investments (if applicable). Such collateral is in the possession of the Fund’s futures commission merchant.
With futures, there is minimal counterparty credit risk to the Fund since futures are exchange-traded and the exchange’s clearinghouse, as counterparty to all exchange-traded futures, guarantees the futures against default.
During the year, the Fund purchased interest rate futures to increase exposure to interest rate risk.
During the year, the Fund purchased commodity futures to increase exposure to commodity risk.
During the year, the Fund sold commodity futures to decrease exposure to commodity risk.
During the year, the Fund purchased futures on equity indices to increase exposure to equity risk.
During the year, the Fund purchased futures on currency indices to increase exposure to currency risk.
Swaps
Swap agreements are two-party contracts entered into primarily by institutional investors for periods ranging from a day to more than one year to exchange one set of cash flows for another. The most significant factor in the performance of swap agreements is the change in value of the specific index, security, or currency, or other factors that determine the amounts of payments due to and from the Fund. The use of swaps is a highly specialized activity which involves investment techniques and risks different from those associated with ordinary portfolio securities transactions. Swap transactions may in some instances involve the delivery of securities or other underlying assets by the Fund or its counterparty to collateralize obligations under the swap. If the other party to a swap that is not collateralized defaults, the Fund would risk the loss of the net amount of the payments that it contractually is entitled to receive. Swap agreements entail the risk that a party will default on its payment obligations to the Fund. If the other party to a swap defaults, the Fund would risk the loss of the net amount of the payments that it contractually is entitled to receive. If the Fund utilizes a swap at the wrong time or judges market conditions incorrectly, the swap may result in a loss to the Fund and reduce the Fund’s total return.
Swap agreements also bear the risk that the Fund will not be able to meet its obligation to the counterparty. Swap agreements are typically privately negotiated and entered into in the OTC market. However, certain swap agreements are required to be cleared through a clearinghouse and traded on an exchange or swap execution facility. Swaps that are required to be cleared are required to post initial and variation margins in accordance with the exchange requirements. Regulations enacted require the Fund to centrally clear certain interest rate and credit default index swaps through a clearinghouse or central counterparty (“CCP”). To clear a swap with a CCP, the Fund will submit the
Janus Investment Fund | 29 |
Janus Henderson Diversified Alternatives Fund
Notes to Consolidated Financial Statements
swap to, and post collateral with, a futures clearing merchant (“FCM”) that is a clearinghouse member. Alternatively, the Fund may enter into a swap with a financial institution other than the FCM (the “Executing Dealer”) and arrange for the swap to be transferred to the FCM for clearing. The Fund may also enter into a swap with the FCM itself. The CCP, the FCM, and the Executing Dealer are all subject to regulatory oversight by the U.S. Commodity Futures Trading Commission (“CFTC”). A default or failure by a CCP or an FCM, or the failure of a swap to be transferred from an Executing Dealer to the FCM for clearing, may expose the Fund to losses, increase its costs, or prevent the Fund from entering or exiting swap positions, accessing collateral, or fully implementing its investment strategies. The regulatory requirement to clear certain swaps could, either temporarily or permanently, reduce the liquidity of cleared swaps or increase the costs of entering into those swaps.
Index swaps, interest rate swaps, and credit default swaps are valued using an approved vendor supplied price. Basket swaps are valued using a broker supplied price. Equity swaps that consist of a single underlying equity are valued either at the closing price, the latest bid price, or the last sale price on the primary market or exchange it trades. The market value of swap contracts are aggregated by positive and negative values and are disclosed separately as an asset or liability on the Fund’s Consolidated Statement of Assets and Liabilities (if applicable). Realized gains and losses are reported on the Fund’s Consolidated Statement of Operations (if applicable). The change in unrealized net appreciation or depreciation during the year is included in the Consolidated Statement of Operations (if applicable).
The Fund’s maximum risk of loss from counterparty risk or credit risk is the discounted value of the payments to be received from/paid to the counterparty over the contract’s remaining life, to the extent that the amount is positive. The risk is mitigated by having a netting arrangement between the Fund and the counterparty and by the posting of collateral by the counterparty to cover the Fund’s exposure to the counterparty.
Total return swaps involve an exchange by two parties in which one party makes payments based on a set rate, either fixed or variable, while the other party makes payments based on the return of an underlying asset, which includes both the income it generates and any capital gains over the payment period. A fixed-income total return swap may be written on many different kinds of underlying reference assets, and may include different indices for various kinds of debt securities (e.g., U.S. investment grade bonds, high-yield bonds, or emerging market bonds).
During the year, the Fund entered into total return swaps on equity indices or custom baskets of equity indices to increase exposure to equity risk. These total return swaps require the Fund to pay a floating reference interest rate, and an amount equal to the negative price movement of securities or an index multiplied by the notional amount of the contract. The Fund will receive payments equal to the positive price movement of the same securities or index multiplied by the notional amount of the contract and, in some cases, dividends paid on the securities.
During the year, the Fund entered into total return swaps on equity indices to decrease exposure to equity risk. These total return swaps require the Fund to pay an amount equal to the positive price movement of securities or an index multiplied by the notional amount of the contract and, in some cases, dividends paid on the securities. The Fund will receive payments of a floating reference interest rate and an amount equal to the negative price movement of the same securities or index multiplied by the notional amount of the contract.
During the year, the Fund entered into total return swaps on a custom basket of commodity indices to increase exposure to commodity risk. These total return swaps require the Fund to pay a fixed or a floating reference interest rate, and an amount equal to the negative price movement of an index multiplied by the notional amount of the contract. The Fund will receive payments equal to the positive price movement of the same index multiplied by the notional amount of the contract.
During the year, the Fund entered into total return swaps on credit indices to increase exposure to credit risk. These total return swaps require the Fund to pay a floating reference interest rate, and an amount equal to the negative price movement of an index multiplied by the notional amount of the contract. The Fund will receive payments equal to the positive price movement of the same index multiplied by the notional amount of the contract.
3. Other Investments and Strategies
Additional Investment Risk
The financial crisis in both the U.S. and global economies over the past several years has resulted, and may continue to result, in a significant decline in the value and liquidity of many securities of issuers worldwide in the equity and fixed-income/credit markets. In response to the crisis, the United States and certain foreign governments, along with the U.S. Federal Reserve and certain foreign central banks, took steps to support the financial markets. The withdrawal of this
30 | JUNE 30, 2018 |
Janus Henderson Diversified Alternatives Fund
Notes to Consolidated Financial Statements
support, a failure of measures put in place to respond to the crisis, or investor perception that such efforts were not sufficient could each negatively affect financial markets generally, and the value and liquidity of specific securities. In addition, policy and legislative changes in the United States and in other countries continue to impact many aspects of financial regulation. The effect of these changes on the markets, and the practical implications for market participants, including the Fund, may not be fully known for some time. As a result, it may also be unusually difficult to identify both investment risks and opportunities, which could limit or preclude the Fund’s ability to achieve its investment objective. Therefore, it is important to understand that the value of your investment may fall, sometimes sharply, and you could lose money.
The enactment of the Dodd-Frank Wall Street Reform and Consumer Protection Act (the “Dodd-Frank Act”) of 2010 provided for widespread regulation of financial institutions, consumer financial products and services, broker-dealers, OTC derivatives, investment advisers, credit rating agencies, and mortgage lending, which expanded federal oversight in the financial sector, including the investment management industry. Many provisions of the Dodd-Frank Act remain pending and will be implemented through future rulemaking. Therefore, the ultimate impact of the Dodd-Frank Act and the regulations under the Dodd-Frank Act on the Fund and the investment management industry as a whole, is not yet certain.
A number of countries in the European Union (“EU”) have experienced, and may continue to experience, severe economic and financial difficulties. In particular, many EU nations are susceptible to economic risks associated with high levels of debt, notably due to investments in sovereign debt of countries such as Greece, Italy, Spain, Portugal, and Ireland. Many non-governmental issuers, and even certain governments, have defaulted on, or been forced to restructure, their debts. Many other issuers have faced difficulties obtaining credit or refinancing existing obligations. Financial institutions have in many cases required government or central bank support, have needed to raise capital, and/or have been impaired in their ability to extend credit. As a result, financial markets in the EU experienced extreme volatility and declines in asset values and liquidity. Responses to these financial problems by European governments, central banks, and others, including austerity measures and reforms, may not work, may result in social unrest, and may limit future growth and economic recovery or have other unintended consequences. Further defaults or restructurings by governments and others of their debt could have additional adverse effects on economies, financial markets, and asset valuations around the world. Greece, Ireland, and Portugal have already received one or more "bailouts" from other Eurozone member states, and it is unclear how much additional funding they will require or if additional Eurozone member states will require bailouts in the future. The risk of investing in securities in the European markets may also be heightened due to the referendum in which the United Kingdom voted to exit the EU (known as “Brexit”). There is considerable uncertainty about how Brexit will be conducted, how negotiations of necessary treaties and trade agreements will proceed, or how financial markets will react. In addition, one or more other countries may also abandon the euro and/or withdraw from the EU, placing its currency and banking system in jeopardy.
Certain areas of the world have historically been prone to and economically sensitive to environmental events such as, but not limited to, hurricanes, earthquakes, typhoons, flooding, tidal waves, tsunamis, erupting volcanoes, wildfires or droughts, tornadoes, mudslides, or other weather-related phenomena. Such disasters, and the resulting physical or economic damage, could have a severe and negative impact on the Fund’s investment portfolio and, in the longer term, could impair the ability of issuers in which the Fund invests to conduct their businesses as they would under normal conditions. Adverse weather conditions may also have a particularly significant negative effect on issuers in the agricultural sector and on insurance companies that insure against the impact of natural disasters.
Counterparties
Fund transactions involving a counterparty are subject to the risk that the counterparty or a third party will not fulfill its obligation to the Fund (“counterparty risk”). Counterparty risk may arise because of the counterparty’s financial condition (i.e., financial difficulties, bankruptcy, or insolvency), market activities and developments, or other reasons, whether foreseen or not. A counterparty’s inability to fulfill its obligation may result in significant financial loss to the Fund. The Fund may be unable to recover its investment from the counterparty or may obtain a limited recovery, and/or recovery may be delayed. The extent of the Fund’s exposure to counterparty risk with respect to financial assets and liabilities approximates its carrying value. See the "Offsetting Assets and Liabilities" section of this Note for further details.
The Fund may be exposed to counterparty risk through participation in various programs, including, but not limited to, lending its securities to third parties, cash sweep arrangements whereby the Fund’s cash balance is invested in one or more types of cash management vehicles, as well as investments in, but not limited to, repurchase agreements, debt securities, and derivatives, including various types of swaps, futures and options. The Fund intends to enter into financial
Janus Investment Fund | 31 |
Janus Henderson Diversified Alternatives Fund
Notes to Consolidated Financial Statements
transactions with counterparties that Janus Capital believes to be creditworthy at the time of the transaction. There is always the risk that Janus Capital’s analysis of a counterparty’s creditworthiness is incorrect or may change due to market conditions. To the extent that the Fund focuses its transactions with a limited number of counterparties, it will have greater exposure to the risks associated with one or more counterparties.
Offsetting Assets and Liabilities
The Fund presents gross and net information about transactions that are either offset in the consolidated financial statements or subject to an enforceable master netting arrangement or similar agreement with a designated counterparty, regardless of whether the transactions are actually offset in the Consolidated Statement of Assets and Liabilities.
In order to better define its contractual rights and to secure rights that will help the Fund mitigate its counterparty risk, the Fund has entered into an International Swaps and Derivatives Association, Inc. Master Agreement (“ISDA Master Agreement”) or similar agreement with its derivative contract counterparties. An ISDA Master Agreement is a bilateral agreement between the Fund and a counterparty that governs OTC derivatives and forward foreign currency exchange contracts and typically contains, among other things, collateral posting terms and netting provisions in the event of a default and/or termination event. Under an ISDA Master Agreement, in the event of a default and/or termination event, the Fund may offset with each counterparty certain derivative financial instruments’ payables and/or receivables with collateral held and/or posted and create one single net payment. For financial reporting purposes, the Fund does not offset certain derivative financial instruments’ payables and receivables and related collateral on the Consolidated Statement of Assets and Liabilities.
The following tables present gross amounts of recognized assets and/or liabilities and the net amounts after deducting collateral that has been pledged by counterparties or has been pledged to counterparties (if applicable). For corresponding information grouped by type of instrument, see the “Fair Value of Derivative Instruments (not accounted for as hedging instruments) as of June 30, 2018” table located in the Fund’s Consolidated Schedule of Investments.
Offsetting of Financial Assets and Derivative Assets | |||||||||
Gross Amounts | |||||||||
of Recognized | Offsetting Asset | Collateral | |||||||
Counterparty | Assets | or Liability(a) | Pledged(b) | Net Amount | |||||
Goldman Sachs International | $ | 225 | $ | — | $ | — | $ | 225 | |
HSBC Securities (USA), Inc. | 5,198 | (5,198) | — | — | |||||
JPMorgan Chase & Co.(c) | 6,400 | — | — | 6,400 | |||||
Total | $ | 11,823 | $ | (5,198) | $ | — | $ | 6,625 | |
Offsetting of Financial Liabilities and Derivative Liabilities | |||||||||
Gross Amounts | |||||||||
of Recognized | Offsetting Asset | Collateral | |||||||
Counterparty | Liabilities | or Liability(a) | Pledged(b) | Net Amount | |||||
Barclays Capital, Inc. | $ | 3,649 | $ | — | $ | — | $ | 3,649 | |
HSBC Securities (USA), Inc. | 23,320 | (5,198) | — | 18,122 | |||||
Total | $ | 26,969 | $ | (5,198) | $ | — | $ | 21,771 | |
(a) | Represents the amount of assets or liabilities that could be offset with the same counterparty under master netting or similar agreements that management elects not to offset on the Statement of Assets and Liabilities. | ||||||||
(b) | Collateral pledged is limited to the net outstanding amount due to/from an individual counterparty. The actual collateral amounts pledged may exceed these amounts and may fluctuate in value. | ||||||||
(c) | This counterparty has an ISDA Master Agreement with the Fund and a separate ISDA Master Agreement with the Subsidiary. Exposure from OTC derivatives can only be netted across transactions governed under the same ISDA Master Agreement with the same legal entity. The Fund and Subsidiary are recognized as two separate legal entities. As such, exposure cannot be netted. This line item represents the amount from the Subsidiary. | ||||||||
The Fund generally does not exchange collateral on its forward foreign currency contracts with its counterparties; however, all liquid securities and restricted cash are considered to cover in an amount at all times equal to or greater
32 | JUNE 30, 2018 |
Janus Henderson Diversified Alternatives Fund
Notes to Consolidated Financial Statements
than the Fund’s commitment with respect to these contracts. Certain securities may be segregated at the Fund’s custodian. These segregated securities are denoted on the accompanying Consolidated Schedule of Investments and are evaluated daily to ensure their cover and/or market value equals or exceeds the Fund’s corresponding forward foreign currency exchange contract's obligation value.
The Fund may require the counterparty to pledge securities as collateral daily (based on the daily valuation of the financial asset) if the Fund has a net aggregate unrealized gain on OTC derivative contracts with a particular counterparty. The Fund may deposit cash as collateral with the counterparty and/or custodian daily (based on the daily valuation of the financial asset) if the Fund has a net aggregate unrealized loss on OTC derivative contracts with a particular counterparty. The collateral amounts are subject to minimum exposure requirements and initial margin requirements. Collateral amounts are monitored and subsequently adjusted up or down as valuations fluctuate by at least the minimum exposure requirement. Collateral may reduce the risk of loss.
Sovereign Debt
The Fund may invest in U.S. and non-U.S. government debt securities (“sovereign debt”). Some investments in sovereign debt, such as U.S. sovereign debt, are considered low risk. However, investments in sovereign debt, especially the debt of less developed countries, can involve a high degree of risk, including the risk that the governmental entity that controls the repayment of sovereign debt may not be willing or able to repay the principal and/or to pay the interest on its sovereign debt in a timely manner. A sovereign debtor’s willingness or ability to satisfy its debt obligation may be affected by various factors including, but not limited to, its cash flow situation, the extent of its foreign currency reserves, the availability of foreign exchange when a payment is due, the relative size of its debt position in relation to its economy as a whole, the sovereign debtor’s policy toward international lenders, and local political constraints to which the governmental entity may be subject. Sovereign debtors may also be dependent on expected disbursements from foreign governments, multilateral agencies, and other entities. The failure of a sovereign debtor to implement economic reforms, achieve specified levels of economic performance, or repay principal or interest when due may result in the cancellation of third party commitments to lend funds to the sovereign debtor, which may further impair such debtor’s ability or willingness to timely service its debts. The Fund may be requested to participate in the rescheduling of such sovereign debt and to extend further loans to governmental entities, which may adversely affect the Fund’s holdings. In the event of default, there may be limited or no legal remedies for collecting sovereign debt and there may be no bankruptcy proceedings through which the Fund may collect all or part of the sovereign debt that a governmental entity has not repaid. In addition, to the extent the Fund invests in non-U.S. sovereign debt, it may be subject to currency risk.
4. Investment Advisory Agreements and Other Transactions with Affiliates
The Fund and the Subsidiary each pay Janus Capital an investment advisory fee which is calculated daily and paid monthly. The following table reflects the Fund’s and the Subsidiary's contractual investment advisory fee rate (expressed as an annual rate).
Average Daily Net Assets of the Fund | Contractual Investment Advisory Fee (%) |
First $1 Billion | 1.00 |
Over $1 Billion | 0.95 |
Janus Capital has contractually agreed to waive a portion of the Fund’s management fee in an amount equal to the management fee paid to Janus Capital by the Subsidiary. The management fee waiver arrangement related to the Subsidiary may not be discontinued by Janus Capital as long as its contract with the Subsidiary is in place.
Janus Capital has contractually agreed to waive the advisory fee payable by the Fund or reimburse expenses in an amount equal to the amount, if any, that the Fund’s total annual fund operating expenses, which include the other expenses of the Subsidiary, including the investment advisory fee, but excluding the fees payable pursuant to a Rule 12b-1 plan, shareholder servicing fees, such as transfer agency fees (including out-of-pocket costs), administrative services fees and any networking/omnibus/administrative fees payable by any share class, brokerage commissions, interest, dividends, taxes, acquired fund fees and expenses, and extraordinary expenses, exceed the annual rate of 1.09% of the Fund’s average daily net assets. Janus Capital has agreed to continue the waivers until at least November 1, 2018. The previous expense limit (until November 1, 2017) was 1.25%.If applicable, amounts waived and/or reimbursed to the Fund by Janus Capital are disclosed as “Excess Expense Reimbursement and Waivers” on the Consolidated Statement of Operations.
Janus Investment Fund | 33 |
Janus Henderson Diversified Alternatives Fund
Notes to Consolidated Financial Statements
Janus Services LLC (“Janus Services”), a wholly-owned subsidiary of Janus Capital, is the Fund’s and the Subsidiary's transfer agent. In addition, Janus Services provides or arranges for the provision of certain other administrative services including, but not limited to, recordkeeping, accounting, order processing, and other shareholder services for the Fund. Janus Services is not compensated for its services related to the shares, except for out-of-pocket costs. These amounts are disclosed as “Other transfer agent fees and expenses” on the Consolidated Statement of Operations.
Certain, but not all, intermediaries may charge administrative fees (such as networking and omnibus) to investors in Class A Shares, Class C Shares, and Class I Shares for administrative services provided on behalf of such investors. These administrative fees are paid by the Class A Shares, Class C Shares, and Class I Shares of the Fund to Janus Services, which uses such fees to reimburse intermediaries. Consistent with the Transfer Agency Agreement between Janus Services and the Fund, Janus Services may negotiate the level, structure, and/or terms of the administrative fees with intermediaries requiring such fees on behalf of the Fund. Janus Capital and its affiliates benefit from an increase in assets that may result from such relationships. The Funds’ Trustees have set limits on fees that the Funds may incur with respect to administrative fees paid for omnibus or networked accounts. Such limits are subject to change by the Trustees in the future. These amounts are disclosed as “Transfer agent networking and omnibus fees” on the Consolidated Statement of Operations.
The Fund’s Class D Shares pay an administrative services fee at an annual rate of 0.12% of the average daily net assets of Class D Shares for shareholder services provided by Janus Services. Janus Services provides or arranges for the provision of shareholder services including, but not limited to, recordkeeping, accounting, answering inquiries regarding accounts, transaction processing, transaction confirmations, and the mailing of prospectuses and shareholder reports. These amounts are disclosed as “Transfer agent administrative fees and expenses” on the Consolidated Statement of Operations.
Janus Services receives an administrative services fee at an annual rate of up to 0.25% of the average daily net assets of the Fund’s Class S Shares and Class T Shares for providing or procuring administrative services to investors in Class S Shares and Class T Shares of the Fund. Janus Services expects to use all or a significant portion of this fee to compensate retirement plan service providers, broker-dealers, bank trust departments, financial advisors, and other financial intermediaries for providing these services. Janus Services or its affiliates may also pay fees for services provided by intermediaries to the extent the fees charged by intermediaries exceed the 0.25% of net assets charged to Class S Shares and Class T Shares of the Fund. Janus Services may keep certain amounts retained for reimbursement of out-of-pocket costs incurred for servicing clients of Class S Shares and Class T Shares. These amounts are disclosed as “Transfer agent administrative fees and expenses” on the Consolidated Statement of Operations.
Services provided by these financial intermediaries may include, but are not limited to, recordkeeping, subaccounting, order processing, providing order confirmations, periodic statements, forwarding prospectuses, shareholder reports, and other materials to existing customers, answering inquiries regarding accounts, and other administrative services. Order processing includes the submission of transactions through the National Securities Clearing Corporation (“NSCC”) or similar systems, or those processed on a manual basis with Janus Capital. For all share classes except Class D Shares, Janus Services also seeks reimbursement for costs it incurs as transfer agent and for providing servicing.
Janus Services is compensated for its services related to the Fund’s Class D Shares. In addition to the administrative fees discussed above, Janus Services receives reimbursement for out-of-pocket costs it incurs for serving as transfer agent and providing, or arranging for, servicing to shareholders. These amounts are disclosed as “Other transfer agent fees and expenses” on the Consolidated Statement of Operations.
Under a distribution and shareholder servicing plan (the “Plan”) adopted in accordance with Rule 12b-1 under the 1940 Act, the Fund pays the Trust’s distributor, Janus Henderson Distributors, a wholly-owned subsidiary of Janus Capital, a fee for the sale and distribution and/or shareholder servicing of the Shares at an annual rate of up to 0.25% of the Class A Shares’ average daily net assets, of up to 1.00% of the Class C Shares’ average daily net assets, and of up to 0.25% of the Class S Shares’ average daily net assets. Under the terms of the Plan, the Trust is authorized to make payments to Janus Henderson Distributors for remittance to retirement plan service providers, broker-dealers, bank trust departments, financial advisors, and other financial intermediaries, as compensation for distribution and/or shareholder services performed by such entities for their customers who are investors in the Fund. These amounts are disclosed as “12b-1 Distribution and shareholder servicing fees” on the Consolidated Statement of Operations. Payments under the Plan are not tied exclusively to actual 12b-1 distribution and shareholder service expenses, and the payments may exceed 12b-1 distribution and shareholder service expenses actually incurred. If any of the Fund’s actual
34 | JUNE 30, 2018 |
Janus Henderson Diversified Alternatives Fund
Notes to Consolidated Financial Statements
12b-1 distribution and shareholder service expenses incurred during a calendar year are less than the payments made during a calendar year, the Fund will be refunded the difference. Refunds, if any, are included in “12b-1 Distribution and shareholder servicing fees” in the Consolidated Statement of Operations.
Janus Capital serves as administrator to the Fund pursuant to an administration agreement between Janus Capital and the Trust. Under the administration agreement, Janus Capital provides oversight and coordination of the Fund’s service providers, recordkeeping, and other administrative services, and is reimbursed by the Fund for certain of its costs in providing these services (to the extent Janus Capital seeks reimbursement and such costs are not otherwise waived). In addition, employees of Janus Capital and/or its affiliates may serve as officers of the Trust. The Fund pays for some or all of the salaries, fees, and expenses of Janus Capital employees and Fund officers, with respect to certain specified administration functions they perform on behalf of the Fund. The Fund pays these costs based on out-of-pocket expenses incurred by Janus Capital, and these costs are separate and apart from advisory fees and other expenses paid in connection with the investment advisory services Janus Capital (or any subadvisor, as applicable) provides to the Fund. These amounts are disclosed as “Affiliated Fund administration fees” on the Consolidated Statement of Operations. In addition, some expenses related to compensation payable to the Fund’s Chief Compliance Officer and certain compliance staff, all of whom are employees of Janus Capital and/or its affiliates, are shared with the Fund. Total compensation of $476,345 was paid to the Chief Compliance Officer and certain compliance staff by the Trust during the year ended June 30, 2018. The Fund's portion is reported as part of “Other expenses” on the Consolidated Statement of Operations.
Effective April 1, 2018, BNP Paribas Financial Services (“BPFS”) provides certain administrative services to the Fund, including services related to Fund accounting, calculation of the Fund’s daily NAV, and Fund audit, tax, and reporting obligations, pursuant to a sub-administration agreement with Janus Capital on behalf of the Fund. As compensation for such services, Janus Capital pays BPFS a fee based on a percentage of the Fund’s assets, along with a flat fee, and is reimbursed by the Fund for amounts paid to BPFS (to the extent Janus Capital seeks reimbursement and such costs are not otherwise waived). These amounts are disclosed as “Non-affiliated fund administration fees” on the Consolidated Statement of Operations.
The Board of Trustees has adopted a deferred compensation plan (the “Deferred Plan”) for independent Trustees to elect to defer receipt of all or a portion of the annual compensation they are entitled to receive from the Fund. All deferred fees are credited to an account established in the name of the Trustees. The amounts credited to the account then increase or decrease, as the case may be, in accordance with the performance of one or more of the Janus Henderson funds that are selected by the Trustees. The account balance continues to fluctuate in accordance with the performance of the selected fund or funds until final payment of all amounts are credited to the account. The fluctuation of the account balance is recorded by the Fund as unrealized appreciation/(depreciation) and is included as of June 30, 2018 on the Consolidated Statement of Assets and Liabilities in the asset, “Non-interested Trustees’ deferred compensation,” and liability, “Non-interested Trustees’ deferred compensation fees.” Additionally, the recorded unrealized appreciation/(depreciation) is included in “Unrealized net appreciation/(depreciation) of investments, foreign currency translations and non-interested Trustees’ deferred compensation” on the Consolidated Statement of Assets and Liabilities. Deferred compensation expenses for the year ended June 30, 2018 are included in “Non-interested Trustees’ fees and expenses” on the Consolidated Statement of Operations. Trustees are allowed to change their designation of mutual funds from time to time. Amounts will be deferred until distributed in accordance with the Deferred Plan. Deferred fees of $471,025 were paid by the Trust to the Trustees under the Deferred Plan during the year ended June 30, 2018.
Pursuant to the provisions of the 1940 Act and related rules, the Fund may participate in an affiliated or nonaffiliated cash sweep program. In the cash sweep program, uninvested cash balances of the Fund may be used to purchase shares of affiliated or nonaffiliated money market funds or cash management pooled investment vehicles. The Fund is eligible to participate in the cash sweep program (the “Investing Funds”). As adviser, Janus Capital has an inherent conflict of interest because of its fiduciary duties to the affiliated money market funds or cash management pooled investment vehicles and the Investing Funds. Janus Henderson Cash Liquidity Fund LLC is an affiliated unregistered cash management pooled investment vehicle that invests primarily in highly-rated short-term fixed-income securities. Janus Henderson Cash Liquidity Fund LLC currently maintains a NAV of $1.00 per share and distributes income daily in a manner consistent with a registered product compliant with Rule 2a-7 under the 1940 Act. There are no restrictions on the Fund's ability to withdraw investments from Janus Henderson Cash Liquidity Fund LLC at will, and
Janus Investment Fund | 35 |
Janus Henderson Diversified Alternatives Fund
Notes to Consolidated Financial Statements
there are no unfunded capital commitments due from the Fund to Janus Henderson Cash Liquidity Fund LLC. The units of Janus Henderson Cash Liquidity Fund LLC are not charged any management fee, sales charge or service fee.
Any purchases and sales, realized gains/losses and recorded dividends from affiliated investments during the year ended June 30, 2018 can be found in the “Schedules of Affiliated Investments” located in the Consolidated Schedule of Investments.
Class A Shares include a 5.75% upfront sales charge of the offering price of the Fund. The sales charge is allocated between Janus Henderson Distributors and financial intermediaries. During the year ended June 30, 2018, Janus Henderson Distributors retained upfront sales charges of $78.
A contingent deferred sales charge (“CDSC”) of 1.00% will be deducted with respect to Class A Shares purchased without a sales load and redeemed within 12 months of purchase, unless waived. Any applicable CDSC will be 1.00% of the lesser of the original purchase price or the value of the redemption of the Class A Shares redeemed. There were no CDSCs paid by redeeming shareholders of Class A Shares to Janus Henderson Distributors during the year ended June 30, 2018.
A CDSC of 1.00% will be deducted with respect to Class C Shares redeemed within 12 months of purchase, unless waived. Any applicable CDSC will be 1.00% of the lesser of the original purchase price or the value of the redemption of the Class C Shares redeemed. During the year ended June 30, 2018, redeeming shareholders of Class C Shares paid CDSCs of $100.
As of June 30, 2018, shares of the Fund were owned by affiliates of Janus Henderson Investors, and/or other funds advised by Janus Henderson, as indicated in the table below:
Class | % of Class Owned |
| % of Fund Owned |
| |
Class A Shares | 29 | % | 1 | % | |
Class C Shares | 65 | 1 | |||
Class D Shares | - | - | |||
Class I Shares | - | - | |||
Class N Shares | 98 | 65 | |||
Class S Shares | 100 | 1 | |||
Class T Shares | 21 | 1 | |||
In addition, other shareholders, including other funds, individuals, accounts, as well as the Fund’s portfolio manager(s) and/or investment personnel, may from time to time own (beneficially or of record) a significant percentage of the Fund’s Shares and can be considered to “control” the Fund when that ownership exceeds 25% of the Fund’s assets (and which may differ from control as determined in accordance with accounting principles generally accepted in the United States of America).
5. Federal Income Tax
The tax components of capital shown in the table below represent: (1) distribution requirements the Fund must satisfy under the income tax regulations; (2) losses or deductions the Fund may be able to offset against income and gains realized in future years; and (3) unrealized appreciation or depreciation of investments for federal income tax purposes.
Other book to tax differences primarily consist of deferred compensation, derivatives, and foreign currency contract adjustments. The Fund has elected to treat gains and losses on forward foreign currency contracts as capital gains and losses, if applicable. Other foreign currency gains and losses on debt instruments are treated as ordinary income for federal income tax purposes pursuant to Section 988 of the Internal Revenue Code.
Loss Deferrals | Other Book | Net Tax | |||||
Undistributed | Undistributed
| Accumulated | Late-Year | Post-October | to Tax | Appreciation/ | |
$ 678,814 | $ - | $ (332,257) | $ - | $ - | $ (35,369) | $ (631,026) | |
36 | JUNE 30, 2018 |
Janus Henderson Diversified Alternatives Fund
Notes to Consolidated Financial Statements
Accumulated capital losses noted below represent net capital loss carryovers, as of June 30, 2018, that may be available to offset future realized capital gains and thereby reduce future taxable gains distributions. The following table shows these capital loss carryovers.
Capital Loss Carryover Schedule | |||||
For the year ended June 30, 2018 | |||||
No Expiration | |||||
| Short-Term | Long-Term | Accumulated | ||
| $ (332,257) | $ - | $ (332,257) | ||
The aggregate cost of investments and the composition of unrealized appreciation and depreciation of investment securities for federal income tax purposes as of June 30, 2018 are noted below. The primary difference between book and tax appreciation or depreciation of investments is investments in partnerships.
Federal Tax Cost | Unrealized | Unrealized
| Net Tax Appreciation/ |
$ 108,630,501 | $ 12,452 | $ (643,478) | $ (631,026) |
Information on the tax components of derivatives as of June 30, 2018 is as follows:
Federal Tax Cost | Unrealized | Unrealized | Net
Tax Appreciation/ |
$ 298,458 | $ 6,400 | $ (3,649) | $ 2,751 |
Tax cost of investments and unrealized appreciation/(depreciation) may also include timing differences that do not constitute adjustments to tax basis.
Income and capital gains distributions are determined in accordance with income tax regulations that may differ from accounting principles generally accepted in the United States of America. These differences are due to differing treatments for items such as net short-term gains, deferral of wash sale losses, foreign currency transactions, net investment losses, and capital loss carryovers. Certain permanent differences such as tax returns of capital and net investment losses noted below have been reclassified to capital.
For the year ended June 30, 2018 | ||||
Distributions | ||||
From Ordinary Income | From Long-Term Capital Gains | Tax Return of Capital | Net Investment Loss | |
$ 2,926,822 | $ 113,172 | $ - | $ - | |
For the year ended June 30, 2017 | ||||
Distributions | ||||
From Ordinary Income | From Long-Term Capital Gains | Tax Return of Capital | Net Investment Loss | |
$ 1,805,193 | $ - | $ - | $ - | |
Permanent book to tax basis differences may result in reclassifications between the components of net assets. These differences have no impact on the results of operations or net assets. The following reclassifications have been made to the Fund:
Janus Investment Fund | 37 |
Janus Henderson Diversified Alternatives Fund
Notes to Consolidated Financial Statements
Increase/(Decrease) to Capital | Increase/(Decrease)
to Undistributed | Increase/(Decrease) to Undistributed
|
$ - | $ 1,685,785 | $ (1,685,785) |
6. Capital Share Transactions
Year ended June 30, 2018 | Year ended June 30, 2017 | |||||
Shares | Amount | Shares | Amount | |||
Class A Shares: | ||||||
Shares sold | 178,367 | $ 1,824,059 | 68,349 | $ 693,334 | ||
Reinvested dividends and distributions | 8,168 | 82,741 | 8,507 | 84,982 | ||
Shares repurchased | (20,563) | (210,749) | (141,210) | (1,426,666) | ||
Net Increase/(Decrease) | 165,972 | $ 1,696,051 |
| (64,354) | $ (648,350) | |
Class C Shares: | ||||||
Shares sold | 18,346 | $ 184,332 | 27,955 | $ 276,529 | ||
Reinvested dividends and distributions | 3,245 | 32,353 | 4,041 | 39,641 | ||
Shares repurchased | (7,945) | (79,314) | (3,618) | (35,814) | ||
Net Increase/(Decrease) | 13,646 | $ 137,371 |
| 28,378 | $ 280,356 | |
Class D Shares: | ||||||
Shares sold | 200,339 | $ 2,054,582 | 275,006 | $2,801,234 | ||
Reinvested dividends and distributions | 12,180 | 123,867 | 12,801 | 128,390 | ||
Shares repurchased | (176,901) | (1,816,899) | (289,307) | (2,938,495) | ||
Net Increase/(Decrease) | 35,618 | $ 361,550 |
| (1,500) | $ (8,871) | |
Class I Shares: | ||||||
Shares sold | 1,581,941 | $16,285,667 | 730,298 | $7,421,286 | ||
Reinvested dividends and distributions | 37,380 | 380,532 | 10,483 | 105,459 | ||
Shares repurchased | (326,472) | (3,358,241) | (323,385) | (3,287,902) | ||
Net Increase/(Decrease) | 1,292,849 | $13,307,958 |
| 417,396 | $4,238,843 | |
Class N Shares: | ||||||
Shares sold | 2,978,018 | $30,971,228 | 815,553 | $8,243,513 | ||
Reinvested dividends and distributions | 219,132 | 2,237,334 | 132,356 | 1,334,148 | ||
Shares repurchased | (659,996) | (6,802,451) | (763,744) | (7,791,468) | ||
Net Increase/(Decrease) | 2,537,154 | $26,406,111 |
| 184,165 | $1,786,193 | |
Class S Shares: | ||||||
Shares sold | 98 | $ 1,000 | - | $ - | ||
Reinvested dividends and distributions | 3,311 | 33,374 | 4,173 | 41,439 | ||
Shares repurchased | - | - | - | - | ||
Net Increase/(Decrease) | 3,409 | $ 34,374 |
| 4,173 | $ 41,439 | |
Class T Shares: | ||||||
Shares sold | 435,554 | $ 4,472,608 | 301,264 | $3,042,024 | ||
Reinvested dividends and distributions | 14,630 | 148,058 | 7,049 | 70,488 | ||
Shares repurchased | (182,986) | (1,869,999) | (102,214) | (1,039,377) | ||
Net Increase/(Decrease) | 267,198 | $ 2,750,667 |
| 206,099 | $2,073,135 | |
7. Purchases and Sales of Investment Securities
For the year ended June 30, 2018, the aggregate cost of purchases and proceeds from sales of investment securities (excluding any short-term securities, short-term options contracts, TBAs, and in-kind transactions, as applicable) was as follows:
Purchases of | Proceeds from Sales | Purchases
of Long- | Proceeds
from Sales |
$ - | $ 2,575,000 | $ - | $ - |
38 | JUNE 30, 2018 |
Janus Henderson Diversified Alternatives Fund
Notes to Consolidated Financial Statements
8. Recent Accounting Pronouncements
The Securities and Exchange Commission ("SEC") adopted new rules as well as amendments to its rules to modernize the reporting and disclosure of information by registered investment companies. In addition, the SEC adopted amendments to Regulation S-X, which require standardized, enhanced disclosure about derivatives in investment company financial statements, as well as other amendments. The compliance date of the amendments to Regulation S-X was August 1, 2017. This report incorporates the amendments to Regulation S-X.
The FASB issued Accounting Standards Update No. 2017-08, Receivables – Nonrefundable Fees and Other Costs (Subtopic 310-20), Premium Amortization on Purchased Callable Debt Securities ("ASU 2017-08") to amend the amortization period for certain purchased callable debt securities held at a premium. The guidance requires certain premiums on callable debt securities to be amortized to the earliest call date. The amortization period for callable debt securities purchased at a discount will not be impacted. The amendments are effective for fiscal years, and interim periods within those fiscal years, beginning after December 15, 2018. Early adoption is permitted, including adoption in an interim period. Management is currently evaluating the impacts of ASU 2017-08 on the financial statements.
9. Subsequent Event
Management has evaluated whether any events or transactions occurred subsequent to June 30, 2018 and through the date of issuance of the Fund’s consolidated financial statements and determined that there were no material events or transactions that would require recognition or disclosure in the Fund’s consolidated financial statements.
Janus Investment Fund | 39 |
Janus Henderson Diversified Alternatives Fund
Report of Independent Registered Public Accounting Firm
To the Board of Trustees of Janus Investment Fund and Shareholders of Janus Henderson Diversified Alternatives Fund:
Opinion on the Financial Statements
We have audited the accompanying consolidated statement of assets and liabilities, including the consolidated schedule of investments, of Janus Henderson Diversified Alternatives Fund (one of the funds constituting Janus Investment Fund, referred to hereafter as the "Fund") as of June 30, 2018, the related consolidated statement of operations for the year ended June 30, 2018, the consolidated statements of changes in net assets for each of the two years in the period ended June 30, 2018, including the related notes, and the consolidated financial highlights for each of the five years in the period ended June 30, 2018 (collectively referred to as the “financial statements”). In our opinion, the financial statements present fairly, in all material respects, the financial position of the Fund as of June 30, 2018, the results of its operations for the year then ended, the changes in its net assets for each of the two years in the period ended June 30, 2018 and the financial highlights for each of the five years in the period ended June 30, 2018 in conformity with accounting principles generally accepted in the United States of America.
Basis for Opinion
These financial statements are the responsibility of the Fund’s management. Our responsibility is to express an opinion on the Fund’s financial statements based on our audits. We are a public accounting firm registered with the Public Company Accounting Oversight Board (United States) (“PCAOB”) and are required to be independent with respect to the Fund in accordance with the U.S. federal securities laws and the applicable rules and regulations of the Securities and Exchange Commission and the PCAOB.
We conducted our audits of these financial statements in accordance with the standards of the PCAOB. Those standards require that we plan and perform the audit to obtain reasonable assurance about whether the financial statements are free of material misstatement, whether due to error or fraud.
Our audits included performing procedures to assess the risks of material misstatement of the financial statements, whether due to error or fraud, and performing procedures that respond to those risks. Such procedures included examining, on a test basis, evidence regarding the amounts and disclosures in the financial statements. Our audits also included evaluating the accounting principles used and significant estimates made by management, as well as evaluating the overall presentation of the financial statements. Our procedures included confirmation of securities owned as of June 30, 2018 by correspondence with the custodian, transfer agent and brokers; when replies were not received from brokers, we performed other auditing procedures. We believe that our audits provide a reasonable basis for our opinion.

Denver, Colorado
August 17, 2018
We have served as the auditor of one or more investment companies in Janus Henderson Funds since 1990.
40 | JUNE 30, 2018 |
Janus Henderson Diversified Alternatives Fund
Additional Information (unaudited)
Proxy Voting Policies and Voting Record
A description of the policies and procedures that the Fund uses to determine how to vote proxies relating to its portfolio securities is available without charge: (i) upon request, by calling 1-800-525-1093; (ii) on the Fund’s website at janushenderson.com/proxyvoting; and (iii) on the SEC’s website at http://www.sec.gov. Additionally, information regarding the Fund’s proxy voting record for the most recent twelve-month period ended June 30 is also available, free of charge, through janushenderson.com/proxyvoting and from the SEC’s website at http://www.sec.gov.
Full Holdings
The Fund is required to disclose its complete holdings on Form N-Q within 60 days of the end of the first and third fiscal quarters, and in the annual report and semiannual report to Fund shareholders. These reports (i) are available on the SEC’s website at http://www.sec.gov; (ii) may be reviewed and copied at the SEC’s Public Reference Room in Washington, D.C. (information on the Public Reference Room may be obtained by calling 1-800-SEC-0330); and (iii) are available without charge, upon request, by calling a Janus Henderson representative at 1-877-335-2687 (toll free) (or 1-800-525-3713 if you hold Class D shares). Portfolio holdings consisting of at least the names of the holdings are generally available on a monthly basis with a 30-day lag. Holdings are generally posted approximately two business days thereafter under Full Holdings for the Fund at janushenderson.com/info (or janushenderson.com/reports if you hold Class D Shares).
APPROVAL OF ADVISORY AGREEMENTS DURING THE PERIOD
The Trustees of Janus Investment Fund and Janus Aspen Series, each of whom serves as an “independent” Trustee (the “Trustees”), oversee the management of each Fund of Janus Investment Fund and each Portfolio of Janus Aspen Series (each, a “Fund” and collectively, the “Funds”), and as required by law, determine annually whether to continue the investment advisory agreement for each Fund and the subadvisory agreements for the 14 Funds that utilize subadvisers.
In connection with their most recent consideration of those agreements for each Fund, the Trustees received and reviewed information provided by Janus Capital and the respective subadvisers in response to requests of the Trustees and their independent legal counsel. They also received and reviewed information and analysis provided by, and in response to requests of, their independent fee consultant. Throughout their consideration of the agreements, the Trustees were advised by their independent legal counsel. The Trustees met with management to consider the agreements, and also met separately in executive session with their independent legal counsel and their independent fee consultant.
Additionally, in connection with their consideration of whether to continue the investment advisory agreement and subadvisory agreement for each Fund, as applicable, the Trustees also received and reviewed information in connection with the transaction to combine the respective businesses of Henderson Group plc and Janus Capital Group, Inc., the parent company of Janus Capital (the “Transaction”), announced in October 2016, which closed in the second quarter of 2017. In this regard, the Trustees reviewed information regarding the impact of the Transaction on the services to be provided by Janus Capital and each subadviser, as applicable, to the Funds under such agreements prior to the close of the Transaction as well as the services provided after the Transaction closed.
At a meeting held on December 7, 2017, based on the Trustees’ evaluation of the information provided by Janus Capital, the subadvisers, and the independent fee consultant, as well as other information, the Trustees determined that the overall arrangements between each Fund and Janus Capital and each subadviser, as applicable, were fair and reasonable in light of the nature, extent and quality of the services provided by Janus Capital, its affiliates and the subadvisers, the fees charged for those services, and other matters that the Trustees considered relevant in the exercise of their business judgment. At that meeting, the Trustees unanimously approved the continuation of the investment advisory agreement for each Fund, and the subadvisory agreement for each subadvised Fund, for the period from February 1, 2018 through February 1, 2019, subject to earlier termination as provided for in each agreement.
In considering the continuation of those agreements, the Trustees reviewed and analyzed various factors that they determined were relevant, including the factors described below, none of which by itself was considered dispositive. However, the material factors and conclusions that formed the basis for the Trustees’ determination to approve the continuation of the agreements are discussed separately below. Also included is a summary of the independent fee consultant’s conclusions and opinions that arose during, and were included as part of, the Trustees’ consideration of the
Janus Investment Fund | 41 |
Janus Henderson Diversified Alternatives Fund
Additional Information (unaudited)
agreements. “Management fees,” as used herein, reflect actual annual advisory fees and any administration fees (excluding out of pocket costs), net of any waivers.
Nature, Extent and Quality of Services
The Trustees reviewed the nature, extent and quality of the services provided by Janus Capital and the subadvisers to the Funds, taking into account the investment objective, strategies and policies of each Fund, and the knowledge the Trustees gained from their regular meetings with management on at least a quarterly basis and their ongoing review of information related to the Funds. In addition, the Trustees reviewed the resources and key personnel of Janus Capital and each subadviser, particularly noting those employees who provide investment and risk management services to the Funds. The Trustees also considered other services provided to the Funds by Janus Capital or the subadvisers, such as managing the execution of portfolio transactions and the selection of broker-dealers for those transactions. The Trustees considered Janus Capital’s role as administrator to the Funds, noting that Janus Capital does not receive a fee for its services but is reimbursed for its out-of-pocket costs. The Trustees considered the role of Janus Capital in monitoring adherence to the Funds’ investment restrictions, providing support services for the Trustees and Trustee committees, and overseeing communications with shareholders and the activities of other service providers, including monitoring compliance with various policies and procedures of the Funds and with applicable securities laws and regulations.
In this regard, the independent fee consultant noted that Janus Capital provides a number of different services for the Funds and Fund shareholders, ranging from investment management services to various other servicing functions, and that, in its opinion, Janus Capital is a capable provider of those services. The independent fee consultant also provided its belief that Janus Capital has developed a number of institutional competitive advantages that should enable it to provide superior investment and service performance over the long term.
The Trustees concluded that the nature, extent and quality of the services provided by Janus Capital or the subadviser to each Fund were appropriate and consistent with the terms of the respective advisory and subadvisory agreements, and that, taking into account steps taken to address those Funds whose performance lagged that of their peers for certain periods, the Funds were likely to benefit from the continued provision of those services. They also concluded that Janus Capital and each subadviser had sufficient personnel, with the appropriate education and experience, to serve the Funds effectively and had demonstrated its ability to attract well-qualified personnel.
Performance of the Funds
The Trustees considered the performance results of each Fund over various time periods. They noted that they considered Fund performance data throughout the year, including periodic meetings with each Fund’s portfolio manager(s), and also reviewed information comparing each Fund’s performance with the performance of comparable funds and peer groups identified by Broadridge Financial Solutions, Inc. (“Broadridge”), an independent data provider, and with the Fund’s benchmark index. In this regard, the independent fee consultant found that the overall Funds’ performance has been strong: for the 36 months ended September 30, 2017, approximately 70% of the Funds were in the top two quartiles of performance, as reported by Morningstar, and for the 12 months ended September 30, 2017, approximately 46% of the Funds were in the top two quartiles of performance, as reported by Morningstar.
The Trustees considered the performance of each Fund, noting that performance may vary by share class, and noted the following:
Alternative Funds
· For Janus Henderson Diversified Alternatives Fund, the Trustees noted that the Fund’s performance was in the second Broadridge quartile for the 36 months ended May 31, 2017 and the second Broadridge quartile for the 12 months ended May 31, 2017.
· For Janus Henderson International Long/Short Equity Fund, the Trustees noted that the Fund’s performance was in the bottom Broadridge quartile for the 12 months ended May 31, 2017. The Trustees noted the reasons for the Fund’s underperformance, the steps Janus Capital had taken or was taking to improve performance, and the Fund’s limited performance history.
Asset Allocation Funds
· For Janus Henderson Global Allocation Fund – Conservative, the Trustees noted that the Fund’s performance was in the bottom Broadridge quartile for the 36 months ended May 31, 2017 and the second Broadridge
42 | JUNE 30, 2018 |
Janus Henderson Diversified Alternatives Fund
Additional Information (unaudited)
quartile for the 12 months ended May 31, 2017. The Trustees noted the reasons for the Fund’s underperformance, the steps Janus Capital had taken or was taking to improve performance, and that the performance trend was improving.
· For Janus Henderson Global Allocation Fund – Growth, the Trustees noted that the Fund’s performance was in the bottom Broadridge quartile for the 36 months ended May 31, 2017 and the second Broadridge quartile for the 12 months ended May 31, 2017. The Trustees noted the reasons for the Fund’s underperformance, the steps Janus Capital had taken or was taking to improve performance, and that the performance trend was improving.
· For Janus Henderson Global Allocation Fund – Moderate, the Trustees noted that the Fund’s performance was in the bottom Broadridge quartile for the 36 months ended May 31, 2017 and the third Broadridge quartile for the 12 months ended May 31, 2017. The Trustees noted the reasons for the Fund’s underperformance and the steps Janus Capital had taken or was taking to improve performance.
Fixed-Income Funds
· For Janus Henderson Flexible Bond Fund, the Trustees noted that the Fund’s performance was in the bottom Broadridge quartile for the 36 months ended May 31, 2017 and the bottom Broadridge quartile for the 12 months ended May 31, 2017. The Trustees noted the reasons for the Fund’s underperformance and the steps Janus Capital had taken or was taking to improve performance.
· For Janus Henderson Global Bond Fund, the Trustees noted that the Fund’s performance was in the third Broadridge quartile for the 36 months ended May 31, 2017 and the bottom Broadridge quartile for the 12 months ended May 31, 2017. The Trustees noted the reasons for the Fund’s underperformance and the steps Janus Capital had taken or was taking to improve performance.
· For Janus Henderson Global Unconstrained Bond Fund, the Trustees noted that the Fund’s performance was in the third Broadridge quartile for the 36 months ended May 31, 2017 and the bottom Broadridge quartile for the 12 months ended May 31, 2017. The Trustees noted the reasons for the Fund’s underperformance and the steps Janus Capital had taken or was taking to improve performance.
· For Janus Henderson High-Yield Fund, the Trustees noted that the Fund’s performance was in the second Broadridge quartile for the 36 months ended May 31, 2017 and the third Broadridge quartile for the 12 months ended May 31, 2017.
· For Janus Henderson Multi-Sector Income Fund, the Trustees noted that the Fund’s performance was in the first Broadridge quartile for the 36 months ended May 31, 2017 and the second Broadridge quartile for the 12 months ended May 31, 2017.
· For Janus Henderson Real Return Fund, the Trustees noted that the Fund’s performance was in the first Broadridge quartile for the 36 months ended May 31, 2017 and the first Broadridge quartile for the 12 months ended May 31, 2017.
· For Janus Henderson Short-Term Bond Fund, the Trustees noted that the Fund’s performance was in the third Broadridge quartile for the 36 months ended May 31, 2017 and the third Broadridge quartile for the 12 months ended May 31, 2017. The Trustees noted the reasons for the Fund’s underperformance and the steps Janus Capital had taken or was taking to improve performance.
· For Janus Henderson Strategic Income Fund, the Trustees noted that the Fund’s performance was in the first Broadridge quartile for the 36 months ended May 31, 2017 and the second Broadridge quartile for the 12 months ended May 31, 2017.
Global and International Equity Funds
· For Janus Henderson Asia Equity Fund, the Trustees noted that the Fund’s performance was in the first Broadridge quartile for the 36 months ended May 31, 2017 and the first Broadridge quartile for the 12 months ended May 31, 2017.
Janus Investment Fund | 43 |
Janus Henderson Diversified Alternatives Fund
Additional Information (unaudited)
· For Janus Henderson Emerging Markets Fund, the Trustees noted that the Fund’s performance was in the first Broadridge quartile for the 36 months ended May 31, 2017 and the third Broadridge quartile for the 12 months ended May 31, 2017.
· For Janus Henderson European Focus Fund, the Trustees noted that the Fund’s performance was in the bottom Broadridge quartile for the 36 months ended May 31, 2017 and the bottom Broadridge quartile for the 12 months ended May 31, 2017. The Trustees noted the reasons for the Fund’s underperformance and the steps Janus Capital had taken or was taking to improve performance.
· For Janus Henderson Global Equity Income Fund, the Trustees noted that the Fund’s performance was in the third Broadridge quartile for the 36 months ended May 31, 2017 and the second Broadridge quartile for the 12 months ended May 31, 2017. The Trustees noted the reasons for the Fund’s underperformance, the steps Janus Capital had taken or was taking to improve performance, and that the performance trend was improving.
· For Janus Henderson Global Life Sciences Fund, the Trustees noted that the Fund’s performance was in the second Broadridge quartile for the 36 months ended May 31, 2017 and the second Broadridge quartile for the 12 months ended May 31, 2017.
· For Janus Henderson Global Real Estate Fund, the Trustees noted that the Fund’s performance was in the second Broadridge quartile for the 36 months ended May 31, 2017 and the first Broadridge quartile for the 12 months ended May 31, 2017.
· For Janus Henderson Global Research Fund, the Trustees noted that the Fund’s performance was in the third Broadridge quartile for the 36 months ended May 31, 2017 and the second Broadridge quartile for the 12 months ended May 31, 2017. The Trustees noted the reasons for the Fund’s underperformance, while also noting that the Fund has a performance fee structure that results in lower management fees during periods of underperformance, the steps Janus Capital had taken or was taking to improve performance, and that the performance trend was improving.
· For Janus Henderson Global Select Fund, the Trustees noted that the Fund’s performance was in the third Broadridge quartile for the 36 months ended May 31, 2017 and the first Broadridge quartile for the 12 months ended May 31, 2017. The Trustees noted the reasons for the Fund’s underperformance, the steps Janus Capital had taken or was taking to improve performance, and that the performance trend was improving.
· For Janus Henderson Global Technology Fund, the Trustees noted that the Fund’s performance was in the third Broadridge quartile for the 36 months ended May 31, 2017 and the third Broadridge quartile for the 12 months ended May 31, 2017. The Trustees noted the reasons for the Fund’s underperformance and the steps Janus Capital had taken or was taking to improve performance.
· For Janus Henderson Global Value Fund, the Trustees noted that the Fund’s performance was in the third Broadridge quartile for the 36 months ended May 31, 2017 and the bottom Broadridge quartile for the 12 months ended May 31, 2017. The Trustees noted the reasons for the Fund’s underperformance, while also noting that the Fund has a performance fee structure that results in lower management fees during periods of underperformance, and the steps Janus Capital and Perkins had taken or were taking to improve performance.
· For Janus Henderson International Opportunities Fund, the Trustees noted that the Fund’s performance was in the second Broadridge quartile for the 36 months ended May 31, 2017 and the bottom Broadridge quartile for the 12 months ended May 31, 2017.
· For Janus Henderson International Small Cap Fund, the Trustees noted that, due to limited performance for the Fund, performance history was not a material factor.
· For Janus Henderson International Value Fund, the Trustees noted that the Fund’s performance was in the third Broadridge quartile for the 36 months ended May 31, 2017 and the bottom Broadridge quartile for the 12 months ended May 31, 2017. The Trustees noted the reasons for the Fund’s underperformance and the steps Janus Capital and Perkins had taken or were taking to improve performance.
· For Janus Henderson Overseas Fund, the Trustees noted that the Fund’s performance was in the bottom Broadridge quartile for the 36 months ended May 31, 2017 and the first Broadridge quartile for the 12 months ended May 31, 2017. The Trustees noted the reasons for the Fund’s underperformance, while also noting that
44 | JUNE 30, 2018 |
Janus Henderson Diversified Alternatives Fund
Additional Information (unaudited)
the Fund has a performance fee structure that results in lower management fees during periods of underperformance, the steps Janus Capital had taken or was taking to improve performance, and that the performance trend was improving.
Money Market Funds
· For Janus Henderson Government Money Market Fund, the Trustees noted that the Fund’s performance was in the third Broadridge quartile for the 36 months ended May 31, 2017 and the third Broadridge quartile for the 12 months ended May 31, 2017. The Trustees noted the reasons for the Fund’s underperformance.
· For Janus Henderson Money Market Fund, the Trustees noted that the Fund’s performance was in the third Broadridge quartile for the 36 months ended May 31, 2017 and the third Broadridge quartile for the 12 months ended May 31, 2017. The Trustees noted the reasons for the Fund’s underperformance.
Multi-Asset Funds
· For Janus Henderson Adaptive Global Allocation Fund, the Trustees noted that the Fund’s performance was in the second Broadridge quartile for the 12 months ended May 31, 2017.
· For Janus Henderson All Asset Fund, the Trustees noted that the Fund’s performance was in the third Broadridge quartile for the 36 months ended May 31, 2017 and the third Broadridge quartile for the 12 months ended May 31, 2017. The Trustees noted the reasons for the Fund’s underperformance and the steps Janus Capital had taken or was taking to improve performance.
· For Janus Henderson Dividend & Income Builder Fund, the Trustees noted that the Fund’s performance was in the second Broadridge quartile for the 36 months ended May 31, 2017 and the second Broadridge quartile for the 12 months ended May 31, 2017.
· For Janus Henderson Value Plus Income Fund, the Trustees noted that the Fund’s performance was in the second Broadridge quartile for the 36 months ended May 31, 2017 and the second Broadridge quartile for the 12 months ended May 31, 2017.
Multi-Asset U.S. Equity Funds
· For Janus Henderson Balanced Fund, the Trustees noted that the Fund’s performance was in the first Broadridge quartile for the 36 months ended May 31, 2017 and the first Broadridge quartile for the 12 months ended May 31, 2017.
· For Janus Henderson Contrarian Fund, the Trustees noted that the Fund’s performance was in the bottom Broadridge quartile for the 36 months ended May 31, 2017 and the first Broadridge quartile for the 12 months ended May 31, 2017. The Trustees noted the reasons for the Fund’s underperformance, while also noting that the Fund has a performance fee structure that results in lower management fees during periods of underperformance, the steps Janus Capital had taken or was taking to improve performance, and that the performance trend was improving.
· For Janus Henderson Enterprise Fund, the Trustees noted that the Fund’s performance was in the first Broadridge quartile for the 36 months ended May 31, 2017 and the second Broadridge quartile for the 12 months ended May 31, 2017.
· For Janus Henderson Forty Fund, the Trustees noted that the Fund’s performance was in the first Broadridge quartile for the 36 months ended May 31, 2017 and the third Broadridge quartile for the 12 months ended May 31, 2017.
· For Janus Henderson Growth and Income Fund, the Trustees noted that the Fund’s performance was in the second Broadridge quartile for the 36 months ended May 31, 2017 and the first Broadridge quartile for the 12 months ended May 31, 2017.
· For Janus Henderson Research Fund, the Trustees noted that the Fund’s performance was in the second Broadridge quartile for the 36 months ended May 31, 2017 and the third Broadridge quartile for the 12 months ended May 31, 2017.
Janus Investment Fund | 45 |
Janus Henderson Diversified Alternatives Fund
Additional Information (unaudited)
· For Janus Henderson Triton Fund, the Trustees noted that the Fund’s performance was in the first Broadridge quartile for the 36 months ended May 31, 2017 and the third Broadridge quartile for the 12 months ended May 31, 2017.
· For Janus Henderson U.S. Growth Opportunities Fund, the Trustees noted that the Fund’s performance was in the bottom Broadridge quartile for the 12 months ended May 31, 2017. The Trustees noted the reasons for the Fund’s underperformance, the steps Janus Capital had taken or was taking to improve performance, and the Fund’s limited performance history.
· For Janus Henderson Venture Fund, the Trustees noted that the Fund’s performance was in the first Broadridge quartile for the 36 months ended May 31, 2017 and the bottom Broadridge quartile for the 12 months ended May 31, 2017.
Quantitative Equity Funds
· For Janus Henderson Emerging Markets Managed Volatility Fund, the Trustees noted that the Fund’s performance was in the bottom Broadridge quartile for the 12 months ended May 31, 2017. The Trustees noted the reasons for the Fund’s underperformance, the steps Janus Capital and Intech had taken or were taking to improve performance, and the Fund’s limited performance history.
· For Janus Henderson Global Income Managed Volatility Fund, the Trustees noted that the Fund’s performance was in the first Broadridge quartile for the 36 months ended May 31, 2017 and the third Broadridge quartile for the 12 months ended May 31, 2017.
· For Janus Henderson International Managed Volatility Fund, the Trustees noted that the Fund’s performance was in the third Broadridge quartile for the 36 months ended May 31, 2017 and the bottom Broadridge quartile for the 12 months ended May 31, 2017. The Trustees noted the reasons for the Fund’s underperformance and the steps Janus Capital and Intech had taken or were taking to improve performance.
· For Janus Henderson U.S. Managed Volatility Fund, the Trustees noted that the Fund’s performance was in the second Broadridge quartile for the 36 months ended May 31, 2017 and the bottom Broadridge quartile for the 12 months ended May 31, 2017.
U.S. Equity Funds
· For Janus Henderson Large Cap Value Fund, the Trustees noted that the Fund’s performance was in the third Broadridge quartile for the 36 months ended May 31, 2017 and the bottom Broadridge quartile for the 12 months ended May 31, 2017. The Trustees noted the reasons for the Fund’s underperformance, while also noting that the Fund has a performance fee structure that results in lower management fees during periods of underperformance, and the steps Janus Capital and Perkins had taken or were taking to improve performance.
· For Janus Henderson Mid Cap Value Fund, the Trustees noted that the Fund’s performance was in the second Broadridge quartile for the 36 months ended May 31, 2017 and the second Broadridge quartile for the 12 months ended May 31, 2017.
· For Janus Henderson Select Value Fund, the Trustees noted that the Fund’s performance was in the first Broadridge quartile for the 36 months ended May 31, 2017 and the second Broadridge quartile for the 12 months ended May 31, 2017.
· For Janus Henderson Small Cap Value Fund, the Trustees noted that the Fund’s performance was in the first Broadridge quartile for the 36 months ended May 31, 2017 and the second Broadridge quartile for the 12 months ended May 31, 2017.
Janus Aspen Series
· For Janus Henderson Balanced Portfolio, the Trustees noted that the Fund’s performance was in the first Broadridge quartile for the 36 months ended May 31, 2017 and the first Broadridge quartile for the 12 months ended May 31, 2017.
· For Janus Henderson Enterprise Portfolio, the Trustees noted that the Fund’s performance was in the first Broadridge quartile for the 36 months ended May 31, 2017 and the second Broadridge quartile for the 12 months ended May 31, 2017.
46 | JUNE 30, 2018 |
Janus Henderson Diversified Alternatives Fund
Additional Information (unaudited)
· For Janus Henderson Flexible Bond Portfolio, the Trustees noted that the Fund’s performance was in the bottom Broadridge quartile for the 36 months ended May 31, 2017 and the bottom Broadridge quartile for the 12 months ended May 31, 2017. The Trustees noted the reasons for the Fund’s underperformance and the steps Janus Capital had taken or was taking to improve performance.
· For Janus Henderson Forty Portfolio, the Trustees noted that the Fund’s performance was in the first Broadridge quartile for the 36 months ended May 31, 2017 and the third Broadridge quartile for the 12 months ended May 31, 2017.
· For Janus Henderson Global Allocation Portfolio – Moderate, the Trustees noted that the Fund’s performance was in the bottom Broadridge quartile for the 36 months ended May 31, 2017 and the second Broadridge quartile for the 12 months ended May 31, 2017. The Trustees noted the reasons for the Fund’s underperformance, the steps Janus Capital had taken or was taking to improve performance, and that the performance trend was improving.
· For Janus Henderson Global Research Portfolio, the Trustees noted that the Fund’s performance was in the third Broadridge quartile for the 36 months ended May 31, 2017 and the third Broadridge quartile for the 12 months ended May 31, 2017. The Trustees noted the reasons for the Fund’s underperformance, while also noting that the Fund has a performance fee structure that results in lower management fees during periods of underperformance, and the steps Janus Capital had taken or was taking to improve performance.
· For Janus Henderson Global Technology Portfolio, the Trustees noted that the Fund’s performance was in the second Broadridge quartile for the 36 months ended May 31, 2017 and the second Broadridge quartile for the 12 months ended May 31, 2017.
· For Janus Henderson Global Unconstrained Bond Portfolio, the Trustees noted that the Fund’s performance was in the bottom Broadridge quartile for the 12 months ended May 31, 2017. The Trustees noted the reasons for the Fund’s underperformance, the steps Janus Capital had taken or was taking to improve performance, and the Fund’s limited performance history.
· For Janus Henderson Mid Cap Value Portfolio, the Trustees noted that the Fund’s performance was in the third Broadridge quartile for the 36 months ended May 31, 2017 and the second Broadridge quartile for the 12 months ended May 31, 2017. The Trustees noted the reasons for the Fund’s underperformance, while also noting that the Fund has a performance fee structure that results in lower management fees during periods of underperformance, the steps Janus Capital and Perkins had taken or were taking to improve performance, and that the performance trend was improving.
· For Janus Henderson Overseas Portfolio, the Trustees noted that the Fund’s performance was in the bottom Broadridge quartile for the 36 months ended May 31, 2017 and the first Broadridge quartile for the 12 months ended May 31, 2017. The Trustees noted the reasons for the Fund’s underperformance, while also noting that the Fund has a performance fee structure that results in lower management fees during periods of underperformance, the steps Janus Capital had taken or was taking to improve performance, and that the performance trend was improving.
· For Janus Henderson Research Portfolio, the Trustees noted that the Fund’s performance was in the second Broadridge quartile for the 36 months ended May 31, 2017 and the third Broadridge quartile for the 12 months ended May 31, 2017.
· For Janus Henderson U.S. Low Volatility Portfolio, the Trustees noted that the Fund’s performance was in the first Broadridge quartile for the 36 months ended May 31, 2017 and the bottom Broadridge quartile for the 12 months ended May 31, 2017.
In consideration of each Fund’s performance, the Trustees concluded that, taking into account the factors relevant to performance, as well as other considerations, including steps taken to improve performance, the Fund’s performance warranted continuation of the Fund’s investment advisory and subadvisory agreement(s).
Costs of Services Provided
The Trustees examined information regarding the fees and expenses of each Fund in comparison to similar information for other comparable funds as provided by Broadridge, an independent data provider. They also reviewed an analysis of
Janus Investment Fund | 47 |
Janus Henderson Diversified Alternatives Fund
Additional Information (unaudited)
that information provided by their independent fee consultant and noted that the rate of management (investment advisory and any administration, but excluding out-of-pocket costs) fees for many of the Funds, after applicable waivers, was below the average management fee rate of the respective peer group of funds selected by an independent data provider. The Trustees also examined information regarding the subadvisory fees charged for subadvisory services, as applicable, noting that all such fees were paid by Janus Capital out of its management fees collected from such Fund.
The independent fee consultant provided its belief that the management fees charged by Janus Capital to each of the Funds under the current investment advisory and administration agreements are reasonable in relation to the services provided by Janus Capital. The independent fee consultant found: (1) the total expenses and management fees of the Funds to be reasonable relative to other mutual funds; (2) total expenses, on average, were 10% below the average total expenses of their respective Broadridge Expense Group peers and 18% below the average total expenses for their Broadridge Expense Universes; (3) management fees for the Funds, on average, were 8% below the average management fees for their Expense Groups and 9% below the average for their Expense Universes; and (4) Fund expenses at the functional level for each asset and share class category were reasonable. The Trustees also considered the total expenses for each share class of each Fund compared to the average total expenses for its Broadridge Expense Group peers and to average total expenses for its Broadridge Expense Universe.
The independent fee consultant concluded that, based on its strategic review of expenses at the complex, category and individual fund level, Fund expenses were found to be reasonable relative to both Expense Group and Expense Universe benchmarks. Further, for certain Funds, the independent fee consultant also performed a systematic “focus list” analysis of expenses in the context of the performance or service delivered to each set of investors in each share class in each selected Fund. Based on this analysis, the independent fee consultant found that the combination of service quality/performance and expenses on these individual Funds and share classes were reasonable in light of performance trends, performance histories, and existence of performance fees, breakpoints, and expense waivers on such Funds.
The Trustees considered the methodology used by Janus Capital and each subadviser in determining compensation payable to portfolio managers, the competitive environment for investment management talent, and the competitive market for mutual funds in different distribution channels.
The Trustees also reviewed management fees charged by Janus Capital and each subadviser to comparable separate account clients and to comparable non-affiliated funds subadvised by Janus Capital or by a subadviser (for which Janus Capital or the subadviser provides only or primarily portfolio management services). Although in most instances subadvisory and separate account fee rates for various investment strategies were lower than management fee rates for Funds having a similar strategy, the Trustees considered that Janus Capital noted that, under the terms of the management agreements with the Funds, Janus Capital performs significant additional services for the Funds that it does not provide to those other clients, including administration services, oversight of the Funds’ other service providers, trustee support, regulatory compliance and numerous other services, and that, in serving the Funds, Janus Capital assumes many legal risks and other costs that it does not assume in servicing its other clients. Moreover, they noted that the independent fee consultant found that: (1) the management fees Janus Capital charges to the Funds are reasonable in relation to the management fees Janus Capital charges to its institutional clients and to the fees Janus Capital charges to funds subadvised by Janus Capital; (2) these institutional and subadvised accounts have different service and infrastructure needs; (3) Janus mutual fund investors enjoy reasonable fees relative to the fees charged to Janus institutional and subadvised fund investors; (4) in three of seven product categories, the Funds receive proportionally better pricing than the industry in relation to Janus institutional clients; and (5) in seven of eight strategies, Janus Capital has lower management fees than funds subadvised by Janus Capital’s portfolio managers.
The Trustees considered the fees for each Fund for its fiscal year ended in 2016, and noted the following with regard to each Fund’s total expenses, net of applicable fee waivers (the Fund’s “total expenses”):
Alternative Funds
· For Janus Henderson Diversified Alternatives Fund, the Trustees noted that, although the Fund’s total expenses exceeded the peer group average for one share class, overall the Fund’s total expenses were reasonable. The Trustees also noted that Janus Capital has contractually agreed to limit the Fund’s expenses.
· For Janus Henderson International Long/Short Equity Fund, the Trustees noted that, although the Fund’s total expenses exceeded the peer group average for one share class, overall the Fund’s total expenses were
48 | JUNE 30, 2018 |
Janus Henderson Diversified Alternatives Fund
Additional Information (unaudited)
reasonable. The Trustees also noted that Janus Capital has contractually agreed to limit the Fund’s expenses effective June 5, 2017.
Asset Allocation Funds
· For Janus Henderson Global Allocation Fund – Conservative, the Trustees noted that, although the Fund’s total expenses exceeded the peer group average for certain share classes, overall the Fund’s total expenses were reasonable. The Trustees also noted that Janus Capital has contractually agreed to limit the Fund’s expenses, although this limit did not apply because the Fund’s total expenses were already below the applicable fee limit.
· For Janus Henderson Global Allocation Fund – Growth, the Trustees noted that the Fund’s total expenses were below the peer group average for all share classes.
· For Janus Henderson Global Allocation Fund – Moderate, the Trustees noted that, although the Fund’s total expenses exceeded the peer group average for certain share classes, overall the Fund’s total expenses were reasonable. The Trustees also noted that Janus Capital has contractually agreed to limit the Fund’s expenses.
Fixed-Income Funds
· For Janus Henderson Flexible Bond Fund, the Trustees noted that, although the Fund’s total expenses exceeded the peer group average for certain share classes, overall the Fund’s total expenses were reasonable. The Trustees also noted that Janus Capital has contractually agreed to limit the Fund’s expenses, although this limit did not apply because the Fund’s total expenses were already below the applicable fee limit.
· For Janus Henderson Global Bond Fund, the Trustees noted that, although the Fund’s total expenses exceeded the peer group average for certain share classes, overall the Fund’s total expenses were reasonable. The Trustees also noted that Janus Capital has contractually agreed to limit the Fund’s expenses.
· For Janus Henderson Global Unconstrained Bond Fund, the Trustees noted that the Fund’s performance was in the third Broadridge quartile for the 36 months ended May 31, 2017 and the bottom Broadridge quartile for the 12 months ended May 31, 2017. The Trustees noted the reasons for the Fund’s underperformance and the steps Janus Capital had taken or was taking to improve performance.
· For Janus Henderson High-Yield Fund, the Trustees noted that, although the Fund’s total expenses exceeded the peer group average for certain share classes, overall the Fund’s total expenses were reasonable. The Trustees also noted that Janus Capital has contractually agreed to limit the Fund’s expenses, although this limit did not apply because the Fund’s total expenses were already below the applicable fee limit.
· For Janus Henderson Multi-Sector Income Fund, the Trustees noted that, although the Fund’s total expenses exceeded the peer group average for one share class, overall the Fund’s total expenses were reasonable. The Trustees also noted that Janus Capital has contractually agreed to limit the Fund’s expenses.
· For Janus Henderson Real Return Fund, the Trustees noted that, although the Fund’s total expenses exceeded the peer group average for certain share classes, overall the Fund’s total expenses were reasonable. The Trustees also noted that Janus Capital has contractually agreed to limit the Fund’s expenses.
· For Janus Henderson Short-Term Bond Fund, the Trustees noted that, although the Fund’s total expenses exceeded the peer group average for certain share classes, overall the Fund’s total expenses were reasonable. The Trustees also noted that Janus Capital has contractually agreed to waive 11 basis points of management fees effective February 1, 2018 and also has contractually agreed to limit the Fund’s expenses.
· For Janus Henderson Strategic Income Fund, the Trustees noted that, although the Fund’s total expenses exceeded the peer group average for one share class, overall the Fund’s total expenses were reasonable. The Trustees also noted that Janus Capital has contractually agreed to limit the Fund’s expenses effective June 5, 2017.
Global and International Equity Funds
· For Janus Henderson Asia Equity Fund, the Trustees noted that, although the Fund’s total expenses exceeded the peer group average for certain share classes, overall the Fund’s total expenses were reasonable. The Trustees also noted that Janus Capital has contractually agreed to limit the Fund’s expenses.
Janus Investment Fund | 49 |
Janus Henderson Diversified Alternatives Fund
Additional Information (unaudited)
· For Janus Henderson Emerging Markets Fund, the Trustees noted that, although the Fund’s total expenses exceeded the peer group average for one share class, overall the Fund’s total expenses were reasonable. The Trustees also noted that Janus Capital has contractually agreed to limit the Fund’s expenses effective June 5, 2017.
· For Janus Henderson European Focus Fund, the Trustees noted that, although the Fund’s total expenses exceeded the peer group average for one share class, overall the Fund’s total expenses were reasonable. The Trustees also noted that Janus Capital has contractually agreed to limit the Fund’s expenses effective June 5, 2017.
· For Janus Henderson Global Equity Income Fund, the Trustees noted that the Fund’s total expenses were below the peer group average for all share classes.
· For Janus Henderson Global Life Sciences Fund, the Trustees noted that the Fund’s total expenses were below the peer group average for all share classes.
· For Janus Henderson Global Real Estate Fund, the Trustees noted that, although the Fund’s total expenses exceeded the peer group average one share class, overall the Fund’s total expenses were reasonable. The Trustees also noted that Janus Capital has contractually agreed to limit the Fund’s expenses, although this limit did not apply because the Fund’s total expenses were already below the applicable fee limit.
· For Janus Henderson Global Research Fund, the Trustees noted that the Fund’s total expenses were below the peer group average for all share classes.
· For Janus Henderson Global Select Fund, the Trustees noted that, although the Fund’s total expenses exceeded the peer group average for one share class, overall the Fund’s total expenses were reasonable. The Trustees also noted that Janus Capital has contractually agreed to limit the Fund’s expenses, although this limit did not apply because the Fund’s total expenses were already below the applicable fee limit.
· For Janus Henderson Global Technology Fund, the Trustees noted that the Fund’s total expenses were below the peer group average for all share classes.
· For Janus Henderson Global Value Fund, the Trustees noted that the Fund’s total expenses were below the peer group average for all share classes.
· For Janus Henderson International Opportunities Fund, the Trustees noted that, although the Fund’s total expenses exceeded the peer group average for certain share classes, overall the Fund’s total expenses were reasonable. The Trustees also noted that Janus Capital has contractually agreed to limit the Fund’s expenses effective June 5, 2017.
· For Janus Henderson International Small Cap Fund, the Trustees noted that, although the Fund’s total expenses exceeded the peer group average for one share class, overall the Fund’s total expenses were reasonable. The Trustees also noted that Janus Capital has contractually agreed to limit the Fund’s expenses effective June 5, 2017.
· For Janus Henderson International Value Fund, the Trustees noted that, although the Fund’s total expenses exceeded the peer group average for one share class, overall the Fund’s total expenses were reasonable. The Trustees also noted that Janus Capital has contractually agreed to limit the Fund’s expenses.
· For Janus Henderson Overseas Fund, the Trustees noted that the Fund’s total expenses were below the peer group average for all share classes.
Money Market Funds
· For Janus Henderson Government Money Market Fund, the Trustees noted that the Fund’s total expenses were below the peer group average for both share classes. In addition, the Trustees considered that Janus Capital voluntarily waives one-half of its advisory fee and other expenses in order to maintain a positive yield.
· For Janus Henderson Money Market Fund, the Trustees noted that the Fund’s total expenses were below the peer group average for both share classes. In addition, the Trustees considered that Janus Capital voluntarily waives one-half of its advisory fee and other expenses in order to maintain a positive yield.
50 | JUNE 30, 2018 |
Janus Henderson Diversified Alternatives Fund
Additional Information (unaudited)
Multi-Asset Funds
· For Janus Henderson Adaptive Global Allocation Fund, the Trustees noted that, although the Fund’s total expenses exceeded the peer group average for one share class, overall the Fund’s total expenses were reasonable. The Trustees also noted that Janus Capital has contractually agreed to limit the Fund’s expenses.
· For Janus Henderson All Asset Fund, the Trustees noted that, although the Fund’s total expenses exceeded the peer group average for one share class, overall the Fund’s total expenses were reasonable. The Trustees also noted that Janus Capital has contractually agreed to limit the Fund’s total expenses effective June 5, 2017.
· For Janus Henderson Dividend & Income Builder Fund, the Trustees noted that, although the Fund’s total expenses exceeded the peer group average for certain share classes, overall the Fund’s total expenses were reasonable. The Trustees also noted that Janus Capital has contractually agreed to limit the Fund’s expenses effective June 5, 2017.
· For Janus Henderson Value Plus Income Fund, the Trustees noted that the Fund’s total expenses were below the peer group average for all share classes.
Multi-Asset U.S. Equity Funds
· For Janus Henderson Balanced Fund, the Trustees noted that, although the Fund’s total expenses exceeded the peer group average for certain share classes, overall the Fund’s total expenses were reasonable. The Trustees also noted that Janus Capital has contractually agreed to limit the Fund’s expenses, although this limit did not apply because the Fund’s total expenses were already below the applicable fee limit.
· For Janus Henderson Contrarian Fund, the Trustees noted that, although the Fund’s total expenses exceeded the peer group average for one share class, overall the Fund’s total expenses were reasonable. The Trustees also noted that Janus Capital has contractually agreed to limit the Fund’s expenses, although this limit did not apply because the Fund’s total expenses were already below the applicable fee limit.
· For Janus Henderson Enterprise Fund, the Trustees noted that, although the Fund’s total expenses exceeded the peer group average for certain share classes, overall the Fund’s total expenses were reasonable. The Trustees also noted that Janus Capital has contractually agreed to limit the Fund’s expenses, although this limit did not apply because the Fund’s total expenses were already below the applicable fee limit.
· For Janus Henderson Forty Fund, the Trustees noted that, although the Fund’s total expenses exceeded the peer group average for certain share classes, overall the Fund’s total expenses were reasonable. The Trustees also noted that Janus Capital has contractually agreed to limit the Fund’s expenses, although this limit did not apply because the Fund’s total expenses were already below the applicable fee limit.
· For Janus Henderson Growth and Income Fund, the Trustees noted that, although the Fund’s total expenses exceeded the peer group average for certain share classes, overall the Fund’s total expenses were reasonable. The Trustees also noted that Janus Capital has contractually agreed to limit the Fund’s expenses, although this limit did not apply because the Fund’s total expenses were already below the applicable fee limit.
· For Janus Henderson Research Fund, the Trustees noted that, although the Fund’s total expenses were equal to or exceeded the peer group average for certain share classes, overall the Fund’s total expenses were reasonable. The Trustees also noted that Janus Capital has contractually agreed to limit the Fund’s expenses effective February 1, 2017.
· For Janus Henderson Triton Fund, the Trustees noted that the Fund’s total expenses were below the peer group average for all share classes.
· For Janus Henderson U.S. Growth Opportunities Fund, the Trustees noted that, although the Fund’s total expenses exceeded the peer group average for one share class, overall the Fund’s total expenses were reasonable. The Trustees also noted that Janus Capital has contractually agreed to limit the Fund’s expenses effective June 5, 2017.
· For Janus Henderson Venture Fund, the Trustees noted that the Fund’s total expenses were below the peer group average for all share classes.
Janus Investment Fund | 51 |
Janus Henderson Diversified Alternatives Fund
Additional Information (unaudited)
Quantitative Equity Funds
· For Janus Henderson Emerging Markets Managed Volatility Fund, the Trustees noted that, although the Fund’s total expenses exceeded the peer group average for certain share classes, overall the Fund’s total expenses were reasonable. The Trustees also noted that Janus Capital has contractually agreed to limit the Fund’s expenses.
· For Janus Henderson Global Income Managed Volatility Fund, the Trustees noted that the Fund’s total expenses were below the peer group average for all share classes.
· For Janus Henderson International Managed Volatility Fund, the Trustees noted that, although the Fund’s total expenses exceeded the peer group average for one share class, overall the Fund’s total expenses were reasonable. The Trustees also noted that Janus Capital has contractually agreed to limit the Fund’s expenses.
· For Janus Henderson U.S. Managed Volatility Fund, the Trustees noted that, although the Fund’s total expenses exceeded the peer group average for one share class, overall the Fund’s total expenses were reasonable. The Trustees also noted that Janus Capital has contractually agreed to limit the Fund’s expenses, although this limit did not apply because the Fund’s total expenses were already below the applicable fee limit.
U.S. Equity Funds
· For Janus Henderson Large Cap Value Fund, the Trustees noted that the Fund’s total expenses were below the peer group average for all share classes.
· For Janus Henderson Mid Cap Value Fund, the Trustees noted that the Fund’s total expenses were below the peer group average for all share classes.
· For Janus Henderson Select Value Fund, the Trustees noted that the Fund’s total expenses were below the peer group averages for all share classes.
· For Janus Henderson Small Cap Value Fund, the Trustees noted that, although the Fund’s total expenses exceeded the peer group average for certain share classes, overall the Fund’s total expenses were reasonable. The Trustees also noted that Janus Capital has contractually agreed to limit the Fund’s expenses, although this limit did not apply because the Fund’s total expenses were already below the applicable fee limit.
Janus Aspen Series
· For Janus Henderson Balanced Portfolio, the Trustees noted that, although the Fund’s total expenses exceeded the peer group average for one share class, overall the Fund’s total expenses were reasonable.
· For Janus Henderson Enterprise Portfolio, the Trustees noted that, although the Fund’s total expenses exceeded the peer group average for one share class, overall the Fund’s total expenses were reasonable.
· For Janus Henderson Flexible Bond Portfolio, the Trustees noted that, although the Fund’s total expenses exceeded the peer group average for one share class, overall the Fund’s total expenses were reasonable. The Trustees also noted that Janus Capital has contractually agreed to limit the Fund’s expenses, although this limit did not apply because the Fund’s total expenses were already below the applicable fee limit.
· For Janus Henderson Forty Portfolio, the Trustees noted that, although the Fund’s total expenses exceeded the peer group average for one share class, overall the Fund’s total expenses were reasonable.
· For Janus Henderson Global Allocation Portfolio - Moderate, the Trustees noted that, although the Fund’s total expenses exceeded the peer group average for one share class, overall the Fund’s total expenses were reasonable. The Trustees also noted that Janus Capital has contractually agreed to limit the Fund’s expenses.
· For Janus Henderson Global Research Portfolio, the Trustees noted that the Fund’s total expenses were below the peer group average for both share classes.
· For Janus Henderson Global Technology Portfolio, the Trustees noted that the Fund’s total expenses were below the peer group average for both share classes.
· For Janus Henderson Global Unconstrained Bond Portfolio, the Trustees noted that, although the Fund’s total expenses exceeded the peer group average for one share class, overall the Fund’s total expenses were reasonable. The Trustees also noted that Janus Capital has contractually agreed to limit the Fund’s expenses.
52 | JUNE 30, 2018 |
Janus Henderson Diversified Alternatives Fund
Additional Information (unaudited)
· For Janus Henderson Mid Cap Value Portfolio, the Trustees noted that the Fund’s total expenses were below the peer group average for both share classes.
· For Janus Henderson Overseas Portfolio, the Trustees noted that the Fund’s total expenses were below the peer group average for both share classes.
· For Janus Henderson Research Portfolio, the Trustees noted that the Fund’s total expenses were below the peer group average for both share classes.
· For Janus Henderson U.S. Low Volatility Portfolio, the Trustees noted that the Fund’s total expenses were below the peer group average for its sole share class.
The Trustees reviewed information on the overall profitability to Janus Capital and its affiliates of their relationship with the Funds, and considered profitability data of other fund managers. The Trustees also considered the financial information, estimated profitability and corporate structure of Janus Capital’s parent company before and after the Transaction. The Trustees recognized that profitability comparisons among fund managers are difficult because of the variation in the type of comparative information that is publicly available, and the profitability of any fund manager is affected by numerous factors, including the organizational structure of the particular fund manager, the types of funds and other accounts it manages, possible other lines of business, the methodology for allocating expenses, and the fund manager’s capital structure and cost of capital. The Trustees also noted that the Trustees’ independent fee consultant reviewed the overall profitability of Janus Capital’s parent company prior to the Transaction, and the independent fee consultant found that, while assessing the reasonableness of Fund expenses in light of such profits was dependent on comparisons with other publicly-traded mutual fund advisers, and that these comparisons were limited in accuracy by differences in complex size, business mix, institutional account orientation and other factors, after accepting these limitations, the level of profit earned by Janus Capital’s parent company was reasonable. In this regard, the independent consultant concluded that the profitability of Janus Capital’s parent company did not show excess nor did it show any insufficiency that could limit the ability to invest the resources needed to drive strong future investment performance on behalf of the Funds.
Additionally, the Trustees considered the estimated profitability to Janus Capital from the investment management services it provided to each Fund. The Trustees also considered such estimated profitability taking into account the impact of the Transaction on Janus Capital’s expense structure on a pro forma basis. In their review, the Trustees considered whether Janus Capital and each subadviser receive adequate incentives and resources to manage the Funds effectively. In reviewing profitability, the Trustees noted that the estimated profitability for an individual Fund is necessarily a product of the allocation methodology utilized by Janus Capital to allocate its expenses as part of the estimated profitability calculation. In this regard, the Trustees noted that the independent fee consultant concluded that (1) the expense allocation methodology utilized by Janus Capital was reasonable and (2) the estimated profitability to Janus Capital from the investment management services it provided to each Fund was reasonable, including after taking into account the impact of the Transaction on Janus Capital’s expense structure on a pro forma basis. The Trustees also considered that the estimated profitability for an individual Fund was influenced by a number of factors, including not only the allocation methodology selected, but also the presence of fee waivers and expense caps, and whether the Fund’s investment management agreement contained breakpoints or a performance fee component. The Trustees determined, after taking into account these factors, among others, that Janus Capital’s estimated profitability with respect to each Fund was not unreasonable in relation to the services provided, and that the variation in the range of such estimated profitability among the Funds was not a material factor in the Board’s approval of the reasonableness of any Fund’s investment management fees.
The Trustees concluded that the management fees payable by each Fund to Janus Capital and its affiliates, as well as the fees paid by Janus Capital to the subadvisers of subadvised Funds, were reasonable in relation to the nature, extent, and quality of the services provided, taking into account the fees charged by other advisers for managing comparable mutual funds with similar strategies, the fees Janus Capital and the subadvisers charge to other clients, and, as applicable, the impact of fund performance on management fees payable by the Funds. The Trustees also concluded that each Fund’s total expenses were reasonable, taking into account the size of the Fund, the quality of services provided by Janus Capital and any subadviser, the investment performance of the Fund, and any expense limitations agreed to or provided by Janus Capital.
Janus Investment Fund | 53 |
Janus Henderson Diversified Alternatives Fund
Additional Information (unaudited)
Economies of Scale
The Trustees considered information about the potential for Janus Capital to realize economies of scale as the assets of the Funds increase. They noted their independent fee consultant’s analysis of economies of scale in prior years. They also noted that, although many Funds pay advisory fees at a base fixed rate as a percentage of net assets, without any breakpoints or performance fees, their independent fee consultant concluded that 86% of these Funds’ share classes have contractual management fees (gross of waivers) below their Broadridge expense group averages. They also noted that for those Funds whose expenses are being reduced by the contractual expense limitations of Janus Capital, Janus Capital is subsidizing certain of these Funds because they have not reached adequate scale. Moreover, as the assets of some of the Funds have declined in the past few years, certain Funds have benefited from having advisory fee rates that have remained constant rather than increasing as assets declined. In addition, performance fee structures have been implemented for various Funds that have caused the effective rate of advisory fees payable by such a Fund to vary depending on the investment performance of the Fund relative to its benchmark index over the measurement period; and a few Funds have fee schedules with breakpoints and reduced fee rates above certain asset levels. The Trustees also noted that the Funds share directly in economies of scale through the lower charges of third-party service providers that are based in part on the combined scale of all of the Funds. Based on all of the information they reviewed, including past research and analysis conducted by the Trustees’ independent fee consultant, the Trustees concluded that the current fee structure of each Fund was reasonable and that the current rates of fees do reflect a sharing between Janus Capital and the Fund of any economies of scale that may be present at the current asset level of the Fund.
The independent fee consultant concluded that, given the limitations of various analytical approaches to economies of scale it had considered in prior years, and their conflicting results, it is difficult to analytically confirm or deny the existence of economies of scale in the Janus complex. The independent consultant concluded that (1) to the extent there were economies of scale at Janus Capital, Janus Capital’s general strategy of setting fixed management fees below peers appeared to share any such economies with investors even on smaller Funds which have not yet achieved those economies and (2) by setting lower fixed fees from the start on these Funds, Janus Capital appeared to be investing to increase the likelihood that these Funds will grow to a level to achieve any scale economies that may exist. Further, the independent fee consultant provided its belief that Fund investors are well-served by the fee levels and performance fee structures in place on the Funds in light of any economies of scale that may be present at Janus Capital.
Other Benefits to Janus Capital
The Trustees also considered benefits that accrue to Janus Capital and its affiliates and subadvisers to the Funds from their relationships with the Funds. They recognized that two affiliates of Janus Capital separately serve the Funds as transfer agent and distributor, respectively, and the transfer agent receives compensation directly from the non-money market funds for services provided. The Trustees also considered Janus Capital’s past and proposed use of commissions paid by the Funds on portfolio brokerage transactions to obtain proprietary and third-party research products and services benefiting the Fund and/or other clients of Janus Capital and/or Janus Capital, and/or a subadviser to a Fund. The Trustees concluded that Janus Capital’s and the subadvisers’ use of these types of client commission arrangements to obtain proprietary and third-party research products and services was consistent with regulatory requirements and guidelines and was likely to benefit each Fund. The Trustees also concluded that, other than the services provided by Janus Capital and its affiliates and subadvisers pursuant to the agreements and the fees to be paid by each Fund therefor, the Funds and Janus Capital and the subadvisers may potentially benefit from their relationship with each other in other ways. They concluded that Janus Capital and/or the subadvisers benefits from the receipt of research products and services acquired through commissions paid on portfolio transactions of the Funds and that the Funds benefit from Janus Capital’s and/or the subadvisers’ receipt of those products and services as well as research products and services acquired through commissions paid by other clients of Janus Capital and/or other clients of the subadvisers. They further concluded that the success of any Fund could attract other business to Janus Capital, the subadvisers or other Janus funds, and that the success of Janus Capital and the subadvisers could enhance Janus Capital’s and the subadvisers’ ability to serve the Funds.
54 | JUNE 30, 2018 |
Janus Henderson Diversified Alternatives Fund
Useful Information About Your Fund Report (unaudited)
The Management Commentary in this report includes valuable insight as well as statistical information to help you understand how your Fund’s performance and characteristics stack up against those of comparable indices.
If the Fund invests in foreign securities, this report may include information about country exposure. Country exposure is based primarily on the country of risk. A company may be allocated to a country based on other factors such as location of the company’s principal office, the location of the principal trading market for the company’s securities, or the country where a majority of the company’s revenues are derived.
Please keep in mind that the opinions expressed in the Management Commentary are just that: opinions. They are a reflection based on best judgment at the time this report was compiled, which was June 30, 2018. As the investing environment changes, so could opinions. These views are unique and are not necessarily shared by fellow employees or by Janus Henderson in general.
Performance Overviews
Performance overview graphs compare the performance of a hypothetical $10,000 investment in the Fund with one or more widely used market indices. When comparing the performance of the Fund with an index, keep in mind that market indices are not available for investment and do not reflect deduction of expenses.
Average annual total returns are quoted for a Fund with more than one year of performance history. Average annual total return is calculated by taking the growth or decline in value of an investment over a period of time, including reinvestment of dividends and distributions, then calculating the annual compounded percentage rate that would have produced the same result had the rate of growth been constant throughout the period. Average annual total return does not reflect the deduction of taxes that a shareholder would pay on Fund distributions or redemptions of Fund shares.
Cumulative total returns are quoted for a Fund with less than one year of performance history. Cumulative total return is the growth or decline in value of an investment over time, independent of the period of time involved. Cumulative total return does not reflect the deduction of taxes that a shareholder would pay on Fund distributions or redemptions of Fund shares.
Pursuant to federal securities rules, expense ratios shown in the performance chart reflect subsidized (if applicable) and unsubsidized ratios. The total annual fund operating expenses ratio is gross of any fee waivers, reflecting the Fund’s unsubsidized expense ratio. The net annual fund operating expenses ratio (if applicable) includes contractual waivers of Janus Capital and reflects the Fund’s subsidized expense ratio. Ratios may be higher or lower than those shown in the “Consolidated Financial Highlights” in this report.
Consolidated Schedule of Investments
Following the performance overview section is the Fund’s Consolidated Schedule of Investments. This schedule reports the types of securities held in the Fund on the last day of the reporting period. Securities are usually listed by type (common stock, corporate bonds, U.S. Government obligations, etc.) and by industry classification (banking, communications, insurance, etc.). Holdings are subject to change without notice.
The value of each security is quoted as of the last day of the reporting period. The value of securities denominated in foreign currencies is converted into U.S. dollars.
If the Fund invests in foreign securities, it will also provide a summary of investments by country. This summary reports the Fund exposure to different countries by providing the percentage of securities invested in each country. The country of each security represents the country of risk. The Fund’s Consolidated Schedule of Investments relies upon the industry group and country classifications published by Barclays and/or MSCI Inc.
Tables listing details of individual forward currency contracts, futures, written options, swaptions, and swaps follow the Fund’s Consolidated Schedule of Investments (if applicable).
Consolidated Statement of Assets and Liabilities
This statement is often referred to as the “balance sheet.” It lists the assets and liabilities of the Fund on the last day of the reporting period.
Janus Investment Fund | 55 |
Janus Henderson Diversified Alternatives Fund
Useful Information About Your Fund Report (unaudited)
The Fund’s assets are calculated by adding the value of the securities owned, the receivable for securities sold but not yet settled, the receivable for dividends declared but not yet received on securities owned, and the receivable for Fund shares sold to investors but not yet settled. The Fund’s liabilities include payables for securities purchased but not yet settled, Fund shares redeemed but not yet paid, and expenses owed but not yet paid. Additionally, there may be other assets and liabilities such as unrealized gain or loss on forward currency contracts.
The section entitled “Net Assets Consist of” breaks down the components of the Fund’s net assets. Because the Fund must distribute substantially all earnings, you will notice that a significant portion of net assets is shareholder capital.
The last section of this statement reports the net asset value (“NAV”) per share on the last day of the reporting period. The NAV is calculated by dividing the Fund’s net assets for each share class (assets minus liabilities) by the number of shares outstanding.
Consolidated Statement of Operations
This statement details the Fund’s income, expenses, realized gains and losses on securities and currency transactions, and changes in unrealized appreciation or depreciation of Fund holdings.
The first section in this statement, entitled “Investment Income,” reports the dividends earned from securities and interest earned from interest-bearing securities in the Fund.
The next section reports the expenses incurred by the Fund, including the advisory fee paid to the investment adviser, transfer agent fees and expenses, and printing and postage for mailing statements, financial reports and prospectuses. Expense offsets and expense reimbursements, if any, are also shown.
The last section lists the amounts of realized gains or losses from investment and foreign currency transactions, and changes in unrealized appreciation or depreciation of investments and foreign currency-denominated assets and liabilities. The Fund will realize a gain (or loss) when it sells its position in a particular security. A change in unrealized gain (or loss) refers to the change in net appreciation or depreciation of the Fund during the reporting period. “Net Realized and Unrealized Gain/(Loss) on Investments” is affected both by changes in the market value of Fund holdings and by gains (or losses) realized during the reporting period.
Consolidated Statements of Changes in Net Assets
These statements report the increase or decrease in the Fund’s net assets during the reporting period. Changes in the Fund’s net assets are attributable to investment operations, dividends and distributions to investors, and capital share transactions. This is important to investors because it shows exactly what caused the Fund’s net asset size to change during the period.
The first section summarizes the information from the Consolidated Statement of Operations regarding changes in net assets due to the Fund’s investment operations. The Fund’s net assets may also change as a result of dividend and capital gains distributions to investors. If investors receive their dividends and/or distributions in cash, money is taken out of the Fund to pay the dividend and/or distribution. If investors reinvest their dividends and/or distributions, the Fund’s net assets will not be affected. If you compare the Fund’s “Net Decrease from Dividends and Distributions” to “Reinvested Dividends and Distributions,” you will notice that dividends and distributions have little effect on the Fund’s net assets. This is because the majority of the Fund’s investors reinvest their dividends and/or distributions.
The reinvestment of dividends and distributions is included under “Capital Share Transactions.” “Capital Shares” refers to the money investors contribute to the Fund through purchases or withdrawals via redemptions. The Fund’s net assets will increase and decrease in value as investors purchase and redeem shares from the Fund.
Consolidated Financial Highlights
This schedule provides a per-share breakdown of the components that affect the Fund’s NAV for current and past reporting periods as well as total return, asset size, ratios, and portfolio turnover rate.
The first line in the table reflects the NAV per share at the beginning of the reporting period. The next line reports the net investment income/(loss) per share. Following is the per share total of net gains/(losses), realized and unrealized. Per share dividends and distributions to investors are then subtracted to arrive at the NAV per share at the end of the period. The next line reflects the total return for the period. Also included are ratios of expenses and net investment income to average net assets.
56 | JUNE 30, 2018 |
Janus Henderson Diversified Alternatives Fund
Useful Information About Your Fund Report (unaudited)
The Fund’s expenses may be reduced through expense offsets and expense reimbursements. The ratios shown reflect expenses before and after any such offsets and reimbursements.
The ratio of net investment income/(loss) summarizes the income earned less expenses, divided by the average net assets of the Fund during the reporting period. Do not confuse this ratio with the Fund’s yield. The net investment income ratio is not a true measure of the Fund’s yield because it does not take into account the dividends distributed to the Fund’s investors.
The next figure is the portfolio turnover rate, which measures the buying and selling activity in the Fund. Portfolio turnover is affected by market conditions, changes in the asset size of the Fund, fluctuating volume of shareholder purchase and redemption orders, the nature of the Fund’s investments, and the investment style and/or outlook of the portfolio manager(s) and/or investment personnel. A 100% rate implies that an amount equal to the value of the entire portfolio was replaced once during the fiscal year; a 50% rate means that an amount equal to the value of half the portfolio is traded in a year; and a 200% rate means that an amount equal to the value of the entire portfolio is traded every six months.
Janus Investment Fund | 57 |
Janus Henderson Diversified Alternatives Fund
Designation Requirements (unaudited)
For federal income tax purposes, the Fund designated the following for the year ended June 30, 2018:
| |
Capital Gain Distributions | $113,172 |
Qualified Dividend Income Percentage | 100% |
58 | JUNE 30, 2018 |
Janus Henderson Diversified Alternatives Fund
Trustees and Officers (unaudited)
The Fund’s Statement of Additional Information includes additional information about the Trustees and officers and is available, without charge, by calling 1-877-335-2687.
The following are the Trustees and officers of the Trust, together with a brief description of their principal occupations during the last five years (principal occupations for certain Trustees may include periods over five years).
Each Trustee has served in that capacity since he or she was originally elected or appointed. The Trustees do not serve a specified term of office. Each Trustee will hold office until the termination of the Trust or his or her earlier death, resignation, retirement, incapacity, or removal. Under the Fund’s Governance Procedures and Guidelines, the policy is for Trustees to retire no later than the end of the calendar year in which the Trustee turns 75. The Trustees review the Fund’s Governance Procedures and Guidelines from time to time and may make changes they deem appropriate. The Fund’s Nominating and Governance Committee will consider nominees for the position of Trustee recommended by shareholders. Shareholders may submit the name of a candidate for consideration by the Committee by submitting their recommendations to the Trust’s Secretary. Each Trustee is currently a Trustee of one other registered investment company advised by Janus Capital: Janus Aspen Series. Collectively, these two registered investment companies consist of 61 series or funds.
The Trust’s officers are elected annually by the Trustees for a one-year term. Certain officers also serve as officers of Janus Aspen Series. Certain officers of the Fund may also be officers and/or directors of Janus Capital. Except as otherwise disclosed, Fund officers receive no compensation from the Fund, except for the Fund’s Chief Compliance Officer, as authorized by the Trustees.
Janus Investment Fund | 59 |
Janus Henderson Diversified Alternatives Fund
Trustees and Officers (unaudited)
TRUSTEES | |||||
Name, Address, and Age | Positions Held with the Trust | Length of Time Served | Principal Occupations During the Past Five Years | Number of Portfolios/Funds in Fund Complex Overseen by Trustee | Other Directorships Held by Trustee During the Past Five Years |
Independent Trustees | |||||
William
F. McCalpin | Chairman | 1/08-Present | Managing Partner, Impact Investments, Athena Capital Advisors LLC (independent registered investment advisor) (since 2016) and Managing Director, Holos Consulting LLC (provides consulting services to foundations and other nonprofit organizations). Formerly, Chief Executive Officer, Imprint Capital (impact investment firm) (2013-2015) and Executive Vice President and Chief Operating Officer of The Rockefeller Brothers Fund (a private family foundation) (1998-2006). | 61 | Director of Mutual Fund Directors Forum (a non-profit organization serving independent directors of U.S. mutual funds), Chairman of the Board and Trustee of The Investment Fund for Foundations Investment Program (TIP) (consisting of 2 funds), and Director of the F.B. Heron Foundation (a private grantmaking foundation). |
60 | JUNE 30, 2018 |
Janus Henderson Diversified Alternatives Fund
Trustees and Officers (unaudited)
TRUSTEES | |||||
Name, Address, and Age | Positions Held with the Trust | Length of Time Served | Principal Occupations During the Past Five Years | Number of Portfolios/Funds in Fund Complex Overseen by Trustee | Other Directorships Held by Trustee During the Past Five Years |
Independent Trustees | |||||
Alan
A. Brown | Trustee | 1/13-Present | Executive Vice President, Institutional Markets, of Black Creek Group (private equity real estate investment management firm) (since 2012). Formerly, Executive Vice President and Co-Head, Global Private Client Group (2007-2010), Executive Vice President, Mutual Funds (2005-2007), and Chief Marketing Officer (2001-2005) of Nuveen Investments, Inc. (asset management). | 61 | Director of WTTW (PBS affiliate) (since 2003). Formerly, Director of MotiveQuest LLC (strategic social market research company) (2003-2016); Director of Nuveen Global Investors LLC (2007-2011); Director of Communities in Schools (2004-2010); and Director of Mutual Fund Education Alliance (until 2010). |
Janus Investment Fund | 61 |
Janus Henderson Diversified Alternatives Fund
Trustees and Officers (unaudited)
TRUSTEES | |||||
Name, Address, and Age | Positions Held with the Trust | Length of Time Served | Principal Occupations During the Past Five Years | Number of Portfolios/Funds in Fund Complex Overseen by Trustee | Other Directorships Held by Trustee During the Past Five Years |
Independent Trustees | |||||
William
D. Cvengros | Trustee | 1/11-Present | Managing Member and Chief Executive Officer of SJC Capital, LLC (a personal investment company and consulting firm) (since 2002). Formerly, Venture Partner for The Edgewater Funds (a middle market private equity firm) (2002-2004); Chief Executive Officer and President of PIMCO Advisors Holdings L.P. (a publicly traded investment management firm) (1994-2000); and Chief Investment Officer of Pacific Life Insurance Company (a mutual life insurance and annuity company) (1987-1994). | 61 | Advisory Board Member, Innovate Partners Emerging Growth and Equity Fund I (early stage venture capital fund) (since 2014) and Managing Trustee of National Retirement Partners Liquidating Trust (since 2013). Formerly, Chairman, National Retirement Partners, Inc. (formerly a network of advisors to 401(k) plans) (2005-2013); Director of Prospect Acquisition Corp. (a special purpose acquisition corporation) (2007-2009); Director of RemedyTemp, Inc. (temporary help services company) (1996-2006); and Trustee of PIMCO Funds Multi-Manager Series (1990-2000) and Pacific Life Variable Life & Annuity Trusts (1987-1994). |
62 | JUNE 30, 2018 |
Janus Henderson Diversified Alternatives Fund
Trustees and Officers (unaudited)
TRUSTEES | |||||
Name, Address, and Age | Positions Held with the Trust | Length of Time Served | Principal Occupations During the Past Five Years | Number of Portfolios/Funds in Fund Complex Overseen by Trustee | Other Directorships Held by Trustee During the Past Five Years |
Independent Trustees | |||||
Raudline
Etienne | Trustee | 6/16-Present | Founder, Daraja Capital (advisory and investment firm) (since 2016), and Senior Advisor, Albright Stonebridge Group LLC (global strategy firm) (since 2016). Formerly, Senior Vice President (2011-2015), Albright Stonebridge Group LLC; and Deputy Comptroller and Chief Investment Officer, New York State Common Retirement Fund (public pension fund) (2008-2011). | 61 | Director of Brightwood Capital Advisors, LLC (since 2014). |
Gary A. Poliner | Trustee | 6/16-Present | Retired. Formerly, President (2010-2013) of Northwestern Mutual Life Insurance Company. | 61 | Director of MGIC Investment Corporation (private mortgage insurance) (since 2013) and West Bend Mutual Insurance Company (property/casualty insurance) (since 2013). Formerly, Trustee of Northwestern Mutual Life Insurance Company (2010-2013); and Director of Frank Russell Company (global asset management firm) (2008-2013). |
Janus Investment Fund | 63 |
Janus Henderson Diversified Alternatives Fund
Trustees and Officers (unaudited)
TRUSTEES | |||||
Name, Address, and Age | Positions Held with the Trust | Length of Time Served | Principal Occupations During the Past Five Years | Number of Portfolios/Funds in Fund Complex Overseen by Trustee | Other Directorships Held by Trustee During the Past Five Years |
Independent Trustees | |||||
James
T. Rothe | Trustee | 1/97-Present | Professor Emeritus of Business of the University of Colorado, Colorado Springs, CO (since 2004). Formerly, Co-founder and Managing Director of Roaring Fork Capital SBIC, L.P. (SBA SBIC fund focusing on private investment in public equity firms) (2004-2014), Professor of Business of the University of Colorado (2002-2004), and Distinguished Visiting Professor of Business (2001-2002) of Thunderbird (American Graduate School of International Management), Glendale, AZ. | 61 | Formerly, Director of Red Robin Gourmet Burgers, Inc. (RRGB) (2004- 2014). |
William
D. Stewart | Trustee | 6/84-Present | Retired. Formerly, President and founder of HPS Products and Corporate Vice President of MKS Instruments, Boulder, CO (a provider of advanced process control systems for the semiconductor industry) (1976-2012). | 61 | None |
64 | JUNE 30, 2018 |
Janus Henderson Diversified Alternatives Fund
Trustees and Officers (unaudited)
TRUSTEES | |||||
Name, Address, and Age | Positions Held with the Trust | Length of Time Served | Principal Occupations During the Past Five Years | Number of Portfolios/Funds in Fund Complex Overseen by Trustee | Other Directorships Held by Trustee During the Past Five Years |
Independent Trustees | |||||
Diane
L. Wallace | Trustee | 6/17-Present | Retired. | 61 | Formerly, Independent Trustee, Henderson Global Funds (13 portfolios) (2015-2017); Independent Trustee, State Farm Associates' Funds Trust, State Farm Mutual Fund Trust, and State Farm Variable Product Trust (28 portfolios) (2013-2017). Chief Operating Officer, Senior Vice President-Operations, and Chief Financial Officer for Driehaus Capital Management, LLC (1988-2006); and Treasurer of Driehaus Mutual Funds (1996-2002). |
Janus Investment Fund | 65 |
Janus Henderson Diversified Alternatives Fund
Trustees and Officers (unaudited)
TRUSTEES | |||||
Name, Address, and Age | Positions Held with the Trust | Length of Time Served | Principal Occupations During the Past Five Years | Number of Portfolios/Funds in Fund Complex Overseen by Trustee | Other Directorships Held by Trustee During the Past Five Years |
Independent Trustees | |||||
Linda
S. Wolf | Trustee | 11/05-Present | Retired. Formerly, Chairman and Chief Executive Officer of Leo Burnett (Worldwide) (advertising agency) (2001-2005). | 61 | Director of Chicago Community Trust (Regional Community Foundation), Chicago Council on Global Affairs, InnerWorkings (U.S. provider of print procurement solutions to corporate clients), Lurie Children’s Hospital (Chicago, IL), Shirley Ryan Ability Lab and Wrapports, LLC (digital communications company). Formerly, Director of Walmart (until 2017); Director of Chicago Convention & Tourism Bureau (until 2014); and The Field Museum of Natural History (Chicago, IL) (until 2014). |
66 | JUNE 30, 2018 |
Janus Henderson Diversified Alternatives Fund
Trustees and Officers (unaudited)
OFFICERS | |||
Name, Address, and Age | Positions Held with the Trust | Term of Office* and Length of Time Served | Principal Occupations During the Past Five Years |
Ashwin Alankar | Executive Vice President and
Co-Portfolio Manager | 7/16-Present | Senior Vice President and Global Head of Asset Allocation and Risk Management of Janus Capital and Portfolio Manager for other Janus Henderson accounts. Formerly, Co-Chief Investment Officer of AllianceBernstein's Tail Risk Parity (2010-2014). |
John
S. Fujiwara | Executive Vice President and
Co-Portfolio Manager | 12/12-Present | Portfolio Manager for other Janus Henderson accounts. Formerly, Senior Principal at Absolute Plus Management, LLC (2006-2012). |
Bruce L. Koepfgen | President and Chief Executive Officer | 7/14-Present | Head of North America at Janus Henderson Investors and Janus Capital Management LLC (since 2017); Executive Vice President and Director of Janus International Holding LLC (since 2011); Executive Vice President of Janus Distributors LLC (since 2011); Vice President and Director of Intech Investment Management LLC (since 2011); Executive Vice President and Director of Perkins Investment Management LLC (since 2011); and Executive Vice President and Director of Janus Management Holdings Corporation (since 2011). Formerly, President of Janus Capital Group Inc. and Janus Capital Management LLC (2013-2017); Executive Vice President of Janus Services LLC (2011-2015), Janus Capital Group Inc. and Janus Capital Management LLC (2011-2013); and Chief Financial Officer of Janus Capital Group Inc., Janus Capital Management LLC, Janus Distributors LLC, Janus Management Holdings Corporation, and Janus Services LLC (2011-2013). |
Janus Investment Fund | 67 |
Janus Henderson Diversified Alternatives Fund
Trustees and Officers (unaudited)
OFFICERS | |||
Name, Address, and Age | Positions Held with the Trust | Term of Office* and Length of Time Served | Principal Occupations During the Past Five Years |
Susan K. Wold | Vice President, Chief Compliance Officer, and Anti-Money Laundering Officer | 9/17-Present | Senior Vice President and Head of Compliance, North America for
Janus Henderson (since September 2017); |
Jesper
Nergaard | Chief Financial Officer | 3/05-Present | Vice President of Janus Capital and Janus Services LLC. |
Kathryn L. Santoro | Vice President, Chief Legal Counsel, and Secretary | 12/16-Present | Vice President of Janus Capital and Janus Services LLC (since 2016). Formerly, Vice President and Associate Counsel of Curian Capital, LLC and Curian Clearing LLC (2013-2016); and General Counsel and Secretary (2011-2012) and Vice President (2009-2012) of Old Mutual Capital, Inc. |
* Officers are elected at least annually by the Trustees for a one-year term and may also be elected from time to time by the Trustees for an interim period. | |||
68 | JUNE 30, 2018 |
Janus Henderson Diversified Alternatives Fund
Notes
NotesPage1
Janus Investment Fund | 69 |
Knowledge. Shared
At Janus Henderson, we believe in the sharing of expert insight for better investment and business decisions. We call this ethos Knowledge. Shared.
Learn more by visiting janushenderson.com.
| ||||||||
This report is submitted for the general information of shareholders of the Fund. It is not an offer or solicitation for the Fund and is not authorized for distribution to prospective investors unless preceded or accompanied by an effective prospectus. | ||||||||
Janus Henderson, Janus, Henderson, Perkins, Intech and Henderson Geneva are trademarks or registered trademarks of Janus Henderson Investors. © Janus Henderson Investors. The name Janus Henderson Investors includes HGI Group Limited, Henderson Global Investors (Brand Management) Sarl and Janus International Holding LLC. Funds distributed by Janus Henderson Distributors | ||||||||
125-02-93018 08-18 | ||||||||

ANNUAL REPORT June 30, 2018 | |||
Janus Henderson Dividend & Income Builder Fund | |||
Janus Investment Fund | |||
| |||
HIGHLIGHTS · Portfolio management perspective · Investment strategy behind your fund · Fund performance,
characteristics |
|

Table of Contents
Janus Henderson Dividend & Income Builder Fund
Janus Henderson Dividend & Income Builder Fund (unaudited)


PERFORMANCE
The Janus Henderson Dividend & Income Builder Fund Class I Shares returned 4.86% over the 12-month reporting period ended June 30, 2018. The Fund’s primary benchmark, the MSCI World IndexSM, returned 11.09%, and its peer group, the Morningstar World Allocation category, returned 5.40%.
INVESTMENT ENVIRONMENT
After a period of synchronized global economic growth in 2017, surprisingly positive U.S. economic growth indicators at the end of January caused the market to reappraise U.S. inflation expectations and increase forecasts for the number of U.S. interest rate hikes. This triggered volatility in both equity and bond markets. Corporate bonds and some higher yielding equities sold off, losing their defensive characteristics for a period; in fact many of the least economically sensitive shares sold off the most. More recently, trade concerns have resulted in the market starting to worry about slowing growth, and with that came a change in market leadership where defensive stocks and sectors started to outperform again. The one consistent theme of the year has been the strong leadership of technology shares.
Overseas markets have underperformed the U.S. over this period. From an economic viewpoint, growth outside the U.S. has been picking up, and monetary policy remains highly accommodative in most economies, which is positive for their growth outlooks. The potential negative market impact of increasing interest rates on U.S. economic growth may have been offset by 2018’s U.S. tax reform, which has increased investor confidence in U.S. corporate spending and earnings trends. This should also be good for global economic growth. Politically, the environment outside the U.S. has been more difficult and this has reduced investor confidence in some markets, notably much of the emerging markets and Europe.
Outside of the inflation shock at the start of 2018, the inflation picture around the world has been relatively benign. Further, reports from the corporate sector have broadly been positive to unchanged, suggesting that some of the market sell-off may have been overdone.
PERFORMANCE DISCUSSION
The Fund delivered positive returns and met its income growth objectives over the period; however it underperformed its primary benchmark, the MSCI World Index.
Janus Investment Fund | 1 |
Janus Henderson Dividend & Income Builder Fund (unaudited)
By sector, the Fund’s defensive bias and bond allocation were a detractor as the market favored cyclicals (led by technology) over the period. More broadly at the sector level, the Fund’s overweight in energy was a positive contributor to returns. The Fund increased its energy position over the last year to an overweight position on the back of an improvement in cash flows for the sector, which has increased dividend cover. The recent increase in the oil price further supports the investment case, and we believe there is scope for dividend yields to compress as the market gains confidence in the sustainability of dividend payments. Among the largest relative detractors by sector was the Fund’s position to the European financials sector as shares sold off toward the end of the period in sympathy with troubles in Italy and Italian bond yields. While share prices have been volatile, the balance sheets of the portfolio’s holdings are strong and the regulatory environment has become much clearer. The positions have been held and offer considerable value, in our opinion.
The Fund’s overweight allocation to Europe (including the UK), had a negative impact on relative performance. The region is generally recovering, but remains vulnerable to political uncertainty. Many of the holdings in the region are global companies, though, and trade at considerable discounts to their peers listed elsewhere. Due to this overweight position, currency was also a detractor to the performance of overseas stocks. After a weak 2017, the U.S. dollar was strong during the second quarter of 2018; against the euro and pound the USD was up over 5%.
In the fixed income allocation, returns over the period were slightly negative. We have taken a defensive approach to the portfolio and the proportion of investment-grade bonds has been increased to seek to provide more downside protection in the event of economic deterioration. While we are comfortable with this from a portfolio construction point of view, in the short term the spread widening has impacted returns.
Please see the Derivative Instruments section in the “Notes to Financial Statements” for a discussion of derivatives used by the fund.
OUTLOOK
The Fund remains defensively positioned, with overweight positions in sectors/industries including telecommunication services, tobacco and pharmaceuticals. We believe these sectors have attractive dividend yields and offer good value on a number of metrics. A number of cyclical sectors have performed well and despite the robust economic backdrop, we are finding fewer opportunities here. We will continue with our existing strategy of identifying companies that pay an attractive and sustainable dividend that we believe has capacity to grow over the medium to long term.
Bond markets have so far been fairly challenging this year after an exceptionally strong 2017. We may be through the worst of the inflation breakout fears and we believe that the majority of the bond bear market is behind us. Credit markets have repriced somewhat to a more attractive level but not to a level that we would consider cheap. We continue to expect coupons to be the main source of returns for the fixed income allocation.
Thank you for your investment in Janus Henderson Dividend & Income Builder Fund.
2 | JUNE 30, 2018 |
Janus Henderson Dividend & Income Builder Fund (unaudited)
Fund At A Glance
June 30, 2018
5 Top Performers - Holdings |
|
|
| 5 Bottom Performers - Holdings |
| |
Contribution | Contribution | |||||
Microsoft Corp | 1.48% | General Electric Co | -0.42% | |||
BP PLC | 0.71% | Standard Chartered PLC | -0.30% | |||
Royal Dutch Shell PLC | 0.69% | Philip Morris International Inc | -0.29% | |||
Cisco Systems Inc | 0.54% | Japan Tobacco Inc | -0.28% | |||
Renault SA | 0.52% | Pandora A/S | -0.24% | |||
5 Top Performers - Sectors* |
|
|
|
|
| |
Fund | Fund Weighting | MSCI World Index (Net) | ||||
Contribution | (Average % of Equity) | Weighting | ||||
Energy | 1.47% | 9.37% | 6.22% | |||
Materials | 0.39% | 4.44% | 5.12% | |||
Real Estate | 0.36% | 4.34% | 3.06% | |||
Utilities | 0.07% | 2.97% | 3.02% | |||
Telecommunication Services | -0.14% | 5.49% | 2.74% | |||
5 Bottom Performers - Sectors* |
|
|
|
|
| |
Fund | Fund Weighting | MSCI World Index (Net) | ||||
Contribution | (Average % of Equity) | Weighting | ||||
Financials | -1.70% | 18.77% | 17.94% | |||
Industrials | -1.34% | 11.40% | 11.51% | |||
Consumer Staples | -1.04% | 11.15% | 8.83% | |||
Information Technology | -0.80% | 8.81% | 17.13% | |||
Other** | -0.61% | 5.45% | 0.00% | |||
Security contribution to performance is measured by using an algorithm that multiplies the daily performance of each security with the previous day’s ending weight in the portfolio and is gross of advisory fees. Fixed income securities and certain equity securities, such as private placements and some share classes of equity securities, are excluded. | ||||||
* | Based on sector classification according to the Global Industry Classification Standard (“GICS”) codes, which are the exclusive property and a service mark of MSCI Inc. and Standard & Poor’s. | |||||
** | Not a GICS classified sector. | |||||
Janus Investment Fund | 3 |
Janus Henderson Dividend & Income Builder Fund (unaudited)
Fund At A Glance
June 30, 2018
5 Largest Equity Holdings - (% of Net Assets) | |
Microsoft Corp | |
Software | 3.4% |
Nestle SA | |
Food Products | 2.3% |
Pfizer Inc | |
Pharmaceuticals | 2.1% |
RELX NV | |
Professional Services | 1.9% |
BP PLC | |
Oil, Gas & Consumable Fuels | 1.8% |
11.5% | |
Asset Allocation - (% of Net Assets) | |||||
Common Stocks | 78.3% | ||||
Corporate Bonds | 16.2% | ||||
Investment Companies | 5.3% | ||||
Other | 0.2% | ||||
100.0% | |||||
Top Country Allocations - Long Positions - (% of Investment Securities) | |
As of June 30, 2018
| As of June 30, 2017
|
4 | JUNE 30, 2018 |
Janus Henderson Dividend & Income Builder Fund (unaudited)
Performance
See important disclosures on the next page. |
| Expense Ratios - | ||||||||
Average Annual Total Return - for the periods ended June 30, 2018 |
|
| per the October 27, 2017 prospectuses | ||||||
|
| One
| Five
| Since |
|
| Total Annual Fund
| Net Annual Fund
| |
Class A Shares at NAV |
| 4.63% | 7.12% | 7.99% |
|
| 1.30% | 1.15% | |
Class A Shares at MOP |
| -1.39% | 6.04% | 7.05% |
|
|
|
| |
Class C Shares at NAV | 3.85% | 6.30% | 7.17% |
|
| 2.07% | 1.92% | ||
Class C Shares at CDSC |
| 2.85% | 6.30% | 7.17% |
|
|
|
| |
Class D Shares(1) |
| 4.77% | 7.26% | 8.12% |
|
| 1.15% | 1.00% | |
Class I Shares |
| 4.86% | 7.37% | 8.24% |
|
| 1.09% | 0.94% | |
Class N Shares |
| 4.94% | 7.29% | 8.15% |
|
| 1.15% | 1.00% | |
Class S Shares |
| 4.52% | 6.92% | 7.77% |
|
| 1.50% | 1.35% | |
Class T Shares |
| 4.66% | 7.15% | 8.01% |
|
| 1.25% | 1.10% | |
MSCI World Index (Net) |
| 11.09% | 9.94% | 11.31% |
|
|
|
| |
Morningstar Quartile - Class I Shares |
| 3rd | 1st | 1st |
|
|
|
| |
Morningstar Ranking - based on total returns for World Allocation Funds |
| 254/487 | 23/413 | 31/399 |
|
|
|
| |
Returns quoted are past performance and do not guarantee future results; current performance may be lower or higher. Investment returns and principal value will vary; there may be a gain or loss when shares are sold. For the most recent month-end performance call 800.668.0434 (or 800.525.3713 if you hold shares directly with Janus Henderson) or visit janushenderson.com/performance (or janushenderson.com/allfunds if you hold shares directly with Janus Henderson).
Maximum Offering Price (MOP) returns include the maximum sales charge of 5.75%. Net Asset Value (NAV) returns exclude this charge, which would have reduced returns.
CDSC returns include a 1% contingent deferred sales charge (CDSC) on Shares redeemed within 12 months of purchase. Net Asset Value (NAV) returns exclude this charge, which would have reduced returns.
Net expense ratios reflect the expense waiver, if any, contractually agreed to through November 1, 2018.
Janus Investment Fund | 5 |
Janus Henderson Dividend & Income Builder Fund (unaudited)
Performance
The expense ratios shown are estimated.
Performance may be affected by risks that include those associated with non-diversification, portfolio turnover, short sales, potential conflicts of interest, foreign and emerging markets, initial public offerings (IPOs), high-yield and high-risk securities, undervalued, overlooked and smaller capitalization companies, real estate related securities including Real Estate Investment Trusts (REITs), derivatives, and commodity-linked investments. Each product has different risks. Please see the prospectus for more information about risks, holdings and other details.
Returns include reinvestment of all dividends and distributions and do not reflect the deduction of taxes that a shareholder would pay on Fund distributions or redemptions of Fund shares. The returns do not include adjustments in accordance with generally accepted accounting principles required at the period end for financial reporting purposes..
See Financial Highlights for actual expense ratios during the reporting period.
Returns of the Fund shown prior to June 5, 2017, are those for Henderson Dividend & Income Builder Fund (the “Predecessor Fund”), which merged into the Fund after the close of business on June 2, 2017. The Predecessor Fund was advised by Henderson Global Investors (North America) Inc. and subadvised by Henderson Investment Management Limited. Class A Shares, Class C Shares, Class I Shares, and Class R6 Shares of the Predecessor Fund were reorganized into Class A Shares, Class C Shares, Class I Shares, and Class N Shares, respectively, of the Fund. In connection with this reorganization, certain shareholders of the Predecessor Fund who held shares directly with the Predecessor Fund and not through an intermediary had the Class A Shares, Class C Shares, Class I Shares, and Class N Shares of the Fund received in the reorganization automatically exchanged for Class D Shares of the Fund following the reorganization. Class A Shares, Class C Shares, and Class I Shares of the Predecessor Fund commenced operations with the Predecessor Fund’s inception on August 1, 2012. Class R6 Shares of the Predecessor Fund commenced operations on November 30, 2015. Class D Shares, Class S Shares, and Class T Shares commenced operations on June 5, 2017.
Performance of Class A Shares shown for periods prior to June 5, 2017, reflects the performance of Class A Shares of the Predecessor Fund, calculated using the fees and expenses of Class A Shares of the Predecessor Fund, in effect during the periods shown, net of any applicable fee and expense limitations or waivers.
Performance of Class C Shares shown for periods prior to June 5, 2017, reflects the performance of Class C Shares of the Predecessor Fund, calculated using the fees and expenses of Class C Shares of the Predecessor Fund, in effect during the periods shown, net of any applicable fee and expense limitations or waivers.
Performance of Class I Shares shown for periods prior to June 5, 2017, reflects the performance of Class I Shares of the Predecessor Fund, calculated using the fees and expenses of Class I Shares of the Predecessor Fund, in effect during the periods shown, net of any applicable fee and expense limitations or waivers.
Performance of Class N Shares shown for periods prior to June 5, 2017, reflects the performance of Class R6 Shares of the Predecessor Fund, calculated using the fees and expenses of Class R6 Shares of the Predecessor Fund, in effect during the periods shown, net of any applicable fee and expense limitations or waivers, except that for periods prior to November 30, 2015, performance for Class N Shares reflects the performance of Class I Shares of the Predecessor Fund, calculated using the estimated fees and expenses of Class N Shares, net of any applicable fee and expense limitations or waivers.
Performance of Class S Shares shown for periods prior to June 5, 2017, reflects the performance of Class I Shares of the Predecessor Fund, calculated using the estimated fees and expenses of Class S Shares, net of any applicable fee and expense limitations or waivers.
Performance of Class T Shares shown for periods prior to June 5, 2017, reflects the performance of Class I Shares of the Predecessor Fund, calculated using the estimated fees and expenses of Class T Shares, net of any applicable fee and expense limitations or waivers.
Performance of Class D Shares shown for periods prior to June 5, 2017, reflects the performance of Class I Shares of the Predecessor Fund, calculated using the estimated fees and expenses of Class D Shares, net of any applicable fee and expense limitations or waivers.
If each share class of the Fund had been available during periods prior to its commencement, the performance shown may have been different. The performance shown for periods following the Fund’s commencement of each share class reflects the fees and expenses of each respective share class, net of any applicable fee and expense limitations or waivers. Please refer to the Fund’s prospectuses for further details concerning historical performance.
Ranking is for the share class shown only; other classes may have different performance characteristics. When an expense waiver is in effect, it may have a material effect on the total return, and therefore the ranking for the period.
© 2018 Morningstar, Inc. All Rights Reserved.
There is no assurance that the investment process will consistently lead to successful investing.
See Notes to Schedule of Investments and Other Information for index definitions.
Index performance does not reflect the expenses of managing a portfolio as an index is unmanaged and not available for direct investment.
See important disclosures on the next page. |
6 | JUNE 30, 2018 |
Janus Henderson Dividend & Income Builder Fund (unaudited)
Performance
See “Useful Information About Your Fund Report.”
Effective June 5, 2017, the Fund’s performance is compared to the MSCI World Index net of foreign withholding taxes. Previously, the Predecessor Fund used the MSCI World Index gross of foreign withholding taxes. The net version of the benchmark is believed to more closely reflect the Fund’s investment universe.
*The Predecessor Fund’s inception date – August 1, 2012
(1) Closed to certain new investors.
Janus Investment Fund | 7 |
Janus Henderson Dividend & Income Builder Fund (unaudited)
Expense Examples
As a shareholder of the Fund, you incur two types of costs: (1) transaction costs, such as sales charges (loads) on purchase payments (applicable to Class A Shares only); and (2) ongoing costs, including management fees; 12b-1 distribution and shareholder servicing fees; transfer agent fees and expenses payable pursuant to the Transfer Agency Agreement; and other Fund expenses. This example is intended to help you understand your ongoing costs (in dollars) of investing in the Fund and to compare these costs with the ongoing costs of investing in other mutual funds. To do so, compare this 5% hypothetical example with the 5% hypothetical examples that appear in the shareholder reports of the other funds. The example is based upon an investment of $1,000 invested at the beginning of the period and held for the six-months indicated, unless noted otherwise in the table and footnotes below.
Actual Expenses
The information in the table under the heading “Actual” provides information about actual account values and actual expenses. You may use the information in these columns, together with the amount you invested, to estimate the expenses that you paid over the period. Simply divide your account value by $1,000 (for example, an $8,600 account value divided by $1,000 = 8.6), then multiply the result by the number in the appropriate column for your share class under the heading entitled “Expenses Paid During Period” to estimate the expenses you paid on your account during the period.
Hypothetical Example for Comparison Purposes
The information in the table under the heading “Hypothetical (5% return before expenses)” provides information about hypothetical account values and hypothetical expenses based upon the Fund’s actual expense ratio and an assumed rate of return of 5% per year before expenses, which is not the Fund’s actual return. The hypothetical account values and expenses may not be used to estimate the actual ending account balance or expenses you paid for the period. You may use this information to compare the ongoing costs of investing in the Fund and other funds. To do so, compare this 5% hypothetical example with the 5% hypothetical examples that appear in the shareholder reports of the other funds. Additionally, for an analysis of the fees associated with an investment in any share class or other similar funds, please visit www.finra.org/fundanalyzer.
Please note that the expenses shown in the table are meant to highlight your ongoing costs only and do not reflect any transaction costs. These fees are fully described in the Fund’s prospectuses. Therefore, the hypothetical examples are useful in comparing ongoing costs only, and will not help you determine the relative total costs of owning different funds. In addition, if these transaction costs were included, your costs would have been higher.
Actual | Hypothetical | |||||||||
| Beginning | Ending | Expenses |
| Beginning | Ending | Expenses | Net Annualized | ||
Class A Shares | $1,000.00 | $975.10 | $5.58 |
| $1,000.00 | $1,019.14 | $5.71 | 1.14% | ||
Class C Shares | $1,000.00 | $971.10 | $9.33 |
| $1,000.00 | $1,015.32 | $9.54 | 1.91% | ||
Class D Shares | $1,000.00 | $975.60 | $4.85 |
| $1,000.00 | $1,019.89 | $4.96 | 0.99% | ||
Class I Shares | $1,000.00 | $976.50 | $4.41 |
| $1,000.00 | $1,020.33 | $4.51 | 0.90% | ||
Class N Shares | $1,000.00 | $976.60 | $4.17 |
| $1,000.00 | $1,020.58 | $4.26 | 0.85% | ||
Class S Shares | $1,000.00 | $974.70 | $6.02 |
| $1,000.00 | $1,018.70 | $6.16 | 1.23% | ||
Class T Shares | $1,000.00 | $975.40 | $5.44 |
| $1,000.00 | $1,019.29 | $5.56 | 1.11% | ||
† | Expenses Paid During Period are equal to the Net Annualized Expense Ratio multiplied by the average account value over the period, multiplied by 181/365 (to reflect the one-half year period). Expenses in the examples include the effect of applicable fee waivers and/or expense reimbursements, if any. Had such waivers and/or reimbursements not been in effect, your expenses would have been higher. Please refer to the Notes to Financial Statements or the Fund’s prospectuses for more information regarding waivers and/or reimbursements. | |||||||||
8 | JUNE 30, 2018 |
Janus Henderson Dividend & Income Builder Fund
Schedule of Investments
June 30, 2018
Shares or | Value | ||||||
Corporate Bonds | |||||||