United States Securities and Exchange Commission
Washington, D.C. 20549
Form N-CSR
Certified Shareholder Report of Registered Management Investment Companies
Investment Company Act file number 811-01879
Janus
Investment Fund
(Exact name of registrant as specified in charter)
151 Detroit Street, Denver,
Colorado 80206
(Address of principal executive offices) (Zip code)
Kathryn Santoro, 151 Detroit
Street, Denver, Colorado 80206
(Name and address of agent for service)
Registrant's telephone
number, including area code: 303-333-3863
Date of fiscal year end: 9/30
Date of reporting period:
3/31/17
Item 1 - Reports to Shareholders
SEMIANNUAL REPORT March 31, 2017 | |||
Janus Asia Equity Fund | |||
Janus Investment Fund | |||
| |||
HIGHLIGHTS · Portfolio management perspective · Investment strategy behind your fund · Fund performance, characteristics | |||
| |||

Table of Contents
Janus Asia Equity Fund
Janus Asia Equity Fund (unaudited)

PERFORMANCE SUMMARY
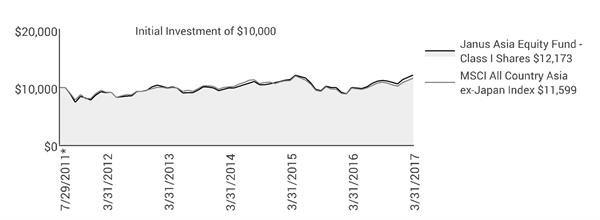
Janus Asia Equity Fund’s Class I Shares returned 8.23% for the six-month period ended March 31, 2017. The Fund’s benchmark, the MSCI All Country Asia ex-Japan Index, returned 6.23%.
MARKET ENVIRONMENT
Asian stocks gained over the period, despite having endured turbulence in the wake of the election of Donald Trump to the U.S. presidency in November. While the specific-policy stances of the Trump administration remain largely unknown, a consistent theme throughout his campaign was a rollback of the decades-long trend of globalization that has greatly benefited Asia and other emerging economies. Another source of investor concern was the expectation of increasing interest rates in the U.S., which could make U.S. securities more attractive on a relative, risk-adjusted basis, thus increasing the cost of capital for Asian companies.
The region’s stocks then rallied as the Trump administration appeared to step back from some of the most heated anti-trade rhetoric espoused during the campaign. Granted, Mr. Trump walked away from the Trans-Pacific Partnership, he has largely been conciliatory in his initial meetings with global leaders. Investors’ improving sentiment toward Asian stocks was also fueled by the expectation that the Federal Reserve (Fed) would likely raise its benchmark interest rate only twice more in 2017.
While the macro developments were factors in the quarter, our view is that the real driver of positive returns across the region was solid corporate fundamentals. Such examples can be found in technology, which was among the best-performing sectors for the period. The story here was semiconductors. Rather than banking on strong demand, which has remained elusive, investors are, instead, recognizing that the semiconductor industry is exercising supply discipline. The rationalization of supply has provided the industry with much-needed pricing power, which has, in turn, led to improving profitability. Given that much of the global semiconductor supply chain flows through Asia, this shift in fundamentals has buttressed the region’s stock markets and, to a lesser degree, their underlying economies.
Sector gainers were led by materials and energy, with technology also delivering solid returns. Historically defensive sectors lost ground, led by health care and telecommunications. On a country basis, South Korea and Taiwan were the strongest performers. The Philippines registered the steepest declines.
PERFORMANCE DISCUSSION
The Fund’s selection of technology and consumer staples stocks contributed most to relative performance. Holdings within consumer discretionary detracted most from relative results.
Samsung performed well during the period as investors looked past corruption allegations against senior executives and instead focused on the company’s strong execution. Each of Samsung’s main business lines – memory, handsets and display – strengthened their positions during the period. The company is the world leader in both DRAM and NAND memory. Pricing is strong in the former category and the latter is positioned for increased domination due to its innovative 3D-NAND technology. This point is driven home by the expectation that Apple will heavily rely upon the technology for its newest iPhone. Apple also plans to utilize Samsung’s OLED display in the iPhone 8, demonstrating the South Korean company’s superiority in the display business. Samsung’s own handset business is set to rebound from last year’s Galaxy Note hiccups as the Galaxy 8 – announced during the quarter – received favorable reviews.
Another semiconductor company set to benefit from Apple’s newest iPhone was Taiwan Semiconductor Manufacturing Company (TSMC). The company is rumored to be the sole supplier of processors for the
Janus Investment Fund | 1 |
Janus Asia Equity Fund (unaudited)
iPhone 8, set to be released this autumn. During the quarter, news outlets reported that TSMC was set to rapidly expand its production and shipments of 10-nanometer chips – the A11 – which is designed exclusively for Apple.
SK Hynix manufactures semiconductors, such as DRAM, flash memory, and SRAM chips. As one of three dominant suppliers of DRAM chips globally, the South Korean company is well positioned to benefit from increasing DRAM demand with limited DRAM supply growth due to capital expenditure cuts by major players.
A leading detractor for the period was Chongqing Changan Auto. Investors shied away from the stock due, in part, to its relatively low-growth trajectory. With regional economies remaining buoyant, many investors gravitated toward higher growth names. We, however, view the high quality of the company and its attractive valuation as a compelling combination. In fact, we view Chongqing as one of the cheapest automotive stocks globally. Our confidence in the stock is reinforced by the large cash position on Chongqing’s balance sheet and its steady free-cash-flow generation. As a consequence, despite the modestly weak quarter for the stock, we see limited additional downside potential.
India’s PC Jeweller detracted from performance, caught up in the country’s rocky attempt to remove high-denomination bills from circulation. With much of the country’s economy cash-based, and often beyond the purview of tax collection, authorities quickly announced the removal of the 500 and 1000 rupee notes. The government also hoped that the move would clamp down on corruption as high-value purchases – including jewelry – were considered linked to malfeasance. The speed of the move disrupted several segments of the economy. With estimates that PC Jeweller’s top line could drop by as much as 20%, and earnings by 40%, we sold our position in the company.
The stock of low-cost air carrier Spring Airlines came under pressure as the company announced earnings that were poorly received by investors. Net profits for the period covered in the report had fallen by roughly 26% year over year. The company’s international business was singled out as a factor in the weak performance. Also, Spring suffered from a sudden delivery of aircraft, which meant it had a finite amount of time to sell seats on the initial flights. Still, we like the company, which is a leading low-cost air carrier in China. We believe that Spring has one of the sector’s best management teams, as evidenced by the company’s strong utilization rate and profitability. We expect growth to continue as Spring adds routes to and from Shanghai, which commands higher ticket prices.
Please see the Derivative instruments section in the “Notes to Financial Statements” for a discussion of derivatives used by the Fund.
OUTLOOK
The strong performance of Asian semiconductor producers during the period illustrates our view that fundamentals matter when determining the long-term outperformers in the region. The past several years have seen management teams become more disciplined when adjusting to shifting market environments. This is occurring not only at the company level, but in the case of China, at the national level. The country’s powerful leadership has been able to force through production cuts, thus streamlining many segments of the industrial sector and boosting profitability. The actions of authorities have also played a role in the recent improvement in consumer discretionary. The government has dialed back some components of its anti-corruption campaign, which had been a significant headwind to the sector, especially the luxury segment.
Improving productivity, profitability and earnings, in our view, will be supportive for Asian companies as we go deeper into 2017. We believe Emerging market (EM) investors tend to be trend followers, rather than contrarian. Thus, as earnings momentum builds, many investors will likely come off the sidelines.
We see limited risk of four rate hikes, in total, by the Fed in 2017. Should that occur, Asian stocks could experience a sell-off. If the 2017 final tally is two, rather than the three largely priced into the market, we do not expect any additional catalyst. Instead, we anticipate that investment decisions will still largely be driven by improving economies and more efficient companies. It is our job to identify the companies whose management teams have positioned their enterprises to become attractive destinations for investors’ capital, regardless of the trajectory of the global business cycle.
Thank you for your investment in Janus Asia Equity Fund.
2 | MARCH 31, 2017 |
Janus Asia Equity Fund (unaudited)
Fund At A Glance
March 31, 2017
5 Top Performers - Holdings |
|
|
| 5 Bottom Performers - Holdings |
| |
Contribution | Contribution | |||||
Samsung Electronics Co Ltd | 1.25% | Chongqing Changan Automobile Co Ltd | -0.37% | |||
SK Hynix Inc | 0.74% | PC Jeweller Ltd | -0.29% | |||
Yunnan Baiyao Group Co Ltd | 0.45% | China Mobile Ltd | -0.22% | |||
Hana Financial Group Inc | 0.44% | Spring Airlines Co Ltd | -0.22% | |||
Taiwan Semiconductor Manufacturing Co Ltd | 0.38% | Axis Bank Ltd | -0.15% | |||
5 Top Performers - Sectors* |
|
|
|
|
| |
Fund | Fund Weighting | MSCI All Country Asia ex-Japan Index | ||||
Contribution | (Average % of Equity) | Weighting | ||||
Information Technology | 1.44% | 32.82% | 27.71% | |||
Consumer Staples | 0.52% | 1.01% | 4.88% | |||
Industrials | 0.50% | 6.41% | 7.91% | |||
Real Estate | 0.38% | 5.79% | 5.92% | |||
Health Care | 0.36% | 2.40% | 2.36% | |||
5 Bottom Performers - Sectors* |
|
|
|
|
| |
Fund | Fund Weighting | MSCI All Country Asia ex-Japan Index | ||||
Contribution | (Average % of Equity) | Weighting | ||||
Consumer Discretionary | -0.52% | 10.29% | 9.56% | |||
Energy | 0.00% | 3.89% | 4.34% | |||
Materials | 0.02% | 2.98% | 4.51% | |||
Other** | 0.03% | 5.29% | 0.00% | |||
Telecommunication Services | 0.06% | 3.55% | 5.47% | |||
Security contribution to performance is measured by using an algorithm that multiplies the daily performance of each security with the previous day’s ending weight in the portfolio and is gross of advisory fees. Fixed income securities and certain equity securities, such as private placements and some share classes of equity securities, are excluded. | ||||||
* | Based on sector classification according to the Global Industry Classification Standard (“GICS”) codes, which are the exclusive property and a service mark of MSCI Inc. and Standard & Poor’s. | |||||
** | Not a GICS classified sector. | |||||
Janus Investment Fund | 3 |
Janus Asia Equity Fund (unaudited)
Fund At A Glance
March 31, 2017
5 Largest Equity Holdings - (% of Net Assets) | |
Taiwan Semiconductor Manufacturing Co Ltd | |
Semiconductor & Semiconductor Equipment | 5.3% |
Samsung Electronics Co Ltd | |
Technology Hardware, Storage & Peripherals | 5.3% |
Tencent Holdings Ltd | |
Internet Software & Services | 4.7% |
Alibaba Group Holding Ltd (ADR) | |
Internet Software & Services | 3.8% |
SK Hynix Inc | |
Semiconductor & Semiconductor Equipment | 3.3% |
22.4% | |
Asset Allocation - (% of Net Assets) | |||||
Common Stocks | 96.8% | ||||
Investment Companies | 6.7% | ||||
Preferred Stocks | 1.8% | ||||
OTC Purchased Options – Calls | 0.0% | ||||
Other | (5.3)% | ||||
100.0% | |||||
Emerging markets comprised 86.3% of total net assets.
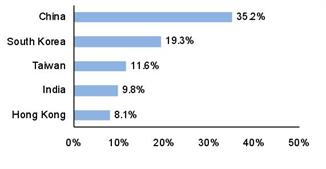
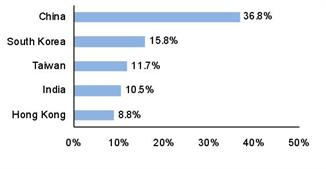
Top Country Allocations - Long Positions - (% of Investment Securities) | |
As of March 31, 2017
| As of September 30, 2016
|
4 | MARCH 31, 2017 |
Janus Asia Equity Fund (unaudited)
Performance
See important disclosures on the next page. |
| Expense Ratios - | |||||||||
Average Annual Total Return - for the periods ended March 31, 2017 |
|
| per the January 27, 2017 prospectuses | |||||||
|
| Fiscal
| One
| Five
| Since |
|
| Total Annual Fund
| Net Annual Fund
| |
Class A Shares at NAV |
| 8.15% | 21.43% | 5.63% | 3.22% |
|
| 3.51% | 1.66% | |
Class A Shares at MOP |
| 1.98% | 14.47% | 4.38% | 2.15% |
|
|
|
| |
Class C Shares at NAV | 7.76% | 20.68% | 4.83% | 2.51% |
|
| 4.23% | 2.34% | ||
Class C Shares at CDSC |
| 6.76% | 19.68% | 4.83% | 2.51% |
|
|
|
| |
Class D Shares(1) |
| 8.15% | 21.61% | 5.76% | 3.37% |
|
| 3.38% | 1.46% | |
Class I Shares |
| 8.23% | 21.81% | 5.95% | 3.53% |
|
| 3.19% | 1.32% | |
Class S Shares |
| 8.06% | 21.45% | 5.58% | 3.17% |
|
| 3.67% | 1.79% | |
Class T Shares |
| 8.19% | 21.71% | 5.80% | 3.36% |
|
| 3.41% | 1.55% | |
MSCI All Country Asia ex-Japan Index |
| 6.23% | 17.47% | 4.77% | 2.65% |
|
|
|
| |
Morningstar Quartile - Class I Shares |
| - | 1st | 1st | 1st |
|
|
|
| |
Morningstar Ranking - based on total returns for Pacific/Asia ex-Japan Stock Funds |
| - | 10/91 | 12/58 | 14/57 |
|
|
|
| |
Returns quoted are past performance and do not guarantee future results; current performance may be lower or higher. Investment returns and principal value will vary; there may be a gain or loss when shares are sold. For the most recent month-end performance call 877.33JANUS(52687) (or 800.525.3713 if you hold shares directly with Janus Capital) or visit janus.com/advisor/mutual-funds (or janus.com/allfunds if you hold shares directly with Janus Capital).
Maximum Offering Price (MOP) returns include the maximum sales charge of 5.75%. Net Asset Value (NAV) returns exclude this charge, which would have reduced returns.
CDSC returns include a 1% contingent deferred sales charge (CDSC) on Shares redeemed within 12 months of purchase. Net Asset Value (NAV) returns exclude this charge, which would have reduced returns.
Janus Investment Fund | 5 |
Janus Asia Equity Fund (unaudited)
Performance
This Fund has a performance-based management fee that may adjust up or down based on the Fund’s performance.
Performance may be affected by risks that include those associated with non-diversification, portfolio turnover, short sales, potential conflicts of interest, foreign and emerging markets, initial public offerings (IPOs), high-yield and high-risk securities, undervalued, overlooked and smaller capitalization companies, real estate related securities including Real Estate Investment Trusts (REITs), derivatives, and commodity-linked investments. Each product has different risks. Please see the prospectus for more information about risks, holdings and other details.
The Fund will normally invest at least 80% of its net assets, measured at the time of purchase, in the type of securities described by its name.
Returns include reinvestment of all dividends and distributions and do not reflect the deduction of taxes that a shareholder would pay on Fund distributions or redemptions of Fund shares. The returns do not include adjustments in accordance with generally accepted accounting principles required at the period end for financial reporting purposes.
See Financial Highlights for actual expense ratios during the reporting period.
Ranking is for the share class shown only; other classes may have different performance characteristics. When an expense waiver is in effect, it may have a material effect on the total return, and therefore the ranking for the period.
© 2017 Morningstar, Inc. All Rights Reserved.
There is no assurance that the investment process will consistently lead to successful investing.
See Notes to Schedule of Investments and Other Information for index definitions.
Index performance does not reflect the expenses of managing a portfolio as an index is unmanaged and not available for direct investment.
See “Useful Information About Your Fund Report.”
*The Fund’s inception date – July 29, 2011
(1) Closed to certain new investors.
6 | MARCH 31, 2017 |
Janus Asia Equity Fund (unaudited)
Expense Examples
As a shareholder of the Fund, you incur two types of costs: (1) transaction costs, such as sales charges (loads) on purchase payments (applicable to Class A Shares only); and (2) ongoing costs, including management fees; 12b-1 distribution and shareholder servicing fees; transfer agent fees and expenses payable pursuant to the Transfer Agency Agreement; and other Fund expenses. This example is intended to help you understand your ongoing costs (in dollars) of investing in the Fund and to compare these costs with the ongoing costs of investing in other mutual funds. To do so, compare this 5% hypothetical example with the 5% hypothetical examples that appear in the shareholder reports of the other funds. The example is based upon an investment of $1,000 invested at the beginning of the period and held for the six-months indicated, unless noted otherwise in the table and footnotes below.
Actual Expenses
The information in the table under the heading “Actual” provides information about actual account values and actual expenses. You may use the information in these columns, together with the amount you invested, to estimate the expenses that you paid over the period. Simply divide your account value by $1,000 (for example, an $8,600 account value divided by $1,000 = 8.6), then multiply the result by the number in the appropriate column for your share class under the heading entitled “Expenses Paid During Period” to estimate the expenses you paid on your account during the period.
Hypothetical Example for Comparison Purposes
The information in the table under the heading “Hypothetical (5% return before expenses)” provides information about hypothetical account values and hypothetical expenses based upon the Fund’s actual expense ratio and an assumed rate of return of 5% per year before expenses, which is not the Fund’s actual return. The hypothetical account values and expenses may not be used to estimate the actual ending account balance or expenses you paid for the period. You may use this information to compare the ongoing costs of investing in the Fund and other funds. To do so, compare this 5% hypothetical example with the 5% hypothetical examples that appear in the shareholder reports of the other funds. Additionally, for an analysis of the fees associated with an investment in any share class or other similar funds, please visit www.finra.org/fundanalyzer.
Please note that the expenses shown in the table are meant to highlight your ongoing costs only and do not reflect any transaction costs. These fees are fully described in the Fund’s prospectuses. Therefore, the hypothetical examples are useful in comparing ongoing costs only, and will not help you determine the relative total costs of owning different funds. In addition, if these transaction costs were included, your costs would have been higher.
Actual | Hypothetical | |||||||||
| Beginning | Ending | Expenses |
| Beginning | Ending | Expenses | Net Annualized | ||
Class A Shares | $1,000.00 | $1,081.50 | $8.30 |
| $1,000.00 | $1,016.95 | $8.05 | 1.60% | ||
Class C Shares | $1,000.00 | $1,077.60 | $11.86 |
| $1,000.00 | $1,013.51 | $11.50 | 2.29% | ||
Class D Shares | $1,000.00 | $1,081.50 | $7.42 |
| $1,000.00 | $1,017.80 | $7.19 | 1.43% | ||
Class I Shares | $1,000.00 | $1,082.30 | $6.90 |
| $1,000.00 | $1,018.30 | $6.69 | 1.33% | ||
Class S Shares | $1,000.00 | $1,080.60 | $8.51 |
| $1,000.00 | $1,016.75 | $8.25 | 1.64% | ||
Class T Shares | $1,000.00 | $1,081.90 | $7.84 |
| $1,000.00 | $1,017.40 | $7.59 | 1.51% | ||
† | Expenses Paid During Period are equal to the Net Annualized Expense Ratio multiplied by the average account value over the period, multiplied by 182/365 (to reflect the one-half year period). Expenses in the examples include the effect of applicable fee waivers and/or expense reimbursements, if any. Had such waivers and/or reimbursements not been in effect, your expenses would have been higher. Please refer to the Notes to Financial Statements or the Fund’s prospectuses for more information regarding waivers and/or reimbursements. | |||||||||
Janus Investment Fund | 7 |
Janus Asia Equity Fund
Schedule of Investments (unaudited)
March 31, 2017
Shares
or | Value | ||||||
Common Stocks – 96.8% | |||||||
Air Freight & Logistics – 0.5% | |||||||
Sinotrans Ltd | .222,000 | $103,697 | |||||
Airlines – 0.6% | |||||||
Spring Airlines Co Ltd* | 23,800 | 119,970 | |||||
Auto Components – 0.4% | |||||||
Hyundai Mobis Co Ltd | 368 | 79,156 | |||||
Automobiles – 7.1% | |||||||
Astra International Tbk PT | 283,200 | 183,337 | |||||
Chongqing Changan Automobile Co Ltd* | 357,100 | 496,272 | |||||
Hyundai Motor Co | 2,403 | 338,496 | |||||
Mahindra & Mahindra Ltd | 9,966 | 197,524 | |||||
Maruti Suzuki India Ltd | 1,253 | 116,089 | |||||
Yulon Motor Co Ltd | 100,000 | 93,111 | |||||
1,424,829 | |||||||
Banks – 12.3% | |||||||
Bangkok Bank PCL# | 8,400 | 45,477 | |||||
Bangkok Bank PCL (NVDR) | 8,400 | 44,377 | |||||
Bank Negara Indonesia Persero Tbk PT | 411,300 | 199,892 | |||||
Bank of China Ltd | 402,000 | 199,673 | |||||
BOC Hong Kong Holdings Ltd | 32,500 | 132,780 | |||||
China Construction Bank Corp | 488,000 | 392,470 | |||||
Hana Financial Group Inc | 10,064 | 332,586 | |||||
Industrial & Commercial Bank of China Ltd | 601,000 | 392,866 | |||||
Metropolitan Bank & Trust Co | 127,224 | 202,869 | |||||
Shinhan Financial Group Co Ltd | 5,011 | 208,848 | |||||
United Overseas Bank Ltd | 20,500 | 324,101 | |||||
2,475,939 | |||||||
Capital Markets – 1.7% | |||||||
CITIC Securities Co Ltd* | 79,000 | 162,650 | |||||
Haitong International Securities Group Ltd | 320,359 | 188,391 | |||||
351,041 | |||||||
Chemicals – 0.8% | |||||||
LG Chem Ltd | 616 | 161,975 | |||||
Commercial Services & Supplies – 0.5% | |||||||
Beijing Originwater Technology Co Ltd* | 40,200 | 94,612 | |||||
Construction & Engineering – 0.7% | |||||||
13 Holdings Ltd* | 156,371 | 43,261 | |||||
Voltas Ltd | 17,006 | 107,934 | |||||
151,195 | |||||||
Construction Materials – 0.5% | |||||||
BBMG Corp | 241,844 | 100,518 | |||||
Diversified Telecommunication Services – 0.8% | |||||||
China Telecom Corp Ltd | 233,894 | 114,068 | |||||
KT Corp | 1,690 | 48,217 | |||||
162,285 | |||||||
Electric Utilities – 1.6% | |||||||
Power Grid Corp of India Ltd | 103,045 | 313,118 | |||||
Electronic Equipment, Instruments & Components – 7.1% | |||||||
AAC Technologies Holdings Inc | 14,500 | 169,698 | |||||
Chroma ATE Inc | 48,000 | 145,392 | |||||
Delta Electronics Inc | 23,577 | 126,278 | |||||
Hangzhou Hikvision Digital Technology Co Ltd* | 45,150 | 208,985 | |||||
Hon Hai Precision Industry Co Ltd | 84,534 | 253,546 | |||||
Largan Precision Co Ltd | 2,000 | 315,096 | |||||
Lens Technology Co Ltd* | 25,300 | 112,774 | |||||
WPG Holdings Ltd | 83,000 | 104,229 | |||||
1,435,998 | |||||||
Health Care Providers & Services – 0.7% | |||||||
Shanghai Pharmaceuticals Holding Co Ltd | 50,700 | 132,763 | |||||
See Notes to Schedule of Investments and Other Information and Notes to Financial Statements. | |
8 | MARCH 31, 2017 |
Janus Asia Equity Fund
Schedule of Investments (unaudited)
March 31, 2017
Shares
or | Value | ||||||
Common Stocks – (continued) | |||||||
Hotels, Restaurants & Leisure – 1.6% | |||||||
Genting Malaysia Bhd | .73,800 | $90,936 | |||||
Genting Singapore PLC | 142,700 | 104,079 | |||||
Melco International Development Ltd | 73,000 | 128,879 | |||||
323,894 | |||||||
Independent Power and Renewable Electricity Producers – 1.1% | |||||||
Beijing Jingneng Clean Energy Co Ltd | 695,021 | 211,959 | |||||
Industrial Conglomerates – 2.0% | |||||||
CK Hutchison Holdings Ltd | 11,840 | 145,652 | |||||
Shun Tak Holdings Ltd* | 261,500 | 92,536 | |||||
Sime Darby Bhd | 74,800 | 156,940 | |||||
395,128 | |||||||
Insurance – 6.3% | |||||||
AIA Group Ltd | 78,600 | 495,593 | |||||
Cathay Financial Holding Co Ltd* | 117,000 | 187,802 | |||||
Hyundai Marine & Fire Insurance Co Ltd | 4,812 | 150,631 | |||||
Ping An Insurance Group Co of China Ltd | 79,800 | 428,538 | |||||
1,262,564 | |||||||
Internet & Direct Marketing Retail – 0.6% | |||||||
Ctrip.com International Ltd (ADR)* | 2,677 | 131,575 | |||||
Internet Software & Services – 9.8% | |||||||
Alibaba Group Holding Ltd (ADR)*,† | 7,110 | 766,671 | |||||
Baidu Inc (ADR)* | 625 | 107,825 | |||||
NAVER Corp | 187 | 142,997 | |||||
Tencent Holdings Ltd | 33,000 | 946,097 | |||||
1,963,590 | |||||||
Marine – 0.6% | |||||||
Orient Overseas International Ltd* | 21,000 | 112,143 | |||||
Media – 0.5% | |||||||
Innocean Worldwide Inc | 1,903 | 104,843 | |||||
Metals & Mining – 2.0% | |||||||
Baoshan Iron & Steel Co Ltd* | 141,400 | 133,567 | |||||
Hindustan Zinc Ltd | 27,289 | 121,378 | |||||
Hyundai Steel Co | 2,756 | 144,196 | |||||
399,141 | |||||||
Oil, Gas & Consumable Fuels – 4.6% | |||||||
China Petroleum & Chemical Corp | 120,000 | 97,281 | |||||
Coal India Ltd | 38,064 | 171,561 | |||||
PetroChina Co Ltd | 298,000 | 218,190 | |||||
PTT PCL | 9,900 | 111,518 | |||||
Reliance Industries Ltd* | 8,696 | 176,907 | |||||
Shaanxi Coal Industry Co Ltd* | 165,900 | 148,765 | |||||
924,222 | |||||||
Personal Products – 0.7% | |||||||
LG Household & Health Care Ltd | 205 | 148,694 | |||||
Pharmaceuticals – 3.0% | |||||||
Sun Pharmaceutical Industries Ltd | 14,141 | 149,871 | |||||
Yunnan Baiyao Group Co Ltd* | 36,300 | 448,338 | |||||
598,209 | |||||||
Real Estate Management & Development – 5.8% | |||||||
Belle Corp | 808,121 | 64,456 | |||||
Central China Real Estate Ltd* | 689,440 | 170,335 | |||||
Cheung Kong Property Holdings Ltd | 15,447 | 104,056 | |||||
City Developments Ltd | 30,200 | 220,265 | |||||
CSI Properties Ltd | 2,600,000 | 118,770 | |||||
Filinvest Land Inc* | 2,592,000 | 84,730 | |||||
Longfor Properties Co Ltd | 92,500 | 152,117 | |||||
Siam Future Development PCL | 561,600 | 103,800 | |||||
See Notes to Schedule of Investments and Other Information and Notes to Financial Statements. | |
Janus Investment Fund | 9 |
Janus Asia Equity Fund
Schedule of Investments (unaudited)
March 31, 2017
Shares
or | Value | ||||||
Common Stocks – (continued) | |||||||
Real Estate Management & Development – (continued) | |||||||
Sun Hung Kai Properties Ltd | .10,000 | $146,951 | |||||
1,165,480 | |||||||
Semiconductor & Semiconductor Equipment – 9.1% | |||||||
Hua Hong Semiconductor Ltd (144A) | 70,747 | 99,229 | |||||
SK Hynix Inc | 14,736 | 665,565 | |||||
Taiwan Semiconductor Manufacturing Co Ltd* | 172,000 | 1,071,457 | |||||
1,836,251 | |||||||
Software – 1.2% | |||||||
Com2uSCorp | 1,360 | 147,300 | |||||
Nexon Co Ltd | 6,000 | 95,355 | |||||
242,655 | |||||||
Technology Hardware, Storage & Peripherals – 6.0% | |||||||
Pegatron Corp | 52,000 | 153,909 | |||||
Samsung Electronics Co Ltd | 576 | 1,061,229 | |||||
1,215,138 | |||||||
Thrifts & Mortgage Finance – 3.0% | |||||||
Housing Development Finance Corp Ltd | 9,685 | 224,054 | |||||
LIC Housing Finance Ltd | 39,390 | 375,185 | |||||
599,239 | |||||||
Tobacco – 0.6% | |||||||
ITC Ltd | 25,923 | 111,908 | |||||
Transportation Infrastructure – 1.0% | |||||||
Shanghai International Airport Co Ltd | 44,700 | 194,449 | |||||
Wireless Telecommunication Services – 2.0% | |||||||
China Mobile Ltd | 36,000 | 393,988 | |||||
Total Common Stocks (cost $17,817,457) | 19,442,166 | ||||||
Preferred Stocks – 1.8% | |||||||
Technology Hardware, Storage & Peripherals – 1.8% | |||||||
Samsung Electronics Co Ltd (cost $296,989) | 247 | 354,119 | |||||
Investment Companies – 6.7% | |||||||
Investments Purchased with Cash Collateral from Securities Lending – 0.1% | |||||||
Janus Cash Collateral Fund LLC, 0.6842%ºº,£ | 17,100 | 17,100 | |||||
Money Markets – 6.6% | |||||||
Janus Cash Liquidity Fund LLC, 0.7113%ºº,£ | 1,338,462 | 1,338,462 | |||||
Total Investment Companies (cost $1,355,562) | 1,355,562 | ||||||
OTC Purchased Options – Calls – 0% | |||||||
Counterparty/Reference Asset | |||||||
Goldman Sachs International: | |||||||
CNH Currency, exercise price 6.80 CNH, expires July 2017* (premiums paid 9,371) | 273,221 | 5,810 | |||||
Total Investments (total cost $19,479,379) – 105.3% | 21,157,657 | ||||||
Liabilities, net of Cash, Receivables and Other Assets – (5.3)% | (1,071,449) | ||||||
Net Assets – 100% | $20,086,208 | ||||||
See Notes to Schedule of Investments and Other Information and Notes to Financial Statements. | |
10 | MARCH 31, 2017 |
Janus Asia Equity Fund
Schedule of Investments (unaudited)
March 31, 2017
Summary of Investments by Country - (Long Positions) (unaudited) | |||||
% of Investment Securities | |||||
Country | Value | ||||
China | $7,449,940 | 35.2 | % | ||
South Korea | 4,088,852 | 19.3 | |||
Taiwan | 2,450,820 | 11.6 | |||
India | 2,065,529 | 9.8 | |||
Hong Kong | 1,709,012 | 8.1 | |||
United States | 1,361,372 | 6.4 | |||
Singapore | 648,445 | 3.1 | |||
Indonesia | 383,229 | 1.8 | |||
Philippines | 352,055 | 1.7 | |||
Thailand | 305,172 | 1.4 | |||
Malaysia | 247,876 | 1.2 | |||
Japan | 95,355 | 0.4 | |||
Total | $21,157,657 | 100.0 | % |
Schedule of OTC Written Options | ||||||||||||||||||||||||||
Counterparty | Reference Asset | Number of Contracts | Exercise Price | Expiration Date | Premiums Received | Unrealized Appreciation/ (Depreciation) | Options Written, at Value | |||||||||||||||||||
Written Call Options: | ||||||||||||||||||||||||||
Goldman Sachs International | CNH Currency | 273,221 | 7.20 | CNH | 7/17 | $ | 4,454 | $ | 3,934 | $ | (520) | |||||||||||||||
See Notes to Schedule of Investments and Other Information and Notes to Financial Statements. | |
Janus Investment Fund | 11 |
Janus Asia Equity Fund
Notes to Schedule of Investments and Other Information (unaudited)
MSCI All Country Asia ex-Japan IndexSM | MSCI All Country Asia ex Japan IndexSM reflects the equity market performance of Asia, excluding Japan. |
ADR | American Depositary Receipt |
LLC | Limited Liability Company |
NVDR | Non-Voting Depositary Receipt |
OTC | Over-the-Counter |
PCL | Public Company Limited |
PLC | Public Limited Company |
144A | Securities sold under Rule 144A of the Securities Act of 1933, as amended, are subject to legal and/or contractual restrictions on resale and may not be publicly sold without registration under the 1933 Act. Unless otherwise noted, these securities have been determined to be liquid under guidelines established by the Board of Trustees. The total value of 144A securities as of the period ended March 31, 2017 is $99,229, which represents 0.5% of net assets. |
* | Non-income producing security. |
† | A portion of this security has been segregated to cover margin or segregation requirements on open futures contracts, forward currency contracts, options contracts, short sales, swap agreements, and/or securities with extended settlement dates, the value of which, as of March 31, 2017, is $10,783. |
ºº | Rate shown is the 7-day yield as of March 31, 2017. |
# | Loaned security; a portion of the security is on loan at March 31, 2017. |
£ | The Fund may invest in certain securities that are considered affiliated companies. As defined by the Investment Company Act of 1940, as amended, an affiliated company is one in which the Fund owns 5% or more of the outstanding voting securities, or a company which is under common ownership or control. The following securities were considered affiliated companies for all or some portion of the period ended March 31, 2017. Unless otherwise indicated, all information in the table is for the period ended March 31, 2017. |
Share | Share | ||||||||||||||
Balance | Balance | Realized | Dividend | Value | |||||||||||
at 9/30/16 | Purchases | Sales | at 3/31/17 | Gain/(Loss) | Income | at 3/31/17 | |||||||||
Janus Cash Collateral Fund LLC | — | 1,070,707 | (1,053,607) | 17,100 | $— | $— | $17,100 | ||||||||
Janus Cash Liquidity Fund LLC | 426,055 | 11,366,865 | (10,454,458) | 1,338,462 | — | 1,298 | 1,338,462 | ||||||||
Total | $— | $1,298 | $1,355,562 | ||||||||||||
12 | MARCH 31, 2017 |
Janus Asia Equity Fund
Notes to Schedule of Investments and Other Information (unaudited)
The following is a summary of the inputs that were used to value the Fund’s investments in securities and other financial instruments as of March 31, 2017. See Notes to Financial Statements for more information. | |||||||||||||
Valuation Inputs Summary | |||||||||||||
Level 2 - | Level 3 - | ||||||||||||
Level 1 - | Other Significant | Significant | |||||||||||
Quotes Prices | Observable Inputs | Unobservable Inputs | |||||||||||
Assets | |||||||||||||
Investments in Securities: | |||||||||||||
Common Stocks | $ | 19,442,166 | $ | - | $ | - | |||||||
Preferred Stocks | - | 354,119 | - | ||||||||||
Investment Companies | - | 1,355,562 | - | ||||||||||
OTC Purchased Options – Calls | - | 5,810 | - | ||||||||||
Total Assets | $ | 19,442,166 | $ | 1,715,491 | $ | - | |||||||
Liabilities | |||||||||||||
Other Financial Instruments(a): | |||||||||||||
Options Written, at Value | $ | - | $ | 520 | $ | - | |||||||
(a) | Other financial instruments include forward currency, futures, written options, written swaptions, and swap contracts. Forward currency contracts are reported at their unrealized appreciation/(depreciation) at measurement date, which represents the change in the contract's value from trade date. Futures, certain written options on futures, and centrally cleared swap contracts are reported at their variation margin at measurement date, which represents the amount due to/from the Fund at that date. Written options, written swaptions, and other swap contracts are reported at their market value at measurement date. | ||||||||||||
Janus Investment Fund | 13 |
Janus Asia Equity Fund
Statement of Assets and Liabilities (unaudited)
March 31, 2017
See footnotes at the end of the Statement. |
|
|
|
|
|
|
|
Assets: | ||||||
Investments, at cost | $ | 19,479,379 | ||||
Unaffiliated investments, at value(1) | 19,802,095 | |||||
Affiliated investments, at value | 1,355,562 | |||||
Cash | 12,307 | |||||
Restricted cash (Note 1) | 24,001 | |||||
Cash denominated in foreign currency(2) | 1,819 | |||||
Non-interested Trustees' deferred compensation | 380 | |||||
Receivables: | ||||||
Dividends | 46,618 | |||||
Due from adviser | 16,541 | |||||
Fund shares sold | 14,056 | |||||
Dividends from affiliates | 469 | |||||
Other assets | 2,265 | |||||
Total Assets |
|
| 21,276,113 |
| ||
Liabilities: | ||||||
Collateral for securities loaned (Note 3) | 17,100 | |||||
Options written, at value(3) | 520 | |||||
Payables: | — | |||||
Investments purchased | 1,083,249 | |||||
Fund shares repurchased | 34,137 | |||||
Advisory fees | 14,295 | |||||
Professional fees | 12,681 | |||||
Foreign tax liability | 11,868 | |||||
Transfer agent fees and expenses | 1,799 | |||||
12b-1 Distribution and shareholder servicing fees | 514 | |||||
Non-interested Trustees' deferred compensation fees | 380 | |||||
Custodian fees | 197 | |||||
Fund administration fees | 133 | |||||
Non-interested Trustees' fees and expenses | 65 | |||||
Accrued expenses and other payables | 12,967 | |||||
Total Liabilities |
|
| 1,189,905 |
| ||
Net Assets |
| $ | 20,086,208 |
| ||
See Notes to Financial Statements. | |
14 | MARCH 31, 2017 |
Janus Asia Equity Fund
Statement of Assets and Liabilities (unaudited)
March 31, 2017
|
|
|
|
|
|
|
Net Assets Consist of: | ||||||
Capital (par value and paid-in surplus) | $ | 19,692,177 | ||||
Undistributed net investment income/(loss) | (94,565) | |||||
Undistributed net realized gain/(loss) from investments and foreign currency transactions | (1,135,157) | |||||
Unrealized net appreciation/(depreciation) of investments, foreign currency translations and non-interested Trustees’ deferred compensation(4) | 1,623,753 | |||||
Total Net Assets |
| $ | 20,086,208 |
| ||
Net Assets - Class A Shares | $ | 265,539 | ||||
Shares Outstanding, $0.01 Par Value (unlimited shares authorized) | 26,389 | |||||
Net Asset Value Per Share(5) |
| $ | 10.06 |
| ||
Maximum Offering Price Per Share(6) |
| $ | 10.67 |
| ||
Net Assets - Class C Shares | $ | 402,495 | ||||
Shares Outstanding, $0.01 Par Value (unlimited shares authorized) | 40,160 | |||||
Net Asset Value Per Share(5) |
| $ | 10.02 |
| ||
Net Assets - Class D Shares | $ | 9,199,578 | ||||
Shares Outstanding, $0.01 Par Value (unlimited shares authorized) | 906,708 | |||||
Net Asset Value Per Share |
| $ | 10.15 |
| ||
Net Assets - Class I Shares | $ | 9,296,727 | ||||
Shares Outstanding, $0.01 Par Value (unlimited shares authorized) | 917,041 | |||||
Net Asset Value Per Share |
| $ | 10.14 |
| ||
Net Assets - Class S Shares | $ | 409,318 | ||||
Shares Outstanding, $0.01 Par Value (unlimited shares authorized) | 40,574 | |||||
Net Asset Value Per Share |
| $ | 10.09 |
| ||
Net Assets - Class T Shares | $ | 512,551 | ||||
Shares Outstanding, $0.01 Par Value (unlimited shares authorized) | 51,103 | |||||
Net Asset Value Per Share |
| $ | 10.03 |
| ||
(1) Includes $16,195 of securities on loan. See Note 3 in Notes to Financial Statements. (2) Includes cost of $1,819. (3) Premiums received $4,454. (4) Includes $11,868 of foreign capital gains tax on investments. (5) Redemption price per share may be reduced for any applicable contingent deferred sales charge. (6) Maximum offering price is computed at 100/94.25 of net asset value. |
See Notes to Financial Statements. | |
Janus Investment Fund | 15 |
Janus Asia Equity Fund
Statement of Operations (unaudited)
For the period ended March 31, 2017
|
|
|
|
|
|
Investment Income: | |||||
| Dividends | $ | 73,607 | ||
Dividends from affiliates | 1,298 | ||||
Other income | 279 | ||||
Foreign tax withheld | (9,602) | ||||
Total Investment Income |
| 65,582 |
| ||
Expenses: | |||||
Advisory fees | 59,016 | ||||
12b-1Distribution and shareholder servicing fees: | |||||
Class A Shares | 336 | ||||
Class C Shares | 1,978 | ||||
Class S Shares | 469 | ||||
Transfer agent administrative fees and expenses: | |||||
Class D Shares | 4,054 | ||||
Class S Shares | 469 | ||||
Class T Shares | 444 | ||||
Transfer agent networking and omnibus fees: | |||||
Class A Shares | 110 | ||||
Class C Shares | 64 | ||||
Class I Shares | 320 | ||||
Other transfer agent fees and expenses: | |||||
Class A Shares | 19 | ||||
Class C Shares | 40 | ||||
Class D Shares | 1,602 | ||||
Class I Shares | 165 | ||||
Class S Shares | 17 | ||||
Class T Shares | 14 | ||||
Registration fees | 30,954 | ||||
Professional fees | 28,043 | ||||
Custodian fees | 12,212 | ||||
Accounting systems fee | 9,173 | ||||
Shareholder reports expense | 3,671 | ||||
Fund administration fees | 537 | ||||
Non-interested Trustees’ fees and expenses | 152 | ||||
Other expenses | 134 | ||||
Total Expenses |
| 153,993 |
| ||
Less: Excess Expense Reimbursement |
| (73,225) |
| ||
Net Expenses |
| 80,768 |
| ||
Net Investment Income/(Loss) |
| (15,186) |
| ||
Net Realized Gain/(Loss) on Investments: | |||||
Investments and foreign currency transactions | (51,715) | ||||
Total Net Realized Gain/(Loss) on Investments |
| (51,715) |
| ||
Change in Unrealized Net Appreciation/Depreciation:(1) | |||||
Investments, foreign currency translations and non-interested Trustees’ deferred compensation | 999,150 | ||||
Written options contracts | 1,653 | ||||
Total Change in Unrealized Net Appreciation/Depreciation |
| 1,000,803 |
| ||
Net Increase/(Decrease) in Net Assets Resulting from Operations | $ | 933,902 |
| ||
(1) Includes change in unrealized appreciation/depreciation of $3,558 due to foreign capital gains tax on investments. |
See Notes to Financial Statements. | |
16 | MARCH 31, 2017 |
Janus Asia Equity Fund
Statements of Changes in Net Assets
|
|
| Period
ended |
| Year ended | |||
Operations: | ||||||||
Net investment income/(loss) | $ | (15,186) | $ | 80,109 | ||||
Net realized gain/(loss) on investments | (51,715) | (937,952) | ||||||
Change in unrealized net appreciation/depreciation | 1,000,803 | 2,348,779 | ||||||
Net Increase/(Decrease) in Net Assets Resulting from Operations |
| 933,902 |
|
| 1,490,936 | |||
Dividends and Distributions to Shareholders: | ||||||||
Dividends from Net Investment Income | ||||||||
Class A Shares | (3,240) | — | ||||||
Class C Shares | (1,728) | — | ||||||
Class D Shares | (71,030) | (3,958) | ||||||
Class I Shares | (36,957) | (5,795) | ||||||
Class S Shares | (3,863) | — | ||||||
Class T Shares | (4,515) | (579) | ||||||
| Total Dividends from Net Investment Income |
| (121,333) |
|
| (10,332) | ||
Distributions from Net Realized Gain from Investment Transactions | ||||||||
Class A Shares | — | (17,690) | ||||||
Class C Shares | — | (17,051) | ||||||
Class D Shares | — | (239,449) | ||||||
Class I Shares | — | (112,535) | ||||||
Class S Shares | — | (14,332) | ||||||
Class T Shares | — | (19,978) | ||||||
| Total Distributions from Net Realized Gain from Investment Transactions | — |
|
| (421,035) | |||
Net Decrease from Dividends and Distributions to Shareholders |
| (121,333) |
|
| (431,367) | |||
Capital Share Transactions: | ||||||||
Class A Shares | (7,702) | (125,250) | ||||||
Class C Shares | (37,851) | 7,051 | ||||||
Class D Shares | 3,391,243 | (910,200) | ||||||
Class I Shares | 6,417,750 | (139,290) | ||||||
Class S Shares | 13,863 | 14,332 | ||||||
Class T Shares | 253,215 | (97,358) | ||||||
Net Increase/(Decrease) from Capital Share Transactions |
| 10,030,518 |
|
| (1,250,715) | |||
Net Increase/(Decrease) in Net Assets |
| 10,843,087 |
|
| (191,146) | |||
Net Assets: | ||||||||
Beginning of period | 9,243,121 | 9,434,267 | ||||||
| End of period | $ | 20,086,208 |
| $ | 9,243,121 | ||
Undistributed Net Investment Income/(Loss) | $ | (94,565) |
| $ | 41,954 | |||
See Notes to Financial Statements. | |
Janus Investment Fund | 17 |
Janus Asia Equity Fund
Financial Highlights
Class A Shares | |||||||||||||||||||||
For a share outstanding during the period ended March 31, 2017 (unaudited) and each year ended September 30 | 2017 |
|
| 2016 |
|
| 2015 |
|
| 2014 |
|
| 2013 |
|
| 2012 | |||||
Net Asset Value, Beginning of Period |
| $9.42 |
|
| $8.31 |
|
| $9.79 |
|
| $9.44 |
|
| $9.25 |
|
| $7.43 |
| |||
Income/(Loss) from Investment Operations: | |||||||||||||||||||||
Net investment income/(loss) | (0.03)(1) | 0.05(1) | 0.01(1) | 0.23(1)(2) | 0.07 | 0.14 | |||||||||||||||
Net realized and unrealized gain/(loss) | 0.78 | 1.44 | (0.95) | 0.59 | 0.20 | 1.68 | |||||||||||||||
Total from Investment Operations |
| 0.75 |
|
| 1.49 |
|
| (0.94) |
|
| 0.82 |
|
| 0.27 |
|
| 1.82 |
| |||
Less Dividends and Distributions: | |||||||||||||||||||||
Dividends (from net investment income) | (0.11) | — | (0.17) | (0.14) | (0.08) | — | |||||||||||||||
Distributions (from capital gains) | — | (0.38) | (0.37) | (0.33) | — | — | |||||||||||||||
Total Dividends and Distributions |
| (0.11) |
|
| (0.38) |
|
| (0.54) |
|
| (0.47) |
|
| (0.08) |
|
| — |
| |||
Net Asset Value, End of Period | $10.06 | $9.42 | $8.31 | $9.79 | $9.44 | $9.25 | |||||||||||||||
Total Return* |
| 8.15% |
|
| 18.58% |
|
| (10.07)% |
|
| 9.06% |
|
| 2.88% |
|
| 24.50% |
| |||
Net Assets, End of Period (in thousands) | $266 | $253 | $348 | $456 | $973 | $878 | |||||||||||||||
Average Net Assets for the Period (in thousands) | $269 | $333 | $400 | $1,053 | $1,063 | $768 | |||||||||||||||
Ratios to Average Net Assets**: |
|
|
|
|
|
|
|
|
|
|
|
|
|
|
|
|
|
| |||
Ratio of Gross Expenses | 2.84% | 3.51% | 2.87% | 2.49% | 2.03% | 4.43% | |||||||||||||||
Ratio of Net Expenses (After Waivers and Expense Offsets) | 1.60% | 1.56% | 1.61% | 1.38% | 1.52% | 1.55% | |||||||||||||||
Ratio of Net Investment Income/(Loss) | (0.59)% | 0.64% | 0.07% | 2.35%(2) | 0.51% | 0.87% | |||||||||||||||
Portfolio Turnover Rate | 23% | 59% | 152% | 72% | 104% | 75% | |||||||||||||||
1 | |||||||||||||||||||||
Class C Shares | |||||||||||||||||||||
For a share outstanding during the period ended March 31, 2017 (unaudited) and each year ended September 30 | 2017 |
|
| 2016 |
|
| 2015 |
|
| 2014 |
|
| 2013 |
|
| 2012 |
| ||||
Net Asset Value, Beginning of Period |
| $9.34 |
|
| $8.29 |
|
| $9.72 |
|
| $9.38 |
|
| $9.18 |
|
| $7.43 |
| |||
Income/(Loss) from Investment Operations: | |||||||||||||||||||||
Net investment income/(loss) | (0.06)(1) | 0.01(1) | (0.03)(1) | 0.16(1)(2) | —(3) | 0.06 | |||||||||||||||
Net realized and unrealized gain/(loss) | 0.78 | 1.42 | (0.98) | 0.59 | 0.21 | 1.69 | |||||||||||||||
Total from Investment Operations |
| 0.72 |
|
| 1.43 |
|
| (1.01) |
|
| 0.75 |
|
| 0.21 |
|
| 1.75 |
| |||
Less Dividends and Distributions: | |||||||||||||||||||||
Dividends (from net investment income) | (0.04) | — | (0.05) | (0.08) | (0.01) | — | |||||||||||||||
Distributions (from capital gains) | — | (0.38) | (0.37) | (0.33) | — | — | |||||||||||||||
Total Dividends and Distributions |
| (0.04) |
|
| (0.38) |
|
| (0.42) |
|
| (0.41) |
|
| (0.01) |
|
| — |
| |||
Net Asset Value, End of Period | $10.02 | $9.34 | $8.29 | $9.72 | $9.38 | $9.18 | |||||||||||||||
Total Return* |
| 7.76% |
|
| 17.87% |
|
| (10.81)% |
|
| 8.22% |
|
| 2.24% |
|
| 23.55% |
| |||
Net Assets, End of Period (in thousands) | $402 | $413 | $360 | $332 | $804 | $775 | |||||||||||||||
Average Net Assets for the Period (in thousands) | $400 | $381 | $373 | $802 | $815 | $716 | |||||||||||||||
Ratios to Average Net Assets**: |
|
|
|
|
|
|
|
|
|
|
|
|
|
|
|
|
|
| |||
Ratio of Gross Expenses | 3.54% | 4.23% | 3.59% | 3.24% | 2.77% | 5.45% | |||||||||||||||
Ratio of Net Expenses (After Waivers and Expense Offsets) | 2.29% | 2.25% | 2.30% | 2.12% | 2.23% | 2.30% | |||||||||||||||
Ratio of Net Investment Income/(Loss) | (1.28)% | 0.10% | (0.31)% | 1.68%(2) | (0.20)% | 0.08% | |||||||||||||||
Portfolio Turnover Rate | 23% | 59% | 152% | 72% | 104% | 75% | |||||||||||||||
* Total return not annualized for periods of less than one full year. ** Annualized for periods of less than one full year. (1) Per share amounts are calculated based on average shares outstanding during the year or period. (2) Net investment income/(loss) per share and Ratio of Net Investment Income/(Loss) to Average Net Assets include a special dividend from Strides Arcolab, Ltd. in December 2013. The impact of the special dividend to Net investment income/(loss) per share and Ratio of Net Investment Income/(Loss) to Average Net Assets is $0.09 and 0.97%, respectively. (3) Less than $0.005 on a per share basis. |
See Notes to Financial Statements. | |
18 | MARCH 31, 2017 |
Janus Asia Equity Fund
Financial Highlights
Class D Shares | |||||||||||||||||||||
For a share outstanding during the period ended March 31, 2017 (unaudited) and each year ended September 30 | 2017 |
|
| 2016 |
|
| 2015 |
|
| 2014 |
|
| 2013 |
|
| 2012 | |||||
Net Asset Value, Beginning of Period |
| $9.49 |
|
| $8.35 |
|
| $9.84 |
|
| $9.48 |
|
| $9.26 |
|
| $7.42 |
| |||
Income/(Loss) from Investment Operations: | |||||||||||||||||||||
Net investment income/(loss) | (0.02)(1) | 0.08(1) | 0.07(1) | 0.24(1)(2) | 0.05 | 0.25 | |||||||||||||||
Net realized and unrealized gain/(loss) | 0.79 | 1.45 | (1.00) | 0.61 | 0.23 | 1.59 | |||||||||||||||
Total from Investment Operations |
| 0.77 |
|
| 1.53 |
|
| (0.93) |
|
| 0.85 |
|
| 0.28 |
|
| 1.84 |
| |||
Less Dividends and Distributions: | |||||||||||||||||||||
Dividends (from net investment income) | (0.11) | (0.01) | (0.19) | (0.16) | (0.06) | — | |||||||||||||||
Distributions (from capital gains) | — | (0.38) | (0.37) | (0.33) | — | — | |||||||||||||||
Redemption fees | N/A | N/A | N/A | N/A | N/A | —(3) | |||||||||||||||
Total Dividends and Distributions |
| (0.11) |
|
| (0.39) |
|
| (0.56) |
|
| (0.49) |
|
| (0.06) |
|
| — |
| |||
Net Asset Value, End of Period | $10.15 | $9.49 | $8.35 | $9.84 | $9.48 | $9.26 | |||||||||||||||
Total Return* |
| 8.26% |
|
| 18.95% |
|
| (9.99)% |
|
| 9.26% |
|
| 3.01% |
|
| 24.80% |
| |||
Net Assets, End of Period (in thousands) | $9,200 | $5,314 | $5,640 | $9,084 | $7,477 | $3,394 | |||||||||||||||
Average Net Assets for the Period (in thousands) | $6,733 | $5,013 | $6,632 | $8,635 | $7,523 | $2,654 | |||||||||||||||
Ratios to Average Net Assets**: |
|
|
|
|
|
|
|
|
|
|
|
|
|
|
|
|
|
| |||
Ratio of Gross Expenses | 2.76% | 3.38% | 2.75% | 2.31% | 1.91% | 2.77% | |||||||||||||||
Ratio of Net Expenses (After Waivers and Expense Offsets) | 1.43% | 1.36% | 1.42% | 1.25% | 1.40% | 1.53% | |||||||||||||||
Ratio of Net Investment Income/(Loss) | (0.33)% | 0.89% | 0.67% | 2.52%(2) | 0.63% | 1.33% | |||||||||||||||
Portfolio Turnover Rate | 23% | 59% | 152% | 72% | 104% | 75% | |||||||||||||||
Class I Shares | |||||||||||||||||||||
For a share outstanding during the period ended March 31, 2017 (unaudited) and each year ended September 30 | 2017 |
|
| 2016 |
|
| 2015 |
|
| 2014 |
|
| 2013 |
|
| 2012 |
| ||||
Net Asset Value, Beginning of Period |
| $9.51 |
|
| $8.37 |
|
| $9.85 |
|
| $9.49 |
|
| $9.27 |
|
| $7.43 |
| |||
Income/(Loss) from Investment Operations: | |||||||||||||||||||||
Net investment income/(loss) | —(1)(4) | 0.10(1) | 0.06(1) | 0.26(1)(2) | 0.04 | 0.19 | |||||||||||||||
Net realized and unrealized gain/(loss) | 0.76 | 1.44 | (0.98) | 0.60 | 0.26 | 1.65 | |||||||||||||||
Total from Investment Operations |
| 0.76 |
|
| 1.54 |
|
| (0.92) |
|
| 0.86 |
|
| 0.30 |
|
| 1.84 |
| |||
Less Dividends and Distributions: | |||||||||||||||||||||
Dividends (from net investment income) | (0.13) | (0.02) | (0.19) | (0.17) | (0.08) | — | |||||||||||||||
Distributions (from capital gains) | — | (0.38) | (0.37) | (0.33) | — | — | |||||||||||||||
Total Dividends and Distributions |
| (0.13) |
|
| (0.40) |
|
| (0.56) |
|
| (0.50) |
|
| (0.08) |
|
| — |
| |||
Net Asset Value, End of Period | $10.14 | $9.51 | $8.37 | $9.85 | $9.49 | $9.27 | |||||||||||||||
Total Return* |
| 8.23% |
|
| 19.09% |
|
| (9.79)% |
|
| 9.43% |
|
| 3.21% |
|
| 24.76% |
| |||
Net Assets, End of Period (in thousands) | $9,297 | $2,665 | $2,470 | $2,899 | $1,295 | $1,145 | |||||||||||||||
Average Net Assets for the Period (in thousands) | $3,057 | $2,528 | $3,017 | $2,751 | $1,549 | $848 | |||||||||||||||
Ratios to Average Net Assets**: |
|
|
|
|
|
|
|
|
|
|
|
|
|
|
|
|
|
| |||
Ratio of Gross Expenses | 2.62% | 3.19% | 2.56% | 2.15% | 1.70% | 3.63% | |||||||||||||||
Ratio of Net Expenses (After Waivers and Expense Offsets) | 1.33% | 1.21% | 1.27% | 1.07% | 1.26% | 1.29% | |||||||||||||||
Ratio of Net Investment Income/(Loss) | 0.09% | 1.14% | 0.57% | 2.75%(2) | 0.55% | 1.19% | |||||||||||||||
Portfolio Turnover Rate | 23% | 59% | 152% | 72% | 104% | 75% | |||||||||||||||
* Total return not annualized for periods of less than one full year. ** Annualized for periods of less than one full year. (1) Per share amounts are calculated based on average shares outstanding during the year or period. (2) Net investment income/(loss) per share and Ratio of Net Investment Income/(Loss) to Average Net Assets include a special dividend from Strides Arcolab, Ltd. in December 2013. The impact of the special dividend to Net investment income/(loss) per share and Ratio of Net Investment Income/(Loss) to Average Net Assets is $0.09 and 0.97%, respectively. (3) Redemption fees aggregated less than $0.005 on a per share basis. Redemption fees were eliminated effective April 2, 2012. (4) Less than $0.005 on a per share basis. |
See Notes to Financial Statements. | |
Janus Investment Fund | 19 |
Janus Asia Equity Fund
Financial Highlights
Class S Shares | |||||||||||||||||||||
For a share outstanding during the period ended March 31, 2017 (unaudited) and each year ended September 30 | 2017 |
|
| 2016 |
|
| 2015 |
|
| 2014 |
|
| 2013 |
|
| 2012 | |||||
Net Asset Value, Beginning of Period |
| $9.43 |
|
| $8.32 |
|
| $9.79 |
|
| $9.43 |
|
| $9.23 |
|
| $7.43 |
| |||
Income/(Loss) from Investment Operations: | |||||||||||||||||||||
Net investment income/(loss) | (0.03)(1) | 0.07(1) | 0.07(1) | 0.23(1)(2) | 0.05 | 0.10 | |||||||||||||||
Net realized and unrealized gain/(loss) | 0.79 | 1.42 | (1.00) | 0.59 | 0.22 | 1.70 | |||||||||||||||
Total from Investment Operations |
| 0.76 |
|
| 1.49 |
|
| (0.93) |
|
| 0.82 |
|
| 0.27 |
|
| 1.80 |
| |||
Less Dividends and Distributions: | |||||||||||||||||||||
Dividends (from net investment income) | (0.10) | — | (0.17) | (0.13) | (0.07) | — | |||||||||||||||
Distributions (from capital gains) | — | (0.38) | (0.37) | (0.33) | — | — | |||||||||||||||
Total Dividends and Distributions |
| (0.10) |
|
| (0.38) |
|
| (0.54) |
|
| (0.46) |
|
| (0.07) |
|
| — |
| |||
Net Asset Value, End of Period | $10.09 | $9.43 | $8.32 | $9.79 | $9.43 | $9.23 | |||||||||||||||
Total Return* |
| 8.17% |
|
| 18.56% |
|
| (9.97)% |
|
| 9.02% |
|
| 2.86% |
|
| 24.23% |
| |||
Net Assets, End of Period (in thousands) | $409 | $368 | $310 | $345 | $791 | $769 | |||||||||||||||
Average Net Assets for the Period (in thousands) | $375 | $329 | $390 | $752 | $874 | $710 | |||||||||||||||
Ratios to Average Net Assets**: |
|
|
|
|
|
|
|
|
|
|
|
|
|
|
|
|
|
| |||
Ratio of Gross Expenses | 3.01% | 3.67% | 3.06% | 2.58% | 2.21% | 4.97% | |||||||||||||||
Ratio of Net Expenses (After Waivers and Expense Offsets) | 1.64% | 1.56% | 1.48% | 1.46% | 1.65% | 1.75% | |||||||||||||||
Ratio of Net Investment Income/(Loss) | (0.60)% | 0.83% | 0.71% | 2.42%(2) | 0.29% | 0.63% | |||||||||||||||
Portfolio Turnover Rate | 23% | 59% | 152% | 72% | 104% | 75% | |||||||||||||||
Class T Shares | |||||||||||||||||||||
For a share outstanding during the period ended March 31, 2017 (unaudited) and each year ended September 30 | 2017 |
|
| 2016 |
|
| 2015 |
|
| 2014 |
|
| 2013 |
|
| 2012 |
| ||||
Net Asset Value, Beginning of Period |
| $9.36 |
|
| $8.25 |
|
| $9.81 |
|
| $9.45 |
|
| $9.25 |
|
| $7.43 |
| |||
Income/(Loss) from Investment Operations: | |||||||||||||||||||||
Net investment income/(loss) | (0.02)(1) | 0.04(1) | 0.04(1) | 0.24(1)(2) | 0.13 | 0.15 | |||||||||||||||
Net realized and unrealized gain/(loss) | 0.77 | 1.46 | (0.96) | 0.61 | 0.15 | 1.67 | |||||||||||||||
Total from Investment Operations |
| 0.75 |
|
| 1.50 |
|
| (0.92) |
|
| 0.85 |
|
| 0.28 |
|
| 1.82 |
| |||
Less Dividends and Distributions: | |||||||||||||||||||||
Dividends (from net investment income) | (0.08) | (0.01) | (0.27) | (0.16) | (0.08) | — | |||||||||||||||
Distributions (from capital gains) | — | (0.38) | (0.37) | (0.33) | — | — | |||||||||||||||
Total Dividends and Distributions |
| (0.08) |
|
| (0.39) |
|
| (0.64) |
|
| (0.49) |
|
| (0.08) |
|
| — |
| |||
Net Asset Value, End of Period | $10.03 | $9.36 | $8.25 | $9.81 | $9.45 | $9.25 | |||||||||||||||
Total Return* |
| 8.19% |
|
| 18.88% |
|
| (9.98)% |
|
| 9.37% |
|
| 2.99% |
|
| 24.50% |
| |||
Net Assets, End of Period (in thousands) | $513 | $230 | $306 | $712 | $1,644 | $861 | |||||||||||||||
Average Net Assets for the Period (in thousands) | $353 | $332 | $566 | $1,357 | $1,331 | $798 | |||||||||||||||
Ratios to Average Net Assets**: |
|
|
|
|
|
|
|
|
|
|
|
|
|
|
|
|
|
| |||
Ratio of Gross Expenses | 2.73% | 3.41% | 2.73% | 2.44% | 2.05% | 4.33% | |||||||||||||||
Ratio of Net Expenses (After Waivers and Expense Offsets) | 1.51% | 1.44% | 1.39% | 1.26% | 1.43% | 1.54% | |||||||||||||||
Ratio of Net Investment Income/(Loss) | (0.46)% | 0.47% | 0.46% | 2.49%(2) | 0.63% | 0.89% | |||||||||||||||
Portfolio Turnover Rate | 23% | 59% | 152% | 72% | 104% | 75% | |||||||||||||||
* Total return not annualized for periods of less than one full year. ** Annualized for periods of less than one full year. (1) Per share amounts are calculated based on average shares outstanding during the year or period. (2) Net investment income/(loss) per share and Ratio of Net Investment Income/(Loss) to Average Net Assets include a special dividend from Strides Arcolab, Ltd. in December 2013. The impact of the special dividend to Net investment income/(loss) per share and Ratio of Net Investment Income/(Loss) to Average Net Assets is $0.09 and 0.97%, respectively. |
See Notes to Financial Statements. | |
20 | MARCH 31, 2017 |
Janus Asia Equity Fund
Notes to Financial Statements (unaudited)
1. Organization and Significant Accounting Policies
Janus Asia Equity Fund (the “Fund”) is a series fund. The Fund is part of Janus Investment Fund (the “Trust”), which is organized as a Massachusetts business trust and is registered under the Investment Company Act of 1940, as amended (the “1940 Act”), as an open-end management investment company, and therefore has applied the specialized accounting and reporting guidance in Financial Accounting Standards Board (“FASB”) Accounting Standards Codification (“ASC”) Topic 946. The Trust offers forty-four funds which include multiple series of shares, with differing investment objectives and policies. The Fund seeks long-term growth of capital. The Fund is classified as diversified, as defined in the 1940 Act.
The Fund offers multiple classes of shares in order to meet the needs of various types of investors. Each class represents an interest in the same portfolio of investments. Certain financial intermediaries may not offer all classes of shares. Class D Shares are closed to certain new investors.
Class A Shares and Class C Shares are generally offered through financial intermediary platforms including, but not limited to, traditional brokerage platforms, mutual fund wrap fee programs, bank trust platforms, and retirement platforms.
Class D Shares are generally no longer being made available to new investors who do not already have a direct account with the Janus funds. Class D Shares are available only to investors who hold accounts directly with the Janus funds, to immediate family members or members of the same household of an eligible individual investor, and to existing beneficial owners of sole proprietorships or partnerships that hold accounts directly with the Janus funds.
Class I Shares are available through certain financial intermediary platforms including, but not limited to, mutual fund wrap fee programs, managed account programs, asset allocation programs, bank trust platforms, as well as certain retirement platforms. Class I Shares are also available to certain direct institutional investors including, but not limited to, corporations, certain retirement plans, public plans, and foundations/endowments.
Class S Shares are offered through financial intermediary platforms including, but not limited to, retirement platforms and asset allocation, mutual fund wrap, or other discretionary or nondiscretionary fee-based investment advisory programs. In addition, Class S Shares may be available through certain financial intermediaries who have an agreement with Janus Capital Management LLC (“Janus Capital”) or its affiliates to offer Class S Shares on their supermarket platforms.
Class T Shares are available through certain financial intermediary platforms including, but not limited to, mutual fund wrap fee programs, managed account programs, asset allocation programs, bank trust platforms, as well as certain retirement platforms. In addition, Class T Shares may be available through certain financial intermediaries who have an agreement with Janus Capital or its affiliates to offer Class T Shares on their supermarket platforms.
The following accounting policies have been followed by the Fund and are in conformity with accounting principles generally accepted in the United States of America.
Investment Valuation
Securities held by the Fund are valued in accordance with policies and procedures established by and under the supervision of the Trustees (the “Valuation Procedures”). Equity securities traded on a domestic securities exchange are generally valued at the closing prices on the primary market or exchange on which they trade. If such price is lacking for the trading period immediately preceding the time of determination, such securities are valued at their current bid price. Equity securities that are traded on a foreign exchange are generally valued at the closing prices on such markets. In the event that there is no current trading volume on a particular security in such foreign exchange, the bid price from the primary exchange is generally used to value the security. Securities that are traded on the over-the-counter (“OTC”) markets are generally valued at their closing or latest bid prices as available. Foreign securities and currencies are converted to U.S. dollars using the applicable exchange rate in effect at the close of the New York Stock Exchange (“NYSE”). The Fund will determine the market value of individual securities held by it by using prices provided by one or more approved professional pricing services or, as needed, by obtaining market quotations from independent broker-dealers. Most debt securities are valued in accordance with the evaluated bid price supplied by the pricing service that is intended to reflect market value. The evaluated bid price supplied by the pricing service is an evaluation that may consider factors such as security prices, yields, maturities and ratings. Certain short-term securities maturing within 60 days or less may be evaluated and valued on an amortized cost basis provided that the amortized cost determined
Janus Investment Fund | 21 |
Janus Asia Equity Fund
Notes to Financial Statements (unaudited)
approximates market value. Securities for which market quotations or evaluated prices are not readily available or deemed unreliable are valued at fair value determined in good faith under the Valuation Procedures. Circumstances in which fair value pricing may be utilized include, but are not limited to: (i) a significant event that may affect the securities of a single issuer, such as a merger, bankruptcy, or significant issuer-specific development; (ii) an event that may affect an entire market, such as a natural disaster or significant governmental action; (iii) a nonsignificant event such as a market closing early or not opening, or a security trading halt; and (iv) pricing of a nonvalued security and a restricted or nonpublic security. Special valuation considerations may apply with respect to “odd-lot” fixed-income transactions which, due to their small size, may receive evaluated prices by pricing services which reflect a large block trade and not what actually could be obtained for the odd-lot position. The Fund uses systematic fair valuation models provided by independent third parties to value international equity securities in order to adjust for stale pricing, which may occur between the close of certain foreign exchanges and the close of the NYSE.
Valuation Inputs Summary
FASB ASC 820, Fair Value Measurements and Disclosures (“ASC 820”), defines fair value, establishes a framework for measuring fair value, and expands disclosure requirements regarding fair value measurements. This standard emphasizes that fair value is a market-based measurement that should be determined based on the assumptions that market participants would use in pricing an asset or liability and establishes a hierarchy that prioritizes inputs to valuation techniques used to measure fair value. These inputs are summarized into three broad levels:
Level 1 – Unadjusted quoted prices in active markets the Fund has the ability to access for identical assets or liabilities.
Level 2 – Observable inputs other than unadjusted quoted prices included in Level 1 that are observable for the asset or liability either directly or indirectly. These inputs may include quoted prices for the identical instrument on an inactive market, prices for similar instruments, interest rates, prepayment speeds, credit risk, yield curves, default rates and similar data.
Assets or liabilities categorized as Level 2 in the hierarchy generally include: debt securities fair valued in accordance with the evaluated bid or ask prices supplied by a pricing service; securities traded on OTC markets and listed securities for which no sales are reported that are fair valued at the latest bid price (or yield equivalent thereof) obtained from one or more dealers transacting in a market for such securities or by a pricing service approved by the Fund’s Trustees; certain short-term debt securities with maturities of 60 days or less that are fair valued at amortized cost; and equity securities of foreign issuers whose fair value is determined by using systematic fair valuation models provided by independent third parties in order to adjust for stale pricing which may occur between the close of certain foreign exchanges and the close of the NYSE. Other securities that may be categorized as Level 2 in the hierarchy include, but are not limited to, preferred stocks, bank loans, swaps, investments in unregistered investment companies, options, and forward contracts.
Level 3 – Unobservable inputs for the asset or liability to the extent that relevant observable inputs are not available, representing the Fund’s own assumptions about the assumptions that a market participant would use in valuing the asset or liability, and that would be based on the best information available.
There have been no significant changes in valuation techniques used in valuing any such positions held by the Fund since the beginning of the fiscal year.
The inputs or methodology used for fair valuing securities are not necessarily an indication of the risk associated with investing in those securities. The summary of inputs used as of March 31, 2017 to fair value the Fund’s investments in securities and other financial instruments is included in the “Valuation Inputs Summary” in the Notes to Schedule of Investments and Other Information.
The Fund recognizes transfers between the levels as of the beginning of the fiscal year. The following describes the amounts of transfers between Level 1, Level 2 and Level 3 of the fair value hierarchy during the period.
Financial assets of $181,234 were transferred out of Level 3 to Level 1 since the current market for the securities with quoted prices are considered active.
22 | MARCH 31, 2017 |
Janus Asia Equity Fund
Notes to Financial Statements (unaudited)
Investment Transactions and Investment Income
Investment transactions are accounted for as of the date purchased or sold (trade date). Dividend income is recorded on the ex-dividend date. Certain dividends from foreign securities will be recorded as soon as the Fund is informed of the dividend, if such information is obtained subsequent to the ex-dividend date. Dividends from foreign securities may be subject to withholding taxes in foreign jurisdictions. Interest income is recorded on the accrual basis and includes amortization of premiums and accretion of discounts. Gains and losses are determined on the identified cost basis, which is the same basis used for federal income tax purposes. Income, as well as gains and losses, both realized and unrealized, are allocated daily to each class of shares based upon the ratio of net assets represented by each class as a percentage of total net assets.
Expenses
The Fund bears expenses incurred specifically on its behalf. Each class of shares bears a portion of general expenses, which are allocated daily to each class of shares based upon the ratio of net assets represented by each class as a percentage of total net assets. Expenses directly attributable to a specific class of shares are charged against the operations of such class.
Estimates
The preparation of financial statements in conformity with accounting principles generally accepted in the United States of America requires management to make estimates and assumptions that affect the reported amount of assets and liabilities and disclosure of contingent assets and liabilities at the date of the financial statements, and the reported amounts of income and expenses during the reporting period. Actual results could differ from those estimates.
Indemnifications
In the normal course of business, the Fund may enter into contracts that contain provisions for indemnification of other parties against certain potential liabilities. The Fund’s maximum exposure under these arrangements is unknown, and would involve future claims that may be made against the Fund that have not yet occurred. Currently, the risk of material loss from such claims is considered remote.
Foreign Currency Translations
The Fund does not isolate that portion of the results of operations resulting from the effect of changes in foreign exchange rates on investments from the fluctuations arising from changes in market prices of securities held at the date of the financial statements. Net unrealized appreciation or depreciation of investments and foreign currency translations arise from changes in the value of assets and liabilities, including investments in securities held at the date of the financial statements, resulting from changes in the exchange rates and changes in market prices of securities held.
Currency gains and losses are also calculated on payables and receivables that are denominated in foreign currencies. The payables and receivables are generally related to foreign security transactions and income translations.
Foreign currency-denominated assets and forward currency contracts may involve more risks than domestic transactions, including currency risk, counterparty risk, political and economic risk, regulatory risk and equity risk. Risks may arise from unanticipated movements in the value of foreign currencies relative to the U.S. dollar.
Dividends and Distributions
The Fund generally declares and distributes dividends of net investment income and realized capital gains (if any) annually. The Fund may treat a portion of the amount paid to redeem shares as a distribution of investment company taxable income and realized capital gains that are reflected in the net asset value. This practice, commonly referred to as “equalization,” has no effect on the redeeming shareholder or a Fund’s total return, but may reduce the amounts that would otherwise be required to be paid as taxable dividends to the remaining shareholders. It is possible that the Internal Revenue Service (IRS) could challenge the Funds’ equalization methodology or calculations, and any such challenge could result in additional tax, interest, or penalties to be paid by the Fund.
The Fund may make certain investments in real estate investment trusts (“REITs”) which pay dividends to their shareholders based upon funds available from operations. It is quite common for these dividends to exceed the REITs’ taxable earnings and profits, resulting in the excess portion of such dividends being designated as a return of capital. If the Fund distributes such amounts, such distributions could constitute a return of capital to shareholders for federal income tax purposes.
Janus Investment Fund | 23 |
Janus Asia Equity Fund
Notes to Financial Statements (unaudited)
Federal Income Taxes
The Fund intends to continue to qualify as a regulated investment company and distribute all of its taxable income in accordance with the requirements of Subchapter M of the Internal Revenue Code. Management has analyzed the Fund’s tax positions taken for all open federal income tax years, generally a three-year period, and has concluded that no provision for federal income tax is required in the Fund’s financial statements. The Fund is not aware of any tax positions for which it is reasonably possible that the total amounts of unrecognized tax benefits will significantly change in the next twelve months.
Restricted Cash
As of March 31, 2017, the Fund has restricted cash in the amount of $24,001. The restricted cash represents collateral pledged in relation to investment quota for China A Shares. The carrying value of the restricted cash approximates fair value.
2. Derivative Instruments
The Fund may invest in various types of derivatives, which may at times result in significant derivative exposure. A derivative is a financial instrument whose performance is derived from the performance of another asset. The Fund may invest in derivative instruments including, but not limited to: futures contracts, put options, call options, options on future contracts, options on foreign currencies, options on recovery locks, options on security and commodity indices, swaps, forward contracts, structured investments, and other equity-linked derivatives. Each derivative instrument that was held by the Fund during the period ended March 31, 2017 is discussed in further detail below. A summary of derivative activity by the Fund is reflected in the tables at the end of this section.
The Fund may use derivative instruments for hedging purposes (to offset risks associated with an investment, currency exposure, or market conditions), to adjust currency exposure relative to a benchmark index, or for speculative purposes (to earn income and seek to enhance returns). When the Fund invests in a derivative for speculative purposes, the Fund will be fully exposed to the risks of loss of that derivative, which may sometimes be greater than the derivative’s cost. The Fund may not use any derivative to gain exposure to an asset or class of assets that it would be prohibited by its investment restrictions from purchasing directly. The Fund’s ability to use derivative instruments may also be limited by tax considerations.
Investments in derivatives in general are subject to market risks that may cause their prices to fluctuate over time. Investments in derivatives may not directly correlate with the price movements of the underlying instrument. As a result, the use of derivatives may expose the Fund to additional risks that it would not be subject to if it invested directly in the securities underlying those derivatives. The use of derivatives may result in larger losses or smaller gains than otherwise would be the case. Derivatives can be volatile and may involve significant risks.
In pursuit of its investment objective, the Fund may seek to use derivatives to increase or decrease exposure to the following market risk factors:
· Commodity Risk – the risk related to the change in value of commodities or commodity-linked investments due to changes in the overall market movements, volatility of the underlying benchmark, changes in interest rates, or other factors affecting a particular industry of commodity such as drought, floods, weather, livestock disease, embargoes, tariffs, and international economic, political, and regulatory developments.
· Counterparty Risk – the risk that the counterparty (the party on the other side of the transaction) on a derivative transaction will be unable to honor its financial obligation to the Fund.
· Credit Risk – the risk an issuer will be unable to make principal and interest payments when due, or will default on its obligations.
· Currency Risk – the risk that changes in the exchange rate between currencies will adversely affect the value (in U.S. dollar terms) of an investment.
· Equity Risk – the risk related to the change in value of equity securities as they relate to increases or decreases in the general market.
· Index Risk – if the derivative is linked to the performance of an index, it will be subject to the risks associated with changes in that index. If the index changes, the Fund could receive lower interest payments or experience a reduction in the value of the derivative to below what the Fund paid. Certain indexed securities, including inverse
24 | MARCH 31, 2017 |
Janus Asia Equity Fund
Notes to Financial Statements (unaudited)
securities (which move in an opposite direction to the index), may create leverage, to the extent that they increase or decrease in value at a rate that is a multiple of the changes in the applicable index.
· Interest Rate Risk – the risk that the value of fixed-income securities will generally decline as prevailing interest rates rise, which may cause the Fund’s NAV to likewise decrease.
· Leverage Risk – the risk associated with certain types of leveraged investments or trading strategies pursuant to which relatively small market movements may result in large changes in the value of an investment. The Fund creates leverage by investing in instruments, including derivatives, where the investment loss can exceed the original amount invested. Certain investments or trading strategies, such as short sales, that involve leverage can result in losses that greatly exceed the amount originally invested.
· Liquidity Risk – the risk that certain securities may be difficult or impossible to sell at the time that the seller would like or at the price that the seller believes the security is currently worth.
Derivatives may generally be traded OTC or on an exchange. Derivatives traded OTC are agreements that are individually negotiated between parties and can be tailored to meet a purchaser’s needs. OTC derivatives are not guaranteed by a clearing agency and may be subject to increased credit risk.
In an effort to mitigate credit risk associated with derivatives traded OTC, the Fund may enter into collateral agreements with certain counterparties whereby, subject to certain minimum exposure requirements, the Fund may require the counterparty to post collateral if the Fund has a net aggregate unrealized gain on all OTC derivative contracts with a particular counterparty. There is no guarantee that counterparty exposure is reduced and these arrangements are dependent on Janus Capital’s ability to establish and maintain appropriate systems and trading.
Options Contracts
An options contract provides the purchaser with the right, but not the obligation, to buy (call option) or sell (put option) a financial instrument at an agreed upon price on or before a specified date. The purchaser pays a premium to the seller for this right. The seller has the corresponding obligation to sell or buy a financial instrument if the purchaser (owner) "exercises" the option. When an option is exercised, the proceeds on sales for a written call option, the purchase cost for a written put option, or the cost of the security for a purchased put or call option are adjusted by the amount of premium received or paid. Upon expiration, or closing of the option transaction, a realized gain or loss is reported on the Statement of Operations (if applicable). The difference between the premium paid/received and the market value of the option is recorded as unrealized appreciation or depreciation. The net change in unrealized appreciation or depreciation is reported on the Statement of Operations (if applicable). Option contracts are typically valued using an approved vendor’s option valuation model. To the extent reliable market quotations are available, option contracts are valued using market quotations. In cases when an approved vendor cannot provide coverage for an option and there is no reliable market quotation, a broker quotation or an internal valuation using the Black-Scholes model, the Cox-Rubenstein Binomial Option Pricing Model, or other appropriate option pricing model is used. Certain options contracts are marked-to-market daily, and the daily variation margin is recorded as a receivable or payable on the Statement of Assets and Liabilities as “Variation margin receivable” or “Variation margin payable” (if applicable).
The Fund may use options contracts to hedge against changes in interest rates, the values of equities, or foreign currencies. The Fund generally invests in options to hedge against adverse movements in the value of portfolio holdings. The use of such instruments may involve certain additional risks as a result of unanticipated movements in the market. A lack of correlation between the value of an instrument underlying an option and the asset being hedged, or unexpected adverse price movements, could render the Fund’s hedging strategy unsuccessful. In addition, there can be no assurance that a liquid secondary market will exist for any option purchased or sold. The Fund may be subject to counterparty risk, interest rate risk, liquidity risk, equity risk, commodity risk, and currency risk in the normal course of pursuing its investment objective through its investments in options contracts.
Options traded on an exchange are regulated and the terms of the options are standardized. Options traded OTC expose the Fund to counterparty risk in the event that the counterparty does not perform. This risk is mitigated by having a netting arrangement between the Fund and the counterparty and by having the counterparty post collateral to cover the Fund’s exposure to the counterparty.
The Fund may purchase put options to hedge against a decline in the value of its portfolio. By using put options in this way, the Fund will reduce any profit it might otherwise have realized in the underlying security by the amount of the premium paid for the put option and by transaction costs. The Fund may purchase call options to hedge against an
Janus Investment Fund | 25 |
Janus Asia Equity Fund
Notes to Financial Statements (unaudited)
increase in the price of securities that it may buy in the future. The premium paid for the call option plus any transaction costs will reduce the benefit, if any, realized by the Fund upon exercise of the option, and, unless the price of the underlying security rises sufficiently, the option may expire worthless to the Fund. The risk in buying options is that the Fund pays a premium whether or not the options are exercised. Options purchased are reported in the Schedule of Investments (if applicable).
During the period, the Fund purchased call options on foreign exchange rates vs. the U.S. dollar in order to increase foreign currency exposure and reduce U.S. dollar exposure where increasing this exposure via the options market was most attractive.
During the period ended March 31, 2017, the average ending monthly market value amounts on purchased call options is $8,921.
In writing an option, the Fund bears the risk of an unfavorable change in the price of the security underlying the written option. When an option is written, the Fund receives a premium and becomes obligated to sell or purchase the underlying security at a fixed price, upon exercise of the option. Options written are reported as a liability on the Statement of Assets and Liabilities as “Options written, at value” (if applicable). The risk in writing call options is that the Fund gives up the opportunity for profit if the market price of the security increases and the options are exercised. The risk in writing put options is that the Fund may incur a loss if the market price of the security decreases and the options are exercised. The risk in buying options is that the Fund pays a premium whether or not the options are exercised. Exercise of an option written by the Fund could result in the Fund buying or selling a security at a price different from the current market value.
During the period, the Fund wrote call options on foreign exchange rates vs. the U.S. dollar in order to reduce currency risk where reducing this exposure via the foreign exchange forward markets was less attractive.
During the period ended March 31, 2017, the average ending monthly market value amounts on written call options is $2,796.
Written option activity for the period ended March 31, 2017 is indicated in the table below: | ||||
Number of | Premiums | |||
|
| Contracts |
| Received |
Options outstanding at September 30, 2016 | 273,221 | $ 4,454 | ||
Options written | - | - | ||
Options closed | - | - | ||
Options expired | - | - | ||
Options exercised | - | - | ||
Options outstanding at March 31, 2017 |
| 273,221 |
| $ 4,454 |
The following table, grouped by derivative type, provides information about the fair value and location of derivatives within the Statement of Assets and Liabilities as of March 31, 2017.
Fair Value of Derivative Instruments (not accounted for as hedging instruments) as of March 31, 2017 | |||||
|
|
|
| Currency |
|
Asset Derivatives: | |||||
Unaffiliated investments, at value | $ 5,810 | (a) | |||
| |||||
Liability Derivatives: | |||||
Options written, at value | $ 520 | ||||
(a) | Amounts relate to purchased options. | ||||
(b) | Amounts relate to purchased options. | ||||
26 | MARCH 31, 2017 |
Janus Asia Equity Fund
Notes to Financial Statements (unaudited)
The following table provides information about the effect of derivatives and hedging activities on the Fund’s Statement of Operations for the period ended March 31, 2017.
The effect of Derivative Instruments (not accounted for as hedging instruments) on the Statement of Operations for the period ended March 31, 2017 | ||||
Amount of Change in Unrealized Appreciation/Depreciation Recognized on Derivatives | ||||
Derivative | Currency |
| ||
Investments, foreign currency translations and non-interested Trustees' deferred compensation | $ (3) | (a) | ||
Written options contracts | 1,653 | |||
Total | $ 1,650 |
| ||
(a) | Amounts relate to purchased options. | |||
(b) | Amounts relate to purchased options. | |||
Please see the "Change in Unrealized Net Appreciation/Depreciation" section of the Fund’s Statement of Operations.
3. Other Investments and Strategies
Additional Investment Risk
The financial crisis in both the U.S. and global economies over the past several years has resulted, and may continue to result, in a significant decline in the value and liquidity of many securities of issuers worldwide in the equity and fixed-income/credit markets. In response to the crisis, the United States and certain foreign governments, along with the U.S. Federal Reserve and certain foreign central banks, took steps to support the financial markets. The withdrawal of this support, a failure of measures put in place to respond to the crisis, or investor perception that such efforts were not sufficient could each negatively affect financial markets generally, and the value and liquidity of specific securities. In addition, policy and legislative changes in the United States and in other countries continue to impact many aspects of financial regulation. The effect of these changes on the markets, and the practical implications for market participants, including the Fund, may not be fully known for some time. As a result, it may also be unusually difficult to identify both investment risks and opportunities, which could limit or preclude the Fund’s ability to achieve its investment objective. Therefore, it is important to understand that the value of your investment may fall, sometimes sharply, and you could lose money.
The enactment of the Dodd-Frank Wall Street Reform and Consumer Protection Act (the “Dodd-Frank Act”) provided for widespread regulation of financial institutions, consumer financial products and services, broker-dealers, OTC derivatives, investment advisers, credit rating agencies, and mortgage lending, which expanded federal oversight in the financial sector, including the investment management industry. Many provisions of the Dodd-Frank Act remain pending and will be implemented through future rulemaking. Therefore, the ultimate impact of the Dodd-Frank Act and the regulations under the Dodd-Frank Act on the Fund and the investment management industry as a whole, is not yet certain.
A number of countries in the European Union (“EU”) have experienced, and may continue to experience, severe economic and financial difficulties. In particular, many EU nations are susceptible to economic risks associated with high levels of debt, notably due to investments in sovereign debt of countries such as Greece, Italy, Spain, Portugal, and Ireland. Many non-governmental issuers, and even certain governments, have defaulted on, or been forced to restructure, their debts. Many other issuers have faced difficulties obtaining credit or refinancing existing obligations. Financial institutions have in many cases required government or central bank support, have needed to raise capital, and/or have been impaired in their ability to extend credit. As a result, financial markets in the EU experienced extreme volatility and declines in asset values and liquidity. Responses to these financial problems by European governments, central banks, and others, including austerity measures and reforms, may not work, may result in social unrest, and may limit future growth and economic recovery or have other unintended consequences. Further defaults or restructurings by governments and others of their debt could have additional adverse effects on economies, financial markets, and asset valuations around the world. Greece, Ireland, and Portugal have already received one or more "bailouts" from other Eurozone member states, and it is unclear how much additional funding they will require or if additional Eurozone member states will require bailouts in the future. The risk of investing in securities in the European markets may also be
Janus Investment Fund | 27 |
Janus Asia Equity Fund
Notes to Financial Statements (unaudited)
heightened due to the referendum in which the United Kingdom voted to exit the EU (known as "Brexit"). One or more other countries may also abandon the euro and/or withdraw from the EU, placing its currency and banking system in jeopardy.
Certain areas of the world have historically been prone to and economically sensitive to environmental events such as, but not limited to, hurricanes, earthquakes, typhoons, flooding, tidal waves, tsunamis, erupting volcanoes, wildfires or droughts, tornadoes, mudslides, or other weather-related phenomena. Such disasters, and the resulting physical or economic damage, could have a severe and negative impact on the Fund’s investment portfolio and, in the longer term, could impair the ability of issuers in which the Fund invests to conduct their businesses as they would under normal conditions. Adverse weather conditions may also have a particularly significant negative effect on issuers in the agricultural sector and on insurance companies that insure against the impact of natural disasters.
China A Shares
The Chinese government may permit a foreign investor to invest in China A Shares as a licensed Qualified Foreign Institutional Investor (“QFII”). QFII licenses are granted by the China Securities Regulatory Commission and an investment quota is granted by the State Administration of Foreign Exchange. Janus Capital has been granted a QFII license and an investment quota.
People’s Republic of China (“PRC”) regulations require QFIIs to entrust assets held in the PRC and to interact with government agencies through a China-based qualified custodian bank. Assets attributable to clients of Janus Capital will be held by the custodian in foreign exchange accounts and securities accounts in the joint name of Janus Capital and its clients, although the terms of the custody agreement make clear that the contents of the accounts belong to the clients, and not to Janus Capital.
During the period ended March 31, 2017, Janus Capital, in its capacity as a QFII, invested in China A Shares on behalf of the Fund. With respect to direct China A Shares investments, as a general matter, any capital invested and profits generated cannot be repatriated for a minimum of one year. Repatriation of any invested capital is subject to approval by the regulator. Additionally, any repatriation of profits would be subject to an audit by a registered accountant in China, and subject to regulatory approval. In light of the foregoing, the Fund’s investment in China A Shares would be subject to the Fund’s limit of investing up to 15% of its net assets in illiquid investments. Current Chinese tax law is unclear whether capital gains realized on the Fund’s investments in China A shares will be subject to tax. Because management believes it is more likely than not that Chinese capital gains tax ultimately will not be imposed, the Fund does not accrue for such taxes.
As of March 31, 2017, the Fund has available investment quota of $24,001. The Fund is subject to certain restrictions and administrative processes relating to its ability to repatriate cash balances and may incur substantial delays in gaining access to its assets.
Counterparties
Fund transactions involving a counterparty are subject to the risk that the counterparty or a third party will not fulfill its obligation to the Fund (“counterparty risk”). Counterparty risk may arise because of the counterparty’s financial condition (i.e., financial difficulties, bankruptcy, or insolvency), market activities and developments, or other reasons, whether foreseen or not. A counterparty’s inability to fulfill its obligation may result in significant financial loss to the Fund. The Fund may be unable to recover its investment from the counterparty or may obtain a limited recovery, and/or recovery may be delayed. The extent of the Fund’s exposure to counterparty risk with respect to financial assets and liabilities approximates its carrying value. See the "Offsetting Assets and Liabilities" section of this Note for further details.
The Fund may be exposed to counterparty risk through participation in various programs, including, but not limited to, lending its securities to third parties, cash sweep arrangements whereby the Fund’s cash balance is invested in one or more types of cash management vehicles, as well as investments in, but not limited to, repurchase agreements, debt securities, and derivatives, including various types of swaps, futures and options. The Fund intends to enter into financial transactions with counterparties that Janus Capital believes to be creditworthy at the time of the transaction. There is always the risk that Janus Capital’s analysis of a counterparty’s creditworthiness is incorrect or may change due to market conditions. To the extent that the Fund focuses its transactions with a limited number of counterparties, it will have greater exposure to the risks associated with one or more counterparties.
28 | MARCH 31, 2017 |
Janus Asia Equity Fund
Notes to Financial Statements (unaudited)
Emerging Market Investing
The Fund may invest in securities of issuers or companies from or with exposure to one or more “developing countries” or “emerging market countries.” To the extent that the Fund invests a significant amount of its assets in one or more of these countries, its returns and net asset value may be affected to a large degree by events and economic conditions in such countries. The risks of foreign investing are heightened when investing in emerging markets, which may result in the price of investments in emerging markets experiencing sudden and sharp price swings. In many developing markets, there is less government supervision and regulation of business and industry practices (including the potential lack of strict finance and accounting controls and standards), stock exchanges, brokers, and listed companies, making these investments potentially more volatile in price and less liquid than investments in developed securities markets, resulting in greater risk to investors. There is a risk in developing countries that a future economic or political crisis could lead to price controls, forced mergers of companies, expropriation or confiscatory taxation, imposition or enforcement of foreign ownership limits, seizure, nationalization, sanctions or imposition of restrictions by various governmental entities on investment and trading, or creation of government monopolies, any of which may have a detrimental effect on the Fund’s investments. In addition, the Fund’s investments may be denominated in foreign currencies and therefore, changes in the value of a country’s currency compared to the U.S. dollar may affect the value of the Fund’s investments. To the extent that the Fund invests a significant portion of its assets in the securities of issuers in or companies of a single country or region, it is more likely to be impacted by events or conditions affecting that country or region, which could have a negative impact on the Fund’s performance. Additionally, foreign and emerging market risks, including, but not limited to, price controls, expropriation or confiscatory taxation, imposition or enforcement of foreign ownership limits, nationalization, and restrictions on repatriation of assets may be heightened to the extent the Fund invests in Chinese local market securities.
Offsetting Assets and Liabilities
The Fund presents gross and net information about transactions that are either offset in the financial statements or subject to an enforceable master netting arrangement or similar agreement with a designated counterparty, regardless of whether the transactions are actually offset in the Statement of Assets and Liabilities.
In order to better define its contractual rights and to secure rights that will help the Fund mitigate its counterparty risk, the Fund has entered into an International Swaps and Derivatives Association, Inc. Master Agreement (“ISDA Master Agreement”) or similar agreement with its derivative contract counterparties. An ISDA Master Agreement is a bilateral agreement between the Fund and a counterparty that governs OTC derivatives and forward foreign currency exchange contracts and typically contains, among other things, collateral posting terms and netting provisions in the event of a default and/or termination event. Under an ISDA Master Agreement, in the event of a default and/or termination event, the Fund may offset with each counterparty certain derivative financial instruments’ payables and/or receivables with collateral held and/or posted and create one single net payment. For financial reporting purposes, the Fund does not offset certain derivative financial instruments’ payables and receivables and related collateral on the Statement of Assets and Liabilities.
The following tables present gross amounts of recognized assets and/or liabilities and the net amounts after deducting collateral that has been pledged by counterparties or has been pledged to counterparties (if applicable). For corresponding information grouped by type of instrument, see either the “Fair Value of Derivative Instruments as of March 31, 2017” table located in Note 2 of these Notes to Financial Statements and/or the Fund’s Schedule of Investments.
Offsetting of Financial Assets and Derivative Assets | ||||||||
Gross Amounts | ||||||||
of Recognized | Offsetting Asset | Collateral | ||||||
Counterparty | Assets | or Liability(a) | Pledged(b) | Net Amount | ||||
Deutsche Bank AG | $ | 16,195 | $ | — | $ | (16,195) | $ | — |
Goldman Sachs International | 5,810 | (520) | — | 5,290 | ||||
Total | $ | 22,005 | $ | (520) | $ | (16,195) | $ | 5,290 |
Janus Investment Fund | 29 |
Janus Asia Equity Fund
Notes to Financial Statements (unaudited)
Offsetting of Financial Liabilities and Derivative Liabilities | |||||||||
Gross Amounts | |||||||||
of Recognized | Offsetting Asset | Collateral | |||||||
Counterparty | Liabilities | or Liability(a) | Pledged(b) | Net Amount | |||||
Goldman Sachs International | $ | 520 | $ | (520) | $ | — | $ | — | |
(a) | Represents the amount of assets or liabilities that could be offset with the same counterparty under master netting or similar agreements that management elects not to offset on the Statement of Assets and Liabilities. | ||||||||
(b) | Collateral pledged is limited to the net outstanding amount due to/from an individual counterparty. The actual collateral amounts pledged may exceed these amounts and may fluctuate in value. | ||||||||
Deutsche Bank AG acts as securities lending agent and a limited purpose custodian or subcustodian to receive and disburse cash balances and cash collateral, hold short-term investments, hold collateral, and perform other custodian functions in accordance with the Agency Securities Lending and Repurchase Agreement. For financial reporting purposes, the {Fund/Portfolio} does not offset financial instruments’ payables and receivables and related collateral on the Statement of Assets and Liabilities.Securities on loan will be continuously secured by collateral which may consist of cash, U.S. Government securities, domestic and foreign short-term debt instruments, letters of credit, time deposits, repurchase agreements, money market mutual funds or other money market accounts, or such other collateral as permitted by the SEC. The value of the collateral must be at least 102% of the market value of the loaned securities that are denominated in U.S. dollars and 105% of the market value of the loaned securities that are not denominated in U.S. dollars. Upon receipt of cash collateral, Janus Capital intends to invest the cash collateral in a cash management vehicle for which Janus Capital serves as investment adviser, Janus Cash Collateral Fund LLC. Loaned securities and related collateral are marked-to-market each business day based upon the market value of the loaned securities at the close of business, employing the most recent available pricing information. Collateral levels are then adjusted based on this mark-to-market evaluation.
The Fund may require the counterparty to pledge securities as collateral daily (based on the daily valuation of the financial asset) if the Fund has a net aggregate unrealized gain on OTC derivative contracts with a particular counterparty. The Fund may deposit cash as collateral with the counterparty and/or custodian daily (based on the daily valuation of the financial asset) if the Fund has a net aggregate unrealized loss on OTC derivative contracts with a particular counterparty. The collateral amounts are subject to minimum exposure requirements and initial margin requirements. Collateral amounts are monitored and subsequently adjusted up or down as valuations fluctuate by at least the minimum exposure requirement. Collateral may reduce the risk of loss.
Real Estate Investing
The Fund may invest in equity and debt securities of real estate-related companies. Such companies may include those in the real estate industry or real estate-related industries. These securities may include common stocks, corporate bonds, preferred stocks, and other equity securities, including, but not limited to, mortgage-backed securities, real estate-backed securities, securities of REITs and similar REIT-like entities. A REIT is a trust that invests in real estate-related projects, such as properties, mortgage loans, and construction loans. REITs are generally categorized as equity, mortgage, or hybrid REITs. A REIT may be listed on an exchange or traded OTC.
Securities Lending
Under procedures adopted by the Trustees, the Fund may seek to earn additional income by lending securities to qualified parties. Deutsche Bank AG acts as securities lending agent and a limited purpose custodian or subcustodian to receive and disburse cash balances and cash collateral, hold short-term investments, hold collateral, and perform other custodian functions. The Fund may lend portfolio securities in an amount equal to up to 1/3 of its total assets as determined at the time of the loan origination. There is the risk of delay in recovering a loaned security or the risk of loss in collateral rights if the borrower fails financially. In addition, Janus Capital makes efforts to balance the benefits and risks from granting such loans. All loans will be continuously secured by collateral which may consist of cash, U.S. Government securities, domestic and foreign short-term debt instruments, letters of credit, time deposits, repurchase agreements, money market mutual funds or other money market accounts, or such other collateral as permitted by the SEC. If the Fund is unable to recover a security on loan, the Fund may use the collateral to purchase replacement securities in the market. There is a risk that the value of the collateral could decrease below the cost of the replacement security by the time the replacement investment is made, resulting in a loss to the Fund.
30 | MARCH 31, 2017 |
Janus Asia Equity Fund
Notes to Financial Statements (unaudited)
Upon receipt of cash collateral, Janus Capital may invest it in affiliated or non-affiliated cash management vehicles, whether registered or unregistered entities, as permitted by the 1940 Act and rules promulgated thereunder. Janus Capital currently intends to invest the cash collateral in a cash management vehicle for which Janus Capital serves as investment adviser, Janus Cash Collateral Fund LLC. An investment in Janus Cash Collateral Fund LLC is generally subject to the same risks that shareholders experience when investing in similarly structured vehicles, such as the potential for significant fluctuations in assets as a result of the purchase and redemption activity of the securities lending program, a decline in the value of the collateral, and possible liquidity issues. Such risks may delay the return of the cash collateral and cause the Fund to violate its agreement to return the cash collateral to a borrower in a timely manner. As adviser to the Fund and Janus Cash Collateral Fund LLC, Janus Capital has an inherent conflict of interest as a result of its fiduciary duties to both the Fund and Janus Cash Collateral Fund LLC. Additionally, Janus Capital receives an investment advisory fee of 0.05% for managing Janus Cash Collateral Fund LLC, but it may not receive a fee for managing certain other affiliated cash management vehicles in which the Fund may invest, and therefore may have an incentive to allocate preferred investment opportunities to investment vehicles for which it is receiving a fee.
The value of the collateral must be at least 102% of the market value of the loaned securities that are denominated in U.S. dollars and 105% of the market value of the loaned securities that are not denominated in U.S. dollars. Loaned securities and related collateral are marked-to-market each business day based upon the market value of the loaned securities at the close of business, employing the most recent available pricing information. Collateral levels are then adjusted based on this mark-to-market evaluation.
The cash collateral invested by Janus Capital is disclosed in the Schedule of Investments (if applicable). Income earned from the investment of the cash collateral, net of rebates paid to, or fees paid by, borrowers and less the fees paid to the lending agent are included as “Affiliated securities lending income, net” on the Statement of Operations. As of March 31, 2017, securities lending transactions accounted for as secured borrowings with an overnight and continuous contractual maturity are $16,195 for equity securities. Gross amounts of recognized liabilities for securities lending (collateral received) as of March 31, 2017 is $17,100, resulting in the net amount due to the counterparty of $905.
4. Investment Advisory Agreements and Other Transactions with Affiliates
The Fund pays Janus Capital an investment advisory fee which is calculated daily and paid monthly. The Fund’s "base" fee rate prior to any performance adjustment (expressed as an annual rate) is 0.92%.
The investment advisory fee rate is determined by calculating a base fee and applying a performance adjustment. The base fee rate is the same as the contractual investment advisory fee rate. The performance adjustment either increases or decreases the base fee depending on how well the Fund has performed relative to its benchmark index. The Fund's benchmark index used in the calculation is the MSCI All Country Asia ex-Japan Index.
The calculation of the performance adjustment applies as follows:
Investment Advisory Fee = Base Fee Rate +/- Performance Adjustment
The investment advisory fee rate paid to Janus Capital by the Fund consists of two components: (1) a base fee calculated by applying the contractual fixed rate of the advisory fee to the Fund’s average daily net assets during the previous month (“Base Fee Rate”), plus or minus (2) a performance-fee adjustment (“Performance Adjustment”) calculated by applying a variable rate of up to 0.15% (positive or negative) to the Fund’s average daily net assets during the applicable performance measurement period, which is generally the previous 36 months.
The Fund’s prospectuses and statement(s) of additional information contain additional information about performance-based fees. The amount shown as advisory fees on the Statement of Operations reflects the Base Fee Rate plus/minus any Performance Adjustment. For the period ended March 31, 2017, the performance adjusted investment advisory fee rate before any waivers and/or reimbursements of expenses is 1.06%.
Janus Capital Singapore Pte. Limited (“Janus Singapore”) serves as subadviser to the Fund. Janus Singapore provides day-to-day management of the Fund’s portfolio operations. Janus Singapore is an indirect wholly-owned subsidiary of Janus Capital. Janus Capital pays Janus Singapore a fee equal to 50% of the advisory fee paid by the Fund (calculated after any applicable performance fee adjustment, fee waivers, and expense reimbursements). The subadvisory fee paid by Janus Capital to Janus Singapore adjusts up or down based on the Fund’s performance relative to the Fund’s benchmark index over the performance measurement period.
Janus Investment Fund | 31 |
Janus Asia Equity Fund
Notes to Financial Statements (unaudited)
Janus Capital has contractually agreed to waive the advisory fee payable by the Fund or reimburse expenses in an amount equal to the amount, if any, that the Fund’s normal operating expenses, including the investment advisory fee, but excluding any performance adjustments to management fees, the 12b-1 distribution and shareholder servicing fees (applicable to Class A Shares, Class C Shares, and Class S Shares), transfer agent fees and expenses payable pursuant to the Transfer Agency Agreement, brokerage commissions, interest, dividends, taxes, acquired fund fees and expenses, and extraordinary expenses, exceed the annual rate of 1.24% of the Fund’s average daily net assets. Janus Capital has agreed to continue the waiver until at least February 1, 2018. The previous expense limit (until February 1, 2017) was 1.04%. If applicable, amounts reimbursed to the Fund by Janus Capital are disclosed as “Excess Expense Reimbursement” on the Statement of Operations.
Janus Services LLC (“Janus Services”), a wholly-owned subsidiary of Janus Capital, is the Fund’s transfer agent. In addition, Janus Services provides or arranges for the provision of certain other administrative services including, but not limited to, recordkeeping, accounting, order processing, and other shareholder services for the Fund. Janus Services is not compensated for its services related to the shares, except for out-of-pocket costs. These amounts are disclosed as “Other transfer agent fees and expenses” on the Statement of Operations.
Certain, but not all, intermediaries may charge administrative fees (such as networking and omnibus) to investors in Class A Shares, Class C Shares, and Class I Shares for administrative services provided on behalf of such investors. These administrative fees are paid by the Class A Shares, Class C Shares, and Class I Shares of the Fund to Janus Services, which uses such fees to reimburse intermediaries. Consistent with the Transfer Agency Agreement between Janus Services and the Fund, Janus Services may negotiate the level, structure, and/or terms of the administrative fees with intermediaries requiring such fees on behalf of the Fund. Janus Capital and its affiliates benefit from an increase in assets that may result from such relationships. The Funds’ Trustees have set limits on fees that the Funds may incur with respect to administrative fees paid for omnibus or networked accounts. Such limits are subject to change by the Trustees in the future. These amounts are disclosed as “Transfer agent networking and omnibus fees” on the Statement of Operations.
The Fund’s Class D Shares pay an administrative services fee at an annual rate of 0.12% of the average daily net assets of Class D Shares for shareholder services provided by Janus Services. Janus Services provides or arranges for the provision of shareholder services including, but not limited to, recordkeeping, accounting, answering inquiries regarding accounts, transaction processing, transaction confirmations, and the mailing of prospectuses and shareholder reports. These amounts are disclosed as “Transfer agent administrative fees and expenses” on the Statement of Operations.
Janus Services receives an administrative services fee at an annual rate of up to 0.25% of the average daily net assets of the Fund’s Class S Shares and Class T Shares for providing or procuring administrative services to investors in Class S Shares and Class T Shares of the Fund. Janus Services expects to use all or a significant portion of this fee to compensate retirement plan service providers, broker-dealers, bank trust departments, financial advisors, and other financial intermediaries for providing these services. Janus Services or its affiliates may also pay fees for services provided by intermediaries to the extent the fees charged by intermediaries exceed the 0.25% of net assets charged to Class S Shares and Class T Shares of the Fund. Janus Services may keep certain amounts retained for reimbursement of out-of-pocket costs incurred for servicing clients of Class S Shares and Class T Shares. These amounts are disclosed as “Transfer agent administrative fees and expenses” on the Statement of Operations.
Services provided by these financial intermediaries may include, but are not limited to, recordkeeping, subaccounting, order processing, providing order confirmations, periodic statements, forwarding prospectuses, shareholder reports, and other materials to existing customers, answering inquiries regarding accounts, and other administrative services. Order processing includes the submission of transactions through the National Securities Clearing Corporation (“NSCC”) or similar systems, or those processed on a manual basis with Janus Capital.
Janus Services is compensated for its services related to the Fund’s Class D Shares. In addition to the administrative fees discussed above, Janus Services receives reimbursement for out-of-pocket costs it incurs for serving as transfer agent and providing, or arranging for, servicing to shareholders. These amounts are disclosed as “Other transfer agent fees and expenses” on the Statement of Operations.
Under a distribution and shareholder servicing plan (the “Plan”) adopted in accordance with Rule 12b-1 under the 1940 Act, the Fund pays the Trust’s distributor, Janus Distributors LLC (“Janus Distributors”), a wholly-owned subsidiary of Janus Capital, a fee for the sale and distribution and/or shareholder servicing of the Shares at an annual rate of up to
32 | MARCH 31, 2017 |
Janus Asia Equity Fund
Notes to Financial Statements (unaudited)
0.25% of the Class A Shares’ average daily net assets, of up to 1.00% of the Class C Shares’ average daily net assets, and of up to 0.25% of the Class S Shares’ average daily net assets. Under the terms of the Plan, the Trust is authorized to make payments to Janus Distributors for remittance to retirement plan service providers, broker-dealers, bank trust departments, financial advisors, and other financial intermediaries, as compensation for distribution and/or shareholder services performed by such entities for their customers who are investors in the Fund. These amounts are disclosed as “12b-1 Distribution and shareholder servicing fees” on the Statement of Operations. Payments under the Plan are not tied exclusively to actual 12b-1 distribution and shareholder service expenses, and the payments may exceed 12b-1 distribution and shareholder service expenses actually incurred. If any of the Fund’s actual 12b-1 distribution and shareholder service expenses incurred during a calendar year are less than the payments made during a calendar year, the Fund will be refunded the difference. Refunds, if any, are included in “12b-1 Distribution fees and shareholder servicing fees” in the Statement of Operations.
Janus Capital furnishes certain administration, compliance, and accounting services for the Fund and is reimbursed by the Fund for certain of its costs in providing those services (to the extent Janus Capital seeks reimbursement and such costs are not otherwise waived). In addition, employees of Janus Capital and/or its affiliates may serve as officers of the Trust. The Fund also pays for some or all of the salaries, fees, and expenses of certain Janus Capital employees and Fund officers, with respect to certain specified administration functions they perform on behalf of the Fund. The Fund pays these costs based on out-of-pocket expenses incurred by Janus Capital, and these costs are separate and apart from advisory fees and other expenses paid in connection with the investment advisory services Janus Capital provides to the Fund. These amounts are disclosed as “Fund administration fees” on the Statement of Operations. Some expenses related to compensation payable to the Fund's Chief Compliance Officer and compliance staff are shared with the Fund. Total compensation of $159,020 was paid to the Chief Compliance Officer and certain compliance staff by the Trust during the period ended March 31, 2017. The Fund's portion is reported as part of “Other expenses” on the Statement of Operations.
The Board of Trustees has adopted a deferred compensation plan (the “Deferred Plan”) for independent Trustees to elect to defer receipt of all or a portion of the annual compensation they are entitled to receive from the Fund. All deferred fees are credited to an account established in the name of the Trustees. The amounts credited to the account then increase or decrease, as the case may be, in accordance with the performance of one or more of the Janus funds that are selected by the Trustees. The account balance continues to fluctuate in accordance with the performance of the selected fund or funds until final payment of all amounts are credited to the account. The fluctuation of the account balance is recorded by the Fund as unrealized appreciation/(depreciation) and is included as of March 31, 2017 on the Statement of Assets and Liabilities in the asset, “Non-interested Trustees’ deferred compensation,” and liability, “Non-interested Trustees’ deferred compensation fees.” Additionally, the recorded unrealized appreciation/(depreciation) is included in “Unrealized net appreciation/(depreciation) of investments, foreign currency translations and non-interested Trustees’ deferred compensation” on the Statement of Assets and Liabilities. Deferred compensation expenses for the period ended March 31, 2017 are included in “Non-interested Trustees’ fees and expenses” on the Statement of Operations. Trustees are allowed to change their designation of mutual funds from time to time. Amounts will be deferred until distributed in accordance with the Deferred Plan. Deferred fees of $195,413 were paid by the Trust to a Trustee under the Deferred Plan during the period ended March 31, 2017.
Pursuant to the provisions of the 1940 Act and related rules, the Fund may participate in an affiliated or nonaffiliated cash sweep program. In the cash sweep program, uninvested cash balances of the Fund may be used to purchase shares of affiliated or nonaffiliated money market funds or cash management pooled investment vehicles. The Fund is eligible to participate in the cash sweep program (the “Investing Funds”). As adviser, Janus Capital has an inherent conflict of interest because of its fiduciary duties to the affiliated money market funds or cash management pooled investment vehicles and the Investing Funds. Janus Cash Liquidity Fund LLC is an affiliated unregistered cash management pooled investment vehicle that invests primarily in highly-rated short-term fixed-income securities. Janus Cash Liquidity Fund LLC currently maintains a NAV of $1.00 per share and distributes income daily in a manner consistent with a registered product compliant with Rule 2a-7 under the 1940 Act. There are no restrictions on the Fund's ability to withdraw investments from Janus Cash Liquidity Fund LLC at will, and there are no unfunded capital commitments due from the Fund to Janus Cash Liquidity Fund LLC. The units of Janus Cash Liquidity Fund LLC are not charged any management fee, sales charge or service fee.
Any purchases and sales, realized gains/losses and recorded dividends from affiliated investments during the period ended March 31, 2017 can be found in a table located in the Notes to Schedule of Investments and Other Information.
Janus Investment Fund | 33 |
Janus Asia Equity Fund
Notes to Financial Statements (unaudited)
Class A Shares include a 5.75% upfront sales charge of the offering price of the Fund. The sales charge is allocated between Janus Distributors and financial intermediaries. During the period ended March 31, 2017, Janus Distributors retained upfront sales charges of $442.
A contingent deferred sales charge (“CDSC”) of 1.00% will be deducted with respect to Class A Shares purchased without a sales load and redeemed within 12 months of purchase, unless waived. Any applicable CDSC will be 1.00% of the lesser of the original purchase price or the value of the redemption of the Class A Shares redeemed. There were no CDSCs paid by redeeming shareholders of Class A Shares to Janus Distributors during the period ended March 31, 2017.
A CDSC of 1.00% will be deducted with respect to Class C Shares redeemed within 12 months of purchase, unless waived. Any applicable CDSC will be 1.00% of the lesser of the original purchase price or the value of the redemption of the Class C Shares redeemed. There were no CDSCs paid by redeeming shareholders of Class C Shares during the period ended March 31, 2017.
As of March 31, 2017, shares of the Fund were owned by Janus Capital and/or other funds advised by Janus Capital, as indicated in the table below:
Class | % of Class Owned |
| % of Fund Owned |
| ||
Class A Shares | 36 | % | - | %* | ||
Class C Shares | 89 | 2 | ||||
Class D Shares | - | - | ||||
Class I Shares | 91 | 42 | ||||
Class S Shares | 97 | 2 | ||||
Class T Shares | - | - | ||||
* | Less than 0.50% | |||||
In addition, other shareholders, including other funds, individuals, accounts, as well as the Fund’s portfolio manager(s) and/or investment personnel, may from time to time own (beneficially or of record) a significant percentage of the Fund’s Shares and can be considered to “control” the Fund when that ownership exceeds 25% of the Fund’s assets (and which may differ from control as determined in accordance with accounting principles generally accepted in the United States of America).
The Fund is permitted to purchase or sell securities (“cross-trade”) between itself and other funds or accounts managed by Janus Capital Management LLC in accordance with Rule 17a-7 under the Investment Company Act of 1940 (“Rule 17a-7”), when the transaction is consistent with the investment objectives and policies of the Fund and in accordance with the Internal Cross Trade Procedures adopted by the Trust’s Board of Trustees. These procedures have been designed to ensure that any cross-trade of securities by the Fund from or to another fund or account that is or could be considered an affiliate of the Fund under certain limited circumstances by virtue of having a common investment adviser, common Officer, or common Trustee complies with Rule 17a-7. Under these procedures, each cross-trade is effected at the current market price to save costs where allowed. During the period ended March 31, 2017, the Fund engaged in cross trades amounting to $15,095 in purchases.
5. Federal Income Tax
Income and capital gains distributions are determined in accordance with income tax regulations that may differ from accounting principles generally accepted in the United States of America. These differences are due to differing treatments for items such as net short-term gains, deferral of wash sale losses, foreign currency transactions, net investment losses, and capital loss carryovers.
The Fund has elected to treat gains and losses on forward foreign currency contracts as capital gains and losses, if applicable. Other foreign currency gains and losses on debt instruments are treated as ordinary income for federal income tax purposes pursuant to Section 988 of the Internal Revenue Code.
Accumulated capital losses noted below represent net capital loss carryovers, as of September 30, 2016, that may be available to offset future realized capital gains and thereby reduce future taxable gains distributions. The following table shows these capital loss carryovers.
34 | MARCH 31, 2017 |
Janus Asia Equity Fund
Notes to Financial Statements (unaudited)
Capital Loss Carryover Schedule | ||||
For the year ended September 30, 2016 | ||||
No Expiration | ||||
Short-Term | Long-Term | Accumulated | ||
$ (675,588) | $ (300,554) | $ (976,142) | ||
The aggregate cost of investments and the composition of unrealized appreciation and depreciation of investment securities for federal income tax purposes as of March 31, 2017 are noted below.
Unrealized appreciation and unrealized depreciation in the table below exclude appreciation/depreciation on foreign currency translations. The primary differences between book and tax appreciation or depreciation of investments are wash sale loss deferrals, investments in partnerships and investments in passive foreign investment companies.
Federal Tax Cost | Unrealized | Unrealized
| Net Tax Appreciation/ |
$ 19,670,041 | $ 1,931,896 | $ (444,280) | $ 1,487,616 |
6. Capital Share Transactions
Period ended March 31, 2017 | Year ended September 30, 2016 | |||||
Shares | Amount | Shares | Amount | |||
Class A Shares: | ||||||
Shares sold | 6,574 | $ 60,072 | 12,417 | $ 104,455 | ||
Reinvested dividends and distributions | 348 | 3,069 | 1,929 | 16,084 | ||
Shares repurchased | (7,380) | (70,843) | (29,367) | (245,789) | ||
Net Increase/(Decrease) | (458) | $ (7,702) |
| (15,021) | $ (125,250) | |
Class C Shares: | ||||||
Shares sold | 91 | $ 828 | 1,069 | $ 9,613 | ||
Reinvested dividends and distributions | 197 | 1,728 | 2,052 | 17,051 | ||
Shares repurchased | (4,287) | (40,407) | (2,390) | (19,613) | ||
Net Increase/(Decrease) | (3,999) | $ (37,851) |
| 731 | $ 7,051 | |
Class D Shares: | ||||||
Shares sold | 551,198 | $5,290,806 | 135,524 | $1,206,585 | ||
Reinvested dividends and distributions | 7,791 | 69,185 | 28,471 | 238,587 | ||
Shares repurchased | (212,210) | (1,968,748) | (279,114) | (2,355,372) | ||
Net Increase/(Decrease) | 346,779 | $3,391,243 |
| (115,119) | $ (910,200) | |
Class I Shares: | ||||||
Shares sold | 671,737 | $6,750,248 | 27,435 | $ 219,281 | ||
Reinvested dividends and distributions | 4,167 | 36,957 | 14,104 | 118,330 | ||
Shares repurchased | (39,129) | (369,455) | (56,353) | (476,901) | ||
Net Increase/(Decrease) | 636,775 | $6,417,750 |
| (14,814) | $ (139,290) | |
Class S Shares: | ||||||
Shares sold | 1,112 | $ 10,000 | - | $ - | ||
Reinvested dividends and distributions | 438 | 3,863 | 1,718 | 14,332 | ||
Shares repurchased | - | - | - | - | ||
Net Increase/(Decrease) | 1,550 | $ 13,863 |
| 1,718 | $ 14,332 | |
Class T Shares: | ||||||
Shares sold | 83,476 | $ 786,900 | 238,960 | $2,070,702 | ||
Reinvested dividends and distributions | 507 | 4,453 | 2,486 | 20,557 | ||
Shares repurchased | (57,497) | (538,138) | (253,950) | (2,188,617) | ||
Net Increase/(Decrease) | 26,486 | $ 253,215 |
| (12,504) | $ (97,358) | |
Janus Investment Fund | 35 |
Janus Asia Equity Fund
Notes to Financial Statements (unaudited)
7. Purchases and Sales of Investment Securities
For the period ended March 31, 2017, the aggregate cost of purchases and proceeds from sales of investment securities (excluding any short-term securities, short-term options contracts, and in-kind transactions) was as follows:
Purchases of | Proceeds from Sales | Purchases
of Long- | Proceeds
from Sales |
$12,875,325 | $ 2,569,106 | $ - | $ - |
8. Merger Related Matters
On October 3, 2016, Janus Capital Group Inc. (“JCGI”), the direct parent of Janus Capital, and Henderson Group plc (“Henderson”) announced that they had entered into an Agreement and Plan of Merger (“Merger Agreement”) relating to the strategic combination of Henderson and JCGI (the “Merger”). Pursuant to the Merger Agreement, a newly formed, direct wholly-owned subsidiary of Henderson will merge with and into JCGI, with JCGI as the surviving corporation and a direct wholly-owned subsidiary of Henderson. The Merger is expected to close in the second quarter of 2017, subject to requisite shareholder and regulatory approvals.
The consummation of the Merger may be deemed to cause an “assignment” (as defined in the 1940 Act) of the advisory agreement between the Fund and Janus Capital in effect as of the date of this Report. In addition, the consummation of the Merger may be deemed to cause an assignment of the sub-advisory agreement between Janus Capital and Janus Singapore in effect as of the date of this Report. As a result, the consummation of the Merger may cause such investment advisory agreement and investment sub-advisory agreement to terminate automatically in accordance with their respective terms.
On December 8, 2016, the Trustees approved, subject to shareholder approval, a new investment advisory agreement between the Fund and Janus Capital in order to permit Janus Capital to continue providing advisory services to the Fund following the closing of the Merger (“Post-Merger Advisory Agreement”). Also on December 8, 2016, the Trustees approved, subject to shareholder approval, a new investment sub-advisory agreement between Janus Capital and Henderson Investment Management Limited (“HIML”) (“Post-Merger Sub-Advisory Agreement”). At the same meeting, the Trustees approved submitting the Post-Merger Advisory Agreement and Post-Merger Sub-Advisory Agreement, among other proposals, to Fund shareholders for approval.
9. Subsequent Event
Management has evaluated whether any events or transactions occurred subsequent to March 31, 2017 and through the date of issuance of the Fund’s financial statements and determined that there were no material events or transactions that would require recognition or disclosure in the Fund’s financial statements other than the following:
Special Meeting(s) of Shareholders were held on April 6, 2017, and adjourned and reconvened on April 18, 2017, April 25, 2017, April 28, 2017, and May 17, 2017 (together, the “Meeting”).
Approval of Advisory and Sub-Advisory Agreements
At the Meeting, Fund shareholders approved the Post-Merger Advisory Agreement and Post-Merger Sub-Advisory Agreement, both of which will take effect upon the consummation of the Merger. At that time, HIML will become the subadviser to the Fund and will replace Janus Singapore as subadviser to the Fund. Janus Capital will pay HIML a sub-advisory fee from its investment advisory fee for managing the Fund.
Election of Trustees
At the Meeting, shareholders of each series of the Trust, including the Fund, voting together as a single class, approved the election of Diane L. Wallace to the Trust’s Board of Trustees. Ms. Wallace currently serves as a trustee of certain mutual funds advised by Henderson Global Investors (North America) Inc., a subsidiary of Henderson. Upon the consummation of the Merger, Ms. Wallace will join the Trust’s Board of Trustees.
Manager-of-Managers Structure
At the Meeting, Fund shareholders also approved a manager-of-managers structure for the Fund. The Trust and Janus Capital have received an exemptive order from the Securities and Exchange Commission that permits Janus Capital,
36 | MARCH 31, 2017 |
Janus Asia Equity Fund
Notes to Financial Statements (unaudited)
subject to the approval of the Trustees, to appoint or replace certain subadvisers to manage all or a portion of the Fund’s assets and enter into, amend, or terminate a sub-advisory agreement with certain subadvisers without obtaining shareholder approval (a “manager-of-managers structure”). The manager-of-managers structure applies to subadvisers that are not affiliated with the Trust or Janus Capital (“non-affiliated subadvisers”), as well as any subadviser that is an indirect or direct “wholly-owned subsidiary” (as such term is defined by the 1940 Act) of Janus Capital or of another company that, indirectly or directly, wholly owns Janus Capital (collectively, “wholly-owned subadvisers”). To the extent that the Fund’s assets are allocated to one or more subadvisers, Janus Capital, subject to oversight and supervision by the Trustees, would have the responsibility to oversee such subadviser(s) and to recommend for approval by the Trustees, the hiring, termination, and replacement of a subadviser for the Fund. In the event that Janus Capital hires a subadviser pursuant to the manager-of-managers structure, the Fund would provide shareholders with information about the subadviser and sub-advisory agreement within 90 days.
Janus Investment Fund | 37 |
Janus Asia Equity Fund
Additional Information (unaudited)
Proxy Voting Policies and Voting Record
A description of the policies and procedures that the Fund uses to determine how to vote proxies relating to its portfolio securities is available without charge: (i) upon request, by calling 1-800-525-0020 (toll free); (ii) on the Fund’s website at janus.com/proxyvoting; and (iii) on the SEC’s website at http://www.sec.gov. Additionally, information regarding the Fund’s proxy voting record for the most recent twelve-month period ended June 30 is also available, free of charge, through janus.com/proxyvoting and from the SEC’s website at http://www.sec.gov.
Quarterly Portfolio Holdings
The Fund files its complete portfolio holdings (schedule of investments) with the SEC for the first and third quarters of each fiscal year on Form N-Q within 60 days of the end of such fiscal quarter. The Fund’s Form N-Q: (i) is available on the SEC’s website at http://www.sec.gov; (ii) may be reviewed and copied at the SEC’s Public Reference Room in Washington, D.C. (information on the Public Reference Room may be obtained by calling 1-800-SEC-0330); and (iii) is available without charge, upon request, by calling Janus at 1-800-525-0020 (toll free).
Approval of Advisory and Sub-Advisory Agreements with Janus and Janus Affiliates during the Period
On September 15, 2016, Janus Capital Group Inc. (“Janus”) advised the Trustees of Janus Investment Fund (the “Trust”), each of whom serves as an “independent” Trustee (the “Board” or the “Trustees”), of its intent to seek a strategic combination of its advisory business with Henderson Group plc (“Henderson”). The Board met with the Chief Executive Officer of Janus, who outlined the proposed combination and the potential benefits to Janus Capital Management LLC (“Janus Capital”) and each Fund of the Trust (each, a “Fund” and collectively, the “Funds”). Subsequent to the September 15, 2016 meeting, the Trustees identified a list of basic principles, which they believed should serve as the foundation for their review of the organizational, operational and strategic issues involved with any potential change in control of Janus Capital, the investment adviser to the Funds. These basic principles were communicated to Janus Capital on September 27, 2016, and were intended to be shared with Henderson. On October 3, 2016, Janus announced that it had entered into a definitive Agreement and Plan of Merger with Henderson pursuant to which Janus and Henderson agreed to effect an all-stock merger of equals strategic combination of their respective businesses, with Janus Capital surviving the merger as a direct wholly-owned subsidiary of Henderson (the “Transaction”). The Board was advised that, subject to certain conditions, the Transaction is currently expected to close during the second quarter of 2017.
As part of its due diligence, the Board developed an initial list of questions related to the proposed transaction, which was provided to Janus Capital on October 6, 2016. At a special Board meeting held on October 19, 2016, the Board considered Janus Capital’s response to the initial information request and met with the management of Janus to discuss the impact of the Transaction on the nature, extent and quality of services Janus Capital is expected to provide to the Janus Funds following the Transaction, addressing, among other matters, the personnel expected to provide such services, and the resources available to do so. After its October 19, 2016 meeting, the Board developed a supplemental request for additional information, which was provided to Janus Capital on October 26, 2016. At another special Board meeting held on November 7-8, 2016, the Board considered Janus Capital’s response to the supplemental information request and again met with the management of Janus and Henderson to discuss the impact of the Transaction on the nature, extent and quality of services Janus Capital is expected to provide to the Janus Funds following the Transaction, and also met with various officers of the Funds and of Janus Capital, including various Fund portfolio managers. After its November 7-8, 2016 meeting, the Board developed a second supplemental request for additional information, which was provided to Janus Capital on November 21, 2016. On December 7-8, 2016, the Board met to consider Janus Capital’s response to the second supplemental information request and to also consider the proposed new investment advisory agreements between the Trust, on behalf of each Fund, and Janus Capital (each, a “New Advisory Agreement” and collectively, the “New Advisory Agreements”) and the new sub-advisory agreements between Janus Capital and each of the Funds that utilize INTECH Investment Management LLC (“INTECH”), Perkins Investment Management LLC (“Perkins”), or Janus Singapore Pte. Limited (“Janus Singapore,” and together with INTECH and Perkins, the “Sub-Advisers” and each, a “Sub-Adviser”) as sub-advisers (each, a “New Sub-Advisory Agreement” and collectively, the “New Sub-Advisory Agreements”) to take effect immediately after the Transaction or shareholder approval, whichever is later. During each of these meetings, the Board sought additional and clarifying information as it deemed necessary or appropriate. In addition, the Board engaged its independent fee consultant to help evaluate certain of the proposals that the Board was being asked to consider. Throughout the process, the Board had the assistance of its independent legal counsel, who advised them on, among other things, its duties and obligations.
38 | MARCH 31, 2017 |
Janus Asia Equity Fund
Additional Information (unaudited)
In connection with the Board’s review, Janus Capital provided, and the Board obtained, substantial information regarding the following matters: the management, financial position and business of Henderson; the history of Henderson’s business and operations; the investment performance of the investment companies advised by Henderson; the proposed structure, operations and investment processes of the combined investment management organization after the Transaction and the strategy for operating and growing the business following the Transaction; the future plans of Janus and Henderson with respect to the Funds and any proposed changes to the operations or structure of the Funds; and the future plans of Janus and Henderson with respect to the provision of services to the Funds, and the entities providing such services, including those affiliated with Janus. The Board also received information regarding the terms of the Transaction, anticipated management of the combined organization, the resources that each of Janus and Henderson bring to the combined organization and the process being followed by Janus and Henderson to integrate their organizations. The Board also received information regarding the impact of the Transaction on each of INTECH, Perkins and Janus Singapore.
In connection with the Board’s approval of New Advisory Agreements and New Sub-Advisory Agreements at its December 8, 2016 meeting, the Board also continued its on-going annual process to determine whether to continue the existing investment advisory agreements between Janus Capital and the Trust on behalf of each Fund (each, a “Current Advisory Agreement” and collectively, the “Current Advisory Agreements”) and the existing sub-advisory agreements between Janus Capital and each of the Funds that utilize INTECH, Perkins, or Janus Singapore as sub-advisers (each, a “Current Sub-Advisory Agreement” and collectively, the “Current Sub-Advisory Agreements”). In this regard, the Board received and reviewed information provided by Janus and the respective Sub-Advisers in response to requests of the Board and its independent legal counsel. The Board also received and reviewed information and analysis provided by, and in response to requests of, its independent fee consultant. The Board noted that as part of this annual process, the Board had considered and was in the process of considering, numerous factors, including the nature and quality of services provided by Janus Capital and each Sub-Adviser, as applicable; investment performance, on an absolute basis and relative to appropriate peer groups and one or a combination of market indices; investment management fees, expense ratios and asset sizes of the Funds and peer groups; investment management fees charged to comparable investment companies, separate accounts and non-fund clients; Janus Capital’s profitability from managing the Funds; fall-out benefits to Janus Capital from its relationship to the Funds, including revenues derived from services provided to the Funds by affiliates of Janus Capital; and the potential benefits to Janus Capital, the Funds of receiving research services from broker/dealer firms in connection with the allocation of portfolio transactions to such firms.
In determining whether to approve the New Advisory Agreement for each Fund and the New Sub-Advisory Agreement for Funds managed by INTECH, Perkins or Janus Singapore in connection with the Transaction, and whether to recommend approval to Fund shareholders, the Board received information and made inquiries into all matters as it deemed appropriate. The Board reviewed and analyzed various factors it deemed relevant, including the following factors, among others, none of which by itself was considered dispositive:
· The terms of the New Advisory Agreements are substantially similar to the corresponding Current Advisory Agreements, and the contractual fee rate will not change. In this regard, see the discussion of the Board’s considerations with respect to its most recent approval of the Current Advisory Agreements prior to December 8, 2016, as disclosed in each Fund’s most recent prior annual or semi-annual shareholder report, as applicable.
· The terms of the New Sub-Advisory Agreements are substantially similar to the corresponding Current Sub-Advisory Agreements, and the contractual fee rate will not change. In this regard, see the discussion of the Board’s considerations with respect to its most recent approval of the Current Sub-Advisory Agreements prior to December 8, 2016, as disclosed in each Fund’s most recent prior annual or semi-annual shareholder report, as applicable.
· Janus Capital’s plans for the operation of the Funds, including its plans for the continued provision of all services currently provided to the Funds by Janus Capital and its affiliates, including, among others, investment advisory services, portfolio trading services, and Fund administrative and accounting services, and the personnel and resources proposed to support the provision of such services.
· The estimated profitability to Janus Capital from managing the Funds after the Transaction, including potential economies of scale and fall-out benefits to Janus Capital from its relationship to the Funds, including revenues derived from services provided to the Funds by affiliates of Janus Capital, and the potential benefits to Janus
Janus Investment Fund | 39 |
Janus Asia Equity Fund
Additional Information (unaudited)
Capital, and the Funds of receiving research services from broker/dealer firms in connection with the allocation of portfolio transactions to such firms.
In connection with its deliberations, the Board received assurances from Janus, on behalf of itself and its affiliates (collectively, “Janus”) including the following:
· Janus has provided to the Board such information as it believes is reasonably necessary to evaluate the New Advisory Agreements and New Sub-Advisory Agreements.
· Janus is committed to the continuance, without interruption, of services to the Funds of at least the type and quality currently provided by Janus Capital and its affiliates, or superior thereto.
· The Transaction is not expected to affect negatively the nature, extent or quality of the investment advisory services provided by Janus Capital to the Funds following the Transaction, and the investment advisory services are expected to be at least comparable to the services being provided under the Current Advisory Agreements and Current Sub-Advisory Agreements. In this regard, the Board noted specific representations that Janus does not intend for the nature, extent or quality of investment advisory and other services to be provided to the Funds following the Transaction to change, and the extent of such services were expected to increase based on the combined resources of the combined investment management organization after the Transaction, and should the nature, extent or quality of such services decline, Janus would commit the resources needed to return such services to pre-Transaction levels.
· The Funds’ current operations were expected to remain largely unchanged, except for certain fund reorganizations which will be separately considered by the Board, and such other changes as were or will be presented to the Board.
· Janus does not intend to make changes to the portfolio managers providing services to the Funds, other than proposed changes in the management of certain Funds as discussed with the Board, including those related to proposals to merge certain Funds with Funds managed by Henderson Global Investors (North America) Inc., an indirect, wholly-owned subsidiary of Henderson, and subject to such changes as may arise at any time as a result of the ongoing process of portfolio manager evaluation.
· After the Transaction, the extent of distribution and marketing services provided to the Janus Funds were expected to increase based on the combined resources of Janus and Henderson. In this regard, Janus Capital advised the Board that after the Transaction, the extent of distribution and marketing services provided to the Janus Funds are expected to increase based on the combined resources of Janus and Henderson. This is due primarily to the anticipated increase of sales related resources and expanded global presence of the combined Janus Henderson organization, which is expected to enhance visibility and brand recognition of the Janus Henderson Funds.
· The intent of Janus Capital to take the necessary and appropriate steps to retain and attract its key investment advisory personnel.
· The intent of Janus to take the necessary and appropriate steps to retain and attract its key compliance, financial, fund accounting and administrative personnel supporting the management and oversight of the Funds.
· Janus is not aware of any express or implied term, condition, arrangement or understanding that would impose in its best judgement an “unfair burden” on any Fund as a result of the Transaction, as defined in Section 15(f) of the 1940 Act, and that Janus will take no action that would have the effect of imposing such an “unfair burden” on any Fund in connection with the Transaction.
Janus assured the Board that it intended to comply with Section 15(f) of the Investment Company Act of 1940, as amended (the “1940 Act”). Section 15(f) provides a non-exclusive safe harbor for an investment adviser to an investment company or any of its affiliated persons to receive any amount or benefit in connection with a change in control of the investment adviser so long as two conditions are met. First, for a period of three years after the transaction, at least 75% of the board members of the investment company must not be interested persons of such investment adviser (as defined under the 1940 Act). The composition of the Board is in compliance with this provision of Section 15(f). In addition, after careful review and consideration, the Board determined that it would be in the best interests of the Funds to add to the Board an individual who currently acts as a non-interested board member of the
40 | MARCH 31, 2017 |
Janus Asia Equity Fund
Additional Information (unaudited)
Henderson Trust. The Board believes that this change in the Board composition will provide perspective and insight relating to experience working with the Henderson organization. The Board’s Nominating and Governance Committee considered a number of candidates and recommended that the Board nominate one proposed new trustee from those candidates who currently act as non-interested board members of the Henderson Trust. The Board approved that trustee nominee to serve on the Board, subject to election by the shareholders of the Funds and contingent on the closing of the Transaction. If the new trustee is elected and serves on the Board, the Board composition would continue to satisfy the provisions of Section 15(f).
To meet the second condition of Section 15(f), an “unfair burden” must not be imposed upon the investment company as a result of such transaction or any express or implied terms, conditions or understandings applicable thereto. The term “unfair burden” is defined in Section 15(f) to include any arrangement during the two-year period after the transaction, whereby the investment adviser, or any interested person of such adviser, receives or is entitled to receive any compensation, directly or indirectly, from the investment company or its shareholders (other than fees for bona fide investment advisory or other services) or from any person in connection with the purchase or sale of securities or other property to, from or on behalf of the investment company (other than bona fide ordinary compensation as principal underwriter for such investment company).
Janus represented that it does not believe that an “unfair burden” will be placed on the Funds as a result of the Transaction. In furtherance thereof, Janus has undertaken to pay the costs of preparing and distributing proxy materials to, and of holding the meetings of, the Funds’ shareholders (the “Meetings”), as well as other fees and expenses in connection with the Transaction, including the reasonable fees and expenses of legal counsel and consultants to the Funds and the Trustees. In addition, Janus has agreed, for a period of two years following the closing of the Transaction, (i) not to request any increases to advisory fees for the Funds, other than those proposed to and approved by the Board prior to the close of the Transaction, and (ii) to continue to use the current process by which expense caps are set annually for the Funds.
As a result of its review and consideration of the New Investment Advisory Agreements and New Sub-Advisory Agreements in connection with the Transaction, at a meeting on December 8, 2016, the Board voted unanimously to approve a New Investment Advisory Agreement for each Fund and a New Sub-Advisory Agreement for each Fund managed by INTECH, Perkins or Janus Singapore, and to recommend such agreements to the Funds’ shareholders for their approval.
Approval of Interim Advisory and Sub-Advisory Agreements with Janus and Janus Affiliates during the Period
In the event shareholders of a Fund do not approve such Fund’s New Advisory Agreement and/or New Sub-Advisory Agreement at the Meetings prior to the closing of the Transaction, Janus Capital proposed that an interim investment advisory agreement between Janus Capital and such Fund (each, an “Interim Advisory Agreement” and collectively, the “Interim Advisory Agreements”) and an interim sub-advisory agreement between Janus Capital and the applicable Sub-Adviser (each, an “Interim Sub-Advisory Agreement” and collectively, the “Interim Sub-Advisory Agreements”) take effect upon the closing of the Transaction. At the December 8, 2016 meeting, the Board, all of whom are Independent Trustees, unanimously approved an Interim Advisory Agreement for each Fund and an Interim Sub-Advisory Agreement for each applicable Fund in order to assure continuity of investment advisory services to the Funds and sub-advisory services to the sub-advised Funds after the Transaction. The terms of each Interim Advisory Agreement are substantially identical to those of the applicable Current Advisory Agreement and New Advisory Agreement, except for the term and escrow provisions described below. Similarly, the terms of each Interim Sub-Advisory Agreement are substantially identical to those of the Current Sub-Advisory Agreements and New Sub-Advisory Agreements, except for the term and escrow provisions described below. The Interim Advisory Agreement and Interim Sub-Advisory Agreement will continue in effect for a term ending on the earlier of 150 days from the closing of the Transaction (the “150-day period”) or when shareholders of the Fund approve the New Advisory Agreement and/or New Sub-Advisory Agreement. Pursuant to Rule 15a-4 under the 1940 Act, compensation earned by Janus Capital under an Interim Advisory Agreement and compensation earned by a Sub-Adviser under an Interim Sub-Advisory Agreement will be held in an interest-bearing escrow account. If shareholders of a Fund approve the New Advisory Agreement prior to the end of the 150-day period, the amount held in the escrow account under the Interim Advisory Agreement will be paid to Janus Capital. If shareholders of a Fund approve the New Advisory Agreement and New Sub-Advisory Agreement prior to the end of the 150-day period, the amount held in the escrow account under the Interim Sub-Advisory Agreement will be paid to the Sub-Adviser. If shareholders of a Fund do not approve the New Advisory Agreement prior to the end of the 150-day period, the Board will take such action as it
Janus Investment Fund | 41 |
Janus Asia Equity Fund
Additional Information (unaudited)
deems to be in the best interests of the Fund, and Janus Capital will be paid the lesser of its costs incurred in performing its services under the Interim Advisory Agreement or the total amount in the escrow account, plus interest earned. If shareholders of a Fund do not approve the New Advisory Agreement and/or New Sub-Advisory Agreement prior to the end of the 150-day period, the Board will take such action as it deems to be in the best interests of the Fund, and the Sub-Adviser will be paid the lesser of its costs incurred in performing its services under the Interim Sub-Advisory Agreement or the total amount in the escrow account, plus interest earned.
Approval of Sub-Advisory Agreements with Henderson Investment Management Limited during the Period
Janus Capital met with the Trustees on November 7-8, 2016, and December 7-8, 2016, to discuss the approval of a new sub-advisory agreement between Janus Capital and Henderson Investment Management Limited (“HIML”) (each, a “HIML Sub-Advisory Agreement” and collectively, the “HIML Sub-Advisory Agreements”) on behalf of each of Janus Asia Equity Fund, Janus Emerging Markets Fund, and Janus Global Real Estate Fund (each, an “HIML Fund” and together, the “HIML Funds”) to take effect immediately after the closing of the Transaction or shareholder approval, whichever is later. At the meetings, the Trustees also discussed the HIML Sub-Advisory Agreements with their independent counsel in executive session. During the course of these meetings, the Trustees requested and considered such information as they deemed relevant to their deliberations. In addition, at prior meetings and during the course of these meetings the Board also undertook a comprehensive process to evaluate the impact of the Transaction on the nature, quality and extent of services expected to be provided by Janus Capital and HIML to each HIML Fund, including after the completion of the Transaction. For a fuller discussion of the Board’s consideration of the approval of a new investment advisory agreement for the HIML Funds in connection with the Transaction, see “Approval of Advisory and Sub-Advisory Agreements with Janus and its Affiliates During the Period” above.
At a meeting of the Board of Trustees held on December 8, 2016, the Trustees considered the HIML Sub-Advisory Agreements. In determining whether to approve the HIML Sub-Advisory Agreements, and whether to recommend approval to the shareholders of each HIML Fund, the Board received information and made inquiries into all matters as it deemed appropriate. The Board reviewed and analyzed various factors it deemed relevant, including the following factors, among others, none of which by itself was considered dispositive:
· the terms of each HIML Sub-Advisory Agreement;
· the nature, quality and extent of services expected to be provided under the HIML Sub-Advisory Agreements, including the reputation, qualifications and background of HIML and its operational and compliance infrastructures;
· the investment approach, the experience and skills of senior management and investment personnel of HIML, including the portfolio managers who would be responsible for managing all or part of the portfolio of each HIML Fund, noting the resources made available to such personnel;
· the ability of HIML to attract and retain high-quality personnel and the organizational depth of HIML;
· the sub-advisory fee rate under each HIML Sub-Advisory Agreement, as well as the overall management fee structure of each HIML Fund, noting that the sub-advisory fee rate is consistent with the approach utilized in the Janus Funds complex for other sub-advisory relationships, taking into account the allocation of managed assets between Janus Capital and HIML for the Global Real Estate Fund;
· under each HIML Sub-Advisory Agreement, Janus Capital would be responsible for paying HIML out of its fees;
· the fall out benefits to HIML and its affiliates from its relationship with each HIML Fund, including the potential benefits to HIML and its affiliates and each HIML Fund of receiving research services from broker/dealer firms in connection with the allocation of portfolio transactions to such firms;
· the potential for economies of scale with respect to the overall fee structure of each HIML Fund and whether either Fund will benefit from any economies of scale; and
· the costs of seeking approval of the HIML Sub-Advisory Agreements will not be borne by the HIML Funds.
As a result of its review and consideration of each HIML Sub-Advisory Agreement and related matters, on December 8, 2016, the Board voted unanimously to approve each HIML Sub-Advisory Agreement and to recommend such agreement to each HIML Fund’s shareholders for their approval.
42 | MARCH 31, 2017 |
Janus Asia Equity Fund
Additional Information (unaudited)
Renewal of Investment Advisory and Sub-Advisory Agreements for INTECH U.S. Core Fund
As noted above, at its December 8, 2016 meeting, the Board continued its on-going annual process to determine whether to continue the Current Advisory Agreements and the Current Sub-Advisory Agreements. In this regard, the Board received and reviewed information provided by Janus and the respective Sub-Advisers in response to requests of the Board and its independent legal counsel. The Board also received and reviewed information and analysis provided by, and in response to requests of, its independent fee consultant. The Board noted that the Current Advisory Agreement between the Trust, on behalf of INTECH U.S. Core Fund, and Janus Capital and the Current Sub-Advisory Agreement between Janus Capital and INTECH, on behalf of the Fund, would expire on January 1, 2017, if not renewed. The Board noted that the date of termination for the Current Advisory Agreements and the Current Sub-Advisory Agreements for the other Funds was February 1, 2017, if not renewed. Accordingly, the Board voted unanimously to renew the Current Advisory Agreement and the Current Sub-Advisory Agreement for INTECH U.S. Core Fund through January 31, 2017 in order to (i) align the termination date of such Agreements with the termination date of the Current Advisory Agreements and the Current Sub-Advisory Agreements for the other Funds and (ii) allow for a more complete consideration of such Agreements, as well as the Current Advisory Agreements and the Current Sub-Advisory Agreements for the other Funds.
APPROVAL OF ADVISORY AGREEMENTS DURING THE PERIOD
The Trustees of Janus Investment Fund and Janus Aspen Series, each of whom serves as an “independent” Trustee (the “Trustees”), oversee the management of each Fund of Janus Investment Fund and each Portfolio of Janus Aspen Series (each, a “Fund” and collectively, the “Funds”), and as required by law, determine annually whether to continue the investment advisory agreement for each Fund and the subadvisory agreements for the 16 Funds that utilize subadvisers.
In connection with their most recent consideration of those agreements for each Fund, the Trustees received and reviewed information provided by Janus Capital and the respective subadvisers in response to requests of the Trustees and their independent legal counsel. They also received and reviewed information and analysis provided by, and in response to requests of, their independent fee consultant. Throughout their consideration of the agreements, the Trustees were advised by their independent legal counsel. The Trustees met with management to consider the agreements, and also met separately in executive session with their independent legal counsel and their independent fee consultant.
Additionally, in connection with their consideration of whether to continue the investment advisory agreement and subadvisory agreement for each Fund, as applicable, the Trustees also received and reviewed information in connection with the proposed transaction to combine the respective businesses of Henderson Group plc and Janus Capital Group, Inc., the parent company of Janus Capital (the “Transaction”), announced in October 2016, which Janus Capital advised the Trustees was expected to close in the second quarter of 2017. In this regard, the Trustees reviewed information regarding the impact of the Transaction on the services to be provided by Janus Capital and each subadviser, as applicable, to the Funds under such agreements both prior to the close of the Transaction, and afterwards, if the Transaction were not to close. If the Transaction closes, all such agreements would be replaced by new investment advisory agreements and subadvisory agreements, as applicable, for each Fund, assuming requisite Fund shareholder approvals have been obtained.
At a meeting held on January 26, 2017, based on the Trustees’ evaluation of the information provided by Janus Capital, the subadvisers, and the independent fee consultant, as well as other information, the Trustees determined that the overall arrangements between each Fund and Janus Capital and each subadviser, as applicable, were fair and reasonable in light of the nature, extent and quality of the services provided by Janus Capital, its affiliates and the subadvisers, the fees charged for those services, and other matters that the Trustees considered relevant in the exercise of their business judgment. At that meeting, the Trustees unanimously approved the continuation of the investment advisory agreement for each Fund, and the subadvisory agreement for each subadvised Fund, for the period from February 1, 2017 through February 1, 2018, subject to earlier termination as provided for in each agreement.
In considering the continuation of those agreements, the Trustees reviewed and analyzed various factors that they determined were relevant, including the factors described below, none of which by itself was considered dispositive. However, the material factors and conclusions that formed the basis for the Trustees’ determination to approve the continuation of the agreements are discussed separately below. Also included is a summary of the independent fee consultant’s conclusions and opinions that arose during, and were included as part of, the Trustees’ consideration of the
Janus Investment Fund | 43 |
Janus Asia Equity Fund
Additional Information (unaudited)
agreements. “Management fees,” as used herein, reflect actual annual advisory fees and any administration fees (excluding out of pocket costs), net of any waivers.
Nature, Extent and Quality of Services
The Trustees reviewed the nature, extent and quality of the services provided by Janus Capital and the subadvisers to the Funds, taking into account the investment objective, strategies and policies of each Fund, and the knowledge the Trustees gained from their regular meetings with management on at least a quarterly basis and their ongoing review of information related to the Funds. In addition, the Trustees reviewed the resources and key personnel of Janus Capital and each subadviser, particularly noting those employees who provide investment and risk management services to the Funds. The Trustees also considered other services provided to the Funds by Janus Capital or the subadvisers, such as managing the execution of portfolio transactions and the selection of broker-dealers for those transactions. The Trustees considered Janus Capital’s role as administrator to the Funds, noting that Janus Capital does not receive a fee for its services but is reimbursed for its out-of-pocket costs. The Trustees considered the role of Janus Capital in monitoring adherence to the Funds’ investment restrictions, providing support services for the Trustees and Trustee committees, and overseeing communications with shareholders and the activities of other service providers, including monitoring compliance with various policies and procedures of the Funds and with applicable securities laws and regulations.
In this regard, the independent fee consultant noted that Janus Capital provides a number of different services for the Funds and Fund shareholders, ranging from investment management services to various other servicing functions, and that, in its opinion, Janus Capital is a capable provider of those services. The independent fee consultant also provided its belief that Janus Capital has developed a number of institutional competitive advantages that should enable it to provide superior investment and service performance over the long term.
The Trustees concluded that the nature, extent and quality of the services provided by Janus Capital or the subadviser to each Fund were appropriate and consistent with the terms of the respective advisory and subadvisory agreements, and that, taking into account steps taken to address those Funds whose performance lagged that of their peers for certain periods, the Funds were likely to benefit from the continued provision of those services. They also concluded that Janus Capital and each subadviser had sufficient personnel, with the appropriate education and experience, to serve the Funds effectively and had demonstrated its ability to attract well-qualified personnel.
Performance of the Funds
The Trustees considered the performance results of each Fund over various time periods. They noted that they considered Fund performance data throughout the year, including periodic meetings with each Fund’s portfolio manager(s), and also reviewed information comparing each Fund’s performance with the performance of comparable funds and peer groups identified by Broadridge Financial Solutions, Inc. (“Broadridge”), an independent data provider, and with the Fund’s benchmark index. In this regard, the independent fee consultant found that the overall Funds’ performance has been strong: for the 36 months ended September 30, 2016, approximately 76% of the Funds were in the top two Broadridge quartiles of performance, and for the 12 months ended September 30, 2016, approximately 47% of the Funds were in the top two Broadridge quartiles of performance.
The Trustees considered the performance of each Fund, noting that performance may vary by share class, and noted the following:
Fixed-Income Funds and Money Market Funds
· For Janus Flexible Bond Fund, the Trustees noted that the Fund’s performance was in the second Broadridge quartile for the 36 months ended May 31, 2016 and the third Broadridge quartile for the 12 months ended May 31, 2016.
· For Janus Global Bond Fund, the Trustees noted that the Fund’s performance was in the second Broadridge quartile for the 36 months ended May 31, 2016 and the third Broadridge quartile for the 12 months ended May 31, 2016.
· For Janus Global Unconstrained Bond Fund, the Trustees noted that the Fund’s performance was in the first Broadridge quartile for the 12 months ended May 31, 2016.
44 | MARCH 31, 2017 |
Janus Asia Equity Fund
Additional Information (unaudited)
· For Janus High-Yield Fund, the Trustees noted that the Fund’s performance was in the second Broadridge quartile for the 36 months ended May 31, 2016 and the second Broadridge quartile for the 12 months ended May 31, 2016.
· For Janus Multi-Sector Income Fund, the Trustees noted that the Fund’s performance was in the first Broadridge quartile for the 12 months ended May 31, 2016.
· For Janus Real Return Fund, the Trustees noted that the Fund’s performance was in the first Broadridge quartile for the 36 months ended May 31, 2016 and the first Broadridge quartile for the 12 months ended May 31, 2016.
· For Janus Short-Term Bond Fund, the Trustees noted that the Fund’s performance was in the second Broadridge quartile for the 36 months ended May 31, 2016 and the third Broadridge quartile for the 12 months ended May 31, 2016.
· For Janus Government Money Market Fund, the Trustees noted that the Fund’s performance was in the third Broadridge quartile for the 36 months ended May 31, 2016 and the third Broadridge quartile for the 12 months ended May 31, 2016. The Trustees noted the reasons for the Fund’s underperformance.
· For Janus Money Market Fund, the Trustees noted that the Fund’s performance was in the bottom Broadridge quartile for the 36 months ended May 31, 2016 and the bottom Broadridge quartile for the 12 months ended May 31, 2016. The Trustees noted the reasons for the Fund’s underperformance.
Asset Allocation Funds
· For Janus Global Allocation Fund – Conservative, the Trustees noted that the Fund’s performance was in the second Broadridge quartile for the 36 months ended May 31, 2016 and the bottom Broadridge quartile for the 12 months ended May 31, 2016.
· For Janus Global Allocation Fund – Growth, the Trustees noted that the Fund’s performance was in the bottom Broadridge quartile for the 36 months ended May 31, 2016 and the bottom Broadridge quartile for the 12 months ended May 31, 2016. The Trustees noted the reasons for the Fund’s underperformance and the steps Janus Capital had taken or was taking to improve performance.
· For Janus Global Allocation Fund – Moderate, the Trustees noted that the Fund’s performance was in the third Broadridge quartile for the 36 months ended May 31, 2016 and the bottom Broadridge quartile for the 12 months ended May 31, 2016. The Trustees noted the reasons for the Fund’s underperformance and the steps Janus Capital had taken or was taking to improve performance.
Alternative Fund
· For Janus Diversified Alternatives Fund, the Trustees noted that the Fund’s performance was in the third Broadridge quartile for the 36 months ended May 31, 2016 and the third Broadridge quartile for the 12 months ended May 31, 2016. The Trustees noted the reasons for the Fund’s underperformance and the steps Janus Capital had taken or was taking to improve performance.
Value Funds
· For Perkins International Value Fund, the Trustees noted that the Fund’s performance was in the second Broadridge quartile for the 36 months ended May 31, 2016 and the first Broadridge quartile for the 12 months ended May 31, 2016.
· For Perkins Global Value Fund, the Trustees noted that the Fund’s performance was in the second Broadridge quartile for the 36 months ended May 31, 2016 and the first Broadridge quartile for the 12 months ended May 31, 2016.
· For Perkins Large Cap Value Fund, the Trustees noted that the Fund’s performance was in the third Broadridge quartile for the 36 months ended May 31, 2016 and the first Broadridge quartile for the 12 months ended May 31, 2016. The Trustees noted the reasons for the Fund’s underperformance, noting that the Fund has a performance fee structure that results in lower management fees during periods of underperformance, the steps Janus Capital and Perkins had taken or were taking to improve performance, and that the performance trend was improving.
Janus Investment Fund | 45 |
Janus Asia Equity Fund
Additional Information (unaudited)
· For Perkins Mid Cap Value Fund, the Trustees noted that the Fund’s performance was in the bottom Broadridge quartile for the 36 months ended May 31, 2016 and the first Broadridge quartile for the 12 months ended May 31, 2016. The Trustees noted the reasons for the Fund’s underperformance, noting that the Fund has a performance fee structure that results in lower management fees during periods of underperformance, the steps Janus Capital and Perkins had taken or were taking to improve performance, and that the performance trend was improving.
· For Perkins Select Value Fund, the Trustees noted that the Fund’s performance was in the second Broadridge quartile for the 36 months ended May 31, 2016 and the first Broadridge quartile for the 12 months ended May 31, 2016.
· For Perkins Small Cap Value Fund, the Trustees noted that the Fund’s performance was in the first Broadridge quartile for the 36 months ended May 31, 2016 and the first Broadridge quartile for the 12 months ended May 31, 2016.
· For Perkins Value Plus Income Fund, the Trustees noted that the Fund’s performance was in the second Broadridge quartile for the 36 months ended May 31, 2016 and the second Broadridge quartile for the 12 months ended May 31, 2016.
Mathematical Funds
· For INTECH Emerging Markets Managed Volatility Fund, the Trustees noted that the Fund’s performance was in the second Broadridge quartile for the 12 months ended May 31, 2016.
· For INTECH Global Income Managed Volatility Fund, the Trustees noted that the Fund’s performance was in the first Broadridge quartile for the 36 months ended May 31, 2016 and the first Broadridge quartile for the 12 months ended May 31, 2016.
· For INTECH International Managed Volatility Fund, the Trustees noted that the Fund’s performance was in the first Broadridge quartile for the 36 months ended May 31, 2016 and the first Broadridge quartile for the 12 months ended May 31, 2016.
· For INTECH U.S. Core Fund, the Trustees noted that the Fund’s performance was in the first Broadridge quartile for the 36 months ended May 31, 2016 and the first Broadridge quartile for the 12 months ended May 31, 2016.
· For INTECH U.S. Managed Volatility Fund, the Trustees noted that the Fund’s performance was in the first Broadridge quartile for the 36 months ended May 31, 2016 and the first Broadridge quartile for the 12 months ended May 31, 2016.
Growth and Core Funds
· For Janus Balanced Fund, the Trustees noted that the Fund’s performance was in the first Broadridge quartile for the 36 months ended May 31, 2016 and the third Broadridge quartile for the 12 months ended May 31, 2016.
· For Janus Contrarian Fund, the Trustees noted that the Fund’s performance was in the bottom Broadridge quartile for the 36 months ended May 31, 2016 and the bottom Broadridge quartile for the 12 months ended May 31, 2016. The Trustees noted the reasons for the Fund’s underperformance, noting that the Fund has a performance fee structure that results in lower management fees during periods of underperformance, and the steps Janus Capital had taken or was taking to improve performance.
· For Janus Enterprise Fund, the Trustees noted that the Fund’s performance was in the first Broadridge quartile for the 36 months ended May 31, 2016 and the first Broadridge quartile for the 12 months ended May 31, 2016.
· For Janus Forty Fund, the Trustees noted that the Fund’s performance was in the first Broadridge quartile for the 36 months ended May 31, 2016 and the first Broadridge quartile for the 12 months ended May 31, 2016.
· For Janus Fund, the Trustees noted that the Fund’s performance was in the first Broadridge quartile for the 36 months ended May 31, 2016 and the second Broadridge quartile for the 12 months ended May 31, 2016.
46 | MARCH 31, 2017 |
Janus Asia Equity Fund
Additional Information (unaudited)
· For Janus Growth and Income Fund, the Trustees noted that the Fund’s performance was in the second Broadridge quartile for the 36 months ended May 31, 2016 and in the second Broadridge quartile for the 12 months ended May 31, 2016.
· For Janus Research Fund, the Trustees noted that the Fund’s performance was in the first Broadridge quartile for the 36 months ended May 31, 2016 and the second Broadridge quartile for the 12 months ended May 31, 2016.
· For Janus Triton Fund, the Trustees noted that the Fund’s performance was in the first Broadridge quartile for the 36 months ended May 31, 2016 and the first Broadridge quartile for the 12 months ended May 31, 2016.
· For Janus Twenty Fund, the Trustees noted that the Fund’s performance was in the third Broadridge quartile for the 36 months ended May 31, 2016 and the first Broadridge quartile for the 12 months ended May 31, 2016. The Trustees noted the reasons for the Fund’s underperformance, noting that the Fund has a performance fee structure that results in lower management fees during periods of underperformance, the steps Janus Capital had taken or was taking to improve performance, and that the performance trend was improving.
· For Janus Venture Fund, the Trustees noted that the Fund’s performance was in the first Broadridge quartile for the 36 months ended May 31, 2016 and the second Broadridge quartile for the 12 months ended May 31, 2016.
Global and International Funds
· For Janus Adaptive Global Allocation Fund, the Trustees noted that, due to limited performance for the Fund, performance history was not a material factor.
· For Janus Asia Equity Fund, the Trustees noted that the Fund’s performance was in the third Broadridge quartile for the 36 months ended May 31, 2016 and the bottom Broadridge quartile for the 12 months ended May 31, 2016. The Trustees noted the reasons for the Fund’s underperformance, noting that the Fund has a performance fee structure that results in lower management fees during periods of underperformance, and the steps Janus Capital had taken or was taking to improve performance.
· For Janus Emerging Markets Fund, the Trustees noted that the Fund’s performance was in the first Broadridge quartile for the 36 months ended May 31, 2016 and the third Broadridge quartile for the 12 months ended May 31, 2016.
· For Janus Global Life Sciences Fund, the Trustees noted that the Fund’s performance was in the first Broadridge quartile for the 36 months ended May 31, 2016 and the bottom Broadridge quartile for the 12 months ended May 31, 2016.
· For Janus Global Real Estate Fund, the Trustees noted that the Fund’s performance was in the third Broadridge quartile for the 36 months ended May 31, 2016 and the bottom Broadridge quartile for the 12 months ended May 31, 2016. The Trustees noted the reasons for the Fund’s underperformance, noting that the Fund has a performance fee structure that results in lower management fees during periods of underperformance, and the steps Janus Capital had taken or was taking to improve performance.
· For Janus Global Research Fund, the Trustees noted that the Fund’s performance was in the third Broadridge quartile for the 36 months ended May 31, 2016 and the bottom Broadridge quartile for the 12 months ended May 31, 2016. The Trustees noted the reasons for the Fund’s underperformance, noting that the Fund has a performance fee structure that results in lower management fees during periods of underperformance, and the steps Janus Capital had taken or was taking to improve performance.
· For Janus Global Select Fund, the Trustees noted that the Fund’s performance was in the bottom Broadridge quartile for the 36 months ended May 31, 2016 and the bottom Broadridge quartile for the 12 months ended May 31, 2016. The Trustees noted the reasons for the Fund’s underperformance and the steps Janus Capital had taken or was taking to improve performance.
· For Janus Global Technology Fund, the Trustees noted that the Fund’s performance was in the third Broadridge quartile for the 36 months ended May 31, 2016 and the first Broadridge quartile for the 12 months
Janus Investment Fund | 47 |
Janus Asia Equity Fund
Additional Information (unaudited)
ended May 31, 2016. The Trustees noted the reasons for the Fund’s underperformance, the steps Janus Capital had taken or was taking to improve performance, and that the performance trend was improving.
· For Janus International Equity Fund, the Trustees noted that the Fund’s performance was in the bottom Broadridge quartile for the 36 months ended May 31, 2016 and the bottom Broadridge quartile for the 12 months ended May 31, 2016. The Trustees noted the reasons for the Fund’s underperformance, noting that the Fund has a performance fee structure that results in lower management fees during periods of underperformance, and the steps Janus Capital had taken or was taking to improve performance.
· For Janus Overseas Fund, the Trustees noted that the Fund’s performance was in the bottom Broadridge quartile for the 36 months ended May 31, 2016 and the bottom Broadridge quartile for the 12 months ended May 31, 2016. The Trustees noted the reasons for the Fund’s underperformance, noting that the Fund has a performance fee structure that results in lower management fees during periods of underperformance, and the steps Janus Capital had taken or was taking to improve performance.
Janus Aspen Series
· For Janus Aspen Balanced Portfolio, the Trustees noted that the Fund’s performance was in the first Broadridge quartile for the 36 months ended May 31, 2016 and the third Broadridge quartile for the 12 months ended May 31, 2016.
· For Janus Aspen Enterprise Portfolio, the Trustees noted that the Fund’s performance was in the first Broadridge quartile for the 36 months ended May 31, 2016 and the first Broadridge quartile for the 12 months ended May 31, 2016.
· For Janus Aspen Flexible Bond Portfolio, the Trustees noted that the Fund’s performance was in the second Broadridge quartile for the 36 months ended May 31, 2016 and the bottom Broadridge quartile for the 12 months ended May 31, 2016.
· For Janus Aspen Forty Portfolio, the Trustees noted that the Fund’s performance was in the first Broadridge quartile for the 36 months ended May 31, 2016 and the first Broadridge quartile for the 12 months ended May 31, 2016.
· For Janus Aspen Global Allocation Portfolio – Moderate, the Trustees noted that the Fund’s performance was in the bottom Broadridge quartile for the 36 months ended May 31, 2016 and the bottom Broadridge quartile for the 12 months ended May 31, 2016. The Trustees noted the reasons for the Fund’s underperformance and the steps Janus Capital had taken or was taking to improve performance.
· For Janus Aspen Global Research Portfolio, the Trustees noted that the Fund’s performance was in the third Broadridge quartile for the 36 months ended May 31, 2016 and the bottom Broadridge quartile for the 12 months ended May 31, 2016. The Trustees noted the reasons for the Fund’s underperformance, noting that the Fund has a performance fee structure that results in lower management fees during periods of underperformance, and the steps Janus Capital had taken or was taking to improve performance.
· For Janus Aspen Global Technology Portfolio, the Trustees noted that the Fund’s performance was in the third Broadridge quartile for the 36 months ended May 31, 2016 and the second Broadridge quartile for the 12 months ended May 31, 2016. The Trustees noted the reasons for the Fund’s underperformance and the steps Janus Capital had taken or was taking to improve performance.
· For Janus Aspen Global Unconstrained Bond Portfolio, the Trustees noted that the Fund’s performance was in the second Broadridge quartile for the 12 months ended May 31, 2016.
· For Janus Aspen INTECH U.S. Low Volatility Portfolio, the Trustees noted that the Fund’s performance was in the first Broadridge quartile for the 36 months ended May 31, 2016 and the first Broadridge quartile for the 12 months ended May 31, 2016.
· For Janus Aspen Janus Portfolio, the Trustees noted that the Fund’s performance was in the first Broadridge quartile for the 36 months ended May 31, 2016 and the second Broadridge quartile for the 12 months ended May 31, 2016.
48 | MARCH 31, 2017 |
Janus Asia Equity Fund
Additional Information (unaudited)
· For Janus Aspen Overseas Portfolio, the Trustees noted that the Fund’s performance was in the bottom Broadridge quartile for the 36 months ended May 31, 2016 and the bottom Broadridge quartile for the 12 months ended May 31, 2016. The Trustees noted the reasons for the Fund’s underperformance, noting that the Fund has a performance fee structure that results in lower management fees during periods of underperformance, and the steps Janus Capital had taken or was taking to improve performance.
· For Janus Aspen Perkins Mid Cap Value Portfolio, the Trustees noted that the Fund’s performance was in the bottom Broadridge quartile for the 36 months ended May 31, 2016 and the first Broadridge quartile for the 12 months ended May 31, 2016.The Trustees noted the reasons for the Fund’s underperformance, noting that the Fund has a performance fee structure that results in lower management fees during periods of underperformance, the steps Janus Capital and Perkins had taken or were taking to improve performance, and that the performance trend was improving.
In consideration of each Fund’s performance, the Trustees concluded that, taking into account the factors relevant to performance, as well as other considerations, including steps taken to improve performance, the Fund’s performance warranted continuation of the Fund’s investment advisory and subadvisory agreement(s).
Costs of Services Provided
The Trustees examined information regarding the fees and expenses of each Fund in comparison to similar information for other comparable funds as provided by Broadridge, an independent data provider. They also reviewed an analysis of that information provided by their independent fee consultant and noted that the rate of management (investment advisory and any administration, but excluding out-of-pocket costs) fees for many of the Funds, after applicable waivers, was below the average management fee rate of the respective peer group of funds selected by an independent data provider. The Trustees also examined information regarding the subadvisory fees charged for subadvisory services, as applicable, noting that all such fees were paid by Janus Capital out of its management fees collected from such Fund.
The independent fee consultant provided its belief that the management fees charged by Janus Capital to each of the Funds under the current investment advisory and administration agreements are reasonable in relation to the services provided by Janus Capital. The independent fee consultant found: (1) the total expenses and management fees of the Funds to be reasonable relative to other mutual funds; (2) total expenses, on average, were 12% below the average total expenses of their respective Broadridge Expense Group peers and 20% below the average total expenses for their Broadridge Expense Universes; (3) management fees for the Funds, on average, were 11% below the average management fees for their Expense Groups and 13% below the average for their Expense Universes; and (4) Fund expenses at the functional level for each asset and share class category were reasonable. The Trustees also considered the total expenses for each share class of each Fund compared to the average total expenses for its Broadridge Expense Group peers and to average total expenses for its Broadridge Expense Universe.
The independent fee consultant concluded that, based on its strategic review of expenses at the complex, category and individual fund level, Fund expenses were found to be reasonable relative to both Expense Group and Expense Universe benchmarks. Further, for certain Funds, the independent fee consultant also performed a systematic “focus list” analysis of expenses in the context of the performance or service delivered to each set of investors in each share class in each selected Fund. Based on this analysis, the independent fee consultant found that the combination of service quality/performance and expenses on these individual Funds and share classes were reasonable in light of performance trends, performance histories, and existence of performance fees, breakpoints, and expense waivers on such Funds.
The Trustees considered the methodology used by Janus Capital and each subadviser in determining compensation payable to portfolio managers, the competitive environment for investment management talent, and the competitive market for mutual funds in different distribution channels.
The Trustees also reviewed management fees charged by Janus Capital and each subadviser to comparable separate account clients and to comparable non-affiliated funds subadvised by Janus Capital or by a subadviser (for which Janus Capital or the subadviser provides only or primarily portfolio management services). Although in most instances subadvisory and separate account fee rates for various investment strategies were lower than management fee rates for Funds having a similar strategy, the Trustees considered that Janus Capital noted that, under the terms of the management agreements with the Funds, Janus Capital performs significant additional services for the Funds that it does not provide to those other clients, including administration services, oversight of the Funds’ other service providers,
Janus Investment Fund | 49 |
Janus Asia Equity Fund
Additional Information (unaudited)
trustee support, regulatory compliance and numerous other services, and that, in serving the Funds, Janus Capital assumes many legal risks and other costs that it does not assume in servicing its other clients. Moreover, they noted that the independent fee consultant found that: (1) the management fees Janus Capital charges to the Funds are reasonable in relation to the management fees Janus Capital charges to its institutional and subadvised accounts; (2) these institutional and subadvised accounts have different service and infrastructure needs; (3) Janus mutual fund investors enjoy reasonable fees relative to the fees charged to Janus institutional and subadvised fund investors; and (4) in the majority of cases, the Funds receive proportionally better pricing than the industry in relation to Janus institutional and subadvised accounts.
The Trustees considered the fees for each Fund for its fiscal year ended in 2015, and noted the following with regard to each Fund’s total expenses, net of applicable fee waivers (the Fund’s “total expenses”):
Fixed-Income Funds and Money Market Funds
· For Janus Flexible Bond Fund, the Trustees noted that, although the Fund’s total expenses exceeded the peer group average for certain share classes, overall the Fund’s total expenses were reasonable. The Trustees also noted that Janus Capital has contractually agreed to limit the Fund’s expenses, although this limit did not apply because the Fund’s total expenses were already below the applicable fee limit.
· For Janus Global Bond Fund, the Trustees noted that although the Fund’s total expenses exceeded the peer group average for certain share classes, overall the Fund’s total expenses were reasonable. The Trustees also noted that Janus Capital has contractually agreed to limit the Fund’s expenses.
· For Janus Global Unconstrained Bond Fund, the Trustees noted that although the Fund’s total expenses exceeded the peer group average for certain share classes, overall the Fund’s total expenses were reasonable. The Trustees also noted that Janus Capital has contractually agreed to limit the Fund’s expenses.
· For Janus High-Yield Fund, the Trustees noted that, although the Fund’s total expenses exceeded the peer group average for certain share classes, overall the Fund’s total expenses were reasonable. The Trustees also noted that Janus Capital has contractually agreed to limit the Fund’s expenses, although this limit did not apply because the Fund’s total expenses were already below the applicable fee limit.
· For Janus Multi-Sector Income Fund, the Trustees noted that, although the Fund’s total expenses exceeded the peer group average for one share class, overall the Fund’s total expenses were reasonable. The Trustees also noted that Janus has contractually agreed to limit the Fund’s expenses.
· For Janus Real Return Fund, the Trustees noted that, although the Fund’s total expenses were equal to or exceeded the peer group average for all share classes, overall the Fund’s total expenses were reasonable. The Trustees also noted that Janus Capital has contractually agreed to limit the Fund’s expenses.
· For Janus Short-Term Bond Fund, the Trustees noted that, although the Fund’s total expenses exceeded the peer group average for certain share classes, overall the Fund’s total expenses were reasonable. The Trustees also noted that Janus Capital has contractually agreed to limit the Fund’s expenses.
· For Janus Government Money Market Fund, the Trustees noted that the Fund’s total expenses exceeded the peer group average for both share classes. The Trustees considered that management fees for this Fund are higher than the peer group average due to the Fund’s management fee including other costs, such as custody and transfer agent services, while many funds in the peer group pay these expenses separately from their management fee. In addition, the Trustees considered that Janus Capital voluntarily waives one-half of its advisory fee and other expenses in order to maintain a positive yield.
· For Janus Money Market Fund, the Trustees noted that the Fund’s total expenses were below the peer group average for both share classes. In addition, the Trustees considered that Janus Capital voluntarily waives one-half of its advisory fee and other expenses in order to maintain a positive yield.
Asset Allocation Funds
· For Janus Global Allocation Fund – Conservative, the Trustees noted that, although the Fund’s total expenses exceeded the peer group median for one share class, overall the Fund’s total expenses were reasonable. The Trustees also noted that Janus Capital has contractually agreed to limit the Fund’s expenses, although this limit did not apply because the Fund’s total expenses were already below the applicable fee limit.
50 | MARCH 31, 2017 |
Janus Asia Equity Fund
Additional Information (unaudited)
· For Janus Global Allocation Fund – Growth, the Trustees noted that the Fund’s total expenses were below the peer group average for all share classes.
· For Janus Global Allocation Fund – Moderate, the Trustees noted that, although the Fund’s total expenses exceeded the peer group average for one share class, overall the Fund’s total expenses were reasonable. The Trustees also noted that Janus Capital has contractually agreed to limit the Fund’s expenses.
Alternative Fund
· For Janus Diversified Alternatives Fund, the Trustees noted that, although the Fund’s total expenses exceeded the peer group average for certain share classes, overall the Fund’s total expenses were reasonable. The Trustees also noted that Janus Capital has contractually agreed to limit the Fund’s expenses.
Value Funds
· For Perkins International Value Fund, the Trustees noted that, although the Fund’s total expenses exceeded the peer group average for one share class, overall the Fund’s total expenses were reasonable. The Trustees also noted that Janus Capital has contractually agreed to limit the Fund’s expenses.
· For Perkins Global Value Fund, the Trustees noted that the Fund’s total expenses were below the peer group average for all share classes.
· For Perkins Large Cap Value Fund, the Trustees noted that, although the Fund’s total expenses exceeded the peer group average for one share class, overall the Fund’s total expenses were reasonable. The Trustees also noted that Janus Capital has contractually agreed to limit the Fund’s expenses.
· For Perkins Mid Cap Value Fund, the Trustees noted that, although the Fund’s total expenses exceeded the peer group average for one share class, overall the Fund’s total expenses were reasonable. The Trustees also noted that Janus Capital has contractually agreed to limit the Fund’s expenses, although this limit did not apply because the Fund’s total expenses were already below the applicable fee limit.
· For Perkins Select Value Fund, the Trustees noted that, although the Fund’s total expenses exceeded the peer group average for one share class, overall the Fund’s total expenses were reasonable. The Trustees also noted that Janus Capital has contractually agreed to limit the Fund’s expenses.
· For Perkins Small Cap Value Fund, the Trustees noted that the Fund’s total expenses were below the peer group average for all share classes.
· For Perkins Value Plus Income Fund, the Trustees noted that although the Fund’s total expenses exceeded the peer group average for one share class, overall the Fund’s total expenses were reasonable. The Trustees also noted that Janus Capital has contractually agreed to limit the Fund’s expenses.
Mathematical Funds
· For INTECH Emerging Markets Managed Volatility Fund, the Trustees noted that although the Fund’s total expenses exceeded the peer group average for one share class, overall the Fund’s total expenses were reasonable. The Trustees also noted that Janus Capital has contractually agreed to limit the Fund’s expenses.
· For INTECH Global Income Managed Volatility Fund, the Trustees noted that the Fund’s total expenses were below the peer group average for all share classes.
· For INTECH International Managed Volatility Fund, the Trustees noted that although the Fund’s total expenses exceeded the peer group average for one share class, overall the Fund’s total expenses were reasonable. The Trustees also noted that Janus Capital has contractually agreed to limit the Fund’s expenses.
· For INTECH U.S. Core Fund, the Trustees noted that although the Fund’s total expenses exceeded the peer group average for one share class, overall the Fund’s total expenses were reasonable. The Trustees also noted that Janus Capital has contractually agreed to limit the Fund’s expenses, although this limit did not apply because the Fund’s total expenses were already below the applicable fee limit.
· For INTECH U.S. Managed Volatility Fund, the Trustees noted that, although the Fund’s total expenses exceeded the peer group average for one share class, overall the Fund’s total expenses were reasonable. The
Janus Investment Fund | 51 |
Janus Asia Equity Fund
Additional Information (unaudited)
Trustees also noted that Janus Capital has contractually agreed to limit the Fund’s expenses, although this limit did not apply because the Fund’s total expenses were already below the applicable fee limit.
Growth and Core Funds
· For Janus Balanced Fund, the Trustees noted that, although the Fund’s total expenses exceeded the peer group average for one share class, overall the Fund’s total expenses were reasonable. The Trustees also noted that Janus Capital has contractually agreed to limit the Fund’s expenses, although this limit did not apply because the Fund’s total expenses were already below the applicable fee limit.
· For Janus Contrarian Fund, the Trustees noted that, although the Fund’s total expenses exceeded the peer group average for certain share classes, overall the Fund’s total expenses were reasonable. The Trustees also noted that Janus Capital has contractually agreed to limit the Fund’s expenses, although this limit did not apply because the Fund’s total expenses were already below the applicable fee limit.
· For Janus Enterprise Fund, the Trustees noted that, although the Fund’s total expenses exceeded the peer group average for one share class, overall the Fund’s total expenses were reasonable. The Trustees also noted that Janus Capital has contractually agreed to limit the Fund’s expenses, although this limit did not apply because the Fund’s total expenses were already below the applicable fee limit.
· For Janus Forty Fund, the Trustees noted that, although the Fund’s total expenses exceeded the peer group average for certain share classes, overall the Fund’s total expenses were reasonable. The Trustees also noted that Janus Capital has contractually agreed to limit the Fund’s expenses, although this limit did not apply because the Fund’s total expenses were already below the applicable fee limit.
· For Janus Fund, the Trustees noted that the Fund’s total expenses were below the peer group average for all share classes.
· For Janus Growth and Income Fund, the Trustees noted that, although the Fund’s total expenses exceeded the peer group average for certain share classes, overall the Fund’s total expenses were reasonable. The Trustees also noted that Janus Capital has contractually agreed to limit the Fund’s expenses, although this limit did not apply because the Fund’s total expenses were already below the applicable fee limit.
· For Janus Research Fund, the Trustees noted that although the Fund’s total expenses exceeded the peer group average for certain share classes, overall the Fund’s total expenses were reasonable.
· For Janus Triton Fund, the Trustees noted that, although the Fund’s total expenses exceeded the peer group average for one share class, overall the Fund’s total expenses were reasonable. The Trustees also noted that Janus Capital has contractually agreed to limit the Fund’s expenses, although this limit did not apply because the Fund’s total expenses were already below the applicable fee limit.
· For Janus Twenty Fund, the Trustees noted that the Fund’s total expenses were below the peer group average for all share classes.
· For Janus Venture Fund, the Trustees noted that, although the Fund’s total expenses exceeded the peer group average for one share class, overall the Fund’s total expenses were reasonable. The Trustees also noted that Janus Capital has contractually agreed to limit the Fund’s expenses, although this limit did not apply because the Fund’s total expenses were already below the applicable fee limit.
Global and International Funds
· For Janus Adaptive Global Allocation Fund, the Trustees noted that, although the Fund’s total expenses exceeded the peer group median for certain share classes, overall the Fund’s total expenses were reasonable. The Trustees also noted that Janus Capital has contractually agreed to limit the Fund’s expenses.
· For Janus Asia Equity Fund, the Trustees noted that, although the Fund’s total expenses exceeded the peer group average for one share class, overall the Fund’s total expenses were reasonable. The Trustees also noted that Janus Capital has contractually agreed to limit the Fund’s expenses.
· For Janus Emerging Markets Fund, the Trustees noted that, although the Fund’s total expenses exceeded the peer group average for one share class, overall the Fund’s total expenses were reasonable. The Trustees also noted that Janus Capital has contractually agreed to limit the Fund’s expenses.
52 | MARCH 31, 2017 |
Janus Asia Equity Fund
Additional Information (unaudited)
· For Janus Global Life Sciences Fund, the Trustees noted that the Fund’s total expenses were below the peer group average for all share classes.
· For Janus Global Real Estate Fund, the Trustees noted that, although the Fund’s total expenses exceeded the peer group average for certain share classes, overall the Fund’s total expenses were reasonable. The Trustees also noted that Janus Capital has contractually agreed to limit the Fund’s expenses, although this limit did not apply because the Fund’s total expenses were already below the applicable fee limit.
· For Janus Global Research Fund, the Trustees noted that the Fund’s total expenses were below the peer group average for all share classes.
· For Janus Global Select Fund, the Trustees noted that the Fund’s total expenses were below the peer group average for all share classes.
· For Janus Global Technology Fund, the Trustees noted that the Fund’s total expenses were below the peer group average for all share classes.
· For Janus International Equity Fund, the Trustees noted that, although the Fund’s total expenses exceeded the peer group average for one share class, overall the Fund’s total expenses were reasonable. The Trustees also noted that Janus Capital has contractually agreed to limit the Fund’s expenses, although this limit did not apply because the Fund’s total expenses were already below the applicable fee limit.
· For Janus Overseas Fund, the Trustees noted that the Fund’s total expenses were below the peer group average for all share classes.
Janus Aspen Series
· For Janus Aspen Balanced Portfolio, the Trustees noted that the Fund’s total expenses were below the peer group average for both share classes.
· For Janus Aspen Enterprise Portfolio, the Trustees noted that the Fund’s total expenses were below the peer group average for both share classes.
· For Janus Aspen Flexible Bond Portfolio, the Trustees noted that, although the Fund’s total expenses exceeded the peer group average for both share classes, overall the Fund’s total expenses were reasonable. The Trustees also noted that Janus Capital has contractually agreed to limit the Fund’s expenses.
· For Janus Aspen Forty Portfolio, the Trustees noted that the Fund’s total expenses were below the peer group average for both share classes.
· For Janus Aspen Global Allocation Portfolio - Moderate, the Trustees noted that, although the Fund’s total expenses exceeded the peer group average for both share classes, overall the Fund’s total expenses were reasonable. The Trustees also noted that Janus Capital has contractually agreed to limit the Fund’s expenses.
· For Janus Aspen Global Research Portfolio, the Trustees noted that the Fund’s total expenses were below the peer group average for both share classes.
· For Janus Aspen Global Technology Portfolio, the Trustees noted that the Fund’s total expenses were below the peer group average for both share classes.
· For Janus Aspen Global Unconstrained Bond Portfolio, the Trustees noted that, although the Fund’s total expenses exceeded the peer group average for both share classes, overall the Fund’s total expenses were reasonable. The Trustees also noted that Janus Capital has contractually agreed to limit the Fund’s expenses.
· For Janus Aspen INTECH U.S. Low Volatility Portfolio, the Trustees noted that the Fund’s total expenses were below the peer group average for its sole share class.
· For Janus Aspen Janus Portfolio, the Trustees noted that the Fund’s total expenses were below the peer group average for both share classes.
· For Janus Aspen Overseas Portfolio, the Trustees noted that the Fund’s total expenses were below the peer group average for both share classes.
Janus Investment Fund | 53 |
Janus Asia Equity Fund
Additional Information (unaudited)
· For Janus Aspen Perkins Mid Cap Value Portfolio, the Trustees noted that the Fund’s total expenses were below the peer group average for both share classes.
The Trustees reviewed information on the profitability to Janus Capital and its affiliates of their relationships with each Fund, as well as an explanation of the methodology utilized by Janus Capital when allocating various expenses of Janus Capital and its affiliates with respect to contractual relationships with the Funds and other clients. The Trustees also reviewed the financial statements and corporate structure of Janus Capital’s parent company. In their review, the Trustees considered whether Janus Capital and each subadviser receive adequate incentives and resources to manage the Funds effectively. The Trustees recognized that profitability comparisons among fund managers are difficult because very little comparative information is publicly available, and the profitability of any fund manager is affected by numerous factors, including the organizational structure of the particular fund manager, the types of funds and other accounts it manages, possible other lines of business, the methodology for allocating expenses, and the fund manager’s capital structure and cost of capital. However, taking into account those factors and the analysis provided by the Trustees’ independent fee consultant, and based on the information available, the Trustees concluded that Janus Capital’s profitability with respect to each Fund in relation to the services rendered was reasonable.
The independent fee consultant found that, while assessing the reasonableness of expenses in light of Janus Capital’s profits is dependent on comparisons with other publicly-traded mutual fund advisers, and that these comparisons are limited in accuracy by differences in complex size, business mix, institutional account orientation, and other factors, after accepting these limitations, the level of profit earned by Janus Capital from managing the Funds is reasonable.
The Trustees concluded that the management fees payable by each Fund to Janus Capital and its affiliates, as well as the fees paid by Janus Capital to the subadvisers of subadvised Funds, were reasonable in relation to the nature, extent, and quality of the services provided, taking into account the fees charged by other advisers for managing comparable mutual funds with similar strategies, the fees Janus Capital and the subadvisers charge to other clients, and, as applicable, the impact of fund performance on management fees payable by the Funds. The Trustees also concluded that each Fund’s total expenses were reasonable, taking into account the size of the Fund, the quality of services provided by Janus Capital and any subadviser, the investment performance of the Fund, and any expense limitations agreed to or provided by Janus Capital.
Economies of Scale
The Trustees considered information about the potential for Janus Capital to realize economies of scale as the assets of the Funds increase. They noted their independent fee consultant’s analysis of economies of scale in prior years. They also noted that, although many Funds pay advisory fees at a base fixed rate as a percentage of net assets, without any breakpoints, their independent fee consultant concluded that 91% of these Funds have contractual management fees (gross of waivers) below their Broadridge expense group averages and, overall, 83% of the Funds are below their respective expense group averages for contractual management fees. They also noted that for those Funds whose expenses are being reduced by the contractual expense limitations of Janus Capital, Janus Capital is subsidizing the Funds because they have not reached adequate scale. Moreover, as the assets of some of the Funds have declined in the past few years, certain Funds have benefited from having advisory fee rates that have remained constant rather than increasing as assets declined. In addition, performance fee structures have been implemented for various Funds that have caused the effective rate of advisory fees payable by such a Fund to vary depending on the investment performance of the Fund relative to its benchmark index over the measurement period; and a few Funds have fee schedules with breakpoints and reduced fee rates above certain asset levels. The Trustees also noted that the Funds share directly in economies of scale through the lower charges of third-party service providers that are based in part on the combined scale of all of the Funds. Based on all of the information they reviewed, including past research and analysis conducted by the Trustees’ independent fee consultant, the Trustees concluded that the current fee structure of each Fund was reasonable and that the current rates of fees do reflect a sharing between Janus Capital and the Fund of any economies of scale that may be present at the current asset level of the Fund.
The independent fee consultant concluded that, given the limitations of various analytical approaches to economies of scale considered in prior years, and their conflicting results, its analyses could not confirm or deny the existence of economies of scale in the Janus complex. Further, the independent fee consultant provided its belief that Fund investors are well-served by the fee levels and performance fee structures in place on the Funds in light of any economies of scale that may be present at Janus Capital.
54 | MARCH 31, 2017 |
Janus Asia Equity Fund
Additional Information (unaudited)
Other Benefits to Janus Capital
The Trustees also considered benefits that accrue to Janus Capital and its affiliates and subadvisers to the Funds from their relationships with the Funds. They recognized that two affiliates of Janus Capital separately serve the Funds as transfer agent and distributor, respectively, and the transfer agent receives compensation directly from the non-money market funds for services provided. The Trustees also considered Janus Capital’s past and proposed use of commissions paid by the Funds on portfolio brokerage transactions to obtain proprietary and third-party research products and services benefiting the Fund and/or other clients of Janus Capital and/or Janus Capital, and/or a subadviser to a Fund. The Trustees concluded that Janus Capital’s and the subadvisers’ use of these types of client commission arrangements to obtain proprietary and third-party research products and services was consistent with regulatory requirements and guidelines and was likely to benefit each Fund. The Trustees also concluded that, other than the services provided by Janus Capital and its affiliates and subadvisers pursuant to the agreements and the fees to be paid by each Fund therefor, the Funds and Janus Capital and the subadvisers may potentially benefit from their relationship with each other in other ways. They concluded that Janus Capital and/or the subadvisers benefits from the receipt of research products and services acquired through commissions paid on portfolio transactions of the Funds and that the Funds benefit from Janus Capital’s and/or the subadvisers’ receipt of those products and services as well as research products and services acquired through commissions paid by other clients of Janus Capital and/or other clients of the subadvisers. They further concluded that the success of any Fund could attract other business to Janus Capital, the subadvisers or other Janus funds, and that the success of Janus Capital and the subadvisers could enhance Janus Capital’s and the subadvisers’ ability to serve the Funds.
Janus Investment Fund | 55 |
Janus Asia Equity Fund
Useful Information About Your Fund Report (unaudited)
The Management Commentary in this report includes valuable insight as well as statistical information to help you understand how your Fund’s performance and characteristics stack up against those of comparable indices.
If the Fund invests in foreign securities, this report may include information about country exposure. Country exposure is based primarily on the country of risk. A company may be allocated to a country based on other factors such as location of the company’s principal office, the location of the principal trading market for the company’s securities, or the country where a majority of the company’s revenues are derived.
Please keep in mind that the opinions expressed in the Management Commentary are just that: opinions. They are a reflection based on best judgment at the time this report was compiled, which was March 31, 2017. As the investing environment changes, so could opinions. These views are unique and are not necessarily shared by fellow employees or by Janus in general.
Performance Overviews
Performance overview graphs compare the performance of a hypothetical $10,000 investment in the Fund with one or more widely used market indices. When comparing the performance of the Fund with an index, keep in mind that market indices are not available for investment and do not reflect deduction of expenses.
Average annual total returns are quoted for a Fund with more than one year of performance history. Average annual total return is calculated by taking the growth or decline in value of an investment over a period of time, including reinvestment of dividends and distributions, then calculating the annual compounded percentage rate that would have produced the same result had the rate of growth been constant throughout the period. Average annual total return does not reflect the deduction of taxes that a shareholder would pay on Fund distributions or redemptions of Fund shares.
Cumulative total returns are quoted for a Fund with less than one year of performance history. Cumulative total return is the growth or decline in value of an investment over time, independent of the period of time involved. Cumulative total return does not reflect the deduction of taxes that a shareholder would pay on Fund distributions or redemptions of Fund shares.
Pursuant to federal securities rules, expense ratios shown in the performance chart reflect subsidized (if applicable) and unsubsidized ratios. The total annual fund operating expenses ratio is gross of any fee waivers, reflecting the Fund’s unsubsidized expense ratio. The net annual fund operating expenses ratio (if applicable) includes contractual waivers of Janus Capital and reflects the Fund’s subsidized expense ratio. Ratios may be higher or lower than those shown in the “Financial Highlights” in this report.
Schedule of Investments
Following the performance overview section is the Fund’s Schedule of Investments. This schedule reports the types of securities held in the Fund on the last day of the reporting period. Securities are usually listed by type (common stock, corporate bonds, U.S. Government obligations, etc.) and by industry classification (banking, communications, insurance, etc.). Holdings are subject to change without notice.
The value of each security is quoted as of the last day of the reporting period. The value of securities denominated in foreign currencies is converted into U.S. dollars.
If the Fund invests in foreign securities, it will also provide a summary of investments by country. This summary reports the Fund exposure to different countries by providing the percentage of securities invested in each country. The country of each security represents the country of risk. The Fund’s Schedule of Investments relies upon the industry group and country classifications published by Barclays and/or MSCI Inc.
Tables listing details of individual forward currency contracts, futures, written options, swaptions, and swaps follow the Fund’s Schedule of Investments (if applicable).
Statement of Assets and Liabilities
This statement is often referred to as the “balance sheet.” It lists the assets and liabilities of the Fund on the last day of the reporting period.
The Fund’s assets are calculated by adding the value of the securities owned, the receivable for securities sold but not yet settled, the receivable for dividends declared but not yet received on securities owned, and the receivable for Fund
56 | MARCH 31, 2017 |
Janus Asia Equity Fund
Useful Information About Your Fund Report (unaudited)
shares sold to investors but not yet settled. The Fund’s liabilities include payables for securities purchased but not yet settled, Fund shares redeemed but not yet paid, and expenses owed but not yet paid. Additionally, there may be other assets and liabilities such as unrealized gain or loss on forward currency contracts.
The section entitled “Net Assets Consist of” breaks down the components of the Fund’s net assets. Because the Fund must distribute substantially all earnings, you will notice that a significant portion of net assets is shareholder capital.
The last section of this statement reports the net asset value (“NAV”) per share on the last day of the reporting period. The NAV is calculated by dividing the Fund’s net assets for each share class (assets minus liabilities) by the number of shares outstanding.
Statement of Operations
This statement details the Fund’s income, expenses, realized gains and losses on securities and currency transactions, and changes in unrealized appreciation or depreciation of Fund holdings.
The first section in this statement, entitled “Investment Income,” reports the dividends earned from securities and interest earned from interest-bearing securities in the Fund.
The next section reports the expenses incurred by the Fund, including the advisory fee paid to the investment adviser, transfer agent fees and expenses, and printing and postage for mailing statements, financial reports and prospectuses. Expense offsets and expense reimbursements, if any, are also shown.
The last section lists the amounts of realized gains or losses from investment and foreign currency transactions, and changes in unrealized appreciation or depreciation of investments and foreign currency-denominated assets and liabilities. The Fund will realize a gain (or loss) when it sells its position in a particular security. A change in unrealized gain (or loss) refers to the change in net appreciation or depreciation of the Fund during the reporting period. “Net Realized and Unrealized Gain/(Loss) on Investments” is affected both by changes in the market value of Fund holdings and by gains (or losses) realized during the reporting period.
Statements of Changes in Net Assets
These statements report the increase or decrease in the Fund’s net assets during the reporting period. Changes in the Fund’s net assets are attributable to investment operations, dividends and distributions to investors, and capital share transactions. This is important to investors because it shows exactly what caused the Fund’s net asset size to change during the period.
The first section summarizes the information from the Statement of Operations regarding changes in net assets due to the Fund’s investment operations. The Fund’s net assets may also change as a result of dividend and capital gains distributions to investors. If investors receive their dividends and/or distributions in cash, money is taken out of the Fund to pay the dividend and/or distribution. If investors reinvest their dividends and/or distributions, the Fund’s net assets will not be affected. If you compare the Fund’s “Net Decrease from Dividends and Distributions” to “Reinvested Dividends and Distributions,” you will notice that dividends and distributions have little effect on the Fund’s net assets. This is because the majority of the Fund’s investors reinvest their dividends and/or distributions.
The reinvestment of dividends and distributions is included under “Capital Share Transactions.” “Capital Shares” refers to the money investors contribute to the Fund through purchases or withdrawals via redemptions. The Fund’s net assets will increase and decrease in value as investors purchase and redeem shares from the Fund.
Financial Highlights
This schedule provides a per-share breakdown of the components that affect the Fund’s NAV for current and past reporting periods as well as total return, asset size, ratios, and portfolio turnover rate.
The first line in the table reflects the NAV per share at the beginning of the reporting period. The next line reports the net investment income/(loss) per share. Following is the per share total of net gains/(losses), realized and unrealized. Per share dividends and distributions to investors are then subtracted to arrive at the NAV per share at the end of the period. The next line reflects the total return for the period. The total return may include adjustments in accordance with generally accepted accounting principles required at the period end for financial reporting purposes. As a result, the total return may differ from the total return reflected for individual shareholder transactions. Also included are ratios of expenses and net investment income to average net assets.
Janus Investment Fund | 57 |
Janus Asia Equity Fund
Useful Information About Your Fund Report (unaudited)
The Fund’s expenses may be reduced through expense offsets and expense reimbursements. The ratios shown reflect expenses before and after any such offsets and reimbursements.
The ratio of net investment income/(loss) summarizes the income earned less expenses, divided by the average net assets of the Fund during the reporting period. Do not confuse this ratio with the Fund’s yield. The net investment income ratio is not a true measure of the Fund’s yield because it does not take into account the dividends distributed to the Fund’s investors.
The next figure is the portfolio turnover rate, which measures the buying and selling activity in the Fund. Portfolio turnover is affected by market conditions, changes in the asset size of the Fund, fluctuating volume of shareholder purchase and redemption orders, the nature of the Fund’s investments, and the investment style and/or outlook of the portfolio manager(s) and/or investment personnel. A 100% rate implies that an amount equal to the value of the entire portfolio was replaced once during the fiscal year; a 50% rate means that an amount equal to the value of half the portfolio is traded in a year; and a 200% rate means that an amount equal to the value of the entire portfolio is traded every six months.
58 | MARCH 31, 2017 |
Janus Asia Equity Fund
Notes
NotesPage1
Janus Investment Fund | 59 |
Janus Asia Equity Fund
Notes
NotesPage2
60 | MARCH 31, 2017 |
Janus Asia Equity Fund
Notes
NotesPage3
Janus Investment Fund | 61 |
Janus provides access to a wide range of investment disciplines.
Alternative
Janus alternative funds seek to deliver strong risk-adjusted returns over a full market cycle with lower correlation to equity markets than traditional investments.
Asset Allocation
Janus’ asset allocation funds utilize our fundamental, bottom-up research to balance risk over the long term. From fund options that meet investors’ risk tolerance and objectives to a method that incorporates non-traditional investment choices to seek non-correlated sources of risk and return, Janus’ asset allocation funds aim to allocate risk more effectively.
Fixed Income
Janus fixed income funds attempt to provide less risk relative to equities while seeking to deliver a competitive total return through high current income and appreciation. Janus money market funds seek capital preservation and liquidity with current income as a secondary objective.
Global & International
Janus global and international funds seek to leverage Janus’ research capabilities by taking advantage of inefficiencies in foreign markets, where accurate information and analytical insight are often at a premium.
Growth & Core
Janus growth funds focus on companies believed to be the leaders in their respective industries, with solid management teams, expanding market share, margins and efficiencies. Janus core funds seek investments in more stable and predictable companies. Our core funds look for a strategic combination of steady growth and, for certain funds, some degree of income.
Mathematical
Our mathematical funds seek to outperform their respective indices while maintaining a risk profile equal to or lower than the index itself. Managed by INTECH® (a Janus subsidiary), these funds use a mathematical process in an attempt to build a more “efficient” portfolio than the index.
Value
Our value funds, managed by Perkins® (a Janus subsidiary), seek to identify companies with favorable reward to risk characteristics by conducting rigorous downside analysis before determining upside potential.
For more information about our funds, contact your investment professional or go to janus.com/advisor/mutual-funds (or janus.com/allfunds if you hold Shares directly with Janus).
| ||||||||||||
Please consider the charges, risks, expenses and investment objectives carefully before investing. For a prospectus or, if available, a summary prospectus containing this and other information, please call Janus at 877.33JANUS (52687) (or 800.525.3713 if you hold Shares directly with Janus); or download the file from janus.com/info (or janus.com/reports if you hold Shares directly with Janus). Read it carefully before you invest or send money. | ||||||||||||
Janus, INTECH and Perkins are registered trademarks of Janus International Holding LLC. © Janus International Holding LLC. Funds distributed by Janus Distributors LLC | ||||||||||||
Investment products offered are: | NOT FDIC-INSURED | MAY LOSE VALUE | NO BANK GUARANTEE | |||||||||
125-24-93036 05-17 | ||||||||||||

SEMIANNUAL REPORT March 31, 2017 | |||
Janus Balanced Fund | |||
Janus Investment Fund | |||
| |||
HIGHLIGHTS · Portfolio management perspective · Investment strategy behind your fund · Fund performance, characteristics | |||
| |||

Table of Contents
Janus Balanced Fund
Janus Balanced Fund (unaudited)


PERFORMANCE OVERVIEW
Janus Balanced Fund’s Class I Shares returned 7.87% for the six-month period ended March 31, 2017, compared with a 4.47% return by the Balanced Index, an internally calculated blended benchmark. The Balanced Index is composed of a 55% weighting in the S&P 500 Index, the Fund’s primary benchmark, and a 45% weighting in the Bloomberg Barclays U.S. Aggregate Bond Index, the Fund’s secondary benchmark. During the period the S&P 500 Index returned 10.12%, while the Bloomberg Barclays U.S. Aggregate Bond Index fell -2.18%.
INVESTMENT ENVIRONMENT
U.S. equity markets swung from caution to optimism and delivered strong gains. Stocks began their rally after the election of Donald Trump in November and continued to climb in the early months of 2017 on expectations that the new administration would champion pro-growth initiatives. Several equity indices reached record highs during the period. Positive economic data also helped drive returns. Gains in nonfarm payrolls accelerated, average hourly wages registered their highest year-over-year increase since 2009, and a key U.S. manufacturing survey hit a recent high. Such signs of growth helped prompt the Federal Reserve (Fed) to raise its benchmark interest rate two times, once in December and again in March.
The strong equity rally began to wane in March, however. The Trump administration’s failure to pass a replacement for the Affordable Care Act (ACA) raised concerns that other anticipated reforms would not be successful. At the sector level, financials delivered the strongest performance, followed by technology and industrials. Energy, meanwhile, slipped as a result of a ramp-up in U.S. oil production toward the end of the period and a decrease in global crude prices.
Corporate credit spreads tightened early on amid high expectations for President Trump’s policy agenda. However, in the latter part of the period, corporate bonds, as well as Treasurys, were largely range-bound as market participants began reassessing the Trump reflation trade and the government’s ability to effectively implement reforms. Investment-grade and high-yield corporate spreads ultimately finished tighter, supported in part by decent company fundamentals and synchronous global growth. Rates rose across the Treasury curve with the yield on the 10-year note ending March at 2.39%, up from 1.59% in September.
PERFORMANCE DISCUSSION
The Fund, which seeks to provide more consistent returns over time by allocating across the spectrum of fixed income and equity securities, outperformed the Balanced Index, its blended benchmark of the S&P 500 Index (55%) and the Bloomberg Barclays U.S. Aggregate Bond Index (45%). The Fund underperformed its primary benchmark, the S&P 500 Index, but outperformed its secondary benchmark, the Bloomberg Barclays U.S. Aggregate Bond Index.
The equity-to-fixed-income allocation ended the period with an equity weighting of approximately 64%, a fixed income weighting of approximately 36% and a small portion in cash. Our equity allocation may vary based on market conditions, and the current level reflects our view that on a risk-adjusted basis, equities present greater opportunity for returns in the present environment.
The Fund’s equity sleeve outperformed its benchmark, the S&P 500 Index. Outperformance was largely driven by our stock selection in the industrials sector. The sector as a whole benefited from a proposed increase in infrastructure spending by the Trump administration. Our significant underweight allocation in energy also proved beneficial as the sector struggled with volatility in crude oil prices near period end. Strong security selection in consumer staples further contributed to relative performance in the equity sleeve. Individual issuers Boeing, CSX and Microsoft were top performing stocks.
Janus Investment Fund | 1 |
Janus Balanced Fund (unaudited)
Boeing was the largest contributor. The airplane manufacturer rose early in the period on optimism that defense spending will increase under the Trump administration: about 40% of Boeing’s business is geared toward the defense industry. Boeing also reported stronger-than-expected fourth quarter earnings. Additionally, global air traffic continues to grow, which means more wear and tear on jets and, as a result, the faster replacement of planes – providing a favorable backdrop for the company’s commercial airplane business. We like Boeing’s ability to generate free cash flow, which management often returns to shareholders, and appreciate the recent dividend increase.
CSX was another leading contributor to performance. The stock was up after an announcement that a new CEO with a history of improving operations at railroad companies was taking the helm at the company. We had long believed that CSX’s operating underperformance relative to other railroad companies made it rife for improvement, and believe better results will follow the new leadership. As CSX focuses on improving its service and reliability to customers, we believe it will continue to drive more shippers to use the railway instead of trucking services.
Microsoft was another key contributor. The tech giant reported strong earnings results for multiple consecutive quarters, thanks in large part to its cloud computing business, Azure. We are increasingly positive on the migration of companies to the cloud, and Microsoft is now the second-largest provider of cloud-based IT services. We also think the company has deftly managed the transition of its legacy software business from perpetual licenses that consumers must purchase to subscription-based licenses. The stock has been up as the market has come to appreciate how management has transformed itself from a legacy software company and how it is positioned for future growth. At the same time, Microsoft has been aggressive in reducing costs, buying back shares and paying dividends to shareholders.
Our security selection in financials did not keep pace with the broader sector during the quarter and weighed on relative results. Security selection in health care also detracted on a relative basis; the sector as a whole was challenged amid continued scrutiny over drug pricing practices and uncertainty around the effect of potential new fiscal policies. Our holdings in information technology held back relative performance, although this was largely due to our underweight allocation in the strong performing sector. On an individual basis, detractors were led by Mattel, Medtronic and Colony NorthStar.
Mattel was the largest individual detractor during the period. The stock was down after a pre-announced earnings miss on lower revenue, due in part to a slowdown in toy sales during the holidays. We continue to like the company, however. We believe Mattel is innovating some of its key toy brands and also believe the new CEO is a good fit to handle the channel disruption facing retailers as more sales move online.
Medtronic also weighed on results. The medical-device maker faced challenges early in the period after making downward revisions to earnings guidance. In addition, the company misanalysed the replacement cycle of cardiac rhythm management devices (such as pacemakers and defibrillators), and overseas sales declined. The stock regained ground on a decent fiscal third quarter earnings report, and revenues could improve further as patients eventually adopt new products, such as Medtronic’s automated insulin-delivery device for type 1 diabetes, approved by the Food and Drug Administration (FDA) in 2016.
Another detractor was Colony NorthStar, the result of a recent merger between global real estate and investment management firm Colony Capital and sister firms NorthStar Asset Management Group and NorthStar Realty Finance. We believe the merger complements Colony’s existing real estate business and will be very accretive to profits. Although the stock underperformed after management reduced guidance for 2017, we view this as a one-time reset. We believe there is substantial growth potential for the newly merged company.
The Fund’s fixed income sleeve outperformed its benchmark, the Bloomberg Barclays U.S. Aggregate Bond Index. We maintained our opportunistic approach to corporate credit during the period. Our analysts continued to identify opportunities in bank loans, the lower rated tiers of investment grade and shorter dated issues within high yield. We adopted a defensive stance on rates, due to a stronger economic outlook coupled with an active Fed. While we added back duration in 2017 – as we anticipate growth and inflation to be muted compared with expectations in the days following the election of President Trump – we remain defensively positioned. Duration of the fixed income sleeve ended March at 96% of the benchmark.
Our corporate credit positioning drove relative outperformance. Within investment-grade, both our
2 | MARCH 31, 2017 |
Janus Balanced Fund (unaudited)
overweight allocation and focus on short- and intermediate-dated issues proved beneficial. Our emphasis on owning securities in the lowest tier of investment-grade ratings aided relative results, as “riskier” assets performed well during the period. For similar reasons, an out-of-index allocation to high yield contributed positively to performance. Our focus on securities that can provide greater spread carry than the index also contributed on a relative basis. Carry is a measure of excess income generated by the Fund’s holdings.
At the credit sector level, banking and brokerage, asset managers and exchanges were among the leading relative contributors. Financials generally benefited from the prospect of a more relaxed regulatory environment under the Trump administration and rising interest rates, which bolster bank profitability. Security selection further contributed to outperformance in the banking sector, largely due to preferred exposure and bank hybrids, which behave akin to high-yield corporate credit. Within brokerage, asset managers and exchanges, our position in Neuberger Berman aided relative performance. The asset manager brought a new 10-year issue that highlighted the relative attractiveness of the company’s existing debt, and our longer dated position benefited from significant spread tightening. Our shorter dated holdings were called in the refinancing initiative. We continue to like the company’s conservative management team and its commitment to reducing leverage.
The technology sector was also accretive. Improving global growth and the anticipation of greater capital investment lifted the sector as a whole. A position in Seagate Technology also performed well and contributed to relative results. The issuer benefitted from an uptick in demand for personal computers and enterprise infrastructure during the period.
AT&T was another leading individual contributor on a relative basis, largely due to our duration underweight. The announcement of AT&T’s acquisition of media company Time Warner resulted in general spread widening in the name as investors anticipate the merger to come with a large debt issuance and a credit downgrade. The news had minimal impact on the front-end paper we own.
No corporate credit sector materially detracted from relative performance. At the individual issuer level, our exposure to Anheuser-Busch InBev weighed marginally on results, largely due to our duration positioning. We continue to like the name, believing the synergies gained from the multinational beverage and brewing company’s merger with SABMiller will be beneficial in driving earnings growth. We also appreciate the management team’s plans to delever and improve the balance sheet post-merger.
On an asset class level, U.S. Treasurys were the largest detractor. Our yield curve positioning hindered relative performance, although this was partially offset by our underweight allocation. Exposure to U.S. mortgage-backed securities (MBS) also weighed on relative results. Commercial mortgage-backed securities (CMBS) boosted performance. Our CMBS exposure is concentrated in securities in which our analysts can form a constructive fundamental view on the underlying assets. We allocate to higher quality, shorter duration positions that we believe can offer cash flow stability. Our out-of-index allocation to bank loans further supported results. The coupons on these floating-rate instruments will benefit from a tightening Fed and subsequently higher LIBOR rates. In the months ahead, we expect loans – which have a senior position in the capital structure – to offer stable and attractive risk-adjusted opportunities with lower volatility than the high-yield market.
OUTLOOK
In our view, U.S. equities remain well positioned. Despite historically high valuations, stocks continue to present stronger risk-adjusted opportunities relative to fixed income. As such, we intend to maintain our overweight allocation to equities as we move into the second quarter. Additionally, equities are set to benefit from both the strengthening U.S. economy and business-friendly fiscal initiatives. Although the recent failure of the ACA replacement plan has raised concerns about the Trump administration’s ability to execute on other areas of its policy agenda, we remain optimistic that some pro-business changes can be made. Given the possibility of future volatility, however, we remain focused on finding companies that can continue to grow earnings and free cash flow over the long term.
Continued improvement in the U.S. economy will afford the Fed the ability to tighten further in 2017. As the Fed seeks to normalize interest rates, we believe increases will be measured in order to avoid derailing economic growth. Shifting monetary policy may pressure front-end yields higher; however, attractive returns relative to other safe-haven debt should entice foreign buyers and keep Treasurys range-bound, particularly on the long end of the curve.
Janus Investment Fund | 3 |
Janus Balanced Fund (unaudited)
Both investment-grade and high-yield corporate credit spreads have compressed through their 10-year averages, and demand remains robust. With rates set to rise, we are closely watching the ability for spreads to hold near current levels. Successful implementation of tax reforms, deregulation initiatives and infrastructure spending could bolster corporate fundamentals and support further spread tightening. However, we expect spreads to trade in a tighter band as investors await the next steps. Within the fixed income sleeve, our focus remains on higher quality business models, free-cash-flow generation potential and management teams committed to a sound balance sheet. In our view, responsible position sizing and security avoidance will be valuable tools in navigating the months ahead. Our objective is to participate in spread tightening while keeping capital preservation at the forefront.
Thank you for investing in the Janus Balanced Fund.
4 | MARCH 31, 2017 |
Janus Balanced Fund (unaudited)
Fund At A Glance
March 31, 2017
5 Top Performers - Holdings |
|
|
| 5 Bottom Performers - Holdings |
| |
Contribution | Contribution | |||||
Boeing Co | 1.37% | Mattel Inc | -0.12% | |||
CSX Corp | 0.89% | Medtronic PLC | -0.11% | |||
Microsoft Corp | 0.77% | Colony NorthStar Inc | -0.10% | |||
Apple Inc | 0.68% | United Parcel Service Inc | -0.03% | |||
CME Group Inc | 0.62% | Suncor Energy Inc | -0.02% | |||
5 Top Performers - Sectors* |
|
|
|
|
| |
Fund | Fund Weighting | S&P 500 Index | ||||
Contribution | (Average % of Equity) | Weighting | ||||
Industrials | 1.49% | 12.95% | 10.16% | |||
Energy | 0.74% | 0.11% | 7.17% | |||
Consumer Staples | 0.70% | 11.66% | 9.47% | |||
Consumer Discretionary | 0.68% | 20.39% | 12.26% | |||
Real Estate | 0.43% | 4.50% | 2.86% | |||
5 Bottom Performers - Sectors* |
|
|
|
|
| |
Fund | Fund Weighting | S&P 500 Index | ||||
Contribution | (Average % of Equity) | Weighting | ||||
Financials | -0.31% | 14.27% | 14.35% | |||
Health Care | -0.22% | 11.70% | 13.93% | |||
Information Technology | -0.08% | 19.62% | 21.28% | |||
Other** | 0.01% | 1.09% | 0.00% | |||
Utilities | 0.12% | 0.00% | 3.15% | |||
Security contribution to performance is measured by using an algorithm that multiplies the daily performance of each security with the previous day’s ending weight in the portfolio and is gross of advisory fees. Fixed income securities and certain equity securities, such as private placements and some share classes of equity securities, are excluded. | ||||||
* | Based on sector classification according to the Global Industry Classification Standard (“GICS”) codes, which are the exclusive property and a service mark of MSCI Inc. and Standard & Poor’s. | |||||
** | Not a GICS classified sector. | |||||
Janus Investment Fund | 5 |
Janus Balanced Fund (unaudited)
Fund At A Glance
March 31, 2017
5 Largest Equity Holdings - (% of Net Assets) | |
Microsoft Corp | |
Software | 3.2% |
Boeing Co | |
Aerospace & Defense | 2.8% |
Mastercard Inc | |
Information Technology Services | 2.7% |
Altria Group Inc | |
Tobacco | 2.4% |
Amgen Inc | |
Biotechnology | 2.3% |
13.4% | |
Asset Allocation - (% of Net Assets) | |||||
Common Stocks | 63.5% | ||||
Corporate Bonds | 17.5% | ||||
Mortgage-Backed Securities | 9.1% | ||||
United States Treasury Notes/Bonds | 4.5% | ||||
Asset-Backed/Commercial Mortgage-Backed Securities | 2.5% | ||||
Bank Loans and Mezzanine Loans | 2.0% | ||||
Investment Companies | 0.8% | ||||
Preferred Stocks | 0.3% | ||||
Other | (0.2)% | ||||
100.0% | |||||
Top Country Allocations - Long Positions - (% of Investment Securities) | |
As of March 31, 2017
| As of September 30, 2016
|
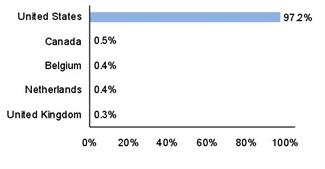
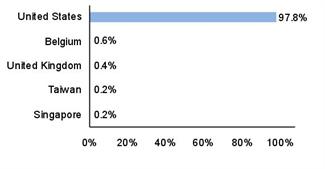
6 | MARCH 31, 2017 |
Janus Balanced Fund (unaudited)
Performance
See important disclosures on the next page. |
| Expense Ratios - | |||||||||
Average Annual Total Return - for the periods ended March 31, 2017 |
|
| per the January 27, 2017 prospectuses | |||||||
|
| Fiscal
| One
| Five | Ten
| Since |
|
| Total Annual Fund
| |
Class A Shares at NAV |
| 7.69% | 10.46% | 7.92% | 7.13% | 9.50% |
|
| 0.94% | |
Class A Shares at MOP |
| 1.49% | 4.11% | 6.64% | 6.50% | 9.24% |
|
|
| |
Class C Shares at NAV | 7.34% | 9.70% | 7.14% | 6.35% | 8.83% |
|
| 1.67% | ||
Class C Shares at CDSC |
| 6.34% | 8.70% | 7.14% | 6.35% | 8.83% |
|
|
| |
Class D Shares(1) |
| 7.80% | 10.67% | 8.16% | 7.30% | 9.58% |
|
| 0.73% | |
Class I Shares |
| 7.87% | 10.77% | 8.22% | 7.23% | 9.55% |
|
| 0.67% | |
Class N Shares |
| 7.88% | 10.86% | 8.05% | 7.23% | 9.55% |
|
| 0.59% | |
Class R Shares |
| 7.47% | 10.00% | 7.51% | 6.68% | 9.12% |
|
| 1.34% | |
Class S Shares |
| 7.60% | 10.27% | 7.77% | 6.95% | 9.34% |
|
| 1.09% | |
Class T Shares |
| 7.76% | 10.54% | 8.05% | 7.23% | 9.55% |
|
| 0.84% | |
S&P 500 Index |
| 10.12% | 17.17% | 13.30% | 7.51% | 9.50% |
|
|
| |
Bloomberg Barclays U.S. Aggregate Bond Index |
| -2.18% | 0.44% | 2.34% | 4.27% | 5.51% |
|
|
| |
Balanced Index |
| 4.47% | 9.42% | 8.39% | 6.34% | 7.98% |
|
|
| |
Morningstar Quartile - Class T Shares |
| - | 2nd | 2nd | 1st | 1st |
|
|
| |
Morningstar Ranking - based on total returns for Allocation - 50% to 70% Equity Funds |
| - | 354/853 | 196/720 | 29/563 | 18/198 |
|
|
| |
Returns quoted are past performance and do not guarantee future results; current performance may be lower or higher. Investment returns and principal value will vary; there may be a gain or loss when shares are sold. For the most recent month-end performance call 877.33JANUS(52687) (or 800.525.3713 if you hold shares directly with Janus Capital) or visit janus.com/advisor/mutual-funds (or janus.com/allfunds if you hold shares directly with Janus Capital).
Maximum Offering Price (MOP) returns include the maximum sales charge of 5.75%. Net Asset Value (NAV) returns exclude this charge, which would have reduced returns.
Janus Investment Fund | 7 |
Janus Balanced Fund (unaudited)
Performance
Performance may be affected by risks that include those associated with non-diversification, portfolio turnover, short sales, potential conflicts of interest, foreign and emerging markets, initial public offerings (IPOs), high-yield and high-risk securities, undervalued, overlooked and smaller capitalization companies, real estate related securities including Real Estate Investment Trusts (REITs), derivatives, and commodity-linked investments. Each product has different risks. Please see the prospectus for more information about risks, holdings and other details.
Returns include reinvestment of all dividends and distributions and do not reflect the deduction of taxes that a shareholder would pay on Fund distributions or redemptions of Fund shares. The returns do not include adjustments in accordance with generally accepted accounting principles required at the period end for financial reporting purposes.
See Financial Highlights for actual expense ratios during the reporting period.
Class A Shares, Class C Shares, Class R Shares, and Class S Shares commenced operations on July 6, 2009. Performance shown for each class for periods prior to July 6, 2009, reflects the performance of the Fund’s Class J Shares, the initial share class (renamed Class T Shares effective February 16, 2010), calculated using the fees and expenses of each respective class, without the effect of any fee and expense limitations or waivers.
Class D Shares commenced operations on February 16, 2010. Performance shown for periods prior to February 16, 2010, reflects the performance of the Fund’s former Class J Shares, calculated using the fees and expenses in effect during the periods shown, net of any applicable fee and expense limitations or waivers.
Class I Shares commenced operations on July 6, 2009. Performance shown for periods prior to July 6, 2009, reflects the performance of the Fund’s former Class J Shares, calculated using the fees and expenses of Class J Shares, net of any applicable fee and expense limitations or waivers.
Class N Shares commenced operations on May 31, 2012. Performance shown for periods prior to May 31, 2012, reflects the performance of the Fund’s Class T Shares, calculated using the fees and expenses of Class T Shares, net of any applicable fee and expense limitations or waivers.
If each share class of the Fund had been available during periods prior to its commencement, the performance shown may have been different. The performance shown for periods following the Fund's commencement of each share class reflects the fees and expenses of each respective share class, net of any applicable fee and expense limitations or waivers. Please refer to the Fund's prospectuses for further details concerning historical performance.
Ranking is for the share class shown only; other classes may have different performance characteristics. When an expense waiver is in effect, it may have a material effect on the total return, and therefore the ranking for the period.
© 2017 Morningstar, Inc. All Rights Reserved.
There is no assurance that the investment process will consistently lead to successful investing.
See Notes to Schedule of Investments and Other Information for index definitions.
Index performance does not reflect the expenses of managing a portfolio as an index is unmanaged and not available for direct investment.
See “Useful Information About Your Fund Report.”
*The Fund’s inception date – September 1, 1992
(1) Closed to certain new investors.
8 | MARCH 31, 2017 |
Janus Balanced Fund (unaudited)
Expense Examples
As a shareholder of the Fund, you incur two types of costs: (1) transaction costs, such as sales charges (loads) on purchase payments (applicable to Class A Shares only); and (2) ongoing costs, including management fees; 12b-1 distribution and shareholder servicing fees; transfer agent fees and expenses payable pursuant to the Transfer Agency Agreement; and other Fund expenses. This example is intended to help you understand your ongoing costs (in dollars) of investing in the Fund and to compare these costs with the ongoing costs of investing in other mutual funds. To do so, compare this 5% hypothetical example with the 5% hypothetical examples that appear in the shareholder reports of the other funds. The example is based upon an investment of $1,000 invested at the beginning of the period and held for the six-months indicated, unless noted otherwise in the table and footnotes below.
Actual Expenses
The information in the table under the heading “Actual” provides information about actual account values and actual expenses. You may use the information in these columns, together with the amount you invested, to estimate the expenses that you paid over the period. Simply divide your account value by $1,000 (for example, an $8,600 account value divided by $1,000 = 8.6), then multiply the result by the number in the appropriate column for your share class under the heading entitled “Expenses Paid During Period” to estimate the expenses you paid on your account during the period.
Hypothetical Example for Comparison Purposes
The information in the table under the heading “Hypothetical (5% return before expenses)” provides information about hypothetical account values and hypothetical expenses based upon the Fund’s actual expense ratio and an assumed rate of return of 5% per year before expenses, which is not the Fund’s actual return. The hypothetical account values and expenses may not be used to estimate the actual ending account balance or expenses you paid for the period. You may use this information to compare the ongoing costs of investing in the Fund and other funds. To do so, compare this 5% hypothetical example with the 5% hypothetical examples that appear in the shareholder reports of the other funds. Additionally, for an analysis of the fees associated with an investment in any share class or other similar funds, please visit www.finra.org/fundanalyzer.
Please note that the expenses shown in the table are meant to highlight your ongoing costs only and do not reflect any transaction costs. These fees are fully described in the Fund’s prospectuses. Therefore, the hypothetical examples are useful in comparing ongoing costs only, and will not help you determine the relative total costs of owning different funds. In addition, if these transaction costs were included, your costs would have been higher.
Actual | Hypothetical | |||||||||
| Beginning | Ending | Expenses |
| Beginning | Ending | Expenses | Net Annualized | ||
Class A Shares | $1,000.00 | $1,076.90 | $4.87 |
| $1,000.00 | $1,020.24 | $4.73 | 0.94% | ||
Class C Shares | $1,000.00 | $1,073.40 | $8.32 |
| $1,000.00 | $1,016.90 | $8.10 | 1.61% | ||
Class D Shares | $1,000.00 | $1,078.00 | $3.78 |
| $1,000.00 | $1,021.29 | $3.68 | 0.73% | ||
Class I Shares | $1,000.00 | $1,078.70 | $3.42 |
| $1,000.00 | $1,021.64 | $3.33 | 0.66% | ||
Class N Shares | $1,000.00 | $1,078.80 | $3.01 |
| $1,000.00 | $1,022.04 | $2.92 | 0.58% | ||
Class R Shares | $1,000.00 | $1,074.70 | $6.88 |
| $1,000.00 | $1,018.30 | $6.69 | 1.33% | ||
Class S Shares | $1,000.00 | $1,076.00 | $5.59 |
| $1,000.00 | $1,019.55 | $5.44 | 1.08% | ||
Class T Shares | $1,000.00 | $1,077.60 | $4.30 |
| $1,000.00 | $1,020.79 | $4.18 | 0.83% | ||
† | Expenses Paid During Period are equal to the Net Annualized Expense Ratio multiplied by the average account value over the period, multiplied by 182/365 (to reflect the one-half year period). Expenses in the examples include the effect of applicable fee waivers and/or expense reimbursements, if any. Had such waivers and/or reimbursements not been in effect, your expenses would have been higher. Please refer to the Notes to Financial Statements or the Fund’s prospectuses for more information regarding waivers and/or reimbursements. | |||||||||
Janus Investment Fund | 9 |
Janus Balanced Fund
Schedule of Investments (unaudited)
March 31, 2017
Shares
or | Value | ||||||
Asset-Backed/Commercial Mortgage-Backed Securities – 2.5% | |||||||
AmeriCredit Automobile Receivables 2016-1, 3.5900%, 2/8/22 | $8,345,000 | $8,532,469 | |||||
AmeriCredit Automobile Receivables Trust 2012-4, 3.8200%, 2/10/20 (144A) | 3,848,000 | 3,849,248 | |||||
AmeriCredit Automobile Receivables Trust 2015-2, 3.0000%, 6/8/21 | 5,730,000 | 5,807,383 | |||||
AmeriCredit Automobile Receivables Trust 2016-2, 3.6500%, 5/9/22 | 5,659,000 | 5,796,338 | |||||
Applebee's Funding LLC / IHOP Funding LLC, 4.2770%, 9/5/44 (144A) | 34,080,000 | 33,380,096 | |||||
Banc of America Commercial Mortgage Trust 2007-3, 5.7608%, 6/10/49‡ | 4,946,271 | 4,963,782 | |||||
Capital Auto Receivables Asset Trust 2013-4, 3.8300%, 7/20/22 (144A) | 3,489,000 | 3,526,779 | |||||
CKE Restaurant Holdings Inc, 4.4740%, 3/20/43 (144A) | 15,531,631 | 15,403,486 | |||||
Commercial Mortgage Trust 2007-GG11, 5.8670%, 12/10/49‡ | 3,786,436 | 3,831,253 | |||||
Cosmopolitan Hotel Trust 2016-COSMO, 3.0120%, 11/15/33 (144A)‡ | 2,581,000 | 2,608,388 | |||||
Cosmopolitan Hotel Trust 2016-COSMO, 4.4120%, 11/15/33 (144A)‡ | 3,369,000 | 3,423,673 | |||||
Cosmopolitan Hotel Trust 2016-COSMO, 5.5620%, 11/15/33 (144A)‡ | 7,706,000 | 7,836,292 | |||||
Domino's Pizza Master Issuer LLC, 5.2160%, 1/25/42 (144A) | 6,886,072 | 6,975,818 | |||||
Domino's Pizza Master Issuer LLC, 3.4840%, 10/25/45 (144A) | 15,046,538 | 15,053,068 | |||||
Fannie Mae Connecticut Avenue Securities, 5.8817%, 11/25/24‡ | 1,605,062 | 1,800,739 | |||||
Fannie Mae Connecticut Avenue Securities, 4.9817%, 5/25/25‡ | 2,954,807 | 3,110,281 | |||||
FREMF 2010 K-SCT Mortgage Trust, 2.0000%, 1/25/20 (144A)§ | 11,305,744 | 10,486,561 | |||||
GAHR Commercial Mortgage Trust 2015-NRF, 3.3822%, 12/15/34 (144A)‡ | 3,732,000 | 3,769,363 | |||||
GS Mortgage Securities Corp II, 3.4357%, 12/10/27 (144A)‡ | 9,067,000 | 8,884,314 | |||||
GS Mortgage Securities Corp Trust 2013-NYC5, 3.6490%, 1/10/30 (144A)‡ | 3,713,000 | 3,754,644 | |||||
GSCCRE Commercial Mortgage Trust 2015-HULA, 5.3122%, 8/15/32 (144A)‡ | 7,508,000 | 7,550,153 | |||||
J.P. Morgan Chase Commercial Mortgage Securities Trust 2016-WIKI, | |||||||
3.5537%, 10/5/31 (144A) | 1,629,000 | 1,647,839 | |||||
J.P. Morgan Chase Commercial Mortgage Securities Trust 2016-WIKI, | |||||||
4.0090%, 10/5/31 (144A)‡ | 2,491,000 | 2,499,157 | |||||
JP Morgan Chase Commercial Mortgage Securities Trust 2010-C2, | |||||||
5.5401%, 11/15/43 (144A)‡ | 4,424,000 | 4,490,990 | |||||
JP Morgan Chase Commercial Mortgage Securities Trust 2015-SGP, | |||||||
3.6622%, 7/15/36 (144A)‡ | 2,493,000 | 2,508,564 | |||||
JP Morgan Chase Commercial Mortgage Securities Trust 2015-SGP, | |||||||
5.4122%, 7/15/36 (144A)‡ | 7,936,000 | 8,025,163 | |||||
JP Morgan Chase Commercial Mortgage Securities Trust 2015-UES, | |||||||
3.6210%, 9/5/32 (144A)‡ | 5,266,000 | 5,109,508 | |||||
LB-UBS Commercial Mortgage Trust 2006-C1, 5.2760%, 2/15/41‡ | 2,745,042 | 2,742,977 | |||||
LB-UBS Commercial Mortgage Trust 2007-C2, 5.4930%, 2/15/40‡ | 1,750,386 | 1,751,276 | |||||
LB-UBS Commercial Mortgage Trust 2007-C7, 6.2531%, 9/15/45‡ | 4,526,755 | 4,616,138 | |||||
OSCAR US Funding Trust V, 2.7300%, 12/15/20 (144A) | 2,790,000 | 2,755,549 | |||||
OSCAR US Funding Trust V, 2.9900%, 12/15/23 (144A) | 2,370,000 | 2,327,551 | |||||
Santander Drive Auto Receivables Trust 2013-4, 4.6700%, 1/15/20 (144A) | 10,630,000 | 10,756,327 | |||||
Santander Drive Auto Receivables Trust 2013-A, 4.7100%, 1/15/21 (144A) | 5,664,000 | 5,776,065 | |||||
Santander Drive Auto Receivables Trust 2015-1, 3.2400%, 4/15/21 | 6,009,000 | 6,089,668 | |||||
Santander Drive Auto Receivables Trust 2015-4, 3.5300%, 8/16/21 | 10,292,000 | 10,469,506 | |||||
Starwood Retail Property Trust 2014-STAR, 3.4122%, 11/15/27 (144A)‡ | 3,173,000 | 3,134,091 | |||||
Starwood Retail Property Trust 2014-STAR, 4.1622%, 11/15/27 (144A)‡ | 9,697,000 | 9,286,678 | |||||
Starwood Retail Property Trust 2014-STAR, 5.0622%, 11/15/27 (144A)‡ | 5,140,000 | 4,885,098 | |||||
Taco Bell Funding LLC, 3.8320%, 5/25/46 (144A) | 11,075,345 | 11,227,243 | |||||
Wachovia Bank Commercial Mortgage Trust Series 2007-C31, 5.6600%, 4/15/47‡ | 15,161,961 | 15,212,517 | |||||
Wachovia Bank Commercial Mortgage Trust Series 2007-C33, 6.0531%, 2/15/51‡ | 10,670,119 | 10,707,021 | |||||
Wachovia Bank Commercial Mortgage Trust Series 2007-C34, 6.1316%, 5/15/46‡ | 3,503,121 | 3,515,275 | |||||
Wells Fargo Commercial Mortgage Trust 2014-TISH, 3.6622%, 1/15/27 (144A)‡ | 2,999,000 | 2,934,634 | |||||
Wells Fargo Commercial Mortgage Trust 2014-TISH, 3.1622%, 2/15/27 (144A)‡ | 5,786,000 | 5,894,014 | |||||
Wells Fargo Commercial Mortgage Trust 2014-TISH, 4.1622%, 2/15/27 (144A)‡ | 1,499,000 | 1,516,050 | |||||
Wendys Funding LLC 2015-1, 3.3710%, 6/15/45 (144A) | 18,162,415 | 18,246,761 | |||||
Total Asset-Backed/Commercial Mortgage-Backed Securities (cost $320,196,455) | 318,469,788 | ||||||
Bank Loans and Mezzanine Loans – 2.0% | |||||||
Basic Industry – 0.1% | |||||||
Axalta Coating Systems US Holdings Inc, 3.6468%, 2/1/23(a),‡ | 16,807,007 | 16,937,765 | |||||
Communications – 0.8% | |||||||
Charter Communications Operating LLC, 2.9900%, 7/1/20‡ | 5,275,193 | 5,286,904 | |||||
Charter Communications Operating LLC, 2.9900%, 1/3/21‡ | 6,583,599 | 6,596,766 | |||||
See Notes to Schedule of Investments and Other Information and Notes to Financial Statements. | |
10 | MARCH 31, 2017 |
Janus Balanced Fund
Schedule of Investments (unaudited)
March 31, 2017
Shares
or | Value | ||||||
Bank Loans and Mezzanine Loans – (continued) | |||||||
Communications – (continued) | |||||||
Charter Communications Operating LLC, 3.2322%, 1/15/24‡ | $14,150,070 | $14,211,057 | |||||
Level 3 Financing Inc, 3.2272%, 2/22/24‡ | 34,025,000 | 34,067,531 | |||||
Mission Broadcasting Inc, 3.9428%, 1/17/24(a),‡ | 1,085,517 | 1,093,995 | |||||
Nexstar Broadcasting Inc, 3.9428%, 1/17/24(a),‡ | 11,502,099 | 11,591,930 | |||||
Nielsen Finance LLC, 3.3544%, 10/4/23‡ | 12,481,656 | 12,539,571 | |||||
Zayo Group LLC, 2.9761%, 1/19/21‡ | 994,000 | 998,264 | |||||
Zayo Group LLC, 0%, 1/19/24(a),‡ | 4,116,161 | 4,130,444 | |||||
Zayo Group LLC, 3.5000%, 1/19/24(a),‡ | 8,550,000 | 8,579,668 | |||||
99,096,130 | |||||||
Consumer Cyclical – 0.6% | |||||||
Aramark Services Inc, 0%, 3/28/24(a),‡ | 12,691,000 | 12,754,455 | |||||
Hilton Worldwide Finance LLC, 2.9815%, 10/25/23‡ | 27,615,883 | 27,807,261 | |||||
Hilton Worldwide Finance LLC, 3.5000%, 10/25/23(a),‡ | 715,571 | 720,530 | |||||
KFC Holding Co, 2.9761%, 6/16/23‡ | 27,871,359 | 27,993,436 | |||||
Landry's Inc, 4.0389%, 10/4/23‡ | 13,225,200 | 13,323,985 | |||||
82,599,667 | |||||||
Consumer Non-Cyclical – 0.3% | |||||||
HCA Inc, 3.2322%, 2/15/24‡ | 15,169,980 | 15,291,947 | |||||
JBS USA LUX SA, 3.2889%, 10/30/22(a),‡ | 12,881,000 | 12,921,318 | |||||
Quintiles IMS Inc, 3.0508%, 3/7/24‡ | 7,790,185 | 7,850,559 | |||||
36,063,824 | |||||||
Finance Companies – 0.1% | |||||||
Avolon TLB Borrower 1 US LLC, 3.7283%, 3/21/22(a),‡ | 7,278,000 | 7,372,032 | |||||
Technology – 0.1% | |||||||
CommScope Inc, 3.4822%, 12/29/22‡ | 15,467,989 | 15,569,459 | |||||
Total Bank Loans and Mezzanine Loans (cost $257,352,554) | 257,638,877 | ||||||
Corporate Bonds – 17.5% | |||||||
Asset-Backed Securities – 0.1% | |||||||
American Tower Trust #1, 1.5510%, 3/15/18 (144A) | 11,961,000 | 11,932,235 | |||||
Banking – 2.7% | |||||||
Ally Financial Inc, 3.2500%, 11/5/18 | 6,034,000 | 6,075,514 | |||||
Ally Financial Inc, 8.0000%, 12/31/18 | 2,458,000 | 2,654,640 | |||||
Bank of America Corp, 5.7000%, 5/2/17 | 7,349,000 | 7,373,178 | |||||
Bank of America Corp, 2.5030%, 10/21/22 | 26,409,000 | 25,721,811 | |||||
Bank of America Corp, 4.1830%, 11/25/27 | 25,022,000 | 25,111,354 | |||||
Citigroup Inc, 2.4846%, 9/1/23‡ | 12,962,000 | 13,328,825 | |||||
Citigroup Inc, 3.8870%, 1/10/28‡ | 12,739,000 | 12,794,389 | |||||
Citizens Financial Group Inc, 3.7500%, 7/1/24 | 3,710,000 | 3,629,812 | |||||
Citizens Financial Group Inc, 4.3500%, 8/1/25 | 2,547,000 | 2,607,018 | |||||
Citizens Financial Group Inc, 4.3000%, 12/3/25 | 14,237,000 | 14,672,254 | |||||
Credit Suisse AG/New York NY, 1.3750%, 5/26/17 | 15,877,000 | 15,879,493 | |||||
Discover Financial Services, 3.9500%, 11/6/24 | 6,803,000 | 6,812,824 | |||||
Discover Financial Services, 3.7500%, 3/4/25 | 9,272,000 | 9,095,137 | |||||
First Republic Bank/CA, 4.6250%, 2/13/47 | 4,720,000 | 4,698,708 | |||||
Goldman Sachs Capital I, 6.3450%, 2/15/34 | 15,211,000 | 18,233,715 | |||||
Goldman Sachs Group Inc, 3.0000%, 4/26/22 | 16,489,000 | 16,505,571 | |||||
Goldman Sachs Group Inc, 3.7500%, 2/25/26 | 8,893,000 | 8,949,168 | |||||
Intesa Sanpaolo SpA, 5.0170%, 6/26/24 (144A) | 6,701,000 | 6,303,329 | |||||
JPMorgan Chase & Co, 2.2950%, 8/15/21 | 17,126,000 | 16,946,417 | |||||
JPMorgan Chase & Co, 3.3750%, 5/1/23 | 17,645,000 | 17,671,467 | |||||
JPMorgan Chase & Co, 3.8750%, 9/10/24 | 4,098,000 | 4,153,298 | |||||
Morgan Stanley, 5.5500%, 4/27/17 | 4,243,000 | 4,254,299 | |||||
Morgan Stanley, 2.6250%, 11/17/21 | 12,858,000 | 12,756,165 | |||||
Morgan Stanley, 3.9500%, 4/23/27 | 9,413,000 | 9,320,310 | |||||
Santander UK PLC, 5.0000%, 11/7/23 (144A) | 15,924,000 | 16,592,171 | |||||
SVB Financial Group, 5.3750%, 9/15/20 | 11,476,000 | 12,418,535 | |||||
Synchrony Financial, 3.0000%, 8/15/19 | 5,071,000 | 5,149,631 | |||||
Synchrony Financial, 4.5000%, 7/23/25 | 10,793,000 | 11,075,205 | |||||
See Notes to Schedule of Investments and Other Information and Notes to Financial Statements. | |
Janus Investment Fund | 11 |
Janus Balanced Fund
Schedule of Investments (unaudited)
March 31, 2017
Shares
or | Value | ||||||
Corporate Bonds – (continued) | |||||||
Banking – (continued) | |||||||
UBS AG, 4.7500%, 5/22/23‡ | $8,163,000 | $8,346,667 | |||||
US Bancorp, 2.3750%, 7/22/26 | 12,335,000 | 11,534,212 | |||||
Wells Fargo & Co, 2.1000%, 5/8/17 | 4,078,000 | 4,080,952 | |||||
Wells Fargo & Co, 3.0000%, 4/22/26 | 4,208,000 | 4,029,446 | |||||
Wells Fargo & Co, 5.8750%µ | 7,652,000 | 8,248,412 | |||||
347,023,927 | |||||||
Basic Industry – 0.6% | |||||||
ArcelorMittal, 7.0000%, 2/25/22‡ | 839,000 | 954,262 | |||||
Ashland LLC, 3.8750%, 4/15/18 | 4,918,000 | 4,991,770 | |||||
CF Industries Inc, 6.8750%, 5/1/18 | 1,550,000 | 1,615,875 | |||||
CF Industries Inc, 4.5000%, 12/1/26 (144A) | 12,886,000 | 13,088,310 | |||||
Georgia-Pacific LLC, 3.1630%, 11/15/21 (144A) | 19,032,000 | 19,341,061 | |||||
Georgia-Pacific LLC, 3.6000%, 3/1/25 (144A) | 9,670,000 | 9,875,526 | |||||
Reliance Steel & Aluminum Co, 4.5000%, 4/15/23 | 9,636,000 | 10,054,549 | |||||
Steel Dynamics Inc, 5.0000%, 12/15/26 (144A) | 1,105,000 | 1,118,813 | |||||
Teck Resources Ltd, 8.5000%, 6/1/24 (144A) | 9,059,000 | 10,451,821 | |||||
71,491,987 | |||||||
Brokerage – 1.3% | |||||||
Carlyle Holdings Finance LLC, 3.8750%, 2/1/23 (144A) | 4,956,000 | 5,033,735 | |||||
CBOE Holdings Inc, 3.6500%, 1/12/27 | 9,585,000 | 9,635,245 | |||||
Charles Schwab Corp, 3.0000%, 3/10/25 | 3,863,000 | 3,818,483 | |||||
Charles Schwab Corp, 4.6250%µ | 8,827,000 | 8,694,595 | |||||
Charles Schwab Corp, 7.0000%µ | 10,665,000 | 12,131,437 | |||||
E*TRADE Financial Corp, 5.3750%, 11/15/22 | 12,768,000 | 13,374,378 | |||||
E*TRADE Financial Corp, 4.6250%, 9/15/23 | 17,066,000 | 17,484,117 | |||||
Intercontinental Exchange Inc, 3.7500%, 12/1/25 | 8,245,000 | 8,515,032 | |||||
Lazard Group LLC, 4.2500%, 11/14/20 | 12,785,000 | 13,444,834 | |||||
Neuberger Berman Group LLC / Neuberger Berman Finance Corp, | |||||||
5.8750%, 3/15/22 (144A) | 14,540,000 | 14,967,185 | |||||
Neuberger Berman Group LLC / Neuberger Berman Finance Corp, | |||||||
4.8750%, 4/15/45 (144A) | 13,417,000 | 11,997,978 | |||||
Raymond James Financial Inc, 5.6250%, 4/1/24 | 29,074,000 | 32,701,243 | |||||
Raymond James Financial Inc, 3.6250%, 9/15/26 | 2,879,000 | 2,834,036 | |||||
Scottrade Financial Services Inc, 6.1250%, 7/11/21 (144A) | 4,108,000 | 4,652,906 | |||||
TD Ameritrade Holding Corp, 2.9500%, 4/1/22 | 6,416,000 | 6,494,461 | |||||
TD Ameritrade Holding Corp, 3.6250%, 4/1/25 | 7,318,000 | 7,503,182 | |||||
173,282,847 | |||||||
Capital Goods – 0.7% | |||||||
Arconic Inc, 5.1250%, 10/1/24 | 1,163,000 | 1,201,379 | |||||
Ardagh Packaging Finance PLC / Ardagh Holdings USA Inc, | |||||||
4.2500%, 9/15/22 (144A) | 1,819,000 | 1,836,644 | |||||
Ball Corp, 4.3750%, 12/15/20 | 6,505,000 | 6,813,987 | |||||
CNH Industrial Capital LLC, 3.6250%, 4/15/18 | 7,037,000 | 7,116,166 | |||||
General Electric Co, 5.0000%µ | 12,148,000 | 12,800,955 | |||||
Martin Marietta Materials Inc, 4.2500%, 7/2/24 | 6,362,000 | 6,568,918 | |||||
Masco Corp, 3.5000%, 4/1/21 | 6,269,000 | 6,379,397 | |||||
Masco Corp, 4.3750%, 4/1/26 | 1,050,000 | 1,091,171 | |||||
Owens Corning, 4.2000%, 12/1/24 | 5,859,000 | 6,035,813 | |||||
Owens Corning, 3.4000%, 8/15/26 | 2,816,000 | 2,726,755 | |||||
Rockwell Collins Inc, 3.2000%, 3/15/24 | 5,614,000 | 5,601,784 | |||||
Rockwell Collins Inc, 3.5000%, 3/15/27 | 9,598,000 | 9,601,004 | |||||
Vulcan Materials Co, 7.0000%, 6/15/18 | 7,571,000 | 8,013,480 | |||||
Vulcan Materials Co, 7.5000%, 6/15/21 | 4,284,000 | 5,014,598 | |||||
Vulcan Materials Co, 4.5000%, 4/1/25 | 12,273,000 | 12,906,078 | |||||
93,708,129 | |||||||
Communications – 1.8% | |||||||
American Tower Corp, 3.3000%, 2/15/21 | 10,024,000 | 10,163,805 | |||||
American Tower Corp, 3.4500%, 9/15/21 | 1,037,000 | 1,055,594 | |||||
American Tower Corp, 3.5000%, 1/31/23 | 1,839,000 | 1,849,631 | |||||
See Notes to Schedule of Investments and Other Information and Notes to Financial Statements. | |
12 | MARCH 31, 2017 |
Janus Balanced Fund
Schedule of Investments (unaudited)
March 31, 2017
Shares
or | Value | ||||||
Corporate Bonds – (continued) | |||||||
Communications – (continued) | |||||||
American Tower Corp, 4.4000%, 2/15/26 | $6,568,000 | $6,793,775 | |||||
American Tower Corp, 3.3750%, 10/15/26 | 12,130,000 | 11,563,966 | |||||
AT&T Inc, 3.4000%, 5/15/25 | 1,969,000 | 1,905,244 | |||||
AT&T Inc, 4.2500%, 3/1/27 | 9,290,000 | 9,425,169 | |||||
AT&T Inc, 5.4500%, 3/1/47 | 9,496,000 | 9,668,533 | |||||
BellSouth LLC, 4.4000%, 4/26/17 (144A) | 49,183,000 | 49,285,301 | |||||
CCO Holdings LLC / CCO Holdings Capital Corp, 5.2500%, 3/15/21 | 9,355,000 | 9,612,262 | |||||
Charter Communications Operating LLC / Charter Communications Operating | |||||||
Capital, 4.9080%, 7/23/25 | 15,043,000 | 15,884,325 | |||||
Comcast Corp, 2.3500%, 1/15/27 | 6,041,000 | 5,532,674 | |||||
Cox Communications Inc, 3.3500%, 9/15/26 (144A) | 12,620,000 | 12,208,272 | |||||
Crown Castle International Corp, 4.8750%, 4/15/22 | 15,660,000 | 16,843,489 | |||||
Crown Castle International Corp, 5.2500%, 1/15/23 | 8,180,000 | 8,925,198 | |||||
Crown Castle International Corp, 4.0000%, 3/1/27 | 5,624,000 | 5,670,702 | |||||
SBA Tower Trust, 2.9330%, 12/11/17 (144A) | 6,085,000 | 6,088,085 | |||||
Time Warner Cable LLC, 5.8500%, 5/1/17 | 8,955,000 | 8,982,510 | |||||
UBM PLC, 5.7500%, 11/3/20 (144A) | 12,530,000 | 13,166,411 | |||||
Verizon Communications Inc, 2.9460%, 3/15/22 (144A) | 4,000,000 | 3,982,496 | |||||
Verizon Communications Inc, 2.6250%, 8/15/26 | 23,125,000 | 21,114,119 | |||||
Verizon Communications Inc, 4.1250%, 8/15/46 | 5,079,000 | 4,381,196 | |||||
234,102,757 | |||||||
Consumer Cyclical – 1.3% | |||||||
1011778 BC ULC / New Red Finance Inc, 4.6250%, 1/15/22 (144A) | 13,355,000 | 13,672,181 | |||||
Brinker International Inc, 3.8750%, 5/15/23 | 2,316,000 | 2,191,515 | |||||
CVS Health Corp, 2.8000%, 7/20/20 | 19,942,000 | 20,273,655 | |||||
CVS Health Corp, 4.7500%, 12/1/22 | 4,980,000 | 5,405,875 | |||||
CVS Health Corp, 5.0000%, 12/1/24 | 6,656,000 | 7,282,170 | |||||
DR Horton Inc, 4.7500%, 5/15/17 | 3,949,000 | 3,962,099 | |||||
DR Horton Inc, 3.7500%, 3/1/19 | 8,771,000 | 8,988,100 | |||||
DR Horton Inc, 4.0000%, 2/15/20 | 1,683,000 | 1,750,833 | |||||
Ford Motor Co, 4.3460%, 12/8/26 | 12,707,000 | 12,937,581 | |||||
Ford Motor Credit Co LLC, 3.0000%, 6/12/17 | 2,254,000 | 2,260,379 | |||||
General Motors Co, 4.8750%, 10/2/23 | 9,492,000 | 10,125,714 | |||||
General Motors Financial Co Inc, 3.7000%, 5/9/23 | 4,255,000 | 4,287,010 | |||||
Hanesbrands Inc, 4.6250%, 5/15/24 (144A) | 16,471,000 | 16,244,524 | |||||
IHO Verwaltungs GmbH, 4.1250%, 9/15/21 (144A) | 2,365,000 | 2,376,825 | |||||
IHO Verwaltungs GmbH, 4.5000%, 9/15/23 (144A) | 1,880,000 | 1,858,850 | |||||
IHS Markit Ltd, 5.0000%, 11/1/22 (144A) | 6,204,000 | 6,498,690 | |||||
IHS Markit Ltd, 4.7500%, 2/15/25 (144A) | 5,045,000 | 5,196,350 | |||||
MDC Holdings Inc, 5.5000%, 1/15/24 | 9,622,000 | 9,910,660 | |||||
MGM Growth Properties Operating Partnership LP / MGP Finance Co-Issuer Inc, | |||||||
5.6250%, 5/1/24 | 5,593,000 | 5,900,615 | |||||
Schaeffler Finance BV, 4.2500%, 5/15/21 (144A) | 3,917,000 | 3,970,859 | |||||
Toll Brothers Finance Corp, 4.0000%, 12/31/18 | 3,478,000 | 3,564,950 | |||||
Toll Brothers Finance Corp, 5.8750%, 2/15/22 | 3,172,000 | 3,441,620 | |||||
Toll Brothers Finance Corp, 4.3750%, 4/15/23 | 1,817,000 | 1,838,586 | |||||
Walgreens Boots Alliance Inc, 2.6000%, 6/1/21 | 3,197,000 | 3,200,469 | |||||
Walgreens Boots Alliance Inc, 3.1000%, 6/1/23 | 2,027,000 | 2,023,917 | |||||
Walgreens Boots Alliance Inc, 3.4500%, 6/1/26 | 8,250,000 | 8,042,306 | |||||
Walgreens Boots Alliance Inc, 4.6500%, 6/1/46 | 1,417,000 | 1,409,343 | |||||
ZF North America Capital Inc, 4.5000%, 4/29/22 (144A) | 2,645,000 | 2,754,106 | |||||
171,369,782 | |||||||
Consumer Non-Cyclical – 2.6% | |||||||
Actavis Funding SCS, 3.0000%, 3/12/20 | 16,591,000 | 16,863,457 | |||||
Anheuser-Busch InBev Finance Inc, 2.6500%, 2/1/21 | 3,450,000 | 3,475,634 | |||||
Anheuser-Busch InBev Finance Inc, 3.3000%, 2/1/23 | 15,819,000 | 16,098,205 | |||||
Anheuser-Busch InBev Finance Inc, 3.6500%, 2/1/26 | 28,828,000 | 29,147,991 | |||||
Anheuser-Busch InBev Finance Inc, 4.9000%, 2/1/46 | 8,091,000 | 8,736,168 | |||||
Becton Dickinson and Co, 1.8000%, 12/15/17 | 8,628,000 | 8,634,497 | |||||
See Notes to Schedule of Investments and Other Information and Notes to Financial Statements. | |
Janus Investment Fund | 13 |
Janus Balanced Fund
Schedule of Investments (unaudited)
March 31, 2017
Shares
or | Value | ||||||
Corporate Bonds – (continued) | |||||||
Consumer Non-Cyclical – (continued) | |||||||
Constellation Brands Inc, 4.7500%, 12/1/25 | $1,385,000 | $1,491,754 | |||||
Constellation Brands Inc, 3.7000%, 12/6/26 | 9,295,000 | 9,284,562 | |||||
Constellation Brands, Inc., 4.2500%, 5/1/23 | 11,988,000 | 12,633,362 | |||||
Danone SA, 2.0770%, 11/2/21 (144A) | 13,029,000 | 12,677,986 | |||||
Danone SA, 2.5890%, 11/2/23 (144A) | 7,856,000 | 7,600,916 | |||||
Express Scripts Holding Co, 3.5000%, 6/15/24 | 4,827,000 | 4,753,861 | |||||
Express Scripts Holding Co, 4.5000%, 2/25/26 | 8,981,000 | 9,211,434 | |||||
Express Scripts Holding Co, 3.4000%, 3/1/27 | 3,242,000 | 3,053,121 | |||||
HCA Inc, 3.7500%, 3/15/19 | 6,411,000 | 6,555,247 | |||||
HCA Inc, 5.8750%, 5/1/23 | 3,207,000 | 3,463,560 | |||||
HCA Inc, 5.0000%, 3/15/24 | 2,588,000 | 2,714,165 | |||||
HCA Inc, 5.3750%, 2/1/25 | 5,545,000 | 5,766,800 | |||||
HCA Inc, 5.8750%, 2/15/26 | 6,924,000 | 7,310,982 | |||||
Kraft Heinz Foods Co, 2.8000%, 7/2/20 | 7,851,000 | 7,955,960 | |||||
Kraft Heinz Foods Co, 3.5000%, 7/15/22 | 6,704,000 | 6,849,081 | |||||
Kraft Heinz Foods Co, 3.0000%, 6/1/26 | 4,523,000 | 4,250,005 | |||||
Life Technologies Corp, 6.0000%, 3/1/20 | 7,723,000 | 8,460,052 | |||||
Molson Coors Brewing Co, 3.0000%, 7/15/26 | 16,201,000 | 15,404,429 | |||||
Molson Coors Brewing Co, 4.2000%, 7/15/46 | 3,884,000 | 3,635,929 | |||||
Newell Brands Inc, 3.1500%, 4/1/21 | 3,421,000 | 3,499,618 | |||||
Newell Brands Inc, 3.8500%, 4/1/23 | 3,241,000 | 3,354,597 | |||||
Newell Brands Inc, 5.0000%, 11/15/23 | 6,492,000 | 6,956,970 | |||||
Newell Brands Inc, 4.2000%, 4/1/26 | 15,276,000 | 15,896,832 | |||||
Shire Acquisitions Investments Ireland DAC, 2.4000%, 9/23/21 | 7,635,000 | 7,476,856 | |||||
Shire Acquisitions Investments Ireland DAC, 2.8750%, 9/23/23 | 10,297,000 | 9,989,264 | |||||
Shire Acquisitions Investments Ireland DAC, 3.2000%, 9/23/26 | 10,357,000 | 9,889,506 | |||||
Sysco Corp, 2.5000%, 7/15/21 | 2,615,000 | 2,606,012 | |||||
Sysco Corp, 3.3000%, 7/15/26 | 6,567,000 | 6,431,785 | |||||
Teva Pharmaceutical Finance Netherlands III BV, 3.1500%, 10/1/26 | 13,871,000 | 12,780,934 | |||||
Universal Health Services Inc, 4.7500%, 8/1/22 (144A) | 10,975,000 | 11,276,812 | |||||
Universal Health Services Inc, 5.0000%, 6/1/26 (144A) | 8,758,000 | 8,998,845 | |||||
Wm Wrigley Jr Co, 2.4000%, 10/21/18 (144A) | 18,557,000 | 18,706,477 | |||||
Wm Wrigley Jr Co, 3.3750%, 10/21/20 (144A) | 6,014,000 | 6,217,796 | |||||
340,111,462 | |||||||
Electric – 0.5% | |||||||
Dominion Resources Inc/VA, 2.0000%, 8/15/21 | 1,448,000 | 1,404,724 | |||||
Dominion Resources Inc/VA, 2.8500%, 8/15/26 | 2,002,000 | 1,869,193 | |||||
Duke Energy Corp, 1.8000%, 9/1/21 | 3,880,000 | 3,747,448 | |||||
Duke Energy Corp, 2.6500%, 9/1/26 | 6,062,000 | 5,625,172 | |||||
IPALCO Enterprises Inc, 5.0000%, 5/1/18 | 5,576,000 | 5,729,340 | |||||
PPL WEM Ltd / Western Power Distribution Ltd, 5.3750%, 5/1/21 (144A) | 10,283,000 | 11,112,643 | |||||
Southern Co, 2.3500%, 7/1/21 | 11,780,000 | 11,565,321 | |||||
Southern Co, 2.9500%, 7/1/23 | 8,432,000 | 8,206,554 | |||||
Southern Co, 3.2500%, 7/1/26 | 11,841,000 | 11,294,988 | |||||
60,555,383 | |||||||
Energy – 1.9% | |||||||
Anadarko Petroleum Corp, 4.8500%, 3/15/21 | 1,721,000 | 1,840,881 | |||||
Antero Resources Corp, 5.3750%, 11/1/21 | 12,854,000 | 13,202,215 | |||||
Canadian Natural Resources Ltd, 5.7000%, 5/15/17 | 2,323,000 | 2,333,714 | |||||
Canadian Natural Resources Ltd, 5.9000%, 2/1/18 | 4,130,000 | 4,265,220 | |||||
Cenovus Energy Inc, 5.7000%, 10/15/19 | 260,000 | 280,608 | |||||
Cimarex Energy Co, 5.8750%, 5/1/22 | 7,642,000 | 7,877,175 | |||||
Cimarex Energy Co, 4.3750%, 6/1/24 | 2,876,000 | 2,987,284 | |||||
ConocoPhillips Co, 4.2000%, 3/15/21 | 7,925,000 | 8,449,611 | |||||
ConocoPhillips Co, 4.9500%, 3/15/26 | 9,949,000 | 11,041,579 | |||||
Diamond Offshore Drilling Inc, 5.8750%, 5/1/19 | 1,963,000 | 2,051,335 | |||||
Enbridge Energy Partners LP, 5.8750%, 10/15/25 | 6,080,000 | 6,795,318 | |||||
Energy Transfer Equity LP, 5.8750%, 1/15/24 | 6,650,000 | 7,065,625 | |||||
Energy Transfer Equity LP, 5.5000%, 6/1/27 | 4,928,000 | 5,149,760 | |||||
See Notes to Schedule of Investments and Other Information and Notes to Financial Statements. | |
14 | MARCH 31, 2017 |
Janus Balanced Fund
Schedule of Investments (unaudited)
March 31, 2017
Shares
or | Value | ||||||
Corporate Bonds – (continued) | |||||||
Energy – (continued) | |||||||
Energy Transfer Partners LP, 4.1500%, 10/1/20 | $5,864,000 | $6,088,445 | |||||
Energy Transfer Partners LP, 4.7500%, 1/15/26 | 2,688,000 | 2,765,936 | |||||
Helmerich & Payne International Drilling Co, 4.6500%, 3/15/25 | 20,281,000 | 21,082,688 | |||||
Hess Corp, 4.3000%, 4/1/27 | 5,335,000 | 5,252,841 | |||||
Hiland Partners Holdings LLC / Hiland Partners Finance Corp, | |||||||
5.5000%, 5/15/22 (144A) | 5,639,000 | 5,882,971 | |||||
Kinder Morgan Energy Partners LP, 5.0000%, 10/1/21 | 5,376,000 | 5,762,400 | |||||
Kinder Morgan Energy Partners LP, 3.9500%, 9/1/22 | 5,747,000 | 5,870,658 | |||||
Kinder Morgan Energy Partners LP, 5.0000%, 8/15/42 | 11,229,000 | 10,594,292 | |||||
Kinder Morgan Inc/DE, 6.5000%, 9/15/20 | 559,000 | 623,961 | |||||
Motiva Enterprises LLC, 5.7500%, 1/15/20 (144A) | 7,946,000 | 8,566,034 | |||||
MPLX LP, 4.5000%, 7/15/23 | 2,495,000 | 2,594,506 | |||||
Oceaneering International Inc, 4.6500%, 11/15/24 | 12,491,000 | 12,492,711 | |||||
Phillips 66 Partners LP, 3.6050%, 2/15/25 | 6,430,000 | 6,261,039 | |||||
Regency Energy Partners LP / Regency Energy Finance Corp, 5.8750%, 3/1/22 | 7,428,000 | 8,167,012 | |||||
Sabine Pass Liquefaction LLC, 5.0000%, 3/15/27 (144A) | 11,511,000 | 12,021,559 | |||||
SM Energy Co, 6.5000%, 11/15/21 | 6,033,000 | 6,183,825 | |||||
SM Energy Co, 6.5000%, 1/1/23 | 2,130,000 | 2,161,950 | |||||
Spectra Energy Partners LP, 4.7500%, 3/15/24 | 6,931,000 | 7,338,245 | |||||
Tesoro Logistics LP / Tesoro Logistics Finance Corp, 5.2500%, 1/15/25 | 3,368,000 | 3,515,350 | |||||
Western Gas Partners LP, 5.3750%, 6/1/21 | 14,912,000 | 16,023,913 | |||||
Western Gas Partners LP, 4.0000%, 7/1/22 | 5,142,000 | 5,279,898 | |||||
Williams Cos Inc, 3.7000%, 1/15/23 | 3,539,000 | 3,477,068 | |||||
Williams Partners LP / ACMP Finance Corp, 4.8750%, 5/15/23 | 9,575,000 | 9,863,016 | |||||
Williams Partners LP / ACMP Finance Corp, 4.8750%, 3/15/24 | 5,180,000 | 5,327,568 | |||||
246,538,211 | |||||||
Finance Companies – 0.4% | |||||||
CIT Group Inc, 4.2500%, 8/15/17 | 23,809,000 | 24,017,329 | |||||
CIT Group Inc, 5.0000%, 5/15/18 (144A) | 2,381,000 | 2,397,072 | |||||
CIT Group Inc, 5.5000%, 2/15/19 (144A) | 7,009,000 | 7,368,211 | |||||
Park Aerospace Holdings Ltd, 5.2500%, 8/15/22 (144A) | 3,895,000 | 4,050,800 | |||||
Park Aerospace Holdings Ltd, 5.5000%, 2/15/24 (144A) | 10,601,000 | 11,025,040 | |||||
48,858,452 | |||||||
Financial Institutions – 0.5% | |||||||
Jones Lang LaSalle Inc, 4.4000%, 11/15/22 | 12,693,000 | 13,236,057 | |||||
Kennedy-Wilson Inc, 5.8750%, 4/1/24 | 21,585,000 | 22,124,625 | |||||
LeasePlan Corp NV, 2.5000%, 5/16/18 (144A) | 22,483,000 | 22,537,836 | |||||
57,898,518 | |||||||
Industrial – 0% | |||||||
Cintas Corp No 2, 4.3000%, 6/1/21 | 5,399,000 | 5,748,817 | |||||
Insurance – 0.5% | |||||||
Aetna Inc, 2.8000%, 6/15/23 | 5,251,000 | 5,207,107 | |||||
Berkshire Hathaway Inc, 3.1250%, 3/15/26 | 1,948,000 | 1,945,931 | |||||
Centene Corp, 4.7500%, 5/15/22 | 761,000 | 781,928 | |||||
Centene Corp, 6.1250%, 2/15/24 | 1,866,000 | 2,003,618 | |||||
Centene Corp, 4.7500%, 1/15/25 | 2,236,000 | 2,248,589 | |||||
Cigna Corp, 3.2500%, 4/15/25 | 25,812,000 | 25,511,781 | |||||
CNO Financial Group Inc, 4.5000%, 5/30/20 | 2,129,000 | 2,198,193 | |||||
WellCare Health Plans Inc, 5.2500%, 4/1/25 | 18,326,000 | 18,898,687 | |||||
58,795,834 | |||||||
Real Estate Investment Trusts (REITs) – 0.6% | |||||||
Alexandria Real Estate Equities Inc, 2.7500%, 1/15/20 | 5,517,000 | 5,533,496 | |||||
Alexandria Real Estate Equities Inc, 4.6000%, 4/1/22 | 15,774,000 | 16,757,398 | |||||
Alexandria Real Estate Equities Inc, 4.5000%, 7/30/29 | 8,547,000 | 8,816,966 | |||||
Post Apartment Homes LP, 4.7500%, 10/15/17 | 7,305,000 | 7,366,223 | |||||
Senior Housing Properties Trust, 6.7500%, 4/15/20 | 3,575,000 | 3,878,614 | |||||
Senior Housing Properties Trust, 6.7500%, 12/15/21 | 3,969,000 | 4,414,921 | |||||
SL Green Realty Corp, 5.0000%, 8/15/18 | 8,525,000 | 8,813,085 | |||||
See Notes to Schedule of Investments and Other Information and Notes to Financial Statements. | |
Janus Investment Fund | 15 |
Janus Balanced Fund
Schedule of Investments (unaudited)
March 31, 2017
Shares
or | Value | ||||||
Corporate Bonds – (continued) | |||||||
Real Estate Investment Trusts (REITs) – (continued) | |||||||
SL Green Realty Corp, 7.7500%, 3/15/20 | $16,744,000 | $18,800,950 | |||||
74,381,653 | |||||||
Technology – 1.8% | |||||||
Broadcom Corp / Broadcom Cayman Finance Ltd, 3.6250%, 1/15/24 (144A) | 8,758,000 | 8,820,646 | |||||
Broadcom Corp / Broadcom Cayman Finance Ltd, 3.8750%, 1/15/27 (144A) | 22,482,000 | 22,623,727 | |||||
Cadence Design Systems Inc, 4.3750%, 10/15/24 | 19,933,000 | 19,991,344 | |||||
Fidelity National Information Services Inc, 3.6250%, 10/15/20 | 5,958,000 | 6,190,559 | |||||
Fidelity National Information Services Inc, 4.5000%, 10/15/22† | 7,755,000 | 8,274,663 | |||||
Fidelity National Information Services Inc, 3.0000%, 8/15/26 | 9,981,000 | 9,402,990 | |||||
NXP BV / NXP Funding LLC, 4.1250%, 6/15/20 (144A) | 3,750,000 | 3,895,313 | |||||
NXP BV / NXP Funding LLC, 4.1250%, 6/1/21 (144A) | 2,942,000 | 3,052,325 | |||||
NXP BV / NXP Funding LLC, 3.8750%, 9/1/22 (144A) | 10,904,000 | 11,149,340 | |||||
NXP BV / NXP Funding LLC, 4.6250%, 6/1/23 (144A) | 6,313,000 | 6,683,889 | |||||
Seagate HDD Cayman, 4.7500%, 1/1/25 | 9,966,000 | 9,760,451 | |||||
Seagate HDD Cayman, 4.8750%, 6/1/27 | 3,251,000 | 3,043,232 | |||||
Seagate HDD Cayman, 5.7500%, 12/1/34 | 3,076,000 | 2,783,780 | |||||
Total System Services Inc, 3.8000%, 4/1/21 | 6,373,000 | 6,590,045 | |||||
Total System Services Inc, 4.8000%, 4/1/26 | 17,787,000 | 19,144,628 | |||||
Trimble Inc, 4.7500%, 12/1/24 | 22,047,000 | 22,815,603 | |||||
TSMC Global Ltd, 1.6250%, 4/3/18 (144A) | 30,462,000 | 30,383,399 | |||||
Verisk Analytics Inc, 4.8750%, 1/15/19 | 7,270,000 | 7,594,075 | |||||
Verisk Analytics Inc, 5.8000%, 5/1/21 | 12,291,000 | 13,613,585 | |||||
Verisk Analytics Inc, 4.1250%, 9/12/22 | 7,085,000 | 7,384,086 | |||||
Verisk Analytics Inc, 5.5000%, 6/15/45 | 8,346,000 | 9,061,060 | |||||
232,258,740 | |||||||
Transportation – 0.2% | |||||||
Penske Truck Leasing Co Lp / PTL Finance Corp, 3.3750%, 3/15/18 (144A) | 12,041,000 | 12,227,611 | |||||
Penske Truck Leasing Co Lp / PTL Finance Corp, 2.5000%, 6/15/19 (144A) | 7,760,000 | 7,803,301 | |||||
Penske Truck Leasing Co Lp / PTL Finance Corp, 4.8750%, 7/11/22 (144A) | 1,197,000 | 1,292,025 | |||||
Penske Truck Leasing Co Lp / PTL Finance Corp, 4.2500%, 1/17/23 (144A) | 6,588,000 | 6,862,588 | |||||
28,185,525 | |||||||
Total Corporate Bonds (cost $2,224,829,443) | 2,256,244,259 | ||||||
Mortgage-Backed Securities – 9.1% | |||||||
Fannie Mae Pool: | |||||||
4.0000%, 9/1/29 | 4,046,421 | 4,286,782 | |||||
4.0000%, 4/1/34 | 4,665,164 | 4,938,302 | |||||
6.0000%, 10/1/35 | 3,272,347 | 3,714,637 | |||||
6.0000%, 12/1/35 | 3,608,350 | 4,102,146 | |||||
6.0000%, 2/1/37 | 647,565 | 752,471 | |||||
6.0000%, 9/1/37 | 1,874,831 | 1,979,144 | |||||
6.0000%, 10/1/38 | 2,368,504 | 2,677,414 | |||||
7.0000%, 2/1/39 | 996,648 | 1,174,879 | |||||
5.5000%, 12/1/39 | 5,252,168 | 5,864,360 | |||||
5.5000%, 3/1/40 | 4,287,208 | 4,854,691 | |||||
5.5000%, 4/1/40 | 10,976,056 | 12,229,340 | |||||
5.0000%, 10/1/40 | 1,958,875 | 2,180,949 | |||||
5.5000%, 2/1/41 | 2,405,113 | 2,723,418 | |||||
5.0000%, 5/1/41 | 5,337,317 | 5,840,766 | |||||
5.5000%, 5/1/41 | 3,603,643 | 4,017,516 | |||||
5.5000%, 6/1/41 | 5,948,550 | 6,627,358 | |||||
5.5000%, 6/1/41 | 5,198,641 | 5,876,837 | |||||
5.5000%, 7/1/41 | 593,068 | 660,183 | |||||
4.5000%, 8/1/41 | 3,953,332 | 4,256,492 | |||||
5.5000%, 12/1/41 | 5,129,345 | 5,729,365 | |||||
4.0000%, 2/1/42 | 7,964,360 | 8,441,082 | |||||
5.5000%, 2/1/42 | 21,030,231 | 23,417,296 | |||||
4.0000%, 6/1/42 | 7,588,542 | 8,028,422 | |||||
4.5000%, 6/1/42 | 1,497,940 | 1,619,612 | |||||
See Notes to Schedule of Investments and Other Information and Notes to Financial Statements. | |
16 | MARCH 31, 2017 |
Janus Balanced Fund
Schedule of Investments (unaudited)
March 31, 2017
Shares
or | Value | ||||||
Mortgage-Backed Securities – (continued) | |||||||
Fannie Mae Pool – (continued) | |||||||
4.0000%, 7/1/42 | $1,408,356 | $1,489,576 | |||||
4.0000%, 8/1/42 | 3,402,015 | 3,599,185 | |||||
4.0000%, 9/1/42 | 6,726,827 | 7,118,510 | |||||
4.0000%, 9/1/42 | 4,224,974 | 4,467,415 | |||||
4.0000%, 11/1/42 | 5,343,817 | 5,653,793 | |||||
4.5000%, 11/1/42 | 2,487,294 | 2,690,846 | |||||
4.0000%, 12/1/42 | 3,794,319 | 4,017,221 | |||||
3.5000%, 1/1/43 | 9,026,574 | 9,262,052 | |||||
3.5000%, 2/1/43 | 20,031,552 | 20,558,266 | |||||
3.5000%, 2/1/43 | 18,776,300 | 19,270,612 | |||||
4.5000%, 3/1/43 | 7,465,279 | 8,169,708 | |||||
4.0000%, 5/1/43 | 11,463,235 | 12,126,815 | |||||
4.0000%, 8/1/43 | 13,626,135 | 14,417,438 | |||||
4.0000%, 9/1/43 | 3,331,840 | 3,525,833 | |||||
3.5000%, 1/1/44 | 16,243,794 | 16,773,580 | |||||
3.5000%, 1/1/44 | 7,215,897 | 7,450,866 | |||||
4.0000%, 2/1/44 | 9,040,203 | 9,562,088 | |||||
3.5000%, 4/1/44 | 8,183,301 | 8,432,955 | |||||
4.5000%, 5/1/44 | 877,809 | 955,716 | |||||
5.5000%, 5/1/44 | 4,842,119 | 5,394,555 | |||||
4.0000%, 6/1/44 | 11,190,866 | 11,841,168 | |||||
4.0000%, 7/1/44 | 20,758,069 | 22,063,541 | |||||
5.0000%, 7/1/44 | 12,121,607 | 13,546,710 | |||||
4.0000%, 8/1/44 | 13,259,415 | 14,092,702 | |||||
4.0000%, 8/1/44 | 5,065,915 | 5,384,781 | |||||
4.5000%, 8/1/44 | 13,669,935 | 14,878,839 | |||||
4.5000%, 10/1/44 | 59,929,032 | 65,209,078 | |||||
4.5000%, 10/1/44 | 10,383,414 | 11,295,521 | |||||
4.5000%, 10/1/44 | 5,870,293 | 6,368,849 | |||||
3.5000%, 2/1/45 | 16,659,200 | 17,097,549 | |||||
4.5000%, 3/1/45 | 10,134,672 | 10,996,378 | |||||
4.0000%, 5/1/45 | 7,944,102 | 8,444,010 | |||||
4.5000%, 5/1/45 | 8,783,092 | 9,552,017 | |||||
4.5000%, 5/1/45 | 5,720,167 | 6,243,625 | |||||
4.5000%, 6/1/45 | 5,365,508 | 5,843,927 | |||||
4.5000%, 9/1/45 | 3,534,568 | 3,836,043 | |||||
4.0000%, 10/1/45 | 17,790,864 | 18,828,584 | |||||
4.5000%, 10/1/45 | 11,793,295 | 12,890,927 | |||||
3.5000%, 12/1/45 | 5,232,475 | 5,389,906 | |||||
4.0000%, 12/1/45 | 7,275,152 | 7,731,567 | |||||
3.5000%, 1/1/46 | 14,007,353 | 14,430,182 | |||||
3.5000%, 1/1/46 | 11,940,549 | 12,301,366 | |||||
4.0000%, 1/1/46 | 3,410,798 | 3,616,005 | |||||
4.5000%, 2/1/46 | 16,014,746 | 17,418,341 | |||||
4.5000%, 2/1/46 | 6,707,520 | 7,290,257 | |||||
4.0000%, 4/1/46 | 9,174,347 | 9,723,366 | |||||
4.5000%, 4/1/46 | 8,659,855 | 9,477,928 | |||||
4.0000%, 5/1/46 | 10,932,274 | 11,592,795 | |||||
4.0000%, 6/1/46 | 3,732,718 | 3,958,397 | |||||
3.5000%, 7/1/46 | 9,506,725 | 9,794,245 | |||||
3.5000%, 7/1/46 | 9,496,521 | 9,758,569 | |||||
4.5000%, 7/1/46 | 13,368,728 | 14,530,182 | |||||
4.5000%, 7/1/46 | 7,003,868 | 7,629,077 | |||||
4.5000%, 7/1/46 | 6,815,794 | 7,366,051 | |||||
3.5000%, 8/1/46 | 5,830,201 | 5,977,488 | |||||
4.5000%, 9/1/46 | 1,597,981 | 1,741,787 | |||||
4.0000%, 10/1/46 | 6,092,492 | 6,443,082 | |||||
4.0000%, 11/1/46 | 3,345,402 | 3,557,095 | |||||
4.5000%, 11/1/46 | 5,722,209 | 6,237,365 | |||||
See Notes to Schedule of Investments and Other Information and Notes to Financial Statements. | |
Janus Investment Fund | 17 |
Janus Balanced Fund
Schedule of Investments (unaudited)
March 31, 2017
Shares
or | Value | ||||||
Mortgage-Backed Securities – (continued) | |||||||
Fannie Mae Pool – (continued) | |||||||
4.5000%, 11/1/46 | $2,201,700 | $2,386,321 | |||||
4.5000%, 12/1/46 | 5,745,778 | 6,203,294 | |||||
4.0000%, 1/1/47 | 3,893,548 | 4,151,689 | |||||
4.0000%, 2/1/47 | 8,523,824 | 9,043,251 | |||||
4.5000%, 2/1/47 | 9,642,798 | 10,434,715 | |||||
3.5000%, 5/1/56 | 21,555,383 | 21,972,923 | |||||
779,501,985 | |||||||
Freddie Mac Gold Pool: | |||||||
3.5000%, 7/1/29 | 5,023,483 | 5,242,299 | |||||
8.0000%, 4/1/32 | 1,274,350 | 1,575,967 | |||||
5.5000%, 10/1/36 | 2,110,986 | 2,394,765 | |||||
6.0000%, 4/1/40 | 11,004,215 | 12,806,015 | |||||
5.5000%, 5/1/41 | 4,871,013 | 5,404,918 | |||||
5.5000%, 8/1/41 | 10,652,649 | 12,231,944 | |||||
5.5000%, 8/1/41 | 7,165,065 | 8,134,856 | |||||
5.5000%, 9/1/41 | 1,598,189 | 1,773,486 | |||||
5.0000%, 3/1/42 | 5,181,691 | 5,746,133 | |||||
3.5000%, 2/1/44 | 6,525,290 | 6,692,711 | |||||
4.5000%, 5/1/44 | 6,147,037 | 6,664,135 | |||||
5.0000%, 7/1/44 | 4,599,131 | 5,083,799 | |||||
4.0000%, 8/1/44 | 4,155,045 | 4,403,034 | |||||
4.5000%, 9/1/44 | 20,062,844 | 21,870,783 | |||||
4.5000%, 6/1/45 | 8,797,408 | 9,593,001 | |||||
4.5000%, 2/1/46 | 9,948,816 | 10,850,380 | |||||
4.5000%, 2/1/46 | 6,179,464 | 6,723,510 | |||||
4.5000%, 6/1/46 | 14,307,796 | 15,433,790 | |||||
3.5000%, 7/1/46 | 18,964,098 | 19,531,717 | |||||
162,157,243 | |||||||
Ginnie Mae I Pool: | |||||||
5.1000%, 1/15/32 | 4,724,766 | 5,391,102 | |||||
7.5000%, 8/15/33 | 4,528,480 | 5,295,765 | |||||
4.9000%, 10/15/34 | 5,156,133 | 5,865,756 | |||||
5.5000%, 9/15/35 | 544,491 | 625,355 | |||||
5.5000%, 8/15/39 | 9,782,692 | 11,347,124 | |||||
5.5000%, 8/15/39 | 3,222,986 | 3,740,773 | |||||
5.0000%, 10/15/39 | 2,053,539 | 2,269,265 | |||||
5.5000%, 10/15/39 | 3,753,044 | 4,341,136 | |||||
5.0000%, 11/15/39 | 3,343,800 | 3,675,901 | |||||
5.0000%, 1/15/40 | 1,125,293 | 1,237,209 | |||||
5.0000%, 5/15/40 | 1,227,311 | 1,365,148 | |||||
5.0000%, 5/15/40 | 508,321 | 566,600 | |||||
5.0000%, 7/15/40 | 3,565,775 | 3,921,015 | |||||
5.0000%, 7/15/40 | 989,371 | 1,088,023 | |||||
5.0000%, 2/15/41 | 3,689,285 | 4,069,536 | |||||
5.0000%, 4/15/41 | 1,501,325 | 1,651,326 | |||||
4.5000%, 5/15/41 | 7,133,160 | 7,957,229 | |||||
5.0000%, 5/15/41 | 1,400,939 | 1,558,950 | |||||
4.5000%, 7/15/41 | 3,461,316 | 3,884,153 | |||||
4.5000%, 7/15/41 | 1,118,205 | 1,216,840 | |||||
4.5000%, 8/15/41 | 9,795,669 | 10,691,896 | |||||
5.0000%, 9/15/41 | 955,759 | 1,070,455 | |||||
5.0000%, 11/15/43 | 6,786,409 | 7,629,090 | |||||
4.5000%, 5/15/44 | 4,433,340 | 4,804,928 | |||||
5.0000%, 6/15/44 | 6,749,603 | 7,540,407 | |||||
5.0000%, 6/15/44 | 2,237,167 | 2,494,280 | |||||
5.0000%, 7/15/44 | 2,680,545 | 2,987,662 | |||||
4.0000%, 1/15/45 | 21,493,061 | 22,843,255 | |||||
4.0000%, 4/15/45 | 3,586,927 | 3,873,350 | |||||
4.0000%, 7/15/46 | 13,761,730 | 14,829,222 | |||||
See Notes to Schedule of Investments and Other Information and Notes to Financial Statements. | |
18 | MARCH 31, 2017 |
Janus Balanced Fund
Schedule of Investments (unaudited)
March 31, 2017
Shares
or | Value | ||||||
Mortgage-Backed Securities – (continued) | |||||||
Ginnie Mae I Pool – (continued) | |||||||
4.5000%, 8/15/46 | $23,964,237 | $25,935,650 | |||||
175,768,401 | |||||||
Ginnie Mae II Pool: | |||||||
6.0000%, 11/20/34 | 2,153,958 | 2,487,474 | |||||
6.0000%, 1/20/39 | 911,430 | 1,033,009 | |||||
7.0000%, 5/20/39 | 484,692 | 574,911 | |||||
4.5000%, 10/20/41 | 6,114,496 | 6,534,887 | |||||
6.0000%, 12/20/41 | 991,008 | 1,130,256 | |||||
5.5000%, 1/20/42 | 2,098,178 | 2,313,919 | |||||
6.0000%, 1/20/42 | 1,044,834 | 1,195,692 | |||||
6.0000%, 2/20/42 | 839,096 | 963,730 | |||||
6.0000%, 3/20/42 | 748,792 | 856,948 | |||||
6.0000%, 4/20/42 | 2,828,059 | 3,244,278 | |||||
3.5000%, 5/20/42 | 2,479,541 | 2,582,106 | |||||
5.5000%, 5/20/42 | 2,964,091 | 3,281,912 | |||||
6.0000%, 5/20/42 | 1,211,669 | 1,366,706 | |||||
5.5000%, 7/20/42 | 3,774,874 | 4,170,769 | |||||
6.0000%, 7/20/42 | 757,487 | 848,987 | |||||
6.0000%, 8/20/42 | 869,378 | 1,000,758 | |||||
6.0000%, 9/20/42 | 1,780,454 | 2,018,939 | |||||
6.0000%, 11/20/42 | 742,325 | 849,593 | |||||
6.0000%, 2/20/43 | 1,125,215 | 1,287,127 | |||||
3.5000%, 9/20/44 | 7,152,551 | 7,448,980 | |||||
5.0000%, 12/20/44 | 3,806,690 | 4,272,635 | |||||
5.0000%, 9/20/45 | 2,756,488 | 3,102,275 | |||||
4.0000%, 10/20/45 | 8,925,394 | 9,570,606 | |||||
62,136,497 | |||||||
Total Mortgage-Backed Securities (cost $1,186,622,536) | 1,179,564,126 | ||||||
United States Treasury Notes/Bonds – 4.5% | |||||||
1.1250%, 2/28/19 | 18,093,000 | 18,050,590 | |||||
1.0000%, 11/15/19 | 7,931,000 | 7,842,704 | |||||
1.2500%, 10/31/21 | 48,040,000 | 46,690,749 | |||||
1.8750%, 2/28/22 | 3,981,000 | 3,971,979 | |||||
2.1250%, 2/29/24 | 47,708,000 | 47,439,642 | |||||
2.0000%, 11/15/26 | 124,997,000 | 120,719,728 | |||||
2.2500%, 2/15/27 | 42,264,000 | 41,719,175 | |||||
2.2500%, 8/15/46 | 120,657,000 | 102,077,753 | |||||
2.8750%, 11/15/46 | 193,743,000 | 188,027,618 | |||||
Total United States Treasury Notes/Bonds (cost $571,276,285) | 576,539,938 | ||||||
Common Stocks – 63.5% | |||||||
Aerospace & Defense – 4.9% | |||||||
Boeing Co | .2,038,351 | 360,502,758 | |||||
General Dynamics Corp | 709,595 | 132,836,184 | |||||
Northrop Grumman Corp | 578,138 | 137,504,342 | |||||
630,843,284 | |||||||
Air Freight & Logistics – 0.7% | |||||||
United Parcel Service Inc | 794,316 | 85,230,107 | |||||
Automobiles – 1.6% | |||||||
General Motors Co | 5,720,942 | 202,292,509 | |||||
Banks – 1.2% | |||||||
US Bancorp | 3,017,021 | 155,376,581 | |||||
Biotechnology – 3.0% | |||||||
AbbVie Inc | 1,265,320 | 82,448,251 | |||||
Amgen Inc† | 1,844,893 | 302,691,595 | |||||
385,139,846 | |||||||
Capital Markets – 5.5% | |||||||
Blackstone Group LP | 5,409,906 | 160,674,208 | |||||
CME Group Inc | 1,988,347 | 236,215,624 | |||||
See Notes to Schedule of Investments and Other Information and Notes to Financial Statements. | |
Janus Investment Fund | 19 |
Janus Balanced Fund
Schedule of Investments (unaudited)
March 31, 2017
Shares
or | Value | ||||||
Common Stocks – (continued) | |||||||
Capital Markets – (continued) | |||||||
Morgan Stanley | .3,849,667 | $164,919,734 | |||||
TD Ameritrade Holding Corp | 3,847,939 | 149,530,910 | |||||
711,340,476 | |||||||
Chemicals – 2.1% | |||||||
LyondellBasell Industries NV | 2,934,869 | 267,630,704 | |||||
Construction Materials – 0.3% | |||||||
Vulcan Materials Co | 317,651 | 38,270,592 | |||||
Consumer Finance – 1.5% | |||||||
Synchrony Financial | 5,719,157 | 196,167,085 | |||||
Equity Real Estate Investment Trusts (REITs) – 2.4% | |||||||
Colony NorthStar Inc | 5,825,321 | 75,204,894 | |||||
Colony Starwood Homes | 1,511,183 | 51,304,663 | |||||
Crown Castle International Corp | 623,474 | 58,887,119 | |||||
MGM Growth Properties LLC | 1,467,527 | 39,696,605 | |||||
Outfront Media Inc | 3,120,700 | 82,854,585 | |||||
307,947,866 | |||||||
Food & Staples Retailing – 3.0% | |||||||
Costco Wholesale Corp | 1,448,544 | 242,906,343 | |||||
Kroger Co | 2,520,141 | 74,318,958 | |||||
Sysco Corp | 1,417,529 | 73,598,106 | |||||
390,823,407 | |||||||
Food Products – 0.7% | |||||||
Hershey Co | 857,933 | 93,729,180 | |||||
Health Care Equipment & Supplies – 1.4% | |||||||
Medtronic PLC | 2,188,157 | 176,277,928 | |||||
Health Care Providers & Services – 0.8% | |||||||
Aetna Inc | 836,496 | 106,695,065 | |||||
Hotels, Restaurants & Leisure – 2.4% | |||||||
McDonald's Corp | 352,026 | 45,626,090 | |||||
Norwegian Cruise Line Holdings Ltd* | 1,676,163 | 85,031,749 | |||||
Six Flags Entertainment Corp | 1,102,177 | 65,568,510 | |||||
Starbucks Corp | 1,909,211 | 111,478,830 | |||||
307,705,179 | |||||||
Household Products – 0.9% | |||||||
Kimberly-Clark Corp | 892,047 | 117,420,147 | |||||
Industrial Conglomerates – 1.6% | |||||||
Honeywell International Inc | 1,670,488 | 208,593,837 | |||||
Information Technology Services – 4.0% | |||||||
Accenture PLC | 905,589 | 108,562,009 | |||||
Automatic Data Processing Inc | 677,813 | 69,401,273 | |||||
Mastercard Inc | 3,053,134 | 343,385,981 | |||||
521,349,263 | |||||||
Internet & Direct Marketing Retail – 1.6% | |||||||
Priceline Group Inc* | 118,452 | 210,841,006 | |||||
Internet Software & Services – 2.1% | |||||||
Alphabet Inc - Class C* | 323,893 | 268,688,677 | |||||
Leisure Products – 1.1% | |||||||
Hasbro Inc | 749,648 | 74,829,863 | |||||
Mattel Inc | 2,838,606 | 72,696,700 | |||||
147,526,563 | |||||||
Media – 2.8% | |||||||
Comcast Corp | 5,729,864 | 215,385,588 | |||||
Madison Square Garden Co* | 179,562 | 35,860,327 | |||||
Time Warner Inc | 1,083,251 | 105,844,455 | |||||
357,090,370 | |||||||
Oil, Gas & Consumable Fuels – 0.3% | |||||||
Suncor Energy Inc | 1,230,446 | 37,782,289 | |||||
Personal Products – 0.5% | |||||||
Estee Lauder Cos Inc | 774,605 | 65,678,758 | |||||
See Notes to Schedule of Investments and Other Information and Notes to Financial Statements. | |
20 | MARCH 31, 2017 |
Janus Balanced Fund
Schedule of Investments (unaudited)
March 31, 2017
Shares
or | Value | ||||||
Common Stocks – (continued) | |||||||
Pharmaceuticals – 1.9% | |||||||
Allergan PLC | .294,505 | $70,363,135 | |||||
Bristol-Myers Squibb Co | 2,562,187 | 139,331,729 | |||||
Eli Lilly & Co | 486,594 | 40,927,421 | |||||
250,622,285 | |||||||
Real Estate Management & Development – 1.0% | |||||||
CBRE Group Inc* | 3,473,480 | 120,842,369 | |||||
Colony American Homes III£,§ | 6,162,871 | 6,356,755 | |||||
127,199,124 | |||||||
Road & Rail – 1.4% | |||||||
CSX Corp | 3,992,006 | 185,827,879 | |||||
Semiconductor & Semiconductor Equipment – 0.6% | |||||||
Intel Corp | 2,074,201 | 74,816,430 | |||||
Software – 5.1% | |||||||
Adobe Systems Inc* | 1,837,602 | 239,127,148 | |||||
Microsoft Corp | 6,281,297 | 413,686,220 | |||||
652,813,368 | |||||||
Specialty Retail – 1.4% | |||||||
Home Depot Inc | 1,231,158 | 180,770,929 | |||||
Technology Hardware, Storage & Peripherals – 1.7% | |||||||
Apple Inc | 1,564,579 | 224,767,419 | |||||
Textiles, Apparel & Luxury Goods – 1.6% | |||||||
NIKE Inc | 3,685,182 | 205,375,193 | |||||
Tobacco – 2.4% | |||||||
Altria Group Inc | 4,332,223 | 309,407,367 | |||||
Total Common Stocks (cost $5,826,615,048) | 8,202,040,713 | ||||||
Preferred Stocks – 0.3% | |||||||
Banks – 0.1% | |||||||
Citigroup Capital XIII, 7.4090% | 785,775 | 20,940,904 | |||||
Capital Markets – 0.1% | |||||||
Morgan Stanley, 6.8750% | 143,731 | 4,053,214 | |||||
Morgan Stanley, 7.1250% | 156,507 | 4,559,049 | |||||
8,612,263 | |||||||
Consumer Finance – 0.1% | |||||||
Discover Financial Services, 6.5000% | 459,705 | 11,929,345 | |||||
Industrial Conglomerates – 0% | |||||||
General Electric Co, 4.7000% | 50,485 | 1,295,950 | |||||
Total Preferred Stocks (cost $40,830,938) | 42,778,462 | ||||||
Investment Companies – 0.8% | |||||||
Money Markets – 0.8% | |||||||
Janus Cash Liquidity Fund LLC, 0.7113%ºº,£ (cost $95,944,604) | 95,944,604 | 95,944,604 | |||||
Total Investments (total cost $10,523,667,863) – 100.2% | 12,929,220,767 | ||||||
Liabilities, net of Cash, Receivables and Other Assets – (0.2)% | (20,185,487) | ||||||
Net Assets – 100% | $12,909,035,280 | ||||||
See Notes to Schedule of Investments and Other Information and Notes to Financial Statements. | |
Janus Investment Fund | 21 |
Janus Balanced Fund
Schedule of Investments (unaudited)
March 31, 2017
Summary of Investments by Country - (Long Positions) (unaudited) | |||||
% of | |||||
Investment | |||||
Country | Value | Securities | |||
United States | $12,571,693,548 | 97.2 | % | ||
Canada | 68,785,833 | 0.5 | |||
Belgium | 57,457,998 | 0.4 | |||
Netherlands | 47,318,703 | 0.4 | |||
United Kingdom | 40,871,225 | 0.3 | |||
Taiwan | 30,383,399 | 0.2 | |||
Ireland | 24,284,516 | 0.2 | |||
Switzerland | 24,226,160 | 0.2 | |||
France | 20,278,902 | 0.2 | |||
Brazil | 12,921,318 | 0.1 | |||
Israel | 12,780,934 | 0.1 | |||
Germany | 10,960,640 | 0.1 | |||
Italy | 6,303,329 | 0.1 | |||
Luxembourg | 954,262 | 0.0 | |||
Total | $12,929,220,767 | 100.0 | % |
See Notes to Schedule of Investments and Other Information and Notes to Financial Statements. | |
22 | MARCH 31, 2017 |
Janus Balanced Fund
Notes to Schedule of Investments and Other Information (unaudited)
Balanced Index | Balanced Index is an internally-calculated, hypothetical combination of total returns from the S&P 500® Index (55%) and the Bloomberg Barclays U.S. Aggregate Bond Index (45%). |
Bloomberg Barclays U.S. Aggregate Bond Index | Bloomberg Barclays U.S. Aggregate Bond Index is a broad-based measure of the investment grade, US dollar-denominated, fixed-rate taxable bond market. |
S&P 500® Index | S&P 500® Index reflects U.S. large-cap equity performance and represents broad U.S. equity market performance. |
LIBOR | London Interbank Offered Rate |
LLC | Limited Liability Company |
LP | Limited Partnership |
PLC | Public Limited Company |
ULC | Unlimited Liability Company |
144A | Securities sold under Rule 144A of the Securities Act of 1933, as amended, are subject to legal and/or contractual restrictions on resale and may not be publicly sold without registration under the 1933 Act. Unless otherwise noted, these securities have been determined to be liquid under guidelines established by the Board of Trustees. The total value of 144A securities as of the period ended March 31, 2017 is $759,252,991, which represents 5.9% of net assets. |
* | Non-income producing security. |
(a) | All or a portion of this position has not settled, or is not funded. Upon settlement or funding date, interest rates for unsettled or unfunded amounts will be determined. Interest and dividends will not be accrued until time of settlement or funding. |
† | A portion of this security has been segregated to cover margin or segregation requirements on open futures contracts, forward currency contracts, options contracts, short sales, swap agreements, and/or securities with extended settlement dates, the value of which, as of March 31, 2017, is $49,265,487. |
‡ | The interest rate on floating rate notes is based on an index or market interest rates and is subject to change. Rate in the security description is as of March 31, 2017. |
ºº | Rate shown is the 7-day yield as of March 31, 2017. |
µ | This variable rate security is a perpetual bond. Perpetual bonds have no contractual maturity date, are not redeemable, and pay an indefinite stream of interest. The coupon rate shown represents the current interest rate. |
£ | The Fund may invest in certain securities that are considered affiliated companies. As defined by the Investment Company Act of 1940, as amended, an affiliated company is one in which the Fund owns 5% or more of the outstanding voting securities, or a company which is under common ownership or control. The following securities were considered affiliated companies for all or some portion of the period ended March 31, 2017. Unless otherwise indicated, all information in the table is for the period ended March 31, 2017. |
Share | Share | ||||||||||||||||||||||||||||||||
Balance | Balance | Realized | Dividend | Value | |||||||||||||||||||||||||||||
at 9/30/16 | Purchases | Sales | at 3/31/17 | Gain/(Loss) | Income | at 3/31/17 | |||||||||||||||||||||||||||
Colony American Homes III | |||||||||||||||||||||||||||||||||
6,162,871 | — | — | 6,162,871 | $— | $344,978 | $6,356,755 | |||||||||||||||||||||||||||
Janus Cash Liquidity Fund LLC | |||||||||||||||||||||||||||||||||
39,813,742 | 2,092,248,846 | (2,036,117,984) | 95,944,604 | — | 222,009 | 95,944,604 | |||||||||||||||||||||||||||
Total | $— | $566,987 | $102,301,359 | ||||||||||||||||||||||||||||||
Janus Investment Fund | 23 |
Janus Balanced Fund
Notes to Schedule of Investments and Other Information (unaudited)
§ | Schedule of Restricted and Illiquid Securities (as of March 31, 2017) | |||||||||
Value as a | ||||||||||
Acquisition | % of Net | |||||||||
Date | Cost | Value | Assets | |||||||
Colony American Homes III | 1/30/13 | $ | 7,735,272 | $ | 6,356,755 | 0.0 | % | |||
FREMF 2010 K-SCT Mortgage Trust, 2.0000%, 1/25/20 | 4/29/13 | 10,516,502 | 10,486,561 | 0.1 | ||||||
Total | $ | 18,251,774 | $ | 16,843,316 | 0.1 | % | ||||
The Fund has registration rights for certain restricted securities held as of March 31, 2017. The issuer incurs all registration costs. | ||||||||||
The following is a summary of the inputs that were used to value the Fund’s investments in securities and other financial instruments as of March 31, 2017. See Notes to Financial Statements for more information. | ||||||||||||
Valuation Inputs Summary | ||||||||||||
Level 2 - | Level 3 - | |||||||||||
Level 1 - | Other Significant | Significant | ||||||||||
Quotes Prices | Observable Inputs | Unobservable Inputs | ||||||||||
Assets | ||||||||||||
Investments in Securities: | ||||||||||||
Asset-Backed/Commercial Mortgage-Backed Securities | $ | - | $ | 318,469,788 | $ | - | ||||||
Bank Loans and Mezzanine Loans | - | 257,638,877 | - | |||||||||
Corporate Bonds | - | 2,256,244,259 | - | |||||||||
Mortgage-Backed Securities | - | 1,179,564,126 | - | |||||||||
United States Treasury Notes/Bonds | - | 576,539,938 | - | |||||||||
Common Stocks | ||||||||||||
Real Estate Management & Development | 120,842,369 | - | 6,356,755 | |||||||||
All Other | 8,074,841,589 | - | - | |||||||||
Preferred Stocks | - | 42,778,462 | - | |||||||||
Investment Companies | - | 95,944,604 | - | |||||||||
Total Assets | $ | 8,195,683,958 | $ | 4,727,180,054 | $ | 6,356,755 | ||||||
24 | MARCH 31, 2017 |
Janus Balanced Fund
Statement of Assets and Liabilities (unaudited)
March 31, 2017
See footnotes at the end of the Statement. |
|
|
|
|
|
|
|
Assets: | ||||||
Investments, at cost | $ | 10,523,667,863 | ||||
Unaffiliated investments, at value | 12,826,919,408 | |||||
Affiliated investments, at value | 102,301,359 | |||||
Non-interested Trustees' deferred compensation | 244,033 | |||||
Receivables: | ||||||
Fund shares sold | 43,549,853 | |||||
Interest | 37,233,549 | |||||
Investments sold | 16,761,842 | |||||
Dividends | 8,874,586 | |||||
Dividends from affiliates | 83,012 | |||||
Other assets | 141,554 | |||||
Total Assets |
|
| 13,036,109,196 |
| ||
Liabilities: | ||||||
Due to custodian | 1,443,718 | |||||
Payables: | — | |||||
Fund shares repurchased | 58,936,132 | |||||
Investments purchased | 52,800,595 | |||||
Advisory fees | 6,462,398 | |||||
Dividends | 2,957,011 | |||||
Transfer agent fees and expenses | 1,924,350 | |||||
12b-1 Distribution and shareholder servicing fees | 1,658,444 | |||||
Non-interested Trustees' deferred compensation fees | 244,033 | |||||
Fund administration fees | 111,623 | |||||
Non-interested Trustees' fees and expenses | 94,665 | |||||
Professional fees | 39,211 | |||||
Custodian fees | 5,105 | |||||
Accrued expenses and other payables | 396,631 | |||||
Total Liabilities |
|
| 127,073,916 |
| ||
Net Assets |
| $ | 12,909,035,280 |
| ||
See Notes to Financial Statements. | |
Janus Investment Fund | 25 |
Janus Balanced Fund
Statement of Assets and Liabilities (unaudited)
March 31, 2017
|
|
|
|
|
|
|
Net Assets Consist of: | ||||||
Capital (par value and paid-in surplus) | $ | 10,410,637,768 | ||||
Undistributed net investment income/(loss) | (3,206,205) | |||||
Undistributed net realized gain/(loss) from investments and foreign currency transactions | 96,007,208 | |||||
Unrealized net appreciation/(depreciation) of investments, foreign currency translations and non-interested Trustees’ deferred compensation | 2,405,596,509 | |||||
Total Net Assets |
| $ | 12,909,035,280 |
| ||
Net Assets - Class A Shares | $ | 703,191,508 | ||||
Shares Outstanding, $0.01 Par Value (unlimited shares authorized) | 23,035,793 | |||||
Net Asset Value Per Share(1) |
| $ | 30.53 |
| ||
Maximum Offering Price Per Share(2) |
| $ | 32.39 |
| ||
Net Assets - Class C Shares | $ | 1,309,374,365 | ||||
Shares Outstanding, $0.01 Par Value (unlimited shares authorized) | 43,230,194 | |||||
Net Asset Value Per Share(1) |
| $ | 30.29 |
| ||
Net Assets - Class D Shares | $ | 1,478,137,151 | ||||
Shares Outstanding, $0.01 Par Value (unlimited shares authorized) | 48,322,906 | |||||
Net Asset Value Per Share |
| $ | 30.59 |
| ||
Net Assets - Class I Shares | $ | 1,827,069,773 | ||||
Shares Outstanding, $0.01 Par Value (unlimited shares authorized) | 59,713,501 | |||||
Net Asset Value Per Share |
| $ | 30.60 |
| ||
Net Assets - Class N Shares | $ | 1,989,497,272 | ||||
Shares Outstanding, $0.01 Par Value (unlimited shares authorized) | 65,085,248 | |||||
Net Asset Value Per Share |
| $ | 30.57 |
| ||
Net Assets - Class R Shares | $ | 337,313,631 | ||||
Shares Outstanding, $0.01 Par Value (unlimited shares authorized) | 11,105,760 | |||||
Net Asset Value Per Share |
| $ | 30.37 |
| ||
Net Assets - Class S Shares | $ | 629,199,920 | ||||
Shares Outstanding, $0.01 Par Value (unlimited shares authorized) | 20,619,673 | |||||
Net Asset Value Per Share |
| $ | 30.51 |
| ||
Net Assets - Class T Shares | $ | 4,635,251,660 | ||||
Shares Outstanding, $0.01 Par Value (unlimited shares authorized) | 151,705,197 | |||||
Net Asset Value Per Share |
| $ | 30.55 |
| ||
(1) Redemption price per share may be reduced for any applicable contingent deferred sales charge. (2) Maximum offering price is computed at 100/94.25 of net asset value. |
See Notes to Financial Statements. | |
26 | MARCH 31, 2017 |
Janus Balanced Fund
Statement of Operations (unaudited)
For the period ended March 31, 2017
|
|
|
|
|
|
Investment Income: | |||||
| Dividends | $ | 92,620,726 | ||
Interest | 70,541,445 | ||||
Dividends from affiliates | 566,987 | ||||
Other income | 595,799 | ||||
Foreign tax withheld | (43,989) | ||||
Total Investment Income |
| 164,280,968 |
| ||
Expenses: | |||||
Advisory fees | 35,148,577 | ||||
12b-1Distribution and shareholder servicing fees: | |||||
Class A Shares | 1,088,287 | ||||
Class C Shares | 6,390,542 | ||||
Class R Shares | 786,574 | ||||
Class S Shares | 807,675 | ||||
Transfer agent administrative fees and expenses: | |||||
Class D Shares | 861,245 | ||||
Class R Shares | 394,870 | ||||
Class S Shares | 807,675 | ||||
Class T Shares | 5,759,767 | ||||
Transfer agent networking and omnibus fees: | |||||
Class A Shares | 461,793 | ||||
Class C Shares | 507,477 | ||||
Class I Shares | 640,745 | ||||
Other transfer agent fees and expenses: | |||||
Class A Shares | 52,080 | ||||
Class C Shares | 88,464 | ||||
Class D Shares | 114,040 | ||||
Class I Shares | 35,834 | ||||
Class N Shares | 25,772 | ||||
Class R Shares | 1,261 | ||||
Class S Shares | 2,094 | ||||
Class T Shares | 14,257 | ||||
Fund administration fees | 607,113 | ||||
Shareholder reports expense | 363,126 | ||||
Non-interested Trustees’ fees and expenses | 200,745 | ||||
Registration fees | 152,370 | ||||
Professional fees | 88,287 | ||||
Custodian fees | 39,600 | ||||
Other expenses | 525,583 | ||||
Total Expenses |
| 55,965,853 |
| ||
Less: Excess Expense Reimbursement |
| (115,048) |
| ||
Net Expenses |
| 55,850,805 |
| ||
Net Investment Income/(Loss) |
| 108,430,163 |
| ||
Net Realized Gain/(Loss) on Investments: | |||||
Investments and foreign currency transactions | 98,558,517 | ||||
Total Net Realized Gain/(Loss) on Investments |
| 98,558,517 |
| ||
Change in Unrealized Net Appreciation/Depreciation: | |||||
Investments, foreign currency translations and non-interested Trustees’ deferred compensation | 742,395,124 | ||||
Total Change in Unrealized Net Appreciation/Depreciation |
| 742,395,124 |
| ||
Net Increase/(Decrease) in Net Assets Resulting from Operations | $ | 949,383,804 |
| ||
See Notes to Financial Statements. | |
Janus Investment Fund | 27 |
Janus Balanced Fund
Statements of Changes in Net Assets
|
|
| Period
ended |
| Year ended | |||
Operations: | ||||||||
Net investment income/(loss) | $ | 108,430,163 | $ | 221,221,189 | ||||
Net realized gain/(loss) on investments | 98,558,517 | 159,099,737 | ||||||
Change in unrealized net appreciation/depreciation | 742,395,124 | 366,986,579 | ||||||
Net Increase/(Decrease) in Net Assets Resulting from Operations |
| 949,383,804 |
|
| 747,307,505 | |||
Dividends and Distributions to Shareholders: | ||||||||
Dividends from Net Investment Income | ||||||||
Class A Shares | (9,282,513) | (16,944,726) | ||||||
Class C Shares | (10,435,976) | (14,938,138) | ||||||
Class D Shares | (17,370,554) | (25,627,380) | ||||||
Class I Shares | (20,872,733) | (30,967,472) | ||||||
Class N Shares | (24,121,881) | (35,354,476) | ||||||
Class R Shares | (3,244,349) | (3,742,042) | ||||||
Class S Shares | (6,715,103) | (10,384,292) | ||||||
Class T Shares | (53,076,736) | (83,564,162) | ||||||
| Total Dividends from Net Investment Income |
| (145,119,845) |
|
| (221,522,688) | ||
Distributions from Net Realized Gain from Investment Transactions | ||||||||
Class A Shares | (10,879,237) | (45,340,413) | ||||||
Class C Shares | (15,956,168) | (60,624,654) | ||||||
Class D Shares | (16,710,703) | (62,550,462) | ||||||
Class I Shares | (18,975,938) | (70,501,358) | ||||||
Class N Shares | (21,666,308) | (77,682,726) | ||||||
Class R Shares | (4,011,088) | (12,754,560) | ||||||
Class S Shares | (7,629,078) | (32,384,158) | ||||||
Class T Shares | (53,548,122) | (218,072,346) | ||||||
| Total Distributions from Net Realized Gain from Investment Transactions | (149,376,642) |
|
| (579,910,677) | |||
Net Decrease from Dividends and Distributions to Shareholders |
| (294,496,487) |
|
| (801,433,365) | |||
Capital Share Transactions: | ||||||||
Class A Shares | (351,065,879) | 46,762,809 | ||||||
Class C Shares | (167,881,209) | 148,921,384 | ||||||
Class D Shares | (6,893,461) | 33,812,313 | ||||||
Class I Shares | 106,215,323 | 130,777,401 | ||||||
Class N Shares | 58,318,837 | 128,628,757 | ||||||
Class R Shares | 38,386,240 | 3,466,223 | ||||||
Class S Shares | (61,393,994) | (91,107,218) | ||||||
Class T Shares | (266,080,406) | (45,643,355) | ||||||
Net Increase/(Decrease) from Capital Share Transactions |
| (650,394,549) |
|
| 355,618,314 | |||
Net Increase/(Decrease) in Net Assets |
| 4,492,768 |
|
| 301,492,454 | |||
Net Assets: | ||||||||
Beginning of period | 12,904,542,512 | 12,603,050,058 | ||||||
| End of period | $ | 12,909,035,280 |
| $ | 12,904,542,512 | ||
Undistributed Net Investment Income/(Loss) | $ | (3,206,205) |
| $ | 33,483,477 | |||
See Notes to Financial Statements. | |
28 | MARCH 31, 2017 |
Janus Balanced Fund
Financial Highlights
Class A Shares | |||||||||||||||||||||
For a share outstanding during the period ended March 31, 2017 (unaudited) and each year ended September 30 | 2017 |
|
| 2016 |
|
| 2015 |
|
| 2014 |
|
| 2013 |
|
| 2012 | |||||
Net Asset Value, Beginning of Period |
| $29.00 |
|
| $29.12 |
|
| $31.10 |
|
| $29.11 |
|
| $27.01 |
|
| $23.19 |
| |||
Income/(Loss) from Investment Operations: | |||||||||||||||||||||
Net investment income/(loss) | 0.24(1) | 0.47(1) | 0.55(1) | 0.49(1) | 0.51 | 0.50 | |||||||||||||||
Net realized and unrealized gain/(loss) | 1.97 | 1.22 | (0.70) | 2.83 | 2.90 | 4.22 | |||||||||||||||
Total from Investment Operations |
| 2.21 |
|
| 1.69 |
|
| (0.15) |
|
| 3.32 |
|
| 3.41 |
|
| 4.72 |
| |||
Less Dividends and Distributions: | |||||||||||||||||||||
Dividends (from net investment income) | (0.33) | (0.48) | (0.52) | (0.47) | (0.50) | (0.49) | |||||||||||||||
Distributions (from capital gains) | (0.35) | (1.33) | (1.31) | (0.86) | (0.81) | (0.41) | |||||||||||||||
Total Dividends and Distributions |
| (0.68) |
|
| (1.81) |
|
| (1.83) |
|
| (1.33) |
|
| (1.31) |
|
| (0.90) |
| |||
Net Asset Value, End of Period | $30.53 | $29.00 | $29.12 | $31.10 | $29.11 | $27.01 | |||||||||||||||
Total Return* |
| 7.69% |
|
| 5.86% |
|
| (0.59)% |
|
| 11.65% |
|
| 13.12% |
|
| 20.70% |
| |||
Net Assets, End of Period (in thousands) | $703,192 | $1,008,842 | $966,624 | $835,681 | $765,049 | $656,171 | |||||||||||||||
Average Net Assets for the Period (in thousands) | $879,839 | $1,037,006 | $941,167 | $839,360 | $690,266 | $610,115 | |||||||||||||||
Ratios to Average Net Assets**: |
|
|
|
|
|
|
|
|
|
|
|
|
|
|
|
|
|
| |||
Ratio of Gross Expenses | 0.94% | 0.94% | 0.93% | 0.95% | 0.94% | 0.98% | |||||||||||||||
Ratio of Net Expenses (After Waivers and Expense Offsets) | 0.94% | 0.94% | 0.93% | 0.95% | 0.94% | 0.98% | |||||||||||||||
Ratio of Net Investment Income/(Loss) | 1.59% | 1.63% | 1.78% | 1.61% | 1.66% | 1.87% | |||||||||||||||
Portfolio Turnover Rate | 27% | 83% | 75% | 72% | 78% | 84% | |||||||||||||||
1 | |||||||||||||||||||||
Class C Shares | |||||||||||||||||||||
For a share outstanding during the period ended March 31, 2017 (unaudited) and each year ended September 30 | 2017 |
|
| 2016 |
|
| 2015 |
|
| 2014 |
|
| 2013 |
|
| 2012 |
| ||||
Net Asset Value, Beginning of Period |
| $28.78 |
|
| $28.95 |
|
| $30.93 |
|
| $29.00 |
|
| $26.93 |
|
| $23.15 |
| |||
Income/(Loss) from Investment Operations: | |||||||||||||||||||||
Net investment income/(loss) | 0.14(1) | 0.26(1) | 0.34(1) | 0.27(1) | 0.32 | 0.31 | |||||||||||||||
Net realized and unrealized gain/(loss) | 1.95 | 1.20 | (0.69) | 2.80 | 2.88 | 4.22 | |||||||||||||||
Total from Investment Operations |
| 2.09 |
|
| 1.46 |
|
| (0.35) |
|
| 3.07 |
|
| 3.20 |
|
| 4.53 |
| |||
Less Dividends and Distributions: | |||||||||||||||||||||
Dividends (from net investment income) | (0.23) | (0.30) | (0.32) | (0.28) | (0.32) | (0.34) | |||||||||||||||
Distributions (from capital gains) | (0.35) | (1.33) | (1.31) | (0.86) | (0.81) | (0.41) | |||||||||||||||
Total Dividends and Distributions |
| (0.58) |
|
| (1.63) |
|
| (1.63) |
|
| (1.14) |
|
| (1.13) |
|
| (0.75) |
| |||
Net Asset Value, End of Period | $30.29 | $28.78 | $28.95 | $30.93 | $29.00 | $26.93 | |||||||||||||||
Total Return* |
| 7.34% |
|
| 5.09% |
|
| (1.25)% |
|
| 10.78% |
|
| 12.30% |
|
| 19.84% |
| |||
Net Assets, End of Period (in thousands) | $1,309,374 | $1,408,455 | $1,267,034 | $996,498 | $708,673 | $538,591 | |||||||||||||||
Average Net Assets for the Period (in thousands) | $1,352,193 | $1,401,426 | $1,175,456 | $874,136 | $597,677 | $491,552 | |||||||||||||||
Ratios to Average Net Assets**: |
|
|
|
|
|
|
|
|
|
|
|
|
|
|
|
|
|
| |||
Ratio of Gross Expenses | 1.61% | 1.65% | 1.61% | 1.68% | 1.70% | 1.72% | |||||||||||||||
Ratio of Net Expenses (After Waivers and Expense Offsets) | 1.61% | 1.65% | 1.61% | 1.68% | 1.70% | 1.72% | |||||||||||||||
Ratio of Net Investment Income/(Loss) | 0.95% | 0.92% | 1.10% | 0.88% | 0.90% | 1.13% | |||||||||||||||
Portfolio Turnover Rate | 27% | 83% | 75% | 72% | 78% | 84% | |||||||||||||||
* Total return not annualized for periods of less than one full year. ** Annualized for periods of less than one full year. (1) Per share amounts are calculated based on average shares outstanding during the year or period. |
See Notes to Financial Statements. | |
Janus Investment Fund | 29 |
Janus Balanced Fund
Financial Highlights
Class D Shares | |||||||||||||||||||||
For a share outstanding during the period ended March 31, 2017 (unaudited) and each year ended September 30 | 2017 |
|
| 2016 |
|
| 2015 |
|
| 2014 |
|
| 2013 |
|
| 2012 | |||||
Net Asset Value, Beginning of Period |
| $29.06 |
|
| $29.17 |
|
| $31.14 |
|
| $29.15 |
|
| $27.03 |
|
| $23.19 |
| |||
Income/(Loss) from Investment Operations: | |||||||||||||||||||||
Net investment income/(loss) | 0.27(1) | 0.53(1) | 0.61(1) | 0.56(1) | 0.56 | 0.56 | |||||||||||||||
Net realized and unrealized gain/(loss) | 1.97 | 1.22 | (0.69) | 2.82 | 2.92 | 4.23 | |||||||||||||||
Total from Investment Operations |
| 2.24 |
|
| 1.75 |
|
| (0.08) |
|
| 3.38 |
|
| 3.48 |
|
| 4.79 |
| |||
Less Dividends and Distributions: | |||||||||||||||||||||
Dividends (from net investment income) | (0.36) | (0.53) | (0.58) | (0.53) | (0.55) | (0.54) | |||||||||||||||
Distributions (from capital gains) | (0.35) | (1.33) | (1.31) | (0.86) | (0.81) | (0.41) | |||||||||||||||
Total Dividends and Distributions |
| (0.71) |
|
| (1.86) |
|
| (1.89) |
|
| (1.39) |
|
| (1.36) |
|
| (0.95) |
| |||
Net Asset Value, End of Period | $30.59 | $29.06 | $29.17 | $31.14 | $29.15 | $27.03 | |||||||||||||||
Total Return* |
| 7.80% |
|
| 6.07% |
|
| (0.38)% |
|
| 11.86% |
|
| 13.40% |
|
| 21.03% |
| |||
Net Assets, End of Period (in thousands) | $1,478,137 | $1,411,125 | $1,382,693 | $1,414,364 | $1,288,565 | $1,157,251 | |||||||||||||||
Average Net Assets for the Period (in thousands) | $1,438,532 | $1,415,240 | $1,453,548 | $1,383,412 | $1,212,029 | $1,089,153 | |||||||||||||||
Ratios to Average Net Assets**: |
|
|
|
|
|
|
|
|
|
|
|
|
|
|
|
|
|
| |||
Ratio of Gross Expenses | 0.73% | 0.73% | 0.73% | 0.73% | 0.73% | 0.72% | |||||||||||||||
Ratio of Net Expenses (After Waivers and Expense Offsets) | 0.73% | 0.73% | 0.73% | 0.73% | 0.73% | 0.72% | |||||||||||||||
Ratio of Net Investment Income/(Loss) | 1.85% | 1.83% | 1.98% | 1.83% | 1.87% | 2.13% | |||||||||||||||
Portfolio Turnover Rate | 27% | 83% | 75% | 72% | 78% | 84% | |||||||||||||||
Class I Shares | |||||||||||||||||||||
For a share outstanding during the period ended March 31, 2017 (unaudited) and each year ended September 30 | 2017 |
|
| 2016 |
|
| 2015 |
|
| 2014 |
|
| 2013 |
|
| 2012 |
| ||||
Net Asset Value, Beginning of Period |
| $29.06 |
|
| $29.18 |
|
| $31.15 |
|
| $29.15 |
|
| $27.02 |
|
| $23.19 |
| |||
Income/(Loss) from Investment Operations: | |||||||||||||||||||||
Net investment income/(loss) | 0.29(1) | 0.55(1) | 0.64(1) | 0.59(1) | 0.45 | 0.57 | |||||||||||||||
Net realized and unrealized gain/(loss) | 1.97 | 1.21 | (0.70) | 2.83 | 3.05 | 4.22 | |||||||||||||||
Total from Investment Operations |
| 2.26 |
|
| 1.76 |
|
| (0.06) |
|
| 3.42 |
|
| 3.50 |
|
| 4.79 |
| |||
Less Dividends and Distributions: | |||||||||||||||||||||
Dividends (from net investment income) | (0.37) | (0.55) | (0.60) | (0.56) | (0.56) | (0.55) | |||||||||||||||
Distributions (from capital gains) | (0.35) | (1.33) | (1.31) | (0.86) | (0.81) | (0.41) | |||||||||||||||
Total Dividends and Distributions |
| (0.72) |
|
| (1.88) |
|
| (1.91) |
|
| (1.42) |
|
| (1.37) |
|
| (0.96) |
| |||
Net Asset Value, End of Period | $30.60 | $29.06 | $29.18 | $31.15 | $29.15 | $27.02 | |||||||||||||||
Total Return* |
| 7.87% |
|
| 6.10% |
|
| (0.30)% |
|
| 11.99% |
|
| 13.47% |
|
| 21.02% |
| |||
Net Assets, End of Period (in thousands) | $1,827,070 | $1,636,459 | $1,510,302 | $1,306,391 | $966,885 | $1,990,129 | |||||||||||||||
Average Net Assets for the Period (in thousands) | $1,670,869 | $1,651,399 | $1,482,511 | $1,167,616 | $1,148,507 | $1,846,745 | |||||||||||||||
Ratios to Average Net Assets**: |
|
|
|
|
|
|
|
|
|
|
|
|
|
|
|
|
|
| |||
Ratio of Gross Expenses | 0.66% | 0.67% | 0.65% | 0.64% | 0.69% | 0.69% | |||||||||||||||
Ratio of Net Expenses (After Waivers and Expense Offsets) | 0.66% | 0.67% | 0.65% | 0.64% | 0.69% | 0.69% | |||||||||||||||
Ratio of Net Investment Income/(Loss) | 1.92% | 1.90% | 2.06% | 1.92% | 2.02% | 2.16% | |||||||||||||||
Portfolio Turnover Rate | 27% | 83% | 75% | 72% | 78% | 84% | |||||||||||||||
* Total return not annualized for periods of less than one full year. ** Annualized for periods of less than one full year. (1) Per share amounts are calculated based on average shares outstanding during the year or period. |
See Notes to Financial Statements. | |
30 | MARCH 31, 2017 |
Janus Balanced Fund
Financial Highlights
Class N Shares | |||||||||||||||||||||
For a share outstanding during the period ended March 31, 2017 (unaudited) and each year or period ended September 30 | 2017 |
|
| 2016 |
|
| 2015 |
|
| 2014 |
|
| 2013 |
|
| 2012(1) | |||||
Net Asset Value, Beginning of Period |
| $29.04 |
|
| $29.15 |
|
| $31.11 |
|
| $29.12 |
|
| $27.01 |
|
| $25.46 |
| |||
Income/(Loss) from Investment Operations: | |||||||||||||||||||||
Net investment income/(loss) | 0.30(2) | 0.57(2) | 0.66(2) | 0.60(2) | 0.77 | 0.17 | |||||||||||||||
Net realized and unrealized gain/(loss) | 1.96 | 1.22 | (0.69) | 2.83 | 2.74 | 1.67 | |||||||||||||||
Total from Investment Operations |
| 2.26 |
|
| 1.79 |
|
| (0.03) |
|
| 3.43 |
|
| 3.51 |
|
| 1.84 |
| |||
Less Dividends and Distributions: | |||||||||||||||||||||
Dividends (from net investment income) | (0.38) | (0.57) | (0.62) | (0.58) | (0.59) | (0.29) | |||||||||||||||
Distributions (from capital gains) | (0.35) | (1.33) | (1.31) | (0.86) | (0.81) | — | |||||||||||||||
Total Dividends and Distributions |
| (0.73) |
|
| (1.90) |
|
| (1.93) |
|
| (1.44) |
|
| (1.40) |
|
| (0.29) |
| |||
Net Asset Value, End of Period | $30.57 | $29.04 | $29.15 | $31.11 | $29.12 | $27.01 | |||||||||||||||
Total Return* |
| 7.88% |
|
| 6.23% |
|
| (0.20)% |
|
| 12.03% |
|
| 13.52% |
|
| 7.25% |
| |||
Net Assets, End of Period (in thousands) | $1,989,497 | $1,834,036 | $1,709,643 | $1,648,665 | $1,432,413 | $7,610 | |||||||||||||||
Average Net Assets for the Period (in thousands) | $1,889,420 | $1,801,032 | $1,751,330 | $1,532,107 | $1,029,152 | $483 | |||||||||||||||
Ratios to Average Net Assets**: |
|
|
|
|
|
|
|
|
|
|
|
|
|
|
|
|
|
| |||
Ratio of Gross Expenses | 0.58% | 0.59% | 0.58% | 0.58% | 0.58% | 0.82% | |||||||||||||||
Ratio of Net Expenses (After Waivers and Expense Offsets) | 0.58% | 0.59% | 0.58% | 0.58% | 0.58% | 0.77% | |||||||||||||||
Ratio of Net Investment Income/(Loss) | 1.99% | 1.98% | 2.14% | 1.98% | 1.89% | 2.98% | |||||||||||||||
Portfolio Turnover Rate | 27% | 83% | 75% | 72% | 78% | 84% | |||||||||||||||
Class R Shares | |||||||||||||||||||||
For a share outstanding during the period ended March 31, 2017 (unaudited) and each year ended September 30 | 2017 |
|
| 2016 |
|
| 2015 |
|
| 2014 |
|
| 2013 |
|
| 2012 |
| ||||
Net Asset Value, Beginning of Period |
| $28.87 |
|
| $29.02 |
|
| $30.99 |
|
| $29.03 |
|
| $26.95 |
|
| $23.15 |
| |||
Income/(Loss) from Investment Operations: | |||||||||||||||||||||
Net investment income/(loss) | 0.18(2) | 0.35(2) | 0.43(2) | 0.37(2) | 0.40 | 0.41 | |||||||||||||||
Net realized and unrealized gain/(loss) | 1.96 | 1.21 | (0.68) | 2.82 | 2.89 | 4.22 | |||||||||||||||
Total from Investment Operations |
| 2.14 |
|
| 1.56 |
|
| (0.25) |
|
| 3.19 |
|
| 3.29 |
|
| 4.63 |
| |||
Less Dividends and Distributions: | |||||||||||||||||||||
Dividends (from net investment income) | (0.29) | (0.38) | (0.41) | (0.37) | (0.40) | (0.42) | |||||||||||||||
Distributions (from capital gains) | (0.35) | (1.33) | (1.31) | (0.86) | (0.81) | (0.41) | |||||||||||||||
Total Dividends and Distributions |
| (0.64) |
|
| (1.71) |
|
| (1.72) |
|
| (1.23) |
|
| (1.21) |
|
| (0.83) |
| |||
Net Asset Value, End of Period | $30.37 | $28.87 | $29.02 | $30.99 | $29.03 | $26.95 | |||||||||||||||
Total Return* |
| 7.47% |
|
| 5.40% |
|
| (0.94)% |
|
| 11.20% |
|
| 12.68% |
|
| 20.32% |
| |||
Net Assets, End of Period (in thousands) | $337,314 | $283,729 | $281,398 | $309,887 | $279,905 | $235,356 | |||||||||||||||
Average Net Assets for the Period (in thousands) | $316,164 | $288,241 | $297,615 | $296,348 | $258,708 | $202,808 | |||||||||||||||
Ratios to Average Net Assets**: |
|
|
|
|
|
|
|
|
|
|
|
|
|
|
|
|
|
| |||
Ratio of Gross Expenses | 1.33% | 1.34% | 1.31% | 1.33% | 1.33% | 1.33% | |||||||||||||||
Ratio of Net Expenses (After Waivers and Expense Offsets) | 1.33% | 1.34% | 1.31% | 1.33% | 1.33% | 1.33% | |||||||||||||||
Ratio of Net Investment Income/(Loss) | 1.25% | 1.23% | 1.39% | 1.23% | 1.27% | 1.51% | |||||||||||||||
Portfolio Turnover Rate | 27% | 83% | 75% | 72% | 78% | 84% | |||||||||||||||
* Total return not annualized for periods of less than one full year. ** Annualized for periods of less than one full year. (1) Period from May 31, 2012 (inception date) through September 30, 2012. (2) Per share amounts are calculated based on average shares outstanding during the year or period. |
See Notes to Financial Statements. | |
Janus Investment Fund | 31 |
Janus Balanced Fund
Financial Highlights
Class S Shares | |||||||||||||||||||||
For a share outstanding during the period ended March 31, 2017 (unaudited) and each year ended September 30 | 2017 |
|
| 2016 |
|
| 2015 |
|
| 2014 |
|
| 2013 |
|
| 2012 | |||||
Net Asset Value, Beginning of Period |
| $28.99 |
|
| $29.12 |
|
| $31.09 |
|
| $29.11 |
|
| $27.01 |
|
| $23.19 |
| |||
Income/(Loss) from Investment Operations: | |||||||||||||||||||||
Net investment income/(loss) | 0.22(1) | 0.43(1) | 0.50(1) | 0.45(1) | 0.47 | 0.47 | |||||||||||||||
Net realized and unrealized gain/(loss) | 1.96 | 1.21 | (0.68) | 2.83 | 2.90 | 4.23 | |||||||||||||||
Total from Investment Operations |
| 2.18 |
|
| 1.64 |
|
| (0.18) |
|
| 3.28 |
|
| 3.37 |
|
| 4.70 |
| |||
Less Dividends and Distributions: | |||||||||||||||||||||
Dividends (from net investment income) | (0.31) | (0.44) | (0.48) | (0.44) | (0.46) | (0.47) | |||||||||||||||
Distributions (from capital gains) | (0.35) | (1.33) | (1.31) | (0.86) | (0.81) | (0.41) | |||||||||||||||
Total Dividends and Distributions |
| (0.66) |
|
| (1.77) |
|
| (1.79) |
|
| (1.30) |
|
| (1.27) |
|
| (0.88) |
| |||
Net Asset Value, End of Period | $30.51 | $28.99 | $29.12 | $31.09 | $29.11 | $27.01 | |||||||||||||||
Total Return* |
| 7.60% |
|
| 5.68% |
|
| (0.71)% |
|
| 11.49% |
|
| 12.97% |
|
| 20.60% |
| |||
Net Assets, End of Period (in thousands) | $629,200 | $657,563 | $750,461 | $837,505 | $837,535 | $789,572 | |||||||||||||||
Average Net Assets for the Period (in thousands) | $648,154 | $706,818 | $828,503 | $844,760 | $811,115 | $722,713 | |||||||||||||||
Ratios to Average Net Assets**: |
|
|
|
|
|
|
|
|
|
|
|
|
|
|
|
|
|
| |||
Ratio of Gross Expenses | 1.08% | 1.09% | 1.08% | 1.08% | 1.08% | 1.08% | |||||||||||||||
Ratio of Net Expenses (After Waivers and Expense Offsets) | 1.08% | 1.08% | 1.07% | 1.08% | 1.08% | 1.08% | |||||||||||||||
Ratio of Net Investment Income/(Loss) | 1.49% | 1.48% | 1.63% | 1.47% | 1.52% | 1.77% | |||||||||||||||
Portfolio Turnover Rate | 27% | 83% | 75% | 72% | 78% | 84% | |||||||||||||||
Class T Shares | |||||||||||||||||||||
For a share outstanding during the period ended March 31, 2017 (unaudited) and each year ended September 30 | 2017 |
|
| 2016 |
|
| 2015 |
|
| 2014 |
|
| 2013 |
|
| 2012 |
| ||||
Net Asset Value, Beginning of Period |
| $29.02 |
|
| $29.15 |
|
| $31.12 |
|
| $29.13 |
|
| $27.02 |
|
| $23.19 |
| |||
Income/(Loss) from Investment Operations: | |||||||||||||||||||||
Net investment income/(loss) | 0.26(1) | 0.50(1) | 0.58(1) | 0.53(1) | 0.53 | 0.54 | |||||||||||||||
Net realized and unrealized gain/(loss) | 1.97 | 1.20 | (0.69) | 2.83 | 2.92 | 4.22 | |||||||||||||||
Total from Investment Operations |
| 2.23 |
|
| 1.70 |
|
| (0.11) |
|
| 3.36 |
|
| 3.45 |
|
| 4.76 |
| |||
Less Dividends and Distributions: | |||||||||||||||||||||
Dividends (from net investment income) | (0.35) | (0.50) | (0.55) | (0.51) | (0.53) | (0.52) | |||||||||||||||
Distributions (from capital gains) | (0.35) | (1.33) | (1.31) | (0.86) | (0.81) | (0.41) | |||||||||||||||
Total Dividends and Distributions |
| (0.70) |
|
| (1.83) |
|
| (1.86) |
|
| (1.37) |
|
| (1.34) |
|
| (0.93) |
| |||
Net Asset Value, End of Period | $30.55 | $29.02 | $29.15 | $31.12 | $29.13 | $27.02 | |||||||||||||||
Total Return* |
| 7.76% |
|
| 5.92% |
|
| (0.46)% |
|
| 11.77% |
|
| 13.27% |
|
| 20.88% |
| |||
Net Assets, End of Period (in thousands) | $4,635,252 | $4,664,334 | $4,734,896 | $4,541,805 | $3,979,849 | $3,548,410 | |||||||||||||||
Average Net Assets for the Period (in thousands) | $4,620,617 | $4,856,359 | $4,872,456 | $4,375,206 | $3,721,640 | $3,387,942 | |||||||||||||||
Ratios to Average Net Assets**: |
|
|
|
|
|
|
|
|
|
|
|
|
|
|
|
|
|
| |||
Ratio of Gross Expenses | 0.83% | 0.84% | 0.83% | 0.83% | 0.83% | 0.83% | |||||||||||||||
Ratio of Net Expenses (After Waivers and Expense Offsets) | 0.83% | 0.83% | 0.82% | 0.82% | 0.83% | 0.83% | |||||||||||||||
Ratio of Net Investment Income/(Loss) | 1.74% | 1.74% | 1.89% | 1.73% | 1.77% | 2.02% | |||||||||||||||
Portfolio Turnover Rate | 27% | 83% | 75% | 72% | 78% | 84% | |||||||||||||||
* Total return not annualized for periods of less than one full year. ** Annualized for periods of less than one full year. (1) Per share amounts are calculated based on average shares outstanding during the year or period. |
See Notes to Financial Statements. | |
32 | MARCH 31, 2017 |
Janus Balanced Fund
Notes to Financial Statements (unaudited)
1. Organization and Significant Accounting Policies
Janus Balanced Fund (the “Fund”) is a series fund. The Fund is part of Janus Investment Fund (the “Trust”), which is organized as a Massachusetts business trust and is registered under the Investment Company Act of 1940, as amended (the “1940 Act”), as an open-end management investment company, and therefore has applied the specialized accounting and reporting guidance in Financial Accounting Standards Board (“FASB”) Accounting Standards Codification (“ASC”) Topic 946. The Trust offers forty-four funds which include multiple series of shares, with differing investment objectives and policies. The Fund seeks long-term capital growth, consistent with preservation of capital and balanced by current income. The Fund is classified as diversified, as defined in the 1940 Act.
The Fund offers multiple classes of shares in order to meet the needs of various types of investors. Each class represents an interest in the same portfolio of investments. Certain financial intermediaries may not offer all classes of shares. Class D Shares are closed to certain new investors.
Shareholders, including other funds, individuals, accounts, as well as the Fund’s portfolio manager(s) and/or investment personnel, may from time to time own (beneficially or of record) a significant percentage of the Fund’s Shares and can be considered to “control” the Fund when that ownership exceeds 25% of the Fund’s assets (and which may differ from control as determined in accordance with accounting principles generally accepted in the United States of America).
Class A Shares and Class C Shares are generally offered through financial intermediary platforms including, but not limited to, traditional brokerage platforms, mutual fund wrap fee programs, bank trust platforms, and retirement platforms.
Class D Shares are generally no longer being made available to new investors who do not already have a direct account with the Janus funds. Class D Shares are available only to investors who hold accounts directly with the Janus funds, to immediate family members or members of the same household of an eligible individual investor, and to existing beneficial owners of sole proprietorships or partnerships that hold accounts directly with the Janus funds.
Class I Shares are available through certain financial intermediary platforms including, but not limited to, mutual fund wrap fee programs, managed account programs, asset allocation programs, bank trust platforms, as well as certain retirement platforms. Class I Shares are also available to certain direct institutional investors including, but not limited to, corporations, certain retirement plans, public plans, and foundations/endowments.
Class N Shares are generally available only to financial intermediaries purchasing on behalf of 401(k) plans, 457 plans, 403(b) plans, Taft-Hartley multi-employer plans, profit-sharing and money purchase pension plans, defined benefit plans and certain welfare benefit plans, such as health savings accounts, and nonqualified deferred compensation plans. Class N Shares are also available to Janus proprietary products.
Class R Shares are offered through financial intermediary platforms including, but not limited to, retirement platforms.
Class S Shares are offered through financial intermediary platforms including, but not limited to, retirement platforms and asset allocation, mutual fund wrap, or other discretionary or nondiscretionary fee-based investment advisory programs. In addition, Class S Shares may be available through certain financial intermediaries who have an agreement with Janus Capital Management LLC (“Janus Capital”) or its affiliates to offer Class S Shares on their supermarket platforms.
Class T Shares are available through certain financial intermediary platforms including, but not limited to, mutual fund wrap fee programs, managed account programs, asset allocation programs, bank trust platforms, as well as certain retirement platforms. In addition, Class T Shares may be available through certain financial intermediaries who have an agreement with Janus Capital or its affiliates to offer Class T Shares on their supermarket platforms.
The following accounting policies have been followed by the Fund and are in conformity with accounting principles generally accepted in the United States of America.
Investment Valuation
Securities held by the Fund are valued in accordance with policies and procedures established by and under the supervision of the Trustees (the “Valuation Procedures”). Equity securities traded on a domestic securities exchange are generally valued at the closing prices on the primary market or exchange on which they trade. If such price is lacking for the trading period immediately preceding the time of determination, such securities are valued at their current bid price. Equity securities that are traded on a foreign exchange are generally valued at the closing prices on such markets. In
Janus Investment Fund | 33 |
Janus Balanced Fund
Notes to Financial Statements (unaudited)
the event that there is no current trading volume on a particular security in such foreign exchange, the bid price from the primary exchange is generally used to value the security. Securities that are traded on the over-the-counter (“OTC”) markets are generally valued at their closing or latest bid prices as available. Foreign securities and currencies are converted to U.S. dollars using the applicable exchange rate in effect at the close of the New York Stock Exchange (“NYSE”). The Fund will determine the market value of individual securities held by it by using prices provided by one or more approved professional pricing services or, as needed, by obtaining market quotations from independent broker-dealers. Most debt securities are valued in accordance with the evaluated bid price supplied by the pricing service that is intended to reflect market value. The evaluated bid price supplied by the pricing service is an evaluation that may consider factors such as security prices, yields, maturities and ratings. Certain short-term securities maturing within 60 days or less may be evaluated and valued on an amortized cost basis provided that the amortized cost determined approximates market value. Securities for which market quotations or evaluated prices are not readily available or deemed unreliable are valued at fair value determined in good faith under the Valuation Procedures. Circumstances in which fair value pricing may be utilized include, but are not limited to: (i) a significant event that may affect the securities of a single issuer, such as a merger, bankruptcy, or significant issuer-specific development; (ii) an event that may affect an entire market, such as a natural disaster or significant governmental action; (iii) a nonsignificant event such as a market closing early or not opening, or a security trading halt; and (iv) pricing of a nonvalued security and a restricted or nonpublic security. Special valuation considerations may apply with respect to “odd-lot” fixed-income transactions which, due to their small size, may receive evaluated prices by pricing services which reflect a large block trade and not what actually could be obtained for the odd-lot position. The Fund uses systematic fair valuation models provided by independent third parties to value international equity securities in order to adjust for stale pricing, which may occur between the close of certain foreign exchanges and the close of the NYSE.
Valuation Inputs Summary
FASB ASC 820, Fair Value Measurements and Disclosures (“ASC 820”), defines fair value, establishes a framework for measuring fair value, and expands disclosure requirements regarding fair value measurements. This standard emphasizes that fair value is a market-based measurement that should be determined based on the assumptions that market participants would use in pricing an asset or liability and establishes a hierarchy that prioritizes inputs to valuation techniques used to measure fair value. These inputs are summarized into three broad levels:
Level 1 – Unadjusted quoted prices in active markets the Fund has the ability to access for identical assets or liabilities.
Level 2 – Observable inputs other than unadjusted quoted prices included in Level 1 that are observable for the asset or liability either directly or indirectly. These inputs may include quoted prices for the identical instrument on an inactive market, prices for similar instruments, interest rates, prepayment speeds, credit risk, yield curves, default rates and similar data.
Assets or liabilities categorized as Level 2 in the hierarchy generally include: debt securities fair valued in accordance with the evaluated bid or ask prices supplied by a pricing service; securities traded on OTC markets and listed securities for which no sales are reported that are fair valued at the latest bid price (or yield equivalent thereof) obtained from one or more dealers transacting in a market for such securities or by a pricing service approved by the Fund’s Trustees; certain short-term debt securities with maturities of 60 days or less that are fair valued at amortized cost; and equity securities of foreign issuers whose fair value is determined by using systematic fair valuation models provided by independent third parties in order to adjust for stale pricing which may occur between the close of certain foreign exchanges and the close of the NYSE. Other securities that may be categorized as Level 2 in the hierarchy include, but are not limited to, preferred stocks, bank loans, swaps, investments in unregistered investment companies, options, and forward contracts.
Level 3 – Unobservable inputs for the asset or liability to the extent that relevant observable inputs are not available, representing the Fund’s own assumptions about the assumptions that a market participant would use in valuing the asset or liability, and that would be based on the best information available.
There have been no significant changes in valuation techniques used in valuing any such positions held by the Fund since the beginning of the fiscal year.
The inputs or methodology used for fair valuing securities are not necessarily an indication of the risk associated with investing in those securities. The summary of inputs used as of March 31, 2017 to fair value the Fund’s investments in
34 | MARCH 31, 2017 |
Janus Balanced Fund
Notes to Financial Statements (unaudited)
securities and other financial instruments is included in the “Valuation Inputs Summary” in the Notes to Schedule of Investments and Other Information.
The Fund did not hold a significant amount of Level 3 securities as of March 31, 2017.
There were no transfers between Level 1, Level 2 and Level 3 of the fair value hierarchy during the period. The Fund recognizes transfers between the levels as of the beginning of the fiscal year.
Investment Transactions and Investment Income
Investment transactions are accounted for as of the date purchased or sold (trade date). Dividend income is recorded on the ex-dividend date. Certain dividends from foreign securities will be recorded as soon as the Fund is informed of the dividend, if such information is obtained subsequent to the ex-dividend date. Dividends from foreign securities may be subject to withholding taxes in foreign jurisdictions. Interest income is recorded on the accrual basis and includes amortization of premiums and accretion of discounts. Gains and losses are determined on the identified cost basis, which is the same basis used for federal income tax purposes. Income, as well as gains and losses, both realized and unrealized, are allocated daily to each class of shares based upon the ratio of net assets represented by each class as a percentage of total net assets.
Expenses
The Fund bears expenses incurred specifically on its behalf. Each class of shares bears a portion of general expenses, which are allocated daily to each class of shares based upon the ratio of net assets represented by each class as a percentage of total net assets. Expenses directly attributable to a specific class of shares are charged against the operations of such class.
Estimates
The preparation of financial statements in conformity with accounting principles generally accepted in the United States of America requires management to make estimates and assumptions that affect the reported amount of assets and liabilities and disclosure of contingent assets and liabilities at the date of the financial statements, and the reported amounts of income and expenses during the reporting period. Actual results could differ from those estimates.
Indemnifications
In the normal course of business, the Fund may enter into contracts that contain provisions for indemnification of other parties against certain potential liabilities. The Fund’s maximum exposure under these arrangements is unknown, and would involve future claims that may be made against the Fund that have not yet occurred. Currently, the risk of material loss from such claims is considered remote.
Foreign Currency Translations
The Fund does not isolate that portion of the results of operations resulting from the effect of changes in foreign exchange rates on investments from the fluctuations arising from changes in market prices of securities held at the date of the financial statements. Net unrealized appreciation or depreciation of investments and foreign currency translations arise from changes in the value of assets and liabilities, including investments in securities held at the date of the financial statements, resulting from changes in the exchange rates and changes in market prices of securities held.
Currency gains and losses are also calculated on payables and receivables that are denominated in foreign currencies. The payables and receivables are generally related to foreign security transactions and income translations.
Foreign currency-denominated assets and forward currency contracts may involve more risks than domestic transactions, including currency risk, counterparty risk, political and economic risk, regulatory risk and equity risk. Risks may arise from unanticipated movements in the value of foreign currencies relative to the U.S. dollar.
Dividends and Distributions
Dividends of net investment income are generally declared and distributed quarterly, and realized capital gains (if any) are distributed annually. The Fund may treat a portion of the amount paid to redeem shares as a distribution of investment company taxable income and realized capital gains that are reflected in the net asset value. This practice, commonly referred to as “equalization,” has no effect on the redeeming shareholder or a Fund’s total return, but may reduce the amounts that would otherwise be required to be paid as taxable dividends to the remaining shareholders. It is possible that the Internal Revenue Service (IRS) could challenge the Funds’ equalization methodology or calculations, and any such challenge could result in additional tax, interest, or penalties to be paid by the Fund.
Janus Investment Fund | 35 |
Janus Balanced Fund
Notes to Financial Statements (unaudited)
The Fund may make certain investments in real estate investment trusts (“REITs”) which pay dividends to their shareholders based upon funds available from operations. It is quite common for these dividends to exceed the REITs’ taxable earnings and profits, resulting in the excess portion of such dividends being designated as a return of capital. If the Fund distributes such amounts, such distributions could constitute a return of capital to shareholders for federal income tax purposes.
Federal Income Taxes
The Fund intends to continue to qualify as a regulated investment company and distribute all of its taxable income in accordance with the requirements of Subchapter M of the Internal Revenue Code. Management has analyzed the Fund’s tax positions taken for all open federal income tax years, generally a three-year period, and has concluded that no provision for federal income tax is required in the Fund’s financial statements. The Fund is not aware of any tax positions for which it is reasonably possible that the total amounts of unrecognized tax benefits will significantly change in the next twelve months.
2. Other Investments and Strategies
Additional Investment Risk
The financial crisis in both the U.S. and global economies over the past several years has resulted, and may continue to result, in a significant decline in the value and liquidity of many securities of issuers worldwide in the equity and fixed-income/credit markets. In response to the crisis, the United States and certain foreign governments, along with the U.S. Federal Reserve and certain foreign central banks, took steps to support the financial markets. The withdrawal of this support, a failure of measures put in place to respond to the crisis, or investor perception that such efforts were not sufficient could each negatively affect financial markets generally, and the value and liquidity of specific securities. In addition, policy and legislative changes in the United States and in other countries continue to impact many aspects of financial regulation. The effect of these changes on the markets, and the practical implications for market participants, including the Fund, may not be fully known for some time. As a result, it may also be unusually difficult to identify both investment risks and opportunities, which could limit or preclude the Fund’s ability to achieve its investment objective. Therefore, it is important to understand that the value of your investment may fall, sometimes sharply, and you could lose money.
The enactment of the Dodd-Frank Wall Street Reform and Consumer Protection Act (the “Dodd-Frank Act”) provided for widespread regulation of financial institutions, consumer financial products and services, broker-dealers, OTC derivatives, investment advisers, credit rating agencies, and mortgage lending, which expanded federal oversight in the financial sector, including the investment management industry. Many provisions of the Dodd-Frank Act remain pending and will be implemented through future rulemaking. Therefore, the ultimate impact of the Dodd-Frank Act and the regulations under the Dodd-Frank Act on the Fund and the investment management industry as a whole, is not yet certain.
A number of countries in the European Union (“EU”) have experienced, and may continue to experience, severe economic and financial difficulties. In particular, many EU nations are susceptible to economic risks associated with high levels of debt, notably due to investments in sovereign debt of countries such as Greece, Italy, Spain, Portugal, and Ireland. Many non-governmental issuers, and even certain governments, have defaulted on, or been forced to restructure, their debts. Many other issuers have faced difficulties obtaining credit or refinancing existing obligations. Financial institutions have in many cases required government or central bank support, have needed to raise capital, and/or have been impaired in their ability to extend credit. As a result, financial markets in the EU experienced extreme volatility and declines in asset values and liquidity. Responses to these financial problems by European governments, central banks, and others, including austerity measures and reforms, may not work, may result in social unrest, and may limit future growth and economic recovery or have other unintended consequences. Further defaults or restructurings by governments and others of their debt could have additional adverse effects on economies, financial markets, and asset valuations around the world. Greece, Ireland, and Portugal have already received one or more "bailouts" from other Eurozone member states, and it is unclear how much additional funding they will require or if additional Eurozone member states will require bailouts in the future. The risk of investing in securities in the European markets may also be heightened due to the referendum in which the United Kingdom voted to exit the EU (known as "Brexit"). One or more other countries may also abandon the euro and/or withdraw from the EU, placing its currency and banking system in jeopardy.
36 | MARCH 31, 2017 |
Janus Balanced Fund
Notes to Financial Statements (unaudited)
Certain areas of the world have historically been prone to and economically sensitive to environmental events such as, but not limited to, hurricanes, earthquakes, typhoons, flooding, tidal waves, tsunamis, erupting volcanoes, wildfires or droughts, tornadoes, mudslides, or other weather-related phenomena. Such disasters, and the resulting physical or economic damage, could have a severe and negative impact on the Fund’s investment portfolio and, in the longer term, could impair the ability of issuers in which the Fund invests to conduct their businesses as they would under normal conditions. Adverse weather conditions may also have a particularly significant negative effect on issuers in the agricultural sector and on insurance companies that insure against the impact of natural disasters.
Loans
The Fund may invest in various commercial loans, including bank loans, bridge loans, debtor-in-possession (“DIP”) loans, mezzanine loans, and other fixed and floating rate loans. These loans may be acquired through loan participations and assignments or on a when-issued basis. Commercial loans will comprise no more than 20% of the Fund’s total assets. Below are descriptions of the types of loans held by the Fund as of March 31, 2017.
· Bank Loans - Bank loans are obligations of companies or other entities entered into in connection with recapitalizations, acquisitions, and refinancings. The Fund’s investments in bank loans are generally acquired as a participation interest in, or assignment of, loans originated by a lender or other financial institution. These investments may include institutionally-traded floating and fixed-rate debt securities.
· Floating Rate Loans – Floating rate loans are debt securities that have floating interest rates, that adjust periodically, and are tied to a benchmark lending rate, such as London Interbank Offered Rate (“LIBOR”). In other cases, the lending rate could be tied to the prime rate offered by one or more major U.S. banks or the rate paid on large certificates of deposit traded in the secondary markets. If the benchmark lending rate changes, the rate payable to lenders under the loan will change at the next scheduled adjustment date specified in the loan agreement. Floating rate loans are typically issued to companies (‘‘borrowers’’) in connection with recapitalizations, acquisitions, and refinancings. Floating rate loan investments are generally below investment grade. Senior floating rate loans are secured by specific collateral of a borrower and are senior in the borrower’s capital structure. The senior position in the borrower’s capital structure generally gives holders of senior loans a claim on certain of the borrower’s assets that is senior to subordinated debt and preferred and common stock in the case of a borrower’s default. Floating rate loan investments may involve foreign borrowers, and investments may be denominated in foreign currencies. Floating rate loans often involve borrowers whose financial condition is troubled or uncertain and companies that are highly leveraged. The Fund may invest in obligations of borrowers who are in bankruptcy proceedings. While the Fund generally expects to invest in fully funded term loans, certain of the loans in which the Fund may invest include revolving loans, bridge loans, and delayed draw term loans.
Purchasers of floating rate loans may pay and/or receive certain fees. The Fund may receive fees such as covenant waiver fees or prepayment penalty fees. The Fund may pay fees such as facility fees. Such fees may affect the Fund’s return.
· Mezzanine Loans - Mezzanine loans are secured by the stock of the company that owns the assets. Mezzanine loans are a hybrid of debt and equity financing that is typically used to fund the expansion of existing companies. A mezzanine loan is composed of debt capital that gives the lender the right to convert to an ownership or equity interest in the company if the loan is not paid back in time and in full. Mezzanine loans typically are the most subordinated debt obligation in an issuer’s capital structure.
Mortgage- and Asset-Backed Securities
Mortgage- and asset-backed securities represent interests in “pools” of commercial or residential mortgages or other assets, including consumer loans or receivables. The Fund may purchase fixed or variable rate commercial or residential mortgage-backed securities issued by the Government National Mortgage Association (“Ginnie Mae”), the Federal National Mortgage Association (“Fannie Mae”), the Federal Home Loan Mortgage Corporation (“Freddie Mac”), or other governmental or government-related entities. Ginnie Mae’s guarantees are backed by the full faith and credit of the U.S. Government, which means that the U.S. Government guarantees that the interest and principal will be paid when due. Fannie Mae and Freddie Mac securities are not backed by the full faith and credit of the U.S. Government. In September 2008, the Federal Housing Finance Agency (“FHFA”), an agency of the U.S. Government, placed Fannie Mae and Freddie Mac under conservatorship. Since that time, Fannie Mae and Freddie Mac have received capital support through U.S. Treasury preferred stock purchases, and Treasury and Federal Reserve purchases of their mortgage-
Janus Investment Fund | 37 |
Janus Balanced Fund
Notes to Financial Statements (unaudited)
backed securities. The FHFA and the U.S. Treasury have imposed strict limits on the size of these entities’ mortgage portfolios. The FHFA has the power to cancel any contract entered into by Fannie Mae and Freddie Mac prior to FHFA’s appointment as conservator or receiver, including the guarantee obligations of Fannie Mae and Freddie Mac.
The Fund may also purchase other mortgage- and asset-backed securities through single- and multi-seller conduits, collateralized debt obligations, structured investment vehicles, and other similar securities. Asset-backed securities may be backed by various consumer obligations, including automobile loans, equipment leases, credit card receivables, or other collateral. In the event the underlying loans are not paid, the securities’ issuer could be forced to sell the assets and recognize losses on such assets, which could impact your return. Unlike traditional debt instruments, payments on these securities include both interest and a partial payment of principal. Mortgage and asset-backed securities are subject to both extension risk, where borrowers pay off their debt obligations more slowly in times of rising interest rates, and prepayment risk, where borrowers pay off their debt obligations sooner than expected in times of declining interest rates. These risks may reduce the Fund’s returns. In addition, investments in mortgage- and asset backed securities, including those comprised of subprime mortgages, may be subject to a higher degree of credit risk, valuation risk, and liquidity risk than various other types of fixed-income securities. Additionally, although mortgage-backed securities are generally supported by some form of government or private guarantee and/or insurance, there is no assurance that guarantors or insurers will meet their obligations.
Real Estate Investing
The Fund may invest in equity and debt securities of real estate-related companies. Such companies may include those in the real estate industry or real estate-related industries. These securities may include common stocks, corporate bonds, preferred stocks, and other equity securities, including, but not limited to, mortgage-backed securities, real estate-backed securities, securities of REITs and similar REIT-like entities. A REIT is a trust that invests in real estate-related projects, such as properties, mortgage loans, and construction loans. REITs are generally categorized as equity, mortgage, or hybrid REITs. A REIT may be listed on an exchange or traded OTC.
Restricted Security Transactions
Restricted securities held by the Fund may not be sold except in exempt transactions or in a public offering registered under the Securities Act of 1933, as amended. The risk of investing in such securities is generally greater than the risk of investing in the securities of widely held, publicly traded companies. Lack of a secondary market and resale restrictions may result in the inability of the Fund to sell a security at a fair price and may substantially delay the sale of the security. In addition, these securities may exhibit greater price volatility than securities for which secondary markets exist.
Sovereign Debt
The Fund may invest in U.S. and foreign government debt securities (“sovereign debt”). Investments in U.S. sovereign debt are considered low risk. However, investments in non-U.S. sovereign debt can involve a high degree of risk, including the risk that the governmental entity that controls the repayment of sovereign debt may not be willing or able to repay the principal and/or to pay the interest on its sovereign debt in a timely manner. A sovereign debtor’s willingness or ability to satisfy its debt obligation may be affected by various factors, including its cash flow situation, the extent of its foreign currency reserves, the availability of foreign exchange when a payment is due, the relative size of its debt position in relation to its economy as a whole, the sovereign debtor’s policy toward international lenders, and local political constraints to which the governmental entity may be subject. Sovereign debtors may also be dependent on expected disbursements from foreign governments, multilateral agencies, and other entities. The failure of a sovereign debtor to implement economic reforms, achieve specified levels of economic performance, or repay principal or interest when due may result in the cancellation of third party commitments to lend funds to the sovereign debtor, which may further impair such debtor’s ability or willingness to timely service its debts. The Fund may be requested to participate in the rescheduling of such sovereign debt and to extend further loans to governmental entities, which may adversely affect the Fund’s holdings. In the event of default, there may be limited or no legal remedies for collecting sovereign debt and there may be no bankruptcy proceedings through which the Fund may collect all or part of the sovereign debt that a governmental entity has not repaid.
When-Issued and Delayed Delivery Securities
The Fund may purchase or sell securities on a when-issued or delayed delivery basis. When-issued and delayed delivery securities in which the Fund may invest include U.S. Treasury Securities, municipal bonds, bank loans, and other similar instruments. The price of the underlying securities and date when the securities will be delivered and paid for are fixed at the time the transaction is negotiated. Losses may arise due to changes in the market value of the securities or from
38 | MARCH 31, 2017 |
Janus Balanced Fund
Notes to Financial Statements (unaudited)
the inability of counterparties to meet the terms of the contract. In connection with such purchases, the Fund may hold liquid assets as collateral with the Fund’s custodian sufficient to cover the purchase price.
3. Investment Advisory Agreements and Other Transactions with Affiliates
The Fund pays Janus Capital an investment advisory fee which is calculated daily and paid monthly. The Fund’s contractual investment advisory fee rate (expressed as an annual rate) is 0.55% of its average daily net assets.
Janus Capital has contractually agreed to waive the advisory fee payable by the Fund or reimburse expenses in an amount equal to the amount, if any, that the Fund’s normal operating expenses, including the investment advisory fee, but excluding the 12b-1 distribution and shareholder servicing fees (applicable to Class A Shares, Class C Shares, Class R Shares, and Class S Shares), transfer agent fees and expenses payable pursuant to the Transfer Agency Agreement, brokerage commissions, interest, dividends, taxes, acquired fund fees and expenses, and extraordinary expenses, exceed the annual rate of 0.68% of the Fund’s average daily net assets. Janus Capital has agreed to continue the waiver until at least February 1, 2018. If applicable, amounts reimbursed to the Fund by Janus Capital are disclosed as “Excess Expense Reimbursement” on the Statement of Operations.
Janus Services LLC (“Janus Services”), a wholly-owned subsidiary of Janus Capital, is the Fund’s transfer agent. In addition, Janus Services provides or arranges for the provision of certain other administrative services including, but not limited to, recordkeeping, accounting, order processing, and other shareholder services for the Fund. Janus Services is not compensated for its services related to the shares, except for out-of-pocket costs. These amounts are disclosed as “Other transfer agent fees and expenses” on the Statement of Operations.
Certain, but not all, intermediaries may charge administrative fees (such as networking and omnibus) to investors in Class A Shares, Class C Shares, and Class I Shares for administrative services provided on behalf of such investors. These administrative fees are paid by the Class A Shares, Class C Shares, and Class I Shares of the Fund to Janus Services, which uses such fees to reimburse intermediaries. Consistent with the Transfer Agency Agreement between Janus Services and the Fund, Janus Services may negotiate the level, structure, and/or terms of the administrative fees with intermediaries requiring such fees on behalf of the Fund. Janus Capital and its affiliates benefit from an increase in assets that may result from such relationships. The Funds’ Trustees have set limits on fees that the Funds may incur with respect to administrative fees paid for omnibus or networked accounts. Such limits are subject to change by the Trustees in the future. These amounts are disclosed as “Transfer agent networking and omnibus fees” on the Statement of Operations.
The Fund’s Class D Shares pay an administrative services fee at an annual rate of 0.12% of the average daily net assets of Class D Shares for shareholder services provided by Janus Services. Janus Services provides or arranges for the provision of shareholder services including, but not limited to, recordkeeping, accounting, answering inquiries regarding accounts, transaction processing, transaction confirmations, and the mailing of prospectuses and shareholder reports. These amounts are disclosed as “Transfer agent administrative fees and expenses” on the Statement of Operations.
Janus Services receives an administrative services fee at an annual rate of up to 0.25% of the average daily net assets of the Fund’s Class R Shares, Class S Shares, and Class T Shares for providing or procuring administrative services to investors in Class R Shares, Class S Shares, and Class T Shares of the Fund. Janus Services expects to use all or a significant portion of this fee to compensate retirement plan service providers, broker-dealers, bank trust departments, financial advisors, and other financial intermediaries for providing these services. Janus Services or its affiliates may also pay fees for services provided by intermediaries to the extent the fees charged by intermediaries exceed the 0.25% of net assets charged to Class R Shares, Class S Shares, and Class T Shares of the Fund. Janus Services may keep certain amounts retained for reimbursement of out-of-pocket costs incurred for servicing clients of Class R Shares, Class S Shares, and Class T Shares. These amounts are disclosed as “Transfer agent administrative fees and expenses” on the Statement of Operations.
Services provided by these financial intermediaries may include, but are not limited to, recordkeeping, subaccounting, order processing, providing order confirmations, periodic statements, forwarding prospectuses, shareholder reports, and other materials to existing customers, answering inquiries regarding accounts, and other administrative services. Order processing includes the submission of transactions through the National Securities Clearing Corporation (“NSCC”) or similar systems, or those processed on a manual basis with Janus Capital.
Janus Investment Fund | 39 |
Janus Balanced Fund
Notes to Financial Statements (unaudited)
Janus Services is compensated for its services related to the Fund’s Class D Shares. In addition to the administrative fees discussed above, Janus Services receives reimbursement for out-of-pocket costs it incurs for serving as transfer agent and providing, or arranging for, servicing to shareholders. These amounts are disclosed as “Other transfer agent fees and expenses” on the Statement of Operations.
Under a distribution and shareholder servicing plan (the “Plan”) adopted in accordance with Rule 12b-1 under the 1940 Act, the Fund pays the Trust’s distributor, Janus Distributors LLC (“Janus Distributors”), a wholly-owned subsidiary of Janus Capital, a fee for the sale and distribution and/or shareholder servicing of the Shares at an annual rate of up to 0.25% of the Class A Shares’ average daily net assets, of up to 1.00% of the Class C Shares’ average daily net assets, of up to 0.50% of the Class R Shares' average daily net assets, and of up to 0.25% of the Class S Shares’ average daily net assets. Under the terms of the Plan, the Trust is authorized to make payments to Janus Distributors for remittance to retirement plan service providers, broker-dealers, bank trust departments, financial advisors, and other financial intermediaries, as compensation for distribution and/or shareholder services performed by such entities for their customers who are investors in the Fund. These amounts are disclosed as “12b-1 Distribution and shareholder servicing fees” on the Statement of Operations. Payments under the Plan are not tied exclusively to actual 12b-1 distribution and shareholder service expenses, and the payments may exceed 12b-1 distribution and shareholder service expenses actually incurred. If any of the Fund’s actual 12b-1 distribution and shareholder service expenses incurred during a calendar year are less than the payments made during a calendar year, the Fund will be refunded the difference. Refunds, if any, are included in “12b-1 Distribution fees and shareholder servicing fees” in the Statement of Operations.
Janus Capital furnishes certain administration, compliance, and accounting services for the Fund and is reimbursed by the Fund for certain of its costs in providing those services (to the extent Janus Capital seeks reimbursement and such costs are not otherwise waived). In addition, employees of Janus Capital and/or its affiliates may serve as officers of the Trust. The Fund also pays for salaries, fees, and expenses of certain Janus Capital employees and Fund officers, with respect to certain specified administration functions they perform on behalf of the Fund. The Fund pays these costs based on out-of-pocket expenses incurred by Janus Capital, and these costs are separate and apart from advisory fees and other expenses paid in connection with the investment advisory services Janus Capital provides to the Fund. These amounts are disclosed as “Fund administration fees” on the Statement of Operations. Some expenses related to compensation payable to the Fund's Chief Compliance Officer and compliance staff are shared with the Fund. Total compensation of $159,020 was paid to the Chief Compliance Officer and certain compliance staff by the Trust during the period ended March 31, 2017. The Fund's portion is reported as part of “Other expenses” on the Statement of Operations.
The Board of Trustees has adopted a deferred compensation plan (the “Deferred Plan”) for independent Trustees to elect to defer receipt of all or a portion of the annual compensation they are entitled to receive from the Fund. All deferred fees are credited to an account established in the name of the Trustees. The amounts credited to the account then increase or decrease, as the case may be, in accordance with the performance of one or more of the Janus funds that are selected by the Trustees. The account balance continues to fluctuate in accordance with the performance of the selected fund or funds until final payment of all amounts are credited to the account. The fluctuation of the account balance is recorded by the Fund as unrealized appreciation/(depreciation) and is included as of March 31, 2017 on the Statement of Assets and Liabilities in the asset, “Non-interested Trustees’ deferred compensation,” and liability, “Non-interested Trustees’ deferred compensation fees.” Additionally, the recorded unrealized appreciation/(depreciation) is included in “Unrealized net appreciation/(depreciation) of investments, foreign currency translations and non-interested Trustees’ deferred compensation” on the Statement of Assets and Liabilities. Deferred compensation expenses for the period ended March 31, 2017 are included in “Non-interested Trustees’ fees and expenses” on the Statement of Operations. Trustees are allowed to change their designation of mutual funds from time to time. Amounts will be deferred until distributed in accordance with the Deferred Plan. Deferred fees of $195,413 were paid by the Trust to a Trustee under the Deferred Plan during the period ended March 31, 2017.
Pursuant to the provisions of the 1940 Act and related rules, the Fund may participate in an affiliated or nonaffiliated cash sweep program. In the cash sweep program, uninvested cash balances of the Fund may be used to purchase shares of affiliated or nonaffiliated money market funds or cash management pooled investment vehicles. The Fund is eligible to participate in the cash sweep program (the “Investing Funds”). As adviser, Janus Capital has an inherent conflict of interest because of its fiduciary duties to the affiliated money market funds or cash management pooled investment vehicles and the Investing Funds. Janus Cash Liquidity Fund LLC is an affiliated unregistered cash
40 | MARCH 31, 2017 |
Janus Balanced Fund
Notes to Financial Statements (unaudited)
management pooled investment vehicle that invests primarily in highly-rated short-term fixed-income securities. Janus Cash Liquidity Fund LLC currently maintains a NAV of $1.00 per share and distributes income daily in a manner consistent with a registered product compliant with Rule 2a-7 under the 1940 Act. There are no restrictions on the Fund's ability to withdraw investments from Janus Cash Liquidity Fund LLC at will, and there are no unfunded capital commitments due from the Fund to Janus Cash Liquidity Fund LLC. The units of Janus Cash Liquidity Fund LLC are not charged any management fee, sales charge or service fee.
Any purchases and sales, realized gains/losses and recorded dividends from affiliated investments during the period ended March 31, 2017 can be found in a table located in the Notes to Schedule of Investments and Other Information.
Class A Shares include a 5.75% upfront sales charge of the offering price of the Fund. The sales charge is allocated between Janus Distributors and financial intermediaries. During the period ended March 31, 2017, Janus Distributors retained upfront sales charges of $104,175.
A contingent deferred sales charge (“CDSC”) of 1.00% will be deducted with respect to Class A Shares purchased without a sales load and redeemed within 12 months of purchase, unless waived. Any applicable CDSC will be 1.00% of the lesser of the original purchase price or the value of the redemption of the Class A Shares redeemed. During the period ended March 31, 2017, redeeming shareholders of Class A Shares paid CDSCs of $1,389 to Janus Distributors.
A CDSC of 1.00% will be deducted with respect to Class C Shares redeemed within 12 months of purchase, unless waived. Any applicable CDSC will be 1.00% of the lesser of the original purchase price or the value of the redemption of the Class C Shares redeemed. During the period ended March 31, 2017, redeeming shareholders of Class C Shares paid CDSCs of $128,430.
The Fund is permitted to purchase or sell securities (“cross-trade”) between itself and other funds or accounts managed by Janus Capital Management LLC in accordance with Rule 17a-7 under the Investment Company Act of 1940 (“Rule 17a-7”), when the transaction is consistent with the investment objectives and policies of the Fund and in accordance with the Internal Cross Trade Procedures adopted by the Trust’s Board of Trustees. These procedures have been designed to ensure that any cross-trade of securities by the Fund from or to another fund or account that is or could be considered an affiliate of the Fund under certain limited circumstances by virtue of having a common investment adviser, common Officer, or common Trustee complies with Rule 17a-7. Under these procedures, each cross-trade is effected at the current market price to save costs where allowed. During the period ended March 31, 2017, the Fund engaged in cross trades amounting to $56,366,936 in purchases and $165,172,043 in sales, resulting in a net realized gain of $5,856,957. The net realized gain is included within the “Net Realized Gain/(Loss) on Investments” section of the Fund’s Statement of Operations.
4. Federal Income Tax
Income and capital gains distributions are determined in accordance with income tax regulations that may differ from accounting principles generally accepted in the United States of America. These differences are due to differing treatments for items such as net short-term gains, deferral of wash sale losses, foreign currency transactions, net investment losses, and capital loss carryovers.
The Fund has elected to treat gains and losses on forward foreign currency contracts as capital gains and losses, if applicable. Other foreign currency gains and losses on debt instruments are treated as ordinary income for federal income tax purposes pursuant to Section 988 of the Internal Revenue Code.
The aggregate cost of investments and the composition of unrealized appreciation and depreciation of investment securities for federal income tax purposes as of March 31, 2017 are noted below.
Unrealized appreciation and unrealized depreciation in the table below exclude appreciation/depreciation on foreign currency translations. The primary difference between book and tax appreciation or depreciation of investments are wash sale loss deferrals and investments in partnerships.
Federal Tax Cost | Unrealized | Unrealized | Net
Tax Appreciation/ |
$ 10,523,748,068 | $2,471,185,483 | $(65,712,784) | $ 2,405,472,699 |
Janus Investment Fund | 41 |
Janus Balanced Fund
Notes to Financial Statements (unaudited)
5. Capital Share Transactions
Period ended March 31, 2017 | Year ended September 30, 2016 | |||||
Shares | Amount | Shares | Amount | |||
Class A Shares: | ||||||
Shares sold | 2,855,845 | $ 85,268,013 | 12,430,088 | $ 359,179,714 | ||
Reinvested dividends and distributions | 557,163 | 16,470,341 | 1,845,576 | 53,383,993 | ||
Shares repurchased | (15,170,444) | (452,804,233) | (12,673,078) | (365,800,898) | ||
Net Increase/(Decrease) | (11,757,436) | $(351,065,879) |
| 1,602,586 | $ 46,762,809 | |
Class C Shares: | ||||||
Shares sold | 2,299,278 | $ 68,070,340 | 13,769,462 | $ 394,868,680 | ||
Reinvested dividends and distributions | 732,121 | 21,485,938 | 2,134,949 | 61,396,327 | ||
Shares repurchased | (8,738,855) | (257,437,487) | (10,729,245) | (307,343,623) | ||
Net Increase/(Decrease) | (5,707,456) | $(167,881,209) |
| 5,175,166 | $ 148,921,384 | |
Class D Shares: | ||||||
Shares sold | 1,857,203 | $ 55,672,187 | 3,575,182 | $ 103,349,776 | ||
Reinvested dividends and distributions | 1,120,487 | 33,264,452 | 2,980,651 | 86,363,553 | ||
Shares repurchased | (3,219,419) | (95,830,100) | (5,385,211) | (155,901,016) | ||
Net Increase/(Decrease) | (241,729) | $ (6,893,461) |
| 1,170,622 | $ 33,812,313 | |
Class I Shares: | ||||||
Shares sold | 15,594,845 | $ 469,999,594 | 23,304,245 | $ 673,515,022 | ||
Reinvested dividends and distributions | 1,081,959 | 32,154,129 | 2,803,885 | 81,230,149 | ||
Shares repurchased | (13,267,845) | (395,938,400) | (21,559,812) | (623,967,770) | ||
Net Increase/(Decrease) | 3,408,959 | $ 106,215,323 |
| 4,548,318 | $ 130,777,401 | |
Class N Shares: | ||||||
Shares sold | 6,320,734 | $ 188,801,432 | 9,510,095 | $ 273,463,981 | ||
Reinvested dividends and distributions | 1,543,015 | 45,788,189 | 3,905,539 | 113,031,263 | ||
Shares repurchased | (5,943,662) | (176,270,784) | (8,895,316) | (257,866,487) | ||
Net Increase/(Decrease) | 1,920,087 | $ 58,318,837 |
| 4,520,318 | $ 128,628,757 | |
Class R Shares: | ||||||
Shares sold | 3,003,875 | $ 89,633,744 | 2,490,192 | $ 71,507,026 | ||
Reinvested dividends and distributions | 224,964 | 6,622,627 | 516,703 | 14,897,713 | ||
Shares repurchased | (1,950,959) | (57,870,131) | (2,875,033) | (82,938,516) | ||
Net Increase/(Decrease) | 1,277,880 | $ 38,386,240 |
| 131,862 | $ 3,466,223 | |
Class S Shares: | ||||||
Shares sold | 1,877,273 | $ 56,063,998 | 4,054,498 | $ 116,842,330 | ||
Reinvested dividends and distributions | 482,729 | 14,282,589 | 1,472,525 | 42,602,373 | ||
Shares repurchased | (4,422,457) | (131,740,581) | (8,614,037) | (250,551,921) | ||
Net Increase/(Decrease) | (2,062,455) | $ (61,393,994) |
| (3,087,014) | $ (91,107,218) | |
Class T Shares: | ||||||
Shares sold | 12,493,499 | $ 372,540,299 | 30,537,017 | $ 884,608,153 | ||
Reinvested dividends and distributions | 3,564,446 | 105,678,184 | 10,321,526 | 298,766,458 | ||
Shares repurchased | (25,054,229) | (744,298,889) | (42,582,990) | (1,229,017,966) | ||
Net Increase/(Decrease) | (8,996,284) | $(266,080,406) |
| (1,724,447) | $ (45,643,355) | |
6. Purchases and Sales of Investment Securities
For the period ended March 31, 2017, the aggregate cost of purchases and proceeds from sales of investment securities (excluding any short-term securities, short-term options contracts, and in-kind transactions) was as follows:
Purchases of | Proceeds from Sales | Purchases
of Long- | Proceeds
from Sales |
$2,027,244,251 | $2,920,720,249 | $ 1,402,648,014 | $ 1,355,757,485 |
42 | MARCH 31, 2017 |
Janus Balanced Fund
Notes to Financial Statements (unaudited)
7. Merger Related Matters
On October 3, 2016, Janus Capital Group Inc. (“JCGI”), the direct parent of Janus Capital, and Henderson Group plc (“Henderson”) announced that they had entered into an Agreement and Plan of Merger (“Merger Agreement”) relating to the strategic combination of Henderson and JCGI (the “Merger”). Pursuant to the Merger Agreement, a newly formed, direct wholly-owned subsidiary of Henderson will merge with and into JCGI, with JCGI as the surviving corporation and a direct wholly-owned subsidiary of Henderson. The Merger is expected to close in the second quarter of 2017, subject to requisite shareholder and regulatory approvals.
The consummation of the Merger may be deemed to cause an “assignment” (as defined in the 1940 Act) of the advisory agreement between the Fund and Janus Capital in effect as of the date of this Report. As a result, the consummation of the Merger may cause the investment advisory agreement to terminate automatically in accordance with its terms.
On December 8, 2016, the Trustees approved, subject to shareholder approval, a new investment advisory agreement between the Fund and Janus Capital in order to permit Janus Capital to continue providing advisory services to the Fund following the closing of the Merger (“Post-Merger Advisory Agreement”). At the same meeting, the Trustees approved submitting the Post-Merger Advisory Agreement, among other proposals, to Fund shareholders for approval.
8. Subsequent Event
Management has evaluated whether any events or transactions occurred subsequent to March 31, 2017 and through the date of issuance of the Fund’s financial statements and determined that there were no material events or transactions that would require recognition or disclosure in the Fund’s financial statements other than the following:
Special Meeting(s) of Shareholders were held on April 6, 2017, and adjourned and reconvened on April 18, 2017, April 25, 2017, April 28, 2017, and May 17, 2017 (together, the “Meeting”).
Approval of Advisory Agreement
At the Meeting, Fund shareholders approved the Post-Merger Advisory Agreement, which will take effect upon the consummation of the Merger.
Election of Trustees
At the Meeting, shareholders of each series of the Trust, including the Fund, voting together as a single class, approved the election of Diane L. Wallace to the Trust’s Board of Trustees. Ms. Wallace currently serves as a trustee of certain mutual funds advised by Henderson Global Investors (North America) Inc., a subsidiary of Henderson. Upon the consummation of the Merger, Ms. Wallace will join the Trust’s Board of Trustees.
Janus Investment Fund | 43 |
Janus Balanced Fund
Additional Information (unaudited)
Proxy Voting Policies and Voting Record
A description of the policies and procedures that the Fund uses to determine how to vote proxies relating to its portfolio securities is available without charge: (i) upon request, by calling 1-800-525-0020 (toll free); (ii) on the Fund’s website at janus.com/proxyvoting; and (iii) on the SEC’s website at http://www.sec.gov. Additionally, information regarding the Fund’s proxy voting record for the most recent twelve-month period ended June 30 is also available, free of charge, through janus.com/proxyvoting and from the SEC’s website at http://www.sec.gov.
Quarterly Portfolio Holdings
The Fund files its complete portfolio holdings (schedule of investments) with the SEC for the first and third quarters of each fiscal year on Form N-Q within 60 days of the end of such fiscal quarter. The Fund’s Form N-Q: (i) is available on the SEC’s website at http://www.sec.gov; (ii) may be reviewed and copied at the SEC’s Public Reference Room in Washington, D.C. (information on the Public Reference Room may be obtained by calling 1-800-SEC-0330); and (iii) is available without charge, upon request, by calling Janus at 1-800-525-0020 (toll free).
Approval of Advisory and Sub-Advisory Agreements with Janus and Janus Affiliates during the Period
On September 15, 2016, Janus Capital Group Inc. (“Janus”) advised the Trustees of Janus Investment Fund (the “Trust”), each of whom serves as an “independent” Trustee (the “Board” or the “Trustees”), of its intent to seek a strategic combination of its advisory business with Henderson Group plc (“Henderson”). The Board met with the Chief Executive Officer of Janus, who outlined the proposed combination and the potential benefits to Janus Capital Management LLC (“Janus Capital”) and each Fund of the Trust (each, a “Fund” and collectively, the “Funds”). Subsequent to the September 15, 2016 meeting, the Trustees identified a list of basic principles, which they believed should serve as the foundation for their review of the organizational, operational and strategic issues involved with any potential change in control of Janus Capital, the investment adviser to the Funds. These basic principles were communicated to Janus Capital on September 27, 2016, and were intended to be shared with Henderson. On October 3, 2016, Janus announced that it had entered into a definitive Agreement and Plan of Merger with Henderson pursuant to which Janus and Henderson agreed to effect an all-stock merger of equals strategic combination of their respective businesses, with Janus Capital surviving the merger as a direct wholly-owned subsidiary of Henderson (the “Transaction”). The Board was advised that, subject to certain conditions, the Transaction is currently expected to close during the second quarter of 2017.
As part of its due diligence, the Board developed an initial list of questions related to the proposed transaction, which was provided to Janus Capital on October 6, 2016. At a special Board meeting held on October 19, 2016, the Board considered Janus Capital’s response to the initial information request and met with the management of Janus to discuss the impact of the Transaction on the nature, extent and quality of services Janus Capital is expected to provide to the Janus Funds following the Transaction, addressing, among other matters, the personnel expected to provide such services, and the resources available to do so. After its October 19, 2016 meeting, the Board developed a supplemental request for additional information, which was provided to Janus Capital on October 26, 2016. At another special Board meeting held on November 7-8, 2016, the Board considered Janus Capital’s response to the supplemental information request and again met with the management of Janus and Henderson to discuss the impact of the Transaction on the nature, extent and quality of services Janus Capital is expected to provide to the Janus Funds following the Transaction, and also met with various officers of the Funds and of Janus Capital, including various Fund portfolio managers. After its November 7-8, 2016 meeting, the Board developed a second supplemental request for additional information, which was provided to Janus Capital on November 21, 2016. On December 7-8, 2016, the Board met to consider Janus Capital’s response to the second supplemental information request and to also consider the proposed new investment advisory agreements between the Trust, on behalf of each Fund, and Janus Capital (each, a “New Advisory Agreement” and collectively, the “New Advisory Agreements”) and the new sub-advisory agreements between Janus Capital and each of the Funds that utilize INTECH Investment Management LLC (“INTECH”), Perkins Investment Management LLC (“Perkins”), or Janus Singapore Pte. Limited (“Janus Singapore,” and together with INTECH and Perkins, the “Sub-Advisers” and each, a “Sub-Adviser”) as sub-advisers (each, a “New Sub-Advisory Agreement” and collectively, the “New Sub-Advisory Agreements”) to take effect immediately after the Transaction or shareholder approval, whichever is later. During each of these meetings, the Board sought additional and clarifying information as it deemed necessary or appropriate. In addition, the Board engaged its independent fee consultant to help evaluate certain of the proposals that the Board was being asked to consider. Throughout the process, the Board had the assistance of its independent legal counsel, who advised them on, among other things, its duties and obligations.
44 | MARCH 31, 2017 |
Janus Balanced Fund
Additional Information (unaudited)
In connection with the Board’s review, Janus Capital provided, and the Board obtained, substantial information regarding the following matters: the management, financial position and business of Henderson; the history of Henderson’s business and operations; the investment performance of the investment companies advised by Henderson; the proposed structure, operations and investment processes of the combined investment management organization after the Transaction and the strategy for operating and growing the business following the Transaction; the future plans of Janus and Henderson with respect to the Funds and any proposed changes to the operations or structure of the Funds; and the future plans of Janus and Henderson with respect to the provision of services to the Funds, and the entities providing such services, including those affiliated with Janus. The Board also received information regarding the terms of the Transaction, anticipated management of the combined organization, the resources that each of Janus and Henderson bring to the combined organization and the process being followed by Janus and Henderson to integrate their organizations. The Board also received information regarding the impact of the Transaction on each of INTECH, Perkins and Janus Singapore.
In connection with the Board’s approval of New Advisory Agreements and New Sub-Advisory Agreements at its December 8, 2016 meeting, the Board also continued its on-going annual process to determine whether to continue the existing investment advisory agreements between Janus Capital and the Trust on behalf of each Fund (each, a “Current Advisory Agreement” and collectively, the “Current Advisory Agreements”) and the existing sub-advisory agreements between Janus Capital and each of the Funds that utilize INTECH, Perkins, or Janus Singapore as sub-advisers (each, a “Current Sub-Advisory Agreement” and collectively, the “Current Sub-Advisory Agreements”). In this regard, the Board received and reviewed information provided by Janus and the respective Sub-Advisers in response to requests of the Board and its independent legal counsel. The Board also received and reviewed information and analysis provided by, and in response to requests of, its independent fee consultant. The Board noted that as part of this annual process, the Board had considered and was in the process of considering, numerous factors, including the nature and quality of services provided by Janus Capital and each Sub-Adviser, as applicable; investment performance, on an absolute basis and relative to appropriate peer groups and one or a combination of market indices; investment management fees, expense ratios and asset sizes of the Funds and peer groups; investment management fees charged to comparable investment companies, separate accounts and non-fund clients; Janus Capital’s profitability from managing the Funds; fall-out benefits to Janus Capital from its relationship to the Funds, including revenues derived from services provided to the Funds by affiliates of Janus Capital; and the potential benefits to Janus Capital, the Funds of receiving research services from broker/dealer firms in connection with the allocation of portfolio transactions to such firms.
In determining whether to approve the New Advisory Agreement for each Fund and the New Sub-Advisory Agreement for Funds managed by INTECH, Perkins or Janus Singapore in connection with the Transaction, and whether to recommend approval to Fund shareholders, the Board received information and made inquiries into all matters as it deemed appropriate. The Board reviewed and analyzed various factors it deemed relevant, including the following factors, among others, none of which by itself was considered dispositive:
· The terms of the New Advisory Agreements are substantially similar to the corresponding Current Advisory Agreements, and the contractual fee rate will not change. In this regard, see the discussion of the Board’s considerations with respect to its most recent approval of the Current Advisory Agreements prior to December 8, 2016, as disclosed in each Fund’s most recent prior annual or semi-annual shareholder report, as applicable.
· The terms of the New Sub-Advisory Agreements are substantially similar to the corresponding Current Sub-Advisory Agreements, and the contractual fee rate will not change. In this regard, see the discussion of the Board’s considerations with respect to its most recent approval of the Current Sub-Advisory Agreements prior to December 8, 2016, as disclosed in each Fund’s most recent prior annual or semi-annual shareholder report, as applicable.
· Janus Capital’s plans for the operation of the Funds, including its plans for the continued provision of all services currently provided to the Funds by Janus Capital and its affiliates, including, among others, investment advisory services, portfolio trading services, and Fund administrative and accounting services, and the personnel and resources proposed to support the provision of such services.
· The estimated profitability to Janus Capital from managing the Funds after the Transaction, including potential economies of scale and fall-out benefits to Janus Capital from its relationship to the Funds, including revenues derived from services provided to the Funds by affiliates of Janus Capital, and the potential benefits to Janus
Janus Investment Fund | 45 |
Janus Balanced Fund
Additional Information (unaudited)
Capital, and the Funds of receiving research services from broker/dealer firms in connection with the allocation of portfolio transactions to such firms.
In connection with its deliberations, the Board received assurances from Janus, on behalf of itself and its affiliates (collectively, “Janus”) including the following:
· Janus has provided to the Board such information as it believes is reasonably necessary to evaluate the New Advisory Agreements and New Sub-Advisory Agreements.
· Janus is committed to the continuance, without interruption, of services to the Funds of at least the type and quality currently provided by Janus Capital and its affiliates, or superior thereto.
· The Transaction is not expected to affect negatively the nature, extent or quality of the investment advisory services provided by Janus Capital to the Funds following the Transaction, and the investment advisory services are expected to be at least comparable to the services being provided under the Current Advisory Agreements and Current Sub-Advisory Agreements. In this regard, the Board noted specific representations that Janus does not intend for the nature, extent or quality of investment advisory and other services to be provided to the Funds following the Transaction to change, and the extent of such services were expected to increase based on the combined resources of the combined investment management organization after the Transaction, and should the nature, extent or quality of such services decline, Janus would commit the resources needed to return such services to pre-Transaction levels.
· The Funds’ current operations were expected to remain largely unchanged, except for certain fund reorganizations which will be separately considered by the Board, and such other changes as were or will be presented to the Board.
· Janus does not intend to make changes to the portfolio managers providing services to the Funds, other than proposed changes in the management of certain Funds as discussed with the Board, including those related to proposals to merge certain Funds with Funds managed by Henderson Global Investors (North America) Inc., an indirect, wholly-owned subsidiary of Henderson, and subject to such changes as may arise at any time as a result of the ongoing process of portfolio manager evaluation.
· After the Transaction, the extent of distribution and marketing services provided to the Janus Funds were expected to increase based on the combined resources of Janus and Henderson. In this regard, Janus Capital advised the Board that after the Transaction, the extent of distribution and marketing services provided to the Janus Funds are expected to increase based on the combined resources of Janus and Henderson. This is due primarily to the anticipated increase of sales related resources and expanded global presence of the combined Janus Henderson organization, which is expected to enhance visibility and brand recognition of the Janus Henderson Funds.
· The intent of Janus Capital to take the necessary and appropriate steps to retain and attract its key investment advisory personnel.
· The intent of Janus to take the necessary and appropriate steps to retain and attract its key compliance, financial, fund accounting and administrative personnel supporting the management and oversight of the Funds.
· Janus is not aware of any express or implied term, condition, arrangement or understanding that would impose in its best judgement an “unfair burden” on any Fund as a result of the Transaction, as defined in Section 15(f) of the 1940 Act, and that Janus will take no action that would have the effect of imposing such an “unfair burden” on any Fund in connection with the Transaction.
Janus assured the Board that it intended to comply with Section 15(f) of the Investment Company Act of 1940, as amended (the “1940 Act”). Section 15(f) provides a non-exclusive safe harbor for an investment adviser to an investment company or any of its affiliated persons to receive any amount or benefit in connection with a change in control of the investment adviser so long as two conditions are met. First, for a period of three years after the transaction, at least 75% of the board members of the investment company must not be interested persons of such investment adviser (as defined under the 1940 Act). The composition of the Board is in compliance with this provision of Section 15(f). In addition, after careful review and consideration, the Board determined that it would be in the best interests of the Funds to add to the Board an individual who currently acts as a non-interested board member of the
46 | MARCH 31, 2017 |
Janus Balanced Fund
Additional Information (unaudited)
Henderson Trust. The Board believes that this change in the Board composition will provide perspective and insight relating to experience working with the Henderson organization. The Board’s Nominating and Governance Committee considered a number of candidates and recommended that the Board nominate one proposed new trustee from those candidates who currently act as non-interested board members of the Henderson Trust. The Board approved that trustee nominee to serve on the Board, subject to election by the shareholders of the Funds and contingent on the closing of the Transaction. If the new trustee is elected and serves on the Board, the Board composition would continue to satisfy the provisions of Section 15(f).
To meet the second condition of Section 15(f), an “unfair burden” must not be imposed upon the investment company as a result of such transaction or any express or implied terms, conditions or understandings applicable thereto. The term “unfair burden” is defined in Section 15(f) to include any arrangement during the two-year period after the transaction, whereby the investment adviser, or any interested person of such adviser, receives or is entitled to receive any compensation, directly or indirectly, from the investment company or its shareholders (other than fees for bona fide investment advisory or other services) or from any person in connection with the purchase or sale of securities or other property to, from or on behalf of the investment company (other than bona fide ordinary compensation as principal underwriter for such investment company).
Janus represented that it does not believe that an “unfair burden” will be placed on the Funds as a result of the Transaction. In furtherance thereof, Janus has undertaken to pay the costs of preparing and distributing proxy materials to, and of holding the meetings of, the Funds’ shareholders (the “Meetings”), as well as other fees and expenses in connection with the Transaction, including the reasonable fees and expenses of legal counsel and consultants to the Funds and the Trustees. In addition, Janus has agreed, for a period of two years following the closing of the Transaction, (i) not to request any increases to advisory fees for the Funds, other than those proposed to and approved by the Board prior to the close of the Transaction, and (ii) to continue to use the current process by which expense caps are set annually for the Funds.
As a result of its review and consideration of the New Investment Advisory Agreements and New Sub-Advisory Agreements in connection with the Transaction, at a meeting on December 8, 2016, the Board voted unanimously to approve a New Investment Advisory Agreement for each Fund and a New Sub-Advisory Agreement for each Fund managed by INTECH, Perkins or Janus Singapore, and to recommend such agreements to the Funds’ shareholders for their approval.
Approval of Interim Advisory and Sub-Advisory Agreements with Janus and Janus Affiliates during the Period
In the event shareholders of a Fund do not approve such Fund’s New Advisory Agreement and/or New Sub-Advisory Agreement at the Meetings prior to the closing of the Transaction, Janus Capital proposed that an interim investment advisory agreement between Janus Capital and such Fund (each, an “Interim Advisory Agreement” and collectively, the “Interim Advisory Agreements”) and an interim sub-advisory agreement between Janus Capital and the applicable Sub-Adviser (each, an “Interim Sub-Advisory Agreement” and collectively, the “Interim Sub-Advisory Agreements”) take effect upon the closing of the Transaction. At the December 8, 2016 meeting, the Board, all of whom are Independent Trustees, unanimously approved an Interim Advisory Agreement for each Fund and an Interim Sub-Advisory Agreement for each applicable Fund in order to assure continuity of investment advisory services to the Funds and sub-advisory services to the sub-advised Funds after the Transaction. The terms of each Interim Advisory Agreement are substantially identical to those of the applicable Current Advisory Agreement and New Advisory Agreement, except for the term and escrow provisions described below. Similarly, the terms of each Interim Sub-Advisory Agreement are substantially identical to those of the Current Sub-Advisory Agreements and New Sub-Advisory Agreements, except for the term and escrow provisions described below. The Interim Advisory Agreement and Interim Sub-Advisory Agreement will continue in effect for a term ending on the earlier of 150 days from the closing of the Transaction (the “150-day period”) or when shareholders of the Fund approve the New Advisory Agreement and/or New Sub-Advisory Agreement. Pursuant to Rule 15a-4 under the 1940 Act, compensation earned by Janus Capital under an Interim Advisory Agreement and compensation earned by a Sub-Adviser under an Interim Sub-Advisory Agreement will be held in an interest-bearing escrow account. If shareholders of a Fund approve the New Advisory Agreement prior to the end of the 150-day period, the amount held in the escrow account under the Interim Advisory Agreement will be paid to Janus Capital. If shareholders of a Fund approve the New Advisory Agreement and New Sub-Advisory Agreement prior to the end of the 150-day period, the amount held in the escrow account under the Interim Sub-Advisory Agreement will be paid to the Sub-Adviser. If shareholders of a Fund do not approve the New Advisory Agreement prior to the end of the 150-day period, the Board will take such action as it
Janus Investment Fund | 47 |
Janus Balanced Fund
Additional Information (unaudited)
deems to be in the best interests of the Fund, and Janus Capital will be paid the lesser of its costs incurred in performing its services under the Interim Advisory Agreement or the total amount in the escrow account, plus interest earned. If shareholders of a Fund do not approve the New Advisory Agreement and/or New Sub-Advisory Agreement prior to the end of the 150-day period, the Board will take such action as it deems to be in the best interests of the Fund, and the Sub-Adviser will be paid the lesser of its costs incurred in performing its services under the Interim Sub-Advisory Agreement or the total amount in the escrow account, plus interest earned.
Approval of Sub-Advisory Agreements with Henderson Investment Management Limited during the Period
Janus Capital met with the Trustees on November 7-8, 2016, and December 7-8, 2016, to discuss the approval of a new sub-advisory agreement between Janus Capital and Henderson Investment Management Limited (“HIML”) (each, a “HIML Sub-Advisory Agreement” and collectively, the “HIML Sub-Advisory Agreements”) on behalf of each of Janus Asia Equity Fund, Janus Emerging Markets Fund, and Janus Global Real Estate Fund (each, an “HIML Fund” and together, the “HIML Funds”) to take effect immediately after the closing of the Transaction or shareholder approval, whichever is later. At the meetings, the Trustees also discussed the HIML Sub-Advisory Agreements with their independent counsel in executive session. During the course of these meetings, the Trustees requested and considered such information as they deemed relevant to their deliberations. In addition, at prior meetings and during the course of these meetings the Board also undertook a comprehensive process to evaluate the impact of the Transaction on the nature, quality and extent of services expected to be provided by Janus Capital and HIML to each HIML Fund, including after the completion of the Transaction. For a fuller discussion of the Board’s consideration of the approval of a new investment advisory agreement for the HIML Funds in connection with the Transaction, see “Approval of Advisory and Sub-Advisory Agreements with Janus and its Affiliates During the Period” above.
At a meeting of the Board of Trustees held on December 8, 2016, the Trustees considered the HIML Sub-Advisory Agreements. In determining whether to approve the HIML Sub-Advisory Agreements, and whether to recommend approval to the shareholders of each HIML Fund, the Board received information and made inquiries into all matters as it deemed appropriate. The Board reviewed and analyzed various factors it deemed relevant, including the following factors, among others, none of which by itself was considered dispositive:
· the terms of each HIML Sub-Advisory Agreement;
· the nature, quality and extent of services expected to be provided under the HIML Sub-Advisory Agreements, including the reputation, qualifications and background of HIML and its operational and compliance infrastructures;
· the investment approach, the experience and skills of senior management and investment personnel of HIML, including the portfolio managers who would be responsible for managing all or part of the portfolio of each HIML Fund, noting the resources made available to such personnel;
· the ability of HIML to attract and retain high-quality personnel and the organizational depth of HIML;
· the sub-advisory fee rate under each HIML Sub-Advisory Agreement, as well as the overall management fee structure of each HIML Fund, noting that the sub-advisory fee rate is consistent with the approach utilized in the Janus Funds complex for other sub-advisory relationships, taking into account the allocation of managed assets between Janus Capital and HIML for the Global Real Estate Fund;
· under each HIML Sub-Advisory Agreement, Janus Capital would be responsible for paying HIML out of its fees;
· the fall out benefits to HIML and its affiliates from its relationship with each HIML Fund, including the potential benefits to HIML and its affiliates and each HIML Fund of receiving research services from broker/dealer firms in connection with the allocation of portfolio transactions to such firms;
· the potential for economies of scale with respect to the overall fee structure of each HIML Fund and whether either Fund will benefit from any economies of scale; and
· the costs of seeking approval of the HIML Sub-Advisory Agreements will not be borne by the HIML Funds.
As a result of its review and consideration of each HIML Sub-Advisory Agreement and related matters, on December 8, 2016, the Board voted unanimously to approve each HIML Sub-Advisory Agreement and to recommend such agreement to each HIML Fund’s shareholders for their approval.
48 | MARCH 31, 2017 |
Janus Balanced Fund
Additional Information (unaudited)
Renewal of Investment Advisory and Sub-Advisory Agreements for INTECH U.S. Core Fund
As noted above, at its December 8, 2016 meeting, the Board continued its on-going annual process to determine whether to continue the Current Advisory Agreements and the Current Sub-Advisory Agreements. In this regard, the Board received and reviewed information provided by Janus and the respective Sub-Advisers in response to requests of the Board and its independent legal counsel. The Board also received and reviewed information and analysis provided by, and in response to requests of, its independent fee consultant. The Board noted that the Current Advisory Agreement between the Trust, on behalf of INTECH U.S. Core Fund, and Janus Capital and the Current Sub-Advisory Agreement between Janus Capital and INTECH, on behalf of the Fund, would expire on January 1, 2017, if not renewed. The Board noted that the date of termination for the Current Advisory Agreements and the Current Sub-Advisory Agreements for the other Funds was February 1, 2017, if not renewed. Accordingly, the Board voted unanimously to renew the Current Advisory Agreement and the Current Sub-Advisory Agreement for INTECH U.S. Core Fund through January 31, 2017 in order to (i) align the termination date of such Agreements with the termination date of the Current Advisory Agreements and the Current Sub-Advisory Agreements for the other Funds and (ii) allow for a more complete consideration of such Agreements, as well as the Current Advisory Agreements and the Current Sub-Advisory Agreements for the other Funds.
APPROVAL OF ADVISORY AGREEMENTS DURING THE PERIOD
The Trustees of Janus Investment Fund and Janus Aspen Series, each of whom serves as an “independent” Trustee (the “Trustees”), oversee the management of each Fund of Janus Investment Fund and each Portfolio of Janus Aspen Series (each, a “Fund” and collectively, the “Funds”), and as required by law, determine annually whether to continue the investment advisory agreement for each Fund and the subadvisory agreements for the 16 Funds that utilize subadvisers.
In connection with their most recent consideration of those agreements for each Fund, the Trustees received and reviewed information provided by Janus Capital and the respective subadvisers in response to requests of the Trustees and their independent legal counsel. They also received and reviewed information and analysis provided by, and in response to requests of, their independent fee consultant. Throughout their consideration of the agreements, the Trustees were advised by their independent legal counsel. The Trustees met with management to consider the agreements, and also met separately in executive session with their independent legal counsel and their independent fee consultant.
Additionally, in connection with their consideration of whether to continue the investment advisory agreement and subadvisory agreement for each Fund, as applicable, the Trustees also received and reviewed information in connection with the proposed transaction to combine the respective businesses of Henderson Group plc and Janus Capital Group, Inc., the parent company of Janus Capital (the “Transaction”), announced in October 2016, which Janus Capital advised the Trustees was expected to close in the second quarter of 2017. In this regard, the Trustees reviewed information regarding the impact of the Transaction on the services to be provided by Janus Capital and each subadviser, as applicable, to the Funds under such agreements both prior to the close of the Transaction, and afterwards, if the Transaction were not to close. If the Transaction closes, all such agreements would be replaced by new investment advisory agreements and subadvisory agreements, as applicable, for each Fund, assuming requisite Fund shareholder approvals have been obtained.
At a meeting held on January 26, 2017, based on the Trustees’ evaluation of the information provided by Janus Capital, the subadvisers, and the independent fee consultant, as well as other information, the Trustees determined that the overall arrangements between each Fund and Janus Capital and each subadviser, as applicable, were fair and reasonable in light of the nature, extent and quality of the services provided by Janus Capital, its affiliates and the subadvisers, the fees charged for those services, and other matters that the Trustees considered relevant in the exercise of their business judgment. At that meeting, the Trustees unanimously approved the continuation of the investment advisory agreement for each Fund, and the subadvisory agreement for each subadvised Fund, for the period from February 1, 2017 through February 1, 2018, subject to earlier termination as provided for in each agreement.
In considering the continuation of those agreements, the Trustees reviewed and analyzed various factors that they determined were relevant, including the factors described below, none of which by itself was considered dispositive. However, the material factors and conclusions that formed the basis for the Trustees’ determination to approve the continuation of the agreements are discussed separately below. Also included is a summary of the independent fee consultant’s conclusions and opinions that arose during, and were included as part of, the Trustees’ consideration of the
Janus Investment Fund | 49 |
Janus Balanced Fund
Additional Information (unaudited)
agreements. “Management fees,” as used herein, reflect actual annual advisory fees and any administration fees (excluding out of pocket costs), net of any waivers.
Nature, Extent and Quality of Services
The Trustees reviewed the nature, extent and quality of the services provided by Janus Capital and the subadvisers to the Funds, taking into account the investment objective, strategies and policies of each Fund, and the knowledge the Trustees gained from their regular meetings with management on at least a quarterly basis and their ongoing review of information related to the Funds. In addition, the Trustees reviewed the resources and key personnel of Janus Capital and each subadviser, particularly noting those employees who provide investment and risk management services to the Funds. The Trustees also considered other services provided to the Funds by Janus Capital or the subadvisers, such as managing the execution of portfolio transactions and the selection of broker-dealers for those transactions. The Trustees considered Janus Capital’s role as administrator to the Funds, noting that Janus Capital does not receive a fee for its services but is reimbursed for its out-of-pocket costs. The Trustees considered the role of Janus Capital in monitoring adherence to the Funds’ investment restrictions, providing support services for the Trustees and Trustee committees, and overseeing communications with shareholders and the activities of other service providers, including monitoring compliance with various policies and procedures of the Funds and with applicable securities laws and regulations.
In this regard, the independent fee consultant noted that Janus Capital provides a number of different services for the Funds and Fund shareholders, ranging from investment management services to various other servicing functions, and that, in its opinion, Janus Capital is a capable provider of those services. The independent fee consultant also provided its belief that Janus Capital has developed a number of institutional competitive advantages that should enable it to provide superior investment and service performance over the long term.
The Trustees concluded that the nature, extent and quality of the services provided by Janus Capital or the subadviser to each Fund were appropriate and consistent with the terms of the respective advisory and subadvisory agreements, and that, taking into account steps taken to address those Funds whose performance lagged that of their peers for certain periods, the Funds were likely to benefit from the continued provision of those services. They also concluded that Janus Capital and each subadviser had sufficient personnel, with the appropriate education and experience, to serve the Funds effectively and had demonstrated its ability to attract well-qualified personnel.
Performance of the Funds
The Trustees considered the performance results of each Fund over various time periods. They noted that they considered Fund performance data throughout the year, including periodic meetings with each Fund’s portfolio manager(s), and also reviewed information comparing each Fund’s performance with the performance of comparable funds and peer groups identified by Broadridge Financial Solutions, Inc. (“Broadridge”), an independent data provider, and with the Fund’s benchmark index. In this regard, the independent fee consultant found that the overall Funds’ performance has been strong: for the 36 months ended September 30, 2016, approximately 76% of the Funds were in the top two Broadridge quartiles of performance, and for the 12 months ended September 30, 2016, approximately 47% of the Funds were in the top two Broadridge quartiles of performance.
The Trustees considered the performance of each Fund, noting that performance may vary by share class, and noted the following:
Fixed-Income Funds and Money Market Funds
· For Janus Flexible Bond Fund, the Trustees noted that the Fund’s performance was in the second Broadridge quartile for the 36 months ended May 31, 2016 and the third Broadridge quartile for the 12 months ended May 31, 2016.
· For Janus Global Bond Fund, the Trustees noted that the Fund’s performance was in the second Broadridge quartile for the 36 months ended May 31, 2016 and the third Broadridge quartile for the 12 months ended May 31, 2016.
· For Janus Global Unconstrained Bond Fund, the Trustees noted that the Fund’s performance was in the first Broadridge quartile for the 12 months ended May 31, 2016.
50 | MARCH 31, 2017 |
Janus Balanced Fund
Additional Information (unaudited)
· For Janus High-Yield Fund, the Trustees noted that the Fund’s performance was in the second Broadridge quartile for the 36 months ended May 31, 2016 and the second Broadridge quartile for the 12 months ended May 31, 2016.
· For Janus Multi-Sector Income Fund, the Trustees noted that the Fund’s performance was in the first Broadridge quartile for the 12 months ended May 31, 2016.
· For Janus Real Return Fund, the Trustees noted that the Fund’s performance was in the first Broadridge quartile for the 36 months ended May 31, 2016 and the first Broadridge quartile for the 12 months ended May 31, 2016.
· For Janus Short-Term Bond Fund, the Trustees noted that the Fund’s performance was in the second Broadridge quartile for the 36 months ended May 31, 2016 and the third Broadridge quartile for the 12 months ended May 31, 2016.
· For Janus Government Money Market Fund, the Trustees noted that the Fund’s performance was in the third Broadridge quartile for the 36 months ended May 31, 2016 and the third Broadridge quartile for the 12 months ended May 31, 2016. The Trustees noted the reasons for the Fund’s underperformance.
· For Janus Money Market Fund, the Trustees noted that the Fund’s performance was in the bottom Broadridge quartile for the 36 months ended May 31, 2016 and the bottom Broadridge quartile for the 12 months ended May 31, 2016. The Trustees noted the reasons for the Fund’s underperformance.
Asset Allocation Funds
· For Janus Global Allocation Fund – Conservative, the Trustees noted that the Fund’s performance was in the second Broadridge quartile for the 36 months ended May 31, 2016 and the bottom Broadridge quartile for the 12 months ended May 31, 2016.
· For Janus Global Allocation Fund – Growth, the Trustees noted that the Fund’s performance was in the bottom Broadridge quartile for the 36 months ended May 31, 2016 and the bottom Broadridge quartile for the 12 months ended May 31, 2016. The Trustees noted the reasons for the Fund’s underperformance and the steps Janus Capital had taken or was taking to improve performance.
· For Janus Global Allocation Fund – Moderate, the Trustees noted that the Fund’s performance was in the third Broadridge quartile for the 36 months ended May 31, 2016 and the bottom Broadridge quartile for the 12 months ended May 31, 2016. The Trustees noted the reasons for the Fund’s underperformance and the steps Janus Capital had taken or was taking to improve performance.
Alternative Fund
· For Janus Diversified Alternatives Fund, the Trustees noted that the Fund’s performance was in the third Broadridge quartile for the 36 months ended May 31, 2016 and the third Broadridge quartile for the 12 months ended May 31, 2016. The Trustees noted the reasons for the Fund’s underperformance and the steps Janus Capital had taken or was taking to improve performance.
Value Funds
· For Perkins International Value Fund, the Trustees noted that the Fund’s performance was in the second Broadridge quartile for the 36 months ended May 31, 2016 and the first Broadridge quartile for the 12 months ended May 31, 2016.
· For Perkins Global Value Fund, the Trustees noted that the Fund’s performance was in the second Broadridge quartile for the 36 months ended May 31, 2016 and the first Broadridge quartile for the 12 months ended May 31, 2016.
· For Perkins Large Cap Value Fund, the Trustees noted that the Fund’s performance was in the third Broadridge quartile for the 36 months ended May 31, 2016 and the first Broadridge quartile for the 12 months ended May 31, 2016. The Trustees noted the reasons for the Fund’s underperformance, noting that the Fund has a performance fee structure that results in lower management fees during periods of underperformance, the steps Janus Capital and Perkins had taken or were taking to improve performance, and that the performance trend was improving.
Janus Investment Fund | 51 |
Janus Balanced Fund
Additional Information (unaudited)
· For Perkins Mid Cap Value Fund, the Trustees noted that the Fund’s performance was in the bottom Broadridge quartile for the 36 months ended May 31, 2016 and the first Broadridge quartile for the 12 months ended May 31, 2016. The Trustees noted the reasons for the Fund’s underperformance, noting that the Fund has a performance fee structure that results in lower management fees during periods of underperformance, the steps Janus Capital and Perkins had taken or were taking to improve performance, and that the performance trend was improving.
· For Perkins Select Value Fund, the Trustees noted that the Fund’s performance was in the second Broadridge quartile for the 36 months ended May 31, 2016 and the first Broadridge quartile for the 12 months ended May 31, 2016.
· For Perkins Small Cap Value Fund, the Trustees noted that the Fund’s performance was in the first Broadridge quartile for the 36 months ended May 31, 2016 and the first Broadridge quartile for the 12 months ended May 31, 2016.
· For Perkins Value Plus Income Fund, the Trustees noted that the Fund’s performance was in the second Broadridge quartile for the 36 months ended May 31, 2016 and the second Broadridge quartile for the 12 months ended May 31, 2016.
Mathematical Funds
· For INTECH Emerging Markets Managed Volatility Fund, the Trustees noted that the Fund’s performance was in the second Broadridge quartile for the 12 months ended May 31, 2016.
· For INTECH Global Income Managed Volatility Fund, the Trustees noted that the Fund’s performance was in the first Broadridge quartile for the 36 months ended May 31, 2016 and the first Broadridge quartile for the 12 months ended May 31, 2016.
· For INTECH International Managed Volatility Fund, the Trustees noted that the Fund’s performance was in the first Broadridge quartile for the 36 months ended May 31, 2016 and the first Broadridge quartile for the 12 months ended May 31, 2016.
· For INTECH U.S. Core Fund, the Trustees noted that the Fund’s performance was in the first Broadridge quartile for the 36 months ended May 31, 2016 and the first Broadridge quartile for the 12 months ended May 31, 2016.
· For INTECH U.S. Managed Volatility Fund, the Trustees noted that the Fund’s performance was in the first Broadridge quartile for the 36 months ended May 31, 2016 and the first Broadridge quartile for the 12 months ended May 31, 2016.
Growth and Core Funds
· For Janus Balanced Fund, the Trustees noted that the Fund’s performance was in the first Broadridge quartile for the 36 months ended May 31, 2016 and the third Broadridge quartile for the 12 months ended May 31, 2016.
· For Janus Contrarian Fund, the Trustees noted that the Fund’s performance was in the bottom Broadridge quartile for the 36 months ended May 31, 2016 and the bottom Broadridge quartile for the 12 months ended May 31, 2016. The Trustees noted the reasons for the Fund’s underperformance, noting that the Fund has a performance fee structure that results in lower management fees during periods of underperformance, and the steps Janus Capital had taken or was taking to improve performance.
· For Janus Enterprise Fund, the Trustees noted that the Fund’s performance was in the first Broadridge quartile for the 36 months ended May 31, 2016 and the first Broadridge quartile for the 12 months ended May 31, 2016.
· For Janus Forty Fund, the Trustees noted that the Fund’s performance was in the first Broadridge quartile for the 36 months ended May 31, 2016 and the first Broadridge quartile for the 12 months ended May 31, 2016.
· For Janus Fund, the Trustees noted that the Fund’s performance was in the first Broadridge quartile for the 36 months ended May 31, 2016 and the second Broadridge quartile for the 12 months ended May 31, 2016.
52 | MARCH 31, 2017 |
Janus Balanced Fund
Additional Information (unaudited)
· For Janus Growth and Income Fund, the Trustees noted that the Fund’s performance was in the second Broadridge quartile for the 36 months ended May 31, 2016 and in the second Broadridge quartile for the 12 months ended May 31, 2016.
· For Janus Research Fund, the Trustees noted that the Fund’s performance was in the first Broadridge quartile for the 36 months ended May 31, 2016 and the second Broadridge quartile for the 12 months ended May 31, 2016.
· For Janus Triton Fund, the Trustees noted that the Fund’s performance was in the first Broadridge quartile for the 36 months ended May 31, 2016 and the first Broadridge quartile for the 12 months ended May 31, 2016.
· For Janus Twenty Fund, the Trustees noted that the Fund’s performance was in the third Broadridge quartile for the 36 months ended May 31, 2016 and the first Broadridge quartile for the 12 months ended May 31, 2016. The Trustees noted the reasons for the Fund’s underperformance, noting that the Fund has a performance fee structure that results in lower management fees during periods of underperformance, the steps Janus Capital had taken or was taking to improve performance, and that the performance trend was improving.
· For Janus Venture Fund, the Trustees noted that the Fund’s performance was in the first Broadridge quartile for the 36 months ended May 31, 2016 and the second Broadridge quartile for the 12 months ended May 31, 2016.
Global and International Funds
· For Janus Adaptive Global Allocation Fund, the Trustees noted that, due to limited performance for the Fund, performance history was not a material factor.
· For Janus Asia Equity Fund, the Trustees noted that the Fund’s performance was in the third Broadridge quartile for the 36 months ended May 31, 2016 and the bottom Broadridge quartile for the 12 months ended May 31, 2016. The Trustees noted the reasons for the Fund’s underperformance, noting that the Fund has a performance fee structure that results in lower management fees during periods of underperformance, and the steps Janus Capital had taken or was taking to improve performance.
· For Janus Emerging Markets Fund, the Trustees noted that the Fund’s performance was in the first Broadridge quartile for the 36 months ended May 31, 2016 and the third Broadridge quartile for the 12 months ended May 31, 2016.
· For Janus Global Life Sciences Fund, the Trustees noted that the Fund’s performance was in the first Broadridge quartile for the 36 months ended May 31, 2016 and the bottom Broadridge quartile for the 12 months ended May 31, 2016.
· For Janus Global Real Estate Fund, the Trustees noted that the Fund’s performance was in the third Broadridge quartile for the 36 months ended May 31, 2016 and the bottom Broadridge quartile for the 12 months ended May 31, 2016. The Trustees noted the reasons for the Fund’s underperformance, noting that the Fund has a performance fee structure that results in lower management fees during periods of underperformance, and the steps Janus Capital had taken or was taking to improve performance.
· For Janus Global Research Fund, the Trustees noted that the Fund’s performance was in the third Broadridge quartile for the 36 months ended May 31, 2016 and the bottom Broadridge quartile for the 12 months ended May 31, 2016. The Trustees noted the reasons for the Fund’s underperformance, noting that the Fund has a performance fee structure that results in lower management fees during periods of underperformance, and the steps Janus Capital had taken or was taking to improve performance.
· For Janus Global Select Fund, the Trustees noted that the Fund’s performance was in the bottom Broadridge quartile for the 36 months ended May 31, 2016 and the bottom Broadridge quartile for the 12 months ended May 31, 2016. The Trustees noted the reasons for the Fund’s underperformance and the steps Janus Capital had taken or was taking to improve performance.
· For Janus Global Technology Fund, the Trustees noted that the Fund’s performance was in the third Broadridge quartile for the 36 months ended May 31, 2016 and the first Broadridge quartile for the 12 months
Janus Investment Fund | 53 |
Janus Balanced Fund
Additional Information (unaudited)
ended May 31, 2016. The Trustees noted the reasons for the Fund’s underperformance, the steps Janus Capital had taken or was taking to improve performance, and that the performance trend was improving.
· For Janus International Equity Fund, the Trustees noted that the Fund’s performance was in the bottom Broadridge quartile for the 36 months ended May 31, 2016 and the bottom Broadridge quartile for the 12 months ended May 31, 2016. The Trustees noted the reasons for the Fund’s underperformance, noting that the Fund has a performance fee structure that results in lower management fees during periods of underperformance, and the steps Janus Capital had taken or was taking to improve performance.
· For Janus Overseas Fund, the Trustees noted that the Fund’s performance was in the bottom Broadridge quartile for the 36 months ended May 31, 2016 and the bottom Broadridge quartile for the 12 months ended May 31, 2016. The Trustees noted the reasons for the Fund’s underperformance, noting that the Fund has a performance fee structure that results in lower management fees during periods of underperformance, and the steps Janus Capital had taken or was taking to improve performance.
Janus Aspen Series
· For Janus Aspen Balanced Portfolio, the Trustees noted that the Fund’s performance was in the first Broadridge quartile for the 36 months ended May 31, 2016 and the third Broadridge quartile for the 12 months ended May 31, 2016.
· For Janus Aspen Enterprise Portfolio, the Trustees noted that the Fund’s performance was in the first Broadridge quartile for the 36 months ended May 31, 2016 and the first Broadridge quartile for the 12 months ended May 31, 2016.
· For Janus Aspen Flexible Bond Portfolio, the Trustees noted that the Fund’s performance was in the second Broadridge quartile for the 36 months ended May 31, 2016 and the bottom Broadridge quartile for the 12 months ended May 31, 2016.
· For Janus Aspen Forty Portfolio, the Trustees noted that the Fund’s performance was in the first Broadridge quartile for the 36 months ended May 31, 2016 and the first Broadridge quartile for the 12 months ended May 31, 2016.
· For Janus Aspen Global Allocation Portfolio – Moderate, the Trustees noted that the Fund’s performance was in the bottom Broadridge quartile for the 36 months ended May 31, 2016 and the bottom Broadridge quartile for the 12 months ended May 31, 2016. The Trustees noted the reasons for the Fund’s underperformance and the steps Janus Capital had taken or was taking to improve performance.
· For Janus Aspen Global Research Portfolio, the Trustees noted that the Fund’s performance was in the third Broadridge quartile for the 36 months ended May 31, 2016 and the bottom Broadridge quartile for the 12 months ended May 31, 2016. The Trustees noted the reasons for the Fund’s underperformance, noting that the Fund has a performance fee structure that results in lower management fees during periods of underperformance, and the steps Janus Capital had taken or was taking to improve performance.
· For Janus Aspen Global Technology Portfolio, the Trustees noted that the Fund’s performance was in the third Broadridge quartile for the 36 months ended May 31, 2016 and the second Broadridge quartile for the 12 months ended May 31, 2016. The Trustees noted the reasons for the Fund’s underperformance and the steps Janus Capital had taken or was taking to improve performance.
· For Janus Aspen Global Unconstrained Bond Portfolio, the Trustees noted that the Fund’s performance was in the second Broadridge quartile for the 12 months ended May 31, 2016.
· For Janus Aspen INTECH U.S. Low Volatility Portfolio, the Trustees noted that the Fund’s performance was in the first Broadridge quartile for the 36 months ended May 31, 2016 and the first Broadridge quartile for the 12 months ended May 31, 2016.
· For Janus Aspen Janus Portfolio, the Trustees noted that the Fund’s performance was in the first Broadridge quartile for the 36 months ended May 31, 2016 and the second Broadridge quartile for the 12 months ended May 31, 2016.
54 | MARCH 31, 2017 |
Janus Balanced Fund
Additional Information (unaudited)
· For Janus Aspen Overseas Portfolio, the Trustees noted that the Fund’s performance was in the bottom Broadridge quartile for the 36 months ended May 31, 2016 and the bottom Broadridge quartile for the 12 months ended May 31, 2016. The Trustees noted the reasons for the Fund’s underperformance, noting that the Fund has a performance fee structure that results in lower management fees during periods of underperformance, and the steps Janus Capital had taken or was taking to improve performance.
· For Janus Aspen Perkins Mid Cap Value Portfolio, the Trustees noted that the Fund’s performance was in the bottom Broadridge quartile for the 36 months ended May 31, 2016 and the first Broadridge quartile for the 12 months ended May 31, 2016.The Trustees noted the reasons for the Fund’s underperformance, noting that the Fund has a performance fee structure that results in lower management fees during periods of underperformance, the steps Janus Capital and Perkins had taken or were taking to improve performance, and that the performance trend was improving.
In consideration of each Fund’s performance, the Trustees concluded that, taking into account the factors relevant to performance, as well as other considerations, including steps taken to improve performance, the Fund’s performance warranted continuation of the Fund’s investment advisory and subadvisory agreement(s).
Costs of Services Provided
The Trustees examined information regarding the fees and expenses of each Fund in comparison to similar information for other comparable funds as provided by Broadridge, an independent data provider. They also reviewed an analysis of that information provided by their independent fee consultant and noted that the rate of management (investment advisory and any administration, but excluding out-of-pocket costs) fees for many of the Funds, after applicable waivers, was below the average management fee rate of the respective peer group of funds selected by an independent data provider. The Trustees also examined information regarding the subadvisory fees charged for subadvisory services, as applicable, noting that all such fees were paid by Janus Capital out of its management fees collected from such Fund.
The independent fee consultant provided its belief that the management fees charged by Janus Capital to each of the Funds under the current investment advisory and administration agreements are reasonable in relation to the services provided by Janus Capital. The independent fee consultant found: (1) the total expenses and management fees of the Funds to be reasonable relative to other mutual funds; (2) total expenses, on average, were 12% below the average total expenses of their respective Broadridge Expense Group peers and 20% below the average total expenses for their Broadridge Expense Universes; (3) management fees for the Funds, on average, were 11% below the average management fees for their Expense Groups and 13% below the average for their Expense Universes; and (4) Fund expenses at the functional level for each asset and share class category were reasonable. The Trustees also considered the total expenses for each share class of each Fund compared to the average total expenses for its Broadridge Expense Group peers and to average total expenses for its Broadridge Expense Universe.
The independent fee consultant concluded that, based on its strategic review of expenses at the complex, category and individual fund level, Fund expenses were found to be reasonable relative to both Expense Group and Expense Universe benchmarks. Further, for certain Funds, the independent fee consultant also performed a systematic “focus list” analysis of expenses in the context of the performance or service delivered to each set of investors in each share class in each selected Fund. Based on this analysis, the independent fee consultant found that the combination of service quality/performance and expenses on these individual Funds and share classes were reasonable in light of performance trends, performance histories, and existence of performance fees, breakpoints, and expense waivers on such Funds.
The Trustees considered the methodology used by Janus Capital and each subadviser in determining compensation payable to portfolio managers, the competitive environment for investment management talent, and the competitive market for mutual funds in different distribution channels.
The Trustees also reviewed management fees charged by Janus Capital and each subadviser to comparable separate account clients and to comparable non-affiliated funds subadvised by Janus Capital or by a subadviser (for which Janus Capital or the subadviser provides only or primarily portfolio management services). Although in most instances subadvisory and separate account fee rates for various investment strategies were lower than management fee rates for Funds having a similar strategy, the Trustees considered that Janus Capital noted that, under the terms of the management agreements with the Funds, Janus Capital performs significant additional services for the Funds that it does not provide to those other clients, including administration services, oversight of the Funds’ other service providers,
Janus Investment Fund | 55 |
Janus Balanced Fund
Additional Information (unaudited)
trustee support, regulatory compliance and numerous other services, and that, in serving the Funds, Janus Capital assumes many legal risks and other costs that it does not assume in servicing its other clients. Moreover, they noted that the independent fee consultant found that: (1) the management fees Janus Capital charges to the Funds are reasonable in relation to the management fees Janus Capital charges to its institutional and subadvised accounts; (2) these institutional and subadvised accounts have different service and infrastructure needs; (3) Janus mutual fund investors enjoy reasonable fees relative to the fees charged to Janus institutional and subadvised fund investors; and (4) in the majority of cases, the Funds receive proportionally better pricing than the industry in relation to Janus institutional and subadvised accounts.
The Trustees considered the fees for each Fund for its fiscal year ended in 2015, and noted the following with regard to each Fund’s total expenses, net of applicable fee waivers (the Fund’s “total expenses”):
Fixed-Income Funds and Money Market Funds
· For Janus Flexible Bond Fund, the Trustees noted that, although the Fund’s total expenses exceeded the peer group average for certain share classes, overall the Fund’s total expenses were reasonable. The Trustees also noted that Janus Capital has contractually agreed to limit the Fund’s expenses, although this limit did not apply because the Fund’s total expenses were already below the applicable fee limit.
· For Janus Global Bond Fund, the Trustees noted that although the Fund’s total expenses exceeded the peer group average for certain share classes, overall the Fund’s total expenses were reasonable. The Trustees also noted that Janus Capital has contractually agreed to limit the Fund’s expenses.
· For Janus Global Unconstrained Bond Fund, the Trustees noted that although the Fund’s total expenses exceeded the peer group average for certain share classes, overall the Fund’s total expenses were reasonable. The Trustees also noted that Janus Capital has contractually agreed to limit the Fund’s expenses.
· For Janus High-Yield Fund, the Trustees noted that, although the Fund’s total expenses exceeded the peer group average for certain share classes, overall the Fund’s total expenses were reasonable. The Trustees also noted that Janus Capital has contractually agreed to limit the Fund’s expenses, although this limit did not apply because the Fund’s total expenses were already below the applicable fee limit.
· For Janus Multi-Sector Income Fund, the Trustees noted that, although the Fund’s total expenses exceeded the peer group average for one share class, overall the Fund’s total expenses were reasonable. The Trustees also noted that Janus has contractually agreed to limit the Fund’s expenses.
· For Janus Real Return Fund, the Trustees noted that, although the Fund’s total expenses were equal to or exceeded the peer group average for all share classes, overall the Fund’s total expenses were reasonable. The Trustees also noted that Janus Capital has contractually agreed to limit the Fund’s expenses.
· For Janus Short-Term Bond Fund, the Trustees noted that, although the Fund’s total expenses exceeded the peer group average for certain share classes, overall the Fund’s total expenses were reasonable. The Trustees also noted that Janus Capital has contractually agreed to limit the Fund’s expenses.
· For Janus Government Money Market Fund, the Trustees noted that the Fund’s total expenses exceeded the peer group average for both share classes. The Trustees considered that management fees for this Fund are higher than the peer group average due to the Fund’s management fee including other costs, such as custody and transfer agent services, while many funds in the peer group pay these expenses separately from their management fee. In addition, the Trustees considered that Janus Capital voluntarily waives one-half of its advisory fee and other expenses in order to maintain a positive yield.
· For Janus Money Market Fund, the Trustees noted that the Fund’s total expenses were below the peer group average for both share classes. In addition, the Trustees considered that Janus Capital voluntarily waives one-half of its advisory fee and other expenses in order to maintain a positive yield.
Asset Allocation Funds
· For Janus Global Allocation Fund – Conservative, the Trustees noted that, although the Fund’s total expenses exceeded the peer group median for one share class, overall the Fund’s total expenses were reasonable. The Trustees also noted that Janus Capital has contractually agreed to limit the Fund’s expenses, although this limit did not apply because the Fund’s total expenses were already below the applicable fee limit.
56 | MARCH 31, 2017 |
Janus Balanced Fund
Additional Information (unaudited)
· For Janus Global Allocation Fund – Growth, the Trustees noted that the Fund’s total expenses were below the peer group average for all share classes.
· For Janus Global Allocation Fund – Moderate, the Trustees noted that, although the Fund’s total expenses exceeded the peer group average for one share class, overall the Fund’s total expenses were reasonable. The Trustees also noted that Janus Capital has contractually agreed to limit the Fund’s expenses.
Alternative Fund
· For Janus Diversified Alternatives Fund, the Trustees noted that, although the Fund’s total expenses exceeded the peer group average for certain share classes, overall the Fund’s total expenses were reasonable. The Trustees also noted that Janus Capital has contractually agreed to limit the Fund’s expenses.
Value Funds
· For Perkins International Value Fund, the Trustees noted that, although the Fund’s total expenses exceeded the peer group average for one share class, overall the Fund’s total expenses were reasonable. The Trustees also noted that Janus Capital has contractually agreed to limit the Fund’s expenses.
· For Perkins Global Value Fund, the Trustees noted that the Fund’s total expenses were below the peer group average for all share classes.
· For Perkins Large Cap Value Fund, the Trustees noted that, although the Fund’s total expenses exceeded the peer group average for one share class, overall the Fund’s total expenses were reasonable. The Trustees also noted that Janus Capital has contractually agreed to limit the Fund’s expenses.
· For Perkins Mid Cap Value Fund, the Trustees noted that, although the Fund’s total expenses exceeded the peer group average for one share class, overall the Fund’s total expenses were reasonable. The Trustees also noted that Janus Capital has contractually agreed to limit the Fund’s expenses, although this limit did not apply because the Fund’s total expenses were already below the applicable fee limit.
· For Perkins Select Value Fund, the Trustees noted that, although the Fund’s total expenses exceeded the peer group average for one share class, overall the Fund’s total expenses were reasonable. The Trustees also noted that Janus Capital has contractually agreed to limit the Fund’s expenses.
· For Perkins Small Cap Value Fund, the Trustees noted that the Fund’s total expenses were below the peer group average for all share classes.
· For Perkins Value Plus Income Fund, the Trustees noted that although the Fund’s total expenses exceeded the peer group average for one share class, overall the Fund’s total expenses were reasonable. The Trustees also noted that Janus Capital has contractually agreed to limit the Fund’s expenses.
Mathematical Funds
· For INTECH Emerging Markets Managed Volatility Fund, the Trustees noted that although the Fund’s total expenses exceeded the peer group average for one share class, overall the Fund’s total expenses were reasonable. The Trustees also noted that Janus Capital has contractually agreed to limit the Fund’s expenses.
· For INTECH Global Income Managed Volatility Fund, the Trustees noted that the Fund’s total expenses were below the peer group average for all share classes.
· For INTECH International Managed Volatility Fund, the Trustees noted that although the Fund’s total expenses exceeded the peer group average for one share class, overall the Fund’s total expenses were reasonable. The Trustees also noted that Janus Capital has contractually agreed to limit the Fund’s expenses.
· For INTECH U.S. Core Fund, the Trustees noted that although the Fund’s total expenses exceeded the peer group average for one share class, overall the Fund’s total expenses were reasonable. The Trustees also noted that Janus Capital has contractually agreed to limit the Fund’s expenses, although this limit did not apply because the Fund’s total expenses were already below the applicable fee limit.
· For INTECH U.S. Managed Volatility Fund, the Trustees noted that, although the Fund’s total expenses exceeded the peer group average for one share class, overall the Fund’s total expenses were reasonable. The
Janus Investment Fund | 57 |
Janus Balanced Fund
Additional Information (unaudited)
Trustees also noted that Janus Capital has contractually agreed to limit the Fund’s expenses, although this limit did not apply because the Fund’s total expenses were already below the applicable fee limit.
Growth and Core Funds
· For Janus Balanced Fund, the Trustees noted that, although the Fund’s total expenses exceeded the peer group average for one share class, overall the Fund’s total expenses were reasonable. The Trustees also noted that Janus Capital has contractually agreed to limit the Fund’s expenses, although this limit did not apply because the Fund’s total expenses were already below the applicable fee limit.
· For Janus Contrarian Fund, the Trustees noted that, although the Fund’s total expenses exceeded the peer group average for certain share classes, overall the Fund’s total expenses were reasonable. The Trustees also noted that Janus Capital has contractually agreed to limit the Fund’s expenses, although this limit did not apply because the Fund’s total expenses were already below the applicable fee limit.
· For Janus Enterprise Fund, the Trustees noted that, although the Fund’s total expenses exceeded the peer group average for one share class, overall the Fund’s total expenses were reasonable. The Trustees also noted that Janus Capital has contractually agreed to limit the Fund’s expenses, although this limit did not apply because the Fund’s total expenses were already below the applicable fee limit.
· For Janus Forty Fund, the Trustees noted that, although the Fund’s total expenses exceeded the peer group average for certain share classes, overall the Fund’s total expenses were reasonable. The Trustees also noted that Janus Capital has contractually agreed to limit the Fund’s expenses, although this limit did not apply because the Fund’s total expenses were already below the applicable fee limit.
· For Janus Fund, the Trustees noted that the Fund’s total expenses were below the peer group average for all share classes.
· For Janus Growth and Income Fund, the Trustees noted that, although the Fund’s total expenses exceeded the peer group average for certain share classes, overall the Fund’s total expenses were reasonable. The Trustees also noted that Janus Capital has contractually agreed to limit the Fund’s expenses, although this limit did not apply because the Fund’s total expenses were already below the applicable fee limit.
· For Janus Research Fund, the Trustees noted that although the Fund’s total expenses exceeded the peer group average for certain share classes, overall the Fund’s total expenses were reasonable.
· For Janus Triton Fund, the Trustees noted that, although the Fund’s total expenses exceeded the peer group average for one share class, overall the Fund’s total expenses were reasonable. The Trustees also noted that Janus Capital has contractually agreed to limit the Fund’s expenses, although this limit did not apply because the Fund’s total expenses were already below the applicable fee limit.
· For Janus Twenty Fund, the Trustees noted that the Fund’s total expenses were below the peer group average for all share classes.
· For Janus Venture Fund, the Trustees noted that, although the Fund’s total expenses exceeded the peer group average for one share class, overall the Fund’s total expenses were reasonable. The Trustees also noted that Janus Capital has contractually agreed to limit the Fund’s expenses, although this limit did not apply because the Fund’s total expenses were already below the applicable fee limit.
Global and International Funds
· For Janus Adaptive Global Allocation Fund, the Trustees noted that, although the Fund’s total expenses exceeded the peer group median for certain share classes, overall the Fund’s total expenses were reasonable. The Trustees also noted that Janus Capital has contractually agreed to limit the Fund’s expenses.
· For Janus Asia Equity Fund, the Trustees noted that, although the Fund’s total expenses exceeded the peer group average for one share class, overall the Fund’s total expenses were reasonable. The Trustees also noted that Janus Capital has contractually agreed to limit the Fund’s expenses.
· For Janus Emerging Markets Fund, the Trustees noted that, although the Fund’s total expenses exceeded the peer group average for one share class, overall the Fund’s total expenses were reasonable. The Trustees also noted that Janus Capital has contractually agreed to limit the Fund’s expenses.
58 | MARCH 31, 2017 |
Janus Balanced Fund
Additional Information (unaudited)
· For Janus Global Life Sciences Fund, the Trustees noted that the Fund’s total expenses were below the peer group average for all share classes.
· For Janus Global Real Estate Fund, the Trustees noted that, although the Fund’s total expenses exceeded the peer group average for certain share classes, overall the Fund’s total expenses were reasonable. The Trustees also noted that Janus Capital has contractually agreed to limit the Fund’s expenses, although this limit did not apply because the Fund’s total expenses were already below the applicable fee limit.
· For Janus Global Research Fund, the Trustees noted that the Fund’s total expenses were below the peer group average for all share classes.
· For Janus Global Select Fund, the Trustees noted that the Fund’s total expenses were below the peer group average for all share classes.
· For Janus Global Technology Fund, the Trustees noted that the Fund’s total expenses were below the peer group average for all share classes.
· For Janus International Equity Fund, the Trustees noted that, although the Fund’s total expenses exceeded the peer group average for one share class, overall the Fund’s total expenses were reasonable. The Trustees also noted that Janus Capital has contractually agreed to limit the Fund’s expenses, although this limit did not apply because the Fund’s total expenses were already below the applicable fee limit.
· For Janus Overseas Fund, the Trustees noted that the Fund’s total expenses were below the peer group average for all share classes.
Janus Aspen Series
· For Janus Aspen Balanced Portfolio, the Trustees noted that the Fund’s total expenses were below the peer group average for both share classes.
· For Janus Aspen Enterprise Portfolio, the Trustees noted that the Fund’s total expenses were below the peer group average for both share classes.
· For Janus Aspen Flexible Bond Portfolio, the Trustees noted that, although the Fund’s total expenses exceeded the peer group average for both share classes, overall the Fund’s total expenses were reasonable. The Trustees also noted that Janus Capital has contractually agreed to limit the Fund’s expenses.
· For Janus Aspen Forty Portfolio, the Trustees noted that the Fund’s total expenses were below the peer group average for both share classes.
· For Janus Aspen Global Allocation Portfolio - Moderate, the Trustees noted that, although the Fund’s total expenses exceeded the peer group average for both share classes, overall the Fund’s total expenses were reasonable. The Trustees also noted that Janus Capital has contractually agreed to limit the Fund’s expenses.
· For Janus Aspen Global Research Portfolio, the Trustees noted that the Fund’s total expenses were below the peer group average for both share classes.
· For Janus Aspen Global Technology Portfolio, the Trustees noted that the Fund’s total expenses were below the peer group average for both share classes.
· For Janus Aspen Global Unconstrained Bond Portfolio, the Trustees noted that, although the Fund’s total expenses exceeded the peer group average for both share classes, overall the Fund’s total expenses were reasonable. The Trustees also noted that Janus Capital has contractually agreed to limit the Fund’s expenses.
· For Janus Aspen INTECH U.S. Low Volatility Portfolio, the Trustees noted that the Fund’s total expenses were below the peer group average for its sole share class.
· For Janus Aspen Janus Portfolio, the Trustees noted that the Fund’s total expenses were below the peer group average for both share classes.
· For Janus Aspen Overseas Portfolio, the Trustees noted that the Fund’s total expenses were below the peer group average for both share classes.
Janus Investment Fund | 59 |
Janus Balanced Fund
Additional Information (unaudited)
· For Janus Aspen Perkins Mid Cap Value Portfolio, the Trustees noted that the Fund’s total expenses were below the peer group average for both share classes.
The Trustees reviewed information on the profitability to Janus Capital and its affiliates of their relationships with each Fund, as well as an explanation of the methodology utilized by Janus Capital when allocating various expenses of Janus Capital and its affiliates with respect to contractual relationships with the Funds and other clients. The Trustees also reviewed the financial statements and corporate structure of Janus Capital’s parent company. In their review, the Trustees considered whether Janus Capital and each subadviser receive adequate incentives and resources to manage the Funds effectively. The Trustees recognized that profitability comparisons among fund managers are difficult because very little comparative information is publicly available, and the profitability of any fund manager is affected by numerous factors, including the organizational structure of the particular fund manager, the types of funds and other accounts it manages, possible other lines of business, the methodology for allocating expenses, and the fund manager’s capital structure and cost of capital. However, taking into account those factors and the analysis provided by the Trustees’ independent fee consultant, and based on the information available, the Trustees concluded that Janus Capital’s profitability with respect to each Fund in relation to the services rendered was reasonable.
The independent fee consultant found that, while assessing the reasonableness of expenses in light of Janus Capital’s profits is dependent on comparisons with other publicly-traded mutual fund advisers, and that these comparisons are limited in accuracy by differences in complex size, business mix, institutional account orientation, and other factors, after accepting these limitations, the level of profit earned by Janus Capital from managing the Funds is reasonable.
The Trustees concluded that the management fees payable by each Fund to Janus Capital and its affiliates, as well as the fees paid by Janus Capital to the subadvisers of subadvised Funds, were reasonable in relation to the nature, extent, and quality of the services provided, taking into account the fees charged by other advisers for managing comparable mutual funds with similar strategies, the fees Janus Capital and the subadvisers charge to other clients, and, as applicable, the impact of fund performance on management fees payable by the Funds. The Trustees also concluded that each Fund’s total expenses were reasonable, taking into account the size of the Fund, the quality of services provided by Janus Capital and any subadviser, the investment performance of the Fund, and any expense limitations agreed to or provided by Janus Capital.
Economies of Scale
The Trustees considered information about the potential for Janus Capital to realize economies of scale as the assets of the Funds increase. They noted their independent fee consultant’s analysis of economies of scale in prior years. They also noted that, although many Funds pay advisory fees at a base fixed rate as a percentage of net assets, without any breakpoints, their independent fee consultant concluded that 91% of these Funds have contractual management fees (gross of waivers) below their Broadridge expense group averages and, overall, 83% of the Funds are below their respective expense group averages for contractual management fees. They also noted that for those Funds whose expenses are being reduced by the contractual expense limitations of Janus Capital, Janus Capital is subsidizing the Funds because they have not reached adequate scale. Moreover, as the assets of some of the Funds have declined in the past few years, certain Funds have benefited from having advisory fee rates that have remained constant rather than increasing as assets declined. In addition, performance fee structures have been implemented for various Funds that have caused the effective rate of advisory fees payable by such a Fund to vary depending on the investment performance of the Fund relative to its benchmark index over the measurement period; and a few Funds have fee schedules with breakpoints and reduced fee rates above certain asset levels. The Trustees also noted that the Funds share directly in economies of scale through the lower charges of third-party service providers that are based in part on the combined scale of all of the Funds. Based on all of the information they reviewed, including past research and analysis conducted by the Trustees’ independent fee consultant, the Trustees concluded that the current fee structure of each Fund was reasonable and that the current rates of fees do reflect a sharing between Janus Capital and the Fund of any economies of scale that may be present at the current asset level of the Fund.
The independent fee consultant concluded that, given the limitations of various analytical approaches to economies of scale considered in prior years, and their conflicting results, its analyses could not confirm or deny the existence of economies of scale in the Janus complex. Further, the independent fee consultant provided its belief that Fund investors are well-served by the fee levels and performance fee structures in place on the Funds in light of any economies of scale that may be present at Janus Capital.
60 | MARCH 31, 2017 |
Janus Balanced Fund
Additional Information (unaudited)
Other Benefits to Janus Capital
The Trustees also considered benefits that accrue to Janus Capital and its affiliates and subadvisers to the Funds from their relationships with the Funds. They recognized that two affiliates of Janus Capital separately serve the Funds as transfer agent and distributor, respectively, and the transfer agent receives compensation directly from the non-money market funds for services provided. The Trustees also considered Janus Capital’s past and proposed use of commissions paid by the Funds on portfolio brokerage transactions to obtain proprietary and third-party research products and services benefiting the Fund and/or other clients of Janus Capital and/or Janus Capital, and/or a subadviser to a Fund. The Trustees concluded that Janus Capital’s and the subadvisers’ use of these types of client commission arrangements to obtain proprietary and third-party research products and services was consistent with regulatory requirements and guidelines and was likely to benefit each Fund. The Trustees also concluded that, other than the services provided by Janus Capital and its affiliates and subadvisers pursuant to the agreements and the fees to be paid by each Fund therefor, the Funds and Janus Capital and the subadvisers may potentially benefit from their relationship with each other in other ways. They concluded that Janus Capital and/or the subadvisers benefits from the receipt of research products and services acquired through commissions paid on portfolio transactions of the Funds and that the Funds benefit from Janus Capital’s and/or the subadvisers’ receipt of those products and services as well as research products and services acquired through commissions paid by other clients of Janus Capital and/or other clients of the subadvisers. They further concluded that the success of any Fund could attract other business to Janus Capital, the subadvisers or other Janus funds, and that the success of Janus Capital and the subadvisers could enhance Janus Capital’s and the subadvisers’ ability to serve the Funds.
Janus Investment Fund | 61 |
Janus Balanced Fund
Useful Information About Your Fund Report (unaudited)
The Management Commentary in this report includes valuable insight as well as statistical information to help you understand how your Fund’s performance and characteristics stack up against those of comparable indices.
If the Fund invests in foreign securities, this report may include information about country exposure. Country exposure is based primarily on the country of risk. A company may be allocated to a country based on other factors such as location of the company’s principal office, the location of the principal trading market for the company’s securities, or the country where a majority of the company’s revenues are derived.
Please keep in mind that the opinions expressed in the Management Commentary are just that: opinions. They are a reflection based on best judgment at the time this report was compiled, which was March 31, 2017. As the investing environment changes, so could opinions. These views are unique and are not necessarily shared by fellow employees or by Janus in general.
Performance Overviews
Performance overview graphs compare the performance of a hypothetical $10,000 investment in the Fund with one or more widely used market indices. When comparing the performance of the Fund with an index, keep in mind that market indices are not available for investment and do not reflect deduction of expenses.
Average annual total returns are quoted for a Fund with more than one year of performance history. Average annual total return is calculated by taking the growth or decline in value of an investment over a period of time, including reinvestment of dividends and distributions, then calculating the annual compounded percentage rate that would have produced the same result had the rate of growth been constant throughout the period. Average annual total return does not reflect the deduction of taxes that a shareholder would pay on Fund distributions or redemptions of Fund shares.
Cumulative total returns are quoted for a Fund with less than one year of performance history. Cumulative total return is the growth or decline in value of an investment over time, independent of the period of time involved. Cumulative total return does not reflect the deduction of taxes that a shareholder would pay on Fund distributions or redemptions of Fund shares.
Pursuant to federal securities rules, expense ratios shown in the performance chart reflect subsidized (if applicable) and unsubsidized ratios. The total annual fund operating expenses ratio is gross of any fee waivers, reflecting the Fund’s unsubsidized expense ratio. The net annual fund operating expenses ratio (if applicable) includes contractual waivers of Janus Capital and reflects the Fund’s subsidized expense ratio. Ratios may be higher or lower than those shown in the “Financial Highlights” in this report.
Schedule of Investments
Following the performance overview section is the Fund’s Schedule of Investments. This schedule reports the types of securities held in the Fund on the last day of the reporting period. Securities are usually listed by type (common stock, corporate bonds, U.S. Government obligations, etc.) and by industry classification (banking, communications, insurance, etc.). Holdings are subject to change without notice.
The value of each security is quoted as of the last day of the reporting period. The value of securities denominated in foreign currencies is converted into U.S. dollars.
If the Fund invests in foreign securities, it will also provide a summary of investments by country. This summary reports the Fund exposure to different countries by providing the percentage of securities invested in each country. The country of each security represents the country of risk. The Fund’s Schedule of Investments relies upon the industry group and country classifications published by Barclays and/or MSCI Inc.
Tables listing details of individual forward currency contracts, futures, written options, swaptions, and swaps follow the Fund’s Schedule of Investments (if applicable).
Statement of Assets and Liabilities
This statement is often referred to as the “balance sheet.” It lists the assets and liabilities of the Fund on the last day of the reporting period.
The Fund’s assets are calculated by adding the value of the securities owned, the receivable for securities sold but not yet settled, the receivable for dividends declared but not yet received on securities owned, and the receivable for Fund
62 | MARCH 31, 2017 |
Janus Balanced Fund
Useful Information About Your Fund Report (unaudited)
shares sold to investors but not yet settled. The Fund’s liabilities include payables for securities purchased but not yet settled, Fund shares redeemed but not yet paid, and expenses owed but not yet paid. Additionally, there may be other assets and liabilities such as unrealized gain or loss on forward currency contracts.
The section entitled “Net Assets Consist of” breaks down the components of the Fund’s net assets. Because the Fund must distribute substantially all earnings, you will notice that a significant portion of net assets is shareholder capital.
The last section of this statement reports the net asset value (“NAV”) per share on the last day of the reporting period. The NAV is calculated by dividing the Fund’s net assets for each share class (assets minus liabilities) by the number of shares outstanding.
Statement of Operations
This statement details the Fund’s income, expenses, realized gains and losses on securities and currency transactions, and changes in unrealized appreciation or depreciation of Fund holdings.
The first section in this statement, entitled “Investment Income,” reports the dividends earned from securities and interest earned from interest-bearing securities in the Fund.
The next section reports the expenses incurred by the Fund, including the advisory fee paid to the investment adviser, transfer agent fees and expenses, and printing and postage for mailing statements, financial reports and prospectuses. Expense offsets and expense reimbursements, if any, are also shown.
The last section lists the amounts of realized gains or losses from investment and foreign currency transactions, and changes in unrealized appreciation or depreciation of investments and foreign currency-denominated assets and liabilities. The Fund will realize a gain (or loss) when it sells its position in a particular security. A change in unrealized gain (or loss) refers to the change in net appreciation or depreciation of the Fund during the reporting period. “Net Realized and Unrealized Gain/(Loss) on Investments” is affected both by changes in the market value of Fund holdings and by gains (or losses) realized during the reporting period.
Statements of Changes in Net Assets
These statements report the increase or decrease in the Fund’s net assets during the reporting period. Changes in the Fund’s net assets are attributable to investment operations, dividends and distributions to investors, and capital share transactions. This is important to investors because it shows exactly what caused the Fund’s net asset size to change during the period.
The first section summarizes the information from the Statement of Operations regarding changes in net assets due to the Fund’s investment operations. The Fund’s net assets may also change as a result of dividend and capital gains distributions to investors. If investors receive their dividends and/or distributions in cash, money is taken out of the Fund to pay the dividend and/or distribution. If investors reinvest their dividends and/or distributions, the Fund’s net assets will not be affected. If you compare the Fund’s “Net Decrease from Dividends and Distributions” to “Reinvested Dividends and Distributions,” you will notice that dividends and distributions have little effect on the Fund’s net assets. This is because the majority of the Fund’s investors reinvest their dividends and/or distributions.
The reinvestment of dividends and distributions is included under “Capital Share Transactions.” “Capital Shares” refers to the money investors contribute to the Fund through purchases or withdrawals via redemptions. The Fund’s net assets will increase and decrease in value as investors purchase and redeem shares from the Fund.
Financial Highlights
This schedule provides a per-share breakdown of the components that affect the Fund’s NAV for current and past reporting periods as well as total return, asset size, ratios, and portfolio turnover rate.
The first line in the table reflects the NAV per share at the beginning of the reporting period. The next line reports the net investment income/(loss) per share. Following is the per share total of net gains/(losses), realized and unrealized. Per share dividends and distributions to investors are then subtracted to arrive at the NAV per share at the end of the period. The next line reflects the total return for the period. Also included are ratios of expenses and net investment income to average net assets.
The Fund’s expenses may be reduced through expense offsets and expense reimbursements. The ratios shown reflect expenses before and after any such offsets and reimbursements.
Janus Investment Fund | 63 |
Janus Balanced Fund
Useful Information About Your Fund Report (unaudited)
The ratio of net investment income/(loss) summarizes the income earned less expenses, divided by the average net assets of the Fund during the reporting period. Do not confuse this ratio with the Fund’s yield. The net investment income ratio is not a true measure of the Fund’s yield because it does not take into account the dividends distributed to the Fund’s investors.
The next figure is the portfolio turnover rate, which measures the buying and selling activity in the Fund. Portfolio turnover is affected by market conditions, changes in the asset size of the Fund, fluctuating volume of shareholder purchase and redemption orders, the nature of the Fund’s investments, and the investment style and/or outlook of the portfolio manager(s) and/or investment personnel. A 100% rate implies that an amount equal to the value of the entire portfolio was replaced once during the fiscal year; a 50% rate means that an amount equal to the value of half the portfolio is traded in a year; and a 200% rate means that an amount equal to the value of the entire portfolio is traded every six months.
64 | MARCH 31, 2017 |
Janus Balanced Fund
Notes
NotesPage1
Janus Investment Fund | 65 |
Janus provides access to a wide range of investment disciplines.
Alternative
Janus alternative funds seek to deliver strong risk-adjusted returns over a full market cycle with lower correlation to equity markets than traditional investments.
Asset Allocation
Janus’ asset allocation funds utilize our fundamental, bottom-up research to balance risk over the long term. From fund options that meet investors’ risk tolerance and objectives to a method that incorporates non-traditional investment choices to seek non-correlated sources of risk and return, Janus’ asset allocation funds aim to allocate risk more effectively.
Fixed Income
Janus fixed income funds attempt to provide less risk relative to equities while seeking to deliver a competitive total return through high current income and appreciation. Janus money market funds seek capital preservation and liquidity with current income as a secondary objective.
Global & International
Janus global and international funds seek to leverage Janus’ research capabilities by taking advantage of inefficiencies in foreign markets, where accurate information and analytical insight are often at a premium.
Growth & Core
Janus growth funds focus on companies believed to be the leaders in their respective industries, with solid management teams, expanding market share, margins and efficiencies. Janus core funds seek investments in more stable and predictable companies. Our core funds look for a strategic combination of steady growth and, for certain funds, some degree of income.
Mathematical
Our mathematical funds seek to outperform their respective indices while maintaining a risk profile equal to or lower than the index itself. Managed by INTECH® (a Janus subsidiary), these funds use a mathematical process in an attempt to build a more “efficient” portfolio than the index.
Value
Our value funds, managed by Perkins® (a Janus subsidiary), seek to identify companies with favorable reward to risk characteristics by conducting rigorous downside analysis before determining upside potential.
For more information about our funds, contact your investment professional or go to janus.com/advisor/mutual-funds (or janus.com/allfunds if you hold Shares directly with Janus).
| ||||||||||||
Please consider the charges, risks, expenses and investment objectives carefully before investing. For a prospectus or, if available, a summary prospectus containing this and other information, please call Janus at 877.33JANUS (52687) (or 800.525.3713 if you hold Shares directly with Janus); or download the file from janus.com/info (or janus.com/reports if you hold Shares directly with Janus). Read it carefully before you invest or send money. | ||||||||||||
Janus, INTECH and Perkins are registered trademarks of Janus International Holding LLC. © Janus International Holding LLC. Funds distributed by Janus Distributors LLC | ||||||||||||
Investment products offered are: | NOT FDIC-INSURED | MAY LOSE VALUE | NO BANK GUARANTEE | |||||||||
125-24-93037 05-17 | ||||||||||||

SEMIANNUAL REPORT March 31, 2017 | |||
Janus Contrarian Fund | |||
Janus Investment Fund | |||
| |||
HIGHLIGHTS · Portfolio management perspective · Investment strategy behind your fund · Fund performance, characteristics | |||
| |||

Table of Contents
Janus Contrarian Fund
Janus Contrarian Fund (unaudited)

PERFORMANCE OVERVIEW
For the six-month period ending March 31, 2017, the Fund’s Class I Shares generated a return of 11.15% versus a return of 10.12% for the S&P 500 Index, the Fund's benchmark.
INVESTMENT ENVIRONMENT
U.S. equities enjoyed strong returns during the six-month period. Stocks rallied after the November U.S. presidential election as investors considered the potential impact of deregulation, increased fiscal spending, corporate tax cuts and other pro-growth policies under a Trump administration. Economic data suggested global economic growth was returning and also played a role in helping boost equities. While stocks gained ground, they were volatile toward the end of the period as investors questioned how quickly Congress might implement some of the new administration’s proposed policies.
PERFORMANCE DISCUSSION
The Fund outperformed its benchmark, the S&P 500 Index. As part of our contrarian investment mandate, we seek companies that are undergoing a structural change in their business or industry that has gone unrecognized by the market, but we believe should positively reshape the company’s destiny, and stock performance, over time. These stocks are generally out of favor with investors, but if we correctly identify the changing dynamics at work within these companies or industries, the stocks in our portfolio have the potential to move from being out of favor to in favor as the company executes its turnaround. Our long-term performance ultimately should be driven by our ability to correctly identify companies that are early in the process of undergoing dramatic changes. This period we were pleased to see many holdings in our portfolio continue to drive positive performance as the market received more indications of long-term improvements taking place at the companies.
United Continental Holdings was a large contributor. Improved pricing metrics helped lift airline stocks late in 2016, as did news that a well-known value investor was taking a substantial ownership stake in major airline companies. The market took the ownership stake as a vote of confidence about improvements to the structure of the airline industry, which we have mentioned in our commentaries for the last five years. In our view, consolidation is a large tailwind for the industry. With a smaller number of companies controlling a greater portion of flights, major airlines have the ability to reduce capacity and improve pricing. With improved pricing power, airlines such as United hit record levels of profitability and are returning cash to shareholders.
Knowles Corp. was another top contributor. The stock was up after the company reported better-than-expected earnings growth and anticipated solid demand for its micro-electrical-mechanical system (MEMS) microphones over the next one to two years. Knowles was spun out of Dover in 2014, a transaction that facilitated improved focus on the company’s core MEMS microphone and hearing aid businesses, as well as cost savings. Knowles stumbled with some execution issues after its spin-out, and we took advantage of the stock’s weakness at the time to build a position in our portfolio. We believe Knowles, the leader in MEMS microphones, currently enjoys its best growth prospects in some time as key mobile phone manufacturers seem likely to spur phone demand through innovation. At the same time, Knowles is well positioned to exploit emerging demand for “voice as interface” consumer devices, such as the Amazon Echo, where Knowles is presently the exclusive MEMS microphone supplier.
Popeyes Louisiana Kitchen was another leading contributor. The stock was up after an announcement that Restaurant Brands International would acquire the company. In our view, the Popeyes franchise is meaningfully underpenetrated both domestically and internationally, has an attractive recurring and profitable
Janus Investment Fund | 1 |
Janus Contrarian Fund (unaudited)
business model and a very strong brand relative to its peers. We believe the company’s strong growth prospects, brand and franchised business model made it a desirable target for Restaurant Brands International.
While pleased with the performance of many holdings in the portfolio, we did own some companies that produced disappointing results during the period. Mattel was our largest detractor. The stock was down after a pre-announced earnings miss on lower revenue due in part to a slowdown in toy sales during the holidays. We continue to like the company, however. We believe Mattel is innovating some of its key toy brands and also believe the new CEO is a good fit to handle the channel disruption facing retailers as more sales move online.
Ball Corp. was another large detractor. The stock fell further after the company reported weaker-than-expected earnings in February, due largely to weakness in its European business. We view the issues affecting earnings as transitory and still like the company’s long-term outlook. Ball’s 2016 acquisition of a competitor has improved the competitive dynamics within the beverage packaging industry within which it operates, and should improve earnings for Ball. We expect the newly combined company to delever quickly, transferring more value to equity holders.
St. Joe Corp. was also a detractor. In our view, nothing fundamentally changed at the company to warrant the stock’s fall in the first quarter. The stock is a longtime holding in the portfolio, and our views on the company remain the same. We think the management team is working diligently to maximize the value of its Florida real estate holdings, but these efforts seem largely unrecognized by the market. The company added a new tenant at its Florida airport, and in our view, the company is still making good progress on the large retirement community under development. The company also bought back more stock during the period. While we are surprised by the stock’s performance in light of these developments, we will continue to be patient with the holding.
DERIVATIVES USE
Derivatives, including options, futures and forwards, are used in the portfolio to generate income (through selling calls and selling puts), to have exposure to a position without owning it (generally selling a put to buy a call — often referred to as stock replacement), and periodically to hedge market risk (generally, by buying puts in market indices, such as the S&P 500). The purpose of the option strategy is an attempt to generate income and reduce the risk in the portfolio. The purpose of the futures strategy is to reduce the overall volatility of the Fund. During the period, our use of derivatives detracted from relative results. Please see the Derivative Instruments section in the “Notes to Financial Statements” for a discussion of derivatives used by the Fund.
OUTLOOK
We believe a few equity market dynamics warrant caution in the months ahead. The rapid rise of stocks after the November presidential election seemed premised on the idea that fiscal stimulus, deregulation and tax cuts were all just around the corner. However, Congress’ failure to replace the Affordable Care Act demonstrates that any of these initiatives will take time, and some may never see the light of day. We wouldn’t be surprised if stocks are volatile as these efforts slowly play themselves out.
We are also concerned about momentum driving select pockets of the market. The Nasdaq 100 Index, which includes 100 of the largest non-financial companies listed on the Nasdaq Stock Market, handily outperformed the S&P 500 this quarter, as mega-cap technology stocks continued to climb higher. These stocks had a brief post-election pause, but have generally been large outperformers for the better part of the last two years. That rise was due partly to the popularity of the secular growth trends they are tied to, but also due to asset flows into exchange traded funds that continue to push the largest stocks in an index higher.
Not owning these companies has been uncomfortable on the ride up, but as contrarian investors, it’s simply not a pocket of the market we would invest in. Valuation has always been – and will always be – an important component of our investment process, and in our view, current valuations for these mega-caps are hard to justify. At some point, we believe these large companies will stumble in meeting their growth projections and the ride down could be painful.
Given our more cautious outlook, we are keeping some dry powder to take advantage of any opportunities market volatility will present in the coming months. We will also continue to stay true to our investment process, focusing on undervalued companies experiencing an underappreciated structural change to their business. Over the long term, we believe that discipline will be rewarded.
Thank you for your investment in Janus Contrarian Fund.
2 | MARCH 31, 2017 |
Janus Contrarian Fund (unaudited)
Fund At A Glance
March 31, 2017
5 Top Performers - Holdings |
|
|
| 5 Bottom Performers - Holdings |
| |
Contribution | Contribution | |||||
United Continental Holdings Inc | 3.42% | Mattel Inc | -0.70% | |||
Knowles Corp | 2.04% | St Joe Co | -0.69% | |||
Popeyes Louisiana Kitchen Inc | 1.45% | Ball Corp | -0.49% | |||
Zebra Technologies Corp | 1.36% | LKQ Corp | -0.43% | |||
Lands' End Inc | 1.02% | Crown Holdings Inc | -0.32% | |||
5 Top Performers - Sectors* |
|
|
|
|
| |
Fund | Fund Weighting | S&P 500 Index | ||||
Contribution | (Average % of Equity) | Weighting | ||||
Industrials | 3.41% | 13.02% | 10.16% | |||
Information Technology | 1.43% | 12.19% | 21.28% | |||
Health Care | 0.59% | 1.46% | 13.93% | |||
Consumer Discretionary | 0.30% | 21.37% | 12.26% | |||
Telecommunication Services | 0.30% | -0.14% | 2.50% | |||
5 Bottom Performers - Sectors* |
|
|
|
|
| |
Fund | Fund Weighting | S&P 500 Index | ||||
Contribution | (Average % of Equity) | Weighting | ||||
Financials | -1.44% | 9.91% | 14.35% | |||
Materials | -1.40% | 14.31% | 2.86% | |||
Real Estate | -1.10% | 7.79% | 2.86% | |||
Other** | -0.23% | 6.99% | 0.00% | |||
Energy | -0.11% | 9.63% | 7.17% | |||
Security contribution to performance is measured by using an algorithm that multiplies the daily performance of each security with the previous day’s ending weight in the portfolio and is gross of advisory fees. Fixed income securities and certain equity securities, such as private placements and some share classes of equity securities, are excluded. | ||||||
* | Based on sector classification according to the Global Industry Classification Standard (“GICS”) codes, which are the exclusive property and a service mark of MSCI Inc. and Standard & Poor’s. | |||||
** | Not a GICS classified sector. | |||||
Janus Investment Fund | 3 |
Janus Contrarian Fund (unaudited)
Fund At A Glance
March 31, 2017
5 Largest Equity Holdings - (% of Net Assets) | |
Knowles Corp | |
Electronic Equipment, Instruments & Components | 6.8% |
United Continental Holdings Inc | |
Airlines | 6.0% |
Enterprise Products Partners LP | |
Oil, Gas & Consumable Fuels | 5.4% |
St Joe Co | |
Real Estate Management & Development | 5.2% |
Mattel Inc | |
Leisure Products | 5.1% |
28.5% | |
Asset Allocation - (% of Net Assets) | |||||
Common Stocks | 78.4% | ||||
Investment Companies | 21.3% | ||||
OTC Purchased Options – Puts | 0.3% | ||||
Other | (0.0)% | ||||
100.0% | |||||
Top Country Allocations - Long Positions - (% of Investment Securities) | |
As of March 31, 2017
| As of September 30, 2016
|
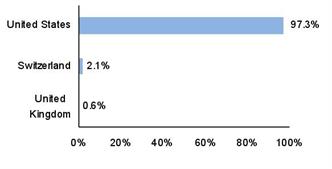
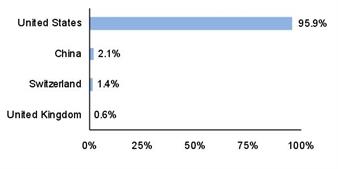
4 | MARCH 31, 2017 |
Janus Contrarian Fund (unaudited)
Performance
See important disclosures on the next page. |
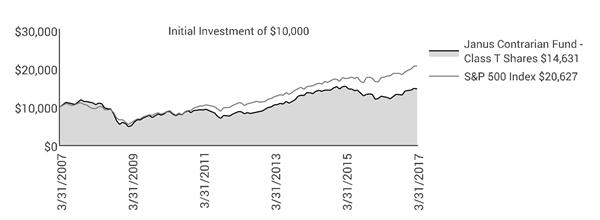
| Expense Ratios - | |||||||||
Average Annual Total Return - for the periods ended March 31, 2017 |
|
| per the January 27, 2017 prospectuses | |||||||
|
| Fiscal
| One
| Five | Ten
| Since |
|
| Total Annual Fund
| |
Class A Shares at NAV |
| 10.96% | 14.80% | 10.79% | 3.74% | 6.67% |
|
| 0.90% | |
Class A Shares at MOP |
| 4.58% | 8.21% | 9.47% | 3.13% | 6.30% |
|
|
| |
Class C Shares at NAV | 10.57% | 14.07% | 9.92% | 2.93% | 5.86% |
|
| 1.66% | ||
Class C Shares at CDSC |
| 9.57% | 13.07% | 9.92% | 2.93% | 5.86% |
|
|
| |
Class D Shares(1) |
| 11.04% | 14.99% | 10.99% | 3.94% | 6.84% |
|
| 0.70% | |
Class I Shares |
| 11.15% | 15.17% | 11.11% | 3.88% | 6.80% |
|
| 0.63% | |
Class R Shares |
| 10.75% | 14.33% | 10.35% | 3.31% | 6.21% |
|
| 1.30% | |
Class S Shares |
| 10.88% | 14.65% | 10.64% | 3.58% | 6.48% |
|
| 1.04% | |
Class T Shares |
| 11.01% | 14.91% | 10.92% | 3.88% | 6.80% |
|
| 0.79% | |
S&P 500 Index |
| 10.12% | 17.17% | 13.30% | 7.51% | 5.28% |
|
|
| |
Morningstar Quartile - Class T Shares |
| - | 3rd | 3rd | 4th | 3rd |
|
|
| |
Morningstar Ranking - based on total returns for Mid-Cap Blend Funds |
| - | 334/465 | 275/397 | 308/329 | 138/186 |
|
|
| |
Returns quoted are past performance and do not guarantee future results; current performance may be lower or higher. Investment returns and principal value will vary; there may be a gain or loss when shares are sold. For the most recent month-end performance call 877.33JANUS(52687) (or 800.525.3713 if you hold shares directly with Janus Capital) or visit janus.com/advisor/mutual-funds (or janus.com/allfunds if you hold shares directly with Janus Capital).
Maximum Offering Price (MOP) returns include the maximum sales charge of 5.75%. Net Asset Value (NAV) returns exclude this charge, which would have reduced returns.
Janus Investment Fund | 5 |
Janus Contrarian Fund (unaudited)
Performance
This Fund has a performance-based management fee that may adjust up or down based on the Fund’s performance.
Performance may be affected by risks that include those associated with non-diversification, portfolio turnover, short sales, potential conflicts of interest, foreign and emerging markets, initial public offerings (IPOs), high-yield and high-risk securities, undervalued, overlooked and smaller capitalization companies, real estate related securities including Real Estate Investment Trusts (REITs), derivatives, and commodity-linked investments. Each product has different risks. Please see the prospectus for more information about risks, holdings and other details.
Returns include reinvestment of all dividends and distributions and do not reflect the deduction of taxes that a shareholder would pay on Fund distributions or redemptions of Fund shares. The returns do not include adjustments in accordance with generally accepted accounting principles required at the period end for financial reporting purposes.
See Financial Highlights for actual expense ratios during the reporting period.
Class A Shares, Class C Shares, Class R Shares, and Class S Shares commenced operations on July 6, 2009. Performance shown for each class for periods prior to July 6, 2009, reflects the performance of the Fund’s Class J Shares, the initial share class (renamed Class T Shares effective February 16, 2010), calculated using the fees and expenses of each respective class, without the effect of any fee and expense limitations or waivers.
Class D Shares commenced operations on February 16, 2010. Performance shown for periods prior to February 16, 2010, reflects the performance of the Fund’s former Class J Shares, calculated using the fees and expenses in effect during the periods shown, net of any applicable fee and expense limitations or waivers.
Class I Shares commenced operations on July 6, 2009. Performance shown for periods prior to July 6, 2009, reflects the performance of the Fund’s former Class J Shares, calculated using the fees and expenses of Class J Shares, net of any applicable fee and expense limitations or waivers.
If each share class of the Fund had been available during periods prior to its commencement, the performance shown may have been different. The performance shown for periods following the Fund's commencement of each share class reflects the fees and expenses of each respective share class, net of any applicable fee and expense limitations or waivers. Please refer to the Fund's prospectuses for further details concerning historical performance.
Ranking is for the share class shown only; other classes may have different performance characteristics. When an expense waiver is in effect, it may have a material effect on the total return, and therefore the ranking for the period.
© 2017 Morningstar, Inc. All Rights Reserved.
There is no assurance that the investment process will consistently lead to successful investing.
See Notes to Schedule of Investments and Other Information for index definitions.
Index performance does not reflect the expenses of managing a portfolio as an index is unmanaged and not available for direct investment.
See “Useful Information About Your Fund Report.”
*The Fund’s inception date – February 29, 2000
(1) Closed to certain new investors.
6 | MARCH 31, 2017 |
Janus Contrarian Fund (unaudited)
Expense Examples
As a shareholder of the Fund, you incur two types of costs: (1) transaction costs, such as sales charges (loads) on purchase payments (applicable to Class A Shares only); and (2) ongoing costs, including management fees; 12b-1 distribution and shareholder servicing fees; transfer agent fees and expenses payable pursuant to the Transfer Agency Agreement; and other Fund expenses. This example is intended to help you understand your ongoing costs (in dollars) of investing in the Fund and to compare these costs with the ongoing costs of investing in other mutual funds. To do so, compare this 5% hypothetical example with the 5% hypothetical examples that appear in the shareholder reports of the other funds. The example is based upon an investment of $1,000 invested at the beginning of the period and held for the six-months indicated, unless noted otherwise in the table and footnotes below.
Actual Expenses
The information in the table under the heading “Actual” provides information about actual account values and actual expenses. You may use the information in these columns, together with the amount you invested, to estimate the expenses that you paid over the period. Simply divide your account value by $1,000 (for example, an $8,600 account value divided by $1,000 = 8.6), then multiply the result by the number in the appropriate column for your share class under the heading entitled “Expenses Paid During Period” to estimate the expenses you paid on your account during the period.
Hypothetical Example for Comparison Purposes
The information in the table under the heading “Hypothetical (5% return before expenses)” provides information about hypothetical account values and hypothetical expenses based upon the Fund’s actual expense ratio and an assumed rate of return of 5% per year before expenses, which is not the Fund’s actual return. The hypothetical account values and expenses may not be used to estimate the actual ending account balance or expenses you paid for the period. You may use this information to compare the ongoing costs of investing in the Fund and other funds. To do so, compare this 5% hypothetical example with the 5% hypothetical examples that appear in the shareholder reports of the other funds. Additionally, for an analysis of the fees associated with an investment in any share class or other similar funds, please visit www.finra.org/fundanalyzer.
Please note that the expenses shown in the table are meant to highlight your ongoing costs only and do not reflect any transaction costs. These fees are fully described in the Fund’s prospectuses. Therefore, the hypothetical examples are useful in comparing ongoing costs only, and will not help you determine the relative total costs of owning different funds. In addition, if these transaction costs were included, your costs would have been higher.
Actual | Hypothetical | |||||||||
| Beginning | Ending | Expenses |
| Beginning | Ending | Expenses | Net Annualized | ||
Class A Shares | $1,000.00 | $1,109.60 | $4.26 |
| $1,000.00 | $1,020.89 | $4.08 | 0.81% | ||
Class C Shares | $1,000.00 | $1,105.70 | $7.93 |
| $1,000.00 | $1,017.40 | $7.59 | 1.51% | ||
Class D Shares | $1,000.00 | $1,110.40 | $3.42 |
| $1,000.00 | $1,021.69 | $3.28 | 0.65% | ||
Class I Shares | $1,000.00 | $1,111.50 | $3.00 |
| $1,000.00 | $1,022.09 | $2.87 | 0.57% | ||
Class R Shares | $1,000.00 | $1,107.50 | $6.41 |
| $1,000.00 | $1,018.85 | $6.14 | 1.22% | ||
Class S Shares | $1,000.00 | $1,108.80 | $5.15 |
| $1,000.00 | $1,020.04 | $4.94 | 0.98% | ||
Class T Shares | $1,000.00 | $1,110.10 | $3.79 |
| $1,000.00 | $1,021.34 | $3.63 | 0.72% | ||
† | Expenses Paid During Period are equal to the Net Annualized Expense Ratio multiplied by the average account value over the period, multiplied by 182/365 (to reflect the one-half year period). Expenses in the examples include the effect of applicable fee waivers and/or expense reimbursements, if any. Had such waivers and/or reimbursements not been in effect, your expenses would have been higher. Please refer to the Notes to Financial Statements or the Fund’s prospectuses for more information regarding waivers and/or reimbursements. | |||||||||
Janus Investment Fund | 7 |
Janus Contrarian Fund
Schedule of Investments (unaudited)
March 31, 2017
Shares
or | Value | ||||||
Common Stocks – 78.4% | |||||||
Airlines – 6.0% | |||||||
United Continental Holdings Inc* | .2,424,494 | $171,266,256 | |||||
Banks – 5.4% | |||||||
Bank of America Corp | 2,373,429 | 55,989,190 | |||||
BB&T Corp | 878,123 | 39,252,098 | |||||
Wells Fargo & Co | 1,069,853 | 59,548,018 | |||||
154,789,306 | |||||||
Beverages – 1.0% | |||||||
Coca-Cola Co | 681,837 | 28,937,162 | |||||
Biotechnology – 0.5% | |||||||
HLS Therapeutics Inc*,£,§ | 1,935,741 | 13,356,613 | |||||
Building Products – 0.7% | |||||||
USG Corp* | 670,854 | 21,333,157 | |||||
Capital Markets – 1.9% | |||||||
Goldman Sachs Group Inc | 235,486 | 54,095,844 | |||||
Chemicals – 3.0% | |||||||
Air Products & Chemicals Inc | 418,718 | 56,648,358 | |||||
Platform Specialty Products Corp* | 2,227,770 | 29,005,565 | |||||
85,653,923 | |||||||
Containers & Packaging – 8.7% | |||||||
Ball Corp | 1,909,163 | 141,774,444 | |||||
Crown Holdings Inc* | 2,055,816 | 108,855,457 | |||||
250,629,901 | |||||||
Distributors – 0.2% | |||||||
LKQ Corp* | 186,982 | 5,472,963 | |||||
Diversified Consumer Services – 1.2% | |||||||
DeVry Education Group Inc | 949,102 | 33,645,666 | |||||
Electronic Equipment, Instruments & Components – 11.7% | |||||||
Knowles Corp*,£ | 10,358,797 | 196,299,203 | |||||
Zebra Technologies Corp* | 1,529,125 | 139,532,656 | |||||
335,831,859 | |||||||
Health Care Equipment & Supplies – 2.0% | |||||||
Abbott Laboratories | 1,326,782 | 58,922,389 | |||||
Health Care Providers & Services – 1.5% | |||||||
Envision Healthcare Corp* | 684,454 | 41,970,719 | |||||
Hotels, Restaurants & Leisure – 2.4% | |||||||
Wendy's Co | 5,175,783 | 70,442,407 | |||||
Independent Power and Renewable Electricity Producers – 0.2% | |||||||
Calpine Corp* | 649,628 | 7,178,389 | |||||
Internet & Direct Marketing Retail – 2.8% | |||||||
Lands' End Inc*,£ | 3,697,532 | 79,312,062 | |||||
Leisure Products – 5.1% | |||||||
Mattel Inc | 5,691,156 | 145,750,505 | |||||
Media – 3.0% | |||||||
News Corp | 6,553,742 | 85,198,646 | |||||
Oil, Gas & Consumable Fuels – 8.8% | |||||||
Anadarko Petroleum Corp† | 1,569,484 | 97,308,008 | |||||
Enterprise Products Partners LP | 5,659,739 | 156,265,394 | |||||
253,573,402 | |||||||
Personal Products – 1.5% | |||||||
Edgewell Personal Care Co* | 601,012 | 43,958,018 | |||||
Pharmaceuticals – 0.6% | |||||||
Indivior PLC* | 4,155,687 | 16,767,886 | |||||
Real Estate Management & Development – 6.5% | |||||||
Colony American Homes III§ | 1,377,158 | 1,420,483 | |||||
Howard Hughes Corp* | 291,505 | 34,178,961 | |||||
St Joe Co*,£ | 8,787,259 | 149,822,766 | |||||
185,422,210 | |||||||
Textiles, Apparel & Luxury Goods – 2.3% | |||||||
Cie Financiere Richemont SA | 749,298 | 59,261,436 | |||||
See Notes to Schedule of Investments and Other Information and Notes to Financial Statements. | |
8 | MARCH 31, 2017 |
Janus Contrarian Fund
Schedule of Investments (unaudited)
March 31, 2017
Shares
or | Value | ||||||
Common Stocks – (continued) | |||||||
Textiles, Apparel & Luxury Goods – (continued) | |||||||
Ralph Lauren Corp | .93,808 | $7,656,609 | |||||
66,918,045 | |||||||
Trading Companies & Distributors – 1.4% | |||||||
Veritiv Corp* | 752,698 | 38,989,756 | |||||
Total Common Stocks (cost $2,091,429,149) | 2,249,417,084 | ||||||
Investment Companies – 21.3% | |||||||
Money Markets – 21.3% | |||||||
Janus Cash Liquidity Fund LLC, 0.7113%ºº,£ (cost $612,158,877) | 612,158,877 | 612,158,877 | |||||
OTC Purchased Options – Puts – 0.3% | |||||||
Counterparty/Reference Asset | |||||||
Goldman Sachs International: | |||||||
iShares Russell 2000 Index Fund (ETF), | |||||||
exercise price $135.00, expires June 2017* | 10,826 | 3,147,728 | |||||
Morgan Stanley & Co.: | |||||||
iShares Russell 2000 Index Fund (ETF), | |||||||
exercise price $134.00, expires June 2017* | 21,842 | 5,714,549 | |||||
Total OTC Purchased Options – Puts (premiums paid $13,086,241) | 8,862,277 | ||||||
Total Investments (total cost $2,716,674,267) – 100.0% | 2,870,438,238 | ||||||
Liabilities, net of Cash, Receivables and Other Assets – (0.0)% | (939,997) | ||||||
Net Assets – 100% | $2,869,498,241 | ||||||
Summary of Investments by Country - (Long Positions) (unaudited) | |||||
% of | |||||
Investment | |||||
Country | Value | Securities | |||
United States | $2,794,408,916 | 97.3 | % | ||
Switzerland | 59,261,436 | 2.1 | |||
United Kingdom | 16,767,886 | 0.6 | |||
Total | $2,870,438,238 | 100.0 | % |
Schedule of Foreign Currency Contracts, Open |
Counterparty/ Currency | Settlement Date | Currency Units Sold | Currency Value | Unrealized Appreciation/ (Depreciation) | ||||
HSBC Securities (USA), Inc.: | ||||||||
British Pound | 4/20/17 | 3,951,000 | $ | 4,951,341 | $ | (62,537) | ||
See Notes to Schedule of Investments and Other Information and Notes to Financial Statements. | |
Janus Investment Fund | 9 |
Janus Contrarian Fund
Notes to Schedule of Investments and Other Information (unaudited)
S&P 500® Index | S&P 500® Index reflects U.S. large-cap equity performance and represents broad U.S. equity market performance. |
ETF | Exchange-Traded Fund |
LLC | Limited Liability Company |
LP | Limited Partnership |
OTC | Over-the-Counter |
PLC | Public Limited Company |
* | Non-income producing security. |
† | A portion of this security has been segregated to cover margin or segregation requirements on open futures contracts, forward currency contracts, options contracts, short sales, swap agreements, and/or securities with extended settlement dates, the value of which, as of March 31, 2017, is $21,700,000. |
ºº | Rate shown is the 7-day yield as of March 31, 2017. |
£ | The Fund may invest in certain securities that are considered affiliated companies. As defined by the Investment Company Act of 1940, as amended, an affiliated company is one in which the Fund owns 5% or more of the outstanding voting securities, or a company which is under common ownership or control. The following securities were considered affiliated companies for all or some portion of the period ended March 31, 2017. Unless otherwise indicated, all information in the table is for the period ended March 31, 2017. |
Share | Share | |||||||||||||||||||||||||||||||||
Balance | Balance | Realized | Dividend | Value | ||||||||||||||||||||||||||||||
at 9/30/16 | Purchases | Sales | at 3/31/17 | Gain/(Loss) | Income | at 3/31/17 | ||||||||||||||||||||||||||||
HLS Therapeutics Inc | ||||||||||||||||||||||||||||||||||
1,935,741 | — | — | 1,935,741 | $— | $— | $13,356,613 | ||||||||||||||||||||||||||||
Janus Cash Collateral Fund LLC | ||||||||||||||||||||||||||||||||||
88,819,420 | 428,078,514 | (516,897,934) | — | — | 2,344,899(1) | — | ||||||||||||||||||||||||||||
Janus Cash Liquidity Fund LLC | ||||||||||||||||||||||||||||||||||
375,198,142 | 1,142,992,616 | (906,031,881) | 612,158,877 | — | 446,334 | 612,158,877 | ||||||||||||||||||||||||||||
Knowles Corp | ||||||||||||||||||||||||||||||||||
10,358,010 | 96,391 | (95,604) | 10,358,797 | (1,294,573) | — | 196,299,203 | ||||||||||||||||||||||||||||
Lands' End Inc | ||||||||||||||||||||||||||||||||||
3,697,532 | — | — | 3,697,532 | — | — | 79,312,062 | ||||||||||||||||||||||||||||
Popeyes Louisiana Kitchen Inc | ||||||||||||||||||||||||||||||||||
1,225,019 | 167,877 | (1,392,896)(2) | — | 35,915,576 | — | — | ||||||||||||||||||||||||||||
St Joe Co | ||||||||||||||||||||||||||||||||||
10,451,593 | — | (1,664,334)(2) | 8,787,259 | (54,311,152) | — | 149,822,766 | ||||||||||||||||||||||||||||
Total | $(19,690,149) | $2,791,233 | $1,050,949,521 | |||||||||||||||||||||||||||||||
(1) | Net of income paid to the securities lending agent and rebates paid to the borrowing counterparties. | |||||||||||||||||||||||||||||||||
(2) | All or a portion is the result of a corporate action. | |||||||||||||||||||||||||||||||||
§ | Schedule of Restricted and Illiquid Securities (as of March 31, 2017) | |||||||||
Value as a | ||||||||||
Acquisition | % of Net | |||||||||
Date | Cost | Value | Assets | |||||||
Colony American Homes III | 1/30/13 | $ | 1,728,531 | $ | 1,420,483 | 0.0 | % | |||
HLS Therapeutics Inc | 7/2/15 | 17,597,650 | 13,356,613 | 0.5 | ||||||
Total | $ | 19,326,181 | $ | 14,777,096 | 0.5 | % | ||||
The Fund has registration rights for certain restricted securities held as of March 31, 2017. The issuer incurs all registration costs. | ||||||||||
10 | MARCH 31, 2017 |
Janus Contrarian Fund
Notes to Schedule of Investments and Other Information (unaudited)
The following is a summary of the inputs that were used to value the Fund’s investments in securities and other financial instruments as of March 31, 2017. See Notes to Financial Statements for more information. | |||||||||||||
Valuation Inputs Summary | |||||||||||||
Level 2 - | Level 3 - | ||||||||||||
Level 1 - | Other Significant | Significant | |||||||||||
Quotes Prices | Observable Inputs | Unobservable Inputs | |||||||||||
Assets | |||||||||||||
Investments in Securities: | |||||||||||||
Common Stocks | |||||||||||||
Biotechnology | $ | - | $ | - | $ | 13,356,613 | |||||||
Real Estate Management & Development | 184,001,727 | - | 1,420,483 | ||||||||||
All Other | 2,050,638,261 | - | - | ||||||||||
Investment Companies | - | 612,158,877 | - | ||||||||||
OTC Purchased Options – Puts | - | 8,862,277 | - | ||||||||||
Total Assets | $ | 2,234,639,988 | $ | 621,021,154 | $ | 14,777,096 | |||||||
Liabilities | |||||||||||||
Other Financial Instruments(a): | |||||||||||||
Forward Currency Contracts | $ | - | $ | 62,537 | $ | - | |||||||
(a) | Other financial instruments include forward currency, futures, written options, written swaptions, and swap contracts. Forward currency contracts are reported at their unrealized appreciation/(depreciation) at measurement date, which represents the change in the contract's value from trade date. Futures, certain written options on futures, and centrally cleared swap contracts are reported at their variation margin at measurement date, which represents the amount due to/from the Fund at that date. Written options, written swaptions, and other swap contracts are reported at their market value at measurement date. | ||||||||||||
Janus Investment Fund | 11 |
Janus Contrarian Fund
Statement of Assets and Liabilities (unaudited)
March 31, 2017
|
|
|
|
|
|
|
Assets: | ||||||
Investments, at cost | $ | 2,716,674,267 | ||||
Unaffiliated investments, at value | 1,819,488,717 | |||||
Affiliated investments, at value | 1,050,949,521 | |||||
Closed foreign currency contracts | 179,536 | |||||
Non-interested Trustees' deferred compensation | 54,198 | |||||
Receivables: | ||||||
Investments sold | 16,644,580 | |||||
Dividends | 1,677,639 | |||||
Fund shares sold | 466,768 | |||||
Foreign tax reclaims | 224,131 | |||||
Dividends from affiliates | 210,399 | |||||
Other assets | 23,277 | |||||
Total Assets |
|
| 2,889,918,766 |
| ||
Liabilities: | ||||||
Due to custodian | 1,059 | |||||
Forward currency contracts | 62,537 | |||||
Closed foreign currency contracts | 7,394 | |||||
Payables: | — | |||||
Investments purchased | 16,951,151 | |||||
Fund shares repurchased | 1,322,001 | |||||
Advisory fees | 1,219,326 | |||||
Transfer agent fees and expenses | 481,781 | |||||
Non-interested Trustees' deferred compensation fees | 54,198 | |||||
12b-1 Distribution and shareholder servicing fees | 39,848 | |||||
Professional fees | 27,988 | |||||
Fund administration fees | 24,701 | |||||
Non-interested Trustees' fees and expenses | 20,907 | |||||
Custodian fees | 2,768 | |||||
Accrued expenses and other payables | 204,866 | |||||
Total Liabilities |
|
| 20,420,525 |
| ||
Net Assets |
| $ | 2,869,498,241 |
| ||
See Notes to Financial Statements. | |
12 | MARCH 31, 2017 |
Janus Contrarian Fund
Statement of Assets and Liabilities (unaudited)
March 31, 2017
|
|
|
|
|
|
|
Net Assets Consist of: | ||||||
Capital (par value and paid-in surplus) | $ | 2,522,701,515 | ||||
Undistributed net investment income/(loss) | (9,865,438) | |||||
Undistributed net realized gain/(loss) from investments and foreign currency transactions | 202,950,566 | |||||
Unrealized net appreciation/(depreciation) of investments, foreign currency translations and non-interested Trustees’ deferred compensation | 153,711,598 | |||||
Total Net Assets |
| $ | 2,869,498,241 |
| ||
Net Assets - Class A Shares | $ | 23,050,882 | ||||
Shares Outstanding, $0.01 Par Value (unlimited shares authorized) | 1,160,283 | |||||
Net Asset Value Per Share(1) |
| $ | 19.87 |
| ||
Maximum Offering Price Per Share(2) |
| $ | 21.08 |
| ||
Net Assets - Class C Shares | $ | 36,038,914 | ||||
Shares Outstanding, $0.01 Par Value (unlimited shares authorized) | 1,915,118 | |||||
Net Asset Value Per Share(1) |
| $ | 18.82 |
| ||
Net Assets - Class D Shares | $ | 1,923,027,513 | ||||
Shares Outstanding, $0.01 Par Value (unlimited shares authorized) | 96,619,361 | |||||
Net Asset Value Per Share |
| $ | 19.90 |
| ||
Net Assets - Class I Shares | $ | 125,973,375 | ||||
Shares Outstanding, $0.01 Par Value (unlimited shares authorized) | 6,325,407 | |||||
Net Asset Value Per Share |
| $ | 19.92 |
| ||
Net Assets - Class R Shares | $ | 953,145 | ||||
Shares Outstanding, $0.01 Par Value (unlimited shares authorized) | 48,975 | |||||
Net Asset Value Per Share |
| $ | 19.46 |
| ||
Net Assets - Class S Shares | $ | 3,906,945 | ||||
Shares Outstanding, $0.01 Par Value (unlimited shares authorized) | 196,759 | |||||
Net Asset Value Per Share |
| $ | 19.86 |
| ||
Net Assets - Class T Shares | $ | 756,547,467 | ||||
Shares Outstanding, $0.01 Par Value (unlimited shares authorized) | 38,027,951 | |||||
Net Asset Value Per Share |
| $ | 19.89 |
| ||
(1) Redemption price per share may be reduced for any applicable contingent deferred sales charge. (2) Maximum offering price is computed at 100/94.25 of net asset value. |
See Notes to Financial Statements. | |
Janus Investment Fund | 13 |
Janus Contrarian Fund
Statement of Operations (unaudited)
For the period ended March 31, 2017
|
|
|
|
|
|
Investment Income: | |||||
| Dividends | $ | 8,459,692 | ||
Affiliated securities lending income, net | 2,344,899 | ||||
Dividends from affiliates | 446,334 | ||||
Other income | 11 | ||||
Foreign tax withheld | (547,925) | ||||
Total Investment Income |
| 10,703,011 |
| ||
Expenses: | |||||
Advisory fees | 6,441,251 | ||||
12b-1Distribution and shareholder servicing fees: | |||||
Class A Shares | 50,369 | ||||
Class C Shares | 179,574 | ||||
Class R Shares | 2,524 | ||||
Class S Shares | 4,797 | ||||
Transfer agent administrative fees and expenses: | |||||
Class D Shares | 1,142,257 | ||||
Class R Shares | 1,318 | ||||
Class S Shares | 4,909 | ||||
Class T Shares | 957,856 | ||||
Transfer agent networking and omnibus fees: | |||||
Class A Shares | 17,133 | ||||
Class C Shares | 22,515 | ||||
Class I Shares | 38,391 | ||||
Other transfer agent fees and expenses: | |||||
Class A Shares | 2,567 | ||||
Class C Shares | 2,741 | ||||
Class D Shares | 216,003 | ||||
Class I Shares | 2,309 | ||||
Class R Shares | 35 | ||||
Class S Shares | 35 | ||||
Class T Shares | 4,661 | ||||
Shareholder reports expense | 262,070 | ||||
Fund administration fees | 135,740 | ||||
Registration fees | 75,517 | ||||
Professional fees | 47,045 | ||||
Non-interested Trustees’ fees and expenses | 45,047 | ||||
Custodian fees | 13,086 | ||||
Other expenses | 107,273 | ||||
Total Expenses |
| 9,777,023 |
| ||
Less: Excess Expense Reimbursement |
| (51,144) |
| ||
Net Expenses |
| 9,725,879 |
| ||
Net Investment Income/(Loss) |
| 977,132 |
| ||
Net Realized Gain/(Loss) on Investments: | |||||
Investments and foreign currency transactions | 279,160,242 | ||||
Investments in affiliates | (19,690,149) | ||||
Futures contracts | (19,840,072) | ||||
Total Net Realized Gain/(Loss) on Investments |
| 239,630,021 |
| ||
Change in Unrealized Net Appreciation/Depreciation: | |||||
Investments, foreign currency translations and non-interested Trustees’ deferred compensation | 56,633,601 | ||||
Futures contracts | 986,100 | ||||
Total Change in Unrealized Net Appreciation/Depreciation |
| 57,619,701 |
| ||
Net Increase/(Decrease) in Net Assets Resulting from Operations | $ | 298,226,854 |
| ||
See Notes to Financial Statements. | |
14 | MARCH 31, 2017 |
Janus Contrarian Fund
Statements of Changes in Net Assets
|
|
| Period
ended |
| Year ended | |||
Operations: | ||||||||
Net investment income/(loss) | $ | 977,132 | $ | 15,312,414 | ||||
Net realized gain/(loss) on investments | 239,630,021 | 82,098,750 | ||||||
Change in unrealized net appreciation/depreciation | 57,619,701 | (25,147,728) | ||||||
Net Increase/(Decrease) in Net Assets Resulting from Operations |
| 298,226,854 |
|
| 72,263,436 | |||
Dividends and Distributions to Shareholders: | ||||||||
Dividends from Net Investment Income | ||||||||
Class A Shares | (9,471) | (135,948) | ||||||
Class D Shares | (6,330,300) | (8,325,547) | ||||||
Class I Shares | (370,634) | (767,878) | ||||||
Class T Shares | (1,938,754) | (2,837,464) | ||||||
| Total Dividends from Net Investment Income |
| (8,649,159) |
|
| (12,066,837) | ||
Distributions from Net Realized Gain from Investment Transactions | ||||||||
Class A Shares | (1,591,772) | (2,291,347) | ||||||
Class C Shares | (1,431,912) | (1,885,957) | ||||||
Class D Shares | (65,676,530) | (52,530,515) | ||||||
Class I Shares | (3,259,157) | (4,649,765) | ||||||
Class R Shares | (37,789) | (38,252) | ||||||
Class S Shares | (134,790) | (119,374) | ||||||
Class T Shares | (26,523,128) | (23,781,495) | ||||||
| Total Distributions from Net Realized Gain from Investment Transactions | (98,655,078) |
|
| (85,296,705) | |||
Net Decrease from Dividends and Distributions to Shareholders |
| (107,304,237) |
|
| (97,363,542) | |||
Capital Share Transactions: | ||||||||
Class A Shares | (34,188,039) | (47,224,632) | ||||||
Class C Shares | (13,618,627) | (28,846,732) | ||||||
Class D Shares | (33,839,162) | (135,589,987) | ||||||
Class I Shares | 25,708,607 | (151,747,175) | ||||||
Class R Shares | (177,009) | (507,688) | ||||||
Class S Shares | (402,494) | (496,280) | ||||||
Class T Shares | (49,575,062) | (177,826,683) | ||||||
Net Increase/(Decrease) from Capital Share Transactions |
| (106,091,786) |
|
| (542,239,177) | |||
Net Increase/(Decrease) in Net Assets |
| 84,830,831 |
|
| (567,339,283) | |||
Net Assets: | ||||||||
Beginning of period | 2,784,667,410 | 3,352,006,693 | ||||||
| End of period | $ | 2,869,498,241 |
| $ | 2,784,667,410 | ||
Undistributed Net Investment Income/(Loss) | $ | (9,865,438) |
| $ | (2,193,411) | |||
See Notes to Financial Statements. | |
Janus Investment Fund | 15 |
Janus Contrarian Fund
Financial Highlights
Class A Shares | |||||||||||||||||||||
For a share outstanding during the period ended March 31, 2017 (unaudited) and each year ended September 30 | 2017 |
|
| 2016 |
|
| 2015 |
|
| 2014 |
|
| 2013 |
|
| 2012 | |||||
Net Asset Value, Beginning of Period |
| $18.53 |
|
| $18.56 |
|
| $23.11 |
|
| $18.48 |
|
| $13.91 |
|
| $11.29 |
| |||
Income/(Loss) from Investment Operations: | |||||||||||||||||||||
Net investment income/(loss) | (0.01)(1) | 0.07(1) | 0.05(1) | 0.02(1) | 0.01 | 0.04 | |||||||||||||||
Net realized and unrealized gain/(loss) | 2.03 | 0.43 | (2.26) | 4.61 | 4.65 | 2.58 | |||||||||||||||
Total from Investment Operations |
| 2.02 |
|
| 0.50 |
|
| (2.21) |
|
| 4.63 |
|
| 4.66 |
|
| 2.62 |
| |||
Less Dividends and Distributions: | |||||||||||||||||||||
Dividends (from net investment income) | —(2) | (0.03) | (0.06) | —(2) | (0.09) | — | |||||||||||||||
Distributions (from capital gains) | (0.68) | (0.50) | (2.28) | — | — | — | |||||||||||||||
Total Dividends and Distributions |
| (0.68) |
|
| (0.53) |
|
| (2.34) |
|
| — |
|
| (0.09) |
|
| — |
| |||
Net Asset Value, End of Period | $19.87 | $18.53 | $18.56 | $23.11 | $18.48 | $13.91 | |||||||||||||||
Total Return* |
| 10.96% |
|
| 2.77% |
|
| (10.76)% |
|
| 25.08% |
|
| 33.67% |
|
| 23.21% |
| |||
Net Assets, End of Period (in thousands) | $23,051 | $53,928 | $102,425 | $75,649 | $25,397 | $23,930 | |||||||||||||||
Average Net Assets for the Period (in thousands) | $41,832 | $73,939 | $114,845 | $46,300 | $24,023 | $28,841 | |||||||||||||||
Ratios to Average Net Assets**: |
|
|
|
|
|
|
|
|
|
|
|
|
|
|
|
|
|
| |||
Ratio of Gross Expenses | 0.81% | 0.90% | 1.13% | 1.02% | 0.85% | 0.91% | |||||||||||||||
Ratio of Net Expenses (After Waivers and Expense Offsets) | 0.81% | 0.90% | 1.13% | 1.02% | 0.85% | 0.91% | |||||||||||||||
Ratio of Net Investment Income/(Loss) | (0.07)% | 0.37% | 0.21% | 0.10% | 0.22% | 0.50% | |||||||||||||||
Portfolio Turnover Rate | 36% | 51% | 70% | 61% | 66% | 53% | |||||||||||||||
1 | |||||||||||||||||||||
Class C Shares | |||||||||||||||||||||
For a share outstanding during the period ended March 31, 2017 (unaudited) and each year ended September 30 | 2017 |
|
| 2016 |
|
| 2015 |
|
| 2014 |
|
| 2013 |
|
| 2012 |
| ||||
Net Asset Value, Beginning of Period |
| $17.64 |
|
| $17.79 |
|
| $22.34 |
|
| $18.01 |
|
| $13.59 |
|
| $11.12 |
| |||
Income/(Loss) from Investment Operations: | |||||||||||||||||||||
Net investment income/(loss) | (0.07)(1) | (0.06)(1) | (0.11)(1) | (0.15)(1) | (0.28) | (0.36) | |||||||||||||||
Net realized and unrealized gain/(loss) | 1.93 | 0.41 | (2.16) | 4.48 | 4.70 | 2.83 | |||||||||||||||
Total from Investment Operations |
| 1.86 |
|
| 0.35 |
|
| (2.27) |
|
| 4.33 |
|
| 4.42 |
|
| 2.47 |
| |||
Less Dividends and Distributions: | |||||||||||||||||||||
Dividends (from net investment income) | — | — | — | — | — | — | |||||||||||||||
Distributions (from capital gains) | (0.68) | (0.50) | (2.28) | — | — | — | |||||||||||||||
Total Dividends and Distributions |
| (0.68) |
|
| (0.50) |
|
| (2.28) |
|
| — |
|
| — |
|
| — |
| |||
Net Asset Value, End of Period | $18.82 | $17.64 | $17.79 | $22.34 | $18.01 | $13.59 | |||||||||||||||
Total Return* |
| 10.57% |
|
| 2.02% |
|
| (11.44)% |
|
| 24.04% |
|
| 32.52% |
|
| 22.21% |
| |||
Net Assets, End of Period (in thousands) | $36,039 | $47,112 | $77,497 | $56,098 | $21,162 | $19,148 | |||||||||||||||
Average Net Assets for the Period (in thousands) | $39,851 | $58,609 | $86,160 | $34,189 | $20,204 | $22,509 | |||||||||||||||
Ratios to Average Net Assets**: |
|
|
|
|
|
|
|
|
|
|
|
|
|
|
|
|
|
| |||
Ratio of Gross Expenses | 1.51% | 1.62% | 1.89% | 1.80% | 1.70% | 1.75% | |||||||||||||||
Ratio of Net Expenses (After Waivers and Expense Offsets) | 1.51% | 1.62% | 1.89% | 1.80% | 1.70% | 1.70% | |||||||||||||||
Ratio of Net Investment Income/(Loss) | (0.77)% | (0.36)% | (0.54)% | (0.69)% | (0.62)% | (0.29)% | |||||||||||||||
Portfolio Turnover Rate | 36% | 51% | 70% | 61% | 66% | 53% | |||||||||||||||
* Total return not annualized for periods of less than one full year. ** Annualized for periods of less than one full year. (1) Per share amounts are calculated based on average shares outstanding during the year or period. (2) Less than $0.005 on a per share basis. |
See Notes to Financial Statements. | |
16 | MARCH 31, 2017 |
Janus Contrarian Fund
Financial Highlights
Class D Shares | |||||||||||||||||||||
For a share outstanding during the period ended March 31, 2017 (unaudited) and each year ended September 30 | 2017 |
|
| 2016 |
|
| 2015 |
|
| 2014 |
|
| 2013 |
|
| 2012 | |||||
Net Asset Value, Beginning of Period |
| $18.60 |
|
| $18.64 |
|
| $23.18 |
|
| $18.53 |
|
| $13.98 |
|
| $11.32 |
| |||
Income/(Loss) from Investment Operations: | |||||||||||||||||||||
Net investment income/(loss) | 0.01(1) | 0.10(1) | 0.08(1) | 0.05(1) | 0.07 | 0.12 | |||||||||||||||
Net realized and unrealized gain/(loss) | 2.04 | 0.44 | (2.27) | 4.64 | 4.63 | 2.54 | |||||||||||||||
Total from Investment Operations |
| 2.05 |
|
| 0.54 |
|
| (2.19) |
|
| 4.69 |
|
| 4.70 |
|
| 2.66 |
| |||
Less Dividends and Distributions: | |||||||||||||||||||||
Dividends (from net investment income) | (0.07) | (0.08) | (0.07) | (0.04) | (0.15) | —(2) | |||||||||||||||
Distributions (from capital gains) | (0.68) | (0.50) | (2.28) | — | — | — | |||||||||||||||
Total Dividends and Distributions |
| (0.75) |
|
| (0.58) |
|
| (2.35) |
|
| (0.04) |
|
| (0.15) |
|
| — |
| |||
Net Asset Value, End of Period | $19.90 | $18.60 | $18.64 | $23.18 | $18.53 | $13.98 | |||||||||||||||
Total Return* |
| 11.04% |
|
| 2.98% |
|
| (10.63)% |
|
| 25.33% |
|
| 33.88% |
|
| 23.51% |
| |||
Net Assets, End of Period (in thousands) | $1,923,028 | $1,830,310 | $1,976,590 | $2,382,592 | $1,977,490 | $1,599,671 | |||||||||||||||
Average Net Assets for the Period (in thousands) | $1,907,889 | $1,856,945 | $2,354,562 | $2,258,453 | $1,813,911 | $1,613,932 | |||||||||||||||
Ratios to Average Net Assets**: |
|
|
|
|
|
|
|
|
|
|
|
|
|
|
|
|
|
| |||
Ratio of Gross Expenses | 0.65% | 0.70% | 0.95% | 0.80% | 0.68% | 0.66% | |||||||||||||||
Ratio of Net Expenses (After Waivers and Expense Offsets) | 0.65% | 0.70% | 0.95% | 0.80% | 0.68% | 0.66% | |||||||||||||||
Ratio of Net Investment Income/(Loss) | 0.10% | 0.56% | 0.35% | 0.24% | 0.41% | 0.75% | |||||||||||||||
Portfolio Turnover Rate | 36% | 51% | 70% | 61% | 66% | 53% | |||||||||||||||
Class I Shares | |||||||||||||||||||||
For a share outstanding during the period ended March 31, 2017 (unaudited) and each year ended September 30 | 2017 |
|
| 2016 |
|
| 2015 |
|
| 2014 |
|
| 2013 |
|
| 2012 |
| ||||
Net Asset Value, Beginning of Period |
| $18.61 |
|
| $18.64 |
|
| $23.20 |
|
| $18.55 |
|
| $13.98 |
|
| $11.33 |
| |||
Income/(Loss) from Investment Operations: | |||||||||||||||||||||
Net investment income/(loss) | 0.02(1) | 0.11(1) | 0.10(1) | 0.09(1) | 0.11 | 0.12 | |||||||||||||||
Net realized and unrealized gain/(loss) | 2.05 | 0.44 | (2.28) | 4.63 | 4.62 | 2.53 | |||||||||||||||
Total from Investment Operations |
| 2.07 |
|
| 0.55 |
|
| (2.18) |
|
| 4.72 |
|
| 4.73 |
|
| 2.65 |
| |||
Less Dividends and Distributions: | |||||||||||||||||||||
Dividends (from net investment income) | (0.08) | (0.08) | (0.10) | (0.07) | (0.16) | —(2) | |||||||||||||||
Distributions (from capital gains) | (0.68) | (0.50) | (2.28) | — | — | — | |||||||||||||||
Total Dividends and Distributions |
| (0.76) |
|
| (0.58) |
|
| (2.38) |
|
| (0.07) |
|
| (0.16) |
|
| — |
| |||
Net Asset Value, End of Period | $19.92 | $18.61 | $18.64 | $23.20 | $18.55 | $13.98 | |||||||||||||||
Total Return* |
| 11.15% |
|
| 3.05% |
|
| (10.60)% |
|
| 25.47% |
|
| 34.09% |
|
| 23.39% |
| |||
Net Assets, End of Period (in thousands) | $125,973 | $93,875 | $248,586 | $329,245 | $85,000 | $44,907 | |||||||||||||||
Average Net Assets for the Period (in thousands) | $101,564 | $144,380 | $382,723 | $184,931 | $69,116 | $51,304 | |||||||||||||||
Ratios to Average Net Assets**: |
|
|
|
|
|
|
|
|
|
|
|
|
|
|
|
|
|
| |||
Ratio of Gross Expenses | 0.57% | 0.63% | 0.86% | 0.74% | 0.52% | 0.62% | |||||||||||||||
Ratio of Net Expenses (After Waivers and Expense Offsets) | 0.57% | 0.63% | 0.86% | 0.74% | 0.52% | 0.62% | |||||||||||||||
Ratio of Net Investment Income/(Loss) | 0.18% | 0.61% | 0.44% | 0.40% | 0.59% | 0.80% | |||||||||||||||
Portfolio Turnover Rate | 36% | 51% | 70% | 61% | 66% | 53% | |||||||||||||||
* Total return not annualized for periods of less than one full year. ** Annualized for periods of less than one full year. (1) Per share amounts are calculated based on average shares outstanding during the year or period. (2) Less than $0.005 on a per share basis. |
See Notes to Financial Statements. | |
Janus Investment Fund | 17 |
Janus Contrarian Fund
Financial Highlights
Class R Shares | |||||||||||||||||||||
For a share outstanding during the period ended March 31, 2017 (unaudited) and each year ended September 30 | 2017 |
|
| 2016 |
|
| 2015 |
|
| 2014 |
|
| 2013 |
|
| 2012 | |||||
Net Asset Value, Beginning of Period |
| $18.19 |
|
| $18.27 |
|
| $22.81 |
|
| $18.31 |
|
| $13.76 |
|
| $11.21 |
| |||
Income/(Loss) from Investment Operations: | |||||||||||||||||||||
Net investment income/(loss) | (0.05)(1) | —(1)(2) | (0.05)(1) | (0.07)(1) | (0.16) | (0.07) | |||||||||||||||
Net realized and unrealized gain/(loss) | 2.00 | 0.42 | (2.21) | 4.57 | 4.72 | 2.62 | |||||||||||||||
Total from Investment Operations |
| 1.95 |
|
| 0.42 |
|
| (2.26) |
|
| 4.50 |
|
| 4.56 |
|
| 2.55 |
| |||
Less Dividends and Distributions: | |||||||||||||||||||||
Dividends (from net investment income) | — | — | — | — | (0.01) | — | |||||||||||||||
Distributions (from capital gains) | (0.68) | (0.50) | (2.28) | — | — | — | |||||||||||||||
Total Dividends and Distributions |
| (0.68) |
|
| (0.50) |
|
| (2.28) |
|
| — |
|
| (0.01) |
|
| — |
| |||
Net Asset Value, End of Period | $19.46 | $18.19 | $18.27 | $22.81 | $18.31 | $13.76 | |||||||||||||||
Total Return* |
| 10.75% |
|
| 2.36% |
|
| (11.13)% |
|
| 24.58% |
|
| 33.12% |
|
| 22.75% |
| |||
Net Assets, End of Period (in thousands) | $953 | $1,058 | $1,592 | $1,994 | $1,634 | $1,877 | |||||||||||||||
Average Net Assets for the Period (in thousands) | $1,058 | $1,191 | $2,031 | $1,910 | $1,715 | $2,053 | |||||||||||||||
Ratios to Average Net Assets**: |
|
|
|
|
|
|
|
|
|
|
|
|
|
|
|
|
|
| |||
Ratio of Gross Expenses | 1.22% | 1.27% | 1.54% | 1.38% | 1.25% | 1.24% | |||||||||||||||
Ratio of Net Expenses (After Waivers and Expense Offsets) | 1.22% | 1.27% | 1.54% | 1.38% | 1.25% | 1.24% | |||||||||||||||
Ratio of Net Investment Income/(Loss) | (0.50)% | —(3) | (0.23)% | (0.35)% | (0.18)% | 0.15% | |||||||||||||||
Portfolio Turnover Rate | 36% | 51% | 70% | 61% | 66% | 53% | |||||||||||||||
Class S Shares | |||||||||||||||||||||
For a share outstanding during the period ended March 31, 2017 (unaudited) and each year ended September 30 | 2017 |
|
| 2016 |
|
| 2015 |
|
| 2014 |
|
| 2013 |
|
| 2012 |
| ||||
Net Asset Value, Beginning of Period |
| $18.53 |
|
| $18.55 |
|
| $23.09 |
|
| $18.48 |
|
| $13.87 |
|
| $11.27 |
| |||
Income/(Loss) from Investment Operations: | |||||||||||||||||||||
Net investment income/(loss) | (0.02)(1) | 0.04(1) | —(1)(2) | (0.01)(1) | (0.05) | 0.04 | |||||||||||||||
Net realized and unrealized gain/(loss) | 2.03 | 0.44 | (2.25) | 4.62 | 4.69 | 2.56 | |||||||||||||||
Total from Investment Operations |
| 2.01 |
|
| 0.48 |
|
| (2.25) |
|
| 4.61 |
|
| 4.64 |
|
| 2.60 |
| |||
Less Dividends and Distributions: | |||||||||||||||||||||
Dividends (from net investment income) | — | — | (0.01) | — | (0.03) | — | |||||||||||||||
Distributions (from capital gains) | (0.68) | (0.50) | (2.28) | — | — | — | |||||||||||||||
Total Dividends and Distributions |
| (0.68) |
|
| (0.50) |
|
| (2.29) |
|
| — |
|
| (0.03) |
|
| — |
| |||
Net Asset Value, End of Period | $19.86 | $18.53 | $18.55 | $23.09 | $18.48 | $13.87 | |||||||||||||||
Total Return* |
| 10.88% |
|
| 2.65% |
|
| (10.92)% |
|
| 24.95% |
|
| 33.50% |
|
| 23.07% |
| |||
Net Assets, End of Period (in thousands) | $3,907 | $4,052 | $4,578 | $6,346 | $2,022 | $2,598 | |||||||||||||||
Average Net Assets for the Period (in thousands) | $3,940 | $4,208 | $6,905 | $5,130 | $1,850 | $2,688 | |||||||||||||||
Ratios to Average Net Assets**: |
|
|
|
|
|
|
|
|
|
|
|
|
|
|
|
|
|
| |||
Ratio of Gross Expenses | 0.98% | 1.04% | 1.29% | 1.16% | 1.00% | 1.00% | |||||||||||||||
Ratio of Net Expenses (After Waivers and Expense Offsets) | 0.98% | 1.03% | 1.28% | 1.15% | 0.99% | 0.99% | |||||||||||||||
Ratio of Net Investment Income/(Loss) | (0.24)% | 0.22% | 0.01% | (0.05)% | 0.07% | 0.42% | |||||||||||||||
Portfolio Turnover Rate | 36% | 51% | 70% | 61% | 66% | 53% | |||||||||||||||
* Total return not annualized for periods of less than one full year. ** Annualized for periods of less than one full year. (1) Per share amounts are calculated based on average shares outstanding during the year or period. (2) Less than $0.005 on a per share basis. (3) Less than 0.005%. |
See Notes to Financial Statements. | |
18 | MARCH 31, 2017 |
Janus Contrarian Fund
Financial Highlights
Class T Shares | |||||||||||||||||||||
For a share outstanding during the period ended March 31, 2017 (unaudited) and each year ended September 30 | 2017 |
|
| 2016 |
|
| 2015 |
|
| 2014 |
|
| 2013 |
|
| 2012 | |||||
Net Asset Value, Beginning of Period |
| $18.58 |
|
| $18.62 |
|
| $23.15 |
|
| $18.51 |
|
| $13.96 |
|
| $11.31 |
| |||
Income/(Loss) from Investment Operations: | |||||||||||||||||||||
Net investment income/(loss) | —(1)(2) | 0.09(1) | 0.06(1) | 0.03(1) | 0.05 | 0.09 | |||||||||||||||
Net realized and unrealized gain/(loss) | 2.04 | 0.43 | (2.26) | 4.64 | 4.63 | 2.56 | |||||||||||||||
Total from Investment Operations |
| 2.04 |
|
| 0.52 |
|
| (2.20) |
|
| 4.67 |
|
| 4.68 |
|
| 2.65 |
| |||
Less Dividends and Distributions: | |||||||||||||||||||||
Dividends (from net investment income) | (0.05) | (0.06) | (0.05) | (0.03) | (0.13) | — | |||||||||||||||
Distributions (from capital gains) | (0.68) | (0.50) | (2.28) | — | — | — | |||||||||||||||
Total Dividends and Distributions |
| (0.73) |
|
| (0.56) |
|
| (2.33) |
|
| (0.03) |
|
| (0.13) |
|
| — |
| |||
Net Asset Value, End of Period | $19.89 | $18.58 | $18.62 | $23.15 | $18.51 | $13.96 | |||||||||||||||
Total Return* |
| 11.01% |
|
| 2.87% |
|
| (10.68)% |
|
| 25.24% |
|
| 33.76% |
|
| 23.43% |
| |||
Net Assets, End of Period (in thousands) | $756,547 | $754,333 | $940,738 | $1,308,109 | $985,916 | $769,713 | |||||||||||||||
Average Net Assets for the Period (in thousands) | $768,325 | $814,169 | $1,252,238 | $1,238,665 | $894,444 | $838,592 | |||||||||||||||
Ratios to Average Net Assets**: |
|
|
|
|
|
|
|
|
|
|
|
|
|
|
|
|
|
| |||
Ratio of Gross Expenses | 0.74% | 0.79% | 1.04% | 0.89% | 0.76% | 0.75% | |||||||||||||||
Ratio of Net Expenses (After Waivers and Expense Offsets) | 0.72% | 0.77% | 1.02% | 0.89% | 0.75% | 0.74% | |||||||||||||||
Ratio of Net Investment Income/(Loss) | 0.03% | 0.48% | 0.27% | 0.16% | 0.34% | 0.67% | |||||||||||||||
Portfolio Turnover Rate | 36% | 51% | 70% | 61% | 66% | 53% | |||||||||||||||
* Total return not annualized for periods of less than one full year. ** Annualized for periods of less than one full year. (1) Per share amounts are calculated based on average shares outstanding during the year or period. (2) Less than $0.005 on a per share basis. |
See Notes to Financial Statements. | |
Janus Investment Fund | 19 |
Janus Contrarian Fund
Notes to Financial Statements (unaudited)
1. Organization and Significant Accounting Policies
Janus Contrarian Fund (the “Fund”) is a series fund. The Fund is part of Janus Investment Fund (the “Trust”), which is organized as a Massachusetts business trust and is registered under the Investment Company Act of 1940, as amended (the “1940 Act”), as an open-end management investment company, and therefore has applied the specialized accounting and reporting guidance in Financial Accounting Standards Board (“FASB”) Accounting Standards Codification (“ASC”) Topic 946. The Trust offers forty-four funds which include multiple series of shares, with differing investment objectives and policies. The Fund seeks long-term growth of capital. The Fund is classified as nondiversified, as defined in the 1940 Act.
The Fund offers multiple classes of shares in order to meet the needs of various types of investors. Each class represents an interest in the same portfolio of investments. Certain financial intermediaries may not offer all classes of shares. Class D Shares are closed to certain new investors.
Shareholders, including other funds, individuals, accounts, as well as the Fund’s portfolio manager(s) and/or investment personnel, may from time to time own (beneficially or of record) a significant percentage of the Fund’s Shares and can be considered to “control” the Fund when that ownership exceeds 25% of the Fund’s assets (and which may differ from control as determined in accordance with accounting principles generally accepted in the United States of America).
Class A Shares and Class C Shares are generally offered through financial intermediary platforms including, but not limited to, traditional brokerage platforms, mutual fund wrap fee programs, bank trust platforms, and retirement platforms.
Class D Shares are generally no longer being made available to new investors who do not already have a direct account with the Janus funds. Class D Shares are available only to investors who hold accounts directly with the Janus funds, to immediate family members or members of the same household of an eligible individual investor, and to existing beneficial owners of sole proprietorships or partnerships that hold accounts directly with the Janus funds.
Class I Shares are available through certain financial intermediary platforms including, but not limited to, mutual fund wrap fee programs, managed account programs, asset allocation programs, bank trust platforms, as well as certain retirement platforms. Class I Shares are also available to certain direct institutional investors including, but not limited to, corporations, certain retirement plans, public plans, and foundations/endowments.
Class R Shares are offered through financial intermediary platforms including, but not limited to, retirement platforms.
Class S Shares are offered through financial intermediary platforms including, but not limited to, retirement platforms and asset allocation, mutual fund wrap, or other discretionary or nondiscretionary fee-based investment advisory programs. In addition, Class S Shares may be available through certain financial intermediaries who have an agreement with Janus Capital Management LLC (“Janus Capital”) or its affiliates to offer Class S Shares on their supermarket platforms.
Class T Shares are available through certain financial intermediary platforms including, but not limited to, mutual fund wrap fee programs, managed account programs, asset allocation programs, bank trust platforms, as well as certain retirement platforms. In addition, Class T Shares may be available through certain financial intermediaries who have an agreement with Janus Capital or its affiliates to offer Class T Shares on their supermarket platforms.
The following accounting policies have been followed by the Fund and are in conformity with accounting principles generally accepted in the United States of America.
Investment Valuation
Securities held by the Fund are valued in accordance with policies and procedures established by and under the supervision of the Trustees (the “Valuation Procedures”). Equity securities traded on a domestic securities exchange are generally valued at the closing prices on the primary market or exchange on which they trade. If such price is lacking for the trading period immediately preceding the time of determination, such securities are valued at their current bid price. Equity securities that are traded on a foreign exchange are generally valued at the closing prices on such markets. In the event that there is no current trading volume on a particular security in such foreign exchange, the bid price from the primary exchange is generally used to value the security. Securities that are traded on the over-the-counter (“OTC”) markets are generally valued at their closing or latest bid prices as available. Foreign securities and currencies are converted to U.S. dollars using the applicable exchange rate in effect at the close of the New York Stock Exchange
20 | MARCH 31, 2017 |
Janus Contrarian Fund
Notes to Financial Statements (unaudited)
(“NYSE”). The Fund will determine the market value of individual securities held by it by using prices provided by one or more approved professional pricing services or, as needed, by obtaining market quotations from independent broker-dealers. Most debt securities are valued in accordance with the evaluated bid price supplied by the pricing service that is intended to reflect market value. The evaluated bid price supplied by the pricing service is an evaluation that may consider factors such as security prices, yields, maturities and ratings. Certain short-term securities maturing within 60 days or less may be evaluated and valued on an amortized cost basis provided that the amortized cost determined approximates market value. Securities for which market quotations or evaluated prices are not readily available or deemed unreliable are valued at fair value determined in good faith under the Valuation Procedures. Circumstances in which fair value pricing may be utilized include, but are not limited to: (i) a significant event that may affect the securities of a single issuer, such as a merger, bankruptcy, or significant issuer-specific development; (ii) an event that may affect an entire market, such as a natural disaster or significant governmental action; (iii) a nonsignificant event such as a market closing early or not opening, or a security trading halt; and (iv) pricing of a nonvalued security and a restricted or nonpublic security. Special valuation considerations may apply with respect to “odd-lot” fixed-income transactions which, due to their small size, may receive evaluated prices by pricing services which reflect a large block trade and not what actually could be obtained for the odd-lot position. The Fund uses systematic fair valuation models provided by independent third parties to value international equity securities in order to adjust for stale pricing, which may occur between the close of certain foreign exchanges and the close of the NYSE.
Valuation Inputs Summary
FASB ASC 820, Fair Value Measurements and Disclosures (“ASC 820”), defines fair value, establishes a framework for measuring fair value, and expands disclosure requirements regarding fair value measurements. This standard emphasizes that fair value is a market-based measurement that should be determined based on the assumptions that market participants would use in pricing an asset or liability and establishes a hierarchy that prioritizes inputs to valuation techniques used to measure fair value. These inputs are summarized into three broad levels:
Level 1 – Unadjusted quoted prices in active markets the Fund has the ability to access for identical assets or liabilities.
Level 2 – Observable inputs other than unadjusted quoted prices included in Level 1 that are observable for the asset or liability either directly or indirectly. These inputs may include quoted prices for the identical instrument on an inactive market, prices for similar instruments, interest rates, prepayment speeds, credit risk, yield curves, default rates and similar data.
Assets or liabilities categorized as Level 2 in the hierarchy generally include: debt securities fair valued in accordance with the evaluated bid or ask prices supplied by a pricing service; securities traded on OTC markets and listed securities for which no sales are reported that are fair valued at the latest bid price (or yield equivalent thereof) obtained from one or more dealers transacting in a market for such securities or by a pricing service approved by the Fund’s Trustees; certain short-term debt securities with maturities of 60 days or less that are fair valued at amortized cost; and equity securities of foreign issuers whose fair value is determined by using systematic fair valuation models provided by independent third parties in order to adjust for stale pricing which may occur between the close of certain foreign exchanges and the close of the NYSE. Other securities that may be categorized as Level 2 in the hierarchy include, but are not limited to, preferred stocks, bank loans, swaps, investments in unregistered investment companies, options, and forward contracts.
Level 3 – Unobservable inputs for the asset or liability to the extent that relevant observable inputs are not available, representing the Fund’s own assumptions about the assumptions that a market participant would use in valuing the asset or liability, and that would be based on the best information available.
There have been no significant changes in valuation techniques used in valuing any such positions held by the Fund since the beginning of the fiscal year.
The inputs or methodology used for fair valuing securities are not necessarily an indication of the risk associated with investing in those securities. The summary of inputs used as of March 31, 2017 to fair value the Fund’s investments in securities and other financial instruments is included in the “Valuation Inputs Summary” in the Notes to Schedule of Investments and Other Information.
The Fund did not hold a significant amount of Level 3 securities as of March 31, 2017.
Janus Investment Fund | 21 |
Janus Contrarian Fund
Notes to Financial Statements (unaudited)
There were no transfers between Level 1, Level 2 and Level 3 of the fair value hierarchy during the period. The Fund recognizes transfers between the levels as of the beginning of the fiscal year.
Investment Transactions and Investment Income
Investment transactions are accounted for as of the date purchased or sold (trade date). Dividend income is recorded on the ex-dividend date. Certain dividends from foreign securities will be recorded as soon as the Fund is informed of the dividend, if such information is obtained subsequent to the ex-dividend date. Dividends from foreign securities may be subject to withholding taxes in foreign jurisdictions. Interest income is recorded on the accrual basis and includes amortization of premiums and accretion of discounts. Gains and losses are determined on the identified cost basis, which is the same basis used for federal income tax purposes. Income, as well as gains and losses, both realized and unrealized, are allocated daily to each class of shares based upon the ratio of net assets represented by each class as a percentage of total net assets.
Expenses
The Fund bears expenses incurred specifically on its behalf. Each class of shares bears a portion of general expenses, which are allocated daily to each class of shares based upon the ratio of net assets represented by each class as a percentage of total net assets. Expenses directly attributable to a specific class of shares are charged against the operations of such class.
Estimates
The preparation of financial statements in conformity with accounting principles generally accepted in the United States of America requires management to make estimates and assumptions that affect the reported amount of assets and liabilities and disclosure of contingent assets and liabilities at the date of the financial statements, and the reported amounts of income and expenses during the reporting period. Actual results could differ from those estimates.
Indemnifications
In the normal course of business, the Fund may enter into contracts that contain provisions for indemnification of other parties against certain potential liabilities. The Fund’s maximum exposure under these arrangements is unknown, and would involve future claims that may be made against the Fund that have not yet occurred. Currently, the risk of material loss from such claims is considered remote.
Foreign Currency Translations
The Fund does not isolate that portion of the results of operations resulting from the effect of changes in foreign exchange rates on investments from the fluctuations arising from changes in market prices of securities held at the date of the financial statements. Net unrealized appreciation or depreciation of investments and foreign currency translations arise from changes in the value of assets and liabilities, including investments in securities held at the date of the financial statements, resulting from changes in the exchange rates and changes in market prices of securities held.
Currency gains and losses are also calculated on payables and receivables that are denominated in foreign currencies. The payables and receivables are generally related to foreign security transactions and income translations.
Foreign currency-denominated assets and forward currency contracts may involve more risks than domestic transactions, including currency risk, counterparty risk, political and economic risk, regulatory risk and equity risk. Risks may arise from unanticipated movements in the value of foreign currencies relative to the U.S. dollar.
Dividends and Distributions
The Fund generally declares and distributes dividends of net investment income and realized capital gains (if any) annually. The Fund may treat a portion of the amount paid to redeem shares as a distribution of investment company taxable income and realized capital gains that are reflected in the net asset value. This practice, commonly referred to as “equalization,” has no effect on the redeeming shareholder or a Fund’s total return, but may reduce the amounts that would otherwise be required to be paid as taxable dividends to the remaining shareholders. It is possible that the Internal Revenue Service (IRS) could challenge the Funds’ equalization methodology or calculations, and any such challenge could result in additional tax, interest, or penalties to be paid by the Fund.
The Fund may make certain investments in real estate investment trusts (“REITs”) which pay dividends to their shareholders based upon funds available from operations. It is quite common for these dividends to exceed the REITs’ taxable earnings and profits, resulting in the excess portion of such dividends being designated as a return of capital. If
22 | MARCH 31, 2017 |
Janus Contrarian Fund
Notes to Financial Statements (unaudited)
the Fund distributes such amounts, such distributions could constitute a return of capital to shareholders for federal income tax purposes.
Federal Income Taxes
The Fund intends to continue to qualify as a regulated investment company and distribute all of its taxable income in accordance with the requirements of Subchapter M of the Internal Revenue Code. Management has analyzed the Fund’s tax positions taken for all open federal income tax years, generally a three-year period, and has concluded that no provision for federal income tax is required in the Fund’s financial statements. The Fund is not aware of any tax positions for which it is reasonably possible that the total amounts of unrecognized tax benefits will significantly change in the next twelve months.
2. Derivative Instruments
The Fund may invest in various types of derivatives, which may at times result in significant derivative exposure. A derivative is a financial instrument whose performance is derived from the performance of another asset. The Fund may invest in derivative instruments including, but not limited to: futures contracts, put options, call options, options on future contracts, options on foreign currencies, options on recovery locks, options on security and commodity indices, swaps, forward contracts, structured investments, and other equity-linked derivatives. Each derivative instrument that was held by the Fund during the period ended March 31, 2017 is discussed in further detail below. A summary of derivative activity by the Fund is reflected in the tables at the end of this section.
The Fund may use derivative instruments for hedging purposes (to offset risks associated with an investment, currency exposure, or market conditions), to adjust currency exposure relative to a benchmark index, or for speculative purposes (to earn income and seek to enhance returns). When the Fund invests in a derivative for speculative purposes, the Fund will be fully exposed to the risks of loss of that derivative, which may sometimes be greater than the derivative’s cost. The Fund may not use any derivative to gain exposure to an asset or class of assets that it would be prohibited by its investment restrictions from purchasing directly. The Fund’s ability to use derivative instruments may also be limited by tax considerations.
Investments in derivatives in general are subject to market risks that may cause their prices to fluctuate over time. Investments in derivatives may not directly correlate with the price movements of the underlying instrument. As a result, the use of derivatives may expose the Fund to additional risks that it would not be subject to if it invested directly in the securities underlying those derivatives. The use of derivatives may result in larger losses or smaller gains than otherwise would be the case. Derivatives can be volatile and may involve significant risks.
In pursuit of its investment objective, the Fund may seek to use derivatives to increase or decrease exposure to the following market risk factors:
· Commodity Risk – the risk related to the change in value of commodities or commodity-linked investments due to changes in the overall market movements, volatility of the underlying benchmark, changes in interest rates, or other factors affecting a particular industry of commodity such as drought, floods, weather, livestock disease, embargoes, tariffs, and international economic, political, and regulatory developments.
· Counterparty Risk – the risk that the counterparty (the party on the other side of the transaction) on a derivative transaction will be unable to honor its financial obligation to the Fund.
· Credit Risk – the risk an issuer will be unable to make principal and interest payments when due, or will default on its obligations.
· Currency Risk – the risk that changes in the exchange rate between currencies will adversely affect the value (in U.S. dollar terms) of an investment.
· Equity Risk – the risk related to the change in value of equity securities as they relate to increases or decreases in the general market.
· Index Risk – if the derivative is linked to the performance of an index, it will be subject to the risks associated with changes in that index. If the index changes, the Fund could receive lower interest payments or experience a reduction in the value of the derivative to below what the Fund paid. Certain indexed securities, including inverse securities (which move in an opposite direction to the index), may create leverage, to the extent that they increase or decrease in value at a rate that is a multiple of the changes in the applicable index.
Janus Investment Fund | 23 |
Janus Contrarian Fund
Notes to Financial Statements (unaudited)
· Interest Rate Risk – the risk that the value of fixed-income securities will generally decline as prevailing interest rates rise, which may cause the Fund’s NAV to likewise decrease.
· Leverage Risk – the risk associated with certain types of leveraged investments or trading strategies pursuant to which relatively small market movements may result in large changes in the value of an investment. The Fund creates leverage by investing in instruments, including derivatives, where the investment loss can exceed the original amount invested. Certain investments or trading strategies, such as short sales, that involve leverage can result in losses that greatly exceed the amount originally invested.
· Liquidity Risk – the risk that certain securities may be difficult or impossible to sell at the time that the seller would like or at the price that the seller believes the security is currently worth.
Derivatives may generally be traded OTC or on an exchange. Derivatives traded OTC are agreements that are individually negotiated between parties and can be tailored to meet a purchaser’s needs. OTC derivatives are not guaranteed by a clearing agency and may be subject to increased credit risk.
In an effort to mitigate credit risk associated with derivatives traded OTC, the Fund may enter into collateral agreements with certain counterparties whereby, subject to certain minimum exposure requirements, the Fund may require the counterparty to post collateral if the Fund has a net aggregate unrealized gain on all OTC derivative contracts with a particular counterparty. There is no guarantee that counterparty exposure is reduced and these arrangements are dependent on Janus Capital’s ability to establish and maintain appropriate systems and trading.
Forward Foreign Currency Exchange Contracts
A forward foreign currency exchange contract (“forward currency contract”) is an obligation to buy or sell a specified currency at a future date at a negotiated rate (which may be U.S. dollars or a foreign currency). The Fund may enter into forward currency contracts for hedging purposes, including, but not limited to, reducing exposure to changes in foreign currency exchange rates on foreign portfolio holdings and locking in the U.S. dollar cost of firm purchase and sale commitments for securities denominated in or exposed to foreign currencies. The Fund may also invest in forward currency contracts for nonhedging purposes such as seeking to enhance returns. The Fund is subject to currency risk and counterparty risk in the normal course of pursuing its investment objective through its investments in forward currency contracts.
Forward currency contracts are valued by converting the foreign value to U.S. dollars by using the current spot U.S. dollar exchange rate and/or forward rate for that currency. Exchange and forward rates as of the close of the NYSE shall be used to value the forward currency contracts. The unrealized appreciation/(depreciation) for forward currency contracts is reported in the Statement of Assets and Liabilities as a receivable or payable and in the Statement of Operations for the change in unrealized net appreciation/depreciation (if applicable). The gain or loss arising from the difference between the U.S. dollar cost of the original contract and the value of the foreign currency in U.S. dollars upon closing a forward currency contract is reported on the Statement of Operations (if applicable).
During the period, the Fund entered into forward currency contracts with the obligation to sell foreign currencies in the future at an agreed upon rate in order to decrease exposure to currency risk associated with foreign currency denominated securities held by the Fund.
During the period ended March 31, 2017, the average ending monthly currency value amounts on sold forward currency contracts is $9,727,647.
Futures Contracts
A futures contract is an exchange-traded agreement to take or make delivery of an underlying asset at a specific time in the future for a specific predetermined negotiated price. The Fund may enter into futures contracts to gain exposure to the stock market or other markets pending investment of cash balances or to meet liquidity needs. The Fund is subject to interest rate risk, equity risk, and currency risk in the normal course of pursuing its investment objective through its investments in futures contracts. The Fund may also use such derivative instruments to hedge or protect from adverse movements in securities prices, currency rates or interest rates. The use of futures contracts may involve risks such as the possibility of illiquid markets or imperfect correlation between the values of the contracts and the underlying securities, or that the counterparty will fail to perform its obligations.
Futures contracts on commodities are valued at the settlement price on valuation date on the commodities exchange as reported by an approved vendor. Mini contracts, as defined in the description of the contract, shall be valued using the
24 | MARCH 31, 2017 |
Janus Contrarian Fund
Notes to Financial Statements (unaudited)
Actual Settlement Price or “ASET” price type as reported by an approved vendor. In the event that foreign futures trade when the foreign equity markets are closed, the last foreign futures trade price shall be used. Futures contracts are marked-to-market daily, and the daily variation margin is recorded as a receivable or payable on the Statement of Assets and Liabilities (if applicable). The change in unrealized net appreciation/depreciation is reported on the Statement of Operations (if applicable). When a contract is closed, a realized gain or loss is reported on the Statement of Operations (if applicable), equal to the difference between the opening and closing value of the contract. Securities held by the Fund that are designated as collateral for market value on futures contracts are noted on the Schedule of Investments (if applicable). Such collateral is in the possession of the Fund’s futures commission merchant.
With futures, there is minimal counterparty credit risk to the Fund since futures are exchange-traded and the exchange’s clearinghouse, as counterparty to all exchange-traded futures, guarantees the futures against default.
During the period, the Fund sold futures on equity indices to decrease exposure to equity risk.
During the period ended March 31, 2017, the average ending monthly market value amounts on sold futures contracts is $169,241,954. There were no futures held at March 31, 2017.
Options Contracts
An options contract provides the purchaser with the right, but not the obligation, to buy (call option) or sell (put option) a financial instrument at an agreed upon price on or before a specified date. The purchaser pays a premium to the seller for this right. The seller has the corresponding obligation to sell or buy a financial instrument if the purchaser (owner) "exercises" the option. When an option is exercised, the proceeds on sales for a written call option, the purchase cost for a written put option, or the cost of the security for a purchased put or call option are adjusted by the amount of premium received or paid. Upon expiration, or closing of the option transaction, a realized gain or loss is reported on the Statement of Operations (if applicable). The difference between the premium paid/received and the market value of the option is recorded as unrealized appreciation or depreciation. The net change in unrealized appreciation or depreciation is reported on the Statement of Operations (if applicable). Option contracts are typically valued using an approved vendor’s option valuation model. To the extent reliable market quotations are available, option contracts are valued using market quotations. In cases when an approved vendor cannot provide coverage for an option and there is no reliable market quotation, a broker quotation or an internal valuation using the Black-Scholes model, the Cox-Rubenstein Binomial Option Pricing Model, or other appropriate option pricing model is used. Certain options contracts are marked-to-market daily, and the daily variation margin is recorded as a receivable or payable on the Statement of Assets and Liabilities as “Variation margin receivable” or “Variation margin payable” (if applicable).
The Fund may use options contracts to hedge against changes in interest rates, the values of equities, or foreign currencies. The Fund generally invests in options to hedge against adverse movements in the value of portfolio holdings. The use of such instruments may involve certain additional risks as a result of unanticipated movements in the market. A lack of correlation between the value of an instrument underlying an option and the asset being hedged, or unexpected adverse price movements, could render the Fund’s hedging strategy unsuccessful. In addition, there can be no assurance that a liquid secondary market will exist for any option purchased or sold. The Fund may be subject to counterparty risk, interest rate risk, liquidity risk, equity risk, commodity risk, and currency risk in the normal course of pursuing its investment objective through its investments in options contracts.
Options traded on an exchange are regulated and the terms of the options are standardized. Options traded OTC expose the Fund to counterparty risk in the event that the counterparty does not perform. This risk is mitigated by having a netting arrangement between the Fund and the counterparty and by having the counterparty post collateral to cover the Fund’s exposure to the counterparty.
The Fund may purchase put options to hedge against a decline in the value of its portfolio. By using put options in this way, the Fund will reduce any profit it might otherwise have realized in the underlying security by the amount of the premium paid for the put option and by transaction costs. The Fund may purchase call options to hedge against an increase in the price of securities that it may buy in the future. The premium paid for the call option plus any transaction costs will reduce the benefit, if any, realized by the Fund upon exercise of the option, and, unless the price of the underlying security rises sufficiently, the option may expire worthless to the Fund. The risk in buying options is that the Fund pays a premium whether or not the options are exercised. Options purchased are reported in the Schedule of Investments (if applicable).
Janus Investment Fund | 25 |
Janus Contrarian Fund
Notes to Financial Statements (unaudited)
During the period, the Fund purchased call options on various equity securities for the purpose of increasing exposure to individual equity risk.
During the period, the Fund purchased put options on various ETFs for the purpose of decreasing exposure to individual equity risk.
During the period ended March 31, 2017, the average ending monthly market value amounts on purchased call and put options are $970,708 and $2,633,923, respectively.
The following table, grouped by derivative type, provides information about the fair value and location of derivatives within the Statement of Assets and Liabilities as of March 31, 2017.
Fair Value of Derivative Instruments (not accounted for as hedging instruments) as of March 31, 2017 | ||||||||
|
|
|
| Currency |
| Equity |
| Total |
Asset Derivatives: | ||||||||
Unaffiliated investments, at value | $ - | $8,862,277 | (a) | $8,862,277 | ||||
| ||||||||
Liability Derivatives: | ||||||||
Forward currency contracts | $ 62,537 | $ - | $ 62,537 | |||||
(a) | Amounts relate to purchased options. | |||||||
(b) | Amounts relate to purchased options. | |||||||
The following tables provide information about the effect of derivatives and hedging activities on the Fund’s Statement of Operations for the period ended March 31, 2017.
The effect of Derivative Instruments (not accounted for as hedging instruments) on the Statement of Operations for the period ended March 31, 2017 | |||||||
Amount of Realized Gain/(Loss) Recognized on Derivatives | |||||||
Derivative | Currency |
| Equity |
| Total | ||
Futures contracts | $ - | $(19,840,072) | $(19,840,072) | ||||
Investments and foreign currency transactions | 446,851 | (a) | 539,776 | (b) | 986,627 | ||
Total | $ 446,851 |
| $(19,300,296) |
| $(18,853,445) | ||
Amount of Change in Unrealized Appreciation/Depreciation Recognized on Derivatives | |||||||
Derivative | Currency |
| Equity |
| Total | ||
Futures contracts | $ - | $ 986,100 | $ 986,100 | ||||
Investments, foreign currency translations and non-interested Trustees' deferred compensation | (156,990) | (a) | (4,223,964) | (b) | (4,380,954) | ||
Total | $(156,990) |
| $ (3,237,864) |
| $ (3,394,854) | ||
(a) | Amounts relate to forward currency contracts. | ||||||
(b) | Amounts relate to purchased options. | ||||||
(c) | Amounts relate to purchased options. | ||||||
Please see the "Net Realized Gain/(Loss) on Investments" and "Change in Unrealized Net Appreciation/Depreciation" sections of the Fund’s Statement of Operations.
3. Other Investments and Strategies
Additional Investment Risk
The financial crisis in both the U.S. and global economies over the past several years has resulted, and may continue to result, in a significant decline in the value and liquidity of many securities of issuers worldwide in the equity and fixed-
26 | MARCH 31, 2017 |
Janus Contrarian Fund
Notes to Financial Statements (unaudited)
income/credit markets. In response to the crisis, the United States and certain foreign governments, along with the U.S. Federal Reserve and certain foreign central banks, took steps to support the financial markets. The withdrawal of this support, a failure of measures put in place to respond to the crisis, or investor perception that such efforts were not sufficient could each negatively affect financial markets generally, and the value and liquidity of specific securities. In addition, policy and legislative changes in the United States and in other countries continue to impact many aspects of financial regulation. The effect of these changes on the markets, and the practical implications for market participants, including the Fund, may not be fully known for some time. As a result, it may also be unusually difficult to identify both investment risks and opportunities, which could limit or preclude the Fund’s ability to achieve its investment objective. Therefore, it is important to understand that the value of your investment may fall, sometimes sharply, and you could lose money.
The enactment of the Dodd-Frank Wall Street Reform and Consumer Protection Act (the “Dodd-Frank Act”) provided for widespread regulation of financial institutions, consumer financial products and services, broker-dealers, OTC derivatives, investment advisers, credit rating agencies, and mortgage lending, which expanded federal oversight in the financial sector, including the investment management industry. Many provisions of the Dodd-Frank Act remain pending and will be implemented through future rulemaking. Therefore, the ultimate impact of the Dodd-Frank Act and the regulations under the Dodd-Frank Act on the Fund and the investment management industry as a whole, is not yet certain.
A number of countries in the European Union (“EU”) have experienced, and may continue to experience, severe economic and financial difficulties. In particular, many EU nations are susceptible to economic risks associated with high levels of debt, notably due to investments in sovereign debt of countries such as Greece, Italy, Spain, Portugal, and Ireland. Many non-governmental issuers, and even certain governments, have defaulted on, or been forced to restructure, their debts. Many other issuers have faced difficulties obtaining credit or refinancing existing obligations. Financial institutions have in many cases required government or central bank support, have needed to raise capital, and/or have been impaired in their ability to extend credit. As a result, financial markets in the EU experienced extreme volatility and declines in asset values and liquidity. Responses to these financial problems by European governments, central banks, and others, including austerity measures and reforms, may not work, may result in social unrest, and may limit future growth and economic recovery or have other unintended consequences. Further defaults or restructurings by governments and others of their debt could have additional adverse effects on economies, financial markets, and asset valuations around the world. Greece, Ireland, and Portugal have already received one or more "bailouts" from other Eurozone member states, and it is unclear how much additional funding they will require or if additional Eurozone member states will require bailouts in the future. The risk of investing in securities in the European markets may also be heightened due to the referendum in which the United Kingdom voted to exit the EU (known as "Brexit"). One or more other countries may also abandon the euro and/or withdraw from the EU, placing its currency and banking system in jeopardy.
Certain areas of the world have historically been prone to and economically sensitive to environmental events such as, but not limited to, hurricanes, earthquakes, typhoons, flooding, tidal waves, tsunamis, erupting volcanoes, wildfires or droughts, tornadoes, mudslides, or other weather-related phenomena. Such disasters, and the resulting physical or economic damage, could have a severe and negative impact on the Fund’s investment portfolio and, in the longer term, could impair the ability of issuers in which the Fund invests to conduct their businesses as they would under normal conditions. Adverse weather conditions may also have a particularly significant negative effect on issuers in the agricultural sector and on insurance companies that insure against the impact of natural disasters.
Counterparties
Fund transactions involving a counterparty are subject to the risk that the counterparty or a third party will not fulfill its obligation to the Fund (“counterparty risk”). Counterparty risk may arise because of the counterparty’s financial condition (i.e., financial difficulties, bankruptcy, or insolvency), market activities and developments, or other reasons, whether foreseen or not. A counterparty’s inability to fulfill its obligation may result in significant financial loss to the Fund. The Fund may be unable to recover its investment from the counterparty or may obtain a limited recovery, and/or recovery may be delayed. The extent of the Fund’s exposure to counterparty risk with respect to financial assets and liabilities approximates its carrying value. See the "Offsetting Assets and Liabilities" section of this Note for further details.
The Fund may be exposed to counterparty risk through participation in various programs, including, but not limited to, lending its securities to third parties, cash sweep arrangements whereby the Fund’s cash balance is invested in one or more types of cash management vehicles, as well as investments in, but not limited to, repurchase agreements, debt
Janus Investment Fund | 27 |
Janus Contrarian Fund
Notes to Financial Statements (unaudited)
securities, and derivatives, including various types of swaps, futures and options. The Fund intends to enter into financial transactions with counterparties that Janus Capital believes to be creditworthy at the time of the transaction. There is always the risk that Janus Capital’s analysis of a counterparty’s creditworthiness is incorrect or may change due to market conditions. To the extent that the Fund focuses its transactions with a limited number of counterparties, it will have greater exposure to the risks associated with one or more counterparties.
Offsetting Assets and Liabilities
The Fund presents gross and net information about transactions that are either offset in the financial statements or subject to an enforceable master netting arrangement or similar agreement with a designated counterparty, regardless of whether the transactions are actually offset in the Statement of Assets and Liabilities.
In order to better define its contractual rights and to secure rights that will help the Fund mitigate its counterparty risk, the Fund has entered into an International Swaps and Derivatives Association, Inc. Master Agreement (“ISDA Master Agreement”) or similar agreement with its derivative contract counterparties. An ISDA Master Agreement is a bilateral agreement between the Fund and a counterparty that governs OTC derivatives and forward foreign currency exchange contracts and typically contains, among other things, collateral posting terms and netting provisions in the event of a default and/or termination event. Under an ISDA Master Agreement, in the event of a default and/or termination event, the Fund may offset with each counterparty certain derivative financial instruments’ payables and/or receivables with collateral held and/or posted and create one single net payment. For financial reporting purposes, the Fund does not offset certain derivative financial instruments’ payables and receivables and related collateral on the Statement of Assets and Liabilities.
The following tables present gross amounts of recognized assets and/or liabilities and the net amounts after deducting collateral that has been pledged by counterparties or has been pledged to counterparties (if applicable). For corresponding information grouped by type of instrument, see either the “Fair Value of Derivative Instruments as of March 31, 2017” table located in Note 2 of these Notes to Financial Statements and/or the Fund’s Schedule of Investments.
Offsetting of Financial Assets and Derivative Assets | |||||||||
Gross Amounts | |||||||||
of Recognized | Offsetting Asset | Collateral | |||||||
Counterparty | Assets | or Liability(a) | Pledged(b) | Net Amount | |||||
Goldman Sachs International | $ | 3,147,728 | $ | — | $ | (3,147,728) | $ | — | |
Morgan Stanley & Co. | 5,714,549 | — | — | 5,714,549 | |||||
Total | $ | 8,862,277 | $ | — | $ | (3,147,728) | $ | 5,714,549 | |
Offsetting of Financial Liabilities and Derivative Liabilities | |||||||||
Gross Amounts | |||||||||
of Recognized | Offsetting Asset | Collateral | |||||||
Counterparty | Liabilities | or Liability(a) | Pledged(b) | Net Amount | |||||
HSBC Securities (USA), Inc. | $ | 62,537 | $ | — | $ | — | $ | 62,537 | |
(a) | Represents the amount of assets or liabilities that could be offset with the same counterparty under master netting or similar agreements that management elects not to offset on the Statement of Assets and Liabilities. | ||||||||
(b) | Collateral pledged is limited to the net outstanding amount due to/from an individual counterparty. The actual collateral amounts pledged may exceed these amounts and may fluctuate in value. | ||||||||
The Fund does not exchange collateral on its forward currency contracts with its counterparties; however, the Fund may segregate cash or high-grade securities in an amount at all times equal to or greater than the Fund’s commitment with respect to these contracts. Such segregated assets, if with the Fund’s custodian, are denoted on the accompanying Schedule of Investments and are evaluated daily to ensure their market value equals or exceeds the current market value of the Fund’s corresponding forward currency contracts.
The Fund may require the counterparty to pledge securities as collateral daily (based on the daily valuation of the financial asset) if the Fund has a net aggregate unrealized gain on OTC derivative contracts with a particular
28 | MARCH 31, 2017 |
Janus Contrarian Fund
Notes to Financial Statements (unaudited)
counterparty. The Fund may deposit cash as collateral with the counterparty and/or custodian daily (based on the daily valuation of the financial asset) if the Fund has a net aggregate unrealized loss on OTC derivative contracts with a particular counterparty. The collateral amounts are subject to minimum exposure requirements and initial margin requirements. Collateral amounts are monitored and subsequently adjusted up or down as valuations fluctuate by at least the minimum exposure requirement. Collateral may reduce the risk of loss.
Real Estate Investing
The Fund may invest in equity and debt securities of real estate-related companies. Such companies may include those in the real estate industry or real estate-related industries. These securities may include common stocks, corporate bonds, preferred stocks, and other equity securities, including, but not limited to, mortgage-backed securities, real estate-backed securities, securities of REITs and similar REIT-like entities. A REIT is a trust that invests in real estate-related projects, such as properties, mortgage loans, and construction loans. REITs are generally categorized as equity, mortgage, or hybrid REITs. A REIT may be listed on an exchange or traded OTC.
Restricted Security Transactions
Restricted securities held by the Fund may not be sold except in exempt transactions or in a public offering registered under the Securities Act of 1933, as amended. The risk of investing in such securities is generally greater than the risk of investing in the securities of widely held, publicly traded companies. Lack of a secondary market and resale restrictions may result in the inability of the Fund to sell a security at a fair price and may substantially delay the sale of the security. In addition, these securities may exhibit greater price volatility than securities for which secondary markets exist.
Securities Lending
Under procedures adopted by the Trustees, the Fund may seek to earn additional income by lending securities to qualified parties. Deutsche Bank AG acts as securities lending agent and a limited purpose custodian or subcustodian to receive and disburse cash balances and cash collateral, hold short-term investments, hold collateral, and perform other custodian functions. The Fund may lend portfolio securities in an amount equal to up to 1/3 of its total assets as determined at the time of the loan origination. There is the risk of delay in recovering a loaned security or the risk of loss in collateral rights if the borrower fails financially. In addition, Janus Capital makes efforts to balance the benefits and risks from granting such loans. All loans will be continuously secured by collateral which may consist of cash, U.S. Government securities, domestic and foreign short-term debt instruments, letters of credit, time deposits, repurchase agreements, money market mutual funds or other money market accounts, or such other collateral as permitted by the SEC. If the Fund is unable to recover a security on loan, the Fund may use the collateral to purchase replacement securities in the market. There is a risk that the value of the collateral could decrease below the cost of the replacement security by the time the replacement investment is made, resulting in a loss to the Fund.
Upon receipt of cash collateral, Janus Capital may invest it in affiliated or non-affiliated cash management vehicles, whether registered or unregistered entities, as permitted by the 1940 Act and rules promulgated thereunder. Janus Capital currently intends to invest the cash collateral in a cash management vehicle for which Janus Capital serves as investment adviser, Janus Cash Collateral Fund LLC. An investment in Janus Cash Collateral Fund LLC is generally subject to the same risks that shareholders experience when investing in similarly structured vehicles, such as the potential for significant fluctuations in assets as a result of the purchase and redemption activity of the securities lending program, a decline in the value of the collateral, and possible liquidity issues. Such risks may delay the return of the cash collateral and cause the Fund to violate its agreement to return the cash collateral to a borrower in a timely manner. As adviser to the Fund and Janus Cash Collateral Fund LLC, Janus Capital has an inherent conflict of interest as a result of its fiduciary duties to both the Fund and Janus Cash Collateral Fund LLC. Additionally, Janus Capital receives an investment advisory fee of 0.05% for managing Janus Cash Collateral Fund LLC, but it may not receive a fee for managing certain other affiliated cash management vehicles in which the Fund may invest, and therefore may have an incentive to allocate preferred investment opportunities to investment vehicles for which it is receiving a fee.
The value of the collateral must be at least 102% of the market value of the loaned securities that are denominated in U.S. dollars and 105% of the market value of the loaned securities that are not denominated in U.S. dollars. Loaned securities and related collateral are marked-to-market each business day based upon the market value of the loaned securities at the close of business, employing the most recent available pricing information. Collateral levels are then adjusted based on this mark-to-market evaluation.
Janus Investment Fund | 29 |
Janus Contrarian Fund
Notes to Financial Statements (unaudited)
The cash collateral invested by Janus Capital is disclosed in the Schedule of Investments (if applicable). Income earned from the investment of the cash collateral, net of rebates paid to, or fees paid by, borrowers and less the fees paid to the lending agent are included as “Affiliated securities lending income, net” on the Statement of Operations. There were no securities on loan as of March 31, 2017.
4. Investment Advisory Agreements and Other Transactions with Affiliates
The Fund pays Janus Capital an investment advisory fee which is calculated daily and paid monthly. The Fund’s "base" fee rate prior to any performance adjustment (expressed as an annual rate) is 0.64%.
The investment advisory fee rate is determined by calculating a base fee and applying a performance adjustment. The base fee rate is the same as the contractual investment advisory fee rate. The performance adjustment either increases or decreases the base fee depending on how well the Fund has performed relative to its benchmark index. The Fund's benchmark index used in the calculation is the S&P 500® Index.
The calculation of the performance adjustment applies as follows:
Investment Advisory Fee = Base Fee Rate +/- Performance Adjustment
The investment advisory fee rate paid to Janus Capital by the Fund consists of two components: (1) a base fee calculated by applying the contractual fixed rate of the advisory fee to the Fund’s average daily net assets during the previous month (“Base Fee Rate”), plus or minus (2) a performance-fee adjustment (“Performance Adjustment”) calculated by applying a variable rate of up to 0.15% (positive or negative) to the Fund’s average daily net assets during the applicable performance measurement period, which is generally the previous 36 months.
The Fund’s prospectuses and statement(s) of additional information contain additional information about performance-based fees. The amount shown as advisory fees on the Statement of Operations reflects the Base Fee Rate plus/minus any Performance Adjustment. For the period ended March 31, 2017, the performance adjusted investment advisory fee rate before any waivers and/or reimbursements of expenses is 0.45%.
Janus Capital has contractually agreed to waive the advisory fee payable by the Fund or reimburse expenses in an amount equal to the amount, if any, that the Fund’s normal operating expenses, including the investment advisory fee, but excluding any performance adjustments to management fees, the 12b-1 distribution and shareholder servicing fees (applicable to Class A Shares, Class C Shares, Class R Shares, and Class S Shares), transfer agent fees and expenses payable pursuant to the Transfer Agency Agreement, brokerage commissions, interest, dividends, taxes, acquired fund fees and expenses, and extraordinary expenses, exceed the annual rate of 0.83% of the Fund’s average daily net assets. Janus Capital has agreed to continue the waiver until at least February 1, 2018. The previous expense limit (until February 1, 2017) was 0.89%. If applicable, amounts reimbursed to the Fund by Janus Capital are disclosed as “Excess Expense Reimbursement” on the Statement of Operations.
Janus Services LLC (“Janus Services”), a wholly-owned subsidiary of Janus Capital, is the Fund’s transfer agent. In addition, Janus Services provides or arranges for the provision of certain other administrative services including, but not limited to, recordkeeping, accounting, order processing, and other shareholder services for the Fund. Janus Services is not compensated for its services related to the shares, except for out-of-pocket costs. These amounts are disclosed as “Other transfer agent fees and expenses” on the Statement of Operations.
Certain, but not all, intermediaries may charge administrative fees (such as networking and omnibus) to investors in Class A Shares, Class C Shares, and Class I Shares for administrative services provided on behalf of such investors. These administrative fees are paid by the Class A Shares, Class C Shares, and Class I Shares of the Fund to Janus Services, which uses such fees to reimburse intermediaries. Consistent with the Transfer Agency Agreement between Janus Services and the Fund, Janus Services may negotiate the level, structure, and/or terms of the administrative fees with intermediaries requiring such fees on behalf of the Fund. Janus Capital and its affiliates benefit from an increase in assets that may result from such relationships. The Funds’ Trustees have set limits on fees that the Funds may incur with respect to administrative fees paid for omnibus or networked accounts. Such limits are subject to change by the Trustees in the future. These amounts are disclosed as “Transfer agent networking and omnibus fees” on the Statement of Operations.
The Fund’s Class D Shares pay an administrative services fee at an annual rate of 0.12% of the average daily net assets of Class D Shares for shareholder services provided by Janus Services. Janus Services provides or arranges for the provision of shareholder services including, but not limited to, recordkeeping, accounting, answering inquiries
30 | MARCH 31, 2017 |
Janus Contrarian Fund
Notes to Financial Statements (unaudited)
regarding accounts, transaction processing, transaction confirmations, and the mailing of prospectuses and shareholder reports. These amounts are disclosed as “Transfer agent administrative fees and expenses” on the Statement of Operations.
Janus Services receives an administrative services fee at an annual rate of up to 0.25% of the average daily net assets of the Fund’s Class R Shares, Class S Shares, and Class T Shares for providing or procuring administrative services to investors in Class R Shares, Class S Shares, and Class T Shares of the Fund. Janus Services expects to use all or a significant portion of this fee to compensate retirement plan service providers, broker-dealers, bank trust departments, financial advisors, and other financial intermediaries for providing these services. Janus Services or its affiliates may also pay fees for services provided by intermediaries to the extent the fees charged by intermediaries exceed the 0.25% of net assets charged to Class R Shares, Class S Shares, and Class T Shares of the Fund. Janus Services may keep certain amounts retained for reimbursement of out-of-pocket costs incurred for servicing clients of Class R Shares, Class S Shares, and Class T Shares. These amounts are disclosed as “Transfer agent administrative fees and expenses” on the Statement of Operations.
Services provided by these financial intermediaries may include, but are not limited to, recordkeeping, subaccounting, order processing, providing order confirmations, periodic statements, forwarding prospectuses, shareholder reports, and other materials to existing customers, answering inquiries regarding accounts, and other administrative services. Order processing includes the submission of transactions through the National Securities Clearing Corporation (“NSCC”) or similar systems, or those processed on a manual basis with Janus Capital.
Janus Services is compensated for its services related to the Fund’s Class D Shares. In addition to the administrative fees discussed above, Janus Services receives reimbursement for out-of-pocket costs it incurs for serving as transfer agent and providing, or arranging for, servicing to shareholders. These amounts are disclosed as “Other transfer agent fees and expenses” on the Statement of Operations.
Under a distribution and shareholder servicing plan (the “Plan”) adopted in accordance with Rule 12b-1 under the 1940 Act, the Fund pays the Trust’s distributor, Janus Distributors LLC (“Janus Distributors”), a wholly-owned subsidiary of Janus Capital, a fee for the sale and distribution and/or shareholder servicing of the Shares at an annual rate of up to 0.25% of the Class A Shares’ average daily net assets, of up to 1.00% of the Class C Shares’ average daily net assets, of up to 0.50% of the Class R Shares' average daily net assets, and of up to 0.25% of the Class S Shares’ average daily net assets. Under the terms of the Plan, the Trust is authorized to make payments to Janus Distributors for remittance to retirement plan service providers, broker-dealers, bank trust departments, financial advisors, and other financial intermediaries, as compensation for distribution and/or shareholder services performed by such entities for their customers who are investors in the Fund. These amounts are disclosed as “12b-1 Distribution and shareholder servicing fees” on the Statement of Operations. Payments under the Plan are not tied exclusively to actual 12b-1 distribution and shareholder service expenses, and the payments may exceed 12b-1 distribution and shareholder service expenses actually incurred. If any of the Fund’s actual 12b-1 distribution and shareholder service expenses incurred during a calendar year are less than the payments made during a calendar year, the Fund will be refunded the difference. Refunds, if any, are included in “12b-1 Distribution fees and shareholder servicing fees” in the Statement of Operations.
Janus Capital furnishes certain administration, compliance, and accounting services for the Fund and is reimbursed by the Fund for certain of its costs in providing those services (to the extent Janus Capital seeks reimbursement and such costs are not otherwise waived). In addition, employees of Janus Capital and/or its affiliates may serve as officers of the Trust. The Fund also pays for some or all of the salaries, fees, and expenses of certain Janus Capital employees and Fund officers, with respect to certain specified administration functions they perform on behalf of the Fund. The Fund pays these costs based on out-of-pocket expenses incurred by Janus Capital, and these costs are separate and apart from advisory fees and other expenses paid in connection with the investment advisory services Janus Capital provides to the Fund. These amounts are disclosed as “Fund administration fees” on the Statement of Operations. Some expenses related to compensation payable to the Fund's Chief Compliance Officer and compliance staff are shared with the Fund. Total compensation of $159,020 was paid to the Chief Compliance Officer and certain compliance staff by the Trust during the period ended March 31, 2017. The Fund's portion is reported as part of “Other expenses” on the Statement of Operations.
The Board of Trustees has adopted a deferred compensation plan (the “Deferred Plan”) for independent Trustees to elect to defer receipt of all or a portion of the annual compensation they are entitled to receive from the Fund. All
Janus Investment Fund | 31 |
Janus Contrarian Fund
Notes to Financial Statements (unaudited)
deferred fees are credited to an account established in the name of the Trustees. The amounts credited to the account then increase or decrease, as the case may be, in accordance with the performance of one or more of the Janus funds that are selected by the Trustees. The account balance continues to fluctuate in accordance with the performance of the selected fund or funds until final payment of all amounts are credited to the account. The fluctuation of the account balance is recorded by the Fund as unrealized appreciation/(depreciation) and is included as of March 31, 2017 on the Statement of Assets and Liabilities in the asset, “Non-interested Trustees’ deferred compensation,” and liability, “Non-interested Trustees’ deferred compensation fees.” Additionally, the recorded unrealized appreciation/(depreciation) is included in “Unrealized net appreciation/(depreciation) of investments, foreign currency translations and non-interested Trustees’ deferred compensation” on the Statement of Assets and Liabilities. Deferred compensation expenses for the period ended March 31, 2017 are included in “Non-interested Trustees’ fees and expenses” on the Statement of Operations. Trustees are allowed to change their designation of mutual funds from time to time. Amounts will be deferred until distributed in accordance with the Deferred Plan. Deferred fees of $195,413 were paid by the Trust to a Trustee under the Deferred Plan during the period ended March 31, 2017.
Pursuant to the provisions of the 1940 Act and related rules, the Fund may participate in an affiliated or nonaffiliated cash sweep program. In the cash sweep program, uninvested cash balances of the Fund may be used to purchase shares of affiliated or nonaffiliated money market funds or cash management pooled investment vehicles. The Fund is eligible to participate in the cash sweep program (the “Investing Funds”). As adviser, Janus Capital has an inherent conflict of interest because of its fiduciary duties to the affiliated money market funds or cash management pooled investment vehicles and the Investing Funds. Janus Cash Liquidity Fund LLC is an affiliated unregistered cash management pooled investment vehicle that invests primarily in highly-rated short-term fixed-income securities. Janus Cash Liquidity Fund LLC currently maintains a NAV of $1.00 per share and distributes income daily in a manner consistent with a registered product compliant with Rule 2a-7 under the 1940 Act. There are no restrictions on the Fund's ability to withdraw investments from Janus Cash Liquidity Fund LLC at will, and there are no unfunded capital commitments due from the Fund to Janus Cash Liquidity Fund LLC. The units of Janus Cash Liquidity Fund LLC are not charged any management fee, sales charge or service fee.
Any purchases and sales, realized gains/losses and recorded dividends from affiliated investments during the period ended March 31, 2017 can be found in a table located in the Notes to Schedule of Investments and Other Information.
Class A Shares include a 5.75% upfront sales charge of the offering price of the Fund. The sales charge is allocated between Janus Distributors and financial intermediaries. During the period ended March 31, 2017, Janus Distributors retained upfront sales charges of $2,527.
A contingent deferred sales charge (“CDSC”) of 1.00% will be deducted with respect to Class A Shares purchased without a sales load and redeemed within 12 months of purchase, unless waived. Any applicable CDSC will be 1.00% of the lesser of the original purchase price or the value of the redemption of the Class A Shares redeemed. There were no CDSCs paid by redeeming shareholders of Class A Shares to Janus Distributors during the period ended March 31, 2017.
A CDSC of 1.00% will be deducted with respect to Class C Shares redeemed within 12 months of purchase, unless waived. Any applicable CDSC will be 1.00% of the lesser of the original purchase price or the value of the redemption of the Class C Shares redeemed. During the period ended March 31, 2017, redeeming shareholders of Class C Shares paid CDSCs of $3,323.
The Fund is permitted to purchase or sell securities (“cross-trade”) between itself and other funds or accounts managed by Janus Capital Management LLC in accordance with Rule 17a-7 under the Investment Company Act of 1940 (“Rule 17a-7”), when the transaction is consistent with the investment objectives and policies of the Fund and in accordance with the Internal Cross Trade Procedures adopted by the Trust’s Board of Trustees. These procedures have been designed to ensure that any cross-trade of securities by the Fund from or to another fund or account that is or could be considered an affiliate of the Fund under certain limited circumstances by virtue of having a common investment adviser, common Officer, or common Trustee complies with Rule 17a-7. Under these procedures, each cross-trade is effected at the current market price to save costs where allowed. During the period ended March 31, 2017, the Fund engaged in cross trades amounting to $2,558,814 in sales, resulting in a net realized loss of $656,525. The net realized loss is included within the “Net Realized Gain/(Loss) on Investments” section of the Fund’s Statement of Operations.
32 | MARCH 31, 2017 |
Janus Contrarian Fund
Notes to Financial Statements (unaudited)
5. Federal Income Tax
Income and capital gains distributions are determined in accordance with income tax regulations that may differ from accounting principles generally accepted in the United States of America. These differences are due to differing treatments for items such as net short-term gains, deferral of wash sale losses, foreign currency transactions, net investment losses, and capital loss carryovers.
The Fund has elected to treat gains and losses on forward foreign currency contracts as capital gains and losses, if applicable. Other foreign currency gains and losses on debt instruments are treated as ordinary income for federal income tax purposes pursuant to Section 988 of the Internal Revenue Code.
Accumulated capital losses noted below represent net capital loss carryovers, as of September 30, 2016, that may be available to offset future realized capital gains and thereby reduce future taxable gains distributions. Under the Regulated Investment Company Modernization Act of 2010, the Fund is permitted to carry forward capital losses incurred in taxable years beginning after December 22, 2010 for an unlimited period. Losses incurred during those years will be required to be utilized prior to the losses incurred in pre-enactment taxable years. As a result of this ordering rule, pre-enactment capital loss carryforwards may more likely expire unused. Also, post-enactment capital losses that are carried forward will retain their character as either short-term or long-term capital losses rather than being considered all short-term as under previous law. The following table shows these capital loss carryovers.
Capital Loss Carryover Schedule | ||||||||
For the year ended September 30, 2016 | ||||||||
September 30, 2017 | September 30, 2018 | September 30, 2019 | Accumulated | |||||
$ (7,198,961) | $ (2,708,558) | $ (922,145) | $ (10,829,664)(1) | |||||
(1) Capital loss carryovers subject to annual limitations, $(7,198,961) should be available in the next fiscal year. | ||||||||
The aggregate cost of investments and the composition of unrealized appreciation and depreciation of investment securities for federal income tax purposes as of March 31, 2017 are noted below.
Unrealized appreciation and unrealized depreciation in the table below exclude appreciation/depreciation on foreign currency translations. The primary differences between book and tax appreciation or depreciation of investments are wash sale loss deferrals and investments in partnerships.
Federal Tax Cost | Unrealized | Unrealized
| Net Tax Appreciation/ |
$ 2,739,890,698 | $329,526,367 | $(198,978,827) | $ 130,547,540 |
Janus Investment Fund | 33 |
Janus Contrarian Fund
Notes to Financial Statements (unaudited)
6. Capital Share Transactions
Period ended March 31, 2017 | Year ended September 30, 2016 | |||||
Shares | Amount | Shares | Amount | |||
Class A Shares: | ||||||
Shares sold | 172,055 | $ 3,363,488 | 747,384 | $ 13,594,222 | ||
Reinvested dividends and distributions | 72,537 | 1,431,885 | 121,124 | 2,208,084 | ||
Shares repurchased | (1,994,970) | (38,983,412) | (3,477,468) | (63,026,938) | ||
Net Increase/(Decrease) | (1,750,378) | $(34,188,039) |
| (2,608,960) | $ (47,224,632) | |
Class C Shares: | ||||||
Shares sold | 53,683 | $ 1,005,973 | 505,598 | $ 8,886,434 | ||
Reinvested dividends and distributions | 57,617 | 1,079,157 | 80,035 | 1,396,608 | ||
Shares repurchased | (867,313) | (15,703,757) | (2,271,677) | (39,129,774) | ||
Net Increase/(Decrease) | (756,013) | $(13,618,627) |
| (1,686,044) | $ (28,846,732) | |
Class D Shares: | ||||||
Shares sold | 1,288,604 | $ 25,367,853 | 1,962,119 | $ 35,049,994 | ||
Reinvested dividends and distributions | 3,548,990 | 70,163,548 | 3,252,611 | 59,425,188 | ||
Shares repurchased | (6,630,861) | (129,370,563) | (12,836,491) | (230,065,169) | ||
Net Increase/(Decrease) | (1,793,267) | $(33,839,162) |
| (7,621,761) | $(135,589,987) | |
Class I Shares: | ||||||
Shares sold | 2,609,938 | $ 51,341,429 | 2,483,717 | $ 45,003,982 | ||
Reinvested dividends and distributions | 149,795 | 2,962,946 | 221,663 | 4,049,784 | ||
Shares repurchased | (1,478,095) | (28,595,768) | (10,998,164) | (200,800,941) | ||
Net Increase/(Decrease) | 1,281,638 | $ 25,708,607 |
| (8,292,784) | $(151,747,175) | |
Class R Shares: | ||||||
Shares sold | 8,379 | $ 162,179 | 12,664 | $ 222,707 | ||
Reinvested dividends and distributions | 1,855 | 35,915 | 2,077 | 37,291 | ||
Shares repurchased | (19,398) | (375,103) | (43,747) | (767,686) | ||
Net Increase/(Decrease) | (9,164) | $ (177,009) |
| (29,006) | $ (507,688) | |
Class S Shares: | ||||||
Shares sold | 7,032 | $ 136,222 | 28,228 | $ 505,735 | ||
Reinvested dividends and distributions | 6,828 | 134,790 | 6,541 | 119,374 | ||
Shares repurchased | (35,791) | (673,506) | (62,863) | (1,121,389) | ||
Net Increase/(Decrease) | (21,931) | $ (402,494) |
| (28,094) | $ (496,280) | |
Class T Shares: | ||||||
Shares sold | 1,349,386 | $ 26,434,459 | 2,859,822 | $ 51,351,899 | ||
Reinvested dividends and distributions | 1,407,698 | 27,816,109 | 1,429,272 | 26,112,797 | ||
Shares repurchased | (5,321,342) | (103,825,630) | (14,219,849) | (255,291,379) | ||
Net Increase/(Decrease) | (2,564,258) | $(49,575,062) |
| (9,930,755) | $(177,826,683) | |
7. Purchases and Sales of Investment Securities
For the period ended March 31, 2017, the aggregate cost of purchases and proceeds from sales of investment securities (excluding any short-term securities, short-term options contracts, and in-kind transactions) was as follows:
Purchases of | Proceeds from Sales | Purchases of Long- | Proceeds from Sales |
$945,775,691 | $1,386,565,568 | $ - | $ - |
8. Merger Related Matters
On October 3, 2016, Janus Capital Group Inc. (“JCGI”), the direct parent of Janus Capital, and Henderson Group plc (“Henderson”) announced that they had entered into an Agreement and Plan of Merger (“Merger Agreement”) relating to the strategic combination of Henderson and JCGI (the “Merger”). Pursuant to the Merger Agreement, a newly formed, direct wholly-owned subsidiary of Henderson will merge with and into JCGI, with JCGI as the surviving
34 | MARCH 31, 2017 |
Janus Contrarian Fund
Notes to Financial Statements (unaudited)
corporation and a direct wholly-owned subsidiary of Henderson. The Merger is expected to close in the second quarter of 2017, subject to requisite shareholder and regulatory approvals.
The consummation of the Merger may be deemed to cause an “assignment” (as defined in the 1940 Act) of the advisory agreement between the Fund and Janus Capital in effect as of the date of this Report. As a result, the consummation of the Merger may cause the investment advisory agreement to terminate automatically in accordance with its terms.
On December 8, 2016, the Trustees approved, subject to shareholder approval, a new investment advisory agreement between the Fund and Janus Capital in order to permit Janus Capital to continue providing advisory services to the Fund following the closing of the Merger (“Post-Merger Advisory Agreement”). At the same meeting, the Trustees approved submitting the Post-Merger Advisory Agreement, among other proposals, to Fund shareholders for approval.
9. Subsequent Event
Management has evaluated whether any events or transactions occurred subsequent to March 31, 2017 and through the date of issuance of the Fund’s financial statements and determined that there were no material events or transactions that would require recognition or disclosure in the Fund’s financial statements other than the following:
Special Meeting(s) of Shareholders were held on April 6, 2017, and adjourned and reconvened on April 18, 2017, April 25, 2017, April 28, 2017, and May 17, 2017 (together, the “Meeting”).
Approval of Advisory Agreement
At the Meeting, Fund shareholders approved the Post-Merger Advisory Agreement, which will take effect upon the consummation of the Merger.
Election of Trustees
At the Meeting, shareholders of each series of the Trust, including the Fund, voting together as a single class, approved the election of Diane L. Wallace to the Trust’s Board of Trustees. Ms. Wallace currently serves as a trustee of certain mutual funds advised by Henderson Global Investors (North America) Inc., a subsidiary of Henderson. Upon the consummation of the Merger, Ms. Wallace will join the Trust’s Board of Trustees.
Janus Investment Fund | 35 |
Janus Contrarian Fund
Additional Information (unaudited)
Proxy Voting Policies and Voting Record
A description of the policies and procedures that the Fund uses to determine how to vote proxies relating to its portfolio securities is available without charge: (i) upon request, by calling 1-800-525-0020 (toll free); (ii) on the Fund’s website at janus.com/proxyvoting; and (iii) on the SEC’s website at http://www.sec.gov. Additionally, information regarding the Fund’s proxy voting record for the most recent twelve-month period ended June 30 is also available, free of charge, through janus.com/proxyvoting and from the SEC’s website at http://www.sec.gov.
Quarterly Portfolio Holdings
The Fund files its complete portfolio holdings (schedule of investments) with the SEC for the first and third quarters of each fiscal year on Form N-Q within 60 days of the end of such fiscal quarter. The Fund’s Form N-Q: (i) is available on the SEC’s website at http://www.sec.gov; (ii) may be reviewed and copied at the SEC’s Public Reference Room in Washington, D.C. (information on the Public Reference Room may be obtained by calling 1-800-SEC-0330); and (iii) is available without charge, upon request, by calling Janus at 1-800-525-0020 (toll free).
Approval of Advisory and Sub-Advisory Agreements with Janus and Janus Affiliates during the Period
On September 15, 2016, Janus Capital Group Inc. (“Janus”) advised the Trustees of Janus Investment Fund (the “Trust”), each of whom serves as an “independent” Trustee (the “Board” or the “Trustees”), of its intent to seek a strategic combination of its advisory business with Henderson Group plc (“Henderson”). The Board met with the Chief Executive Officer of Janus, who outlined the proposed combination and the potential benefits to Janus Capital Management LLC (“Janus Capital”) and each Fund of the Trust (each, a “Fund” and collectively, the “Funds”). Subsequent to the September 15, 2016 meeting, the Trustees identified a list of basic principles, which they believed should serve as the foundation for their review of the organizational, operational and strategic issues involved with any potential change in control of Janus Capital, the investment adviser to the Funds. These basic principles were communicated to Janus Capital on September 27, 2016, and were intended to be shared with Henderson. On October 3, 2016, Janus announced that it had entered into a definitive Agreement and Plan of Merger with Henderson pursuant to which Janus and Henderson agreed to effect an all-stock merger of equals strategic combination of their respective businesses, with Janus Capital surviving the merger as a direct wholly-owned subsidiary of Henderson (the “Transaction”). The Board was advised that, subject to certain conditions, the Transaction is currently expected to close during the second quarter of 2017.
As part of its due diligence, the Board developed an initial list of questions related to the proposed transaction, which was provided to Janus Capital on October 6, 2016. At a special Board meeting held on October 19, 2016, the Board considered Janus Capital’s response to the initial information request and met with the management of Janus to discuss the impact of the Transaction on the nature, extent and quality of services Janus Capital is expected to provide to the Janus Funds following the Transaction, addressing, among other matters, the personnel expected to provide such services, and the resources available to do so. After its October 19, 2016 meeting, the Board developed a supplemental request for additional information, which was provided to Janus Capital on October 26, 2016. At another special Board meeting held on November 7-8, 2016, the Board considered Janus Capital’s response to the supplemental information request and again met with the management of Janus and Henderson to discuss the impact of the Transaction on the nature, extent and quality of services Janus Capital is expected to provide to the Janus Funds following the Transaction, and also met with various officers of the Funds and of Janus Capital, including various Fund portfolio managers. After its November 7-8, 2016 meeting, the Board developed a second supplemental request for additional information, which was provided to Janus Capital on November 21, 2016. On December 7-8, 2016, the Board met to consider Janus Capital’s response to the second supplemental information request and to also consider the proposed new investment advisory agreements between the Trust, on behalf of each Fund, and Janus Capital (each, a “New Advisory Agreement” and collectively, the “New Advisory Agreements”) and the new sub-advisory agreements between Janus Capital and each of the Funds that utilize INTECH Investment Management LLC (“INTECH”), Perkins Investment Management LLC (“Perkins”), or Janus Singapore Pte. Limited (“Janus Singapore,” and together with INTECH and Perkins, the “Sub-Advisers” and each, a “Sub-Adviser”) as sub-advisers (each, a “New Sub-Advisory Agreement” and collectively, the “New Sub-Advisory Agreements”) to take effect immediately after the Transaction or shareholder approval, whichever is later. During each of these meetings, the Board sought additional and clarifying information as it deemed necessary or appropriate. In addition, the Board engaged its independent fee consultant to help evaluate certain of the proposals that the Board was being asked to consider. Throughout the process, the Board had the assistance of its independent legal counsel, who advised them on, among other things, its duties and obligations.
36 | MARCH 31, 2017 |
Janus Contrarian Fund
Additional Information (unaudited)
In connection with the Board’s review, Janus Capital provided, and the Board obtained, substantial information regarding the following matters: the management, financial position and business of Henderson; the history of Henderson’s business and operations; the investment performance of the investment companies advised by Henderson; the proposed structure, operations and investment processes of the combined investment management organization after the Transaction and the strategy for operating and growing the business following the Transaction; the future plans of Janus and Henderson with respect to the Funds and any proposed changes to the operations or structure of the Funds; and the future plans of Janus and Henderson with respect to the provision of services to the Funds, and the entities providing such services, including those affiliated with Janus. The Board also received information regarding the terms of the Transaction, anticipated management of the combined organization, the resources that each of Janus and Henderson bring to the combined organization and the process being followed by Janus and Henderson to integrate their organizations. The Board also received information regarding the impact of the Transaction on each of INTECH, Perkins and Janus Singapore.
In connection with the Board’s approval of New Advisory Agreements and New Sub-Advisory Agreements at its December 8, 2016 meeting, the Board also continued its on-going annual process to determine whether to continue the existing investment advisory agreements between Janus Capital and the Trust on behalf of each Fund (each, a “Current Advisory Agreement” and collectively, the “Current Advisory Agreements”) and the existing sub-advisory agreements between Janus Capital and each of the Funds that utilize INTECH, Perkins, or Janus Singapore as sub-advisers (each, a “Current Sub-Advisory Agreement” and collectively, the “Current Sub-Advisory Agreements”). In this regard, the Board received and reviewed information provided by Janus and the respective Sub-Advisers in response to requests of the Board and its independent legal counsel. The Board also received and reviewed information and analysis provided by, and in response to requests of, its independent fee consultant. The Board noted that as part of this annual process, the Board had considered and was in the process of considering, numerous factors, including the nature and quality of services provided by Janus Capital and each Sub-Adviser, as applicable; investment performance, on an absolute basis and relative to appropriate peer groups and one or a combination of market indices; investment management fees, expense ratios and asset sizes of the Funds and peer groups; investment management fees charged to comparable investment companies, separate accounts and non-fund clients; Janus Capital’s profitability from managing the Funds; fall-out benefits to Janus Capital from its relationship to the Funds, including revenues derived from services provided to the Funds by affiliates of Janus Capital; and the potential benefits to Janus Capital, the Funds of receiving research services from broker/dealer firms in connection with the allocation of portfolio transactions to such firms.
In determining whether to approve the New Advisory Agreement for each Fund and the New Sub-Advisory Agreement for Funds managed by INTECH, Perkins or Janus Singapore in connection with the Transaction, and whether to recommend approval to Fund shareholders, the Board received information and made inquiries into all matters as it deemed appropriate. The Board reviewed and analyzed various factors it deemed relevant, including the following factors, among others, none of which by itself was considered dispositive:
· The terms of the New Advisory Agreements are substantially similar to the corresponding Current Advisory Agreements, and the contractual fee rate will not change. In this regard, see the discussion of the Board’s considerations with respect to its most recent approval of the Current Advisory Agreements prior to December 8, 2016, as disclosed in each Fund’s most recent prior annual or semi-annual shareholder report, as applicable.
· The terms of the New Sub-Advisory Agreements are substantially similar to the corresponding Current Sub-Advisory Agreements, and the contractual fee rate will not change. In this regard, see the discussion of the Board’s considerations with respect to its most recent approval of the Current Sub-Advisory Agreements prior to December 8, 2016, as disclosed in each Fund’s most recent prior annual or semi-annual shareholder report, as applicable.
· Janus Capital’s plans for the operation of the Funds, including its plans for the continued provision of all services currently provided to the Funds by Janus Capital and its affiliates, including, among others, investment advisory services, portfolio trading services, and Fund administrative and accounting services, and the personnel and resources proposed to support the provision of such services.
· The estimated profitability to Janus Capital from managing the Funds after the Transaction, including potential economies of scale and fall-out benefits to Janus Capital from its relationship to the Funds, including revenues derived from services provided to the Funds by affiliates of Janus Capital, and the potential benefits to Janus
Janus Investment Fund | 37 |
Janus Contrarian Fund
Additional Information (unaudited)
Capital, and the Funds of receiving research services from broker/dealer firms in connection with the allocation of portfolio transactions to such firms.
In connection with its deliberations, the Board received assurances from Janus, on behalf of itself and its affiliates (collectively, “Janus”) including the following:
· Janus has provided to the Board such information as it believes is reasonably necessary to evaluate the New Advisory Agreements and New Sub-Advisory Agreements.
· Janus is committed to the continuance, without interruption, of services to the Funds of at least the type and quality currently provided by Janus Capital and its affiliates, or superior thereto.
· The Transaction is not expected to affect negatively the nature, extent or quality of the investment advisory services provided by Janus Capital to the Funds following the Transaction, and the investment advisory services are expected to be at least comparable to the services being provided under the Current Advisory Agreements and Current Sub-Advisory Agreements. In this regard, the Board noted specific representations that Janus does not intend for the nature, extent or quality of investment advisory and other services to be provided to the Funds following the Transaction to change, and the extent of such services were expected to increase based on the combined resources of the combined investment management organization after the Transaction, and should the nature, extent or quality of such services decline, Janus would commit the resources needed to return such services to pre-Transaction levels.
· The Funds’ current operations were expected to remain largely unchanged, except for certain fund reorganizations which will be separately considered by the Board, and such other changes as were or will be presented to the Board.
· Janus does not intend to make changes to the portfolio managers providing services to the Funds, other than proposed changes in the management of certain Funds as discussed with the Board, including those related to proposals to merge certain Funds with Funds managed by Henderson Global Investors (North America) Inc., an indirect, wholly-owned subsidiary of Henderson, and subject to such changes as may arise at any time as a result of the ongoing process of portfolio manager evaluation.
· After the Transaction, the extent of distribution and marketing services provided to the Janus Funds were expected to increase based on the combined resources of Janus and Henderson. In this regard, Janus Capital advised the Board that after the Transaction, the extent of distribution and marketing services provided to the Janus Funds are expected to increase based on the combined resources of Janus and Henderson. This is due primarily to the anticipated increase of sales related resources and expanded global presence of the combined Janus Henderson organization, which is expected to enhance visibility and brand recognition of the Janus Henderson Funds.
· The intent of Janus Capital to take the necessary and appropriate steps to retain and attract its key investment advisory personnel.
· The intent of Janus to take the necessary and appropriate steps to retain and attract its key compliance, financial, fund accounting and administrative personnel supporting the management and oversight of the Funds.
· Janus is not aware of any express or implied term, condition, arrangement or understanding that would impose in its best judgement an “unfair burden” on any Fund as a result of the Transaction, as defined in Section 15(f) of the 1940 Act, and that Janus will take no action that would have the effect of imposing such an “unfair burden” on any Fund in connection with the Transaction.
Janus assured the Board that it intended to comply with Section 15(f) of the Investment Company Act of 1940, as amended (the “1940 Act”). Section 15(f) provides a non-exclusive safe harbor for an investment adviser to an investment company or any of its affiliated persons to receive any amount or benefit in connection with a change in control of the investment adviser so long as two conditions are met. First, for a period of three years after the transaction, at least 75% of the board members of the investment company must not be interested persons of such investment adviser (as defined under the 1940 Act). The composition of the Board is in compliance with this provision of Section 15(f). In addition, after careful review and consideration, the Board determined that it would be in the best interests of the Funds to add to the Board an individual who currently acts as a non-interested board member of the
38 | MARCH 31, 2017 |
Janus Contrarian Fund
Additional Information (unaudited)
Henderson Trust. The Board believes that this change in the Board composition will provide perspective and insight relating to experience working with the Henderson organization. The Board’s Nominating and Governance Committee considered a number of candidates and recommended that the Board nominate one proposed new trustee from those candidates who currently act as non-interested board members of the Henderson Trust. The Board approved that trustee nominee to serve on the Board, subject to election by the shareholders of the Funds and contingent on the closing of the Transaction. If the new trustee is elected and serves on the Board, the Board composition would continue to satisfy the provisions of Section 15(f).
To meet the second condition of Section 15(f), an “unfair burden” must not be imposed upon the investment company as a result of such transaction or any express or implied terms, conditions or understandings applicable thereto. The term “unfair burden” is defined in Section 15(f) to include any arrangement during the two-year period after the transaction, whereby the investment adviser, or any interested person of such adviser, receives or is entitled to receive any compensation, directly or indirectly, from the investment company or its shareholders (other than fees for bona fide investment advisory or other services) or from any person in connection with the purchase or sale of securities or other property to, from or on behalf of the investment company (other than bona fide ordinary compensation as principal underwriter for such investment company).
Janus represented that it does not believe that an “unfair burden” will be placed on the Funds as a result of the Transaction. In furtherance thereof, Janus has undertaken to pay the costs of preparing and distributing proxy materials to, and of holding the meetings of, the Funds’ shareholders (the “Meetings”), as well as other fees and expenses in connection with the Transaction, including the reasonable fees and expenses of legal counsel and consultants to the Funds and the Trustees. In addition, Janus has agreed, for a period of two years following the closing of the Transaction, (i) not to request any increases to advisory fees for the Funds, other than those proposed to and approved by the Board prior to the close of the Transaction, and (ii) to continue to use the current process by which expense caps are set annually for the Funds.
As a result of its review and consideration of the New Investment Advisory Agreements and New Sub-Advisory Agreements in connection with the Transaction, at a meeting on December 8, 2016, the Board voted unanimously to approve a New Investment Advisory Agreement for each Fund and a New Sub-Advisory Agreement for each Fund managed by INTECH, Perkins or Janus Singapore, and to recommend such agreements to the Funds’ shareholders for their approval.
Approval of Interim Advisory and Sub-Advisory Agreements with Janus and Janus Affiliates during the Period
In the event shareholders of a Fund do not approve such Fund’s New Advisory Agreement and/or New Sub-Advisory Agreement at the Meetings prior to the closing of the Transaction, Janus Capital proposed that an interim investment advisory agreement between Janus Capital and such Fund (each, an “Interim Advisory Agreement” and collectively, the “Interim Advisory Agreements”) and an interim sub-advisory agreement between Janus Capital and the applicable Sub-Adviser (each, an “Interim Sub-Advisory Agreement” and collectively, the “Interim Sub-Advisory Agreements”) take effect upon the closing of the Transaction. At the December 8, 2016 meeting, the Board, all of whom are Independent Trustees, unanimously approved an Interim Advisory Agreement for each Fund and an Interim Sub-Advisory Agreement for each applicable Fund in order to assure continuity of investment advisory services to the Funds and sub-advisory services to the sub-advised Funds after the Transaction. The terms of each Interim Advisory Agreement are substantially identical to those of the applicable Current Advisory Agreement and New Advisory Agreement, except for the term and escrow provisions described below. Similarly, the terms of each Interim Sub-Advisory Agreement are substantially identical to those of the Current Sub-Advisory Agreements and New Sub-Advisory Agreements, except for the term and escrow provisions described below. The Interim Advisory Agreement and Interim Sub-Advisory Agreement will continue in effect for a term ending on the earlier of 150 days from the closing of the Transaction (the “150-day period”) or when shareholders of the Fund approve the New Advisory Agreement and/or New Sub-Advisory Agreement. Pursuant to Rule 15a-4 under the 1940 Act, compensation earned by Janus Capital under an Interim Advisory Agreement and compensation earned by a Sub-Adviser under an Interim Sub-Advisory Agreement will be held in an interest-bearing escrow account. If shareholders of a Fund approve the New Advisory Agreement prior to the end of the 150-day period, the amount held in the escrow account under the Interim Advisory Agreement will be paid to Janus Capital. If shareholders of a Fund approve the New Advisory Agreement and New Sub-Advisory Agreement prior to the end of the 150-day period, the amount held in the escrow account under the Interim Sub-Advisory Agreement will be paid to the Sub-Adviser. If shareholders of a Fund do not approve the New Advisory Agreement prior to the end of the 150-day period, the Board will take such action as it
Janus Investment Fund | 39 |
Janus Contrarian Fund
Additional Information (unaudited)
deems to be in the best interests of the Fund, and Janus Capital will be paid the lesser of its costs incurred in performing its services under the Interim Advisory Agreement or the total amount in the escrow account, plus interest earned. If shareholders of a Fund do not approve the New Advisory Agreement and/or New Sub-Advisory Agreement prior to the end of the 150-day period, the Board will take such action as it deems to be in the best interests of the Fund, and the Sub-Adviser will be paid the lesser of its costs incurred in performing its services under the Interim Sub-Advisory Agreement or the total amount in the escrow account, plus interest earned.
Approval of Sub-Advisory Agreements with Henderson Investment Management Limited during the Period
Janus Capital met with the Trustees on November 7-8, 2016, and December 7-8, 2016, to discuss the approval of a new sub-advisory agreement between Janus Capital and Henderson Investment Management Limited (“HIML”) (each, a “HIML Sub-Advisory Agreement” and collectively, the “HIML Sub-Advisory Agreements”) on behalf of each of Janus Asia Equity Fund, Janus Emerging Markets Fund, and Janus Global Real Estate Fund (each, an “HIML Fund” and together, the “HIML Funds”) to take effect immediately after the closing of the Transaction or shareholder approval, whichever is later. At the meetings, the Trustees also discussed the HIML Sub-Advisory Agreements with their independent counsel in executive session. During the course of these meetings, the Trustees requested and considered such information as they deemed relevant to their deliberations. In addition, at prior meetings and during the course of these meetings the Board also undertook a comprehensive process to evaluate the impact of the Transaction on the nature, quality and extent of services expected to be provided by Janus Capital and HIML to each HIML Fund, including after the completion of the Transaction. For a fuller discussion of the Board’s consideration of the approval of a new investment advisory agreement for the HIML Funds in connection with the Transaction, see “Approval of Advisory and Sub-Advisory Agreements with Janus and its Affiliates During the Period” above.
At a meeting of the Board of Trustees held on December 8, 2016, the Trustees considered the HIML Sub-Advisory Agreements. In determining whether to approve the HIML Sub-Advisory Agreements, and whether to recommend approval to the shareholders of each HIML Fund, the Board received information and made inquiries into all matters as it deemed appropriate. The Board reviewed and analyzed various factors it deemed relevant, including the following factors, among others, none of which by itself was considered dispositive:
· the terms of each HIML Sub-Advisory Agreement;
· the nature, quality and extent of services expected to be provided under the HIML Sub-Advisory Agreements, including the reputation, qualifications and background of HIML and its operational and compliance infrastructures;
· the investment approach, the experience and skills of senior management and investment personnel of HIML, including the portfolio managers who would be responsible for managing all or part of the portfolio of each HIML Fund, noting the resources made available to such personnel;
· the ability of HIML to attract and retain high-quality personnel and the organizational depth of HIML;
· the sub-advisory fee rate under each HIML Sub-Advisory Agreement, as well as the overall management fee structure of each HIML Fund, noting that the sub-advisory fee rate is consistent with the approach utilized in the Janus Funds complex for other sub-advisory relationships, taking into account the allocation of managed assets between Janus Capital and HIML for the Global Real Estate Fund;
· under each HIML Sub-Advisory Agreement, Janus Capital would be responsible for paying HIML out of its fees;
· the fall out benefits to HIML and its affiliates from its relationship with each HIML Fund, including the potential benefits to HIML and its affiliates and each HIML Fund of receiving research services from broker/dealer firms in connection with the allocation of portfolio transactions to such firms;
· the potential for economies of scale with respect to the overall fee structure of each HIML Fund and whether either Fund will benefit from any economies of scale; and
· the costs of seeking approval of the HIML Sub-Advisory Agreements will not be borne by the HIML Funds.
As a result of its review and consideration of each HIML Sub-Advisory Agreement and related matters, on December 8, 2016, the Board voted unanimously to approve each HIML Sub-Advisory Agreement and to recommend such agreement to each HIML Fund’s shareholders for their approval.
40 | MARCH 31, 2017 |
Janus Contrarian Fund
Additional Information (unaudited)
Renewal of Investment Advisory and Sub-Advisory Agreements for INTECH U.S. Core Fund
As noted above, at its December 8, 2016 meeting, the Board continued its on-going annual process to determine whether to continue the Current Advisory Agreements and the Current Sub-Advisory Agreements. In this regard, the Board received and reviewed information provided by Janus and the respective Sub-Advisers in response to requests of the Board and its independent legal counsel. The Board also received and reviewed information and analysis provided by, and in response to requests of, its independent fee consultant. The Board noted that the Current Advisory Agreement between the Trust, on behalf of INTECH U.S. Core Fund, and Janus Capital and the Current Sub-Advisory Agreement between Janus Capital and INTECH, on behalf of the Fund, would expire on January 1, 2017, if not renewed. The Board noted that the date of termination for the Current Advisory Agreements and the Current Sub-Advisory Agreements for the other Funds was February 1, 2017, if not renewed. Accordingly, the Board voted unanimously to renew the Current Advisory Agreement and the Current Sub-Advisory Agreement for INTECH U.S. Core Fund through January 31, 2017 in order to (i) align the termination date of such Agreements with the termination date of the Current Advisory Agreements and the Current Sub-Advisory Agreements for the other Funds and (ii) allow for a more complete consideration of such Agreements, as well as the Current Advisory Agreements and the Current Sub-Advisory Agreements for the other Funds.
APPROVAL OF ADVISORY AGREEMENTS DURING THE PERIOD
The Trustees of Janus Investment Fund and Janus Aspen Series, each of whom serves as an “independent” Trustee (the “Trustees”), oversee the management of each Fund of Janus Investment Fund and each Portfolio of Janus Aspen Series (each, a “Fund” and collectively, the “Funds”), and as required by law, determine annually whether to continue the investment advisory agreement for each Fund and the subadvisory agreements for the 16 Funds that utilize subadvisers.
In connection with their most recent consideration of those agreements for each Fund, the Trustees received and reviewed information provided by Janus Capital and the respective subadvisers in response to requests of the Trustees and their independent legal counsel. They also received and reviewed information and analysis provided by, and in response to requests of, their independent fee consultant. Throughout their consideration of the agreements, the Trustees were advised by their independent legal counsel. The Trustees met with management to consider the agreements, and also met separately in executive session with their independent legal counsel and their independent fee consultant.
Additionally, in connection with their consideration of whether to continue the investment advisory agreement and subadvisory agreement for each Fund, as applicable, the Trustees also received and reviewed information in connection with the proposed transaction to combine the respective businesses of Henderson Group plc and Janus Capital Group, Inc., the parent company of Janus Capital (the “Transaction”), announced in October 2016, which Janus Capital advised the Trustees was expected to close in the second quarter of 2017. In this regard, the Trustees reviewed information regarding the impact of the Transaction on the services to be provided by Janus Capital and each subadviser, as applicable, to the Funds under such agreements both prior to the close of the Transaction, and afterwards, if the Transaction were not to close. If the Transaction closes, all such agreements would be replaced by new investment advisory agreements and subadvisory agreements, as applicable, for each Fund, assuming requisite Fund shareholder approvals have been obtained.
At a meeting held on January 26, 2017, based on the Trustees’ evaluation of the information provided by Janus Capital, the subadvisers, and the independent fee consultant, as well as other information, the Trustees determined that the overall arrangements between each Fund and Janus Capital and each subadviser, as applicable, were fair and reasonable in light of the nature, extent and quality of the services provided by Janus Capital, its affiliates and the subadvisers, the fees charged for those services, and other matters that the Trustees considered relevant in the exercise of their business judgment. At that meeting, the Trustees unanimously approved the continuation of the investment advisory agreement for each Fund, and the subadvisory agreement for each subadvised Fund, for the period from February 1, 2017 through February 1, 2018, subject to earlier termination as provided for in each agreement.
In considering the continuation of those agreements, the Trustees reviewed and analyzed various factors that they determined were relevant, including the factors described below, none of which by itself was considered dispositive. However, the material factors and conclusions that formed the basis for the Trustees’ determination to approve the continuation of the agreements are discussed separately below. Also included is a summary of the independent fee consultant’s conclusions and opinions that arose during, and were included as part of, the Trustees’ consideration of the
Janus Investment Fund | 41 |
Janus Contrarian Fund
Additional Information (unaudited)
agreements. “Management fees,” as used herein, reflect actual annual advisory fees and any administration fees (excluding out of pocket costs), net of any waivers.
Nature, Extent and Quality of Services
The Trustees reviewed the nature, extent and quality of the services provided by Janus Capital and the subadvisers to the Funds, taking into account the investment objective, strategies and policies of each Fund, and the knowledge the Trustees gained from their regular meetings with management on at least a quarterly basis and their ongoing review of information related to the Funds. In addition, the Trustees reviewed the resources and key personnel of Janus Capital and each subadviser, particularly noting those employees who provide investment and risk management services to the Funds. The Trustees also considered other services provided to the Funds by Janus Capital or the subadvisers, such as managing the execution of portfolio transactions and the selection of broker-dealers for those transactions. The Trustees considered Janus Capital’s role as administrator to the Funds, noting that Janus Capital does not receive a fee for its services but is reimbursed for its out-of-pocket costs. The Trustees considered the role of Janus Capital in monitoring adherence to the Funds’ investment restrictions, providing support services for the Trustees and Trustee committees, and overseeing communications with shareholders and the activities of other service providers, including monitoring compliance with various policies and procedures of the Funds and with applicable securities laws and regulations.
In this regard, the independent fee consultant noted that Janus Capital provides a number of different services for the Funds and Fund shareholders, ranging from investment management services to various other servicing functions, and that, in its opinion, Janus Capital is a capable provider of those services. The independent fee consultant also provided its belief that Janus Capital has developed a number of institutional competitive advantages that should enable it to provide superior investment and service performance over the long term.
The Trustees concluded that the nature, extent and quality of the services provided by Janus Capital or the subadviser to each Fund were appropriate and consistent with the terms of the respective advisory and subadvisory agreements, and that, taking into account steps taken to address those Funds whose performance lagged that of their peers for certain periods, the Funds were likely to benefit from the continued provision of those services. They also concluded that Janus Capital and each subadviser had sufficient personnel, with the appropriate education and experience, to serve the Funds effectively and had demonstrated its ability to attract well-qualified personnel.
Performance of the Funds
The Trustees considered the performance results of each Fund over various time periods. They noted that they considered Fund performance data throughout the year, including periodic meetings with each Fund’s portfolio manager(s), and also reviewed information comparing each Fund’s performance with the performance of comparable funds and peer groups identified by Broadridge Financial Solutions, Inc. (“Broadridge”), an independent data provider, and with the Fund’s benchmark index. In this regard, the independent fee consultant found that the overall Funds’ performance has been strong: for the 36 months ended September 30, 2016, approximately 76% of the Funds were in the top two Broadridge quartiles of performance, and for the 12 months ended September 30, 2016, approximately 47% of the Funds were in the top two Broadridge quartiles of performance.
The Trustees considered the performance of each Fund, noting that performance may vary by share class, and noted the following:
Fixed-Income Funds and Money Market Funds
· For Janus Flexible Bond Fund, the Trustees noted that the Fund’s performance was in the second Broadridge quartile for the 36 months ended May 31, 2016 and the third Broadridge quartile for the 12 months ended May 31, 2016.
· For Janus Global Bond Fund, the Trustees noted that the Fund’s performance was in the second Broadridge quartile for the 36 months ended May 31, 2016 and the third Broadridge quartile for the 12 months ended May 31, 2016.
· For Janus Global Unconstrained Bond Fund, the Trustees noted that the Fund’s performance was in the first Broadridge quartile for the 12 months ended May 31, 2016.
42 | MARCH 31, 2017 |
Janus Contrarian Fund
Additional Information (unaudited)
· For Janus High-Yield Fund, the Trustees noted that the Fund’s performance was in the second Broadridge quartile for the 36 months ended May 31, 2016 and the second Broadridge quartile for the 12 months ended May 31, 2016.
· For Janus Multi-Sector Income Fund, the Trustees noted that the Fund’s performance was in the first Broadridge quartile for the 12 months ended May 31, 2016.
· For Janus Real Return Fund, the Trustees noted that the Fund’s performance was in the first Broadridge quartile for the 36 months ended May 31, 2016 and the first Broadridge quartile for the 12 months ended May 31, 2016.
· For Janus Short-Term Bond Fund, the Trustees noted that the Fund’s performance was in the second Broadridge quartile for the 36 months ended May 31, 2016 and the third Broadridge quartile for the 12 months ended May 31, 2016.
· For Janus Government Money Market Fund, the Trustees noted that the Fund’s performance was in the third Broadridge quartile for the 36 months ended May 31, 2016 and the third Broadridge quartile for the 12 months ended May 31, 2016. The Trustees noted the reasons for the Fund’s underperformance.
· For Janus Money Market Fund, the Trustees noted that the Fund’s performance was in the bottom Broadridge quartile for the 36 months ended May 31, 2016 and the bottom Broadridge quartile for the 12 months ended May 31, 2016. The Trustees noted the reasons for the Fund’s underperformance.
Asset Allocation Funds
· For Janus Global Allocation Fund – Conservative, the Trustees noted that the Fund’s performance was in the second Broadridge quartile for the 36 months ended May 31, 2016 and the bottom Broadridge quartile for the 12 months ended May 31, 2016.
· For Janus Global Allocation Fund – Growth, the Trustees noted that the Fund’s performance was in the bottom Broadridge quartile for the 36 months ended May 31, 2016 and the bottom Broadridge quartile for the 12 months ended May 31, 2016. The Trustees noted the reasons for the Fund’s underperformance and the steps Janus Capital had taken or was taking to improve performance.
· For Janus Global Allocation Fund – Moderate, the Trustees noted that the Fund’s performance was in the third Broadridge quartile for the 36 months ended May 31, 2016 and the bottom Broadridge quartile for the 12 months ended May 31, 2016. The Trustees noted the reasons for the Fund’s underperformance and the steps Janus Capital had taken or was taking to improve performance.
Alternative Fund
· For Janus Diversified Alternatives Fund, the Trustees noted that the Fund’s performance was in the third Broadridge quartile for the 36 months ended May 31, 2016 and the third Broadridge quartile for the 12 months ended May 31, 2016. The Trustees noted the reasons for the Fund’s underperformance and the steps Janus Capital had taken or was taking to improve performance.
Value Funds
· For Perkins International Value Fund, the Trustees noted that the Fund’s performance was in the second Broadridge quartile for the 36 months ended May 31, 2016 and the first Broadridge quartile for the 12 months ended May 31, 2016.
· For Perkins Global Value Fund, the Trustees noted that the Fund’s performance was in the second Broadridge quartile for the 36 months ended May 31, 2016 and the first Broadridge quartile for the 12 months ended May 31, 2016.
· For Perkins Large Cap Value Fund, the Trustees noted that the Fund’s performance was in the third Broadridge quartile for the 36 months ended May 31, 2016 and the first Broadridge quartile for the 12 months ended May 31, 2016. The Trustees noted the reasons for the Fund’s underperformance, noting that the Fund has a performance fee structure that results in lower management fees during periods of underperformance, the steps Janus Capital and Perkins had taken or were taking to improve performance, and that the performance trend was improving.
Janus Investment Fund | 43 |
Janus Contrarian Fund
Additional Information (unaudited)
· For Perkins Mid Cap Value Fund, the Trustees noted that the Fund’s performance was in the bottom Broadridge quartile for the 36 months ended May 31, 2016 and the first Broadridge quartile for the 12 months ended May 31, 2016. The Trustees noted the reasons for the Fund’s underperformance, noting that the Fund has a performance fee structure that results in lower management fees during periods of underperformance, the steps Janus Capital and Perkins had taken or were taking to improve performance, and that the performance trend was improving.
· For Perkins Select Value Fund, the Trustees noted that the Fund’s performance was in the second Broadridge quartile for the 36 months ended May 31, 2016 and the first Broadridge quartile for the 12 months ended May 31, 2016.
· For Perkins Small Cap Value Fund, the Trustees noted that the Fund’s performance was in the first Broadridge quartile for the 36 months ended May 31, 2016 and the first Broadridge quartile for the 12 months ended May 31, 2016.
· For Perkins Value Plus Income Fund, the Trustees noted that the Fund’s performance was in the second Broadridge quartile for the 36 months ended May 31, 2016 and the second Broadridge quartile for the 12 months ended May 31, 2016.
Mathematical Funds
· For INTECH Emerging Markets Managed Volatility Fund, the Trustees noted that the Fund’s performance was in the second Broadridge quartile for the 12 months ended May 31, 2016.
· For INTECH Global Income Managed Volatility Fund, the Trustees noted that the Fund’s performance was in the first Broadridge quartile for the 36 months ended May 31, 2016 and the first Broadridge quartile for the 12 months ended May 31, 2016.
· For INTECH International Managed Volatility Fund, the Trustees noted that the Fund’s performance was in the first Broadridge quartile for the 36 months ended May 31, 2016 and the first Broadridge quartile for the 12 months ended May 31, 2016.
· For INTECH U.S. Core Fund, the Trustees noted that the Fund’s performance was in the first Broadridge quartile for the 36 months ended May 31, 2016 and the first Broadridge quartile for the 12 months ended May 31, 2016.
· For INTECH U.S. Managed Volatility Fund, the Trustees noted that the Fund’s performance was in the first Broadridge quartile for the 36 months ended May 31, 2016 and the first Broadridge quartile for the 12 months ended May 31, 2016.
Growth and Core Funds
· For Janus Balanced Fund, the Trustees noted that the Fund’s performance was in the first Broadridge quartile for the 36 months ended May 31, 2016 and the third Broadridge quartile for the 12 months ended May 31, 2016.
· For Janus Contrarian Fund, the Trustees noted that the Fund’s performance was in the bottom Broadridge quartile for the 36 months ended May 31, 2016 and the bottom Broadridge quartile for the 12 months ended May 31, 2016. The Trustees noted the reasons for the Fund’s underperformance, noting that the Fund has a performance fee structure that results in lower management fees during periods of underperformance, and the steps Janus Capital had taken or was taking to improve performance.
· For Janus Enterprise Fund, the Trustees noted that the Fund’s performance was in the first Broadridge quartile for the 36 months ended May 31, 2016 and the first Broadridge quartile for the 12 months ended May 31, 2016.
· For Janus Forty Fund, the Trustees noted that the Fund’s performance was in the first Broadridge quartile for the 36 months ended May 31, 2016 and the first Broadridge quartile for the 12 months ended May 31, 2016.
· For Janus Fund, the Trustees noted that the Fund’s performance was in the first Broadridge quartile for the 36 months ended May 31, 2016 and the second Broadridge quartile for the 12 months ended May 31, 2016.
44 | MARCH 31, 2017 |
Janus Contrarian Fund
Additional Information (unaudited)
· For Janus Growth and Income Fund, the Trustees noted that the Fund’s performance was in the second Broadridge quartile for the 36 months ended May 31, 2016 and in the second Broadridge quartile for the 12 months ended May 31, 2016.
· For Janus Research Fund, the Trustees noted that the Fund’s performance was in the first Broadridge quartile for the 36 months ended May 31, 2016 and the second Broadridge quartile for the 12 months ended May 31, 2016.
· For Janus Triton Fund, the Trustees noted that the Fund’s performance was in the first Broadridge quartile for the 36 months ended May 31, 2016 and the first Broadridge quartile for the 12 months ended May 31, 2016.
· For Janus Twenty Fund, the Trustees noted that the Fund’s performance was in the third Broadridge quartile for the 36 months ended May 31, 2016 and the first Broadridge quartile for the 12 months ended May 31, 2016. The Trustees noted the reasons for the Fund’s underperformance, noting that the Fund has a performance fee structure that results in lower management fees during periods of underperformance, the steps Janus Capital had taken or was taking to improve performance, and that the performance trend was improving.
· For Janus Venture Fund, the Trustees noted that the Fund’s performance was in the first Broadridge quartile for the 36 months ended May 31, 2016 and the second Broadridge quartile for the 12 months ended May 31, 2016.
Global and International Funds
· For Janus Adaptive Global Allocation Fund, the Trustees noted that, due to limited performance for the Fund, performance history was not a material factor.
· For Janus Asia Equity Fund, the Trustees noted that the Fund’s performance was in the third Broadridge quartile for the 36 months ended May 31, 2016 and the bottom Broadridge quartile for the 12 months ended May 31, 2016. The Trustees noted the reasons for the Fund’s underperformance, noting that the Fund has a performance fee structure that results in lower management fees during periods of underperformance, and the steps Janus Capital had taken or was taking to improve performance.
· For Janus Emerging Markets Fund, the Trustees noted that the Fund’s performance was in the first Broadridge quartile for the 36 months ended May 31, 2016 and the third Broadridge quartile for the 12 months ended May 31, 2016.
· For Janus Global Life Sciences Fund, the Trustees noted that the Fund’s performance was in the first Broadridge quartile for the 36 months ended May 31, 2016 and the bottom Broadridge quartile for the 12 months ended May 31, 2016.
· For Janus Global Real Estate Fund, the Trustees noted that the Fund’s performance was in the third Broadridge quartile for the 36 months ended May 31, 2016 and the bottom Broadridge quartile for the 12 months ended May 31, 2016. The Trustees noted the reasons for the Fund’s underperformance, noting that the Fund has a performance fee structure that results in lower management fees during periods of underperformance, and the steps Janus Capital had taken or was taking to improve performance.
· For Janus Global Research Fund, the Trustees noted that the Fund’s performance was in the third Broadridge quartile for the 36 months ended May 31, 2016 and the bottom Broadridge quartile for the 12 months ended May 31, 2016. The Trustees noted the reasons for the Fund’s underperformance, noting that the Fund has a performance fee structure that results in lower management fees during periods of underperformance, and the steps Janus Capital had taken or was taking to improve performance.
· For Janus Global Select Fund, the Trustees noted that the Fund’s performance was in the bottom Broadridge quartile for the 36 months ended May 31, 2016 and the bottom Broadridge quartile for the 12 months ended May 31, 2016. The Trustees noted the reasons for the Fund’s underperformance and the steps Janus Capital had taken or was taking to improve performance.
· For Janus Global Technology Fund, the Trustees noted that the Fund’s performance was in the third Broadridge quartile for the 36 months ended May 31, 2016 and the first Broadridge quartile for the 12 months
Janus Investment Fund | 45 |
Janus Contrarian Fund
Additional Information (unaudited)
ended May 31, 2016. The Trustees noted the reasons for the Fund’s underperformance, the steps Janus Capital had taken or was taking to improve performance, and that the performance trend was improving.
· For Janus International Equity Fund, the Trustees noted that the Fund’s performance was in the bottom Broadridge quartile for the 36 months ended May 31, 2016 and the bottom Broadridge quartile for the 12 months ended May 31, 2016. The Trustees noted the reasons for the Fund’s underperformance, noting that the Fund has a performance fee structure that results in lower management fees during periods of underperformance, and the steps Janus Capital had taken or was taking to improve performance.
· For Janus Overseas Fund, the Trustees noted that the Fund’s performance was in the bottom Broadridge quartile for the 36 months ended May 31, 2016 and the bottom Broadridge quartile for the 12 months ended May 31, 2016. The Trustees noted the reasons for the Fund’s underperformance, noting that the Fund has a performance fee structure that results in lower management fees during periods of underperformance, and the steps Janus Capital had taken or was taking to improve performance.
Janus Aspen Series
· For Janus Aspen Balanced Portfolio, the Trustees noted that the Fund’s performance was in the first Broadridge quartile for the 36 months ended May 31, 2016 and the third Broadridge quartile for the 12 months ended May 31, 2016.
· For Janus Aspen Enterprise Portfolio, the Trustees noted that the Fund’s performance was in the first Broadridge quartile for the 36 months ended May 31, 2016 and the first Broadridge quartile for the 12 months ended May 31, 2016.
· For Janus Aspen Flexible Bond Portfolio, the Trustees noted that the Fund’s performance was in the second Broadridge quartile for the 36 months ended May 31, 2016 and the bottom Broadridge quartile for the 12 months ended May 31, 2016.
· For Janus Aspen Forty Portfolio, the Trustees noted that the Fund’s performance was in the first Broadridge quartile for the 36 months ended May 31, 2016 and the first Broadridge quartile for the 12 months ended May 31, 2016.
· For Janus Aspen Global Allocation Portfolio – Moderate, the Trustees noted that the Fund’s performance was in the bottom Broadridge quartile for the 36 months ended May 31, 2016 and the bottom Broadridge quartile for the 12 months ended May 31, 2016. The Trustees noted the reasons for the Fund’s underperformance and the steps Janus Capital had taken or was taking to improve performance.
· For Janus Aspen Global Research Portfolio, the Trustees noted that the Fund’s performance was in the third Broadridge quartile for the 36 months ended May 31, 2016 and the bottom Broadridge quartile for the 12 months ended May 31, 2016. The Trustees noted the reasons for the Fund’s underperformance, noting that the Fund has a performance fee structure that results in lower management fees during periods of underperformance, and the steps Janus Capital had taken or was taking to improve performance.
· For Janus Aspen Global Technology Portfolio, the Trustees noted that the Fund’s performance was in the third Broadridge quartile for the 36 months ended May 31, 2016 and the second Broadridge quartile for the 12 months ended May 31, 2016. The Trustees noted the reasons for the Fund’s underperformance and the steps Janus Capital had taken or was taking to improve performance.
· For Janus Aspen Global Unconstrained Bond Portfolio, the Trustees noted that the Fund’s performance was in the second Broadridge quartile for the 12 months ended May 31, 2016.
· For Janus Aspen INTECH U.S. Low Volatility Portfolio, the Trustees noted that the Fund’s performance was in the first Broadridge quartile for the 36 months ended May 31, 2016 and the first Broadridge quartile for the 12 months ended May 31, 2016.
· For Janus Aspen Janus Portfolio, the Trustees noted that the Fund’s performance was in the first Broadridge quartile for the 36 months ended May 31, 2016 and the second Broadridge quartile for the 12 months ended May 31, 2016.
46 | MARCH 31, 2017 |
Janus Contrarian Fund
Additional Information (unaudited)
· For Janus Aspen Overseas Portfolio, the Trustees noted that the Fund’s performance was in the bottom Broadridge quartile for the 36 months ended May 31, 2016 and the bottom Broadridge quartile for the 12 months ended May 31, 2016. The Trustees noted the reasons for the Fund’s underperformance, noting that the Fund has a performance fee structure that results in lower management fees during periods of underperformance, and the steps Janus Capital had taken or was taking to improve performance.
· For Janus Aspen Perkins Mid Cap Value Portfolio, the Trustees noted that the Fund’s performance was in the bottom Broadridge quartile for the 36 months ended May 31, 2016 and the first Broadridge quartile for the 12 months ended May 31, 2016.The Trustees noted the reasons for the Fund’s underperformance, noting that the Fund has a performance fee structure that results in lower management fees during periods of underperformance, the steps Janus Capital and Perkins had taken or were taking to improve performance, and that the performance trend was improving.
In consideration of each Fund’s performance, the Trustees concluded that, taking into account the factors relevant to performance, as well as other considerations, including steps taken to improve performance, the Fund’s performance warranted continuation of the Fund’s investment advisory and subadvisory agreement(s).
Costs of Services Provided
The Trustees examined information regarding the fees and expenses of each Fund in comparison to similar information for other comparable funds as provided by Broadridge, an independent data provider. They also reviewed an analysis of that information provided by their independent fee consultant and noted that the rate of management (investment advisory and any administration, but excluding out-of-pocket costs) fees for many of the Funds, after applicable waivers, was below the average management fee rate of the respective peer group of funds selected by an independent data provider. The Trustees also examined information regarding the subadvisory fees charged for subadvisory services, as applicable, noting that all such fees were paid by Janus Capital out of its management fees collected from such Fund.
The independent fee consultant provided its belief that the management fees charged by Janus Capital to each of the Funds under the current investment advisory and administration agreements are reasonable in relation to the services provided by Janus Capital. The independent fee consultant found: (1) the total expenses and management fees of the Funds to be reasonable relative to other mutual funds; (2) total expenses, on average, were 12% below the average total expenses of their respective Broadridge Expense Group peers and 20% below the average total expenses for their Broadridge Expense Universes; (3) management fees for the Funds, on average, were 11% below the average management fees for their Expense Groups and 13% below the average for their Expense Universes; and (4) Fund expenses at the functional level for each asset and share class category were reasonable. The Trustees also considered the total expenses for each share class of each Fund compared to the average total expenses for its Broadridge Expense Group peers and to average total expenses for its Broadridge Expense Universe.
The independent fee consultant concluded that, based on its strategic review of expenses at the complex, category and individual fund level, Fund expenses were found to be reasonable relative to both Expense Group and Expense Universe benchmarks. Further, for certain Funds, the independent fee consultant also performed a systematic “focus list” analysis of expenses in the context of the performance or service delivered to each set of investors in each share class in each selected Fund. Based on this analysis, the independent fee consultant found that the combination of service quality/performance and expenses on these individual Funds and share classes were reasonable in light of performance trends, performance histories, and existence of performance fees, breakpoints, and expense waivers on such Funds.
The Trustees considered the methodology used by Janus Capital and each subadviser in determining compensation payable to portfolio managers, the competitive environment for investment management talent, and the competitive market for mutual funds in different distribution channels.
The Trustees also reviewed management fees charged by Janus Capital and each subadviser to comparable separate account clients and to comparable non-affiliated funds subadvised by Janus Capital or by a subadviser (for which Janus Capital or the subadviser provides only or primarily portfolio management services). Although in most instances subadvisory and separate account fee rates for various investment strategies were lower than management fee rates for Funds having a similar strategy, the Trustees considered that Janus Capital noted that, under the terms of the management agreements with the Funds, Janus Capital performs significant additional services for the Funds that it does not provide to those other clients, including administration services, oversight of the Funds’ other service providers,
Janus Investment Fund | 47 |
Janus Contrarian Fund
Additional Information (unaudited)
trustee support, regulatory compliance and numerous other services, and that, in serving the Funds, Janus Capital assumes many legal risks and other costs that it does not assume in servicing its other clients. Moreover, they noted that the independent fee consultant found that: (1) the management fees Janus Capital charges to the Funds are reasonable in relation to the management fees Janus Capital charges to its institutional and subadvised accounts; (2) these institutional and subadvised accounts have different service and infrastructure needs; (3) Janus mutual fund investors enjoy reasonable fees relative to the fees charged to Janus institutional and subadvised fund investors; and (4) in the majority of cases, the Funds receive proportionally better pricing than the industry in relation to Janus institutional and subadvised accounts.
The Trustees considered the fees for each Fund for its fiscal year ended in 2015, and noted the following with regard to each Fund’s total expenses, net of applicable fee waivers (the Fund’s “total expenses”):
Fixed-Income Funds and Money Market Funds
· For Janus Flexible Bond Fund, the Trustees noted that, although the Fund’s total expenses exceeded the peer group average for certain share classes, overall the Fund’s total expenses were reasonable. The Trustees also noted that Janus Capital has contractually agreed to limit the Fund’s expenses, although this limit did not apply because the Fund’s total expenses were already below the applicable fee limit.
· For Janus Global Bond Fund, the Trustees noted that although the Fund’s total expenses exceeded the peer group average for certain share classes, overall the Fund’s total expenses were reasonable. The Trustees also noted that Janus Capital has contractually agreed to limit the Fund’s expenses.
· For Janus Global Unconstrained Bond Fund, the Trustees noted that although the Fund’s total expenses exceeded the peer group average for certain share classes, overall the Fund’s total expenses were reasonable. The Trustees also noted that Janus Capital has contractually agreed to limit the Fund’s expenses.
· For Janus High-Yield Fund, the Trustees noted that, although the Fund’s total expenses exceeded the peer group average for certain share classes, overall the Fund’s total expenses were reasonable. The Trustees also noted that Janus Capital has contractually agreed to limit the Fund’s expenses, although this limit did not apply because the Fund’s total expenses were already below the applicable fee limit.
· For Janus Multi-Sector Income Fund, the Trustees noted that, although the Fund’s total expenses exceeded the peer group average for one share class, overall the Fund’s total expenses were reasonable. The Trustees also noted that Janus has contractually agreed to limit the Fund’s expenses.
· For Janus Real Return Fund, the Trustees noted that, although the Fund’s total expenses were equal to or exceeded the peer group average for all share classes, overall the Fund’s total expenses were reasonable. The Trustees also noted that Janus Capital has contractually agreed to limit the Fund’s expenses.
· For Janus Short-Term Bond Fund, the Trustees noted that, although the Fund’s total expenses exceeded the peer group average for certain share classes, overall the Fund’s total expenses were reasonable. The Trustees also noted that Janus Capital has contractually agreed to limit the Fund’s expenses.
· For Janus Government Money Market Fund, the Trustees noted that the Fund’s total expenses exceeded the peer group average for both share classes. The Trustees considered that management fees for this Fund are higher than the peer group average due to the Fund’s management fee including other costs, such as custody and transfer agent services, while many funds in the peer group pay these expenses separately from their management fee. In addition, the Trustees considered that Janus Capital voluntarily waives one-half of its advisory fee and other expenses in order to maintain a positive yield.
· For Janus Money Market Fund, the Trustees noted that the Fund’s total expenses were below the peer group average for both share classes. In addition, the Trustees considered that Janus Capital voluntarily waives one-half of its advisory fee and other expenses in order to maintain a positive yield.
Asset Allocation Funds
· For Janus Global Allocation Fund – Conservative, the Trustees noted that, although the Fund’s total expenses exceeded the peer group median for one share class, overall the Fund’s total expenses were reasonable. The Trustees also noted that Janus Capital has contractually agreed to limit the Fund’s expenses, although this limit did not apply because the Fund’s total expenses were already below the applicable fee limit.
48 | MARCH 31, 2017 |
Janus Contrarian Fund
Additional Information (unaudited)
· For Janus Global Allocation Fund – Growth, the Trustees noted that the Fund’s total expenses were below the peer group average for all share classes.
· For Janus Global Allocation Fund – Moderate, the Trustees noted that, although the Fund’s total expenses exceeded the peer group average for one share class, overall the Fund’s total expenses were reasonable. The Trustees also noted that Janus Capital has contractually agreed to limit the Fund’s expenses.
Alternative Fund
· For Janus Diversified Alternatives Fund, the Trustees noted that, although the Fund’s total expenses exceeded the peer group average for certain share classes, overall the Fund’s total expenses were reasonable. The Trustees also noted that Janus Capital has contractually agreed to limit the Fund’s expenses.
Value Funds
· For Perkins International Value Fund, the Trustees noted that, although the Fund’s total expenses exceeded the peer group average for one share class, overall the Fund’s total expenses were reasonable. The Trustees also noted that Janus Capital has contractually agreed to limit the Fund’s expenses.
· For Perkins Global Value Fund, the Trustees noted that the Fund’s total expenses were below the peer group average for all share classes.
· For Perkins Large Cap Value Fund, the Trustees noted that, although the Fund’s total expenses exceeded the peer group average for one share class, overall the Fund’s total expenses were reasonable. The Trustees also noted that Janus Capital has contractually agreed to limit the Fund’s expenses.
· For Perkins Mid Cap Value Fund, the Trustees noted that, although the Fund’s total expenses exceeded the peer group average for one share class, overall the Fund’s total expenses were reasonable. The Trustees also noted that Janus Capital has contractually agreed to limit the Fund’s expenses, although this limit did not apply because the Fund’s total expenses were already below the applicable fee limit.
· For Perkins Select Value Fund, the Trustees noted that, although the Fund’s total expenses exceeded the peer group average for one share class, overall the Fund’s total expenses were reasonable. The Trustees also noted that Janus Capital has contractually agreed to limit the Fund’s expenses.
· For Perkins Small Cap Value Fund, the Trustees noted that the Fund’s total expenses were below the peer group average for all share classes.
· For Perkins Value Plus Income Fund, the Trustees noted that although the Fund’s total expenses exceeded the peer group average for one share class, overall the Fund’s total expenses were reasonable. The Trustees also noted that Janus Capital has contractually agreed to limit the Fund’s expenses.
Mathematical Funds
· For INTECH Emerging Markets Managed Volatility Fund, the Trustees noted that although the Fund’s total expenses exceeded the peer group average for one share class, overall the Fund’s total expenses were reasonable. The Trustees also noted that Janus Capital has contractually agreed to limit the Fund’s expenses.
· For INTECH Global Income Managed Volatility Fund, the Trustees noted that the Fund’s total expenses were below the peer group average for all share classes.
· For INTECH International Managed Volatility Fund, the Trustees noted that although the Fund’s total expenses exceeded the peer group average for one share class, overall the Fund’s total expenses were reasonable. The Trustees also noted that Janus Capital has contractually agreed to limit the Fund’s expenses.
· For INTECH U.S. Core Fund, the Trustees noted that although the Fund’s total expenses exceeded the peer group average for one share class, overall the Fund’s total expenses were reasonable. The Trustees also noted that Janus Capital has contractually agreed to limit the Fund’s expenses, although this limit did not apply because the Fund’s total expenses were already below the applicable fee limit.
· For INTECH U.S. Managed Volatility Fund, the Trustees noted that, although the Fund’s total expenses exceeded the peer group average for one share class, overall the Fund’s total expenses were reasonable. The
Janus Investment Fund | 49 |
Janus Contrarian Fund
Additional Information (unaudited)
Trustees also noted that Janus Capital has contractually agreed to limit the Fund’s expenses, although this limit did not apply because the Fund’s total expenses were already below the applicable fee limit.
Growth and Core Funds
· For Janus Balanced Fund, the Trustees noted that, although the Fund’s total expenses exceeded the peer group average for one share class, overall the Fund’s total expenses were reasonable. The Trustees also noted that Janus Capital has contractually agreed to limit the Fund’s expenses, although this limit did not apply because the Fund’s total expenses were already below the applicable fee limit.
· For Janus Contrarian Fund, the Trustees noted that, although the Fund’s total expenses exceeded the peer group average for certain share classes, overall the Fund’s total expenses were reasonable. The Trustees also noted that Janus Capital has contractually agreed to limit the Fund’s expenses, although this limit did not apply because the Fund’s total expenses were already below the applicable fee limit.
· For Janus Enterprise Fund, the Trustees noted that, although the Fund’s total expenses exceeded the peer group average for one share class, overall the Fund’s total expenses were reasonable. The Trustees also noted that Janus Capital has contractually agreed to limit the Fund’s expenses, although this limit did not apply because the Fund’s total expenses were already below the applicable fee limit.
· For Janus Forty Fund, the Trustees noted that, although the Fund’s total expenses exceeded the peer group average for certain share classes, overall the Fund’s total expenses were reasonable. The Trustees also noted that Janus Capital has contractually agreed to limit the Fund’s expenses, although this limit did not apply because the Fund’s total expenses were already below the applicable fee limit.
· For Janus Fund, the Trustees noted that the Fund’s total expenses were below the peer group average for all share classes.
· For Janus Growth and Income Fund, the Trustees noted that, although the Fund’s total expenses exceeded the peer group average for certain share classes, overall the Fund’s total expenses were reasonable. The Trustees also noted that Janus Capital has contractually agreed to limit the Fund’s expenses, although this limit did not apply because the Fund’s total expenses were already below the applicable fee limit.
· For Janus Research Fund, the Trustees noted that although the Fund’s total expenses exceeded the peer group average for certain share classes, overall the Fund’s total expenses were reasonable.
· For Janus Triton Fund, the Trustees noted that, although the Fund’s total expenses exceeded the peer group average for one share class, overall the Fund’s total expenses were reasonable. The Trustees also noted that Janus Capital has contractually agreed to limit the Fund’s expenses, although this limit did not apply because the Fund’s total expenses were already below the applicable fee limit.
· For Janus Twenty Fund, the Trustees noted that the Fund’s total expenses were below the peer group average for all share classes.
· For Janus Venture Fund, the Trustees noted that, although the Fund’s total expenses exceeded the peer group average for one share class, overall the Fund’s total expenses were reasonable. The Trustees also noted that Janus Capital has contractually agreed to limit the Fund’s expenses, although this limit did not apply because the Fund’s total expenses were already below the applicable fee limit.
Global and International Funds
· For Janus Adaptive Global Allocation Fund, the Trustees noted that, although the Fund’s total expenses exceeded the peer group median for certain share classes, overall the Fund’s total expenses were reasonable. The Trustees also noted that Janus Capital has contractually agreed to limit the Fund’s expenses.
· For Janus Asia Equity Fund, the Trustees noted that, although the Fund’s total expenses exceeded the peer group average for one share class, overall the Fund’s total expenses were reasonable. The Trustees also noted that Janus Capital has contractually agreed to limit the Fund’s expenses.
· For Janus Emerging Markets Fund, the Trustees noted that, although the Fund’s total expenses exceeded the peer group average for one share class, overall the Fund’s total expenses were reasonable. The Trustees also noted that Janus Capital has contractually agreed to limit the Fund’s expenses.
50 | MARCH 31, 2017 |
Janus Contrarian Fund
Additional Information (unaudited)
· For Janus Global Life Sciences Fund, the Trustees noted that the Fund’s total expenses were below the peer group average for all share classes.
· For Janus Global Real Estate Fund, the Trustees noted that, although the Fund’s total expenses exceeded the peer group average for certain share classes, overall the Fund’s total expenses were reasonable. The Trustees also noted that Janus Capital has contractually agreed to limit the Fund’s expenses, although this limit did not apply because the Fund’s total expenses were already below the applicable fee limit.
· For Janus Global Research Fund, the Trustees noted that the Fund’s total expenses were below the peer group average for all share classes.
· For Janus Global Select Fund, the Trustees noted that the Fund’s total expenses were below the peer group average for all share classes.
· For Janus Global Technology Fund, the Trustees noted that the Fund’s total expenses were below the peer group average for all share classes.
· For Janus International Equity Fund, the Trustees noted that, although the Fund’s total expenses exceeded the peer group average for one share class, overall the Fund’s total expenses were reasonable. The Trustees also noted that Janus Capital has contractually agreed to limit the Fund’s expenses, although this limit did not apply because the Fund’s total expenses were already below the applicable fee limit.
· For Janus Overseas Fund, the Trustees noted that the Fund’s total expenses were below the peer group average for all share classes.
Janus Aspen Series
· For Janus Aspen Balanced Portfolio, the Trustees noted that the Fund’s total expenses were below the peer group average for both share classes.
· For Janus Aspen Enterprise Portfolio, the Trustees noted that the Fund’s total expenses were below the peer group average for both share classes.
· For Janus Aspen Flexible Bond Portfolio, the Trustees noted that, although the Fund’s total expenses exceeded the peer group average for both share classes, overall the Fund’s total expenses were reasonable. The Trustees also noted that Janus Capital has contractually agreed to limit the Fund’s expenses.
· For Janus Aspen Forty Portfolio, the Trustees noted that the Fund’s total expenses were below the peer group average for both share classes.
· For Janus Aspen Global Allocation Portfolio - Moderate, the Trustees noted that, although the Fund’s total expenses exceeded the peer group average for both share classes, overall the Fund’s total expenses were reasonable. The Trustees also noted that Janus Capital has contractually agreed to limit the Fund’s expenses.
· For Janus Aspen Global Research Portfolio, the Trustees noted that the Fund’s total expenses were below the peer group average for both share classes.
· For Janus Aspen Global Technology Portfolio, the Trustees noted that the Fund’s total expenses were below the peer group average for both share classes.
· For Janus Aspen Global Unconstrained Bond Portfolio, the Trustees noted that, although the Fund’s total expenses exceeded the peer group average for both share classes, overall the Fund’s total expenses were reasonable. The Trustees also noted that Janus Capital has contractually agreed to limit the Fund’s expenses.
· For Janus Aspen INTECH U.S. Low Volatility Portfolio, the Trustees noted that the Fund’s total expenses were below the peer group average for its sole share class.
· For Janus Aspen Janus Portfolio, the Trustees noted that the Fund’s total expenses were below the peer group average for both share classes.
· For Janus Aspen Overseas Portfolio, the Trustees noted that the Fund’s total expenses were below the peer group average for both share classes.
Janus Investment Fund | 51 |
Janus Contrarian Fund
Additional Information (unaudited)
· For Janus Aspen Perkins Mid Cap Value Portfolio, the Trustees noted that the Fund’s total expenses were below the peer group average for both share classes.
The Trustees reviewed information on the profitability to Janus Capital and its affiliates of their relationships with each Fund, as well as an explanation of the methodology utilized by Janus Capital when allocating various expenses of Janus Capital and its affiliates with respect to contractual relationships with the Funds and other clients. The Trustees also reviewed the financial statements and corporate structure of Janus Capital’s parent company. In their review, the Trustees considered whether Janus Capital and each subadviser receive adequate incentives and resources to manage the Funds effectively. The Trustees recognized that profitability comparisons among fund managers are difficult because very little comparative information is publicly available, and the profitability of any fund manager is affected by numerous factors, including the organizational structure of the particular fund manager, the types of funds and other accounts it manages, possible other lines of business, the methodology for allocating expenses, and the fund manager’s capital structure and cost of capital. However, taking into account those factors and the analysis provided by the Trustees’ independent fee consultant, and based on the information available, the Trustees concluded that Janus Capital’s profitability with respect to each Fund in relation to the services rendered was reasonable.
The independent fee consultant found that, while assessing the reasonableness of expenses in light of Janus Capital’s profits is dependent on comparisons with other publicly-traded mutual fund advisers, and that these comparisons are limited in accuracy by differences in complex size, business mix, institutional account orientation, and other factors, after accepting these limitations, the level of profit earned by Janus Capital from managing the Funds is reasonable.
The Trustees concluded that the management fees payable by each Fund to Janus Capital and its affiliates, as well as the fees paid by Janus Capital to the subadvisers of subadvised Funds, were reasonable in relation to the nature, extent, and quality of the services provided, taking into account the fees charged by other advisers for managing comparable mutual funds with similar strategies, the fees Janus Capital and the subadvisers charge to other clients, and, as applicable, the impact of fund performance on management fees payable by the Funds. The Trustees also concluded that each Fund’s total expenses were reasonable, taking into account the size of the Fund, the quality of services provided by Janus Capital and any subadviser, the investment performance of the Fund, and any expense limitations agreed to or provided by Janus Capital.
Economies of Scale
The Trustees considered information about the potential for Janus Capital to realize economies of scale as the assets of the Funds increase. They noted their independent fee consultant’s analysis of economies of scale in prior years. They also noted that, although many Funds pay advisory fees at a base fixed rate as a percentage of net assets, without any breakpoints, their independent fee consultant concluded that 91% of these Funds have contractual management fees (gross of waivers) below their Broadridge expense group averages and, overall, 83% of the Funds are below their respective expense group averages for contractual management fees. They also noted that for those Funds whose expenses are being reduced by the contractual expense limitations of Janus Capital, Janus Capital is subsidizing the Funds because they have not reached adequate scale. Moreover, as the assets of some of the Funds have declined in the past few years, certain Funds have benefited from having advisory fee rates that have remained constant rather than increasing as assets declined. In addition, performance fee structures have been implemented for various Funds that have caused the effective rate of advisory fees payable by such a Fund to vary depending on the investment performance of the Fund relative to its benchmark index over the measurement period; and a few Funds have fee schedules with breakpoints and reduced fee rates above certain asset levels. The Trustees also noted that the Funds share directly in economies of scale through the lower charges of third-party service providers that are based in part on the combined scale of all of the Funds. Based on all of the information they reviewed, including past research and analysis conducted by the Trustees’ independent fee consultant, the Trustees concluded that the current fee structure of each Fund was reasonable and that the current rates of fees do reflect a sharing between Janus Capital and the Fund of any economies of scale that may be present at the current asset level of the Fund.
The independent fee consultant concluded that, given the limitations of various analytical approaches to economies of scale considered in prior years, and their conflicting results, its analyses could not confirm or deny the existence of economies of scale in the Janus complex. Further, the independent fee consultant provided its belief that Fund investors are well-served by the fee levels and performance fee structures in place on the Funds in light of any economies of scale that may be present at Janus Capital.
52 | MARCH 31, 2017 |
Janus Contrarian Fund
Additional Information (unaudited)
Other Benefits to Janus Capital
The Trustees also considered benefits that accrue to Janus Capital and its affiliates and subadvisers to the Funds from their relationships with the Funds. They recognized that two affiliates of Janus Capital separately serve the Funds as transfer agent and distributor, respectively, and the transfer agent receives compensation directly from the non-money market funds for services provided. The Trustees also considered Janus Capital’s past and proposed use of commissions paid by the Funds on portfolio brokerage transactions to obtain proprietary and third-party research products and services benefiting the Fund and/or other clients of Janus Capital and/or Janus Capital, and/or a subadviser to a Fund. The Trustees concluded that Janus Capital’s and the subadvisers’ use of these types of client commission arrangements to obtain proprietary and third-party research products and services was consistent with regulatory requirements and guidelines and was likely to benefit each Fund. The Trustees also concluded that, other than the services provided by Janus Capital and its affiliates and subadvisers pursuant to the agreements and the fees to be paid by each Fund therefor, the Funds and Janus Capital and the subadvisers may potentially benefit from their relationship with each other in other ways. They concluded that Janus Capital and/or the subadvisers benefits from the receipt of research products and services acquired through commissions paid on portfolio transactions of the Funds and that the Funds benefit from Janus Capital’s and/or the subadvisers’ receipt of those products and services as well as research products and services acquired through commissions paid by other clients of Janus Capital and/or other clients of the subadvisers. They further concluded that the success of any Fund could attract other business to Janus Capital, the subadvisers or other Janus funds, and that the success of Janus Capital and the subadvisers could enhance Janus Capital’s and the subadvisers’ ability to serve the Funds.
Janus Investment Fund | 53 |
Janus Contrarian Fund
Useful Information About Your Fund Report (unaudited)
The Management Commentary in this report includes valuable insight as well as statistical information to help you understand how your Fund’s performance and characteristics stack up against those of comparable indices.
If the Fund invests in foreign securities, this report may include information about country exposure. Country exposure is based primarily on the country of risk. A company may be allocated to a country based on other factors such as location of the company’s principal office, the location of the principal trading market for the company’s securities, or the country where a majority of the company’s revenues are derived.
Please keep in mind that the opinions expressed in the Management Commentary are just that: opinions. They are a reflection based on best judgment at the time this report was compiled, which was March 31, 2017. As the investing environment changes, so could opinions. These views are unique and are not necessarily shared by fellow employees or by Janus in general.
Performance Overviews
Performance overview graphs compare the performance of a hypothetical $10,000 investment in the Fund with one or more widely used market indices. When comparing the performance of the Fund with an index, keep in mind that market indices are not available for investment and do not reflect deduction of expenses.
Average annual total returns are quoted for a Fund with more than one year of performance history. Average annual total return is calculated by taking the growth or decline in value of an investment over a period of time, including reinvestment of dividends and distributions, then calculating the annual compounded percentage rate that would have produced the same result had the rate of growth been constant throughout the period. Average annual total return does not reflect the deduction of taxes that a shareholder would pay on Fund distributions or redemptions of Fund shares.
Cumulative total returns are quoted for a Fund with less than one year of performance history. Cumulative total return is the growth or decline in value of an investment over time, independent of the period of time involved. Cumulative total return does not reflect the deduction of taxes that a shareholder would pay on Fund distributions or redemptions of Fund shares.
Pursuant to federal securities rules, expense ratios shown in the performance chart reflect subsidized (if applicable) and unsubsidized ratios. The total annual fund operating expenses ratio is gross of any fee waivers, reflecting the Fund’s unsubsidized expense ratio. The net annual fund operating expenses ratio (if applicable) includes contractual waivers of Janus Capital and reflects the Fund’s subsidized expense ratio. Ratios may be higher or lower than those shown in the “Financial Highlights” in this report.
Schedule of Investments
Following the performance overview section is the Fund’s Schedule of Investments. This schedule reports the types of securities held in the Fund on the last day of the reporting period. Securities are usually listed by type (common stock, corporate bonds, U.S. Government obligations, etc.) and by industry classification (banking, communications, insurance, etc.). Holdings are subject to change without notice.
The value of each security is quoted as of the last day of the reporting period. The value of securities denominated in foreign currencies is converted into U.S. dollars.
If the Fund invests in foreign securities, it will also provide a summary of investments by country. This summary reports the Fund exposure to different countries by providing the percentage of securities invested in each country. The country of each security represents the country of risk. The Fund’s Schedule of Investments relies upon the industry group and country classifications published by Barclays and/or MSCI Inc.
Tables listing details of individual forward currency contracts, futures, written options, swaptions, and swaps follow the Fund’s Schedule of Investments (if applicable).
Statement of Assets and Liabilities
This statement is often referred to as the “balance sheet.” It lists the assets and liabilities of the Fund on the last day of the reporting period.
54 | MARCH 31, 2017 |
Janus Contrarian Fund
Useful Information About Your Fund Report (unaudited)
The Fund’s assets are calculated by adding the value of the securities owned, the receivable for securities sold but not yet settled, the receivable for dividends declared but not yet received on securities owned, and the receivable for Fund shares sold to investors but not yet settled. The Fund’s liabilities include payables for securities purchased but not yet settled, Fund shares redeemed but not yet paid, and expenses owed but not yet paid. Additionally, there may be other assets and liabilities such as unrealized gain or loss on forward currency contracts.
The section entitled “Net Assets Consist of” breaks down the components of the Fund’s net assets. Because the Fund must distribute substantially all earnings, you will notice that a significant portion of net assets is shareholder capital.
The last section of this statement reports the net asset value (“NAV”) per share on the last day of the reporting period. The NAV is calculated by dividing the Fund’s net assets for each share class (assets minus liabilities) by the number of shares outstanding.
Statement of Operations
This statement details the Fund’s income, expenses, realized gains and losses on securities and currency transactions, and changes in unrealized appreciation or depreciation of Fund holdings.
The first section in this statement, entitled “Investment Income,” reports the dividends earned from securities and interest earned from interest-bearing securities in the Fund.
The next section reports the expenses incurred by the Fund, including the advisory fee paid to the investment adviser, transfer agent fees and expenses, and printing and postage for mailing statements, financial reports and prospectuses. Expense offsets and expense reimbursements, if any, are also shown.
The last section lists the amounts of realized gains or losses from investment and foreign currency transactions, and changes in unrealized appreciation or depreciation of investments and foreign currency-denominated assets and liabilities. The Fund will realize a gain (or loss) when it sells its position in a particular security. A change in unrealized gain (or loss) refers to the change in net appreciation or depreciation of the Fund during the reporting period. “Net Realized and Unrealized Gain/(Loss) on Investments” is affected both by changes in the market value of Fund holdings and by gains (or losses) realized during the reporting period.
Statements of Changes in Net Assets
These statements report the increase or decrease in the Fund’s net assets during the reporting period. Changes in the Fund’s net assets are attributable to investment operations, dividends and distributions to investors, and capital share transactions. This is important to investors because it shows exactly what caused the Fund’s net asset size to change during the period.
The first section summarizes the information from the Statement of Operations regarding changes in net assets due to the Fund’s investment operations. The Fund’s net assets may also change as a result of dividend and capital gains distributions to investors. If investors receive their dividends and/or distributions in cash, money is taken out of the Fund to pay the dividend and/or distribution. If investors reinvest their dividends and/or distributions, the Fund’s net assets will not be affected. If you compare the Fund’s “Net Decrease from Dividends and Distributions” to “Reinvested Dividends and Distributions,” you will notice that dividends and distributions have little effect on the Fund’s net assets. This is because the majority of the Fund’s investors reinvest their dividends and/or distributions.
The reinvestment of dividends and distributions is included under “Capital Share Transactions.” “Capital Shares” refers to the money investors contribute to the Fund through purchases or withdrawals via redemptions. The Fund’s net assets will increase and decrease in value as investors purchase and redeem shares from the Fund.
Financial Highlights
This schedule provides a per-share breakdown of the components that affect the Fund’s NAV for current and past reporting periods as well as total return, asset size, ratios, and portfolio turnover rate.
The first line in the table reflects the NAV per share at the beginning of the reporting period. The next line reports the net investment income/(loss) per share. Following is the per share total of net gains/(losses), realized and unrealized. Per share dividends and distributions to investors are then subtracted to arrive at the NAV per share at the end of the period. The next line reflects the total return for the period. Also included are ratios of expenses and net investment income to average net assets.
Janus Investment Fund | 55 |
Janus Contrarian Fund
Useful Information About Your Fund Report (unaudited)
The Fund’s expenses may be reduced through expense offsets and expense reimbursements. The ratios shown reflect expenses before and after any such offsets and reimbursements.
The ratio of net investment income/(loss) summarizes the income earned less expenses, divided by the average net assets of the Fund during the reporting period. Do not confuse this ratio with the Fund’s yield. The net investment income ratio is not a true measure of the Fund’s yield because it does not take into account the dividends distributed to the Fund’s investors.
The next figure is the portfolio turnover rate, which measures the buying and selling activity in the Fund. Portfolio turnover is affected by market conditions, changes in the asset size of the Fund, fluctuating volume of shareholder purchase and redemption orders, the nature of the Fund’s investments, and the investment style and/or outlook of the portfolio manager(s) and/or investment personnel. A 100% rate implies that an amount equal to the value of the entire portfolio was replaced once during the fiscal year; a 50% rate means that an amount equal to the value of half the portfolio is traded in a year; and a 200% rate means that an amount equal to the value of the entire portfolio is traded every six months.
56 | MARCH 31, 2017 |
Janus Contrarian Fund
Notes
NotesPage1
Janus Investment Fund | 57 |
Janus provides access to a wide range of investment disciplines.
Alternative
Janus alternative funds seek to deliver strong risk-adjusted returns over a full market cycle with lower correlation to equity markets than traditional investments.
Asset Allocation
Janus’ asset allocation funds utilize our fundamental, bottom-up research to balance risk over the long term. From fund options that meet investors’ risk tolerance and objectives to a method that incorporates non-traditional investment choices to seek non-correlated sources of risk and return, Janus’ asset allocation funds aim to allocate risk more effectively.
Fixed Income
Janus fixed income funds attempt to provide less risk relative to equities while seeking to deliver a competitive total return through high current income and appreciation. Janus money market funds seek capital preservation and liquidity with current income as a secondary objective.
Global & International
Janus global and international funds seek to leverage Janus’ research capabilities by taking advantage of inefficiencies in foreign markets, where accurate information and analytical insight are often at a premium.
Growth & Core
Janus growth funds focus on companies believed to be the leaders in their respective industries, with solid management teams, expanding market share, margins and efficiencies. Janus core funds seek investments in more stable and predictable companies. Our core funds look for a strategic combination of steady growth and, for certain funds, some degree of income.
Mathematical
Our mathematical funds seek to outperform their respective indices while maintaining a risk profile equal to or lower than the index itself. Managed by INTECH® (a Janus subsidiary), these funds use a mathematical process in an attempt to build a more “efficient” portfolio than the index.
Value
Our value funds, managed by Perkins® (a Janus subsidiary), seek to identify companies with favorable reward to risk characteristics by conducting rigorous downside analysis before determining upside potential.
For more information about our funds, contact your investment professional or go to janus.com/advisor/mutual-funds (or janus.com/allfunds if you hold Shares directly with Janus).
| ||||||||||||
Please consider the charges, risks, expenses and investment objectives carefully before investing. For a prospectus or, if available, a summary prospectus containing this and other information, please call Janus at 877.33JANUS (52687) (or 800.525.3713 if you hold Shares directly with Janus); or download the file from janus.com/info (or janus.com/reports if you hold Shares directly with Janus). Read it carefully before you invest or send money. | ||||||||||||
Janus, INTECH and Perkins are registered trademarks of Janus International Holding LLC. © Janus International Holding LLC. Funds distributed by Janus Distributors LLC | ||||||||||||
Investment products offered are: | NOT FDIC-INSURED | MAY LOSE VALUE | NO BANK GUARANTEE | |||||||||
125-24-93038 05-17 | ||||||||||||

SEMIANNUAL REPORT March 31, 2017 | |||
Janus Emerging Markets Fund | |||
Janus Investment Fund | |||
| |||
HIGHLIGHTS · Portfolio management perspective · Investment strategy behind your fund · Fund performance, characteristics | |||
| |||

Table of Contents
Janus Emerging Markets Fund
Janus Emerging Markets Fund (unaudited)

PERFORMANCE
Janus Emerging Markets Fund’s Class I Shares returned 8.00% for the six-month period ended March 31, 2017. The Fund’s benchmark, the MSCI Emerging Markets Index, returned 6.80%.
MARKET ENVIRONMENT
Emerging market (EM) stocks gained over the period, despite having endured turbulence in the wake of the election of Donald Trump to the U.S. presidency in November. While the specific-policy stances of the Trump administration remain largely unknown, a consistent theme throughout his campaign was a rollback of the decades-long trend of globalization that has greatly benefited emerging economies. Another source of investor concern was the expectation of increasing interest rates in the U.S., which could make U.S. securities more attractive on a relative, risk-adjusted basis, thus increasing the cost of capital for EM companies.
EM stocks then rallied as the Trump administration appeared to step back from some of the most heated anti-trade rhetoric espoused during the campaign. Granted, Mr. Trump walked away from the Trans-Pacific Partnership, he has largely been conciliatory in his initial meetings with global leaders. Investors’ improving sentiment toward EM stocks was also fueled by the expectation that the Federal Reserve (Fed) would likely raise its benchmark interest rate only twice more in 2017.
While the macro developments were factors in the quarter, our view is that the real driver of positive returns across EM countries was solid corporate fundamentals. Such examples can be found in technology, which was among the best-performing sectors for the period. The story here was semiconductors. Rather than banking on strong demand, which has remained elusive, investors are, instead, recognizing that the semiconductor industry is exercising supply discipline. The rationalization of supply has provided the industry with much-needed pricing power, which has, in turn, led to improving profitability. Given that much of the global semiconductor supply chain flows through the major EM region of Asia, this shift in fundamentals has buttressed the region’s stock markets and, to a lesser degree, their underlying economies.
Sector gainers were led by materials and energy. Historically defensive sectors lost ground, led by health care and consumer staples. Most countries within the EM benchmark were in positive territory, with the major economies of Russia and Brazil doing particularly well.
PERFORMANCE DISCUSSION
The Fund’s selection of technology and health care stocks contributed most to relative performance. Our allocation to consumer discretionary and an underweight to materials detracted most from results.
Samsung performed well during the period as investors looked past corruption allegations against senior executives and instead focused on the company’s strong execution. Each of Samsung’s main business lines – memory, handsets and display – strengthened their positions during the period. The company is the world leader in both DRAM and NAND memory. Pricing is strong in the former category and the latter is positioned for increased domination due to its innovative 3D-NAND technology. This point is driven home by the expectation that Apple will heavily rely upon the technology for its newest iPhone. Apple also plans to utilize Samsung’s OLED display in the iPhone 8, demonstrating the South Korean company’s superiority in the display business. Samsung’s own handset business is set to rebound from last year’s Galaxy Note hiccups as the Galaxy 8 – announced during the quarter – received favorable reviews.
SK Hynix manufactures semiconductors such as DRAM, flash memory and SRAM chips. As one of three dominant suppliers of DRAM chips globally, the South Korean company is well-positioned to benefit from increasing DRAM demand with limited DRAM supply growth due to capital expenditure cuts by major players.
Janus Investment Fund | 1 |
Janus Emerging Markets Fund (unaudited)
Also contributing was Yunnan Baiyao Group. The company is a market leader in providing traditional Chinese medicine. We like its large market share in its core businesses and how it is levering its name to gain share in new markets such as toothpaste and tea. A disciplined management team oversees a high margin business, and they have proven to be conservative and effective allocators of capital. A key component of this process has been to initially outsource new product manufacturing, then once proven, bring it in-house and invest in highly productive, automated manufacturing techniques.
A leading detractor for the period was Chongqing Changan Auto. Investors shied away from the stock due, in part, to its relatively low-growth trajectory. With regional economies remaining buoyant, many investors gravitated toward higher growth names. We, however, view the high quality of the company and its attractive valuation as a compelling combination. In fact, we believe Chongqing is one of the cheapest automotive stocks globally. Our confidence in the stock is reinforced by the large cash position on Chongqing’s balance sheet and its steady free-cash-flow generation. As a consequence, despite the modestly weak quarter for the stock, we see limited additional downside potential.
India’s PC Jeweller detracted from performance, caught up in the country’s rocky attempt to remove high-denomination bills from circulation. With much of the country’s economy cash-based, and often beyond the purview of tax collection, authorities quickly announced the removal of the 500 and 1000 rupee notes. The government also hoped that the move would clamp down on corruption as high-value purchases – including jewelry – were considered linked to malfeasance. The speed of the move disrupted several segments of the economy. With estimates that PC Jeweller’s top line could drop by as much as 20%, and earnings by 40%, we sold our position in the company.
The stock of low-cost air carrier Spring Airlines came under pressure as the company announced earnings that were poorly received by investors. Net profits for the period covered in the report had fallen by roughly 26% year over year. The company’s international business was singled out as a factor in the weak performance. Also, Spring suffered from a sudden delivery of aircraft, which meant it had a finite amount of time to sell seats on the initial flights. Still, we like the company, which is a leading low-cost air carrier in China. We believe that Spring has one of the sector’s best management teams, as evidenced by the company’s strong utilization rate and profitability. We expect growth to continue as Spring adds routes to and from Shanghai, which commands higher ticket prices.
Please see the Derivative instruments section in the “Notes to Financial Statements” for a discussion of derivatives used by the Fund.
OUTLOOK
The strong performance of semiconductor producers during the period illustrates our view that fundamentals matter when determining the long-term outperformers in EMs. The past several years have seen EM management teams – especially those in the Asian technology space – becoming more disciplined when adjusting to shifting market environments. This is occurring not only at the company level, but in the case of China, at the national level. The country’s powerful leadership has been able to force through production cuts, thus streamlining many segments of the industrial sector and boosting profitability. The actions of authorities have also played a role in the recent improvement in consumer discretionary. The government has dialed back some components of its anti-corruption campaign, which had been a significant headwind to the sector, especially the luxury segment.
Improving productivity, profitability and earnings, in our view, will be supportive for EM companies as we go deeper into 2017. We believe EM investors tend to be trend followers, rather than contrarian. Thus, as earnings momentum builds, many investors will likely come off the sidelines.
We see limited risk of four rate hikes, in total, by the Fed in 2017. Should that occur, EM stocks could experience a sell-off. If the 2017 final tally is two, rather than the three largely priced into the market, we do not expect any additional catalyst. Instead, we anticipate that investment decisions will still largely be driven by improving economies and more efficient companies. It is our job to identify the companies whose management teams have positioned their enterprises to become attractive destinations for investors’ capital, regardless of the trajectory of the global business cycle.
Thank you for your investment in Janus Emerging Markets Fund.
2 | MARCH 31, 2017 |
Janus Emerging Markets Fund (unaudited)
Fund At A Glance
March 31, 2017
5 Top Performers - Holdings |
|
|
| 5 Bottom Performers - Holdings |
| |
Contribution | Contribution | |||||
Samsung Electronics Co Ltd | 1.04% | Chongqing Changan Automobile Co Ltd | -0.32% | |||
SK Hynix Inc | 0.61% | PC Jeweller Ltd | -0.23% | |||
Yunnan Baiyao Group Co Ltd | 0.42% | BRF SA | -0.22% | |||
Itau Unibanco Holding SA (ADR) | 0.40% | China Mobile Ltd | -0.19% | |||
Hana Financial Group Inc | 0.37% | Spring Airlines Co Ltd | -0.17% | |||
5 Top Performers - Sectors* |
|
|
|
|
| |
Fund | Fund Weighting | MSCI Emerging Markets Index | ||||
Contribution | (Average % of Equity) | Weighting | ||||
Information Technology | 1.51% | 28.13% | 23.71% | |||
Health Care | 0.46% | 2.33% | 2.49% | |||
Consumer Staples | 0.46% | 4.28% | 7.23% | |||
Industrials | 0.32% | 5.88% | 5.84% | |||
Utilities | 0.18% | 3.33% | 2.87% | |||
5 Bottom Performers - Sectors* |
|
|
|
|
| |
Fund | Fund Weighting | MSCI Emerging Markets Index | ||||
Contribution | (Average % of Equity) | Weighting | ||||
Materials | -0.33% | 3.97% | 7.23% | |||
Consumer Discretionary | -0.24% | 12.21% | 10.36% | |||
Energy | -0.22% | 6.36% | 7.63% | |||
Financials | -0.02% | 22.31% | 24.23% | |||
Telecommunication Services | -0.01% | 3.05% | 5.83% | |||
Security contribution to performance is measured by using an algorithm that multiplies the daily performance of each security with the previous day’s ending weight in the portfolio and is gross of advisory fees. Fixed income securities and certain equity securities, such as private placements and some share classes of equity securities, are excluded. | ||||||
* | Based on sector classification according to the Global Industry Classification Standard (“GICS”) codes, which are the exclusive property and a service mark of MSCI Inc. and Standard & Poor’s. | |||||
Janus Investment Fund | 3 |
Janus Emerging Markets Fund (unaudited)
Fund At A Glance
March 31, 2017
5 Largest Equity Holdings - (% of Net Assets) | |
Samsung Electronics Co Ltd | |
Technology Hardware, Storage & Peripherals | 4.2% |
Taiwan Semiconductor Manufacturing Co Ltd | |
Semiconductor & Semiconductor Equipment | 4.1% |
Tencent Holdings Ltd | |
Internet Software & Services | 3.8% |
Alibaba Group Holding Ltd (ADR) | |
Internet Software & Services | 3.5% |
SK Hynix Inc | |
Semiconductor & Semiconductor Equipment | 2.9% |
18.5% | |
Asset Allocation - (% of Net Assets) | |||||
Common Stocks | 96.2% | ||||
Investment Companies | 3.4% | ||||
Preferred Stocks | 2.1% | ||||
OTC Purchased Options – Calls | 0.0% | ||||
Warrants | 0.0% | ||||
Other | (1.7)% | ||||
100.0% | |||||
Emerging markets comprised 95.1% of total net assets.
Top Country Allocations - Long Positions - (% of Investment Securities) | |
As of March 31, 2017
| As of September 30, 2016
|
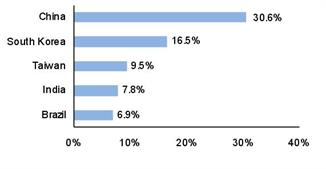
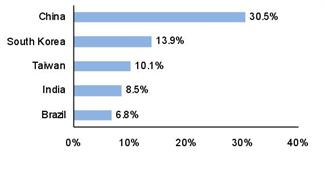
4 | MARCH 31, 2017 |
Janus Emerging Markets Fund (unaudited)
Performance
See important disclosures on the next page. |
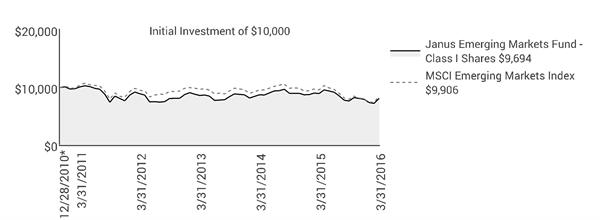
| Expense Ratios - | |||||||||
Average Annual Total Return - for the periods ended March 31, 2017 |
|
| per the January 27, 2017 prospectuses | |||||||
|
| Fiscal
| One
| Five
| Since |
|
| Total Annual Fund
| Net Annual Fund
| |
Class A Shares at NAV |
| 7.82% | 19.20% | 1.27% | -0.85% |
|
| 2.02% | 1.78% | |
Class A Shares at MOP |
| 1.63% | 12.38% | 0.08% | -1.79% |
|
|
|
| |
Class C Shares at NAV | 7.50% | 18.39% | 0.53% | -1.53% |
|
| 2.71% | 2.49% | ||
Class C Shares at CDSC |
| 6.50% | 17.39% | 0.53% | -1.53% |
|
|
|
| |
Class D Shares(1) |
| 8.07% | 19.67% | 1.55% | -0.62% |
|
| 1.73% | 1.51% | |
Class I Shares |
| 8.00% | 19.69% | 1.73% | -0.50% |
|
| 1.60% | 1.40% | |
Class S Shares |
| 7.89% | 19.47% | 1.37% | -0.78% |
|
| 2.09% | 1.84% | |
Class T Shares |
| 7.91% | 19.47% | 1.46% | -0.69% |
|
| 1.79% | 1.59% | |
MSCI Emerging Markets Index |
| 6.80% | 17.22% | 0.81% | -0.15% |
|
|
|
| |
Morningstar Quartile - Class I Shares |
| - | 2nd | 2nd | 3rd |
|
|
|
| |
Morningstar Ranking - based on total returns for Diversified Emerging Markets Funds |
| - | 224/840 | 192/539 | 259/418 |
|
|
|
| |
Returns quoted are past performance and do not guarantee future results; current performance may be lower or higher. Investment returns and principal value will vary; there may be a gain or loss when shares are sold. For the most recent month-end performance call 877.33JANUS(52687) (or 800.525.3713 if you hold shares directly with Janus Capital) or visit janus.com/advisor/mutual-funds (or janus.com/allfunds if you hold shares directly with Janus Capital).
Maximum Offering Price (MOP) returns include the maximum sales charge of 5.75%. Net Asset Value (NAV) returns exclude this charge, which would have reduced returns.
CDSC returns include a 1% contingent deferred sales charge (CDSC) on Shares redeemed within 12 months of purchase. Net Asset Value (NAV) returns exclude this charge, which would have reduced returns.
Janus Investment Fund | 5 |
Janus Emerging Markets Fund (unaudited)
Performance
This Fund has a performance-based management fee that may adjust up or down based on the Fund’s performance.
Performance may be affected by risks that include those associated with non-diversification, portfolio turnover, short sales, potential conflicts of interest, foreign and emerging markets, initial public offerings (IPOs), high-yield and high-risk securities, undervalued, overlooked and smaller capitalization companies, real estate related securities including Real Estate Investment Trusts (REITs), derivatives, and commodity-linked investments. Each product has different risks. Please see the prospectus for more information about risks, holdings and other details.
The Fund will normally invest at least 80% of its net assets, measured at the time of purchase, in the type of securities described by its name.
Returns include reinvestment of all dividends and distributions and do not reflect the deduction of taxes that a shareholder would pay on Fund distributions or redemptions of Fund shares. The returns do not include adjustments in accordance with generally accepted accounting principles required at the period end for financial reporting purposes.
See Financial Highlights for actual expense ratios during the reporting period.
Ranking is for the share class shown only; other classes may have different performance characteristics. When an expense waiver is in effect, it may have a material effect on the total return, and therefore the ranking for the period.
© 2017 Morningstar, Inc. All Rights Reserved.
There is no assurance that the investment process will consistently lead to successful investing.
See Notes to Schedule of Investments and Other Information for index definitions.
Index performance does not reflect the expenses of managing a portfolio as an index is unmanaged and not available for direct investment.
See “Useful Information About Your Fund Report.”
Subject to shareholder approval, the Fund is expected to merge into a similar fund. See the prospectus for further details.
*The Fund’s inception date – December 28, 2010
(1) Closed to certain new investors.
6 | MARCH 31, 2017 |
Janus Emerging Markets Fund (unaudited)
Expense Examples
As a shareholder of the Fund, you incur two types of costs: (1) transaction costs, such as sales charges (loads) on purchase payments (applicable to Class A Shares only); and (2) ongoing costs, including management fees; 12b-1 distribution and shareholder servicing fees; transfer agent fees and expenses payable pursuant to the Transfer Agency Agreement; and other Fund expenses. This example is intended to help you understand your ongoing costs (in dollars) of investing in the Fund and to compare these costs with the ongoing costs of investing in other mutual funds. To do so, compare this 5% hypothetical example with the 5% hypothetical examples that appear in the shareholder reports of the other funds. The example is based upon an investment of $1,000 invested at the beginning of the period and held for the six-months indicated, unless noted otherwise in the table and footnotes below.
Actual Expenses
The information in the table under the heading “Actual” provides information about actual account values and actual expenses. You may use the information in these columns, together with the amount you invested, to estimate the expenses that you paid over the period. Simply divide your account value by $1,000 (for example, an $8,600 account value divided by $1,000 = 8.6), then multiply the result by the number in the appropriate column for your share class under the heading entitled “Expenses Paid During Period” to estimate the expenses you paid on your account during the period.
Hypothetical Example for Comparison Purposes
The information in the table under the heading “Hypothetical (5% return before expenses)” provides information about hypothetical account values and hypothetical expenses based upon the Fund’s actual expense ratio and an assumed rate of return of 5% per year before expenses, which is not the Fund’s actual return. The hypothetical account values and expenses may not be used to estimate the actual ending account balance or expenses you paid for the period. You may use this information to compare the ongoing costs of investing in the Fund and other funds. To do so, compare this 5% hypothetical example with the 5% hypothetical examples that appear in the shareholder reports of the other funds. Additionally, for an analysis of the fees associated with an investment in any share class or other similar funds, please visit www.finra.org/fundanalyzer.
Please note that the expenses shown in the table are meant to highlight your ongoing costs only and do not reflect any transaction costs. These fees are fully described in the Fund’s prospectuses. Therefore, the hypothetical examples are useful in comparing ongoing costs only, and will not help you determine the relative total costs of owning different funds. In addition, if these transaction costs were included, your costs would have been higher.
Actual | Hypothetical | |||||||||
| Beginning | Ending | Expenses |
| Beginning | Ending | Expenses | Net Annualized | ||
Class A Shares | $1,000.00 | $1,078.20 | $9.43 |
| $1,000.00 | $1,015.86 | $9.15 | 1.82% | ||
Class C Shares | $1,000.00 | $1,075.00 | $12.83 |
| $1,000.00 | $1,012.57 | $12.44 | 2.48% | ||
Class D Shares | $1,000.00 | $1,080.70 | $7.89 |
| $1,000.00 | $1,017.35 | $7.64 | 1.52% | ||
Class I Shares | $1,000.00 | $1,080.00 | $7.36 |
| $1,000.00 | $1,017.85 | $7.14 | 1.42% | ||
Class S Shares | $1,000.00 | $1,078.90 | $9.23 |
| $1,000.00 | $1,016.06 | $8.95 | 1.78% | ||
Class T Shares | $1,000.00 | $1,079.10 | $8.29 |
| $1,000.00 | $1,016.95 | $8.05 | 1.60% | ||
† | Expenses Paid During Period are equal to the Net Annualized Expense Ratio multiplied by the average account value over the period, multiplied by 182/365 (to reflect the one-half year period). Expenses in the examples include the effect of applicable fee waivers and/or expense reimbursements, if any. Had such waivers and/or reimbursements not been in effect, your expenses would have been higher. Please refer to the Notes to Financial Statements or the Fund’s prospectuses for more information regarding waivers and/or reimbursements. | |||||||||
Janus Investment Fund | 7 |
Janus Emerging Markets Fund
Schedule of Investments (unaudited)
March 31, 2017
Shares
or | Value | ||||||
Common Stocks – 96.2% | |||||||
Air Freight & Logistics – 0.5% | |||||||
Sinotrans Ltd | .936,000 | $437,209 | |||||
Airlines – 0.4% | |||||||
Spring Airlines Co Ltd* | 75,888 | 382,534 | |||||
Auto Components – 0.3% | |||||||
Hyundai Mobis Co Ltd | 1,360 | 292,532 | |||||
Automobiles – 6.2% | |||||||
Astra International Tbk PT | 1,015,900 | 657,670 | |||||
Chongqing Changan Automobile Co Ltd* | 1,344,300 | 1,868,213 | |||||
Hyundai Motor Co | 7,501 | 1,056,621 | |||||
Mahindra & Mahindra Ltd | 33,635 | 666,639 | |||||
Maruti Suzuki India Ltd | 5,534 | 512,720 | |||||
Yulon Motor Co Ltd | 520,157 | 484,325 | |||||
5,246,188 | |||||||
Banks – 14.0% | |||||||
Abu Dhabi Commercial Bank PJSC | 391,007 | 724,008 | |||||
Atlas Mara Ltd* | 21,997 | 47,294 | |||||
Bangkok Bank PCL | 1,600 | 8,662 | |||||
Bangkok Bank PCL (NVDR)# | 56,300 | 297,428 | |||||
Bank Negara Indonesia Persero Tbk PT | 1,767,800 | 859,154 | |||||
Bank of China Ltd | 1,504,000 | 747,036 | |||||
China Construction Bank Corp | 1,703,000 | 1,369,623 | |||||
Grupo Financiero Banorte SAB de CV | 123,100 | 707,975 | |||||
Hana Financial Group Inc | 34,340 | 1,134,839 | |||||
Industrial & Commercial Bank of China Ltd | 2,005,000 | 1,310,643 | |||||
Itau Unibanco Holding SA (ADR)† | 97,987 | 1,182,703 | |||||
Metropolitan Bank & Trust Co | 440,121 | 701,807 | |||||
Moneta Money Bank AS* | 120,291 | 407,726 | |||||
Sberbank of Russia PJSC (ADR)* | 108,169 | 1,248,270 | |||||
Shinhan Financial Group Co Ltd | 20,385 | 849,603 | |||||
Turkiye Garanti Bankasi AS | 125,000 | 304,979 | |||||
11,901,750 | |||||||
Beverages – 1.3% | |||||||
Fomento Economico Mexicano SAB de CV | 79,400 | 704,270 | |||||
Vina Concha y Toro SA | 252,823 | 430,087 | |||||
1,134,357 | |||||||
Capital Markets – 1.9% | |||||||
BM&FBovespa SA - Bolsa de Valores Mercadorias e Futuros | 75,400 | 464,671 | |||||
CITIC Securities Co Ltd* | 226,500 | 466,331 | |||||
Haitong International Securities Group Ltd | 1,170,609 | 688,390 | |||||
1,619,392 | |||||||
Chemicals – 1.2% | |||||||
LG Chem Ltd | 2,174 | 571,645 | |||||
Sasol Ltd | 14,387 | 419,322 | |||||
990,967 | |||||||
Commercial Services & Supplies – 0.9% | |||||||
Beijing Originwater Technology Co Ltd* | 182,600 | 429,753 | |||||
Valid Solucoes e Servicos de Seguranca em Meios de Pagamento e Identificacao SA | 47,800 | 345,126 | |||||
774,879 | |||||||
Construction & Engineering – 0.2% | |||||||
13 Holdings Ltd* | 662,186 | 183,200 | |||||
Diversified Financial Services – 0.7% | |||||||
FirstRand Ltd | 174,066 | 602,162 | |||||
Diversified Telecommunication Services – 0.6% | |||||||
China Telecom Corp Ltd | 671,693 | 327,579 | |||||
KT Corp | 6,120 | 174,607 | |||||
502,186 | |||||||
Electric Utilities – 1.2% | |||||||
Power Grid Corp of India Ltd | 322,726 | 980,654 | |||||
See Notes to Schedule of Investments and Other Information and Notes to Financial Statements. | |
8 | MARCH 31, 2017 |
Janus Emerging Markets Fund
Schedule of Investments (unaudited)
March 31, 2017
Shares
or | Value | ||||||
Common Stocks – (continued) | |||||||
Electronic Equipment, Instruments & Components – 5.4% | |||||||
Chroma ATE Inc | .165,000 | $499,786 | |||||
Delta Electronics Inc | 112,358 | 601,786 | |||||
Hangzhou Hikvision Digital Technology Co Ltd* | 157,650 | 729,713 | |||||
Hon Hai Precision Industry Co Ltd | 307,099 | 921,095 | |||||
Largan Precision Co Ltd | 7,000 | 1,102,835 | |||||
Lens Technology Co Ltd* | 87,500 | 390,029 | |||||
WPG Holdings Ltd | 300,000 | 376,730 | |||||
4,621,974 | |||||||
Equity Real Estate Investment Trusts (REITs) – 0.4% | |||||||
Emlak Konut Gayrimenkul Yatirim Ortakligi AS* | 445,348 | 355,650 | |||||
Food & Staples Retailing – 0.6% | |||||||
X5 Retail Group NV (GDR)* | 16,374 | 550,985 | |||||
Food Products – 1.2% | |||||||
BRF SA | 34,400 | 424,326 | |||||
Gruma SAB de CV | 23,325 | 328,341 | |||||
Industrias Bachoco SAB de CV (ADR) | 5,161 | 279,107 | |||||
1,031,774 | |||||||
Gas Utilities – 1.1% | |||||||
Infraestructura Energetica Nova SAB de CV | 198,900 | 947,988 | |||||
Health Care Providers & Services – 0.7% | |||||||
Shanghai Pharmaceuticals Holding Co Ltd | 215,300 | 563,787 | |||||
Hotels, Restaurants & Leisure – 1.1% | |||||||
Genting Malaysia Bhd | 322,600 | 397,506 | |||||
Melco International Development Ltd | 302,000 | 533,172 | |||||
930,678 | |||||||
Independent Power and Renewable Electricity Producers – 0.9% | |||||||
Beijing Jingneng Clean Energy Co Ltd | 2,590,105 | 789,900 | |||||
Industrial Conglomerates – 1.2% | |||||||
Shun Tak Holdings Ltd* | 1,158,000 | 409,777 | |||||
Sime Darby Bhd | 274,800 | 576,564 | |||||
986,341 | |||||||
Insurance – 2.4% | |||||||
Hyundai Marine & Fire Insurance Co Ltd | 11,568 | 362,114 | |||||
Ping An Insurance Group Co of China Ltd | 308,700 | 1,657,765 | |||||
2,019,879 | |||||||
Internet & Direct Marketing Retail – 0.6% | |||||||
Ctrip.com International Ltd (ADR)* | 10,754 | 528,559 | |||||
Internet Software & Services – 9.6% | |||||||
Alibaba Group Holding Ltd (ADR)* | 27,394 | 2,953,895 | |||||
Baidu Inc (ADR)* | 2,646 | 456,488 | |||||
Mail.Ru Group Ltd (GDR)* | 35,396 | 782,252 | |||||
NAVER Corp | 558 | 426,697 | |||||
Tencent Holdings Ltd | 112,600 | 3,228,196 | |||||
Yandex NV*,† | 14,209 | 311,603 | |||||
8,159,131 | |||||||
Machinery – 1.1% | |||||||
Iochpe Maxion SA | 177,959 | 947,758 | |||||
Marine – 0.6% | |||||||
Orient Overseas International Ltd* | 88,500 | 472,604 | |||||
Media – 2.6% | |||||||
Innocean Worldwide Inc | 8,191 | 451,271 | |||||
Naspers Ltd | 10,048 | 1,735,749 | |||||
2,187,020 | |||||||
Metals & Mining – 2.1% | |||||||
Baoshan Iron & Steel Co Ltd* | 579,100 | 547,018 | |||||
Cia de Minas Buenaventura SAA (ADR) | 32,084 | 386,291 | |||||
Hindustan Zinc Ltd | 56,280 | 250,326 | |||||
See Notes to Schedule of Investments and Other Information and Notes to Financial Statements. | |
Janus Investment Fund | 9 |
Janus Emerging Markets Fund
Schedule of Investments (unaudited)
March 31, 2017
Shares
or | Value | ||||||
Common Stocks – (continued) | |||||||
Metals & Mining – (continued) | |||||||
Hyundai Steel Co | .11,562 | $604,934 | |||||
1,788,569 | |||||||
Multiline Retail – 1.1% | |||||||
SACI Falabella | 47,205 | 397,245 | |||||
Woolworths Holdings Ltd/South Africa | 99,216 | 517,580 | |||||
914,825 | |||||||
Oil, Gas & Consumable Fuels – 6.8% | |||||||
China Petroleum & Chemical Corp | 378,000 | 306,435 | |||||
Coal India Ltd | 130,760 | 589,356 | |||||
LUKOIL PJSC (ADR) | 12,012 | 636,156 | |||||
Novatek PJSC (GDR) | 3,867 | 481,441 | |||||
PetroChina Co Ltd | 1,008,000 | 738,039 | |||||
Petroleo Brasileiro SA (ADR)* | 95,130 | 921,810 | |||||
PTT PCL | 42,200 | 475,358 | |||||
Reliance Industries Ltd* | 25,617 | 521,138 | |||||
Shaanxi Coal Industry Co Ltd* | 698,800 | 626,626 | |||||
Ultrapar Participacoes SA (ADR) | 22,112 | 502,606 | |||||
5,798,965 | |||||||
Personal Products – 0.6% | |||||||
LG Household & Health Care Ltd | 748 | 542,553 | |||||
Pharmaceuticals – 2.9% | |||||||
Sun Pharmaceutical Industries Ltd | 53,886 | 571,102 | |||||
Yunnan Baiyao Group Co Ltd* | 150,473 | 1,858,478 | |||||
2,429,580 | |||||||
Real Estate Management & Development – 4.6% | |||||||
Belle Corp | 2,987,567 | 238,196 | |||||
Central China Real Estate Ltd* | 2,877,794 | 710,996 | |||||
CSI Properties Ltd | 9,210,000 | 420,721 | |||||
Emaar Properties PJSC | 334,785 | 665,486 | |||||
Filinvest Land Inc* | 9,077,000 | 296,717 | |||||
Longfor Properties Co Ltd | 357,000 | 587,091 | |||||
Multiplan Empreendimentos Imobiliarios SA | 28,100 | 595,198 | |||||
Siam Future Development PCL | 2,234,240 | 412,953 | |||||
3,927,358 | |||||||
Semiconductor & Semiconductor Equipment – 7.4% | |||||||
Hua Hong Semiconductor Ltd (144A) | 202,623 | 284,198 | |||||
SK Hynix Inc | 54,247 | 2,450,115 | |||||
Taiwan Semiconductor Manufacturing Co Ltd* | 567,000 | 3,532,070 | |||||
6,266,383 | |||||||
Software – 0.6% | |||||||
Com2uSCorp | 4,966 | 537,861 | |||||
Technology Hardware, Storage & Peripherals – 5.0% | |||||||
Pegatron Corp | 227,000 | 671,872 | |||||
Samsung Electronics Co Ltd | 1,947 | 3,595,265 | |||||
4,267,137 | |||||||
Thrifts & Mortgage Finance – 2.6% | |||||||
Housing Development Finance Corp Ltd | 34,729 | 803,426 | |||||
LIC Housing Finance Ltd | 152,560 | 1,453,115 | |||||
2,256,541 | |||||||
Tobacco – 0.5% | |||||||
ITC Ltd | 101,840 | 439,639 | |||||
Transportation Infrastructure – 0.9% | |||||||
Shanghai International Airport Co Ltd | 167,300 | 727,771 | |||||
Wireless Telecommunication Services – 2.2% | |||||||
China Mobile Ltd | 137,000 | 1,499,344 | |||||
MTN Group Ltd | 42,553 | 387,388 | |||||
1,886,732 | |||||||
Total Common Stocks (cost $73,779,842) | 81,925,952 | ||||||
See Notes to Schedule of Investments and Other Information and Notes to Financial Statements. | |
10 | MARCH 31, 2017 |
Janus Emerging Markets Fund
Schedule of Investments (unaudited)
March 31, 2017
Shares
or | Value | ||||||
Preferred Stocks – 2.1% | |||||||
Paper & Forest Products – 0.7% | |||||||
Suzano Papel e Celulose SA | .133,000 | $563,426 | |||||
Technology Hardware, Storage & Peripherals – 1.4% | |||||||
Samsung Electronics Co Ltd | 845 | 1,211,461 | |||||
Total Preferred Stocks (cost $1,465,549) | 1,774,887 | ||||||
Warrants – 0% | |||||||
Banks – 0% | |||||||
Atlas Mara Ltd, expires 8/21/17 (144A)* | 69,975 | 38 | |||||
Machinery – 0% | |||||||
Iochpe Maxion SA, expires 6/3/19* | 4,305 | 6,904 | |||||
Total Warrants (cost $21,536) | 6,942 | ||||||
Investment Companies – 3.4% | |||||||
Investments Purchased with Cash Collateral from Securities Lending – 0.3% | |||||||
Janus Cash Collateral Fund LLC, 0.6842%ºº,£ | 233,100 | 233,100 | |||||
Money Markets – 3.1% | |||||||
Janus Cash Liquidity Fund LLC, 0.7113%ºº,£ | 2,649,048 | 2,649,048 | |||||
Total Investment Companies (cost $2,882,148) | 2,882,148 | ||||||
OTC Purchased Options – Calls – 0% | |||||||
Counterparty/Reference Asset | |||||||
Goldman Sachs International: | |||||||
CNH Currency, exercise price 6.80 CNH, expires July 2017* (premiums paid $60,168) | 1,754,183 | 37,304 | |||||
Total Investments (total cost $78,209,243) – 101.7% | 86,627,233 | ||||||
Liabilities, net of Cash, Receivables and Other Assets – (1.7)% | (1,435,164) | ||||||
Net Assets – 100% | $85,192,069 | ||||||
Summary of Investments by Country - (Long Positions) (unaudited) | |||||
% of | |||||
Investment | |||||
Country | Value | Securities | |||
China | $26,523,249 | 30.6 | % | ||
South Korea | 14,262,118 | 16.5 | |||
Taiwan | 8,190,499 | 9.5 | |||
India | 6,788,115 | 7.8 | |||
Brazil | 5,954,528 | 6.9 | |||
Russia | 4,010,707 | 4.6 | |||
South Africa | 3,709,495 | 4.3 | |||
Mexico | 2,967,681 | 3.4 | |||
United States | 2,919,452 | 3.4 | |||
Hong Kong | 2,707,864 | 3.1 | |||
Indonesia | 1,516,824 | 1.7 | |||
United Arab Emirates | 1,389,494 | 1.6 | |||
Philippines | 1,236,720 | 1.4 | |||
Thailand | 1,194,401 | 1.4 | |||
Malaysia | 974,070 | 1.1 | |||
Chile | 827,332 | 1.0 | |||
Turkey | 660,629 | 0.8 | |||
Czech Republic | 407,726 | 0.5 | |||
Peru | 386,291 | 0.4 | |||
United Kingdom | 38 | 0.0 | |||
Total | $86,627,233 | 100.0 | % |
See Notes to Schedule of Investments and Other Information and Notes to Financial Statements. | |
Janus Investment Fund | 11 |
Janus Emerging Markets Fund
Schedule of Investments (unaudited)
March 31, 2017
Schedule of OTC Written Options | ||||||||||||||||||||||||||
Counterparty | Reference Asset | Number of Contracts | Exercise Price | Expiration Date | Premiums Received | Unrealized Appreciation/ (Depreciation) | Options Written, at Value | |||||||||||||||||||
Written Call Options: | ||||||||||||||||||||||||||
Goldman Sachs International | CNH Currency | 1,754,183 | 7.20 | CNH | 7/17 | $ | 28,593 | $ | 25,260 | $ | (3,333) | |||||||||||||||
Schedule of Total Return Swaps | |||||||||||
Unrealized | |||||||||||
Return Paid | Return Received | Termination | Notional | Appreciation/ | |||||||
Counterparty | by the Fund | by the Fund | Date | Amount | (Depreciation) | ||||||
Credit Suisse International | 1 month USD LIBOR plus 125 basis points | Moscow Exchange MICEX - RTS OAO | 2/5/18 | $210,647 | $10,875 | ||||||
See Notes to Schedule of Investments and Other Information and Notes to Financial Statements. | |
12 | MARCH 31, 2017 |
Janus Emerging Markets Fund
Notes to Schedule of Investments and Other Information (unaudited)
MSCI Emerging Markets IndexSM | MSCI Emerging Markets IndexSM reflects the equity market performance of emerging markets. |
ADR | American Depositary Receipt |
GDR | Global Depositary Receipt |
LIBOR | London Interbank Offered Rate |
LLC | Limited Liability Company |
NVDR | Non-Voting Depositary Receipt |
OTC | Over-the-Counter |
PCL | Public Company Limited |
PJSC | Private Joint Stock Company |
144A | Securities sold under Rule 144A of the Securities Act of 1933, as amended, are subject to legal and/or contractual restrictions on resale and may not be publicly sold without registration under the 1933 Act. Unless otherwise noted, these securities have been determined to be liquid under guidelines established by the Board of Trustees. The total value of 144A securities as of the period ended March 31, 2017 is $284,236, which represents 0.3% of net assets. |
* | Non-income producing security. |
† | A portion of this security has been segregated to cover margin or segregation requirements on open futures contracts, forward currency contracts, options contracts, short sales, swap agreements, and/or securities with extended settlement dates, the value of which, as of March 31, 2017, is $735,080. |
ºº | Rate shown is the 7-day yield as of March 31, 2017. |
# | Loaned security; a portion of the security is on loan at March 31, 2017. |
£ | The Fund may invest in certain securities that are considered affiliated companies. As defined by the Investment Company Act of 1940, as amended, an affiliated company is one in which the Fund owns 5% or more of the outstanding voting securities, or a company which is under common ownership or control. The following securities were considered affiliated companies for all or some portion of the period ended March 31, 2017. Unless otherwise indicated, all information in the table is for the period ended March 31, 2017. |
Share | Share | ||||||||||||||
Balance | Balance | Realized | Dividend | Value | |||||||||||
at 9/30/16 | Purchases | Sales | at 3/31/17 | Gain/(Loss) | Income | at 3/31/17 | |||||||||
Janus Cash Collateral Fund LLC | 140,000 | 7,082,432 | (6,989,332) | 233,100 | $— | $459(1) | $233,100 | ||||||||
Janus Cash Liquidity Fund LLC | 429,141 | 31,784,316 | (29,564,409) | 2,649,048 | — | 2,765 | 2,649,048 | ||||||||
Total | $— | $3,224 | $2,882,148 | ||||||||||||
(1) | Net of income paid to the securities lending agent and rebates paid to the borrowing counterparties. | ||||||||||||||
Janus Investment Fund | 13 |
Janus Emerging Markets Fund
Notes to Schedule of Investments and Other Information (unaudited)
The following is a summary of the inputs that were used to value the Fund’s investments in securities and other financial instruments as of March 31, 2017. See Notes to Financial Statements for more information. | |||||||||||||
Valuation Inputs Summary | |||||||||||||
Level 2 - | Level 3 - | ||||||||||||
Level 1 - | Other Significant | Significant | |||||||||||
Quotes Prices | Observable Inputs | Unobservable Inputs | |||||||||||
Assets | |||||||||||||
Investments in Securities: | |||||||||||||
Common Stocks | $ | 81,925,952 | $ | - | $ | - | |||||||
Preferred Stocks | - | 1,774,887 | - | ||||||||||
Warrants | 6,942 | - | - | ||||||||||
Investment Companies | - | 2,882,148 | - | ||||||||||
OTC Purchased Options – Calls | - | 37,304 | - | ||||||||||
Total Investments in Securities | $ | 81,932,894 | $ | 4,694,339 | $ | - | |||||||
Other Financial Instruments(a): | |||||||||||||
Outstanding Swap Contracts, at Value | - | 10,875 | - | ||||||||||
Total Assets | $ | 81,932,894 | $ | 4,705,214 | $ | - | |||||||
Liabilities | |||||||||||||
Other Financial Instruments(a): | |||||||||||||
Options Written, at Value | $ | - | $ | 3,333 | $ | - | |||||||
(a) | Other financial instruments include forward currency, futures, written options, written swaptions, and swap contracts. Forward currency contracts are reported at their unrealized appreciation/(depreciation) at measurement date, which represents the change in the contract's value from trade date. Futures, certain written options on futures, and centrally cleared swap contracts are reported at their variation margin at measurement date, which represents the amount due to/from the Fund at that date. Written options, written swaptions, and other swap contracts are reported at their market value at measurement date. | ||||||||||||
14 | MARCH 31, 2017 |
Janus Emerging Markets Fund
Statement of Assets and Liabilities (unaudited)
March 31, 2017
See footnotes at the end of the Statement. |
|
|
|
|
|
|
|
Assets: | ||||||
Investments, at cost | $ | 78,209,243 | ||||
Unaffiliated investments, at value(1) | 83,745,085 | |||||
Affiliated investments, at value | 2,882,148 | |||||
Cash | 145,906 | |||||
Restricted cash (Note 1) | 453,186 | |||||
Cash denominated in foreign currency(2) | 45,920 | |||||
Outstanding swap contracts, at value | 10,875 | |||||
Non-interested Trustees' deferred compensation | 1,608 | |||||
Receivables: | ||||||
Dividends | 239,020 | |||||
Fund shares sold | 152,020 | |||||
Investments sold | 61,854 | |||||
Foreign tax reclaims | 1,316 | |||||
Dividends from affiliates | 1,314 | |||||
Other assets | 9,773 | |||||
Total Assets |
|
| 87,750,025 |
| ||
Liabilities: | ||||||
Collateral for securities loaned (Note 3) | 233,100 | |||||
Options written, at value(3) | 3,333 | |||||
Closed foreign currency contracts | 4,511 | |||||
Payables: | — | |||||
Investments purchased | 2,025,029 | |||||
Fund shares repurchased | 144,949 | |||||
Advisory fees | 61,617 | |||||
Foreign tax liability | 37,591 | |||||
Professional fees | 16,516 | |||||
Transfer agent fees and expenses | 9,490 | |||||
Custodian fees | 3,337 | |||||
Non-interested Trustees' deferred compensation fees | 1,608 | |||||
Fund administration fees | 617 | |||||
Non-interested Trustees' fees and expenses | 411 | |||||
12b-1 Distribution and shareholder servicing fees | 407 | |||||
Accrued expenses and other payables | 15,440 | |||||
Total Liabilities |
|
| 2,557,956 |
| ||
Net Assets |
| $ | 85,192,069 |
| ||
See Notes to Financial Statements. | |
Janus Investment Fund | 15 |
Janus Emerging Markets Fund
Statement of Assets and Liabilities (unaudited)
March 31, 2017
|
|
|
|
|
|
|
Net Assets Consist of: | ||||||
Capital (par value and paid-in surplus) | $ | 83,259,648 | ||||
Undistributed net investment income/(loss) | (377,979) | |||||
Undistributed net realized gain/(loss) from investments and foreign currency transactions | (5,950,127) | |||||
Unrealized net appreciation/(depreciation) of investments, foreign currency translations and non-interested Trustees’ deferred compensation(4) | 8,260,527 | |||||
Total Net Assets |
| $ | 85,192,069 |
| ||
Net Assets - Class A Shares | $ | 152,011 | ||||
Shares Outstanding, $0.01 Par Value (unlimited shares authorized) | 16,916 | |||||
Net Asset Value Per Share(5) |
| $ | 8.99 |
| ||
Maximum Offering Price Per Share(6) |
| $ | 9.54 |
| ||
Net Assets - Class C Shares | $ | 386,651 | ||||
Shares Outstanding, $0.01 Par Value (unlimited shares authorized) | 43,614 | |||||
Net Asset Value Per Share(5) |
| $ | 8.87 |
| ||
Net Assets - Class D Shares | $ | 13,406,418 | ||||
Shares Outstanding, $0.01 Par Value (unlimited shares authorized) | 1,498,850 | |||||
Net Asset Value Per Share |
| $ | 8.94 |
| ||
Net Assets - Class I Shares | $ | 64,173,974 | ||||
Shares Outstanding, $0.01 Par Value (unlimited shares authorized) | 7,153,629 | |||||
Net Asset Value Per Share |
| $ | 8.97 |
| ||
Net Assets - Class S Shares | $ | 181,514 | ||||
Shares Outstanding, $0.01 Par Value (unlimited shares authorized) | 20,121 | |||||
Net Asset Value Per Share |
| $ | 9.02 |
| ||
Net Assets - Class T Shares | $ | 6,891,501 | ||||
Shares Outstanding, $0.01 Par Value (unlimited shares authorized) | 770,158 | |||||
Net Asset Value Per Share |
| $ | 8.95 |
| ||
(1) Includes $221,242 of securities on loan. See Note 3 in Notes to Financial Statements. (2) Includes cost of $45,920. (3) Premiums received $28,593. (4) Includes $37,591 of foreign capital gains tax on investments. (5) Redemption price per share may be reduced for any applicable contingent deferred sales charge. (6) Maximum offering price is computed at 100/94.25 of net asset value. |
See Notes to Financial Statements. | |
16 | MARCH 31, 2017 |
Janus Emerging Markets Fund
Statement of Operations (unaudited)
For the period ended March 31, 2017
|
|
|
|
|
|
Investment Income: | |||||
| Dividends | $ | 452,515 | ||
Dividends from affiliates | 2,765 | ||||
Affiliated securities lending income, net | 459 | ||||
Other income | 2,184 | ||||
Foreign tax withheld | (63,529) | ||||
Total Investment Income |
| 394,394 |
| ||
Expenses: | |||||
Advisory fees | 337,522 | ||||
12b-1Distribution and shareholder servicing fees: | |||||
Class A Shares | 211 | ||||
Class C Shares | 1,655 | ||||
Class S Shares | 211 | ||||
Transfer agent administrative fees and expenses: | |||||
Class D Shares | 6,606 | ||||
Class S Shares | 211 | ||||
Class T Shares | 9,515 | ||||
Transfer agent networking and omnibus fees: | |||||
Class A Shares | 229 | ||||
Class C Shares | 186 | ||||
Class I Shares | 12,162 | ||||
Other transfer agent fees and expenses: | |||||
Class A Shares | 10 | ||||
Class C Shares | 21 | ||||
Class D Shares | 2,421 | ||||
Class I Shares | 1,094 | ||||
Class T Shares | 94 | ||||
Registration fees | 62,350 | ||||
Professional fees | 33,030 | ||||
Custodian fees | 13,464 | ||||
Shareholder reports expense | 6,215 | ||||
Fund administration fees | 2,936 | ||||
Non-interested Trustees’ fees and expenses | 926 | ||||
Other expenses | 3,666 | ||||
Total Expenses |
| 494,735 |
| ||
Less: Excess Expense Reimbursement |
| (44,180) |
| ||
Net Expenses |
| 450,555 |
| ||
Net Investment Income/(Loss) |
| (56,161) |
| ||
Net Realized Gain/(Loss) on Investments: | |||||
Investments and foreign currency transactions | 482,318 | ||||
Swap contracts | (3,047) | ||||
Total Net Realized Gain/(Loss) on Investments |
| 479,271 |
| ||
Change in Unrealized Net Appreciation/Depreciation:(1) | |||||
Investments, foreign currency translations and non-interested Trustees’ deferred compensation | 4,364,684 | ||||
Swap contracts | 508 | ||||
Written options contracts | 10,616 | ||||
Total Change in Unrealized Net Appreciation/Depreciation |
| 4,375,808 |
| ||
Net Increase/(Decrease) in Net Assets Resulting from Operations | $ | 4,798,918 |
| ||
(1) Includes change in unrealized appreciation/depreciation of $62,037 due to foreign capital gains tax on investments. |
See Notes to Financial Statements. | |
Janus Investment Fund | 17 |
Janus Emerging Markets Fund
Statements of Changes in Net Assets
|
|
| Period
ended |
| Year ended | |||
Operations: | ||||||||
Net investment income/(loss) | $ | (56,161) | $ | 348,741 | ||||
Net realized gain/(loss) on investments | 479,271 | (5,039,425) | ||||||
Change in unrealized net appreciation/depreciation | 4,375,808 | 12,746,897 | ||||||
Net Increase/(Decrease) in Net Assets Resulting from Operations |
| 4,798,918 |
|
| 8,056,213 | |||
Dividends and Distributions to Shareholders: | ||||||||
Dividends from Net Investment Income | ||||||||
Class A Shares | (1,109) | — | ||||||
Class C Shares | (681) | — | ||||||
Class D Shares | (106,544) | (27,129) | ||||||
Class I Shares | (437,592) | (144,626) | ||||||
Class S Shares | — | (2,678) | ||||||
Class T Shares | (79,572) | (11,506) | ||||||
Net Decrease from Dividends and Distributions to Shareholders |
| (625,498) |
|
| (185,939) | |||
Capital Share Transactions: | ||||||||
Class A Shares | (92,723) | (70,857) | ||||||
Class C Shares | 103,940 | 120 | ||||||
Class D Shares | 3,080,653 | 725,808 | ||||||
Class I Shares | 19,886,428 | 8,040,426 | ||||||
Class S Shares | 5,176 | 38,787 | ||||||
Class T Shares | 775,587 | 918,073 | ||||||
Net Increase/(Decrease) from Capital Share Transactions |
| 23,759,061 |
|
| 9,652,357 | |||
Net Increase/(Decrease) in Net Assets |
| 27,932,481 |
|
| 17,522,631 | |||
Net Assets: | ||||||||
Beginning of period | 57,259,588 | 39,736,957 | ||||||
| End of period | $ | 85,192,069 |
| $ | 57,259,588 | ||
Undistributed Net Investment Income/(Loss) | $ | (377,979) |
| $ | 303,680 | |||
See Notes to Financial Statements. | |
18 | MARCH 31, 2017 |
Janus Emerging Markets Fund
Financial Highlights
Class A Shares | |||||||||||||||||||||
For a share outstanding during the period ended March 31, 2017 (unaudited) and each year ended September 30 | 2017 |
|
| 2016 |
|
| 2015 |
|
| 2014 |
|
| 2013 |
|
| 2012 | |||||
Net Asset Value, Beginning of Period |
| $8.38 |
|
| $7.15 |
|
| $8.61 |
|
| $8.23 |
|
| $7.99 |
|
| $7.41 |
| |||
Income/(Loss) from Investment Operations: | |||||||||||||||||||||
Net investment income/(loss) | (0.03)(1) | 0.01(1) | 0.02(1) | 0.15(1)(2) | 0.28 | 0.03 | |||||||||||||||
Net realized and unrealized gain/(loss) | 0.69 | 1.22 | (1.35) | 0.39 | (0.01) | 0.62 | |||||||||||||||
Total from Investment Operations |
| 0.66 |
|
| 1.23 |
|
| (1.33) |
|
| 0.54 |
|
| 0.27 |
|
| 0.65 |
| |||
Less Dividends and Distributions: | |||||||||||||||||||||
Dividends (from net investment income) | (0.05) | — | (0.13) | (0.16) | (0.03) | (0.04) | |||||||||||||||
Distributions (from capital gains) | — | — | — | — | — | (0.03) | |||||||||||||||
Total Dividends and Distributions |
| (0.05) |
|
| — |
|
| (0.13) |
|
| (0.16) |
|
| (0.03) |
|
| (0.07) |
| |||
Net Asset Value, End of Period | $8.99 | $8.38 | $7.15 | $8.61 | $8.23 | $7.99 | |||||||||||||||
Total Return* |
| 7.94% |
|
| 17.20% |
|
| (15.61)% |
|
| 6.71% |
|
| 3.34% |
|
| 8.78% |
| |||
Net Assets, End of Period (in thousands) | $152 | $238 | $278 | $378 | $275 | $992 | |||||||||||||||
Average Net Assets for the Period (in thousands) | $177 | $261 | $371 | $307 | $759 | $1,028 | |||||||||||||||
Ratios to Average Net Assets**: |
|
|
|
|
|
|
|
|
|
|
|
|
|
|
|
|
|
| |||
Ratio of Gross Expenses | 1.99% | 2.02% | 1.98% | 1.97% | 1.81% | 2.37% | |||||||||||||||
Ratio of Net Expenses (After Waivers and Expense Offsets) | 1.82% | 1.74% | 1.61% | 1.65% | 1.48% | 1.46% | |||||||||||||||
Ratio of Net Investment Income/(Loss) | (0.76)% | 0.17% | 0.23% | 1.73%(2) | 0.06% | 0.47% | |||||||||||||||
Portfolio Turnover Rate | 24% | 95% | 131% | 59% | 138% | 136% | |||||||||||||||
1 | |||||||||||||||||||||
Class C Shares | |||||||||||||||||||||
For a share outstanding during the period ended March 31, 2017 (unaudited) and each year ended September 30 | 2017 |
|
| 2016 |
|
| 2015 |
|
| 2014 |
|
| 2013 |
|
| 2012 |
| ||||
Net Asset Value, Beginning of Period |
| $8.26 |
|
| $7.09 |
|
| $8.50 |
|
| $8.12 |
|
| $7.91 |
|
| $7.39 |
| |||
Income/(Loss) from Investment Operations: | |||||||||||||||||||||
Net investment income/(loss) | (0.05)(1) | (0.03)(1) | (0.04)(1) | 0.11(1)(2) | (0.20) | (0.03) | |||||||||||||||
Net realized and unrealized gain/(loss) | 0.68 | 1.20 | (1.35) | 0.36 | 0.41 | 0.62 | |||||||||||||||
Total from Investment Operations |
| 0.63 |
|
| 1.17 |
|
| (1.39) |
|
| 0.47 |
|
| 0.21 |
|
| 0.59 |
| |||
Less Dividends and Distributions: | |||||||||||||||||||||
Dividends (from net investment income) | (0.02) | — | (0.02) | (0.09) | — | (0.04) | |||||||||||||||
Distributions (from capital gains) | — | — | — | — | — | (0.03) | |||||||||||||||
Total Dividends and Distributions |
| (0.02) |
|
| — |
|
| (0.02) |
|
| (0.09) |
|
| — |
|
| (0.07) |
| |||
Net Asset Value, End of Period | $8.87 | $8.26 | $7.09 | $8.50 | $8.12 | $7.91 | |||||||||||||||
Total Return* |
| 7.62% |
|
| 16.50% |
|
| (16.36)% |
|
| 5.85% |
|
| 2.65% |
|
| 7.98% |
| |||
Net Assets, End of Period (in thousands) | $387 | $259 | $225 | $94 | $194 | $771 | |||||||||||||||
Average Net Assets for the Period (in thousands) | $331 | $269 | $121 | $185 | $428 | $788 | |||||||||||||||
Ratios to Average Net Assets**: |
|
|
|
|
|
|
|
|
|
|
|
|
|
|
|
|
|
| |||
Ratio of Gross Expenses | 2.62% | 2.71% | 2.77% | 2.68% | 2.54% | 3.04% | |||||||||||||||
Ratio of Net Expenses (After Waivers and Expense Offsets) | 2.48% | 2.47% | 2.39% | 2.32% | 2.16% | 2.21% | |||||||||||||||
Ratio of Net Investment Income/(Loss) | (1.21)% | (0.39)% | (0.47)% | 1.32%(2) | (0.97)% | (0.27)% | |||||||||||||||
Portfolio Turnover Rate | 24% | 95% | 131% | 59% | 138% | 136% | |||||||||||||||
* Total return not annualized for periods of less than one full year. ** Annualized for periods of less than one full year. (1) Per share amounts are calculated based on average shares outstanding during the year or period. (2) Net investment income/(loss) per share and Ratio of Net Investment Income/(Loss) to Average Net Assets include a special dividend from Strides Arcolab, Ltd. in December 2013. The impact of the special dividend to Net investment income/(loss) per share and Ratio of Net Investment Income/(Loss) to Average Net Assets is $0.08 and 0.94%, respectively. |
See Notes to Financial Statements. | |
Janus Investment Fund | 19 |
Janus Emerging Markets Fund
Financial Highlights
Class D Shares | |||||||||||||||||||||
For a share outstanding during the period ended March 31, 2017 (unaudited) and each year ended September 30 | 2017 |
|
| 2016 |
|
| 2015 |
|
| 2014 |
|
| 2013 |
|
| 2012 | |||||
Net Asset Value, Beginning of Period |
| $8.36 |
|
| $7.13 |
|
| $8.58 |
|
| $8.24 |
|
| $8.00 |
|
| $7.42 |
| |||
Income/(Loss) from Investment Operations: | |||||||||||||||||||||
Net investment income/(loss) | (0.01)(1) | 0.04(1) | 0.04(1) | 0.19(1)(2) | 0.20 | 0.05 | |||||||||||||||
Net realized and unrealized gain/(loss) | 0.67 | 1.22 | (1.35) | 0.37 | 0.09 | 0.60 | |||||||||||||||
Total from Investment Operations |
| 0.66 |
|
| 1.26 |
|
| (1.31) |
|
| 0.56 |
|
| 0.29 |
|
| 0.65 |
| |||
Less Dividends and Distributions: | |||||||||||||||||||||
Dividends (from net investment income) | (0.08) | (0.03) | (0.14) | (0.22) | (0.05) | (0.04) | |||||||||||||||
Distributions (from capital gains) | — | — | — | — | — | (0.03) | |||||||||||||||
Redemption fees | N/A | N/A | N/A | N/A | N/A | —(3) | |||||||||||||||
Total Dividends and Distributions |
| (0.08) |
|
| (0.03) |
|
| (0.14) |
|
| (0.22) |
|
| (0.05) |
|
| (0.07) |
| |||
Net Asset Value, End of Period | $8.94 | $8.36 | $7.13 | $8.58 | $8.24 | $8.00 | |||||||||||||||
Total Return* |
| 8.07% |
|
| 17.65% |
|
| (15.38)% |
|
| 6.98% |
|
| 3.56% |
|
| 8.76% |
| |||
Net Assets, End of Period (in thousands) | $13,406 | $9,584 | $7,583 | $10,889 | $9,136 | $9,359 | |||||||||||||||
Average Net Assets for the Period (in thousands) | $11,000 | $8,032 | $10,066 | $9,995 | $9,679 | $8,963 | |||||||||||||||
Ratios to Average Net Assets**: |
|
|
|
|
|
|
|
|
|
|
|
|
|
|
|
|
|
| |||
Ratio of Gross Expenses | 1.69% | 1.73% | 1.68% | 1.67% | 1.64% | 2.15% | |||||||||||||||
Ratio of Net Expenses (After Waivers and Expense Offsets) | 1.52% | 1.47% | 1.30% | 1.34% | 1.30% | 1.35% | |||||||||||||||
Ratio of Net Investment Income/(Loss) | (0.25)% | 0.59% | 0.51% | 2.18%(2) | 0.61% | 0.66% | |||||||||||||||
Portfolio Turnover Rate | 24% | 95% | 131% | 59% | 138% | 136% | |||||||||||||||
Class I Shares | |||||||||||||||||||||
For a share outstanding during the period ended March 31, 2017 (unaudited) and each year ended September 30 | 2017 |
|
| 2016 |
|
| 2015 |
|
| 2014 |
|
| 2013 |
|
| 2012 |
| ||||
Net Asset Value, Beginning of Period |
| $8.40 |
|
| $7.16 |
|
| $8.61 |
|
| $8.27 |
|
| $8.01 |
|
| $7.41 |
| |||
Income/(Loss) from Investment Operations: | |||||||||||||||||||||
Net investment income/(loss) | —(1)(4) | 0.06(1) | 0.05(1) | 0.20(1)(2) | 0.19 | 0.07 | |||||||||||||||
Net realized and unrealized gain/(loss) | 0.66 | 1.21 | (1.35) | 0.38 | 0.11 | 0.60 | |||||||||||||||
Total from Investment Operations |
| 0.66 |
|
| 1.27 |
|
| (1.30) |
|
| 0.58 |
|
| 0.30 |
|
| 0.67 |
| |||
Less Dividends and Distributions: | |||||||||||||||||||||
Dividends (from net investment income) | (0.09) | (0.03) | (0.15) | (0.24) | (0.04) | (0.04) | |||||||||||||||
Distributions (from capital gains) | — | — | — | — | — | (0.03) | |||||||||||||||
Redemption fees | N/A | N/A | N/A | N/A | N/A | —(3) | |||||||||||||||
Total Dividends and Distributions |
| (0.09) |
|
| (0.03) |
|
| (0.15) |
|
| (0.24) |
|
| (0.04) |
|
| (0.07) |
| |||
Net Asset Value, End of Period | $8.97 | $8.40 | $7.16 | $8.61 | $8.27 | $8.01 | |||||||||||||||
Total Return* |
| 8.00% |
|
| 17.77% |
|
| (15.22)% |
|
| 7.19% |
|
| 3.78% |
|
| 9.05% |
| |||
Net Assets, End of Period (in thousands) | $64,174 | $41,342 | $27,417 | $21,896 | $15,996 | $8,392 | |||||||||||||||
Average Net Assets for the Period (in thousands) | $42,350 | $38,073 | $22,174 | $19,341 | $12,309 | $5,502 | |||||||||||||||
Ratios to Average Net Assets**: |
|
|
|
|
|
|
|
|
|
|
|
|
|
|
|
|
|
| |||
Ratio of Gross Expenses | 1.55% | 1.60% | 1.56% | 1.52% | 1.50% | 1.81% | |||||||||||||||
Ratio of Net Expenses (After Waivers and Expense Offsets) | 1.42% | 1.37% | 1.17% | 1.18% | 1.14% | 1.19% | |||||||||||||||
Ratio of Net Investment Income/(Loss) | (0.11)% | 0.73% | 0.61% | 2.29%(2) | 1.16% | 0.90% | |||||||||||||||
Portfolio Turnover Rate | 24% | 95% | 131% | 59% | 138% | 136% | |||||||||||||||
* Total return not annualized for periods of less than one full year. ** Annualized for periods of less than one full year. (1) Per share amounts are calculated based on average shares outstanding during the year or period. (2) Net investment income/(loss) per share and Ratio of Net Investment Income/(Loss) to Average Net Assets include a special dividend from Strides Arcolab, Ltd. in December 2013. The impact of the special dividend to Net investment income/(loss) per share and Ratio of Net Investment Income/(Loss) to Average Net Assets is $0.08 and 0.94%, respectively. (3) Redemption fees aggregated less than $0.005 on a per share basis. Redemption fees were eliminated effective April 2, 2012. |
See Notes to Financial Statements. | |
20 | MARCH 31, 2017 |
Janus Emerging Markets Fund
Financial Highlights
Class S Shares | |||||||||||||||||||||
For a share outstanding during the period ended March 31, 2017 (unaudited) and each year ended September 30 | 2017 |
|
| 2016 |
|
| 2015 |
|
| 2014 |
|
| 2013 |
|
| 2012 | |||||
Net Asset Value, Beginning of Period |
| $8.36 |
|
| $7.14 |
|
| $8.56 |
|
| $8.24 |
|
| $7.97 |
|
| $7.41 |
| |||
Income/(Loss) from Investment Operations: | |||||||||||||||||||||
Net investment income/(loss) | (0.02)(1) | 0.02(1) | 0.03(1) | 0.18(1)(2) | 0.14 | 0.02 | |||||||||||||||
Net realized and unrealized gain/(loss) | 0.68 | 1.22 | (1.33) | 0.36 | 0.14 | 0.61 | |||||||||||||||
Total from Investment Operations |
| 0.66 |
|
| 1.24 |
|
| (1.30) |
|
| 0.54 |
|
| 0.28 |
|
| 0.63 |
| |||
Less Dividends and Distributions: | |||||||||||||||||||||
Dividends (from net investment income) | — | (0.02) | (0.12) | (0.22) | (0.01) | (0.04) | |||||||||||||||
Distributions (from capital gains) | — | — | — | — | — | (0.03) | |||||||||||||||
Total Dividends and Distributions |
| — |
|
| (0.02) |
|
| (0.12) |
|
| (0.22) |
|
| (0.01) |
|
| (0.07) |
| |||
Net Asset Value, End of Period | $9.02 | $8.36 | $7.14 | $8.56 | $8.24 | $7.97 | |||||||||||||||
Total Return* |
| 7.89% |
|
| 17.39% |
|
| (15.32)% |
|
| 6.67% |
|
| 3.55% |
|
| 8.50% |
| |||
Net Assets, End of Period (in thousands) | $182 | $163 | $124 | $147 | $337 | $676 | |||||||||||||||
Average Net Assets for the Period (in thousands) | $169 | $701 | $166 | $326 | $481 | $676 | |||||||||||||||
Ratios to Average Net Assets**: |
|
|
|
|
|
|
|
|
|
|
|
|
|
|
|
|
|
| |||
Ratio of Gross Expenses | 1.99% | 2.09% | 2.01% | 2.05% | 1.97% | 2.50% | |||||||||||||||
Ratio of Net Expenses (After Waivers and Expense Offsets) | 1.78% | 1.74% | 1.43% | 1.54% | 1.48% | 1.64% | |||||||||||||||
Ratio of Net Investment Income/(Loss) | (0.55)% | 0.23% | 0.33% | 2.10%(2) | 0.05% | 0.29% | |||||||||||||||
Portfolio Turnover Rate | 24% | 95% | 131% | 59% | 138% | 136% | |||||||||||||||
Class T Shares | |||||||||||||||||||||
For a share outstanding during the period ended March 31, 2017 (unaudited) and each year ended September 30 | 2017 |
|
| 2016 |
|
| 2015 |
|
| 2014 |
|
| 2013 |
|
| 2012 |
| ||||
Net Asset Value, Beginning of Period |
| $8.37 |
|
| $7.14 |
|
| $8.60 |
|
| $8.26 |
|
| $7.99 |
|
| $7.41 |
| |||
Income/(Loss) from Investment Operations: | |||||||||||||||||||||
Net investment income/(loss) | (0.02)(1) | 0.04(1) | 0.09(1) | 0.19(1)(2) | 0.29 | 0.05 | |||||||||||||||
Net realized and unrealized gain/(loss) | 0.68 | 1.21 | (1.41) | 0.37 | 0.01 | 0.60 | |||||||||||||||
Total from Investment Operations |
| 0.66 |
|
| 1.25 |
|
| (1.32) |
|
| 0.56 |
|
| 0.30 |
|
| 0.65 |
| |||
Less Dividends and Distributions: | |||||||||||||||||||||
Dividends (from net investment income) | (0.08) | (0.02) | (0.14) | (0.22) | (0.03) | (0.04) | |||||||||||||||
Distributions (from capital gains) | — | — | — | — | — | (0.03) | |||||||||||||||
Redemption fees | N/A | N/A | N/A | N/A | N/A | —(3) | |||||||||||||||
Total Dividends and Distributions |
| (0.08) |
|
| (0.02) |
|
| (0.14) |
|
| (0.22) |
|
| (0.03) |
|
| (0.07) |
| |||
Net Asset Value, End of Period | $8.95 | $8.37 | $7.14 | $8.60 | $8.26 | $7.99 | |||||||||||||||
Total Return* |
| 8.03% |
|
| 17.53% |
|
| (15.52)% |
|
| 6.92% |
|
| 3.73% |
|
| 8.78% |
| |||
Net Assets, End of Period (in thousands) | $6,892 | $5,673 | $4,111 | $1,207 | $825 | $2,141 | |||||||||||||||
Average Net Assets for the Period (in thousands) | $7,619 | $4,632 | $2,578 | $1,121 | $2,105 | $2,004 | |||||||||||||||
Ratios to Average Net Assets**: |
|
|
|
|
|
|
|
|
|
|
|
|
|
|
|
|
|
| |||
Ratio of Gross Expenses | 1.74% | 1.79% | 1.79% | 1.77% | 1.70% | 2.13% | |||||||||||||||
Ratio of Net Expenses (After Waivers and Expense Offsets) | 1.60% | 1.56% | 1.44% | 1.41% | 1.37% | 1.42% | |||||||||||||||
Ratio of Net Investment Income/(Loss) | (0.44)% | 0.47% | 1.09% | 2.19%(2) | (0.19)% | 0.58% | |||||||||||||||
Portfolio Turnover Rate | 24% | 95% | 131% | 59% | 138% | 136% | |||||||||||||||
* Total return not annualized for periods of less than one full year. ** Annualized for periods of less than one full year. (1) Per share amounts are calculated based on average shares outstanding during the year or period. (2) Net investment income/(loss) per share and Ratio of Net Investment Income/(Loss) to Average Net Assets include a special dividend from Strides Arcolab, Ltd. in December 2013. The impact of the special dividend to Net investment income/(loss) per share and Ratio of Net Investment Income/(Loss) to Average Net Assets is $0.08 and 0.94%, respectively. (3) Redemption fees aggregated less than $0.005 on a per share basis. Redemption fees were eliminated effective April 2, 2012. |
See Notes to Financial Statements. | |
Janus Investment Fund | 21 |
Janus Emerging Markets Fund
Notes to Financial Statements (unaudited)
1. Organization and Significant Accounting Policies
Janus Emerging Markets Fund (the “Fund”) is a series fund. The Fund is part of Janus Investment Fund (the “Trust”), which is organized as a Massachusetts business trust and is registered under the Investment Company Act of 1940, as amended (the “1940 Act”), as an open-end management investment company, and therefore has applied the specialized accounting and reporting guidance in Financial Accounting Standards Board (“FASB”) Accounting Standards Codification (“ASC”) Topic 946. The Trust offers forty-four funds which include multiple series of shares, with differing investment objectives and policies. The Fund seeks long-term growth of capital. The Fund is classified as diversified, as defined in the 1940 Act.
The Fund offers multiple classes of shares in order to meet the needs of various types of investors. Each class represents an interest in the same portfolio of investments. Certain financial intermediaries may not offer all classes of shares. Class D Shares are closed to certain new investors.
Class A Shares and Class C Shares are generally offered through financial intermediary platforms including, but not limited to, traditional brokerage platforms, mutual fund wrap fee programs, bank trust platforms, and retirement platforms.
Class D Shares are generally no longer being made available to new investors who do not already have a direct account with the Janus funds. Class D Shares are available only to investors who hold accounts directly with the Janus funds, to immediate family members or members of the same household of an eligible individual investor, and to existing beneficial owners of sole proprietorships or partnerships that hold accounts directly with the Janus funds.
Class I Shares are available through certain financial intermediary platforms including, but not limited to, mutual fund wrap fee programs, managed account programs, asset allocation programs, bank trust platforms, as well as certain retirement platforms. Class I Shares are also available to certain direct institutional investors including, but not limited to, corporations, certain retirement plans, public plans, and foundations/endowments.
Class S Shares are offered through financial intermediary platforms including, but not limited to, retirement platforms and asset allocation, mutual fund wrap, or other discretionary or nondiscretionary fee-based investment advisory programs. In addition, Class S Shares may be available through certain financial intermediaries who have an agreement with Janus Capital Management LLC (“Janus Capital”) or its affiliates to offer Class S Shares on their supermarket platforms.
Class T Shares are available through certain financial intermediary platforms including, but not limited to, mutual fund wrap fee programs, managed account programs, asset allocation programs, bank trust platforms, as well as certain retirement platforms. In addition, Class T Shares may be available through certain financial intermediaries who have an agreement with Janus Capital or its affiliates to offer Class T Shares on their supermarket platforms.
The following accounting policies have been followed by the Fund and are in conformity with accounting principles generally accepted in the United States of America.
Investment Valuation
Securities held by the Fund are valued in accordance with policies and procedures established by and under the supervision of the Trustees (the “Valuation Procedures”). Equity securities traded on a domestic securities exchange are generally valued at the closing prices on the primary market or exchange on which they trade. If such price is lacking for the trading period immediately preceding the time of determination, such securities are valued at their current bid price. Equity securities that are traded on a foreign exchange are generally valued at the closing prices on such markets. In the event that there is no current trading volume on a particular security in such foreign exchange, the bid price from the primary exchange is generally used to value the security. Securities that are traded on the over-the-counter (“OTC”) markets are generally valued at their closing or latest bid prices as available. Foreign securities and currencies are converted to U.S. dollars using the applicable exchange rate in effect at the close of the New York Stock Exchange (“NYSE”). The Fund will determine the market value of individual securities held by it by using prices provided by one or more approved professional pricing services or, as needed, by obtaining market quotations from independent broker-dealers. Most debt securities are valued in accordance with the evaluated bid price supplied by the pricing service that is intended to reflect market value. The evaluated bid price supplied by the pricing service is an evaluation that may consider factors such as security prices, yields, maturities and ratings. Certain short-term securities maturing within 60 days or less may be evaluated and valued on an amortized cost basis provided that the amortized cost determined
22 | MARCH 31, 2017 |
Janus Emerging Markets Fund
Notes to Financial Statements (unaudited)
approximates market value. Securities for which market quotations or evaluated prices are not readily available or deemed unreliable are valued at fair value determined in good faith under the Valuation Procedures. Circumstances in which fair value pricing may be utilized include, but are not limited to: (i) a significant event that may affect the securities of a single issuer, such as a merger, bankruptcy, or significant issuer-specific development; (ii) an event that may affect an entire market, such as a natural disaster or significant governmental action; (iii) a nonsignificant event such as a market closing early or not opening, or a security trading halt; and (iv) pricing of a nonvalued security and a restricted or nonpublic security. Special valuation considerations may apply with respect to “odd-lot” fixed-income transactions which, due to their small size, may receive evaluated prices by pricing services which reflect a large block trade and not what actually could be obtained for the odd-lot position. The Fund uses systematic fair valuation models provided by independent third parties to value international equity securities in order to adjust for stale pricing, which may occur between the close of certain foreign exchanges and the close of the NYSE.
Valuation Inputs Summary
FASB ASC 820, Fair Value Measurements and Disclosures (“ASC 820”), defines fair value, establishes a framework for measuring fair value, and expands disclosure requirements regarding fair value measurements. This standard emphasizes that fair value is a market-based measurement that should be determined based on the assumptions that market participants would use in pricing an asset or liability and establishes a hierarchy that prioritizes inputs to valuation techniques used to measure fair value. These inputs are summarized into three broad levels:
Level 1 – Unadjusted quoted prices in active markets the Fund has the ability to access for identical assets or liabilities.
Level 2 – Observable inputs other than unadjusted quoted prices included in Level 1 that are observable for the asset or liability either directly or indirectly. These inputs may include quoted prices for the identical instrument on an inactive market, prices for similar instruments, interest rates, prepayment speeds, credit risk, yield curves, default rates and similar data.
Assets or liabilities categorized as Level 2 in the hierarchy generally include: debt securities fair valued in accordance with the evaluated bid or ask prices supplied by a pricing service; securities traded on OTC markets and listed securities for which no sales are reported that are fair valued at the latest bid price (or yield equivalent thereof) obtained from one or more dealers transacting in a market for such securities or by a pricing service approved by the Fund’s Trustees; certain short-term debt securities with maturities of 60 days or less that are fair valued at amortized cost; and equity securities of foreign issuers whose fair value is determined by using systematic fair valuation models provided by independent third parties in order to adjust for stale pricing which may occur between the close of certain foreign exchanges and the close of the NYSE. Other securities that may be categorized as Level 2 in the hierarchy include, but are not limited to, preferred stocks, bank loans, swaps, investments in unregistered investment companies, options, and forward contracts.
Level 3 – Unobservable inputs for the asset or liability to the extent that relevant observable inputs are not available, representing the Fund’s own assumptions about the assumptions that a market participant would use in valuing the asset or liability, and that would be based on the best information available.
There have been no significant changes in valuation techniques used in valuing any such positions held by the Fund since the beginning of the fiscal year.
The inputs or methodology used for fair valuing securities are not necessarily an indication of the risk associated with investing in those securities. The summary of inputs used as of March 31, 2017 to fair value the Fund’s investments in securities and other financial instruments is included in the “Valuation Inputs Summary” in the Notes to Schedule of Investments and Other Information.
The Fund recognizes transfers between the levels as of the beginning of the fiscal year. The following describes the amounts of transfers between Level 1, Level 2 and Level 3 of the fair value hierarchy during the period.
Financial assets of $1,013,244 were transferred out of Level 3 to Level 1 since the current market for the securities with quoted prices are considered active.
Investment Transactions and Investment Income
Investment transactions are accounted for as of the date purchased or sold (trade date). Dividend income is recorded on the ex-dividend date. Certain dividends from foreign securities will be recorded as soon as the Fund is informed of
Janus Investment Fund | 23 |
Janus Emerging Markets Fund
Notes to Financial Statements (unaudited)
the dividend, if such information is obtained subsequent to the ex-dividend date. Dividends from foreign securities may be subject to withholding taxes in foreign jurisdictions. Interest income is recorded on the accrual basis and includes amortization of premiums and accretion of discounts. Gains and losses are determined on the identified cost basis, which is the same basis used for federal income tax purposes. Income, as well as gains and losses, both realized and unrealized, are allocated daily to each class of shares based upon the ratio of net assets represented by each class as a percentage of total net assets.
Expenses
The Fund bears expenses incurred specifically on its behalf. Each class of shares bears a portion of general expenses, which are allocated daily to each class of shares based upon the ratio of net assets represented by each class as a percentage of total net assets. Expenses directly attributable to a specific class of shares are charged against the operations of such class.
Estimates
The preparation of financial statements in conformity with accounting principles generally accepted in the United States of America requires management to make estimates and assumptions that affect the reported amount of assets and liabilities and disclosure of contingent assets and liabilities at the date of the financial statements, and the reported amounts of income and expenses during the reporting period. Actual results could differ from those estimates.
Indemnifications
In the normal course of business, the Fund may enter into contracts that contain provisions for indemnification of other parties against certain potential liabilities. The Fund’s maximum exposure under these arrangements is unknown, and would involve future claims that may be made against the Fund that have not yet occurred. Currently, the risk of material loss from such claims is considered remote.
Foreign Currency Translations
The Fund does not isolate that portion of the results of operations resulting from the effect of changes in foreign exchange rates on investments from the fluctuations arising from changes in market prices of securities held at the date of the financial statements. Net unrealized appreciation or depreciation of investments and foreign currency translations arise from changes in the value of assets and liabilities, including investments in securities held at the date of the financial statements, resulting from changes in the exchange rates and changes in market prices of securities held.
Currency gains and losses are also calculated on payables and receivables that are denominated in foreign currencies. The payables and receivables are generally related to foreign security transactions and income translations.
Foreign currency-denominated assets and forward currency contracts may involve more risks than domestic transactions, including currency risk, counterparty risk, political and economic risk, regulatory risk and equity risk. Risks may arise from unanticipated movements in the value of foreign currencies relative to the U.S. dollar.
Dividends and Distributions
The Fund generally declares and distributes dividends of net investment income and realized capital gains (if any) annually. The Fund may treat a portion of the amount paid to redeem shares as a distribution of investment company taxable income and realized capital gains that are reflected in the net asset value. This practice, commonly referred to as “equalization,” has no effect on the redeeming shareholder or a Fund’s total return, but may reduce the amounts that would otherwise be required to be paid as taxable dividends to the remaining shareholders. It is possible that the Internal Revenue Service (IRS) could challenge the Funds’ equalization methodology or calculations, and any such challenge could result in additional tax, interest, or penalties to be paid by the Fund.
The Fund may make certain investments in real estate investment trusts (“REITs”) which pay dividends to their shareholders based upon funds available from operations. It is quite common for these dividends to exceed the REITs’ taxable earnings and profits, resulting in the excess portion of such dividends being designated as a return of capital. If the Fund distributes such amounts, such distributions could constitute a return of capital to shareholders for federal income tax purposes.
Federal Income Taxes
The Fund intends to continue to qualify as a regulated investment company and distribute all of its taxable income in accordance with the requirements of Subchapter M of the Internal Revenue Code. Management has analyzed the Fund’s tax positions taken for all open federal income tax years, generally a three-year period, and has concluded that
24 | MARCH 31, 2017 |
Janus Emerging Markets Fund
Notes to Financial Statements (unaudited)
no provision for federal income tax is required in the Fund’s financial statements. The Fund is not aware of any tax positions for which it is reasonably possible that the total amounts of unrecognized tax benefits will significantly change in the next twelve months.
Restricted Cash
As of March 31, 2017, the Fund has restricted cash in the amount of $453,186. The restricted cash represents collateral pledged in relation to derivatives and/or securities with extended settlement dates, as well as investment quota for China A Shares. The carrying value of the restricted cash approximates fair value.
2. Derivative Instruments
The Fund may invest in various types of derivatives, which may at times result in significant derivative exposure. A derivative is a financial instrument whose performance is derived from the performance of another asset. The Fund may invest in derivative instruments including, but not limited to: futures contracts, put options, call options, options on future contracts, options on foreign currencies, options on recovery locks, options on security and commodity indices, swaps, forward contracts, structured investments, and other equity-linked derivatives. Each derivative instrument that was held by the Fund during the period ended March 31, 2017 is discussed in further detail below. A summary of derivative activity by the Fund is reflected in the tables at the end of this section.
The Fund may use derivative instruments for hedging purposes (to offset risks associated with an investment, currency exposure, or market conditions), to adjust currency exposure relative to a benchmark index, or for speculative purposes (to earn income and seek to enhance returns). When the Fund invests in a derivative for speculative purposes, the Fund will be fully exposed to the risks of loss of that derivative, which may sometimes be greater than the derivative’s cost. The Fund may not use any derivative to gain exposure to an asset or class of assets that it would be prohibited by its investment restrictions from purchasing directly. The Fund’s ability to use derivative instruments may also be limited by tax considerations.
Investments in derivatives in general are subject to market risks that may cause their prices to fluctuate over time. Investments in derivatives may not directly correlate with the price movements of the underlying instrument. As a result, the use of derivatives may expose the Fund to additional risks that it would not be subject to if it invested directly in the securities underlying those derivatives. The use of derivatives may result in larger losses or smaller gains than otherwise would be the case. Derivatives can be volatile and may involve significant risks.
In pursuit of its investment objective, the Fund may seek to use derivatives to increase or decrease exposure to the following market risk factors:
· Commodity Risk – the risk related to the change in value of commodities or commodity-linked investments due to changes in the overall market movements, volatility of the underlying benchmark, changes in interest rates, or other factors affecting a particular industry of commodity such as drought, floods, weather, livestock disease, embargoes, tariffs, and international economic, political, and regulatory developments.
· Counterparty Risk – the risk that the counterparty (the party on the other side of the transaction) on a derivative transaction will be unable to honor its financial obligation to the Fund.
· Credit Risk – the risk an issuer will be unable to make principal and interest payments when due, or will default on its obligations.
· Currency Risk – the risk that changes in the exchange rate between currencies will adversely affect the value (in U.S. dollar terms) of an investment.
· Equity Risk – the risk related to the change in value of equity securities as they relate to increases or decreases in the general market.
· Index Risk – if the derivative is linked to the performance of an index, it will be subject to the risks associated with changes in that index. If the index changes, the Fund could receive lower interest payments or experience a reduction in the value of the derivative to below what the Fund paid. Certain indexed securities, including inverse securities (which move in an opposite direction to the index), may create leverage, to the extent that they increase or decrease in value at a rate that is a multiple of the changes in the applicable index.
· Interest Rate Risk – the risk that the value of fixed-income securities will generally decline as prevailing interest rates rise, which may cause the Fund’s NAV to likewise decrease.
Janus Investment Fund | 25 |
Janus Emerging Markets Fund
Notes to Financial Statements (unaudited)
· Leverage Risk – the risk associated with certain types of leveraged investments or trading strategies pursuant to which relatively small market movements may result in large changes in the value of an investment. The Fund creates leverage by investing in instruments, including derivatives, where the investment loss can exceed the original amount invested. Certain investments or trading strategies, such as short sales, that involve leverage can result in losses that greatly exceed the amount originally invested.
· Liquidity Risk – the risk that certain securities may be difficult or impossible to sell at the time that the seller would like or at the price that the seller believes the security is currently worth.
Derivatives may generally be traded OTC or on an exchange. Derivatives traded OTC are agreements that are individually negotiated between parties and can be tailored to meet a purchaser’s needs. OTC derivatives are not guaranteed by a clearing agency and may be subject to increased credit risk.
In an effort to mitigate credit risk associated with derivatives traded OTC, the Fund may enter into collateral agreements with certain counterparties whereby, subject to certain minimum exposure requirements, the Fund may require the counterparty to post collateral if the Fund has a net aggregate unrealized gain on all OTC derivative contracts with a particular counterparty. There is no guarantee that counterparty exposure is reduced and these arrangements are dependent on Janus Capital’s ability to establish and maintain appropriate systems and trading.
Forward Foreign Currency Exchange Contracts
A forward foreign currency exchange contract (“forward currency contract”) is an obligation to buy or sell a specified currency at a future date at a negotiated rate (which may be U.S. dollars or a foreign currency). The Fund may enter into forward currency contracts for hedging purposes, including, but not limited to, reducing exposure to changes in foreign currency exchange rates on foreign portfolio holdings and locking in the U.S. dollar cost of firm purchase and sale commitments for securities denominated in or exposed to foreign currencies. The Fund may also invest in forward currency contracts for nonhedging purposes such as seeking to enhance returns. The Fund is subject to currency risk and counterparty risk in the normal course of pursuing its investment objective through its investments in forward currency contracts.
Forward currency contracts are valued by converting the foreign value to U.S. dollars by using the current spot U.S. dollar exchange rate and/or forward rate for that currency. Exchange and forward rates as of the close of the NYSE shall be used to value the forward currency contracts. The unrealized appreciation/(depreciation) for forward currency contracts is reported in the Statement of Assets and Liabilities as a receivable or payable and in the Statement of Operations for the change in unrealized net appreciation/depreciation (if applicable). The gain or loss arising from the difference between the U.S. dollar cost of the original contract and the value of the foreign currency in U.S. dollars upon closing a forward currency contract is reported on the Statement of Operations (if applicable).
During the period, the Fund entered into forward currency contracts with the obligation to sell foreign currencies in the future at an agreed upon rate in order to decrease exposure to currency risk associated with foreign currency denominated securities held by the Fund.
During the period ended March 31, 2017, the average ending monthly currency value amounts on sold forward currency contracts is $368,344. There were no forward currency contracts held at March 31, 2017.
Options Contracts
An options contract provides the purchaser with the right, but not the obligation, to buy (call option) or sell (put option) a financial instrument at an agreed upon price on or before a specified date. The purchaser pays a premium to the seller for this right. The seller has the corresponding obligation to sell or buy a financial instrument if the purchaser (owner) "exercises" the option. When an option is exercised, the proceeds on sales for a written call option, the purchase cost for a written put option, or the cost of the security for a purchased put or call option are adjusted by the amount of premium received or paid. Upon expiration, or closing of the option transaction, a realized gain or loss is reported on the Statement of Operations (if applicable). The difference between the premium paid/received and the market value of the option is recorded as unrealized appreciation or depreciation. The net change in unrealized appreciation or depreciation is reported on the Statement of Operations (if applicable). Option contracts are typically valued using an approved vendor’s option valuation model. To the extent reliable market quotations are available, option contracts are valued using market quotations. In cases when an approved vendor cannot provide coverage for an option and there is no reliable market quotation, a broker quotation or an internal valuation using the Black-Scholes model, the Cox-Rubenstein Binomial Option Pricing Model, or other appropriate option pricing model is used. Certain options contracts are marked-
26 | MARCH 31, 2017 |
Janus Emerging Markets Fund
Notes to Financial Statements (unaudited)
to-market daily, and the daily variation margin is recorded as a receivable or payable on the Statement of Assets and Liabilities as “Variation margin receivable” or “Variation margin payable” (if applicable).
The Fund may use options contracts to hedge against changes in interest rates, the values of equities, or foreign currencies. The Fund generally invests in options to hedge against adverse movements in the value of portfolio holdings. The use of such instruments may involve certain additional risks as a result of unanticipated movements in the market. A lack of correlation between the value of an instrument underlying an option and the asset being hedged, or unexpected adverse price movements, could render the Fund’s hedging strategy unsuccessful. In addition, there can be no assurance that a liquid secondary market will exist for any option purchased or sold. The Fund may be subject to counterparty risk, interest rate risk, liquidity risk, equity risk, commodity risk, and currency risk in the normal course of pursuing its investment objective through its investments in options contracts.
Options traded on an exchange are regulated and the terms of the options are standardized. Options traded OTC expose the Fund to counterparty risk in the event that the counterparty does not perform. This risk is mitigated by having a netting arrangement between the Fund and the counterparty and by having the counterparty post collateral to cover the Fund’s exposure to the counterparty.
The Fund may purchase put options to hedge against a decline in the value of its portfolio. By using put options in this way, the Fund will reduce any profit it might otherwise have realized in the underlying security by the amount of the premium paid for the put option and by transaction costs. The Fund may purchase call options to hedge against an increase in the price of securities that it may buy in the future. The premium paid for the call option plus any transaction costs will reduce the benefit, if any, realized by the Fund upon exercise of the option, and, unless the price of the underlying security rises sufficiently, the option may expire worthless to the Fund. The risk in buying options is that the Fund pays a premium whether or not the options are exercised. Options purchased are reported in the Schedule of Investments (if applicable).
During the period, the Fund purchased call options on foreign exchange rates vs. the U.S. dollar in order to increase foreign currency exposure and reduce U.S. dollar exposure where increasing this exposure via the options market was most attractive.
During the period ended March 31, 2017, the average ending monthly market value amounts on purchased call options is $57,274.
In writing an option, the Fund bears the risk of an unfavorable change in the price of the security underlying the written option. When an option is written, the Fund receives a premium and becomes obligated to sell or purchase the underlying security at a fixed price, upon exercise of the option. Options written are reported as a liability on the Statement of Assets and Liabilities as “Options written, at value” (if applicable). The risk in writing call options is that the Fund gives up the opportunity for profit if the market price of the security increases and the options are exercised. The risk in writing put options is that the Fund may incur a loss if the market price of the security decreases and the options are exercised. The risk in buying options is that the Fund pays a premium whether or not the options are exercised. Exercise of an option written by the Fund could result in the Fund buying or selling a security at a price different from the current market value.
During the period, the Fund wrote call options on foreign exchange rates vs. the U.S. dollar in order to reduce currency risk where reducing this exposure via the foreign exchange forward markets was less attractive.
During the period ended March 31, 2017, the average ending monthly market value amounts on written call options is $17,949.
Written option activity for the period ended March 31, 2017 is indicated in the table below: | ||||
Number of | Premiums | |||
|
| Contracts |
| Received |
Options outstanding at September 30, 2016 | 1,754,183 | $ 28,593 | ||
Options written | - | - | ||
Options closed | - | - | ||
Options expired | - | - | ||
Options exercised | - | - | ||
Options outstanding at March 31, 2017 |
| 1,754,183 |
| $ 28,593 |
Janus Investment Fund | 27 |
Janus Emerging Markets Fund
Notes to Financial Statements (unaudited)
Swaps
Swap agreements are two-party contracts entered into primarily by institutional investors for periods ranging from a day to more than one year to exchange one set of cash flows for another. The most significant factor in the performance of swap agreements is the change in value of the specific index, security, or currency, or other factors that determine the amounts of payments due to and from the Fund. The use of swaps is a highly specialized activity which involves investment techniques and risks different from those associated with ordinary portfolio securities transactions. Swap transactions may in some instances involve the delivery of securities or other underlying assets by the Fund or its counterparty to collateralize obligations under the swap. If the other party to a swap that is not collateralized defaults, the Fund would risk the loss of the net amount of the payments that it contractually is entitled to receive. Swap agreements entail the risk that a party will default on its payment obligations to the Fund. If the other party to a swap defaults, the Fund would risk the loss of the net amount of the payments that it contractually is entitled to receive. If the Fund utilizes a swap at the wrong time or judges market conditions incorrectly, the swap may result in a loss to the Fund and reduce the Fund’s total return.
Swap agreements also bear the risk that the Fund will not be able to meet its obligation to the counterparty. Swap agreements are typically privately negotiated and entered into in the OTC market. However, certain swap agreements are required to be cleared through a clearinghouse and traded on an exchange or swap execution facility. Swaps that are required to be cleared are required to post initial and variation margins in accordance with the exchange requirements. Regulations enacted require the Fund to centrally clear certain interest rate and credit default index swaps through a clearinghouse or central counterparty (“CCP”). To clear a swap with a CCP, the Fund will submit the swap to, and post collateral with, a futures clearing merchant (“FCM”) that is a clearinghouse member. Alternatively, the Fund may enter into a swap with a financial institution other than the FCM (the “Executing Dealer”) and arrange for the swap to be transferred to the FCM for clearing. The Fund may also enter into a swap with the FCM itself. The CCP, the FCM, and the Executing Dealer are all subject to regulatory oversight by the CFTC. A default or failure by a CCP or an FCM, or the failure of a swap to be transferred from an Executing Dealer to the FCM for clearing, may expose the Fund to losses, increase its costs, or prevent the Fund from entering or exiting swap positions, accessing collateral, or fully implementing its investment strategies. The regulatory requirement to clear certain swaps could, either temporarily or permanently, reduce the liquidity of cleared swaps or increase the costs of entering into those swaps.
Index swaps, interest rate swaps, and credit default swaps are valued using an approved vendor supplied price. Basket swaps are valued using a broker supplied price. Equity swaps that consist of a single underlying equity are valued either at the closing price, the latest bid price, or the last sale price on the primary market or exchange it trades. The market value of swap contracts are aggregated by positive and negative values and are disclosed separately as an asset or liability on the Fund’s Statement of Assets and Liabilities (if applicable). Realized gains and losses are reported on the Fund’s Statement of Operations (if applicable). The change in unrealized net appreciation or depreciation during the period is included in the Statement of Operations (if applicable).
The Fund’s maximum risk of loss from counterparty risk or credit risk is the discounted value of the payments to be received from/paid to the counterparty over the contract’s remaining life, to the extent that the amount is positive. The risk is mitigated by having a netting arrangement between the Fund and the counterparty and by the posting of collateral by the counterparty to cover the Fund’s exposure to the counterparty.
Total return swaps involve an exchange by two parties in which one party makes payments based on a set rate, either fixed or variable, while the other party makes payments based on the return of an underlying asset, which includes both the income it generates and any capital gains over the payment period. A fixed-income total return swap may be written on many different kinds of underlying reference assets, and may include different indices for various kinds of debt securities (e.g., U.S. investment grade bonds, high-yield bonds, or emerging market bonds).
During the period, the Fund entered into total return swaps on equity indices to increase exposure to equity risk. These total return swaps require the Fund to pay a floating reference interest rate, and an amount equal to the negative price movement of securities or an index multiplied by the notional amount of the contract. The Fund will receive payments equal to the positive price movement of the same securities or index multiplied by the notional amount of the contract and, in some cases, dividends paid on the securities.
During the period ended March 31, 2017, the average ending monthly market value amounts on total return swaps which are long the reference asset is $2,304.
28 | MARCH 31, 2017 |
Janus Emerging Markets Fund
Notes to Financial Statements (unaudited)
The following table, grouped by derivative type, provides information about the fair value and location of derivatives within the Statement of Assets and Liabilities as of March 31, 2017.
Fair Value of Derivative Instruments (not accounted for as hedging instruments) as of March 31, 2017 | ||||||||
|
|
|
| Currency |
| Equity
|
| Total |
Asset Derivatives: | ||||||||
Unaffiliated investments, at value | $ 37,304 | (a) | $ - | $37,304 | ||||
Outstanding swap contracts, at value | - | 10,875 | 10,875 | |||||
Total Asset Derivatives |
| $ 37,304 |
| $ 10,875 |
| $48,179 | ||
| ||||||||
Liability Derivatives: | ||||||||
Options written, at value | $ 3,333 | $ - | $ 3,333 | |||||
(a) | Amounts relate to purchased options. | |||||||
(b) | Amounts relate to purchased options. | |||||||
The following tables provide information about the effect of derivatives and hedging activities on the Fund’s Statement of Operations for the period ended March 31, 2017.
The effect of Derivative Instruments (not accounted for as hedging instruments) on the Statement of Operations for the period ended March 31, 2017 | |||||||
Amount of Realized Gain/(Loss) Recognized on Derivatives | |||||||
Derivative | Currency |
| Equity |
| Total | ||
Investments and foreign currency transactions | $ 63,661 | (a) | $ - | $63,661 | |||
Swap contracts | - | (3,047) | (3,047) | ||||
Total | $ 63,661 |
| $ (3,047) |
| $60,614 | ||
Amount of Change in Unrealized Appreciation/Depreciation Recognized on Derivatives | |||||||
Derivative | Currency |
| Equity |
| Total | ||
Investments, foreign currency translations and non-interested Trustees' deferred compensation | $ (3,559) | (b) | $ - | $ (3,559) | |||
Swap contracts | - | 508 | 508 | ||||
Written options contracts | 10,616 | - | 10,616 | ||||
Total | $ 7,057 |
| $ 508 |
| $ 7,565 | ||
(a) | Amounts relate to forward currency contracts. | ||||||
(b) | Amounts relate to forward currency contracts and purchased options. | ||||||
(c) | Amounts relate to purchased options. | ||||||
Please see the "Net Realized Gain/(Loss) on Investments" and "Change in Unrealized Net Appreciation/Depreciation" sections of the Fund’s Statement of Operations.
3. Other Investments and Strategies
Additional Investment Risk
The financial crisis in both the U.S. and global economies over the past several years has resulted, and may continue to result, in a significant decline in the value and liquidity of many securities of issuers worldwide in the equity and fixed-income/credit markets. In response to the crisis, the United States and certain foreign governments, along with the U.S. Federal Reserve and certain foreign central banks, took steps to support the financial markets. The withdrawal of this support, a failure of measures put in place to respond to the crisis, or investor perception that such efforts were not sufficient could each negatively affect financial markets generally, and the value and liquidity of specific securities. In addition, policy and legislative changes in the United States and in other countries continue to impact many aspects of
Janus Investment Fund | 29 |
Janus Emerging Markets Fund
Notes to Financial Statements (unaudited)
financial regulation. The effect of these changes on the markets, and the practical implications for market participants, including the Fund, may not be fully known for some time. As a result, it may also be unusually difficult to identify both investment risks and opportunities, which could limit or preclude the Fund’s ability to achieve its investment objective. Therefore, it is important to understand that the value of your investment may fall, sometimes sharply, and you could lose money.
The enactment of the Dodd-Frank Wall Street Reform and Consumer Protection Act (the “Dodd-Frank Act”) provided for widespread regulation of financial institutions, consumer financial products and services, broker-dealers, OTC derivatives, investment advisers, credit rating agencies, and mortgage lending, which expanded federal oversight in the financial sector, including the investment management industry. Many provisions of the Dodd-Frank Act remain pending and will be implemented through future rulemaking. Therefore, the ultimate impact of the Dodd-Frank Act and the regulations under the Dodd-Frank Act on the Fund and the investment management industry as a whole, is not yet certain.
A number of countries in the European Union (“EU”) have experienced, and may continue to experience, severe economic and financial difficulties. In particular, many EU nations are susceptible to economic risks associated with high levels of debt, notably due to investments in sovereign debt of countries such as Greece, Italy, Spain, Portugal, and Ireland. Many non-governmental issuers, and even certain governments, have defaulted on, or been forced to restructure, their debts. Many other issuers have faced difficulties obtaining credit or refinancing existing obligations. Financial institutions have in many cases required government or central bank support, have needed to raise capital, and/or have been impaired in their ability to extend credit. As a result, financial markets in the EU experienced extreme volatility and declines in asset values and liquidity. Responses to these financial problems by European governments, central banks, and others, including austerity measures and reforms, may not work, may result in social unrest, and may limit future growth and economic recovery or have other unintended consequences. Further defaults or restructurings by governments and others of their debt could have additional adverse effects on economies, financial markets, and asset valuations around the world. Greece, Ireland, and Portugal have already received one or more "bailouts" from other Eurozone member states, and it is unclear how much additional funding they will require or if additional Eurozone member states will require bailouts in the future. The risk of investing in securities in the European markets may also be heightened due to the referendum in which the United Kingdom voted to exit the EU (known as "Brexit"). One or more other countries may also abandon the euro and/or withdraw from the EU, placing its currency and banking system in jeopardy.
Certain areas of the world have historically been prone to and economically sensitive to environmental events such as, but not limited to, hurricanes, earthquakes, typhoons, flooding, tidal waves, tsunamis, erupting volcanoes, wildfires or droughts, tornadoes, mudslides, or other weather-related phenomena. Such disasters, and the resulting physical or economic damage, could have a severe and negative impact on the Fund’s investment portfolio and, in the longer term, could impair the ability of issuers in which the Fund invests to conduct their businesses as they would under normal conditions. Adverse weather conditions may also have a particularly significant negative effect on issuers in the agricultural sector and on insurance companies that insure against the impact of natural disasters.
China A Shares
The Chinese government may permit a foreign investor to invest in China A Shares as a licensed Qualified Foreign Institutional Investor (“QFII”). QFII licenses are granted by the China Securities Regulatory Commission and an investment quota is granted by the State Administration of Foreign Exchange. Janus Capital has been granted a QFII license and an investment quota.
People’s Republic of China (“PRC”) regulations require QFIIs to entrust assets held in the PRC and to interact with government agencies through a China-based qualified custodian bank. Assets attributable to clients of Janus Capital will be held by the custodian in foreign exchange accounts and securities accounts in the joint name of Janus Capital and its clients, although the terms of the custody agreement make clear that the contents of the accounts belong to the clients, and not to Janus Capital.
During the period ended March 31, 2017, Janus Capital, in its capacity as a QFII, invested in China A Shares on behalf of the Fund. With respect to direct China A Shares investments, as a general matter, any capital invested and profits generated cannot be repatriated for a minimum of one year. Repatriation of any invested capital is subject to approval by the regulator. Additionally, any repatriation of profits would be subject to an audit by a registered accountant in China, and subject to regulatory approval. In light of the foregoing, the Fund’s investment in China A Shares would be subject
30 | MARCH 31, 2017 |
Janus Emerging Markets Fund
Notes to Financial Statements (unaudited)
to the Fund’s limit of investing up to 15% of its net assets in illiquid investments. Current Chinese tax law is unclear whether capital gains realized on the Fund’s investments in China A shares will be subject to tax. Because management believes it is more likely than not that Chinese capital gains tax ultimately will not be imposed, the Fund does not accrue for such taxes.
As of March 31, 2017, the Fund has available investment quota of $243,186. The Fund is subject to certain restrictions and administrative processes relating to its ability to repatriate cash balances and may incur substantial delays in gaining access to its assets.
Counterparties
Fund transactions involving a counterparty are subject to the risk that the counterparty or a third party will not fulfill its obligation to the Fund (“counterparty risk”). Counterparty risk may arise because of the counterparty’s financial condition (i.e., financial difficulties, bankruptcy, or insolvency), market activities and developments, or other reasons, whether foreseen or not. A counterparty’s inability to fulfill its obligation may result in significant financial loss to the Fund. The Fund may be unable to recover its investment from the counterparty or may obtain a limited recovery, and/or recovery may be delayed. The extent of the Fund’s exposure to counterparty risk with respect to financial assets and liabilities approximates its carrying value. See the "Offsetting Assets and Liabilities" section of this Note for further details.
The Fund may be exposed to counterparty risk through participation in various programs, including, but not limited to, lending its securities to third parties, cash sweep arrangements whereby the Fund’s cash balance is invested in one or more types of cash management vehicles, as well as investments in, but not limited to, repurchase agreements, debt securities, and derivatives, including various types of swaps, futures and options. The Fund intends to enter into financial transactions with counterparties that Janus Capital believes to be creditworthy at the time of the transaction. There is always the risk that Janus Capital’s analysis of a counterparty’s creditworthiness is incorrect or may change due to market conditions. To the extent that the Fund focuses its transactions with a limited number of counterparties, it will have greater exposure to the risks associated with one or more counterparties.
Emerging Market Investing
The Fund may invest in securities of issuers or companies from or with exposure to one or more “developing countries” or “emerging market countries.” To the extent that the Fund invests a significant amount of its assets in one or more of these countries, its returns and net asset value may be affected to a large degree by events and economic conditions in such countries. The risks of foreign investing are heightened when investing in emerging markets, which may result in the price of investments in emerging markets experiencing sudden and sharp price swings. In many developing markets, there is less government supervision and regulation of business and industry practices (including the potential lack of strict finance and accounting controls and standards), stock exchanges, brokers, and listed companies, making these investments potentially more volatile in price and less liquid than investments in developed securities markets, resulting in greater risk to investors. There is a risk in developing countries that a future economic or political crisis could lead to price controls, forced mergers of companies, expropriation or confiscatory taxation, imposition or enforcement of foreign ownership limits, seizure, nationalization, sanctions or imposition of restrictions by various governmental entities on investment and trading, or creation of government monopolies, any of which may have a detrimental effect on the Fund’s investments. In addition, the Fund’s investments may be denominated in foreign currencies and therefore, changes in the value of a country’s currency compared to the U.S. dollar may affect the value of the Fund’s investments. To the extent that the Fund invests a significant portion of its assets in the securities of issuers in or companies of a single country or region, it is more likely to be impacted by events or conditions affecting that country or region, which could have a negative impact on the Fund’s performance. Additionally, foreign and emerging market risks, including, but not limited to, price controls, expropriation or confiscatory taxation, imposition or enforcement of foreign ownership limits, nationalization, and restrictions on repatriation of assets may be heightened to the extent the Fund invests in Chinese local market securities.
Offsetting Assets and Liabilities
The Fund presents gross and net information about transactions that are either offset in the financial statements or subject to an enforceable master netting arrangement or similar agreement with a designated counterparty, regardless of whether the transactions are actually offset in the Statement of Assets and Liabilities.
In order to better define its contractual rights and to secure rights that will help the Fund mitigate its counterparty risk, the Fund has entered into an International Swaps and Derivatives Association, Inc. Master Agreement (“ISDA Master Agreement”) or similar agreement with its derivative contract counterparties. An ISDA Master Agreement is a bilateral
Janus Investment Fund | 31 |
Janus Emerging Markets Fund
Notes to Financial Statements (unaudited)
agreement between the Fund and a counterparty that governs OTC derivatives and forward foreign currency exchange contracts and typically contains, among other things, collateral posting terms and netting provisions in the event of a default and/or termination event. Under an ISDA Master Agreement, in the event of a default and/or termination event, the Fund may offset with each counterparty certain derivative financial instruments’ payables and/or receivables with collateral held and/or posted and create one single net payment. For financial reporting purposes, the Fund does not offset certain derivative financial instruments’ payables and receivables and related collateral on the Statement of Assets and Liabilities.
The following tables present gross amounts of recognized assets and/or liabilities and the net amounts after deducting collateral that has been pledged by counterparties or has been pledged to counterparties (if applicable). For corresponding information grouped by type of instrument, see either the “Fair Value of Derivative Instruments as of March 31, 2017” table located in Note 2 of these Notes to Financial Statements and/or the Fund’s Schedule of Investments.
Offsetting of Financial Assets and Derivative Assets | |||||||||
Gross Amounts | |||||||||
of Recognized | Offsetting Asset | Collateral | |||||||
Counterparty | Assets | or Liability(a) | Pledged(b) | Net Amount | |||||
Credit Suisse International | $ | 10,875 | $ | — | $ | — | $ | 10,875 | |
Deutsche Bank AG | 221,242 | — | (221,242) | — | |||||
Goldman Sachs International | 37,304 | (3,333) | — | 33,971 | |||||
Total | $ | 269,421 | $ | (3,333) | $ | (221,242) | $ | 44,846 | |
Offsetting of Financial Liabilities and Derivative Liabilities | |||||||||
Gross Amounts | |||||||||
of Recognized | Offsetting Asset | Collateral | |||||||
Counterparty | Liabilities | or Liability(a) | Pledged(b) | Net Amount | |||||
Goldman Sachs International | $ | 3,333 | $ | (3,333) | $ | — | $ | — | |
(a) | Represents the amount of assets or liabilities that could be offset with the same counterparty under master netting or similar agreements that management elects not to offset on the Statement of Assets and Liabilities. | ||||||||
(b) | Collateral pledged is limited to the net outstanding amount due to/from an individual counterparty. The actual collateral amounts pledged may exceed these amounts and may fluctuate in value. | ||||||||
Deutsche Bank AG acts as securities lending agent and a limited purpose custodian or subcustodian to receive and disburse cash balances and cash collateral, hold short-term investments, hold collateral, and perform other custodian functions in accordance with the Agency Securities Lending and Repurchase Agreement. Securities on loan will be continuously secured by collateral which may consist of cash, U.S. Government securities, domestic and foreign short-term debt instruments, letters of credit, time deposits, repurchase agreements, money market mutual funds or other money market accounts, or such other collateral as permitted by the SEC. The value of the collateral must be at least 102% of the market value of the loaned securities that are denominated in U.S. dollars and 105% of the market value of the loaned securities that are not denominated in U.S. dollars. Upon receipt of cash collateral, Janus Capital intends to invest the cash collateral in a cash management vehicle for which Janus Capital serves as investment adviser, Janus Cash Collateral Fund LLC. Loaned securities and related collateral are marked-to-market each business day based upon the market value of the loaned securities at the close of business, employing the most recent available pricing information. Collateral levels are then adjusted based on this mark-to-market evaluation.
The Fund may require the counterparty to pledge securities as collateral daily (based on the daily valuation of the financial asset) if the Fund has a net aggregate unrealized gain on OTC derivative contracts with a particular counterparty. The Fund may deposit cash as collateral with the counterparty and/or custodian daily (based on the daily valuation of the financial asset) if the Fund has a net aggregate unrealized loss on OTC derivative contracts with a particular counterparty. The collateral amounts are subject to minimum exposure requirements and initial margin requirements. Collateral amounts are monitored and subsequently adjusted up or down as valuations fluctuate by at least the minimum exposure requirement. Collateral may reduce the risk of loss.
32 | MARCH 31, 2017 |
Janus Emerging Markets Fund
Notes to Financial Statements (unaudited)
Real Estate Investing
The Fund may invest in equity and debt securities of real estate-related companies. Such companies may include those in the real estate industry or real estate-related industries. These securities may include common stocks, corporate bonds, preferred stocks, and other equity securities, including, but not limited to, mortgage-backed securities, real estate-backed securities, securities of REITs and similar REIT-like entities. A REIT is a trust that invests in real estate-related projects, such as properties, mortgage loans, and construction loans. REITs are generally categorized as equity, mortgage, or hybrid REITs. A REIT may be listed on an exchange or traded OTC.
Securities Lending
Under procedures adopted by the Trustees, the Fund may seek to earn additional income by lending securities to qualified parties. Deutsche Bank AG acts as securities lending agent and a limited purpose custodian or subcustodian to receive and disburse cash balances and cash collateral, hold short-term investments, hold collateral, and perform other custodian functions. The Fund may lend portfolio securities in an amount equal to up to 1/3 of its total assets as determined at the time of the loan origination. There is the risk of delay in recovering a loaned security or the risk of loss in collateral rights if the borrower fails financially. In addition, Janus Capital makes efforts to balance the benefits and risks from granting such loans. All loans will be continuously secured by collateral which may consist of cash, U.S. Government securities, domestic and foreign short-term debt instruments, letters of credit, time deposits, repurchase agreements, money market mutual funds or other money market accounts, or such other collateral as permitted by the SEC. If the Fund is unable to recover a security on loan, the Fund may use the collateral to purchase replacement securities in the market. There is a risk that the value of the collateral could decrease below the cost of the replacement security by the time the replacement investment is made, resulting in a loss to the Fund.
Upon receipt of cash collateral, Janus Capital may invest it in affiliated or non-affiliated cash management vehicles, whether registered or unregistered entities, as permitted by the 1940 Act and rules promulgated thereunder. Janus Capital currently intends to invest the cash collateral in a cash management vehicle for which Janus Capital serves as investment adviser, Janus Cash Collateral Fund LLC. An investment in Janus Cash Collateral Fund LLC is generally subject to the same risks that shareholders experience when investing in similarly structured vehicles, such as the potential for significant fluctuations in assets as a result of the purchase and redemption activity of the securities lending program, a decline in the value of the collateral, and possible liquidity issues. Such risks may delay the return of the cash collateral and cause the Fund to violate its agreement to return the cash collateral to a borrower in a timely manner. As adviser to the Fund and Janus Cash Collateral Fund LLC, Janus Capital has an inherent conflict of interest as a result of its fiduciary duties to both the Fund and Janus Cash Collateral Fund LLC. Additionally, Janus Capital receives an investment advisory fee of 0.05% for managing Janus Cash Collateral Fund LLC, but it may not receive a fee for managing certain other affiliated cash management vehicles in which the Fund may invest, and therefore may have an incentive to allocate preferred investment opportunities to investment vehicles for which it is receiving a fee.
The value of the collateral must be at least 102% of the market value of the loaned securities that are denominated in U.S. dollars and 105% of the market value of the loaned securities that are not denominated in U.S. dollars. Loaned securities and related collateral are marked-to-market each business day based upon the market value of the loaned securities at the close of business, employing the most recent available pricing information. Collateral levels are then adjusted based on this mark-to-market evaluation.
The cash collateral invested by Janus Capital is disclosed in the Schedule of Investments (if applicable). Income earned from the investment of the cash collateral, net of rebates paid to, or fees paid by, borrowers and less the fees paid to the lending agent are included as “Affiliated securities lending income, net” on the Statement of Operations. As of March 31, 2017, securities lending transactions accounted for as secured borrowings with an overnight and continuous contractual maturity are $221,242 for equity securities. Gross amounts of recognized liabilities for securities lending (collateral received) as of March 31, 2017 is $233,100, resulting in the net amount due to the counterparty of $11,858.
4. Investment Advisory Agreements and Other Transactions with Affiliates
The Fund pays Janus Capital an investment advisory fee which is calculated daily and paid monthly. The Fund’s "base" fee rate prior to any performance adjustment (expressed as an annual rate) is 1.00%.
The investment advisory fee rate is determined by calculating a base fee and applying a performance adjustment. The base fee rate is the same as the contractual investment advisory fee rate. The performance adjustment either increases or decreases the base fee depending on how well the Fund has performed relative to its benchmark index. The Fund's benchmark index used in the calculation is the MSCI Emerging Markets IndexSM.
Janus Investment Fund | 33 |
Janus Emerging Markets Fund
Notes to Financial Statements (unaudited)
The calculation of the performance adjustment applies as follows:
Investment Advisory Fee = Base Fee Rate +/- Performance Adjustment
The investment advisory fee rate paid to Janus Capital by the Fund consists of two components: (1) a base fee calculated by applying the contractual fixed rate of the advisory fee to the Fund’s average daily net assets during the previous month (“Base Fee Rate”), plus or minus (2) a performance-fee adjustment (“Performance Adjustment”) calculated by applying a variable rate of up to 0.15% (positive or negative) to the Fund’s average daily net assets during the applicable performance measurement period, which is generally the previous 36 months.
The Fund’s prospectuses and statement(s) of additional information contain additional information about performance-based fees. The amount shown as advisory fees on the Statement of Operations reflects the Base Fee Rate plus/minus any Performance Adjustment. For the period ended March 31, 2017, the performance adjusted investment advisory fee rate before any waivers and/or reimbursements of expenses is 1.10%.
Janus Capital Singapore Pte. Limited (“Janus Singapore”) serves as subadviser and is responsible for a portion of the Fund subject to the general oversight of Janus Capital. Janus Singapore is an indirect wholly-owned subsidiary of Janus Capital. Janus Capital pays Janus Singapore a fee equal to one-third of the advisory fee paid by the Fund to Janus Capital (calculated after any applicable performance fee adjustment, fee waivers, and expense reimbursements). The subadvisory fee paid by Janus Capital to Janus Singapore adjusts up or down based on the Fund’s performance relative to the Fund’s benchmark index over the performance measurement period.
Janus Capital has contractually agreed to waive the advisory fee payable by the Fund or reimburse expenses in an amount equal to the amount, if any, that the Fund’s normal operating expenses, including the investment advisory fee, but excluding any performance adjustments to management fees, the 12b-1 distribution and shareholder servicing fees (applicable to Class A Shares, Class C Shares, and Class S Shares), transfer agent fees and expenses payable pursuant to the Transfer Agency Agreement, brokerage commissions, interest, dividends, taxes, acquired fund fees and expenses, and extraordinary expenses, exceed the annual rate of 1.24% of the Fund’s average daily net assets. Janus Capital has agreed to continue the waiver until at least February 1, 2018. If applicable, amounts reimbursed to the Fund by Janus Capital are disclosed as “Excess Expense Reimbursement” on the Statement of Operations.
Janus Services LLC (“Janus Services”), a wholly-owned subsidiary of Janus Capital, is the Fund’s transfer agent. In addition, Janus Services provides or arranges for the provision of certain other administrative services including, but not limited to, recordkeeping, accounting, order processing, and other shareholder services for the Fund. Janus Services is not compensated for its services related to the shares, except for out-of-pocket costs. These amounts are disclosed as “Other transfer agent fees and expenses” on the Statement of Operations.
Certain, but not all, intermediaries may charge administrative fees (such as networking and omnibus) to investors in Class A Shares, Class C Shares, and Class I Shares for administrative services provided on behalf of such investors. These administrative fees are paid by the Class A Shares, Class C Shares, and Class I Shares of the Fund to Janus Services, which uses such fees to reimburse intermediaries. Consistent with the Transfer Agency Agreement between Janus Services and the Fund, Janus Services may negotiate the level, structure, and/or terms of the administrative fees with intermediaries requiring such fees on behalf of the Fund. Janus Capital and its affiliates benefit from an increase in assets that may result from such relationships. The Funds’ Trustees have set limits on fees that the Funds may incur with respect to administrative fees paid for omnibus or networked accounts. Such limits are subject to change by the Trustees in the future. These amounts are disclosed as “Transfer agent networking and omnibus fees” on the Statement of Operations.
The Fund’s Class D Shares pay an administrative services fee at an annual rate of 0.12% of the average daily net assets of Class D Shares for shareholder services provided by Janus Services. Janus Services provides or arranges for the provision of shareholder services including, but not limited to, recordkeeping, accounting, answering inquiries regarding accounts, transaction processing, transaction confirmations, and the mailing of prospectuses and shareholder reports. These amounts are disclosed as “Transfer agent administrative fees and expenses” on the Statement of Operations.
Janus Services receives an administrative services fee at an annual rate of up to 0.25% of the average daily net assets of the Fund’s Class S Shares and Class T Shares for providing or procuring administrative services to investors in Class S Shares and Class T Shares of the Fund. Janus Services expects to use all or a significant portion of this fee to compensate retirement plan service providers, broker-dealers, bank trust departments, financial advisors, and other
34 | MARCH 31, 2017 |
Janus Emerging Markets Fund
Notes to Financial Statements (unaudited)
financial intermediaries for providing these services. Janus Services or its affiliates may also pay fees for services provided by intermediaries to the extent the fees charged by intermediaries exceed the 0.25% of net assets charged to Class S Shares and Class T Shares of the Fund. Janus Services may keep certain amounts retained for reimbursement of out-of-pocket costs incurred for servicing clients of Class S Shares and Class T Shares. These amounts are disclosed as “Transfer agent administrative fees and expenses” on the Statement of Operations.
Services provided by these financial intermediaries may include, but are not limited to, recordkeeping, subaccounting, order processing, providing order confirmations, periodic statements, forwarding prospectuses, shareholder reports, and other materials to existing customers, answering inquiries regarding accounts, and other administrative services. Order processing includes the submission of transactions through the National Securities Clearing Corporation (“NSCC”) or similar systems, or those processed on a manual basis with Janus Capital.
Janus Services is compensated for its services related to the Fund’s Class D Shares. In addition to the administrative fees discussed above, Janus Services receives reimbursement for out-of-pocket costs it incurs for serving as transfer agent and providing, or arranging for, servicing to shareholders. These amounts are disclosed as “Other transfer agent fees and expenses” on the Statement of Operations.
Under a distribution and shareholder servicing plan (the “Plan”) adopted in accordance with Rule 12b-1 under the 1940 Act, the Fund pays the Trust’s distributor, Janus Distributors LLC (“Janus Distributors”), a wholly-owned subsidiary of Janus Capital, a fee for the sale and distribution and/or shareholder servicing of the Shares at an annual rate of up to 0.25% of the Class A Shares’ average daily net assets, of up to 1.00% of the Class C Shares’ average daily net assets, and of up to 0.25% of the Class S Shares’ average daily net assets. Under the terms of the Plan, the Trust is authorized to make payments to Janus Distributors for remittance to retirement plan service providers, broker-dealers, bank trust departments, financial advisors, and other financial intermediaries, as compensation for distribution and/or shareholder services performed by such entities for their customers who are investors in the Fund. These amounts are disclosed as “12b-1 Distribution and shareholder servicing fees” on the Statement of Operations. Payments under the Plan are not tied exclusively to actual 12b-1 distribution and shareholder service expenses, and the payments may exceed 12b-1 distribution and shareholder service expenses actually incurred. If any of the Fund’s actual 12b-1 distribution and shareholder service expenses incurred during a calendar year are less than the payments made during a calendar year, the Fund will be refunded the difference. Refunds, if any, are included in “12b-1 Distribution fees and shareholder servicing fees” in the Statement of Operations.
Janus Capital furnishes certain administration, compliance, and accounting services for the Fund and is reimbursed by the Fund for certain of its costs in providing those services (to the extent Janus Capital seeks reimbursement and such costs are not otherwise waived). In addition, employees of Janus Capital and/or its affiliates may serve as officers of the Trust. The Fund also pays for some or all of the salaries, fees, and expenses of certain Janus Capital employees and Fund officers, with respect to certain specified administration functions they perform on behalf of the Fund. The Fund pays these costs based on out-of-pocket expenses incurred by Janus Capital, and these costs are separate and apart from advisory fees and other expenses paid in connection with the investment advisory services Janus Capital provides to the Fund. These amounts are disclosed as “Fund administration fees” on the Statement of Operations. Some expenses related to compensation payable to the Fund's Chief Compliance Officer and compliance staff are shared with the Fund. Total compensation of $159,020 was paid to the Chief Compliance Officer and certain compliance staff by the Trust during the period ended March 31, 2017. The Fund's portion is reported as part of “Other expenses” on the Statement of Operations.
The Board of Trustees has adopted a deferred compensation plan (the “Deferred Plan”) for independent Trustees to elect to defer receipt of all or a portion of the annual compensation they are entitled to receive from the Fund. All deferred fees are credited to an account established in the name of the Trustees. The amounts credited to the account then increase or decrease, as the case may be, in accordance with the performance of one or more of the Janus funds that are selected by the Trustees. The account balance continues to fluctuate in accordance with the performance of the selected fund or funds until final payment of all amounts are credited to the account. The fluctuation of the account balance is recorded by the Fund as unrealized appreciation/(depreciation) and is included as of March 31, 2017 on the Statement of Assets and Liabilities in the asset, “Non-interested Trustees’ deferred compensation,” and liability, “Non-interested Trustees’ deferred compensation fees.” Additionally, the recorded unrealized appreciation/(depreciation) is included in “Unrealized net appreciation/(depreciation) of investments, foreign currency translations and non-interested Trustees’ deferred compensation” on the Statement of Assets and Liabilities. Deferred compensation expenses for the period ended March 31, 2017 are included in “Non-interested Trustees’ fees and expenses” on the Statement of
Janus Investment Fund | 35 |
Janus Emerging Markets Fund
Notes to Financial Statements (unaudited)
Operations. Trustees are allowed to change their designation of mutual funds from time to time. Amounts will be deferred until distributed in accordance with the Deferred Plan. Deferred fees of $195,413 were paid by the Trust to a Trustee under the Deferred Plan during the period ended March 31, 2017.
Pursuant to the provisions of the 1940 Act and related rules, the Fund may participate in an affiliated or nonaffiliated cash sweep program. In the cash sweep program, uninvested cash balances of the Fund may be used to purchase shares of affiliated or nonaffiliated money market funds or cash management pooled investment vehicles. The Fund is eligible to participate in the cash sweep program (the “Investing Funds”). As adviser, Janus Capital has an inherent conflict of interest because of its fiduciary duties to the affiliated money market funds or cash management pooled investment vehicles and the Investing Funds. Janus Cash Liquidity Fund LLC is an affiliated unregistered cash management pooled investment vehicle that invests primarily in highly-rated short-term fixed-income securities. Janus Cash Liquidity Fund LLC currently maintains a NAV of $1.00 per share and distributes income daily in a manner consistent with a registered product compliant with Rule 2a-7 under the 1940 Act. There are no restrictions on the Fund's ability to withdraw investments from Janus Cash Liquidity Fund LLC at will, and there are no unfunded capital commitments due from the Fund to Janus Cash Liquidity Fund LLC. The units of Janus Cash Liquidity Fund LLC are not charged any management fee, sales charge or service fee.
Any purchases and sales, realized gains/losses and recorded dividends from affiliated investments during the period ended March 31, 2017 can be found in a table located in the Notes to Schedule of Investments and Other Information.
Class A Shares include a 5.75% upfront sales charge of the offering price of the Fund. The sales charge is allocated between Janus Distributors and financial intermediaries. During the period ended March 31, 2017, Janus Distributors retained upfront sales charges of $195.
A contingent deferred sales charge (“CDSC”) of 1.00% will be deducted with respect to Class A Shares purchased without a sales load and redeemed within 12 months of purchase, unless waived. Any applicable CDSC will be 1.00% of the lesser of the original purchase price or the value of the redemption of the Class A Shares redeemed. During the period ended March 31, 2017, redeeming shareholders of Class A Shares paid CDSCs of $40 to Janus Distributors.
A CDSC of 1.00% will be deducted with respect to Class C Shares redeemed within 12 months of purchase, unless waived. Any applicable CDSC will be 1.00% of the lesser of the original purchase price or the value of the redemption of the Class C Shares redeemed. There were no CDSCs paid by redeeming shareholders of Class C Shares during the period ended March 31, 2017.
As of March 31, 2017, shares of the Fund were owned by Janus Capital and/or other funds advised by Janus Capital, as indicated in the table below:
Class | % of Class Owned |
| % of Fund Owned |
| ||
Class A Shares | - | % | - | % | ||
Class C Shares | - | - | ||||
Class D Shares | - | - | ||||
Class I Shares | 54 | 41 | ||||
Class S Shares | 63 | -* | ||||
Class T Shares | - | - | ||||
* | Less than 0.50% | |||||
In addition, other shareholders, including other funds, individuals, accounts, as well as the Fund’s portfolio manager(s) and/or investment personnel, may from time to time own (beneficially or of record) a significant percentage of the Fund’s Shares and can be considered to “control” the Fund when that ownership exceeds 25% of the Fund’s assets (and which may differ from control as determined in accordance with accounting principles generally accepted in the United States of America).
The Fund is permitted to purchase or sell securities (“cross-trade”) between itself and other funds or accounts managed by Janus Capital Management LLC in accordance with Rule 17a-7 under the Investment Company Act of 1940 (“Rule 17a-7”), when the transaction is consistent with the investment objectives and policies of the Fund and in accordance with the Internal Cross Trade Procedures adopted by the Trust’s Board of Trustees. These procedures have been designed to ensure that any cross-trade of securities by the Fund from or to another fund or account that is or could be
36 | MARCH 31, 2017 |
Janus Emerging Markets Fund
Notes to Financial Statements (unaudited)
considered an affiliate of the Fund under certain limited circumstances by virtue of having a common investment adviser, common Officer, or common Trustee complies with Rule 17a-7. Under these procedures, each cross-trade is effected at the current market price to save costs where allowed. During the period ended March 31, 2017, the Fund engaged in cross trades amounting to $44,726 in purchases.
5. Federal Income Tax
Income and capital gains distributions are determined in accordance with income tax regulations that may differ from accounting principles generally accepted in the United States of America. These differences are due to differing treatments for items such as net short-term gains, deferral of wash sale losses, foreign currency transactions, net investment losses, and capital loss carryovers.
The Fund has elected to treat gains and losses on forward foreign currency contracts as capital gains and losses, if applicable. Other foreign currency gains and losses on debt instruments are treated as ordinary income for federal income tax purposes pursuant to Section 988 of the Internal Revenue Code.
Accumulated capital losses noted below represent net capital loss carryovers, as of September 30, 2016, that may be available to offset future realized capital gains and thereby reduce future taxable gains distributions. The following table shows these capital loss carryovers.
Capital Loss Carryover Schedule | ||||
For the year ended September 30, 2016 | ||||
No Expiration | ||||
Short-Term | Long-Term | Accumulated | ||
$(2,653,460) | $(3,276,645) | $ (5,930,105) | ||
The aggregate cost of investments and the composition of unrealized appreciation and depreciation of investment securities for federal income tax purposes as of March 31, 2017 are noted below.
Unrealized appreciation and unrealized depreciation in the table below exclude appreciation/depreciation on foreign currency translations. The primary differences between book and tax appreciation or depreciation of investments wash sale loss deferrals, investments in partnerships and investments in passive foreign investment companies.
Federal Tax Cost | Unrealized | Unrealized
| Net Tax Appreciation/ |
$ 78,896,234 | $10,052,820 | $ (2,321,821) | $ 7,730,999 |
Janus Investment Fund | 37 |
Janus Emerging Markets Fund
Notes to Financial Statements (unaudited)
6. Capital Share Transactions
Period ended March 31, 2017 | Year ended September 30, 2016 | |||||
Shares | Amount | Shares | Amount | |||
Class A Shares: | ||||||
Shares sold | 4,840 | $ 42,880 | 12,017 | $ 93,775 | ||
Reinvested dividends and distributions | 140 | 1,109 | - | - | ||
Shares repurchased | (16,451) | (136,712) | (22,502) | (164,632) | ||
Net Increase/(Decrease) | (11,471) | $ (92,723) |
| (10,485) | $ (70,857) | |
Class C Shares: | ||||||
Shares sold | 14,194 | $ 119,511 | 13,912 | $ 105,001 | ||
Reinvested dividends and distributions | 87 | 681 | - | - | ||
Shares repurchased | (2,040) | (16,252) | (14,188) | (104,881) | ||
Net Increase/(Decrease) | 12,241 | $ 103,940 |
| (276) | $ 120 | |
Class D Shares: | ||||||
Shares sold | 680,019 | $ 5,769,148 | 335,337 | $ 2,615,373 | ||
Reinvested dividends and distributions | 13,174 | 103,942 | 3,563 | 26,474 | ||
Shares repurchased | (340,243) | (2,792,437) | (255,980) | (1,916,039) | ||
Net Increase/(Decrease) | 352,950 | $ 3,080,653 |
| 82,920 | $ 725,808 | |
Class I Shares: | ||||||
Shares sold | 2,593,860 | $22,995,697 | 2,274,810 | $16,818,769 | ||
Reinvested dividends and distributions | 55,251 | 437,592 | 19,413 | 144,626 | ||
Shares repurchased | (419,614) | (3,546,861) | (1,199,329) | (8,922,969) | ||
Net Increase/(Decrease) | 2,229,497 | $19,886,428 |
| 1,094,894 | $ 8,040,426 | |
Class S Shares: | ||||||
Shares sold | 905 | $ 7,638 | 136,594 | $ 1,052,134 | ||
Reinvested dividends and distributions | - | - | 360 | 2,678 | ||
Shares repurchased | (290) | (2,462) | (134,816) | (1,016,025) | ||
Net Increase/(Decrease) | 615 | $ 5,176 |
| 2,138 | $ 38,787 | |
Class T Shares: | ||||||
Shares sold | 449,885 | $ 3,790,721 | 768,559 | $ 5,771,719 | ||
Reinvested dividends and distributions | 10,048 | 79,379 | 1,543 | 11,482 | ||
Shares repurchased | (367,430) | (3,094,513) | (667,825) | (4,865,128) | ||
Net Increase/(Decrease) | 92,503 | $ 775,587 |
| 102,277 | $ 918,073 | |
7. Purchases and Sales of Investment Securities
For the period ended March 31, 2017, the aggregate cost of purchases and proceeds from sales of investment securities (excluding any short-term securities, short-term options contracts, and in-kind transactions) was as follows:
Purchases of | Proceeds from Sales | Purchases
of Long- | Proceeds
from Sales |
$38,489,835 | $ 14,502,361 | $ - | $ - |
8. Merger Related Matters
On October 3, 2016, Janus Capital Group Inc. (“JCGI”), the direct parent of Janus Capital, and Henderson Group plc (“Henderson”) announced that they had entered into an Agreement and Plan of Merger (“Merger Agreement”) relating to the strategic combination of Henderson and JCGI (the “Merger”). Pursuant to the Merger Agreement, a newly formed, direct wholly-owned subsidiary of Henderson will merge with and into JCGI, with JCGI as the surviving corporation and a direct wholly-owned subsidiary of Henderson. The Merger is expected to close in the second quarter of 2017, subject to requisite shareholder and regulatory approvals.
The consummation of the Merger may be deemed to cause an “assignment” (as defined in the 1940 Act) of the advisory agreement between the Fund and Janus Capital in effect as of the date of this Report. As a result, the
38 | MARCH 31, 2017 |
Janus Emerging Markets Fund
Notes to Financial Statements (unaudited)
consummation of the Merger may cause such investment advisory agreement to terminate automatically in accordance with its terms.
On December 8, 2016, the Trustees approved, subject to shareholder approval, a new investment advisory agreement between the Fund and Janus Capital in order to permit Janus Capital to continue providing advisory services to the Fund following the closing of the Merger (“Post-Merger Advisory Agreement”). Also on December 8, 2016, the Trustees approved, subject to shareholder approval, an Agreement and Plan of Reorganization that provides for the merger (the “Fund Merger”) of the Fund into Janus Henderson Emerging Markets Fund, a newly formed series of the Trust (the “Acquiring Fund”). The Acquiring Fund is being formed to facilitate the transfer of Henderson Emerging Markets Fund (the “Henderson Fund”), a mutual fund managed by Henderson Global Investors (North America) Inc., a subsidiary of Henderson, to the Janus Capital platform through a merger of the Henderson Fund into the Acquiring Fund. The investment objective and principal investment policies of the Acquiring Fund will correspond to those of the Henderson Fund, and the Acquiring Fund will be managed by Henderson Fund portfolio managers. The Henderson Fund is expected to be the surviving fund for accounting purposes. At the same meeting, the Trustees approved submitting the Post-Merger Advisory Agreement and Fund Merger, among other proposals, to Fund shareholders for approval.
9. Subsequent Event
Management has evaluated whether any events or transactions occurred subsequent to March 31, 2017 and through the date of issuance of the Fund’s financial statements and determined that there were no material events or transactions that would require recognition or disclosure in the Fund’s financial statements other than the following:
Special Meeting(s) of Shareholders were held on April 6, 2017, and adjourned and reconvened on April 18, 2017, April 25, 2017, April 28, 2017, and May 17, 2017 (together, the “Meeting”).
Approval of Advisory Agreement
At the Meeting, Fund shareholders approved the Post-Merger Advisory Agreement, which will take effect upon the consummation of the Merger.
Fund Merger
At the Meeting, Fund shareholders approved the Fund Merger. The Fund Merger is conditioned on the consummation of the Merger. If the Merger is consummated, the Fund Merger is anticipated to be effective June 12, 2017.
Election of Trustees
At the Meeting, shareholders of each series of the Trust, including the Fund, voting together as a single class, approved the election of Diane L. Wallace to the Trust’s Board of Trustees. Ms. Wallace currently serves as a trustee of certain mutual funds advised by Henderson Global Investors (North America) Inc., a subsidiary of Henderson. Upon the consummation of the Merger, Ms. Wallace will join the Trust’s Board of Trustees.
Janus Investment Fund | 39 |
Janus Emerging Markets Fund
Additional Information (unaudited)
Proxy Voting Policies and Voting Record
A description of the policies and procedures that the Fund uses to determine how to vote proxies relating to its portfolio securities is available without charge: (i) upon request, by calling 1-800-525-0020 (toll free); (ii) on the Fund’s website at janus.com/proxyvoting; and (iii) on the SEC’s website at http://www.sec.gov. Additionally, information regarding the Fund’s proxy voting record for the most recent twelve-month period ended June 30 is also available, free of charge, through janus.com/proxyvoting and from the SEC’s website at http://www.sec.gov.
Quarterly Portfolio Holdings
The Fund files its complete portfolio holdings (schedule of investments) with the SEC for the first and third quarters of each fiscal year on Form N-Q within 60 days of the end of such fiscal quarter. The Fund’s Form N-Q: (i) is available on the SEC’s website at http://www.sec.gov; (ii) may be reviewed and copied at the SEC’s Public Reference Room in Washington, D.C. (information on the Public Reference Room may be obtained by calling 1-800-SEC-0330); and (iii) is available without charge, upon request, by calling Janus at 1-800-525-0020 (toll free).
Approval of Advisory and Sub-Advisory Agreements with Janus and Janus Affiliates during the Period
On September 15, 2016, Janus Capital Group Inc. (“Janus”) advised the Trustees of Janus Investment Fund (the “Trust”), each of whom serves as an “independent” Trustee (the “Board” or the “Trustees”), of its intent to seek a strategic combination of its advisory business with Henderson Group plc (“Henderson”). The Board met with the Chief Executive Officer of Janus, who outlined the proposed combination and the potential benefits to Janus Capital Management LLC (“Janus Capital”) and each Fund of the Trust (each, a “Fund” and collectively, the “Funds”). Subsequent to the September 15, 2016 meeting, the Trustees identified a list of basic principles, which they believed should serve as the foundation for their review of the organizational, operational and strategic issues involved with any potential change in control of Janus Capital, the investment adviser to the Funds. These basic principles were communicated to Janus Capital on September 27, 2016, and were intended to be shared with Henderson. On October 3, 2016, Janus announced that it had entered into a definitive Agreement and Plan of Merger with Henderson pursuant to which Janus and Henderson agreed to effect an all-stock merger of equals strategic combination of their respective businesses, with Janus Capital surviving the merger as a direct wholly-owned subsidiary of Henderson (the “Transaction”). The Board was advised that, subject to certain conditions, the Transaction is currently expected to close during the second quarter of 2017.
As part of its due diligence, the Board developed an initial list of questions related to the proposed transaction, which was provided to Janus Capital on October 6, 2016. At a special Board meeting held on October 19, 2016, the Board considered Janus Capital’s response to the initial information request and met with the management of Janus to discuss the impact of the Transaction on the nature, extent and quality of services Janus Capital is expected to provide to the Janus Funds following the Transaction, addressing, among other matters, the personnel expected to provide such services, and the resources available to do so. After its October 19, 2016 meeting, the Board developed a supplemental request for additional information, which was provided to Janus Capital on October 26, 2016. At another special Board meeting held on November 7-8, 2016, the Board considered Janus Capital’s response to the supplemental information request and again met with the management of Janus and Henderson to discuss the impact of the Transaction on the nature, extent and quality of services Janus Capital is expected to provide to the Janus Funds following the Transaction, and also met with various officers of the Funds and of Janus Capital, including various Fund portfolio managers. After its November 7-8, 2016 meeting, the Board developed a second supplemental request for additional information, which was provided to Janus Capital on November 21, 2016. On December 7-8, 2016, the Board met to consider Janus Capital’s response to the second supplemental information request and to also consider the proposed new investment advisory agreements between the Trust, on behalf of each Fund, and Janus Capital (each, a “New Advisory Agreement” and collectively, the “New Advisory Agreements”) and the new sub-advisory agreements between Janus Capital and each of the Funds that utilize INTECH Investment Management LLC (“INTECH”), Perkins Investment Management LLC (“Perkins”), or Janus Singapore Pte. Limited (“Janus Singapore,” and together with INTECH and Perkins, the “Sub-Advisers” and each, a “Sub-Adviser”) as sub-advisers (each, a “New Sub-Advisory Agreement” and collectively, the “New Sub-Advisory Agreements”) to take effect immediately after the Transaction or shareholder approval, whichever is later. During each of these meetings, the Board sought additional and clarifying information as it deemed necessary or appropriate. In addition, the Board engaged its independent fee consultant to help evaluate certain of the proposals that the Board was being asked to consider. Throughout the process, the Board had the assistance of its independent legal counsel, who advised them on, among other things, its duties and obligations.
40 | MARCH 31, 2017 |
Janus Emerging Markets Fund
Additional Information (unaudited)
In connection with the Board’s review, Janus Capital provided, and the Board obtained, substantial information regarding the following matters: the management, financial position and business of Henderson; the history of Henderson’s business and operations; the investment performance of the investment companies advised by Henderson; the proposed structure, operations and investment processes of the combined investment management organization after the Transaction and the strategy for operating and growing the business following the Transaction; the future plans of Janus and Henderson with respect to the Funds and any proposed changes to the operations or structure of the Funds; and the future plans of Janus and Henderson with respect to the provision of services to the Funds, and the entities providing such services, including those affiliated with Janus. The Board also received information regarding the terms of the Transaction, anticipated management of the combined organization, the resources that each of Janus and Henderson bring to the combined organization and the process being followed by Janus and Henderson to integrate their organizations. The Board also received information regarding the impact of the Transaction on each of INTECH, Perkins and Janus Singapore.
In connection with the Board’s approval of New Advisory Agreements and New Sub-Advisory Agreements at its December 8, 2016 meeting, the Board also continued its on-going annual process to determine whether to continue the existing investment advisory agreements between Janus Capital and the Trust on behalf of each Fund (each, a “Current Advisory Agreement” and collectively, the “Current Advisory Agreements”) and the existing sub-advisory agreements between Janus Capital and each of the Funds that utilize INTECH, Perkins, or Janus Singapore as sub-advisers (each, a “Current Sub-Advisory Agreement” and collectively, the “Current Sub-Advisory Agreements”). In this regard, the Board received and reviewed information provided by Janus and the respective Sub-Advisers in response to requests of the Board and its independent legal counsel. The Board also received and reviewed information and analysis provided by, and in response to requests of, its independent fee consultant. The Board noted that as part of this annual process, the Board had considered and was in the process of considering, numerous factors, including the nature and quality of services provided by Janus Capital and each Sub-Adviser, as applicable; investment performance, on an absolute basis and relative to appropriate peer groups and one or a combination of market indices; investment management fees, expense ratios and asset sizes of the Funds and peer groups; investment management fees charged to comparable investment companies, separate accounts and non-fund clients; Janus Capital’s profitability from managing the Funds; fall-out benefits to Janus Capital from its relationship to the Funds, including revenues derived from services provided to the Funds by affiliates of Janus Capital; and the potential benefits to Janus Capital, the Funds of receiving research services from broker/dealer firms in connection with the allocation of portfolio transactions to such firms.
In determining whether to approve the New Advisory Agreement for each Fund and the New Sub-Advisory Agreement for Funds managed by INTECH, Perkins or Janus Singapore in connection with the Transaction, and whether to recommend approval to Fund shareholders, the Board received information and made inquiries into all matters as it deemed appropriate. The Board reviewed and analyzed various factors it deemed relevant, including the following factors, among others, none of which by itself was considered dispositive:
· The terms of the New Advisory Agreements are substantially similar to the corresponding Current Advisory Agreements, and the contractual fee rate will not change. In this regard, see the discussion of the Board’s considerations with respect to its most recent approval of the Current Advisory Agreements prior to December 8, 2016, as disclosed in each Fund’s most recent prior annual or semi-annual shareholder report, as applicable.
· The terms of the New Sub-Advisory Agreements are substantially similar to the corresponding Current Sub-Advisory Agreements, and the contractual fee rate will not change. In this regard, see the discussion of the Board’s considerations with respect to its most recent approval of the Current Sub-Advisory Agreements prior to December 8, 2016, as disclosed in each Fund’s most recent prior annual or semi-annual shareholder report, as applicable.
· Janus Capital’s plans for the operation of the Funds, including its plans for the continued provision of all services currently provided to the Funds by Janus Capital and its affiliates, including, among others, investment advisory services, portfolio trading services, and Fund administrative and accounting services, and the personnel and resources proposed to support the provision of such services.
· The estimated profitability to Janus Capital from managing the Funds after the Transaction, including potential economies of scale and fall-out benefits to Janus Capital from its relationship to the Funds, including revenues derived from services provided to the Funds by affiliates of Janus Capital, and the potential benefits to Janus
Janus Investment Fund | 41 |
Janus Emerging Markets Fund
Additional Information (unaudited)
Capital, and the Funds of receiving research services from broker/dealer firms in connection with the allocation of portfolio transactions to such firms.
In connection with its deliberations, the Board received assurances from Janus, on behalf of itself and its affiliates (collectively, “Janus”) including the following:
· Janus has provided to the Board such information as it believes is reasonably necessary to evaluate the New Advisory Agreements and New Sub-Advisory Agreements.
· Janus is committed to the continuance, without interruption, of services to the Funds of at least the type and quality currently provided by Janus Capital and its affiliates, or superior thereto.
· The Transaction is not expected to affect negatively the nature, extent or quality of the investment advisory services provided by Janus Capital to the Funds following the Transaction, and the investment advisory services are expected to be at least comparable to the services being provided under the Current Advisory Agreements and Current Sub-Advisory Agreements. In this regard, the Board noted specific representations that Janus does not intend for the nature, extent or quality of investment advisory and other services to be provided to the Funds following the Transaction to change, and the extent of such services were expected to increase based on the combined resources of the combined investment management organization after the Transaction, and should the nature, extent or quality of such services decline, Janus would commit the resources needed to return such services to pre-Transaction levels.
· The Funds’ current operations were expected to remain largely unchanged, except for certain fund reorganizations which will be separately considered by the Board, and such other changes as were or will be presented to the Board.
· Janus does not intend to make changes to the portfolio managers providing services to the Funds, other than proposed changes in the management of certain Funds as discussed with the Board, including those related to proposals to merge certain Funds with Funds managed by Henderson Global Investors (North America) Inc., an indirect, wholly-owned subsidiary of Henderson, and subject to such changes as may arise at any time as a result of the ongoing process of portfolio manager evaluation.
· After the Transaction, the extent of distribution and marketing services provided to the Janus Funds were expected to increase based on the combined resources of Janus and Henderson. In this regard, Janus Capital advised the Board that after the Transaction, the extent of distribution and marketing services provided to the Janus Funds are expected to increase based on the combined resources of Janus and Henderson. This is due primarily to the anticipated increase of sales related resources and expanded global presence of the combined Janus Henderson organization, which is expected to enhance visibility and brand recognition of the Janus Henderson Funds.
· The intent of Janus Capital to take the necessary and appropriate steps to retain and attract its key investment advisory personnel.
· The intent of Janus to take the necessary and appropriate steps to retain and attract its key compliance, financial, fund accounting and administrative personnel supporting the management and oversight of the Funds.
· Janus is not aware of any express or implied term, condition, arrangement or understanding that would impose in its best judgement an “unfair burden” on any Fund as a result of the Transaction, as defined in Section 15(f) of the 1940 Act, and that Janus will take no action that would have the effect of imposing such an “unfair burden” on any Fund in connection with the Transaction.
Janus assured the Board that it intended to comply with Section 15(f) of the Investment Company Act of 1940, as amended (the “1940 Act”). Section 15(f) provides a non-exclusive safe harbor for an investment adviser to an investment company or any of its affiliated persons to receive any amount or benefit in connection with a change in control of the investment adviser so long as two conditions are met. First, for a period of three years after the transaction, at least 75% of the board members of the investment company must not be interested persons of such investment adviser (as defined under the 1940 Act). The composition of the Board is in compliance with this provision of Section 15(f). In addition, after careful review and consideration, the Board determined that it would be in the best interests of the Funds to add to the Board an individual who currently acts as a non-interested board member of the
42 | MARCH 31, 2017 |
Janus Emerging Markets Fund
Additional Information (unaudited)
Henderson Trust. The Board believes that this change in the Board composition will provide perspective and insight relating to experience working with the Henderson organization. The Board’s Nominating and Governance Committee considered a number of candidates and recommended that the Board nominate one proposed new trustee from those candidates who currently act as non-interested board members of the Henderson Trust. The Board approved that trustee nominee to serve on the Board, subject to election by the shareholders of the Funds and contingent on the closing of the Transaction. If the new trustee is elected and serves on the Board, the Board composition would continue to satisfy the provisions of Section 15(f).
To meet the second condition of Section 15(f), an “unfair burden” must not be imposed upon the investment company as a result of such transaction or any express or implied terms, conditions or understandings applicable thereto. The term “unfair burden” is defined in Section 15(f) to include any arrangement during the two-year period after the transaction, whereby the investment adviser, or any interested person of such adviser, receives or is entitled to receive any compensation, directly or indirectly, from the investment company or its shareholders (other than fees for bona fide investment advisory or other services) or from any person in connection with the purchase or sale of securities or other property to, from or on behalf of the investment company (other than bona fide ordinary compensation as principal underwriter for such investment company).
Janus represented that it does not believe that an “unfair burden” will be placed on the Funds as a result of the Transaction. In furtherance thereof, Janus has undertaken to pay the costs of preparing and distributing proxy materials to, and of holding the meetings of, the Funds’ shareholders (the “Meetings”), as well as other fees and expenses in connection with the Transaction, including the reasonable fees and expenses of legal counsel and consultants to the Funds and the Trustees. In addition, Janus has agreed, for a period of two years following the closing of the Transaction, (i) not to request any increases to advisory fees for the Funds, other than those proposed to and approved by the Board prior to the close of the Transaction, and (ii) to continue to use the current process by which expense caps are set annually for the Funds.
As a result of its review and consideration of the New Investment Advisory Agreements and New Sub-Advisory Agreements in connection with the Transaction, at a meeting on December 8, 2016, the Board voted unanimously to approve a New Investment Advisory Agreement for each Fund and a New Sub-Advisory Agreement for each Fund managed by INTECH, Perkins or Janus Singapore, and to recommend such agreements to the Funds’ shareholders for their approval.
Approval of Interim Advisory and Sub-Advisory Agreements with Janus and Janus Affiliates during the Period
In the event shareholders of a Fund do not approve such Fund’s New Advisory Agreement and/or New Sub-Advisory Agreement at the Meetings prior to the closing of the Transaction, Janus Capital proposed that an interim investment advisory agreement between Janus Capital and such Fund (each, an “Interim Advisory Agreement” and collectively, the “Interim Advisory Agreements”) and an interim sub-advisory agreement between Janus Capital and the applicable Sub-Adviser (each, an “Interim Sub-Advisory Agreement” and collectively, the “Interim Sub-Advisory Agreements”) take effect upon the closing of the Transaction. At the December 8, 2016 meeting, the Board, all of whom are Independent Trustees, unanimously approved an Interim Advisory Agreement for each Fund and an Interim Sub-Advisory Agreement for each applicable Fund in order to assure continuity of investment advisory services to the Funds and sub-advisory services to the sub-advised Funds after the Transaction. The terms of each Interim Advisory Agreement are substantially identical to those of the applicable Current Advisory Agreement and New Advisory Agreement, except for the term and escrow provisions described below. Similarly, the terms of each Interim Sub-Advisory Agreement are substantially identical to those of the Current Sub-Advisory Agreements and New Sub-Advisory Agreements, except for the term and escrow provisions described below. The Interim Advisory Agreement and Interim Sub-Advisory Agreement will continue in effect for a term ending on the earlier of 150 days from the closing of the Transaction (the “150-day period”) or when shareholders of the Fund approve the New Advisory Agreement and/or New Sub-Advisory Agreement. Pursuant to Rule 15a-4 under the 1940 Act, compensation earned by Janus Capital under an Interim Advisory Agreement and compensation earned by a Sub-Adviser under an Interim Sub-Advisory Agreement will be held in an interest-bearing escrow account. If shareholders of a Fund approve the New Advisory Agreement prior to the end of the 150-day period, the amount held in the escrow account under the Interim Advisory Agreement will be paid to Janus Capital. If shareholders of a Fund approve the New Advisory Agreement and New Sub-Advisory Agreement prior to the end of the 150-day period, the amount held in the escrow account under the Interim Sub-Advisory Agreement will be paid to the Sub-Adviser. If shareholders of a Fund do not approve the New Advisory Agreement prior to the end of the 150-day period, the Board will take such action as it
Janus Investment Fund | 43 |
Janus Emerging Markets Fund
Additional Information (unaudited)
deems to be in the best interests of the Fund, and Janus Capital will be paid the lesser of its costs incurred in performing its services under the Interim Advisory Agreement or the total amount in the escrow account, plus interest earned. If shareholders of a Fund do not approve the New Advisory Agreement and/or New Sub-Advisory Agreement prior to the end of the 150-day period, the Board will take such action as it deems to be in the best interests of the Fund, and the Sub-Adviser will be paid the lesser of its costs incurred in performing its services under the Interim Sub-Advisory Agreement or the total amount in the escrow account, plus interest earned.
Approval of Sub-Advisory Agreements with Henderson Investment Management Limited during the Period
Janus Capital met with the Trustees on November 7-8, 2016, and December 7-8, 2016, to discuss the approval of a new sub-advisory agreement between Janus Capital and Henderson Investment Management Limited (“HIML”) (each, a “HIML Sub-Advisory Agreement” and collectively, the “HIML Sub-Advisory Agreements”) on behalf of each of Janus Asia Equity Fund, Janus Emerging Markets Fund, and Janus Global Real Estate Fund (each, an “HIML Fund” and together, the “HIML Funds”) to take effect immediately after the closing of the Transaction or shareholder approval, whichever is later. At the meetings, the Trustees also discussed the HIML Sub-Advisory Agreements with their independent counsel in executive session. During the course of these meetings, the Trustees requested and considered such information as they deemed relevant to their deliberations. In addition, at prior meetings and during the course of these meetings the Board also undertook a comprehensive process to evaluate the impact of the Transaction on the nature, quality and extent of services expected to be provided by Janus Capital and HIML to each HIML Fund, including after the completion of the Transaction. For a fuller discussion of the Board’s consideration of the approval of a new investment advisory agreement for the HIML Funds in connection with the Transaction, see “Approval of Advisory and Sub-Advisory Agreements with Janus and its Affiliates During the Period” above.
At a meeting of the Board of Trustees held on December 8, 2016, the Trustees considered the HIML Sub-Advisory Agreements. In determining whether to approve the HIML Sub-Advisory Agreements, and whether to recommend approval to the shareholders of each HIML Fund, the Board received information and made inquiries into all matters as it deemed appropriate. The Board reviewed and analyzed various factors it deemed relevant, including the following factors, among others, none of which by itself was considered dispositive:
· the terms of each HIML Sub-Advisory Agreement;
· the nature, quality and extent of services expected to be provided under the HIML Sub-Advisory Agreements, including the reputation, qualifications and background of HIML and its operational and compliance infrastructures;
· the investment approach, the experience and skills of senior management and investment personnel of HIML, including the portfolio managers who would be responsible for managing all or part of the portfolio of each HIML Fund, noting the resources made available to such personnel;
· the ability of HIML to attract and retain high-quality personnel and the organizational depth of HIML;
· the sub-advisory fee rate under each HIML Sub-Advisory Agreement, as well as the overall management fee structure of each HIML Fund, noting that the sub-advisory fee rate is consistent with the approach utilized in the Janus Funds complex for other sub-advisory relationships, taking into account the allocation of managed assets between Janus Capital and HIML for the Global Real Estate Fund;
· under each HIML Sub-Advisory Agreement, Janus Capital would be responsible for paying HIML out of its fees;
· the fall out benefits to HIML and its affiliates from its relationship with each HIML Fund, including the potential benefits to HIML and its affiliates and each HIML Fund of receiving research services from broker/dealer firms in connection with the allocation of portfolio transactions to such firms;
· the potential for economies of scale with respect to the overall fee structure of each HIML Fund and whether either Fund will benefit from any economies of scale; and
· the costs of seeking approval of the HIML Sub-Advisory Agreements will not be borne by the HIML Funds.
As a result of its review and consideration of each HIML Sub-Advisory Agreement and related matters, on December 8, 2016, the Board voted unanimously to approve each HIML Sub-Advisory Agreement and to recommend such agreement to each HIML Fund’s shareholders for their approval.
44 | MARCH 31, 2017 |
Janus Emerging Markets Fund
Additional Information (unaudited)
Renewal of Investment Advisory and Sub-Advisory Agreements for INTECH U.S. Core Fund
As noted above, at its December 8, 2016 meeting, the Board continued its on-going annual process to determine whether to continue the Current Advisory Agreements and the Current Sub-Advisory Agreements. In this regard, the Board received and reviewed information provided by Janus and the respective Sub-Advisers in response to requests of the Board and its independent legal counsel. The Board also received and reviewed information and analysis provided by, and in response to requests of, its independent fee consultant. The Board noted that the Current Advisory Agreement between the Trust, on behalf of INTECH U.S. Core Fund, and Janus Capital and the Current Sub-Advisory Agreement between Janus Capital and INTECH, on behalf of the Fund, would expire on January 1, 2017, if not renewed. The Board noted that the date of termination for the Current Advisory Agreements and the Current Sub-Advisory Agreements for the other Funds was February 1, 2017, if not renewed. Accordingly, the Board voted unanimously to renew the Current Advisory Agreement and the Current Sub-Advisory Agreement for INTECH U.S. Core Fund through January 31, 2017 in order to (i) align the termination date of such Agreements with the termination date of the Current Advisory Agreements and the Current Sub-Advisory Agreements for the other Funds and (ii) allow for a more complete consideration of such Agreements, as well as the Current Advisory Agreements and the Current Sub-Advisory Agreements for the other Funds.
APPROVAL OF ADVISORY AGREEMENTS DURING THE PERIOD
The Trustees of Janus Investment Fund and Janus Aspen Series, each of whom serves as an “independent” Trustee (the “Trustees”), oversee the management of each Fund of Janus Investment Fund and each Portfolio of Janus Aspen Series (each, a “Fund” and collectively, the “Funds”), and as required by law, determine annually whether to continue the investment advisory agreement for each Fund and the subadvisory agreements for the 16 Funds that utilize subadvisers.
In connection with their most recent consideration of those agreements for each Fund, the Trustees received and reviewed information provided by Janus Capital and the respective subadvisers in response to requests of the Trustees and their independent legal counsel. They also received and reviewed information and analysis provided by, and in response to requests of, their independent fee consultant. Throughout their consideration of the agreements, the Trustees were advised by their independent legal counsel. The Trustees met with management to consider the agreements, and also met separately in executive session with their independent legal counsel and their independent fee consultant.
Additionally, in connection with their consideration of whether to continue the investment advisory agreement and subadvisory agreement for each Fund, as applicable, the Trustees also received and reviewed information in connection with the proposed transaction to combine the respective businesses of Henderson Group plc and Janus Capital Group, Inc., the parent company of Janus Capital (the “Transaction”), announced in October 2016, which Janus Capital advised the Trustees was expected to close in the second quarter of 2017. In this regard, the Trustees reviewed information regarding the impact of the Transaction on the services to be provided by Janus Capital and each subadviser, as applicable, to the Funds under such agreements both prior to the close of the Transaction, and afterwards, if the Transaction were not to close. If the Transaction closes, all such agreements would be replaced by new investment advisory agreements and subadvisory agreements, as applicable, for each Fund, assuming requisite Fund shareholder approvals have been obtained.
At a meeting held on January 26, 2017, based on the Trustees’ evaluation of the information provided by Janus Capital, the subadvisers, and the independent fee consultant, as well as other information, the Trustees determined that the overall arrangements between each Fund and Janus Capital and each subadviser, as applicable, were fair and reasonable in light of the nature, extent and quality of the services provided by Janus Capital, its affiliates and the subadvisers, the fees charged for those services, and other matters that the Trustees considered relevant in the exercise of their business judgment. At that meeting, the Trustees unanimously approved the continuation of the investment advisory agreement for each Fund, and the subadvisory agreement for each subadvised Fund, for the period from February 1, 2017 through February 1, 2018, subject to earlier termination as provided for in each agreement.
In considering the continuation of those agreements, the Trustees reviewed and analyzed various factors that they determined were relevant, including the factors described below, none of which by itself was considered dispositive. However, the material factors and conclusions that formed the basis for the Trustees’ determination to approve the continuation of the agreements are discussed separately below. Also included is a summary of the independent fee consultant’s conclusions and opinions that arose during, and were included as part of, the Trustees’ consideration of the
Janus Investment Fund | 45 |
Janus Emerging Markets Fund
Additional Information (unaudited)
agreements. “Management fees,” as used herein, reflect actual annual advisory fees and any administration fees (excluding out of pocket costs), net of any waivers.
Nature, Extent and Quality of Services
The Trustees reviewed the nature, extent and quality of the services provided by Janus Capital and the subadvisers to the Funds, taking into account the investment objective, strategies and policies of each Fund, and the knowledge the Trustees gained from their regular meetings with management on at least a quarterly basis and their ongoing review of information related to the Funds. In addition, the Trustees reviewed the resources and key personnel of Janus Capital and each subadviser, particularly noting those employees who provide investment and risk management services to the Funds. The Trustees also considered other services provided to the Funds by Janus Capital or the subadvisers, such as managing the execution of portfolio transactions and the selection of broker-dealers for those transactions. The Trustees considered Janus Capital’s role as administrator to the Funds, noting that Janus Capital does not receive a fee for its services but is reimbursed for its out-of-pocket costs. The Trustees considered the role of Janus Capital in monitoring adherence to the Funds’ investment restrictions, providing support services for the Trustees and Trustee committees, and overseeing communications with shareholders and the activities of other service providers, including monitoring compliance with various policies and procedures of the Funds and with applicable securities laws and regulations.
In this regard, the independent fee consultant noted that Janus Capital provides a number of different services for the Funds and Fund shareholders, ranging from investment management services to various other servicing functions, and that, in its opinion, Janus Capital is a capable provider of those services. The independent fee consultant also provided its belief that Janus Capital has developed a number of institutional competitive advantages that should enable it to provide superior investment and service performance over the long term.
The Trustees concluded that the nature, extent and quality of the services provided by Janus Capital or the subadviser to each Fund were appropriate and consistent with the terms of the respective advisory and subadvisory agreements, and that, taking into account steps taken to address those Funds whose performance lagged that of their peers for certain periods, the Funds were likely to benefit from the continued provision of those services. They also concluded that Janus Capital and each subadviser had sufficient personnel, with the appropriate education and experience, to serve the Funds effectively and had demonstrated its ability to attract well-qualified personnel.
Performance of the Funds
The Trustees considered the performance results of each Fund over various time periods. They noted that they considered Fund performance data throughout the year, including periodic meetings with each Fund’s portfolio manager(s), and also reviewed information comparing each Fund’s performance with the performance of comparable funds and peer groups identified by Broadridge Financial Solutions, Inc. (“Broadridge”), an independent data provider, and with the Fund’s benchmark index. In this regard, the independent fee consultant found that the overall Funds’ performance has been strong: for the 36 months ended September 30, 2016, approximately 76% of the Funds were in the top two Broadridge quartiles of performance, and for the 12 months ended September 30, 2016, approximately 47% of the Funds were in the top two Broadridge quartiles of performance.
The Trustees considered the performance of each Fund, noting that performance may vary by share class, and noted the following:
Fixed-Income Funds and Money Market Funds
· For Janus Flexible Bond Fund, the Trustees noted that the Fund’s performance was in the second Broadridge quartile for the 36 months ended May 31, 2016 and the third Broadridge quartile for the 12 months ended May 31, 2016.
· For Janus Global Bond Fund, the Trustees noted that the Fund’s performance was in the second Broadridge quartile for the 36 months ended May 31, 2016 and the third Broadridge quartile for the 12 months ended May 31, 2016.
· For Janus Global Unconstrained Bond Fund, the Trustees noted that the Fund’s performance was in the first Broadridge quartile for the 12 months ended May 31, 2016.
46 | MARCH 31, 2017 |
Janus Emerging Markets Fund
Additional Information (unaudited)
· For Janus High-Yield Fund, the Trustees noted that the Fund’s performance was in the second Broadridge quartile for the 36 months ended May 31, 2016 and the second Broadridge quartile for the 12 months ended May 31, 2016.
· For Janus Multi-Sector Income Fund, the Trustees noted that the Fund’s performance was in the first Broadridge quartile for the 12 months ended May 31, 2016.
· For Janus Real Return Fund, the Trustees noted that the Fund’s performance was in the first Broadridge quartile for the 36 months ended May 31, 2016 and the first Broadridge quartile for the 12 months ended May 31, 2016.
· For Janus Short-Term Bond Fund, the Trustees noted that the Fund’s performance was in the second Broadridge quartile for the 36 months ended May 31, 2016 and the third Broadridge quartile for the 12 months ended May 31, 2016.
· For Janus Government Money Market Fund, the Trustees noted that the Fund’s performance was in the third Broadridge quartile for the 36 months ended May 31, 2016 and the third Broadridge quartile for the 12 months ended May 31, 2016. The Trustees noted the reasons for the Fund’s underperformance.
· For Janus Money Market Fund, the Trustees noted that the Fund’s performance was in the bottom Broadridge quartile for the 36 months ended May 31, 2016 and the bottom Broadridge quartile for the 12 months ended May 31, 2016. The Trustees noted the reasons for the Fund’s underperformance.
Asset Allocation Funds
· For Janus Global Allocation Fund – Conservative, the Trustees noted that the Fund’s performance was in the second Broadridge quartile for the 36 months ended May 31, 2016 and the bottom Broadridge quartile for the 12 months ended May 31, 2016.
· For Janus Global Allocation Fund – Growth, the Trustees noted that the Fund’s performance was in the bottom Broadridge quartile for the 36 months ended May 31, 2016 and the bottom Broadridge quartile for the 12 months ended May 31, 2016. The Trustees noted the reasons for the Fund’s underperformance and the steps Janus Capital had taken or was taking to improve performance.
· For Janus Global Allocation Fund – Moderate, the Trustees noted that the Fund’s performance was in the third Broadridge quartile for the 36 months ended May 31, 2016 and the bottom Broadridge quartile for the 12 months ended May 31, 2016. The Trustees noted the reasons for the Fund’s underperformance and the steps Janus Capital had taken or was taking to improve performance.
Alternative Fund
· For Janus Diversified Alternatives Fund, the Trustees noted that the Fund’s performance was in the third Broadridge quartile for the 36 months ended May 31, 2016 and the third Broadridge quartile for the 12 months ended May 31, 2016. The Trustees noted the reasons for the Fund’s underperformance and the steps Janus Capital had taken or was taking to improve performance.
Value Funds
· For Perkins International Value Fund, the Trustees noted that the Fund’s performance was in the second Broadridge quartile for the 36 months ended May 31, 2016 and the first Broadridge quartile for the 12 months ended May 31, 2016.
· For Perkins Global Value Fund, the Trustees noted that the Fund’s performance was in the second Broadridge quartile for the 36 months ended May 31, 2016 and the first Broadridge quartile for the 12 months ended May 31, 2016.
· For Perkins Large Cap Value Fund, the Trustees noted that the Fund’s performance was in the third Broadridge quartile for the 36 months ended May 31, 2016 and the first Broadridge quartile for the 12 months ended May 31, 2016. The Trustees noted the reasons for the Fund’s underperformance, noting that the Fund has a performance fee structure that results in lower management fees during periods of underperformance, the steps Janus Capital and Perkins had taken or were taking to improve performance, and that the performance trend was improving.
Janus Investment Fund | 47 |
Janus Emerging Markets Fund
Additional Information (unaudited)
· For Perkins Mid Cap Value Fund, the Trustees noted that the Fund’s performance was in the bottom Broadridge quartile for the 36 months ended May 31, 2016 and the first Broadridge quartile for the 12 months ended May 31, 2016. The Trustees noted the reasons for the Fund’s underperformance, noting that the Fund has a performance fee structure that results in lower management fees during periods of underperformance, the steps Janus Capital and Perkins had taken or were taking to improve performance, and that the performance trend was improving.
· For Perkins Select Value Fund, the Trustees noted that the Fund’s performance was in the second Broadridge quartile for the 36 months ended May 31, 2016 and the first Broadridge quartile for the 12 months ended May 31, 2016.
· For Perkins Small Cap Value Fund, the Trustees noted that the Fund’s performance was in the first Broadridge quartile for the 36 months ended May 31, 2016 and the first Broadridge quartile for the 12 months ended May 31, 2016.
· For Perkins Value Plus Income Fund, the Trustees noted that the Fund’s performance was in the second Broadridge quartile for the 36 months ended May 31, 2016 and the second Broadridge quartile for the 12 months ended May 31, 2016.
Mathematical Funds
· For INTECH Emerging Markets Managed Volatility Fund, the Trustees noted that the Fund’s performance was in the second Broadridge quartile for the 12 months ended May 31, 2016.
· For INTECH Global Income Managed Volatility Fund, the Trustees noted that the Fund’s performance was in the first Broadridge quartile for the 36 months ended May 31, 2016 and the first Broadridge quartile for the 12 months ended May 31, 2016.
· For INTECH International Managed Volatility Fund, the Trustees noted that the Fund’s performance was in the first Broadridge quartile for the 36 months ended May 31, 2016 and the first Broadridge quartile for the 12 months ended May 31, 2016.
· For INTECH U.S. Core Fund, the Trustees noted that the Fund’s performance was in the first Broadridge quartile for the 36 months ended May 31, 2016 and the first Broadridge quartile for the 12 months ended May 31, 2016.
· For INTECH U.S. Managed Volatility Fund, the Trustees noted that the Fund’s performance was in the first Broadridge quartile for the 36 months ended May 31, 2016 and the first Broadridge quartile for the 12 months ended May 31, 2016.
Growth and Core Funds
· For Janus Balanced Fund, the Trustees noted that the Fund’s performance was in the first Broadridge quartile for the 36 months ended May 31, 2016 and the third Broadridge quartile for the 12 months ended May 31, 2016.
· For Janus Contrarian Fund, the Trustees noted that the Fund’s performance was in the bottom Broadridge quartile for the 36 months ended May 31, 2016 and the bottom Broadridge quartile for the 12 months ended May 31, 2016. The Trustees noted the reasons for the Fund’s underperformance, noting that the Fund has a performance fee structure that results in lower management fees during periods of underperformance, and the steps Janus Capital had taken or was taking to improve performance.
· For Janus Enterprise Fund, the Trustees noted that the Fund’s performance was in the first Broadridge quartile for the 36 months ended May 31, 2016 and the first Broadridge quartile for the 12 months ended May 31, 2016.
· For Janus Forty Fund, the Trustees noted that the Fund’s performance was in the first Broadridge quartile for the 36 months ended May 31, 2016 and the first Broadridge quartile for the 12 months ended May 31, 2016.
· For Janus Fund, the Trustees noted that the Fund’s performance was in the first Broadridge quartile for the 36 months ended May 31, 2016 and the second Broadridge quartile for the 12 months ended May 31, 2016.
48 | MARCH 31, 2017 |
Janus Emerging Markets Fund
Additional Information (unaudited)
· For Janus Growth and Income Fund, the Trustees noted that the Fund’s performance was in the second Broadridge quartile for the 36 months ended May 31, 2016 and in the second Broadridge quartile for the 12 months ended May 31, 2016.
· For Janus Research Fund, the Trustees noted that the Fund’s performance was in the first Broadridge quartile for the 36 months ended May 31, 2016 and the second Broadridge quartile for the 12 months ended May 31, 2016.
· For Janus Triton Fund, the Trustees noted that the Fund’s performance was in the first Broadridge quartile for the 36 months ended May 31, 2016 and the first Broadridge quartile for the 12 months ended May 31, 2016.
· For Janus Twenty Fund, the Trustees noted that the Fund’s performance was in the third Broadridge quartile for the 36 months ended May 31, 2016 and the first Broadridge quartile for the 12 months ended May 31, 2016. The Trustees noted the reasons for the Fund’s underperformance, noting that the Fund has a performance fee structure that results in lower management fees during periods of underperformance, the steps Janus Capital had taken or was taking to improve performance, and that the performance trend was improving.
· For Janus Venture Fund, the Trustees noted that the Fund’s performance was in the first Broadridge quartile for the 36 months ended May 31, 2016 and the second Broadridge quartile for the 12 months ended May 31, 2016.
Global and International Funds
· For Janus Adaptive Global Allocation Fund, the Trustees noted that, due to limited performance for the Fund, performance history was not a material factor.
· For Janus Asia Equity Fund, the Trustees noted that the Fund’s performance was in the third Broadridge quartile for the 36 months ended May 31, 2016 and the bottom Broadridge quartile for the 12 months ended May 31, 2016. The Trustees noted the reasons for the Fund’s underperformance, noting that the Fund has a performance fee structure that results in lower management fees during periods of underperformance, and the steps Janus Capital had taken or was taking to improve performance.
· For Janus Emerging Markets Fund, the Trustees noted that the Fund’s performance was in the first Broadridge quartile for the 36 months ended May 31, 2016 and the third Broadridge quartile for the 12 months ended May 31, 2016.
· For Janus Global Life Sciences Fund, the Trustees noted that the Fund’s performance was in the first Broadridge quartile for the 36 months ended May 31, 2016 and the bottom Broadridge quartile for the 12 months ended May 31, 2016.
· For Janus Global Real Estate Fund, the Trustees noted that the Fund’s performance was in the third Broadridge quartile for the 36 months ended May 31, 2016 and the bottom Broadridge quartile for the 12 months ended May 31, 2016. The Trustees noted the reasons for the Fund’s underperformance, noting that the Fund has a performance fee structure that results in lower management fees during periods of underperformance, and the steps Janus Capital had taken or was taking to improve performance.
· For Janus Global Research Fund, the Trustees noted that the Fund’s performance was in the third Broadridge quartile for the 36 months ended May 31, 2016 and the bottom Broadridge quartile for the 12 months ended May 31, 2016. The Trustees noted the reasons for the Fund’s underperformance, noting that the Fund has a performance fee structure that results in lower management fees during periods of underperformance, and the steps Janus Capital had taken or was taking to improve performance.
· For Janus Global Select Fund, the Trustees noted that the Fund’s performance was in the bottom Broadridge quartile for the 36 months ended May 31, 2016 and the bottom Broadridge quartile for the 12 months ended May 31, 2016. The Trustees noted the reasons for the Fund’s underperformance and the steps Janus Capital had taken or was taking to improve performance.
· For Janus Global Technology Fund, the Trustees noted that the Fund’s performance was in the third Broadridge quartile for the 36 months ended May 31, 2016 and the first Broadridge quartile for the 12 months
Janus Investment Fund | 49 |
Janus Emerging Markets Fund
Additional Information (unaudited)
ended May 31, 2016. The Trustees noted the reasons for the Fund’s underperformance, the steps Janus Capital had taken or was taking to improve performance, and that the performance trend was improving.
· For Janus International Equity Fund, the Trustees noted that the Fund’s performance was in the bottom Broadridge quartile for the 36 months ended May 31, 2016 and the bottom Broadridge quartile for the 12 months ended May 31, 2016. The Trustees noted the reasons for the Fund’s underperformance, noting that the Fund has a performance fee structure that results in lower management fees during periods of underperformance, and the steps Janus Capital had taken or was taking to improve performance.
· For Janus Overseas Fund, the Trustees noted that the Fund’s performance was in the bottom Broadridge quartile for the 36 months ended May 31, 2016 and the bottom Broadridge quartile for the 12 months ended May 31, 2016. The Trustees noted the reasons for the Fund’s underperformance, noting that the Fund has a performance fee structure that results in lower management fees during periods of underperformance, and the steps Janus Capital had taken or was taking to improve performance.
Janus Aspen Series
· For Janus Aspen Balanced Portfolio, the Trustees noted that the Fund’s performance was in the first Broadridge quartile for the 36 months ended May 31, 2016 and the third Broadridge quartile for the 12 months ended May 31, 2016.
· For Janus Aspen Enterprise Portfolio, the Trustees noted that the Fund’s performance was in the first Broadridge quartile for the 36 months ended May 31, 2016 and the first Broadridge quartile for the 12 months ended May 31, 2016.
· For Janus Aspen Flexible Bond Portfolio, the Trustees noted that the Fund’s performance was in the second Broadridge quartile for the 36 months ended May 31, 2016 and the bottom Broadridge quartile for the 12 months ended May 31, 2016.
· For Janus Aspen Forty Portfolio, the Trustees noted that the Fund’s performance was in the first Broadridge quartile for the 36 months ended May 31, 2016 and the first Broadridge quartile for the 12 months ended May 31, 2016.
· For Janus Aspen Global Allocation Portfolio – Moderate, the Trustees noted that the Fund’s performance was in the bottom Broadridge quartile for the 36 months ended May 31, 2016 and the bottom Broadridge quartile for the 12 months ended May 31, 2016. The Trustees noted the reasons for the Fund’s underperformance and the steps Janus Capital had taken or was taking to improve performance.
· For Janus Aspen Global Research Portfolio, the Trustees noted that the Fund’s performance was in the third Broadridge quartile for the 36 months ended May 31, 2016 and the bottom Broadridge quartile for the 12 months ended May 31, 2016. The Trustees noted the reasons for the Fund’s underperformance, noting that the Fund has a performance fee structure that results in lower management fees during periods of underperformance, and the steps Janus Capital had taken or was taking to improve performance.
· For Janus Aspen Global Technology Portfolio, the Trustees noted that the Fund’s performance was in the third Broadridge quartile for the 36 months ended May 31, 2016 and the second Broadridge quartile for the 12 months ended May 31, 2016. The Trustees noted the reasons for the Fund’s underperformance and the steps Janus Capital had taken or was taking to improve performance.
· For Janus Aspen Global Unconstrained Bond Portfolio, the Trustees noted that the Fund’s performance was in the second Broadridge quartile for the 12 months ended May 31, 2016.
· For Janus Aspen INTECH U.S. Low Volatility Portfolio, the Trustees noted that the Fund’s performance was in the first Broadridge quartile for the 36 months ended May 31, 2016 and the first Broadridge quartile for the 12 months ended May 31, 2016.
· For Janus Aspen Janus Portfolio, the Trustees noted that the Fund’s performance was in the first Broadridge quartile for the 36 months ended May 31, 2016 and the second Broadridge quartile for the 12 months ended May 31, 2016.