http://fasb.org/us-gaap/2023#SecuredDebtCurrenthttp://fasb.org/us-gaap/2023#SecuredDebtCurrenthttp://fasb.org/us-gaap/2023#SecuredDebtCurrenthttp://fasb.org/us-gaap/2023#SecuredDebtCurrenthttp://fasb.org/us-gaap/2023#SecuredDebtCurrenthttp://fasb.org/us-gaap/2023#SecuredDebtCurrenthttp://fasb.org/us-gaap/2023#SecuredDebtCurrenthttp://fasb.org/us-gaap/2023#SecuredDebtCurrenthttp://jdcc.deere.com/20240128#ForeignDebtSecuritiesMemberhttp://jdcc.deere.com/20240128#ForeignDebtSecuritiesMember000http://fasb.org/us-gaap/2023#SecuredDebtCurrenthttp://fasb.org/us-gaap/2023#SecuredDebtCurrenthttp://fasb.org/us-gaap/2023#OtherAssetshttp://fasb.org/us-gaap/2023#OtherAssetshttp://fasb.org/us-gaap/2023#InterestExpense http://fasb.org/us-gaap/2023#SellingGeneralAndAdministrativeExpensehttp://fasb.org/us-gaap/2023#InterestExpense http://fasb.org/us-gaap/2023#SellingGeneralAndAdministrativeExpensehttp://jdcc.deere.com/20240128#UltimateParentCompanyAndItsWhollyOwnedSubsidiariesMemberhttp://jdcc.deere.com/20240128#UltimateParentCompanyAndItsWhollyOwnedSubsidiariesMemberhttp://jdcc.deere.com/20240128#UltimateParentCompanyAndItsWhollyOwnedSubsidiariesMemberhttp://jdcc.deere.com/20240128#UltimateParentCompanyAndItsWhollyOwnedSubsidiariesMemberhttp://jdcc.deere.com/20240128#LongTermDebtAndFinanceLeasesNoncurrenthttp://jdcc.deere.com/20240128#LongTermDebtAndFinanceLeasesNoncurrent250025002500http://fasb.org/us-gaap/2023#SecuredDebtCurrentP60Dhttp://fasb.org/us-gaap/2023#SecuredDebtCurrenthttp://jdcc.deere.com/20240128#ForeignDebtSecuritiesMemberhttp://jdcc.deere.com/20240128#LongTermDebtAndFinanceLeasesNoncurrenthttp://jdcc.deere.com/20240128#CorrectionOfTimingOfExpenseAndClassificationForFinancingIncentivesProgramToDealersMemberDEERE JOHN CAPITAL CORP0000027673false--10-27Q10000027673us-gaap:RetainedEarningsMember2024-01-280000027673us-gaap:NoncontrollingInterestMember2024-01-280000027673us-gaap:CommonStockMember2024-01-280000027673us-gaap:RetainedEarningsMember2023-10-290000027673us-gaap:NoncontrollingInterestMember2023-10-290000027673us-gaap:CommonStockMember2023-10-290000027673us-gaap:RetainedEarningsMember2023-01-290000027673us-gaap:NoncontrollingInterestMember2023-01-290000027673us-gaap:CommonStockMember2023-01-290000027673us-gaap:RetainedEarningsMember2022-10-300000027673us-gaap:NoncontrollingInterestMember2022-10-300000027673us-gaap:CommonStockMember2022-10-300000027673us-gaap:AccumulatedOtherComprehensiveIncomeMember2022-10-300000027673us-gaap:AccumulatedTranslationAdjustmentMember2024-01-280000027673us-gaap:AccumulatedOtherComprehensiveIncomeMember2024-01-280000027673us-gaap:AccumulatedNetUnrealizedInvestmentGainLossMember2024-01-280000027673us-gaap:AccumulatedGainLossNetCashFlowHedgeParentMember2024-01-280000027673us-gaap:AccumulatedTranslationAdjustmentMember2023-10-290000027673us-gaap:AccumulatedOtherComprehensiveIncomeMember2023-10-290000027673us-gaap:AccumulatedNetUnrealizedInvestmentGainLossMember2023-10-290000027673us-gaap:AccumulatedGainLossNetCashFlowHedgeParentMember2023-10-290000027673us-gaap:AccumulatedTranslationAdjustmentMember2023-01-290000027673us-gaap:AccumulatedOtherComprehensiveIncomeMember2023-01-290000027673us-gaap:AccumulatedNetUnrealizedInvestmentGainLossMember2023-01-290000027673us-gaap:AccumulatedGainLossNetCashFlowHedgeParentMember2023-01-290000027673us-gaap:SecuredDebtMemberus-gaap:SubsequentEventMember2024-02-250000027673jdcc:ConstructionAndForestryEquipmentMember2024-01-280000027673jdcc:AgricultureAndTurfEquipmentMember2024-01-280000027673jdcc:ConstructionAndForestryEquipmentMember2023-10-290000027673jdcc:AgricultureAndTurfEquipmentMember2023-10-290000027673jdcc:ConstructionAndForestryEquipmentMember2023-01-290000027673jdcc:AgricultureAndTurfEquipmentMember2023-01-290000027673us-gaap:NoncontrollingInterestMember2023-10-302024-01-280000027673us-gaap:RetainedEarningsMember2022-10-312023-01-290000027673us-gaap:NoncontrollingInterestMember2022-10-312023-01-290000027673us-gaap:AccumulatedOtherComprehensiveIncomeMember2023-10-302024-01-280000027673us-gaap:AccumulatedOtherComprehensiveIncomeMember2022-10-312023-01-290000027673us-gaap:InterestRateSwapMember2023-10-302024-01-280000027673us-gaap:InterestRateSwapMember2022-10-312023-01-290000027673us-gaap:AccumulatedTranslationAdjustmentMember2023-10-302024-01-280000027673us-gaap:AccumulatedNetUnrealizedInvestmentGainLossMember2023-10-302024-01-280000027673us-gaap:AccumulatedTranslationAdjustmentMember2022-10-312023-01-290000027673us-gaap:AccumulatedNetUnrealizedInvestmentGainLossMember2022-10-312023-01-290000027673us-gaap:AssetPledgedAsCollateralWithRightMember2024-01-280000027673us-gaap:AssetPledgedAsCollateralWithRightMember2023-10-290000027673us-gaap:AssetPledgedAsCollateralWithRightMember2023-01-290000027673us-gaap:AccumulatedGainLossNetCashFlowHedgeParentMember2023-10-302024-01-280000027673us-gaap:AccumulatedGainLossNetCashFlowHedgeParentMember2022-10-312023-01-290000027673us-gaap:NotesPayableOtherPayablesMember2023-01-290000027673jdcc:MarketableSecuritiesMemberus-gaap:FairValueInputsLevel2Memberus-gaap:FairValueMeasurementsRecurringMember2024-01-280000027673jdcc:MarketableSecuritiesMemberus-gaap:FairValueInputsLevel2Memberus-gaap:FairValueMeasurementsRecurringMember2023-10-290000027673jdcc:MarketableSecuritiesMemberus-gaap:FairValueInputsLevel2Memberus-gaap:FairValueMeasurementsRecurringMember2023-01-290000027673us-gaap:InterestRateSwapMemberus-gaap:ReclassificationOutOfAccumulatedOtherComprehensiveIncomeMemberus-gaap:AccumulatedGainLossNetCashFlowHedgeParentMember2023-10-302024-01-280000027673us-gaap:InterestRateSwapMemberus-gaap:ReclassificationOutOfAccumulatedOtherComprehensiveIncomeMemberus-gaap:AccumulatedGainLossNetCashFlowHedgeParentMember2022-10-312023-01-290000027673us-gaap:InterestRateSwapMember2024-01-280000027673us-gaap:InterestRateSwapMember2023-10-290000027673us-gaap:InterestRateSwapMember2023-01-290000027673us-gaap:FinancialGuaranteeMemberjdcc:JohnDeereFinancialIncMemberus-gaap:CommercialPaperMember2024-01-280000027673srt:RevisionOfPriorPeriodErrorCorrectionAdjustmentMember2023-01-302023-01-300000027673srt:RevisionOfPriorPeriodErrorCorrectionAdjustmentMember2023-01-300000027673us-gaap:RetainedEarningsMember2023-10-302024-01-280000027673us-gaap:FinancialGuaranteeMemberjdcc:JohnDeereFinancialIncMemberus-gaap:DerivativeMember2024-01-280000027673us-gaap:InterestRateSwapMemberus-gaap:InterestExpenseMember2023-10-302024-01-280000027673us-gaap:ForeignExchangeContractMemberus-gaap:SellingGeneralAndAdministrativeExpensesMember2023-10-302024-01-280000027673us-gaap:InterestRateSwapMemberus-gaap:InterestExpenseMember2022-10-312023-01-290000027673us-gaap:ForeignExchangeContractMemberus-gaap:SellingGeneralAndAdministrativeExpensesMember2022-10-312023-01-290000027673jdcc:UltimateParentCompanyAndItsWhollyOwnedSubsidiariesMemberus-gaap:RelatedPartyMember2022-10-312023-01-290000027673us-gaap:InterestRateCapMemberus-gaap:NotDesignatedAsHedgingInstrumentEconomicHedgeMemberus-gaap:ShortMember2024-01-280000027673us-gaap:AccountsPayableAndAccruedLiabilitiesMemberus-gaap:FairValueInputsLevel2Memberus-gaap:FairValueMeasurementsRecurringMember2024-01-280000027673jdcc:OtherPayablesToRelatedPartyMemberus-gaap:FairValueInputsLevel2Memberus-gaap:FairValueMeasurementsRecurringMember2024-01-280000027673us-gaap:CrossCurrencyInterestRateContractMemberus-gaap:NotDesignatedAsHedgingInstrumentEconomicHedgeMember2024-01-280000027673us-gaap:InterestRateSwapMemberus-gaap:FairValueHedgingMemberus-gaap:DesignatedAsHedgingInstrumentMember2023-10-290000027673us-gaap:InterestRateCapMemberus-gaap:NotDesignatedAsHedgingInstrumentEconomicHedgeMemberus-gaap:ShortMember2023-10-290000027673us-gaap:AccountsPayableAndAccruedLiabilitiesMemberus-gaap:FairValueInputsLevel2Memberus-gaap:FairValueMeasurementsRecurringMember2023-10-290000027673jdcc:OtherPayablesToRelatedPartyMemberus-gaap:FairValueInputsLevel2Memberus-gaap:FairValueMeasurementsRecurringMember2023-10-290000027673us-gaap:InterestRateCapMemberus-gaap:NotDesignatedAsHedgingInstrumentEconomicHedgeMemberus-gaap:ShortMember2023-01-290000027673us-gaap:AccountsPayableAndAccruedLiabilitiesMemberus-gaap:FairValueInputsLevel2Memberus-gaap:FairValueMeasurementsRecurringMember2023-01-290000027673jdcc:OtherPayablesToRelatedPartyMemberus-gaap:FairValueInputsLevel2Memberus-gaap:FairValueMeasurementsRecurringMember2023-01-290000027673us-gaap:OtherAssetsMemberus-gaap:FairValueInputsLevel2Memberus-gaap:FairValueMeasurementsRecurringMember2024-01-280000027673us-gaap:InterestRateSwapMemberus-gaap:FairValueHedgingMemberus-gaap:DesignatedAsHedgingInstrumentMember2024-01-280000027673us-gaap:InterestRateSwapMemberus-gaap:CashFlowHedgingMemberus-gaap:DesignatedAsHedgingInstrumentMember2024-01-280000027673us-gaap:InterestRateCapMemberus-gaap:NotDesignatedAsHedgingInstrumentEconomicHedgeMemberus-gaap:LongMember2024-01-280000027673jdcc:ReceivablesFromRelatedPartyMemberus-gaap:FairValueInputsLevel2Memberus-gaap:FairValueMeasurementsRecurringMember2024-01-280000027673us-gaap:InterestRateSwapMemberus-gaap:NotDesignatedAsHedgingInstrumentEconomicHedgeMember2024-01-280000027673us-gaap:ForeignExchangeContractMemberus-gaap:NotDesignatedAsHedgingInstrumentEconomicHedgeMember2024-01-280000027673us-gaap:OtherAssetsMemberus-gaap:FairValueInputsLevel2Memberus-gaap:FairValueMeasurementsRecurringMember2023-10-290000027673us-gaap:InterestRateSwapMemberus-gaap:CashFlowHedgingMemberus-gaap:DesignatedAsHedgingInstrumentMember2023-10-290000027673us-gaap:InterestRateCapMemberus-gaap:NotDesignatedAsHedgingInstrumentEconomicHedgeMemberus-gaap:LongMember2023-10-290000027673jdcc:ReceivablesFromRelatedPartyMemberus-gaap:FairValueInputsLevel2Memberus-gaap:FairValueMeasurementsRecurringMember2023-10-290000027673us-gaap:InterestRateSwapMemberus-gaap:NotDesignatedAsHedgingInstrumentEconomicHedgeMember2023-10-290000027673us-gaap:ForeignExchangeContractMemberus-gaap:NotDesignatedAsHedgingInstrumentEconomicHedgeMember2023-10-290000027673us-gaap:CrossCurrencyInterestRateContractMemberus-gaap:NotDesignatedAsHedgingInstrumentEconomicHedgeMember2023-10-290000027673us-gaap:OtherAssetsMemberus-gaap:FairValueInputsLevel2Memberus-gaap:FairValueMeasurementsRecurringMember2023-01-290000027673us-gaap:InterestRateSwapMemberus-gaap:FairValueHedgingMemberus-gaap:DesignatedAsHedgingInstrumentMember2023-01-290000027673us-gaap:InterestRateSwapMemberus-gaap:CashFlowHedgingMemberus-gaap:DesignatedAsHedgingInstrumentMember2023-01-290000027673us-gaap:InterestRateCapMemberus-gaap:NotDesignatedAsHedgingInstrumentEconomicHedgeMemberus-gaap:LongMember2023-01-290000027673jdcc:ReceivablesFromRelatedPartyMemberus-gaap:FairValueInputsLevel2Memberus-gaap:FairValueMeasurementsRecurringMember2023-01-290000027673us-gaap:InterestRateSwapMemberus-gaap:NotDesignatedAsHedgingInstrumentEconomicHedgeMember2023-01-290000027673us-gaap:ForeignExchangeContractMemberus-gaap:NotDesignatedAsHedgingInstrumentEconomicHedgeMember2023-01-290000027673us-gaap:CrossCurrencyInterestRateContractMemberus-gaap:NotDesignatedAsHedgingInstrumentEconomicHedgeMember2023-01-290000027673jdcc:UltimateParentCompanyAndItsWhollyOwnedSubsidiariesMemberus-gaap:RelatedPartyMember2024-01-280000027673jdcc:UnrelatedExternalCounterpartiesMember2024-01-280000027673jdcc:UltimateParentCompanyAndItsWhollyOwnedSubsidiariesMemberus-gaap:RelatedPartyMember2023-10-290000027673jdcc:UnrelatedExternalCounterpartiesMember2023-10-290000027673jdcc:UltimateParentCompanyAndItsWhollyOwnedSubsidiariesMemberus-gaap:RelatedPartyMember2023-01-290000027673jdcc:UnrelatedExternalCounterpartiesMember2023-01-290000027673us-gaap:FinancialGuaranteeMemberjdcc:JohnDeereFinancialIncMemberus-gaap:MediumTermNotesMember2024-01-280000027673jdcc:MediumTermNotesDueInNextTenYearsMember2024-01-280000027673jdcc:MediumTermNotesDueInNextTenYearsMember2023-10-290000027673jdcc:MediumTermNotesDueInNextTenYearsMember2023-01-290000027673us-gaap:RelatedPartyMember2023-10-302024-01-280000027673us-gaap:RelatedPartyMember2022-10-312023-01-290000027673us-gaap:AccountingStandardsUpdate202202Member2024-01-280000027673us-gaap:AccountingStandardsUpdate202201Member2024-01-280000027673us-gaap:AccountingStandardsUpdate202108Member2024-01-280000027673jdcc:AccountingStandardsUpdate202309Member2024-01-280000027673jdcc:AccountingStandardsUpdate202307Member2024-01-280000027673jdcc:AccountingStandardsUpdate202306Member2024-01-280000027673jdcc:AccountingStandardsUpdate202305Member2024-01-280000027673us-gaap:FairValueInputsLevel2Memberus-gaap:FairValueMeasurementsRecurringMember2024-01-280000027673us-gaap:FairValueInputsLevel2Memberus-gaap:FairValueMeasurementsRecurringMember2023-10-290000027673us-gaap:FairValueInputsLevel2Memberus-gaap:FairValueMeasurementsRecurringMember2023-01-290000027673us-gaap:NonrelatedPartyMember2024-01-280000027673us-gaap:NonrelatedPartyMember2023-10-290000027673srt:ScenarioPreviouslyReportedMemberus-gaap:NonrelatedPartyMember2023-01-290000027673srt:RevisionOfPriorPeriodErrorCorrectionAdjustmentMemberus-gaap:NonrelatedPartyMember2023-01-290000027673us-gaap:NonrelatedPartyMember2023-01-290000027673us-gaap:UnfundedLoanCommitmentMember2024-01-280000027673us-gaap:ConstructionSectorMemberus-gaap:CommercialPortfolioSegmentMemberus-gaap:FinancialAssetPastDueMember2024-01-280000027673us-gaap:AgriculturalSectorMemberus-gaap:NonperformingFinancingReceivableMemberus-gaap:CommercialPortfolioSegmentMember2024-01-280000027673jdcc:RetailNotesPortfolioSegmentMemberus-gaap:AssetPledgedAsCollateralWithRightMember2024-01-280000027673jdcc:RetailNotesPortfolioSegmentMemberus-gaap:AssetNotPledgedAsCollateralMember2024-01-280000027673jdcc:FinancingLeasesPortfolioSegmentMember2024-01-280000027673us-gaap:ConstructionSectorMemberus-gaap:CommercialPortfolioSegmentMemberus-gaap:FinancialAssetPastDueMember2023-10-290000027673us-gaap:AgriculturalSectorMemberus-gaap:NonperformingFinancingReceivableMemberus-gaap:CommercialPortfolioSegmentMember2023-10-290000027673us-gaap:AgriculturalSectorMemberus-gaap:CommercialPortfolioSegmentMemberus-gaap:FinancialAssetPastDueMember2023-10-290000027673jdcc:RetailNotesPortfolioSegmentMemberus-gaap:AssetPledgedAsCollateralWithRightMember2023-10-290000027673jdcc:RetailNotesPortfolioSegmentMemberus-gaap:AssetNotPledgedAsCollateralMember2023-10-290000027673jdcc:FinancingLeasesPortfolioSegmentMember2023-10-290000027673us-gaap:ConstructionSectorMemberus-gaap:CommercialPortfolioSegmentMemberus-gaap:FinancialAssetPastDueMember2023-01-290000027673us-gaap:AgriculturalSectorMemberus-gaap:NonperformingFinancingReceivableMemberus-gaap:CommercialPortfolioSegmentMember2023-01-290000027673srt:ScenarioPreviouslyReportedMemberjdcc:RetailNotesPortfolioSegmentMemberus-gaap:AssetNotPledgedAsCollateralMember2023-01-290000027673srt:RevisionOfPriorPeriodErrorCorrectionAdjustmentMemberjdcc:RetailNotesPortfolioSegmentMemberus-gaap:AssetNotPledgedAsCollateralMember2023-01-290000027673jdcc:RetailNotesPortfolioSegmentMemberus-gaap:AssetPledgedAsCollateralWithRightMember2023-01-290000027673jdcc:RetailNotesPortfolioSegmentMemberus-gaap:AssetNotPledgedAsCollateralMember2023-01-290000027673jdcc:FinancingLeasesPortfolioSegmentMember2023-01-290000027673us-gaap:FairValueInputsLevel3Memberus-gaap:AssetPledgedAsCollateralWithRightMember2024-01-280000027673us-gaap:FairValueInputsLevel3Memberus-gaap:AssetNotPledgedAsCollateralMember2024-01-280000027673us-gaap:CarryingReportedAmountFairValueDisclosureMemberus-gaap:AssetPledgedAsCollateralWithRightMember2024-01-280000027673us-gaap:CarryingReportedAmountFairValueDisclosureMemberus-gaap:AssetNotPledgedAsCollateralMember2024-01-280000027673us-gaap:FairValueInputsLevel3Memberus-gaap:AssetPledgedAsCollateralWithRightMember2023-10-290000027673us-gaap:FairValueInputsLevel3Memberus-gaap:AssetNotPledgedAsCollateralMember2023-10-290000027673us-gaap:CarryingReportedAmountFairValueDisclosureMemberus-gaap:AssetPledgedAsCollateralWithRightMember2023-10-290000027673us-gaap:CarryingReportedAmountFairValueDisclosureMemberus-gaap:AssetNotPledgedAsCollateralMember2023-10-290000027673us-gaap:FairValueInputsLevel3Memberus-gaap:AssetPledgedAsCollateralWithRightMember2023-01-290000027673us-gaap:FairValueInputsLevel3Memberus-gaap:AssetNotPledgedAsCollateralMember2023-01-290000027673us-gaap:CarryingReportedAmountFairValueDisclosureMemberus-gaap:AssetPledgedAsCollateralWithRightMember2023-01-290000027673us-gaap:CarryingReportedAmountFairValueDisclosureMemberus-gaap:AssetNotPledgedAsCollateralMember2023-01-290000027673srt:ScenarioPreviouslyReportedMember2023-01-290000027673srt:RevisionOfPriorPeriodErrorCorrectionAdjustmentMember2023-01-290000027673us-gaap:RelatedPartyMember2024-01-280000027673us-gaap:RelatedPartyMember2023-10-290000027673us-gaap:RelatedPartyMember2023-01-290000027673jdcc:UltimateParentCompanyAndItsWhollyOwnedSubsidiariesMemberus-gaap:RelatedPartyMember2023-10-302024-01-280000027673us-gaap:FairValueInputsLevel2Member2024-01-280000027673us-gaap:CarryingReportedAmountFairValueDisclosureMember2024-01-280000027673us-gaap:FairValueInputsLevel2Member2023-10-290000027673us-gaap:CarryingReportedAmountFairValueDisclosureMember2023-10-290000027673us-gaap:FairValueInputsLevel2Member2023-01-290000027673us-gaap:CarryingReportedAmountFairValueDisclosureMember2023-01-290000027673jdcc:UltimateParentCompanyAndItsWhollyOwnedSubsidiariesMemberus-gaap:DerivativeMemberus-gaap:RelatedPartyMember2024-01-280000027673jdcc:UltimateParentCompanyAndItsWhollyOwnedSubsidiariesMemberus-gaap:DerivativeMemberus-gaap:RelatedPartyMember2023-10-290000027673jdcc:UltimateParentCompanyAndItsWhollyOwnedSubsidiariesMemberus-gaap:DerivativeMemberus-gaap:RelatedPartyMember2023-01-290000027673srt:ScenarioPreviouslyReportedMember2022-10-312023-01-290000027673srt:RevisionOfPriorPeriodErrorCorrectionAdjustmentMember2022-10-312023-01-290000027673jdcc:LongTermDebtNoncurrentMemberus-gaap:InterestRateSwapMember2024-01-280000027673jdcc:DebtCurrentMemberus-gaap:InterestRateSwapMember2024-01-280000027673jdcc:LongTermDebtNoncurrentMemberus-gaap:InterestRateSwapMember2023-10-290000027673jdcc:DebtCurrentMemberus-gaap:InterestRateSwapMember2023-10-290000027673jdcc:LongTermDebtNoncurrentMemberus-gaap:InterestRateSwapMember2023-01-290000027673jdcc:DebtCurrentMemberus-gaap:InterestRateSwapMember2023-01-290000027673us-gaap:FinancialGuaranteeMemberjdcc:JohnDeereFinancialIncMemberus-gaap:MediumTermNotesMember2023-10-302024-01-280000027673us-gaap:UnfundedLoanCommitmentMember2023-10-302024-01-280000027673us-gaap:UnfundedLoanCommitmentMember2022-10-312023-01-290000027673us-gaap:AgriculturalSectorMemberus-gaap:CommercialPortfolioSegmentMemberus-gaap:FinancialAssetPastDueMember2024-01-280000027673us-gaap:AgriculturalSectorMemberus-gaap:CommercialPortfolioSegmentMemberus-gaap:FinancialAssetPastDueMember2023-01-290000027673us-gaap:ConstructionSectorMemberus-gaap:ConsumerPortfolioSegmentMemberus-gaap:FinancingReceivablesEqualToGreaterThan90DaysPastDueMember2023-10-290000027673us-gaap:ConstructionSectorMemberus-gaap:ConsumerPortfolioSegmentMemberus-gaap:FinancingReceivablesEqualToGreaterThan90DaysPastDueMember2023-01-290000027673us-gaap:ConstructionSectorMemberus-gaap:PerformingFinancingReceivableMemberus-gaap:ConsumerPortfolioSegmentMember2024-01-280000027673us-gaap:ConstructionSectorMemberus-gaap:PerformingFinancingReceivableMemberus-gaap:CommercialPortfolioSegmentMember2024-01-280000027673us-gaap:ConstructionSectorMemberus-gaap:NonperformingFinancingReceivableMemberus-gaap:ConsumerPortfolioSegmentMember2024-01-280000027673us-gaap:ConstructionSectorMemberus-gaap:ConsumerPortfolioSegmentMemberus-gaap:FinancingReceivablesEqualToGreaterThan90DaysPastDueMember2024-01-280000027673us-gaap:ConstructionSectorMemberus-gaap:ConsumerPortfolioSegmentMemberus-gaap:FinancingReceivables60To89DaysPastDueMember2024-01-280000027673us-gaap:ConstructionSectorMemberus-gaap:ConsumerPortfolioSegmentMemberus-gaap:FinancingReceivables30To59DaysPastDueMember2024-01-280000027673us-gaap:AgriculturalSectorMemberus-gaap:PerformingFinancingReceivableMemberus-gaap:ConsumerPortfolioSegmentMember2024-01-280000027673us-gaap:AgriculturalSectorMemberus-gaap:PerformingFinancingReceivableMemberus-gaap:CommercialPortfolioSegmentMember2024-01-280000027673us-gaap:AgriculturalSectorMemberus-gaap:NonperformingFinancingReceivableMemberus-gaap:ConsumerPortfolioSegmentMember2024-01-280000027673us-gaap:AgriculturalSectorMemberus-gaap:ConsumerPortfolioSegmentMemberus-gaap:FinancingReceivablesEqualToGreaterThan90DaysPastDueMember2024-01-280000027673us-gaap:AgriculturalSectorMemberus-gaap:ConsumerPortfolioSegmentMemberus-gaap:FinancingReceivables60To89DaysPastDueMember2024-01-280000027673us-gaap:AgriculturalSectorMemberus-gaap:ConsumerPortfolioSegmentMemberus-gaap:FinancingReceivables30To59DaysPastDueMember2024-01-280000027673us-gaap:ConsumerPortfolioSegmentMember2024-01-280000027673us-gaap:ConstructionSectorMemberus-gaap:PerformingFinancingReceivableMemberus-gaap:ConsumerPortfolioSegmentMember2023-10-290000027673us-gaap:ConstructionSectorMemberus-gaap:PerformingFinancingReceivableMemberus-gaap:CommercialPortfolioSegmentMember2023-10-290000027673us-gaap:ConstructionSectorMemberus-gaap:NonperformingFinancingReceivableMemberus-gaap:ConsumerPortfolioSegmentMember2023-10-290000027673us-gaap:ConstructionSectorMemberus-gaap:ConsumerPortfolioSegmentMemberus-gaap:FinancingReceivables60To89DaysPastDueMember2023-10-290000027673us-gaap:ConstructionSectorMemberus-gaap:ConsumerPortfolioSegmentMemberus-gaap:FinancingReceivables30To59DaysPastDueMember2023-10-290000027673us-gaap:AgriculturalSectorMemberus-gaap:PerformingFinancingReceivableMemberus-gaap:ConsumerPortfolioSegmentMember2023-10-290000027673us-gaap:AgriculturalSectorMemberus-gaap:PerformingFinancingReceivableMemberus-gaap:CommercialPortfolioSegmentMember2023-10-290000027673us-gaap:AgriculturalSectorMemberus-gaap:NonperformingFinancingReceivableMemberus-gaap:ConsumerPortfolioSegmentMember2023-10-290000027673us-gaap:AgriculturalSectorMemberus-gaap:ConsumerPortfolioSegmentMemberus-gaap:FinancingReceivablesEqualToGreaterThan90DaysPastDueMember2023-10-290000027673us-gaap:AgriculturalSectorMemberus-gaap:ConsumerPortfolioSegmentMemberus-gaap:FinancingReceivables60To89DaysPastDueMember2023-10-290000027673us-gaap:AgriculturalSectorMemberus-gaap:ConsumerPortfolioSegmentMemberus-gaap:FinancingReceivables30To59DaysPastDueMember2023-10-290000027673us-gaap:ConsumerPortfolioSegmentMember2023-10-290000027673us-gaap:ConstructionSectorMemberus-gaap:PerformingFinancingReceivableMemberus-gaap:ConsumerPortfolioSegmentMember2023-01-290000027673us-gaap:ConstructionSectorMemberus-gaap:PerformingFinancingReceivableMemberus-gaap:CommercialPortfolioSegmentMember2023-01-290000027673us-gaap:ConstructionSectorMemberus-gaap:NonperformingFinancingReceivableMemberus-gaap:ConsumerPortfolioSegmentMember2023-01-290000027673us-gaap:ConstructionSectorMemberus-gaap:ConsumerPortfolioSegmentMemberus-gaap:FinancingReceivables60To89DaysPastDueMember2023-01-290000027673us-gaap:ConstructionSectorMemberus-gaap:ConsumerPortfolioSegmentMemberus-gaap:FinancingReceivables30To59DaysPastDueMember2023-01-290000027673us-gaap:AgriculturalSectorMemberus-gaap:PerformingFinancingReceivableMemberus-gaap:ConsumerPortfolioSegmentMember2023-01-290000027673us-gaap:AgriculturalSectorMemberus-gaap:PerformingFinancingReceivableMemberus-gaap:CommercialPortfolioSegmentMember2023-01-290000027673us-gaap:AgriculturalSectorMemberus-gaap:NonperformingFinancingReceivableMemberus-gaap:ConsumerPortfolioSegmentMember2023-01-290000027673us-gaap:AgriculturalSectorMemberus-gaap:ConsumerPortfolioSegmentMemberus-gaap:FinancingReceivablesEqualToGreaterThan90DaysPastDueMember2023-01-290000027673us-gaap:AgriculturalSectorMemberus-gaap:ConsumerPortfolioSegmentMemberus-gaap:FinancingReceivables60To89DaysPastDueMember2023-01-290000027673us-gaap:AgriculturalSectorMemberus-gaap:ConsumerPortfolioSegmentMemberus-gaap:FinancingReceivables30To59DaysPastDueMember2023-01-290000027673us-gaap:ConsumerPortfolioSegmentMember2023-01-290000027673us-gaap:PerformingFinancingReceivableMember2023-10-302024-01-280000027673us-gaap:FinancingReceivables30To59DaysPastDueMember2023-10-302024-01-280000027673us-gaap:ConstructionSectorMemberus-gaap:ConsumerPortfolioSegmentMember2023-10-302024-01-280000027673us-gaap:AgriculturalSectorMemberus-gaap:ConsumerPortfolioSegmentMember2023-10-302024-01-280000027673us-gaap:ConsumerPortfolioSegmentMember2023-10-302024-01-280000027673jdcc:RetailRevolvingChargeAccountsPortfolioSegmentMember2023-10-302024-01-280000027673jdcc:RetailNotesAndFinanceLeasesPortfolioSegmentMember2023-10-302024-01-280000027673jdcc:RetailRevolvingChargeAccountsPortfolioSegmentMember2022-10-312023-01-290000027673us-gaap:CommercialPortfolioSegmentMember2023-10-302024-01-280000027673us-gaap:CommercialPortfolioSegmentMember2022-10-312023-01-290000027673jdcc:RetailNotesAndFinanceLeasesPortfolioSegmentMember2022-10-312023-01-2900000276732022-10-312023-01-290000027673us-gaap:CommercialPortfolioSegmentMember2024-01-280000027673jdcc:RetailRevolvingChargeAccountsPortfolioSegmentMember2024-01-280000027673jdcc:RetailNotesAndFinanceLeasesPortfolioSegmentMember2024-01-280000027673us-gaap:CommercialPortfolioSegmentMember2023-10-290000027673jdcc:RetailRevolvingChargeAccountsPortfolioSegmentMember2023-10-290000027673jdcc:RetailNotesAndFinanceLeasesPortfolioSegmentMember2023-10-290000027673us-gaap:CommercialPortfolioSegmentMember2023-01-290000027673jdcc:RetailRevolvingChargeAccountsPortfolioSegmentMember2023-01-290000027673jdcc:RetailNotesAndFinanceLeasesPortfolioSegmentMember2023-01-290000027673us-gaap:CommercialPortfolioSegmentMember2022-10-300000027673jdcc:RetailRevolvingChargeAccountsPortfolioSegmentMember2022-10-300000027673jdcc:RetailNotesAndFinanceLeasesPortfolioSegmentMember2022-10-3000000276732022-10-300000027673us-gaap:NonperformingFinancingReceivableMember2023-10-302024-01-280000027673us-gaap:NonperformingFinancingReceivableMember2022-10-312023-01-2900000276732024-01-2800000276732023-10-2900000276732023-01-2900000276732024-02-2900000276732023-10-302024-01-28xbrli:sharesiso4217:USDjdcc:itemxbrli:pure

UNITED STATES

SECURITIES AND EXCHANGE COMMISSION

WASHINGTON, D.C. 20549

FORM 10-Q

(Mark One)

QUARTERLY REPORT PURSUANT TO SECTION 13 OR 15(d) OF THE SECURITIES EXCHANGE ACT OF 1934

For the quarterly period ended January 28, 2024

or

TRANSITION REPORT PURSUANT TO SECTION 13 OR 15(d) OF THE SECURITIES EXCHANGE ACT OF 1934

For the transition period from ____ to ____

Commission file no: 1-6458

JOHN DEERE CAPITAL CORPORATION

(Exact name of registrant as specified in its charter)

Delaware
(State of Incorporation)

36-2386361
(IRS Employer Identification No.)

P.O. Box 5328
Madison, Wisconsin 53705-0328
(Address of principal executive offices)

Telephone Number: (800) 438-7394

Securities Registered Pursuant to Section 12(b) of the Act:

Title of each class

Trading symbol

Name of each exchange on which registered

2.00% Senior Notes Due 2031

JDCC 31

New York Stock Exchange

Indicate by check mark whether the registrant: (1) has filed all reports required to be filed by Section 13 or 15(d) of the Securities Exchange Act of 1934 during the preceding 12 months (or for such shorter period that the registrant was required to file such reports), and (2) has been subject to such filing requirements for the past 90 days.

Yes No

Indicate by check mark whether the registrant has submitted electronically every Interactive Data File required to be submitted pursuant to Rule 405 of Regulation S-T (§232.405 of this chapter) during the preceding 12 months (or for such shorter period that the registrant was required to submit such files).

Yes No

Indicate by check mark whether the registrant is a large accelerated filer, an accelerated filer, a non-accelerated filer, a smaller reporting company, or an emerging growth company. See the definitions of “large accelerated filer,” “accelerated filer,” “smaller reporting company,” and “emerging growth company” in Rule 12b-2 of the Exchange Act.

Large accelerated filer

Accelerated filer

Non-accelerated filer

Smaller reporting company

Emerging growth company

If an emerging growth company, indicate by check mark if the registrant has elected not to use the extended transition period for complying with any new or revised financial accounting standards provided pursuant to Section 13(a) of the Exchange Act.

Indicate by check mark whether the registrant is a shell company (as defined in Rule 12b-2 of the Exchange Act). Yes   No

At February 29, 2024, 2,500 shares of common stock, without par value, of the registrant were outstanding, all of which were owned by John Deere Financial Services, Inc., a wholly-owned subsidiary of Deere & Company.

The registrant meets the conditions set forth in General Instruction H(1)(a) and (b) of Form 10-Q and is therefore filing this Form with certain reduced disclosures as permitted by those instructions.

PART I. FINANCIAL INFORMATION

Item 1.     Financial Statements.

John Deere Capital Corporation and Subsidiaries

Statements of Consolidated Income

(Unaudited)

(in millions)

Three Months Ended 

January 28

January 29


2024


2023

Revenues

Finance income earned on retail notes

$

452.3

$

330.0

Lease revenues


264.8


242.5

Revolving charge account income


105.2


82.9

Finance income earned on wholesale receivables


271.1


151.5

Other income


67.1


29.6

Total revenues


1,160.5


836.5

Expenses

Interest expense


571.4

301.0

Operating expenses:

Depreciation of equipment on operating leases


167.2

164.5

Administrative and operating expenses


132.2

136.7

Fees and interest paid to John Deere


57.1

57.6

Provision for credit losses

21.0


3.5

Total operating expenses


377.5


362.3

Total expenses


948.9


663.3

Income of Consolidated Group before Income Taxes


211.6


173.2

Provision for income taxes


38.9

36.8

Income of Consolidated Group


172.7


136.4

Equity in income of unconsolidated affiliate


1.3

1.0

Net Income


174.0


137.4

Less: Net loss attributable to noncontrolling interests

(.5)

(.2)

Net Income Attributable to the Company

$

174.5

$

137.6

See Condensed Notes to Interim Consolidated Financial Statements.

2

John Deere Capital Corporation and Subsidiaries

Statements of Consolidated Comprehensive Income

(Unaudited)

(in millions)

Three Months Ended 

January 28

January 29


2024


2023

Net Income

$

174.0

$

137.4

Other Comprehensive Income (Loss), Net of Income Taxes

Cumulative translation adjustment

26.8

66.2

Unrealized loss on derivatives

(15.6)

(14.3)

Unrealized gain on debt securities

.6

.4

Other Comprehensive Income (Loss), Net of Income Taxes


11.8


52.3

Comprehensive Income of Consolidated Group


185.8


189.7

Less: Comprehensive loss attributable to noncontrolling interests

(.5)

(.2)

Comprehensive Income Attributable to the Company

$

186.3

$

189.9

See Condensed Notes to Interim Consolidated Financial Statements.

3

John Deere Capital Corporation and Subsidiaries

Consolidated Balance Sheets

(Unaudited)

(in millions)

January 28

October 29

January 29

2024

2023

2023

Assets


Cash and cash equivalents

$

1,520.1

$

1,487.5

$

1,055.0

Marketable securities

2.3

1.4

1.8

Receivables:

Retail notes


25,716.4


24,641.1


23,875.5

Retail notes securitized


6,417.7


7,356.8


5,101.4

Revolving charge accounts


2,925.5


4,594.4


2,834.0

Wholesale receivables


14,542.8


13,330.1


9,752.1

Financing leases


1,251.0


1,421.8


1,030.8

Total receivables


50,853.4


51,344.2


42,593.8

Allowance for credit losses


(139.6)


(146.4)


(121.7)

Total receivables – net


50,713.8


51,197.8


42,472.1

Other receivables


163.1


162.0


108.2

Receivables from John Deere


146.6


144.4


171.2

Equipment on operating leases – net


4,933.4


5,051.5


4,693.4

Notes receivable from John Deere

663.7

650.7

494.4

Investment in unconsolidated affiliate


29.6


27.6


25.8

Deferred income taxes


24.1


24.6


26.9

Other assets


387.6


367.5


298.4

Total Assets

$

58,584.3

$

59,115.0

$

49,347.2

Liabilities and Stockholder’s Equity

Short-term external borrowings:

Commercial paper and other notes payable

$

6,416.4

$

6,836.1

$

3,637.8

Securitization borrowings


6,116.1


6,995.2


4,863.9

Current maturities of long-term external borrowings


5,705.1


6,059.9


6,080.1

Total short-term external borrowings


18,237.6


19,891.2


14,581.8

Notes payable to John Deere


3,512.5


3,184.0


4,416.2

Other payables to John Deere


596.7


974.9


664.2

Accounts payable and accrued expenses


1,082.5


1,128.3


996.4

Deposits held from dealers and merchants


129.3


138.4


127.8

Deferred income taxes


431.9


456.3


192.2

Long-term external borrowings


28,720.4


27,439.3


23,493.4

Total liabilities


52,710.9


53,212.4


44,472.0

Commitments and contingencies (Note 9)

Stockholder’s equity:

Common stock, without par value (issued and outstanding –
2,500 shares owned by John Deere Financial Services, Inc.)


2,292.8


2,292.8


1,482.8

Retained earnings


3,672.7


3,713.2


3,443.5

Accumulated other comprehensive loss


(92.6)


(104.4)


(52.4)

Total Company stockholder’s equity


5,872.9


5,901.6


4,873.9

Noncontrolling interests


.5


1.0


1.3

Total stockholder’s equity


5,873.4


5,902.6


4,875.2

Total Liabilities and Stockholder’s Equity

$

58,584.3

$

59,115.0

$

49,347.2

See Condensed Notes to Interim Consolidated Financial Statements.

4

John Deere Capital Corporation and Subsidiaries

Statements of Consolidated Cash Flows

(Unaudited)

(in millions)


Three Months Ended 

January 28

January 29


2024


2023

Cash Flows from Operating Activities:

Net income

$

174.0

$

137.4

Adjustments to reconcile net income to net cash

provided by operating activities:

Provision for credit losses


21.0

3.5

Provision for depreciation and amortization


173.0

170.1

Credit for deferred income taxes


(20.1)

(14.0)

Change in accounts payable and accrued expenses


(45.3)

40.9

Change in accrued income taxes payable/receivable


35.6

10.0

Other


71.4

(9.2)

Net cash provided by operating activities


409.6


338.7

Cash Flows from Investing Activities:

Cost of receivables acquired (excluding wholesale)


(5,863.0)

(5,686.3)

Collections of receivables (excluding wholesale)


7,447.7

6,902.4

Increase in wholesale receivables – net


(1,100.8)

(1,148.5)

Cost of equipment on operating leases acquired


(361.4)

(375.3)

Proceeds from sales of equipment on operating leases


319.2

386.2

Cost of notes receivable acquired from John Deere

(8.3)

(120.8)

Collections of notes receivable from John Deere

4.4

2.2

Other


(8.4)

(12.9)

Net cash provided by (used for) investing activities


429.4


(53.0)

Cash Flows from Financing Activities:

Increase (decrease) in commercial paper and other notes payable – net (original maturities
of three months or less)


(1,688.2)

1,223.2

Decrease in securitization borrowings – net


(881.5)

(849.3)

Increase (decrease) in short-term borrowings with John Deere – net


311.2

(964.7)

Proceeds from external borrowings issued (original maturities greater than three months)


4,831.4

2,298.9

Payments of external borrowings (original maturities greater than three months)


(3,160.4)

(1,618.5)

Dividends paid


(215.0)

Debt issuance costs


(8.1)

(8.6)

Net cash provided by (used for) financing activities


(810.6)


81.0

Effect of Exchange Rate Changes on Cash, Cash Equivalents, and Restricted Cash


1.5

13.1

Net Increase in Cash, Cash Equivalents, and Restricted Cash


29.9


379.8

Cash, Cash Equivalents, and Restricted Cash at Beginning of Period


1,612.9


766.1

Cash, Cash Equivalents, and Restricted Cash at End of Period

$

1,642.8

$

1,145.9

Components of Cash, Cash Equivalents, and Restricted Cash:

Cash and cash equivalents

$

1,520.1

$

1,055.0

Restricted cash*

122.7

90.9

Total Cash, Cash Equivalents, and Restricted Cash

$

1,642.8

$

1,145.9

* Restricted cash is reported in other assets on the consolidated balance sheets and primarily relates to the securitization of receivables (see Note 5).

See Condensed Notes to Interim Consolidated Financial Statements.

5

John Deere Capital Corporation and Subsidiaries

Statements of Changes in Consolidated Stockholder’s Equity

For the Three Months Ended January 28, 2024 and January 29, 2023

(Unaudited)

(in millions)

Company Stockholder

Accumulated

Total

Other

Stockholder’s

Common

Retained

Comprehensive

Noncontrolling

Equity

Stock

Earnings

Income (Loss)

Interests


Balance October 30, 2022

$

4,685.5

$

1,482.8

$

3,305.9

$

(104.7)

$

1.5

Net income (loss)


137.4


137.6

(.2)

Other comprehensive income


52.3

52.3

Balance January 29, 2023

$

4,875.2

$

1,482.8

$

3,443.5

$

(52.4)

$

1.3

Balance October 29, 2023

$

5,902.6

$

2,292.8

$

3,713.2

$

(104.4)

$

1.0

Net income (loss)


174.0


174.5

(.5)

Other comprehensive income


11.8

11.8

Dividends declared


(215.0)

(215.0)

Balance January 28, 2024

$

5,873.4

$

2,292.8

$

3,672.7

$

(92.6)

$

.5

See Condensed Notes to Interim Consolidated Financial Statements.

6

John Deere Capital Corporation and Subsidiaries

Condensed Notes to Interim Consolidated Financial Statements

(Unaudited)

(1) Organization and Consolidation

References to John Deere Capital Corporation (Capital Corporation), “the Company,” “we,” “us,” or “our” include our consolidated subsidiaries. John Deere Financial Services, Inc., a wholly-owned finance holding subsidiary of Deere & Company, owns all of the outstanding common stock of Capital Corporation. We provide and administer financing for retail purchases of new equipment manufactured by Deere & Company’s production and precision agriculture operations, small agriculture and turf operations, and construction and forestry operations and used equipment taken in trade for this equipment. References to “agriculture and turf” include both production and precision agriculture and small agriculture and turf. We generally purchase retail installment sales and loan contracts (retail notes) from Deere & Company and its wholly-owned subsidiaries (collectively called John Deere). John Deere generally acquires these retail notes through independent John Deere retail dealers. We also purchase and finance a limited amount of non-John Deere retail notes. In addition, we finance and service revolving charge accounts, in most cases acquired from and offered through merchants and dealers in the agriculture and turf and construction and forestry markets (revolving charge accounts). We also provide wholesale financing to dealers of John Deere agriculture and turf equipment and construction and forestry equipment, primarily to finance inventories of equipment for those dealers (wholesale receivables). Further, we lease John Deere equipment and a limited amount of non-John Deere equipment to retail customers (financing and operating leases). We also offer credit enhanced international export financing to select customers and dealers, which primarily involves John Deere products. Retail notes, revolving charge accounts, and financing leases are collectively called “Customer Receivables.” Customer Receivables and wholesale receivables are collectively called “Receivables.” Receivables and equipment on operating leases are collectively called “Receivables and Leases.” We secure our Receivables, other than certain revolving charge accounts, by retaining as collateral security in the goods associated with those Receivables or with the use of other collateral.

We use a 52/53 week fiscal year with quarters ending on the last Sunday in the reporting period. The first quarter ends for fiscal years 2024 and 2023 were January 28, 2024 and January 29, 2023, respectively. Both periods contained 13 weeks. Unless otherwise stated, references to particular years, quarters, or months refer to our fiscal years generally ending in October and the associated periods in those fiscal years.

We are the primary beneficiary of and consolidate certain variable interest entities that are special purpose entities (SPEs) related to the securitization of receivables. See Note 5 for more information on these SPEs.

Presentation of Amounts

All amounts are presented in millions of dollars, unless otherwise specified.

Immaterial Restatement of Prior Period Financial Statements

In the second quarter of 2023, we corrected the accounting treatment for financing incentives offered to John Deere dealers, which impacted the timing of expense recognition and the presentation of incentive costs in the consolidated financial statements. Refer to Note 2 for further information regarding the new and previous accounting treatment. The impact of the correction in periods prior to the second quarter ended April 30, 2023 was not material to the consolidated financial statements in any of the impacted periods; however, the aggregate impact of correcting prior periods within the second quarter ended April 30, 2023 would have been material to our 2023 consolidated financial results. Consequently, we made these immaterial corrections in the comparative prior periods. Refer to Note 12 for quantification of the prior period restatement impacts. Additionally, comparative prior period amounts in the applicable notes to the consolidated financial statements have been restated.

(2) Summary of Significant Accounting Policies and New Accounting Standards

Financing Incentives

In the second quarter of 2023, we corrected our accounting policy for financing incentives offered to John Deere dealers, as described below.

We provide incentive funds to John Deere dealers that meet certain performance metrics, which include minimum finance volume and finance market share with us over a defined period. At the end of the qualification period, dealers are granted incentive funds, which can be used for certain predefined uses, including interest rate reductions on future loan and lease

7

originations. In addition, certain dealers may elect to receive cash for a portion of their earned funds. We accrue for the incentive costs over the qualification period, which are reported as “Administrative and operating expenses” in the consolidated income statements and “Accounts payable and accrued expenses” in the consolidated balance sheets. The accrued liability is released as dealers utilize the funds.

Under the previous accounting treatment, we amortized the non-cash portion of the incentive program costs as a reduction to finance income or lease revenue after the dealers designated the use of the incentive award. There was no change to the accounting treatment for the cash portion of the incentive program costs, which continues to be accrued over the qualification period.

Quarterly Financial Statements

We have prepared our interim consolidated financial statements, without audit, pursuant to the rules and regulations of the U.S. Securities and Exchange Commission (SEC). Certain information and footnote disclosures normally included in annual financial statements prepared in accordance with accounting principles generally accepted in the U.S. have been condensed or omitted as permitted by such rules and regulations. All normal recurring adjustments have been included. Management believes the disclosures are adequate to present fairly the financial position, results of operations, and cash flows at the dates and for the periods presented. It is suggested these interim consolidated financial statements be read in conjunction with the consolidated financial statements and the notes thereto appearing in our latest Annual Report on Form 10-K. Results for interim periods are not necessarily indicative of those to be expected for the fiscal year.

Use of Estimates in Financial Statements

Certain accounting policies require management to make estimates and assumptions in determining the amounts reflected in the financial statements and related disclosures. Actual results could differ from those estimates.

New Accounting Standards

We closely monitor all Accounting Standard Updates (ASUs) issued by the Financial Accounting Standards Board (FASB) and other authoritative guidance.

Accounting Standards Adopted

In the first quarter of 2024, we adopted ASU No. 2022-02, Financial Instruments – Credit Losses (Topic 326): Troubled Debt Restructurings and Vintage Disclosures. The ASU eliminates the accounting guidance for troubled debt restructurings, enhances disclosures for certain receivable modifications related to borrowers experiencing financial difficulty, and requires disclosure of current period gross write-offs by year of origination. The adoption did not have a material effect on our consolidated financial statements.

We also adopted the following standards in 2024, none of which had a material effect on our consolidated financial statements.  

2022-01 — Derivatives and Hedging (Topic 815): Fair Value Hedging – Portfolio Layer Method

2021-08 — Business Combinations (Topic 805): Accounting for Contract Assets and Contract Liabilities from Contracts with Customers

Accounting Standards to be Adopted

In December 2023, the FASB issued ASU 2023-09, Income Taxes (Topic 740): Improvements to Income Tax Disclosures, which expands disclosures in an entity’s income tax rate reconciliation table and cash taxes paid both in the U.S. and foreign jurisdictions. The effective date of the ASU is fiscal year 2026. We are assessing the effect of this update on our related disclosures.

We will also adopt the following standards in future periods, none of which are expected to have a material effect on our consolidated financial statements.

2023-07 — Segment Reporting (Topic 280): Improvements to Reportable Segment Disclosures

2023-06 — Disclosure Improvements: Codification Amendments in Response to the SEC’s Disclosure Update and Simplification Initiative

2023-05 — Business Combinations—Joint Venture Formations (Subtopic 805-60): Recognition and Initial Measurement

8

(3) Other Comprehensive Income Items

The after-tax components of accumulated other comprehensive income (loss) were as follows:

January 28

October 29

January 29

2024

2023

2023

Cumulative translation adjustment

$

(110.0)

$

(136.8)

$

(102.8)

Unrealized gain on derivatives

19.2

34.8

52.5

Unrealized loss on debt securities

(1.8)

(2.4)

(2.1)

Total accumulated other comprehensive income (loss)

$

(92.6)

$

(104.4)

$

(52.4)

The following tables reflect amounts recorded in other comprehensive income (loss), as well as reclassifications out of other comprehensive income (loss).

Before

Tax

After

Tax

(Expense)

Tax

Amount

Credit

Amount

Three Months Ended January 28, 2024

Cumulative translation adjustment

$

26.8

$

26.8

Unrealized gain (loss) on derivatives:

Unrealized hedging gain (loss)


(7.8)

$

1.6


(6.2)

Reclassification of realized (gain) loss to:

Interest rate contracts – Interest expense


(11.9)

2.5

(9.4)

Net unrealized gain (loss) on derivatives


(19.7)


4.1


(15.6)

Unrealized gain (loss) on debt securities:

Unrealized holding gain (loss)

.8

(.2)

.6

Total other comprehensive income (loss)

$

7.9

$

3.9

$

11.8

Three Months Ended January 29, 2023

Cumulative translation adjustment

$

66.2

$

66.2

Unrealized gain (loss) on derivatives:

Unrealized hedging gain (loss)


(1.9)

$

.4


(1.5)

Reclassification of realized (gain) loss to:

Interest rate contracts – Interest expense


(16.3)

3.5


(12.8)

Net unrealized gain (loss) on derivatives


(18.2)


3.9


(14.3)

Unrealized gain (loss) on debt securities:

Unrealized holding gain (loss)

.7

(.3)

.4

Total other comprehensive income (loss)

$

48.7

$

3.6

$

52.3

(4) Receivables

Credit Quality

We monitor the credit quality of Receivables based on delinquency status, defined as follows:

Past due balances represent Receivables still accruing finance income with any payments 30 days or more past the contractual payment due date.
Non-performing Receivables represent Receivables for which we have stopped accruing finance income, which generally occurs when Customer Receivables are 90 days delinquent and when interest-bearing wholesale receivables become 60 days delinquent. Accrued finance income and lease revenue previously recognized on non-performing Receivables is reversed and subsequently recognized on a cash basis. Accrual of finance income and lease revenue is resumed when the receivable becomes contractually current, and collections are reasonably assured.  

9

Accrued finance income and lease revenue reversed on non-performing Receivables, and finance income and lease revenue recognized from cash payments on non-performing Receivables were as follows:

Three Months Ended

January 28

January 29

2024

2023

Accrued finance income and lease revenue reversed

$

6.7

$

2.8

Finance income and lease revenue recognized on cash payments

5.9

3.1

Total Receivable balances represent principal plus accrued interest. Receivable balances are written off to the allowance for credit losses when, in the judgment of management, they are considered uncollectible. Write-offs generally occur when Customer Receivables are 120 days delinquent, and on a case-by-case basis when wholesale receivables are 60 days delinquent. In these situations, we repossess available collateral or designate the account for litigation, and the estimated uncollectible amount is written off to the allowance for credit losses.

The credit quality analysis of Customer Receivables by year of origination was as follows:

January 28, 2024

2024

2023

2022

2021

2020

Prior Years

Revolving Charge Accounts

Total

Customer Receivables:


Agriculture and turf

Current

$

2,740.5

$

11,557.0

$

6,550.6

$

3,954.2

$

1,692.4

$

667.3

$

2,719.3

$

29,881.3

30-59 days past due

4.5

105.0

58.5

40.8

18.8

10.0

69.7

307.3

60-89 days past due

.5

45.9

19.3

12.7

6.1

4.3

15.8

104.6

90+ days past due

1.1

.5

3.0

4.4

.3

9.3

Non-performing

.3

39.1

78.6

48.7

26.9

24.8

10.4

228.8

Construction and forestry

Current

677.8

2,156.0

1,400.8

716.3

216.8

94.0

101.2

5,362.9

30-59 days past due

7.2

64.9

35.5

24.1

7.8

3.3

5.3

148.1

60-89 days past due

.4

24.2

19.2

11.7

5.7

2.8

2.2

66.2

90+ days past due

.2

.2

.4

Non-performing

55.3

74.8

44.6

17.9

7.5

1.6

201.7

Total

$

3,431.2

$

14,048.5

$

8,238.0

$

4,856.1

$

1,996.8

$

814.5

2,925.5

$

36,310.6

October 29, 2023

2023

2022

2021

2020

2019

Prior Years

Revolving Charge Accounts

Total

Customer Receivables:


Agriculture and turf

Current

$

12,998.3

$

7,208.2

$

4,459.1

$

1,970.4

$

666.3

$

179.3

$

4,424.8

$

31,906.4

30-59 days past due


46.8

66.6

34.6

18.7

8.2

2.9

28.1

205.9

60-89 days past due


15.8

22.0

14.8

7.8

3.3

1.3

8.6

73.6

90+ days past due

1.4

.8

2.7

2.9

.1

.1

8.0

Non-performing

25.9

63.7

44.5

25.0

12.9

12.0

7.2

191.2

Construction and forestry

Current

2,343.4

1,586.2

859.0

279.2

65.3

27.3

118.6

5,279.0

30-59 days past due

44.4

28.1

24.8

8.6

3.4

.4

4.1

113.8

60-89 days past due

17.8

11.4

11.8

4.5

1.0

.2

1.8

48.5

90+ days past due

.1

1.2

.1

.1

1.5

Non-performing

34.1

67.5

51.2

20.7

7.5

4.0

1.2

186.2

Total

$

15,528.0

$

9,055.7

$

5,502.6

$

2,337.9

$

768.0

$

227.5

$

4,594.4

$

38,014.1

10

January 29, 2023

2023

2022

2021

2020

2019

Prior Years

Revolving Charge Accounts

Total

Customer Receivables:


Agriculture and turf

Current

$

2,452.2

$

10,749.5

$

6,302.5

$

3,104.4

$

1,289.3

$

565.0

$

2,686.3

$

27,149.2

30-59 days past due

1.7

29.4

29.2

48.2

10.4

42.8

27.2

188.9

60-89 days past due

1.3

12.2

10.5

18.0

3.7

14.1

5.9

65.7

90+ days past due

1.2

.2

2.9

1.0

.2

5.5

Non-performing

.3

35.1

43.3

29.1

15.0

19.6

7.8

150.2

Construction and forestry

Current

553.7

2,156.3

1,339.0

538.4

177.7

68.5

99.0

4,932.6

30-59 days past due

1.5

9.9

23.6

34.3

15.7

52.1

4.6

141.7

60-89 days past due

.4

4.3

15.7

17.7

6.4

23.0

2.0

69.5

90+ days past due

.1

.2

.4

.2

.9

Non-performing

38.9

51.8

26.1

13.0

6.5

1.2

137.5

Total

$

3,011.1

$

13,036.9

$

7,816.0

$

3,819.5

$

1,532.4

$

791.8

$

2,834.0

$

32,841.7

The credit quality analysis of wholesale receivables by year of origination was as follows:

January 28, 2024

2024

2023

2022

2021

2020

Prior Years

Revolving

Total

Wholesale receivables:

Agriculture and turf

Current

$

199.8

$

450.3

$

67.6

$

4.8

$

2.6

$

1.3

$

10,198.5

$

10,924.9

30+ days past due

.6

61.3

61.9

Non-performing

5.8

5.8

Construction and forestry

Current

5.6

10.7

2.2

19.3

.1

.1

3,495.5

3,533.5

30+ days past due

16.7

16.7

Non-performing

Total

$

205.4

$

461.6

$

69.8

$

24.1

$

2.7

$

1.4

$

13,777.8

$

14,542.8

October 29, 2023

2023

2022

2021

2020

2019

Prior Years

Revolving

Total

Wholesale receivables:

Agriculture and turf

Current

$

609.5

$

92.6

$

20.0

$

3.9

$

.7

$

159.9

$

9,270.1

$

10,156.7

30+ days past due

45.8

45.8

Non-performing

5.7

5.7

Construction and forestry

Current

19.4

2.5

19.9

.2

.1

75.2

2,987.6

3,104.9

30+ days past due

17.0

17.0

Non-performing

Total

$

628.9

$

95.1

$

39.9

$

4.1

$

.8

$

235.1

$

12,326.2

$

13,330.1

11

January 29, 2023

2023

2022

2021

2020

2019

Prior Years

Revolving

Total

Wholesale receivables:

Agriculture and turf

Current

$

114.6

$

283.2

$

45.7

$

20.2

$

3.7

$

1.2

$

7,349.9

$

7,818.5

30+ days past due

.3

9.2

9.5

Non-performing

5.9

5.9

Construction and forestry

Current

5.8

3.8

23.7

1.0

.3

.1

1,875.8

1,910.5

30+ days past due

7.7

7.7

Non-performing

Total

$

120.4

$

287.3

$

69.4

$

21.2

$

4.0

$

1.3

$

9,248.5

$

9,752.1

Allowance for Credit Losses

The allowance for credit losses is an estimate of the credit losses expected over the life of our Receivable portfolio. Non-performing Receivables are included in the estimate of expected credit losses. The allowance is measured on a collective basis for receivables with similar risk characteristics. Receivables that do not share risk characteristics are evaluated on an individual basis. Risk characteristics include:

product category,
market,
geography,
credit risk, and
remaining balance.

Recoveries from freestanding credit enhancements, such as dealer deposits, and certain credit insurance contracts are not included in the estimate of expected credit losses. Recoveries from dealer deposits are recognized in “Other income” when the dealer’s deposit account is charged. During the three months ended January 28, 2024 and January 29, 2023, recoveries from freestanding credit enhancements recorded in other income were $7.3 and $2.0, respectively.

An analysis of the allowance for credit losses and investment in Receivables was as follows:

Three Months Ended January 28, 2024

Retail Notes

Revolving

& Financing

Charge

Wholesale

Total

Leases

Accounts

Receivables

Receivables

Allowance:

Beginning of period balance

$

114.9

$

20.4

$

11.1

$

146.4

Provision (credit) for credit losses*


22.8

(2.0)

(.4)

20.4

Write-offs


(24.3)

(10.7)

(35.0)

Recoveries


1.7

7.6

9.3

Translation adjustments


(1.5)

(1.5)

End of period balance

$

115.1

$

15.3

$

9.2

$

139.6

Receivables:

End of period balance

$

33,385.1

$

2,925.5

$

14,542.8

$

50,853.4

12

Three Months Ended January 29, 2023

Retail Notes

Revolving

& Financing

Charge

Wholesale

Total

Leases

Accounts

Receivables

Receivables

Allowance:

Beginning of period balance

$

95.4

$

21.9

$

11.1

$

128.4

Provision (credit) for credit losses*


6.8

(3.7)

(.5)

2.6

Write-offs


(10.2)

(7.5)

(.1)

(17.8)

Recoveries


2.4

5.3

.6

8.3

Translation adjustments


.4

(.2)

.2

End of period balance

$

94.8

$

16.0

$

10.9

$

121.7

Receivables:

End of period balance

$

30,007.7

$

2,834.0

$

9,752.1

$

42,593.8

* Excludes provision for credit losses on unfunded commitments of $.6 and $.9 for the three months ended January 28, 2024 and January 29, 2023, respectively. The estimated credit losses related to unfunded commitments are recorded in “Accounts payable and accrued expenses.”

The allowance for credit losses decreased slightly in the first three months of 2024, primarily due to a seasonal decline in the revolving charge account portfolio. We continue to monitor the economy as part of the allowance setting process, including potential impacts of inflation and interest rates, among other factors, and qualitative adjustments to the allowance are incorporated as necessary.

Write-offs by year of origination were as follows:

Three Months Ended January 28, 2024

2024

2023

2022

2021

2020

Prior Years

Revolving

Total

Customer Receivables:

Agriculture and turf

$

1.5

$

2.9

$

1.8

$

3.6

$

.6

$

8.8

$

19.2

Construction and forestry

$

.2

5.5

4.5

2.2

.8

.7

1.9

15.8

Total

$

.2

$

7.0

$

7.4

$

4.0

$

4.4

$

1.3

$

10.7

$

35.0

Modifications

We occasionally grant contractual modifications to customers experiencing financial difficulties. Before offering a modification, we evaluate the ability of the customer to meet the modified payment terms. Modifications offered include payment deferrals, term extensions, or a combination thereof. Finance charges continue to accrue during the deferral or extension period. Our allowance for credit losses incorporates historical loss information, including the effects of loan modifications with customers. Therefore, additional adjustments to the allowance are generally not recorded upon modification of a loan.

The ending amortized cost of loans modified with borrowers experiencing financial difficulty during the three months ended January 28, 2024 was $9.3, of which $8.6 was current, $.1 was 30-59 days past due, and $.6 was non-performing. These modifications represented .02 percent of our Receivable portfolio at January 28, 2024.

Defaults and subsequent write-offs of loans modified in the prior twelve months were not significant during the three months ended January 28, 2024. In addition, at January 28, 2024, we had no commitments to provide additional financing to these customers.

Troubled Debt Restructuring

Prior to adopting ASU 2022-02, modifications of loans to borrowers experiencing financial difficulty were considered troubled debt restructurings when the modification resulted in a concession we would not otherwise consider. During the three months ended January 29, 2023, we identified 36 Receivable contracts, primarily retail notes, as troubled debt restructurings with aggregate balances of $1.0 pre-modification and $1.0 post-modification. During this same period, there were no significant troubled debt restructurings that subsequently defaulted and were written off.  

13

(5) Securitization of Receivables

Our funding strategy includes retail note securitizations. While these securitization programs are administered in various forms, they are accomplished in the following basic steps:

1.  We transfer retail notes into a bankruptcy-remote SPE.

2.  The SPE issues debt to investors. The debt is secured by the retail notes.

3.  Investors are paid back based on cash receipts from the retail notes.

As part of step 1, these retail notes are legally isolated from the claims of our general creditors. This ensures cash receipts from the retail notes are accessible to pay back securitization program investors. The structure of these transactions does not meet the accounting criteria for a sale of receivables. As a result, they are accounted for as a secured borrowing. The receivables and borrowings remain on our balance sheet and are separately reported as “Retail notes securitized” and “Securitization borrowings,” respectively.

The components of the securitization programs were as follows:

January 28

October 29

January 29

2024

2023

2023

Retail notes securitized

$

6,417.7

$

7,356.8

$

5,101.4

Allowance for credit losses


(17.8)


(21.4)


(12.5)

Other assets (primarily restricted cash)


139.9


152.0


97.2

Total restricted securitized assets

$

6,539.8

$

7,487.4

$

5,186.1

Securitization borrowings

$

6,116.1

$

6,995.2

$

4,863.9

Accrued interest on borrowings


10.0


12.6


5.9

Total liabilities related to restricted securitized assets

$

6,126.1

$

7,007.8

$

4,869.8

(6) Leases

We lease John Deere equipment and a limited amount of non-John Deere equipment to retail customers through sales-type, direct financing, and operating leases. Sales-type and direct financing leases are reported in “Financing leases” and operating leases are reported in “Equipment on operating leases – net.”

Lease revenues earned by us were as follows:

Three Months Ended

January 28

January 29

2024

2023

Sales-type and direct financing lease revenues

$

27.0

$

18.8

Operating lease revenues

234.2

218.9

Variable lease revenues


4.0


5.6

Total lease revenues

$

265.2

$

243.3

Variable lease revenues reported above primarily relate to separately invoiced property taxes on leased equipment in certain markets, late fees, and excess use and damage fees. Excess use and damage fees are reported in “Other income” and were $.4 and $.8 for the first quarter of 2024 and 2023, respectively.

The cost of equipment on operating leases by market was as follows:

January 28

October 29

January 29

2024

2023

2023

Agriculture and turf

$

5,198.3

$

5,265.2

$

4,893.6

Construction and forestry

1,005.7


1,042.4

1,084.9

Total

6,204.0

6,307.6

5,978.5

Accumulated depreciation


(1,270.6)

(1,256.1)

(1,285.1)

Equipment on operating leases – net

$

4,933.4

$

5,051.5

$

4,693.4

14

Total operating lease residual values at January 28, 2024, October 29, 2023, and January 29, 2023 were $3,483.7, $3,538.3, and $3,257.1, respectively. John Deere dealers generally provide a first-loss residual value guarantee on operating lease originations. Total residual value guarantees were $580.4, $566.9, and $467.1 at January 28, 2024, October 29, 2023, and January 29, 2023, respectively.

We discuss with lessees and dealers options to purchase the equipment or extend the lease prior to operating lease maturity. We remarket equipment returned to us upon termination of leases. The matured operating lease inventory balances at January 28, 2024, October 29, 2023, and January 29, 2023 were $19.7, $16.2, and $11.8, respectively. Matured operating lease inventory is reported in “Other assets.”

(7) Notes Receivable from and Payable to John Deere

We provide loans to Banco John Deere S.A.(BJD), a John Deere finance subsidiary in Brazil, which are reported in “Notes receivable from John Deere.” Balances due from BJD were as follows:

January 28

October 29

January 29

2024

2023

2023

Notes receivable from John Deere

$

663.7

$

650.7

$

494.4

The loan agreements mature over the next seven years and charge interest at competitive market rates. Interest earned from John Deere is recorded in “Other income” and was $11.5 for the first three months of 2024, compared with $6.9 for the same period last year.

We also obtain funding from affiliated companies which resulted in notes payable to John Deere as follows:

January 28

October 29

January 29

2024

2023

2023

Notes payable to John Deere

$

3,512.5

$

3,184.0

$

4,416.2

The intercompany borrowings are primarily short-term in nature or contain a due on demand call option. At January 28, 2024, $542.3 of the intercompany borrowings were long-term loans without a due on demand call option, which mature in 2025. We pay interest to John Deere for these borrowings based on competitive market rates. Interest expense paid to John Deere was $43.8 and $40.0 for the three months ended January 28, 2024 and January 29, 2023 respectively, which is recorded in “Fees and interest paid to John Deere.”

(8) Long-Term External Borrowings

Long-term external borrowings consisted of the following:

January 28

October 29

January 29

2024

2023

2023

Senior Debt:

Medium-term notes

$

28,805.4

$

27,522.8

$

23,564.2

Other notes

.5

Total senior debt

28,805.4

27,522.8

23,564.7

Unamortized debt discount and debt issuance costs

(85.0)

(83.5)

(71.3)

Total

$

28,720.4

$

27,439.3

$

23,493.4

Medium-term notes are primarily offered by prospectus and issued at fixed and variable rates. The medium-term notes in the table above include unamortized fair value adjustments related to interest rate swaps. The principal balances of the medium-term notes were $29,581.7, $28,733.5, and $24,265.7 at January 28, 2024, October 29, 2023, and January 29, 2023, respectively, and have maturity dates through 2033. All outstanding medium-term notes and other notes in the table above are senior unsecured borrowings and generally rank equally with each other.

15

(9) Commitments and Contingencies

We provide guarantees related to certain financial instruments issued by John Deere Financial Inc., a John Deere finance subsidiary in Canada. At January 28, 2024, the following notional amounts were guaranteed by us:

Medium-term notes: $3,228.2
Commercial paper: $1,975.9
Derivatives: $4,606.7, with a fair value liability of $113.2

The weighted-average interest rate on the medium-term notes at January 28, 2024 was 3.1 percent with a maximum remaining maturity of five years.

We have commitments to extend credit to customers and John Deere dealers through lines of credit and other pre-approved credit arrangements. We apply the same credit policies and approval process for these commitments to extend credit as we do for our Receivables and Leases, and generally have the right to unconditionally cancel, alter, or amend the terms at any time. Collateral is not required for these commitments, but if credit is extended, collateral may be required upon funding. A significant portion of these commitments is not expected to be fully drawn upon; therefore, the total commitment amounts likely do not represent a future cash requirement. The unused commitments at January 28, 2024 were as follows:

John Deere dealers: $7,903.6
Customers: $33,653.8, primarily related to revolving charge accounts

We have a reserve for credit losses of $2.6 on unfunded commitments that are not unconditionally cancellable at January 28, 2024, which is recorded in “Accounts payable and accrued expenses.”

At January 28, 2024, we had restricted other assets associated with borrowings related to securitizations (see Note 5). Excluding the securitization programs, the remaining balance of restricted other assets was not material as of January 28, 2024.

We are subject to various unresolved legal actions which arise in the normal course of our business, the most prevalent of which relate to retail credit matters. We believe the reasonably possible range of losses for these unresolved legal actions would not have a material effect on our consolidated financial statements.

(10) Fair Value Measurements

The fair values of financial instruments that do not approximate the carrying values were as follows:

January 28, 2024

October 29, 2023

January 29, 2023

Carrying

Fair

Carrying

Fair

Carrying

Fair

Value

Value

Value

Value

Value

Value

Receivables financed – net

$

44,313.9

$

43,978.1

$

43,862.4

$

43,168.7

$

37,383.2

$

36,668.3

Retail notes securitized – net


6,399.9


6,224.9


7,335.4


7,055.8


5,088.9


4,868.9

Securitization borrowings


6,116.1

6,103.8


6,995.2


6,921.1


4,863.9


4,784.8

Current maturities of long-term
external borrowings


5,705.1

5,610.7


6,059.9


5,953.0


6,080.1


5,957.2

Long-term external borrowings


28,720.4


28,775.5


27,439.3


27,057.7


23,493.4


23,126.2

Fair value measurements above were Level 3 for all Receivables and Level 2 for all borrowings.

Fair values of Receivables that were issued long-term were based on the discounted values of their related cash flows at interest rates currently being offered by us for similar Receivables. The fair values of the remaining Receivables approximated the carrying amounts.

Fair values of long-term external borrowings and securitization borrowings were based on current market quotes for identical or similar borrowings and credit risk, or on the discounted values of their related cash flows at current market interest rates. Certain long-term external borrowings have been swapped to current variable interest rates. The carrying values of these long-term external borrowings include adjustments related to fair value hedges.

16

Assets and liabilities measured at fair value on a recurring basis were as follows:


January 28


October 29


January 29

2024

2023

2023

Marketable securities


International debt securities

$

2.3

$

1.4

$

1.8

Receivables from John Deere

Derivatives

146.6

144.4

171.2

Other assets

Derivatives

22.2


11.3


1.2

Total assets

$

171.1

$

157.1

$

174.2

Other payables to John Deere

Derivatives

$

596.7

$

974.9

$

664.2

Accounts payable and accrued expenses

Derivatives

4.3


.5


29.1

Total liabilities

$

601.0

$

975.4

$

693.3

All fair value measurements in the table above were Level 2. Excluded from the table above were our cash equivalents, which were carried at cost that approximates fair value. The cash equivalents consist primarily of time deposits and money market funds.

The international debt securities mature over the next seven years. At January 28, 2024, the amortized cost basis and fair value of these available-for-sale debt securities were $5.1 and $2.3, respectively. Unrealized losses at January 28, 2024 were not recognized in income due to the ability and intent to hold to maturity.

There were no assets or liabilities measured at fair value on a nonrecurring basis, other than Receivables with specific allowances which were not material, during each of the periods ended January 28, 2024, October 29, 2023, and January 29, 2023.

The following is a description of the valuation methodologies we use to measure certain balance sheet items at fair value:

Marketable securities – The international debt securities are valued using quoted prices for identical assets in inactive markets.

Derivatives – Our derivative financial instruments consist of interest rate contracts (swaps and caps), foreign currency exchange contracts (forwards and swaps), and cross-currency interest rate contracts (swaps). The portfolio is valued based on an income approach (discounted cash flow) using market observable inputs, including swap curves and both forward and spot exchange rates for currencies.

Receivables – Specific reserve impairments are based on the fair value of the collateral, which is measured using a market approach (appraisal values or realizable values).

(11) Derivative Instruments

Our outstanding derivative transactions are with both unrelated external counterparties and with John Deere. For derivative transactions with John Deere, we utilize a centralized hedging structure in which John Deere enters into a derivative transaction with an unrelated external counterparty and simultaneously enters into a derivative transaction with us. Except for collateral provisions, the terms of the transaction between John Deere and us are identical to the terms of the transaction between John Deere and its unrelated external counterparty. Derivative asset and liability positions for transactions with John Deere are recorded in “Receivables from John Deere” and “Other payables to John Deere,” respectively. Derivative asset and liability positions for transactions with unrelated external counterparty banks are recorded in “Other assets” and “Accounts payable and accrued expenses,” respectively.

17

The fair values of our derivative instruments and the associated notional amounts were as follows:

January 28, 2024

October 29, 2023

January 29, 2023

Fair Value

Fair Value

Fair Value

Notional

Asset

Liability

Notional

Asset

Liability

Notional

Asset

Liability

Cash flow hedges:

Interest rate contracts - swaps

$

2,200.0

$

27.4

$

4.4

$

1,500.0

$

44.7

$

1,950.0

$

69.2

Fair value hedges:

Interest rate contracts - swaps

11,779.6

52.1

547.3

11,859.4

$

915.7

10,126.7

20.8

$

629.0

Not designated as hedging instruments:

Interest rate contracts - swaps

7,784.7

53.8

18.3

8,010.9

72.2

27.4

4,847.8

76.2

24.0

Foreign currency exchange contracts

1,814.8

22.2

4.3

1,546.5

11.3

.5

1,297.8

1.2

29.1

Cross-currency interest rate contracts

188.6

13.4

175.8

3.2

7.5

119.3

.3

6.5

Interest rate caps - sold

1,199.5

13.3

1,336.0

24.3

788.8

4.7

Interest rate caps - purchased

1,199.5

13.3

1,336.0

24.3

788.8

4.7

The amount of gain recorded in other comprehensive income (OCI) related to cash flow hedges at January 28, 2024 that is expected to be reclassified to interest expense in the next twelve months if interest rates remain unchanged is $26.2 after-tax. No gains or losses were reclassified from OCI to earnings based on the probability that the original forecasted transaction would not occur.

The amounts recorded in the consolidated balance sheets related to borrowings designated in fair value hedging relationships were as follows. Fair value hedging adjustments are included in the carrying amount of the hedged item.

Active Hedging Relationships

Discontinued Hedging Relationships

Cumulative

Carrying

Cumulative

Carrying

Fair Value

Amount of

Fair Value

Amount of

Hedging

Formerly

Hedging

January 28, 2024

Hedged Item

Adjustment

Hedged Item

Adjustment

Current maturities of long-term external borrowings

$

1,959.5

$

10.4

Long-term external borrowings

$

11,220.3

$

(506.6)

7,710.9

(269.7)

October 29, 2023

Current maturities of long-term external borrowings

$

1,814.0

$

14.9

Long-term external borrowings

$

10,883.7

$

(922.6)

7,144.1

(288.1)

January 29, 2023

Current maturities of long-term external borrowings

$

1,914.8

$

15.3

Long-term external borrowings

$

9,461.7

$

(618.6)

5,505.8

(82.9)

18

The classification and gains (losses), including accrued interest expense related to derivative instruments on the statements of consolidated income consisted of the following:

Three Months Ended


January 28

January 29


2024


2023


Fair Value Hedges

Interest rate contracts - Interest expense


$

335.7

$

235.3

Cash Flow Hedges

Recognized in OCI:

Interest rate contracts - OCI (pretax)


(7.8)

$

(1.9)

Reclassified from OCI:

Interest rate contracts - Interest expense


11.9


16.3

Not Designated as Hedges

Interest rate contracts - Interest expense *


$

(5.7)

$

(1.9)

Foreign currency exchange contracts - Administrative and operating expenses *


(103.2)

(135.1)

Total not designated

$

(108.9)

$

(137.0)

*    Includes interest and foreign currency exchange gains (losses) from cross-currency interest rate contracts.

Included in the table above are interest expense and administrative and operating expense amounts we incurred on derivatives transacted with John Deere. The amounts we recognized on these affiliated party transactions for the three months ended January 28, 2024 and January 29, 2023 were gains of $331.4 and $242.5, respectively.

None of our derivative agreements contain credit-risk-related contingent features. We have a loss sharing agreement with John Deere in which we have agreed to absorb any losses and expenses John Deere incurs if an unrelated external counterparty fails to meet its obligations on a derivative transaction that John Deere entered into to manage our exposures. The loss sharing agreement did not increase the maximum amount of loss that we would incur, after considering collateral received and netting arrangements, as of January 28, 2024, October 29, 2023, and January 29, 2023.

19

Derivatives are recorded without offsetting for netting arrangements or collateral. The impact on the derivative assets and liabilities for external derivatives and those with John Deere related to netting arrangements and any collateral received or paid were as follows:

January 28, 2024

Gross Amounts
Recognized

Netting
Arrangements

Collateral

Net
Amount

Derivatives:

Assets


External

$

22.2

$

(3.0)

$

19.2

John Deere


146.6

(101.6)


45.0

Liabilities

External


4.3


(3.0)


1.3

John Deere


596.7


(101.6)


495.1

October 29, 2023

Gross Amounts
Recognized

Netting
Arrangements

Collateral

Net
Amount

Derivatives:

Assets


External

$

11.3

$

(.1)


$

11.2

John Deere


144.4


(107.0)


37.4

Liabilities

External


.5


(.1)


.4

John Deere


974.9


(107.0)


867.9

January 29, 2023

Gross Amounts
Recognized

Netting
Arrangements

Collateral

Net
Amount

Derivatives:

Assets


External

$

1.2

$

1.2

John Deere


171.2

$

(129.1)


42.1

Liabilities

External


29.1


29.1

John Deere


664.2


(129.1)


535.1

(12) Immaterial Restatement of Prior Period Financial Statements

In the second quarter of 2023, we corrected the accounting treatment for financing incentives offered to John Deere dealers, which impacted the timing of expense recognition and the presentation of incentive costs in the consolidated financial statements. Refer to Note 1 and Note 2 for additional information. While the prior period amounts have been restated, as set forth below for comparability, the impact of the correction in periods prior to the second quarter ended April 30, 2023 was not material to our consolidated financial statements in any of the impacted periods.

20

The prior period impacts to our statement of consolidated income and the related impacts to the statement of consolidated comprehensive income were as follows:

Three Months Ended January 29, 2023

Previously

As

Reported


Adjustment


Adjusted

Revenues

Finance income earned on retail notes

$

315.9

$

14.1

$

330.0

Lease revenues

240.7

1.8

242.5

Total revenues

820.6

15.9

836.5

Expenses

Administrative and operating expenses

108.5

28.2

136.7

Total operating expenses

334.1

28.2

362.3

Total expenses

635.1

28.2

663.3

Income of Consolidated Group before Income Taxes

185.5

(12.3)

173.2

Provision for income taxes

39.6

(2.8)

36.8

Income of Consolidated Group

145.9

(9.5)

136.4

Net Income

146.9

(9.5)

137.4

Net Income Attributable to the Company

$

147.1

$

(9.5)

$

137.6

The prior period impacts to our consolidated balance sheet and the related components of stockholder’s equity were as follows:

January 29, 2023

Previously

As

Reported


Adjustment


Adjusted

Assets

Receivables:

Retail notes

$

23,937.2

$

(61.7)

$

23,875.5

Total receivables


42,655.5


(61.7)


42,593.8

Total receivables – net


42,533.8


(61.7)


42,472.1

Deferred income taxes


24.4


2.5


26.9

Total Assets

$

49,406.4

$

(59.2)

$

49,347.2

Liabilities and Stockholder’s Equity

Accounts payable and accrued expenses

$

893.4

$

103.0

$

996.4

Deferred income taxes


225.5


(33.3)


192.2

Total liabilities


44,402.3


69.7


44,472.0

Stockholder’s equity:

Retained earnings


3,572.4


(128.9)


3,443.5

Total Company stockholder’s equity


5,002.8


(128.9)


4,873.9

Total stockholder’s equity


5,004.1


(128.9)


4,875.2

Total Liabilities and Stockholder’s Equity

$

49,406.4

$

(59.2)

$

49,347.2

21

The prior period impacts to our statement of consolidated cash flows were as follows:

Three Months Ended January 29, 2023

Previously

As

Reported


Adjustment


Adjusted

Cash Flows from Operating Activities:

Net income

$

146.9

$

(9.5)

$

137.4

Adjustments to reconcile net income to net cash

provided by operating activities:

Credit for deferred income taxes

(11.3)

(2.7)

(14.0)

Change in accounts payable and accrued expenses

29.1

11.8

40.9

Other

(9.6)

.4

(9.2)

Net cash provided by operating activities

$

338.7

$

$

338.7

(13)Subsequent Event

In February 2024, we entered into a retail note securitization transaction that resulted in $529.3 of secured borrowings.

22

Item 2.   Management’s Discussion and Analysis of Financial Condition and Results of Operations.

Results of Operations

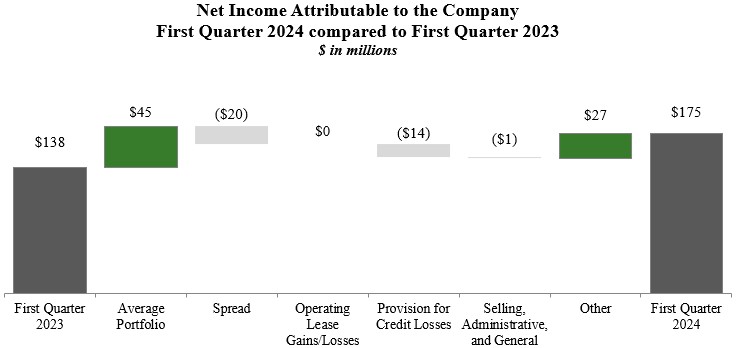
All amounts are presented in millions of dollars unless otherwise specified.

Overview

Organization

We provide financial solutions that enable John Deere customers and dealers to advance their lives and livelihoods. Through our offering of retail notes, leases, and revolving charge accounts, customers are able to finance new and used John Deere equipment, as well as parts, services, and other input costs needed to run their operations. We also provide wholesale financing to John Deere dealers.

Smart Industrial Operating Model and Leap Ambitions

John Deere announced the Smart Industrial Operating Model in 2020.  This operating model is based on three focus areas:

(a)Production systems: A strategic alignment of products and solutions around John Deere customers’ operations.

(b)Technology stack: Investments in technology, as well as research and development, that deliver intelligent solutions to John Deere customers through digital capabilities, automation, autonomy, and alternative power technologies.

(c)Lifecycle solutions: The integration of John Deere’s aftermarket and support capabilities to more effectively manage customer equipment, service, and technology needs across the full lifetime of a John Deere product.

John Deere’s Leap Ambitions were launched in 2022. These ambitions are designed to boost economic value and sustainability for John Deere’s customers. The ambitions align across the production systems of John Deere customers, seeking to optimize their operations to deliver better outcomes with fewer resources. As an enabling business, we are fully integrated with John Deere’s Smart Industrial Operating Model and are focused on providing financial solutions to help John Deere achieve its Leap Ambitions.

In January 2024, John Deere released its 2023 Business Impact Report, available at JohnDeere.com/ sustainability. This report identifies important progress on John Deere’s Leap Ambitions in fiscal year 2023. The information in John Deere’s 2023 Business Impact Report is not incorporated by reference into, and does not form a part of, this Quarterly Report on Form 10-Q.

Trends and Economic Conditions

Our volume of Receivables and Leases is largely dependent upon the level of retail sales and leases of John Deere products. The level of John Deere retail sales and leases is responsive to a variety of economic, financial, climatic, legislative, and other factors that influence supply and demand for its products.

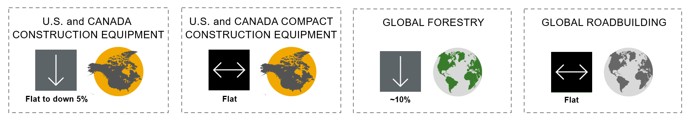
Industry Sales Outlook for Fiscal Year 2024

Agriculture and Turf

Graphic

Construction and Forestry

Graphic

23

John Deere Trends

Customers seek to improve profitability, productivity, and sustainability through technology. Integration of technology into equipment is a persistent market trend. John Deere’s Smart Industrial Operating Model and Leap Ambitions are intended to capitalize on this market trend. The technologies that are the focus of John Deere’s operating model are incorporated into products within each of John Deere’s operating segments. We expect this trend to persist for the foreseeable future.

Agriculture and Turf Outlook for 2024

John Deere expects large and small agricultural equipment sales to be down from 2023 levels in North America, Europe, and South America.
Sales of compact utility tractors continue to be lower as the industry works to bring down inventory levels while demand for turf products has stabilized.
John Deere continues to produce at levels in line with retail demand in North America. To manage inventory in Europe and Brazil, John Deere is producing at levels below retail demand.
Agricultural fundamentals are expected to moderate in 2024 due to lower commodity prices and elevated interest rates, offset by resilient farm balance sheets, and lower input costs.
The U.S. equipment fleet age is above 20-year averages for both tractors and combines.
The dairy and livestock sector continues to benefit from elevated cattle and hay prices.
Commodity markets remain disrupted in Central and Eastern Europe due to the Russia/Ukraine war. Western Europe equipment demand is moderately impacted by uncertainty related to current cash crop receipts, agriculture policy changes, and high interest rates.

Construction and Forestry Outlook for 2024

Construction equipment industry sales are forecasted to be down from 2023 levels.
Benefits from increasing U.S. infrastructure spending, elevated manufacturing investment levels, and improving single family housing starts are expected to partially offset moderation in office and retail construction.
Roadbuilding demand remains strong in the U.S., largely offset by softening demand in Europe.

Company Trends

Our net income for fiscal year 2024 is expected to be higher than fiscal year 2023 primarily due to income earned on a higher average portfolio and lower dealer financing incentives, partially offset by less favorable financing spreads and a higher provision for credit losses.

Central bank policy interest rates increased in 2023 and have remained elevated. Most of our receivables and leases with retail customers are fixed rate, while our wholesale receivables generally are variable rate. This Receivable and Lease portfolio is financed with fixed and variable rate borrowings. We manage our exposure to interest rate fluctuations by matching the interest rate characteristics of our portfolio with our funding sources. We also enter into interest rate swap agreements to match our interest rate exposure.

Rising interest rates have historically impacted our borrowings sooner than the benefit is realized from our Receivable and Lease portfolio. As a result, we experienced $19.5 (after-tax) less favorable financing spreads in the first three months of 2024 compared to 2023. We expect to continue experiencing spread compression in 2024, but at a moderating pace relative to spread compression experienced in 2023.

Higher interest rates are driven by factors outside of our control, and as a result we cannot reasonably foresee when these conditions will subside.

Other Items of Concern and Uncertainties

Other items that could impact our results are:

global and regional political conditions, including the ongoing war between Russia and Ukraine and the war between Israel and Hamas,
economic, tax, and trade policies,
new or retaliatory tariffs,

24

capital market disruptions,
foreign currency and capital control policies,
regulations and legislation regarding right to repair,
weather conditions,
marketplace adoption and monetization of technologies we have invested in,
John Deere’s and our ability to strengthen our digital capabilities, automation, autonomy, and alternative power technologies,
changes in demand and pricing for new and used equipment,
significant fluctuations in foreign currency exchange rates,
volatility in the prices of many commodities, and
slower economic growth or recession.

Financing Incentives

In the second quarter of 2023, we corrected the accounting treatment for financing incentives offered to John Deere dealers. Refer to Note 1, Note 2, and Note 12 of the interim consolidated financial statements for additional information. While prior period amounts have been restated for comparability, the impact of the correction in periods prior to the second quarter ended April 30, 2023 was not material to our consolidated financial statements in any of the impacted periods.

2024 Compared with 2023

The total revenues and net income attributable to the Company were as follows:

Three Months Ended

January 28

January 29


2024


2023

Total revenues

$

1,160.5

$

836.5

Net income attributable to the Company

174.5

137.6

Total revenues increased for the first quarter of 2024 primarily due to a 19 percent increase in average portfolio balances and higher average financing rates. Net income for the quarter was higher than the same period in 2023 primarily due to income earned on higher average portfolio balances and lower dealer financing incentives, partially offset by less-favorable financing spreads and a higher provision for credit losses.

Graphic

25

Revenues

Finance income, lease revenues, and other income earned by us were as follows:

Three Months Ended

January 28

January 29

%


2024

2023

Change

Finance income earned on:

Retail notes

$

452.3

$

330.0

37

Revolving charge accounts

105.2

82.9

27

Wholesale receivables

271.1

151.5

79

Lease revenues

264.8

242.5

9

Other income

67.1

29.6

127

Higher average portfolio balances and higher average finance rates drove increased revenues across all products. The change was most pronounced within wholesale receivables, due to a 58 percent increase in average portfolio balances.

Other income increased in the first quarter of 2024 compared to 2023 due to higher interest earned on our cash and cash equivalents and intercompany receivables from John Deere. Furthermore, we received an international support payment from John Deere in 2024 as a result of foreign exchange losses in Argentina due to currency devaluation.

Revenues earned from John Deere totaled $278.4 for the first quarter of 2024, compared with $208.2 for the same period last year. The increase was primarily due to increased compensation paid by John Deere on wholesale receivables and retail notes, driven by a higher interest rate environment, in addition to higher average portfolio balances. The international support payment from John Deere noted above also contributed to the increase. Revenues earned from John Deere are included in each of the revenue amounts discussed above.

Expenses

Expenses incurred by us were as follows:

Three Months Ended

January 28

January 29

%

2024

2023

Change

Interest expense

$

571.4

$

301.0

90

Depreciation of equipment on operating leases

167.2

164.5

2

Administrative and operating expenses

132.2

136.7

(3)

Fees and interest paid to John Deere

57.1

57.6

(1)

Provision for credit losses

21.0

3.5

500

Provision for income taxes

38.9

36.8

6

The increase in interest expense for the first quarter of 2024 was primarily due to higher average borrowing rates and higher average borrowings to fund a larger portfolio.

Administrative and operating expenses decreased in the first quarter of 2024 compared to 2023 due to lower dealer financing incentive program costs, partially offset by higher foreign exchange losses in Argentina.

The provision for credit losses increased in the first quarter 2024 compared with the same period last year primarily due to higher net write-offs on construction and forestry retail notes. The annualized provision for credit losses, as a percentage of the average balance of total Receivables, was .17 percent for the first quarter of 2024, compared with .03 percent for the same period last year.

The provision for income taxes increased during the first quarter of 2024 primarily due to higher pretax income, partially offset by favorable discrete tax items.

26

Receivables and Leases

Receivable and Lease (excluding wholesale) volumes were as follows:

Three Months Ended

January 28

January 29

$

%

2024

2023

Change

Change 

Retail notes:


Agriculture and turf

2,833.1

2,684.5

148.6

6

Construction and forestry


753.6


630.6


123.0

20

Total retail notes


3,586.7


3,315.1


271.6

8

Revolving charge accounts


2,075.6


2,212.7


(137.1)

(6)

Financing leases


185.3


128.5


56.8

44

Equipment on operating leases


360.2


377.2


(17.0)

(5)

Total Receivables and Leases (excluding wholesale)

$

6,207.8

$

6,033.5

$

174.3

3

Receivable and Lease portfolio balances were as follows:


January 28


October 29


January 29

2024

2023

2023

Retail notes:


Agriculture and turf

26,678.4

26,708.3

23,988.2

Construction and forestry


5,455.7


5,289.6


4,988.7

Total retail notes


32,134.1


31,997.9


28,976.9

Revolving charge accounts


2,925.5


4,594.4


2,834.0

Wholesale receivables


14,542.8


13,330.1


9,752.1

Financing leases


1,251.0


1,421.8


1,030.8

Equipment on operating leases


4,933.4


5,051.5


4,693.4

Total Receivables and Leases

55,786.8

56,395.7

47,287.2

Customer Receivables decreased $1,703.5 during the first three months of 2024 due to a seasonal decrease in revolving charge account receivables. Customer Receivables increased $3,468.9 compared to one year ago due to strong John Deere retail sales. Wholesale receivables increased $1,212.7 in the first three months of 2024 and $4,790.7 compared to one year ago due to higher dealer inventory levels.

Total Receivables 30 days or more past due, non-performing Receivables, and the allowance for credit losses were as follows (as a percentage of the Receivables balance):

January 28, 2024

October 29, 2023

January 29, 2023

Dollars

Percent

Dollars

Percent

Dollars

Percent

Receivables 30 days or more past due

$

714.5

1.41

$

514.1

1.00

$

489.4

1.15

Non-performing Receivables

436.3

.86

383.1

.75

293.6

.69

Allowance for credit losses

139.6

.27

146.4

.29

121.7

.29

We monitor the credit quality of Receivables based on delinquency status. Receivables 30 days or more past due continue to accrue finance income. We stop accruing finance income once Receivables are considered non-performing, which generally occurs once Receivables are 90 days past due. An allowance for credit losses is recorded for the estimated credit losses expected over the life of the Receivable portfolio. We measure expected credit losses on a collective basis when similar risk characteristics exist. Risk characteristics include product category, market, geography, credit risk, and remaining balance. Receivables that do not share risk characteristics with other receivables in the portfolio are evaluated on an individual basis. Non-performing Receivables are included in the estimate of expected credit losses. While we believe our allowance is sufficient to provide for losses over the life of our existing Receivable portfolio, different assumptions or changes in economic conditions would result in changes to the allowance for credit losses and the provision for credit losses. See Note 4 for additional information related to the allowance for credit losses.

27

Deposits held from dealers and merchants amounted to $129.3 at January 28, 2024, compared with $138.4 at October 29, 2023 and $127.8 at January 29, 2023. These balances primarily represent the aggregate dealer retail note and lease deposits from individual John Deere dealers to which losses from retail notes and leases originating from the respective dealers can be charged. Recoveries from dealer deposits are recognized in “Other income” when the dealer’s deposit account is charged. Recoveries from dealer deposits and other freestanding credit enhancements recorded in other income were $7.3 in the first quarter of 2024, compared with $2.0 for the same period last year.

Write-offs and recoveries of Receivables, by product, and as an annualized percentage of average balances held during the period, were as follows:

Three Months Ended

January 28, 2024

January 29, 2023

Dollars

Percent

Dollars

Percent

Write-offs:


Retail notes and financing leases:

Agriculture and turf

$

(10.4)


(.15)

$

(7.1)


(.11)

Construction and forestry


(13.9)


(.99)


(3.1)


(.24)

Total retail notes and financing leases


(24.3)


(.29)


(10.2)


(.14)

Revolving charge accounts


(10.7)


(1.19)


(7.5)


(.91)

Wholesale receivables


(.1)


Total write-offs


(35.0)


(.28)


(17.8)


(.17)

Recoveries:

Retail notes and financing leases:

Agriculture and turf


1.3


.02


1.6


.03

Construction and forestry


.4


.03


.8


.06

Total retail notes and financing leases


1.7


.02


2.4


.03

Revolving charge accounts


7.6


.85


5.3


.64

Wholesale receivables


.6

.03

Total recoveries


9.3


.08


8.3


.08

Total net write-offs

$

(25.7)


(.20)

$

(9.5)


(.09)

Critical Accounting Estimates

See our critical accounting estimates discussed in “Management’s Discussion and Analysis of Financial Condition and Results of Operations” of our recently filed Annual Report on Form 10-K. There have been no material changes to these estimates.

Capital Resources and Liquidity – 2024 Compared with 2023

We rely on our ability to raise substantial amounts of funds to finance our Receivable and Lease portfolios. We have access to global capital markets at a reasonable cost and our ability to meet our debt obligations is supported in several ways. Sources of liquidity include:

cash and cash equivalents,
the issuance of commercial paper and term debt,
the securitization of retail notes,
intercompany loans from John Deere,
our Receivable and Lease portfolio, which is self-liquidating in nature, and
bank lines of credit.

We closely monitor our liquidity sources against the cash requirements and expect to have sufficient sources of global funding and liquidity to meet our funding needs in the short-term (next 12 months) and long-term (beyond 12 months).

28

Key metrics and certain balance sheet data are provided in the following table:

January 28

October 29

January 29


2024


2023


2023

Cash, cash equivalents, and marketable securities

$

1,522.4

$

1,488.9

$

1,056.8

Receivables and Leases – net

55,647.2

56,249.3

47,165.5

Interest-bearing debt

50,470.5

50,514.5

42,491.4

Unused credit lines

1,576.6

841.2

1,580.5

Ratio of interest-bearing debt to stockholder’s equity

8.6 to 1

8.6 to 1

8.5 to 1

The increase in unused credit lines at January 28, 2024 compared to October 28, 2023 relates to a decrease in commercial paper outstanding, by both us and John Deere.

There have been no material changes to the contractual obligations and other cash requirements identified in our most recently filed Annual Report on Form 10-K.

Cash Flows

Three Months Ended

January 28

January 29


2024


2023

Net cash provided by operating activities

$

409.6

$

338.7

Net cash provided by (used for) investing activities

429.4

(53.0)

Net cash provided by (used for) financing activities

(810.6)

81.0

Effect of exchange rate changes on cash, cash equivalents, and restricted cash

1.5

13.1

Net increase in cash, cash equivalents, and restricted cash

$

29.9

$

379.8

Net cash provided by investing activities increased during the first three months of 2024, primarily due to a seasonal decrease in revolving charge account receivables, partially offset by an increase in wholesale receivables. The aggregate net cash provided by operating and investing activities was used primarily to decrease external borrowings, resulting in cash outflows for financing activities.

Borrowings

Total borrowings decreased $44.0 in the first three months of 2024 and increased $7,979.1 compared to a year ago, generally corresponding with the level of the Receivable and Lease portfolios. During the first three months of 2024, we issued $2,147.3 and retired $1,713.4 of long-term external borrowings, which primarily consisted of medium-term notes. During the first three months of 2024, we also retired $881.5 of retail note securitization borrowings and maintained an average commercial paper balance of $6,707.4. Our funding profile may be altered to reflect such factors as relative costs of funding sources, assets available for securitizations, and capital market accessibility.

We have a revolving warehouse facility to utilize bank conduit facilities to securitize retail notes (see Note 5). The facility was renewed in November 2023 with an expiration in November 2024 and with an increase in the total capacity or “financing limit” from $1,500.0 to $2,000.0. At January 28, 2024, $1,117.6 of securitization borrowings were outstanding under the facility. At the end of the contractual revolving period, unless we and the banks agree to renew, we would liquidate the secured borrowings over time as payments on the retail notes are collected.

Lines of Credit

We have access to bank lines of credit with various banks throughout the world. Some of the lines are available to both us and Deere & Company.

Worldwide lines of credit were $10,080.0 at January 28, 2024, consisting primarily of:

a 364-day credit facility agreement of $5.0 billion, expiring in the second quarter of 2024,
a credit facility agreement of $2.5 billion, expiring in the second quarter of 2027, and
a credit facility agreement of $2.5 billion, expiring in the second quarter of 2028.

29

At January 28, 2024, $1,576.6 of these worldwide lines of credit were unused. For the purpose of computing the unused credit lines, commercial paper and short-term bank borrowings of us and John Deere, were considered to constitute utilization.

The credit agreements governing these lines of credit require us to maintain a consolidated ratio of earnings to fixed charges at not less than 1.05 to 1 for any four consecutive fiscal quarterly periods and our ratio of senior debt, excluding securitization indebtedness, to capital base (total subordinated debt and stockholder’s equity excluding accumulated other comprehensive income (loss)) at not more than 11 to 1 at the end of any fiscal quarter. All of these credit agreement requirements have been met during the periods included in the consolidated financial statements. The agreements are mutually extendable, and the annual facility fees are not significant.

Debt Ratings

Our ability to obtain funding is affected by our debt ratings, which are closely related to the outlook for and the financial condition of John Deere, and the nature and availability of support facilities, such as our lines of credit and the support agreement from Deere & Company.

To access public debt capital markets, we rely on credit rating agencies to assign short-term and long-term credit ratings to our debt securities as an indicator of credit quality for fixed income investors. A security rating is not a recommendation by the rating agency to buy, sell, or hold. A credit rating agency may change or withdraw ratings based on its assessment of our current and future ability to meet interest and principal repayment obligations. Each agency’s rating should be evaluated independently of any other rating. Lower credit ratings generally result in higher borrowing costs, including costs of derivative transactions, reduced access to debt capital markets, and may adversely impact our liquidity.

The senior long-term and short-term debt ratings and outlook currently assigned to our unsecured debt securities by the rating agencies engaged by us are the same as those for John Deere and are as follows:


Senior Long-Term


Short-Term


Outlook

Fitch Ratings

A+

F1

Stable

Moody’s Investors Service, Inc.


A1


Prime-1


Stable

Standard & Poor’s


A


A-1


Stable

Forward-Looking Statements

Certain statements contained herein, including in the section entitled “Overview” relating to future events, expectations, and trends constitute “forward-looking statements” as defined in the Private Securities Litigation Reform Act of 1995 and involve factors that are subject to change, assumptions, risks, and uncertainties that could cause actual results to differ materially.

30

Forward-looking statements are based on currently available information and current assumptions, expectations, and projections about future events and should not be relied upon. Except as required by law, we expressly disclaim any obligation to update or revise our forward-looking statements. Many factors, risks, and uncertainties could cause actual results to differ materially from these forward-looking statements. Among these factors are risks related to:

changes and compliance with U.S., foreign and international laws, regulations, and policies relating to trade, economic sanctions, data privacy, spending, taxing, banking, monetary, environmental (including climate change and engine emission), and farming policies;
volumes of Receivables and Leases being dependent upon the level of retail sales and leases of John Deere products;
political, economic, and social instability of the geographies in which we and John Deere operate, including the ongoing war between Russia and Ukraine and the war between Israel and Hamas;
adverse macroeconomic conditions, including unemployment, inflation, rising interest rates, changes in consumer practices due to slower economic growth, and regional or global liquidity constraints;
worldwide demand for food and different forms of renewable energy;
John Deere’s and our ability to execute business strategies, including John Deere’s Smart Industrial Operating Model and Leap Ambitions;
John Deere’s and our ability to understand and meet customers’ changing expectations and demand for John Deere products and solutions, including our financing solutions;
John Deere’s and our ability to adapt in highly competitive markets;
John Deere dealers’ practices and their ability to manage distribution of John Deere products and support and service precision technology solutions;
changes in climate patterns, unfavorable weather events, and natural disasters;
governmental and other actions designed to address climate change in connection with a transition to a lower-carbon economy;
higher interest rates and currency fluctuations, which could adversely affect the U.S. dollar, customer confidence, access to capital, and demand for John Deere’s and our products and solutions;
a decrease in the value of used equipment or higher than estimated returns of equipment on operating leases;
availability and price of raw materials, components, and whole goods;
delays or disruptions in John Deere’s supply chain;
John Deere’s equipment fails to perform as expected, which could result in warranty claims, post-sales repairs or recalls, product liability litigation, and regulatory investigations;
the ability to attract, develop, engage, and retain qualified personnel;
security breaches, cybersecurity attacks, technology failures, and other disruptions to John Deere information technology infrastructure and products of John Deere, or us;
loss of or challenges to intellectual property rights;
legislation introduced or enacted that could affect John Deere’s business model and intellectual property, such as right to repair legislation;
investigations, claims, lawsuits, or other legal proceedings;
events that damage John Deere’s or our reputation or brand;
world grain stocks, available farm acres, soil conditions, harvest yields, prices for commodities and livestock, input costs, and availability of transport for crops; and
housing starts and supply, real estate and housing prices, levels of public and non-residential construction, and infrastructure investment.

Further information concerning our business, including factors that could materially affect our financial results, is included in our other filings with the SEC (including, but not limited to, the factors discussed in Item 1A. “Risk Factors” of our most recent Annual Report on Form 10-K and this Quarterly Report on Form 10-Q). There also may be other factors that we cannot anticipate or that are not described herein because we do not currently perceive them to be material.

31

Our business is closely related to John Deere’s business. Further information, including factors that could materially affect our financial results and John Deere’s financial results, is included in the most recent Deere & Company Annual Report on Form 10-K and Quarterly Report on Form 10-Q (including, but not limited to, the factors discussed in Item 1A., “Risk Factors” of the most recent Annual Report on Form 10-K and Quarterly Report on Form 10-Q) and other Deere & Company filings with the SEC.

Item 3.     Quantitative and Qualitative Disclosures About Market Risk.

Omitted pursuant to General Instruction H.

Item 4.     Controls and Procedures.

Our principal executive officer and principal financial officer have concluded that our disclosure controls and procedures (as defined in Rules 13a-15(e) and 15d-15(e) of the Securities Exchange Act of 1934, as amended (the Exchange Act)) were effective as of January 28, 2024, based on the evaluation of these controls and procedures required by Rule 13a-15(b) or 15d-15(b) of the Exchange Act. During the first quarter, there were no changes that have materially affected or are reasonably likely to materially affect our internal control over financial reporting.

PART II.  OTHER INFORMATION

Item 1.     Legal Proceedings.

We are subject to various unresolved legal actions which arise in the normal course of our business, the most prevalent of which relate to retail credit matters. We believe the reasonably possible range of losses for these unresolved legal actions would not have a material effect on our consolidated financial statements.

Item 1A.  Risk Factors.

See our most recently filed Annual Report on Form 10-K (Part I, Item 1A). There have been no material changes in this information. The risks described in the Annual Report on Form 10-K, and the “Forward-Looking Statements” in this report, are not the only risks we face. Additional risks and uncertainties may also materially affect our business, financial condition, or operating results. One should not consider the risk factors to be a complete discussion of risks, uncertainties, and assumptions.

Item 2.     Unregistered Sales of Equity Securities and Use of Proceeds.

Omitted pursuant to General Instruction H.

Item 3.     Defaults Upon Senior Securities.

Omitted pursuant to General Instruction H.

Item 4.     Mine Safety Disclosures.

Not applicable.

Item 5.     Other Information.

None.

32

Item 6.     Exhibits.

Certain instruments relating to long-term debt, constituting less than 10 percent of the registrant’s total assets, are not filed as exhibits herewith pursuant to Item 601(b)(4)(iii)(A) of Regulation S-K. The registrant will furnish copies of such instruments to the SEC upon request of the SEC.

3.1

Certificate of Incorporation, as amended (Exhibit 3.1 to Form 10-K of the registrant for the year ended October 31, 1999, Securities and Exchange Commission file number 1-6458*)

3.2

Bylaws, as amended (Exhibit 3.2 to Form 10-K of the registrant for the year ended October 31, 1999, Securities and Exchange Commission file number 1-6458*)

31.1

Rule 13a-14(a)/15d-14(a) Certification

31.2

Rule 13a-14(a)/15d-14(a) Certification

32

Section 1350 Certifications (furnished herewith)

101.INS

Inline XBRL Instance Document (the instance document does not appear in the Interactive Data File because its XBRL tags are embedded within the Inline XBRL document)

101.SCH

Inline XBRL Taxonomy Extension Schema Document

101.CAL

Inline XBRL Taxonomy Extension Calculation Linkbase Document

101.DEF

Inline XBRL Taxonomy Extension Definition Linkbase Document

101.LAB

Inline XBRL Taxonomy Extension Label Linkbase Document

101.PRE

Inline XBRL Taxonomy Extension Presentation Linkbase Document

104

Cover Page Interactive Data File (formatted as Inline XBRL and contained in Exhibit 101)

*     Incorporated by reference.

33

SIGNATURES

Pursuant to the requirements of the Securities Exchange Act of 1934, the registrant has duly caused this report to be signed on its behalf by the undersigned thereunto duly authorized.

JOHN DEERE CAPITAL CORPORATION

Date:

February 29, 2024

By:

/s/ Joshua A. Jepsen

Joshua A. Jepsen

Senior Vice President

(Principal Financial Officer and Principal Accounting Officer)

34