http://fasb.org/us-gaap/2023#SecuredDebtCurrenthttp://fasb.org/us-gaap/2023#SecuredDebtCurrenthttp://fasb.org/us-gaap/2023#SecuredDebtCurrenthttp://fasb.org/us-gaap/2023#SecuredDebtCurrenthttp://fasb.org/us-gaap/2023#SecuredDebtCurrenthttp://fasb.org/us-gaap/2023#SecuredDebtCurrenthttp://fasb.org/us-gaap/2023#SecuredDebtCurrenthttp://fasb.org/us-gaap/2023#SecuredDebtCurrenthttp://jdcc.deere.com/20231029#ForeignDebtSecuritiesMember25002500http://jdcc.deere.com/20231029#LongTermDebtAndFinanceLeasesNoncurrentDEERE JOHN CAPITAL CORP0000027673--10-292023FYfalsehttp://fasb.org/us-gaap/2023#InterestExpense http://fasb.org/us-gaap/2023#SellingGeneralAndAdministrativeExpensehttp://fasb.org/us-gaap/2023#InterestExpense http://fasb.org/us-gaap/2023#SellingGeneralAndAdministrativeExpensehttp://fasb.org/us-gaap/2023#InterestExpense http://fasb.org/us-gaap/2023#SellingGeneralAndAdministrativeExpensehttp://fasb.org/us-gaap/2023#OtherAssetshttp://fasb.org/us-gaap/2023#OtherAssetshttp://fasb.org/us-gaap/2023#OtherAssetshttp://jdcc.deere.com/20231029#UltimateParentCompanyAndItsWhollyOwnedSubsidiariesMemberhttp://jdcc.deere.com/20231029#UltimateParentCompanyAndItsWhollyOwnedSubsidiariesMember0http://fasb.org/us-gaap/2023#SecuredDebtCurrenthttp://fasb.org/us-gaap/2023#SecuredDebtCurrenthttp://fasb.org/us-gaap/2023#SecuredDebtCurrenthttp://jdcc.deere.com/20231029#UltimateParentCompanyAndItsWhollyOwnedSubsidiariesMemberhttp://jdcc.deere.com/20231029#UltimateParentCompanyAndItsWhollyOwnedSubsidiariesMemberhttp://jdcc.deere.com/20231029#UltimateParentCompanyAndItsWhollyOwnedSubsidiariesMember0.005http://jdcc.deere.com/20231029#UltimateParentCompanyAndItsWhollyOwnedSubsidiariesMemberhttp://jdcc.deere.com/20231029#UltimateParentCompanyAndItsWhollyOwnedSubsidiariesMemberhttp://jdcc.deere.com/20231029#UltimateParentCompanyAndItsWhollyOwnedSubsidiariesMemberP1Mhttp://jdcc.deere.com/20231029#UltimateParentCompanyAndItsWhollyOwnedSubsidiariesMemberhttp://jdcc.deere.com/20231029#UltimateParentCompanyAndItsWhollyOwnedSubsidiariesMemberhttp://jdcc.deere.com/20231029#UltimateParentCompanyAndItsWhollyOwnedSubsidiariesMemberhttp://fasb.org/us-gaap/2023#SecuredDebtCurrenthttp://jdcc.deere.com/20231029#UltimateParentCompanyAndItsWhollyOwnedSubsidiariesMemberhttp://jdcc.deere.com/20231029#UltimateParentCompanyAndItsWhollyOwnedSubsidiariesMemberhttp://jdcc.deere.com/20231029#UltimateParentCompanyAndItsWhollyOwnedSubsidiariesMemberhttp://jdcc.deere.com/20231029#UltimateParentCompanyAndItsWhollyOwnedSubsidiariesMemberhttp://jdcc.deere.com/20231029#UltimateParentCompanyAndItsWhollyOwnedSubsidiariesMemberhttp://jdcc.deere.com/20231029#UltimateParentCompanyAndItsWhollyOwnedSubsidiariesMemberhttp://jdcc.deere.com/20231029#UltimateParentCompanyAndItsWhollyOwnedSubsidiariesMemberhttp://jdcc.deere.com/20231029#UltimateParentCompanyAndItsWhollyOwnedSubsidiariesMemberhttp://jdcc.deere.com/20231029#UltimateParentCompanyAndItsWhollyOwnedSubsidiariesMemberhttp://jdcc.deere.com/20231029#UltimateParentCompanyAndItsWhollyOwnedSubsidiariesMemberhttp://jdcc.deere.com/20231029#UltimateParentCompanyAndItsWhollyOwnedSubsidiariesMemberhttp://jdcc.deere.com/20231029#UltimateParentCompanyAndItsWhollyOwnedSubsidiariesMemberhttp://jdcc.deere.com/20231029#ForeignDebtSecuritiesMemberhttp://jdcc.deere.com/20231029#LongTermDebtAndFinanceLeasesNoncurrenthttp://jdcc.deere.com/20231029#CorrectionOfTimingOfExpenseAndClassificationForFinancingIncentivesProgramToDealersMember0000027673us-gaap:RetainedEarningsMember2023-10-290000027673us-gaap:NoncontrollingInterestMember2023-10-290000027673us-gaap:CommonStockMember2023-10-290000027673us-gaap:RetainedEarningsMember2022-10-300000027673us-gaap:NoncontrollingInterestMember2022-10-300000027673us-gaap:CommonStockMember2022-10-300000027673us-gaap:RetainedEarningsMember2021-10-310000027673us-gaap:NoncontrollingInterestMember2021-10-310000027673us-gaap:CommonStockMember2021-10-310000027673srt:CumulativeEffectPeriodOfAdoptionAdjustmentMemberus-gaap:AccountingStandardsUpdate201613Memberus-gaap:RetainedEarningsMember2020-11-010000027673us-gaap:RetainedEarningsMember2020-11-010000027673us-gaap:NoncontrollingInterestMember2020-11-010000027673us-gaap:CommonStockMember2020-11-010000027673us-gaap:AccumulatedOtherComprehensiveIncomeMember2020-11-010000027673us-gaap:AccumulatedTranslationAdjustmentMember2023-10-290000027673us-gaap:AccumulatedOtherComprehensiveIncomeMember2023-10-290000027673us-gaap:AccumulatedNetUnrealizedInvestmentGainLossMember2023-10-290000027673us-gaap:AccumulatedGainLossNetCashFlowHedgeParentMember2023-10-290000027673us-gaap:AccumulatedTranslationAdjustmentMember2022-10-300000027673us-gaap:AccumulatedOtherComprehensiveIncomeMember2022-10-300000027673us-gaap:AccumulatedNetUnrealizedInvestmentGainLossMember2022-10-300000027673us-gaap:AccumulatedGainLossNetCashFlowHedgeParentMember2022-10-300000027673us-gaap:AccumulatedTranslationAdjustmentMember2021-10-310000027673us-gaap:AccumulatedOtherComprehensiveIncomeMember2021-10-310000027673us-gaap:AccumulatedNetUnrealizedInvestmentGainLossMember2021-10-310000027673us-gaap:AccumulatedGainLossNetCashFlowHedgeParentMember2021-10-310000027673jdcc:CommercialPaperAndOtherNotesPayableMember2023-10-290000027673us-gaap:SecuredDebtMember2022-10-300000027673jdcc:CommercialPaperAndOtherNotesPayableMember2022-10-300000027673us-gaap:NonUsMember2022-10-312023-10-290000027673country:US2022-10-312023-10-290000027673us-gaap:NonUsMember2021-11-012022-10-300000027673country:US2021-11-012022-10-300000027673us-gaap:NonUsMember2020-11-022021-10-310000027673country:US2020-11-022021-10-310000027673us-gaap:PropertySubjectToOperatingLeaseMemberus-gaap:RelatedPartyMember2022-10-312023-10-290000027673us-gaap:CommercialPortfolioSegmentMemberus-gaap:RelatedPartyMember2022-10-312023-10-290000027673jdcc:RetailRevolvingChargeAccountsPortfolioSegmentMemberus-gaap:RelatedPartyMember2022-10-312023-10-290000027673jdcc:RetailNotesPortfolioSegmentMemberus-gaap:RelatedPartyMember2022-10-312023-10-290000027673jdcc:FinancingLeasesPortfolioSegmentMemberus-gaap:RelatedPartyMember2022-10-312023-10-290000027673us-gaap:PropertySubjectToOperatingLeaseMemberus-gaap:RelatedPartyMember2021-11-012022-10-300000027673us-gaap:CommercialPortfolioSegmentMemberus-gaap:RelatedPartyMember2021-11-012022-10-300000027673jdcc:RetailRevolvingChargeAccountsPortfolioSegmentMemberus-gaap:RelatedPartyMember2021-11-012022-10-300000027673jdcc:RetailNotesPortfolioSegmentMemberus-gaap:RelatedPartyMember2021-11-012022-10-300000027673jdcc:FinancingLeasesPortfolioSegmentMemberus-gaap:RelatedPartyMember2021-11-012022-10-300000027673us-gaap:PropertySubjectToOperatingLeaseMemberus-gaap:RelatedPartyMember2020-11-022021-10-310000027673us-gaap:CommercialPortfolioSegmentMemberus-gaap:RelatedPartyMember2020-11-022021-10-310000027673jdcc:RetailRevolvingChargeAccountsPortfolioSegmentMemberus-gaap:RelatedPartyMember2020-11-022021-10-310000027673jdcc:RetailNotesPortfolioSegmentMemberus-gaap:RelatedPartyMember2020-11-022021-10-310000027673jdcc:FinancingLeasesPortfolioSegmentMemberus-gaap:RelatedPartyMember2020-11-022021-10-310000027673srt:ScenarioPreviouslyReportedMember2021-10-310000027673srt:RevisionOfPriorPeriodErrorCorrectionAdjustmentMember2021-10-310000027673srt:ScenarioPreviouslyReportedMember2020-11-010000027673srt:RevisionOfPriorPeriodErrorCorrectionAdjustmentMember2020-11-010000027673jdcc:RetailNotesPortfolioSegmentMember2022-10-312023-10-290000027673jdcc:RetailNotesPortfolioSegmentMember2021-11-012022-10-300000027673jdcc:RetailNotesPortfolioSegmentMember2020-11-022021-10-310000027673us-gaap:NoncontrollingInterestMember2022-10-312023-10-290000027673us-gaap:EquityMethodInvestmentNonconsolidatedInvesteeOrGroupOfInvesteesMember2022-10-312023-10-290000027673us-gaap:NoncontrollingInterestMember2021-11-012022-10-300000027673us-gaap:EquityMethodInvestmentNonconsolidatedInvesteeOrGroupOfInvesteesMember2021-11-012022-10-300000027673us-gaap:NoncontrollingInterestMember2020-11-022021-10-310000027673us-gaap:EquityMethodInvestmentNonconsolidatedInvesteeOrGroupOfInvesteesMember2020-11-022021-10-310000027673us-gaap:NonrelatedPartyMember2022-10-312023-10-290000027673us-gaap:NonrelatedPartyMember2021-11-012022-10-300000027673us-gaap:NonrelatedPartyMember2020-11-022021-10-310000027673us-gaap:AccumulatedOtherComprehensiveIncomeMember2022-10-312023-10-290000027673us-gaap:AccumulatedOtherComprehensiveIncomeMember2021-11-012022-10-300000027673us-gaap:AccumulatedOtherComprehensiveIncomeMember2020-11-022021-10-310000027673us-gaap:InterestRateSwapMember2022-10-312023-10-290000027673us-gaap:InterestRateSwapMember2021-11-012022-10-300000027673us-gaap:InterestRateSwapMember2020-11-022021-10-310000027673us-gaap:AccumulatedTranslationAdjustmentMember2022-10-312023-10-290000027673us-gaap:AccumulatedNetUnrealizedInvestmentGainLossMember2022-10-312023-10-290000027673us-gaap:AccumulatedTranslationAdjustmentMember2021-11-012022-10-300000027673us-gaap:AccumulatedNetUnrealizedInvestmentGainLossMember2021-11-012022-10-300000027673us-gaap:AccumulatedTranslationAdjustmentMember2020-11-022021-10-310000027673us-gaap:AccumulatedNetUnrealizedInvestmentGainLossMember2020-11-022021-10-310000027673us-gaap:AssetPledgedAsCollateralWithRightMember2023-10-290000027673us-gaap:AssetPledgedAsCollateralWithRightMember2022-10-300000027673us-gaap:AccumulatedGainLossNetCashFlowHedgeParentMember2022-10-312023-10-290000027673us-gaap:AccumulatedGainLossNetCashFlowHedgeParentMember2021-11-012022-10-300000027673us-gaap:AccumulatedGainLossNetCashFlowHedgeParentMember2020-11-022021-10-310000027673us-gaap:NotesPayableOtherPayablesMember2022-10-300000027673jdcc:BancoJohnDeereSaMemberus-gaap:RelatedPartyMember2023-10-290000027673jdcc:JohnDeereAgriculturalHoldingsIncMemberus-gaap:RelatedPartyMember2022-10-300000027673jdcc:BancoJohnDeereSaMemberus-gaap:RelatedPartyMember2022-10-300000027673jdcc:LineOfCreditFacilityAgreementExpiringSecondQuarter2028Member2023-10-290000027673jdcc:LineOfCreditFacilityAgreementExpiringSecondQuarter2027Member2023-10-290000027673jdcc:LineOfCreditFacility364DayAgreementExpiringSecondQuarter2024Member2023-10-290000027673jdcc:MarketableSecuritiesMemberus-gaap:FairValueInputsLevel2Memberus-gaap:FairValueMeasurementsRecurringMember2023-10-290000027673jdcc:MarketableSecuritiesMemberus-gaap:FairValueInputsLevel2Memberus-gaap:FairValueMeasurementsRecurringMember2022-10-300000027673us-gaap:InterestRateSwapMemberus-gaap:ReclassificationOutOfAccumulatedOtherComprehensiveIncomeMemberus-gaap:AccumulatedGainLossNetCashFlowHedgeParentMember2022-10-312023-10-290000027673us-gaap:InterestRateSwapMemberus-gaap:ReclassificationOutOfAccumulatedOtherComprehensiveIncomeMemberus-gaap:AccumulatedGainLossNetCashFlowHedgeParentMember2021-11-012022-10-300000027673us-gaap:InterestRateSwapMemberus-gaap:ReclassificationOutOfAccumulatedOtherComprehensiveIncomeMemberus-gaap:AccumulatedGainLossNetCashFlowHedgeParentMember2020-11-022021-10-310000027673us-gaap:InterestRateSwapMember2023-10-290000027673us-gaap:InterestRateSwapMember2022-10-300000027673us-gaap:FinancialGuaranteeMemberjdcc:JohnDeereFinancialIncMemberus-gaap:CommercialPaperMember2023-10-290000027673country:AR2020-11-022021-10-310000027673srt:RevisionOfPriorPeriodErrorCorrectionAdjustmentMember2023-01-302023-01-300000027673srt:RevisionOfPriorPeriodErrorCorrectionAdjustmentMember2023-01-300000027673jdcc:JohnDeereFinancialSSMember2023-10-290000027673srt:ParentCompanyMemberus-gaap:SubsequentEventMember2023-12-072023-12-070000027673srt:ParentCompanyMemberus-gaap:RelatedPartyMember2022-10-312023-10-290000027673us-gaap:RetainedEarningsMember2022-10-312023-10-290000027673srt:ParentCompanyMemberus-gaap:RelatedPartyMember2021-11-012022-10-300000027673us-gaap:RetainedEarningsMember2021-11-012022-10-300000027673srt:ParentCompanyMemberus-gaap:RelatedPartyMember2020-11-022021-10-310000027673us-gaap:RetainedEarningsMember2020-11-022021-10-310000027673us-gaap:FinancialGuaranteeMemberjdcc:JohnDeereFinancialIncMemberus-gaap:DerivativeMember2023-10-290000027673us-gaap:InterestRateSwapMemberus-gaap:InterestExpenseMember2022-10-312023-10-290000027673us-gaap:ForeignExchangeContractMemberus-gaap:SellingGeneralAndAdministrativeExpensesMember2022-10-312023-10-290000027673us-gaap:InterestRateSwapMemberus-gaap:InterestExpenseMember2021-11-012022-10-300000027673us-gaap:ForeignExchangeContractMemberus-gaap:SellingGeneralAndAdministrativeExpensesMember2021-11-012022-10-300000027673us-gaap:InterestRateSwapMemberus-gaap:InterestExpenseMember2020-11-022021-10-310000027673us-gaap:ForeignExchangeContractMemberus-gaap:SellingGeneralAndAdministrativeExpensesMember2020-11-022021-10-310000027673jdcc:UltimateParentCompanyAndItsWhollyOwnedSubsidiariesMemberus-gaap:RelatedPartyMember2021-11-012022-10-300000027673jdcc:UltimateParentCompanyAndItsWhollyOwnedSubsidiariesMemberus-gaap:RelatedPartyMember2020-11-022021-10-310000027673us-gaap:InterestRateSwapMemberus-gaap:FairValueHedgingMemberus-gaap:DesignatedAsHedgingInstrumentMember2023-10-290000027673us-gaap:InterestRateCapMemberus-gaap:NotDesignatedAsHedgingInstrumentEconomicHedgeMemberus-gaap:ShortMember2023-10-290000027673us-gaap:AccountsPayableAndAccruedLiabilitiesMemberus-gaap:FairValueInputsLevel2Memberus-gaap:FairValueMeasurementsRecurringMember2023-10-290000027673jdcc:OtherPayablesToRelatedPartyMemberus-gaap:FairValueInputsLevel2Memberus-gaap:FairValueMeasurementsRecurringMember2023-10-290000027673us-gaap:InterestRateSwapMemberus-gaap:FairValueHedgingMemberus-gaap:DesignatedAsHedgingInstrumentMember2022-10-300000027673us-gaap:InterestRateCapMemberus-gaap:NotDesignatedAsHedgingInstrumentEconomicHedgeMemberus-gaap:ShortMember2022-10-300000027673us-gaap:AccountsPayableAndAccruedLiabilitiesMemberus-gaap:FairValueInputsLevel2Memberus-gaap:FairValueMeasurementsRecurringMember2022-10-300000027673jdcc:OtherPayablesToRelatedPartyMemberus-gaap:FairValueInputsLevel2Memberus-gaap:FairValueMeasurementsRecurringMember2022-10-300000027673us-gaap:OtherAssetsMemberus-gaap:FairValueInputsLevel2Memberus-gaap:FairValueMeasurementsRecurringMember2023-10-290000027673us-gaap:InterestRateSwapMemberus-gaap:CashFlowHedgingMemberus-gaap:DesignatedAsHedgingInstrumentMember2023-10-290000027673us-gaap:InterestRateCapMemberus-gaap:NotDesignatedAsHedgingInstrumentEconomicHedgeMemberus-gaap:LongMember2023-10-290000027673jdcc:ReceivablesFromRelatedPartyMemberus-gaap:FairValueInputsLevel2Memberus-gaap:FairValueMeasurementsRecurringMember2023-10-290000027673us-gaap:InterestRateSwapMemberus-gaap:NotDesignatedAsHedgingInstrumentEconomicHedgeMember2023-10-290000027673us-gaap:ForeignExchangeContractMemberus-gaap:NotDesignatedAsHedgingInstrumentEconomicHedgeMember2023-10-290000027673us-gaap:CrossCurrencyInterestRateContractMemberus-gaap:NotDesignatedAsHedgingInstrumentEconomicHedgeMember2023-10-290000027673us-gaap:OtherAssetsMemberus-gaap:FairValueInputsLevel2Memberus-gaap:FairValueMeasurementsRecurringMember2022-10-300000027673us-gaap:InterestRateSwapMemberus-gaap:CashFlowHedgingMemberus-gaap:DesignatedAsHedgingInstrumentMember2022-10-300000027673us-gaap:InterestRateCapMemberus-gaap:NotDesignatedAsHedgingInstrumentEconomicHedgeMemberus-gaap:LongMember2022-10-300000027673jdcc:ReceivablesFromRelatedPartyMemberus-gaap:FairValueInputsLevel2Memberus-gaap:FairValueMeasurementsRecurringMember2022-10-300000027673us-gaap:InterestRateSwapMemberus-gaap:NotDesignatedAsHedgingInstrumentEconomicHedgeMember2022-10-300000027673us-gaap:ForeignExchangeContractMemberus-gaap:NotDesignatedAsHedgingInstrumentEconomicHedgeMember2022-10-300000027673us-gaap:CrossCurrencyInterestRateContractMemberus-gaap:NotDesignatedAsHedgingInstrumentEconomicHedgeMember2022-10-300000027673jdcc:UnrelatedExternalCounterpartiesMember2023-10-290000027673jdcc:UltimateParentCompanyAndItsWhollyOwnedSubsidiariesMemberus-gaap:RelatedPartyMember2022-10-300000027673jdcc:UnrelatedExternalCounterpartiesMember2022-10-300000027673us-gaap:PensionPlansDefinedBenefitMember2022-10-312023-10-290000027673us-gaap:OtherPostretirementBenefitPlansDefinedBenefitMember2022-10-312023-10-290000027673us-gaap:OtherPostretirementBenefitPlansDefinedBenefitMember2021-11-012022-10-300000027673us-gaap:OtherPostretirementBenefitPlansDefinedBenefitMember2020-11-022021-10-310000027673us-gaap:FinancialGuaranteeMemberjdcc:JohnDeereFinancialIncMemberus-gaap:MediumTermNotesMember2023-10-290000027673jdcc:MediumTermNotesDueInNextTenYearsMember2023-10-290000027673jdcc:MediumTermNotesDueInNextTenYearsMember2022-10-300000027673us-gaap:RelatedPartyMember2022-10-312023-10-290000027673us-gaap:RelatedPartyMember2021-11-012022-10-300000027673us-gaap:RelatedPartyMember2020-11-022021-10-310000027673country:USus-gaap:AccountsReceivableMemberus-gaap:GeographicConcentrationRiskMember2022-10-312023-10-290000027673us-gaap:AccountingStandardsUpdate202202Member2023-10-290000027673us-gaap:AccountingStandardsUpdate202201Member2023-10-290000027673us-gaap:AccountingStandardsUpdate202110Member2023-10-290000027673us-gaap:AccountingStandardsUpdate202108Member2023-10-290000027673us-gaap:AccountingStandardsUpdate202105Member2023-10-290000027673us-gaap:AccountingStandardsUpdate202104Member2023-10-290000027673us-gaap:FairValueInputsLevel2Memberus-gaap:FairValueMeasurementsRecurringMember2023-10-290000027673us-gaap:FairValueInputsLevel2Memberus-gaap:FairValueMeasurementsRecurringMember2022-10-300000027673us-gaap:RelatedPartyMemberjdcc:TaxSharingAgreementMember2023-10-290000027673us-gaap:NonrelatedPartyMember2023-10-290000027673us-gaap:RelatedPartyMemberjdcc:TaxSharingAgreementMember2022-10-300000027673srt:ScenarioPreviouslyReportedMemberus-gaap:NonrelatedPartyMember2022-10-300000027673srt:RevisionOfPriorPeriodErrorCorrectionAdjustmentMemberus-gaap:NonrelatedPartyMember2022-10-300000027673us-gaap:NonrelatedPartyMember2022-10-300000027673srt:MinimumMemberus-gaap:CommercialPortfolioSegmentMember2022-10-312023-10-290000027673srt:MaximumMemberus-gaap:CommercialPortfolioSegmentMember2022-10-312023-10-290000027673us-gaap:SecuredDebtMember2023-10-290000027673jdcc:ConstructionAndForestryEquipmentMember2023-10-290000027673jdcc:AgricultureAndTurfEquipmentMember2023-10-290000027673jdcc:ConstructionAndForestryEquipmentMember2022-10-300000027673jdcc:AgricultureAndTurfEquipmentMember2022-10-300000027673us-gaap:UnfundedLoanCommitmentMember2023-10-290000027673srt:MinimumMemberjdcc:RetailNotesPortfolioSegmentMember2022-10-312023-10-290000027673srt:MinimumMemberjdcc:RetailNotesPortfolioSegmentMember2021-11-012022-10-300000027673us-gaap:SecuredDebtMember2022-10-312023-10-290000027673country:AR2022-10-312023-10-290000027673country:AR2021-11-012022-10-300000027673us-gaap:ConstructionSectorMemberus-gaap:CommercialPortfolioSegmentMemberus-gaap:FinancialAssetPastDueMember2023-10-290000027673us-gaap:AgriculturalSectorMemberus-gaap:NonperformingFinancingReceivableMemberus-gaap:CommercialPortfolioSegmentMember2023-10-290000027673us-gaap:AgriculturalSectorMemberus-gaap:CommercialPortfolioSegmentMemberus-gaap:FinancialAssetPastDueMember2023-10-290000027673us-gaap:NonUsMember2023-10-290000027673jdcc:FinancingLeasesPortfolioSegmentMember2023-10-290000027673country:US2023-10-290000027673us-gaap:ConstructionSectorMemberus-gaap:CommercialPortfolioSegmentMemberus-gaap:FinancialAssetPastDueMember2022-10-300000027673us-gaap:AgriculturalSectorMemberus-gaap:NonperformingFinancingReceivableMemberus-gaap:CommercialPortfolioSegmentMember2022-10-300000027673srt:ScenarioPreviouslyReportedMemberjdcc:RetailNotesPortfolioSegmentMemberus-gaap:AssetNotPledgedAsCollateralMember2022-10-300000027673srt:RevisionOfPriorPeriodErrorCorrectionAdjustmentMemberjdcc:RetailNotesPortfolioSegmentMemberus-gaap:AssetNotPledgedAsCollateralMember2022-10-300000027673us-gaap:NonUsMember2022-10-300000027673jdcc:FinancingLeasesPortfolioSegmentMember2022-10-300000027673country:US2022-10-300000027673us-gaap:NonUsMember2021-10-310000027673country:US2021-10-310000027673us-gaap:FairValueInputsLevel3Memberus-gaap:AssetPledgedAsCollateralWithRightMember2023-10-290000027673us-gaap:FairValueInputsLevel3Memberus-gaap:AssetNotPledgedAsCollateralMember2023-10-290000027673us-gaap:CarryingReportedAmountFairValueDisclosureMemberus-gaap:AssetPledgedAsCollateralWithRightMember2023-10-290000027673us-gaap:CarryingReportedAmountFairValueDisclosureMemberus-gaap:AssetNotPledgedAsCollateralMember2023-10-290000027673us-gaap:FairValueInputsLevel3Memberus-gaap:AssetPledgedAsCollateralWithRightMember2022-10-300000027673us-gaap:FairValueInputsLevel3Memberus-gaap:AssetNotPledgedAsCollateralMember2022-10-300000027673us-gaap:CarryingReportedAmountFairValueDisclosureMemberus-gaap:AssetPledgedAsCollateralWithRightMember2022-10-300000027673us-gaap:CarryingReportedAmountFairValueDisclosureMemberus-gaap:AssetNotPledgedAsCollateralMember2022-10-300000027673srt:ScenarioPreviouslyReportedMember2022-10-300000027673srt:RevisionOfPriorPeriodErrorCorrectionAdjustmentMember2022-10-300000027673us-gaap:RelatedPartyMember2023-10-290000027673us-gaap:RelatedPartyMember2022-10-300000027673country:AR2023-10-290000027673country:AR2022-10-300000027673us-gaap:FairValueInputsLevel2Member2023-10-290000027673us-gaap:CarryingReportedAmountFairValueDisclosureMember2023-10-290000027673us-gaap:FairValueInputsLevel2Member2022-10-300000027673us-gaap:CarryingReportedAmountFairValueDisclosureMember2022-10-300000027673srt:MinimumMemberus-gaap:AgriculturalSectorMemberjdcc:RetailNotesPortfolioSegmentMember2022-10-312023-10-290000027673srt:MaximumMemberus-gaap:AgriculturalSectorMemberjdcc:RetailNotesPortfolioSegmentMember2022-10-312023-10-290000027673jdcc:UltimateParentCompanyAndItsWhollyOwnedSubsidiariesMemberus-gaap:DerivativeMemberus-gaap:RelatedPartyMember2023-10-290000027673jdcc:UltimateParentCompanyAndItsWhollyOwnedSubsidiariesMemberus-gaap:DerivativeMemberus-gaap:RelatedPartyMember2022-10-300000027673srt:ScenarioPreviouslyReportedMember2021-11-012022-10-300000027673srt:RevisionOfPriorPeriodErrorCorrectionAdjustmentMember2021-11-012022-10-300000027673srt:ScenarioPreviouslyReportedMember2020-11-022021-10-310000027673srt:RevisionOfPriorPeriodErrorCorrectionAdjustmentMember2020-11-022021-10-310000027673jdcc:LongTermDebtNoncurrentMemberus-gaap:InterestRateSwapMember2023-10-290000027673jdcc:DebtCurrentMemberus-gaap:InterestRateSwapMember2023-10-290000027673jdcc:LongTermDebtNoncurrentMemberus-gaap:InterestRateSwapMember2022-10-300000027673jdcc:DebtCurrentMemberus-gaap:InterestRateSwapMember2022-10-300000027673us-gaap:FinancialGuaranteeMemberjdcc:JohnDeereFinancialIncMemberus-gaap:MediumTermNotesMember2022-10-312023-10-290000027673us-gaap:UnfundedLoanCommitmentMember2022-10-312023-10-290000027673us-gaap:UnfundedLoanCommitmentMember2021-11-012022-10-300000027673us-gaap:UnfundedLoanCommitmentMember2020-11-022021-10-310000027673us-gaap:AgriculturalSectorMemberus-gaap:CommercialPortfolioSegmentMemberus-gaap:FinancialAssetPastDueMember2022-10-300000027673us-gaap:ConstructionSectorMemberus-gaap:ConsumerPortfolioSegmentMemberus-gaap:FinancingReceivablesEqualToGreaterThan90DaysPastDueMember2023-10-290000027673us-gaap:ConstructionSectorMemberus-gaap:ConsumerPortfolioSegmentMemberus-gaap:FinancingReceivablesEqualToGreaterThan90DaysPastDueMember2022-10-300000027673us-gaap:AgriculturalSectorMemberus-gaap:ConsumerPortfolioSegmentMemberus-gaap:FinancingReceivablesEqualToGreaterThan90DaysPastDueMember2022-10-300000027673us-gaap:ConstructionSectorMemberus-gaap:PerformingFinancingReceivableMemberus-gaap:CommercialPortfolioSegmentMember2022-10-300000027673us-gaap:ConstructionSectorMemberus-gaap:PerformingFinancingReceivableMemberus-gaap:ConsumerPortfolioSegmentMember2023-10-290000027673us-gaap:ConstructionSectorMemberus-gaap:PerformingFinancingReceivableMemberus-gaap:CommercialPortfolioSegmentMember2023-10-290000027673us-gaap:ConstructionSectorMemberus-gaap:NonperformingFinancingReceivableMemberus-gaap:ConsumerPortfolioSegmentMember2023-10-290000027673us-gaap:ConstructionSectorMemberus-gaap:ConsumerPortfolioSegmentMemberus-gaap:FinancingReceivables60To89DaysPastDueMember2023-10-290000027673us-gaap:ConstructionSectorMemberus-gaap:ConsumerPortfolioSegmentMemberus-gaap:FinancingReceivables30To59DaysPastDueMember2023-10-290000027673us-gaap:AgriculturalSectorMemberus-gaap:PerformingFinancingReceivableMemberus-gaap:ConsumerPortfolioSegmentMember2023-10-290000027673us-gaap:AgriculturalSectorMemberus-gaap:PerformingFinancingReceivableMemberus-gaap:CommercialPortfolioSegmentMember2023-10-290000027673us-gaap:AgriculturalSectorMemberus-gaap:NonperformingFinancingReceivableMemberus-gaap:ConsumerPortfolioSegmentMember2023-10-290000027673us-gaap:AgriculturalSectorMemberus-gaap:ConsumerPortfolioSegmentMemberus-gaap:FinancingReceivablesEqualToGreaterThan90DaysPastDueMember2023-10-290000027673us-gaap:AgriculturalSectorMemberus-gaap:ConsumerPortfolioSegmentMemberus-gaap:FinancingReceivables60To89DaysPastDueMember2023-10-290000027673us-gaap:AgriculturalSectorMemberus-gaap:ConsumerPortfolioSegmentMemberus-gaap:FinancingReceivables30To59DaysPastDueMember2023-10-290000027673us-gaap:ConsumerPortfolioSegmentMember2023-10-290000027673us-gaap:ConstructionSectorMemberus-gaap:PerformingFinancingReceivableMemberus-gaap:ConsumerPortfolioSegmentMember2022-10-300000027673us-gaap:ConstructionSectorMemberus-gaap:NonperformingFinancingReceivableMemberus-gaap:ConsumerPortfolioSegmentMember2022-10-300000027673us-gaap:ConstructionSectorMemberus-gaap:ConsumerPortfolioSegmentMemberus-gaap:FinancingReceivables60To89DaysPastDueMember2022-10-300000027673us-gaap:ConstructionSectorMemberus-gaap:ConsumerPortfolioSegmentMemberus-gaap:FinancingReceivables30To59DaysPastDueMember2022-10-300000027673us-gaap:AgriculturalSectorMemberus-gaap:PerformingFinancingReceivableMemberus-gaap:ConsumerPortfolioSegmentMember2022-10-300000027673us-gaap:AgriculturalSectorMemberus-gaap:PerformingFinancingReceivableMemberus-gaap:CommercialPortfolioSegmentMember2022-10-300000027673us-gaap:AgriculturalSectorMemberus-gaap:NonperformingFinancingReceivableMemberus-gaap:ConsumerPortfolioSegmentMember2022-10-300000027673us-gaap:AgriculturalSectorMemberus-gaap:ConsumerPortfolioSegmentMemberus-gaap:FinancingReceivables60To89DaysPastDueMember2022-10-300000027673us-gaap:AgriculturalSectorMemberus-gaap:ConsumerPortfolioSegmentMemberus-gaap:FinancingReceivables30To59DaysPastDueMember2022-10-300000027673us-gaap:ConsumerPortfolioSegmentMember2022-10-300000027673us-gaap:ConsumerPortfolioSegmentMember2022-10-312023-10-290000027673jdcc:UsedEquipmentMemberus-gaap:ConstructionSectorMemberjdcc:RetailNotesPortfolioSegmentMemberus-gaap:AssetPledgedAsCollateralWithRightMember2023-10-290000027673jdcc:UsedEquipmentMemberus-gaap:ConstructionSectorMemberjdcc:RetailNotesPortfolioSegmentMemberus-gaap:AssetNotPledgedAsCollateralMember2023-10-290000027673jdcc:UsedEquipmentMemberus-gaap:AgriculturalSectorMemberjdcc:RetailNotesPortfolioSegmentMemberus-gaap:AssetPledgedAsCollateralWithRightMember2023-10-290000027673jdcc:UsedEquipmentMemberus-gaap:AgriculturalSectorMemberjdcc:RetailNotesPortfolioSegmentMemberus-gaap:AssetNotPledgedAsCollateralMember2023-10-290000027673jdcc:NewEquipmentMemberus-gaap:ConstructionSectorMemberjdcc:RetailNotesPortfolioSegmentMemberus-gaap:AssetPledgedAsCollateralWithRightMember2023-10-290000027673jdcc:NewEquipmentMemberus-gaap:ConstructionSectorMemberjdcc:RetailNotesPortfolioSegmentMemberus-gaap:AssetNotPledgedAsCollateralMember2023-10-290000027673jdcc:NewEquipmentMemberus-gaap:AgriculturalSectorMemberjdcc:RetailNotesPortfolioSegmentMemberus-gaap:AssetPledgedAsCollateralWithRightMember2023-10-290000027673jdcc:NewEquipmentMemberus-gaap:AgriculturalSectorMemberjdcc:RetailNotesPortfolioSegmentMemberus-gaap:AssetNotPledgedAsCollateralMember2023-10-290000027673jdcc:RetailNotesPortfolioSegmentMemberus-gaap:AssetPledgedAsCollateralWithRightMember2023-10-290000027673jdcc:RetailNotesPortfolioSegmentMemberus-gaap:AssetNotPledgedAsCollateralMember2023-10-290000027673jdcc:UsedEquipmentMemberus-gaap:ConstructionSectorMemberjdcc:RetailNotesPortfolioSegmentMemberus-gaap:AssetPledgedAsCollateralWithRightMember2022-10-300000027673jdcc:UsedEquipmentMemberus-gaap:ConstructionSectorMemberjdcc:RetailNotesPortfolioSegmentMemberus-gaap:AssetNotPledgedAsCollateralMember2022-10-300000027673jdcc:UsedEquipmentMemberus-gaap:AgriculturalSectorMemberjdcc:RetailNotesPortfolioSegmentMemberus-gaap:AssetPledgedAsCollateralWithRightMember2022-10-300000027673jdcc:UsedEquipmentMemberus-gaap:AgriculturalSectorMemberjdcc:RetailNotesPortfolioSegmentMemberus-gaap:AssetNotPledgedAsCollateralMember2022-10-300000027673jdcc:NewEquipmentMemberus-gaap:ConstructionSectorMemberjdcc:RetailNotesPortfolioSegmentMemberus-gaap:AssetPledgedAsCollateralWithRightMember2022-10-300000027673jdcc:NewEquipmentMemberus-gaap:ConstructionSectorMemberjdcc:RetailNotesPortfolioSegmentMemberus-gaap:AssetNotPledgedAsCollateralMember2022-10-300000027673jdcc:NewEquipmentMemberus-gaap:AgriculturalSectorMemberjdcc:RetailNotesPortfolioSegmentMemberus-gaap:AssetPledgedAsCollateralWithRightMember2022-10-300000027673jdcc:NewEquipmentMemberus-gaap:AgriculturalSectorMemberjdcc:RetailNotesPortfolioSegmentMemberus-gaap:AssetNotPledgedAsCollateralMember2022-10-300000027673jdcc:RetailNotesPortfolioSegmentMemberus-gaap:AssetPledgedAsCollateralWithRightMember2022-10-300000027673jdcc:RetailNotesPortfolioSegmentMemberus-gaap:AssetNotPledgedAsCollateralMember2022-10-300000027673us-gaap:CommercialPortfolioSegmentMember2021-11-012022-10-300000027673us-gaap:CommercialPortfolioSegmentMember2020-11-022021-10-310000027673us-gaap:ConstructionSectorMemberjdcc:RetailNotesAndFinanceLeasesPortfolioSegmentMember2022-10-312023-10-290000027673us-gaap:AgriculturalSectorMemberjdcc:RetailNotesAndFinanceLeasesPortfolioSegmentMember2022-10-312023-10-290000027673us-gaap:CommercialPortfolioSegmentMember2022-10-312023-10-290000027673jdcc:RetailRevolvingChargeAccountsPortfolioSegmentMember2022-10-312023-10-290000027673jdcc:RetailNotesAndFinanceLeasesPortfolioSegmentMember2022-10-312023-10-290000027673us-gaap:ConstructionSectorMemberjdcc:RetailNotesAndFinanceLeasesPortfolioSegmentMember2021-11-012022-10-300000027673us-gaap:AgriculturalSectorMemberjdcc:RetailNotesAndFinanceLeasesPortfolioSegmentMember2021-11-012022-10-300000027673jdcc:RetailRevolvingChargeAccountsPortfolioSegmentMember2021-11-012022-10-300000027673jdcc:RetailNotesAndFinanceLeasesPortfolioSegmentMember2021-11-012022-10-300000027673us-gaap:ConstructionSectorMemberjdcc:RetailNotesAndFinanceLeasesPortfolioSegmentMember2020-11-022021-10-310000027673us-gaap:AgriculturalSectorMemberjdcc:RetailNotesAndFinanceLeasesPortfolioSegmentMember2020-11-022021-10-310000027673jdcc:RetailRevolvingChargeAccountsPortfolioSegmentMember2020-11-022021-10-310000027673jdcc:RetailNotesAndFinanceLeasesPortfolioSegmentMember2020-11-022021-10-310000027673us-gaap:CommercialPortfolioSegmentMember2023-10-290000027673jdcc:RetailRevolvingChargeAccountsPortfolioSegmentMember2023-10-290000027673jdcc:RetailNotesAndFinanceLeasesPortfolioSegmentMember2023-10-290000027673us-gaap:CommercialPortfolioSegmentMember2022-10-300000027673jdcc:RetailRevolvingChargeAccountsPortfolioSegmentMember2022-10-300000027673jdcc:RetailNotesAndFinanceLeasesPortfolioSegmentMember2022-10-300000027673us-gaap:CommercialPortfolioSegmentMember2021-10-310000027673jdcc:RetailRevolvingChargeAccountsPortfolioSegmentMember2021-10-310000027673jdcc:RetailNotesAndFinanceLeasesPortfolioSegmentMember2021-10-3100000276732021-10-310000027673srt:CumulativeEffectPeriodOfAdoptionAdjustmentMemberus-gaap:AccountingStandardsUpdate201613Memberus-gaap:CommercialPortfolioSegmentMember2020-11-010000027673srt:CumulativeEffectPeriodOfAdoptionAdjustmentMemberus-gaap:AccountingStandardsUpdate201613Memberjdcc:RetailRevolvingChargeAccountsPortfolioSegmentMember2020-11-010000027673srt:CumulativeEffectPeriodOfAdoptionAdjustmentMemberus-gaap:AccountingStandardsUpdate201613Memberjdcc:RetailNotesAndFinanceLeasesPortfolioSegmentMember2020-11-010000027673srt:CumulativeEffectPeriodOfAdoptionAdjustmentMemberus-gaap:AccountingStandardsUpdate201613Member2020-11-010000027673us-gaap:CommercialPortfolioSegmentMember2020-11-010000027673jdcc:RetailRevolvingChargeAccountsPortfolioSegmentMember2020-11-010000027673jdcc:RetailNotesAndFinanceLeasesPortfolioSegmentMember2020-11-0100000276732020-11-010000027673us-gaap:NonperformingFinancingReceivableMember2022-10-312023-10-290000027673us-gaap:NonperformingFinancingReceivableMember2021-11-012022-10-300000027673us-gaap:NonperformingFinancingReceivableMember2020-11-022021-10-310000027673currency:ARS2023-10-290000027673currency:ARS2022-10-300000027673us-gaap:SubsequentEventMember2023-12-072023-12-070000027673us-gaap:EquityMethodInvestmentNonconsolidatedInvesteeOrGroupOfInvesteesMember2023-10-290000027673us-gaap:EquityMethodInvestmentNonconsolidatedInvesteeOrGroupOfInvesteesMember2022-10-3000000276732021-11-012022-10-3000000276732020-11-022021-10-3100000276732022-10-300000027673us-gaap:CommonStockMember2022-10-312023-10-290000027673jdcc:BankConduitFacilitiesRevolvingCreditAgreementMemberus-gaap:SubsequentEventMember2023-11-260000027673jdcc:BankConduitFacilitiesRevolvingCreditAgreementMember2023-10-290000027673jdcc:UltimateParentCompanyAndItsWhollyOwnedSubsidiariesMemberus-gaap:RelatedPartyMember2023-10-290000027673jdcc:UltimateParentCompanyAndItsWhollyOwnedSubsidiariesMemberus-gaap:RelatedPartyMember2022-10-312023-10-2900000276732023-10-2900000276732023-12-1500000276732022-10-312023-10-29xbrli:sharesiso4217:USDxbrli:purejdcc:itemiso4217:USDxbrli:shares

Table of Contents

UNITED STATES

SECURITIES AND EXCHANGE COMMISSION

WASHINGTON, D.C. 20549

FORM 10-K

(Mark one)

ANNUAL REPORT PURSUANT TO SECTION 13 OR 15(d) OF THE SECURITIES EXCHANGE ACT OF 1934

For the fiscal year ended October 29, 2023

or

TRANSITION REPORT PURSUANT TO SECTION 13 OR 15(d) OF THE SECURITIES EXCHANGE ACT OF 1934

For the transition period from ____ to ____

Commission file number 1-6458

JOHN DEERE CAPITAL CORPORATION

(Exact name of registrant as specified in its charter)

Delaware

36-2386361

(State of incorporation)

(IRS Employer Identification No.)

P.O. Box 5328

Madison, Wisconsin

53705-0328

(800) 438-7394

(Address of principal executive offices)

(Zip Code)

(Telephone number)

SECURITIES REGISTERED PURSUANT TO SECTION 12(b) OF THE ACT:

Title of each class

Trading symbol

Name of each exchange on which registered

2.00% Senior Notes Due 2031

JDCC 31

New York Stock Exchange

SECURITIES REGISTERED PURSUANT TO SECTION 12(g) OF THE ACT: NONE

Indicate by check mark if the registrant is a well-known seasoned issuer, as defined in Rule 405 of the Securities Act.

Yes    No 

Indicate by check mark if the registrant is not required to file reports pursuant to Section 13 or Section 15(d) of the Act.

Yes    No 

Indicate by check mark whether the registrant (1) has filed all reports required to be filed by Section 13 or 15(d) of the Securities Exchange Act of 1934 during the preceding 12 months (or for such shorter period that the registrant was required to file such reports), and (2) has been subject to such filing requirements for the past 90 days.

Yes    No 

Indicate by check mark whether the registrant has submitted electronically every Interactive Data File required to be submitted pursuant to Rule 405 of Regulation S-T (§232.405 of this chapter) during the preceding 12 months (or for such shorter period that the registrant was required to submit such files).

Yes    No 

Indicate by check mark whether the registrant is a large accelerated filer, an accelerated filer, a non-accelerated filer, a smaller reporting company, or an emerging growth company. See the definitions of “large accelerated filer,” “accelerated filer,” “smaller reporting company,” and “emerging growth company” in Rule 12b-2 of the Exchange Act.

Large accelerated filer 

Accelerated filer 

Non-accelerated filer 

Smaller reporting company

Emerging growth company

If an emerging growth company, indicate by check mark if the registrant has elected not to use the extended transition period for complying with any new or revised financial accounting standards provided pursuant to Section 13(a) of the Exchange Act.

Indicate by check mark whether the registrant has filed a report on and attestation to its management’s assessment of the effectiveness of its internal control over financial reporting under Section 404(b) of the Sarbanes-Oxley Act (15 U.S.C. 7262(b)) by the registered public accounting firm that prepared or issued its audit report.

If securities are registered pursuant to Section 12(b) of the Act, indicate by check mark whether the financial statements of the registrant included in the filing reflect the correction of an error to previously issued financial statements.

Indicate by check mark whether any of those error corrections are restatements that required a recovery analysis of incentive-based compensation received by any of the registrant’s executive officers during the relevant recovery period pursuant to §240.10D-1(b).

Indicate by check mark whether the registrant is a shell company (as defined in Rule 12b-2 of the Act). Yes    No 

At December 15, 2023, 2,500 shares of common stock, without par value, of the registrant were outstanding, all of which were owned by John Deere Financial Services, Inc., a wholly-owned subsidiary of Deere & Company.

The registrant meets the conditions set forth in General Instruction I(1)(a) and (b) of Form 10-K and is therefore filing this Annual Report on Form 10-K with certain reduced disclosures as permitted by Instruction I(2).

Table of Contents

Table of Contents

Page

PART I

Item 1.

Business

2

Item 1A.

Risk Factors

10

Item 1B.

Unresolved Staff Comments

20

Item 2.

Properties

20

Item 3.

Legal Proceedings

20

Item 4.

Mine Safety Disclosures

20

PART II

Item 5.

Market for Registrant’s Common Equity, Related Stockholder Matters and Issuer Purchases of Equity Securities

21

Item 6.

[Reserved]

21

Item 7.

Management’s Discussion and Analysis of Financial Condition and Results of Operations

21

Item 7A.

Quantitative and Qualitative Disclosures About Market Risk

31

Item 8.

Financial Statements and Supplementary Data

32

Item 9.

Changes in and Disagreements with Accountants on Accounting and Financial Disclosure

32

Item 9A.

Controls and Procedures

32

Item 9B.

Other Information

33

Item 9C.

Disclosure Regarding Foreign Jurisdictions That Prevent Inspections

33

PART III

Item 10.

Directors, Executive Officers and Corporate Governance

33

Item 11.

Executive Compensation

33

Item 12.

Security Ownership of Certain Beneficial Owners and Management and Related Stockholder Matters

33

Item 13.

Certain Relationships and Related Transactions, and Director Independence

33

Item 14.

Principal Accountant Fees and Services

33

PART IV

Item 15.

Exhibits and Financial Statement Schedules

34

Item 16.

Form 10-K Summary

34

1

Table of Contents

PART I

Item 1.  Business.

This Annual Report on Form 10-K contains forward-looking statements that are subject to risks and uncertainties. All statements other than statements of historical fact included in this Annual Report on Form 10-K are forward-looking statements. Forward-looking statements provide our current expectations and projections relating to our financial condition, results of operations, plans, objectives, future performance, and business. You can identify forward-looking statements as they do not relate to historical or current facts and by words such as “believe,” “expect,” “estimate,” “anticipate,” “will,” “should,” “plan,” “forecast,” “target,” “guide,” “project,” “intend,” “could,” and similar words or expressions.

All forward-looking statements are subject to risks and uncertainties that may cause actual results to differ materially from those that we expected. Important factors that could cause actual results to differ materially from our expectations, or cautionary statements, and other important information about forward-looking statements are disclosed under Item 1A, “Risk Factors,” and Item 7, “Management’s Discussion and Analysis of Financial Condition and Results of Operations–Forward-Looking Statements” in this Annual Report on Form 10-K.

Presentation of Amounts

All amounts are presented in millions of dollars, unless otherwise specified.

The Company

John Deere Capital Corporation (Capital Corporation) and its subsidiaries are collectively called “we,” “us,” “our” or “the Company.” John Deere Financial Services, Inc. (JDFS), a wholly-owned finance holding subsidiary of Deere & Company, owns all of the outstanding common stock of Capital Corporation. See “Our Relationships with John Deere” for additional information regarding agreements between us and Deere & Company. We conduct business in Australia, New Zealand, the United States (U.S.), and in several countries in Africa, Asia, Europe, and Latin America, including Argentina and Mexico. Capital Corporation was incorporated under the laws of Delaware and commenced operations in 1958.

We provide and administer financing for retail purchases of new equipment manufactured by Deere & Company’s production and precision agriculture operations, small agriculture and turf operations, and construction and forestry operations and used equipment taken in trade for this equipment. References to “agriculture and turf” include both production and precision agriculture and small agriculture and turf. We generally purchase retail installment sales and loan contracts (retail notes) from Deere & Company and its wholly-owned subsidiaries (collectively called John Deere). John Deere generally acquires these retail notes through independent John Deere retail dealers. We also purchase and finance a limited amount of non-John Deere retail notes. In addition, we finance and service revolving charge accounts, in most cases acquired from and offered through merchants in the agriculture and turf and construction and forestry markets (revolving charge accounts). We also provide wholesale financing to dealers of John Deere agriculture and turf equipment and construction and forestry equipment, primarily to finance inventories of equipment for those dealers (wholesale receivables). Further, we lease John Deere equipment and a limited amount of non-John Deere equipment to retail customers (financing and operating leases). We also offer credit enhanced international export financing to select customers and dealers, which primarily involves John Deere products. Retail notes, revolving charge accounts, and financing leases are collectively called “Customer Receivables.” Customer Receivables and wholesale receivables are collectively called “Receivables.” Receivables and equipment on operating leases are collectively called “Receivables and Leases.” We generally secure our Receivables, other than certain revolving charge accounts, by retaining as collateral security in the goods associated with those Receivables or with the use of other collateral.

Deere & Company’s internet address is https://www.deere.com. The information contained on John Deere’s website is not included in, nor incorporated by reference into, this Annual Report on Form 10-K.

2

Table of Contents

Business of John Deere

John Deere’s operations are categorized into four business segments:

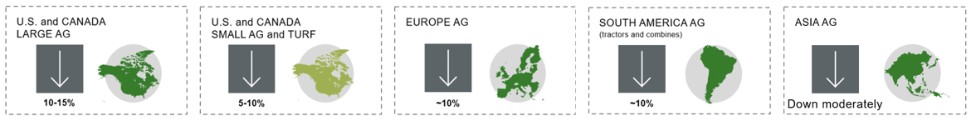
The production and precision agriculture segment defines, develops, and delivers global equipment and technology solutions for production-scale growers of crops like large grains (such as corn and soy), small grains (such as wheat, oats, and barley), cotton, and sugarcane. Equipment manufactured and distributed by the segment includes large and certain mid-size tractors, combines, cotton pickers, cotton strippers, sugarcane harvesters, related harvesting front-end equipment, and pull-behind scrapers. In addition, the segment includes tillage, seeding, and application equipment, including sprayers and nutrient management and soil preparation machinery.

The small agriculture and turf segment defines, develops, and delivers global equipment and technology solutions designed to unlock customer value for dairy and livestock producers, high-value crop producers, and turf and utility customers. Equipment manufactured and distributed by the segment include certain mid-size, small and utility tractors, and related loaders and attachments; turf and utility equipment, including riding lawn equipment, commercial mowing equipment, golf course equipment, utility vehicles, implements for mowing, tiling, snow and debris handling, aerating, and other residential, commercial, golf, and sports turf care applications; and hay and forage equipment, including self-propelled forage harvesters and attachments, balers, and mowers.

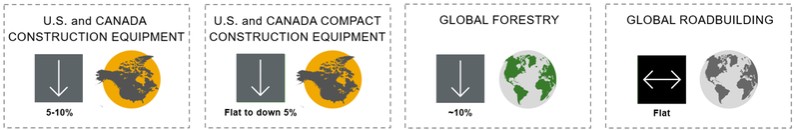
The construction and forestry segment delivers a robust portfolio of construction, roadbuilding, and forestry products with precision technology solutions. The segment’s primary construction products include excavators, wheel loaders, motor graders, dozers, backhoes, articulated dump trucks, compact construction equipment including skid steers, compact excavators, and compact truck loaders, along with a variety of attachments. The segment’s primary roadbuilding products include milling machines, pavers, compactors, rollers, crushers, screens and asphalt plants, and the primary forestry products include skidders, feller bunchers, forwarders, knuckleboom loaders, harvesters, swing machines, and precision forestry technology solutions.

The products and services produced by the segments above are marketed primarily through independent retail dealer networks and major retail outlets. For roadbuilding products in certain markets outside the U.S. and Canada, the products are sold through John Deere-owned sales and service subsidiaries.

The financial services segment includes our operations (described herein) and additional operations in the U.S., Canada, Brazil, China, India, and Thailand. The operations in Russia were sold in the second quarter of fiscal year 2023. The segment primarily finances sales and leases by John Deere dealers of new and used production and precision agriculture equipment, small agriculture and turf equipment, and construction and forestry equipment. In addition, the financial services segment provides wholesale financing to dealers of the foregoing equipment, finances retail revolving charge accounts, and offers extended equipment warranties.

John Deere’s worldwide production and precision agriculture operations, small agriculture and turf operations, and construction and forestry operations are sometimes collectively referred to as the “equipment operations.” The financial services segment is sometimes referred to as the “financial services operations.” Receivables and Leases managed by us are evaluated by market (agriculture and turf or construction and forestry).

For fiscal 2023, worldwide net income attributable to Deere & Company was $10.166 billion, or $34.63 per share, compared with $7.131 billion, or $23.28 per share, in fiscal 2022.

Deere & Company’s consolidated net sales and revenues increased 16 percent to $61.251 billion in 2023, compared with $52.577 billion in 2022. Net sales of the equipment operations increased in fiscal 2023 to $55.565 billion, compared with $47.917 billion last year, due to favorable industry fundamentals and strong demand for farm and construction equipment.

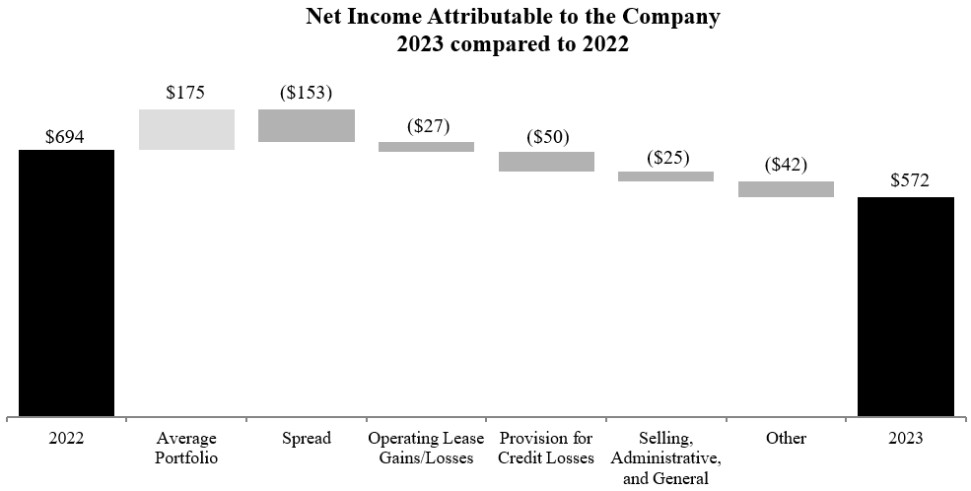
The financial services operations reported net income of $619 for fiscal 2023 compared with $880 in fiscal 2022. Net income declined as a result of the unfavorable impact of higher interest rates on financing spreads and a correction of the accounting treatment for financing incentives offered to John Deere dealers. In 2022, financial services increased the provision for credit losses in Russia and recorded an intercompany benefit from the equipment operations, which guarantees financial services’ investments in certain international markets, including Russia.

3

Table of Contents

Smart Industrial Operating Model and Leap Ambitions

John Deere announced the Smart Industrial Operating Model in 2020.  This operating model is based on three focus areas:

(a)Production systems: A strategic alignment of products and solutions around John Deere customers’ operations.
(b)Technology stack: Investments in technology, as well as research and development, that deliver intelligent solutions to John Deere customers through digital capabilities, automation, autonomy, and alternative power technologies.
(c)Lifecycle solutions: The integration of John Deere’s aftermarket and support capabilities to more effectively manage customer equipment, service, and technology needs across the full lifetime of a John Deere product.

John Deere’s Leap Ambitions were launched in 2022. These ambitions are designed to boost economic value and sustainability. The ambitions align across the production systems of John Deere customers, seeking to optimize their operations to deliver better outcomes with fewer resources. As an enabling business, we are fully integrated with John Deere’s Smart Industrial Operating Model and are focused on providing financial solutions to help John Deere achieve its Leap Ambitions.

Our Relationships with John Deere

Our results of operations are affected by our relationships with John Deere, including, among other items, the terms on which we acquire Receivables and borrow funds from John Deere, the reimbursement for interest waiver and low-rate finance programs from John Deere, the compensation paid by John Deere in connection with our purchase of trade receivables from John Deere, and the payment to John Deere for various expenses applicable to our operations. In addition, we have joint access with John Deere to certain lines of credit.

Our volume of Receivables and Leases is largely dependent upon the level of retail sales and leases of John Deere products. The level of John Deere retail sales and leases is responsive to a variety of economic, financial, geopolitical, climatic, legislative, and other factors that influence supply and demand for its products. The majority of our business is affected by changes in interest rates, demand for credit, and competition.

We bear substantially all of the credit risk (net of recovery from withholdings from certain John Deere dealers and merchants) associated with our holding of Receivables and Leases. A small portion of the Receivables and Leases held (less than 5 percent) is guaranteed by certain subsidiaries of Deere & Company. We also perform substantially all servicing and collection functions. Servicing and collection functions for a small portion of the Receivables and Leases held (less than 5 percent) are provided by John Deere. John Deere is reimbursed for staff and other administrative services at estimated cost and for credit lines provided to us based on utilization of those lines.

The terms and the basis on which we acquire retail notes and certain wholesale receivables from John Deere are governed by agreements with John Deere, generally terminable by either John Deere or us on 30 days’ notice. As provided in these agreements, we agree to the terms and conditions for purchasing the retail notes and wholesale receivables from John Deere. Under these agreements, John Deere is not obligated to sell notes to us, and we are obligated to purchase notes from John Deere only if the notes comply with the terms and conditions set by us.

The basis on which John Deere acquires retail notes and wholesale receivables from John Deere dealers is governed by agreements with those dealers, which may be terminated in accordance with their terms and applicable law. In acquiring these notes from dealers, the terms and conditions, as set forth in agreements with the dealers, conform with the terms and conditions adopted by us in determining the acceptability of retail and certain wholesale receivables to be purchased from John Deere. The dealers are not obligated to sell these notes to John Deere and John Deere is not obligated to accept these notes from the dealers. In practice, retail and wholesale receivables are acquired from dealers only if the terms of these notes and the creditworthiness of the customers are acceptable to us. We act on behalf of both ourselves and John Deere in determining the acceptability of the notes and in acquiring acceptable notes from dealers.

The basis on which we enter into leases with retail customers through John Deere dealers is governed by agreements between those dealers and us. Leases are accepted based on the terms and conditions, the lessees’ creditworthiness, the anticipated residual values of the equipment, and the intended use of the equipment.

4

Table of Contents

Deere & Company has an agreement with us pursuant to which it has agreed to continue to own, directly or through one or more wholly-owned subsidiaries, at least 51 percent of the voting shares of capital stock of Capital Corporation and to maintain our consolidated tangible net worth at not less than $50.0. This agreement also obligates Deere & Company to make payments to us such that our consolidated ratio of earnings to fixed charges is not less than 1.05 to 1 for any four consecutive fiscal quarterly periods. Deere & Company’s obligations to make payments to us under the agreement are independent of whether we are in default on our indebtedness, obligations, or other liabilities. Further, Deere & Company’s obligations under the agreement are not measured by the amount of our indebtedness, obligations, or other liabilities. Deere & Company’s obligations to make payments under this agreement are expressly stated not to be a guarantee of any specific indebtedness, obligation, or liability of ours and are enforceable only by or in the name of Capital Corporation. No payments were required under this agreement during the periods included in the consolidated financial statements. At October 29, 2023, Deere & Company indirectly owned 100 percent of the voting shares of Capital Corporation’s capital stock and our consolidated tangible net worth was $5,901.6.

We purchase certain wholesale trade receivables from John Deere. These trade receivables arise from John Deere’s sales of goods to independent dealers. Under the terms of the sales to dealers, interest is primarily charged to dealers on outstanding balances from the earlier of the date when goods are sold to retail customers by the dealer or the expiration of certain interest-free periods granted at the time of the sale to the dealer, until payment is received by us. Dealers cannot cancel purchases after John Deere recognizes a sale and are responsible for payment even if the equipment is not sold to retail customers. The interest-free periods are determined based on the type of equipment sold and the time of year of the sale. These periods range from one to twelve months for most equipment. Interest-free periods may not be extended. Interest charged may not be forgiven and the past due interest rates exceed market rates. We receive compensation from John Deere at approximate market interest rates for these interest-free periods. We compute the compensation from John Deere for interest-free periods based on our estimated funding costs, administrative and operating expenses, credit losses, and required return on equity.

A portion of finance income earned by us arises from financing of retail sales of John Deere equipment on which finance charges are waived or reduced by John Deere for a period from the date of the retail sale to a specified subsequent date. We receive compensation from John Deere equal to competitive market interest rates for periods during which finance charges have been waived or reduced. We compute the compensation from John Deere for waived or reduced finance charges based on our estimated funding costs, administrative and operating expenses, credit losses, and required return on equity. The financing rate following the waiver or interest reduction period is not significantly different from the compensation rate from John Deere.

Description of Receivables and Leases

Receivables and Leases arise mainly from retail and wholesale sales and leases of John Deere products and used equipment accepted in trade for them, and from retail sales of equipment of unrelated manufacturers. Receivables and Leases also include revolving charge receivables. At October 29, 2023 and October 30, 2022, at least 90 percent of the Receivables and Leases administered by us were for financing that facilitated the purchase or lease of John Deere products.

John Deere Financial, f.s.b. (Thrift) is a wholly-owned subsidiary of Capital Corporation. It holds a federal thrift charter and is regulated by the Office of the Comptroller of the Currency (OCC). The U.S. Federal Reserve Board has oversight of us, as the owner of the Thrift. The Thrift is headquartered in Wisconsin and offers the following revolving charge products throughout the U.S.:

John Deere Financial Multi-Use AccountTM is used by farmers and ranchers to finance their purchases of production inputs from agribusiness merchants, including seed, fertilizer, and crop protection. It is also used by agriculture and turf customers to finance the purchase of parts and service from John Deere dealers.
PowerPlanTM is used by construction and forestry customers to finance the purchase of equipment parts, equipment rentals, and service work performed at John Deere construction and forestry dealers.
John Deere Financial Revolving Plan is used by retail customers of John Deere dealers to finance purchases of turf and utility equipment.

5

Table of Contents

We provide wholesale financing to John Deere dealers, primarily to finance agriculture and turf and construction and forestry equipment inventories. A large portion of the wholesale financing is provided by us to dealers from whom we also purchase agriculture and turf and construction and forestry retail notes.

We generally require that theft and physical damage insurance be carried on all goods leased or securing retail notes and wholesale receivables. In certain markets, the customer may, at the customer’s own expense, have us or the seller of the goods purchase this insurance or obtain it from other sources. Insurance is not required for goods purchased under revolving charge accounts.

Receivables and Leases are eligible for acceptance if they conform to prescribed finance and lease plan terms. In limited circumstances, Receivables and Leases may be accepted even though they do not conform in all respects to the established guidelines. We determine whether Receivables and Leases should be accepted and how they should be serviced. Acceptance of these Receivables and Leases is dependent on having one or more risk mitigation enhancements that may include larger down payments or advance lease payments, additional co-borrowers or guarantors, the pledge of additional collateral as security, the assignment of specific earnings to us, or the acceptance of accelerated payment schedules. Our officers are responsible for establishing policies and reviewing our performance in accepting and collecting Receivables and Leases. We perform substantially all of our own routine collections, settlements, and repossessions on Receivables and Leases.

John Deere retail notes and wholesale receivables are generally supported by perfected security interests in goods financed under laws such as the Uniform Commercial Code (UCC), certain federal statutes, and state motor vehicle laws in the U.S. and by security in goods or other security under applicable laws in other countries and jurisdictions. UCC financing statements are also prepared and filed on leases; however, these filings for operating leases are made for informational purposes only.

Finance Rates on Retail Notes

As of October 29, 2023 and October 30, 2022, over 95 percent of the retail notes held by us bore a fixed finance rate. A portion of the finance income earned by us arises from reimbursements from John Deere in connection with financing the retail sales of John Deere equipment on which finance charges are waived or reduced by John Deere for a period from the date of sale to a specified subsequent date. See Note 3 to the Consolidated Financial Statements for additional information.

Average Original Term and Average Actual Life of Retail Notes and Leases

Due to prepayments (often from trade-ins and refinancing), the average actual life of retail notes and leases is considerably shorter than the average original term. The following table shows the average original term for retail notes and leases acquired during the year and the average actual life for retail notes and leases liquidated during the year (in months):

Average Original Term

Average Actual Life


2023


2022


2023


2022

Retail notes:


57


58


34


35

New equipment:

Agriculture and turf


57


58


32


34

Construction and forestry


52


51


38


36

Used equipment:

Agriculture and turf


60


61


35


37

Construction and forestry


52


51


31


29

Financing leases


26


28


23


26

Equipment on operating leases


45


46


33


35

6

Table of Contents

Maturities

The following table presents the contractual maturities of Receivables and Leases owned by us at October 29, 2023 and a summary of Receivables and Leases owned by us at October 30, 2022:

One year

or less

One to five years

Five to fifteen years

Total


Fixed


 Variable 


Fixed


 Variable 


rate

rate

rate

rate

2023

2022

Retail notes:

Agriculture and turf

$

8,110.7

$

17,587.8

$

353.8

$

649.5

$

6.5

$

26,708.3

$

23,796.5

Construction and forestry


2,057.3


3,207.9


6.0


18.4


5,289.6


4,954.1

Total retail notes

10,168.0

20,795.7

359.8

667.9

6.5


31,997.9


28,750.6

Revolving charge accounts

4,435.2

63.4

95.8


4,594.4


4,165.8

Wholesale receivables

12,893.7

157.5

277.1

1.8


13,330.1


8,404.5

Financing leases

874.9

537.2

9.7


1,421.8


1,120.7

Equipment on operating leases

988.7

3,952.2

110.6


5,051.5


4,853.5

Total Receivables and Leases

$

29,360.5

$

25,506.0

$

732.7

$

790.0

$

6.5

$

56,395.7

$

47,295.1

Net Write-offs

Receivable balances are written off to the allowance for credit losses when, in the judgment of management, they are considered uncollectible. Write-offs generally occur when Customer Receivables are 120 days delinquent, and on a case-by-case basis when wholesale receivables are 60 days delinquent.

Total net (write-offs) recoveries, by product, were as follows:


2023


2022


2021


Dollars

Percent

Dollars

Percent

Dollars

Percent

Net write-offs:

Retail notes and financing leases:

Agriculture and turf

$

(22.9)

(.09)

%

$

(11.2)

(.04)

%

$

(9.4)

(.04)

%

Construction and forestry


(25.0)

(.47)


(15.1)

(.30)


(15.7)

(.36)

Total retail notes and financing leases


(47.9)

(.16)


(26.3)

(.10)


(25.1)

(.10)

Revolving charge accounts


(22.6)

(.59)


2.9

.09


7.7

.23

Wholesale receivables


.4

.01


(.2)


(.3)

Total net write-offs

$

(70.1)

(.15)

%

$

(23.6)

(.06)

%

$

(17.7)

(.05)

%

Net write-offs as a percent of portfolio increased in 2023 from near record lows in 2022 and 2021, but remain below the 10 year average of .18 percent.

Allowance for Credit Losses

The total allowance for credit losses, by product, at October 29, 2023 and October 30, 2022, and the portfolio, by product, as a percent of total portfolio are presented below:

2023

2022


Dollars


Percent


Dollars


Percent


Retail notes and financing leases:

Agriculture and turf

$

55.4


54

%

$

43.1


58

%

Construction and forestry


59.5


11


52.3


12

Total retail notes and financing leases


114.9


65


95.4


70

Revolving charge accounts


20.4


9


21.9


10

Wholesale receivables


11.1


26


11.1


20

Total

$

146.4


100

%

$

128.4


100

%

7

Table of Contents

Key credit quality metrics and related portfolio balances at October 29, 2023 and October 30, 2022 were as follows:

2023

2022

Dollars


Dollars


Receivables 30 days or more past due

$

514.1

$

404.9

Non-performing Receivables

383.1

263.2

Allowance for credit losses

146.4

128.4

Total Receivables

51,344.2

42,441.6

2023

2022

Percent

Percent

Receivables 30 days or more past due to total Receivables

1.00

%

.95

%

Non-performing Receivables to total Receivables

.75

.62

Allowance for credit losses to total Receivables

.29

.30

Allowance for credit losses to non-performing Receivables

38.21

48.78

The Receivables portfolio continued to perform well in 2023. While certain portfolio quality metrics summarized above have diminished slightly from the prior year, past due and non-performing Receivables remain at historically healthy levels. The allowance for credit losses as a percent of total portfolio was relatively stable in 2023, as the impact of portfolio growth in wholesale receivables offset the impact of higher allowances on turf and construction customer accounts.

Competition

The businesses in which we are engaged are highly competitive. We primarily compete for customers with commercial banks and finance and leasing companies based upon our service, finance rates charged, and other finance terms. In addition, the competitive landscape is evolving as technology is unlocking new capabilities for traditional competitors and enabling new digital entrants that could be either technology partners or potential competitors. The proportion of John Deere equipment retail sales and leases financed by us is influenced by conditions prevailing in the agriculture and turf equipment and construction and forestry equipment markets, in the financial markets, and in business generally. We financed a significant portion of John Deere equipment retail sales and leases in many of the countries in which we operated during 2023 and 2022.

We emphasize convenient service to customers and endeavor to offer terms desired in our specialized markets, such as seasonal schedules of repayment and rentals. Our retail finance rates and lease rates are generally believed to be in the range offered by other sales finance and leasing companies, although not as low as those of some banks and other lenders and lessors.

Regulation

In several U.S. states, state law limits the maximum finance rate on receivables. The present state limitations have not significantly limited variable-rate finance charges or the fixed-rate finance charges established by us. However, if interest rate levels should increase significantly, maximum state rates could affect us by preventing the variable rates on outstanding variable-rate retail notes from increasing above the maximum state rate and by limiting the fixed rates on new notes. In some states, we may be able to qualify new retail notes for a higher maximum rate limit by using retail installment sales contracts (rather than loan contracts) or by using fixed-rate rather than variable-rate contracts.

In addition to rate regulations, various U.S. state and federal laws and regulations apply to some Receivables and Leases, principally retail notes for goods sold for personal, family, or household use and John Deere Financial Revolving Plan, John Deere Financial Multi-Use AccountTM, and PowerPlanTM products and receivables. To date, these laws and regulations have not had a significant adverse effect on us.

The Thrift holds a federal thrift charter and is subject to regulation and examination by the OCC. The U.S. Federal Reserve Board has oversight of us, as the owner of the Thrift.

8

Table of Contents

Our financing offers outside the U.S. are affected by a variety of country specific laws, regulations, and customs, including those governing property rights and debtor obligations, and are subject to changes that may introduce greater risks to us.

In fiscal year 2023, compliance with the regulations applicable to us did not have a material effect on our capital expenditures, earnings, or competitive position. We do not expect to incur material capital expenditures related to compliance with regulations during fiscal year 2024. Additional information about the impact of government regulations on our business is included in Item 1A, “Risk Factors” under the headings “Strategic Risks” and “Legal and Compliance Risks.”

Human Capital

Higher Purpose

Our employees are guided by John Deere’s higher purpose: We run so life can leap forward. Employees are further guided by John Deere’s Code of Business Conduct (Code), which helps them to uphold and strengthen the standards of honor and integrity that have defined John Deere since its founding. Our world and business may change, yet we continue to be guided by our core values—integrity, quality, commitment and innovation.

Employees

At October 29, 2023, we had 1,508 full-time and part-time employees. We also retain consultants, independent contractors, and temporary workers.

Code of Business Conduct

We are committed to conducting business in accordance with the highest ethical standards. We require all employees to complete training on our Code and, where permitted by law, also require that employees regularly certify compliance with the Code. The Code provides specific guidance to all our employees, outlining how they can and must uphold and strengthen the integrity that has defined John Deere since its founding. In addition, we maintain a global compliance hotline to allow for concerns of potential violations of the Code, global policies, or the law to be brought forward.

Diversity, Equity, and Inclusion (DEI)

We adhere to the principle of equal employment opportunity and we believe that a diverse workforce is essential to our long-term success and solving our customers’ most pressing challenges. We strive to foster a diverse, equitable, and inclusive culture. We embrace employees’ differences in race, color, religion, age, sex, sexual orientation, gender, gender identity and expression, marital or partnership status, family status, citizenship, national origin, ancestry, geographic background, military or veteran status, disability (mental or physical), and any other characteristics that make our employees unique.

Our leadership team works to set a consistent and transparent tone on DEI issues and strategy. We also create spaces for open conversations and learning through our Employee Resource Groups (ERGs) speaker series and micro-learnings. John Deere sponsors 13 ERGs that are run by employees, open to all employees, and are a key driver of inclusion. ERGs build organization-wide networks that allow employees to come together and discuss shared interests. The global chapters work with local teams to support our efforts to attract, retain, and develop the best talent. In addition, our global DEI strategy focuses on embedding DEI into world-wide business operations and people processes.

In addition to recruiting from a wide array of colleges and universities, John Deere partners with several professional organizations to support our diversity recruitment strategy, including AnitaB.org. – a global organization for women in technology, Minorities in Agriculture Natural Resources and Related Sciences, the National Association of Black Accountants, Inc., the National Black MBA Association, Inc., the National Society of Black Engineers, the Society of Women Engineers, the Thurgood Marshall College Fund Leadership Institute, and the Society of Hispanic Professional Engineers. Our broad recruiting strategy helps us identify talent from diverse backgrounds.

9

Table of Contents

Compensation & Benefits

Our total rewards are intended to be competitive, meet the varied needs of our global workforce, and reinforce our values. We are committed to providing comprehensive and competitive pay and benefits to our employees. We invested, and continue to invest, in employees through growth and development and well-being initiatives.

Our work environment is designed to promote innovation, well-being, and reward performance. Our total rewards for employees include a variety of components that aim to support sustainable employment and the ability to build a strong financial future, including competitive market-based pay and comprehensive benefits. In addition to earning base pay, eligible employees are compensated for their contributions to our goals with both short-term cash incentives and long-term equity-based incentives.

Eligible full-time employees in the U.S. have access to medical, dental, and vision plans; savings and retirement plans; parental leave and paid time off; and other resources, such as the Employee Assistance Program, which provides mental health and wellness services. We also offer a variety of working arrangements to eligible employees, including flexible schedules, remote work, and job sharing to help employees manage home and work-life situations. Programs and benefits differ internationally for a variety of reasons, such as local legal requirements, market practices, and negotiations with works councils and other employee representative bodies.

Training and Development

Employees are critical to the long-term success of our business. We encourage employees to identify the paths that can build the skills, experience, knowledge, and competencies needed for career advancement. We support employees by creating purpose-driven work opportunities, comprehensive performance reviews and development plans, mentoring opportunities, and professional and personal development opportunities.

We encourage employees to provide feedback across the enterprise through our internal voluntary employee experience survey, ad-hoc “pulse” surveys, and new-hire and exit surveys. Reports from these surveys help equip us to address needs across the employee lifecycle to improve the overall experience and engagement of our workforce.

Around the world, we offer internships, training, upskilling, apprenticeships, and leadership development at all stages of an employee’s career. Training programs are tailored to different geographic regions and job functions and include topics such as relationships with customers and dealers, our culture and values, compliance with the Code, compliance with anti-bribery/corruption laws and policies, compliance with management of private data and cybersecurity, regulatory compliance, conflicts of interest, discrimination and workplace harassment policies, sexual harassment policies, and leadership development.

Human Rights and Our Code of Conduct

We honor human rights and respect the individual dignity of all persons globally. Our commitment to human rights requires that we understand and fulfill our responsibilities consistent with our values and practices. We strive to ensure that human rights are upheld for our employees and employees of John Deere dealers. Our commitment to human rights is defined in the Code, the John Deere dealer Code of Conduct, related policies and procedures, and John Deere’s statement “Support of Human Rights in our Business Practice,” each of which is available on John Deere’s website under “Governance.” These documents establish guidelines for our employees and John Deere dealers. We do not tolerate human rights abuses, such as forced labor, unlawful child labor, and human trafficking.

Item 1A.  Risk Factors.

The results of our operations are affected by our relationships with John Deere. See “Our Relationships with John Deere” for additional information regarding our relationships with John Deere.

The following risks are considered material to our business based upon current knowledge, information, and assumptions. This discussion of risk factors should be considered closely in conjunction with “Management’s Discussion and Analysis of Financial Condition and Results of Operations” (MD&A), including the risks and uncertainties described in the “Forward-Looking Statements,” the Notes to Consolidated Financial Statements, and the risk factors of Deere & Company included in Exhibit 99 to this Annual Report on Form 10-K and incorporated herein by reference. These risk factors and

10

Table of Contents

other forward-looking statements relate to future events, expectations, trends, and operating periods. They involve certain factors that are subject to change and important risks and uncertainties that could cause actual results to differ materially. Although the risks are organized by headings, and each risk is discussed separately, many are interrelated. The risks described in this Annual Report on Form 10-K and the “Forward-Looking Statements” in this report are not the only risks we face.

STRATEGIC RISKS

Our profitability and the financial condition of our operations are dependent upon the operations of John Deere.

Our volume of Receivables and Leases is largely dependent upon the level of retail sales and leases of John Deere products. The results of our operations are affected by our relationship with John Deere, including, among other items, the terms on which we acquire Receivables and borrow funds from John Deere, the reimbursement for interest waiver and low-rate finance programs from John Deere, the compensation paid by John Deere in connection with our purchase of trade receivables from John Deere, and the payment to John Deere for various expenses applicable to our operations. In addition, we have joint access to certain lines of credit with John Deere.

If there were significant changes in the production or sales of John Deere products; the quality or resale value of John Deere equipment; John Deere’s liquidity, capital position, debt ratings, and access to capital markets; the reputation of John Deere; or high inflation, higher interest rates, supply chain constraints, or other factors impacting John Deere or its products, such changes could significantly affect our profitability, financial condition, and access to capital markets. In addition, if there were changes to sales incentive programs offered by John Deere to retail customers, in which we receive reimbursement for interest waiver and low-rate finance programs, this could decrease our market share of John Deere financed equipment, volumes, and profitability.

We may be impacted by general negative economic conditions and outlook causing weakened demand for John Deere’s equipment and services, limiting access to funding, and resulting in higher funding costs for us and John Deere.

The demand for John Deere’s and our products and services depends on the fundamentals in the markets in which we operate and can be significantly reduced in an economic environment characterized by high unemployment, high interest rates, cautious consumer spending, inflation, lower corporate earnings, and lower business investment. Negative or uncertain economic conditions that cause John Deere’s customers to lack confidence in the general economic outlook can significantly reduce their likelihood of purchasing John Deere’s equipment. These economic events adversely affected and may continue to adversely affect John Deere and our operations.

Sustained negative economic conditions and outlook also affect housing starts, energy prices and demand, and other construction, which dampens demand for certain construction equipment. John Deere’s turf operations and its construction and forestry segments are dependent on construction activity and have also been affected by recent adverse economic conditions. Decreases in construction activity and housing starts could have a material adverse effect on John Deere’s and our results of operations.

If negative economic conditions affect the overall farm economy, there could be a similar effect on John Deere’s agricultural equipment sales. Uncertain or negative outlook with respect to pervasive U.S. fiscal issues as well as general economic conditions and outlook, such as market volatility and continuing interest rate increases by the Federal Reserve, have caused and could continue to cause significant changes in market liquidity conditions. Such changes could impact access to funding and associated funding costs, which could reduce our earnings and cash flows.

11

Table of Contents

John Deere may not realize the anticipated benefits of its Smart Industrial Operating Model and Leap Ambitions.

John Deere’s failure to realize the anticipated benefits of its Smart Industrial Operating Model and related business strategies in production systems, precision technologies, and aftermarket support could adversely affect our results of operations and financial condition based on our dependence on John Deere operations. Several factors could impact John Deere’s ability to successfully execute the Smart Industrial Operating Model, including, among other things, failure to accurately assess market opportunities and the technology required to address such opportunities; failure to develop and introduce new technologies or lack of adoption of such technologies by John Deere’s customers; and failure to holistically provide lifecycle solutions. In addition, if John Deere is unable to optimize its capital allocation in connection with the Smart Industrial Operating Model, including capital allocation for the development and delivery of financial solutions we provide, we and John Deere may not be able to realize the full benefits of the Smart Industrial Operating Model, which could have an adverse effect on John Deere’s and our financial condition and results of operations.

Similarly, John Deere may not realize the anticipated benefits of its Leap Ambitions and related goals in the expected timelines, or at all. As part of the Leap Ambitions, John Deere adopted various goals it expects to achieve by 2026 or 2030. John Deere may not be able to achieve these goals for a variety of reasons, some of which may be out of its control. For example, John Deere’s estimates and assumptions related to efficiency of its products and the adoption of precision technology may not be accurate; certain materials, such as quality battery cells and cameras, may become unavailable or too costly; or infrastructure required to achieve its goals, such as sufficient charging stations or fuel availability, may become too costly or may not be developed on the expected timeline. The actual or perceived failure of John Deere to achieve its Leap Ambitions could negatively impact its ability to execute the Smart Industrial Operating Model.

John Deere may face risks associated with international, national, and regional trade laws, regulations, and policies and government farm programs and policies which could significantly impair John Deere’s profitability and growth prospects. As our volume of Receivables and Leases is largely dependent upon the level of retail sales and leases of John Deere products, these macroeconomic drivers could also negatively impact our profitability and growth prospects.

International, national, and regional laws, regulations, and policies directly or indirectly related to or restricting the import and export of John Deere’s products, services, and technology, or those of its customers, or for the benefit of favored industries or sectors, could harm John Deere’s global business. John Deere’s profitability and growth prospects are tied directly to the global marketplace. Restricted access to global markets could impair John Deere’s ability to export goods and services from its various manufacturing locations around the world and could limit the ability to access raw materials and high-quality parts and components at competitive prices on a timely basis. Trade restrictions, negotiation of new trade agreements, non-tariff trade barriers, local content requirements, and imposition of new or retaliatory tariffs against certain countries or covering certain products, including developments in U.S.-China trade relations, export control and sanctions against Russia, have limited, and could continue to limit, John Deere’s ability to capitalize on current and future growth opportunities in international markets. These trade restrictions, and changes in, or uncertainty surrounding global trade policies, may affect John Deere’s competitive position. Furthermore, trade restrictions could impede those in developing countries from achieving a higher standard of living, which could negatively impact John Deere’s future growth opportunities arising from increasing global demand for food, fuel, and infrastructure. Policies impacting exchange rates and commodity prices, or those limiting the export or import of commodities could have a material adverse effect on the international flow of agricultural and other commodities that may result in a corresponding negative effect on the demand for agricultural and forestry equipment in many areas of the world. John Deere’s agricultural equipment sales could be harmed by such policies because farm income influences sales of agricultural equipment around the world. Additionally, changes in government farm programs and policies can influence demand for agricultural equipment as well as create unequal competition for multinational companies relative to domestic companies.

We may be unable to manage increasing political, economic, and social uncertainty in certain regions of the world, which could significantly change the dynamics of John Deere’s and our competition, customer base, and product offerings globally.

John Deere’s efforts to grow its business depends in part upon access and developing market shared and profitability in additional geographic markets, including, but not limited to, Argentina, Brazil, China, India, and South Africa. In some cases, these countries have greater political and economic volatility, greater vulnerability to infrastructure and labor disruptions, and differing customer product preferences and requirements than John Deere’s other markets. In fiscal 2022,

12

Table of Contents

as a result of the war in Ukraine, John Deere suspended shipments of machines and service parts to Russia. The suspension of shipments to Russia reduced actual and forecasted revenue for the region, among other impacts. Having business operations in various regions and countries exposes us and John Deere to multiple and potentially conflicting business practices, and legal and regulatory requirements that are subject to change. These practices and legal requirements are often complex and difficult to navigate, including those related to tariffs and trade regulations, investments, property ownership rights, taxation, repatriation of earnings, and advanced technologies. Expanding business operations globally also increases exposure to currency fluctuations, which can materially affect our financial results. While John Deere maintains a positive corporate image and its brands are widely recognized and valued in its traditional markets, the brands are less known in some emerging markets, which could impede John Deere’s efforts to successfully compete in these markets.

John Deere may be affected by changing worldwide demand for food and different forms of renewable energy, which could impact the price of farm commodities and consequently the demand for John Deere equipment. This could result in higher research and development costs related to changing machine fuel requirements.

Changing worldwide demand for farm outputs to meet the world’s growing food and renewable energy demands, driven in part by government policies, including those related to climate change, and a growing world population, are likely to result in fluctuating agricultural commodity prices, which directly affect sales of agricultural equipment. Lower agricultural commodity prices directly affect farm incomes, which could negatively affect sales of agricultural equipment and result in higher credit losses. While higher commodity prices benefit John Deere’s crop-producing agricultural equipment customers, they could result in greater feed costs for livestock and poultry producers, which in turn may result in lower levels of equipment purchased by these customers. In addition, changing renewable energy demands may cause farmers to change the types or quantities of the crops they raise, with corresponding changes in equipment demand. Finally, changes in governmental policies regulating bio-fuel utilization could affect commodity demand and commodity prices, demand for John Deere’s diesel-fueled equipment, and result in higher research and development costs for John Deere related to equipment fuel standards. These changes could have a negative effect on our results.

John Deere’s ability to understand its customers’ preferences and requirements, and to develop, manufacture, and market products that meet customer demand could significantly affect its business results.

John Deere’s ability to match new product offerings to global customers’ preferences for different types and sizes of equipment and various equipment features and functionality, at affordable prices, is critical to its success. In addition, our ability to anticipate and deliver on customers’ changing preferences for financial solutions is critical to our success. This requires a thorough understanding of John Deere’s and our existing and potential customers on a global basis, particularly in growth markets such as Argentina, Brazil and India. Failure to deliver quality products that meet customer needs at competitive prices ahead of competitors could have a significant adverse effect on John Deere’s and our business.

In addition, customer preferences in the markets served by John Deere are changing as a result of ongoing social and regulatory focus on sustainability as these markets transition to less carbon-intensive business models. As regulations and social pressure drive change, John Deere must continue to proactively monitor trends and develop alternatives and enhancements that elevate and complement its product offerings. For example, even though John Deere plans to offer electric, hybrid-electric, and battery electric equipment solutions, John Deere may be unable to keep up with the rising demand for electric agriculture, turf, and construction equipment.

The development of alternative farming techniques, carbon sequestration technologies, and new low-carbon biofuels are changing farmers’ business models and equipment needs. If John Deere fails to continue to develop or invest in emerging technologies to meet changing customer demands, John Deere will be at risk of losing potential sources of revenue, which could affect John Deere’s and our future financial results.

John Deere’s and our ability to adapt in highly competitive markets could affect our business, results of operations, and financial condition.

John Deere operates in a variety of highly competitive global and regional markets with other manufacturers and distributors that produce and sell similar products. In addition, John Deere’s industry is attracting non-traditional competitors, including technology-focused companies and start-up ventures. John Deere competes on product performance, innovation and quality, distribution, sustainability, customer service, and price. Aggressive pricing or other

13

Table of Contents

strategies pursued by competitors, unanticipated product or manufacturing delays, or John Deere’s failure to price its products competitively could adversely affect John Deere’s business, results of operations, and financial condition, which could negatively affect our results.

The equipment finance industry in which we operate is highly competitive. We compete for customers with commercial banks and finance and leasing companies based upon service, finance rates charged, and other finance terms. In addition, the competitive landscape is evolving as technology is unlocking new capabilities for traditional competitors and enabling new digital entrants. Our ability to maintain and expand our market share is contingent upon us offering competitive pricing, developing and maintaining strong relationships with dealers and customers, making substantial investments in our technological infrastructure, and effectively responding to changes in the agriculture and turf equipment and construction and forestry equipment markets. In addition, any expansion into new markets may require us to compete with more experienced and established market participants. Failure to effectively manage these challenges could adversely affect our market share, and pressure to provide competitive pricing could have a negative effect on our results of operations and financial condition.

John Deere relies on a network of independent dealers to manage the distribution of its products and services. If dealers are unsuccessful with their sales and business operations, it could have an adverse effect on overall John Deere sales and revenue.

John Deere relies on the capability of John Deere dealers to develop and implement effective sales plans to create demand among purchasers for the equipment and related products and services that the dealers purchase from John Deere. If John Deere’s dealers are unsuccessful in these endeavors, John Deere will be unable to grow its sales and revenue, which would have an adverse effect on John Deere’s and our financial condition. In addition, the dealer channel’s ability to support and service precision technology solutions and emerging power solutions may affect customers’ acceptance and adoption rates of these products. The unavailability of specialized technicians to service John Deere’s equipment may result in overburdening dealers’ servicing capacity.

Dealers may have trouble funding their day-to-day cash flow needs and paying their obligations due to adverse business conditions resulting from negative economic effects or other factors. Dealers may exit or John Deere may seek to terminate relationships with certain dealers if they are unable to meet customer needs. The unplanned loss of any John Deere dealers could lead to inadequate market coverage, negative customer impressions of John Deere, and may adversely impact John Deere’s and our ability to collect receivables that are associated with that dealer.

ENVIRONMENTAL, CLIMATE, AND WEATHER RISKS

Unfavorable weather conditions or natural catastrophes that reduce agricultural production and demand for agriculture and turf equipment could directly and indirectly affect John Deere’s and our business.

The purchasing decisions of John Deere’s customers, particularly the purchasers of agriculture and turf equipment, can be significantly affected by poor or unusual weather conditions. Such conditions include: insufficient levels of rain, which prevent farmers from planting new crops and may cause growing crops to die or result in lower yields; excessive rain or flooding can prevent planting from occurring at optimal times and may cause crop loss through increased disease or mold growth; temperatures outside normal ranges, which can cause crop failure or decreased yields and may also affect disease incidence; natural disasters such as regional floods, hurricanes or other storms, droughts, diseases, wildfires, and pests, either as a physical effect of climate change or otherwise, which have had and could in the future have significant negative effects on agricultural and livestock production; adverse weather conditions in a particular geographic region, particularly during the important spring selling season; and drought conditions can adversely affect sales of certain mowing equipment and can similarly cause lower sales volumes. Each of these conditions could have a negative impact on farm income which can affect demand for agricultural equipment and the financial condition and credit risk of our customers and John Deere’s dealers.

14

Table of Contents

Governmental actions designed to address climate change based on the emergence of new technologies and business models in connection with the transition to a lower-carbon economy could adversely affect John Deere and its customers.

There is global scientific consensus that greenhouse gas (GHG) emissions continue to alter the composition of Earth’s atmosphere in ways that are affecting and are expected to continue to affect the global climate. These considerations have led to new international, national, regional, and local legislative and regulatory responses. Various stakeholders, including legislators and regulators, shareholders, and non-governmental organizations, as well as companies in many business sectors, including us and John Deere, are continuing to look for ways to reduce GHG emissions. The regulation of GHG emissions from certain stationary or mobile sources or the imposition of carbon pricing mechanisms could result in additional costs to us and John Deere in the form of taxes or emission allowances, required facilities improvements, and increased energy costs. These results would increase John Deere’s and our operating costs through higher utility, transportation, and materials cost and could prevent John Deere from selling products into certain markets. Increased input costs, such as fuel and fertilizer, and compliance-related costs could also affect customer operations and demand for John Deere equipment.

Further, we are subject to additional international and national European regulations relating to climate and environmental risk, which are continually evolving and could affect the financing operations and climate-risk processes developed by us. Regulators in Europe and the U.S. have also focused efforts on increased disclosure related to climate change and mitigation efforts. The EU recently adopted the European Sustainability Reporting Standards (ESRS) and the Corporate Sustainability Reporting Directive (CSRD) that will impose disclosure of the risks and opportunities arising from social and environmental issues, and on the impact of companies’ activities on people and the environment. The CSRD will need to be transposed into Member State law before it becomes effective, which is expected to occur in 2024. Similarly, the State of California recently passed the Climate Corporate Data Accountability Act and the Climate-Related Financial Risk Act that will impose broad climate-related disclosure obligations on certain companies doing business in California, including us and John Deere, starting in 2026. The Securities and Exchange Commission (SEC) has included in its regulatory agenda potential rulemaking on climate change disclosures that, if adopted, could significantly increase compliance burdens and associated regulatory costs and complexity.

FINANCIAL RISKS

Changes in government banking, monetary, and fiscal policies could have a negative effect on us.

Policies of the U.S. and other governments regarding banking, monetary, and fiscal policies intended to promote or maintain liquidity, stabilize financial markets, and/or address local deficit or structural economic issues may not be effective and could have a material impact on our customers and markets. Central bank policy interest rates continued to increase in fiscal year 2023. Most of our retail receivables are fixed rate, while wholesale financing receivables are generally variable rate. We have both fixed and variable rate borrowings. Historically, rising interest rates impact our borrowings sooner than the benefit is realized from the Receivable and Lease portfolios.

Our operations and results could also be affected by financial regulatory reform that could, among other things, have an adverse effect on us and our customers by limiting their ability to enter into hedging transactions or to finance purchases of John Deere products. Government policies on spending can also affect John Deere, especially the construction and forestry segment, due to the impact of government spending on infrastructure development. John Deere and our operations, including those outside of the U.S., may also be affected by non-U.S. regulatory reforms being implemented to further regulate non-U.S. financial institutions and markets.

Changes in tax rates, tax legislation, or exposure to additional tax liabilities could have a negative effect on us and John Deere.

We and John Deere are subject to income taxes in the U.S. and numerous foreign jurisdictions. John Deere’s and our domestic and international tax liabilities are dependent upon the location of earnings among these different jurisdictions. Tax rates in various jurisdictions may be subject to significant change. John Deere’s and our effective tax rates could be affected by changes in the mix of earnings in countries with differing statutory tax rates, changes in the valuation of deferred tax assets and liabilities, or changes in tax laws or their interpretations. If John Deere’s and our effective tax rates

15

Table of Contents

were to increase, or if the ultimate determination of taxes owed is for an amount more than amounts previously accrued, John Deere’s and our operating results, cash flows, and financial condition could be adversely affected.

Our consolidated financial results are reported in U.S. dollars while certain assets and other reported items are denominated in foreign currencies, creating currency exchange and translation risk.

We are a global company with transactions denominated in a variety of currencies. We are subject to currency exchange risk to the extent that costs are denominated in currencies other than those in which we earn revenues. Additionally, the reporting currency for our consolidated financial statements is the U.S. dollar. Certain of our assets, liabilities, expenses, and revenues are denominated in other countries’ currencies, which are then translated into U.S. dollars at the applicable exchange rates and reported in our consolidated financial statements. Therefore, fluctuations in foreign exchange rates affect the value of those items as reflected in our consolidated financial statements, even if their value remains unchanged in their original currencies. While the use of currency hedging instruments may provide us with some protection from adverse fluctuations in currency exchange rates, by utilizing these instruments, we potentially forego any benefits that may result from favorable fluctuations in such rates.

Changes in interest rate risks or market liquidity conditions could adversely affect our financials and our earnings and/or cash.

Central bank policy interest rates continued to increase in fiscal year 2023. Rising interest rates could have a dampening effect on overall economic activity and/or the financial condition of our customers, either or both of which could negatively affect customer demand for John Deere equipment and customers’ ability to repay their obligations to us. Rising interest rates may cause credit market dislocations, that can impact funding costs, which can affect our ability to offer customers competitive financing rates. While we strive to match the interest rate characteristics of our financial assets and liabilities, changing interest rates have had an adverse effect on our financing spread—the difference between the yield we earn on our assets and the interest rates we pay for funding—which has affected our earnings.

In addition, actions by credit rating agencies, such as downgrades or negative changes to ratings outlooks, can affect the availability and cost of funding for us and can increase our cost of capital and hurt our competitive position.

Because we are a financing company, negative economic conditions in the financial industry could materially impact our operations and financial results.

Negative economic conditions could have an adverse effect on the financial industry in which we operate. We provide financing for a significant portion of John Deere’s sales in many of the countries in which we operate. We are exposed to the risk that customers and others will default on contractual obligations and may experience credit losses that exceed our expectations and adversely affect our financial condition and results of operations. Our inability to access funds at cost-effective rates to support our financing activities could have a material adverse effect on our business. Our liquidity and ongoing profitability depend largely on timely access to capital to meet future cash flow requirements and to fund operations and costs associated with engaging in diversified funding activities. Additionally, negative market conditions could reduce customer confidence levels, resulting in declines in credit applications and increases in delinquencies and default rates, which could materially impact our write-offs and provision for credit losses.

Our results could be adversely affected by a decrease in the value of used equipment or higher than estimated returns of equipment on operating lease.

We sell repossessed equipment and equipment returned to us at the end-of-lease terms, primarily through the John Deere dealer network. We estimate the end-of-lease term residual value at the inception of the operating leases based on a number of factors, including lease term, expected hours of usage, historical wholesale sale prices, return experience, intended equipment use, market dynamics and trends, and third-party residual guarantees. Used equipment values may decrease as a result of any one or a combination of factors including market conditions, supply of and demand for used equipment, and technological advancements in new equipment. Depressed prices for used equipment may result in, or increase, a loss upon our disposition of off-lease or repossessed equipment, and in the case of repossessed equipment, we may be unable to collect the resulting deficiency. In addition, lower residual value estimates could result in increasing operating lease depreciation, impairment losses, and losses on the sale of matured operating lease inventory, which would decrease our earnings.

16

Table of Contents

We could suffer operational and financial harm if our models fail to properly anticipate and manage risk.

We use models to forecast losses, project revenue and expenses, assess and control our operations and financial condition, perform automated credit decisioning, assist in capital planning, and forecast and assess capital and liquidity requirements for credit, market, operational and strategic risks. However, models are subject to inherent limitations from simplifying assumptions, uncertainty regarding economic and financial outcomes, and emerging risks. Our models may not be sufficiently predictive of future results due to limited historical patterns, unanticipated market movements, customer behavior, and liquidity, which could limit their effectiveness and require timely recalibration. In addition, our models may be adversely impacted by human error and may not be effective if we fail to properly oversee and review them at regular intervals and detect their flaws during our review and monitoring processes. Regardless of the steps we take to help confirm effective controls, monitor and test, implement new technology, and implement new processes, we could suffer operational and financial harm if our models fail to properly anticipate and help us manage risks.

MANUFACTURING AND OPERATIONAL RISKS

Changes in the availability and price of certain raw materials, components, and whole goods have resulted and could continue to result in disruptions to the supply chain causing production disruptions, increased costs, and lower profits on sales of John Deere products. As our volume of Receivables and Leases is largely dependent upon the level of retail sales and leases of John Deere products, supply chain disruptions and impacts of price increases could negatively impact our future volumes.

John Deere requires access to various raw materials, components, and whole goods at competitive prices to manufacture and distribute our products. The price and availability of these materials have varied significantly in the last 36 months. While John Deere has seen stabilization in the supply chain and some commodity pricing improvements, John Deere anticipates potential fluctuations due to inflation, geopolitical and economic uncertainty, and regulatory and policy instability, including import tariffs and trade agreements. The latter have the potential to significantly increase production and logistics costs and have a material negative effect on the profitability of John Deere’s business, particularly if John Deere is unable to recover the increased costs due to market considerations or other factors. John Deere has experienced changes in the availability and prices of these raw materials, components, whole goods, and freight over the past several years, especially in fiscal years 2021 and 2022. Global logistics network challenges resulted in delays, shortages of key manufacturing components, increased order backlogs, increased transportation costs, and production inefficiencies from a higher number of partially completed machines in inventory, which increased John Deere’s overall production and overhead costs. Increases in such costs have had an adverse effect on John Deere’s business operations.

John Deere relies on its suppliers to acquire the raw materials, components, and whole goods required to manufacture their products. Significant disruptions to the supply chain resulting from shortages of raw materials, components, and whole goods have and could continue to adversely affect John Deere’s ability to meet commitments to its customers. In addition, certain materials and components used in John Deere products are acquired from a single supplier or are proprietary in nature and cannot be alternatively sourced expeditiously. Furthermore, if John Deere’s customers are unwilling to accept price increases for its products, or if John Deere is unable to offset the increases in costs, raw material costs or shortages could have a material adverse effect on John Deere’s operational or financial results, which could negatively impact us.

RESOURCES RISKS

Our ability to attract, develop, engage, and retain qualified employees could affect our ability to execute our strategy.

Our continued success depends, in part, on our ability to identify and attract qualified candidates with the requisite education, background, and experience, as well as our ability to develop, engage, and retain qualified employees. Failure to attract, develop, engage, and retain qualified employees, whether as a result of an insufficient number of qualified applicants, difficulty in recruiting new employees, or inadequate resources to train, integrate, and retain qualified employees, could impair our ability to execute our business strategy and could adversely affect our business, results of operations, and financial condition. In addition, while we strive to reduce the impact of the departure of employees, our operations or ability to execute our business strategy and meet our business objectives may be affected by the loss of employees, particularly when departures involve larger numbers of employees, such as those we could experience if a surge occurs in the number of employees voluntarily leaving their jobs. Higher rates of employee separations may

17

Table of Contents

adversely affect us through decreased employee morale, the loss of knowledge of departing employees, and the devotion of resources to recruiting and onboarding new employees.

Security breaches and other disruptions to our information technology infrastructure could interfere with our operations and could compromise the information of us as well as our customers and/or John Deere dealers, exposing us to liability that could cause our business and reputation to suffer.

In the ordinary course of business, we rely upon information technology networks and systems, some of which are managed by third parties, to process, transmit, and store electronic information and to manage or support a variety of business processes and activities, including credit application and collection of payments from dealers and other purchasers of John Deere equipment. We use information technology systems to record, process, and summarize financial information and results of operations for internal reporting purposes and to comply with regulatory financial reporting, legal, and tax requirements. Additionally, we collect and store sensitive data, including intellectual property, proprietary business information, and the proprietary business information of our customers and John Deere dealers, as well as personally identifiable information of our customers and employees in data centers which are often owned by third parties, and on information technology networks. The secure operation of these information technology networks and the processing and maintenance of this information is critical to our business operations and strategy. Despite security measures, including a vulnerability disclosure program, and business continuity plans, our information technology networks and infrastructure have been, and may be, vulnerable to intrusion, damage, disruptions, or shutdowns due to attacks by cyber criminals, employees’, suppliers’, or dealers’ errors or malfeasance, supply chain compromises, disruptions during the process of upgrading or replacing computer software or hardware, power outages, computer viruses, ransomware or other malware, telecommunication or utility failures, terrorist acts, natural disasters, or other events. Although we have not suffered any significant cyber incidents that resulted in a material business impact, we have from time to time been the target of malicious cyber threat actors. The occurrence of any significant event could compromise our networks, and the information stored there could be accessed, obtained, publicly disclosed, lost, altered, misused, or stolen. Any such access, disclosure, alteration, misuse or other loss of information could result in legal claims or proceedings, government investigations, liability or regulatory penalties, disruption or shut down of our operations, and damage to our reputation, which could adversely affect our business, results of operations, and financial condition. Furthermore, as security threats continue to evolve and increase in frequency and sophistication, we may need to invest additional resources to protect information security.

Our operations are affected by risks associated with our use of vendors and other third-party service providers.

We rely on vendor and third-party service providers for a variety of products and services to run our core credit operations, such as customer invoicing, collections, and software solutions. This reliance exposes us to risks of those third parties failing to perform financially or contractually to our expectations. These risks could include material adverse impacts on our business, such as disruption or interruption of business activities, cyber-attacks and information security breaches, poor performance of services affecting our customer relationships, and possibilities that we could be responsible to our customers for legal and regulatory violations committed by those third parties while conducting services on our behalf. While we have implemented ongoing monitoring to address this risk, there can be no assurance that our vendor and third-party relationships will not have a material adverse impact on our business.

LEGAL AND COMPLIANCE RISKS

Our global operations are subject to complex and changing laws and regulations, the violation of which could expose us to potential liabilities, increased costs, and other adverse effects.

Our global operations are subject to numerous international, federal, state, and local laws and regulations, many of which are complex, frequently changing, and subject to varying interpretations. These laws and regulations cover a broad spectrum of subject areas, including advertising; anti–money laundering; antitrust; consumer finance; environmental, climate-related, health, and safety; foreign exchange controls and cash repatriation restrictions; foreign ownership and investment; human rights, labor, and employment; and data privacy. These laws may vary substantially within the different countries in which we operate. Compliance with these laws and regulations is costly and may further increase the cost of conducting our global operations. In addition, we must comply with the U.S. Foreign Corrupt Practices Act and all applicable foreign anti-corruption laws, including the U.K. Bribery Act, which generally prohibit companies and their

18

Table of Contents

intermediaries from making improper payments or providing anything of value to improperly influence government officials or private individuals for the purpose of obtaining or retaining a business advantage, regardless of whether those practices are culturally expected in a particular jurisdiction. Although we have a compliance program in place designed to reduce the likelihood of potential violations of such laws and regulations, there can be no assurance that our employees, contractors, or agents will not violate such laws and regulations or our policies and procedures. Violations of these laws and regulations could result in criminal or civil sanctions and have a material adverse effect on our reputation, business, results of operations, and financial condition.

Changes to existing laws and regulations, or changes to how they are interpreted, or the implementation of new, more stringent laws or regulations, could adversely affect our business by increasing compliance costs, limiting our ability to offer a product or service, requiring changes to our business practices, or otherwise making our products and services less attractive to customers. Legislative and regulatory changes and other actions that could potentially affect our business may be announced with little or no advance notice and we may not be able to effectively mitigate all adverse effects from such measures.

We are subject to governmental laws, regulations, and other legal obligations related to privacy and data protection. Any inability or perceived inability of addressing these requirements could adversely affect our business.

The legislative and regulatory framework for privacy and data protection issues worldwide is rapidly evolving and is likely to remain uncertain for the foreseeable future. We collect personal information and other data as integral parts of our business processes and activities. This data is subject to a variety of U.S. and foreign laws and regulations, including oversight by various regulatory and other governmental bodies. Many foreign countries and governmental bodies, including the European Union (EU) and other relevant jurisdictions where we conduct business, have laws and regulations concerning the collection and use of personal information and other data obtained from their residents or by businesses operating within their jurisdictions. The EU General Data Protection Regulation and the California Consumer Privacy Act, among others, impose stringent data protection requirements and provide significant penalties for noncompliance. New privacy laws will continue to come into effect around the world in the future. Any inability or perceived inability to adequately address privacy and data protection concerns (even if unfounded), or comply with applicable laws, regulations, policies, industry standards, contractual obligations, or other legal obligations, could result in additional cost and liability to us, damage our reputation, inhibit revenue, and otherwise adversely affect our business.

Legal proceedings and disputes in which, we are, and may in the future be, involved could harm our business, financial condition, reputation, and brand.

We are subject to a variety of legal proceedings and legal compliance risks around the world. We face risks of exposure to various types of claims, lawsuits, and government inquiries or investigations in the ordinary course of business, the most prevalent of which relate to retail credit matters. The uncertainty associated with substantial unresolved claims and lawsuits may harm our business, financial condition, reputation, and brand. The defense of lawsuits and government inquiries or investigations has resulted and may result in the expenditures of significant financial resources and the diversion of management’s time and attention away from business operations. Such legal proceedings may also affect our assessment and estimates of loss contingencies recorded as a reserve and require us to make payments exceeding our reserves.

GENERAL RISKS

John Deere’s and our reputation and brand could be damaged by negative publicity.

John Deere’s brand has worldwide recognition and significantly contributes to the success of both our businesses. John Deere’s reputation is critical to growing the customer base. John Deere’s brand depends on the ability to maintain a positive customer perception of the business, including the core values of integrity, quality, innovation, and commitment. Negative claims or publicity involving John Deere, its products or services, its culture and values, its stance on environmental, social, and governance topics, customer data, or any of its key employees or suppliers, could damage John Deere’s reputation and brand image, regardless of whether such claims are accurate. Damage to John Deere’s reputation could adversely impact its and our ability to attract new and maintain existing customer, employee, dealer, and business relationships.

19

Table of Contents

Additionally, negative or inaccurate postings, articles, or comments on social media and the internet about John Deere could generate negative publicity that could damage the reputation of John Deere, us, or the John Deere brand.

Further, adverse publicity about regulatory or legal action against John Deere or us, or legal action initiated by John Deere or us, could also damage John Deere’s and our reputation and brand image, undermine customer confidence, and reduce long-term demand for John Deere equipment, even if the regulatory or legal action is unfounded or not material to John Deere’s or our operations. If the reputation, culture, or image of John Deere’s brands are damaged, or John Deere or we receive negative publicity, then our revenue, financial condition, and results of operations could be materially and adversely affected.

Unexpected events have and may in the future increase our cost of doing business or disrupt our operations.

The occurrence of one or more unexpected events, including war, acts of terrorism, epidemics and pandemics (such as the COVID-19 pandemic), civil unrest, fires, tornadoes, tsunamis, hurricanes, earthquakes, floods, and other forms of severe weather in the U.S. or in other countries in which we operate, or in which John Deere suppliers are located, have and could in the future adversely affect our operations and financial performance. Such events have and could cause complete or partial closure of one or more of John Deere’s manufacturing facilities or distribution centers, temporary or long-term disruption in the supply of component products from some local and international suppliers, and disruption and delay in the transport of John Deere products to dealers, end-users, and distribution centers. Existing insurance coverage may not provide protection from all the costs that may arise from such events.

The potential physical impacts of climate change on John Deere’s facilities, suppliers, and customers, and therefore on John Deere’s operations, are highly uncertain and will be particular to the circumstances developing in various geographic regions. These potential physical effects may adversely affect the demand for John Deere’s products and the financial performance of John Deere’s and our operations.

Item 1B.  Unresolved Staff Comments.

None.

Item 2.  Properties.

We own office buildings in Johnston, Iowa; and lease office space in Middleton, Wisconsin; Rosario, Argentina; Brisbane, Australia; Gloucester, England; Langar, England; Ormes, France; Walldorf, Germany; Milan, Italy; Luxembourg City, Luxembourg; Monterrey, Mexico; Poznan, Poland; and Parla, Spain. We believe our properties are adequate and suitable for our business as presently conducted and are adequately maintained.

Item 3.  Legal Proceedings.

We are subject to various unresolved legal actions that arise in the normal course of our business, the most prevalent of which relate to retail credit matters. We believe the reasonably possible range of losses for these unresolved legal actions would not have a material effect on our consolidated financial statements.

Item 4.  Mine Safety Disclosures.

Not applicable.

20

Table of Contents

PART II

Item 5.  Market for Registrant’s Common Equity, Related Stockholder Matters, and Issuer Purchases of Equity Securities.

(a)All of Capital Corporation’s common stock is owned by JDFS, a finance holding company that is wholly-owned by Deere & Company. In 2023 and 2022, Capital Corporation declared and paid cash dividends of $165.0 and $370.0, respectively, to JDFS. In turn, JDFS declared and paid comparable dividends to Deere & Company.

In 2023, Deere & Company increased its capital investment in JDFS by $810.0. JDFS, in turn, increased its capital investment in Capital Corporation by the same amount. There were no capital investments during 2022.

(b)Not applicable.
(c)Not applicable.

Item 6.  [Reserved]

Item 7.  Management’s Discussion and Analysis of Financial Condition and Results of Operations.

The MD&A is intended to promote understanding of our financial condition and results of operations. The MD&A is provided as a supplement to, and should be read in conjunction with, the consolidated financial statements and the accompanying Notes to Consolidated Financial Statements. For comparison of 2022 to 2021 results, refer to the “Management’s Discussion and Analysis” section of our 2022 Form 10-K.

Results of Operations

Overview

Organization

We provide financial solutions that enable John Deere customers and dealers to advance their lives and livelihoods. Through our offering of retail notes, leases, and revolving charge accounts, customers are able to finance new and used John Deere equipment, as well as parts, services, and other input costs needed to run their operations. We also provide wholesale financing to John Deere dealers.

Smart Industrial Operating Model and Leap Ambitions

John Deere announced the Smart Industrial Operating Model in 2020.  This operating model is based on three focus areas:

(a)Production systems: A strategic alignment of products and solutions around John Deere customers’ operations.
(b)Technology stack: Investments in technology, as well as research and development, that deliver intelligent solutions to John Deere customers through digital capabilities, automation, autonomy, and alternative power technologies.
(c)Lifecycle solutions: The integration of John Deere’s aftermarket and support capabilities to more effectively manage customer equipment, service, and technology needs across the full lifetime of a John Deere product.

John Deere’s Leap Ambitions were launched in 2022. These ambitions are designed to boost economic value and sustainability. The ambitions align across the production systems of John Deere customers, seeking to optimize their operations to deliver better outcomes with fewer resources. As an enabling business, we are fully integrated with John Deere’s Smart Industrial Operating Model and are focused on providing financial solutions to help John Deere achieve its Leap Ambitions.

Trends and Economic Conditions

Our volume of Receivables and Leases is largely dependent upon the level of retail sales and leases of John Deere products. The level of John Deere retail sales and leases is responsive to a variety of economic, financial, climatic, legislative, and other factors that influence supply and demand for its products.

21

Table of Contents

Industry Sales Outlook for Fiscal Year 2024

Graphic

Graphic

John Deere Trends

Customers seek to improve profitability, productivity, and sustainability through technology. Integration of technology into equipment is a persistent market trend. John Deere’s Smart Industrial Operating Model and Leap Ambitions are intended to capitalize on this market trend. The technologies that are the focus of John Deere’s operating model are incorporated into products within each of John Deere’s operating segments. We expect this trend to persist for the foreseeable future.

Agriculture and Turf Outlook for 2024

John Deere expects large agricultural equipment sales to decline in 2024 in North America, Europe, and South America.
Demand for small agricultural equipment is expected to moderate in Europe.
Turf and utility equipment product sales are expected to be lower due to the overall U.S. economic condition and elevated interest rates.

Market Conditions:

Agricultural fundamentals are expected to moderate in 2024 due to lower commodity prices and elevated interest rates, offset by declining input costs and improved customer financials.
The dairy and livestock sector continues to benefit from elevated protein and hay prices.
Farm input costs in Europe are declining. Grain prices vary from favorable in Western Europe to depressed in Eastern Europe due to the Russia/Ukraine war.
The fleet average age is older than in prior business cycles. Combines are in line with the historical average age, while tractors are slightly older than historical averages.

Construction and Forestry Outlook for 2024

Market Conditions:

Construction equipment industry sales are forecasted to be down from 2023 levels.
Benefits from rental fleet replenishment, the energy industry, and U.S. infrastructure spending are expected to partially offset moderation in residential home, office, and retail construction.
Roadbuilding demand remains strong similar to 2023 in the U.S., largely offset by softening demand in Europe.

22

Table of Contents

Company Trends

Our net income in fiscal year 2024 is expected to be higher due to income earned on a higher average portfolio and lower dealer financing incentives, partially offset by less favorable financing spreads and lower gains on operating lease dispositions.

Central bank policy interest rates increased in 2022 and 2023. Most of our receivables and leases with retail customers are fixed rate, while our wholesale receivables generally are variable rate. This Receivable and Lease portfolio is financed with fixed and variable rate borrowings. We manage our exposure to interest rate fluctuations by matching the interest rate characteristics of our portfolio with our funding sources. We also enter into interest rate swap agreements to match our interest rate exposure.  

Rising interest rates have historically impacted our borrowings sooner than the benefit is realized from our Receivable and Lease portfolio. As a result, we experienced $152.6 (after-tax) less favorable financing spreads in 2023 compared to 2022. If interest rates continue to rise, we expect to continue experiencing spread compression in 2024.

Rising interest rates are driven by factors outside of our control, and as a result, we cannot reasonably foresee when this condition will subside.

Other Items of Concern and Uncertainties

Other items that could impact our results are:

global and regional political conditions, including the war in Ukraine and the Israel-Hamas war,
economic, tax, and trade policies,
new or retaliatory tariffs,
capital market disruptions,
foreign currency and capital control policies,
regulations and legislation regarding right to repair,
weather conditions,
marketplace adoption and monetization of technologies we have invested in,
John Deere’s and our ability to strengthen our digital capabilities, automation, autonomy, and alternative power technologies,
changes in demand and pricing for new and used equipment,
significant fluctuations in foreign currency exchange rates,
volatility in the prices of many commodities, and
slower economic growth or possible recession.

Financing Incentives

In the second quarter of 2023, we corrected the accounting treatment for financing incentives offered to John Deere dealers. Refer to Note 1, Note 2, and Note 23 of the consolidated financial statements for additional information. While prior period amounts have been restated for comparability, the impact of the correction in periods prior to the quarter ended April 30, 2023 was not material to our consolidated financial statements in any of the impacted periods.

2023 Compared with 2022

The total revenues and net income attributable to the Company were as follows:

2023

2022

Total revenues

$

3,975.5

$

2,806.6

Net income attributable to the Company

572.3

693.6

Total revenues increased in 2023 primarily due to a 22 percent increase in average Receivable balances and higher average financing rates on Receivables of 6.3 percent in 2023 compared to 4.5 percent in 2022. Net income in 2023 was lower than 2022 due to less favorable financing spreads, a higher provision for credit losses, unfavorable derivative market valuation

23

Table of Contents

adjustments (presented in Other in the bar below), lower gains on operating lease dispositions, and higher selling, administrative, and general expenses. These factors were partially offset by income earned on a higher average portfolio.

Graphic

Revenues

Finance income, lease revenues, and other income earned by us were as follows:

2023

2022

% Change

Finance income earned from:

Retail notes

$

1,494.7

$

1,064.5

40

Revolving charge accounts

417.4

300.2

39

Wholesale receivables

889.8

342.5

160

Lease revenues

997.3

963.7

3

Other income

176.3

135.7

30

Higher average financing rates and higher average portfolio balances drove increased revenues across all products during 2023. The change was most pronounced within wholesale receivables, due to a 67 percent increase in average portfolio balances and an increase in the average financing rate from 4.9 percent in 2022 to 7.7 percent in 2023.  The majority of wholesale receivables earn a variable rate of interest. Lease revenues were up only slightly, driven by a relatively stable operating lease portfolio, with average balances up 1 percent over 2022.

Other income increased in 2023 primarily due to higher interest earned on our cash and cash equivalents and intercompany receivables from John Deere, partially offset by lower gains on operating lease dispositions. While demand for used equipment remains strong, lease gains were lower during 2023 as end-of-lease values are now more closely aligned with equipment sale proceeds.

Revenues earned from John Deere totaled $1,027.9 in 2023, compared with $643.1 in 2022. The increase was primarily the result of higher compensation paid by John Deere on wholesale receivables and retail notes, driven by a higher interest rate environment and higher average portfolio balances. Revenues earned from John Deere are included in each of the revenue amounts discussed above.

24

Table of Contents

Expenses

Expenses incurred by us were as follows:

2023

2022

% Change

Interest expense

$

1,671.5

$

497.3

236

Depreciation of equipment on operating leases

659.7

667.7

(1)

Administrative and operating expenses

569.4

501.6

14

Fees and interest paid to John Deere

252.6

222.1

14

Provision for credit losses

88.5

23.5

277

Provision for income taxes

165.9

205.6

(19)

The increase in interest expense in 2023 was primarily due to higher average borrowing rates due to rising interest rates and higher average borrowings to fund a larger portfolio.

Administrative and operating expenses increased during 2023 due to higher dealer financing incentive program costs driven by increased finance volumes, in addition to higher employment costs, including incentive compensation.

Fees and interest paid to John Deere increased in 2023 primarily due to higher interest on intercompany borrowings from John Deere driven by higher average borrowing rates. This was partially offset by a one-time payment to Deere & Company in 2022 that did not recur in 2023, related to unrealized gains on certain non-designated derivatives assumed by Deere & Company.

The provision for credit losses increased in 2023 compared to 2022 primarily due to higher write-offs on retail notes and revolving charge accounts, an increase in allowance driven by growth in the retail notes and financing lease portfolios, and higher expected losses on turf and construction customer accounts.

The lower provision for income taxes in 2023 was primarily due lower pretax income.

Receivables and Leases

For the fiscal years ended October 29, 2023 and October 30, 2022, Receivable and Lease (excluding wholesale) volumes and balances held were as follows:

Fiscal Year Volumes

Fiscal Year End Balances


%

%


2023


2022


Change


2023


2022


Change


Retail notes:

Agriculture and turf

$

13,787.7

$

12,723.9


8

$

26,708.3

$

23,796.5


12

Construction and forestry


2,725.9


2,840.1


(4)


5,289.6


4,954.1


7

Total retail notes


16,513.6


15,564.0


6


31,997.9


28,750.6


11

Revolving charge accounts


8,118.1


7,561.1


7


4,594.4


4,165.8

10

Financing leases


1,134.8


800.8


42


1,421.8


1,120.7


27

Equipment on operating leases


2,356.6


2,062.3


14


5,051.5


4,853.5


4

Total Receivables and Leases (excluding wholesale)

$

28,123.1

$

25,988.2


8

$

43,065.6

$

38,890.6


11

Customer Receivables increased $3,977.0 during 2023 compared 2022 due to strong John Deere retail sales.

25

Table of Contents

Total Receivables 30 days or more past due, non-performing Receivables, and the allowance for credit losses were as follows (as a percentage of the Receivables balance):

2023

2022

Dollars

Percent


Dollars

Percent


Receivables 30 days or more past due

$

514.1

1.00

%  

$

404.9

.95

%  

Non-performing Receivables

383.1

.75

263.2

.62

Allowance for credit losses

146.4

.29

128.4

.30

We monitor the credit quality of Receivables based on delinquency status. Receivables 30 days or more past due continue to accrue finance income. We stop accruing finance income once Receivables are considered non-performing, which generally occurs once Receivables are 90 days past due. An allowance for credit losses is recorded for the estimated credit losses expected over the life of the Receivable portfolio.

Deposits held from dealers and merchants amounted to $138.4 at October 29, 2023, compared with $137.3 at October 30, 2022. These balances primarily represent the aggregate dealer retail note and lease withholding accounts from individual John Deere dealers to which losses from retail notes and leases originating from the respective dealers can be charged. Recoveries from dealer deposits are recognized in “Other income” when the dealer’s withholding account is charged. Recoveries from dealer deposits and other freestanding credit enhancements recorded in other income in 2023 and 2022 were $17.0 and $8.5, respectively.

2022 Compared with 2021

Please refer to the “Management’s Discussion and Analysis” section of our 2022 Form 10-K.

Capital Resources and Liquidity

Sources of Liquidity, Key Metrics, and Balance Sheet Data

We rely on our ability to raise substantial amounts of funds to finance our Receivable and Lease portfolios. We have access to most global markets at a reasonable cost and our ability to meet our debt obligations is supported in several ways. Sources of liquidity include:

cash and cash equivalents,
the issuance of commercial paper and term debt,
the securitization of retail notes,
intercompany loans from John Deere,
our Receivable and Lease portfolio, which is self-liquidating in nature, and
bank lines of credit.

We closely monitor our liquidity sources against our cash requirements and expect to have sufficient sources of global funding and liquidity to meet our funding needs in the short-term (next 12 months) and long-term (beyond 12 months).

Key metrics and certain balance sheet data are provided in the following table as of October 29, 2023, October 30, 2022, and October 31, 2021:

2023

2022

2021

Cash, cash equivalents, and marketable securities


$

1,488.9


$

662.9


$

679.1

Receivables and Leases - net

56,249.3

47,166.7

41,443.3

Interest-bearing debt

50,514.5

41,856.1

37,319.9

Unused credit lines

841.2

3,283.9

5,770.3

Ratio of interest-bearing debt to stockholder’s equity

8.6 to 1

8.9 to 1

8.4 to 1

The reduction in unused credit lines at October 29, 2023, compared to both prior periods relates to an increase in commercial paper outstanding, by both us and John Deere, to fund growth in the Receivable portfolio.

26

Table of Contents

Cash Flows

2023

2022

2021

Net cash provided by operating activities


$

1,536.2


$

1,205.9


$

1,365.9

Net cash used for investing activities

(10,178.0)

(7,206.8)

(3,391.7)

Net cash provided by financing activities

9,480.2

6,017.1

2,026.2

Effect of Exchange Rate Changes on Cash, Cash Equivalents, and Restricted Cash

8.4

(22.9)

3.0

Net Increase (Decrease) in Cash, Cash Equivalents, and Restricted Cash

$

846.8

$

(6.7)

$

3.4

Net cash used for investing activities increased during 2023 primarily due to growth in the Receivable portfolio, which was funded primarily through external borrowings, cash provided by operating activities, and capital investments from John Deere, partially offset by a reduction in borrowings from John Deere.

Borrowings

Total borrowings increased $8,658.4 in 2023, corresponding with the level of the Receivable and Lease portfolios. During 2023, we issued $11,184.2 and retired $5,972.1 of long-term external borrowings, which primarily consisted of medium-term notes. During 2023, we also issued $4,479.6 and retired $3,194.5 of retail note securitization borrowings and maintained an average commercial paper balance of $4,910.9. Our funding profile may be altered to reflect such factors as relative costs of funding sources, assets available for securitizations, and capital market accessibility.

We have a revolving credit agreement to securitize retail notes (see Note 5). At October 29, 2023, the revolving credit agreement had a total capacity, or “financing limit,” of $1,500.0 of secured financings at any time. $1,281.4 of short-term securitization borrowings were outstanding under the agreement at October 29, 2023. At the end of the contractual revolving period, unless we and the banks agree to renew, we would liquidate the secured borrowings over time as payments on the retail notes are collected. The agreement was renewed in November 2023 with an expiration in November 2024 and a capacity of $2,000.0.

Capital Investments and Dividends

During 2023, Deere & Company increased its capital investment in JDFS by $810.0. JDFS, in turn, increased its capital investment in Capital Corporation by the same amount. The capital investments were made to maintain targeted leverage ratios and were driven by growth in total Receivables and corresponding borrowings. There were no capital investments during 2022.

Capital Corporation declared and paid cash dividends to JDFS of $165.0 in 2023 and $370.0 in 2022. In turn, JDFS paid comparable dividends to Deere & Company.

Lines of Credit

We have access to bank lines of credit with various banks throughout the world. Some of the lines are available to both us and Deere & Company. Worldwide lines of credit totaled $10,215.7 at October 29, 2023, $841.2 of which were unused. For the purpose of computing the unused credit lines, commercial paper and short-term bank borrowings of us and John Deere were considered to constitute utilization. See Note 8 for more information.

Debt Ratings

Our ability to obtain funding is affected by our debt ratings, which are closely related to the outlook for and the financial condition of John Deere, and the nature and availability of support facilities, such as our lines of credit and the support agreement from Deere & Company.

To access debt markets, we rely on credit rating agencies to assign short-term and long-term credit ratings to our debt. These ratings are an indicator of credit quality for fixed income investors. A debt rating is not a recommendation by the rating agency to buy, sell, or hold. A credit rating agency may change or withdraw ratings based on its assessment of our current and future ability to meet interest and principal repayment obligations. Lower credit ratings or negative changes to

27

Table of Contents

ratings outlooks generally result in higher borrowing costs, including costs of derivative transactions, and reduced access to debt capital markets, and may adversely impact our liquidity.

The senior long-term and short-term debt ratings and outlook currently assigned to our unsecured debt securities by the rating agencies engaged by us are the same as those for John Deere and are as follows:


Senior Long-Term


Short-Term


Outlook

Fitch Ratings


A+


F1


Stable

Moody’s Investors Service, Inc.


A2


Prime-1


Positive

Standard & Poor’s


A


A-1


Stable

Contractual Obligations and Cash Requirements

Our material cash requirements from contractual and other cash obligations relate to borrowings, including securitization borrowings. As of October 29, 2023, we had $18,865.9 of principal payments on borrowings and securitization borrowings payable in the next 12 months, along with interest payments of $1,612.4. The securitization borrowing payments are based on the expected liquidation of the related retail notes securitized. Our borrowings will likely be replaced with new borrowings to finance the Receivables and Leases portfolio. See Notes 5, 7, and 9 for further detail regarding future contractual payments on securitization borrowings, intercompany borrowings, and long-term external borrowings.

Critical Accounting Estimates

The timely preparation of financial statements requires management to make estimates and assumptions. Those estimates affect reported amounts in these financial statements. Changes in those estimates and assumptions could have a significant effect on our consolidated financial statements. The following estimates are the most critical to our consolidated financial statements:

allowance for credit losses,
operating lease residual values, and
income taxes.

These items require the most difficult, subjective, or complex judgments. Our accounting policies are described primarily in Note 2 of our Consolidated Financial Statements.

Allowance for Credit Losses

The allowance for credit losses is an estimate of the credit losses expected over the life of our Receivable portfolio. The allowance is measured on a collective basis for receivables with similar risk characteristics. Receivables that do not share risk characteristics are evaluated on an individual basis.  Risk characteristics include:

product category,
market,
geography,
credit risk, and
remaining balance.

We utilize the following loss forecast models to estimate expected credit losses:

Transition matrix models are used for large and complex Customer Receivable pools. These models are used for more than 90 percent of Customer Receivables. Historical portfolio performance and current delinquency levels are used to forecast future defaults. Estimated recovery rates are applied to the estimated default balance to calculate the expected credit losses.
Weighted-average remaining maturity (WARM) models are used for smaller and less complex Customer Receivable pools.
Historical loss rate models are used for wholesale receivables, with consideration of current economic conditions and dealer financial risk.

28

Table of Contents

The model output is adjusted for forecasted economic conditions which may include the following economic indicators:

commodity prices,
industry equipment sales,
unemployment rates, and
housing starts.

Management reviews each model’s output quarterly, and qualitative adjustments are incorporated as necessary. See Note 4 to the Consolidated Financial Statements for further information.

The allowance for credit losses at October 29, 2023, October 30, 2022, and October 31, 2021 was $146.4, $128.4, and $129.0, respectively. The allowance for credit losses increased in 2023 compared to 2022, primarily driven by growth in the retail notes and financing lease portfolios and higher expected losses on turf and construction customer accounts.

While we believe our allowance is sufficient to provide for losses over the life of our existing Receivables portfolio, different assumptions would result in changes to the allowance for credit losses, specifically:

For the wholesale receivable portfolio: Changes in economic conditions have historically had limited impact on credit losses.
Within the Customer Receivables portfolio: Credit loss estimates are dependent on a number of factors, including historical portfolio performance, current delinquency levels, and estimated recoveries on defaulted accounts.  

Holding all other factors constant, a 10 percent increase in the transition matrix models’ forecasted defaults as a result of elevated levels of delinquencies, deteriorating roll rates, or otherwise, and a simultaneous 10 percent decrease in recovery rates would have resulted in an increase to the allowance for credit losses of approximately $40 at October 29, 2023.

Operating Lease Residual Values

Equipment on operating leases is depreciated to the estimated residual value over the lease term. The residual values are based on several factors, including:

lease term,
expected hours of usage,
historical wholesale sale prices,
return experience,
intended equipment use,
market dynamics and trends, and
dealer residual value guarantees.

We review residual value estimates during the lease term. Depreciation is adjusted over the remaining lease term if residual value estimates are revised. Impairments are recorded when events or circumstances necessitate.

At the end of the majority of leases, the equipment is disposed in the following sequence:

The lessee has the option to purchase the equipment for the contractual residual value.
The dealer has the option to purchase the equipment.
The equipment is sold to a third party at the equipment’s fair value. In this situation, we may record a gain or loss for the difference between the residual value and the sale price.

The total operating lease residual values at October 29, 2023, October 30, 2022, and October 31, 2021 were $3,538.3, $3,366.7, and $3,547.6, respectively. The increase in 2023 was primarily due to a higher operating lease portfolio.

Hypothetically, if (a) future market values for equipment on operating leases were to decrease 10 percent from our present estimates and (b) all the equipment on operating leases were returned to us for remarketing at the end of the lease term, the total unfavorable impact after consideration of dealer residual value guarantees would be approximately $80. This amount would be recognized as higher depreciation expense over the remaining term of the operating leases, or potentially as an impairment.

29

Table of Contents

Income Taxes

We are subject to federal, state, and foreign income taxes. These tax laws can be complex. Significant judgment and interpretation is required to implement them. Changes in tax laws could materially affect our consolidated financial statements. We record our tax positions in the following categories:

current taxes,
deferred taxes, and
uncertain tax positions.

Deferred income taxes represent temporary differences between the tax and the financial reporting basis of assets and liabilities. This will result in taxable or deductible amounts in the future. Loss carryforwards and tax credits are significant components of deferred tax asset balances. These assets are reviewed regularly for the following:

the likelihood of recoverability from future taxable income,
reversal of deferred tax liabilities, and
tax planning strategies.

Valuation allowances are established when we determine that the deferred tax benefit may not be realized. The recoverability analysis requires significant judgment and relies on estimates. Changes in foreign income tax laws, income for certain jurisdictions, or our tax structure could impact the valuation allowance balance.

Some tax positions contain significant uncertainties. These positions may be challenged or disallowed by taxing authorities. If it is likely the position will be disallowed, no tax benefit is recorded. If it is likely the position will be sustained, a tax benefit is recognized. The ultimate resolution could take many years. This may result in a payment that is significantly different from the original estimate.

See Note 14 for further information on income taxes.

Forward-Looking Statements

Certain statements contained herein, including in the section entitled “Overview” relating to future events, expectations, and trends constitute “forward-looking statements” as defined in the Private Securities Litigation Reform Act of 1995.

Forward-looking statements are based on currently available information and current assumptions, expectations, and projections about future events and should not be relied upon. Except as required by law, we expressly disclaim any obligation to update or revise our forward-looking statements. Many factors, risks, and uncertainties could cause actual results to differ materially from these forward-looking statements. Among these factors are risks related to:

volumes of Receivables and Leases being dependent upon the level of retail sales and leases of John Deere products;
changes in U.S., foreign and international laws, regulations, and policies relating to trade, spending, taxing, banking, monetary, environmental (including climate change and engine emission), and farming policies;
political, economic, and social instability of the geographies in which we and John Deere operate;
including the ongoing wars between Russia and Ukraine and between Israel and Hamas;
adverse macroeconomic conditions, including unemployment, inflation, rising interest rates, changes in consumer practices due to slower economic growth or possible recession, and regional or global liquidity constraints;
growth and sustainability of non-food uses for crops (including ethanol and biodiesel production);
John Deere’s and our ability to execute business strategies, including John Deere’s Smart Industrial Operating Model and Leap Ambitions;
John Deere’s and our ability to understand and meet customers’ changing expectations and demand for John Deere products and solutions, including our financing solutions;
John Deere’s and our ability to adapt in highly competitive markets;
John Deere’s dealer practices and their ability to manage distribution of John Deere products and support and service precision technology solutions;

30

Table of Contents

changes in climate patterns, unfavorable weather events, and natural disasters;
governmental and other actions designed to address climate change in connection with a transition to a lower-carbon economy;
higher interest rates and currency fluctuations, which could adversely affect the U.S. dollar, customer confidence, access to capital, and demand for John Deere’s and our products and solutions;
stress in the banking sector may have adverse impacts on vendors or customers as well as on our ability to access cash deposits;
changes in our credit ratings and any failure to comply with financial covenants in credit agreements could impact access to funding;
availability and price of raw materials, components, whole goods, and used equipment;
delays or disruptions in John Deere’s supply chain;
the ability to attract, develop, engage, and retain qualified personnel;
security breaches, cybersecurity attacks, technology failures, and other disruptions to the information technology infrastructure and products of John Deere, their products, or us;
compliance with evolving U.S. and foreign laws, including economic sanctions, data privacy, and environmental laws and regulations; 
investigations, claims, lawsuits, or other legal proceedings;
events that damage John Deere’s or our reputation or brand;
world grain stocks, available farm acres, soil conditions, harvest yields, prices for commodities and livestock, input costs, and availability of transport for crops; and
housing starts and supply, real estate and housing prices, levels of public and non-residential construction, and infrastructure investment.

Further information concerning our business, including factors that could materially affect our financial results, is included in our filings with the SEC (including, but not limited to, the factors discussed in Item 1A. “Risk Factors” of this Annual Report on Form 10-K). There also may be other factors that we cannot anticipate or that are not described herein because we do not currently perceive them to be material. Our business is closely related to John Deere’s business. Further information, including factors that could materially affect our financial results and John Deere’s financial results, is included in the most recent Deere & Company Annual Report on Form 10-K (including, but not limited to, the factors discussed in Item 1A., “Risk Factors” of the most recent Annual Report on Form 10-K) and other Deere & Company filings with the SEC.

Item 7A.  Quantitative and Qualitative Disclosures About Market Risk.

Financial Instrument Market Risk Information

We are naturally exposed to various interest rate and foreign currency risks. In an effort to mitigate the effects of such risks, we enter into derivative transactions to manage this exposure and not for speculative purposes.

From time to time, we enter into interest rate swap agreements to manage our interest rate exposure. We also have foreign currency exposures at some of our foreign and domestic operations related to financing in currencies other than the functional currencies. We have entered into derivative agreements related to the management of these foreign currency transaction risks.

Interest Rate Risk

Results of Operations – Central bank policy rates increased in 2022 and 2023. Rising interest rates have historically impacted our borrowings sooner than the benefit is realized from the Receivable and Lease portfolio. As a result, our financing spread was unfavorably impacted in 2023 compared to 2022. If interest rates continue to rise, we expect to continue experiencing spread compression in 2024.

31

Table of Contents

Fair Value Measurement – Quarterly, we use a combination of cash flow models to assess the sensitivity of our financial instruments with interest rate exposure to changes in market interest rates. The models calculate the effect of adjusting interest rates as follows:

cash flows for Receivables are discounted at the current prevailing rate for each Receivable portfolio,
cash flows for unsecured borrowings are discounted at the applicable benchmark yield curve plus market credit spreads for similarly rated borrowers,
cash flows for securitized borrowings are discounted at the swap yield curve plus a market credit spread for similarly rated borrowers, and
cash flows for interest rate swaps are projected and discounted using forward rates from the swap yield curve at the repricing dates.

The net loss in these financial instruments’ fair values, which would be caused by increasing the interest rates by 10 percent from the market rates at October 29, 2023 and October 30, 2022, would have been approximately $137 and $115, respectively.

Reference Rate Reform – We transitioned our financing, funding, and hedging portfolios from the London Interbank Offered Rate (LIBOR) to alternative reference rates. These transition activities did not have a material impact on our financial statements.

Foreign Currency Risk

Our policy is to manage foreign currency risk through hedging strategies if the currency of the borrowings does not match the currency of the Receivable portfolio. As a result, a hypothetical 10 percent adverse change in the value of the U.S. dollar relative to all other foreign currencies would not have a material effect on our cash flows.

Item 8. Financial Statements and Supplementary Data.

See accompanying table of contents of financial statements on page 35.

Item 9. Changes in and Disagreements with Accountants on Accounting and Financial Disclosure.

Not applicable.

Item 9A.  Controls and Procedures.

Disclosure Controls and Procedures

Our principal executive officer and our principal financial officer have concluded that our disclosure controls and procedures (as defined in Rules 13a-15(e) and 15d-15(e) of the Securities Exchange Act of 1934, as amended (the Exchange Act)) were effective as of October 29, 2023, based on the evaluation of these controls and procedures required by Rule 13a-15(b) or 15d-15(b) of the Exchange Act.

Management’s Report on Internal Control Over Financial Reporting

Management is responsible for establishing and maintaining adequate internal control over financial reporting. Our internal control system was designed to provide reasonable assurance regarding the preparation and fair presentation of published financial statements in accordance with generally accepted accounting principles in the U.S.

All internal control systems, no matter how well designed, have inherent limitations. Therefore, even those systems determined to be effective can provide only reasonable assurance with respect to financial statement preparation and presentation in accordance with generally accepted accounting principles in the U.S.

Management assessed the effectiveness of our internal control over financial reporting as of October 29, 2023, using the criteria set forth in Internal Control – Integrated Framework (2013) issued by the Committee of Sponsoring Organizations of the Treadway Commission. Based on that assessment, management concluded that, as of October 29, 2023, our internal control over financial reporting was effective.

32

Table of Contents

This Annual Report on Form 10-K does not include an attestation report of our independent registered public accounting firm regarding internal control over financial reporting. Management’s report was not subject to attestation by our independent registered public accounting firm pursuant to rules of the Securities and Exchange Commission that permit us to provide only management’s report in this Annual Report on Form 10-K.

Changes in Internal Control Over Financial Reporting

During the fourth quarter, there were no changes that have materially affected or are reasonably likely to materially affect our internal control over financial reporting.

Item 9B.  Other Information.

On December 14, 2023, we entered into an amended and restated international support agreement (the “International Support Agreement”) with Deere & Company and certain of our wholly-owned subsidiaries, pursuant to which we and Deere & Company have agreed to make periodic support payments to each other if and to the extent necessary to ensure our International Business (defined as our businesses in certain international markets, including Mexico, Argentina and Chile) earns a specified target return on equity. The International Support Agreement was amended and restated to include the impact of foreign exchange gains/losses in the calculation of the amount of support payments payable thereunder. The International Support Agreement is intended to ensure our ability to support Deere & Company’s operations in the applicable jurisdictions.

The International Support Agreement may be terminated by us or Deere & Company upon thirty days’ notice to the other party. Deere & Company’s obligations to make payments under the International Support Agreement are expressly stated not to be a guarantee of any specific indebtedness, obligation, or liability of ours. The foregoing summary of the International Support Agreement does not purport to be complete and is subject to, and qualified in its entirety by, the full text of the International Support Agreement, a copy of which is filed herewith as Exhibit 10.11 and is incorporated into this report by reference.

Item 9C.  Disclosure Regarding Foreign Jurisdictions That Prevent Inspections.

Not applicable.

PART III

Item 10.  Directors, Executive Officers, and Corporate Governance.

Omitted pursuant to Instruction I(2).

Item 11.  Executive Compensation.

Omitted pursuant to Instruction I(2).

Item 12.  Security Ownership of Certain Beneficial Owners and Management and Related Stockholder Matters.

Omitted pursuant to Instruction I(2).

Item 13.  Certain Relationships and Related Transactions, and Director Independence.

Omitted pursuant to Instruction I(2).

Item 14.  Principal Accountant Fees and Services.

For the years ended October 29, 2023 and October 30, 2022, professional services were performed by Deloitte & Touche LLP (PCAOB ID No. 34), the member firms of Deloitte Touche Tohmatsu, and their respective affiliates (collectively called Deloitte & Touche).

33

Table of Contents

Audit Fees

The aggregate fees billed include amounts for the audit of our annual financial statements, the reviews of the financial statements included in our Quarterly Reports on Form 10-Q, including services related thereto such as comfort letters, statutory audits, attest services, consents, and assistance with and review of documents filed with the SEC and other regulatory bodies. Audit fees for the fiscal years ended October 29, 2023 and October 30, 2022 were $4.1 and $3.4, respectively.

Audit-Related Fees

During the last two fiscal years, Deloitte & Touche has provided us with assurance and related services that are reasonably related to the performance of the audit of our financial statements. The aggregate fees billed for such audit-related services for each of the fiscal years ended October 29, 2023 and October 30, 2022 were $.3. These services included various attest services.

Tax Fees

There were no fees billed for professional services provided by Deloitte & Touche in connection with tax advice and tax planning services for the fiscal years ended October 29, 2023 and October 30, 2022.

All Other Fees

There were no fees billed by Deloitte & Touche for services not included above for the fiscal years ended October 29, 2023 and October 30, 2022.

Pre-approval of Services by the Independent Registered Public Accounting Firm

As a wholly-owned subsidiary of Deere & Company, audit and non-audit services provided by our independent registered public accounting firm are subject to Deere & Company’s Audit Review Committee pre-approval policies and procedures as described in the Deere & Company 2023 proxy statement. During the fiscal year ended October 29, 2023, all services provided by the independent registered public accounting firm were pre-approved by Deere & Company’s Audit Review Committee in accordance with such policy.

PART IV

Item 15.  Exhibits and Financial Statement Schedules.

(1)

Financial Statements

See the table of contents to financial statements on page 35.

(2)

Financial Statement Schedules

None.

(3)

Exhibits

See the index to exhibits on page 72.

Item 16.  Form 10-K Summary.

None.

34

Table of Contents

Table of Contents

Page

Financial Statements:

John Deere Capital Corporation and Subsidiaries:

Report of Independent Registered Public Accounting Firm

36

Statements of Consolidated Income
For the Years Ended October 29, 2023, October 30, 2022, and October 31, 2021

39

Statements of Consolidated Comprehensive Income
For the Years Ended October 29, 2023 October 30, 2022, and October 31, 2021

40

Consolidated Balance Sheets
As of October 29, 2023 and October 30, 2022

41

Statements of Consolidated Cash Flows
For the Years Ended October 29, 2023, October 30, 2022, and October 31, 2021

42

Statements of Changes in Consolidated Stockholder’s Equity
For the Years Ended October 31, 2021, October 30, 2022, and October 29, 2023

43

Notes to Consolidated Financial Statements

44

Schedules Omitted

The following schedules are omitted because of the absence of conditions under which they are required or because the required information is included in the Notes to the Consolidated Financial Statements:

I, II, III, IV, and V.

35

Table of Contents

REPORT OF INDEPENDENT REGISTERED PUBLIC ACCOUNTING FIRM

To the stockholders and the Board of Directors of John Deere Capital Corporation:

Opinion on the Financial Statements

We have audited the accompanying consolidated balance sheets of John Deere Capital Corporation and subsidiaries (the “Company”) as of October 29, 2023 and October 30, 2022, the related statements of consolidated income, consolidated comprehensive income, changes in consolidated stockholder’s equity, and consolidated cash flows, for each of the three years in the period ended October 29, 2023, and the related notes (collectively referred to as the "financial statements"). In our opinion, the financial statements present fairly, in all material respects, the financial position of the Company as of October 29, 2023 and October 30, 2022, and the results of its operations and its cash flows for each of the three years in the period ended October 29, 2023, in conformity with accounting principles generally accepted in the United States of America.

Basis for Opinion

These financial statements are the responsibility of the Company's management. Our responsibility is to express an opinion on the Company's financial statements based on our audits. We are a public accounting firm registered with the Public Company Accounting Oversight Board (United States) (PCAOB) and are required to be independent with respect to the Company in accordance with the U.S. federal securities laws and the applicable rules and regulations of the Securities and Exchange Commission and the PCAOB.

We conducted our audits in accordance with the standards of the PCAOB. Those standards require that we plan and perform the audit to obtain reasonable assurance about whether the financial statements are free of material misstatement, whether due to error or fraud. The Company is not required to have, nor were we engaged to perform, an audit of its internal control over financial reporting. As part of our audits, we are required to obtain an understanding of internal control over financial reporting but not for the purpose of expressing an opinion on the effectiveness of the Company’s internal control over financial reporting. Accordingly, we express no such opinion.

Our audits included performing procedures to assess the risks of material misstatement of the financial statements, whether due to error or fraud, and performing procedures that respond to those risks. Such procedures included examining, on a test basis, evidence regarding the amounts and disclosures in the financial statements. Our audits also included evaluating the accounting principles used and significant estimates made by management, as well as evaluating the overall presentation of the financial statements. We believe that our audits provide a reasonable basis for our opinion.

Critical Audit Matter

The critical audit matter communicated below is a matter arising from the current-period audit of the financial statements that was communicated or required to be communicated to the audit committee and that (1) relates to accounts or disclosures that are material to the financial statements and (2) involved our especially challenging, subjective, or complex judgments. The communication of critical audit matters does not alter in any way our opinion on the financial statements, taken as a whole, and we are not, by communicating the critical audit matter below, providing a separate opinion on the critical audit matter or on the accounts or disclosures to which it relates.

36

Table of Contents

Allowance for Credit Losses – Refer to Notes 2 and 4 to the financial statements

Critical Audit Matter Description

The allowance for credit losses is an estimate of the credit losses expected over the life of the Company’s receivable portfolio. Non-performing receivables are included in the estimate of expected credit losses. The allowance is measured on a collective basis for receivables with similar risk characteristics. Receivables that do not share risk characteristics are evaluated on an individual basis. Risk characteristics include:

product category,
market,
geography,
credit risk,
remaining balance.

The Company utilizes the following loss forecast models to estimate expected credit losses:

Customer Receivables:

Transition matrix models are used for large and complex customer receivable pools. These models are used for more than 90 percent of customer receivables and estimate credit losses using historical delinquency and default information to assign probabilities that a receivable will pay as contractually scheduled or become delinquent and advance through the various delinquency stages. The model simulates the runoff of the portfolio, month-by-month, over the life of the receivables until the balances are fully repaid or default, using roll rates applied to the outstanding portfolio. The roll rates are applied based on the delinquency status of the customer accounts and are further segmented based on the credit risk and remaining balance of the underlying receivables. Estimated recovery rates are applied to the balance at default to calculate the expected credit losses.
Weighted-average remaining maturity (WARM) models are used for smaller and less complex customer receivable pools, and apply historical average annual loss rates, adjusted for current and forecasted economic conditions, to the projected portfolio runoff.

Wholesale receivables:

Historical loss rate models are used for wholesale receivables, with consideration of current economic conditions and dealer financial risk. Changes in economic conditions have historically had limited impact on credit losses in this portfolio.

The model output is adjusted for forecasted economic conditions, which may include the economic indicators listed below. Management also reviews each model’s output quarterly, and qualitative adjustments are incorporated as necessary.

commodity prices
industry equipment sales
unemployment rates
housing starts

We identified the allowance for credit losses estimated for the Company’s United States receivable portfolio by the transition matrix models and related reasonable and supportable forecast and qualitative adjustment as a critical audit matter because determining the appropriate methodology and assumptions used in the estimate requires significant judgment by management. Given the subjective nature and judgment applied by management to determine the allowance for credit losses, auditing the methodology and assumptions requires a high degree of auditor judgment and an increased extent of effort, including the need to involve credit specialists.

37

Table of Contents

How the Critical Audit Matter Was Addressed in the Audit

Our audit procedures related to testing the United States portion of the Company’s allowance for credit losses estimated by the transition matrix models and related reasonable and supportable forecast and qualitative adjustment included the following, among others:

We tested the effectiveness of management’s controls over the methodology, data and assumptions used to estimate the allowance for credit losses.
We tested the accuracy and evaluated the relevance of the underlying historical data used in the Company’s transition matrix model.
With the assistance of our credit specialists, we evaluated the reasonableness and accuracy of the transition matrix model used to estimate the allowance for credit losses, including model assumptions and the selection and application of relevant risk characteristics and use of qualitative adjustments.
We evaluated qualitative adjustments to the model estimate. Our evaluation included:
oComparison of qualitative factors used by the Company to source data provided by the Company and/or to externally available data
oConsideration and evaluation of contradictory evidence

We evaluated management’s ability to accurately forecast credit losses by performing a retrospective review, which involved comparing actual credit losses to historical estimates.

/s/ DELOITTE & TOUCHE LLP

Chicago, Illinois

December 15, 2023

We have served as the Company’s auditor since 1959.

38

Table of Contents

John Deere Capital Corporation and Subsidiaries

Statements of Consolidated Income

For the Years Ended October 29, 2023, October 30, 2022, and October 31, 2021

(in millions)

2023


2022


2021

Revenues

Finance income earned on retail notes

$

1,494.7

$

1,064.5

$

976.0

Lease revenues


997.3


963.7


1,028.3

Revolving charge account income


417.4


300.2


298.1

Finance income earned on wholesale receivables


889.8


342.5


299.8

Other income


176.3


135.7


121.5

Total revenues


3,975.5


2,806.6


2,723.7

Expenses

Interest expense


1,671.5


497.3


472.9

Operating expenses:

Depreciation of equipment on operating leases

659.7


667.7


733.4

Administrative and operating expenses

569.4


501.6


471.8

Fees and interest paid to John Deere

252.6


222.1


168.3

Provision (credit) for credit losses

88.5


23.5


(.9)

Total operating expenses


1,570.2


1,414.9


1,372.6

Total expenses


3,241.7


1,912.2


1,845.5

Income of Consolidated Group before Income Taxes


733.8


894.4


878.2

Provision for income taxes


165.9


205.6


193.8

Income of Consolidated Group


567.9


688.8


684.4

Equity in income of unconsolidated affiliate


3.9


4.5


3.0

Net Income


571.8


693.3


687.4

Less: Net income (loss) attributable to noncontrolling interests

(.5)

(.3)


.2

Net Income Attributable to the Company

$

572.3

$

693.6

$

687.2

The accompanying Notes to Consolidated Financial Statements are an integral part of this statement.

39

Table of Contents

John Deere Capital Corporation and Subsidiaries

Statements of Consolidated Comprehensive Income

For the Years Ended October 29, 2023, October 30, 2022, and October 31, 2021

(in millions)

2023

2022

2021

Net Income


$

571.8


$

693.3


$

687.4

Other Comprehensive Income (Loss), Net of Income Taxes

Cumulative translation adjustment

32.2

(114.5)

15.0

Unrealized gain (loss) on derivatives

(32.0)

60.0

13.5

Unrealized gain (loss) on debt securities

.1

(.8)

(.1)

Other Comprehensive Income (Loss), Net of Income Taxes

.3

(55.3)

28.4

Comprehensive Income of Consolidated Group

572.1

638.0

715.8

Less: Comprehensive income (loss) attributable to noncontrolling interests

(.5)

(.3)

.2

Comprehensive Income Attributable to the Company

$

572.6

$

638.3

$

715.6

The accompanying Notes to Consolidated Financial Statements are an integral part of this statement.

40

Table of Contents

John Deere Capital Corporation and Subsidiaries

Consolidated Balance Sheets

As of October 29, 2023 and October 30, 2022

(in millions)

2023


2022

Assets

Cash and cash equivalents

$

1,487.5

$

661.8

Marketable securities

1.4

1.1

Receivables:

Retail notes


24,641.1


22,799.0

Retail notes securitized


7,356.8


5,951.6

Revolving charge accounts


4,594.4


4,165.8

Wholesale receivables


13,330.1


8,404.5

Financing leases


1,421.8


1,120.7

Total receivables


51,344.2


42,441.6

Allowance for credit losses


(146.4)


(128.4)

Total receivables – net


51,197.8


42,313.2

Other receivables


162.0


91.4

Receivables from John Deere


144.4


214.8

Equipment on operating leases – net


5,051.5


4,853.5

Notes receivable from John Deere

650.7

370.7

Investment in unconsolidated affiliate


27.6


22.6

Deferred income taxes


24.6


25.5

Other assets


367.5


314.3

Total Assets

$

59,115.0

$

48,868.9

Liabilities and Stockholder’s Equity

Short-term external borrowings:

Commercial paper and other notes payable

$

6,836.1

$

2,402.3

Securitization borrowings


6,995.2


5,710.9

Current maturities of long-term external borrowings


6,059.9


5,989.6

Total short-term external borrowings


19,891.2


14,102.8

Notes payable to John Deere


3,184.0


5,225.5

Other payables to John Deere


974.9


1,024.2

Accounts payable and accrued expenses


1,128.3


957.3

Deposits held from dealers and merchants


138.4


137.3

Deferred income taxes


456.3


208.5

Long-term external borrowings


27,439.3


22,527.8

Total liabilities


53,212.4


44,183.4

Commitments and contingencies (Note 17)

Stockholder’s equity:

Common stock, without par value (issued and outstanding –
2,500 shares owned by John Deere Financial Services, Inc.)


2,292.8


1,482.8

Retained earnings


3,713.2


3,305.9

Accumulated other comprehensive loss


(104.4)


(104.7)

Total Company stockholder’s equity


5,901.6


4,684.0

Noncontrolling interests


1.0


1.5

Total stockholder’s equity


5,902.6


4,685.5

Total Liabilities and Stockholder’s Equity

$

59,115.0

$

48,868.9

The accompanying Notes to Consolidated Financial Statements are an integral part of this statement.

41

Table of Contents

John Deere Capital Corporation and Subsidiaries

Statements of Consolidated Cash Flows

For the Years Ended October 29, 2023, October 30, 2022, and October 31, 2021

(in millions)


2023


2022


2021


Cash Flows from Operating Activities:

Net income

$

571.8

$

693.3

$

687.4

Adjustments to reconcile net income to net cash
provided by operating activities:

Provision (credit) for credit losses


88.5


23.5


(.9)

Provision for depreciation and amortization


686.0


692.1


756.6

Provision (credit) for deferred income taxes


257.2


(35.3)


(89.7)

Change in accounts payable and accrued expenses


191.8


12.0


(17.9)

Change in accrued income taxes payable/receivable


(47.4)


(31.9)


(11.1)

Other


(211.7)


(147.8)


41.5

Net cash provided by operating activities


1,536.2


1,205.9


1,365.9

Cash Flows from Investing Activities:

Cost of receivables acquired (excluding wholesale)


(25,776.6)


(23,941.6)


(22,438.0)

Collections of receivables (excluding wholesale)


21,553.4


19,967.5


18,147.4

Decrease (increase) in wholesale receivables – net


(4,836.1)


(2,737.6)


1,197.1

Cost of equipment on operating leases acquired


(2,362.5)


(2,067.1)


(1,845.7)

Proceeds from sales of equipment on operating leases


1,528.6


1,547.4


1,569.1

Cost of notes receivable acquired from John Deere

(397.5)

(351.9)

(321.5)

Collections of notes receivable from John Deere

122.5

367.4

297.5

Other


(9.8)


9.1


2.4

Net cash used for investing activities


(10,178.0)


(7,206.8)


(3,391.7)

Cash Flows from Financing Activities:

Increase in commercial paper and other notes payable – net (original maturities of three months or less)


2,643.8


1,716.6


504.9

Increase (decrease) in securitization borrowings – net


1,285.1


1,119.7


(60.7)

Increase (decrease) in short-term borrowings with John Deere – net


(2,017.0)


88.6


392.8

Proceeds from external borrowings issued (original maturities greater than three months)


13,020.4


9,255.3


7,418.3

Payments of external borrowings (original maturities greater than three months)


(6,046.2)


(5,754.4)


(5,710.4)

Dividends paid


(165.0)


(370.0)


(485.0)

Capital investments from John Deere

810.0

Debt issuance costs


(50.9)


(38.7)


(33.7)

Net cash provided by financing activities


9,480.2


6,017.1


2,026.2

Effect of Exchange Rate Changes on Cash, Cash Equivalents, and Restricted Cash


8.4


(22.9)


3.0

Net Increase (Decrease) in Cash, Cash Equivalents, and Restricted Cash


846.8


(6.7)


3.4

Cash, Cash Equivalents, and Restricted Cash at Beginning of Year


766.1


772.8


769.4

Cash, Cash Equivalents, and Restricted Cash at End of Year

$

1,612.9

$

766.1

$

772.8

Components of Cash, Cash Equivalents, and Restricted Cash:

Cash and cash equivalents

$

1,487.5

$

661.8

$

677.0

Restricted cash*

125.4

104.3

95.8

Total Cash, Cash Equivalents, and Restricted Cash

$

1,612.9

$

766.1

$

772.8

* Restricted cash is reported in other assets on the consolidated balance sheets and primarily relates to the securitization of receivables (see Note 5).

The accompanying Notes to Consolidated Financial Statements are an integral part of this statement.

42

Table of Contents

John Deere Capital Corporation and Subsidiaries

Statements of Changes in Consolidated Stockholder’s Equity

For the Years Ended October 31, 2021, October 30, 2022 and October 29. 2023

(in millions)

Company Stockholder


Accumulated


Total

Other

Non-


Stockholder’s

Common

Retained

Comprehensive

controlling


Equity

Stock

Earnings

Income (Loss)

Interests


Balance November 1, 2020

$

4,212.9

$

1,482.8

$

2,806.3

$

(77.8)

$

1.6

ASU No. 2016-13 adoption


(26.2)

(26.2)

Net income


687.4

687.2

.2

Other comprehensive income


28.4


28.4

Dividends declared

(485.0)

(485.0)

Balance October 31, 2021


4,417.5


1,482.8

2,982.3

(49.4)

1.8

Net income (loss)


693.3

693.6

(.3)

Other comprehensive loss


(55.3)

(55.3)

Dividends declared


(370.0)


(370.0)

Balance October 30, 2022


4,685.5


1,482.8

3,305.9

(104.7)

1.5

Net income (loss)


571.8

572.3

(.5)

Other comprehensive income


.3

.3

Capital investments

810.0

810.0

Dividends declared


(165.0)

(165.0)

Balance October 29, 2023

$

5,902.6

$

2,292.8

$

3,713.2

$

(104.4)

$

1.0

The accompanying Notes to Consolidated Financial Statements are an integral part of this statement.

43

Table of Contents

John Deere Capital Corporation and Subsidiaries

Notes to Consolidated Financial Statements

Note Listing

Page

1.

Organization and Consolidation

44


2.

Summary of Significant Accounting Policies and New Accounting Standards

45


3.

Receivables

48


4.

Allowance for Credit Losses and Credit Quality of Receivables

50


5.

Securitization of Receivables

54


6.

Leases

55


7.

Notes Receivable from and Payable to John Deere

58


8.

Short-Term External Borrowings

58


9.

Long-Term External Borrowings

59


10.

Capital Stock

59


11.

Capital Investments and Dividends

60


12.

Pension and Other Postretirement Benefits

60


13.

Share-Based Compensation

60


14.

Income Taxes

61


15.

Other Income and Administrative and Operating Expenses

63


16.

Supplemental Cash Flow Information

63


17.

Commitments and Contingencies

63


18.

Other Comprehensive Income Items

64


19.

Fair Value Measurements

65


20.

Derivative Instruments

67


21.

Geographic Area Information

69


22.

Unconsolidated Affiliated Company

70


23.

Immaterial Restatement of Prior Period Financial Statements

70


24.

Subsequent Events

71


Note 1. Organization and Consolidation

Corporate Organization

References to John Deere Capital Corporation (Capital Corporation), “the Company,” “we,” “us,” or “our” include our consolidated subsidiaries. John Deere Financial Services, Inc. (JDFS), a wholly-owned finance holding subsidiary of Deere & Company, owns all of the outstanding common stock of Capital Corporation. We conduct business in Australia, New Zealand, the U.S., and in several countries in Africa, Asia, Europe, and Latin America, including Argentina and Mexico. Deere & Company and its wholly-owned subsidiaries are collectively called “John Deere.”

Retail notes, revolving charge accounts, and financing leases are collectively called “Customer Receivables.” Customer Receivables and wholesale receivables are collectively called “Receivables.” Receivables and equipment on operating leases are collectively called “Receivables and Leases.”

We bear substantially all of the credit risk (net of recovery from withholdings from certain John Deere dealers and merchants) associated with our holding of Receivables and Leases. We secure our Receivables, other than certain revolving charge accounts, by retaining as collateral security in the equipment associated with those Receivables or with the use of other collateral, and require theft and physical damage insurance on such equipment. A small portion of the Receivables and Leases held (less than 5 percent) is guaranteed by certain subsidiaries of Deere & Company. We also perform substantially all servicing and collection functions. Servicing and collection functions for a small portion of the Receivables and Leases held (less than 5 percent) are provided by John Deere. John Deere is reimbursed for staff and other administrative services at estimated cost, and for credit lines provided to us based on utilization of those lines.

44

Table of Contents

Principles of Consolidation

The consolidated financial statements represent the consolidation of all companies in which Capital Corporation has a controlling interest. Certain variable interest entities (VIEs) are consolidated since we are the primary beneficiary. The primary beneficiary has both the power to direct the activities that most significantly impact the VIEs’ economic performance and the obligation to absorb losses or the right to receive benefits that could potentially be significant to the VIEs. We consolidate certain VIEs that are special purpose entities (SPEs) related to the securitization of receivables (see Note 5). We record our investment in each unconsolidated affiliated company (20 to 50 percent ownership) at our related equity in the net assets of such affiliate (see Note 22).

Fiscal Year

We use a 52/53 week fiscal year ending on the last Sunday in the reporting period, which generally occurs near the end of October. An additional week is included in the fourth fiscal quarter every five or six years to realign our fiscal quarters with the calendar. The fiscal year ends for 2023, 2022, and 2021 were October 29, 2023, October 30, 2022, and October 31, 2021, respectively. Fiscal years 2023, 2022, and 2021 contained 52 weeks. Unless otherwise stated, references to particular years or quarters refer to our fiscal years and the associated periods in those fiscal years.

Presentation of Amounts

All amounts are presented in millions of dollars, unless otherwise specified.

Immaterial Restatement of Prior Period Financial Statements

In the second quarter of 2023, we corrected the accounting treatment for financing incentives offered to John Deere dealers, which impacted the timing of expense recognition and the presentation of incentive costs in our consolidated financial statements. Refer to Note 2 for further information regarding the new and previous accounting treatment. The impact of the correction in periods prior to the quarter ended April 30, 2023 was not material to our consolidated financial statements in any of the impacted periods; however, the aggregate impact of correcting prior periods within the quarter ended April 30, 2023 would have been material to our 2023 consolidated financial results. Consequently, we made these immaterial corrections in the comparative prior periods. Refer to Note 23 for quantification of the prior period restatement impacts. Additionally, comparative prior period amounts in the applicable notes to the consolidated financial statements have been restated.

Argentina

We have financial services operations in Argentina. The U.S. dollar has historically been the functional currency for our Argentina operations, as its business is indexed to the U.S. dollar due to the highly inflationary conditions. The Argentine government has certain capital and currency controls that restrict our ability to access U.S. dollars in Argentina and remit earnings from our Argentine operations. As of October 29, 2023 and October 30, 2022, our net investment in Argentina was $41.1 and $53.5, respectively. Revenues from our Argentine operations represented approximately 2 percent and 3 percent of our consolidated revenues for 2023 and 2022, respectively. The net peso exposure as of October 29, 2023 and October 30, 2022 was approximately $31.8 and $45.6, respectively. Argentine peso-denominated monetary assets and liabilities are remeasured at each balance sheet date using the official currency exchange rate. During 2023, 2022, and 2021, we recognized pretax net foreign exchange losses of $27.4, $22.1, and $14.0, respectively, related to our Argentina operations.

Note 2. Summary of Significant Accounting Policies and New Accounting Standards

The following are significant accounting policies in addition to those included in other notes to the consolidated financial statements.

Use of Estimates in Financial Statements

Certain accounting policies require management to make estimates and assumptions in determining the amounts reflected in the financial statements and related disclosures. Actual results could differ from these estimates.

45

Table of Contents

Cash and Cash Equivalents

We consider investments with purchased maturities of three months or less to be cash equivalents.

Revenue Recognition

Financing revenue, including compensation from John Deere for waived or reduced finance charges, is recorded over the lives of the related receivables using the interest method. Deferred costs on the origination of receivables are recognized as a reduction in finance revenue over the lives of the receivables using the interest method. Operating lease revenue, including compensation from John Deere, and deferred costs on the origination of operating leases are recognized on a straight-line basis over the scheduled lease terms in lease revenue.

Receivables and Allowance for Credit Losses

Receivables are reported on the consolidated balance sheets at outstanding principal and accrued interest, adjusted for any write-offs and any unamortized deferred fees or costs on originated Receivables. We also record an allowance for credit losses and provision for credit losses related to the Receivables. The allowance represents an estimate of the credit losses expected over the life of the Receivable portfolio. Receivables are written off to the allowance when the account is considered uncollectible. Refer to Note 4 for additional information.

Securitization of Receivables

Certain Receivables are periodically transferred to SPEs in securitization transactions (see Note 5). These securitizations qualify as collateral for secured borrowings and no gains or losses are recognized at the time of securitization. The receivables remain on the consolidated balance sheets and are classified as “Retail notes securitized.” We recognize finance income over the lives of these receivables using the interest method.

Depreciation

We estimate residual values of equipment on operating leases at the inception of the lease, and the equipment is depreciated over the lease terms to the estimated residual value using the straight-line method. We review residual value estimates during the lease term and depreciation is adjusted prospectively on a straight-line basis over the remaining lease term if residual estimates are revised.

Impairment of Long-Lived Assets

We evaluate the carrying value of long-lived assets, including equipment on operating leases, when events or circumstances warrant such a review. If the carrying value of the long-lived asset is considered impaired, it is written down to its fair value.

Fees and Interest Paid to John Deere

Fees and interest paid to John Deere include corporate support fees and interest on intercompany borrowings from John Deere based on approximate market rates.

Derivative Financial Instruments

It is our policy to use derivative transactions only to manage exposures from the normal course of business. We do not execute derivative transactions for the purpose of creating speculative positions or trading. We have interest rate and foreign currency fluctuation risk between the types and amounts of our Receivable and Lease portfolios and how these portfolios are funded. We also have foreign currency exposures at some of our foreign and domestic operations related to financing in currencies other than the functional currencies.

All derivatives are recorded at fair value on the consolidated balance sheets. Cash collateral received or paid is not offset against the derivative fair values on the consolidated balance sheets. The cash flows from the derivative contracts are recorded in operating activities in the statements of consolidated cash flows. Each derivative is designated as a cash flow hedge, fair value hedge, or remains undesignated.

46

Table of Contents

Changes in the fair value of derivatives are recorded as follows:

Cash flow hedges are recorded in other comprehensive income (OCI) and subsequently reclassified into interest expense in the same periods during which the effects of the hedged item (borrowings) impact earnings. These amounts offset the effects of interest rate changes on the related borrowings in interest expense.
Fair value hedges are recorded in interest expense, and the gains or losses are generally offset by the fair value gains or losses on the hedged items (fixed-rate borrowings), which are also recorded in interest expense.
Derivatives not designated as hedging instruments are recorded in interest expense (interest rate contracts) or administrative and operating expenses (foreign currency exchange contracts).

All designated hedges are formally documented as to the relationship with the hedged item as well as the risk-management strategy. Both at inception and on an ongoing basis, the hedging instrument is assessed for its effectiveness. If and when a derivative is determined not to be highly effective as a hedge, the underlying hedged transaction is no longer likely to occur, the hedge designation is removed, or the derivative is terminated, hedge accounting is discontinued (see Note 20).

Financing Incentives

We provide incentive funds to John Deere dealers that meet certain performance metrics, which include minimum finance volume and finance market share with us over a defined period. At the end of the qualification period, dealers are granted incentive funds, which can be applied to certain predefined uses, including interest rate reductions on future loan and lease originations. In addition, certain dealers may elect to receive cash for a portion of their earned funds. We accrue for the incentive costs over the qualification period, which are reported as “Administrative and operating expenses” in the consolidated income statements and “Accounts payable and accrued expenses” in the consolidated balance sheets. The accrued liability is released as dealers utilize the funds.

As mentioned in Note 1, in the second quarter of 2023 we corrected our accounting policy for financing incentives offered to John Deere dealers. Under the previous accounting treatment, we amortized the non-cash portion of the incentive program costs as a reduction to finance income or lease revenue after the dealers designated the use of the incentive award. There was no change to the accounting treatment for the cash portion of the incentive program costs, which continues to be accrued over the qualification period.

Foreign Currency Translation

The functional currencies for most of our foreign operations are their respective local currencies. The assets and liabilities of these operations are translated into U.S. dollars using the exchange rates at the end of the period. The revenues and expenses are translated at weighted-average rates for the period. The gains or losses from these translations are recorded in OCI. Gains or losses from transactions denominated in a currency other than the functional currency of the subsidiary involved and foreign currency exchange components of derivative contracts are included in net income. The pretax net losses for foreign currency exchange in 2023, 2022, and 2021 were $20.4, $25.6, and $14.9 respectively, which are reported in “Administrative and operating expenses” and primarily related to our Argentina operations (see Note 1).

New Accounting Standards

We closely monitor all Accounting Standard Updates (ASUs) issued by the Financial Accounting Standards Board (FASB) and other authoritative guidance. We adopted the following standards in 2023, none of which had a material effect on our consolidated financial statements:

New Accounting Standards Adopted

No. 2021-10 — Government Assistance (Topic 832): Disclosures by Business Entities about Government Assistance

No. 2021-05 — Leases (Topic 842): Lessors – Certain Leases with Variable Lease Payments

No. 2021-04 — Issuer's Accounting for Certain Modifications or Exchanges of Freestanding Equity Classified Written Call Options

47

Table of Contents

We will adopt the following standards in future periods, none of which are expected to have a material effect on our consolidated financial statements:

New Accounting Standards to be Adopted

No. 2022-02 — Financial Instruments – Credit Losses (Topic 326): Troubled Debt Restructurings and Vintage Disclosures

No. 2022-01 — Derivatives and Hedging (Topic 815): Fair Value Hedging – Portfolio Layer Method

No. 2021-08 — Business Combinations (Topic 805): Accounting for Contract Assets and Contract Liabilities from Contracts with Customers

Note 3. Receivables

Retail Notes Receivable

Retail notes receivable by market at October 29, 2023 and October 30, 2022 were as follows:

2023

2022


Unrestricted


Securitized


Unrestricted


Securitized


Agriculture and turf – new

$

14,350.6

$

2,664.9

$

12,997.8

$

2,100.2

Agriculture and turf – used


7,344.9


3,387.4


6,745.8


2,767.4

Construction and forestry – new


2,884.1


1,010.9


2,776.5


846.7

Construction and forestry – used


1,067.4


430.5


1,105.0


332.0

Total


25,647.0


7,493.7


23,625.1


6,046.3

Unearned finance income


(1,005.9)


(136.9)


(826.1)


(94.7)

Retail notes receivable

$

24,641.1

$

7,356.8

$

22,799.0

$

5,951.6

Gross retail note installments at October 29, 2023 and October 30, 2022 were scheduled to be received as follows:

2023

2022


Unrestricted


Securitized


Unrestricted


Securitized


Due in:

0-12 months

$

7,718.5

$

2,820.5

$

7,139.7

$

2,225.2

13-24 months


6,146.8


2,088.5


5,668.8


1,667.4

25-36 months


5,047.0


1,509.0


4,677.8


1,208.9

37-48 months


3,724.5


824.4


3,427.2


709.3

49-60 months


2,321.1


240.5


2,057.6


226.8

Over 60 months


689.1


10.8


654.0


8.7

Total

$

25,647.0

$

7,493.7

$

23,625.1

$

6,046.3

Finance income is recognized over the lives of the retail notes using the interest method. During 2023, the average effective yield on retail notes held by us was approximately 5.0 percent, compared with 3.9 percent in 2022 and 4.0 percent in 2021. As of October 29, 2023 and October 30, 2022, over 95 percent of the retail notes held by us bore a fixed finance rate.

A portion of the finance income earned by us arises from financing of retail sales of John Deere equipment on which finance charges are waived or reduced by John Deere for a period from the date of the retail sale to a specified subsequent date. We receive compensation from John Deere equal to competitive market interest rates for periods during which finance charges have been waived or reduced. We compute the compensation from John Deere for waived or reduced finance charges based on our estimated funding costs, administrative and operating expenses, credit losses, and required return on equity. The financing rate following the waiver or interest reduction period is not significantly different from the compensation rate from John Deere. During 2023, 2022, and 2021, the finance income earned from John Deere on retail notes containing waiver of finance charges or reduced rates was $388.4, $328.3, and $325.0, respectively.

48

Table of Contents

A deposit is withheld by us on certain John Deere agriculture and turf equipment retail notes originating from dealers. Any subsequent retail note losses, subject to certain limitations by customer, are charged against the withheld deposits. At the end of each calendar quarter, the balance of each dealer’s withholding account in excess of a specified percent (ranging from one-half to three percent based on dealer qualifications) of the total balance outstanding on retail notes originating with that dealer is remitted to the dealer. Credit losses recovered from dealer deposits are presented in “Other income” at the time the dealer deposits are charged. There is generally no withholding of dealer deposits on John Deere construction and forestry equipment retail notes.

Revolving Charge Accounts Receivable

Revolving charge account income is comprised of the following:

discounts paid by dealers and merchants on most transactions for processing and support,
finance charges paid by customers on their outstanding account balances, and
finance charge subsidies from John Deere and sponsoring merchants for waiver of finance charges or reduced rates.  

During 2023, 2022, and 2021, the finance income earned from John Deere on revolving charge accounts containing waiver of finance charges or reduced rates was $18.5, $13.4, and $14.3, respectively. Revolving charge accounts receivable at October 29, 2023 and October 30, 2022 totaled $4,594.4 and $4,165.8, and were net of unearned interest income of $88.4 and $59.2 for the same periods, respectively. Generally, account holders may pay their account balance in full at any time or make payments over a number of months according to a payment schedule.

Wholesale Receivables

We also provide wholesale financing to dealers of John Deere agriculture and turf equipment and construction and forestry equipment, primarily to finance inventories of equipment for those dealers. Wholesale finance income related to these notes is generally recognized monthly based on the daily balance of wholesale receivables outstanding and the applicable effective interest rate. Interest rates vary with a bank base rate, the type of equipment financed, and dealer financial profile. Substantially all wholesale receivables are secured with collateral or other credit enhancements. On average, the wholesale receivables portfolio turned five times and seven times during 2023 and 2022, respectively. Wholesale receivables at October 29, 2023 and October 30, 2022 totaled $13,330.1 and $8,404.5, respectively. Wholesale receivables increased in 2023 compared to 2022 due to higher shipment volumes of John Deere equipment, in addition to higher dealer used inventory levels compared to historic lows in the prior year.

We purchase certain wholesale trade receivables from John Deere, which are included within “Wholesale receivables.” These trade receivables arise from John Deere’s sales of goods to independent dealers. Under the terms of the sales to dealers, interest is primarily charged to dealers on outstanding balances, from the earlier of the date when goods are sold to retail customers by the dealer or the expiration of certain interest-free periods granted at the time of the sale to the dealer, until payment is received by us. Dealers cannot cancel purchases after John Deere recognizes a sale and are responsible for payment even if the equipment is not sold to retail customers. The interest-free periods are determined based on the type of equipment sold and the time of year of the sale. These periods range from one to twelve months for most equipment. Interest-free periods may not be extended. Interest charged may not be forgiven and the past due interest rates exceed market rates. We receive compensation from John Deere at approximate market interest rates for these interest-free periods. We compute the compensation from John Deere for interest-free periods based on our estimated funding costs, administrative and operating expenses, credit losses, and required return on equity. During 2023, 2022, and 2021, the compensation earned from John Deere on wholesale receivables for waiver of finance charges or reduced rates was $542.6, $239.0, and $197.9, respectively. The increase in 2023 was primarily due to higher average portfolio and higher average compensation rates due to increased funding costs.

Financing Leases

We lease agriculture and turf equipment and construction and forestry equipment directly to retail customers. Leases classified as sales-type or direct financing leases are reported in “Financing leases” on the consolidated balance sheets. See Note 6 to the Consolidated Financial Statements for detailed disclosures related to financing leases.

49

Table of Contents

Concentration of Credit Risk

Receivables have significant concentrations of credit risk in the agriculture and turf and construction and forestry markets. On a geographic basis, 86 percent of our Receivables portfolio was located in the U.S., at October 29, 2023. There is not a disproportionate concentration of credit risk with any single customer or dealer.

Note 4. Allowance for Credit Losses and Credit Quality of Receivables

Credit Quality

We monitor the credit quality of Receivables based on delinquency status, defined as follows:

Past due balances represent Receivables still accruing finance income with any payments 30 days or more past the contractual payment due date.
Non-performing Receivables represent Receivables for which we have stopped accruing finance income, which generally occurs when Customer Receivables are 90 days delinquent and when interest-bearing wholesale receivables become 60 days delinquent. Accrued finance income and lease revenue previously recognized on non-performing Receivables is reversed and subsequently recognized on a cash basis. Accrual of finance income and lease revenue is resumed when the receivable becomes contractually current, and collections are reasonably assured.  

Accrued finance income and lease revenue reversed on non-performing Receivables, and finance income and lease revenue recognized from cash payments on non-performing Receivables were as follows:

2023

2022

2021

Accrued finance income and lease revenue reversed

$

17.1

$

11.3

$

12.4

Finance income and lease revenue recognized on cash payments

18.4

15.4

17.1

Total Receivable balances represent principal plus accrued interest. Receivable balances are written off to the allowance for credit losses when, in the judgment of management, they are considered uncollectible. Write-offs generally occur when Customer Receivables are 120 days delinquent, and on a case-by-case basis when wholesale receivables are 60 days delinquent. In these situations, collateral is repossessed (for collateral-dependent Receivables) or the account is designated for litigation, and the estimated uncollectible amount is written off to the allowance for credit losses.

The credit quality analysis of Customer Receivables by year of origination was as follows:

October 29, 2023

2023

2022

2021

2020

2019

Prior Years

Revolving Charge Accounts

Total

Customer Receivables:


Agriculture and turf

Current

$

12,998.3

$

7,208.2

$

4,459.1

$

1,970.4

$

666.3

$

179.3

$

4,424.8

$

31,906.4

30-59 days past due

46.8

66.6

34.6

18.7

8.2

2.9

28.1

205.9

60-89 days past due

15.8

22.0

14.8

7.8

3.3

1.3

8.6

73.6

90+ days past due

1.4

.8

2.7

2.9

.1

.1

8.0

Non-performing

25.9

63.7

44.5

25.0

12.9

12.0

7.2

191.2

Construction and forestry

Current

2,343.4

1,586.2

859.0

279.2

65.3

27.3

118.6

5,279.0

30-59 days past due

44.4

28.1

24.8

8.6

3.4

.4

4.1

113.8

60-89 days past due

17.8

11.4

11.8

4.5

1.0

.2

1.8

48.5

90+ days past due

.1

1.2

.1

.1

1.5

Non-performing

34.1

67.5

51.2

20.7

7.5

4.0

1.2

186.2

Total Customer Receivables

$

15,528.0

$

9,055.7

$

5,502.6

$

2,337.9

$

768.0

$

227.5

$

4,594.4

$

38,014.1

50

Table of Contents

October 30, 2022

2022

2021

2020

2019

2018

Prior Years

Revolving Charge Accounts

Total

Customer Receivables:


Agriculture and turf

Current

$

11,736.1

$

6,939.9

$

3,479.6

$

1,515.8

$

581.3

$

152.9

$

4,022.7

$

28,428.3

30-59 days past due

40.1

55.8

31.4

15.0

6.4

2.7

18.4

169.8

60-89 days past due

11.8

19.5

10.8

4.4

2.0

1.1

4.5

54.1

90+ days past due

.4

.2

.2

.8

Non-performing

24.7

38.4

29.2

13.7

11.2

10.2

7.8

135.2

Construction and forestry

Current

2,373.7

1,526.3

658.1

230.7

57.2

10.5

107.7

4,964.2

30-59 days past due

44.5

40.6

20.7

7.6

1.8

.6

3.1

118.9

60-89 days past due

18.1

11.4

6.0

3.0

.7

.1

1.0

40.3

90+ days past due

.3

1.3

1.4

3.0

Non-performing

19.3

51.2

27.6

15.4

5.5

2.9

.6

122.5

Total Customer Receivables

$

14,269.0

$

8,684.6

$

4,263.6

$

1,807.0

$

666.1

$

181.0

$

4,165.8

$

34,037.1

The credit quality analysis of wholesale receivables by year of origination was as follows:

October 29, 2023

2023

2022

2021

2020

2019

Prior Years

Revolving

Total

Wholesale receivables:


Agriculture and turf

Current

$

609.5

$

92.6

$

20.0

$

3.9

$

.7

$

159.9

$

9,270.1

$

10,156.7

30+ days past due

45.8

45.8

Non-performing

5.7

5.7

Construction and forestry

Current

19.4

2.5

19.9

.2

.1

75.2

2,987.6

3,104.9

30+ days past due

17.0

17.0

Non-performing

Total wholesale receivables

$

628.9

$

95.1

$

39.9

$

4.1

$

.8

$

235.1

$

12,326.2

$

13,330.1

October 30, 2022

2022

2021

2020

2019

2018

Prior Years

Revolving

Total

Wholesale receivables:


Agriculture and turf

Current

$

381.3

$

62.7

$

25.0

$

3.8

$

.3

$

1.1

$

6,238.1

$

6,712.3

30+ days past due

.1

8.3

8.4

Non-performing

5.5

5.5

Construction and forestry

Current

4.8

28.2

1.4

.4

.1

1,633.8

1,668.7

30+ days past due

9.6

9.6

Non-performing

Total wholesale receivables

$

386.1

$

91.0

$

26.4

$

4.2

$

.4

$

1.1

$

7,895.3

$

8,404.5

51

Table of Contents

Allowance for Credit Losses

The allowance for credit losses is an estimate of the credit losses expected over the life of our Receivable portfolio. Non-performing Receivables are included in the estimate of expected credit losses. The allowance is measured on a collective basis for receivables with similar risk characteristics. Receivables that do not share risk characteristics are evaluated on an individual basis. Risk characteristics include:

product category,
market,
geography,
credit risk, and
remaining balance.

We utilize the following loss forecast models to estimate expected credit losses:

Customer Receivables:

Transition matrix models are used for large and complex Customer Receivable pools. These models are used for more than 90 percent of Customer Receivables and estimate credit losses using historical delinquency and default information to assign probabilities that a receivable will pay as contractually scheduled or become delinquent and advance through the various delinquency stages. The model simulates the runoff of the portfolio, month-by-month, over the life of the receivables until the balances are fully repaid or default, using roll rates applied to the outstanding portfolio. The roll rates are applied based on the delinquency status of the customer accounts and are further segmented based on the credit risk and remaining balance of the underlying receivables. Estimated recovery rates are applied to the balance at default to calculate the expected credit losses.
Weighted-average remaining maturity (WARM) models are used for smaller and less complex Customer Receivable pools, and apply historical average annual loss rates, adjusted for current and forecasted economic conditions, to the projected portfolio runoff.

Wholesale receivables:

Historical loss rate models are used for wholesale receivables, with consideration of current economic conditions and dealer financial risk. Changes in economic conditions have historically had limited impact on credit losses in this portfolio.

The model output is adjusted for forecasted economic conditions, which may include the economic indicators listed below.

commodity prices,
industry equipment sales,
unemployment rates, and
housing starts.

Management reviews each model’s output quarterly, and qualitative adjustments are incorporated as necessary.

Recoveries from freestanding credit enhancements, such as dealer deposits and certain credit insurance contracts, are not included in the estimate of expected credit losses. Recoveries from dealer deposits are recognized in “Other income” when the dealer’s withholding account is charged. During 2023, 2022, and 2021, $17.0, $8.5 and $14.3, respectively, was recorded in other income related to recoveries from freestanding credit enhancements. At October 29, 2023 and October 30, 2022, we had $129.6 and $132.7, respectively, of deposits withheld from John Deere dealers and merchants available as credit enhancements for retail notes and financing leases.

52

Table of Contents

An analysis of the allowance for credit losses and investment in Receivables at October 29, 2023, October 30, 2022, and October 31, 2021 was as follows:


Retail Notes


Revolving


& Financing

Charge

Wholesale

Total


Leases

Accounts

Receivables

Receivables


2023

Allowance:

Beginning of year balance

$

95.4

$

21.9

$

11.1

$

128.4

Provision (credit) for credit losses*


67.6

21.2

(.2)

88.6

Write-offs


(60.8)

(44.4)

(.2)

(105.4)

Recoveries


12.9

21.8

.6

35.3

Translation adjustments


(.2)

(.1)

(.2)

(.5)

End of year balance

$

114.9

$

20.4

$

11.1

$

146.4

Receivables:

End of year balance

$

33,419.7

$

4,594.4

$

13,330.1

$

51,344.2

2022


Allowance:

Beginning of year balance

$

96.5

$

20.8

$

11.7

$

129.0

Provision (credit) for credit losses*


26.1

(1.8)

.1


24.4

Write-offs


(40.7)

(26.8)

(.3)


(67.8)

Recoveries


14.4

29.7

.1


44.2

Translation adjustments


(.9)

(.5)


(1.4)

End of year balance

$

95.4

$

21.9

$

11.1

$

128.4

Receivables:

End of year balance

$

29,871.3

$

4,165.8

$

8,404.5

$

42,441.6

2021


Allowance:

Beginning of year balance

$

76.9

$

42.3

$

9.9

$

129.1

ASU No. 2016-13 adoption


32.5

(12.2)

(.6)


19.7

Provision (credit) for credit losses*


11.8

(17.0)

2.5


(2.7)

Write-offs


(36.7)

(27.8)

(.3)


(64.8)

Recoveries


11.6

35.5


47.1

Translation adjustments


.4

.2


.6

End of year balance

$

96.5

$

20.8

$

11.7

$

129.0

Receivables:

End of year balance

$

26,933.3

$

3,740.1

$

5,951.3

$

36,624.7

* Excludes provision (credit) for credit losses on unfunded commitments of $(.1), $(.9), and $1.8 for the years ended October 29, 2023, October 30, 2022, and October 31, 2021, respectively. The estimated credit losses related to unfunded commitments are recorded in “Accounts payable and accrued expenses.”

The allowance for credit losses increased in 2023 compared to 2022, primarily driven by growth in the retail notes and financing lease portfolios and higher expected losses on turf and construction customer accounts. We continue to monitor the economy as part of the allowance setting process, including potential impacts of inflation and interest rates, among other factors, and qualitative adjustments to the allowance are incorporated, as necessary.

53

Table of Contents

Troubled Debt Restructuring

A troubled debt restructuring is a significant modification of debt in which a creditor grants a concession it would not otherwise consider to a debtor that is experiencing financial difficulties. These concessions may include a reduction of the stated interest rate, an extension of the maturity date, a reduction of the face amount or maturity amount of the debt, or a reduction of accrued interest. The following table includes Receivable contracts identified as troubled debt restructurings, which were primarily retail notes:

2023

2022

2021

Number of receivable contracts

149

199

326


Pre-modification balance

$

7.2

$

7.0

$

12.0


Post-modification balance

6.7

5.8

10.7


In 2023, 2022, and 2021, we had no significant troubled debt restructurings that subsequently defaulted and were written off. At October 29, 2023, we had no commitments to provide additional financing to customers whose accounts were modified in troubled debt restructurings.

Write-offs

Total write-offs and recoveries, by product, and as a percentage of average balances held during the year, were as follows:

2023

2022

2021


Dollars


Percent


Dollars


Percent


Dollars


Percent


Write-offs:

Retail notes & financing leases:

Agriculture and turf

$

(31.7)


(.12)

%  

$

(21.4)


(.09)

%  

$

(18.6)


(.09)

%

Construction and forestry


(29.1)


(.55)


(19.3)


(.39)


(18.1)


(.42)

Total retail notes & financing leases


(60.8)


(.20)


(40.7)


(.15)


(36.7)


(.15)

Revolving charge accounts


(44.4)


(1.17)


(26.8)


(.77)


(27.8)


(.85)

Wholesale receivables


(.2)


(.3)


(.3)


Total write-offs


(105.4)


(.23)


(67.8)


(.18)


(64.8)


(.19)

Recoveries:

Retail notes & financing leases:

Agriculture and turf


8.8


.03


10.2


.05


9.2


.05

Construction and forestry


4.1


.08


4.2


.09


2.4


.06

Total retail notes & financing leases


12.9


.04


14.4


.05


11.6


.05

Revolving charge accounts


21.8


.58


29.7


.86


35.5


1.08

Wholesale receivables


.6


.01


.1


Total recoveries


35.3


.08


44.2


.12


47.1


.14

Total net write-offs

$

(70.1)


(.15)

%  

$

(23.6)


(.06)

%  

$

(17.7)


(.05)

%

Note 5. Securitization of Receivables

Our funding strategy includes retail note securitizations. While these securitization programs are administered in various forms, they are accomplished in the following basic steps:

1.We transfer retail notes into a bankruptcy-remote SPE.
2.The SPE issues debt to investors. The debt is secured by the retail notes.
3.Investors are paid back based on cash receipts from the retail notes.

As part of step 1, these retail notes are legally isolated from the claims of our general creditors. This ensures cash receipts from the retail notes are accessible to pay back securitization program investors. The structure of these transactions does not meet the accounting criteria for a sale of receivables. As a result, they are accounted for as secured borrowings. The

54

Table of Contents

receivables and borrowings remain on our balance sheet and are separately reported as “Retail notes securitized” and “Securitization borrowings,” respectively.

We offer securitization programs to institutional investors and other financial institutions through public issuances or privately through a revolving credit agreement. At October 29, 2023, the revolving agreement had a financing limit of up to $1,500.0 of secured financings at any time. At October 29, 2023, $1,281.4 of securitization borrowings were outstanding under the revolving agreement. The agreement was renewed in November 2023 with an expiration in November 2024 and an increased capacity of $2,000.0.

The components of the securitization programs at October 29, 2023 and October 30, 2022 were as follows:  


2023


2022


Retail notes securitized

$

7,356.8

$

5,951.6

Allowance for credit losses


(21.4)


(15.7)

Other assets (primarily restricted cash)


152.0


155.2

Total restricted securitized assets

$

7,487.4

$

6,091.1

Securitization borrowings

$

6,995.2

$

5,710.9

Accrued interest on borrowings


12.6


6.1

Total liabilities related to restricted securitized assets

$

7,007.8

$

5,717.0

Under both the public and private securitization programs, restricted cash held by the SPE serves as a credit enhancement. The restricted cash would be used to satisfy receivable payment deficiencies, if any. The cash restriction is removed either after all secured borrowing payments are made or proportionally as the secured receivables are collected and the borrowing obligations are reduced. No additional support to these programs beyond what was previously contractually required has been provided during the reporting periods.

The weighted-average interest rates on securitization borrowings at October 29, 2023 and October 30, 2022 were 4.7 percent and 2.8 percent, respectively.

Although these securitization borrowings are classified as short-term since payment is required if the retail notes are liquidated early, the payment schedule for these borrowings at October 29, 2023 based on the expected liquidation of the retail notes is as follows: 2024 - $3,278.1, 2025 - $2,075.5, 2026 - $1,187.2, 2027 - $416.9, 2028 - $44.1, and later years - $4.6. At October 29, 2023 the maximum remaining term of all restricted securitized retail notes was approximately seven years.

Note 6. Leases

We lease John Deere equipment and a limited amount of non-John Deere equipment to retail customers through sales-type, direct financing, and operating leases. Sales-type and direct financing leases are reported in “Financing leases,” and operating leases are reported in “Equipment on operating leases – net.”

Leases offered by us may include early termination and renewal options. At the end of the majority of leases, the lessee generally has the option to purchase the underlying equipment for the contractual residual value or return it to the dealer. If the equipment is returned to the dealer, the dealer also has the option to purchase the equipment or return it to us for remarketing.

We have elected to combine lease and nonlease components. The nonlease components primarily relate to preventative maintenance and extended warranty agreements financed by the customer. We have also elected to report consideration related to sales and value-added taxes net of the related tax expense. Property taxes on leased assets are recorded on a gross basis in “Lease revenues” and “Administrative and operating expenses.” Variable lease revenues primarily relate to separately invoiced property taxes on leased equipment in certain markets, late fees, and excess use and damage fees.

55

Table of Contents

Lease revenues earned by us were as follows:

2023

2022

2021

Sales-type and direct financing lease revenues

$

90.7

$

56.6

$

48.6

Operating lease revenues

894.2

886.1

959.3

Variable lease revenues


14.2


23.4


26.9

Total lease revenues

$

999.1

$

966.1

$

1,034.8

Variable lease revenues reported above include excess use and damage fees of $1.8, $2.4, and $6.5 for 2023, 2022, and 2021, respectively, which were reported in “Other income.”

Deposits withheld from John Deere dealers and related credit losses on leases are handled in a manner similar to the procedures for retail notes. As with retail notes, there are generally no deposits withheld from dealers on leases related to construction and forestry equipment. In addition, a lease payment discount program, allowing reduced payments over the term of the lease, is administered in a manner similar to finance waivers on retail notes (see Note 3). During 2023, 2022, and 2021, the finance income earned from John Deere on sales-type and direct financing leases containing waiver of finance charges or reduced rates was $6.9, $3.9, and $3.7, respectively. The operating lease revenue earned from John Deere during 2023, 2022, and 2021 was $24.5, $30.0, and $47.1, respectively.

Financing Leases

Sales-type and direct financing lease receivables by market at October 29, 2023 and October 30, 2022 were as follows:

2023

2022

Agriculture and turf

$

664.4

$

570.2

Construction and forestry

223.4


183.7

Total

887.8

753.9

Guaranteed residual values

701.9

466.5

Unguaranteed residual values

27.2

25.9

Unearned finance income


(195.1)

(125.6)

Financing leases receivable

$

1,421.8

$

1,120.7

At the time of accepting a lease that qualifies as a sales-type or direct financing lease, we record the gross amount of lease payments receivable, estimated residual value of the leased equipment, and unearned finance income. The unearned finance income is recognized as revenue over the lease term using the interest method.

Scheduled payments, including guaranteed residual values, on sales-type and direct financing lease receivables at October 29, 2023 were as follows:

Due in:

2024

$

955.8

2025

306.9

2026

168.1

2027

98.1

2028

49.9

Later years


10.9

Total

$

1,589.7

56

Table of Contents

Operating Leases

The cost of equipment on operating leases by market at October 29, 2023 and October 30, 2022 was as follows:

2023

2022

Agriculture and turf

$

5,265.2

$

5,017.3

Construction and forestry

1,042.4


1,138.0

Total

6,307.6

6,155.3

Accumulated depreciation


(1,256.1)

(1,301.8)

Equipment on operating leases - net

$

5,051.5

$

4,853.5

Lease payments from equipment on operating leases are recorded as income on a straight-line method over the lease term. Lease agreements include usage limits and specifications on machine condition, which allows us to assess lessees for excess use or damages to the underlying equipment.

Lease payments for equipment on operating leases at October 29, 2023 were scheduled as follows:

Due in:

2024

$

749.5

2025

561.3

2026

321.4

2027

157.9

2028

38.9

Later years


7.8

Total

$

1,836.8

Operating lease assets are recorded at cost and depreciated to their estimated residual value on a straight-line method over the term of the leases. We estimate the residual values for operating leases at lease inception based on several factors, including:

lease term,
expected hours of usage,
historical wholesale sale prices,
return experience,
intended equipment use,
market dynamics and trends, and
third-party residual guarantees.

We review residual value estimates during the lease term, and depreciation is adjusted prospectively on a straight-line basis over the remaining lease term if residual value estimates are revised. Impairments are recorded when events or circumstances necessitate. There were no impairment losses on operating leases recorded during any periods presented.

The total operating lease residual values at October 29, 2023 and October 30, 2022 were $3,538.3 and $3,366.7, respectively. John Deere dealers generally provide a first-loss residual value guarantee on operating lease originations. Total residual value guarantees were $566.9 and $440.7 at October 29, 2023 and October 30, 2022, respectively.

We discuss with lessees and dealers options to purchase the equipment or extend the lease prior to operating lease maturity. Equipment returned to us upon termination of leases is remarketed by us. The matured operating lease inventory balances at October 29, 2023 and October 30, 2022 were $16.2 and $10.8, respectively. Matured operating lease inventory is reported in “Other assets.”

Past due balances of operating leases represent the total balance held (net book value plus accrued lease payments) and still accruing finance income with any payment amounts 30 days or more past the contractual payment due date. These amounts were $51.8 and $58.7 at October 29, 2023 and October 30, 2022, respectively.

57

Table of Contents

Note 7. Notes Receivable from and Payable to John Deere

At October 29, 2023 and October 30, 2022 we had notes receivable from John Deere with the following affiliated companies:

2023

2022

Banco John Deere S.A.

$

650.7

$

370.0

John Deere Agricultural Holdings, Inc.


.7

Total notes receivable from John Deere

$

650.7

$

370.7

The loan agreements mature over the next seven years and charge interest at competitive market interest rates. Interest earned from John Deere was $37.6, $16.9, and $15.4 in 2023, 2022, and 2021, respectively, which is recorded in “Other income.”

At October 29, 2023 and October 30, 2022, we had notes payable to John Deere as follows:

2023

2022

Notes payable to John Deere

$

3,184.0

$

5,225.5

Weighted average interest rate

5.2%

3.3%

The intercompany borrowings are primarily short-term in nature or contain a due on demand call option. At October 29, 2023, $528.1 of the intercompany borrowings were long-term loans without a due on demand call option, which mature in 2025. We pay interest to John Deere for these borrowings based on competitive market rates. Interest expense paid to John Deere was $199.9, $86.8, and $53.0 in 2023, 2022, and 2021, respectively, which is recorded in “Fees and interest paid to John Deere.”

Note 8. Short-Term External Borrowings

Our short-term external borrowings at October 29, 2023 and October 30, 2022 consisted of the following:


2023


2022


Commercial paper and other notes payable

$

6,836.1

$

2,402.3

Securitization borrowings


6,995.2


5,710.9

Current maturities of long-term external borrowings *


6,059.9


5,989.6

Total

$

19,891.2

$

14,102.8

* Includes unamortized fair value adjustments related to interest rate swaps.

The weighted-average interest rates at October 29, 2023 and October 30, 2022, were:


2023


2022

Commercial paper and other notes payable

5.6%

3.4%

Securitization borrowings

4.7%

2.8%

Worldwide lines of credit were $10,215.7 at October 29, 2023, consisting primarily of:

a 364-day credit facility agreement of $5.0 billion, expiring in the second quarter of 2024,
a credit facility agreement of $2.5 billion, expiring in the second quarter of 2027, and
a credit facility agreement of $2.5 billion, expiring in the second quarter of 2028.

Some of these credit lines are available to both us and Deere & Company. At October 29, 2023, $841.2 of these worldwide lines of credit were unused. For the purpose of computing the unused credit lines, commercial paper and short-term bank borrowings of us and John Deere were considered to constitute utilization.

58

Table of Contents

The credit agreements governing these lines of credit require us to maintain our consolidated ratio of earnings to fixed charges at not less than 1.05 to 1 for any four consecutive fiscal quarterly periods and our ratio of senior debt, excluding securitization indebtedness to capital base (total subordinated debt and stockholder’s equity excluding accumulated other comprehensive income (loss)) at not more than 11 to 1 at the end of any fiscal quarter. All of these credit agreement requirements have been met during the periods included in the consolidated financial statements. The agreements are mutually extendable, and the annual facility fees are not significant.

Deere & Company has an agreement with us pursuant to which it has agreed to continue to own, directly or through one or more wholly-owned subsidiaries, at least 51 percent of the voting shares of capital stock of Capital Corporation and to maintain our consolidated tangible net worth at not less than $50.0. This agreement also obligates Deere & Company to make payments to us such that our consolidated ratio of earnings to fixed charges is not less than 1.05 to 1 for any four consecutive fiscal quarterly periods. Deere & Company’s obligations to make payments to us under the agreement are independent of whether we are in default on our indebtedness, obligations, or other liabilities. Further, Deere & Company’s obligations under the agreement are not measured by the amount of our indebtedness, obligations, or other liabilities. Deere & Company’s obligations to make payments under this agreement are expressly stated not to be a guarantee of any specific indebtedness, obligation, or liability of ours and are enforceable only by or in the name of Capital Corporation. No payments were required under this agreement during the periods included in the consolidated financial statements. At October 29, 2023, Deere & Company indirectly owned 100 percent of the voting shares of Capital Corporation’s capital stock and our consolidated tangible net worth was $5,901.6.

Note 9. Long-Term External Borrowings

Long-term external borrowings at October 29, 2023 and October 30, 2022 consisted of the following:


2023


2022


Senior Debt:

Medium-term notes

$

27,522.8

$

22,595.4

Other notes


2.5

Total senior debt


27,522.8


22,597.9

Unamortized debt discount and debt issuance costs


(83.5)


(70.1)

Total

$

27,439.3

$

22,527.8

All outstanding medium-term notes and other notes are senior unsecured borrowings and generally rank equally with each other. Medium-term notes are primarily offered by prospectus and have serial maturity dates through 2033. The medium-term notes in the table above include unamortized fair value adjustments related to interest rate swaps.

The principal balance and weighted-average interest rates on medium-term notes were as follows:


2023


2022

Medium-term notes:

Principal

$

28,733.5

$

23,564.6

Average interest rates*

4.9%

2.9%

* Includes impact of interest rate swaps

The principal amounts of medium-term notes maturing in each of the next five years are as follows: 2024 - $6,047.8, 2025 -$7,214.7, 2026 - $6,933.7, 2027 - $2,900.0, and 2028 - $4,635.1.

Note 10. Capital Stock

All of Capital Corporation’s common stock is owned by JDFS, a wholly-owned finance holding subsidiary of Deere & Company. No shares of common stock of Capital Corporation were reserved for officers or employees or for options, warrants, conversions, or other rights at October 29, 2023 or October 30, 2022. At October 29, 2023 and October 30, 2022, Capital Corporation had authorized, but not issued, 10,000 shares of $1 par value preferred stock.

59

Table of Contents

Note 11. Capital Investments and Dividends

The following capital investments were received from JDFS and cash dividends were declared and paid to JDFS during 2023, 2022, and 2021:

2023

2022

2021

Capital investments

$

810.0

Dividends

165.0

$

370.0

$

485.0

In each case, JDFS either received a comparable capital investment or paid a comparable dividend to Deere & Company. The capital investments during 2023 were made to maintain targeted average leverage ratios and were driven by growth in total Receivables and corresponding borrowings.

Note 12. Pension and Other Postretirement Benefits

We are a participating employer in certain Deere & Company sponsored defined benefit pension plans for employees in the U.S. and certain defined benefit pension plans outside the U.S. These pension plans provide for benefits that are based primarily on years of service and employee compensation. Pension expense (benefit) is actuarially determined based on our employees included in the plan. Our pension expense (benefit) was $(4.8) in 2023 and was not significant in 2022 or 2021. The accumulated benefit obligation and plan net assets for our employees are not determined separately from Deere & Company.

We provide defined benefit health care and life insurance plans for certain retired employees in the U.S. as a participating employer in Deere & Company’s sponsored plans. Health care and life insurance benefits expense is actuarially determined based on our employees included in the plans and amounted to $6.2 in 2023, $6.0 in 2022, and $6.1 in 2021.

We are a participating employer in certain Deere & Company sponsored defined contribution plans related to employee investment and savings plans primarily in the U.S. Our contributions and costs under these plans were $14.4 in 2023, $13.8 in 2022, and $11.8 in 2021.

Further disclosure for the plans described above is included in the notes to the Deere & Company Annual Report on Form 10-K for the year ended October 29, 2023 (the “Deere & Company 2023 Form 10-K”).

Note 13. Share-Based Compensation

Some of our employees participate in Deere & Company share-based compensation plans. During 2023, 2022, and 2021, the total share-based compensation expense and income tax benefit recognized was as follows:

2023

2022

2021

Share-based compensation expense

$

8.6

$

6.4

$

6.3

Income tax benefit

2.0

1.5

1.5

Further disclosure for these plans is included in the notes to the Deere & Company 2023 Form 10-K.

60

Table of Contents

Note 14. Income Taxes

We are subject to income taxes in a number of jurisdictions. The income tax provision is determined using the asset and liability method. The provision for income taxes by taxing jurisdiction and by significant component consisted of the following:


2023


2022


2021


Current:

U.S.:

Federal

$

(98.6)

$

200.8

$

231.1

State


(33.7)


10.8


15.2

Foreign


41.0


29.3


37.2

Total current


(91.3)


240.9


283.5

Deferred:

U.S.:

Federal


230.6


(48.9)


(75.4)

State


29.1


3.2


1.9

Foreign


(2.5)


10.4


(16.2)

Total deferred


257.2


(35.3)


(89.7)

Provision for income taxes

$

165.9

$

205.6

$

193.8

Our taxable income is included in the consolidated U.S. income tax return and various state returns of Deere & Company. Under tax sharing arrangements with Deere & Company, our provision for income taxes is generally recorded as if Capital Corporation and each of our subsidiaries filed separate income tax returns, with a modification for realizability of certain tax benefits. The difference between the provision for income taxes recorded by us and the provision for income taxes calculated on an unmodified, separate return basis was not material in 2023, 2022, or 2021.

The amounts due from (payable to) Deere & Company under the tax sharing arrangements at October 29, 2023 and October 30, 2022 were as follows:


2023


2022

Tax sharing receivables

$

43.8

$

6.3

Tax sharing payables

(7.5)

(9.3)

The tax sharing receivables are included in “Other receivables” and the payables are included in “Accounts payable and accrued expenses.”

A comparison of the statutory and effective income tax provision and reasons for related differences follows:


2023


2022


2021


U.S. federal income tax provision at a statutory rate (21 percent)

$

154.1

$

187.8

$

184.4

Increase (decrease) resulting from:

Tax rates on foreign earnings


1.4


6.0


5.5

State and local income taxes, net of federal income tax benefit


.4


11.3


13.7

Other - net


10.0


.5


(9.8)

Provision for income taxes

$

165.9

$

205.6

$

193.8

At October 29, 2023, accumulated earnings of $87.0 in certain subsidiaries outside the U.S. are expected to remain indefinitely reinvested outside of the U.S. As such, a provision for foreign withholding taxes has not been made. Determination of the amount of foreign withholding tax liability on these unremitted earnings is not practicable.

61

Table of Contents

Deferred income taxes arise because there are certain items that are treated differently for financial accounting than for income tax reporting purposes. An analysis of deferred income tax assets and liabilities at October 29, 2023 and October 30, 2022 was as follows:

2023

2022


Deferred


Deferred


Deferred


Deferred


Tax

Tax

Tax

Tax


Assets

Liabilities

Assets

Liabilities


Lease transactions

$

1.2

$

562.6

$

.1

$

262.6

Accrual for retirement and other benefits

3.8

5.3

Accrual for other employee benefits

19.6

14.3

Allowance for credit losses

39.8

32.6

Net unrealized gain on derivatives/investments

8.8

26.5

Tax loss and tax credit carryforwards


27.6


11.6

Federal taxes on deferred state tax deductions


4.9


7.8

Miscellaneous accruals and other


61.1

8.1


46.8

4.1

Less valuation allowances


(10.2)


(8.3)

Deferred income tax assets and liabilities

$

147.8

$

579.5

$

110.2

$

293.2

At October 29, 2023, tax loss and tax credit carryforwards of $27.6 were available, with $26.3 expiring from 2029 through 2043 and $1.3 with an indefinite carryforward period.

A reconciliation of the total amounts of unrecognized tax benefits at October 29, 2023, October 30, 2022, and October 31, 2021 was as follows:


2023


2022


2021


Beginning of year balance

$

36.5

$

34.9

$

33.3

Increases to tax positions taken during the current year


15.0


9.3


11.2

Increases to tax positions taken during prior years


3.2


1.2


1.4

Decreases to tax positions taken during prior years


(6.9)


(6.1)


(5.8)

Decreases due to lapse of statute of limitations


(2.6)


(2.7)


(3.7)

Settlements

(.8)

(.1)

(1.5)

End of year balance

$

44.4

$

36.5

$

34.9

The amount of unrecognized tax benefits at October 29, 2023 and October 30, 2022 that would impact the effective tax rate if the tax benefits were recognized was $26.8 and $25.2, respectively. The remaining liability was related to tax positions for which there are offsetting tax receivables, or the uncertainty was only related to timing. We expect that any reasonably possible change in the amounts of unrecognized tax benefits in the next twelve months would not be significant.

We file our tax returns according to the tax laws of the jurisdictions in which we operate, which includes the U.S. federal jurisdiction, and various state and foreign jurisdictions. We are included in the consolidated U.S. income tax return and various state returns of Deere & Company. The U.S. Internal Revenue Service has completed the examination of Deere & Company’s federal income tax returns for periods prior to 2015. The federal income tax returns for years 2015 to 2020 are currently under examination. Various state and foreign income tax returns also remain subject to examination by taxing authorities.

Our policy is to recognize interest related to income taxes in “Interest expense” and “Other income,” and recognize penalties in “Administrative and operating expenses.” The amount of interest and penalties recognized was not significant for any of the periods presented. At October 29, 2023 and October 30, 2022, the liability for accrued interest and penalties totaled $12.3 and $12.8, respectively.

62

Table of Contents

Note 15. Other Income and Administrative and Operating Expenses

The major components of other income and administrative and operating expenses were as follows:

2023

2022

2021

Other income

Fees and interest from John Deere

$

47.0

$

28.5

$

25.6

External interest income

63.1

8.6

2.9

Operating lease disposition gains - net

31.0

66.9

65.0

Freestanding credit enhancement recoveries

17.0

8.5

14.3

Other


18.2


23.2


13.7

Total

$

176.3

$

135.7

$

121.5

Administrative and operating expenses

Compensation and benefits

$

273.8

$

252.9

$

249.0

Computer processing and software

58.3

55.8

52.0

Property taxes on leased assets

23.3

33.0

29.0

Foreign currency exchange losses - net

20.4

25.6

14.9

Dealer financing incentives*

129.9

77.3

81.9

Other


63.7


57.0


45.0

Total

$

569.4

$

501.6

$

471.8

* As summarized in Notes 1, 2, and 23, we corrected our accounting treatment for dealer financing incentives during 2023. Prior period amounts in the table above have been restated and now include both the cash and non-cash portion of dealer financing incentives. Previously, the non-cash portion of dealer financing incentives was reported as a reduction to finance income.

Note 16. Supplemental Cash Flow Information

For purposes of the statements of consolidated cash flows, all cash flows related to short-term borrowings with original maturities of three months or less, in addition to securitization borrowings, are reported on a net basis. During 2023, we issued $4,479.6 and retired $3,194.5 of retail note securitization borrowings.

Supplemental cash flow information was as follows:

2023

2022

2021

Cash paid for interest

$

1,726.6

$

606.8

$

562.4

Cash paid (received) for income taxes

(43.2)

280.9

306.8

Note 17. Commitments and Contingencies

We provide guarantees related to certain financial instruments issued by John Deere Financial Inc., a John Deere finance subsidiary in Canada. At October 29, 2023, the following notional amounts were guaranteed by us:

Medium-term notes: $2,855.8 
Commercial paper: $2,418.0
Derivatives: $3,581.2, with a fair value liability of $125.8

The weighted-average interest rate on the medium-term notes at October 29, 2023 was 2.9 percent with a maximum remaining maturity of six years.

We have commitments to extend credit to customers and John Deere dealers through lines of credit and other pre-approved credit arrangements. We apply the same credit policies and approval process for these commitments to extend credit as we do for our Receivables and Leases, and generally have the right to unconditionally cancel, alter, or amend the terms at any time. Collateral is not required for these commitments, but if credit is extended, collateral may be required upon funding.

63

Table of Contents

A significant portion of these commitments is not expected to be fully drawn upon; therefore, the total commitment amounts likely do not represent a future cash requirement. The unused commitments at October 29, 2023 were as follows:

John Deere dealers: $8.0 billion
Customers: $31.7 billion, primarily related to revolving charge accounts

We have a reserve for credit losses of $2.0 on unfunded commitments that are not unconditionally cancellable at October 29, 2023, which is recorded in “Accounts payable and accrued expenses.”

At October 29, 2023, we had restricted other assets associated with borrowings related to securitizations (see Note 5). Excluding the securitization programs, the remaining balance of restricted other assets was not material as of October 29, 2023.

We are subject to various unresolved legal actions which arise in the normal course of our business, the most prevalent of which relate to retail credit matters. We believe the reasonably possible range of losses for these unresolved legal actions would not have a material effect on our consolidated financial statements.

Note 18. Other Comprehensive Income Items

The after-tax components of accumulated other comprehensive income (loss) at October 29, 2023, October 30, 2022, and October 31, 2021 were as follows:


2023


2022


2021

Cumulative translation adjustment

$

(136.8)

$

(169.0)

$

(54.5)

Unrealized gain on derivatives

34.8

66.8

6.8

Unrealized loss on debt securities

(2.4)

(2.5)

(1.7)

Total accumulated other comprehensive income (loss)

$

(104.4)

$

(104.7)

$

(49.4)

64

Table of Contents

The following reflect amounts recorded in and reclassifications out of other comprehensive income (loss) and the income tax effects:


Before


Tax


After


Tax

(Expense)

Tax


Amount

Credit

Amount


2023

Cumulative translation adjustment

$

32.2

$

32.2

Unrealized gain (loss) on derivatives:

Unrealized hedging gain (loss)


25.4

$

(5.3)


20.1

Reclassification of realized (gain) loss to:

Interest rate contracts – Interest expense


(65.9)


13.8


(52.1)

Net unrealized gain (loss) on derivatives


(40.5)


8.5


(32.0)

Unrealized gain (loss) on debt securities:

Unrealized holding gain (loss)

.1

.1

Total other comprehensive income (loss)

$

(8.2)

$

8.5

$

.3

2022

Cumulative translation adjustment

$

(114.5)

$

(114.5)

Unrealized gain (loss) on derivatives:

Unrealized hedging gain (loss)


88.3

$

(18.5)


69.8

Reclassification of realized (gain) loss to:

Interest rate contracts – Interest expense


(12.4)


2.6


(9.8)

Net unrealized gain (loss) on derivatives


75.9


(15.9)


60.0

Unrealized gain (loss) on debt securities:

Unrealized holding gain (loss)

(1.1)

.3

(.8)

Total other comprehensive income (loss)

$

(39.7)

$

(15.6)

$

(55.3)

2021

Cumulative translation adjustment

$

15.0

$

15.0

Unrealized gain (loss) on derivatives:

Unrealized hedging gain (loss)


7.7

$

(1.6)


6.1

Reclassification of realized (gain) loss to:

Interest rate contracts – Interest expense


9.4


(2.0)


7.4

Net unrealized gain (loss) on derivatives


17.1


(3.6)


13.5

Unrealized gain (loss) on debt securities:

Unrealized holding gain (loss)

(.2)

.1

(.1)

Total other comprehensive income (loss)

$

31.9

$

(3.5)

$

28.4

Note 19. Fair Value Measurements

Fair value is defined as the price that would be received to sell an asset or paid to transfer a liability in an orderly transaction between market participants at the measurement date. To determine fair value, we use various methods, including market and income approaches. We utilize valuation models and techniques that maximize the use of observable inputs. The models are industry-standard models that consider various assumptions, including time values and yield curves as well as other economic measures. These valuation techniques are consistently applied.

65

Table of Contents

Level 1 measurements consist of quoted prices in active markets for identical assets or liabilities. Level 2 measurements include significant other observable inputs, such as quoted prices for similar assets or liabilities in active markets; identical assets or liabilities in inactive markets; observable inputs such as interest rates and yield curves; and other market-corroborated inputs. Level 3 measurements include significant unobservable inputs.

The fair values of financial instruments that do not approximate the carrying values at October 29, 2023 and October 30, 2022 were as follows:

2023

2022


Carrying


Fair


Carrying


Fair


Value

Value

Value

Value


Receivables financed – net

$

43,862.4

$

43,168.7

$

36,377.3

$

35,562.4

Retail notes securitized – net


7,335.4


7,055.8


5,935.9


5,696.3

Securitization borrowings


6,995.2


6,921.1


5,710.9


5,576.6

Current maturities of long-term external borrowings


6,059.9


5,953.0


5,989.6


5,887.7

Long-term external borrowings


27,439.3


27,057.7


22,527.8


21,792.7

Fair value measurements above were Level 3 for all Receivables and Level 2 for all borrowings.

Fair values of Receivables that were issued long-term were based on the discounted values of their related cash flows at interest rates currently being offered by us for similar Receivables. The fair values of the remaining Receivables approximated the carrying amounts.

Fair values of long-term external borrowings and securitization borrowings were based on current market quotes for identical or similar borrowings and credit risk, or on the discounted values of their related cash flows at current market interest rates. Certain long-term external borrowings have been swapped to current variable interest rates. The carrying values of these long-term external borrowings include adjustments related to fair value hedges.

Assets and liabilities measured at October 29, 2023 and October 30, 2022 at fair value on a recurring basis were as follows:

2023


2022

Marketable securities

International debt securities

$

1.4

$

1.1

Receivables from John Deere

Derivatives

144.4

214.8

Other assets

Derivatives

11.3

1.3

Total assets

$

157.1

$

217.2

Other payables to John Deere

Derivatives

$

974.9

$

1,024.2

Accounts payable and accrued expenses

Derivatives

.5

14.1

Total liabilities

$

975.4

$

1,038.3

All fair value measurements in the table above were Level 2. Excluded from the table above were our cash equivalents, which were carried at a cost that approximates fair value. The cash equivalents consist of time deposits and money market funds.

The international debt securities mature over the next seven years. At October 29, 2023, the amortized cost basis and fair value of these available-for-sale debt securities were $5.1 and $1.4, respectively. Unrealized losses at October 29, 2023 were not recognized in income due to the ability and intent to hold to maturity.

There were no assets or liabilities measured at fair value on a nonrecurring basis, other than Receivables with specific allowances which were not material, during the periods ended October 29, 2023, October 30, 2022, and October 31, 2021.

66

Table of Contents

The following is a description of the valuation methodologies we use to measure certain balance sheet items at fair value:

Marketable securities – The international debt securities are valued using quoted prices for identical assets in inactive markets.

Derivatives – Our derivative financial instruments consist of interest rate contracts (swaps and caps), foreign currency exchange contracts (forwards and swaps), and cross-currency interest rate contracts (swaps). The portfolio is valued based on an income approach (discounted cash flow) using market observable inputs, including swap curves and both forward and spot exchange rates for currencies.

Receivables – Specific reserve impairments are based on the fair value of the collateral, which is measured using a market approach (appraisal values or realizable values).

Note 20. Derivative Instruments

Our outstanding derivatives transactions are with both unrelated external counterparties and with John Deere. For derivatives transactions with John Deere, we utilize a centralized hedging structure in which John Deere enters into a derivative transaction with an unrelated external counterparty and simultaneously enters into a derivative transaction with us. Except for collateral provisions, the terms of the transaction between John Deere and us are identical to the terms of the transaction between John Deere and its unrelated external counterparty. Derivative asset and liability positions for transactions with John Deere are recorded in “Receivables from John Deere” and “Other payables to John Deere,” respectively. Derivative asset and liability positions for transactions with unrelated external counterparty banks are recorded in “Other assets” and “Accounts payable and accrued expenses,” respectively.

The fair value of our derivative instruments and the associated notional amounts were as follows:

October 29, 2023

October 30, 2022

Fair Value

Fair Value

Notional

Asset

Liability

Notional

Asset

Liability

Cash flow hedges:

Interest rate contracts - swaps

$

1,500.0

$

44.7

$

1,950.0

$

87.5

Fair value hedges:

Interest rate contracts - swaps

11,859.4

$

915.7

9,448.9

$

947.9

Not designated as hedging instruments:

Interest rate contracts - swaps

8,010.9

72.2

27.4

3,931.3

75.5

25.2

Foreign currency exchange contracts

1,546.5

11.3

.5

1,069.0

1.3

14.1

Cross-currency interest rate contracts

175.8

3.2

7.5

134.2

2.8

2.1

Interest rate caps - sold

1,336.0

24.3

1,020.3

49.0

Interest rate caps - purchased

1,336.0

24.3

1,020.3

49.0

The amount of gain recorded in OCI related to cash flow hedges at October 29, 2023 that is expected to be reclassified to interest expense in the next twelve months if interest rates remain unchanged is $33.3 after-tax. No gains or losses were reclassified from OCI to earnings based on the probability that the original forecasted transaction would not occur.

67

Table of Contents

The amounts recorded, at October 29, 2023 and October 30, 2022, in the consolidated balance sheets related to borrowings designated in fair value hedging relationships were as follows. Fair value hedging adjustments are included in the carrying amount of the hedged item.


Active Hedging Relationships


Discontinued Hedging Relationships

Carrying

Cumulative

Carrying Amount

Cumulative

Amount of

Fair Value

of Formerly

Fair Value

2023


Hedged Item


Hedging Adjustment


Hedged Item


Hedging Adjustment

Current maturities of long-term external borrowings

$

1,814.0

$

14.9

Long-term external borrowings

$

10,883.7

$

(922.6)

7,144.1

(288.1)

2022

Current maturities of long-term external borrowings

$

2,514.9

$

15.5

Long-term external borrowings

$

8,453.6

$

(950.1)

5,519.6

(19.1)

The classification and gains (losses), including accrued interest expense, related to derivative instruments on the statements of consolidated income consisted of the following:


2023

2022

2021


Fair Value Hedges

Interest rate contracts - Interest expense


$

(518.7)

$

(1,102.0)

$

(208.9)

Cash Flow Hedges

Recognized in OCI

Interest rate contracts - OCI (pretax)


$

25.4

$

88.3

$

7.7

Reclassified from OCI

Interest rate contracts - Interest expense


65.9


12.4


(9.4)

Not Designated as Hedges

Interest rate contracts - Interest expense *


$

27.3

$

62.4

$

5.2

Foreign currency exchange contracts - Administrative and operating expenses *


19.1


169.3


(26.6)

Total not designated

$

46.4

$

231.7

$

(21.4)

*Includes interest and foreign currency exchange gains (losses) from cross-currency interest rate contracts.

Included in the table above are interest expense and administrative and operating expense amounts we incurred on derivatives transacted with John Deere. The amounts we recognized on these affiliate party transactions were losses of $437.1, $1,021.7, and $224.3 during 2023, 2022, and 2021, respectively.

Counterparty Risk and Collateral

Derivative instruments are subject to significant concentrations of credit risk in the banking sector. We manage individual unrelated external counterparty exposure by setting limits that consider the credit rating of the unrelated external counterparty, the credit default swap spread of the counterparty, and other financial commitments and exposures between us and the unrelated external counterparty banks. All interest rate derivatives are transacted under International Swaps and Derivatives Association (ISDA) documentation. Each master agreement permits the net settlement of amounts owed in the event of default or termination. None of our derivative agreements contain credit-risk-related contingent features.

We have ISDA agreements with John Deere that permit the net settlement of amounts owed between counterparties in the event of early termination. In addition, we have a loss sharing agreement with John Deere in which we have agreed to

68

Table of Contents

absorb any losses and expenses John Deere incurs if an unrelated external counterparty fails to meet its obligations on a derivative transaction that John Deere entered into to manage our exposures. The loss sharing agreement did not increase the maximum amount of loss that we would incur, after considering collateral received and netting arrangements, as of October 29, 2023 and October 30, 2022.

Derivatives are recorded without offsetting for netting arrangements or collateral. The impact on the derivative assets and liabilities for external derivatives and those with John Deere related to netting arrangements and any collateral received or paid at October 29, 2023 and October 30, 2022 were as follows:

2023

Derivatives:

Gross Amounts Recognized

Netting Arrangements

Collateral

Net
Amount


Assets

External

$

11.3

$

(.1)


$

11.2

John Deere


144.4


(107.0)


37.4

Liabilities

External


.5


(.1)


.4

John Deere


974.9


(107.0)


867.9

2022

Derivatives:

Gross Amounts Recognized

Netting Arrangements

Collateral

Net
Amount


Assets

External

$

1.3

$

(1.1)


$

.2

John Deere


214.8


(128.3)


86.5

Liabilities

External


14.1


(1.1)


13.0

John Deere


1,024.2


(128.3)


895.9

Note 21. Geographic Area Information

Based on the way our operations are managed and evaluated by management and materiality considerations, we operate as one operating segment. However, geographic area information for revenues and Receivables attributed to the U.S. and countries outside the U.S. is disclosed below. No individual foreign country’s revenues or Receivables were material for disclosure purposes.

Geographic area information as of and for the years ended October 29, 2023, October 30, 2022, and October 31, 2021 is presented below:


2023


2022


2021


Revenues:

U.S.

$

3,456.5

$

2,450.5

$

2,393.0

Outside the U.S.


519.0


356.1


330.7

Total

$

3,975.5

$

2,806.6

$

2,723.7

Receivables:

U.S.

$

44,260.0

$

36,555.6

$

30,713.2

Outside the U.S.


7,084.2


5,886.0


5,911.5

Total

$

51,344.2

$

42,441.6

$

36,624.7

69

Table of Contents

Note 22. Unconsolidated Affiliated Company

Our investment in an unconsolidated affiliated company consists of a 50 percent ownership in John Deere Financial S.A.S., a joint venture in France that primarily offers loans and leases to customers. We do not control the joint venture and account for our investment in the joint venture on the equity basis. Our share of the income or loss of this joint venture is reported in “Equity in income of unconsolidated affiliate,” and the investment is reported in “Investment in unconsolidated affiliate.”

Summarized financial information of the unconsolidated affiliated company for the relevant fiscal years was as follows:


2023


2022


2021


Operations:

Total revenue

$

25.5

$

17.7

$

16.6

Net income


7.8


9.0


5.9

The Company’s equity in net income


3.9


4.5


3.0


2023


2022


Financial Position:

Total assets

$

606.5

$

496.3

Total external borrowings


541.3


449.3

Total net assets


55.2


45.2

The Company’s share of net assets


27.6


22.6

Note 23. Immaterial Restatement of Prior Period Financial Statements

In the second quarter of 2023, we corrected the accounting treatment for financing incentives offered to John Deere dealers, which impacted the timing of expense recognition and the presentation of incentive costs in our consolidated financial statements. Refer to Note 1 and Note 2 for additional information. While the prior period amounts have been restated, as set forth below for comparability, the impact of the correction in periods prior to the quarter ended April 30, 2023 was not material to our consolidated financial statements in any of the impacted periods.

The prior period impacts to our statements of consolidated income and the related impacts to our statements of consolidated comprehensive income for the years ended October 30, 2022 and October 31, 2021 were as follows:

2022

2021

Previously

As

Previously

As

Reported


Adjustment


Adjusted


Reported


Adjustment


Adjusted

Revenues

Finance income earned on retail notes

$

1,023.3

$

41.2

$

1,064.5

$

946.6

$

29.4

$

976.0

Lease revenues

957.5

6.2

963.7

1,022.0

6.3

1,028.3

Total revenues

2,759.2

47.4

2,806.6

2,688.0

35.7

2,723.7

Expenses

Administrative and operating expenses

440.1

61.5

501.6

406.0

65.8

471.8

Total operating expenses

1,353.4

61.5

1,414.9

1,306.8

65.8

1,372.6

Total expenses

1,850.7

61.5

1,912.2

1,779.7

65.8

1,845.5

Income of Consolidated Group before Income Taxes

908.5

(14.1)

894.4

908.3

(30.1)

878.2

Provision for income taxes

209.0

(3.4)

205.6

200.5

(6.7)

193.8

Income of Consolidated Group

699.5

(10.7)

688.8

707.8

(23.4)

684.4

Net Income

704.0

(10.7)

693.3

710.8

(23.4)

687.4

Net Income Attributable to the Company

$

704.3

$

(10.7)

$

693.6

$

710.6

$

(23.4)

$

687.2

70

Table of Contents

The prior period impacts to our consolidated balance sheet and the related components of stockholder’s equity as of October 30, 2022 were as shown below. In addition, beginning retained earnings for the year ended October 30, 2022 decreased $108.7 from $3,091.0 to $2,982.3, and beginning retained earnings for the year ended October 31, 2021 decreased $85.3 from $2,891.6 to $2,806.3.

2022

Previously

As

Reported


Adjustment


Adjusted

Assets

Receivables:

Retail notes

$

22,860.3

$

(61.3)

$

22,799.0

Total receivables


42,502.9


(61.3)


42,441.6

Total receivables – net


42,374.5


(61.3)


42,313.2

Deferred income taxes


23.3


2.2


25.5

Total Assets

$

48,928.0

$

(59.1)

$

48,868.9

Liabilities and Stockholder’s Equity

Accounts payable and accrued expenses

$

866.1

$

91.2

$

957.3

Deferred income taxes


239.4


(30.9)


208.5

Total liabilities


44,123.1


60.3


44,183.4

Stockholder’s equity:

Retained earnings


3,425.3


(119.4)


3,305.9

Total Company stockholder’s equity


4,803.4


(119.4)


4,684.0

Total stockholder’s equity


4,804.9


(119.4)


4,685.5

Total Liabilities and Stockholder’s Equity

$

48,928.0

$

(59.1)

$

48,868.9

The prior period impacts to our statements of consolidated cash flows for the years ended October 30, 2022 and October 31, 2021 were as follows:

2022

2021

Previously

As

Previously

As

Reported


Adjustment


Adjusted

Reported


Adjustment


Adjusted

Cash Flows from Operating Activities:

Net income

$

704.0

$

(10.7)

$

693.3

$

710.8

$

(23.4)

$

687.4

Adjustments to reconcile net income to net cash provided by operating activities:

Credit for deferred income taxes

(32.0)

(3.3)

(35.3)

(83.3)

(6.4)

(89.7)

Change in accounts payable and accrued expenses

14.4

(2.4)

12.0

(39.5)

21.6

(17.9)

Other

(164.2)

16.4

(147.8)

33.3

8.2

41.5

Net cash provided by operating activities

$

1,205.9

$

$

1,205.9

$

1,365.9

$

$

1,365.9

Note 24. Subsequent Events

On December 7, 2023, Capital Corporation declared a $215 dividend paid to JDFS on December 14, 2023. JDFS, in turn, declared a $215 dividend to Deere & Company, also paid on December 14, 2023.

71

Table of Contents

Index to Exhibits

3.1

Certificate of Incorporation, as amended (Exhibit 3.1 to Form 10-K of the registrant for the year ended October 31, 1999, Securities and Exchange Commission File Number 1-6458*)

3.2

Bylaws, as amended (Exhibit 3.2 to Form 10-K of the registrant for the year ended October 31, 1999, Securities and Exchange Commission File Number 1-6458*)

4.1

Senior Indenture dated March 15, 1997 between the registrant and The Bank of New York Mellon (successor Trustee to The Chase Manhattan Bank National Association), as Trustee (Exhibit 4.1 to registration statement on Form S-3 no. 333-68355, filed December 4, 1998, Securities and Exchange Commission File Number 1-6458*)

4.2

First Supplemental Senior Indenture dated April 21, 2011 between the registrant and The Bank of New York Mellon, as Trustee (Exhibit 4.2 to registration statement on Form S-3 no. 333-173672, filed April 21, 2011, Securities and Exchange Commission File Number 1-6458*)

4.3

Second Supplemental Senior Indenture dated April 17, 2014 between the registrant and The Bank of New York Mellon, as Trustee (Exhibit 4.3 to registration statement on Form S-3 no. 333-195332, filed April 17, 2014, Securities and Exchange Commission File Number 1-6458*)

4.4

Subordinated Indenture dated September 1, 2003 between the registrant and U.S. Bank National Association, as Trustee (Exhibit 4.3 to registration statement on Form S-3 no. 333-108705, filed September 11, 2003, Securities and Exchange Commission File Number 1-6458*)

4.5

Terms and Conditions of the Euro Medium Term Notes, published March 31, 2022, applicable to the U.S. $6,000,000,000 Euro Medium Term Note Programme of the registrant, Deere & Company, John Deere Bank S.A., and John Deere Cash Management (Exhibit 4.5 to the Form 10-K of Deere & Company for the year ended October 30, 2022, Securities and Exchange Commission File Number 1-4121*)

4.6

Third Supplemental Senior Indenture dated April 7, 2017 between the registrant and The Bank of New York Mellon, as Trustee (Exhibit 4.4 to registration statement on Form S-3 no. 333-217193, filed April 7, 2017, Securities and Exchange Commission File Number 1-6458*)

4.7

Description of the registrant’s 2.00% Senior Notes due 2031 (Exhibit 4.8 to Form 10-K of the registrant for the year ended October 31, 2021, Securities and Exchange Commission File Number 1-6458*)

Certain instruments relating to long-term debt constituting less than 10 percent of the registrant’s total assets may not be filed as exhibits herewith pursuant to Item 601(b)(4)(iii)(A) of Regulation S-K. The registrant will furnish copies of such instruments to the Commission upon request.

10.1

Agreement, as amended November 1, 1994, between the registrant and Deere & Company concerning agricultural retail notes (Exhibit 10.1 to Form 10-K of Deere & Company for the year ended October 31, 1998, Securities and Exchange Commission File Number 1-4121*)

10.2

Agreement, as amended November 1, 1994, between the registrant and Deere & Company concerning lawn and grounds care retail notes (Exhibit 10.2 to the Form 10-K of Deere & Company for the year ended October 31, 1998, Securities and Exchange Commission File Number 1-4121*)

10.3

Agreement, as amended November 1, 1994, between the registrant and John Deere Construction Equipment Company concerning construction retail notes (Exhibit 10.3 to the Form 10-K of Deere & Company for the year ended October 31, 1998, Securities and Exchange Commission File Number 1-4121*)

10.4

Agreement, dated July 14, 1997, between the registrant and John Deere Construction Equipment Company concerning construction retail notes (Exhibit 10.4 to Form 10-K of Deere & Company for the year ended October 31, 2003, Securities and Exchange Commission File Number 1-4121*)

10.5

Second Amended Agreement, dated March 27, 2023, between the registrant and Deere & Company relating to fixed charges ratio, ownership and minimum net worth of the registrant (Exhibit 10.4 to Form 10-Q of the registrant for the quarter ended April 30, 2023, Securities and Exchange Commission File Number 1-4121*)

72

Table of Contents

10.6

Asset Purchase Agreement, dated October 29, 2001, between Deere & Company and Deere Capital, Inc. concerning the sale of trade receivables (Exhibit 10.19 to Form 10-K of Deere & Company for the year ended October 31, 2001, Securities and Exchange Commission File Number 1-4121*)

10.7

Second Amendment, dated February 21, 2020, to the Asset Purchase Agreement dated October 29, 2001, between Deere & Company and Deere Capital, Inc. (including conformed copy of the Asset Purchase Agreement as Exhibit A thereto) (Exhibit 10.1 to Form 10-Q of Deere & Company for the quarter ended February 2, 2020, Securities and Exchange Commission File Number 1-4121*)

10.8

Asset Purchase Agreement, dated October 29, 2001, between John Deere Construction & Forestry Company and Deere Capital, Inc. concerning the sale of trade receivables (Exhibit 10.20 to Form 10-K of Deere & Company for the year ended October 31, 2001, Securities and Exchange Commission File Number 1-4121*)

10.9

Second Amendment, dated February 21, 2020, to the Asset Purchase Agreement dated October 29, 2001, between John Deere Construction & Forestry Company and Deere Capital, Inc. (including conformed copy of the Asset Purchase Agreement as Exhibit A thereto) (Exhibit 10.2 to Form 10-Q of Deere & Company for the quarter ended February 2, 2020, Securities and Exchange Commission File Number 1-4121*)

10.10

Incentive Compensation Recovery Policy effective October 2, 2023

10.11

Agreement, dated December 14, 2023, between the registrant, Deere & Company, Deere Credit, Inc., and Deere Capital, Inc., relating to providing international support payments between the parties

10.12

2027 Credit Agreement, dated March 27, 2023, among the registrant, Deere & Company, John Deere Bank S.A., various financial institutions, JPMorgan Chase Bank, N.A., as Administrative Agent, Bank of America, N.A. and Citibank, N.A., as Co-Syndication Agents, and J.P. Morgan Securities LLC, as Sustainability Structuring Agent (Exhibit 10.2 to Form 10-Q of the registrant for the quarter ended April 30, 2023, Securities and Exchange Commission File Number 1-6458*)

10.13

2028 Credit Agreement, dated March 27, 2023, among the registrant, Deere & Company, John Deere Bank S.A., various financial institutions, JPMorgan Chase Bank, N.A., as Administrative Agent, Bank of America, N.A. and Citibank, N.A., as Co-Syndication Agents, and J.P. Morgan Securities LLC, as Sustainability Structuring Agent (Exhibit 10.3 to Form 10-Q of the registrant for the quarter ended April 30, 2023, Securities and Exchange Commission File Number 1-6458*)

10.14

364-Day Credit Agreement, dated March 27, 2023, among the registrant, Deere & Company, John Deere Bank S.A., various financial institutions, JPMorgan Chase Bank, N.A., as Administrative Agent, Bank of America, N.A. and Citibank, N.A., as Co-Syndication Agents, and J.P. Morgan Securities LLC, as Sustainability Structuring Agent (Exhibit 10.1 to Form 10-Q of the registrant for the quarter ended April 30, 2023, Securities and Exchange Commission File Number 1-6458*)

21.

Omitted pursuant to instruction I(2)

23.

Consent of Deloitte & Touche LLP

24.

Power of Attorney (included on signature page)

31.1

Rule 13a-14(a)/15d-14(a) Certification

31.2

Rule 13a-14(a)/15d-14(a) Certification

32.

Section 1350 Certifications (furnished herewith)

99.

Item 1A of the Deere & Company Form 10-K for the fiscal year ended October 29, 2023 (Securities and Exchange Commission File Number 1-4121*)

101.INS

Inline XBRL Instance Document (the instance document does not appear in the Interactive Data File because its XBRL tags are embedded within the Inline XBRL document)

101.SCH

Inline XBRL Taxonomy Extension Schema Document

101.CAL

Inline XBRL Taxonomy Extension Calculation Linkbase Document

73

Table of Contents

101.DEF

Inline XBRL Taxonomy Extension Definition Linkbase Document

101.LAB

Inline XBRL Taxonomy Extension Label Linkbase Document

101.PRE

Inline XBRL Taxonomy Extension Presentation Linkbase Document

104

Cover Page Interactive Data File (formatted as Inline XBRL and contained in Exhibit 101)

*

Incorporated by reference.

Management contract or compensatory plan or arrangement.

74

Table of Contents

SIGNATURES

Pursuant to the requirements of Section 13 or 15(d) of the Securities Exchange Act of 1934, the registrant has duly caused this report to be signed on its behalf by the undersigned, thereunto duly authorized.

JOHN DEERE CAPITAL CORPORATION

By:

/s/ John C. May

John C. May

Chairman and Chief Executive Officer

(Principal Executive Officer)

Date:December 15, 2023

Pursuant to the requirements of the Securities Exchange Act of 1934, this report has been signed below by the following persons on behalf of the registrant and in the capacities and on the date indicated.

Each person signing below also hereby appoints John C. May, Joshua A. Jepsen, and Edward R. Berk, and each of them singly, his or her lawful attorney-in-fact with full power to execute and file any and all amendments to this report together with exhibits thereto and generally to do all such things as such attorney-in-fact may deem appropriate to enable John Deere Capital Corporation to comply with the provisions of the Securities Exchange Act of 1934 and all requirements of the Securities and Exchange Commission.

Signature

Title

Date

/s/ John C. May

Director, Chairman, and

)

John C. May

Chief Executive Officer

)

(Principal Executive Officer)

)

)

/s/ Joshua A. Jepsen

Director and Senior Vice President

)

Joshua A. Jepsen

(Principal Financial Officer and

)

Principal Accounting Officer)

)

)

)

/s/ Rajesh Kalathur

Director and President

)

Rajesh Kalathur

)

)

)

/s/ Ryan D. Campbell

Director

)

December 15, 2023

Ryan D. Campbell

)

)

)

/s/ Deanna M. Kovar

Director

)

Deanna M. Kovar

)

)

)

/s/ Steven N. Owenson

Director

)

Steven N. Owenson

)

)

)

/s/ Cory J. Reed

Director

)

Cory J. Reed

)

)

75

Table of Contents

Signature

Title

Date

/s/ Jayma A. Sandquist

Director

)

Jayma A. Sandquist

)

)

December 15, 2023

)

/s/ Andrew C. Traeger

Director

)

Andrew C. Traeger

)

76