http://fasb.org/us-gaap/2022#SecuredDebtCurrenthttp://fasb.org/us-gaap/2022#SecuredDebtCurrenthttp://fasb.org/us-gaap/2022#SecuredDebtCurrenthttp://fasb.org/us-gaap/2022#SecuredDebtCurrenthttp://fasb.org/us-gaap/2022#SecuredDebtCurrenthttp://fasb.org/us-gaap/2022#SecuredDebtCurrenthttp://fasb.org/us-gaap/2022#SecuredDebtCurrenthttp://fasb.org/us-gaap/2022#SecuredDebtCurrenthttp://fasb.org/us-gaap/2022#SecuredDebtCurrenthttp://fasb.org/us-gaap/2022#SecuredDebtCurrent250025002500000http://fasb.org/us-gaap/2022#OtherAssetshttp://fasb.org/us-gaap/2022#OtherAssetshttp://fasb.org/us-gaap/2022#InterestExpense http://fasb.org/us-gaap/2022#SellingGeneralAndAdministrativeExpensehttp://fasb.org/us-gaap/2022#InterestExpense http://fasb.org/us-gaap/2022#SellingGeneralAndAdministrativeExpensehttp://fasb.org/us-gaap/2022#InterestExpense http://fasb.org/us-gaap/2022#SellingGeneralAndAdministrativeExpensehttp://fasb.org/us-gaap/2022#InterestExpense http://fasb.org/us-gaap/2022#SellingGeneralAndAdministrativeExpensehttp://fasb.org/us-gaap/2022#SecuredDebtCurrenthttp://fasb.org/us-gaap/2022#SecuredDebtCurrenthttp://jdcc.deere.com/20230430#CorrectionOfTimingOfExpenseAndClassificationForFinancingIncentivesProgramToDealersMemberDEERE JOHN CAPITAL CORP0000027673false--10-29Q20000027673us-gaap:RetainedEarningsMember2023-04-300000027673us-gaap:NoncontrollingInterestMember2023-04-300000027673us-gaap:CommonStockMember2023-04-300000027673us-gaap:RetainedEarningsMember2023-01-290000027673us-gaap:NoncontrollingInterestMember2023-01-290000027673us-gaap:CommonStockMember2023-01-290000027673us-gaap:AccumulatedOtherComprehensiveIncomeMember2023-01-290000027673us-gaap:RetainedEarningsMember2022-10-300000027673us-gaap:NoncontrollingInterestMember2022-10-300000027673us-gaap:CommonStockMember2022-10-300000027673us-gaap:RetainedEarningsMember2022-05-010000027673us-gaap:NoncontrollingInterestMember2022-05-010000027673us-gaap:CommonStockMember2022-05-010000027673us-gaap:RetainedEarningsMember2022-01-300000027673us-gaap:NoncontrollingInterestMember2022-01-300000027673us-gaap:CommonStockMember2022-01-300000027673us-gaap:AccumulatedOtherComprehensiveIncomeMember2022-01-300000027673us-gaap:RetainedEarningsMember2021-10-310000027673us-gaap:NoncontrollingInterestMember2021-10-310000027673us-gaap:CommonStockMember2021-10-310000027673us-gaap:AccumulatedOtherComprehensiveIncomeMember2021-10-310000027673us-gaap:AccumulatedTranslationAdjustmentMember2023-04-300000027673us-gaap:AccumulatedOtherComprehensiveIncomeMember2023-04-300000027673us-gaap:AccumulatedNetUnrealizedInvestmentGainLossMember2023-04-300000027673us-gaap:AccumulatedGainLossNetCashFlowHedgeParentMember2023-04-300000027673us-gaap:AccumulatedTranslationAdjustmentMember2022-10-300000027673us-gaap:AccumulatedOtherComprehensiveIncomeMember2022-10-300000027673us-gaap:AccumulatedNetUnrealizedInvestmentGainLossMember2022-10-300000027673us-gaap:AccumulatedGainLossNetCashFlowHedgeParentMember2022-10-300000027673us-gaap:AccumulatedTranslationAdjustmentMember2022-05-010000027673us-gaap:AccumulatedOtherComprehensiveIncomeMember2022-05-010000027673us-gaap:AccumulatedNetUnrealizedInvestmentGainLossMember2022-05-010000027673us-gaap:AccumulatedGainLossNetCashFlowHedgeParentMember2022-05-010000027673us-gaap:SecuredDebtMemberus-gaap:SubsequentEventMember2023-05-220000027673srt:ScenarioPreviouslyReportedMember2021-10-310000027673srt:RevisionOfPriorPeriodErrorCorrectionAdjustmentMember2021-10-310000027673jdcc:ConstructionAndForestryEquipmentMember2023-04-300000027673jdcc:AgricultureAndTurfEquipmentMember2023-04-300000027673jdcc:ConstructionAndForestryEquipmentMember2022-10-300000027673jdcc:AgricultureAndTurfEquipmentMember2022-10-300000027673jdcc:ConstructionAndForestryEquipmentMember2022-05-010000027673jdcc:AgricultureAndTurfEquipmentMember2022-05-010000027673us-gaap:RetainedEarningsMember2023-01-302023-04-300000027673us-gaap:NoncontrollingInterestMember2023-01-302023-04-300000027673us-gaap:RetainedEarningsMember2022-10-312023-04-300000027673us-gaap:NoncontrollingInterestMember2022-10-312023-04-300000027673us-gaap:NoncontrollingInterestMember2022-01-312022-05-010000027673us-gaap:NoncontrollingInterestMember2021-11-012022-05-010000027673us-gaap:AccumulatedOtherComprehensiveIncomeMember2023-01-302023-04-300000027673us-gaap:AccumulatedOtherComprehensiveIncomeMember2022-10-312023-04-300000027673us-gaap:AccumulatedOtherComprehensiveIncomeMember2022-01-312022-05-010000027673us-gaap:AccumulatedOtherComprehensiveIncomeMember2021-11-012022-05-010000027673us-gaap:InterestRateSwapMember2023-01-302023-04-300000027673us-gaap:InterestRateSwapMember2022-10-312023-04-300000027673us-gaap:InterestRateSwapMember2022-01-312022-05-010000027673us-gaap:InterestRateSwapMember2021-11-012022-05-010000027673us-gaap:AccumulatedTranslationAdjustmentMember2023-01-302023-04-300000027673us-gaap:AccumulatedNetUnrealizedInvestmentGainLossMember2023-01-302023-04-300000027673us-gaap:AccumulatedTranslationAdjustmentMember2022-10-312023-04-300000027673us-gaap:AccumulatedTranslationAdjustmentMember2022-01-312022-05-010000027673us-gaap:AccumulatedNetUnrealizedInvestmentGainLossMember2022-01-312022-05-010000027673us-gaap:AccumulatedTranslationAdjustmentMember2021-11-012022-05-010000027673us-gaap:AccumulatedNetUnrealizedInvestmentGainLossMember2021-11-012022-05-010000027673us-gaap:AssetPledgedAsCollateralWithRightMember2023-04-300000027673us-gaap:AssetPledgedAsCollateralWithRightMember2022-10-300000027673us-gaap:AssetPledgedAsCollateralWithRightMember2022-05-010000027673us-gaap:AccumulatedGainLossNetCashFlowHedgeParentMember2023-01-302023-04-300000027673us-gaap:AccumulatedGainLossNetCashFlowHedgeParentMember2022-10-312023-04-300000027673us-gaap:AccumulatedGainLossNetCashFlowHedgeParentMember2022-01-312022-05-010000027673us-gaap:AccumulatedGainLossNetCashFlowHedgeParentMember2021-11-012022-05-010000027673srt:ScenarioPreviouslyReportedMember2022-10-312023-01-290000027673srt:RevisionOfPriorPeriodErrorCorrectionAdjustmentMember2022-10-312023-01-2900000276732022-10-312023-01-290000027673jdcc:MarketableSecuritiesMemberus-gaap:FairValueInputsLevel2Memberus-gaap:FairValueMeasurementsRecurringMemberjdcc:ForeignDebtSecuritiesMember2023-04-300000027673jdcc:MarketableSecuritiesMemberus-gaap:FairValueInputsLevel2Memberus-gaap:FairValueMeasurementsRecurringMemberjdcc:ForeignDebtSecuritiesMember2022-10-300000027673jdcc:MarketableSecuritiesMemberus-gaap:FairValueInputsLevel2Memberus-gaap:FairValueMeasurementsRecurringMemberjdcc:ForeignDebtSecuritiesMember2022-05-010000027673us-gaap:NotesPayableOtherPayablesMember2023-04-300000027673us-gaap:NotesPayableOtherPayablesMember2022-10-300000027673us-gaap:NotesPayableOtherPayablesMember2022-05-010000027673jdcc:BancoJohnDeereSaMember2023-04-300000027673jdcc:JohnDeereAgriculturalHoldingsIncMember2022-10-300000027673jdcc:BancoJohnDeereSaMember2022-10-300000027673jdcc:JohnDeereAgriculturalHoldingsIncMember2022-05-010000027673jdcc:BancoJohnDeereSaMember2022-05-010000027673us-gaap:InterestRateSwapMemberus-gaap:ReclassificationOutOfAccumulatedOtherComprehensiveIncomeMemberus-gaap:AccumulatedGainLossNetCashFlowHedgeParentMember2023-01-302023-04-300000027673us-gaap:InterestRateSwapMemberus-gaap:ReclassificationOutOfAccumulatedOtherComprehensiveIncomeMemberus-gaap:AccumulatedGainLossNetCashFlowHedgeParentMember2022-10-312023-04-300000027673us-gaap:InterestRateSwapMemberus-gaap:ReclassificationOutOfAccumulatedOtherComprehensiveIncomeMemberus-gaap:AccumulatedGainLossNetCashFlowHedgeParentMember2022-01-312022-05-010000027673us-gaap:InterestRateSwapMemberus-gaap:ReclassificationOutOfAccumulatedOtherComprehensiveIncomeMemberus-gaap:AccumulatedGainLossNetCashFlowHedgeParentMember2021-11-012022-05-010000027673srt:RevisionOfPriorPeriodErrorCorrectionAdjustmentMember2023-01-302023-01-300000027673srt:RevisionOfPriorPeriodErrorCorrectionAdjustmentMember2023-01-300000027673us-gaap:RetainedEarningsMember2022-01-312022-05-010000027673us-gaap:RetainedEarningsMember2021-11-012022-05-010000027673us-gaap:InterestRateSwapMemberus-gaap:FairValueHedgingMemberus-gaap:DesignatedAsHedgingInstrumentMember2023-04-300000027673us-gaap:InterestRateSwapMemberus-gaap:CashFlowHedgingMemberus-gaap:DesignatedAsHedgingInstrumentMember2023-04-300000027673us-gaap:InterestRateCapMemberus-gaap:NotDesignatedAsHedgingInstrumentEconomicHedgeMemberus-gaap:ShortMember2023-04-300000027673us-gaap:InterestRateCapMemberus-gaap:NotDesignatedAsHedgingInstrumentEconomicHedgeMemberus-gaap:LongMember2023-04-300000027673us-gaap:InterestRateSwapMemberus-gaap:NotDesignatedAsHedgingInstrumentEconomicHedgeMember2023-04-300000027673us-gaap:ForeignExchangeContractMemberus-gaap:NotDesignatedAsHedgingInstrumentEconomicHedgeMember2023-04-300000027673us-gaap:CrossCurrencyInterestRateContractMemberus-gaap:NotDesignatedAsHedgingInstrumentEconomicHedgeMember2023-04-300000027673us-gaap:InterestRateSwapMemberus-gaap:FairValueHedgingMemberus-gaap:DesignatedAsHedgingInstrumentMember2022-10-300000027673us-gaap:InterestRateSwapMemberus-gaap:CashFlowHedgingMemberus-gaap:DesignatedAsHedgingInstrumentMember2022-10-300000027673us-gaap:InterestRateCapMemberus-gaap:NotDesignatedAsHedgingInstrumentEconomicHedgeMemberus-gaap:ShortMember2022-10-300000027673us-gaap:InterestRateCapMemberus-gaap:NotDesignatedAsHedgingInstrumentEconomicHedgeMemberus-gaap:LongMember2022-10-300000027673us-gaap:InterestRateSwapMemberus-gaap:NotDesignatedAsHedgingInstrumentEconomicHedgeMember2022-10-300000027673us-gaap:ForeignExchangeContractMemberus-gaap:NotDesignatedAsHedgingInstrumentEconomicHedgeMember2022-10-300000027673us-gaap:CrossCurrencyInterestRateContractMemberus-gaap:NotDesignatedAsHedgingInstrumentEconomicHedgeMember2022-10-300000027673us-gaap:InterestRateSwapMemberus-gaap:FairValueHedgingMemberus-gaap:DesignatedAsHedgingInstrumentMember2022-05-010000027673us-gaap:InterestRateSwapMemberus-gaap:CashFlowHedgingMemberus-gaap:DesignatedAsHedgingInstrumentMember2022-05-010000027673us-gaap:InterestRateCapMemberus-gaap:NotDesignatedAsHedgingInstrumentEconomicHedgeMemberus-gaap:ShortMember2022-05-010000027673us-gaap:InterestRateCapMemberus-gaap:NotDesignatedAsHedgingInstrumentEconomicHedgeMemberus-gaap:LongMember2022-05-010000027673us-gaap:InterestRateSwapMemberus-gaap:NotDesignatedAsHedgingInstrumentEconomicHedgeMember2022-05-010000027673us-gaap:ForeignExchangeContractMemberus-gaap:NotDesignatedAsHedgingInstrumentEconomicHedgeMember2022-05-010000027673us-gaap:CrossCurrencyInterestRateContractMemberus-gaap:NotDesignatedAsHedgingInstrumentEconomicHedgeMember2022-05-010000027673us-gaap:FinancialGuaranteeMemberjdcc:JohnDeereFinancialIncMemberus-gaap:DerivativeMember2023-04-300000027673us-gaap:InterestRateSwapMemberus-gaap:InterestExpenseMember2023-01-302023-04-300000027673us-gaap:ForeignExchangeContractMemberus-gaap:SellingGeneralAndAdministrativeExpensesMember2023-01-302023-04-300000027673us-gaap:InterestRateSwapMemberus-gaap:InterestExpenseMember2022-10-312023-04-300000027673us-gaap:ForeignExchangeContractMemberus-gaap:SellingGeneralAndAdministrativeExpensesMember2022-10-312023-04-300000027673us-gaap:InterestRateSwapMemberus-gaap:InterestExpenseMember2022-01-312022-05-010000027673us-gaap:ForeignExchangeContractMemberus-gaap:SellingGeneralAndAdministrativeExpensesMember2022-01-312022-05-010000027673us-gaap:InterestRateSwapMemberus-gaap:InterestExpenseMember2021-11-012022-05-010000027673us-gaap:ForeignExchangeContractMemberus-gaap:SellingGeneralAndAdministrativeExpensesMember2021-11-012022-05-010000027673jdcc:UltimateParentCompanyAndItsWhollyOwnedSubsidiariesMember2023-01-302023-04-300000027673jdcc:UltimateParentCompanyAndItsWhollyOwnedSubsidiariesMember2022-01-312022-05-010000027673jdcc:UltimateParentCompanyAndItsWhollyOwnedSubsidiariesMember2021-11-012022-05-010000027673us-gaap:AccountsPayableAndAccruedLiabilitiesMemberus-gaap:ForeignExchangeContractMemberus-gaap:NotDesignatedAsHedgingInstrumentEconomicHedgeMember2023-04-300000027673us-gaap:AccountsPayableAndAccruedLiabilitiesMemberus-gaap:FairValueInputsLevel2Memberus-gaap:FairValueMeasurementsRecurringMember2023-04-300000027673jdcc:OtherPayablesToRelatedPartyMemberus-gaap:InterestRateSwapMemberus-gaap:NotDesignatedAsHedgingInstrumentEconomicHedgeMember2023-04-300000027673jdcc:OtherPayablesToRelatedPartyMemberus-gaap:InterestRateSwapMemberus-gaap:DesignatedAsHedgingInstrumentMember2023-04-300000027673jdcc:OtherPayablesToRelatedPartyMemberus-gaap:FairValueInputsLevel2Memberus-gaap:FairValueMeasurementsRecurringMember2023-04-300000027673jdcc:OtherPayablesToRelatedPartyMemberus-gaap:CrossCurrencyInterestRateContractMemberus-gaap:NotDesignatedAsHedgingInstrumentEconomicHedgeMember2023-04-300000027673jdcc:OtherPayablesToRelatedPartyMemberus-gaap:NotDesignatedAsHedgingInstrumentEconomicHedgeMember2023-04-300000027673us-gaap:AccountsPayableAndAccruedLiabilitiesMemberus-gaap:ForeignExchangeContractMemberus-gaap:NotDesignatedAsHedgingInstrumentEconomicHedgeMember2022-10-300000027673us-gaap:AccountsPayableAndAccruedLiabilitiesMemberus-gaap:FairValueInputsLevel2Memberus-gaap:FairValueMeasurementsRecurringMember2022-10-300000027673jdcc:OtherPayablesToRelatedPartyMemberus-gaap:InterestRateSwapMemberus-gaap:NotDesignatedAsHedgingInstrumentEconomicHedgeMember2022-10-300000027673jdcc:OtherPayablesToRelatedPartyMemberus-gaap:InterestRateSwapMemberus-gaap:DesignatedAsHedgingInstrumentMember2022-10-300000027673jdcc:OtherPayablesToRelatedPartyMemberus-gaap:FairValueInputsLevel2Memberus-gaap:FairValueMeasurementsRecurringMember2022-10-300000027673jdcc:OtherPayablesToRelatedPartyMemberus-gaap:CrossCurrencyInterestRateContractMemberus-gaap:NotDesignatedAsHedgingInstrumentEconomicHedgeMember2022-10-300000027673jdcc:OtherPayablesToRelatedPartyMemberus-gaap:NotDesignatedAsHedgingInstrumentEconomicHedgeMember2022-10-300000027673us-gaap:AccountsPayableAndAccruedLiabilitiesMemberus-gaap:ForeignExchangeContractMemberus-gaap:NotDesignatedAsHedgingInstrumentEconomicHedgeMember2022-05-010000027673us-gaap:AccountsPayableAndAccruedLiabilitiesMemberus-gaap:FairValueInputsLevel2Memberus-gaap:FairValueMeasurementsRecurringMember2022-05-010000027673jdcc:OtherPayablesToRelatedPartyMemberus-gaap:InterestRateSwapMemberus-gaap:NotDesignatedAsHedgingInstrumentEconomicHedgeMember2022-05-010000027673jdcc:OtherPayablesToRelatedPartyMemberus-gaap:InterestRateSwapMemberus-gaap:DesignatedAsHedgingInstrumentMember2022-05-010000027673jdcc:OtherPayablesToRelatedPartyMemberus-gaap:FairValueInputsLevel2Memberus-gaap:FairValueMeasurementsRecurringMember2022-05-010000027673jdcc:OtherPayablesToRelatedPartyMemberus-gaap:CrossCurrencyInterestRateContractMemberus-gaap:NotDesignatedAsHedgingInstrumentEconomicHedgeMember2022-05-010000027673jdcc:OtherPayablesToRelatedPartyMemberus-gaap:NotDesignatedAsHedgingInstrumentEconomicHedgeMember2022-05-010000027673us-gaap:OtherAssetsMemberus-gaap:ForeignExchangeContractMemberus-gaap:NotDesignatedAsHedgingInstrumentEconomicHedgeMember2023-04-300000027673us-gaap:OtherAssetsMemberus-gaap:FairValueInputsLevel2Memberus-gaap:FairValueMeasurementsRecurringMember2023-04-300000027673jdcc:ReceivablesFromRelatedPartyMemberus-gaap:InterestRateSwapMemberus-gaap:NotDesignatedAsHedgingInstrumentEconomicHedgeMember2023-04-300000027673jdcc:ReceivablesFromRelatedPartyMemberus-gaap:InterestRateSwapMemberus-gaap:DesignatedAsHedgingInstrumentMember2023-04-300000027673jdcc:ReceivablesFromRelatedPartyMemberus-gaap:FairValueInputsLevel2Memberus-gaap:FairValueMeasurementsRecurringMember2023-04-300000027673jdcc:ReceivablesFromRelatedPartyMemberus-gaap:CrossCurrencyInterestRateContractMemberus-gaap:NotDesignatedAsHedgingInstrumentEconomicHedgeMember2023-04-300000027673jdcc:ReceivablesFromRelatedPartyMemberus-gaap:NotDesignatedAsHedgingInstrumentEconomicHedgeMember2023-04-300000027673us-gaap:OtherAssetsMemberus-gaap:ForeignExchangeContractMemberus-gaap:NotDesignatedAsHedgingInstrumentEconomicHedgeMember2022-10-300000027673us-gaap:OtherAssetsMemberus-gaap:FairValueInputsLevel2Memberus-gaap:FairValueMeasurementsRecurringMember2022-10-300000027673jdcc:ReceivablesFromRelatedPartyMemberus-gaap:InterestRateSwapMemberus-gaap:NotDesignatedAsHedgingInstrumentEconomicHedgeMember2022-10-300000027673jdcc:ReceivablesFromRelatedPartyMemberus-gaap:InterestRateSwapMemberus-gaap:DesignatedAsHedgingInstrumentMember2022-10-300000027673jdcc:ReceivablesFromRelatedPartyMemberus-gaap:FairValueInputsLevel2Memberus-gaap:FairValueMeasurementsRecurringMember2022-10-300000027673jdcc:ReceivablesFromRelatedPartyMemberus-gaap:CrossCurrencyInterestRateContractMemberus-gaap:NotDesignatedAsHedgingInstrumentEconomicHedgeMember2022-10-300000027673jdcc:ReceivablesFromRelatedPartyMemberus-gaap:NotDesignatedAsHedgingInstrumentEconomicHedgeMember2022-10-300000027673us-gaap:OtherAssetsMemberus-gaap:ForeignExchangeContractMemberus-gaap:NotDesignatedAsHedgingInstrumentEconomicHedgeMember2022-05-010000027673us-gaap:OtherAssetsMemberus-gaap:FairValueInputsLevel2Memberus-gaap:FairValueMeasurementsRecurringMember2022-05-010000027673jdcc:ReceivablesFromRelatedPartyMemberus-gaap:InterestRateSwapMemberus-gaap:NotDesignatedAsHedgingInstrumentEconomicHedgeMember2022-05-010000027673jdcc:ReceivablesFromRelatedPartyMemberus-gaap:InterestRateSwapMemberus-gaap:DesignatedAsHedgingInstrumentMember2022-05-010000027673jdcc:ReceivablesFromRelatedPartyMemberus-gaap:FairValueInputsLevel2Memberus-gaap:FairValueMeasurementsRecurringMember2022-05-010000027673jdcc:ReceivablesFromRelatedPartyMemberus-gaap:CrossCurrencyInterestRateContractMemberus-gaap:NotDesignatedAsHedgingInstrumentEconomicHedgeMember2022-05-010000027673jdcc:ReceivablesFromRelatedPartyMemberus-gaap:NotDesignatedAsHedgingInstrumentEconomicHedgeMember2022-05-010000027673jdcc:UnrelatedExternalCounterpartiesMember2023-04-300000027673jdcc:UltimateParentCompanyAndItsWhollyOwnedSubsidiariesMember2023-04-300000027673jdcc:UnrelatedExternalCounterpartiesMember2022-10-300000027673jdcc:UltimateParentCompanyAndItsWhollyOwnedSubsidiariesMember2022-10-300000027673jdcc:UnrelatedExternalCounterpartiesMember2022-05-010000027673jdcc:UltimateParentCompanyAndItsWhollyOwnedSubsidiariesMember2022-05-010000027673us-gaap:VariableInterestEntityNotPrimaryBeneficiaryMemberus-gaap:FinancialGuaranteeMemberjdcc:JohnDeereCanadaFundingIncMember2023-04-300000027673us-gaap:FinancialGuaranteeMemberjdcc:JohnDeereFinancialIncMemberus-gaap:MediumTermNotesMember2023-04-300000027673jdcc:MediumTermNotesDueInNextTenYearsMember2023-04-300000027673jdcc:MediumTermNotesDueInNextTenYearsMember2022-10-300000027673jdcc:MediumTermNotesDueInNextTenYearsMember2022-05-010000027673jdcc:AccountingStandardsUpdate202202Member2023-04-300000027673us-gaap:VariableInterestEntityNotPrimaryBeneficiaryMemberjdcc:JohnDeereCanadaFundingIncMember2023-04-300000027673us-gaap:FairValueInputsLevel2Memberus-gaap:FairValueMeasurementsRecurringMember2023-04-300000027673us-gaap:FairValueInputsLevel2Memberus-gaap:FairValueMeasurementsRecurringMember2022-10-300000027673us-gaap:FairValueInputsLevel2Memberus-gaap:FairValueMeasurementsRecurringMember2022-05-010000027673us-gaap:UnfundedLoanCommitmentMember2023-04-300000027673jdcc:AgricultureAndTurfIndustryMemberus-gaap:NonperformingFinancingReceivableMemberus-gaap:CommercialPortfolioSegmentMember2023-04-300000027673jdcc:RetailNotesPortfolioSegmentMemberus-gaap:AssetPledgedAsCollateralWithRightMember2023-04-300000027673jdcc:RetailNotesPortfolioSegmentMemberus-gaap:AssetNotPledgedAsCollateralMember2023-04-300000027673jdcc:FinancingLeasesPortfolioSegmentMember2023-04-300000027673srt:ScenarioPreviouslyReportedMemberjdcc:RetailNotesPortfolioSegmentMemberus-gaap:AssetNotPledgedAsCollateralMember2022-10-300000027673srt:RevisionOfPriorPeriodErrorCorrectionAdjustmentMemberjdcc:RetailNotesPortfolioSegmentMemberus-gaap:AssetNotPledgedAsCollateralMember2022-10-300000027673jdcc:ConstructionAndForestryIndustryMemberus-gaap:CommercialPortfolioSegmentMemberus-gaap:FinancialAssetPastDueMember2022-10-300000027673jdcc:AgricultureAndTurfIndustryMemberus-gaap:NonperformingFinancingReceivableMemberus-gaap:CommercialPortfolioSegmentMember2022-10-300000027673jdcc:RetailNotesPortfolioSegmentMemberus-gaap:AssetPledgedAsCollateralWithRightMember2022-10-300000027673jdcc:RetailNotesPortfolioSegmentMemberus-gaap:AssetNotPledgedAsCollateralMember2022-10-300000027673jdcc:FinancingLeasesPortfolioSegmentMember2022-10-300000027673srt:ScenarioPreviouslyReportedMemberjdcc:RetailNotesPortfolioSegmentMemberus-gaap:AssetNotPledgedAsCollateralMember2022-05-010000027673srt:RevisionOfPriorPeriodErrorCorrectionAdjustmentMemberjdcc:RetailNotesPortfolioSegmentMemberus-gaap:AssetNotPledgedAsCollateralMember2022-05-010000027673jdcc:ConstructionAndForestryIndustryMemberus-gaap:CommercialPortfolioSegmentMemberus-gaap:FinancialAssetPastDueMember2022-05-010000027673jdcc:AgricultureAndTurfIndustryMemberus-gaap:NonperformingFinancingReceivableMemberus-gaap:CommercialPortfolioSegmentMember2022-05-010000027673jdcc:AgricultureAndTurfIndustryMemberus-gaap:CommercialPortfolioSegmentMemberus-gaap:FinancialAssetPastDueMember2022-05-010000027673jdcc:RetailNotesPortfolioSegmentMemberus-gaap:AssetPledgedAsCollateralWithRightMember2022-05-010000027673jdcc:RetailNotesPortfolioSegmentMemberus-gaap:AssetNotPledgedAsCollateralMember2022-05-010000027673jdcc:FinancingLeasesPortfolioSegmentMember2022-05-010000027673us-gaap:FairValueInputsLevel3Memberus-gaap:AssetPledgedAsCollateralWithRightMember2023-04-300000027673us-gaap:FairValueInputsLevel3Memberus-gaap:AssetNotPledgedAsCollateralMember2023-04-300000027673us-gaap:CarryingReportedAmountFairValueDisclosureMemberus-gaap:AssetPledgedAsCollateralWithRightMember2023-04-300000027673us-gaap:CarryingReportedAmountFairValueDisclosureMemberus-gaap:AssetNotPledgedAsCollateralMember2023-04-300000027673us-gaap:FairValueInputsLevel3Memberus-gaap:AssetPledgedAsCollateralWithRightMember2022-10-300000027673us-gaap:FairValueInputsLevel3Memberus-gaap:AssetNotPledgedAsCollateralMember2022-10-300000027673us-gaap:CarryingReportedAmountFairValueDisclosureMemberus-gaap:AssetPledgedAsCollateralWithRightMember2022-10-300000027673us-gaap:CarryingReportedAmountFairValueDisclosureMemberus-gaap:AssetNotPledgedAsCollateralMember2022-10-300000027673srt:ScenarioPreviouslyReportedMember2022-10-300000027673srt:RevisionOfPriorPeriodErrorCorrectionAdjustmentMember2022-10-300000027673us-gaap:FairValueInputsLevel3Memberus-gaap:AssetPledgedAsCollateralWithRightMember2022-05-010000027673us-gaap:FairValueInputsLevel3Memberus-gaap:AssetNotPledgedAsCollateralMember2022-05-010000027673us-gaap:CarryingReportedAmountFairValueDisclosureMemberus-gaap:AssetPledgedAsCollateralWithRightMember2022-05-010000027673us-gaap:CarryingReportedAmountFairValueDisclosureMemberus-gaap:AssetNotPledgedAsCollateralMember2022-05-010000027673srt:ScenarioPreviouslyReportedMember2022-05-010000027673srt:RevisionOfPriorPeriodErrorCorrectionAdjustmentMember2022-05-010000027673jdcc:UltimateParentCompanyAndItsWhollyOwnedSubsidiariesMember2022-10-312023-04-300000027673us-gaap:FairValueInputsLevel2Member2023-04-300000027673us-gaap:CarryingReportedAmountFairValueDisclosureMember2023-04-300000027673us-gaap:FairValueInputsLevel2Member2022-10-300000027673us-gaap:CarryingReportedAmountFairValueDisclosureMember2022-10-300000027673us-gaap:FairValueInputsLevel2Member2022-05-010000027673us-gaap:CarryingReportedAmountFairValueDisclosureMember2022-05-010000027673jdcc:LongTermDebtNoncurrentMemberus-gaap:InterestRateSwapMember2023-04-300000027673jdcc:DebtCurrentMemberus-gaap:InterestRateSwapMember2023-04-300000027673jdcc:LongTermDebtNoncurrentMemberus-gaap:InterestRateSwapMember2022-10-300000027673jdcc:DebtCurrentMemberus-gaap:InterestRateSwapMember2022-10-300000027673jdcc:LongTermDebtNoncurrentMemberus-gaap:InterestRateSwapMember2022-05-010000027673jdcc:DebtCurrentMemberus-gaap:InterestRateSwapMember2022-05-010000027673us-gaap:DerivativeMemberjdcc:UltimateParentCompanyAndItsWhollyOwnedSubsidiariesMember2023-04-300000027673us-gaap:DerivativeMemberjdcc:UltimateParentCompanyAndItsWhollyOwnedSubsidiariesMember2022-10-300000027673us-gaap:DerivativeMemberjdcc:UltimateParentCompanyAndItsWhollyOwnedSubsidiariesMember2022-05-010000027673srt:ScenarioPreviouslyReportedMember2022-01-312022-05-010000027673srt:RevisionOfPriorPeriodErrorCorrectionAdjustmentMember2022-01-312022-05-010000027673srt:ScenarioPreviouslyReportedMember2021-11-012022-05-010000027673srt:RevisionOfPriorPeriodErrorCorrectionAdjustmentMember2021-11-012022-05-010000027673us-gaap:VariableInterestEntityNotPrimaryBeneficiaryMemberus-gaap:FinancialGuaranteeMemberjdcc:JohnDeereCanadaFundingIncMember2022-10-312023-04-300000027673us-gaap:FinancialGuaranteeMemberjdcc:JohnDeereFinancialIncMemberus-gaap:MediumTermNotesMember2022-10-312023-04-300000027673us-gaap:UnfundedLoanCommitmentMember2023-01-302023-04-300000027673us-gaap:UnfundedLoanCommitmentMember2022-10-312023-04-300000027673us-gaap:UnfundedLoanCommitmentMember2022-01-312022-05-010000027673us-gaap:UnfundedLoanCommitmentMember2021-11-012022-05-010000027673jdcc:AgricultureAndTurfIndustryMemberus-gaap:CommercialPortfolioSegmentMemberus-gaap:FinancialAssetPastDueMember2022-10-300000027673jdcc:ConstructionAndForestryIndustryMemberus-gaap:CommercialPortfolioSegmentMemberus-gaap:FinancialAssetPastDueMember2023-04-300000027673jdcc:ConstructionAndForestryIndustryMemberus-gaap:ConsumerPortfolioSegmentMemberus-gaap:FinancingReceivablesEqualToGreaterThan90DaysPastDueMember2022-10-300000027673jdcc:AgricultureAndTurfIndustryMemberus-gaap:ConsumerPortfolioSegmentMemberus-gaap:FinancingReceivablesEqualToGreaterThan90DaysPastDueMember2022-10-300000027673jdcc:ConstructionAndForestryIndustryMemberus-gaap:ConsumerPortfolioSegmentMemberus-gaap:FinancingReceivablesEqualToGreaterThan90DaysPastDueMember2022-05-010000027673jdcc:ConstructionAndForestryIndustryMemberus-gaap:ConsumerPortfolioSegmentMemberus-gaap:FinancingReceivablesEqualToGreaterThan90DaysPastDueMember2023-04-300000027673jdcc:AgricultureAndTurfIndustryMemberus-gaap:CommercialPortfolioSegmentMemberus-gaap:FinancialAssetPastDueMember2023-04-300000027673jdcc:ConstructionAndForestryIndustryMemberus-gaap:PerformingFinancingReceivableMemberus-gaap:CommercialPortfolioSegmentMember2022-10-300000027673jdcc:ConstructionAndForestryIndustryMemberus-gaap:PerformingFinancingReceivableMemberus-gaap:CommercialPortfolioSegmentMember2022-05-010000027673jdcc:ConstructionAndForestryIndustryMemberus-gaap:PerformingFinancingReceivableMemberus-gaap:ConsumerPortfolioSegmentMember2023-04-300000027673jdcc:ConstructionAndForestryIndustryMemberus-gaap:PerformingFinancingReceivableMemberus-gaap:CommercialPortfolioSegmentMember2023-04-300000027673jdcc:ConstructionAndForestryIndustryMemberus-gaap:NonperformingFinancingReceivableMemberus-gaap:ConsumerPortfolioSegmentMember2023-04-300000027673jdcc:ConstructionAndForestryIndustryMemberus-gaap:ConsumerPortfolioSegmentMemberus-gaap:FinancingReceivables60To89DaysPastDueMember2023-04-300000027673jdcc:ConstructionAndForestryIndustryMemberus-gaap:ConsumerPortfolioSegmentMemberus-gaap:FinancingReceivables30To59DaysPastDueMember2023-04-300000027673jdcc:AgricultureAndTurfIndustryMemberus-gaap:PerformingFinancingReceivableMemberus-gaap:ConsumerPortfolioSegmentMember2023-04-300000027673jdcc:AgricultureAndTurfIndustryMemberus-gaap:PerformingFinancingReceivableMemberus-gaap:CommercialPortfolioSegmentMember2023-04-300000027673jdcc:AgricultureAndTurfIndustryMemberus-gaap:NonperformingFinancingReceivableMemberus-gaap:ConsumerPortfolioSegmentMember2023-04-300000027673jdcc:AgricultureAndTurfIndustryMemberus-gaap:ConsumerPortfolioSegmentMemberus-gaap:FinancingReceivablesEqualToGreaterThan90DaysPastDueMember2023-04-300000027673jdcc:AgricultureAndTurfIndustryMemberus-gaap:ConsumerPortfolioSegmentMemberus-gaap:FinancingReceivables60To89DaysPastDueMember2023-04-300000027673jdcc:AgricultureAndTurfIndustryMemberus-gaap:ConsumerPortfolioSegmentMemberus-gaap:FinancingReceivables30To59DaysPastDueMember2023-04-300000027673us-gaap:ConsumerPortfolioSegmentMember2023-04-300000027673jdcc:ConstructionAndForestryIndustryMemberus-gaap:PerformingFinancingReceivableMemberus-gaap:ConsumerPortfolioSegmentMember2022-10-300000027673jdcc:ConstructionAndForestryIndustryMemberus-gaap:NonperformingFinancingReceivableMemberus-gaap:ConsumerPortfolioSegmentMember2022-10-300000027673jdcc:ConstructionAndForestryIndustryMemberus-gaap:ConsumerPortfolioSegmentMemberus-gaap:FinancingReceivables60To89DaysPastDueMember2022-10-300000027673jdcc:ConstructionAndForestryIndustryMemberus-gaap:ConsumerPortfolioSegmentMemberus-gaap:FinancingReceivables30To59DaysPastDueMember2022-10-300000027673jdcc:AgricultureAndTurfIndustryMemberus-gaap:PerformingFinancingReceivableMemberus-gaap:ConsumerPortfolioSegmentMember2022-10-300000027673jdcc:AgricultureAndTurfIndustryMemberus-gaap:PerformingFinancingReceivableMemberus-gaap:CommercialPortfolioSegmentMember2022-10-300000027673jdcc:AgricultureAndTurfIndustryMemberus-gaap:NonperformingFinancingReceivableMemberus-gaap:ConsumerPortfolioSegmentMember2022-10-300000027673jdcc:AgricultureAndTurfIndustryMemberus-gaap:ConsumerPortfolioSegmentMemberus-gaap:FinancingReceivables60To89DaysPastDueMember2022-10-300000027673jdcc:AgricultureAndTurfIndustryMemberus-gaap:ConsumerPortfolioSegmentMemberus-gaap:FinancingReceivables30To59DaysPastDueMember2022-10-300000027673us-gaap:ConsumerPortfolioSegmentMember2022-10-300000027673jdcc:ConstructionAndForestryIndustryMemberus-gaap:PerformingFinancingReceivableMemberus-gaap:ConsumerPortfolioSegmentMember2022-05-010000027673jdcc:ConstructionAndForestryIndustryMemberus-gaap:NonperformingFinancingReceivableMemberus-gaap:ConsumerPortfolioSegmentMember2022-05-010000027673jdcc:ConstructionAndForestryIndustryMemberus-gaap:ConsumerPortfolioSegmentMemberus-gaap:FinancingReceivables60To89DaysPastDueMember2022-05-010000027673jdcc:ConstructionAndForestryIndustryMemberus-gaap:ConsumerPortfolioSegmentMemberus-gaap:FinancingReceivables30To59DaysPastDueMember2022-05-010000027673jdcc:AgricultureAndTurfIndustryMemberus-gaap:PerformingFinancingReceivableMemberus-gaap:ConsumerPortfolioSegmentMember2022-05-010000027673jdcc:AgricultureAndTurfIndustryMemberus-gaap:PerformingFinancingReceivableMemberus-gaap:CommercialPortfolioSegmentMember2022-05-010000027673jdcc:AgricultureAndTurfIndustryMemberus-gaap:NonperformingFinancingReceivableMemberus-gaap:ConsumerPortfolioSegmentMember2022-05-010000027673jdcc:AgricultureAndTurfIndustryMemberus-gaap:ConsumerPortfolioSegmentMemberus-gaap:FinancingReceivablesEqualToGreaterThan90DaysPastDueMember2022-05-010000027673jdcc:AgricultureAndTurfIndustryMemberus-gaap:ConsumerPortfolioSegmentMemberus-gaap:FinancingReceivables60To89DaysPastDueMember2022-05-010000027673jdcc:AgricultureAndTurfIndustryMemberus-gaap:ConsumerPortfolioSegmentMemberus-gaap:FinancingReceivables30To59DaysPastDueMember2022-05-010000027673us-gaap:ConsumerPortfolioSegmentMember2022-05-010000027673us-gaap:ConsumerPortfolioSegmentMember2022-10-312023-04-300000027673jdcc:RetailRevolvingChargeAccountsPortfolioSegmentMember2023-01-302023-04-300000027673jdcc:RetailRevolvingChargeAccountsPortfolioSegmentMember2022-10-312023-04-300000027673us-gaap:CommercialPortfolioSegmentMember2023-01-302023-04-300000027673jdcc:RetailNotesAndFinanceLeasesPortfolioSegmentMember2023-01-302023-04-300000027673us-gaap:CommercialPortfolioSegmentMember2022-10-312023-04-300000027673jdcc:RetailNotesAndFinanceLeasesPortfolioSegmentMember2022-10-312023-04-300000027673us-gaap:CommercialPortfolioSegmentMember2022-01-312022-05-010000027673jdcc:RetailRevolvingChargeAccountsPortfolioSegmentMember2022-01-312022-05-010000027673jdcc:RetailNotesAndFinanceLeasesPortfolioSegmentMember2022-01-312022-05-0100000276732022-01-312022-05-010000027673us-gaap:CommercialPortfolioSegmentMember2021-11-012022-05-010000027673jdcc:RetailRevolvingChargeAccountsPortfolioSegmentMember2021-11-012022-05-010000027673jdcc:RetailNotesAndFinanceLeasesPortfolioSegmentMember2021-11-012022-05-0100000276732021-11-012022-05-010000027673us-gaap:CommercialPortfolioSegmentMember2023-04-300000027673jdcc:RetailRevolvingChargeAccountsPortfolioSegmentMember2023-04-300000027673jdcc:RetailNotesAndFinanceLeasesPortfolioSegmentMember2023-04-300000027673us-gaap:CommercialPortfolioSegmentMember2023-01-290000027673jdcc:RetailRevolvingChargeAccountsPortfolioSegmentMember2023-01-290000027673jdcc:RetailNotesAndFinanceLeasesPortfolioSegmentMember2023-01-2900000276732023-01-290000027673us-gaap:CommercialPortfolioSegmentMember2022-10-300000027673jdcc:RetailRevolvingChargeAccountsPortfolioSegmentMember2022-10-300000027673jdcc:RetailNotesAndFinanceLeasesPortfolioSegmentMember2022-10-300000027673us-gaap:CommercialPortfolioSegmentMember2022-05-010000027673jdcc:RetailRevolvingChargeAccountsPortfolioSegmentMember2022-05-010000027673jdcc:RetailNotesAndFinanceLeasesPortfolioSegmentMember2022-05-010000027673us-gaap:CommercialPortfolioSegmentMember2022-01-300000027673jdcc:RetailRevolvingChargeAccountsPortfolioSegmentMember2022-01-300000027673jdcc:RetailNotesAndFinanceLeasesPortfolioSegmentMember2022-01-3000000276732022-01-300000027673us-gaap:CommercialPortfolioSegmentMember2021-10-310000027673jdcc:RetailRevolvingChargeAccountsPortfolioSegmentMember2021-10-310000027673jdcc:RetailNotesAndFinanceLeasesPortfolioSegmentMember2021-10-3100000276732021-10-310000027673us-gaap:NonperformingFinancingReceivableMember2023-01-302023-04-300000027673us-gaap:NonperformingFinancingReceivableMember2022-10-312023-04-300000027673us-gaap:NonperformingFinancingReceivableMember2022-01-312022-05-010000027673us-gaap:NonperformingFinancingReceivableMember2021-11-012022-05-0100000276732023-04-3000000276732022-10-3000000276732022-05-010000027673us-gaap:CommonStockMember2023-01-302023-04-3000000276732023-01-302023-04-300000027673us-gaap:CommonStockMember2022-10-312023-04-3000000276732023-06-0100000276732022-10-312023-04-30xbrli:sharesiso4217:USDjdcc:itemxbrli:pure

UNITED STATES

SECURITIES AND EXCHANGE COMMISSION

WASHINGTON, D.C. 20549

FORM 10-Q

(Mark One)

QUARTERLY REPORT PURSUANT TO SECTION 13 OR 15(d) OF THE SECURITIES EXCHANGE ACT OF 1934

For the quarterly period ended April 30, 2023

or

TRANSITION REPORT PURSUANT TO SECTION 13 OR 15(d) OF THE SECURITIES EXCHANGE ACT OF 1934

For the transition period from ____ to ____

Commission file no: 1-6458

JOHN DEERE CAPITAL CORPORATION

(Exact name of registrant as specified in its charter)

Delaware
(State of Incorporation)

36-2386361
(IRS Employer Identification No.)

P.O. Box 5328
Madison, Wisconsin 53705-0328
(Address of principal executive offices)

Telephone Number: (800) 438-7394

Securities Registered Pursuant to Section 12(b) of the Act:

Title of each class

Trading symbol

Name of each exchange on which registered

2.00% Senior Notes Due 2031

JDCC 31

New York Stock Exchange

Indicate by check mark whether the registrant: (1) has filed all reports required to be filed by Section 13 or 15(d) of the Securities Exchange Act of 1934 during the preceding 12 months (or for such shorter period that the registrant was required to file such reports), and (2) has been subject to such filing requirements for the past 90 days.

Yes No

Indicate by check mark whether the registrant has submitted electronically every Interactive Data File required to be submitted pursuant to Rule 405 of Regulation S-T (§232.405 of this chapter) during the preceding 12 months (or for such shorter period that the registrant was required to submit such files).

Yes No

Indicate by check mark whether the registrant is a large accelerated filer, an accelerated filer, a non-accelerated filer, a smaller reporting company, or an emerging growth company. See the definitions of “large accelerated filer,” “accelerated filer,” “smaller reporting company,” and “emerging growth company” in Rule 12b-2 of the Exchange Act.

Large accelerated filer

Accelerated filer

Non-accelerated filer

Smaller reporting company

Emerging growth company

If an emerging growth company, indicate by check mark if the registrant has elected not to use the extended transition period for complying with any new or revised financial accounting standards provided pursuant to Section 13(a) of the Exchange Act.

Indicate by check mark whether the registrant is a shell company (as defined in Rule 12b-2 of the Exchange Act). Yes   No

At June 1, 2023, 2,500 shares of common stock, without par value, of the registrant were outstanding, all of which were owned by John Deere Financial Services, Inc., a wholly-owned subsidiary of Deere & Company.

The registrant meets the conditions set forth in General Instruction H(1)(a) and (b) of Form 10-Q and is therefore filing this Form with certain reduced disclosures as permitted by those instructions.

PART I. FINANCIAL INFORMATION

Item 1.     Financial Statements.

John Deere Capital Corporation and Subsidiaries

Statements of Consolidated Income

(Unaudited)

(in millions)

Three Months Ended 

Six Months Ended 


April 30

May 1

April 30

May 1


2023


2022


2023


2022


Revenues

Finance income earned on retail notes

$

352.1

$

251.9

$

682.1

$

500.8

Lease revenues


240.6


238.0


483.1


481.1

Revolving charge account income


91.9


65.9


174.8


132.4

Finance income earned on wholesale receivables


204.0


71.0


355.5


130.9

Other income


40.7


35.2


70.3


70.2

Total revenues


929.3


662.0


1,765.8


1,315.4

Expenses

Interest expense


375.3

55.7


676.3

155.2

Operating expenses:

Depreciation of equipment on operating leases


161.1

165.8


325.6

334.6

Administrative and operating expenses


140.0

128.2


276.7

244.6

Fees and interest paid to John Deere


58.1

99.6


115.7

139.3

Provision for credit losses


26.7


13.2

30.2


12.0

Total operating expenses


385.9


406.8


748.2


730.5

Total expenses


761.2


462.5


1,424.5


885.7

Income of consolidated group before income taxes


168.1


199.5


341.3


429.7

Provision for income taxes


39.0

43.9


75.8

93.8

Income of consolidated group


129.1


155.6


265.5


335.9

Equity in income of unconsolidated affiliate


.8

1.1


1.8

3.0

Net income


129.9


156.7


267.3


338.9

Less: Net loss attributable to noncontrolling interests

(.1)

(.1)

(.3)

(.1)

Net income attributable to the Company

$

130.0

$

156.8

$

267.6

$

339.0

See Condensed Notes to Interim Consolidated Financial Statements.

2

John Deere Capital Corporation and Subsidiaries

Statements of Consolidated Comprehensive Income

(Unaudited)

(in millions)

Three Months Ended 

Six Months Ended 


April 30

May 1

April 30

May 1


2023


2022


2023


2022


Net income

$

129.9

$

156.7

$

267.3

$

338.9

Other comprehensive income (loss), net of income taxes

Cumulative translation adjustment


(1.0)

(34.2)

65.2

(70.6)

Unrealized gain (loss) on derivatives


(18.7)

27.7

(33.0)

40.7

Unrealized loss on debt securities

(.4)

(.2)

(.4)

Other comprehensive income (loss), net of income taxes


(20.1)


(6.7)


32.2


(30.3)

Comprehensive income of consolidated group


109.8


150.0


299.5


308.6

Less: Comprehensive loss attributable to noncontrolling interests

(.1)

(.1)

(.3)

(.1)

Comprehensive income attributable to the Company

$

109.9

$

150.1

$

299.8

$

308.7

See Condensed Notes to Interim Consolidated Financial Statements.

3

John Deere Capital Corporation and Subsidiaries

Consolidated Balance Sheets

(Unaudited)

(in millions)

April 30

October 30

May 1


2023

2022

2022


Assets


Cash and cash equivalents

$

1,493.8

$

661.8

$

632.1

Marketable securities

1.2

1.1

1.6

Receivables:

Retail notes


23,713.5


22,799.0


22,164.1

Retail notes securitized


5,674.0


5,951.6


4,079.2

Revolving charge accounts


3,699.4


4,165.8


3,425.0

Wholesale receivables


12,880.4


8,404.5


7,346.4

Financing leases


1,116.2


1,120.7


896.5

Total receivables


47,083.5


42,441.6


37,911.2

Allowance for credit losses


(133.7)


(128.4)


(124.5)

Total receivables – net


46,949.8


42,313.2


37,786.7

Other receivables


121.5


91.4


81.2

Receivables from John Deere


188.5


214.8


149.0

Equipment on operating leases – net


4,724.2


4,853.5


4,708.7

Notes receivable from John Deere

545.6

370.7

211.5

Investment in unconsolidated affiliate


26.9


22.6


22.4

Deferred income taxes


25.9


25.5


31.5

Other assets


335.0


314.3


342.8

Total Assets

$

54,412.4

$

48,868.9

$

43,967.5

Liabilities and Stockholder’s Equity

Short-term external borrowings:

Commercial paper and other notes payable

$

6,376.7

$

2,402.3

$

1,731.5

Securitization borrowings


5,379.2


5,710.9


4,000.9

Current maturities of long-term external borrowings


5,186.3


5,989.6


6,153.7

Total short-term external borrowings


16,942.2


14,102.8


11,886.1

Notes payable to John Deere


4,810.4


5,225.5


5,276.4

Other payables to John Deere


610.2


1,024.2


599.4

Accounts payable and accrued expenses


1,041.1


957.3


920.1

Deposits held from dealers and merchants


131.7


137.3


126.9

Deferred income taxes


175.0


208.5


216.2

Long-term external borrowings


24,906.8


22,527.8


20,391.3

Total liabilities


48,617.4


44,183.4


39,416.4

Commitments and contingencies (Note 9)

Stockholder’s equity:

Common stock, without par value (issued and outstanding – 2,500 shares owned by John Deere Financial Services, Inc.)


2,292.8


1,482.8


1,482.8

Retained earnings


3,573.5


3,305.9


3,146.3

Accumulated other comprehensive loss


(72.5)


(104.7)


(79.7)

Total Company stockholder’s equity


5,793.8


4,684.0


4,549.4

Noncontrolling interests


1.2


1.5


1.7

Total stockholder’s equity


5,795.0


4,685.5


4,551.1

Total Liabilities and Stockholder’s Equity

$

54,412.4

$

48,868.9

$

43,967.5

See Condensed Notes to Interim Consolidated Financial Statements.

4

John Deere Capital Corporation and Subsidiaries

Statements of Consolidated Cash Flows

(Unaudited)

(in millions)


Six Months Ended 

April 30

May 1


2023


2022


Cash Flows from Operating Activities:

Net income

$

267.3

$

338.9

Adjustments to reconcile net income to net cash

provided by operating activities:

Provision for credit losses


30.2

12.0

Provision for depreciation and amortization


336.4

347.2

Credit for deferred income taxes


(25.0)

(28.5)

Change in accounts payable and accrued expenses


69.8

(37.2)

Change in accrued income taxes payable/receivable


7.9

Other


(29.9)

(91.3)

Net cash provided by operating activities


656.7


541.1

Cash Flows from Investing Activities:

Cost of receivables acquired (excluding wholesale)


(12,155.6)

(11,109.0)

Collections of receivables (excluding wholesale)


11,957.6

10,839.7

Increase in wholesale receivables – net


(4,277.7)

(1,577.9)

Cost of equipment on operating leases acquired


(956.8)

(831.4)

Proceeds from sales of equipment on operating leases


771.2

775.8

Cost of notes receivable acquired from John Deere

(207.0)

(122.9)

Collections of notes receivable from John Deere

35.7

335.3

Other


(10.7)

(7.6)

Net cash used for investing activities


(4,843.3)


(1,698.0)

Cash Flows from Financing Activities:

Increase in commercial paper and other notes payable – net


3,948.6

1,051.6

Decrease in securitization borrowings – net


(333.3)

(593.7)

Decrease in short-term borrowings with John Deere – net


(580.0)

(90.2)

Proceeds from issuance of long-term external borrowings


4,298.0

3,658.0

Payments of long-term external borrowings


(3,121.4)

(2,722.9)

Dividends paid


(175.0)

Capital investments from John Deere

810.0

Debt issuance costs


(17.6)

(16.1)

Net cash provided by financing activities


5,004.3


1,111.7

Effect of exchange rate changes on cash, cash equivalents, and restricted cash


13.6

(9.4)

Net increase (decrease) in cash, cash equivalents, and restricted cash


831.3


(54.6)

Cash, cash equivalents, and restricted cash at beginning of period


766.1


772.8

Cash, cash equivalents, and restricted cash at end of period

$

1,597.4

$

718.2

Components of cash, cash equivalents, and restricted cash:

Cash and cash equivalents

$

1,493.8

$

632.1

Restricted cash*

103.6

86.1

Total cash, cash equivalents, and restricted cash

$

1,597.4

$

718.2

* Restricted cash is reported in other assets on the consolidated balance sheets and primarily relates to the securitization of receivables (see Note 5).

See Condensed Notes to Interim Consolidated Financial Statements.

5

John Deere Capital Corporation and Subsidiaries

Statements of Changes in Consolidated Stockholder’s Equity

For the Three and Six Months Ended April 30, 2023 and May 1, 2022

(Unaudited)

(in millions)

Company Stockholder


Accumulated

Total

Other

Non-

Stockholder’s

Common

Retained

Comprehensive

Controlling

Equity

Stock

Earnings

Income (Loss)

Interests


Three Months Ended May 1, 2022

Balance January 30, 2022

$

4,536.1

$

1,482.8

$

3,124.5

$

(73.0)

$

1.8

Net income (loss)

156.7

156.8

(.1)

Other comprehensive loss

(6.7)

(6.7)

Dividends declared

(135.0)

(135.0)

Balance May 1, 2022

$

4,551.1

$

1,482.8

$

3,146.3

$

(79.7)

$

1.7

Six Months Ended May 1, 2022

Balance October 31, 2021

$

4,417.5

$

1,482.8

$

2,982.3

$

(49.4)

$

1.8

Net income (loss)


338.9


339.0

(.1)

Other comprehensive loss


(30.3)

(30.3)

Dividends declared


(175.0)

(175.0)

Balance May 1, 2022

$

4,551.1

$

1,482.8

$

3,146.3

$

(79.7)

$

1.7

Three Months Ended April 30, 2023

Balance January 29, 2023

$

4,875.2

$

1,482.8

$

3,443.5

$

(52.4)

$

1.3

Net income (loss)

129.9

130.0

(.1)

Other comprehensive loss

(20.1)

(20.1)

Capital investment

810.0

810.0

Balance April 30, 2023

$

5,795.0

$

2,292.8

$

3,573.5

$

(72.5)

$

1.2

Six Months Ended April 30, 2023

Balance October 30, 2022

$

4,685.5

$

1,482.8

$

3,305.9

$

(104.7)

$

1.5

Net income (loss)


267.3


267.6

(.3)

Other comprehensive income


32.2

32.2

Capital investment

810.0

810.0

Balance April 30, 2023

$

5,795.0

$

2,292.8

$

3,573.5

$

(72.5)

$

1.2

See Condensed Notes to Interim Consolidated Financial Statements.

6

John Deere Capital Corporation and Subsidiaries

Condensed Notes to Interim Consolidated Financial Statements

(Unaudited)

(1)  Organization and Consolidation

John Deere Capital Corporation (Capital Corporation) and its subsidiaries are collectively called the Company. John Deere Financial Services, Inc. (JDFS), a wholly-owned finance holding subsidiary of Deere & Company, owns all of the outstanding common stock of Capital Corporation. The Company provides and administers financing for retail purchases of new equipment manufactured by Deere & Company’s production and precision agriculture operations, small agriculture and turf operations, and construction and forestry operations and used equipment taken in trade for this equipment. References to “agriculture and turf” include both production and precision agriculture and small agriculture and turf. The Company generally purchases retail installment sales and loan contracts (retail notes) from Deere & Company and its wholly-owned subsidiaries (collectively called John Deere). John Deere generally acquires these retail notes through independent John Deere retail dealers. The Company also purchases and finances a limited amount of non-John Deere retail notes. In addition, the Company finances and services revolving charge accounts, in most cases acquired from and offered through merchants in the agriculture and turf and construction and forestry markets (revolving charge accounts). The Company also provides wholesale financing to dealers of John Deere agriculture and turf equipment and construction and forestry equipment, primarily to finance inventories of equipment for those dealers (wholesale receivables). Further, the Company leases John Deere equipment and a limited amount of non-John Deere equipment to retail customers (financing and operating leases). The Company also offers credit enhanced international export financing to select customers and dealers, which primarily involves John Deere products. Retail notes, revolving charge accounts, and financing leases are collectively called “Customer Receivables.” Customer Receivables and wholesale receivables are collectively called “Receivables.” Receivables and equipment on operating leases are collectively called “Receivables and Leases.” The Company generally secures its Receivables, other than certain revolving charge accounts, by retaining as collateral security in the goods associated with those Receivables or with the use of other collateral.

The Company uses a 52/53 week fiscal year with quarters ending on the last Sunday in the reporting period. The second quarter ends for fiscal years 2023 and 2022 were April 30, 2023 and May 1, 2022, respectively. Both second quarters contained 13 weeks, while both year-to-date periods contained 26 weeks. Unless otherwise stated, references to particular years, quarters, or months refer to the Company’s fiscal years generally ending in October and the associated periods in those fiscal years.

The Company is the primary beneficiary of and consolidates certain variable interest entities (VIEs) that are special purpose entities (SPEs) related to the securitization of receivables. See Note 5 for more information on these SPEs.

Immaterial Restatement of Prior Period Financial Statements

In the second quarter of 2023, the Company corrected the accounting treatment for financing incentives offered to John Deere dealers, which impacted the timing of expense recognition and the presentation of incentive costs in the consolidated financial statements. Refer to Note 2 for further information regarding the new and previous accounting treatment. The impact of the correction in periods prior to the second quarter ended April 30, 2023 is not material to the consolidated financial statements of the Company in any of the impacted periods; however, the aggregate impact of correcting prior periods within the second quarter ended April 30, 2023 would have been material to the Company’s current period consolidated financial results. Consequently, the Company has made these immaterial corrections in the comparative prior periods. Refer to Note 12 for quantification of the prior period restatement impacts. Additionally, comparative prior period amounts in the applicable notes to the consolidated financial statements have been restated.

(2)  Summary of Significant Accounting Policies and New Accounting Standards

In the second quarter of 2023 the Company corrected its accounting policy for financing incentives offered to John Deere dealers, as described below.

7

Financing Incentives

The Company provides incentive funds to John Deere dealers that meet certain performance metrics, which include minimum finance volume and finance market share with the Company over a defined period. At the end of the qualification period, dealers are granted incentive funds, which can be used for certain predefined uses, including interest rate reductions on future loan and lease originations. In addition, certain dealers may elect to receive cash for a portion of their earned funds. The Company accrues for the incentive costs over the qualification period, which are reported as administrative and operating expenses in the consolidated income statements and accounts payable and accrued expenses in the consolidated balance sheets. The accrued liability is released as dealers utilize the funds.

Under the previous accounting treatment, the Company amortized the non-cash portion of the incentive program costs as a reduction to finance income or lease revenue after the dealers designated the use of the incentive award.

Quarterly Financial Statements

The Company has prepared its interim consolidated financial statements, without audit, pursuant to the rules and regulations of the U.S. Securities and Exchange Commission (SEC). Certain information and footnote disclosures normally included in annual financial statements prepared in accordance with accounting principles generally accepted in the U.S. have been condensed or omitted as permitted by such rules and regulations. All normal recurring adjustments have been included. Management believes the disclosures are adequate to present fairly the financial position, results of operations, and cash flows at the dates and for the periods presented. It is suggested these interim consolidated financial statements be read in conjunction with the consolidated financial statements and the notes thereto appearing in the Company’s latest Annual Report on Form 10-K. Results for interim periods are not necessarily indicative of those to be expected for the fiscal year.

Use of Estimates in Financial Statements

The preparation of financial statements in conformity with accounting principles generally accepted in the U.S. requires management to make estimates and assumptions that affect the reported amounts and related disclosures. Actual results could differ from those estimates.

New Accounting Standards

The Company closely monitors all Accounting Standard Updates (ASUs) issued by the Financial Accounting Standards Board (FASB) and other authoritative guidance. ASUs adopted in 2023 did not have a material impact on the Company’s financial statements.

In March 2022, the FASB issued ASU No. 2022-02, Financial Instruments – Credit Losses (Topic 326): Troubled Debt Restructurings and Vintage Disclosures, which will be effective in the first quarter of fiscal year 2024. The ASU eliminates the accounting guidance for troubled debt restructurings, enhances disclosures for certain receivable modifications related to borrowers experiencing financial difficulty, and requires disclosure of current period gross write-offs by year of origination. ASU No. 2022-02 and other ASUs to be adopted in future periods are being evaluated and at this point are not expected to have a material impact on the Company’s financial statements.

8

(3)  Other Comprehensive Income Items

The after-tax components of accumulated other comprehensive income (loss) were as follows (in millions of dollars):

April 30

October 30

May 1

2023

2022

2022

Cumulative translation adjustment

$

(103.8)

$

(169.0)

$

(125.1)

Unrealized gain on derivatives

33.8

66.8

47.5

Unrealized loss on debt securities

(2.5)

(2.5)

(2.1)

Total accumulated other comprehensive income (loss)

$

(72.5)

$

(104.7)

$

(79.7)

Amounts recorded in and reclassifications out of other comprehensive income (loss), and the income tax effects, were as follows (in millions of dollars):

Before

Tax

After


Tax

(Expense)

Tax


Amount

Credit

Amount


Three Months Ended April 30, 2023


Cumulative translation adjustment


$

(1.0)

$

(1.0)

Unrealized gain (loss) on derivatives:

Unrealized hedging gain (loss)


(3.7)

$

.8


(2.9)

Reclassification of realized (gain) loss to:

Interest rate contracts – Interest expense


(19.9)

4.1

(15.8)

Net unrealized gain (loss) on derivatives


(23.6)


4.9


(18.7)

Unrealized gain (loss) on debt securities:

Unrealized holding gain (loss)

(.7)

.3

(.4)

Total other comprehensive income (loss)

$

(25.3)

$

5.2

$

(20.1)

Six Months Ended April 30, 2023

Cumulative translation adjustment

$

65.2

$

65.2

Unrealized gain (loss) on derivatives:

Unrealized hedging gain (loss)


(5.6)

$

1.2


(4.4)

Reclassification of realized (gain) loss to:

Interest rate contracts – Interest expense


(36.2)

7.6

(28.6)

Net unrealized gain (loss) on derivatives


(41.8)


8.8


(33.0)

Total other comprehensive income (loss)

$

23.4

$

8.8

$

32.2

9

Before

Tax

After


Tax

(Expense)

Tax


Amount

Credit

Amount


Three Months Ended May 1, 2022

Cumulative translation adjustment

$

(34.2)

$

(34.2)

Unrealized gain (loss) on derivatives:

Unrealized hedging gain (loss)


35.2

$

(7.3)


27.9

Reclassification of realized (gain) loss to:

Interest rate contracts – Interest expense


(.2)


(.2)

Net unrealized gain (loss) on derivatives


35.0

(7.3)


27.7

Unrealized gain (loss) on debt securities:

Unrealized holding gain (loss)

(.2)

(.2)

Total other comprehensive income (loss)

$

.6

$

(7.3)

$

(6.7)

Six Months Ended May 1, 2022

Cumulative translation adjustment

$

(70.6)

$

(70.6)

Unrealized gain (loss) on derivatives:

Unrealized hedging gain (loss)


50.6

$

(10.6)


40.0

Reclassification of realized (gain) loss to:

Interest rate contracts – Interest expense


.9

(.2)


.7

Net unrealized gain (loss) on derivatives


51.5


(10.8)


40.7

Unrealized gain (loss) on debt securities:

Unrealized holding gain (loss)

(.5)

.1

(.4)

Total other comprehensive income (loss)

$

(19.6)

$

(10.7)

$

(30.3)

(4)  Receivables

Credit Quality

The Company monitors the credit quality of Receivables based on delinquency status. Past due balances of Receivables still accruing finance income represent the total balance held (principal plus accrued interest) with any payment amounts 30 days or more past the contractual payment due date. Non-performing Receivables represent receivables for which the Company has ceased accruing finance income. Generally, when Customer Receivables are 90 days delinquent, accrual of finance income and lease revenue is suspended, and accrued finance income and lease revenue previously recognized is reversed. Generally, when a wholesale receivable becomes 60 days delinquent, the Company determines whether the accrual of finance income on interest-bearing wholesale receivables should be suspended and whether accrued finance income previously recognized should be reversed. Finance income and lease revenue for non-performing Receivables is recognized on a cash basis. Accrual of finance income and lease revenue is resumed when the receivable becomes contractually current and collections are reasonably assured.

Accrued finance income and lease revenue reversed on non-performing Receivables, and finance income and lease revenue recognized from cash payments on non-performing Receivables were as follows (in millions of dollars):

Three Months Ended

Six Months Ended

April 30

May 1

April 30

May 1

2023

2022

2023

2022

Accrued finance income and lease revenue reversed

$

5.1

$

3.0

$

7.9

$

6.8


Finance income and lease revenue recognized on cash payments

4.6

3.9

7.7

7.0

Receivable balances are written off to the allowance for credit losses when, in the judgment of management, they are considered uncollectible. Generally, when retail notes and financing lease accounts are 120 days delinquent, the collateral is repossessed or the account is designated for litigation, and the estimated uncollectible amount from the customer is written off to the allowance for credit losses. Revolving charge

10

accounts are generally deemed to be uncollectible and written off to the allowance for credit losses when delinquency reaches 120 days. Generally, when a wholesale account becomes 60 days delinquent, the Company determines whether the collateral should be repossessed or the account designated for litigation, and the estimated uncollectible amount is written off to the allowance for credit losses.

The credit quality analysis of Customer Receivables by year of origination was as follows (in millions of dollars):

April 30, 2023

2023

2022

2021

2020

2019

Prior Years

Revolving Charge Accounts

Total

Customer Receivables:


Agriculture and turf

Current

$

5,762.9

$

9,434.5

$

5,598.5

$

2,662.7

$

1,034.1

$

392.3

$

3,539.3

$

28,424.3

30-59 days past due

8.6

48.8

50.1

29.1

16.5

7.8

14.2

175.1

60-89 days past due

1.1

9.8

20.1

16.9

3.1

1.9

7.7

60.6

90+ days past due

.2

.4

.1

.1

.1

.9

Non-performing

5.4

45.2

37.0

25.5

14.0

16.0

24.9

168.0

Construction and forestry

Current

1,168.7

1,954.1

1,179.4

440.4

132.8

49.4

106.6

5,031.4

30-59 days past due

5.6

30.5

23.9

22.9

20.8

9.5

3.7

116.9

60-89 days past due

.2

5.5

13.2

10.9

13.5

11.7

1.8

56.8

90+ days past due

1.3

.1

1.3

2.7

Non-performing

4.4

59.9

56.1

29.4

9.6

5.8

1.2

166.4

Total

$

6,956.9

$

11,589.8

$

6,978.7

$

3,238.0

$

1,245.8

$

494.5

$

3,699.4

$

34,203.1

October 30, 2022

2022

2021

2020

2019

2018

Prior Years

Revolving Charge Accounts

Total

Customer Receivables:


Agriculture and turf

Current

$

11,736.1

$

6,939.9

$

3,479.6

$

1,515.8

$

581.3

$

152.9

$

4,022.7

$

28,428.3

30-59 days past due

40.1

55.8

31.4

15.0

6.4

2.7

18.4

169.8

60-89 days past due

11.8

19.5

10.8

4.4

2.0

1.1

4.5

54.1

90+ days past due

.4

.2

.2

.8

Non-performing

24.7

38.4

29.2

13.7

11.2

10.2

7.8

135.2

Construction and forestry

Current

2,373.7

1,526.3

658.1

230.7

57.2

10.5

107.7

4,964.2

30-59 days past due

44.5

40.6

20.7

7.6

1.8

.6

3.1

118.9

60-89 days past due

18.1

11.4

6.0

3.0

.7

.1

1.0

40.3

90+ days past due

.3

1.3

1.4

3.0

Non-performing

19.3

51.2

27.6

15.4

5.5

2.9

.6

122.5

Total

$

14,269.0

$

8,684.6

$

4,263.6

$

1,807.0

$

666.1

$

181.0

$

4,165.8

$

34,037.1

11

May 1, 2022

2022

2021

2020

2019

2018

Prior Years

Revolving Charge Accounts

Total

Customer Receivables:


Agriculture and turf

Current

$

5,084.4

$

8,914.4

$

4,483.0

$

2,103.9

$

923.3

$

369.7

$

3,299.5

$

25,178.2

30-59 days past due

18.0

66.3

31.6

16.9

7.6

4.0

11.0

155.4

60-89 days past due

3.7

20.7

9.7

5.4

3.7

1.8

4.1

49.1

90+ days past due

.3

.6

.2

.1

1.2

Non-performing

3.5

32.2

30.9

19.1

15.4

14.9

14.9

130.9

Construction and forestry

Current

1,326.9

1,929.9

902.5

380.7

116.3

26.8

91.1

4,774.2

30-59 days past due

15.6

43.0

28.7

11.0

3.5

1.4

3.1

106.3

60-89 days past due

6.2

19.3

12.1

4.9

1.4

.3

.7

44.9

90+ days past due

.2

.6

.4

1.2

Non-performing

2.7

37.6

43.8

24.5

9.6

4.6

.6

123.4

Total

$

6,461.2

$

11,063.7

$

5,543.5

$

2,566.8

$

1,081.0

$

423.6

$

3,425.0

$

30,564.8

The credit quality analysis of wholesale receivables by year of origination was as follows (in millions of dollars):

April 30, 2023

2023

2022

2021

2020

2019

Prior Years

Revolving

Total

Wholesale receivables:


Agriculture and turf

Current

$

258.8

$

196.6

$

34.3

$

14.7

$

2.0

$

1.1

$

9,844.4

$

10,351.9

30+ days past due

.1

6.7

6.8

Non-performing

6.0

6.0

Construction and forestry

Current

9.1

3.5

22.9

.6

.2

.1

2,470.2

2,506.6

30+ days past due

.1

9.0

9.1

Non-performing

Total

$

268.0

$

200.1

$

57.2

$

15.3

$

2.3

$

1.2

$

12,336.3

$

12,880.4

October 30, 2022

2022

2021

2020

2019

2018

Prior Years

Revolving

Total

Wholesale receivables:


Agriculture and turf

Current

$

381.3

$

62.7

$

25.0

$

3.8

$

.3

$

1.1

$

6,238.1

$

6,712.3

30+ days past due

.1

8.3

8.4

Non-performing

5.5

5.5

Construction and forestry

Current

4.8

28.2

1.4

.4

.1

1,633.8

1,668.7

30+ days past due

9.6

9.6

Non-performing

Total

$

386.1

$

91.0

$

26.4

$

4.2

$

.4

$

1.1

$

7,895.3

$

8,404.5

12

May 1, 2022

2022

2021

2020

2019

2018

Prior Years

Revolving

Total

Wholesale receivables:


Agriculture and turf

Current

$

223.2

$

149.8

$

41.4

$

7.8

$

1.2

$

1.8

$

5,548.6

$

5,973.8

30+ days past due

18.5

18.5

Non-performing

5.9

5.9

Construction and forestry

Current

3.7

33.0

1.9

1.7

.2

1,304.4

1,344.9

30+ days past due

3.3

3.3

Non-performing

Total

$

226.9

$

182.8

$

43.3

$

9.5

$

1.4

$

1.8

$

6,880.7

$

7,346.4

Allowance for Credit Losses

The allowance for credit losses is an estimate of the credit losses expected over the life of the Company’s Receivable portfolio. The Company measures expected credit losses on a collective basis when similar risk characteristics exist. Risk characteristics considered by the Company include product category, market, geography, credit risk, and remaining duration. Receivables that do not share risk characteristics with other receivables in the portfolio are evaluated on an individual basis. Non-performing Receivables are included in the estimate of expected credit losses.

Recoveries from freestanding credit enhancements, such as dealer deposits, and certain credit insurance contracts are not included in the estimate of expected credit losses. Recoveries from dealer deposits are recognized in other income on the statements of consolidated income when the dealer’s withholding account is charged. Recoveries from freestanding credit enhancements recorded in other income were $3.9 million for the second quarter and $5.8 million for the first six months of 2023, compared with $1.9 million for the second quarter and $3.1 million for the first six months of 2022.

An analysis of the allowance for credit losses and investment in Receivables during 2023 was as follows (in millions of dollars):

Three Months Ended


April 30, 2023


Retail Notes

Revolving


& Financing

Charge

Wholesale

Total


Leases

Accounts

Receivables

Receivables


Allowance:

Beginning of period balance

$

94.8

$

16.0

$

10.9

$

121.7

Provision for credit losses*


18.6

8.2

.2

27.0

Write-offs


(14.3)

(10.5)

(24.8)

Recoveries


4.2

5.6

9.8

Translation adjustments


(.1)

.1

End of period balance

$

103.2

$

19.3

$

11.2

$

133.7

13

Six Months Ended


April 30, 2023


Retail Notes

Revolving


& Financing

Charge

Wholesale

Total


Leases

Accounts

Receivables

Receivables


Allowance:

Beginning of period balance

$

95.4

$

21.9

$

11.1

$

128.4

Provision (credit) for credit losses*


25.4

4.5

(.3)

29.6

Write-offs


(24.5)

(18.0)

(.1)

(42.6)

Recoveries


6.6

10.9

.6

18.1

Translation adjustments


.3

(.1)

.2

End of period balance

$

103.2

$

19.3

$

11.2

$

133.7

Receivables:

End of period balance

$

30,503.7

$

3,699.4

$

12,880.4

$

47,083.5

*Excludes provision (credit) for credit losses on unfunded commitments of $(.3) million and $.6 million for the three and six months ended April 30, 2023, respectively. The estimated credit losses related to unfunded commitments are recorded in accounts payable and accrued expenses on the consolidated balance sheets.

The allowance for credit losses increased in the second quarter and first six months of 2023, primarily driven by higher expected losses on turf and construction customer accounts, in addition to higher portfolio balances. The Company continues to monitor the economy as part of the allowance setting process, including potential impacts of inflation and interest rates, among other factors, and qualitative adjustments to the allowance are incorporated as necessary.

An analysis of the allowance for credit losses and investment in Receivables during 2022 was as follows (in millions of dollars):

Three Months Ended


May 1, 2022


Retail Notes

Revolving


& Financing

Charge

Wholesale

Total


Leases

Accounts

Receivables

Receivables


Allowance:

Beginning of period balance

$

94.7

$

15.2

$

11.5

$

121.4

Provision for credit losses*


10.9

2.5

.2

13.6

Write-offs


(13.3)

(7.5)

(.2)

(21.0)

Recoveries


3.7

7.1

10.8

Translation adjustments


(.1)

.1

(.3)

(.3)

End of period balance

$

95.9

$

17.4

$

11.2

$

124.5

14

Six Months Ended


May 1, 2022


Retail Notes

Revolving


& Financing

Charge

Wholesale

Total


Leases

Accounts

Receivables

Receivables


Allowance:

Beginning of period balance

$

96.5

$

20.8

$

11.7

$

129.0

Provision (credit) for credit losses*


18.8

(6.9)

.3

12.2

Write-offs


(25.8)

(11.5)

(.2)

(37.5)

Recoveries


6.6

14.9

21.5

Translation adjustments


(.2)

.1

(.6)

(.7)

End of period balance

$

95.9

$

17.4

$

11.2

$

124.5

Receivables:

End of period balance

$

27,139.8

$

3,425.0

$

7,346.4

$

37,911.2

*Excludes provision (credit) for credit losses on unfunded commitments of $(.4) million and $(.2) million for the three and six months ended May 1, 2022, respectively. The estimated credit losses related to unfunded commitments are recorded in accounts payable and accrued expenses on the consolidated balance sheets.

Troubled Debt Restructuring

A troubled debt restructuring is a significant modification of debt in which a creditor grants a concession it would not otherwise consider to a debtor that is experiencing financial difficulties. These modifications may include a reduction of the stated interest rate, an extension of the maturity date, a reduction of the face amount or maturity amount of the debt, or a reduction of accrued interest. The following table includes Receivable contracts identified as troubled debt restructurings, which were primarily retail notes (in millions of dollars):

Six Months Ended

April 30

May 1

2023

2022

Number of receivable contracts

72

139


Pre-modification balance

$

1.5

$

5.8

Post-modification balance

1.5

4.7

During the same periods as the table above, there were no significant troubled debt restructurings that subsequently defaulted and were written off. At April 30, 2023, the Company had no commitments to provide additional financing to customers whose accounts were modified in troubled debt restructurings.

(5)  Securitization of Receivables

As a part of its overall funding strategy, the Company periodically transfers certain Receivables (retail notes) into VIEs that are SPEs or non-VIE banking operations, as part of its asset-backed securities programs (securitizations). The structure of these transactions is such that the transfer of the retail notes does not meet the accounting criteria for sales of receivables, and is, therefore, accounted for as a secured borrowing. SPEs utilized in securitizations of retail notes differ from other entities included in the Company’s consolidated statements because the assets they hold are legally isolated. Use of the assets held by the SPEs or the non-VIEs is restricted by terms of the documents governing the securitization transactions.

15

The components of consolidated restricted assets, secured borrowings, and other liabilities related to secured borrowings in securitization transactions were as follows (in millions of dollars):

April 30

October 30

May 1


2023

2022

2022


Retail notes securitized

$

5,674.0

$

5,951.6

$

4,079.2

Allowance for credit losses


(15.6)


(15.7)


(12.2)

Other assets (primarily restricted cash)


115.3


155.2


124.0

Total restricted securitized assets

$

5,773.7

$

6,091.1

$

4,191.0

Securitization borrowings

$

5,379.2

$

5,710.9

$

4,000.9

Accrued interest on borrowings


8.3


6.1


2.1

Total liabilities related to restricted securitized assets

$

5,387.5

$

5,717.0

$

4,003.0

(6)  Leases

The Company leases John Deere equipment and a limited amount of non-John Deere equipment to retail customers through sales-type, direct financing, and operating leases. Sales-type and direct financing leases are reported in financing leases on the consolidated balance sheets. Operating leases are reported in equipment on operating leases – net on the consolidated balance sheets.

Lease revenues earned by the Company were as follows (in millions of dollars):

Three Months Ended

Six Months Ended

April 30

May 1

April 30

May 1

2023

2022

2023

2022

Sales-type and direct financing lease revenues

$

19.6

$

12.5

$

38.4

$

25.5

Operating lease revenues

216.8

220.3

435.7

445.0

Variable lease revenues


4.6


5.8


10.2


12.0

Total lease revenues

$

241.0

$

238.6

$

484.3

$

482.5

Variable lease revenues reported above primarily relate to separately invoiced property taxes on leased equipment in certain markets, late fees, and excess use and damage fees. Excess use and damage fees are reported in other income on the statements of consolidated income and were $.4 million and $1.2 million for the second quarter and first six months ended April 30, 2023, respectively, compared with $.6 million and $1.4 million for the same periods last year, respectively.

The cost of equipment on operating leases by market was as follows (in millions of dollars):

April 30

October 30

May 1

2023

2022

2022

Agriculture and turf

$

4,921.6

$

5,017.3

$

4,846.7

Construction and forestry

1,067.9


1,138.0

1,222.9

Total

5,989.5

6,155.3

6,069.6

Accumulated depreciation


(1,265.3)

(1,301.8)

(1,360.9)

Equipment on operating leases – net

$

4,724.2

$

4,853.5

$

4,708.7

Total operating lease residual values at April 30, 2023, October 30, 2022, and May 1, 2022 were $3,277.0 million, $3,366.7 million, and $3,335.0 million, respectively. Certain operating leases are subject to residual value guarantees. The total residual value guarantees were $501.3 million, $440.7 million, and $348.4 million at April 30, 2023, October 30, 2022, and May 1, 2022, respectively. The increase in residual value guarantees is primarily due to guarantees provided by John Deere dealers, which generally provide a first-loss residual value guarantee on operating lease originations effective after January 2020.

16

The Company discusses with lessees and dealers options to purchase the equipment or extend the lease prior to operating lease maturity. Equipment returned to the Company upon termination of leases is remarketed by the Company. The matured operating lease inventory balances at April 30, 2023, October 30, 2022, and May 1, 2022 were $16.3 million, $10.8 million, and $9.1 million, respectively. Matured operating lease inventory is reported in other assets on the consolidated balance sheets.

(7)  Notes Receivable from and Payable to John Deere

The Company provides loans to and holds other receivables from affiliated companies. The loan agreements mature over the next seven years and charge interest at competitive market rates. Interest earned from John Deere is recorded in other income and was $8.6 million for the second quarter and $15.4 million in the first six months of 2023, respectively, compared with $4.7 million and $10.2 million for the same periods last year, respectively.

The Company had notes receivable from John Deere with the following affiliated companies as follows (in millions of dollars):

April 30

October 30

May 1

2023

2022

2022

Banco John Deere S.A.

$

545.6

$

370.0

$

171.8

John Deere Agricultural Holdings, Inc.


.7

39.7

Total Notes Receivable from John Deere

$

545.6

$

370.7

$

211.5

The Company also obtains funding from affiliated companies. At April 30, 2023, October 30, 2022, and May 1, 2022, the Company had notes payable to John Deere of $4,810.4 million, $5,225.5 million and $5,276.4 million, respectively. The intercompany borrowings are primarily short-term in nature or contain a due on demand call option. At April 30, 2023, $551.5 million of the intercompany borrowings were long-term loans without a due on demand call option, which mature in 2025. The Company pays interest to John Deere for these borrowings based on competitive market rates. Interest expense paid to John Deere, which is recorded in fees and interest paid to John Deere, was $45.8 million for the second quarter and $85.7 million for the first six months of 2023, respectively, compared with $17.5 million and $34.0 million for the same periods last year, respectively.

(8)  Long-Term External Borrowings

Long-term external borrowings of the Company at April 30, 2023, October 30, 2022, and May 1, 2022 consisted of the following (in millions of dollars):

April 30

October 30

May 1

2023

2022

2022

Senior Debt:

Medium-term notes

$

24,977.3

$

22,595.4

$

20,445.0

Other notes

.3

2.5

5.4

Total senior debt

24,977.6

22,597.9

20,450.4

Unamortized debt discount and debt issuance costs

(70.8)

(70.1)

(59.1)

Total

$

24,906.8

$

22,527.8

$

20,391.3

Medium-term notes are primarily offered by prospectus and issued at fixed and variable rates. The medium-term notes in the table above include unamortized fair value adjustments related to interest rate swaps. The principal balances of the medium-term notes were $25,625.1 million, $23,564.6 million, and $20,904.0 million at April 30, 2023, October 30, 2022, and May 1, 2022, respectively, and have serial maturity dates through 2032. All outstanding medium-term notes and other notes in the table above are senior unsecured borrowings and generally rank equally with each other.

17

(9)  Commitments and Contingencies

At April 30, 2023, John Deere Financial Inc., the John Deere finance subsidiary in Canada, had $2,059.9 million of medium-term notes outstanding, and a fair value liability of $113.0 million for derivatives outstanding, prior to considering applicable netting provisions, with notional amounts of $3,071.4 million that were guaranteed by Capital Corporation. The weighted-average interest rate on the medium-term notes at April 30, 2023 was 2.0 percent with a maximum remaining maturity of six years.

Capital Corporation has a variable interest in John Deere Canada Funding Inc. (JDCFI), a wholly-owned subsidiary of John Deere Financial Inc., which was created as a VIE to issue debt in public markets to fund the operations of affiliated companies in Canada. Capital Corporation has a variable interest in JDCFI because it provides guarantees for all debt issued by JDCFI, however it does not consolidate JDCFI because it does not have the power to direct the activities that most significantly impact JDCFI’s economic performance. Capital Corporation has no carrying value of assets or liabilities related to JDCFI. Its maximum exposure to loss is the amount of the debt issued by JDCFI and guaranteed by Capital Corporation, which was $147.1 million at April 30, 2023. The interest rate on the debt at April 30, 2023 was 3.0 percent with a remaining maturity less than one year. No additional support beyond what was previously contractually required has been provided to JDCFI during the reporting periods.

The Company has commitments to extend credit to customers and John Deere dealers through lines of credit and other pre-approved credit arrangements. The Company applies the same credit policies and approval process for these commitments to extend credit as it does for its Receivables. Collateral is not required for these commitments, but if credit is extended, collateral may be required upon funding. At April 30, 2023, the amount of unused commitments to extend credit to customers and John Deere dealers was $32.9 billion and $5.6 billion, respectively. A significant portion of these commitments is not expected to be fully drawn upon; therefore, the total commitment amounts likely do not represent a future cash requirement. The Company generally has the right to unconditionally cancel, alter, or amend the terms of these commitments at any time. Over 95 percent of the unused commitments to extend credit to customers relate to revolving charge accounts. The Company has a reserve for credit losses of $2.6 million on unfunded commitments that are not unconditionally cancellable at April 30, 2023, which is recorded in accounts payable and accrued expenses on the consolidated balance sheets.

At April 30, 2023, the Company had restricted other assets associated with borrowings related to securitizations (see Note 5). Excluding the securitization programs, the remaining balance of restricted other assets was not material as of April 30, 2023.

The Company is subject to various unresolved legal actions which arise in the normal course of its business, the most prevalent of which relate to retail credit matters. The Company believes the reasonably possible range of losses for these unresolved legal actions would not have a material effect on its consolidated financial statements.

(10)   Fair Value Measurements

The fair values of financial instruments that do not approximate the carrying values were as follows (in millions of dollars):

April 30, 2023

October 30, 2022

May 1, 2022


Carrying

Fair

Carrying

Fair

Carrying

Fair


Value

Value

Value

Value

Value

Value


Receivables financed – net

$

41,291.4

$

40,883.5

$

36,377.3

$

35,562.4

$

33,719.7

$

33,365.3

Retail notes securitized – net


5,658.4


5,493.8


5,935.9

5,696.3


4,067.0


4,010.7

Securitization borrowings


5,379.2


5,271.2


5,710.9

5,576.6


4,000.9


3,937.7

Current maturities of long-
term external borrowings


5,186.3

5,078.3


5,989.6

5,887.7


6,153.7


6,127.1

Long-term external
borrowings


24,906.8


24,658.8


22,527.8

21,792.7


20,391.3


20,035.4

Fair value measurements above were Level 3 for all Receivables and Level 2 for all borrowings.

18

Fair values of Receivables that were issued long-term were based on the discounted values of their related cash flows at interest rates currently being offered by the Company for similar Receivables. The fair values of the remaining Receivables approximated the carrying amounts.

Fair values of long-term external borrowings and securitization borrowings were based on current market quotes for identical or similar borrowings and credit risk, or on the discounted values of their related cash flows at current market interest rates. Certain long-term external borrowings have been swapped to current variable interest rates. The carrying values of these long-term external borrowings include adjustments related to fair value hedges.

Assets and liabilities measured at fair value on a recurring basis were as follows (in millions of dollars):


April 30


October 30


May 1


2023

2022

2022


Marketable securities


International debt securities

$

1.2

$

1.1

$

1.6

Receivables from John Deere

Derivatives

188.5

214.8

149.0

Other assets

Derivatives

12.4


1.3


39.7

Total assets

$

202.1

$

217.2

$

190.3

Other payables to John Deere

Derivatives

$

610.2

$

1,024.2

$

599.4

Accounts payable and accrued expenses

Derivatives

1.8


14.1


.2

Total liabilities

$

612.0

$

1,038.3

$

599.6

All fair value measurements in the table above were Level 2. Excluded from the table above were the Company’s cash equivalents, which were carried at cost that approximates fair value. The cash equivalents consist primarily of time deposits and money market funds.

The international debt securities mature over the next eight years. At April 30, 2023, the amortized cost basis and fair value of these available-for-sale debt securities were $5.0 million and $1.2 million, respectively. Unrealized losses at April 30, 2023 were not recognized in income due to the ability and intent to hold to maturity.

There were no assets or liabilities measured at fair value on a nonrecurring basis, other than Receivables with specific allowances which were not material, during each of the periods ended April 30, 2023, October 30, 2022, and May 1, 2022.

The following is a description of the valuation methodologies the Company uses to measure certain balance sheet items at fair value:

Marketable securities – The international debt securities are valued using quoted prices for identical assets in inactive markets.

Derivatives – The Company’s derivative financial instruments consist of interest rate contracts (swaps and caps), foreign currency exchange contracts (forwards and swaps), and cross-currency interest rate contracts (swaps). The portfolio is valued based on an income approach (discounted cash flow) using market observable inputs, including swap curves and both forward and spot exchange rates for currencies.

Receivables – Specific reserve impairments are based on the fair value of the collateral, which is measured using a market approach (appraisal values or realizable values).

19

(11)  Derivative Instruments

The Company’s policy is to execute derivative transactions to manage exposures arising in the normal course of business and not for the purpose of creating speculative positions or trading. The Company manages the relationship of the types and amounts of its funding sources to its Receivable and Lease portfolios in an effort to diminish risk due to interest rate and foreign currency fluctuations, while responding to favorable financing opportunities. The Company also has foreign currency exposures at some of its foreign and domestic operations related to financing in currencies other than the functional currencies.

All derivatives are recorded at fair value on the consolidated balance sheets. Cash collateral received or paid is not offset against the derivative fair values on the consolidated balance sheets. The cash flows from the derivative contracts are recorded in operating activities in the statements of consolidated cash flows. Each derivative is designated as a cash flow hedge, a fair value hedge, or remains undesignated. All designated hedges are formally documented as to the relationship with the hedged item as well as the risk-management strategy. Both at inception and on an ongoing basis the hedging instrument is assessed as to its effectiveness. If and when a derivative is determined not to be highly effective as a hedge, the underlying hedged transaction is no longer likely to occur, the hedge designation is removed, or the derivative is terminated, hedge accounting is discontinued.

Cash Flow Hedges

Certain interest rate contracts (swaps) were designated as hedges of future cash flows from borrowings. The total notional amounts of the receive-variable/pay-fixed interest rate contracts at April 30, 2023, October 30, 2022, and May 1, 2022 were $2,250.0 million, $1,950.0 million, and $2,450.0 million, respectively. Fair value gains or losses on cash flow hedges are recorded in other comprehensive income (OCI) and subsequently reclassified into interest expense in the same periods during which the hedged transactions impact earnings. These amounts offset the effects of interest rate changes on the related borrowings.

The amount of gain recorded in OCI at April 30, 2023 that is expected to be reclassified to interest expense in the next twelve months if interest rates remain unchanged is $32.7 million after-tax. No gains or losses were reclassified from OCI to earnings based on the probability that the original forecasted transaction would not occur.

Fair Value Hedges

Certain interest rate contracts (swaps) were designated as fair value hedges of borrowings. The total notional amounts of the receive-fixed/pay-variable interest rate contracts at April 30, 2023, October 30, 2022, and May 1, 2022 were $10,280.9 million, $9,448.9 million, and $7,952.3 million, respectively. The fair value gains or losses on these contracts were generally offset by fair value gains or losses on the hedged items (fixed-rate borrowings) with both items recorded in interest expense.

20

The amounts recorded in the consolidated balance sheets related to borrowings designated in fair value hedging relationships were as follows (in millions of dollars). Fair value hedging adjustments are included in the carrying amount of the hedged item.

Active Hedging Relationships

Discontinued Hedging Relationships

Carrying

Cumulative

Carrying Amount

Cumulative

Amount of

Fair Value

of Formerly

Fair Value

April 30, 2023

Hedged Item

Hedging Adjustment

Hedged Item

Hedging Adjustment

Current maturities of long-term external borrowings

$

1,213.3

$

13.9

Long-term external borrowings

$

9,719.4

$

(515.9)

5,656.7

(131.9)

October 30, 2022

Current maturities of long-term external borrowings

$

2,514.9

$

15.5

Long-term external borrowings

$

8,453.6

$

(950.1)

5,519.6

(19.1)

May 1, 2022

Current maturities of long-term external borrowings

$

177.8

$

.6

$

2,606.6

$

7.4

Long-term external borrowings

7,174.6

(564.5)

5,120.0

105.5

Derivatives Not Designated as Hedging Instruments

The Company has certain interest rate contracts (swaps and caps), foreign currency exchange contracts (forwards and swaps), and cross-currency interest rate contracts (swaps), which were not formally designated as hedges. These derivatives were held as economic hedges for underlying interest rate or foreign currency exposures for certain borrowings. The total notional amounts of the interest rate swaps at April 30, 2023, October 30, 2022, and May 1, 2022 were $6,009.3 million, $3,931.3 million, and $2,791.1 million, the foreign currency exchange contracts were $1,312.3 million, $1,069.0 million, and $903.4 million, and the cross-currency interest rate contracts were $163.3 million, $134.2 million, and $102.6 million, respectively. To facilitate borrowings through securitization of retail notes, interest rate caps were sold with notional amounts of $966.8 million, $1,020.3 million, and $1,281.9 million at April 30, 2023, October 30, 2022, and May 1, 2022, respectively. Interest rate caps were also purchased with notional amounts of $966.8 million, $1,020.3 million, and $1,281.9 million at the same dates, respectively. The fair value gains or losses from derivatives not designated as hedging instruments were recorded in the statements of consolidated income, generally offsetting over time the exposure on the hedged item.

21

Fair values of derivative instruments in the consolidated balance sheets were as follows (in millions of dollars):


April 30


October 30


May 1


2023

2022

2022


Receivables from John Deere

Designated as hedging instruments:

Interest rate contracts

$

104.1

$

87.5

$

62.5

Not designated as hedging instruments:

Interest rate contracts


83.0


124.5


81.5

Cross-currency interest rate contracts


1.4


2.8


5.0

Total not designated


84.4


127.3


86.5

Other Assets

Not designated as hedging instruments:

Foreign currency exchange contracts


12.4


1.3


39.7

Total derivative assets

$

200.9

$

216.1

$

188.7

Other Payables to John Deere

Designated as hedging instruments:

Interest rate contracts

$

564.0

$

947.9

$

545.2

Not designated as hedging instruments:

Interest rate contracts


32.6


74.2


54.0

Cross-currency interest rate contracts

13.6

2.1


.2

Total not designated


46.2


76.3


54.2

Accounts Payable and Accrued Expenses

Not designated as hedging instruments:

Foreign currency exchange contracts


1.8


14.1


.2

Total derivative liabilities

$

612.0

$

1,038.3

$

599.6

22

The classification and gains (losses), including accrued interest expense related to derivative instruments on the statements of consolidated income consisted of the following (in millions of dollars):

Three Months Ended

Six Months Ended


April 30

May 1

April 30

May 1


2023


2022


2023


2022


Fair Value Hedges

Interest rate contracts - Interest expense


$

(3.9)

$

(489.5)

$

231.4

$

(629.0)

Cash Flow Hedges

Recognized in OCI:

Interest rate contracts - OCI (pretax)


$

(3.7)

$

35.2

$

(5.6)

$

50.6

Reclassified from OCI:

Interest rate contracts - Interest expense


19.9


.2


36.2


(.9)

Not Designated as Hedges

Interest rate contracts - Interest expense *


$

4.3

$

46.5

$

2.4

$

43.2

Foreign currency exchange contracts - Administrative and operating expenses *


75.3


(3.4)

(59.8)

64.4

Total not designated

$

79.6

$

43.1

$

(57.4)

$

107.6

*    Includes interest and foreign currency exchange gains (losses) from cross-currency interest rate contracts.

Included in the table above are interest expense and administrative and operating expense amounts the Company incurred on derivatives transacted with John Deere. The amounts the Company recognized on these affiliate party transactions for the three months ended April 30, 2023 and May 1, 2022 were a gain of $13.9 million and a loss of $454.9 million, respectively. The amounts the Company recognized on these affiliate party transactions for the six months ended April 30,2023 and May 1, 2022 were a gain of $256.4 million and a loss of $577.5 million, respectively.  

Counterparty Risk and Collateral

Derivative instruments are subject to significant concentrations of credit risk to the banking sector. The Company manages individual unrelated external counterparty exposure by setting limits that consider the credit rating of the unrelated external counterparty, the credit default swap spread of the counterparty, and other financial commitments and exposures between the Company and the unrelated external counterparty banks. All interest rate derivatives are transacted under International Swaps and Derivatives Association (ISDA) documentation. Each master agreement permits the net settlement of amounts owed in the event of default or termination. None of the Company’s derivative agreements contain credit-risk-related contingent features.

The Company’s outstanding derivatives transactions are with both unrelated external counterparties and with John Deere. For derivatives transactions with John Deere, the Company utilizes a centralized hedging structure in which John Deere enters into a derivative transaction with an unrelated external counterparty and simultaneously enters into a derivative transaction with the Company. Except for collateral provisions, the terms of the transaction between the Company and John Deere are identical to the terms of the transaction between John Deere and its unrelated external counterparty.

The Company has ISDA agreements with John Deere that permit the net settlement of amounts owed between counterparties in the event of early termination. In addition, the Company has a loss sharing agreement with John Deere in which the Company has agreed to absorb any losses and expenses John Deere incurs if an unrelated external counterparty fails to meet its obligations on a derivative transaction that John Deere entered into to manage exposures of the Company. The loss sharing agreement did not increase the maximum amount of loss that the Company would incur, after considering collateral received and netting arrangements, as of April 30, 2023, October 30, 2022, and May 1, 2022.

23

Derivatives are recorded without offsetting for netting arrangements or collateral. The impact on the derivative assets and liabilities for external derivatives and those with John Deere related to netting arrangements and any collateral received or paid were as follows (in millions of dollars):

April 30, 2023


Derivatives:

Gross Amounts
Recognized

Netting
Arrangements

Collateral

Net
Amount


Assets


External

$

12.4

$

(1.5)

$

10.9

John Deere


188.5

(147.0)


41.5

Liabilities

External


1.8


(1.5)


.3

John Deere


610.2


(147.0)


463.2

October 30, 2022


Derivatives:

Gross Amounts
Recognized

Netting
Arrangements

Collateral

Net
Amount


Assets


External

$

1.3

$

(1.1)

$

.2

John Deere


214.8


(128.3)


86.5

Liabilities

External


14.1


(1.1)


13.0

John Deere


1,024.2


(128.3)


895.9

May 1, 2022


Derivatives:

Gross Amounts
Recognized

Netting
Arrangements

Collateral

Net
Amount


Assets


External

$

39.7

$

(.2)

$

39.5

John Deere


149.0

(82.8)


66.2

Liabilities

External


.2


(.2)


John Deere


599.4


(82.8)


516.6

24

(12)  Immaterial Restatement of Prior Period Financial Statements

In the second quarter of 2023, the Company corrected the accounting treatment for financing incentives offered to John Deere dealers, which impacted the timing of expense recognition and the presentation of incentive costs in the consolidated financial statements. Refer to Note 1 and Note 2 for additional information. While the prior period amounts have been restated, as set forth below for comparability, the impact of the correction in periods prior to the second quarter ended April 30, 2023 is not material to the consolidated financial statements of the Company in any of the impacted periods.

The prior period impacts to the Company’s statements of consolidated income and the related impacts to the statements of consolidated comprehensive income were as shown below (in millions of dollars). In addition, the Company's net income for the three months ended January 29, 2023 decreased $9.5 million from $147.1 million to $137.6 million.

Three Months Ended May 1, 2022

Six Months Ended May 1, 2022

Previously

As

Previously

As

Reported


Adjustment


Adjusted


Reported


Adjustment


Adjusted

Revenues

Finance income earned on retail notes

$

242.8

$

9.1

$

251.9

$

482.8

$

18.0

$

500.8

Lease revenues

236.5

1.5

238.0

478.0

3.1

481.1

Total revenues

651.4

10.6

662.0

1,294.3

21.1

1,315.4

Expenses

Administrative and operating expenses

115.2

13.0

128.2

211.6

33.0

244.6

Total operating expenses

393.8

13.0

406.8

697.5

33.0

730.5

Total expenses

449.5

13.0

462.5

852.7

33.0

885.7

Income of consolidated group before income taxes

201.9

(2.4)

199.5

441.6

(11.9)

429.7

Provision for income taxes

44.5

(.6)

43.9

96.5

(2.7)

93.8

Income of consolidated group

157.4

(1.8)

155.6

345.1

(9.2)

335.9

Net income

158.5

(1.8)

156.7

348.1

(9.2)

338.9

Net income attributable to the Company

$

158.6

$

(1.8)

$

156.8

$

348.2

$

(9.2)

$

339.0

The prior period impacts to the Company’s consolidated balance sheets and the related components of stockholder’s equity were as shown below (in millions of dollars). In addition, beginning retained earnings for the year ended October 30, 2022 decreased $108.7 million from $3,091.0 million to $2,982.3 million.

October 30, 2022

May 1, 2022

Previously

As

Previously

As

Reported


Adjustment


Adjusted


Reported


Adjustment


Adjusted

Assets

Receivables:

Retail notes

$

22,860.3

$

(61.3)

$

22,799.0

$

22,211.4

$

(47.3)

$

22,164.1

Total receivables


42,502.9


(61.3)


42,441.6


37,958.5


(47.3)


37,911.2

Total receivables – net


42,374.5


(61.3)


42,313.2


37,834.0


(47.3)


37,786.7

Deferred income taxes


23.3


2.2


25.5


29.6


1.9


31.5

Total Assets

$

48,928.0

$

(59.1)

$

48,868.9

$

44,012.9

$

(45.4)

$

43,967.5

Liabilities and Stockholder’s Equity

Accounts payable and accrued expenses

$

866.1

$

91.2

$

957.3

$

817.0

$

103.1

$

920.1

Deferred income taxes


239.4


(30.9)


208.5


246.8


(30.6)


216.2

Total liabilities


44,123.1


60.3


44,183.4


39,343.9


72.5


39,416.4

Stockholder’s equity:

Retained earnings


3,425.3


(119.4)


3,305.9


3,264.2


(117.9)


3,146.3

Total Company stockholder’s equity


4,803.4


(119.4)


4,684.0


4,667.3


(117.9)


4,549.4

Total stockholder’s equity


4,804.9


(119.4)


4,685.5


4,669.0


(117.9)


4,551.1

Total Liabilities and Stockholder’s Equity

$

48,928.0

$

(59.1)

$

48,868.9

$

44,012.9

$

(45.4)

$

43,967.5

25

The prior period impacts to the Company’s statement of consolidated cash flows were as follows (in millions of dollars):

May 1, 2022

Previously

As

Reported


Adjustment


Adjusted

Cash Flows from Operating Activities:

Net income

$

348.1

$

(9.2)

$

338.9

Adjustments to reconcile net income to net cash

provided by operating activities:

Credit for deferred income taxes

(25.8)

(2.7)

(28.5)

Change in accounts payable and accrued expenses

(46.7)

9.5

(37.2)

Other

(93.7)

2.4

(91.3)

Net cash provided by operating activities

$

541.1

$

$

541.1

(13)  Subsequent Events

On May 22, 2023, the Company entered into a retail note securitization using its revolving warehouse facility that resulted in securitization borrowings of $589.1 million.

26

Item 2.   Management’s Discussion and Analysis of Financial Condition and Results of Operations.

Results of Operations

Overview

Organization

The Company primarily generates revenues and cash by financing John Deere dealers’ sales and leases of new and used production and precision agriculture, small agriculture and turf, and construction and forestry equipment. In addition, the Company also provides wholesale financing to dealers of the foregoing equipment and finances retail revolving charge accounts.

Smart Industrial Operating Model and Leap Ambitions

John Deere’s Smart Industrial operating model is focused on making significant investments in strengthening its capabilities in digital, automation, autonomy, and alternative propulsion technologies. These technologies are intended to increase worksite efficiency, improve yields, lower input costs, and ease labor constraints. John Deere’s Leap Ambitions are goals designed to boost economic value and sustainability for John Deere’s customers. As an enabling business, the Company is fully integrated with John Deere’s Smart Industrial operating model and is focused on providing financial solutions to help John Deere achieve its Leap Ambitions. John Deere and the Company anticipate opportunities in this area, as John Deere, the Company, and their customers have a vested interest in sustainable practices.

Trends and Economic Conditions

The Company’s volume of Receivables and Leases is largely dependent upon the level of retail sales and leases of John Deere products. The level of John Deere retail sales and leases is responsive to a variety of economic, financial, climatic, legislative, and other factors that influence supply and demand for its products.

Industry Trends for Fiscal Year 2023

Industry sales of large agricultural machinery in the U.S. and Canada for 2023 are forecasted to increase approximately 10 percent compared to 2022. Industry sales of small agricultural and turf equipment in the U.S. and Canada are expected to be down about 5 percent in 2023. Industry sales of agricultural machinery in Europe are forecasted to be flat to up 5 percent, while South American industry sales of tractors and combines are expected to be flat in 2023. Asia industry sales are forecasted to be down moderately in 2023. On an industry basis, the U.S. and Canada construction equipment and compact construction equipment sales are both expected to be flat to up 5 percent in 2023. Global forestry and global roadbuilding industry sales are each expected to be flat.

John Deere Trends

Customers’ demand for integration of technology into equipment is a market trend underlying John Deere’s Smart Industrial operating model and Leap Ambitions framework. Customers have sought to improve profitability, productivity, and sustainability through technology. John Deere’s approach to technology involves hardware and software; guidance, connectivity and digital solutions; automation and machine intelligence; machine autonomy; and alternative propulsion technologies. This technology is incorporated into products within each of John Deere’s operating segments. Customers continue to adopt technology integrated in the John Deere portfolio of “smart” machines, systems, and solutions. The Company expects this trend to persist for the foreseeable future.

Demand for John Deere’s equipment remains strong, as order books are full throughout 2023. Agricultural fundamentals are expected to remain solid through 2023, and retail demand will comprise most of 2023 sales. The North American retail customer fleet age of combines and large tractors is historically high, and dealer inventories are low due to the manufacturing and supply chain constraints over the past few years. John Deere expects elevated demand to continue for the second half of the year as evidenced by retail customer orders that extend into 2024. Crop prices remain favorable to John Deere customers in part due to a stock-to-use ratio below

27

the 10-year average for key grains. John Deere expects sales volume of large agricultural equipment to be greater in 2023 than 2022 in North America and Europe. Sales volume for small agriculture and turf equipment is expected to be lower than 2022 due to lower demand for consumer-oriented products, partially offset by stronger demand for mid-sized equipment. Construction equipment markets are forecasted to be steady. Strong U.S. infrastructure spending, industrial construction, and rental inventory restocking are expected to more than offset moderation in residential home and commercial real estate construction. Importantly, construction equipment dealer inventory remains below historical averages. Roadbuilding demand remains strongest in the U.S., largely offset by softening demand in Europe and parts of Asia.

Supply chain conditions have improved over 2022; however, John Deere continues to experience disruptions above historical norms. Supply chain disruptions impacted many aspects of John Deere’s business starting in 2022, including parts availability, increased production costs, and higher inventory levels. Past due deliveries from suppliers were at elevated levels during 2022. John Deere implemented mitigation efforts to minimize the impact of supply chain disruptions on its ability to meet customer demand. John Deere has experienced supply chain improvements in the second quarter of 2023. The reduction in supply chain disruptions contributed to higher levels of production in the second quarter of 2023. However, remaining constraints in the supply base will limit higher levels of production in the second half of the year. As a result, the production schedules in 2023 will be more aligned with the customers’ seasonal use of John Deere’s products, marking a return to historical seasonal production patterns.

Company Trends

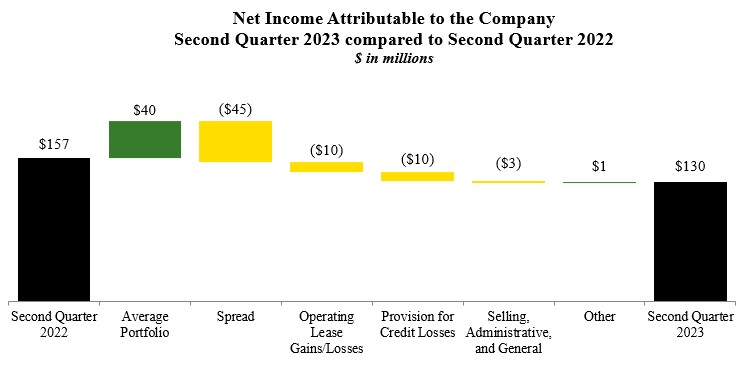
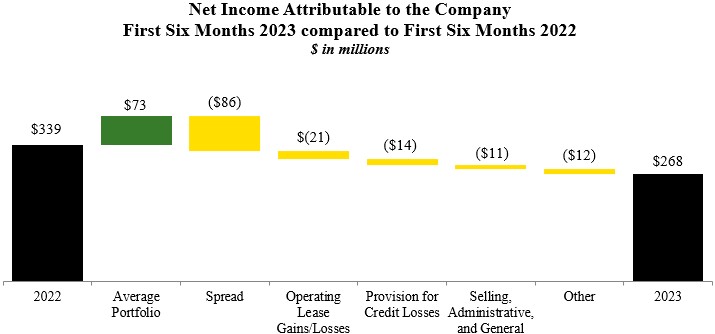
Net income for the Company in fiscal year 2023 is expected to be lower than fiscal year 2022 primarily due to less favorable financing spreads, lower gains on operating lease dispositions, a higher provision for credit losses, and higher selling, administrative, and general expenses. These factors are expected to be partially offset by income earned on higher average portfolio balances, driven by strong demand of John Deere’s products throughout 2023, which is favorably impacting financing volumes.

Central bank policy interest rates increased in the first six months of 2023. Most of the Company’s Customer Receivables are fixed rate, while its wholesale receivables generally are variable rate. The Company has both fixed and variable rate borrowings. The Company manages the risk of interest rate fluctuations by balancing the types and amounts of its funding sources to its Receivable and Lease portfolios. Accordingly, the Company enters into interest rate swap agreements to manage its interest rate exposure. Historically, rising interest rates impact the Company’s borrowings sooner than the benefit is realized from the Receivable and Lease portfolio. As a result, the Company’s financing spread was unfavorably impacted by $85.7 million (after-tax) in the first six months of 2023 compared to 2022. The Company expects spread compression to persist during 2023.

Recent banking sector events have resulted in increased liquidity considerations. The Company’s deposits are well diversified, and as a result, the Company was not exposed to banks that have entered receivership or encountered liquidity issues. These events have not changed the Company’s access to capital markets. The Company continues to monitor counterparty exposure through regular reviews of various risk metrics and by adjusting exposure limits as needed.

As the Company’s volume of Receivables and Leases is largely dependent upon the level of retail sales and leases of John Deere products, supply chain disruptions could impact the Company’s future volumes. Despite supply chain challenges, the Company’s volumes have grown and further growth is forecast in 2023, driven by strong demand for John Deere equipment.

Supply chain disruptions, rising interest rates, and recent banking sector events are driven by factors outside of the Company’s control, and as a result, the Company cannot reasonably foresee when these conditions will subside.

Other Items of Concern and Uncertainties

Other items of concern include global and regional political conditions, failure to raise the U.S. debt ceiling, economic and trade policies, imposition of new or retaliatory tariffs against certain countries or covering certain products, post-pandemic effects, capital market disruptions, changes in demand and pricing for new and used

28

equipment, significant fluctuations in foreign currency exchange rates, and volatility in the prices of many commodities. These items could impact the Company’s results. John Deere and the Company are making investments in technology and in strengthening capabilities in digital, automation, autonomy, and alternative propulsion technologies. As with most technology investments, marketplace adoption, monetization, and regulation of these features holds an elevated level of uncertainty.

Financing Incentives

In the second quarter of 2023, the Company corrected the accounting treatment for financing incentives offered to John Deere dealers. Refer to Note 1, Note 2, and Note 12 of the interim consolidated financial statements for additional information. While prior period amounts have been restated for comparability, the impact of the correction in periods prior to the second quarter ended April 30, 2023 is not material to the consolidated financial statements of the Company in any of the impacted periods.

2023 Compared with 2022

The total revenues and net income attributable to the Company were as follows (in millions of dollars):

Three Months Ended

Six Months Ended

April 30

May 1

April 30

May 1


2023


2022


2023


2022


Total revenues

$

929.3

$

662.0

$

1,765.8

$

1,315.4

Net income attributable to the Company

130.0

156.8

267.6

339.0

Total revenues increased for the second quarter and first six months of 2023 primarily due to a 19% and 17% increase in average portfolio balances, respectively, in addition to higher average financing rates compared to the same periods last year. Net income for the second quarter and first six months of 2023 was lower compared to the same periods in 2022 primarily due to less favorable financing spreads, lower gains on operating lease dispositions, and a higher provision for credit losses, partially offset by income earned on higher average portfolio balances.

Graphic

29

Graphic

Revenues

Finance income, lease revenues, and other income earned by the Company were as follows (in millions of dollars):

Three Months Ended

Six Months Ended

April 30

May 1

%

April 30

May 1

%

2023

2022

Change


2023

2022

Change

Finance income earned on:

Retail notes

$

352.1

$

251.9

40

$

682.1

$

500.8

36

Revolving charge accounts

91.9

65.9

39

174.8

132.4

32

Wholesale receivables

204.0

71.0

187

355.5

130.9

172

Lease revenues

240.6

238.0

1

483.1

481.1

Other income

40.7

35.2

16

70.3

70.2

Finance income earned on retail notes, revolving charge accounts, and wholesale receivables increased during the second quarter and first six months of 2023 compared to 2022, due to higher average financing rates and higher average portfolio balances. Lease revenues were about the same for each period.

Other income increased slightly in the second quarter and was about the same for the first six months of 2023 compared to 2022 due to higher interest earned on the Company’s cash and cash equivalents, offset by lower gains on operating lease dispositions. While demand for used equipment remains strong, lease gains declined during 2023 as end-of-lease book values are now more closely aligned with equipment sale proceeds.

Revenues earned from John Deere totaled $251.2 million for the second quarter and $459.4 million for the first six months of 2023, compared with $149.7 million and $288.3 million for the same periods last year. The increase was primarily due to increased compensation paid by John Deere on wholesale receivables and retail notes, driven by a higher interest rate environment, in addition to higher average portfolio balances. Revenues earned from John Deere are included in each of the revenue amounts discussed above.

30

Expenses

Expenses incurred by the Company were as follows (in millions of dollars):

Three Months Ended

Six Months Ended

April 30

May 1

%

April 30

May 1

%

2023

2022

Change


2023

2022

Change

Interest expense

$

375.3

$

55.7

574

$

676.3

$

155.2

336

Depreciation of equipment on operating leases

161.1

165.8

(3)

325.6

334.6

(3)

Administrative and operating expenses

140.0

128.2

9

276.7

244.6

13

Fees and interest paid to John Deere

58.1

99.6

(42)

115.7

139.3

(17)

Provision for credit losses

26.7

13.2

102

30.2

12.0

152

Provision for income taxes

39.0

43.9

(11)

75.8

93.8

(19)

The increase in interest expense for the second quarter and first six months of 2023 was primarily due to higher average borrowing rates and higher average borrowings.

Depreciation of equipment on operating leases decreased slightly for the second quarter and first six months of 2023 compared to 2022 due to lower average balances of equipment on operating leases.

Administrative and operating expenses increased in the second quarter and first six months of 2023 compared to 2022 due to higher dealer financing incentive program costs driven by increased finance volumes, in addition to higher employment costs, including incentive compensation.

Fees and interest paid to John Deere decreased in the second quarter and first six months of 2023 primarily due to a one-time payment to Deere & Company in 2022 that did not recur in 2023, related to unrealized gains on certain non-designated derivatives assumed by Deere & Company. This was partially offset by higher interest on intercompany borrowings from John Deere, driven by higher average borrowing rates.

The provision for credit losses increased in the second quarter and first six months of 2023 compared with the same periods last year primarily due to favorable allowance adjustments on agricultural retail notes and finance leases in 2022, which did not recur in the current year, in addition to higher net write-offs on revolving charge accounts in 2023. The annualized provision for credit losses, as a percentage of the average balance of total Receivables, was .24 percent for the second quarter and .14 percent for the first six months of 2023, compared with .14 percent and .07 percent for the same periods last year, respectively.

The provision for income taxes decreased during the second quarter and first six months of 2023 primarily due to lower pretax income.

Receivables and Leases

Receivable and Lease (excluding wholesale) volumes were as follows (in millions of dollars):

Three Months Ended

April 30

May 1

$

%

2023

2022

Change

Change 

Retail notes:


Agriculture and turf

3,443.7

3,040.3

403.4

13

Construction and forestry


674.1


779.8


(105.7)

(14)

Total retail notes


4,117.8


3,820.1


297.7

8

Revolving charge accounts


2,146.9


1,946.8


200.1

10

Financing leases


249.0


159.6


89.4

56

Equipment on operating leases


573.0


521.1


51.9

10

Total Receivables and Leases (excluding wholesale)

$

7,086.7

$

6,447.6

$

639.1

10

31

Six Months Ended

April 30

May 1

$

%

2023

2022

Change

Change 

Retail notes:


Agriculture and turf

6,128.2

5,360.2

768.0

14

Construction and forestry


1,304.7


1,454.2


(149.5)

(10)

Total retail notes


7,432.9


6,814.4


618.5

9

Revolving charge accounts


4,359.6


4,035.3


324.3

8

Financing leases


377.5


259.8


117.7

45

Equipment on operating leases


950.3


828.6


121.7

15

Total Receivables and Leases (excluding wholesale)

$

13,120.3

$

11,938.1

$

1,182.2

10

Total Receivables and Leases owned were as follows (in millions of dollars):


April 30


October 30


May 1

2023

2022

2022

Retail notes:


Agriculture and turf

24,323.1

23,796.5

21,462.9

Construction and forestry


5,064.4


4,954.1


4,780.4

Total retail notes


29,387.5


28,750.6


26,243.3

Revolving charge accounts


3,699.4


4,165.8


3,425.0

Wholesale receivables


12,880.4


8,404.5


7,346.4

Financing leases


1,116.2


1,120.7


896.5

Equipment on operating leases


4,724.2


4,853.5


4,708.7

Total Receivables and Leases

51,807.7

47,295.1

42,619.9

Customer Receivables increased $166.0 million during the first six months of 2023 due to strong John Deere retail sales, partially offset by a seasonal decrease in revolving charge account receivables. Customer Receivables increased $3,638.3 million compared to one year ago due to strong John Deere retail sales. Wholesale receivables increased $4,475.9 million in the first six months of 2023 and $5,534.0 million compared to one year ago due to higher shipment volumes of John Deere equipment.

Total Receivables 30 days or more past due, non-performing Receivables, and the allowance for credit losses were as follows (in millions of dollars and as a percentage of the Receivables balance):

April 30

October 30

May 1

2023

2022

2022

Dollars

Percent

Dollars

Percent

Dollars

Percent

Receivables 30 days or more past due

$

428.9

.91

$

404.9

.95

$

379.9

1.00

Non-performing Receivables

340.4

.72

263.2

.62

260.2

.69

Allowance for credit losses

133.7

.28

128.4

.30

124.5

.33

Receivables 30 days or more past due continue to accrue finance income. The Company ceases to accrue finance income once Receivables are considered non-performing. An allowance for credit losses is recorded for the estimated credit losses expected over the life of the Receivable portfolio. The Company measures expected credit losses on a collective basis when similar risk characteristics exist. Risk characteristics considered by the Company include product category, market, geography, credit risk, and remaining duration. Receivables that do not share risk characteristics with other receivables in the portfolio are evaluated on an individual basis. Non-performing Receivables are included in the estimate of expected credit losses. While the Company believes its allowance is sufficient to provide for losses over the life of its existing Receivable portfolio, different assumptions or changes in economic conditions would result in changes to the allowance for credit losses and the provision for credit losses. See Note 4 for additional information related to the allowance for credit losses.

32

Deposits held from dealers and merchants amounted to $131.7 million at April 30, 2023, compared with $137.3 million at October 30, 2022 and $126.9 million at May 1, 2022. These balances primarily represent the aggregate dealer retail note and lease withholding accounts from individual John Deere dealers to which losses from retail notes and leases originating from the respective dealers can be charged. Recoveries from dealer deposits are recognized in other income when the dealer’s withholding account is charged. Recoveries from dealer deposits and other freestanding credit enhancements recorded in other income were $3.9 million in the second quarter and $5.8 million for the first six months of 2023, compared with $1.9 million and $3.1 million for the same periods last year, respectively.

Write-offs and recoveries of Receivables, by product, and as an annualized percentage of average balances held during the period, were as follows (in millions of dollars):

Three Months Ended

April 30, 2023

May 1, 2022

Dollars

Percent

Dollars

Percent

Write-offs:


Retail notes and financing leases:

Agriculture and turf

$

(8.1)


(.13)

$

(5.3)


(.10)

Construction and forestry


(6.2)


(.48)


(8.0)


(.66)

Total retail notes and financing leases


(14.3)


(.19)


(13.3)


(.20)

Revolving charge accounts


(10.5)


(1.32)


(7.5)


(1.00)

Wholesale receivables


(.2)


(.01)

Total write-offs


(24.8)


(.23)


(21.0)


(.23)

Recoveries:

Retail notes and financing leases:

Agriculture and turf


3.4


.05


2.7


.05

Construction and forestry


.8


.06


1.0


.08

Total retail notes and financing leases


4.2


.06


3.7


.06

Revolving charge accounts


5.6


.70


7.1


.95

Total recoveries


9.8


.09


10.8


.12

Total net write-offs

$

(15.0)


(.14)

$

(10.2)


(.11)

Six Months Ended

April 30, 2023

May 1, 2022

Dollars

Percent

Dollars

Percent

Write-offs:


Retail notes and financing leases:

Agriculture and turf

$

(15.2)


(.12)

$

(11.3)


(.10)

Construction and forestry


(9.3)


(.36)


(14.5)


(.61)

Total retail notes and financing leases


(24.5)


(.16)


(25.8)


(.19)

Revolving charge accounts


(18.0)


(1.11)


(11.5)


(.77)

Wholesale receivables


(.1)


(.2)


(.01)

Total write-offs


(42.6)


(.19)


(37.5)


(.21)

Recoveries:

Retail notes and financing leases:

Agriculture and turf


5.0


.04


4.6


.04

Construction and forestry


1.6


.06


2.0


.08

Total retail notes and financing leases


6.6


.04


6.6


.05

Revolving charge accounts


10.9


.67


14.9


.99

Wholesale receivables


.6

.01

Total recoveries


18.1


.08


21.5


.12

Total net write-offs

$

(24.5)


(.11)

$

(16.0)


(.09)

33

Critical Accounting Estimates

See the Company’s critical accounting estimates discussed in Management’s Discussion and Analysis of Financial Condition and Results of Operations of the Company’s most recently filed Annual Report on Form 10-K. There have been no material changes to these estimates.

Capital Resources and Liquidity

For additional information on the Company’s dependence on, and relationship with, Deere & Company, see the Company’s most recently filed Annual Report on Form 10-K.

Sources of Liquidity, Key Metrics and Balance Sheet Data

The Company relies on its ability to raise substantial amounts of funds to finance its Receivable and Lease portfolios. The Company has access to most global capital markets at a reasonable cost. The Company’s ability to meet its debt obligations is supported in several ways. The assets of the Company are self-liquidating in nature. A solid equity position is available to absorb unusual losses on these assets, and all commercial paper is backed by unsecured, committed borrowing lines from various banks. Liquidity is also provided by the Company’s ability to securitize its retail notes and through the issuance of term debt in both public and private markets. Additionally, liquidity may be provided through loans from John Deere. The Company closely monitors its liquidity sources against the cash requirements and expects to have sufficient sources of global funding and liquidity to meet its funding needs in the short-term (next 12 months) and long-term (beyond 12 months).

Key metrics and certain balance sheet data are provided in the following table, in millions of dollars:

April 30

October 30

May 1


2023


2022


2022

Cash, cash equivalents, and marketable securities

$

1,495.0

$

662.9

$

633.7

Receivables and Leases – net

51,674.0

47,166.7

42,495.4

Interest-bearing debt

46,659.4

41,856.1

37,553.8

Unused credit lines

785.3

3,283.9

4,607.5

Ratio of interest-bearing debt to stockholder’s equity

8.1 to 1

8.9 to 1

8.3 to 1

The reduction in unused credit lines in 2023 compared to both prior periods relates to an increase in commercial paper outstanding, by both the Company and John Deere, due to changes in Receivables and funding mix.

There have been no material changes to the contractual and other cash requirements identified in the Company’s most recently issued Annual Report on Form 10-K.

Cash Flows

Six Months Ended

April 30

May 1

(In millions of dollars)


2023


2022

Net cash provided by operating activities

$

656.7

$

541.1

Net cash used for investing activities

(4,843.3)

(1,698.0)

Net cash provided by financing activities

5,004.3

1,111.7

Effect of exchange rate changes on cash, cash equivalents, and restricted cash

13.6

(9.4)

Net increase (decrease) in cash, cash equivalents, and restricted cash

$

831.3

$

(54.6)

Net cash was used for investing activities during the first six months of 2023 primarily due to growth in the wholesale and retail note portfolios. Net cash used by investing activities was funded primarily through external borrowings, capital investments from John Deere, and cash provided by operating activities, partially offset by a reduction in borrowings from John Deere.

34

Borrowings

Total borrowings increased $4,803.3 million in the first six months of 2023 and increased $9,105.6 million compared to a year ago, generally corresponding with the level of the Receivable and Lease portfolios. During the first six months of 2023, the Company issued $4,298.0 million and retired $3,121.4 million of long-term external borrowings, which primarily consisted of medium-term notes. During the first six months of 2023, the Company also issued $1,289.1 million and retired $1,622.4 million of retail note securitization borrowings and maintained an average commercial paper balance of $3,886.4 million. The Company’s funding profile may be altered to reflect such factors as relative costs of funding sources, assets available for securitizations, and capital market accessibility.

The Company has a revolving warehouse facility to utilize bank conduit facilities to securitize retail notes (see Note 5). The facility was renewed in November 2022 with an expiration in November 2023 and increased the total capacity or “financing limit” from $1,000.0 million to $1,500.0 million. At April 30, 2023, $948.1 million of securitization borrowings were outstanding under the facility. At the end of the contractual revolving period, unless the banks and the Company agree to renew, the Company would liquidate the secured borrowings over time as payments on the retail notes are collected.

Capital Investments and Dividends

In the first six months of 2023, Deere & Company increased its capital investment in JDFS by $810.0 million. JDFS, in turn, increased its capital investment in Capital Corporation by the same amount. The capital investments were made to maintain consistent leverage ratios driven by growth in total Receivables and corresponding borrowings. There were no capital investments during the first six months of 2022.

Capital Corporation did not declare or pay a dividend in the first six months of 2023. In the first six months of 2022, Capital Corporation declared and paid cash dividends to JDFS of $175.0 million. JDFS paid comparable dividends to Deere & Company.

Lines of Credit

The Company has access to bank lines of credit with various banks throughout the world. Some of the lines are available to both the Company and Deere & Company. Worldwide lines of credit totaled $10,082.7 million at April 30, 2023, $785.3 million of which were unused. For the purpose of computing the unused credit lines, commercial paper and short-term bank borrowings of the Company and John Deere, excluding secured borrowings and the current portion of long-term external borrowings, were considered to constitute utilization. Included in the total credit lines at April 30, 2023 was a 364-day credit facility agreement of $5,000.0 million, expiring in the second quarter of 2024. In addition, total credit lines included long-term credit facility agreements of $2,500.0 million, expiring in the second quarter of 2027, and $2,500.0 million, expiring in the second quarter of 2028. These credit agreements require the Company to maintain its consolidated ratio of earnings to fixed charges at not less than 1.05 to 1 for any four consecutive fiscal quarterly periods and its ratio of senior debt, excluding securitization indebtedness, to capital base (total subordinated debt and stockholder’s equity excluding accumulated other comprehensive income (loss)) at not more than 11 to 1 at the end of any fiscal quarter. All of the requirements in the credit agreements have been met during the periods included in the consolidated financial statements.

Debt Ratings

The Company’s ability to obtain funding is affected by its debt ratings, which are closely related to the outlook for and the financial condition of John Deere, and the nature and availability of support facilities, such as the Company’s lines of credit and the support agreement from Deere & Company.

35

To access public debt capital markets, the Company relies on credit rating agencies to assign short-term and long-term credit ratings to the Company’s debt securities as an indicator of credit quality for fixed income investors. A security rating is not a recommendation by the rating agency to buy, sell, or hold the Company’s securities. A credit rating agency may change or withdraw ratings based on its assessment of the Company’s current and future ability to meet interest and principal repayment obligations. Each agency’s rating should be evaluated independently of any other rating. Lower credit ratings generally result in higher borrowing costs, including costs of derivative transactions, and reduced access to debt capital markets.

The senior long-term and short-term debt ratings and outlook currently assigned to unsecured Company debt securities by the rating agencies engaged by the Company are the same as those for John Deere. Those ratings are as follows:


Senior Long-Term


Short-Term


Outlook


Fitch Ratings

A+

F1

Stable

Moody’s Investors Service, Inc.


A2


Prime-1


Positive

Standard & Poor’s


A


A-1


Stable

Forward-Looking Statements

Certain statements contained herein, including in the section entitled “Overview” relating to future events, expectations, and trends constitute “forward-looking statements” as defined in the Private Securities Litigation Reform Act of 1995.

Forward-looking statements are based on currently available information and current assumptions, expectations, and projections about future events and should not be relied upon. Except as required by law, the Company expressly disclaims any obligation to update or revise its forward-looking statements. Many factors, risks, and uncertainties could cause actual results to differ materially from these forward-looking statements. Among these factors are risks related to:

volume of Receivables and Leases being dependent upon the level of retail sales and leases of John Deere products;
changes in U.S. and international laws, regulations, and policies relating to trade, spending, taxing, banking, monetary, environmental (including climate change and engine emission), and farming policies;
political, economic, and social instability of the geographies in which John Deere and the Company operate;
wars and other conflicts, including the current conflict between Russia and Ukraine;
adverse macroeconomic conditions, including unemployment, inflation, rising interest rates, changes in consumer practices due to slower economic growth or possible recession, and regional or global liquidity constraints;
growth and sustainability of non-food uses for crops (including ethanol and biodiesel production);
John Deere’s and the Company’s ability to execute business strategies, including John Deere’s Smart Industrial operating model and Leap Ambitions;
John Deere’s and the Company’s ability to understand and meet customers’ changing expectations and demand for John Deere products and solutions, including the Company’s financing solutions;
John Deere’s and the Company’s ability to adapt in highly competitive markets;
John Deere’s dealer practices and their ability to manage distribution of John Deere products and support and service precision technology solutions;
changes in climate patterns, unfavorable weather events, and natural disasters;
higher interest rates and currency fluctuations which could adversely affect the U.S. dollar, customer confidence, access to capital, and demand for John Deere’s and the Company’s products and solutions;
stress in the banking sector may have adverse impacts on customers as well as on the Company’s ability to access cash deposits;

36

uncertainty related to prolonged negotiations regarding the U.S. federal debt ceiling or the U.S. government’s failure to raise the debt ceiling;
changes in the Company’s credit ratings and failure to comply with financial covenants in credit agreements could impact access to funding;
availability and price of raw materials, components, and whole goods;
delays or disruptions in John Deere’s supply chain;
the ability to attract, develop, engage, and retain qualified personnel;
security breaches, cybersecurity attacks, technology failures, and other disruptions to the information technology infrastructure of John Deere or the Company and its products;
compliance with evolving U.S. and foreign laws, including economic sanctions, data privacy, environmental, anti-money laundering, and consumer finance laws and regulations;
legislation introduced or enacted that could affect John Deere’s business model and intellectual property, such as so-called right to repair or right to modify legislation;
investigations, claims, lawsuits, or other legal proceedings;
events that damage John Deere’s or the Company’s reputation or brand;
world grain stocks, available farm acres, soil conditions, harvest yields, prices for commodities and livestock, input costs, and availability of transport for crops; and
housing starts and supply, real estate and housing prices, levels of public and non-residential construction, and infrastructure investment.

Further information concerning the Company and its business, including factors that could materially affect the Company’s financial results, is included in the Company’s other filings with the SEC (including, but not limited to, the factors discussed in Item 1A. “Risk Factors” of the Company’s most recent Annual Report on Form 10-K and this Quarterly Report on Form 10-Q). There also may be other factors that we cannot anticipate or that are not described herein because we do not currently perceive them to be material.

The Company’s business is closely related to John Deere’s business. Further information, including factors that could materially affect the Company’s and John Deere’s financial results, is included in the most recent Deere & Company Annual Report on Form 10-K and Quarterly Report on Form 10-Q (including, but not limited to, the factors discussed in Item 1A., “Risk Factors” of the most recent Annual Report on Form 10-K and Quarterly Report on Form 10-Q) and other Deere & Company filings with the SEC.

Item 3.     Quantitative and Qualitative Disclosures About Market Risk.

Omitted pursuant to General Instruction H.

Item 4.     Controls and Procedures.

The Company’s principal executive officer and its principal financial officer have concluded that the Company’s disclosure controls and procedures (as defined in Rules 13a-15(e) and 15d-15(e) of the Securities Exchange Act of 1934, as amended (the Exchange Act)) were effective as of April 30, 2023, based on the evaluation of these controls and procedures required by Rule 13a-15(b) or 15d-15(b) of the Exchange Act. During the second quarter, there were no changes that have materially affected or are reasonably likely to materially affect the Company’s internal control over financial reporting.

PART II.  OTHER INFORMATION

Item 1.     Legal Proceedings.

The Company is subject to various unresolved legal actions which arise in the normal course of its business, the most prevalent of which relate to retail credit matters. The Company believes the reasonably possible range of losses for these unresolved legal actions would not have a material effect on its consolidated financial statements.

Item 1A.  Risk Factors.

See the Company’s most recently filed Annual Report on Form 10-K (Part I, Item 1A). There has been no

37

material change in this information. The risks described in the Annual Report on Form 10-K, and the “Forward-Looking Statements” in this report, are not the only risks faced by the Company. Additional risks and uncertainties may also materially affect the Company’s business, financial condition, or operating results. One should not consider the risk factors to be a complete discussion of risks, uncertainties, and assumptions.

Item 2.     Unregistered Sales of Equity Securities and Use of Proceeds.

Omitted pursuant to General Instruction H.

Item 3.     Defaults Upon Senior Securities.

Omitted pursuant to General Instruction H.

Item 4.     Mine Safety Disclosures.

Not applicable.

Item 5.     Other Information.

None.

38

Item 6.     Exhibits.

Certain instruments relating to long-term debt, constituting less than 10 percent of the registrant’s total assets, are not filed as exhibits herewith pursuant to Item 601(b)(4)(iii)(A) of Regulation S-K. The registrant will furnish copies of such instruments to the SEC upon request of the SEC.

3.1

Certificate of Incorporation, as amended (Exhibit 3.1 to Form 10-K of the registrant for the year ended October 31, 1999, Securities and Exchange Commission file number 1-6458*)

3.2

Bylaws, as amended (Exhibit 3.2 to Form 10-K of the registrant for the year ended October 31, 1999, Securities and Exchange Commission file number 1-6458*)

10.1

364-Day Credit Agreement, dated March 27, 2023, among the registrant, Deere & Company, John Deere Bank S.A., various financial institutions, JPMorgan Chase Bank, N.A., as Administrative Agent, Bank of America, N.A. and Citibank, N.A., as Co-Syndication Agents, and J.P. Morgan Securities LLC, as Sustainability Structuring Agent

10.2

2027 Credit Agreement, dated March 27, 2023, among the registrant, Deere & Company, John Deere Bank S.A., various financial institutions, JPMorgan Chase Bank, N.A., as Administrative Agent, Bank of America, N.A. and Citibank, N.A., as Co-Syndication Agents, and J.P. Morgan Securities LLC, as Sustainability Structuring Agent

10.3

2028 Credit Agreement, dated March 27, 2023, among the registrant, Deere & Company, John Deere Bank S.A., various financial institutions, JPMorgan Chase Bank, N.A., as Administrative Agent, Bank of America, N.A. and Citibank, N.A., as Co-Syndication Agents, and J.P. Morgan Securities LLC, as Sustainability Structuring Agent

10.4

Second Amended Agreement, dated March 27, 2023, between the registrant and Deere & Company relating to fixed charges ratio, ownership, and minimum net worth of the registrant

31.1

Rule 13a-14(a)/15d-14(a) Certification

31.2

Rule 13a-14(a)/15d-14(a) Certification

32

Section 1350 Certifications (furnished herewith)

101.SCH

Inline XBRL Taxonomy Extension Schema Document

101.CAL

Inline XBRL Taxonomy Extension Calculation Linkbase Document

101.DEF

Inline XBRL Taxonomy Extension Definition Linkbase Document

101.LAB

Inline XBRL Taxonomy Extension Label Linkbase Document

101.PRE

Inline XBRL Taxonomy Extension Presentation Linkbase Document

104

Cover Page Interactive Data File (formatted as Inline XBRL and contained in Exhibit 101)

*     Incorporated by reference.

39

SIGNATURES

Pursuant to the requirements of the Securities Exchange Act of 1934, the registrant has duly caused this report to be signed on its behalf by the undersigned thereunto duly authorized.

JOHN DEERE CAPITAL CORPORATION

Date:

June 1, 2023

By:

/s/ Joshua A. Jepsen

Joshua A. Jepsen

Senior Vice President and

Principal Financial Officer and

Principal Accounting Officer

40