UNITED STATES
SECURITIES AND EXCHANGE COMMISSION
WASHINGTON, D.C. 20549
FORM
(Mark One)
For the quarterly period ended
or
For the transition period from ____ to ____
Commission file no:
JOHN DEERE CAPITAL CORPORATION
(Exact name of registrant as specified in its charter)
|
| |
| ||
Telephone Number: ( |
Securities Registered Pursuant to Section 12(b) of the Act:
Title of each class | Trading symbol | Name of each exchange on which registered | ||
Indicate by check mark whether the registrant: (1) has filed all reports required to be filed by Section 13 or 15(d) of the Securities Exchange Act of 1934 during the preceding 12 months (or for such shorter period that the registrant was required to file such reports), and (2) has been subject to such filing requirements for the past 90 days.
Indicate by check mark whether the registrant has submitted electronically every Interactive Data File required to be submitted pursuant to Rule 405 of Regulation S-T (§232.405 of this chapter) during the preceding 12 months (or for such shorter period that the registrant was required to submit such files).
Indicate by check mark whether the registrant is a large accelerated filer, an accelerated filer, a non-accelerated filer, a smaller reporting company, or an emerging growth company. See the definitions of “large accelerated filer,” “accelerated filer,” “smaller reporting company,” and “emerging growth company” in Rule 12b-2 of the Exchange Act.
Large accelerated filer | ☐ | Accelerated filer | ☐ |
☒ | Smaller reporting company | ||
Emerging growth company |
If an emerging growth company, indicate by check mark if the registrant has elected not to use the extended transition period for complying with any new or revised financial accounting standards provided pursuant to Section 13(a) of the Exchange Act. ☐
Indicate by check mark whether the registrant is a shell company (as defined in Rule 12b-2 of the Exchange Act). Yes
At February 23, 2023
The registrant meets the conditions set forth in General Instruction H(1)(a) and (b) of Form 10-Q and is therefore filing this Form with certain reduced disclosures as permitted by those instructions.
PART I. FINANCIAL INFORMATION
Item 1. Financial Statements.
John Deere Capital Corporation and Subsidiaries
Statements of Consolidated Income
(Unaudited)
(in millions)
Three Months Ended |
| ||||||
January 29 | January 30 |
| |||||
| 2023 |
| 2022 |
| |||
Revenues | |||||||
Finance income earned on retail notes | $ | | $ | | |||
Lease revenues |
| |
| | |||
Revolving charge account income |
| |
| | |||
Finance income earned on wholesale receivables |
| |
| | |||
Other income |
| |
| | |||
Total revenues |
| |
| | |||
Expenses | |||||||
Interest expense |
| | | ||||
Operating expenses: | |||||||
Depreciation of equipment on operating leases |
| | | ||||
Administrative and operating expenses |
| | | ||||
Fees and interest paid to John Deere |
| | | ||||
Provision (credit) for credit losses | |
| ( | ||||
Total operating expenses |
| |
| | |||
Total expenses |
| |
| | |||
Income of consolidated group before income taxes |
| |
| | |||
Provision for income taxes |
| | | ||||
Income of consolidated group |
| |
| | |||
Equity in income of unconsolidated affiliate |
| | | ||||
Net income |
| |
| | |||
Less: Net loss attributable to noncontrolling interests | ( | ||||||
Net income attributable to the Company | $ | | $ | |
See Condensed Notes to Interim Consolidated Financial Statements.
2
John Deere Capital Corporation and Subsidiaries
Statements of Consolidated Comprehensive Income
(Unaudited)
(in millions)
Three Months Ended |
| ||||||
January 29 | January 30 |
| |||||
| 2023 |
| 2022 |
| |||
Net income | $ | | $ | | |||
Other comprehensive income (loss), net of income taxes | |||||||
Cumulative translation adjustment | | ( | |||||
Unrealized gain (loss) on derivatives | ( | | |||||
Unrealized gain (loss) on debt securities | | ( | |||||
Other comprehensive income (loss), net of income taxes |
| |
| ( | |||
Comprehensive income of consolidated group |
| |
| | |||
Less: Comprehensive loss attributable to noncontrolling interests | ( | ||||||
Comprehensive income attributable to the Company | $ | | $ | |
See Condensed Notes to Interim Consolidated Financial Statements.
3
John Deere Capital Corporation and Subsidiaries
Consolidated Balance Sheets
(Unaudited)
(in millions)
January 29 | October 30 | January 30 |
| |||||||
2023 | 2022 | 2022 |
| |||||||
Assets |
|
|
| |||||||
Cash and cash equivalents | $ | | $ | | $ | | ||||
Marketable securities | | | | |||||||
Receivables: | ||||||||||
Retail notes |
| |
| |
| | ||||
| |
| |
| | |||||
Revolving charge accounts |
| |
| |
| | ||||
Wholesale receivables |
| |
| |
| | ||||
Financing leases |
| |
| |
| | ||||
Total receivables |
| |
| |
| | ||||
Allowance for credit losses |
| ( |
| ( |
| ( | ||||
Total receivables – net |
| |
| |
| | ||||
Other receivables |
| |
| |
| | ||||
Receivables from John Deere |
| |
| |
| | ||||
Equipment on operating leases – net |
| |
| |
| | ||||
Notes receivable from John Deere | | | | |||||||
Investment in unconsolidated affiliate |
| |
| |
| | ||||
Deferred income taxes |
| |
| |
| | ||||
Other assets |
| |
| |
| | ||||
Total Assets | $ | | $ | | $ | | ||||
Liabilities and Stockholder’s Equity | ||||||||||
Short-term external borrowings: | ||||||||||
Commercial paper and other notes payable | $ | | $ | | $ | | ||||
Securitization borrowings |
| |
| |
| | ||||
Current maturities of long-term external borrowings |
| |
| |
| | ||||
Total short-term external borrowings |
| |
| |
| | ||||
Notes payable to John Deere |
| |
| |
| | ||||
Other payables to John Deere |
| |
| |
| | ||||
Accounts payable and accrued expenses |
| |
| |
| | ||||
Deposits held from dealers and merchants |
| |
| |
| | ||||
Deferred income taxes |
| |
| |
| | ||||
Long-term external borrowings |
| |
| |
| | ||||
Total liabilities |
| |
| |
| | ||||
Commitments and contingencies (Note 9) | ||||||||||
Stockholder’s equity: | ||||||||||
Common stock, without par value (issued and outstanding – |
| |
| |
| | ||||
Retained earnings |
| |
| |
| | ||||
Accumulated other comprehensive loss |
| ( |
| ( |
| ( | ||||
Total Company stockholder’s equity |
| |
| |
| | ||||
Noncontrolling interests |
| |
| |
| | ||||
Total stockholder’s equity |
| |
| |
| | ||||
Total Liabilities and Stockholder’s Equity | $ | | $ | | $ | |
See Condensed Notes to Interim Consolidated Financial Statements.
4
John Deere Capital Corporation and Subsidiaries
Statements of Consolidated Cash Flows
(Unaudited)
(in millions)
| Three Months Ended | ||||||
January 29 | January 30 | ||||||
| 2023 |
| 2022 |
| |||
Cash Flows from Operating Activities: | |||||||
Net income | $ | | $ | | |||
Adjustments to reconcile net income to net cash | |||||||
provided by operating activities: | |||||||
Provision (credit) for credit losses |
| | ( | ||||
Provision for depreciation and amortization |
| | | ||||
Credit for deferred income taxes |
| ( | ( | ||||
Change in accounts payable and accrued expenses |
| | ( | ||||
Change in accrued income taxes payable/receivable |
| | | ||||
Other |
| ( | ( | ||||
Net cash provided by operating activities |
| |
| | |||
Cash Flows from Investing Activities: | |||||||
Cost of receivables acquired (excluding wholesale) |
| ( | ( | ||||
Collections of receivables (excluding wholesale) |
| | | ||||
Increase in wholesale receivables – net |
| ( | ( | ||||
Cost of equipment on operating leases acquired |
| ( | ( | ||||
Proceeds from sales of equipment on operating leases |
| | | ||||
Cost of notes receivable acquired from John Deere | ( | ( | |||||
Collections of notes receivable from John Deere | | | |||||
Other |
| ( | ( | ||||
Net cash provided by (used for) investing activities |
| ( |
| | |||
Cash Flows from Financing Activities: | |||||||
Increase (decrease) in commercial paper and other notes payable – net |
| | ( | ||||
Decrease in securitization borrowings – net |
| ( | ( | ||||
Decrease in short-term borrowings with John Deere – net |
| ( | ( | ||||
Proceeds from issuance of long-term external borrowings |
| | | ||||
Payments of long-term external borrowings |
| ( | ( | ||||
Dividends paid |
| ( | |||||
Debt issuance costs |
| ( | ( | ||||
Net cash provided by (used for) financing activities |
| |
| ( | |||
Effect of exchange rate changes on cash, cash equivalents, and restricted cash |
| | ( | ||||
Net increase (decrease) in cash, cash equivalents, and restricted cash |
| |
| ( | |||
Cash, cash equivalents, and restricted cash at beginning of period |
| |
| | |||
Cash, cash equivalents, and restricted cash at end of period | $ | | $ | | |||
Components of cash, cash equivalents, and restricted cash: | |||||||
Cash and cash equivalents | $ | | $ | | |||
Restricted cash* | | | |||||
Total cash, cash equivalents, and restricted cash | $ | | $ | |
* Restricted cash is reported in other assets on the consolidated balance sheets and primarily relates to the securitization of receivables (see Note 5).
See Condensed Notes to Interim Consolidated Financial Statements.
5
John Deere Capital Corporation and Subsidiaries
Statements of Changes in Consolidated Stockholder’s Equity
For the Three Months Ended January 29, 2023 and January 30, 2022
(Unaudited)
(in millions)
Company Stockholder |
| |||||||||||||||
Accumulated | ||||||||||||||||
Total | Other | Non- | ||||||||||||||
Stockholder’s | Common | Retained | Comprehensive | Controlling | ||||||||||||
Equity | Stock | Earnings | Income (Loss) | Interests |
| |||||||||||
|
|
|
|
|
| |||||||||||
Balance October 31, 2021 | $ | | $ | | $ | | $ | ( | $ | | ||||||
Net income |
| |
| | ||||||||||||
Other comprehensive loss |
| ( | ( | |||||||||||||
Dividends declared |
| ( | ( | |||||||||||||
Balance January 30, 2022 | $ | | $ | | $ | | $ | ( | $ | | ||||||
Balance October 30, 2022 | $ | | $ | | $ | | $ | ( | $ | | ||||||
Net income (loss) |
| |
| | ( | |||||||||||
Other comprehensive income |
| | | |||||||||||||
Balance January 29, 2023 | $ | | $ | | $ | | $ | ( | $ | |
See Condensed Notes to Interim Consolidated Financial Statements.
6
John Deere Capital Corporation and Subsidiaries
Condensed Notes to Interim Consolidated Financial Statements
(Unaudited)
(1) Organization and Consolidation
John Deere Capital Corporation (Capital Corporation) and its subsidiaries are collectively called the Company. John Deere Financial Services, Inc. (JDFS), a wholly-owned finance holding subsidiary of Deere & Company, owns all of the outstanding common stock of Capital Corporation. The Company provides and administers financing for retail purchases of new equipment manufactured by Deere & Company’s production and precision agriculture operations, small agriculture and turf operations, and construction and forestry operations and used equipment taken in trade for this equipment. References to “agriculture and turf” include both production and precision agriculture and small agriculture and turf. The Company generally purchases retail installment sales and loan contracts (retail notes) from Deere & Company and its wholly-owned subsidiaries (collectively called John Deere). John Deere generally acquires these retail notes through independent John Deere retail dealers. The Company also purchases and finances a limited amount of non-John Deere retail notes. In addition, the Company finances and services revolving charge accounts, in most cases acquired from and offered through merchants in the agriculture and turf and construction and forestry markets (revolving charge accounts). The Company also provides wholesale financing to dealers of John Deere agriculture and turf equipment and construction and forestry equipment, primarily to finance inventories of equipment for those dealers (wholesale receivables). Further, the Company leases John Deere equipment and a limited amount of non-John Deere equipment to retail customers (financing and operating leases). The Company also offers credit enhanced international export financing to select customers and dealers, which primarily involves John Deere products. Retail notes, revolving charge accounts, and financing leases are collectively called “Customer Receivables.” Customer Receivables and wholesale receivables are collectively called “Receivables.” Receivables and equipment on operating leases are collectively called “Receivables and Leases.” The Company generally secures its Receivables, other than certain revolving charge accounts, by retaining as collateral security in the goods associated with those Receivables or with the use of other collateral.
The Company uses a 52/53 week fiscal year with quarters ending on the last Sunday in the reporting period. The first quarter ends for fiscal years 2023 and 2022 were January 29, 2023 and January 30, 2022, respectively. Both periods contained
The Company is the primary beneficiary of and consolidates certain variable interest entities (VIEs) that are special purpose entities (SPEs) related to the securitization of receivables. See Note 5 for more information on these SPEs.
(2) Summary of Significant Accounting Policies and New Accounting Standards
Quarterly Financial Statements
The Company has prepared its interim consolidated financial statements, without audit, pursuant to the rules and regulations of the U.S. Securities and Exchange Commission (SEC). Certain information and footnote disclosures normally included in annual financial statements prepared in accordance with accounting principles generally accepted in the U.S. have been condensed or omitted as permitted by such rules and regulations. All normal recurring adjustments have been included. Management believes the disclosures are adequate to present fairly the financial position, results of operations, and cash flows at the dates and for the periods presented. It is suggested these interim consolidated financial statements be read in conjunction with the consolidated financial statements and the notes thereto appearing in the Company’s latest Annual Report on Form 10-K. Results for interim periods are not necessarily indicative of those to be expected for the fiscal year.
7
Use of Estimates in Financial Statements
The preparation of financial statements in conformity with accounting principles generally accepted in the U.S. requires management to make estimates and assumptions that affect the reported amounts and related disclosures. Actual results could differ from those estimates.
New Accounting Standards
The Company closely monitors all Accounting Standard Updates (ASUs) issued by the Financial Accounting Standards Board (FASB) and other authoritative guidance. ASUs adopted in 2023 did not have a material impact on the Company’s financial statements.
In March 2022, the FASB issued
(3) Other Comprehensive Income Items
The after-tax components of accumulated other comprehensive income (loss) were as follows (in millions of dollars):
January 29 | October 30 | January 30 | |||||||
2023 | 2022 | 2022 | |||||||
Cumulative translation adjustment | $ | ( | $ | ( | $ | ( | |||
Unrealized gain on derivatives | | | | ||||||
Unrealized loss on debt securities | ( | ( | ( | ||||||
Total accumulated other comprehensive income (loss) | $ | ( | $ | ( | $ | ( |
8
Amounts recorded in and reclassifications out of other comprehensive income (loss), and the income tax effects, were as follows (in millions of dollars):
Before | Tax | After |
| |||||||
Tax | (Expense) | Tax |
| |||||||
Three Months Ended January 29, 2023 | Amount | Credit | Amount |
| ||||||
Cumulative translation adjustment | $ | | $ | | ||||||
Unrealized gain (loss) on derivatives: | ||||||||||
Unrealized hedging gain (loss) |
| ( | $ | |
| ( | ||||
Reclassification of realized (gain) loss to: | ||||||||||
Interest rate contracts – Interest expense |
| ( | | ( | ||||||
Net unrealized gain (loss) on derivatives |
| ( |
| |
| ( | ||||
Unrealized gain (loss) on debt securities: | ||||||||||
Unrealized holding gain (loss) | | ( | | |||||||
Total other comprehensive income (loss) | $ | | $ | | $ | | ||||
Three Months Ended January 30, 2022 | ||||||||||
Cumulative translation adjustment | $ | ( | $ | ( | ||||||
Unrealized gain (loss) on derivatives: | ||||||||||
Unrealized hedging gain (loss) |
| | $ | ( |
| | ||||
Reclassification of realized (gain) loss to: | ||||||||||
Interest rate contracts – Interest expense |
| | ( |
| | |||||
Net unrealized gain (loss) on derivatives |
| |
| ( |
| | ||||
Unrealized gain (loss) on debt securities: | ||||||||||
Unrealized holding gain (loss) | ( | | ( | |||||||
Total other comprehensive income (loss) | $ | ( | $ | ( | $ | ( |
(4) Receivables
The Company monitors the credit quality of Receivables based on delinquency status. Past due balances of Receivables still accruing finance income represent the total balance held (principal plus accrued interest) with any payment amounts
Receivable balances are written off to the allowance for credit losses when, in the judgment of management, they are considered uncollectible. Generally, when retail notes and financing lease accounts are
9
The credit quality analysis of Customer Receivables by year of origination was as follows (in millions of dollars):
January 29, 2023 | ||||||||||||||||||||||||
2023 | 2022 | 2021 | 2020 | 2019 | Prior Years | Revolving Charge Accounts | Total | |||||||||||||||||
Customer Receivables: |
|
|
|
|
|
|
|
| ||||||||||||||||
Agriculture and turf | ||||||||||||||||||||||||
Current | $ | | $ | | $ | | $ | | $ | | $ | | $ | | $ | | ||||||||
30-59 days past due | | | | | | | | | ||||||||||||||||
60-89 days past due | | | | | | | | | ||||||||||||||||
90+ days past due | | | | | | | ||||||||||||||||||
Non-performing | | | | | | | | | ||||||||||||||||
Construction and forestry | ||||||||||||||||||||||||
Current | | | | | | | | | ||||||||||||||||
30-59 days past due | | | | | | | | | ||||||||||||||||
60-89 days past due | | | | | | | | | ||||||||||||||||
90+ days past due | | | | | | |||||||||||||||||||
Non-performing | | | | | | | | |||||||||||||||||
Total Customer Receivables | $ | | $ | | $ | | $ | | $ | | $ | | $ | | $ | |
October 30, 2022 | ||||||||||||||||||||||||
2022 | 2021 | 2020 | 2019 | 2018 | Prior Years | Revolving Charge Accounts | Total | |||||||||||||||||
Customer Receivables: |
|
|
|
|
|
|
|
| ||||||||||||||||
Agriculture and turf | ||||||||||||||||||||||||
Current | $ | | $ | | $ | | $ | | $ | | $ | | $ | | $ | | ||||||||
30-59 days past due | | | | | | | | | ||||||||||||||||
60-89 days past due | | | | | | | | | ||||||||||||||||
90+ days past due | | | | | ||||||||||||||||||||
Non-performing | | | | | | | | | ||||||||||||||||
Construction and forestry | ||||||||||||||||||||||||
Current | | | | | | | | | ||||||||||||||||
30-59 days past due | | | | | | | | | ||||||||||||||||
60-89 days past due | | | | | | | | | ||||||||||||||||
90+ days past due | | | | | ||||||||||||||||||||
Non-performing | | | | | | | | | ||||||||||||||||
Total Customer Receivables | $ | | $ | | $ | | $ | | $ | | $ | | $ | | $ | |
10
January 30, 2022 | ||||||||||||||||||||||||
2022 | 2021 | 2020 | 2019 | 2018 | Prior Years | Revolving Charge Accounts | Total | |||||||||||||||||
Customer Receivables: |
|
|
|
|
|
|
|
| ||||||||||||||||
Agriculture and turf | ||||||||||||||||||||||||
Current | $ | | $ | | $ | | $ | | $ | | $ | | $ | | $ | | ||||||||
30-59 days past due | | | | | | | | | ||||||||||||||||
60-89 days past due | | | | | | | | | ||||||||||||||||
90+ days past due | | | | | | |||||||||||||||||||
Non-performing | | | | | | | | | ||||||||||||||||
Construction and forestry | ||||||||||||||||||||||||
Current | | | | | | | | | ||||||||||||||||
30-59 days past due | | | | | | | | | ||||||||||||||||
60-89 days past due | | | | | | | | |||||||||||||||||
90+ days past due | | | | | ||||||||||||||||||||
Non-performing | | | | | | | | | ||||||||||||||||
Total Customer Receivables | $ | | $ | | $ | | $ | | $ | | $ | | $ | | $ | |
The credit quality analysis of wholesale receivables by year of origination was as follows (in millions of dollars):
January 29, 2023 | ||||||||||||||||||||||||
2023 | 2022 | 2021 | 2020 | 2019 | Prior Years | Revolving | Total | |||||||||||||||||
Wholesale receivables: |
|
|
|
|
|
|
|
| ||||||||||||||||
Agriculture and turf | ||||||||||||||||||||||||
Current | $ | | $ | | $ | | $ | | $ | | $ | | $ | | $ | | ||||||||
30+ days past due | | | | |||||||||||||||||||||
Non-performing | | | ||||||||||||||||||||||
Construction and forestry | ||||||||||||||||||||||||
Current | | | | | | | | | ||||||||||||||||
30+ days past due | | | ||||||||||||||||||||||
Non-performing | ||||||||||||||||||||||||
Total wholesale receivables | $ | | $ | | $ | | $ | | $ | | $ | | $ | | $ | |
October 30, 2022 | ||||||||||||||||||||||||
2022 | 2021 | 2020 | 2019 | 2018 | Prior Years | Revolving | Total | |||||||||||||||||
Wholesale receivables: |
|
|
|
|
|
|
|
| ||||||||||||||||
Agriculture and turf | ||||||||||||||||||||||||
Current | $ | | $ | | $ | | $ | | $ | | $ | | $ | | $ | | ||||||||
30+ days past due | | | | |||||||||||||||||||||
Non-performing | | | ||||||||||||||||||||||
Construction and forestry | ||||||||||||||||||||||||
Current | | | | | | | | |||||||||||||||||
30+ days past due | | | ||||||||||||||||||||||
Non-performing | ||||||||||||||||||||||||
Total wholesale receivables | $ | | $ | | $ | | $ | | $ | | $ | | $ | | $ | |
11
January 30, 2022 | ||||||||||||||||||||||||
2022 | 2021 | 2020 | 2019 | 2018 | Prior Years | Revolving | Total | |||||||||||||||||
Wholesale receivables: |
|
|
|
|
|
|
|
| ||||||||||||||||
Agriculture and turf | ||||||||||||||||||||||||
Current | $ | | $ | | $ | | $ | | $ | | $ | | $ | | $ | | ||||||||
30+ days past due | | | ||||||||||||||||||||||
Non-performing | | | ||||||||||||||||||||||
Construction and forestry | ||||||||||||||||||||||||
Current | | | | | | | | |||||||||||||||||
30+ days past due | | | ||||||||||||||||||||||
Non-performing | ||||||||||||||||||||||||
Total wholesale receivables | $ | | $ | | $ | | $ | | $ | | $ | | $ | | $ | |
Allowance for Credit Losses
The allowance for credit losses is an estimate of the credit losses expected over the life of the Company’s Receivable portfolio. The Company measures expected credit losses on a collective basis when similar risk characteristics exist. Risk characteristics considered by the Company include product category, market, geography, credit risk, and remaining duration. Receivables that do not share risk characteristics with other receivables in the portfolio are evaluated on an individual basis. Non-performing Receivables are included in the estimate of expected credit losses.
Recoveries from freestanding credit enhancements, such as dealer deposits, and certain credit insurance contracts are not included in the estimate of expected credit losses. Recoveries from dealer deposits are recognized in other income on the statements of consolidated income when the dealer’s withholding account is charged. During the three months ended January 29, 2023 and January 30, 2022, recoveries from freestanding credit enhancements recorded in other income were $
An analysis of the allowance for credit losses and investment in Receivables during 2023 was as follows (in millions of dollars):
Three Months Ended |
| ||||||||||||
January 29, 2023 |
| ||||||||||||
Retail Notes | Revolving |
| |||||||||||
& Financing | Charge | Wholesale | Total |
| |||||||||
Leases | Accounts | Receivables | Receivables |
| |||||||||
Allowance: | |||||||||||||
Beginning of period balance | $ | | $ | | $ | | $ | | |||||
Provision (credit) for credit losses* |
| | ( | ( | | ||||||||
Write-offs |
| ( | ( | ( | ( | ||||||||
Recoveries |
| | | | | ||||||||
Translation adjustments |
| | ( | | |||||||||
End of period balance | $ | | $ | | $ | | $ | | |||||
Receivables: | |||||||||||||
End of period balance | $ | | $ | | $ | | $ | |
*Excludes provision for credit losses on unfunded commitments of $
The allowance for credit losses decreased $
12
agricultural market. The allowance for credit losses on retail notes and financing leases was relatively flat during the first quarter of 2023, as the impacts of favorable agricultural conditions were offset by higher expected losses on turf customer accounts. The Company continues to monitor the economy as part of the allowance setting process, including potential impacts of inflation and interest rates, among other factors, and qualitative adjustments to the allowance are incorporated as necessary.
An analysis of the allowance for credit losses and investment in Receivables during 2022 was as follows (in millions of dollars):
Three Months Ended |
| ||||||||||||
January 30, 2022 |
| ||||||||||||
Retail Notes | Revolving |
| |||||||||||
& Financing | Charge | Wholesale | Total |
| |||||||||
Leases | Accounts | Receivables | Receivables |
| |||||||||
Allowance: | |||||||||||||
Beginning of period balance | $ | | $ | | $ | | $ | | |||||
Provision (credit) for credit losses* |
| | ( | | ( | ||||||||
Write-offs |
| ( | ( | ( | |||||||||
Recoveries |
| | | | |||||||||
Translation adjustments |
| ( | ( | ( | |||||||||
End of period balance | $ | | $ | | $ | | $ | | |||||
Receivables: | |||||||||||||
End of period balance | $ | | $ | | $ | | $ | |
*Excludes provision for credit losses on unfunded commitments of $
Troubled Debt Restructuring
Three Months Ended | |||||||||||||
January 29 | January 30 | ||||||||||||
2023 | 2022 | ||||||||||||
Number of receivable contracts | | |
| ||||||||||
Pre-modification balance | $ | | $ | | |||||||||
Post-modification balance | | |
During the same periods as the table above, there were
(5) Securitization of Receivables
As a part of its overall funding strategy, the Company periodically transfers certain Receivables (retail notes) into VIEs that are SPEs, or non-VIE banking operations, as part of its asset-backed securities programs (securitizations). The structure of these transactions is such that the transfer of the retail notes does not meet the accounting criteria for sales of receivables, and is, therefore, accounted for as a secured borrowing. SPEs utilized in securitizations of retail notes differ from other entities included in the Company’s consolidated statements
13
because the assets they hold are legally isolated. Use of the assets held by the SPEs or the non-VIEs is restricted by terms of the documents governing the securitization transactions.
The components of consolidated restricted assets, secured borrowings, and other liabilities related to secured borrowings in securitization transactions were as follows (in millions of dollars):
January 29 | October 30 | January 30 |
| |||||||
2023 | 2022 | 2022 |
| |||||||
$ | | $ | | $ | | |||||
Allowance for credit losses |
| ( |
| ( |
| ( | ||||
Other assets (primarily restricted cash) |
| |
| |
| | ||||
Total restricted securitized assets | $ | | $ | | $ | | ||||
Securitization borrowings | $ | | $ | | $ | | ||||
Accrued interest on borrowings |
| |
| |
| | ||||
Total liabilities related to restricted securitized assets | $ | | $ | | $ | |
(6) Leases
The Company leases John Deere equipment and a limited amount of non-John Deere equipment to retail customers through sales-type, direct financing, and operating leases. Sales-type and direct financing leases are reported in financing leases on the consolidated balance sheets. Operating leases are reported in equipment on operating leases – net on the consolidated balance sheets.
Lease revenues earned by the Company were as follows (in millions of dollars):
Three Months Ended | ||||||
January 29 | January 30 | |||||
2023 | 2022 | |||||
Sales-type and direct financing lease revenues | $ | | $ | | ||
Operating lease revenues | | | ||||
Variable lease revenues |
| |
| | ||
Total lease revenues | $ | | $ | |
Variable lease revenues reported above primarily relate to separately invoiced property taxes on leased equipment in certain markets, late fees, and excess use and damage fees. Excess use and damage fees are reported in other income on the statements of consolidated income and were $
The cost of equipment on operating leases by market was as follows (in millions of dollars):
January 29 | October 30 | January 30 | |||||||
2023 | 2022 |
| 2022 | ||||||
Agriculture and turf | $ | | $ | | $ | | |||
Construction and forestry | |
| | | |||||
Total | | | | ||||||
Accumulated depreciation |
| ( | ( | ( | |||||
Equipment on operating leases - net | $ | | $ | | $ | |
Total operating lease residual values at January 29, 2023, October 30, 2022, and January 30, 2022 were $
14
The Company discusses with lessees and dealers options to purchase the equipment or extend the lease prior to operating lease maturity. Equipment returned to the Company upon termination of leases is remarketed by the Company. The matured operating lease inventory balances at January 29, 2023, October 30, 2022, and January 30, 2022 were $
(7) Notes Receivable from and Payable to John Deere
The Company provides loans to and holds other receivables from affiliated companies. The loan agreements mature over the next
The Company had notes receivable from John Deere with the following affiliated companies as follows (in millions of dollars):
January 29 | October 30 | January 30 | ||||||||
2023 | 2022 | 2022 | ||||||||
Limited Liability Company John Deere Financial | $ | | ||||||||
Banco John Deere S.A. | $ | | $ | |
| | ||||
John Deere Agricultural Holdings, Inc. |
| | ||||||||
Total Notes Receivable from John Deere | $ | | $ | | $ | |
The Company also obtains funding from affiliated companies. At January 29, 2023, October 30, 2022, and January 30, 2022, the Company had notes payable to John Deere of $
(8) Long-Term External Borrowings
Long-term external borrowings of the Company at January 29, 2023, October 30, 2022, and January 30, 2022 consisted of the following (in millions of dollars):
| January 29 | October 30 | January 30 | |||||||
| 2023 | 2022 | 2022 | |||||||
Senior Debt: |
| |||||||||
Medium-term notes |
| $ | | $ | | $ | | |||
Other notes | | | | |||||||
Total senior debt | | | | |||||||
Unamortized debt discount and debt issuance costs | ( | ( | ( | |||||||
Total | $ | | $ | | $ | |
15
(9) Commitments and Contingencies
At January 29, 2023, John Deere Financial Inc., the John Deere finance subsidiary in Canada, had $
Capital Corporation has a variable interest in John Deere Canada Funding Inc. (JDCFI), a wholly-owned subsidiary of John Deere Financial Inc., which was created as a VIE to issue debt in public markets to fund the operations of affiliated companies in Canada. Capital Corporation has a variable interest in JDCFI because it provides guarantees for all debt issued by JDCFI, however it does not consolidate JDCFI because it does not have the power to direct the activities that most significantly impact JDCFI’s economic performance. Capital Corporation has
The Company has commitments to extend credit to customers and John Deere dealers through lines of credit and other pre-approved credit arrangements. The Company applies the same credit policies and approval process for these commitments to extend credit as it does for its Receivables. Collateral is not required for these commitments, but if credit is extended, collateral may be required upon funding. At January 29, 2023, the amount of unused commitments to extend credit to customers and John Deere dealers was $
At January 29, 2023, the Company had restricted other assets associated with borrowings related to securitizations (see Note 5). Excluding the securitization programs, the remaining balance of restricted other assets was not material as of January 29, 2023.
The Company is subject to various unresolved legal actions which arise in the normal course of its business, the most prevalent of which relate to retail credit matters. The Company believes the reasonably possible range of losses for these unresolved legal actions would not have a material effect on its consolidated financial statements.
(10) Fair Value Measurements
The fair values of financial instruments that do not approximate the carrying values were as follows (in millions of dollars):
January 29, 2023 | October 30, 2022 | January 30, 2022 |
| ||||||||||||||||
Carrying | Fair | Carrying | Fair | Carrying | Fair |
| |||||||||||||
Value | Value | Value | Value | Value | Value |
| |||||||||||||
Receivables financed – net |
| $ | | $ | |
| $ | | $ | |
| $ | |
| $ | | |||
Retail notes securitized – net |
| |
| |
| |
| |
| |
| | |||||||
Securitization borrowings |
| |
| |
| |
| |
| |
| | |||||||
Current maturities of long- |
| |
| |
| |
| |
| |
| | |||||||
Long-term external |
| |
| |
| |
| |
| |
| |
16
Fair value measurements above were Level 3 for all Receivables and Level 2 for all borrowings.
Fair values of Receivables that were issued long-term were based on the discounted values of their related cash flows at interest rates currently being offered by the Company for similar Receivables. The fair values of the remaining Receivables approximated the carrying amounts.
Fair values of long-term external borrowings and securitization borrowings were based on current market quotes for identical or similar borrowings and credit risk, or on the discounted values of their related cash flows at current market interest rates. Certain long-term external borrowings have been swapped to current variable interest rates. The carrying values of these long-term external borrowings include adjustments related to fair value hedges.
Assets and liabilities measured at fair value on a recurring basis were as follows (in millions of dollars):
| January 29 |
| October 30 |
| January 30 |
| ||||
2023 | 2022 | 2022 |
| |||||||
Marketable securities |
|
|
| |||||||
International debt securities | $ | | $ | | $ | | ||||
Receivables from John Deere | ||||||||||
Derivatives | | | | |||||||
Other assets | ||||||||||
Derivatives | |
| |
| | |||||
Total assets | $ | | $ | | $ | | ||||
Other payables to John Deere | ||||||||||
Derivatives | $ | | $ | | $ | | ||||
Accounts payable and accrued expenses | ||||||||||
Derivatives | |
| |
| | |||||
Total liabilities | $ | | $ | | $ | |
All fair value measurements in the table above were Level 2. Excluded from the table above were the Company’s cash equivalents, which were carried at cost that approximates fair value. The cash equivalents consist primarily of time deposits and money market funds.
The international debt securities mature over the next eight years. At January 29, 2023, the amortized cost basis and fair value of these available-for-sale debt securities were $
There were no assets or liabilities measured at fair value on a nonrecurring basis, other than Receivables with specific allowances which were not material, during each of the periods ended January 29, 2023, October 30, 2022, and January 30, 2022.
The following is a description of the valuation methodologies the Company uses to measure certain balance sheet items at fair value:
Marketable securities – The international debt securities are valued using quoted prices for identical assets in inactive markets.
Derivatives – The Company’s derivative financial instruments consist of interest rate contracts (swaps and caps), foreign currency exchange contracts (futures, forwards, and swaps), and cross-currency interest rate contracts (swaps). The portfolio is valued based on an income approach (discounted cash flow) using market observable inputs, including swap curves and both forward and spot exchange rates for currencies.
Receivables – Specific reserve impairments are based on the fair value of the collateral, which is measured using a market approach (appraisal values or realizable values).
17
(11) Derivative Instruments
The Company’s policy is to execute derivative transactions to manage exposures arising in the normal course of business and not for the purpose of creating speculative positions or trading. The Company manages the relationship of the types and amounts of its funding sources to its Receivable and Lease portfolios in an effort to diminish risk due to interest rate and foreign currency fluctuations, while responding to favorable financing opportunities. The Company also has foreign currency exposures at some of its foreign and domestic operations related to financing in currencies other than the functional currencies.
All derivatives are recorded at fair value on the consolidated balance sheets. Cash collateral received or paid is not offset against the derivative fair values on the consolidated balance sheets. The cash flows from the derivative contracts are recorded in operating activities in the statements of consolidated cash flows. Each derivative is designated as a cash flow hedge, a fair value hedge, or remains undesignated. All designated hedges are formally documented as to the relationship with the hedged item as well as the risk-management strategy. Both at inception and on an ongoing basis the hedging instrument is assessed as to its effectiveness. If and when a derivative is determined not to be highly effective as a hedge, the underlying hedged transaction is no longer likely to occur, the hedge designation is removed, or the derivative is terminated, hedge accounting is discontinued.
Cash Flow Hedges
Certain interest rate contracts (swaps) were designated as hedges of future cash flows from borrowings. The total notional amounts of the receive-variable/pay-fixed interest rate contracts at January 29, 2023, October 30, 2022, and January 30, 2022 were $
The amount of gain recorded in OCI at January 29, 2023 that is expected to be reclassified to interest expense in the next twelve months if interest rates remain unchanged is $
Fair Value Hedges
Certain interest rate contracts (swaps) were designated as fair value hedges of borrowings. The total notional amounts of the receive-fixed/pay-variable interest rate contracts at January 29, 2023, October 30, 2022, and January 30, 2022 were $
18
The amounts recorded in the consolidated balance sheets related to borrowings designated in fair value hedging relationships were as follows (in millions of dollars). Fair value hedging adjustments are included in the carrying amount of the hedged item.
Active Hedging Relationships | Discontinued Hedging Relationships | ||||||||||||
Carrying | Cumulative | Carrying Amount | Cumulative | ||||||||||
Amount of | Fair Value | of Formerly | Fair Value | ||||||||||
January 29, 2023 | Hedged Item | Hedging Adjustment | Hedged Item | Hedging Adjustment | |||||||||
Current maturities of long-term external borrowings | $ | | $ | | |||||||||
Long-term external borrowings | $ | | $ | ( | | ( | |||||||
October 30, 2022 | |||||||||||||
Current maturities of long-term external borrowings | $ | | $ | | |||||||||
Long-term external borrowings | $ | | $ | ( | | ( | |||||||
January 30, 2022 | |||||||||||||
Current maturities of long-term external borrowings | $ | | $ | | $ | | $ | | |||||
Long-term external borrowings | | ( | | |
Derivatives Not Designated as Hedging Instruments
The Company has certain interest rate contracts (swaps and caps), foreign currency exchange contracts (futures, forwards, and swaps), and cross-currency interest rate contracts (swaps), which were not formally designated as hedges. These derivatives were held as economic hedges for underlying interest rate or foreign currency exposures for certain borrowings. The total notional amounts of the interest rate swaps at January 29, 2023, October 30, 2022, and January 30, 2022 were $
19
Fair values of derivative instruments in the consolidated balance sheets were as follows (in millions of dollars):
| January 29 |
| October 30 |
| January 30 |
| ||||
2023 | 2022 | 2022 |
| |||||||
Receivables from John Deere | ||||||||||
Designated as hedging instruments: | ||||||||||
Interest rate contracts | $ | | $ | | $ | | ||||
Not designated as hedging instruments: | ||||||||||
Interest rate contracts |
| |
| |
| | ||||
Cross-currency interest rate contracts |
| |
| |
| | ||||
Total not designated |
| |
| |
| | ||||
Other Assets | ||||||||||
Not designated as hedging instruments: | ||||||||||
Foreign currency exchange contracts |
| |
| |
| | ||||
Total derivative assets | $ | | $ | | $ | | ||||
Other Payables to John Deere | ||||||||||
Designated as hedging instruments: | ||||||||||
Interest rate contracts | $ | | $ | | $ | | ||||
Not designated as hedging instruments: | ||||||||||
Interest rate contracts |
| |
| |
| | ||||
Cross-currency interest rate contracts | | |
| | ||||||
Total not designated |
| |
| |
| | ||||
Accounts Payable and Accrued Expenses | ||||||||||
Not designated as hedging instruments: | ||||||||||
Foreign currency exchange contracts |
| |
| |
| | ||||
Total derivative liabilities | $ | | $ | | $ | |
20
The classification and gains (losses), including accrued interest expense related to derivative instruments on the statements of consolidated income consisted of the following (in millions of dollars):
Three Months Ended |
| ||||||
January 29 | January 30 |
| |||||
| 2023 |
| 2022 |
| |||
Fair Value Hedges | |||||||
Interest rate contracts - Interest expense |
| $ | | $ | ( | ||
Cash Flow Hedges | |||||||
Recognized in OCI: | |||||||
Interest rate contracts - OCI (pretax) |
| $ | ( | $ | | ||
Reclassified from OCI: | |||||||
Interest rate contracts - Interest expense |
|
| |
| ( | ||
Not Designated as Hedges | |||||||
Interest rate contracts - Interest expense * |
| $ | ( | $ | ( | ||
Foreign currency exchange contracts - Administrative and operating expenses * |
| ( | | ||||
Total not designated | $ | ( | $ | |
* Includes interest and foreign currency exchange gains (losses) from cross-currency interest rate contracts.
Included in the table above are interest expense and administrative and operating expense amounts the Company incurred on derivatives transacted with John Deere. The amounts the Company recognized on these affiliate party transactions for the three months ended January 29, 2023 and January 30, 2022 were a gain of $
Counterparty Risk and Collateral
Derivative instruments are subject to significant concentrations of credit risk to the banking sector. The Company manages individual unrelated external counterparty exposure by setting limits that consider the credit rating of the unrelated external counterparty, the credit default swap spread of the counterparty, and other financial commitments and exposures between the Company and the unrelated external counterparty banks. All interest rate derivatives are transacted under International Swaps and Derivatives Association (ISDA) documentation. Each master agreement permits the net settlement of amounts owed in the event of default or termination. None of the Company’s derivative agreements contain credit-risk-related contingent features.
The Company’s outstanding derivatives transactions are with both unrelated external counterparties and with John Deere. For derivatives transactions with John Deere, the Company utilizes a centralized hedging structure in which John Deere enters into a derivative transaction with an unrelated external counterparty and simultaneously enters into a derivative transaction with the Company. Except for collateral provisions, the terms of the transaction between the Company and John Deere are identical to the terms of the transaction between John Deere and its unrelated external counterparty.
The Company has ISDA agreements with John Deere that permit the net settlement of amounts owed between counterparties in the event of early termination. In addition, the Company has a loss sharing agreement with John Deere in which the Company has agreed to absorb any losses and expenses John Deere incurs if an unrelated external counterparty fails to meet its obligations on a derivative transaction that John Deere entered into to manage exposures of the Company. The loss sharing agreement did not increase the maximum amount of loss that the Company would incur, after considering collateral received and netting arrangements, as of January 29, 2023, October 30, 2022, and January 30, 2022.
21
Derivatives are recorded without offsetting for netting arrangements or collateral. The impact on the derivative assets and liabilities for external derivatives and those with John Deere related to netting arrangements and any collateral received or paid were as follows (in millions of dollars):
January 29, 2023 |
| ||||||||||||
Derivatives: | Gross Amounts | Netting | Collateral | Net |
| ||||||||
Assets |
|
|
|
|
|
|
|
| |||||
External | $ | | $ | | |||||||||
John Deere |
| | $ | ( |
| | |||||||
Liabilities | |||||||||||||
External |
| |
|
| | ||||||||
John Deere |
| |
| ( |
|
| |
October 30, 2022 |
| ||||||||||||
Derivatives: | Gross Amounts | Netting | Collateral | Net |
| ||||||||
Assets |
|
|
|
|
|
|
|
| |||||
External | $ | | $ | ( |
| $ | | ||||||
John Deere |
| |
| ( |
|
| | ||||||
Liabilities | |||||||||||||
External |
| |
| ( |
|
| | ||||||
John Deere |
| |
| ( |
|
| |
January 30, 2022 |
|
|
|
|
|
| |||||||
Derivatives: | Gross Amounts | Netting | Collateral | Net |
| ||||||||
Assets |
|
|
| ||||||||||
External | $ | | $ | ( | $ | | |||||||
John Deere |
| | ( |
| | ||||||||
Liabilities | |||||||||||||
External |
| |
| ( |
| ||||||||
John Deere |
| |
| ( |
|
| |
(12) Subsequent Events
On February 13, 2023, Deere & Company increased its investment in JDFS by $
In February 2023, the Company entered into two retail note securitization transactions. The first transaction resulted in $
22
Item 2. Management’s Discussion and Analysis of Financial Condition and Results of Operations.
Results of Operations
Overview
Organization
The Company primarily generates revenues and cash by financing John Deere dealers’ sales and leases of new and used production and precision agriculture, small agriculture and turf, and construction and forestry equipment. In addition, the Company also provides wholesale financing to dealers of the foregoing equipment and finances retail revolving charge accounts.
Smart Industrial Operating Model and Leap Ambitions
John Deere’s Smart Industrial operating model is focused on making significant investments in strengthening its capabilities in digital, automation, autonomy, and alternative propulsion technologies. These technologies are intended to increase worksite efficiency, improve yields, lower input costs, and ease labor constraints. John Deere’s Leap Ambitions are goals designed to boost economic value and sustainability for John Deere’s customers. As an enabling business, the Company is fully integrated with John Deere’s Smart Industrial operating model and is focused on providing financial solutions to help John Deere achieve its Leap Ambitions. John Deere and the Company anticipate opportunities in this area, as John Deere, the Company, and their customers have a vested interest in sustainable practices.
In February 2023, John Deere released its 2022 Sustainability Report, available at JohnDeere.com/sustainability. This report identifies important progress on John Deere’s Leap Ambitions in fiscal year 2022. The information in John Deere’s 2022 Sustainability Report is not incorporated by reference into, and does not form a part of, this Form 10-Q.
Trends and Economic Conditions
The Company’s volume of Receivables and Leases is largely dependent upon the level of retail sales and leases of John Deere products. The level of John Deere retail sales and leases is responsive to a variety of economic, financial, climatic, legislative, and other factors that influence supply and demand for its products.
Industry Trends for Fiscal Year 2023
Industry sales of large agricultural machinery in the U.S. and Canada for 2023 are forecasted to increase 5 to 10 percent compared to 2022. Industry sales of small agricultural and turf equipment in the U.S. and Canada are expected to be down about 5 percent in 2023. Industry sales of agricultural machinery in Europe are forecasted to be flat to up 5 percent, while South American industry sales of tractors and combines are expected to be flat to up 5 percent in 2023. Asia industry sales are forecasted to be down moderately in 2023. On an industry basis, North American construction equipment and compact construction equipment sales are both expected to be flat to up 5 percent in 2023. Global forestry and global roadbuilding industry sales are each expected to be flat.
John Deere Trends
Customers’ demand for integration of technology into equipment is a market trend underlying John Deere’s Smart Industrial operating model and Leap Ambitions framework. Customers have sought to improve profitability, productivity, and sustainability through technology. John Deere’s approach to technology involves hardware and software, guidance, connectivity and digital solutions, automation and machine intelligence, autonomy, and alternative propulsion technologies. This technology is incorporated into products within each of John Deere’s operating segments. Customers continue to adopt technology integrated in the John Deere portfolio of “smart” machines, systems, and solutions. The Company expects this trend to persist for the foreseeable future.
Demand for John Deere’s equipment remains strong, as order books are full through a majority of 2023. Agricultural fundamentals are expected to remain solid into 2023, and retail demand will comprise most of 2023
23
sales. The North American retail customer fleet age of combines and large tractors remains above average, and dealer inventories are historically low due to the manufacturing and supply chain constraints over the past few years. John Deere expects the replenishment of dealer stock inventory to occur in 2024. Crop prices remain favorable to John Deere customers in part due to low stock-to-use ratios for key grains. John Deere expects to sell more large agricultural equipment in 2023 than 2022 in North America, Europe, and South America. Demand for small agricultural equipment remains stable, while turf and utility equipment product sales are expected to be lower due to the overall U.S. economic conditions. Construction equipment markets are forecasted to be steady. Rental fleets replenishment, the energy industry, and U.S. infrastructure spend are expected to offset moderation in residential home construction. Roadbuilding demand remains strongest in the U.S., largely offset by softening demand in Europe and parts of Asia.
John Deere experienced supply chain disruptions in 2022, which continued into 2023. Supply chain disruptions impacted many aspects of John Deere’s business, including parts availability, increased production costs, and higher inventory levels. Past due deliveries from suppliers were at elevated levels during 2022. Although past due deliveries remain elevated, John Deere experienced improvement during the first quarter of 2023. The reduction in supply chain disruptions contributed to higher levels of production. John Deere implemented mitigation efforts to minimize the impact of supply chain disruptions on its ability to meet customer demand. While supply chain disruptions are expected to persist into 2023, John Deere is working diligently to secure the parts and components that customers need to deliver essential food and infrastructure more profitably and sustainably. Although John Deere experienced some improvement in this area during the first quarter of 2023, concerns remain, and this issue could impact John Deere’s ability to meet customer demand in the remainder of 2023.
Company Trends
Net income for the Company in fiscal 2023 is expected to be lower than fiscal 2022 primarily due to less favorable financing spreads, higher selling, administrative, and general expenses, and lower gains on operating lease dispositions. These factors are expected to be partially offset by income earned on a higher average portfolio, driven by strong demand of John Deere’s products in 2023, which is favorably impacting forecasted financing volumes.
Central bank policy interest rates increased in the first quarter of 2023 and are projected to continue to increase during 2023, but at a moderating pace compared to 2022. Most of the Company’s Customer Receivables are fixed rate, while its wholesale receivables generally earn a floating rate. The Company has both fixed and floating rate borrowings. The Company manages the risk of interest rate fluctuations by balancing the types and amounts of its funding sources to its Receivable and Lease portfolios. Accordingly, the Company enters into interest rate swap agreements to manage its interest rate exposure. Historically, rising interest rates impact the Company’s borrowings sooner than the benefit is realized from the Receivable and Lease portfolio. As a result, the Company’s financing spread was unfavorably impacted by $50.0 million (after-tax) in the first quarter of 2023 compared to 2022. The Company expects spread compression to persist during 2023.
Inflation was a pervasive feature throughout 2022, and the Company expects inflation to continue in 2023. The Company’s estimation of credit losses may be negatively impacted in the event customers’ operations are negatively impacted due to inflation or rising interest rates. As part of the process to establish the allowance for credit losses, the Company continues to monitor the economy, including potential impacts of inflation and rising interest rates, among other factors, and qualitative adjustments to the allowance are incorporated as necessary. As of January 29, 2023, impacts of inflation and interest rates did not have a material impact on the Company’s allowance.
As the Company’s volume of Receivables and Leases is largely dependent upon the level of retail sales and leases of John Deere products, supply chain disruptions could impact the Company’s future volumes. Despite supply chain challenges, the Company’s volumes are forecast to grow in 2023, driven by strong demand for John Deere equipment.
Supply chain disruptions, inflationary pressures, and rising interest rates are driven by factors outside of the Company’s control, and as a result, the Company cannot reasonably foresee when these conditions will subside.
24
For additional information regarding the impact of supply chain disruptions, including mitigation efforts to minimize the impact of potential supply chain disruptions on John Deere’s ability to meet customer demand, as well as inflationary pressures, refer to Item 2. “Management’s Discussion and Analysis of Financial Condition and Results of Operations —Trends and Economic Conditions” included in Deere & Company’s Quarterly Report on Form 10-Q for the quarter ended January 29, 2023.
Items of Concern and Uncertainties
Other items of concern include global and regional political conditions, economic and trade policies, imposition of new or retaliatory tariffs against certain countries or covering certain products, post-pandemic effects, capital market disruptions, changes in demand and pricing for new and used equipment, significant fluctuations in foreign currency exchange rates, and volatility in the prices of many commodities. These items could impact the Company’s results. John Deere and the Company are making investments in technology and in strengthening capabilities in digital, automation, autonomy, and alternative propulsion technologies. As with most technology investments, marketplace adoption and monetization of these features holds an elevated level of uncertainty.
2023 Compared with 2022
The total revenues and net income attributable to the Company were as follows (in millions of dollars):
Three Months Ended | |||||||
January 29 | January 30 |
| |||||
| 2023 |
| 2022 |
| |||
Total revenues | $ | 820.6 | $ | 642.9 | |||
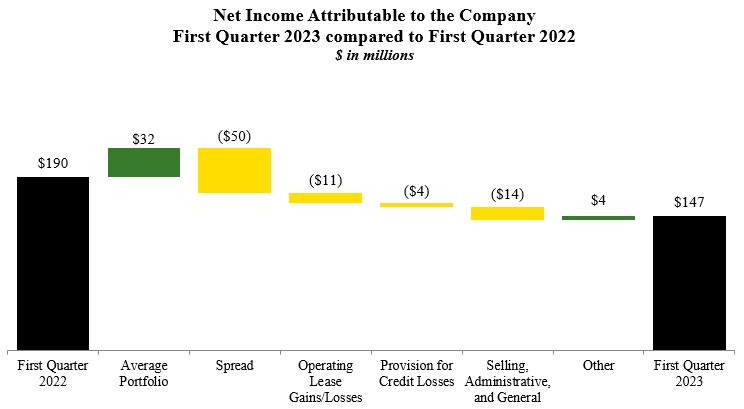
Net income attributable to the Company | 147.1 | 189.6 |
Total revenues increased for the first quarter of 2023 primarily due to a 16% increase in average portfolio balances, in addition to higher average financing rates compared to the same period last year. Net income for the first quarter was lower compared to the same period in 2022 primarily due to less favorable financing spreads, higher selling, administrative, and general expenses, and lower gains on operating lease dispositions, partially offset by income earned on higher average portfolio balances.
25
Revenues
Finance income, lease revenues, and other income earned by the Company were as follows (in millions of dollars):
Three Months Ended | |||||||||
January 29 | January 30 | % | |||||||
| 2023 | 2022 | Change | ||||||
Finance income earned on: | |||||||||
Retail notes | $ | 315.9 | $ | 240.0 | 32 | ||||
Revolving charge accounts | 82.9 | 66.5 | 25 | ||||||
Wholesale receivables | 151.5 | 59.9 | 153 | ||||||
Lease revenues | 240.7 | 241.5 | |||||||
Other income | 29.6 | 35.0 | (15) |
Finance income earned on retail notes, revolving charge accounts, and wholesale receivables increased during the first quarter of 2023 compared to 2022, due to higher average financing rates and higher average portfolio balances. Lease revenues were about the same for each period.
Other income decreased in the first quarter of 2023 due to lower gains on operating lease dispositions. While demand for used equipment remains strong, lease gains declined in the first quarter as end-of-lease book values are now more closely aligned with equipment sale proceeds. This decrease was partially offset by higher interest earned on the Company’s cash and cash equivalents.
Revenues earned from John Deere totaled $208.2 million for the first quarter of 2023, compared with $138.7 million for the same period last year. The increase was primarily due to increased compensation paid by John Deere on wholesale receivables and retail notes, driven by a higher interest rate environment, in addition to higher average portfolio balances. Revenues earned from John Deere are included in each of the revenue amounts discussed above.
Expenses
Expenses incurred by the Company were as follows (in millions of dollars):
Three Months Ended | |||||||||
January 29 | January 30 | % | |||||||
2023 | 2022 | Change | |||||||
Interest expense | $ | 301.0 | $ | 99.5 | 203 | ||||
Depreciation of equipment on operating leases | 164.5 | 168.8 | (3) | ||||||
Administrative and operating expenses | 108.5 | 96.4 | 13 | ||||||
Fees and interest paid to John Deere | 57.6 | 39.7 | 45 | ||||||
Provision (credit) for credit losses | 3.5 | (1.2) | |||||||
Provision for income taxes | 39.6 | 52.0 | (24) |
The increase in interest expense for the first quarter of 2023 was primarily due to higher average borrowing rates and higher average borrowings.
Depreciation of equipment on operating leases for the first quarter of 2023 decreased slightly due to lower average balances of equipment on operating leases.
Administrative and operating expenses increased in the first quarter of 2023 compared to 2022 due to higher dealer incentive program costs and higher employment costs, including incentive compensation.
Fees and interest paid to John Deere increased in 2023 primarily due to higher interest on intercompany borrowings from John Deere driven by higher average borrowing rates.
26
The provision (credit) for credit losses increased slightly in the first quarter of 2023 compared to the same period last year, primarily due to net recoveries on revolving charge accounts in the prior year period, which did not recur this year. The annualized provision (credit) for credit losses, as a percentage of the average balance of total Receivables, was .03 percent for the first quarter of 2023, compared with (.01) percent for the same period last year.
The provision for income taxes decreased during the first quarter of 2023 primarily due to lower pretax income in the current quarter.
Receivables and Leases
Receivable and Lease (excluding wholesale) volumes were as follows (in millions of dollars):
Three Months Ended | |||||||||||
January 29 | January 30 | $ | % | ||||||||
2023 | 2022 | Change | Change | ||||||||
Retail notes: |
|
|
|
|
|
| |||||
Agriculture and turf | $ | 2,684.5 | $ | 2,319.9 | $ | 364.6 |
| 16 | |||
Construction and forestry |
| 630.6 |
| 674.5 |
| (43.9) |
| (7) | |||
Total retail notes |
| 3,315.1 |
| 2,994.4 |
| 320.7 |
| 11 | |||
Revolving charge accounts |
| 2,212.7 |
| 2,088.5 |
| 124.2 |
| 6 | |||
Financing leases |
| 128.5 |
| 100.2 |
| 28.3 |
| 28 | |||
Equipment on operating leases |
| 377.2 |
| 307.5 |
| 69.7 |
| 23 | |||
Total Receivables and Leases (excluding wholesale) | $ | 6,033.5 | $ | 5,490.6 | $ | 542.9 |
| 10 | |||
Total Receivables and Leases owned were as follows (in millions of dollars):
| January 29 |
| October 30 |
| January 30 | ||||
2023 | 2022 | 2022 | |||||||
Retail notes: |
|
|
| ||||||
Agriculture and turf | $ | 24,049.9 | $ | 23,857.8 | $ | 21,253.9 | |||
Construction and forestry |
| 4,988.7 |
| 4,954.1 |
| 4,600.1 | |||
Total retail notes |
| 29,038.6 |
| 28,811.9 |
| 25,854.0 | |||
Revolving charge accounts |
| 2,834.0 |
| 4,165.8 |
| 2,684.8 | |||
Wholesale receivables |
| 9,752.1 |
| 8,404.5 |
| 6,312.0 | |||
Financing leases |
| 1,030.8 |
| 1,120.7 |
| 878.4 | |||
Equipment on operating leases |
| 4,693.4 |
| 4,853.5 |
| 4,745.6 | |||
Total Receivables and Leases | $ | 47,348.9 | $ | 47,356.4 | $ | 40,474.8 |
Customer Receivables decreased $1,195.0 million during the first three months of 2023 mostly due to a seasonal decrease in revolving charge account receivables. Customer Receivables increased $3,486.2 million compared to one year ago due to strong John Deere retail sales. Wholesale receivables increased $1,347.6 million in the first three months of 2023 and $3,440.1 million compared to one year ago due to higher shipment volumes of John Deere equipment.
27
Total Receivables 30 days or more past due, non-performing Receivables, and the allowance for credit losses were as follows (in millions of dollars and as a percentage of the Receivables balance):
January 29 | October 30 | January 30 | |||||||||||||
2023 | 2022 | 2022 | |||||||||||||
Dollars | Percent | Dollars | Percent | Dollars | Percent | ||||||||||
Receivables 30 days or more past due | $ | 489.4 | 1.15 | $ | 404.9 | .95 | $ | 418.8 | 1.17 | ||||||
Non-performing Receivables | 293.6 | .69 | 263.2 | .62 | 274.9 | .77 | |||||||||
Allowance for credit losses | 121.7 | .29 | 128.4 | .30 | 121.4 | .34 |
Receivables 30 days or more past due continue to accrue finance income. The Company ceases to accrue finance income once Receivables are considered non-performing. An allowance for credit losses is recorded for the estimated credit losses expected over the life of the Receivable portfolio. The Company measures expected credit losses on a collective basis when similar risk characteristics exist. Risk characteristics considered by the Company include product category, market, geography, credit risk, and remaining duration. Receivables that do not share risk characteristics with other receivables in the portfolio are evaluated on an individual basis. Non-performing Receivables are included in the estimate of expected credit losses. While the Company believes its allowance is sufficient to provide for losses over the life of its existing Receivable portfolio, different assumptions or changes in economic conditions would result in changes to the allowance for credit losses and the provision for credit losses. See Note 4 for additional information related to the allowance for credit losses.
Deposits held from dealers and merchants amounted to $127.8 million at January 29, 2023, compared with $137.3 million at October 30, 2022 and $126.1 million at January 30, 2022. These balances primarily represent the aggregate dealer retail note and lease withholding accounts from individual John Deere dealers to which losses from retail notes and leases originating from the respective dealers can be charged. Recoveries from dealer deposits are recognized in other income when the dealer’s withholding account is charged. Recoveries from dealer deposits and other freestanding credit enhancements recorded in other income were $2.0 million in the first quarter of 2023, compared with $1.1 million for the same period last year.
Write-offs and recoveries of Receivables, by product, and as an annualized percentage of average balances held during the period, were as follows (in millions of dollars):
Three Months Ended | |||||||||||
January 29, 2023 | January 30, 2022 | ||||||||||
Dollars | Percent | Dollars | Percent | ||||||||
Write-offs: |
|
|
|
|
|
|
| ||||
Retail notes and financing leases: | |||||||||||
Agriculture and turf | $ | (7.1) |
| (.11) | $ | (6.1) |
| (.11) | |||
Construction and forestry |
| (3.1) |
| (.24) |
| (6.4) |
| (.54) | |||
Total retail notes and financing leases |
| (10.2) |
| (.14) |
| (12.5) |
| (.19) | |||
Revolving charge accounts |
| (7.5) |
| (.91) |
| (4.0) |
| (.53) | |||
Wholesale receivables |
| (.1) |
|
|
| ||||||
Total write-offs |
| (17.8) |
| (.17) |
| (16.5) |
| (.19) | |||
Recoveries: | |||||||||||
Retail notes and financing leases: | |||||||||||
Agriculture and turf |
| 1.6 |
| .03 |
| 2.0 |
| .04 | |||
Construction and forestry |
| .8 |
| .06 |
| .9 |
| .08 | |||
Total retail notes and financing leases |
| 2.4 |
| .03 |
| 2.9 |
| .04 | |||
Revolving charge accounts |
| 5.3 |
| .64 |
| 7.8 |
| 1.04 | |||
Wholesale receivables |
| .6 | .03 | ||||||||
Total recoveries |
| 8.3 |
| .08 |
| 10.7 |
| .12 | |||
Total net write-offs | $ | (9.5) |
| (.09) | $ | (5.8) |
| (.07) |
28
Critical Accounting Estimates
See the Company’s critical accounting estimates discussed in Management’s Discussion and Analysis of Financial Condition and Results of Operations of the Company’s most recently filed Annual Report on Form 10-K. There have been no material changes to these estimates.
Capital Resources and Liquidity
For additional information on the Company’s dependence on, and relationship with, Deere & Company, see the Company’s most recently filed Annual Report on Form 10-K.
Sources of Liquidity, Key Metrics and Balance Sheet Data
The Company relies on its ability to raise substantial amounts of funds to finance its Receivable and Lease portfolios. The Company has access to most global markets at a reasonable cost. The Company’s ability to meet its debt obligations is supported in several ways. The assets of the Company are self-liquidating in nature. A solid equity position is available to absorb unusual losses on these assets, and all commercial paper is backed by unsecured, committed borrowing lines from various banks. Liquidity is also provided by the Company’s ability to securitize its retail notes and through the issuance of term debt in both public and private markets. Additionally, liquidity may be provided through loans from John Deere. The Company closely monitors its liquidity sources against the cash requirements and expects to have sufficient sources of global funding and liquidity to meet its funding needs in the short-term (next 12 months) and long-term (beyond 12 months).
Key metrics and certain balance sheet data are provided in the following table, in millions of dollars:
January 29 | October 30 | January 30 | |||||||
| 2023 |
| 2022 |
| 2022 | ||||
Cash, cash equivalents, and marketable securities | $ | 1,056.8 | $ | 662.9 | $ | 666.3 | |||
Receivables and Leases – net | 47,227.2 | 47,228.0 | 40,353.4 | ||||||
Interest-bearing debt | 42,491.4 | 41,856.1 | 36,019.3 | ||||||
Unused credit lines | 1,580.5 | 3,283.9 | 5,865.2 | ||||||
Ratio of interest-bearing debt to stockholder’s equity | 8.5 to 1 | 8.7 to 1 | 7.7 to 1 |
The reduction in unused credit lines compared to both prior periods relates to an increase in commercial paper outstanding, by both the Company and John Deere, due to changes in Receivables and funding mix.
There have been no material changes to the contractual and other cash requirements identified in the Company’s most recently issued Annual Report on Form 10-K.
Cash Flows
Three Months Ended | ||||||
January 29 | January 30 | |||||
(In millions of dollars) |
| 2023 |
| 2022 | ||
Net cash provided by operating activities | $ | 338.7 | $ | 268.7 | ||
Net cash provided by (used for) investing activities | (53.0) | 676.0 | ||||
Net cash provided by (used for) financing activities | 81.0 | (963.1) | ||||
Effect of exchange rate changes on cash, cash equivalents, and restricted cash | 13.1 | (5.2) | ||||
Net increase (decrease) in cash, cash equivalents, and restricted cash | $ | 379.8 | $ | (23.6) |
Net cash was used for investing activities during the first three months of 2023 primarily due to growth in wholesale receivables and notes receivable from John Deere, partially offset by a seasonal decrease in revolving charge account receivables. Net cash used by investing activities was funded primarily through external borrowings and cash provided by operating activities, partially offset by a reduction in borrowings from John Deere.
29
Borrowings
Total borrowings increased $635.3 million in the first three months of 2023 and increased $6,472.1 million compared to a year ago, generally corresponding with the level of the Receivable and Lease portfolios, as well as the level of cash and cash equivalents. During the first three months of 2023, the Company issued $2,298.9 million and retired $1,618.5 million of long-term external borrowings, which primarily consisted of medium-term notes. During the first three months of 2023, the Company also retired $849.3 million of retail note securitization borrowings and maintained an average commercial paper balance of $3,331.5 million. The Company’s funding profile may be altered to reflect such factors as relative costs of funding sources, assets available for securitizations, and capital market accessibility.
The Company has a revolving warehouse facility to utilize bank conduit facilities to securitize retail notes (see Note 5). The facility was renewed in November 2022 with an expiration in November 2023 and increased the total capacity or “financing limit” from $1,000.0 million to $1,500.0 million. At January 29, 2023, $786.0 million of securitization borrowings were outstanding under the facility. At the end of the contractual revolving period, unless the banks and the Company agree to renew, the Company would liquidate the secured borrowings over time as payments on the retail notes are collected.
Lines of Credit
The Company has access to bank lines of credit with various banks throughout the world. Some of the lines are available to both the Company and Deere & Company. Worldwide lines of credit totaled $8,029.0 million at January 29, 2023, $1,580.5 million of which were unused. For the purpose of computing the unused credit lines, commercial paper and short-term bank borrowings of the Company and John Deere, excluding secured borrowings and the current portion of long-term external borrowings, were considered to constitute utilization. Included in the total credit lines at January 29, 2023 was a 364-day credit facility agreement of $3,000.0 million, expiring in the second quarter of 2023. In addition, total credit lines included long-term credit facility agreements of $2,500.0 million, expiring in the second quarter of 2026, and $2,500.0 million, expiring in the second quarter of 2027. The Company expects to extend the terms of these credit facilities. These credit agreements require the Company to maintain its consolidated ratio of earnings to fixed charges at not less than 1.05 to 1 for each fiscal quarter and its ratio of senior debt, excluding securitization indebtedness, to capital base (total subordinated debt and stockholder’s equity excluding accumulated other comprehensive income (loss)) at not more than 11 to 1 at the end of any fiscal quarter. All of these credit agreement requirements have been met during the periods included in the consolidated financial statements.
Debt Ratings
The Company’s ability to obtain funding is affected by its debt ratings, which are closely related to the outlook for and the financial condition of John Deere, and the nature and availability of support facilities, such as the Company’s lines of credit and the support agreement from Deere & Company.
To access public debt capital markets, the Company relies on credit rating agencies to assign short-term and long-term credit ratings to the Company’s securities as an indicator of credit quality for fixed income investors. A security rating is not a recommendation by the rating agency to buy, sell, or hold the Company’s securities. A credit rating agency may change or withdraw ratings based on its assessment of the Company’s current and future ability to meet interest and principal repayment obligations. Each agency’s rating should be evaluated independently of any other rating. Lower credit ratings generally result in higher borrowing costs, including costs of derivative transactions, and reduced access to debt capital markets.
30
The senior long-term and short-term debt ratings and outlook currently assigned to unsecured Company debt securities by the rating agencies engaged by the Company are the same as those for John Deere. Those ratings are as follows:
| Senior Long-Term |
| Short-Term |
| Outlook |
| |
Fitch Ratings | A+ | F1 | Stable | ||||
Moody’s Investors Service, Inc. |
| A2 |
| Prime-1 |
| Positive | |
Standard & Poor’s |
| A |
| A-1 |
| Stable |
Forward-Looking Statements
Certain statements contained herein, including in the section entitled “Overview” relating to future events, expectations, and trends constitute “forward-looking statements” as defined in the Private Securities Litigation Reform Act of 1995 and involve factors that are subject to change, assumptions, risks, and uncertainties that could cause actual results to differ materially.
Forward-looking statements are based on currently available information and current assumptions, expectations, and projections about future events and should not be relied upon. Except as required by law, the Company expressly disclaims any obligation to update or revise its forward-looking statements. Many factors could cause actual results to differ materially from these forward-looking statements. Among these factors are risks related to:
● | volume of Receivables and Leases being dependent upon the level of retail sales and leases of John Deere products; |
● | changes in U.S. and international laws, regulations and policies relating to trade, spending, taxing, banking, monetary, environmental (including climate change and engine emission), and farming policies; |
● | political, economic, and social instability of the geographies in which John Deere and the Company operate; |
● | wars and other conflicts, including the current conflict between Russia and Ukraine, and natural disasters; |
● | adverse macroeconomic conditions, including unemployment, inflation, rising interest rates, changes in consumer practices due to slower economic growth or possible recession, and liquidity constraints; |
● | growth and sustainability of non-food uses for crops (including ethanol and biodiesel production); |
● | John Deere’s and the Company’s ability to execute business strategies, including John Deere’s Smart Industrial operating model and Leap Ambitions; |
● | John Deere’s and the Company’s ability to understand and meet their customers’ changing expectations and demand for John Deere products and the Company’s financing solutions; |
● | John Deere’s and the Company’s ability to adapt in highly competitive markets; |
● | John Deere’s dealer practices and their ability to manage distribution of John Deere products and support and service precision technology solutions; |
● | changes in climate patterns and unfavorable weather events; |
● | higher interest rates and currency fluctuations which could adversely affect the U.S. dollar, customer confidence, access to capital, and demand for John Deere’s and the Company’s products; |
● | changes in the Company’s credit ratings and failure to comply with financial covenants in credit agreements could impact access to funding; |
● | availability and price of raw materials, components, and whole goods; |
● | delays or disruptions in John Deere’s supply chain; |
● | the ability to attract, develop, engage, and retain qualified personnel; |
● | security breaches, cybersecurity attacks, technology failures, and other disruptions to the information technology infrastructure of John Deere or the Company and its products; |
● | compliance with evolving U.S. and foreign laws, including economic sanctions, data privacy, environmental, anti-money laundering, and consumer finance laws and regulations; |
31
● | legislation introduced or enacted that could affect John Deere’s business model and intellectual property, such as so-called right to repair or right to modify legislation; |
● | investigations, claims, lawsuits, or other legal proceedings; |
● | events that damage John Deere’s or the Company’s reputation or brand; |
● | world grain stocks, available farm acres, soil conditions, harvest yields, prices for commodities and livestock, input costs (e.g., fertilizer), and availability of transport for crops; and |
● | housing starts and supply, real estate and housing prices, levels of public and non-residential construction, and infrastructure investment. |
Further information concerning the Company and its business, including factors that could materially affect the Company’s financial results, is included in the Company’s other filings with the SEC (including, but not limited to, the factors discussed in Item 1A. “Risk Factors” of the Company’s most recent Annual Report on Form 10-K).
The Company’s business is closely related to John Deere’s business. Further information, including factors that could materially affect the Company’s and John Deere’s financial results, is included in the most recent Deere & Company Annual Report on Form 10-K and subsequent Quarterly Reports on Form 10-Q (including, but not limited to, the factors discussed in Item 1A., “Risk Factors” of the Annual Report on Form 10-K and subsequent Quarterly Reports on Form 10-Q) and other Deere & Company filings with the SEC.
Item 3. Quantitative and Qualitative Disclosures About Market Risk.
Omitted pursuant to General Instruction H.
Item 4. Controls and Procedures.
The Company’s principal executive officer and its principal financial officer have concluded that the Company’s disclosure controls and procedures (as defined in Rules 13a-15(e) and 15d-15(e) of the Securities Exchange Act of 1934, as amended (the Exchange Act)) were effective as of January 29, 2023, based on the evaluation of these controls and procedures required by Rule 13a-15(b) or 15d-15(b) of the Exchange Act. During the first quarter, there were no changes that have materially affected or are reasonably likely to materially affect the Company’s internal control over financial reporting.
PART II. OTHER INFORMATION
Item 1. Legal Proceedings.
The Company is subject to various unresolved legal actions which arise in the normal course of its business, the most prevalent of which relate to retail credit matters. The Company believes the reasonably possible range of losses for these unresolved legal actions would not have a material effect on its consolidated financial statements.
Item 1A. Risk Factors.
See the Company’s most recently filed Annual Report on Form 10-K (Part I, Item 1A). There has been no material change in this information. The risks described in the Annual Report on Form 10-K, and the “Forward-Looking Statements” in this report, are not the only risks faced by the Company. Additional risks and uncertainties may also materially affect the Company’s business, financial condition, or operating results. One should not consider the risk factors to be a complete discussion of risks, uncertainties, and assumptions.
Item 2. Unregistered Sales of Equity Securities and Use of Proceeds.
Omitted pursuant to General Instruction H.
Item 3. Defaults Upon Senior Securities.
Omitted pursuant to General Instruction H.
32
Item 4. Mine Safety Disclosures.
Not applicable.
Item 5. Other Information.
None.
Item 6. Exhibits.
Certain instruments relating to long-term debt, constituting less than 10 percent of the registrant’s total assets, are not filed as exhibits herewith pursuant to Item 601(b)(4)(iii)(A) of Regulation S-K. The registrant will file copies of such instruments upon request of the SEC.
3.1 | |
3.2 | |
31.1 | |
31.2 | |
32 | |
101.SCH | Inline XBRL Taxonomy Extension Schema Document |
101.CAL | Inline XBRL Taxonomy Extension Calculation Linkbase Document |
101.DEF | Inline XBRL Taxonomy Extension Definition Linkbase Document |
101.LAB | Inline XBRL Taxonomy Extension Label Linkbase Document |
101.PRE | Inline XBRL Taxonomy Extension Presentation Linkbase Document |
104 | Cover Page Interactive Data File (formatted as Inline XBRL and contained in Exhibit 101) |
* Incorporated by reference.
33
SIGNATURES
Pursuant to the requirements of the Securities Exchange Act of 1934, the registrant has duly caused this report to be signed on its behalf by the undersigned thereunto duly authorized.
JOHN DEERE CAPITAL CORPORATION | ||||
Date: | February 23, 2023 | By: | /s/ Joshua A. Jepsen | |
Joshua A. Jepsen | ||||
Senior Vice President and Principal Financial Officer and Principal Accounting Officer | ||||
34